A textbook of sound - Internet Archive
544
-
Upload
khangminh22 -
Category
Documents
-
view
0 -
download
0
Transcript of A textbook of sound - Internet Archive


1ml
:

Date Due
Bureau Cat. no. 1137


Digitized by the Internet Archive
in 2013
http://archive.org/details/textbookofsoundbOOwood

A TEXTBOOK OF SOUND


A TEXTBOOK OF
SOUNDBeing an account of the Physics of
Vibrations with special reference to recent
theoretical and technical developments
BY
A. B. WOODD.Sc. (Manchester), F.Inst.P.
Senior Scientific Officer, Admiralty Research Laboratory, Teddington,
Middlesex ; Member of Council of the Physical Society of London ; late
Oliver Lodge Fellow and Lecturer in Physics, Liverpool University
NEW YORKTHE MACMILLAN COMPANY
1930

\?>°ylpbuCOPYRIGHT 1Q30
Printed in Great Britain by
Neill & Co., Ltd., Edinburgh.

PREFACE
The change which has taken place during the past ten or twenty
years in the study of mechanical vibrations and sound is myexcuse for writing this book when such treatises as those of
Rayleigh and Lamb already exist. These treatises, founded so
firmly on sound mechanical and mathematical principles, must
for a long time to come be regarded as the basis of further develop-
ments. Since Rayleigh's Sound first appeared many treatises
have been written, but, with the exception of a few which have
been published since I commenced to write the present volume,
the majority have dealt with the subject in the time-honoured
way with insufficient reference to the change in the methods of
treatment which has been so conspicuous in recent years. I have
consequently followed, whenever possible, the theoretical treat-
ment of Rayleigh and Lamb, but have also endeavoured to deal
with the ever-increasing bulk of new data and methods of investi-
gation which is now available. Whilst writing the book mydoubts have increased regarding a suitable choice of title. Murray's
New English Dictionary defines 'Sound' as "(1) The sensation
produced in the organs of hearing when the air is set in vibration
in such a way as to effect these ; also that which is or may be heard
;
the external object of audition, or the properties of bodies by which
this is produced; (2) the particular auditory effect produced by
a special cause"; whilst 'Acoustics' is defined as "The science
of sound, and the phenomenon of hearing." Now the subject
as I have treated it, in the light of recent developments, embraces
much more than these definitions imply. I have regarded it as
including not only the range of audible frequencies with whichthe subject was formerly concerned, but also the regions of
inaudible vibrations of very low and very high frequency. Anew concise description is required which embraces vibratory
systems of all frequencies. The indiscriminate use of the titles
'Sound' and 'Acoustics' is not surprising in view of the
dictionary definitions to which I have referred. I have, however,in the present volume endeavoured to reserve the use of the word'acoustics' (Greek olkovw, hear) for that aspect of the subject
more immediately connected with hearing. For want of a more

vi TEXTBOOK OF SOUND
appropriate word I have regarded ' sound' as referring to vibra-
tions of all frequencies, audible or otherwise.
In addition to the large extension of frequency-range, newapparatus and new methods of investigation have been introduced
which have completely transformed all branches of the subject.
The very important analogy existing between electrical and
mechanical vibrating systems is now in general use. Not only
are electrical methods extensively applied in the production and
reception of mechanical vibrations, but the theory of one is
closely interlinked with that of the other. The familiar con-
ceptions of electrical potential, current, and impedance are nowapplied with almost equal facility to mechanical systems ; we have
mechanical filters analogous to electrical filters, and complex
mechanical vibrating systems (e.g. such as a gramophone sound
box or a 'loud speaker') are now designed in strict accordance
with electrical principles. Electrical methods are extensively
used also as a means of amplifying mechanical vibrations, the
feeble effects at a sound-receiving surface being converted into
electrical currents, amplified electrically and reproduced as
mechanical vibrations of greatly increased intensity. It seems
desirable that these and the many other important developments
should be recorded side by side with the earlier work of Rayleigh
and his followers.
I have endeavoured to write the book in a manner suited to the
requirements of university students, but it is hoped that it mayalso prove of some value to those interested in the more technical,
or applied, aspects of the subject. For those requiring further
information a plentiful supply of references to original papers
is provided.
In spite of the care I have taken in reading through the MS,I am still conscious of mistakes, for which I ask the indulgence
of my readers. I hope, however, that none of them are of a
serious nature.
In conclusion, I should like to express my thanks to numerous
authors for their kindness in supplying me with reprints of their
original papers, and to publishers for permission to use their
blocks for illustrations. Specific acknowledgments will be found
in the text. My thanks are also due to the Admiralty for per-
mission to write and publish this book.
A. B. W.
Admiralty Research LaboratoryTeddington

CONTENTSPAGE
INTRODUCTION 1
SECTION I
THEORY OF VIBRATIONS
Vibrations of a Particle 9
Simple Harmonic Motion. Examples of. Composition of
Beats. Lissajous' Figures.
Fourier's Theorem. Examples of Wave-form Analysis and
Synthesis.
Damped Vibrations. Critical Damping.Forced Vibrations. Resonance. Amplitude and Phase of
Forced Vibrations. Energy of Vibration. Sharpness
of Resonance. Coupled Systems. Reaction.
Relaxation Oscillations
.
Vibrations in an Extended Medium. Wave Motion 47
Plane Waves. Velocity. Energy of Wave Motion. In-
tensity. Power of Source Emitting Plane Waves.Radiation Resistance.
Spherical Waves. Equations of Continuity and Motion.
Velocity Potential. ' Strength ' and ' Power ' of Source.
Simple and Double Sources. Local Flow. Principle
of Superposition. Huyghens' Secondary Waves.
Electrical Vibrations 69Free and Forced Oscillations. Resonance. The Circle
Diagram. Motional Impedance. Efficiency of Elec-
trical Sound Sources (Motional Impedance Circle andWattmeter Methods).
Sources of Alternating Current. Interrupters. Hummers.A.C. Machines. Singing Arcs. Valve Oscillators. ValveAmplifiers.
SECTION II
VIBRATING SYSTEMS AND SOURCES OF SOUNDTransverse Vibrations of Strings 84
Velocity of Waves on a String. Reflection. Stationary
Waves. Monochord. Small Motion at Nodes. Stiff-
ness of Strings. Yielding of Supports. Loaded

viii TEXTBOOK OF SOUNDPAGE
Strings. Methods of Producing Vibration of Strings.
Quality. Strings Excited by Plucking, Striking, andBowing. Wolf-note. Strings as Sources of Sound.The Sounding Board. Strings Excited Electromagneti-
cally. Reaction of Medium on Strings.
Transverse Vibrations of Elastic Bars 107Theory. Clamped-free, Free-free, etc., Bars. Methods
of Excitation. Mechanical and Electromagnetic Fre-
quency-meters. Methods of Tuning a Bar.
Tuning-Forks. Mode of Vibration. Frequency Stan-
dards and Substandards of Time. Electrically-main-
tained Forks. Valve-maintained Forks. PhonicMotors. Frequency Determination of Forks. PhonicMotor Method. Temperature Coefficient of Frequency.
Variation of Frequency with Amplitude. Clock-con-
trolled Forks. Forks as Standards of Frequency.
Multivibrators.
Vibrations of a Ring. Flexural and Extensional Modes of
Vibration.
Longitudinal Vibrations of Rods 135
Theory. Free-free. Midpoint Clamped. Clamped-free.
Excitation and Observation of Longitudinal Vibrations.
Electrical Methods : (a) Electromagnetic, (b) Electro-
static, (c) Magnetostriction.
High-frequency Vibrations of Piezo-electric Crystals.
Piezo-Electricity. Resonant Vibration of Crystal Slices.
(a) Piezo-electric Resonators and Oscillators. Quartz
Standards of Frequency. Quartz Oscillators
as Frequency Stabilisers.
(b) Piezo-electric Sources of Sound. Langevin
Transmitter.
Sound Radiation from a High-frequency Piston. Sources
of Large Area. Directional Effects.
Torsional Vibrations of Bars 152
Theory. Experimental. Piezo-electric Effects Produced
by Torsion.
Vibrations of Membranes, Diaphragms, Plates, andBells 154
Membranes. Theory. Membranes as Sources of Sound.
Directional Properties.
Diaphragms. Theory. In Air; Added Load; In Water.
Damping. Persistence of Vibration of Loaded and
Unloaded Diaphragms.Experimental. Diaphragms in Air and Water. Damping.
Power Radiated. Mean Amplitude. Applications.

CONTENTS ix
PAGE
Plates. Modes of Vibration. Chladni's Figures. High-
frequency Vibrations of Quartz Plates (Dye's Interfero-
meter Method).Curved Plates. Cylinders and Bells. Bells as Sound
Sources in Air and under Water.
Air Cavities 169
Cylindrical Air Columns. Organ Pipes. Theory of1
Closed ' and ' Open ' Pipes. End Correction.
Conical Pipes. Open, Closed, and Truncated. Liquid-
filled Pipes. Organ Pipes, ' Flue ' and ' Reed ' Pipes.
High-frequency Pipes. Galton's Whistle. Hartmannand Trolle's Air-jet Generator.
Experimental Observation of Vibrations in Pipes.
(a) Kundt's Dust Tubes.
(6) Konig's Manometric Capsule, Pressure-amplitude
Measurements.(c) Displacement and Velocity Amplitude.
(d) Density and Temperature Changes in Pipes.
Air Cavity. Helmholtz Resonators. Theory. Relation
between Pipe and Helmholtz Resonator. Use of
Helmholtz Resonator in Sound Analysis. DoubleResonator. Absorption of Sound by Resonators.
Quincke Filters. Reinforcement of Sound by Re-
sonators.
Trumpets and Horns.
(a) Intensifying Properties.
(b) Directive Properties.
The Voice. Speech. Helmholtz Harmonic Theory.Paget's Experiments. Willis-Hermann-Scripture In-
harmonic Theory. Millar's Voice Records. Cran-dall's Analysis.
Maintenance of Vibrations by Heat 198
Trevelyan's Rocker. Singing Flames. Gauze Tones.Heating by Alternating Currents. Thermophone. Singing
Arc. Spark Sound Waves.
Vortex Sounds 205(a) ^Eolian Tones, (b) Edge and Jet Tones.
Sirens 209Seebeck and La Tour's Sirens. Wave-form. Pure Tone
Siren.
Power Sirens for Fog Signalling. Efficiency. The Dia-phone. The Centrifugal Siren.
Explosion Sounds 212Infra-sound. Gun Sounds. Shock Excitation.

TEXTBOOK OF SOUNDPAGE
Sounds from Rotating Propellers 214Aeroplane Sounds. Ship Sounds.
Directional Sources of Sound 215Sources of Large Area. Multiple Sources.
Methods of Observing the Motion of Vibrating Bodies 220Mechanical and Optical Methods. Methods of Magni-
fying the Motion. Stroboscopic Observation.
SECTION III
TRANSMISSION OF SOUND
Velocity of Sound Waves of Small Amplitude 229
(A) In Gases. Theory. Effect of Pressure, Temperature,Humidity, Ratio of Specific Heats. Relation be-
tween Sound-wave Velocity and Molecular Velocity
in Gases.
(a) Free Air. Experimental. Early Work. Re-cent Observations.
(b) Gases Contained in Tubes. Tube Correction.
Direct Method. Kundt's Dust Tube.Resonant Gas Column. Velocity in Gases
and Vapours at Different Temperatures.
(B) In Liquids. Ratio of Specific Heats.
(a) Liquids in Bulk. Velocity in Water in Lakes
and in the Sea. Multiple-charge Method.Radio-acoustic Method.
(b) Liquids in Tubes. Theory and Experimental.
(C) In Solids. Theory.
(a) In Bulk. Seismic Waves.(b) Limited Solids. Rods. Soft Solids. Cry-
stalline Solids.
Velocity of Sounds of High Frequency 256
(a) In Gases. Stationary Wave Methods. Oscillatory
Sparks, and Quartz Oscillators (Pierce).
(b) In Liquids. Experiments with High-frequency Quartz
Oscillators (Boyle, Wood, and Loomis).
(c) In Solids. Magnetostriction and Quartz Oscillators.
Short Steel Rods. Stationary Wave Experiments.
Velocity of Sound Waves of Finite Amplitude 263
Theory. Experimental. ' Schlieren ' Method applied
to Explosion Waves in Gases. Waves of Large ' Con-
densation.7 Large-amplitude Waves in Water. Sounds
from High-speed Projectiles. ' Onde de Choc.'

CONTEXTS xi
PAGE
Change of Medium 271
(A) Reflection. Reflection of Plane Waves at the Boun-dary of Two Extended Media. Theory. Acous-
tic Resistance. Images. Reflection from Plate
of Finite Thickness . Succession of Thin Parallel
Laminae.
Stationary Waves. ' Fixed ' and ' Free ' Ends.
Imperfect Reflection. Reflection Coefficients.
Echoes. Harmonic Echoes. Scattering. Musical
Echoes. Gratings. Reflection from CurvedSurfaces. Mirrors. Whispering Galleries.
Huyghens' Construction for Reflected Waves.(B) Refraction. Effect of Wind and Temperature Gradi-
ents. ' Mirage.' Temperature Gradients in the
Sea.
Interference 293
Ripples. Stationary Waves. Experimental Observations
with Sounds of Audible and Supersonic Frequencies in
Air and in Water.
Diffraction 299Half-wave Zones. Fresnel's Integrals. Cornu's Spiral.
Straight Edge. Parallel Aperture. Circular Aperture.
Circular Disc. Zone Plate. Diffraction Gratings.
Reflection from Stepped or Corrugated Surfaces.
Experimental. High-frequency Sounds. Spark Im-pulses.
Disturbance produced by a Stnall Obstacle. Exploration
of Sound-field around an Osbtacle in Water.
Attenuation of Sound Waves 317Energy Loss Due to Viscosity and Heat Conduction, in Air
and in Water. Effect of Amplitude on Efficiency of
Sound Sources. Transmission of High-frequencySounds through Gases and Liquids. Sound Absorp-tion in Narrow Tubes and Cavities. Porous Bodies.
Stationary-wave Method of Measuring Absorption
Coefficients. Absorption and Velocity of Sound in
Turbid Media. Gas Bubbles in Liquids. Transmis-sion of Sound through the Atmosphere. Audibility of
Fog Signals. Explosive Sounds. Zones of Silence.
Transmission of Sound through the Sea.
Variation of Pitch with Motion 336Doppler Effect. Motion of Source, Receiver, and Medium.
Experimental Study of Wave Transmission 340High-frequency Sound Waves.Spark Pulse Photography. ' Shadow ' and ' Schlieren
'
Methods.Ripple-tank Method. Bullet Photography.

TEXTBOOK OF SOUND
SECTION IV
RECEPTION, TRANSFORMATION, AND MEASUREMENTOF SOUND ENERGY
PAGE
Types and Classifications of Sound Receivers. 349
The Ear 351Sensitivity to Changes of Intensity and Frequency.Weber-Fechner Law. Auditory Sensation Area.
Abnormal Hearing. Masking Effects of other Sounds.Perception of Quality and Pitch. Minimum Durationfor Identification of Pitch. * Persistence of Audition.'
Aural Fatigue. Audible Limits of Frequency.
Perception of Direction. Binaural Audition (Phase, In-
tensity, and Time-difference Theories).
Combination or Sum and Difference Tones. Objective andSubjective Combination Tones. Beats. Discord andHarmony.
Structure of the Ear. Theories of Hearing.
Sensitive Flames and Jets 371
Instability of Jets. Detection of High-frequency Sounds.
Factors Governing the Efficiency of Sound Receivers 373
Theory. Resonant Receivers. Untuned Receivers of
Small Area. The Receiver as an ' Obstacle.' Re-
ceivers of Large Area. Pressure and Displacement
Receivers.
Mechanical Transformers. The Lever Principle.
Conversion of Sound Energy into Electrical Energy 384
Electromagnetic Receivers (Moving-iron Type). Electro-
dynamic Receivers (Moving-coil Type). Induction
Type. ' Velocity ' Receivers (Three Types). Piezo-
electric Receivers. Magnetostriction Receivers. TheCondenser Microphone (Electrostatic). The CarbonMicrophone. Thermal Receivers. Hot-wire Micro-
phone. Resonators. Under-water Receivers. Hydro-
phones.
Directional Reception of Sound 411
Binaural Methods. Compensators. Geophones. Sumand Difference Method.
Directional Properties of a Small Diaphragm Receiver.
Bi- and Uni-directional Hydrophones.Directional Displacement Receivers. Directional Properties
of ' Button ' Microphones. Light-body Hydrophones.
Diffraction Methods. Diffraction Disc and Zone Plate.
Receivers of Large Area.
Multiple Receivers. Location of Impulsive Sources.

CONTENTS xiii
PAGE
Sound Measurement. Analysis and Recording 423
Pressure Amplitude in Undisturbed Medium Relative to
that in the Receiver. ' Absolute ' Measurement of
Amplitude.The Rayleigh Disc. Resonated System. Sivian's Modi-
fication.
Pressure of Sound Waves.
Sound Radiometers. Torsion-vane Pendulum.Forces of Reaction between Bodies in a Sound Field.
(a) Repulsion of Resonators.
(b) Attraction between a Vibrating Body and a Neigh-bouring Obstacle.
(c) Attraction or Repulsion between Spherical Particles
in a Sound Field.
Interferometer Methods.The Webster Phonometer. The Millar Phonodeik. Hilger
Audiometer.Electrical Methods. Hot-wire Microphone. Electro-
magnetic and Electrodynamic Receivers. Null Methodof Sound Measurement.
Sound Analysis. Non-resonant Receiver — Amplifier —Oscillograph.
Electrical Oscillographs (Duddell, Einthoven, AbrahamRheograph, Electrostatic, and Cathode Ray Oscillo-
graphs).
Measurement of Frequency. Absolute and ComparativeMethods. Vibration Galvanometers.
Measurement of Amplitude of Vibration of a Source.Bragg 's Pendulum and Webster's Interferometer
Methods.Wave Filters (Electrical and Mechanical). Low-pass,
High-pass, Band-pass Filters.
SECTION VTECHNICAL APPLICATIONS
Measurement of Distance by Sound 466Direct, Reflection, and Differential-velocity Methods.
(A) Echo Sounding.
(i) American Systems
—
(a) Fessenden RotatingDisc Method, (b) Angle of Reflection Method,(c) Stationary-wrave Method.
(2) German System. Behm-Echolot.
(3) French System. Langevin Piezo-electric QuartzOscillator. Florisson Recorder.
(4) British System. Admiralty Echo Sounders.
Geological Prospecting. Echo and Seismic Methods.

xiv TEXTBOOK OF SOUNDPAGE
(B) Sound Ranging.
(i) Radio-acoustic Method.
(2) Multiple-point Method (Army and Navy-Systems).
Acoustics of Buildings 484Reverberation. ' Standard Reverberation Period.' Units
of Absorption. Optimum Reverberation.
Determination of Absorption Coefficients—(a) Full Scale
(Sabine), and (b) Small Scale (Test-specimen) Methods.Study ofShape ofan Auditorium. Spark-pulse and Ripple-
tank Methods.
Reproduction of Sound 491
Gramophones and Loud Speakers. Optical Methods of
Recording and Reproducing Sounds. The Photo-
phone. Phonofilms.
Alternating Power Transmission 497
Constantinesco's System.
Other Technical Applications 499
(1) The Problem of Noise Reduction. Causes of Noise in
Machinery. Traffic Noise.
(2) Sound Signalling in Air and under Water.
(3) Supersonics. Piezo-electric Oscillators
—
(a) Depth-
sounding, (b) Standardisation of Frequency of High-
frequency Electrical Circuits, (c) In Physical and
Biological Research.
(4) Musical Instruments.
APPENDICES—Tables of Velocity of Sound 504
INDEX 507

INTRODUCTION
We may regard sound either as a sensation or the stimulus which
produces the sensation. The physicist is usually concerned with
the stimulus—that is, in the phenomena which occur external to
the ear. Just as it is customary to regard 'light' as including
'invisible' radiations in the ultra-violet and the infra-red, so weshall regard sound as including mechanical vibrations of all
frequencies, audible or otherwise. In this respect sound may be
considered as including that branch of mechanics which deals with
alternating or vibratory motion. The study of mechanical
vibrations is closely analogous to that of alternating currents, the
mathematical theory being almost identical when the membersof certain pairs of fundamental quantities, e.g. inertia-inductance,
stiffness-capacity, friction-resistance, are interchanged. To those
familiar with alternating-current theory, this analogy will prove
of considerable assistance in dealing with the theoretical aspect
of sound. Recent developments in the use of high-frequency
alternating currents, in radio-telephony, have their counterpart
in the production of mechanical vibrations of the same order of
frequency. Alternating currents, of whatever frequency, provide
also a very convenient means of exciting the corresponding
mechanical vibrations and vice versa.
It requires little effort to demonstrate that all sounding bodies
are in a state of vibration. In some cases the vibrations can be
seen directly as a blurred outline, or optical magnification maybe necessary to reveal them, whilst in other cases more delicate
mechanical or electrical tests are necessary. The simple experi-
ment with the pith-ball pendulum is a very convincing way of
demonstrating the vibration of tuning-forks, bells, or similar
sources of sound. The experiment becomes more convincing
when applied to the case of a short steel bar in which the longi-
tudinal vibrations are above the upper audible limit.
In order to convey the sound from the vibrating body to the
ear, or other form of receiver, at a distant point it is necessary
that the intervening medium should be capable of transmitting
the vibrations. In this connection it is customary to refer to the
classical experiments of Hawksbee {Phil. Trans., 1705), in which
a bell is caused to ring under an evacuated glass jar. When the
i

2 INTRODUCTION
jar is full of air at atmospheric pressure the sound is clearly heard
;
after the air is withdrawn the sound is hardly perceptible. Tyndall
(Sound, p. 7, 1867), with an improved pump and the use of hydrogen
gas to replace the air in the jar, rendered the bell quite silent. It
is important of course, in this experiment, to ensure that the
vibrations of the bell are not communicated to the air outside the
jar via the supports, i.e. the bell should be suspended by thin
strings which are incapable of transmitting an appreciable amountof the vibration.
We are naturally inclined to regard the atmosphere as the
universal medium for the transmission of sound. Speech, music,
and all the familiar noises of everyday life are conveyed to the
ear through the surrounding air. It is therefore not very sur-
prising that until comparatively recent times the practical utilisa-
tion of other media as vehicles for the transmission of sound has
been somewhat neglected. The exigencies of war made a study
of sound propagation in the sea a necessity, and we were thus
brought to realise that this relatively homogeneous medium is
almost ideal for the purpose. As a result of this study manyimportant applications of under-water sound transmission have
been developed. On account of the heterogeneous nature of the
earth's crust little practical development has so far been possible
in its use as a medium for sound transmission. The passage of
sound through solid wires and bars is of course familiar to all,
but we have only limited experience yet of sound propagation
through an extended solid mass, comparable in bulk with the
atmosphere or the sea.*
To complete the natural sequence of events a suitable receiver
is required to collect the sound energy after transmission through
the intervening elastic medium. In the case of sound transmission
through the atmosphere the ear forms a natural, though not
always the most convenient receiver. When liquids or solids
transmit the sound other forms of receiver are generally necessary
or preferable.
The production, transmission, and reception of sound has nowdeveloped into a science with many important technical applica-
tions. Before dealing with the subject in detail, however, we shall
recall briefly a few of the more familiar points, with the object
of defining certain terms which will occur frequently in the text.
Musical Sounds and Noises - There can be no hard-and-fast
# This disregards the case of propagation of earthquake waves, natural or
artificial, through the various layers forming the earth's crust and interior.

INTRODUCTION 3
line of division between a musical sound and a noise, for some
noises have a more or less musical character, whilst some musical
sounds are not free from noise. The extreme cases, of course,
raise no difficulty. Musical sounds are characterised principally by
smoothness and a pleasing effect on the auditory nerves, whereas
noises are of an irregular or explosive nature. A musical sound
is regular or periodic, i.e. the vibrations repeat themselves at
regular intervals. The converse is, of course, not necessarily
true, for the periodic repetition of a noise—like a clock tick
—
would not constitute a musical sound unless the noise were
repeated at a frequency above the Tower audible limit.' If
the edge of a card is struck by the teeth of a rotating wheel the
sounds heard might therefore be regarded as a succession of noises
up to a speed of about 20 taps per second, merging into a musical
sound, of a harsh character, at higher speeds.
We shall be principally concerned in the following pages with
musical or periodic sounds of frequency within, or above, the
audible range.
Frequency. Pitch - The frequency of a regular or periodic
vibration is the number of vibrations performed per second.
The period of a vibration is the reciprocal of the frequency, i.e.
the time taken to complete one vibration. Musical sounds arrange
themselves in a natural order according to pitch. The latter
depends solely on the predominant frequencv of the vibrations
—
the greater this frequency the higher the pitch. This is simply
verified by means of the toothed wheel and card mentioned above
or by means of a siren which produces a sound whose funda-
mental frequency is proportional to the product of speed (revs,
per sec.) and the number of holes in the revolving disc.
Musical Intervals. Diatonic Scale - In the case of musical
or periodic sounds within the audible range we recognise certain
corresponding differences of pitch called intervals which are
always regarded as the same, for the same relationship, wherever
they occur in the scale. Physically, the intervals are distinguished
by the property that the frequencies corresponding to the respec-
tive pitches are in a simple numerical ratio. The more important
consonant intervals, with their frequency ratios, are
:
Unison . . 1:1 Fifth . . 3:2Minor Third . . 6:5 Major Sixth . . 8:5Major Third . . 5:4 Minor Sixth . . 5:3Fourth . . 4 :3 Octave . . 2:1

4 INTRODUCTION
The notes whose frequencies are multiples of that of a given one,
the fundamental, are called harmonics. A slight mistuning of
either note comprising a consonant interval produces the phe-
nomenon of beats. If the mistuning is more serious, the beats
become more rapid, a sense of discord is experienced, and ulti-
mately two independent notes of the diatonic scale are recognised.
The frequency-ratios which define each note of the Diatonic
Musical Scale (the basis of European music) are as follow :
—
CDEFGABC1 11 1J 11 11 If 1| 2.
The same series of ratios applies to any other octave which maybe chosen.
Intensity. Loudness - These terms refer to the external, or
physical, and the internal, or subjective, aspects respectively.
The intensity of a sound refers to a definite physical quantity
which determines the rate of supply of vibrational energy. This
energy is proportional to the square of the amplitude of vibration
(this being measured by the maximum excursion of the vibrator
from its central position). Loudness corresponds to the degree
of sensation, depending on the intensity of the sound and the
sensitiveness of the ear under the particular conditions. Near the
limits of audibility the loudness may be very feeble, although the
intensity be very great. In this connection also it is important to
note that the sensation of loudness is not simply proportional to
intensity (or to amplitude). The range of intensity to which the
ear can accommodate itself is indeed remarkable. Thus extremely
feeble vibrations having an amplitude of the order 10~ 8 cm. can be
detected by the ear, the same ear remaining undamaged by the
sound of a violent explosion at a short range. The ear can thus
easily accommodate itself to deal with sounds varying in amplitude
in the ratio of 1 to 10 6, or in intensity in the ratio 1 to 10 12
. Therelation between sensation and stimulus is generally expressed
by Weber's law: "The increase of stimulus necessary to produce
the minimum perceptible increase of sensation is proportional to
the pre-existing stimulus." From this law Fechner derived the
relation
S=£logI or dS/dI=k/I,
5 being the magnitude of the sensation, I the intensity of the
stimulus, and k a constant. Such a law is difficult to verify
experimentally on account of the uncertainty in the measure of

INTRODUCTION 5
S the sensation. The fact remains, however, that the sensitiveness
d§ldl of the ear diminishes rapidly with increase of total intensity
of the sound. Many feeble sounds which are easily audible in
the 'stilly night' could not be heard in the 'noisy day.'
Quality. Wave-form - Sounds of the same pitch and loudness
but produced by different means are distinguished by their
'quality.' Thus the same note produced by a voice, a piano,
and a violin has distinct characteristics which are at once recog-
nisable by the ear. The statement that notes of the same pitch
have the same frequency is therefore somewhat indefinite; the
same 'predominant frequency' is implied. Very few sounds
can be regarded as 'pure,' i.e. free from overtones. A note
sounded on the piano is complex since it may contain, in addition
to the fundamental note, a large number of overtones. Thepresence or otherwise of these overtones decides the quality of
the sound. A tuning-fork emits a note which is almost pure,
whereas the same note on a violin may contain many important
overtones. These overtones reveal to the ear the nature of the
instrument producing the sound. Analysis of the wave-form of
a particular sound reveals which harmonics are present and their
relative intensities. Wave-form is therefore an indication of
'quality.'
Velocity - The passage of sound from the vibrating source
through the intervening medium is not instantaneous. The flash
and the report of a distant gun are separated by an appreciable
time-interval, indicating a finite velocity for the sound as it travels
through the atmosphere. The time taken for the flash to reach
the observer being quite negligible, it is possible to determine
the velocity of the sound wave in a very simple and direct mannerprovided the distance between the gun and the observer is known.
Of course there are various other factors involved in a reliable
determination of the velocity, but we need not consider themat present. Sound travels with different velocities in different
media. For example, sound travels faster in a long iron pipe or
bar than in the surrounding air. This is easily verified by an
observer listening at the end of a long iron rail whilst a confederate
strikes the rail at the opposite end. Two sounds will be heard,
the first to arrive via the iron, the second via the air. Thevelocity of sound in air is about 330 metres/sec, in water about
1500 metres/sec, and in steel about 5100 metres/sec-—covering
a range of approximately 16:1

6 INTRODUCTION
Within wide limits the velocity of sound is approximately
independent of intensity or frequency. Otherwise distant music
would be confused and discordant. When the amplitude of the
vibration is very great, however, as in the vicinity of a violent
explosion, this simple law no longer holds, for the variations of
density of the medium are then comparable with the normal
density.
Propagation ofSound. Longitudinal Wave-Motion- Sound,
in transmission through an elastic medium, has all the character-
istics of wave-motion. Just as ripples spread outwards in twodimensions from a stone thrown into a pond, so waves of sound
spread, in three dimensions, in the elastic medium in contact with
a vibrating body or 'source' of sound. The movement of any
particle of the medium is, however, purely local, each particle
making small to-and-fro excursions in a manner similar to that of
the vibrating body itself. This local motion of the particles
must be clearly distinguished from the motion of the disturbance
which travels forward from layer to layer of the medium with an
ever-increasing radius. It is the state of to-and-fro motion which
advances, the medium as a whole, after the disturbance has passed,
remaining in its initial position. As we shall see, the velocity
with which the wave travels is dependent on the elasticity and
density of the medium. This wave-ydocity must not be confused
with the variable particle velocity involved in the to-and-fro
vibration. Sound waves differ from water waves, or ripples, in
one important respect, viz. the vibratory motion takes place in
the same line as the direction of advance of the wave, whereas in
the case of ripples the to-and-fro motion is at right angles to the
direction of propagation of the wave. The former type of motion,
as in the sound wave, is called longitudinal', the latter, transverse.
The general character of longitudinal wave-motion may be
demonstrated by means of a long helical spring {e.g. 6 feet long,
3 or 4 inches diameter, of wire 0-06 inch thick) supported hori-
zontally at frequent intervals by threads. If one end be movedto and fro longitudinally, a corresponding motion will travel, like
a wave, to the other end. This simple apparatus may be used to
demonstrate effects of reflection, etc., with which we are not at
present concerned.*
* A useful wave-model has recently been demonstrated by Mr. T. B.
Vinycomb (Phys. Soc. Exhibition, 1927). This will be found valuable
as a means of observing in ' slow motion ' the various wave phenomenaencountered in the study of sound.

INTRODUCTION 7
Order of Treatment - The logical order of treatment of the
theory of sound involves three fundamental considerations. First,
a vibrating body or 'sound source' is necessary; second, an
elastic medium in contact with the body is required to transmit
the vibrations to a distant point ; and third, some form of receiver
is necessary to absorb the energy from the medium and to recon-
vert it into a form which is convenient for observation. We shall
follow this order of treatment as far as practicable.


SECTION I
THEORY OF VIBRATIONS
The simplest and most fundamental type of sound sensation
is that which corresponds to a simple harmonic motion
—
i.e. to
the simplest mathematical form of periodic function. Simple
harmonic motions may vary in period and amplitude but in no
other manner ; they are consequently ideal for the production of
'simple' or 'pure' tones. Another important feature of this
form of motion is the possibility of transmission from one mediumto another without change of form. Again, it has been proved
by Fourier that the most complex form of periodic motion can
be analysed into a series of simple harmonic motions having
frequencies which are multiples of that of the complex motion.
The vibrations of a tuning-fork may approximate closely to a
simple harmonic motion, the sensation resulting being described
as a 'pure tone.'
VIBRATIONS OF A PARTICLE
Simple Harmonic Motion - The study of the motion of vibrat-
ing bodies, sources of sound, is complicated by the presence of the
surrounding medium. This medium withdraws energy from the
sounding body and consequently exerts forces of reaction on it.
We shall for the present, however, ignore such forces and consider
only the vibrations of a simple isolated system.
The typical case of simple harmonic motion is that of a particle
attracted towards a fixed point O in the line of motion with a force
varying as the distance from that point. If s denote the force at
unit distance, the force at a distance x will be — sx, the sign being
always opposite to that of x. Thus, if m is the mass of the particle,
d^xmTt
=-sx .... (1)
If we write
n 2 =s/m .... (2)
we have
d^x
STHA.-0. ... (3)

IO VIBRATIONS OF A PARTICLE
of which the solution is
x=A cos nt-\-B sin nt
or substituting A=a cos e and B = — a sin e,
x=a cos (nt+ e)
where the constants A, B, or a, e, are arbitrary
(4)
• • (5)
The motion is
therefore periodic, the values of x and dx/dt recurring whenever
nt increases by 2tt. The maximum displacement a is called the
amplitude of the oscillation. The period
T=27T/n=27rVmJs ... (6)
is always the same whatever the initial conditions of amplitude
a or phase e, hence the oscillations are said to be 'isochronous.''
The type of vibration represented by (5) is of fundamental
importance. The equation shows that the particle oscillates
continuously between two points which are at a distance a from the
centre O. By simple differentiation, the velocity of the particle,
which moves as in (5), is given by
dx\dt= — an sin (nt+ e) . . (7)
and the acceleration
d2xjdt2=— an2 cos (nt+ e) (8)
= — n 2x, as postulated in (1). The meaning of equation (5) is
best exemplified in the case of a point P moving uniformly with
constant angular velocity n in
a circular path, of radius ' a,'
see fig. 1 . The orthogonal pro-
jectionM of P on the fixed dia-
meterAOB will perform simple
harmonic motion in accordance
with equation (5). The angle
0=(«£+e) indicating the posi-
tion of P, and hence of M, after
a time t, is called the phase at
that particular instant; whilst
the angle e, the starting posi-
tion P when t=0, is known as
the initial phase or 'epoch.'
If we denote OM by x it will be seen that the displacement of
M from O is
x=a cos 6=a cos (nt+ e).
Fig. i

SIMPLE HARMONIC MOTION ii
A simple harmonic motion may consequently be described as the
orthogonal projection of a uniform circular motion. The periodic
time T is the time of revolution lirjn of the point P, and the
amplitude is the radius * a ' of the circle.
The frequency * of the motion, i.e. number of oscillations of
the point M per second, is w/27?, or the number of revolutions of
P per second. The expressions for the velocity and accelera-
tion of the point M are obtained by considering that these are
equal to the projections on AB of the corresponding quantities
for P. Since the linear velocity of P is an, then the velocity
of M is equal to — an sin (nt+ e), the minus sign being a con-
sequence of the negative direction of the velocity of M when 6
is positive. The acceleration of the point P is directed radially
inwards towards the centre O of the circle and is equal to a 2n 2/a
=an 2. The resolved component of this along AB gives the
acceleration of M, viz. —an 2 cos (nt+ e), or —n 2x.
A useful means of studying periodic motions is the graphical
method in which displacements, velocities, and accelerations are
plotted as ordinates with the time *t ' or the phase angle 9 (that
is (nt^e)) as abscissas. Such curves are shown in fig. 2. Curve
(c) acceleration
(b) velocity
i. (a) displacement
^1 L
Fig. 2
(a) represents the displacement x as a function of 6, curve (b)
the velocity dx/dt, and curve (c) the acceleration d2x/dt2. The
ordinates for these three curves are not plotted to the same scale
in the figure—the values shown must be multiplied by n and n2
respectively to give the true values of velocity and acceleration.
It will be seen that the velocity is always 90° (or 7r/2), and the
* The quantity ' n ' which characterises frequency in equations ofperiodic motion has no well-recognised descriptive name. The term' pulsatance ' is sometimes used. Thus pulsatance n~2n x frequency.

i2 VIBRATIONS OF A PARTICLE
acceleration 180° (or tt) out of phase with the displacement. In
the light of equations (5), (7), and (8) above it is evident that the
slope and curvature of the displacement curve in fig. 2 represent
particle velocity and acceleration respectively. The velocity is
a maximum (equal to nd) when the displacement is zero, and the
acceleration is a minimum (equal to —n 2a) when the displacement
is a maximum (equal to a).
Examples ofSimple Harmonic Motion - In the form of motion
we have just considered the force is always directed to a central,
or equilibrium, position and varies as the distance from that
position. As equation (6) indicates, the periodic time of such a
simple oscillation is T=27TV/
m/s, i.e. the period increases with
the mass m and decreases with the ' stiffness ' or ' elastic ' constant s
(s being the force required to produce unit displacement of the
mass from its zero position). This relation is of very wide
application in the study of sound vibrations; in fact by means
of this principle it is sometimes possible to obtain limits for a
periodic time of a vibrating system, which cannot easily be
calculated exactly. The following examples are given as typical
of simple harmonic motion :
—
(1) The Simple Pendulum - A particle P of mass m is sus-
pended by a light string of length / from a fixed point C (see
fig. 3). The particle makes small oscillations in a vertical plane
about a point O. Let 9 be the angle
of inclination of the string to the
vertical, a being the length of the arc
OP, and x the length of the perpen-
dicular PN from P on OC. Thetension of the string has no component
in the direction of the tangent to the
arc, hence the force restoring the par-
ticle is the component of mg in that
direction, viz. —mg sin 9. To the first
order of approximation we may regard
sin 9 as equal to 9 and the chord x equal
to the arc a, when the angle of swing is
small. Consequently we may write: Restoring force =—mgx/l,therefore the motion is simple harmonic, and s (the restoring
force per unit displacement) =—mg/l. Consequently the
periodic time
T=27TVm/s=27TVml/mg=27rVl/g.

SIMPLE HARMONIC MOTION 13
This case of the simple pendulum may be used to illustrate manyimportant principles in the theory of sound. In spite of the fact
that the periodic time and amplitudes involved are so widely
different in magnitude, the treatment is fundamentally the same.
(2) The vertical Vibrations of a Mass suspended on a Helical
Spring - To a first order of approximation this case also provides
a good example of simple harmonic motion. Assuming the
spring obeys Hooke's law, the restoring force is propoitional to
the displacement x, and neglecting the mass of the spring,* wehave: Restoring force =— sx, Mass moved =m, Periodic time
T =2tt Vm/s. This result is conveniently expressed in terms of the
statical increase of length which is produced by the weight whenhanging in equilibrium. Denoting this by /, we have sl=mg, so
that the period is T=2irVl/g, the same as that of a simple pen-
dulum of length /.
It requires little effort to suggest further examples of the
same nature. In all such cases when we are dealing with a
central force proportional, but of opposite sign, to the displace-
ment the motion is simple harmonic with a period 27rVm/s-—
•
the greater the ' stiffness ' the smaller the period, the greater the
'inertia' the greater the period. Expressed in terms of frequency
of vibration the rule becomes
—
the smaller the ' inertia ' or the greater
the 'stiffness,' the higher the frequency ; frequency =—Vs/m.277
Energy of a Particle in Simple Harmonic Motion - We have
seen that the velocity v of the particle in S.H.M. is given bydx—= —an sin (nt+ e). Consequently the kinetic energy at this
instant is
E =\mv 2 =\ma2n 2 sin2 (nt+ e).
Now the sum of the kinetic E and the potential P energies is a
constant (since no energy enters or leaves the particle), and whenone form is at a maximum value the other is zero. Thus the
maximum value of E gives us the total energy of the vibrating
particle, i.e \ma2n2. Hence E JrF=^ma 2n 2
, whence
V=\ma 2n2{l— sin2 {nt Jr ^j)=\ma2n2 cos 2 (nt-\-e).
Now the displacement at any instant t is x=a cos (nt-\-e). Con-sequently the potential energy of the particle at that instant is
* The inertia of the spring can be allowed for by adding one thirdof its mass to that of the suspended mass (see p. 14).

i 4 VIBRATIONS OF A PARTICLE
P=^mn 2x2, i.e. proportional to the mass m of the particle, the
square of the frequency (77/2-77), and the square of the displace-
ment x.
Since the mean values of sin2 (nt^-e) and cos 2 (nt+ e) are each
equal |, we have
Mean Kinetic Energy =Mean Potential Energy =\ma 2n 2
and
Maximum Energy =\ma2n 2.
Consequently the energy is on the average half kinetic and half
potential. The energy is a maximum at the mid-point and the
two turning points of the vibration, in the former case all kinetic
and in the latter cases all potential.
It is often convenient to study the motion of a particle from
the standpoint of potential and kinetic energy. Thus if the
particle of mass m vibrate under the action of a restoring force
which is — s times the displacement, the kinetic and potential
energies are given by
mx2 and P= I sxdx sx*.
Since E+P=constant, \mx2jr\sx2=constant. On differentiating
we obtain mx-{-sx=0, the solution of which is
x=a cos (nt+ e) where n=Vs/m=27r/T,
and a and e are constants representing the amplitude and initial
phase of the motion. That is, we obtain the ordinary equation for
the simple harmonic motion of the particle having a periodic time
T=27rVmJs.Example - As an example of the application of this method
consider the case of a mass M suspended by a coiled spring, the
mass of the latter being too great to be negligible. Assuming
the spring of mass m to be uniformly stretched at every instant
of the motion, we have Y =\sx2 where s is the force required to
produce unit extension of the spring.
Kinetic energy of the suspended mass =§M#2,
[l m (y \ 2
Kinetic energy of the spring = I \— . dy . [jxj =lmx2,
where I is the length of the spring, y is the distance of the element
Sy from point of support. Therefore, total kinetic energy of
system =|(M+Jm)P and the periodic time T=2TrV(M.-\-lm)/s.

SIMPLE HARMONIC MOTION 15
Thus, in calculating the period, one-third the mass of the spring
must be added to the mass of the suspended weight.
Composition ofSimple Harmonic Motions - If a single particle
is acted on by a number of distinct forces, each of which acting
separately would cause the particle to perform simple harmonic
motion, the question arises as to the resultant motion of the
particle, assuming that each force produces its own effect.
Case I - Vibrations of the same Frequency and in the same
Straight Line, (a) Two forces only. Let the two vibrations be
represented by
x1 =a1 cos (ftZ+eJ and x2 =a2 cos (nt-\-e2) . (1)
Since the two displacements are in the same straight line and each
produces its own effect, the resultant displacement is x=x1Jrx 2 ,
that is
x=A cos nt—B sin nt ... (2)
where
A=ax cos e 1 -\-a2 cos € 2 \
and I . (3)
B =a± sin e 1Jr a 2 sin e 2 J
Writing
we have
Thus
i.e.
A=r cos 9 and B =r sin 6
r 2=A 2+B 2 and tan#=B/A . . (4)
x=r(cos nt cos 6— sin nt sin #),
x=r cos (nt+ 6) . . . (5)
This indicates that the two component simple harmonic vibrations
result in a vibration of the same frequency but with amplitudeand phase given by r and 6 respectively. The values of r and6 may easily be deduced in terms of a1a2 and ex € 2 from equa-tions (3) and (4) above, whence it will be found that the resultant
amplitude
^=fc 2 +«2 2+ 2tf1 tf 2 cos(e 1-e 2)}* . . (6)
and
_ a1 sin ei+tfo sin «r 2tan0=^ Li-J. . (7)
a± cos e1 -\-a2 cos e 2v '

where
and
16 VIBRATIONS OF A PARTICLE
It is a simple matter to obtain the same results graphically. It
will be found that two simple harmonic oscillations in the samestraight line may be combined like two forces in the usual paral-
lelogram construction, i.e. according to the law of vector addition.
The diagonal of the parallelogram represents in length the amplitude,
and in direction the phase of the resultant vibration.
(b) Any Number of Vibrations - In a similar manner it may beshown that any number of simple harmonic vibrations of the samefrequency result in a vibration of the same type.
Thusx= Ha cos (nt+ e) \
= cos ntHa cos e— sin ntHa sin e •. . (8)
= r cos (nt-\-6)
r={(Ha cos e)2 +(Ha sine) 2}* . . (9)
Ha sin e , %tan0=—
-
. . . (10Ha cos e
The particular case of two forces only, (a) above, may be at once
deduced from these expressions.
Regarded from the graphical standpoint, since two S.H.M.'s
of the same frequency and in the same straight line may be com-
bined, it will be seen that any number of such vibrations can be
combined by taking the resultant of any two of them and com-
bining it with a third vibration and so on, until the final resultant
is obtained. Such a system of vibrations is reduced to a single
resultant by a vector polygon in exactly the same manner as a system
offorces acting at a point.
(c) A large Number of Vibrations of the same Amplitude and
Frequency but differing progressively in Phase - This case is of
particular importance when we come to deal with the subject
of diffraction of sound waves (see p. 300). The effect of super-
posing m component vibrations of the same amplitude and fre-
quency, but progressively differing in phase by e, may be obtained
from equations (9) and (10). We must now write
^ r • • c • sin (me/2) . meLa sin e=<2[sm e+ sin 2e+ . . . + sin me\=—— . sin
andsin (me/2) me
Ha cos e=«[cos e+ cos 2e+ • • + cosme] = —
—
.cos
sin (e/2) 2
sin (me12) mt
sin(c/2) 'g0ST

SIMPLE HARMONIC MOTION i7
whenceR
ma sin 6and 6
me(10a)
Fig.
where 26 is the phase difference between the first and the last of
the component vibrations. The »
same result may be obtained, if •
required, from the vector polygon
(see fig. 4). Commencing at O in
the line OX the polygon OABP is
constructed with each side of length
a and making an angle e with its
neighbour. The resultant vibration
R is given in amplitude and phase
by OP the closing side of the
polygon.
Phase Change Continuous - Acase of special importance arises
when the component amplitudes a
and phase difference e may be re-
garded as infinitesimal. The polygon then becomes a con-
a chord. If a is represented by a
length §s of the curve and e by a
small change of angle 89\ we have
as before 6fr/W= (constant), or
s= 6' X (constant), which defines
the arc of a circle tangential to OXat O (see fig. 5). The constant
in this relation is the radius r
of the circle. Writing as before
Z.XOP = 0, then 0' =26 and s=26r.
w The resultant vibration is repre-
sented by the closing side of the
polygon, i.e. the chord OP joining
the extremities of the arc. We see from the construction that
R=chord OP=2rsin0,and the arc of length 2rd must also be mSs, whence r=mSs/26.Consequently
tinuous curve close by
R:mSs . sin
s sin —2
or
which is in agreement with equation (10a).

iS VIBRATIONS OF A PARTICLE
Whenever 6 is an odd multiple of 77, the last component
vibration being in opposite phase to the first, and 6 an odd multiple
of 7r/2, the resultant R( 2s/7r) is equal to the diameter of the
semicircle formed by the vector addition of the components.
Similarly when 6' is an even multiple of rr, the polygon is a com-
plete circle and R becomes zero.
Continuous Phase Change. Amplitudes gradually diminishing.
Spirals - An interesting and important modification of the case
just considered occurs when the successive amplitudes are slowly
diminishing in magnitude (see fig. 6). From 6\ to w, the
polygon is represented approxi-
mately by a semicircle; from
77 to 2t7 a second semicircle is
added but the diameter is
slightly less on account of the
gradual decrease in amplitude
;
a third semicircle of still smaller
diameter is added between 2 77
and 3 rr, and so on. Actually,
of course, the radius of curva-
ture of the polygon gradually
diminishes. For an infinite
number of component vibra-
tions the polygon becomes a
spiral curve converging asymp-
totically to the centre P of the
first semicircle. In such a
case the resultant R(=OP) is equal to half the resultant corre-
sponding to the first half-turn of the spiral and is 77 2 out of phase
with the first component vibration at O. In general, it is evident
that
Rx R,R
2 2
where R x and RL are the resultants corresponding to the first and
the last (LTh) half-turn of the spiral. As L increases RL diminishes
and ultimately becomes zero when L is infinite.
Case II - (a) Vibrations of Different Frequency, and in the same
Straight Line. In this case
x=a1 cos (n^— e^—aoCos (iiot^eo) . . (11)
If n± and n 2 are incommensurable the value of x never recurs,

SIMPLE HARMONIC MOTION 19
consequently the resulting motion is non-periodic. If, however,
nx and n 2 be in the ratio of two whole numbers, x will repeat after
a time equal to the L.C.M. of nx and n 2 , but the vibration will
not be simple harmonic although it is periodic. The case whenn 1 and n 2 are commensurate will be considered under Fourier's
theorem (see p. 25).
(b) Slightly different Frequencies. Beats - A special case arises
when the frequencies of the component vibrations are almost
equal. This case is of frequent occurrence and of considerable
importance. If the two vibrations represented on the right-hand
side of equation (11) have the same amplitude, frequency, and
initial phase it is evident that the resultant amplitude will be
double that due to either of the forces individually. If now one
of the vibrations has a slightly higher frequency than the other
the combined vibration will at first be nearly the same as if the
frequencies were equal
—
i.e. the resultant amplitude will be double
the ' single ' amplitude. As the higher frequency vibration gains on
the lower, however, thereby changing the relative phase, a point
will be reached when they are in opposition and will neutralise
each other (amplitude zero). After a further interval they will
again be in phase and the amplitude doubled and so on.
Let the two frequencies be njln and (n Jr m)/2iT, m being small
compared with n. The corresponding vibrations are
x1 =a1 cos (nt-^-e-^) \
and L . (12)
x2 =a 2 cos (nt+mt-\-€ 2)J
Since m is small compared with n these equations are similar to
(1) above, if we regard (mt+ e 2) as the phase term in the second
equation. Consequently as in equations (6) and (7) the resultant
amplitude and phase are given respectively by
r= [a12-\-a2
2 -\-2a1a2 cos {e1— (m£+ £2)}]* . . (13)
and
tan 6-ai Sin €l+ ^2 Sin
(mt+ €2) QT)
ax cos e1 -\-a2 cos (m£+ e 2)
the resultant displacement being
x=r cos (nt-\-6) . . . (15)
The resultant vibration of frequency 72/2-77 may thus be regarded
as harmonic with amplitude r and phase 9, which vary slowly
with a frequency m^ir. The amplitude is a maximum when
cos (e 1— e 2
— m/) = -fl, r=a1 -\-a 2 ;

20 VIBRATIONS OF A PARTICLE
and a minimum when
cos (€ ±— € 2— mt) = — 1, r=a
1—a 2 .
If we take for simplicity the case when
a1 =a 2iand ej — e 2
=0y
x=r cos nt
and
r={2a 2(l Jr cos m£)}
(16)
(17)
i.e. the resultant amplitude varies between 2a and 0, the time interval
between two successive maxima being 2rr/m.
The phenomenon of 'beats,' illustrated in fig. 7, is observed
when two notes nearly, but not quite, in tune are heard together.
In such a case a periodic rise and fall of intensity is noticed. Theexplanation is afforded by the above analytical treatment, wThich
indicates also the importance of arranging approximately equal
component amplitudes to secure the greatest contrast between
maxima and minima. When two notes of nearly equal pitch are
sounded together the frequency of the beats is m/27r if n/2-n- and
(w+m)/27T are the frequencies of the two notes. This principle
may be employed to tune two notes to unison with considerable
accuracy. Under favourable conditions beats as slow as 1 in
30 seconds may be recognised.
The phenomenon of 'beats' has also a very important signi-
ficance in the case of electrical oscillations of radio-frequency (of
the order 10 6 cycles per second) and in the corresponding case
of high-frequency sounds. The beat effect in these examples is
generally known as 'heterodyne.' Briefly, two very high and
quite inaudible frequencies n and (n-\-m) are rendered audible,
after rectification, by slight mistuning—the number of beats per
second m falling within the range of frequencies perceptible by
the ear.
Case III - Vibrations of the same frequency in directions at
right angles. In this case we are dealing with the motion of a
particle in a plane. The projections of this motion on rectangular

SIMPLE HARMONIC MOTION 21
axes x and y each represent a simple harmonic motion. Let these
motions be indicated by the equations
^=«cos(wf+ e1) and v=&cos(^+ e 2) . (18)
Since the axes are rectangular and the amplitudes of the motion
a and b, the path of the particle must lie within a rectangle of
sides 2a and 2b. Eliminating t from these equations, we obtain
the equation to the curve of resultant motion of the particles, viz.
J+fJ-5- cos(ei^ £2)^ sin2(€i~£2)=0• (
19)
This is the equation of an ellipse whose position and dimensions
depend upon the amplitudes a and b and the initial phases e x
and e 2 . If e ± is equal to e 2 or they differ by tt (half a period) the
ellipse takes the form of two coincident straight lines
lx y\2
If the phases differ by tt/2 (quarter period), 003(6!— e 2)=0 and
the equation becomes
x2 y 2
an ellipse whose axes coincide with the axes of co-ordinates x
and y. If, in addition to this condition the amplitudes a and b
are equal, the orbit of the particle becomes a circle with centre
at the origin, viz. x2jry2 =a2
.
Frequencies nearly Equal -When the two S.H. vibrations are
exactly alike in frequency the elliptic paths referred to above
remain perfectly steady. If, however, there is a slight difference
between the frequencies, the form of the ellipse will slowly change.
This effect is due to the gradual change in the relative phase
(€x—
e
2) of the two components. The boundary of all the possible
elliptic orbits is a rectangle of sides 2a and 2b, since the extreme
values of x and y are -±_a and ±6 respectively. We shall nowconsider the effect of maintaining a and b constant whilst slowly
varying (e x—
c
2). Starting with the phases in agreement, e1 =€ 2 =0,x y
the ellipse coincides with the diagonal 7 = of the rectangle.
As (e1— €2) increases from to 77/2 the ellipse opens out to the
x 2 y 2
form ~^+t2= 1) afterwards closing up again and ultimately

22 VIBRATIONS OF A PARTICLE
x ycoinciding with the other diagonal —r--r=0, as U 1
— e 2) increasesa b
from 77/2 to 77. As the phase difference varies from 77 to 27r the
reverse process takes place until the ellipse again coincides with
the first diagonal. The cycle of changes is illustrated in fig. 8 (a).
The frequency of this cycle is clearly equal to the difference of
frequency of the component simple harmonic motions.
2:1
3:1
Vibrations of this character may be demonstrated in a very
convincing manner by means of the spherical pendulum. Aheavy bob suspended on a thread or a wire describes an elliptic
path with period T=27rVl/g as it swings under the action of
gravity. By varying the amplitudes of displacement along the
x and y axes the bob can be made to describe the series of ellipses,
circles, and straight lines shown in fig. 8 (a).
Case IV - Vibrations, having frequencies commensurate {or
nearly so), in directions at right angles. When the ratio of fre-
quencies w2:l the component vibrations are represented by
x=a cos (2nt Jre 1) and y=b cos (nt+ e 2). (20)
which, on elimination of t, give the resultant orbit of the particle,
viz.
I2 4y 2
fj/2 x
)
sin( €l-€
2) j+— ^- +- sin
(Cl-e2)-lJ
=0 (21)
This is the general equation for a curve having two loops which
(for (€ 1— € 2)=m7r/2) degenerates into two coincident parabolas,
represented by the equation
2y 2 x
b 2 a0.

SIMPLE HARMONIC MOTION 23
If the frequencies depart slightly from the ratio 2 : 1 the form
of the curve slowly varies in a manner indicated by variations
of fa— e 2) in equation (21). Typical curves of this character are
shown in fig. 8 (b).
When the ratio of frequencies is 3 : 1 an equation of the sixth
degree represents the resultant orbit. Taking the case where
e 1= e 2 =0, x=a cos Snt and y=b cos nt,
the equation obtained by eliminating t is
4y 3 3v x
~¥~T+ a
representing two coincident cubic curves. When fa— € 2)=tt/2
the equation is one of the sixth degree,
•8\ / /L%»2\2y2\l 4y2 \ 2 x2
(22)
which represents a curve having three loops. As in the previous
cases, when the ratio of frequencies is not exactly 3:1, the form
of the curve changes slowly in accordance with the change of phase
relationship fa— e2). Typical phases of the curve are shown in
fig. 8 (c). If the ratio of frequencies is a whole number 'N' the
number of loops in the figure will also be N. This analytical
process of determining the resultant motion of a particle acted on
by simple harmonic forces at right angles becomes rather cum-brous when the ratio of frequencies is greater than 3, and graphical
methods become more suitable.
Blackburn's Pendulum - A very simple experimental methodof investigating the combination of rectangular vibrations is that
known as Blackburn's pendulum. Taking the general case of two
motions at right angles,
x=acos(knt-\-e1) and y=b cos (w£+ e2) . (23)
where k is a constant representing the ratio of the frequencies
of the component vibrations, it is possible by means of this
pendulum to determine the resultant motion. Blackburn's
pendulum is of simple construction. It consists of a weight Phanging on a string OP attached at O to another string AB fixed
at the ends (see fig. 9). Neglecting the inertia of the strings,
the point P will always be in the same plane as AOB. It will be
seen that the motion of P may be either that of a simple pendulum

24 VIBRATIONS OF A PARTICLE
of length OP (vibrating in the plane of the diagram), or of a simple
pendulum of length NP (vibrating at right angles to the plane of
the diagram), or of a combination of these two vibrations. Thusif OP=/! and NP=/2 , the two component frequencies will be
k1
and f2
1
2^
Fig.
respectively. The resultant motion of the bob will in the general
case be represented by equation (23) above..
Various modifications of this pendulum, to give simple controls
of the relative frequencies, amplitudes,
and initial phases, have been described #
and the reader is referred to these de-
scriptions for further details of this
fascinating and instructive apparatus.
The numerous figures obtainable bymeans of Blackburn's pendulum are
generally known as Lissajous' figures.
The figures were first produced byLissajous using an optical method as
an accurate means of comparison of
vibration frequencies of two systems
in motion at right angles. The experiment is most directly
carried out by means of two tuning-forks vibrating in planes
at right angles. One prong of each fork carries a small mirror,
and a spot of light is reflected successively from the two
mirrors on to a screen where the combined motion of the two
forks is clearly shown. Many other optical and mechanical
devices have been described for producing Lissajous' figures.
Wheatstone's " kaleidophone " (1827) gives some of these figures
in a very simple way. It consists of a straight rod clamped in a
vice and carrying an illuminated bead at its upper end. If the
rod is circular in section the end will describe a circle, ellipse,
or a straight line—but on account of slight differences in elasticity
in different directions the figure usually changes and revolves.
By bowing the rod at different points, vibrations of overtones are
superposed on the fundamental. In this way the frequencies of
the first and second overtones were found by Tyndall to be 6-25
and 17-36 times the frequency of the fundamental (see p. 113).
* (1) Etude Optique des mouvements Vibratoires . J. A. Lissajous. Pub-lished 1873. (2) Harmonographs and Vibration Figures. Gould, Benham,Kerr, and Wilberforce (Newton & Co., London). See also W. Pupp{Phys. Zeits., 30, p. 427, July 1929).

FOURIER'S THEOREM 25
By means of the cathode-ray oscillograph * the formation of
Lissajous' figures at any frequency (e.g. of the order 10 6) is very
simply demonstrated. In this case the 'vibrations' at right
angles are electrical and produce proportionate displacements of
a beam of cathode rays which subsequently fall on a photographic
plate or a phosphorescent screen, where the resultant motion,
i.e. the Lissajous figure, is indicated.
As we have already seen, the frequency of repetition of the
cycle of Lissajous' figures is equal to the difference of frequency
of the component vibrations when these are nearly equal—corre-
sponding to the effect of beats in the case where the component
vibrations are co-linear.
The production of stationary, or slowly-changing, Lissajous'
figures has an important application in the comparison of fre-
quencies of vibration. Thus Konig studied the effect of
temperature on the frequency of a tuning-fork by means of the
Lissajous' figures formed by this fork and another 'standard'
fork. In a similar manner he investigated the effect on frequency
of a fork, produced by proximity of a resonator having varying
degrees of slight mistuning. Recently D. W. Dye has employed
the cathode ray oscillograph for the harmonic comparison of very
high frequencies (10 5 cycles/sec.)—the high frequency being
adjusted to an exact multiple of a 1000 p.p.s., the frequency of a
standard fork. The figures reproduced in Dye's paper f at these
high frequencies bear a striking resemblance to those in Tyndall's
R.I. lectures on Sound, J at low frequencies of the order of 10
to 1000 p.p.s.
Fourier's Theorem
Summation of any number of simple harmonic vibrations of com-
mensurate frequencies—the vibrations being in the same straight line
Synthesis and analysis of complex forms of vibration. In Case II
(a) above, a brief reference was made to the combination of
S.H. vibrations of commensurate frequencies. A very important
theorem which deals with this case is due to J. B. J. Fourier. §
The theorem is stated in various forms by different writers, andis generally quoted in relation to the study of the transverse
vibration of strings. Its application is, however, of much wider
scope than this. Briefly, the theorem states that any single-valued
periodic function whatever can be expressed as a summation of simple
* A. B. Wood, Proc. Phys. Soc, 35, p. 109, 1923.
f Proc. Phys. Soc, 37, part 3, April 1925, pp. 158-168.
t Pp. 133-135. § Theorie de la Chaleur (Paris, 1822).

26 VIBRATIONS OF A PARTICLE
harmonic terms having frequencies which are multiples of that of the
given function.
The theorem not only deals with the synthesis of a complexperiodic vibration from simple harmonic terms, but also indicates
a method by which a complex vibration can be analysed into its
component simple vibrations.
It should be noted that the theorem has two provisos regarding
the form of the complex vibration, viz. (1) that the displacement
must be single-valued and continuous—it is obvious that this
condition is fulfilled in all cases of mechanical vibrations, e.g.
a particle cannot actually have two different displacements at the
same instant of time; (2) that the displacement must always have
a finite value—this condition also is clearly fulfilled in the case of
sound. Fourier's theorem may be expressed by the series #
x=f(tit)=a -\-a 1 cos (nt-\-€ 1)-\-a 2 cos (2nt Jr e 2)-\- . . .
-\-arcos (rnt-\-e,)
that is, I . (1)
x =f(ni)= a +2 arcos
(rnt+ €r)
r=l J
In this equation x is the displacement of the complex periodic
vibration of frequency n\2iT\ al9 a 2i ar are the amplitudes of the
component simple harmonic vibrations, e x , e2 , er being the respec-
tive initial phases. It is sometimes convenient in analysis to
express x as the sum of a sine and a cosine series. This can easily
be done by writing A=a cos e and B = — a sin e, when we obtain
x=f(nt) =A -\-A1 cos nt+A2 cos 2nt+ . . . +Arcos (r .nt)) , .
+B 1 sinw*+B 2 sin2^+ . . . +B., sin {rnt) J ^'
Integrating this equation, with respect to t, for a complete vibra-
tion of period T=2<7r/«, we find
1 fT
A =- xdt . . . . (3)1 -o
To obtain the amplitude-values Ar of the cosine series we multiply
all terms of equation (2) by cos (r . ni) and integrate for a complete
cycle (0 to T), whence2 f
T
Ar=— x cos (r . nt)dt . . . (4)
-•- o
* The analytical proof of this theorem is beyond the scope of this
book. Reference should be made to Fourier's original work or to various
mathematical treatises on the subject. H. S. Carslaw, Fourier's Series
and Integrals, London, 1906. Lamb {Dynamical Theory of Sound) deals
with the theorem in a very helpful manner, but does not give a rigid proof.

FOURIER'S THEOREM 27
Similarly the amplitude-values B r of the sine series are obtained
by multiplying all terms of equation (2) by sin (r . nt) and in-
tegrating as before
2 rT
Br=— x sin (r . nt)dt . . (5)
LJQ
By means of equations (2) to (5) it is possible to analyse or syn-
thesise any complex form of vibration. The constant amplitude
term A or a is a measure of the displacement of the axis of the
vibration curve from the axis of co-ordinates. If the abscissa
of the curve coincides with the axis of the curve the constant
vanishes. Equation (3) shows that A represents the mean dis-
placement. Measuring from the lowest point of the displacement
curve to the mean value of x we obtain the axis of the curve.
The terms required to construct a given curve may be limited
or may be infinite in number. Certain harmonics of the series
may be missing entirely. As an example consider the case of a
combination of two S.H.M.'s of nearly equal frequency resulting
in 'beats' (see fig. 7). If the two frequencies are, say, 300 and
302, there will be two beats per second, i.e. the fundamental
frequency of the resultant is 2 p.p.s. Analysis of the 'beat'
vibration will therefore indicate that only the 300th and 302nd
terms of Fourier's series are present—the fundamental of the
series will have a frequency of 2 p.p.s. but zero amplitude.
Examples illustrating Analysis and Synthesis by Fourier's
Theorem
Example (1) - Displacement x constant {equal to c) from t=0 to
T/2, and zero from T/2 to T (a 'square' wave), see fig. 10.
x =f(nt) =c from t =0 to T/2,
x =f(nt) =0 from t =T/2 to T,
Fig. 10
when the time axis of co-ordinates is taken through the lowest
point of the displacement curve. From equation (3) we have
for A,

28 VIBRATIONS OF A PARTICLE
-Jxdt,
which may be written
1 fT/2
A»=Ti„
Cdt=2'
i.e. the axis of the displacement curve is the line x=c/2.
From equation (4)
2 fT
Ar= — I # cos (rnt)dt,
1 -A)
which reduces to
A,=TTY
r . 27rfsin
T/2
when we remember that T=27r/nyi.e. all the cosine terms of the
Fourier series have zero amplitude, and consequently disappear
altogether.
Similarly, from equation (5),
2 rT
Br=—
1 x sin (Ynt)dt,LJ
which becomes
c
TTY
2rrt- COS Y .— T/2 ^
= [— COS Y
^77+ 1].
When y is even
when y is odd
COS Y . 7T = + 1 and Br=0,
cosr.7T= — 1 and Br =2c/7rr.
Consequently all the even terms of the sine series disappear, and
we are left with the odd terms, having amplitude coefficients
2c— (1, h h h h etc).7T
The complete series therefore becomes
*=/(«*)=«+-Z 77
1 . 1 . 1 .
sinw/+- sm3nt-\— sm 5nt-{- . . . H
—
sinr.?^3 5 r

FOURIER'S THEOREM 29
In fig. 11 the addition of these terms is indicated graphically. In
(a) the first three terms of the series are shown independently,
and as a resultant curve. It will be seen that even in this case
(a) addition of 3 terms
(b) addition of 15 terms
Fig. 11
the resultant bears a rough resemblance to the curve to be analysed.
By the addition of 15 terms of the series shown in (b) the curve
is almost perfectly reproduced.
Example (2) - Displacement
linear with time from x =c when
t=0 to x=0 whent =T (see
fig. 12). A * saw-tooth ' wave.
x=f(nt)=c(l-t/T)
when the time axis passes
through the lowest points of the periodic curve.
2 77
A =ij' xdt=U {\-tlT)dt=-,TJ
which gives the ordinate of the axis of the curve.
Again
2c ^A,=M (l-t/T)co*(pa)dt9

3Q VIBRATIONS OF A PARTICLE
which, on integration between the required limits, reduces to zero
for all values of r, i.e. the cosine series becomes zero.
Br=%i (1-t/T) sin (r.nt)dt,
which on integration reduces to 2c/nr. That is, the amplitude
coefficients of the sine series are
tA 2 3 4
and the corresponding simple harmonic motions have periods
T, T/2, T/3, etc. The Fourier's series in this case is therefore
',x
c 2cf . 1 . 1 . 1 .
x=f(nt) =—|— sin^-f-sm2^-f-sm3^+ . . . -{--smrnt2 7t\ 2 3 r
The addition of successive terms of this series is indicated graph-
ically in fig. 13. The curves indicate clearly the convergence of the
series; the more terms employed, the closer the resemblance
between the resultant curve and the curve under analysis.
3 terms
\ 10 te
L\30 terms K
Fig. 13
Example (3) - Two straight lines meeting at x=c, t=T/2 and
passing through x=0 at £=0 and t=T respectively (see fig. 14 (a)).
In this case we have
x =2ct/T from t =0 to t =T/2

FOURIER'S THEOREM 3i
and
x=2c(l-t/T) from t=T/2 to t=T.
1 r-i 22c J1 f
TJ T J-JTj2
:(i!-fHr T
/•T/22^
(rnt)dt Jr 2c( 1 --- ) cos (rJTJ2
nt)dt
2cK-iy-ij.
For even values of r the values of Arbecome zero. When r is
4codd A = —
.
ttV2
cwrwe to 6t analysed
B,=T
1 ' 2ct f I 2t\I — . sin(r. nt)dt+ 2c[l——J sin (r.nt)dt
* T/2 \ A /
0,
i.e. all the sine terms disappear. The Fourier series thus reduces
to a series of cosine terms of amplitude coefficients,
4c/ 111~7v' 3~2 ' s5, 7*'
etc;
and periodic times T, T/3, T/5, T/7, etc. Thus
r/ , c 4cf 1 1 1 \x=f(nt)=- cos«£+— cos3w£+— cos5«/-f . . . -|
—
-.cosr.nt .
2, tt*\ 6* o zr2
j
The resultant obtained by adding three terms of this series is
shown in fig. 14 (b). It will be observed that the series is rapidly
convergent, and therefore the curve under analysis is closely
represented by the sum of comparatively few terms of the series.
In this respect, compare with fig. 13, where the series is not so
rapidly convergent. Writing n=2ir\r
X in the above equation for

32 VIBRATIONS OF A PARTICLE
x, we may obtain a useful check on the accuracy of the result.
Thus when t is an odd multiple of T/4, the displacement x is always
c/2, i.e. the particle is then passing through the mid-point of its
vibration—this is evident from a consideration of the displacement
curve (fig. 14). Again, when t is an odd multiple of T/2, the dis-
placement x has always reached its maximum value c, and we have
4,
3 2
1
;+ • to infinity
1 1
h3 2 oK2
to infinity,writing x=c this becomes 772/8=l
which is known to be correct.
Even and Odd Harmonics - An even harmonic has a frequency
which is an even number of times the fundamental frequency,
One of the effects of an even
harmonic is to make the
two halves of the wave
dissimilar (fig. 15a). Thepresence of odd harmonics,
however, does not render
the wave-form unsymmetri-
cal (see fig. 15b); when the
fundamental has advanced
through half a period the odd harmonics have advanced through
a number of complete periods plus half a period, hence their
Fig. 15A—Second Harmonic andFundamental
Fig. 15B—Third Harmonic and Fundamental (illustrating effect of varyingrelative phase)
instantaneous values are in the same direction relative to the
instantaneous value of the fundamental.

DAMPED VIBRATIONS 33
The relative phase of the harmonics and the fundamental affects
the resulting character of the wave to a marked extent. This is
illustrated in the series of curves shown in fig. 15 (b), which result
from the substitution of different values for the angle e in the
expression x=B ± sin #+B3 sin (3#+ e), where the amplitude B3
of the third harmonic is one quarter B1} the amplitude of the
fundamental.
The above examples of the application of Fourier's theorem to
the analysis and synthesis of comparatively simple types of periodic
vibration, also serve to indicate the complexity of the calculation
when the curve between and T is very irregular. In such
cases the analysis by calculation is a long and tedious process
requiring perhaps several days' work for a single curve. In order
to simplify the process when many complex periodic curves have
to be examined, various types of mechanical devices have been
constructed. These devices, known as 'harmonic analysers? are
designed to perform mechanically the integrations indicated in
equations (3), (4), and (5) above. Instruments of this nature have
been devised by Kelvin (Proc. Roy. Soc, 27, 371, 1878), Henrici
(Phil. Mag., 38, 110, 1894), Michelson and Stratton (Amer. Journ.
Science, 5, 1-13, 1898), and many others.* Fourier's theorem
and ' harmonic analysis ' has a wide field of application, not only
in the study of sound, but in astronomy, meteorology, tide pre-
diction, mechanical and electrical engineering.
Damped Vibrations
Frictional Forces - It has been assumed up to this point that
all vibrations have a constant amplitude for an indefinite time.
Dissipative, or frictional forces, involving losses of energy in heat
and other forms of mechanical motion, have been disregarded.
There is no simple law which indicates the variation of frictional
forces when a body moves through a medium offering resistance
to its motion. Experiment has shown that the law of resistance
changes with the velocity of the body. For small velocities,
however, it is generally assumed that the retarding force, due to
the medium, is proportional to velocity. The problem of the
vibration of a particle subject to a restoring force proportional
to its displacement and a resistance varying as the velocity is
very important. All vibrating bodies are subject to such forces,
* An interesting description of harmonic analysis and synthesis, witha valuable list of references, is given by D. C. Millar in The Science ofMusical Sounds (Macmillan : New York, 1916).
3

34 VIBRATIONS OF A PARTICLE
otherwise there would be no loss of energy by the body and
consequently no radiation of sound energy.
The equation of motion of a vibrating particle of mass m subject
to a damping force proportional to the velocity is
d2x dx/ xmM+r
Jt+SX=° •••(!)
where s is the 'spring factor' (stiffness factor) or the restoring
force per unit displacement, and r is the 'resistance constant' or
retarding force per unit velocity. Equation (1) may conveniently
be solved as follows. Writing
x=ye~u .... (2)
we have
andM-*>--" <»>
d2x jd2y oudy ,
dt 2 \dt 2 dtJJ
wSubstituting in equation (1) we have
$+(~- 2*)?+ (*2
--*+-V=° ••
<5)
at2 \m /at \ m mj
Writing s\m=n 2 (where 2tt/7i is the period of the free oscillations
of the unrestrained particle), and r/2m=k (since we are at this
stage free to choose any convenient value for the constant k),
equation (5) becomes
g+(w2_^=0 ... (6)
Equation (1) is therefore satisfied by
x=e~*y .... (7)
provided the value of y is defined by equation (6). Three im-
portant cases arise
:
Case I - Frictional Forces Small. n>k. This stipulation
makes (n2—k 2), in equation (6), a positive quantity. Consequently
if we write V(n 2—k2)=n' the solution of (6) is y=a cos (n't-\-e).
Substituting this value of y in equation (7) we obtain
x=ae-** cos (n't+ e) ... (8)

DAMPED VIBRATIONS 35
This relation for x represents geometrically a simple harmonic
curve of which the amplitude ae~u diminishes exponentially to
zero with increasing time. Since the periodic term cos(?z7+ e)
alternates between the limits ±1, the space-time curve of x lies
between the curves x= ±ae~ kt(see fig. 16). The measure of the
decay of amplitude is the constant
k, called the 'damping coefficient.'
This constant depends on the ratio
of resistance to mass (r/2m)—it
should be noted, however, that
the rate of dissipation of energy
(rx2) in the system due to friction
depends only on the resistance
factor r.
The ratio of successive maximum amplitudes (on opposite
sides of zero displacement) is eknl
'\ and the logarithm of this
ratio,
hn , ^ hir— log10 e =0-217—
,
n n
is known as the ' logarithmic decrement ' of the oscillations. Refer-
ence is sometimes made to the 'modulus of decay' of dampedoscillations; this is defined by the time taken for the amplitude
to fall in the ratio l/e.
A simple harmonic vibration, undamped, can be represented
by the orthogonal projection of a uniform circular motion.
Similarly the damped vibration which we have just been consider-
ing is obtained from the orthogonal projection of an equiangular
spiral, described at constant angular velocity with the radius
vector diminishing at a uniform rate.
Effect of Damping on Frequency - In equation (8) above, the
period of the damped oscillation is 2w/»', where n'=Vn2—
k
2
and 27r/n is the undamped period. The frequency is there-
fore diminished by the damping. In most cases occurring in
practice, however, the difference between n and n' is a very
small quantity of the second order, and may usually be neglected,
i.e. the effect of damping on the period is negligible, except in
a few extreme cases where the vibrations are strongly damped.
As an example of the effect of damping on frequency take the
case of a tuning-fork of frequency 25 p.p.s. (w = 157), and damp-ing coefficient &=0T (found experimentally from observation

36 VIBRATIONS OF A PARTICLE
of the time required for the amplitude to fall to half its initial
value).*
w' = Vw 2-A2= V24,649-001 =157-3-2 xlO- 5.
That is, the damping has lowered the frequency by one part in
five millions, a quantity which in practice is usually quite negligible.
In general, the period will be given by 2ttVm/s (=27r/w).
Case II - Large Frictional Forces. k>n. In this case of very
heavy damping, equation (6) becomes
d2y
where n' = Vk2—
n
2. The solution is y=Aen
'
t
-\-'Bent
, whence
x=Ae- klt+Be- k*i
(by equation (7)) . . (9)
if
k1=k-Vk2-n2 and k 2=k+ Vk 2-n2.
The particle does not 'vibrate,' but the displacement after passing
its first maximum decays asymptotically to zero. This is the case
of an ' overdamped,' ' deadbeat,' or aperiodic displacement, illustrated
in a moving coil galvanometer shunted by a very low resistance.
It has, in common with the following Case III, important applica-
tions in the electrical recording of sound by means of an oscillo-
graph, and in the design of certain forms of sound receivers.
d2yCase III - k=n. Equation (6) now becomes -— =0, whence
;y=A*+B and x=e- lt(At+B) . . (10)
This is the transition case of critical damping, the motion being
just aperiodic or non- oscillatory. The displacement at first
increases by virtue of the factor (A/+B), but the exponential
term becomes relatively important as t increases. The displace-
ment can only become zero for one finite value of t.
The case of critical damping has an important bearing on the
problem of recording sound vibrations either mechanically or
electrically.
Forced Vibrations. Resonance
So far we have dealt only with 'free' vibrations where no
external forces, apart from frictional forces, are applied to the
* See A. B. Wood, " Electrically Maintained Tuning-Forks. SomeFactors affecting Frequency," Journ. Sci. Instrs., 1, p. 330, 1924.

FORCED VIBRATIONS. RESONANCE 37
vibrating system. Such vibrations, as we have seen, diminish in
amplitude in accordance with certain simple laws, and ultimately
die away.
We now come to consider the very important case where a mass
is maintained in a state of vibration by a periodic force which
may or may not have the same period as the free vibration. Aswe shall see, the mass in such a case will ultimately vibrate with
the same period as that of the force, its vibrations being designated
forced vibrations. In the special case where the period of the free
vibrations coincides with the period of the force we have the
phenomenon of resonance.
Let the external periodic force be represented by Fcos^>£,
where F is the maximum value of the force of frequency P/2tt,
then the equation of motion of a particle of mass m is given by
d2x dxm—-~\-t-—\-sx=F cospt (1)
If we write s/m =n 2 and r/2m =k as before, and F/m =/, equation (1)
becomes
d2x dx
w+2kdt
+n2x=fcospt-
(2)
Assume x=a cos (nt— e) and writing cos pt =cos {€Jr (pt— e)}
>we
obtain on substitution in (2)
a(n 2 —p 2) cos (pt— e)— 2kpa sin (pt— e)=/cos e . cos (pt— e)
—/ sin e sin (pt— e) . (3)
Now equation (3) must hold for all values of t, consequently wemay equate coefficients of sin (pt— e) and of cos (pt— e) and obtain
a(?i 2—p 2) =f cos 6
and 2kpa =/ sin e
. f sin ewhence a=
2kp
and tan e =2kp/(n 2—p
The solution is therefore
/ sm €X
2kfC0S{pt~ e)
''
(5)
where
t<m€=2kpl(n 2-p 2)(from (4)) . . (6)
(4)

38 VIBRATIONS OF A PARTICLE
Equation (5) represents the forced vibration, i.e. the vibration
maintained by the external force. It will be seen that the ampli-
tude <2=/sin e . /2kp is proportional to / the magnitude of the
force, and the period is the same as that of the force. In the case
where there is no friction
k=0, sin e=0, e=0 or 77, and a=f/(n 2—p 2).
Thus
x=——- cos pt . . . (5a)n 2—p 2
Equation (5) does not represent the complete solution of the funda-
mental equation (2). We may add any value of x which makesthe expression on the left of equation (2) vanish. Such values
of x have been obtained (e.g. see equation (8), p. 34) in the case
of 'free' oscillations subject to a damping force. Hence, in the
case of n>k, we have the complete solution
x=ae~M cos (n't-\-e')+Jn1 cos (pt— e) . (7)2kp
The first term on the right of this equation represents a 'free'
damped oscillation which is superposed on the forced oscillation
represented by the second term. On account of the exponential
factor, the free oscillations gradually die out and, after a time,
only the effects of the forced vibration are appreciable.* Thesame conclusion holds also in the cases when n<k and n=k.
Amplitude of Forced Vibrations - In the steady state of
maintained oscillations, we may regard equations (5) and (6) as
representing the motion produced by the external force. There
* An interesting theoretical and experimental study of this initial
stage of forced vibrations has recently been made by L. W. Blau (Journ.
Frank. Inst., 206, p. 355, Sept. 1928). He writes equation (2) in a
different form which exhibits a number of important characteristics of
the initial vibrations. Writing s= (n—p) and An=n — Vn2 —k2it is
found (a) when s ^ An, there are ' beats,' and the first beat maximum is
greater than any later maximum, whilst the first beat minimum is less
than any later beat minimum;
(b) when (n 2 —p 2)= k 2 there are no beats
and the resultant amplitude grows monotonically from zero to the steady
amplitude of forced vibrations;
(c) at resonance when n=p, there are
still maxima which occur with a frequency An/2n in a damped system;
(d) the absence of beats is neither a sufficient nor a necessary condition
of resonance in a damped system. Blau obtained photographic records
of the forced oscillations of a pendulum with varying degrees of damp-ing, these records show the initial ' beats ' and confirm the theoretical
deductions.

FORCED VIBRATIONS. RESONANCE 39
are several important points to be noticed in regard to the forced
vibration. The amplitude A of the forced vibration is /sin e . /2kp.
Nowsin €=2kpj{(n 2-p 2
)
2+±k 2p
2f from (6).
Therefore
A=f/{(n2-p 2
)2+±k 2
p2}i
. . . (8)
giving the amplitude of the forced vibration in terms of (1) the
impressed force/ (=F/m), (2) the free frequency n/27T (n 2 =s/m),
(3) the forced frequency p/2-rr, and (4) the damping k (=r/2m).
This expression is of fundamental importance.
Now the amplitude A is a maximum when the expression in
brackets in equation (8) is a minimum, as regards variation of the
forced frequency. Differentiating this expression with respect
to p and equating to zero, we find for the minimum condition
p2 =n2_2k 2 provided n 2>2k2. Substituting this value of p
2 in
equation (8) we obtain for the maximum value of amplitude, whenk is small compared with n
ythat is, n=p nearly,
Amax =f/2kn . (9)
2-5
2-0
In the case where there is no damping (k=0) and the free frequency
is the same as the forced
frequency (n=p), it will
be seen that the ampli-
tude A becomes infinite.
Such a case, however,
never occurs in practice,
for the damping k is
never zero. For small ^
values of damping ^(n2>2k2
) ythe forced am-
plitude is greatest whenthe forced frequency co-
incides with that of the
free vibration in the ab-
sence of damping. This
condition is known as
resonance. Frequencyamplitude curves for
varying degrees of damping are shown in fig. 17.
Phase of Forced Vibrations - In general, the force and the
resultant forced vibration will not be in phase. Equation (5)
t,.«
=5.1-0
0-5
(a)
1 h =
2 k =
3 A =
4 A =
5 h =
0-37n
n
h7-55/7
2n2-4n
<r^>
ft^V5s" ^^
5/? n
Frequency p
Fig. 17
1-5/7 2/7 2-5/7

4o VIBRATIONS OF A PARTICLE
indicates a lag e between the displacement and the force, the
magnitude of this lag being determined by equations (4) and (6).
From (4) we see that sin e is always positive, whilst cos e may be
positive or negative according as n is greater or less than/). Theangle e therefore lies between and tt/2 when the frequency (p)
of the force is less than the frequency (n) of the ' free ' vibration,
and between rr/2 and tt when the forced frequency is greater than
the free frequency. The lag e (given by equation (6)) will, in
general, if the damping be small, be nearly equal to or tt in these
cases, i.e. the displacement will be in phase or out of phase with the
force according as the frequency of the force is less or greater than
the frequency of the free vibration. As resonance is approached,
however, the effect of even slight damping becomes more notice-
able, and the phase lag e approaches tt/2 at resonance in a mannerdetermined by equation (6) . At exact resonance when tan € becomes
infinite, e = tt/2, i.e. the force and displacement are in quadrature (that
is, differing 90° in phase), whilst the force and velocity are in phase.
When there is no damping, k=0, sin e=0, €=0 or 77, and the
displacement x is expressed by equation (5a). Thus when
p is less than n the dis-150
120
90
^60°
(b) A/^>
^~
y^t1 A = n
5 h = 10 n
£ 4^2
1k>0-
1-5AI 2n
placement x is always in
phase with the force,
when p is greater than n
the displacement reverses
in sign and is in opposite
phase to the force. Asthe frequency of the force
passes through resonance,
the phase suddenly re-
verses from to 77. This
change of phase is moregradual when there is
friction—in fact, use may be made of the abruptness of this phasechange to measure the sharpness of resonance and the degree of
damping present in a vibrating system—the more abrupt the
change the smaller the damping and the sharper the resonance.
In fig. 18 a series of curves is drawn, to an arbitrary scale, in-
dicating the general nature of the variation of phase lag e as the
frequency of the forced vibration (p) passes through the resonance
frequency (n), each curve of the series corresponding to a particular
value of k the damping factor. All the phase curves pass throughe =7r/2 when p =n.
0-5A7 n
Frequency p
Fig. 18

FORCED VIBRATIONS. RESONANCE 41
The relationships of phase between the applied periodic force
and the motion can be illustrated by means of simple pendulums
under the action of a periodic driving force. This driving force
may, for example, be supplied by a massive ' compound ' pendulum
C which carries at convenient positions the supports of two
'simple' pendulums A and B whose frequencies are respectively
higher and lower than the frequency of C. When the large
pendulum C is set swinging it will be found that the motions
of A and B are at first irregular (see equation (7) and subsequent
remarks, p. 38), giving the appearance of 'beats,' but at a later
stage the simple pendulums will swing regularly, the short one
'A' being in phase with C, and the long one 'B ' being in opposi-
tion, or out of phase with C. The critical case of resonance mayalso be studied in this way, the simple and compound pendulums
being then in quadrature (€ = ±90°). Resonance phenomena at
higher frequencies (20 to 1000) may be very strikingly demon-
strated by means of a frequency indicator of the reed type (see
fig. 19). If such an indicator is supplied with alternating, or
unriife1 iiinimfiJin
Fig. 19—Instantaneous appearance of Reeds of Frequency Meter(viewed stroboscopically)
interrupted, current of suitable frequency one of the graduated
series of reeds will usually be found to vibrate vigorously, whilst
those on either side of it are only moving slightly. If the reeds
are viewed stroboscopically either by intermittent illumination or
by intermittent viewing (by means of a moving-slit stroboscope
or a glimpse-apparatus such as the Ashdown 'Rotoscope'), the
vibrations may be seen in ' slow-motion.' It will then be noticed
that the reeds on opposite sides of the resonant reed are in exactly
opposite phase, whilst the phase of the resonant reed is intermediate-—as indicated in fig. 19.
Energy Considerations. Power Dissipation - An important
question relating to the maintenance of forced vibrations is that
of power or rate of supply of energy. This question is closely
connected with that of the phase relationships which we have just
considered. Now mechanical power, or the rate of doing work,

42 VIBRATIONS OF A PARTICLE
is the product of force and velocity. The force is/ cos pt, and
the velocity dx/dt is obtained by differentiating equation (5).
Thus the ' instantaneous ' power supplied to maintain the oscilla-
tions is/ cos pt . dx/dt, that is,
f2
= —'— . sin e . sin (pt—e) cos pt
{sin e -sin (2pt— e)} . . (10)4k
The average value of the second term is zero, consequently the
mean power supplied is
W=^.sin2 e. . . . (11)4k
the value of sin e being obtained from equation (6).
The mean power supplied by the impressed force to maintain
the oscillations is therefore zero when e=0 or tt. This case is
realised when the damping is zero (k=0). For example, in the
case of forced vibrations of a pendulum free from damping, the
work done by the force in one half-period is exactly balanced bythe work restored by the pendulum in the other half-period. In
the case of resonance, however, when €=tt/2, i.e. the displacement
is in quadrature and the velocity in phase with the force, the mean
power supplied by the force is a maximum and equal to
Wma,=/V« .... (12)
a quantity increasing as the damping diminishes. This result
may be obtained more directly from the equation of motion
(equations (1) and (2), p. 37). Regarding this as analogous to the
electrical case, at resonance the effects of inductance and capacity
neutralise, and the force is expended in overcoming friction
(corresponding to resistance) only, i.e.
and
nl dx .,
dx f2k— =t cos pt> whence —-=—1-cospt,
dt dt 2k
dx f2
„Power =/ cos pt~ =— cos 2 pt,at £k
the mean value of cos 2 pt is \ over a cycle. Therefore
Mean Power =/ 2/4k as before.

FORCED VIBRATIONS. RESONANCE 43
Sharpness of Resonance - As we have already seen, when the
'forced' and 'fiee' frequencies are equal, it is only the presence
of damping which prevents the amplitude of the vibration from
becoming infinite. The damping becomes relatively more and
more powerful in its influence as resonance is approached. At
resonance the amplitude and power dissipation reach their maxi-
mum values. On account of the very frequent occurrence of
resonance phenomena in sound it is important to consider howthese quantities vary with frequency in the neighbourhood of
resonance.
The amplitude A under any specified conditions of k, p, and n
may be obtained from equation (8), or combining this equation
with (9) A may be expressed as a ratio of Amavy the maximumamplitude (at resonance n=p). Thus
Similarly, the power W dissipated under the specified conditions
is given by (11); combining this with (12), giving maximumpower dissipation, we obtain
W= sin2 6 . . . (14)WTT max
Substituting the value of sin e obtained earlier (p. 39), we find
W 4k 2p
2
Wmax (n 2-p 2)2+±k 2p'<
(15)
a relation indicating how the power required to maintain vibra-
tions against frictional and radiation losses varies in the neigh-
bourhood of resonance. It will be seen from this relation that
the energy dissipated at a certain frequency (P/2tt) near resonance
is half that dissipated at resonance (i.e. W/Wmax =J) when(n 2-p 2
)
2 =4k2p
2. That is when
p k-=1±- (approximately) . . . (16)
Thus the energy-dissipation at resonance falls to half value whenthe forced frequency departs from the natural or free frequency by
the fraction k/n. This indicates that the smaller the damping andthe greater the natural frequency, the more rapidly will the dis-
sipation fall off on either side of resonance—that is, the sharper

44 VIBRATIONS OF A PARTICLE
will be the resonance. The ratio k/n is therefore a measure of the
sharpness of resonance.
Typical 'resonance curves' are shown in fig. 17. These
curves indicate a diminishing 'sharpness' as k increases. This
important principle has many striking and important applications
in sound. When a vibrating system is only lightly damped, very
careful tuning is required to attain the resonance condition of maxi-
mum amplitude and power dissipation. In frequency standard-
isation very sharp tuning, and consequently minimum damping,
is desirable in order to obtain an accurate determination of the
peak of the resonance-curve. In other circumstances resonance
is undesirable, e.g. in the faithful recording or reproduction of
sounds extending over a range of frequencies, it is desirable to
select<
ni
far removed from any possible values of(
p,' or alter-
natively to employ a system which is very heavily damped (k very
large)—in both cases the system is relatively insensitive.
A well-balanced tuning-fork is a good example of sharp tuning
when it may be excited through the medium of the surrounding
air by the vibrations of a second fork adjusted to the same fre-
quency. When the two forks are closely in tune there will be a
very marked response, otherwise there is relatively little effect.
Even sharper tuning is required in the case of certain quartz
resonators and oscillators (see p. 142) which have extremely little
damping. The damping constant k of a vibrating system maybe conveniently determined by measuring the rate of decay of its
free oscillations (see p. 35) or from a resonance curve.
Perhaps one of the simplest and most instructive experiments
to illustrate the effect of damping on resonance is that in which a
massive compound pendulum drives two simple pendulums of
the same period as the large pendulum. One of the simple
pendulums has a bob of pith, the other of lead. The former is
heavily damped by air friction, whereas the latter is not seriously
affected (for the damping constant k=r/2m, see p. 34). Conse-
quently the amplitude of the pith pendulum at resonance is small
compared with that of the lead pendulum. On account of the
large damping the light pith pendulum loses during each swing
nearly all the energy given to it by the large pendulum, very little
energy is stored and the amplitude remains small.
Coupled Systems. Reaction - As in the case of coupled
electrical circuits, two mechanical vibrating systems react on one
another when connected by some form of mechanical ' link.' Whenmechanical power is supplied to a vibrating system B from a

RELAXATION OSCILLATIONS 45
system 'A' a condition may arise, and this is especially so at
resonance, when the drainage of energy is so great that the system
A can no longer maintain its maximum amplitude. The inter-
change of energy between the two systems also involves a change
of natural frequency, for the primary system A is now loaded by
the system B. The general features of mechanical coupling
between two such systems may be simply demonstrated by means
of apparatus described by T. R. Lyle * in a paper "On the
Mechanical Analogy to the Coupled Circuits used in Wireless
Telegraphy." A horizontal beam of mass M, free to move on
the direction of its length, carries two simple pendulums, of
lengths lj2 and masses m 1m 2 respectively, vibrating in a vertical
plane through the axis of the beam. The surging of energy
backwards and forwards is very well illustrated by the model.
If one pendulum is started swinging it will be seen that the second
pendulum begins to swing with increasing amplitude, while the
amplitude of the first at the same time diminishes. This goes
on to a certain point when the reverse takes place, and the transfer
of energy forwards and backwards many times may be observed.
The effect is very striking when the two pendulums have equal
or nearly equal periods. The 'coefficient of coupling' is shown
/ m1m 2 I M* .,,.',to be K jzr^ r-zr-z -, analogous to K /
——— in the electricalV (M+m 1)(M+m 2)'
8 V L XL 2
case where L x and L 2 are the self-inductances and Me the mutual
inductance of the coupled circuits. The mechanical coupling
of the pendulums obviously diminishes as M the mass of the
connecting beam increases. As in the electrical case, the coupled
system has two natural frequencies.
The vibrations of any mechanical system are communicated to
a greater or less degree to other systems in contact with it. In
certain cases such an effect may have important consequences, e.g.
the frequency of an accurate electrically maintained tuning-fork maybe seriously affected by the manner in which the fork is supported.
|
Relaxation Oscillations t
The type of vibration represented by equation (1), p. 34, or
by equation (2), p. 37, is the most common form of periodic
* T. R. Lyle, Phil. Mag., 25, pp. 567-592, April 1913. E. H. Bartonand H. M. Browning, Phil. Mag., 44, pp. 573-576, Sept. 1922. See also
C. H. Lees, Phil. Mag., 48, p. 129, 1924.
t A. B. Wood, jfourn. Sci. Instrs., 1, p. 330, Aug. 1924.
X See B. van der Pol, Phil. Mag., 2, p. 978, Nov. 1926, and p. 763,Nov. 1928.

46 VIBRATIONS OF A PARTICLE
oscillation. The periodic time of free vibration is dependent solely
on the ratio of the inertia and elastic factors, whilst the resistance
factor controls only the resultant amplitude. Another type of
vibration which is of fairly common occurrence has, however, very
different characteristics. Thus, in equation (1), p. 34, if the sign
of the resistance coefficient r be negative, we have
• • 0)r
x ,
ms
x-\—mx=0
the solution of which, writing
r
m= 2k and
s2
mis
X-=ae +klcos
(n't+ e)
• (2)
cf. with equation (8), p. 34. In this case the amplitude, instead
of dying away, increases to infinity. Such a condition is physically
impossible, of course, but equation (1) may be applicable for
values of x up to a certain limit. Thus we may rewrite equa-
tion (1) as follows:
x-2k(l-x2)x+n2x=0 ... (3)
representing an oscillatory system in which the resistance is a
function of the displacement. When k is a positive quantity
the system has a resistance which, for a small amplitude, is
negative. Therefore the position #=0 is unstable. When,further,
k 2»n 2 .... (4)
it is obvious that as long as ,x;2<<1 the variable x will initially leave
the value x=0 aperiodically, but when later x 2>l the resistance
has changed sign and has become positive, x will tend to return
towards the zero value. It may be shown * that the periodic time
T of a vibration typified by equation (3) is
2k rT=l-61— or 1-61- ... (5)
n 2s
The fundamental period of the vibration is, apart from the
numerical constant, defined by a quantity involving the resistance
and elastic factors only. B. van der Pol describes such oscillations
as 'relaxation oscillations.' They differ very markedly from the
sinusoidal oscillations of a mass controlled by a spring, for the
resistance may now be negative (as in analogous electrical cases),
* Loc. cit.

RELAXATION OSCILLATIONS 47
Neon Lamp flashing intermittently (2500p.ps.)
Wehnelt Interrupter (1000 p.p. s.)
Fig. 20
increasing to a positive value as the displacement increases. Thedisplacements take place in suddenjumps which recur periodically.
As examples of relaxation oscillations, van der Pol mentions : the
aeolian harp, the pneumatic
hammer, the scratching
noise on a plate, the wav-
ing of a flag in the wind,
the squeaking of a door,
the Wehnelt interrupter,
the intermittent discharge
of a condenser through a
neon tube, etc., etc. In all
these examples the fre-
quency is not dependent
on the customary ratio of
elasticity and mass, but is controlled by some form of resistance
which, on reaching a certain critical value, suddenly relaxes,
builds up again, relaxes, and so on. The properties of relaxation
oscillations are
:
(1) Their time period is determined by a time constant, or
relaxation time, dependent on resistance and elastic forces only.
(2) Their wave-form is far from simple harmonic. Very steep
parts occur on 'relaxation' of the resistance, and as a consequence
many harmonics of large amplitude are present.
(3) A small impressed periodic force can easily bring the relaxa-
tion system into step with it (automatic synchronisation), whilst
under these circumstances the amplitude is hardly influenced at all.
If equation (3) is regarded as an electrical oscillation, 2&=R/L,w 2= l/LC, and consequently T=1-61RC. The fundamental
period of the relaxation oscillation is therefore dependent on the
product of resistance R and capacity C. An example of this maybe found in the Anson-Pearson * neon lamp intermittent ' flashing
'
circuit, in which a neon tube and a condenser in parallel are
connected in series with a high resistance and source of current.
Copies of cathode ray oscillograph records of a Wehnelt inter-
rupter and of a flashing neon lamp are shown in fig. 20.
VIBRATIONS IN AN EXTENDED MEDIUMWAVE-MOTION
In the foregoing treatment consideration has been given mainly
to the vibrations of a particle either 'free' or acted upon by
* Phys. Soc. Proc, 34, p. 204, 1922.

48 EXTENDED MEDIUM VIBRATIONS
external periodic forces and friction. This treatment finds
particular application in the study of sound production and
reception. It is important now to consider what takes place in
an extended medium (solid, liquid, or gas), which may contain
sound sources and receivers. As we have seen, the vibrating body
and the medium surrounding it may be regarded as a single
compound vibrating system since the medium reacts on the body
and therefore influences its motion. It is often more convenient,
however, to separate the two motions and to regard the vibration
of the medium to be forced by the actual vibrations of the body.
A brief reference has already been made to longitudinal wave
motion. In this type of motion the vibratory displacements of
the particles of the medium take place along the same line as the
direction of propagation of the wave. It should be noted at the
outset that the 'particles' to which we refer are not necessarily
individual molecules, but may be small volumes or thin layers
of the medium. The vibratory motions transmitted by the
medium are therefore superposed on the irregular motion of the
molecules. Sound waves are the inevitable result when a vibrating
body is immersed in an elastic medium. We are therefore con-
cerned with the physical properties (density, elasticity, viscosity,
etc.) of the medium when considering the mechanism of wave
transmission.
The problem in its simplest form, viz. that of transmission of
'plane' (or non-spreading) waves, is closely analogous to that of
transmission of longitudinal waves in a long helical spring. If
one end of such a spring, suitably suspended, is subjected to a
single to-and-fro displacement alternate waves of compression and
tension will be propagated along it, the velocity of transmission
depending on the relative stiffness and inertia of the spring. If
any particular point of the spring is observed during the passage
of the wave it will be seen to perform a vibration similar to that
imposed at the free end. In the case of a very long spring wecan visualise the effect of a simple harmonic displacement of the
end. As before, the velocity of transmission of the wave will
depend on the inertia and stiffness of the spring, and the motion
of any point will be simple harmonic like the forced motion of the
free end. Taking an ' instantaneous view ' of the spring as a whole
when a number of such waves have been started along it, we should
see a series of alternate compressions and extensions of the spring,
the maxima of compression, or extension, being separated by
equal intervals. It requires no proof here to show that the length

PLANE WAVES 49
of these intervals is equal to the velocity c of wave propagation
divided by the number of vibrations of the end of the spring per
second (the frequency N). We shall refer to these equal intervals
between successive maxima, and successive minima, as the wave-
length A. Consequently we may write NA=c.Similarly, in the case of transmission of simple harmonic waves
through an extended elastic medium the linear density of the
particles, or their state of condensation or rarefaction (compression
or expansion), is at any instant represented by a simple harmonic
curve, which repeats itself at regular intervals of a wave-length,
this wave-length being the ratio of the velocity of wave trans-
mission to the frequency of the impression vibration.
Plane Waves
Suppose a progressive wave of simple harmonic type to pro-
ceed in a positive direction along the axis of x* Then the dis-
placement £ at any time t of a point whose mean position is x
will be given by
f=asin2J|-£) . . . (1)
or
f=asin277(N*-*/A) ... (2)
where a is the amplitude, T and N the period and frequency,
and A the wave-length of the vibration. Writing c=NA=A/Twe obtain other forms of equation (1), viz.
2tti=a sin—(ct— x) . . . (3)
A
and
f =a sin n{t— x/c) ... (4)
where n has the usual significance and is equal to 2-7rN. These
forms of expression for the particle displacement f in a progressive
plane wave will be found convenient for most purposes. Such a
system of waves could, of course, be represented by a displace-
ment curve similar to that of fig. 2, where the ordinates represent'£' and the abscissa 't\ Consideration of the above expressions
shows that, in the case of progressive waves, phases may be
expressed in terms of fractions of a wave-length—one wave-length
A corresponding to a phase angle of 2tt. Thus the difference of
* We assume in what follows, that the effects of viscosity and otherattenuation factors in the medium are negligible.
4

5o EXTENDED MEDIUM VIBRATIONS
phase between the vibration of two particles at distances xx and x2
from the origin is 27t(x2—x1)/\. It will be evident that a system
of waves travelling in the negative direction of x will be represented
by the introduction of a positive instead of a negative sign inside
the brackets in equations (1) to (4).
Particle-Velocity - Differentiating equation (4), which gives
the displacement of a particle in the path of the wave, we obtain
the particle-velocity |,
d£/dt=na cos n(t— x/c) . . (5)
which may be written
ir-ci- ^giving the particle-velocity in terms of the wave-velocity and the
slope of the displacement curve.
Acceleration of Particles in progressive waves. Differentiating
(5) we obtain
d2g/dt2= -n2asmn(t-x/c) . . (7)
or
d=*d (8)
i.e. the acceleration is approximately equal to the product of the
square of the wave-velocity and the curvature of the displacement
curve. Equation (8) is the differential equation which character-
ises a wave-motion. Its complete solution is
£=f(ct-x)+F(ct+x) ... (9)
which represents two independent systems of waves travelling in
opposite directions with the same velocity c. This velocity is,
within the limits of the approximate equation (8), entirely inde-
pendent of the form of the wave. For example, in the case of the
simple form of wave represented by equation (3), viz.
£ =a sin—(ct— x),A
the velocity c is the same whatever the wave-length A may be.
Within certain limits, set by equation (8), the velocity c is also
independent of the amplitude a.
In other words, the velocity of wave transmission is independent
of the frequency or amplitude [provided this is small), and is deter-
mined solely by the physical properties of the medium.

PLANE WAVES 51
Velocity of Wave Transmission - The physical properties of
the medium which influence the velocity are density and elasticity,
corresponding to the mass and stiffness factors in the case of the
vibrations of a particle previously considered. As the wave of
compression and rarefaction passes through the medium the
volume and density fluctuate locally about the normal values.
The magnitude of these fluctuations is controlled by the properties
of the medium and the applied forces. The following definitions *
are important in this connection :
—
(1) Dilatation (A) is the ratio of the increment of volume Sv
to the original volume v , thus
A =$v/v and v=v (l + A) . . (10)
(2) Condensation (s) is the ratio of the increment of density Sp
to the original density p , thus
s=Sp/p and p=
Po(l+s) . . (H)
Since
pv=PoVo, (1+*)(1 + A)=1 . . (12)
and s= — A if we neglect sA as a small second order quantity.
(3) Volume or 'cubic' elasticity (k)—sometimes known as the
bulk modulus of elasticity,
Sp Sp Sp• (
13)— Sv/v Sv s
where Sp is the stress and Sv the corresponding strain. Whencewe have, for small variations of s,
p=p -\-KS . . . . (14)
(4) Compressibility (C) is the reciprocal of the bulk modulus k.
Thusn» , „ 1
and C=- . . . (15)v Sp K
Consider the case of plane waves travelling along the axis of x,
the displacement of a point whose mean position is x being f at
any time t. The displacements of planes normally at x and
(x+ Sx) will be f and ( $-\-j- • Bx). The thickness of the layer
bounded by the planes x and (x+ Sx) is therefore changed from
* Lamb's notation is adopted as being most suitable.

52 EXTENDED MEDIUM VIBRATIONS
hx to (1 -\-d£/dx)$x, consequently the dilatation A=d£/dx, and the
condensation
p dxl \ dxj
from (11) and (12).
[For small displacements we may write s= —d£/dx= — A.]
The mass of unit area of the layer is p Sx. If the excess pressure
on the (x+ Sx) face is Sp, we may equate this force to the product
of the acceleration d2£/dt 2 and the mass p Sx of the layer. That is,
p $xd2g/dt2 =—8p,or
p ax
Now we have 8p=KS * from (13) and s = —d£/dx, consequently
d*g_K d2i
or writing
equation (16) becomes
c=Vk/p .... (17)
d2£ d2£— =c2— .... (18)dt* dx2
-
\ )
which is identical with equation (8) obtained above. The com-
plete solution is given in equation (9), which represents two
independent wave-systems travelling in opposite directions with
velocity c. As equations (16) and (17) indicate, the velocity of the
wave is determined solely by the elasticity and density of the medium
through which it is passing.
The treatment just given applies to all cases of transmission
of small amplitude plane waves, in solid, liquid, or gaseous media,
provided the appropriate modidus of elasticity is applied. Thesame method of treatment also applies to the case of longitudinal
waves in solid rods—this will be dealt with in a later section. In
the case of a rod, the elasticity factor is Young's modulus, whereas
in the case of plane waves in an extended solid, when lateral
displacements are impossible, it is necessary to use the longitu-
dinal elasticity (#c+f/*) where k is the bulk modulus and /x the
rigidity. In gases, and fluids in general, the elasticity is the
* This applies to an unlimited fluid medium. For a solid in bulkk must be replaced by (*-}-§/*) (where n is the rigidity of the solid)
because a solid changes in shape as well as in volume.

PLANE WAVES 53
ordinary bulk modulus, except in certain cases where the volume
of the medium is limited.
Energy of Plane Waves of Sound - The rate of transfer of
energy per unit area of cross-section of the wave may be regarded
as a physical measure of the intensity * of the sound transmitted.
In the first place, we shall determine the kinetic energy of the
wave-system per unit area of the plane parallel to the wave-front.
Considering the simple harmonic wave expressed by equations
(1) and (4), viz.
£=a sin n(t—x/c),
we obtain the particle-velocity by differentiation with respect to
time,
d£/dt=an cos n(t—x/c).
Now the mass of unit area of a layer of thickness Sx is p Sx.
Consequently, the kinetic energy SE of the layer is given by
SE=ip Bx(— ),
and the kinetic energy of the whole wave-system is
E =\p Qa2n 2
i cos 2 n(t—x/c)dx
=\p^a 2n 21 {1 + cos 2n(t—x/c)}dx
(19)
The mean value of the ' cos ' term under the integral is zero. Hencethe average kinetic energy per unit area and unit length (i.e. per unit
volume) of the wave is equal to
iPoaV . . . • . (20)
The maximum kinetic energy per unit volume of the wave is from
(19)
ip a2n2.
But the sum of the kinetic and potential energies is a constant,
and when one form of energy is a maximum the other form is
zero, therefore
Total energy of the wave-motion per unit volume =\pQa2n 2
. (21)
This quantity is the total energy contained in unit length of
the wave per unit area of wave-front, and may therefore be
* This must not be confused with ' loudness.'

54 EXTENDED MEDIUM VIBRATIONS
conveniently called energy density. We require to know also the rate
of flow of energy through the medium. This is at once obtained
when we notice that the wave travels a distance c per second.
Consequently the flow of energy per unit time per unit area of
wave-front, or
Transmission of energy per second per unit area) , „ __, r . r =wca 2n 2
. (22)of wave-front
J
This may be regarded as the intensity of the sound wave. It is
directly proportional to the density of the medium and the wave-
velocity, and to the square of the amplitude and frequency of the
vibration. The relation thus obtained for the intensity (or rate
of energy flow) is of fundamental importance. As we have just
shown, the intensity is equal to the product of energy density {i.e.
energy per unit volume of wave) and wave-velocity.
By differentiation of the equation of wave-motion we obtain
the maximum particle-velocity (d£/dt)max equal to an, and the
maximum condensation smax equal to (—d£/dt)max , or
Wc ' c
'
indicating that the maximum condensation is equal to the maximumparticle-velocity divided by the wave-velocity . Substituting this
relation in (22) we obtain an expression for the energy flow, or
intensity, in terms of particle-velocity and wave-velocity, viz.
Energy flow =±pch 2max .... (23)
Nowc2= k/p (see (17))
and
^mai=^max (see (13)).
Therefore the energy flow or intensity is, from (23),
~2 pc '
(24)
an expression giving the intensity of the sound wave in terms of
the maximum pressure-variation in the path of the wave.
Power of a Source emitting Plane Waves. RadiationResistance - The energy thus present in the sound wave must be
derived primarily from the vibrating source. The rate at which the
source does work, i.e. the power of the source in producing sound

PLANE WAVES 55
waves, is equal to the product of pressure-variation and particle-
velocity, i.e. to 8p xdg/dt per unit area of wave-front. Now
since c= V«/p we have
Sp=V^.(di/dt) or /*£ . . (25)
Hence the instantaneous power expended by the source per unit
area of wave-front
=Vw . (d{/dt)* or pel2
. . (26)
The mean power radiated per unit area of wave-front is therefore
given by
W^.m*$m or \f>c^=ipcnW . (27)
It will be seen that the relations (25), (26), and (27) are closely
analogous to the electrical expressions connecting voltage, resist-
ance, and current, if we regard Sp, VKp (or pc), and (dg/dt) as
corresponding to these electrical quantities respectively. Thusequation (25) is the mechanical analogue of Ohm's law, and
equations (26) and (27) represent the law of power dissipation in
a circuit of resistance V Kp (or pc). The quantity V Kp, or pc,
is therefore generally described as the radiation resistance (or
impedance) of the medium which transmits the sound waves. It
is a fundamental characteristic of the medium, to which frequent
reference is made. Equation (27) indicates that the mean powerradiated by a source of plane waves of area S (large comparedwith A2
) and uniform amplitude
=±pcn2a2S . . . (28)
Taking the case of a circular disc or piston source (see p. 147) of
radius r, frequency N, and uniform amplitude a,
(Mean Power radiated) =2iTh2pcN 2a 2 ergs/sec.
Example - A disc 20 cms. radius r, vibrates in water (/o = l,
c= l-5xl0 5 cms./sec.) with a frequency N = 10 5 p.p.s. Thepower radiated =37 xl0 13#2 ergs/sec. or 37 xl0 6a2 watts. If the
amplitude of vibration is 0001 cm., the power radiated is 37 watts.
It is important to notice that the wave-length of the sound in this
case is small (A= 1-5 xl0 5/105 = l-5 cms.) compared with the
radius of the disc. Otherwise the waves would cease to be plane
and the calculation would have no meaning.

56 EXTENDED MEDIUM VIBRATIONS
Spherical WavesThe results derived ahove for the energy in plane waves hold
equally well for spherical waves at a sufficient distance from the
source. The general case of spherical waves at any distance from
the source requires further consideration. We have now to deal
with a sound wave which is progressively increasing (or decreasing)
in diameter. The amplitude of the particles of the mediumthrough which the wave passes is therefore dependent on the
distance from the source of the waves. Elementary considerations
at once indicate that the energy density in the wave will vary
inversely as the square of the distance from a point source of
spherical waves, whence it may be inferred that the amplitude
(of displacement, pressure, or condensation) will vary inversely as
the distance. As in the case of plane waves we shall assume that
the displacement is always small at all parts of the wave, and that
there is no loss of energy, due to viscous, thermal, or other causes.
In order to deduce the fundamental equation for spherical wave-
motion it is necessary first of all to refer to the equation of con-
tinuity and the equations of motion.
The Equation of Continuity - In effect, this equation is
merely a mathematical statement of an otherwise obvious fact
that matter is neither created nor destroyed in the interior of the
medium. Consider an elementary volume S^SjyS^ of the medium.
Then, in any small time interval St, the difference in the quantity
of matter entering and leaving through its faces must be equal
to the change in the quantity of matter inside the small volume
during this time. Let u, v, and w denote the velocity components
of the particle whose co-ordinates are x, y, and z at the instant t.
Then the quantity of matter entering the face in the yz plane is
nSy . Sz . pSt. Again, the quantity passing out at the opposite
face of the elementary volume will be
u . p-\—'-,— . Sx jSySz . St.
Thus the excess passing out of the small volume by the two faces is
—-— . Sx . Sy . Sz . St.dx
J
Similar expressions are obtained for the other faces. Consequently
the total mass lost in the time St is
dx 8y dz j

SPHERICAL WAVES 57
Now the mass lost is also equal to
Sx . Sy . §z.dt
y
Equating these two expressions we have
dp d(uP) d(vp) 8(wp)=0 (1)
dt dx dy dz
which is the general form * of the equation of continuity. Since
p=p (\^r s), dp/dt=p ds/dt; and for small-amplitude vibrations
d(pu)/dx=p du/dx approximately. Equation (1) therefore becomes
ds du dv dw n—
I
11 =0 ... (2)
dt dx dy dz
a form of the equation of continuity more convenient for applica-
tion to the case of small-amplitude vibrations.
Equations of Motion - Referring again to the elementary
volume SxSySz, the total pressures on the two yz faces (Sx apart)
are (/>±|8# . dp/dx)Sy . 8z, giving a resultant force along the
x-axis of —(dpjdx)hx . Sy . Sz. Now the mass in question is
pSxSySz and its acceleration du/dt. Consequently we have
du dpPdt~~dx'
and similarlyf
'
- (^)
dv dp dw dpP^-=— tt and p— =—
—
^dt dyrdt dz
But $p = KS (see equation (13), p. 51), and c2= k/p , therefore
s«=_ £2& av=_/A and
*± *(4)
dt dx dt dy dt dzv J
neglecting variations of pdu/dt, etc., and regarding p=p to a
sufficient degree of accuracy for small oscillations. Equations (4)
are fundamental when dealing with the propagation of sound
waves through an elastic medium.
General Equation - We have now to combine the equation
of continuity (2) with the equations of motion (4). Differentiating
(2) with respect to t we obtain
d 2s { d 2u d 2v d 2w 1
dt2=
~[dxJt+
'd^dt+dzJtj ^
* See Rayleigh, Theory of Sound, 2, p. 3.

58 EXTENDED MEDIUM VIBRATIONS
Differentiating the equations in (4) with respect to x, y, and z
respectively, and adding, we have
[d 2s d 2
s d 2s) d 2u d 2v b 2z~H ^72+^+^i =^+^+^ • (
6)[dx 2 dy 2 dz2
\ dxdt dydt dzdt
From (5) and (6) we obtain
d 2s [dh d 2
s d 2s)
dt 2 [dx2 dy 2 dz2\
or
d 2s— =c2V 2s
dt2
(?)
which is the general equation of sound waves in a three-dimen-
sional homogeneous medium. It will readily be seen in the case
of plane waves travelling in the direction of the axis of x that
equation (7) reduces to
d 2s d 2
s— =c2— .... (8)dt2 dx2 K }
which is similar to that previously obtained (equation (18), p. 52).
Spherical Sound Waves - In order to apply the general
equation (7) to the case of spherical waves, we must transform to
polar co-ordinates, writing
x=r sin 6 cos </>, y=r sin sin </>, #=rcos#.
We now find
d 2s 2 ds 1 d I . ds\ 1 d 2
s
dr2 r dr r2 sin 86\ dvj r2 sin2 6 d<p 2
For a symmetrical spherical wave, s will be a function of r and /
only, and independent of 6 and </>. Equation (9) may then be
simplified
Vhji^^j_m. . . (10)dr2 r dr r dr2
Consequently by substitution in (7) the equation of motion
becomes
d\rs) d\rs)
dt2 dr2• y )
The general solution of this equation is
rs=f(ct-r)+ F(ct+r) . . . (12)

SPHERICAL WAVES 59
representing independent diverging and converging waves of any
type, having a common velocity c. This velocity c=Vk/p is,
of course, identical with the velocity in the case of plane waves.
Velocity Potential * - It is convenient at this point to introduce
a new function into our equations. This function, the velocity-
potential </>, was first employed by Lagrange in dealing with
hydrodynamical problems. The name 'velocity-potential' was
given on account of its analogy with electrostatic potential. Therelation it bears to the particle-velocity at any point in the mediumis given by
deb 8ct> deb,
u=~, »= -/• w = -~f 13ox cy cz
provided there is no rotational motion. This latter condition is of
course fulfilled when the particles of the medium are in vibration
when transmitting sound waves. (The expressions for u, v, win (13) represent components of current if </> denote electric
potential, provided the resistivity of the substance be unity.)
If equipotential surfaces, <f>=constant, are drawn throughout the
sound-field, then the velocity is at any point in the direction in
which<f>
decreases most rapidly and, as in (13), is equal to the
gradient of </>.
We require first of all to determine <j> in terms of the condensa-
tion s. This may be done by integrating equation (4), thus
3 ft
u= —c 2— sdt-\-uQ and two similar,dxP
or, if the medium is initially at rest, u =0, and
8 ft
u= —c2—sdt and two similar . . (14)dxh v ;
Comparing equations (13) and (14) we obtain
=c2 (sdt or y=c2s . . . (15)*-*%
which is the required expression for the velocity-potential cf> in
terms of the condensation s. The general equation of soundwaves (7) now becomes
3 =c2V^ •
• •• (16)
* See pp. 201-205, Lamb's Dynamical Theory of Sound.

60 EXTENDED MEDIUM VIBRATIONS
and the equation of motion (11) of the medium for spherical waves is
nowg2W) J2
(r<l>) (mdt2 dr2 ' \ )
the solution being
.-f(ct-r)+-.F(ct+r) . . (18)
Considering only the divergent wave
$J-f(ct-r). . . . (19)
and regarding f and | as the displacement and velocity of a
particle along the radius r, we have from (15) and (19)
s=^f'(ct-r).... (20)
where f'(ct—r) is the derivative of/with respect to (ct—r). This
equation indicates that the condensation in a diverging spherical
wave is inversely proportional to the distance r as it travels
outwards. The particle-velocity along the radius r is
^-t^rnCt- r)+^f{ct' r) (21)
As the distance r increases with the spreading of the wave the
first term on the right of this equation becomes large compared
with the second term. In such a case therefore the velocity
tends to become proportional to 1/r, and the energy density to l/r 2.
The pressure-variation p at any point distant r from the source
may be obtained from equation (15), viz. d(f>/dt=c2s. Substituting
c 2= k/p and s =P/k in this equation, we find
d±=P- or P=p84 . . • (22)
dt pF H
dtK J
Consequently from (19) and (22)
p=pt^\.f'(ct-r) . . . (23)
When r is sufficiently great to render the second term of equation
(21) negligible, then
p=pc£=V^p.£ . . . (24)
That is, the pressure is equal to the product of the radiation resistance

SPHERICAL WAVES 61
(pc) and the particle-velocity, when the distance from the source
is large. This result, which we obtained for plane waves (see
equation (25), p. 55), is analogous to the electrical relation between
voltage, resistance, and current.
The only distinction between plane and spherical waves, when
r may be regarded as large, is that due to the spreading of the
spherical wave. Thus we must replace j and p for the plane
waves by (r£) and (rp) for diverging spherical waves.
Simple Harmonic Spherical Waves - The equations of
motion obtained in the foregoing treatment apply to all forms of
small-amplitude vibrations. The form of particular interest is,
of course, the simple harmonic vibration. In this case we maywrite equation (19) in the form
0=- cos *(*--) . . . (25)
Then the particle-velocity £ along the radius is
i=^=nsmn(t-
r-)+-cosn(t- . (26)
Sr cr \ cj r2\ cj
The rate of flow of medium, i.e. the flux, through a sphere of
radius r, will therefore be
4c7rA.fl / T\ I Y \
47rr^=— .rsvnnlt— +4ttAcoswIt— . (27)
Regarding the source as a very small sphere of radius r (a point
source) and having a maximum surface velocity of £ we mayimagine that fluid (the medium) is introduced or abstracted at a
certain rate, the ' strength ' of the source being defined as the maximumrate of volume variation at the source. This fictitious source
provides the necessary train of sound waves. Then at the surface
of the source we have
g=gQ cos nt . . . . (28)
Also from equation (27) we have, when r=r =0 nearly,
(±7rr 2)i cos nt =4:ttA cos nt . . (29)
The quantity (477T 2. f ) on the left of this equation represents the
maximum rate of introduction (or abstraction) of fluid at the
source, i.e. the strength of the source* Denoting this quantity byA' we have from (29)
A' cos nt =4:ttA cos nt . . . (30)
* Rayleigh, 2, p. 109 et seq. ; Lamb, Arts. 69-76.

6z EXTENDED MEDIUM VIBRATIONS
The velocity potential of a small source of strength A' is therefore
from (30) and (25)
6=~— cos n(t-r-) . . . (31)
4ttt \ el
This equation is generally expressed in the form
A'6= cos (nt—kr) . . . (32)4-nr
v J
where
, n 2ttk=-=— .... {32a)C A
The particle-velocity being
. dd> kh!f= —=— sin (nt— kr)+ (a negligible term involving) l/r 2
) . (33)dr 4z7rr
Equation (32) is of fundamental importance in dealing with sound
radiation from any type of source. Although it applies essentially
to a 'point' source {i.e. of dimensions small compared with A), it
is quite evident that it must also be applicable to sources of any
shape or size, regarding each elementary area of the source as a
'point source' and integrating over the whole of the vibrating
surface. It is therefore possible to deduce the fundamental
quantities, particle-velocity f, condensation s, and pressure p, at
any point in the medium provided we know the motion at all
points of the source itself. Numerous applications of the velocity-
potential function are to be found in the treatises on Sound byLamb and Rayleigh. A number of examples of practical import-
ance are dealt with in a book by I. B. Crandall.*
Power of a Source radiating Spherical Waves - The rate of
doing work, or power, of the sound waves from a 'point' source
must be the same at any spherical surface surrounding the source,
and is therefore independent of distance r from the source.
Neglecting steady pressures which contribute nothing to the
average effect, the rate of doing work at the surface of a sphere
of radius r is the product of alternating pressure p, area of surface
and radial velocity, i.e. the power W of the source
dtr
drtdt dr
v }
since p=pd<j>jdt (see equation (22)).
* Theory of Vibrating Systems and Sound. (Macmillan.)

POWER OF SOURCE 63
Obtaining dcf>/dt and dcf>/dr from (32) we find
An . . _ . AkW Attt^p sin (nt—kr) . sin (nt— kr).4ttt 4t7T
Since the mean value of the sin2 term is J, the average rate at
which the source does work, or
pA2rc& pn 2A2 pcA2k2
, NM^«w Power= —
-
— or — or — . (35)077 OTTC 077
where A is the strength of the source defined as the maximum rate
of volume variation at the source , i.e. A=S£ where S is the area
of the vibrating surface and £ (=«f ) is the maximum velocity
(assumed uniform) over the surface. Writing n =27rN,
Mean Power =2 773
/oN4S 2
f2/c ergs/sec. . ,(36)
If the source is a circular piston of radius R (small compared with
A) this becomes
=2tt 5pWR*£ 2/c ergs/sec. . . . (37)
In the case of a small circular diaphragm radiating sound waves,
the amplitude £ and velocity f are not uniform over the whole
surface. We must therefore substitute for £ in (37) the average
amplitude f over the surface which, in the fundamental mode, is
approximately f /3, where £ is the maximum amplitude at the
centre of the diaphragm.* We have in this case
W=2ir5PR /kN*£ /9c ergs/sec. (approximately) . (38)
The relations (35) to (38) for the mean power radiated in spherical
waves are of course only applicable to a small isolated source.
The emission of energy would be modified by discontinuities in
the medium near the source. Thus a rigid plane near the source
would double the amplitude by reflection, but would limit the
radiation to one hemisphere only. Therefore the net powerradiated, as given in the above expressions, would have to be
doubled on one side of the sound source and reduced to zero on
the other. Rayleigh deals with this case of sound radiation from
a small piston source forming part of an infinite rigid wall.|
The expression given in (38) can be checked experimentally bysimultaneous observations of the frequency, amplitude, and
motional impedance (see p. 73) of a diaphragm vibrating in
water. The amplitude may be measured optically by means of
* See also equation (2), p. 158. f Sound, 2, p. 162.

64 EXTENDED MEDIUM VIBRATIONS
a small mirror attached at a point half-way along a radius of
the diaphragm. The power radiated is most conveniently in-
dicated by a wattmeter in circuit with the alternating electrical
supply which excites the diaphragm. The change of 'watts' on
passing through resonance is a measure of the sound-power
radiated (10 7 ergs/sec. = 1 watt). The sound intensity at any point
in the medium will of course be the power divided by 4-jrr2
, where
r is the distance of the point from the source (assumed small).
Double Sources - The simple 'point source' which we have
been considering is a theoretical abstraction. All vibrating
bodies have a finite size which may be very large (the case of
plane waves) or very small (in case of spherical waves) compared
with a wave-length of the sound radiated. Further, many sources
of sound, unless special precautions are taken, will act as double
sources. Thus a vibrating diaphragm exposed to the free atmo-
sphere on both sides is, at any instant, sending out a compression
pulse on one side and a rarefaction pulse on the other, behaving
as two sources near together and in opposite phase. A vibrating
wire is another example of this. Lamb * has developed the theory
of the double source, regarding it as tw^o simple sources near
together but in opposite phase. It requires little proof to show
that such a source will radiate less energy than the correspond-
ing simple source, for one component will almost neutralise the
effect produced by the other. The velocity potential 6 at a point
P distant r from a double source of strength C cos nt is, for large
values of r,
kC(/>= sin n(t—r/c) cos 6 . . <39)
477T
where 6 is the angle made between a line joining the two simple
sources and a line from the midpoint to the point P. Also the
rate of emission of energy by the double source is
Wm*j**v
orPj^
. . . (40)dt 24tt 24ttc 3 V ;
the intensity at any point in the medium depending on the
orientation 6 as in (39). It is instructive to compare equations
(35) for a simple source, and (40) for a double source. Regarding
these as having the same strength, we observe that
(a) In both cases the power radiated is proportional to pc, the
radiation resistance of the surrounding medium, and
* Sound, p. 226.

DOUBLE SOURCES 65
(b) the emission from a simple source varies as n 2(i.e. as 1/A2
),
whereas it varies as ra4
(i.e. as 1/A4) from a double source. The
double source, therefore, rapidly becomes more efficient as a
radiator, relative to the simple source, with increasing frequency
and diminishing wave-length of the sound.
In the case of the double source (see equation (40)), if the
frequency N is fixed, the energy emitted in different media will
vary directly as the density p and inversely as the cube of the
wave-velocity c. The energy emission for sources of the same
strength in gaseous media, where this velocity varies inversely
as Vp, will, at constant frequency, vary inversely as the fifth powerof the wave-velocity. This accounts for the apparent feebleness
of a bell or a tuning-fork (both double sources) when vibrating in
hydrogen as compared with air. The wave-velocity in hydrogen
is 3-9 times that in air. Consequently the energy emission is
(3-9) 5 or 900 times as great in air as in hydrogen. A comparison
might also be made between air and water as the transmitting
media, the relative densities and wave-velocities being 1/770 and
1/4-4 respectively. Apart from other considerations, the energy
emission from sources of equal strength would, for the reasons
given above, be about 3400 times as great in water as in air. Thepowerful damping effect of water, as compared with air, on the
vibrations of a solid body are thus explained.
In both cases of a simple and a double source (see equations
(35) and (40)) the energy emission is proportional to the square
of the strength of the source, i.e. to S 2£
2, where S is the area
of the vibrating surface. It will be clear, therefore, why a
vibrating tuning-fork or wire emits its energy at a much greater
rate when it is brought into contact with a solid body of large
area such as a table top. The sounding-board of a piano or of
a violin radiates practically all the vibrational energy of its strings.
As we have seen, the increase in energy-emission with frequency
is most rapid (qc w4) in the case of a double source. When the
vibrations are very slow (n small) the fluid surrounding the source
behaves as if it were incompressible and simply flows locally from
one face of the double source to the other which is in opposite
phase. In such a case no sensible vibration is transmitted by the
medium. As the frequency increases, and A becomes comparable
with, or greater than, the distance apart of the two simple sources
which form the 'double-source,' this 'local flow' is reduced and
true waves of alternating pressure, i.e. sound waves, are set upin the medium. The local flow increases with increase in the
5

66 EXTENDED MEDIUM VIBRATIONS
velocity of sound in the medium, when the latter more nearly
approaches incompressibility, and less energy is radiated as sound
(as in the case of hydrogen and air cited above).
This reduction of ' local flow ' has important practical application
in the design of sound generators to work in media such as air
or water. It is obviously better, for example, to employ a vibrat-
ing diaphragm with one side enclosed, when it behaves as a simple
source and radiates much more energy than if its efforts were
partially neutralised by the simultaneous out-of-phase vibrations
from the opposite side. For a similar reason a diaphragm en-
closed on one side is much more efficient as a radiator when sound-
ing its fundamental tone, than vibrating with one nodal circle
when there is local flow between the two areas vibrating in
opposite phase. In the case of a vibrating string the local flow
in the surrounding air accounts for the feebleness of the sound
emitted.
In certain circumstances, however, more particularly in the
directional transmission of sound, the double (or possibly a
multiple) source (see p. 217) is very important. When the distance
apart of the two equivalent simple sources is comparable with or
greater than a wave-length, the
directional term cos 6 in equa-
tion (39) becomes important.
Rayleigh refers to a simple
experiment performed byStokes* to illustrate the increase
of the sound emitted from a
tuning-fork when local flow
around the prongs is prevented.
A piece of cardboard is held with
one edge parallel and close to one prong of the vibrating fork.
When the card is placed as at A or B in fig. 21 relative to the
prong there is little or no effect, but when placed at C, makingan angle with the plane of the prongs, the sound is considerably
intensified.
Fig. 2
The Principle of Superposition - Huyghens first drew atten-
tion to the important fact that the passage of one beam of light
through an aperture is in no way affected by the passage of another
beam through the same aperture. The light waves cross each
* See Rayleigh, Sound, 2, p. 306
p f447
?1868.
and Stokes, Phil. Trans., 158,

SUPERPOSITION. SECONDARY WAVES 67
other at the aperture without interfering at all with each other's
course. The same is true also of sound waves. This independence
of the separate waves is explained on the principle of superposition.
This principle implies that the resultant displacement, velocity,
or condensation at any point in the medium is equal to the vector
sum of the corresponding quantities due to each wave-train
independently. The principle is valid only for small amplitudes,
when it can be assumed that the stresses are linear functions of the
strains, a condition which is fulfilled in the case of ordinary sound
waves of small amplitude. It is important to notice that the
principle is only applicable to quantities which may reverse in
sign (viz. displacements, velocities, and condensations) ; it would
lead to erroneous results if applied to the addition of energies or
intensities, involving the squares of these quantities. From a purely
physical standpoint there cannot, of course, be two wave-systems
at once in the same part of the medium, since an element of the
medium cannot have two different densities or velocities at the
same instant. The actual motion of the medium is different from
any of the individual motions which would be produced by the
wave-trains independently ; when we speak of two or more wave-
systems passing at the same instant through the same medium,the actual or resultant effect is a single wave-system different from
any of the imaginary ones. It is important to remember whenapplying the principle that there is no restriction as to the relation
between the component frequencies.
A special case of superposition, which may appear to be a
contradiction, is known as interference (see p. 293). Two inde-
pendent wave-trains of the same frequency mutually cross each
other. At certain places there is reinforcement (i.e. increased
amplitude), whilst at others there is reduced, or possibly zero,
amplitude. Such 'interference,' as it is called, is a direct outcomeof the principle of superposition.
Huyghens' Secondary Waves - Another important principle
due to Huyghens is the following : The wave-front of a disturbance
may at any instant be obtained as the envelope of the secondary
waves proceeding from all points of the wave-front at. some pre-
ceding instant.
Thus a disturbance diverging with velocity v from a point
source may at any time t1 be represented by a thin spherical shell.
According to Huyghens' principle, we may regard this shell as
the disturbed region, and determine the disturbance at a sub-
sequent time t2 by drawing spheres of radii v(t2— f1) round each

68 EXTENDED MEDIUM VIBRATIONS
point of the shell. The outer spherical envelope of these spheres
will be the new wave-front at the instant t2 . By this construction
it will be found that the direction of advance of the wave is normal
to the wave-front. As the distance from the source becomes
large, a small area of the wave-front approximates to a plane surface
at right angles to the direction of advance of the wave. It is often
convenient, and sufficiently accurate, to regard a spherical waveat a large distance from the source as a plane wave. A wave-front
may be defined as a surface such that the disturbance over it
commenced at the same source at the same instant. Such a wave-
front may of course be entirely in one medium or in two or moremedia. The wave-front due to a point source in a homogeneous
medium will always be spherical. The definition of course
involves the assumption that waves of all frequencies are pro-
pagated with equal velocities.
Making use of the theory of the simple point source of sound,
and combining it with Huyghens' principles of superposition and
secondary waves, it is often possible to deduce the sound distri-
bution in a medium containing a source of sound of appreciable
size. The reflection and refraction of sound waves at the boundary
of two different media follow the ordinary laws applicable to light
waves, provided the dimensions of the boundary are always large
compared with the wave-length of the sound incident upon it.
In the majority of sound problems with which we shall have to
deal, however, this condition is not fulfilled, the dimensions of
obstacles and apertures being frequently of the same order as the
wave-length of the sound. Diffraction problems in sound are
consequently of much more frequent occurrence, and are of
greater relative importance, than they are in the case of light.
Only when sounds of very high frequency (and therefore of short
wave-length) are employed is it possible to demonstrate the ordinary
optical laws of reflection, etc., with apparatus of moderate dimen-
sions. In order to obtain effective focussing of sound waves by
curved reflectors or lenses it is important that the dimensions of
the reflector should be many times the wave-length of the incident
sound. The same statement is applicable to sound screens if
'optical' shadows are required. In the majority of cases, there-
fore, where diffraction effects predominate or cannot be neglected,
the principle of secondary waves as proposed by Huyghens maybe of great assistance. The method is often applied experiment-
ally by means of spark-pulse and ripple photography (see p. 340)
where the progress of a wave-front can be followed from point to

ELECTRICAL VIBRATIONS 69
point in a medium containing obstacles of any required form and
distribution. In Section III such questions will be examined in
greater detail.
ELECTRICAL VIBRATIONS
Attention has already been drawn to the close analogy which
exists between mechanical and electrical vibrations. On this
account alone it would seem justifiable to introduce the subject
of alternating electrical phenomena at this point, but there is also
another important reason why further reference should be made
to this subject. Alternating electrical and magnetic effects pro-
vide a very convenient means of exciting the corresponding
mechanical vibrations. An alternating current supply of variable
frequency and power may be employed in the production of sound
vibrations of corresponding frequency and intensity.
The earlier forms of alternating current generators (of sonic
and supersonic frequency), such as the Duddell singing arc, were
very effective but rather inconvenient in use. The advent of the
thermionic three- electrode-valve during recent years has, however,
supplied an extremely convenient and inexpensive source of
alternating electrical power. By means of the valve it is a com-
paratively simple matter to produce alternating current of almost
any conceivable frequency, from zero to many millions of cycles
per second. In addition to this the power output at any particular
frequency may be easily controlled and measured. It is not
surprising, therefore, that a rapid development has taken place
in the design of electrical sound sources (or generators as they are
sometimes called) and in electrical methods of receiving and
recording sound waves. The transfer of electrical to mechanical
energy and vice versa is of frequent occurrence in many problems
concerned with the production, transmission, and reception of a
sound wave.
We shall therefore consider briefly the more salient facts in the
theory and methods of production of electrical oscillations.
Free Oscillations in a Circuit containing Inductance,Capacity, and Resistance - When a condenser of capacity C is
discharged through a coil of inductance L and resistance R, the
electrical charge Q in the condenser at any time t after closing the
circuit may be deduced from the equation of electromotive forces
operating in the circuit, viz.
^S+2- •<>

70 ELECTRICAL VIBRATIONS
A comparison of this equation with equation (1) on p. 34 is in-
structive. It will be seen at once that they are of the same form,
consequently the solutions will be similar. It is important to
note the corresponding mechanical and electrical quantities
involved, viz.
Inductance L^Inertia (mass) m.
Resistance (electrical) R=Resistance (mechanical) r.
Capacity C=Compliance or —— . -.stiffness s
Quantity (electrical displacement) Q^Displacement x.
Current dQ/dt=Velocity dx/dt.
Rate of current change d2Q/dt2=Acceleration d2x/dt''
f2
The method of solution of the above equation, follows exactly the
same lines as that on p. 34, etc., in the mechanical case. WhenR is less than a certain critical value the solution therefore takes
the same form as equation (8), p. 34.
Q=Qtf-* co&{n't+c)
where Q is the initial charge on the condenser,
&=R/2L the electrical damping coefficient
and
1 R2
LC^iL2
(3)
This equation represents a vibratory S.H. motion with amplitude
dying away exponentially. The condition for oscillations is that
ri should be real, i.e.
h^ or R<2VE^ • •
(4)
Provided 'R is considerably smaller than the critical value in (4),
the frequency of oscillation is
N2tt 2ttVLC
or the periodic time
T=2t7\/LC
(5)
substituting m for L and 1/s for C, we obtain the corresponding
relation T=27rVm/s for the mechanical system.

FORCED OSCILLATIONS. RESONANCE 71
Forced Oscillations - In the previous case we considered the
effect of discharging a condenser through a circuit having induct-
ance and resistance. Now take the case of an alternating e.m.f.
E cos pt applied to such a circuit. The equation of e.m.f. 's will be
£«£+?--*• «
Comparing with the analogous equation for the forced vibrations
of a mechanical system (see equation (1), p. 37), we obtain the
solution equivalent to equation (5), p. 37, viz.
_ / sin €
2kp, . 2kp
tan €=—:
it and sin €(n 2-p 2
){(n2-p2
)2+±k2
p2Y
where
/=E/L, &=R/2L, and n 2 = l/LC
co
The current i in the circuit at any instant t is obtained by differ-
entiating Q thus,
. dQ /'sin € . ,
On substitution of the corresponding electrical quantities for
/, k, and n 2, this becomes
E sin ( pt— e) E .
sin (pt-e) . (9)
Lp-^'
The denominator of this expression for the current is known as the
electrical impedance Z of the circuit, the quantity ( Lp——)being
designated the reactance X. The phase lag e is given by
**«=(i^Wri •• •
(10)
Resonance - When the frequency of the force coincides with
that of the free oscillation (resistance damping being small), wehave from (9) and (7),
E E/= — sin (pt— 7r/2)=— cos pt [since n=p, tan e= 00
, and €=77/2],R R

72 ELECTRICAL VIBRATIONS
the maximum current being therefore E/R, in phase with the
applied voltage. When R is zero, which of course never occurs
in practice, the current becomes infinite. In ordinary cases, the
current at resonance is limited solely by the resistance in the
circuit, the effect of inductance being neutralised by the negative
effect of the capacity. This is obviously analogous to the case of
resonance in a mechanical circuit where the amplitude and particle
velocity are limited only by the frictional damping.
The question of electrical power dissipation is also similar
to the mechanical case dealt with on p. 42. It is unnecessary
to repeat the discussion already given.
The Circle Diagram - The phase relations between e.m.f.
E, impedance Z, and current i (or the corresponding mechanical
quantities force, mechanical impedance, and particle-velocity)
may be indicated simply by a vector diagram.* If an alternating
voltage be applied to a circuit consisting of a resistance R and a
reactance X (inductance and capacity), the voltages across the
two component parts of the circuit will always be 90° out of phase
with each other, this being independent of the magnitudes of the
resistance and the reactance. Fig. 22 (a) shows a vector diagram
Fig. 22
of the circuit where AB=Zz'=voltage applied to the circuit. Acircle described on AB as diameter will therefore pass through the
point C since the angle ACB is always a right angle. If the
relative values of the resistance and reactance be altered, the
angle<f>,
the phase lag between current and applied e.m.f., is
altered also, but the angle ACB is still a right angle. The dia-
gram generally takes the form shown in fig. 22 (b), in which ABindicates the phase of the applied e.m.f. and BC the phase of the
* E.g. see Kemp, Alternating Current Electrical Engineering (Mac-millan).

MOTIONAL IMPEDANCE. EFFICIENCY 73
current. A similar diagram may be constructed for a vibrating
mechanical system, substituting / for E/L, k for R/2L, and n 2 for
1/LC.
Motional Impedance. Efficiency of Electrically - driven
Sound Sources - On account of the extensive use of electro-
dynamic or electromagnetic forms of sound generators and
receivers, it is a matter of some importance to know their charac-
teristics and efficiency. In any form of machine which converts
electrical energy into motion, the moving mechanism reacts on the
electrical circuit. In the case of an ordinary electric motor, for
example, a back e.m.f. is developed in the armature when the latter
rotates. The electrical efficiency of the motor is equal to the ratio
of this back e.m.f. E to the voltage V of the supply, since "VY is the
gross power supplied and Ei is the net power utilised. The current
i through the armature is equal to (V—E)/r which consequently
becomes smaller, the greater the efficiency of the motor, i.e. the
nearer E approaches V. The back e.m.f. therefore behaves like
an added resistance in the circuit. Denoting this apparent
additional resistance due to the rotation of the armature by R,
we may write the current i equal to V/(r-f R). Now, the powersupplied is i
2(r-\-R) and the power utilised is i2R, whence the
efficiency is R/(r+ R). The efficiency is therefore the ratio of the
'motionaV resistance R to the total effective resistance (r+R). Thenet power utilised by the motor is a maximum when d(i2R)/dR is
zero, i.e. when R=r, in which case the efficiency is 1/2.
In a similar manner, the mechanical vibrating element of an
electrical sound generator or receiver reacts on the electrical
circuit. The back e.m.f. produced by the vibration manifests
itself as a change of impedance in the circuit. It is customary,
therefore, to determine the characteristics of such a vibrator fromthe analysis of its impedance at different frequencies of excitation.
This method of analysis was first introduced by Kennelly andPierce * who applied it to study the vibrations of a telephone
diaphragm. The principle involved with an alternating current
motor, e.g. a telephone receiver, is analogous to that of the direct
current motor to which we have just referred. The only difference
is that we have now to deal with impedances and phase angles
instead of the ordinary D.C. resistance. Thus, in such an
* See Kennelly and Pierce {Amer. Acad. Science Proc, 48, p. 113,1912) ; Electrical Vibration Instruments, A. E. Kennelly (Macmillan)
;
and Dictionary of Applied Physics, 2, 'Electricity,' pp. 844-846, 971,and 977.

74 ELECTRICAL VIBRATIONS
electrically maintained vibrating system, if R'L' are the 'vibrating
'
and RL the ' stationary ' values of resistance and inductance, then
(R'— R) is the motional resistance, (L'p — hp) or (X'—X) the
motional reactance, whilst the motional impedance is the vector sumof (R'-R)and(X'-X).
Motional Impedance Circle - When the impressed frequency
differs widely from the resonant frequency of the vibrating sys-
tem, the amplitude of vibration will be small for a given input
of electrical energy. Under such circumstances, therefore, the
motional impedance will be small and the efficiency very low.
Near resonance, however, in a well-designed 'sound transmitter,'
the motional impedance may be large and the efficiency corre-
spondingly high. To determine the characteristics of a trans-
mitter, therefore, a series of impedance measurements {i.e. of
R and X) is made at constant current over a range of frequencies
in the neighbourhood of resonance. Strictly speaking, two series
of measurements should be made with the vibrator, (1) 'free' to
move, and (2) clamped, or heavily damped, in the normal position.
In practice, however, it is generally unnecessary to make the
measurements (2) as they can be inferred from the results of
series (1). In fig. 23 (a) and {b) the resistance and reactance of a
280
240
200
: 160
|
120
80
(a)II
/
rA:/
240
-v200CO
5]o 160
X 120
(§j 40
200 400 600 800 1000 1200 1400
Frequency pp.s.
(b) /7
f
/X /
y/
I
I
// u
/
t
40 80 120 160
O 200 400 800 800 1000 1200 1400
Frequency pp.s.
80
120
160
-A R
>fi \ p.
v \ l
>Xs ^
\
%X h (c)
Fig. 23
vibrating telephone (diaphragm type) are plotted in terms of
frequency near resonance.
If now the corresponding values of motional resistance (R' — R)and motional reactance (X'—X) obtained from these curves are

MOTIONAL IMPEDANCE. EFFICIENCY 75
plotted as in fig. 23 (c), each point being marked with its corre-
sponding frequency, it will be found that the locus of the points is
a circle passing through the origin. The motional impedance at
any given frequency will then be the chord Op n of the circle. At
resonance, the motional impedance is represented by the chord of
maximum length, i.e. the diameter OA of the circle. In this case
the motional impedance is a pure resistance in phase with the
current. Consequently the diameter of the circle, expressed in
ohms, multiplied by the square of the current (amps.) gives a
measure of the mechanical power developed (watts) by the motion
of the vibrator. The angle 2/3 between the diameter OA and the
R axis is a measure of the ' iron loss ' in a moving iron transmitter,
such as a telephone earpiece. As in the case of the electric motor,
the ratio of the maximum motional resistance to the total effective
''free' resistance is a measure of the efficiency at resonance. If the
resonance is very sharp, the damped (or clamped) impedance maybe regarded as constant over the range of the circle. In such a
case it is often sufficiently accurate to obtain the motional resistance
at resonance by simply subtracting the minimum from the maxi-
mum observed impedances near resonance.
Wattmeter Method - If the power of a sound transmitter is
sufficiently large, the output and efficiency may be determined
with sufficient accuracy by a more direct method. Measuring the
electrical power consumed in the circuit by a wattmeter at a series
of frequencies near resonance, it will be found that a markedincrease occurs at reson-
ance. Such a curve for a
small diaphragm sound
transmitter under water is
shown in fig. 24. It will
be seen that the total powerconsumed at resonance is 80
watts, whereas the power
absorbed on account of the
motion of the diaphragm is
35 watts. Assuming this
power represents energy
radiated per second as
sound, the efficiency is 44 per cent. A similar result is obtained
if an ammeter in series and a voltmeter in parallel with the trans-
mitter are used instead of a wattmeter. In this case the impedanceof the circuit at any frequency is given by the ratio volts/amps.

76 ELECTRICAL VIBRATIONS
Sources of Alternating Current
Any attempt to give details of the numerous ways in which
alternating currents for acoustic purposes may be produced is
manifestly outside the scope of this book. It is important, never-
theless, to refer briefly to a few which are in general use at the
present time. For further information the reader is referred to
standard treatises in A.C. electrical engineering. A useful
descriptive list of suitable generators is given in the Dictionary
of Applied Physics* We shall refer briefly to a few of the moreimportant.
(1) Interrupters - Perhaps the simplest type of 'alternator,' if
it may be so described, is an interrupter of direct current. ' Inter-
rupted' current may be used either directly or through the
secondary of a transformer. In the latter case the current maybe more properly described as alternating. Direct current maybe rendered intermittent at any desired frequency within certain
limits in numerous ways.
(a) Motor-driven Commutator - This is a very convenient
form of interrupter in which the frequency is controlled by
the speed of the motor. The number of segments in the com-
mutator will of course be chosen to suit the frequency-range
required, having regard to the speed-range of the motor. If
much power is required from such a device it is usually the
practice to connect a suitable condenser and series resistance
across the two brushes which carry the current to the commutator,
this arrangement having the effect of reducing sparking at the
break of circuit. Sparking effects are particularly troublesome
when there is much inductance in the circuit. In addition to the
use of a condenser to reduce sparking it is advisable, as far as
practicable, to break the current at a high speed in order to reduce
also the possible formation of an arc between the brush and the
commutator segments. The frequency of this form of interrupter
is liable to vary unless some form of speed governor is fitted to
the motor.
(b) Tuning-Fork and Wire Interrupters - Tuning-forks and
stretched steel wires may be maintained in vibration on the
electric-bell principle, by means of suitable contact-breakers
—wires dipping into mercury cups or solid spring-mounted
metal contacts—combined with a maintaining electromagnet.
Auxiliary contacts may of course be provided to interrupt the
* Vol. 2, ' Electricity,' pp. 393-401 and pp. 897-903.

SOURCES OF ALTERNATING CURRENT 77
current in the main circuit, without interfering with the main-
taining circuit of the fork or the wire. Vibrating wires and
forks provide a reliable source of interrupted current of constant
frequency. By altering the tension of the wire the frequency
may be varied continuously from, say, 30 to 300 cycles/sec. Thetuning-fork interrupter, on the other hand, is essentially fixed in
frequency. If different frequencies are required it is necessary to
have a suitable range of forks. Interrupted current of frequency
as high as 200 per second may be obtained by means of tuning-
forks in this way, but the difficulties of making and breaking
mechanical contacts carrying current become very great at higher
frequencies than this. Reference will be made later to valve-
maintained tuning-forks of frequency of the order 1000 p. p. sec.
(c) Buzzers - Various forms of buzzers have been devised, the
principle of operation being in most cases essentially that of the
ordinary electric bell. The vibrating diaphragm or reed makes
and breaks a contact in the circuit of the maintaining magnet.
An improved form, due to Dr. Dye of the N.P.L., has an addi-
tional secondary winding in which alternating current is induced
by the intermittent primary current winding which maintains the
buzzer. The diaphragm buzzers made by the General Electric
Company are made with frequencies lying within the range 300
to 1000 cycles per second.
(d) Electrolytic Interrupters (Wehnelt Type) - An interrupter
of an entirely different type is one due to Wehnelt, which
depends on the interrupted flow of direct current through an
electrolyte. If a small platinum point is used as the anode and a
lead or aluminium plate as the cathode in an electrolytic cell
(containing a concentrated solution of almost any salt, e.g.
ammonium phosphate, or even common salt), then an interrupted
flow of current will take place at a regular frequency provided
the circuit (at, say, 100 volts) contains sufficient inductance. Thewave-form is rich in harmonics. The purity of the wave-formmay be improved by using a tuned circuit (inductance andcapacity) across the electrodes. It is of interest to note in passing
that a Wehnelt interrupter not only forms a convenient meansof obtaining interrupted current of frequency-range 100 to 5000
p.p.s. or so, but also may serve as a fairly powerful source of
sound. The sudden production of gas bubbles at the samefrequency as the interruptions results in corresponding pressure
vibrations being set up in the surrounding liquid.
(2) Microphone Hummers - The wave-form of interrupted

78 ELECTRICAL VIBRATIONS
current is obviously far from sinusoidal, since the current is varied
suddenly between zero and maximum. In the microphone
hummer a vibrator (tuning-fork, bar, telephone diaphragm, etc.)
is maintained in vibration by the fluctuating current through a
microphone attached to the vibrator. This current, acting through
an electromagnet, reacts on the vibrator which in turn shakes the
microphone—the cycle being continuous. A moderately pure sinu-
soidal alternating current may then be obtained from a secondary
winding on the maintaining electromagnet. The same principle
has been applied by A. Campbell * at moderately high frequencies,
1000 to 5000 p.p.s., by means of a steel bar with a microphone
and exciting magnet suitably mounted. As before, a transformer
is used to couple the vibrator to the external circuit. The hum-ming telephone f is a microphone hummer in which a vibrating
telephone diaphragm reacts through the intervening air on a
microphone coupled electrically to the telephone.
(3) Singing Arcs - Duddell's singing arc J provides a source
of alternating power of a fairly wide range of frequency, but in
its original form is not very convenient. A modification, due to
C. L. Fortesque, employs a 'pointolite' (tungsten arc) instead of
the carbon arc. This results in much steadier working conditions.
As in the Duddell arc the pointolite is tuned by means of induct-
ance L and capacity C across the arc electrodes, a suitable coupling
coil being employed to connect to the external circuit. The
frequency is simply determined by 1/2ttV'LC (or 159-2/VLC if
C is measured in microfarads and L in henries).
(4) Alternating Current Machines - Low-frequency alter-
nators working up to 200 p.p.s. are well known and are described
in electrical engineering textbooks. For audiofrequencies, other
designs have been developed.
(a) Dolezalek Toothed Wheel - In its simplest form this con-
sists of a toothed iron wheel rotated, by means of a motor of con-
trolled speed, close to the poles of an electromagnet carrying
secondary coils near its poles. The pole pitch is equal to an
exact whole multiple of the tooth pitch of the iron wheel. As the
teeth pass the poles the flux through the magnet, and consequently
the secondary coils, is varied, the frequency being determined
simply by the product of the number of teeth and revolutions per
second of the wheel. To reduce losses due to eddy currents, it
* Roy. Soc. Proc, 78, p. 209, 1906.
t F. Gill, J. Inst. Elect. Eng., 31, p. 388, 1901.
j J. Inst. Elect. Eng., 30, p. 232, 1900.

SOURCES OF ALTERNATING CURRENT 79
is an advantage to laminate the magnet and the teeth of the wheel.
Frequencies up to 4000 p.p.s. may easily be obtained in this way.
A very simple form of Dolezalek alternator may be constructed
by using a two-pole telephone receiver with its bobbins, and
mounting it near the teeth of a suitable motor- driven wheel. Thewave-form is rich in harmonics.
(b) Duddell Alternator - This machine is well designed and
provides a reasonably pure sine-wave current over a frequency
range up to about 2000 p.p.s. The rotor of the machine carries
the field winding on 30 poles. The stator consists of a laminated
iron ring wound like a gramme ring—the air gaps between stator
and rotor being fairly long to reduce armature reaction. The out-
put of the machine varies from about 10 watts at low speeds to
about 500 watts at high speeds.
(c) Alexanderson Alternator. - In very high-speed alternators
it is necessary to employ a specially strong mechanical construction
for the rotor. This has been achieved in the Alexanderson
machine, which runs at 30,000 r.p.m., i.e. ten times the speed of
an average small motor. A rotating disc has 300 slots set round
its edge to leave 300 steel teeth. Each of these teeth acts in turn
to close the magnetic circuit between two of the poles of the
stator, which holds the magnetising field coils and a peculiar form
of slot winding in which the alternating e.m.f. is generated.
These alternators were generally used for purposes of wireless
telegraphy. A good description may be found in the Dictionary
of Applied Physics, 2, 'Electricity,' pp. 1051-1053.
(d) Valve Oscillation Generators - The introduction of the
thermionic valve has undoubtedly provided the best source of
alternating current for sound production. Simplicity combined
with wide ranges of power and frequency make the valve, with
its associated circuits, an ideal means of electrically exciting
mechanical vibrations of any conceivable frequency. It has the
advantage over nearly every other type of alternator, of silence
and steadiness of operation combined with great flexibility of
frequency control. The three-electrode valve with its grid, plate,
and hot metal filament is now so well known in its associations
with radiotelephony that a further description here is superfluous.
Many different methods are in regular use for maintaining
electrical oscillations, and the reader is referred to treatises on
radiotelephony for details of these. Perhaps one of the simplest
and most convenient forms of oscillation generator circuit is that
shown in fig. 25. When due allowance is made for the difference

Load
80 ELECTRICAL VIBRATIONS
in frequencies of oscillation the arrangement of an audiofrequency
valve generator is identical with that employed at radiofrequencies.
In the arrangement shown an inductance coil hgconnecting the
filament to the grid is coupled inductively to another coil ~Lpconnect-
ing the plate to the filament through a high-tension battery B. Au . variable condenser C is connected
s-^M. amp. meter
O in parallel with the plate coil L^.
In alternative arrangements this
condenser may be connected
across the grid coil, or condensers
may be used with both grid and
n 1,1, Iplate coils. A third coil L
e ,
B + coupled to the coils L/;and L^,
Fig. 2s-Valve Oscillatorprovides the alternating current
for the external circuit. Briefly, the system functions as fol-
lows. A small oscillation set up in the tuned circuit L^C,
e.g. by switching on the filament current or the high-tension
battery, induces a corresponding change in the grid coil which
consequently causes the potential of the grid relative to the
filament to fluctuate in the same manner. In turn, this
varies the plate current, giving an amplified voltage fluctua-
tion in the plate L^C circuit, thereby increasing its oscilla-
tions. The grid is again affected, and the cycle continues to
repeat itself until a steady state of oscillation is maintained.
Regarded in this very elementary manner, the frequency of oscilla-
tion is dependent solely on the values of L^ and C in the plate
circuit, i.e. the frequency is equal to l/27rvL^C, provided the
resistance R of the plate coil is not too great. A more complete
view of the matter includes the effect of mutual inductance Mbetween the plate and grid coils, as well as the amplification
factor <7 and 'plate' resistance p of the valve itself. The valve
adds to the resistance R in the oscillatory circuit a term of the
form (Lp -f
ctM)//oC, the equation of oscillation * being
dH / L+ dViy* if R
where i is the current flowing in the plate inductance coil hp .
The damping constant
1/ L+.M2L\ pC
* See ' La Lampe a trois Electrodes,' C. Gutton, 5, p. 59, edited by Le;
SocieW' Journal de Physique.'

VALVE AMPLIFIERS 81
and the frequency of oscillation, when damping is small,
277 2ttM LC
27rVLC
when R is small compared with p, as is usually the case in practice.
The condition for oscillation requires that n2 should be always
greater than k 2.
If it is required that an oscillator should give a maximumpower-output at a particular frequency it is an advantage to divide
the inductance ~Lpin the tuned circuit into two parts, Lp and L',
one of which, L', is introduced in series with the capacity as
shown in fig. 25. This amounts to connecting the plate to a
suitable tapping point on the inductance L,pin the tuned circuit.
The frequency of an oscillator is conveniently adjusted by
means of a set of condensers, from a variable air condenser 0001
microfarad to large capacities of the order of 10 microfarads in
mica or paraffin paper condensers. It is convenient also to have
a series of pairs of inductances suitable for different ranges of
frequency, e.g. 1 henry for frequencies from 200 to 1000 or 2000,
10 millihenries for frequencies of the order 10,000, and so on.
A set of coils made for radiotelephony purposes will cover the
higher frequency ranges if required. There are numerous com-
mercial forms of valve which are suitable for oscillators having
power outputs from a few watts to many kilowatts. 'Loud
speaker' valves are very convenient where a moderate output,
10 or 20 watts, is required for general laboratory purposes. If
larger powers are necessary it is advisable to refer for special
information to treatises on radiotelephony.
Valve Amplifiers - The use of amplifying valve circuits to
increase the intensity of relatively feeble alternating currents and
voltages is of considerable importance in connection with electrical
methods of sound reception. Feeble sound waves, of whatever
frequency, may be picked up by means of a receiver which con-
verts the mechanical into electrical vibrations and the latter
multiplied many hundreds of times, if required, by means of a
valve amplifier. As in the case of valve oscillators, many forms of
amplifier exist. The design of the inter-connections of a multi-valve
amplifier depends essentially on the frequency range in which it is to
be used, and on the amount of permissible distortion of wave-form.
6

82 ELECTRICAL VIBRATIONS
Resistance-capacity coupled amplifiers are very useful and, with
suitable valves and grid bias, give a faithful reproduction of wave-
form. At audiofrequencies it is possible to use commercial
forms of transformer without serious distortion. In figs. 26a and
h.t.;
Fig. 26A—Amplifier Transformer Coupling
26b typical valve amplifier circuits of this nature are indicated.
The design of the input and output ends of a multi-valve amplifier
must, of course, depend on the particular circumstances under
which it is to be used. Commercial types of amplifying valves
give voltage amplifications varying from 6 to 36 or more, according
H.T
Fig. 26b—Amplifier Resistance-Capacity Coupling
to the design. Usually a high voltage amplification implies a
high plate impedance. Descriptions of valves and valve circuits
with their amplifying, rectifying, and oscillatory properties are to
be found in numerous publications dealing with radiotelephony.
These should be consulted if further information is desired.

SECTION II
VIBRATING SYSTEMSAND SOURCES OF SOUND
Hitherto we have dealt with simple ' ideal ' systems, point sources,
homogeneous media, and simple harmonic motion. It is neces-
sary now to consider how the results thus obtained are applied to
the more complex vibrations of actual sources of sound. Solid
bodies are particularly liable to vibrate in more than one mode,
and in each of these possible modes there may be overtones
present in addition to the fundamental. By adopting suitable
precautions, it is possible in certain cases to confine the vibration
mainly to one particular type. The vibrations of a stretched
string, for example, are predominantly transverse, but it is not
difficult to excite longitudinal or torsional vibrations also. As the
diameter of a wire increases relatively to the length the importance
of the longitudinal mode of vibration increases, and in a rod the
transverse and longitudinal modes are both easily excited. Asthe diameter of the rod is still further increased relatively to the
length, the rod may ultimately be regarded as a plate which
vibrates in the transverse mode most easily. In all these cases,
however, if the method of excitation is suitably chosen, it is
possible to encourage one particular mode, whilst discouraging
the others. The vibrations of the body are also affected by the
nature of the medium surrounding it, and by the presence of
other bodies in the neighbourhood, particularly if these bodies
have natural periods of vibration equal to, or near to, that of
the vibrating source.
In considering actual cases it is generally necessary to makesimplifying assumptions and to deal with vibrators conforming
approximately to certain simple types. Vibrations of the inter-
mediate types which do not conform with the mathematical
assumptions and approximations must be considered mainly
from the purely 'physical' aspect, the mathematical treatment,
when possible, being very complex. For example, the string
vibrator is regarded as a perfectly uniform and flexible filament of
solid matter stretched between two fixed supports. In practice,
allowance has to be made for lack of uniformity and flexibility and
83

84 TRANSVERSE VIBRATIONS OF STRINGS
for movement of the points of support. The method of excitation
of vibration in a body has a considerable influence on the wave-
form or quality of the sound it emits. A string, for example,
vibrates transversely in different ways according as it is bowed,plucked, or struck. A steel rod struck at one end will vibrate
both transversely and longitudinally, but by means of an electro-
magnet it is possible to make either mode predominate.
In regard to the nature of the motion of solid vibrating systems,
the more important factors with which we shall have to deal are,
broadly speaking, (1) the resonant or 'natural' frequencies of the
vibrating system, (2) the segmental arrangement of the various
forms of vibration, and (3) the extent to which these vibrations
may be communicated to the surrounding medium. The appli-
cations of vibrating systems as sources of sound will be discussed.
TRANSVERSE VIBRATIONS OF STRINGS
The type of vibration of stretched strings or wires with which
we are most familiar is that in which the particles of the string
vibrate in a plane perpendicular to the line of the string. This
form of vibration is described as the transverse or lateral type.
Another mode of vibration which is of comparatively little interest
is the longitudinal vibration in which the string remains straight
but the tension varies.
In the first instance we shall assume the 'theoretical' string
which (a) is perfectly uniform, having a constant mass per unit
length, (b) is perfectly flexible, its stiffness being supposed negli-
gible, and (c) is not subjected to appreciable changes of length
whilst in vibration. A long, thin, tightly stretched wire held
between massive and well-clamped supports fulfils these con-
ditions fairly well. After dealing with the 'ideal string' we shall
consider what modifications are necessary to conform with actual
conditions, in which the wire has stiffness and the supports yield
as the wire vibrates. When any point of a wire stretched between
two fixed points is displaced and released the wire commences to
'vibrate.' This vibration in effect results from transverse motions
travelling in opposite directions along the string, and successive
reflections of the 'wave' from the opposite fixed ends. In order
to visualise such reflection of a transverse wave the student is
recommended to make a few simple experiments on waves
travelling along a stretched rope, one end of which is held in the
hand whilst the other end is fixed. It will be observed that the

VELOCITY OF TRANSVERSE WAVE 85
movement of each particle of the rope whilst it forms part of the
reflected wave is in the opposite direction to its motion whilst it
formed part of the original wave. If such a transverse wave
arrives at the 'free' end of a rope it is also reflected, but the
direction of motion of the particles is not reversed. The rope
assumes the form of a sine wave if the end is moved up and downharmonically.
Velocity of a Transverse Wave along a String - A long
string of mass m per unit length is stretched by a force of T dynes.
Assume, in the first place, that the gradient of the curve formed
by the string in its displaced position is always so small that the
tension T may be regarded as constant. Taking the x axis of
co-ordinates in the direction of the undisplaced string, and the
y axis in the direction of displacement at right angles to the
string, we require to determine the motion of an element 8x
whose displacement is y at the point x at the instant t. If (6— 86)
and cf) are the angles of inclination of the tangents to the curve at
the ends of the element S.v, the difference in the tensions acting
on the ends of the element in the direction of the y axis will be
T {sin (</>— 8(f>)
—
sin 6}=T cos cf> . 8(j> =TS(sin <j>) .
Also the mass of the element S.v is ;//S.v, and its acceleration in the
direction of y is d-y df2 , whence
m8x .d2y df2 =T8(sm6) . . . (1)
Writing sin<f>=tan
<f>=dy dx when the gradient of the curve is
small, we have
df2 m dx- ' K >
which characterises a wave-motion travelling with a velocity
c=VT/m .... (3)
The solution of equation (2) is
y=f(ct-x)+F(ct+x) ... (4)
representing transverse waves travelling in opposite directions
with the same velocity c.
Cf. with equations (8) and (9), p. 50.
A novel method of proof of the wave-velocity formula (3) has
been given by Tait * in which the string is drawn through an
* Encyclopedia Britannica, 9th ed.. Art. ' Mechanics.'

86 TRANSVERSE VIBRATIONS OF STRINGS
imaginary smooth tube with velocity c. The tube is straight
except for the isolated curved portion which represents the wave
on the string. If R is the radius of curvature at any point of the
tube, the force acting in the direction of the normal to an element
8s is TSs/R, where T is the tension in the string. Now the
centrifugal force of the element $s of mass m per unit length and
velocity c will be mSs . c2/R, and this must balance the force
TSs/R if there is to be no reaction on the tube. Consequently,
if TSs/R=m . Ss . c2/R, c=VT/m, and there is no reaction on
the tube, i.e. the tube may be regarded as absent, and the wave
travelling along the string with the velocity c= VT/m. In this
method of proof, no assumptions need be made regarding the
smallness of the displacement.
Reflection. Formation of Stationary Waves - If both ends
of the string of length / are fixed, the wave is reflected successively
from each end, and the resultant motion is determined by the
superposition of the direct or incident wave and the reflected waves.
The equation of motion expressed in (4) above must now be
modified to suit the end-conditions of the string where the dis-
placement y must always be zero. Thus we have, when #=0,
y =0, i.e. f (ct) = — F(cf) ; we may then rewrite (4),
y =f(ct—x)—f{ct+x) ... (5)
Since y=0 when x=l we have also
f(ct-I)=f(ct+l) . . . (6)
or writing
z=(ct-l)
/(*)=/>+ 2/),
indicating that z is a periodic function repeating at intervals of 21.
Consequently the motion of the string is periodic, the period
T=2l/c being the time taken for a wave to travel along the full
length of the string and back again. The frequency of this form
of vibration is consequently
c ItN=— where c= K —,21 \ m
i.e.
• N4\/~- • • • (7
.)
If the displacement y varies sinusoidally with the frequency we

STATIONARY WAVES ON STRING 87
may obtain stationary waves on the string. Thus equation (5)
may be written
y^=a cos n(t—x/c)—a cos n^+x/c),
which reduces to
y =2a sin nt sin nx/c \
=2a sin (2ttN*) . sin (2ttNx/c)\l
At any point x along the string the amplitude is therefore varying
sinusoidally with time between zero and 2a. The amplitude of
successive particles is also varying with distance x according to a
sine law. The result is a series of loops formed on the string, the
amplitude varying between and 2a, i.e. the maximum amplitude
is double that in the initial wave. The condition for the formation
of loops on a string of finite length / is clearly that in which / is a
whole multiple of the length of a loop. At x =0 and x =1 we must
have y =0, therefore, from (8),
sin (2ttN//c) =0 or 2ttNI/c=tt, 2tt, 3tt, etc.
Consequently the frequencies of the various partials are given by
sc s /TN*=2/ or
21V m'WherC
*= 1
'2
'3
>etc
' ' (7fl
)
representing a complete harmonic series o tones. The number of
loops, i.e. half wave-lengths, into which the string divides is equal
to s. A few of the modes of vibra-____^
tion are indicated in fig. 27. There <^TT^ A ^T^-"*' 5^are a number (s— 1) of points which
are at rest between the fixed ends ^
—
A —^jjj^r " "A" " ^» s=2
of the string. These points marked
N are called nodes, whilst inter- ^^__ nj, n^_^^^mediate points marked A, at which z~ a"^ "a"the amplitude of vibration is a maxi- FlGmum, are known as antinodes or
loops. Any node might be clamped without interfering with the
motion of the remainder of the string.
The string may, of course, vibrate with any number of partials
at the same time; the resultant sound being characterised by the
overtones present in addition to the fundamental. The harmonic
relation of the overtones is regarded as essential to the good musical' quality ' of a vibrating string.
The laws of vibration of strings, embodied in equation (la)
were discovered experimentally in 1638 by Mersenne. Theymay be stated as follows :
—

88 TRANSVERSE VIBRATIONS OF STRINGS
1
.
For a given string and a given tension the frequency varies
inversely as the length. (Note.—This principle was known to
Aristotle.)
2. For a string of given length and material the frequency
varies as the square root of the tension applied.
3. The frequency of vibration of strings of the same length and
subjected to the same tension, varies inversely as the square root
of the mass 'm' per unit length of the string, i.e. varies inversely
as the square root of the area of cross-section A and the density
p of the string (since m=pA).These results may be simply deduced by the method of dimen-
sions. Assuming that the frequency of vibration N is dependent
only on the length /, mass per unit length m, and the tension T3
of the string,
Z=(L) /^(ML- 1) T
1=(MLT- 2
) N^T- 1).
ThusFrequency NsT-^/yT/,
and we have
(length) a—b+ c= ol
(mass) &+ c— giving c=|, b= — \, a = — 1.
Time -2c= -l]
1 1 /t~Consequently, the frequency Nqc— qc-./ — as before.
1 / V p
The Monochord or Sonometer - Examples of the application
of Mersenne's laws are to be found in all stringed instruments.
They are most easily verified by means of the sonometer or mono-
chord. This consists essentially of a thin metallic wire (steel piano
wire is usually employed) stretched over two 'bridges' by means
of a weight hanging over a pulley, or by a spring tensioning device.
A movable bridge provides a convenient means of varying the
vibrating length of the wire. It is important that the base on
which the string and bridges are mounted should be strong and
massive, yielding as little as possible to the forces of tension
applied to the string. The vibrations may be excited in any
convenient manner, e.g. by plucking, striking, bowing, or by
electromagnetic means. The monochord is very useful as a
means of comparing frequencies (see also p. 103). Fixing the
tension of the string, the length which tunes to a fork of standard
frequency is determined. The corresponding length for the' unknown ' note is also found, and the ratio of frequencies is the
inverse ratio of the lengths. Sonometers are often provided with

MONOCHORD. MOTION AT NODES 89
a second wire of fixed length and tension to provide a standard
frequency as a basis for comparison. The use of the frequency
formula, equation (7), for the absolute determination of pitch
does not permit of great accuracy on account of the difficulty
of measuring the tension, which is liable to variation on opposite
sides of a bridge. The * effective ' length of a string is rendered
somewhat uncertain by the stiffness of the wire, and the frequency
is further affected by yielding of the bridges.
The various overtones, in this case harmonics, of a string maybe very simply demonstrated by the monochord. If the string
is lightly damped at the midpoint, by touching it gently with the
finger, and then plucked, it will be found to vibrate in two loops.
The antinodes, if of small amplitude, may be easily located by
means of small paper riders arranged at short intervals along the
wire. If the string is touched at a point one-third of its length
from the end, it will vibrate in three loops. Similarly it can be
made to vibrate in four, five, or more sections by touching it at
one-fourth, one- fifth, etc., of its length from the end.
Small Motion at the Nodes of a String - It is generally agreed
that the nodes of a string which is maintained permanently in
vibration in two or more loops cannot be points of absolute rest,
as the energy requisite for the maintenance of the vibrations is
transmitted through these points. The problem has been in-
vestigated by Raman,* who has shown that these small motions
at the node differ in phase by a quarter period from the vibrations
of the rest of the string. By attaching a thread to an obliquely-
set electrically-maintained tuning-fork, and to various points of
the vibrating string, it was found that points of the string in the
loops describe ' figure of eight (8) ' curves, whilst the so-called nodes
describe very flat parabolas, the chief motion being longitudinal.
S. Ray f has shown that the velocity of a transverse wave ona string is a function of the ratio a/X, where a is the amplitude
of vibration and A the wave-length. (The ordinary theory assumes
the wave-form to be very flat, and consequently the velocity is
independent of a and A.) When a/X is constant, or the wavesare geometrically similar, the velocity of propagation is constant,
but not otherwise. The velocity of a wave therefore cannot be
independent of the amplitude of vibration. On this basis J S. Rayexplains the motion of the nodes of strings as investigated byRaman.
* Nature, 82, p. 9, Nov. 4, 1909. f Phys. Rev., 28, p. 229, July 1926.
X Ibid., p. 1321, Dec. 1926.

90 TRANSVERSE VIBRATIONS OF STRINGS
Stiffness of Strings - The definition of a string given above
requires that the string shall have no * stiffness, ' i.e. shall require
no force to bend it. A stretched steel wire, at the point where it
passes over the bridge of a monochord, reveals the weakness of
this theoretical assumption; especially if the wire is moderately
thick. At such a point the 'wire' is tending towards a 'bar' or
rod, in which elastic forces are called into play when bending takes
place. A short length of steel wire clamped at one end has a
definite period of transverse vibration of its own due to this
inherent stiffness which we have hitherto ignored. In the case
of a wire having finite stiffness, the restoring force acting on an
element displaced from its normal position consists of the com-
ponent of the applied tension acting 'inwards,' plus an elastic
force called into play by the bending of the wire. Thus the total
restoring force is increased a with corresponding increase in
frequency. Savart, who first investigated this effect, obtained
the result N 12=N 2+N 2
, where N x is the observed frequency,
N the calculated frequency for an 'ideal' string (see equation (7)),
and N is the frequency with which the string would vibrate at
zero tension {i.e. by the virtue of its own stiffness). Rayleigh #
has determined the effect of stiffness and finds that the frequency
of a wire is increased in the ratio 1 : (1-f Bs27t
2/2T/2), where B
is a quantity depending on the material and form of section of the
wire. Donkin f has calculated the frequencies of the harmonic
series of a 'stiff' wire of circular section, viz.
5 ITJ
ttWE)
where r is the radius of section and E is Young's Modulus of the
material of the wire. The second term in brackets represents
the correction factor for the 'stiffness' of the wire. It will be
seen that the correction is small for the fundamental (f=l) of a
wire of small radius of section, but becomes more and more im-
portant as the number of loops s increases. An increase in the
number of loops has, from this point of view, a similar effect to
a decrease in length / of the wire.
Taking the case of a steel wire of length 50 cms., 0-5 mm.diameter, subjected to a tension of 10 7 dynes (about 25 lbs. weight),
the fundamental frequency is found to be approximately 1-00012
* Sound, 1, p. 207 ; and E. Allan (Phil. Mag., p. 1324, Dec. 1927);
see also Lamb, Sound, p. 133.
f Donkin, Accoustics.

LOADED STRINGS 91
times that of the ideal wire. The same wire vibrating in 5 loops
(s=5) would have a frequency 1-003 times that of the 'ideal'
string—the correction is here more important. When the stiff-
ness of the string is taken into account, not only is the fundamental
raised in pitch but the overtones are raised in pitch in increasing
proportion. Consequently the fundamental and overtones of a
'stiff' string no longer form an exact harmonic series. With the
strings usually employed in music these slight divergences from
the ideal string are not of serious importance.
Yielding of the Supports - Rayleigh * has calculated the effect
on frequency produced by yielding of the supports, or bridges,
carrying the tensioned wire. The principal cases are examined
in which the supports have (a) negligible mass, but a very large
spring factor /x, and (b) negligible spring factor but very large
mass. In the former case the effect of the yielding is the same
as that due to an increase of length of the string in the ratio
1: (l-f2T//x/). In the latter case, where mass predominates, the
effect is equivalent to shortening the string in the ratio
1:(1-2T//M«Vt72).
Whether the frequency of the string will be raised or lowered
by the yielding of the supports depends therefore on the sign
of the correction factor, i.e. whether the natural frequency of the
yielding support (of mass M and stiffness jjl) is lower or higher
than that of the string. In case (a) there is a proportionate
lowering of frequency for all overtones, which therefore still form
a harmonic series. In case (b), however, the proportionate rise
in frequency is greater the lower the harmonic component (i.e.
the smaller s).
Loaded Strings - It will be clear that any normal mode of
vibration of a string having a node at the point to which a load is
attached will be unaffected by the presence of the load. Thefundamental will, of course, be reduced in frequency. Thus if
a load is attached to the midpoint of a string the even harmonics,
having a node at the centre, will be unaffected, whereas the oddharmonics will be lowered in frequency. The harmonic relation-
ship is therefore disturbed by the addition of a load at any point
of a uniform string. Rayleigh (1, p. 205) calculates the period
of the fundamental vibration of a string of mass m per unit length
* Sound, 1, p. 203.

92 TRANSVERSE VIBRATIONS OF STRINGS
carrying a load M (large compared with mass of string) at its mid-
point, viz.
„ . , IW I ml\Penod^
N/-.(l+-j . . (10)
If the mass of the string ml is small compared with the added load
M this becomes
Period =77VM//T,
a result which may be deduced directly from simple dynamical
considerations. For example, if the mass M is displaced a
distance y from its normal position and released we have
M</^/<fc 2 = -2Tsin 0,
where 6 is the inclination of the displaced string relative to its
zero position. Now sin 6 is equal to 2y/l (approx.), consequently
, rd2y 4Ty
1 / HP
whence w2 =4T/M/. The frequency N=
—
== ~\/ir7r7>an<^ tne
27T 77 V Nil
period =77 / A load distributed uniformly along the whole
length of the string merely adds to the effective mass per unit
length m of the string without adding to its stiffness (if this can
be assumed), the result being a lowering of frequency of the
fundamental and all the overtones in the same ratio. Use is madeof this type of loading in the lower strings of a pianoforte. In
order to obtain a sufficiently low frequency within the limits of
length and tension possible in the instrument, the lower strings
are loaded with a closely wound layer of wire. This increases the
mass without appreciably increasing the stiffness.
Methods of Producing Vibration in Strings. Quality - Astretched string may be set in transverse vibration in a variety
of ways. Plucking, bowing, and striking are the more familiar
methods, exemplified in the harp, the violin, and the piano
respectively. A string may also be set in vibration by forced
oscillation of a point of support or of some point intermediate
between the fixed ends. Meldes classical experiment, in which one
end of a string is attached to a vibrating tuning-fork, is an example
of the former, whilst the electromagnetically maintained wire

QUALITY 93
described on pp. 76 and 102 exemplifies the case of forced excita-
tion at an intermediate point. It will be appreciated that the
method of excitation has a very important influence on the form
of the wave which travels along the string. A Fourier analysis
of this wave reveals the relative amplitudes of the various
harmonics present in the disturbance. Now the quality of the
note emitted by the wire is dependent essentially on the relative
amplitudes of the various overtones which are added to the funda-
mental tone. It is just this addition of overtones which makes it
possible for the ear to distinguish between the sounds of a piano,
a violin, and a tuning-fork emitting the same note. If the pure
fundamental tones could be separated in each of these cases they
would be indistinguishable from one another. The overtones
introduce the necessary quality which is so important to the ear.
It is therefore necessary to consider the influence of the modeof excitation on the production of overtones.
The general form of the displacement of a stretched string
is given by equations (2), (3), and (4) on p. 85. Equation (4)
represents two waves travelling with equal velocity VT/m in
opposite directions. When these waves are reflected at the fixed
ends of the string and are superposed on the incident waves,
stationary waves are formed and the wire is divided into nodes
and loops in a manner dependent on the form of the incident
waves, i.e. dependent on the method of displacing the string. In
the case of the fundamental type of vibration in which the string
forms one loop only (/=A/2), the displacement y x in the stationary
waves is given by equation (8), p. 87, where N=c/2/, that is,
7TX . TTCt
y1=A sin— . sin— . . (11)
In the case of the sth harmonic (l=sX/2) and N =sc/2l,
a . / 7TX\ . I 7TCt\
y s=As sm[s .— smls .—-J
. . (12)
The resultant vibration of the string will generally be complexand dependent on the mode of excitation, consequently the
resultant displacement will be represented by the summationfrom s=ltos= Goofa complete Fourier series involving sine andcosine terms (see p. 26), thus
3>=2 sin(^j|«s cosU^j+^ sin (^)| (13)

94 TRANSVERSE VIBRATIONS OF STRINGS
This is the most general solution of the motion of a string. Theequation was first obtained by Bernouilli in 1755. The constants
as and bs will of course depend on the special circumstances of the
vibration, and may be expressed in terms of initial values of yand y. In equation (13), when 2=0, representing the string in
its initial or 'starting' position, the coefficients of bs =0, and
STTX
T'y 2 a* sm
Similarly
y
— /~° '""-'
TTC^* s= l
bs sinSttX
I
(the coefficients of as being zero)
(14)
The values of the coefficients as and bs in (14) may be determined
as in the case of Fourier's Theorem (p. 26 et seq.). Multiplying
by sin (sttx/1) and integrating from to /, we find
2ri SttX
y sin ——ax
and2 fl . . STTX
b,=— y sm —— . axSTTCSV I
(15)
Equations (13) to (15) may now be used to calculate the motion
of the string in particular cases, assuming the condition of the
string at one particular instant is known.
Strings Excited by Plucking or Striking - If the initial dis-
placement of a string be produced by 'plucking,' i.e. by pulling
aside at one point and suddenly releasing, the wave-form which
travels along the string will depend on the nature of the bend in
pthe string at the point of
plucking. We shall assume
that the displacing force
B acts at a particular point Cof the string AB (fig. 28).
Actually, of course, the
force must act on an element of appreciable length. Let the co-
ordinates of the ' plucked ' point P of the string at the instant t =0be x=dandj>=/3. Between A and F,y=j3x/d; between B and P,
y=P(J—x)/(j—d) 1consequently from equation (14) we obtain
«, d ^CFig. 28
221
fdX .
Jo d
STTX
I
dx'ICH—X
JdJ^d
X . STTXsm—j-dx
d I
2pr< Sndsin
TT2s2d(l-d) I
(16)

PLUCKING AND STRIKING 95
This relation indicates that the sth harmonic will disappear when
sin (s7rd/l)=0, that is, when sd/l is any integer, or whenever there
is a node of the sth harmonic situated atF. If the string is divided
into 5 equal parts and is plucked at any dividing point, the sttl
harmonic will be absent from the resultant vibration. This
principle also shows, in the case of a string at rest in its equilibrium
position, that it is impossible for any force applied at the mid-
point of the string to produce any even harmonics. If, after the
application of a force at the midpoint, this point be damped bytouching it lightly, the string will be brought to rest; for the odd
harmonics cannot persist with a node at the midpoint, and the
even harmonics were absent initially for the reason given above.
Thomas Young # (1841) proved experimentally when any point
of a string is plucked, struck, or bowed, all the overtones (or
partials) which require that point for a node will be absent from
the resultant vibration.
The relation for as given in (15) indicates that a string plucked
in the above manner has the full harmonic series of overtones,
the amplitude varying inversely as s2
, i.e. the amplitude of the
partials falls off rapidly towards the higher frequencies. Thequality of the resultant tone depends on the ratio d/l, and conse-
quently varies with the point of plucking the string.
It must be remembered that the foregoing treatment refers to
an 'ideal' string. As we have seen, the 'stiffness' of an actual
string causes a slight departure from the harmonic series. Dampingdue to internal friction is another factor which has a similar
tendency—its effect becoming more important at higher fre-
quencies. Since the higher partials are damped most rapidly,
the tone of a plucked string improves in purity (i.e. tends towards
the fundamental S.H. type) as it diminishes in loudness. Well-
known examples of plucked string instruments are the harp,
guitar, mandolin, banjo, and various 'jazz ' instruments.
When a string is excited by striking, complications arise due to
the finite time of contact of the striking hammer with the string.
The general features of the vibration produced by striking are
much the same as those in which the string is plucked, but the
motion is complicated by the fact that the point of the string whichreceives the blow of the hammer is displaced before the remainderof the string. The resultant wave-form is therefore dependenton a number of factors, including the duration of the blow, the
velocity of the hammer, and the relative masses of the hammer* See Tyndall's Sound, pp. 118-124.

96 TRANSVERSE VIBRATIONS OF STRINGS
and string. During recent years a considerable amount of research
has been carried out in connection with this complex question.
Various theories have been developed, notably those of Helm-holtz and of Kaufmann.* In both theories the assumptions maderelative to the mode of contact between hammer and string are of
a somewhat artificial character when compared with the actual
conditions experimentally determined.f As in the case of the
plucked string, the sth harmonic is absent if the string be plucked
at one of the nodes corresponding to this harmonic. The moreabrupt and localised the blow, the greater the relative intensity of
the higher harmonics. Harmonics above the sixth are considered
undesirable in a pianoforte string, consequently the hammers are
covered with felt to reduce the suddenness of the impact, and the
blow is struck at a point from one-seventh to one-ninth the length
of the string from the end.i As Helmholtz has pointed out, all
overtones above the sixth are dissonant tones which must be
suppressed by making the striking-point coincide with a node for
these overtones.
Recent work on the elastic impact of a pianoforte hammer has
thrown some light on this difficult problem. Bhargava and
Ghosh § have shown that the elasticity of the hammer felt must
be taken into account in calculating the duration of impact. With
this addition, Kaufmann's theory, which refers to the unyielding
hammer, agrees well with experimental results. Ghosh and
Dey||have subsequently verified the theoretical deductions by
a photographic method. W. H. George ^f has investigated by
an oscillographic method the duration and mode of contact
between metallic hammers and strings, and has found in some
cases momentary separation between hammer and string. Theexistence of important pressure variations and the instants of
their occurrence during the impact have been established. Theresults obtained cannot be explained on the theories of Helmholtz,
Lamb, or Bhargava-Ghosh, but may be reconciled with those of
Kaufmann, Das,#* or Raman-Banerji. Using a suitably designed
* Helmholtz, Sensations of Tone ; and Kaufmann, Wied.Ann.,5^, (1895).
f See papers by G. H. Berry (Phil. Mag., 19, p. 648, April 1910) ; G. H.Bryan (Phys. Soc. Proc, 25, 1912-13) ; C. V. Raman and B. Banerji
(Proc. Roy. Soc, 97, p. 108, 1920).
t Tyndall, Sound, p. 122.
§ Phil. Mag., 49, p. 121, Jan. 1925 ; and Phys. Rev., 24, p. 456, Oct. 1924.
II hid. Assoc. Cult. Proc., 9, 1925.
H Proc. Rov. Soc, 108, p. 284, 1925; and Phil. Mag., 49, p. 97 ; and50, p. 491, 1925.
** P. Das, various papers in Ind. Assoc. Cult. Proc, 7, 9, and 10.

BOWING 97
metal hammer, equivalent to a pendulum, George and Beckett *
have shown that the loss of energy on rebound from a string
struck transversely is a measure of the energy communicated to
the string. As the position of the impact moves away from a
bridge the energy lost by the hammer increases exponentially until
a point of maximum energy-loss is reached. This point is nearer
the bridge the heavier the hammer. Measurement of the duration
of the impact shows that for maximum energy- loss by the hammerthe conditions are such that the hammer rebounds just before the
wave reflected from the farther bridge reaches the point of impact.
In a recent paper P. Das f gives a theory involving an elastic
pianoforte hammer, explaining why a hard hammer imparts a
piercing quality to the general tone of the vibrating string. Again
,
if the elastic hammer has a large initial velocity, and hence under-
goes a large compression, its effective hardness increases. Conse-
quently, if the string be struck very hard, the tone loses its softness
and acquires a metallic ring.
Strings Excited by Bowing - Many attempts have been madeto develop a theory for the vibrations of a bowed string, but upto the present none of these can be regarded as completely satis-
factory. Helmholtz in 1861 gave an explanation of the mode of
vibration of a violin string which is in tolerably good agreement
with observation. He observed the motion of a bowed string bymeans of the vibration microscope. The latter was used to view
an illuminated particle attached to the string, the 'microscope'
(objective) being mounted on a prong of a tuning-fork (electrically
maintained) vibrating in a direction at right angles to the vibra-
tions of the string. The Lissajous figures thus observed served
to indicate the nature of the vibration of the string. Helmholtz Jconcludes: "We learn therefore by these experiments:
" (1) The strings of a violin when struck by the bow, vibrate
in one plane.
" (2) That every point of a string moves to and fro with two
constant velocities.
" These two data are sufficient for finding the complete equation
of the motion of the whole string. It is the following:—
,-AZ{i*.(?)-(g)}.
* Proc. Roy. Soc, 114, Feb. 1927.
f Proc. Phys. Soc, 40, p. 29, 1927 ; and Phil. Mag., 6, p. 479, 1928.
t Phil. Mag., 21, 393-396, 1861.
7

98 TRANSVERSE VIBRATIONS OF STRINGS
T is the duration of the vibration and A an arbitrary constant.
A comprehensive idea of the motion represented by this equation
may be given in the fol-
lowing way: Let ab, fig.
29 (a), be the equilibrium
position of the string.
During the vibration its
forms will be similar to
acb, compounded of two
straight lines ac and cb,
intersecting at c. Let this
point of intersection moveFig. 29
with a constant velocity along two flat circular arcs, lying sym-
metrically on the two sides of the string, and passing through its
ends, as represented in fig. 29 (a). A motion the same as the
actual motion of the whole string is thus given. As for the motion
of every single point it may be deduced from the above equation
that the two parts ab and be (see fig. 29 (b)) of the time of every
vibration are proportional to the two parts of the string which are
separated by the observed point. The two velocities, of course,
are inversely proportional to the times ab and be. In that half of
the string which is touched by the bow, the smaller velocity has
the same direction as the bow; in the other half of the string it
has the contrary direction. By comparing the velocity of the
bow with the velocity of the point touched by it, I found that this
point of the string adheres fast to the bow and partakes of its
motion during the time ab, then is torn off and jumps back to its
first position during the time be, till the bow again gets hold of it."
After remarking on Young's law that all component vibrations are
absent which have a node at the point of excitation, Helmholtz
refers to the suppression of high overtones which are dissonant.
"Near the end of the string, where the bow is commonly applied
by players, the nodes of different harmonics are very near to each
other, so that the bow is nearly always at, or at least very near to,
the plane of a node."
Helmholtz's observations indicate that the note produced by
bowing has the same pitch as the natural note of the string. Thevibrations, apparently forced by the bow, may therefore still be
regarded as free. Although the energy for maintenance comes fromthe bow, the note is determined by the string. The intermittent
dragging action of the bow serves to maintain the natural vibra-
tion of the string in the short intervening periods. Rayleigh

WOLF-NOTE 99
suggests that the sustaining power of the bow depends on the fact
that solid friction is less at moderate than at small velocities.
Consequently when the part of the string acted on is moving with
the bow (not improbably with the same velocity) the mutual
action is greater than when the string is moving in the opposite
direction with a greater relative velocity. "The accelerating
effect in the first part of the motion is not entirely neutralised
by the subsequent retardation, and an outstanding acceleration
remains capable of maintaining the vibration in spite of other
losses of energy."
The foundations of a mechanical theory of bowed strings have
been laid during recent years principally by the researches of
C. V. Raman.* One of the outstanding questions which is not
yet fully cleared up is the manner in which the overtones of the
bowed string are influenced by the position of the bowing point.
The problem is complicated by other variable factors which
influence the character of the overtones, viz. the bowing pressure
and speed, and the width of the region of contact between the bowand the string. Raman has found in these investigations that the
vibration-curve of a point on the string departs slightly from the
Helmholtz two-step zigzag; one of the motions being uniform
and the other fluttering. Young's theorem is verified, the
amplitude of a partial being zero for a bowing at its node, and the
phase of that partial passes discontinuously from +77/2 to — 7r/2
as the bowing point passes that node.
Wolf-Note - On all stringed instruments of the violin type a
certain note can be found which it is difficult, and often impossible,
to produce by bowing. When this "wolf-note," as it is called,
is sounded, the whole body of the instrument vibrates in an un-
usual degree. At this pitch the bow refuses to 'bite' and a soft
pure tone cannot be obtained. If the pressure of the bow on the
string is increased, the tone resulting is often of an unsteady nature
with variable intensity. G. W. White, f examining the point
experimentally by a photographic method, came to the conclusion
that the pitch of the wolf-note was about that of best resonance
of the belly of the cello on which the experiments were made.Further, the fluctuations of intensity were shown to correspond
to waxing and waning of the vibrations of the belly. C. V. Raman J
* (1) Ind. Assoc, for Cult, of Science, 15, pp. 1-158, 1918; (2) Phil.Mag., 38, pp. 573-581, Nov. 1919.
t Camb. Phil. Soc. Proc, 18, pp. 85-88, June 1915.
t Nature, 97, pp. 362-363, June 29, 1916.

ioo TRANSVERSE VIBRATIONS OF STRINGS
gives a somewhat different explanation. He suggests the effect
depends on the fact that, when the pressure of the bow is less than
a certain critical value proportionate to the rate of dissipation of
energy from the string, the principal mode of the string's vibration,
in which the fundamental predominates, is incapable of being
maintained and passes over into one in which the octave is
prominent. When the bow sets the string in vibration, the belly
of the instrument is strongly excited by sympathetic resonance,
and the rate of dissipation of energy increases beyond the limit
to which the bow can maintain the fundamental pre-eminent ; the
vibration of the string, therefore, changes to that in which the
fundamental is feeble. These views are confirmed by a photo-
graphic record of simultaneous vibrations of string and belly.
Strings as a Source of Sound. The Sounding-Board - In
the foregoing treatment we have, in general, regarded the string
as isolated by its supports or bridges, whereas in reality it is
connected by these supports to some form of base. The string,
in performing its vibrations, reacts on its end supports, which in
turn react on the base. We have seen (p. 65) that on account of
the local reciprocating flow in the air surrounding a vibrating
wire, the latter acts as a double source of very feeble strength.
Consequently a vibrating wire rigidly supported would radiate
extremely little sound energy into the surrounding medium.
When it is desired, therefore, to employ a vibrating string as a
source of sound, e.g. in all stringed musical instruments, it is
essential that its vibrations should be 'transformed'
—
i.e. trans-
ferred to another body which is more suitable to transmit vibra-
tions into the surrounding medium. This office is performed by
the sounding-board, which must be connected to the string by
suitable flexible supports. In this manner a much larger vibrating
area is brought into contact with the medium (air usually) and
the rate at which energy is radiated is greatly increased. Thesounding-board of a piano and the belly of a violin radiate practi-
cally all the energy of strings. It is important in a good stringed
instrument that the sounding-board should possess no predominant
resonance frequencies of its own, otherwise these will reinforce
disproportionately corresponding frequencies of the strings. In
certain cases of such resonance, e.g. the 'wolf-note' quoted above,
the energy absorbed from the string andreradiatedby the sounding-
board may become so great as to be comparable with the total
energy supplied, in which case the reaction on the string becomes
excessive.

SOUNDING-BOARD 101
The manner in which a string communicates its vibrations to
the sounding-board is illustrated in its simplest form in fig. 30,
where AB represents the.,
B
1
Fig. 30
vibrating string, AC and
BD the flexible supports
or bridges, and CD the ~^=
sounding - board. Theeffect of the motion of
the string is to bend the upper ends of the supports inwards
when it is at the upper and at the lower limits of its vibra-
tion. The supports therefore vibrate at twice the frequency
of the string. The sounding-board, however, vibrates with the
same frequency as the string, the corresponding positions 1 and 2
being indicated in fig. 30. The process will be evident from
consideration of the diagram. The amplitude of vibration of the
base will of course depend to a large extent on its mass and stiffness
relative to the corresponding quantities for the wire. The nature
of the supports AC and BD will also influence the result (see also
p. 91). If the base-board and supports of the wire did not yield
there would be no appreciable emission of sound from the wire.
The exact tuning of a stretched string and a tuning-fork is some-
times tested by pressing the stem of the fork on one of the end
supports of the wire—in this process it is tacitly assumed that the
end support of the string is in motion when the string vibrates
transversely. W. H. George * has determined the amplitude of
this end-motion of the string and the variations of tension whichthe string undergoes during vibration. The length / of the
displaced string is given by
JWl +(dy/dx)l=\ WlMdyldxf .dx,
in which y is given by equation (13) on p. 93.
In the case of the fundamental form of vibration
andy=A sin (ttx/1
)
H.\A-AV -nx
V ~tj~ • cos ~r • dx
2/n , r^1+K!-W (1"li- Sin!^^'
W. H. George, Phil. Mag., 49, p. 97, Jan. 1925.

io2 TRANSVERSE VIBRATIONS OF STRINGS
where
k=Att/1 and <j>=7tx/1 .
The change of tension
ST=7rr2Y/(/// -l) (Y -Young's modulus).
The extension of the wire must not exceed the elastic limit, con-
sequently there is a maximum permissible amplitude with a given
tension in the wire. For maximum emission of sound energy the
tension and amplitude must be as large as possible, i.e. a wire with
a large breaking stress, or tenacity, is required. Wolfenden *
states in this connection: ''It is not too much to say that the
improvements made during the last century in the tenacity and
elasticity of steel wire have rendered the modern piano possible."
Greater tenacity in the wire ultimately results therefore in in-
creased sound output with increase of intensity and duration of
tones. The design of sound-boards for various types of stringed
instruments is a very complex problem which is largely dealt with
on an empirical basis by those experienced in the work. Experi-
mental studies have been made by various investigators, notably
E. H. Barton, | of the nature of the vibrations of the sounding-
boards of the violin, pianoforte, and other stringed instruments.
In these investigations simultaneous photographic records are
made of the vibrations of the string and that part of the 'body'
of the instrument under consideration.
Strings Excited by Electromagnetic Means - We have so far
considered only impulsive or discontinuous forms of excitation.
The most direct and simple means of obtaining continuous or
maintained vibrations in a stretched string is undoubtedly the
electromagnetic' method\ We have already referred to one
electromagnetic method of maintaining the vibrations of a
steel wire (see p. 76). In this method the string carries a
contact breaker which interrupts the current in an electro-
magnet as the wire vibrates. The form of maintenance of the
vibrations is analogous to that of the electric bell. A second
form of maintenance of vibrations also employs a contact breaker,
or interrupter, but in this case the interrupted current passes
through the wire itself. The latter may be of any non-magnetic
material having suitable elastic properties. Near its midpoint
* Treatise on the Art of Pianoforte Construction, p. 16, 1916.
t E. H. Barton, Sound.

ELECTROMAGNETIC EXCITATION 103
the wire passes through the transverse field of a magnet (permanent
or electromagnet). The current through the wire reacting on
the steady magnetic field causes corresponding motion of the wire
at right angles to the field. The force acting on the wire is equal
to the product of current, strength of field, and length of wire in
the field. The harmonics in the wave-form of the current passing
through the wire may, if desired, be suppressed by electrical
tuning. An interrupter of this kind was described by Arons.*
It gives a very steady and easily adjustable frequency. A third
method of maintaining a wire in continuous vibration by electro-
magnetic means is analogous to the second method, but in this
case the wire is not self-maintained. Alternating current of con-
trollable frequency is supplied (e.g. from a valve oscillator) to
the wire, part of which lies in a strong magnetic field. When the
frequency of the current coincides with one of the possible
harmonic frequencies of the wire a large amplitude vibration is
set up. Alternatively the frequency of the wire may be tuned to
that of the current by varying the tension by means of any con-
venient ' continuous ' form of tensioning device (e.g. a strong
helical spring extended by means of a screw capable of coarse
and fine adjustment). This method is extremely convenient and,
by suitably disposing the permanent magnet, i.e. by controlling
the point of mechanical excitation of the wire, it is possible to
obtain the higher harmonics. The principle involved is of course
that of the Einthoven string galvanometer (or oscillograph), where
a very fine conducting fibre is caused to vibrate in a magnetic
field by virtue of the small alternating currents passing through it.
In the oscillograph, however, resonance frequencies are avoided
as far as possible, whereas in the present application, as a source
of continuous sound, resonance is encouraged. The principle
has been applied by D. W. Dye f at the National Physical
Laboratory, Teddington, in a standard sonometer or monochord—the instrument being used mainly to determine audiofrequencies
without the necessity of employing a large range of tuning-forks.
This instrument makes it possible to measure or adjust an elec-
trical frequency with an accuracy of 1 in 1000 over a consider-
able range. The sonometer is shown in fig. 31. The design
is very simple. A phosphor-bronze wire 0-3 mm. diameter
has a weight hung on its lower end and is thereby tightly strained
* L. Arons, Wied. Ann., 66, p. 1177, 1898 ; and E. Orlick, Elekt.-Zeits.,
24, p. 502, 1903.
t See N.P.L. Annual Report, p. 83, 1924.

io4 TRANSVERSE VIBRATIONS OF STRINGS
j.
V groove formedby 2 steel balls
in contact
Permanent mag-net embracingwire
Phosphor-bronzewire 0-3 mm.
V -groove pulley
4 mm. dia-meter
Scales of fre-
quency
between a fixed upper nodal point in the form of a V groove(formed by two very small steel balls in contact) and a lower groove
formed by a little wheel
about 4 mm. diameter
on a light steel spindle.
This lower nodal point
is on a carriage which
can be racked up and
down on slides covering
nearly the whole length
of the wire. The carriage
has two pointers, which
indicate the frequency on
direct reading scales. Asmall alternating current
passes through the wire, a
portion of which lies be-
tween the poles of a per-
manent magnet mountedso that it can slide along
the length of the wire.
When the free length
of the wire is such that
its frequency of vibration
in a single loop or in a
number of loops is equal
to that of the source,
a large resonant vibra-
tion occurs. The wire
can be made to vibrate^
in any number of loops
(up to 10) provided the
magnet does not coincide
with a node (Young's
law). It is thus possible FlG - 3i—Dye's ' Sonometer '
to cover a wide range of frequencies by means of a number of
scales. When vibrating in a single loop the range is 200 to 400
;
for two loops 400 to 800; for three loops 600 to 1200; for five
loops 1000 to 3000 ; for ten loops 2000 to 10,000 cycles per second.
The range for one loop also serves for two loops (using a multi-
plying factor 2), but the other ranges require separate scales
because the stiffness of the wire causes these scales to depart
Small V-groovepulley
Tensioningweight

REACTION OF MEDIUM 105
from exact multiples of the unit scale. By this system it is never
necessary, except on the highest range, to use a length of wire
shorter than half the maximum, and so the accuracy of reading
can be kept high. Over the whole range a change of frequency
of 1 in 1000 corresponds to a length of wire not less than 0-4 mm.The error of a setting is less than half this length under any con-
ditions. The power taken by the apparatus is only about 1 milli-
watt to give a good sound above 300 cycles per second or to give
visible loops at lower frequencies. Frequencies between 100 and
200 are obtained by using a weight of one quarter that used for
the other ranges.
When such a vibrating wire is used as a frequency standard,
it is important of course that the supporting base and 'bridges'
should be as rigid as possible. When the wire is to be used
as a source of sound, however, a certain amount of yielding of
the bridges and flexibility of the base—the sounding-board—is
essential. The difference in application is exemplified in the
monochord, as a frequency-measuring device, and the violin, which
is essentially a sound-producing device. The radiation of sound
energy from the sounding-board results in increased damping of
the vibrations of the wire. Thus the amplitude of the vibrations
in a well-constructed monochord will be large and persistent,
compared with the corresponding vibrations in an instrument
with flexible supports and base.
Reaction of Surrounding Medium on a Vibrating String -
Assuming a vibrating wire is rigidly supported, its vibrations are
influenced only by the medium and internal friction. Neglecting
the latter quantity we have to consider the added mass (due to a
layer of the medium moving bodily with the wire), the radiation
of sound energy and loss of energy due to viscosity of the medium.The problem was investigated mathematically by Stokes,* whoshowed that the damping coefficient k is given by
k= V2npfi/p Qa,
where w/277 is the frequency, /x the viscosity, and p the density of
the medium, whilst p is the volume density of the material of the
string of radius of section a. H. Martin f has attacked the
problem experimentally. He observed, by means of a microscope,
the vibrations of an electrically-maintained wire in various liquids,
obtaining resonance curves which indicated both the resonant
* Camb. Phil. Soc. Trans., 9, p. 8, 1856.
t Ann. d. Physik, 77, p. 627, 1925.

106 TRANSVERSE VIBRATIONS OF STRINGS
frequency and the damping coefficient, His experimental results
lead to the empirical formula
k= 1 -45 Vnpfi/p a,
which is in good agreement with Stokes's calculation.
When massive wires vibrate in air at audible frequencies the
damping due to the above causes is relatively small, but whenthe wire is very fine and the frequencies relatively high the value
of k may reach serious proportions. This is particularly the case
in the Einthoven string galvanometer, where a string of silvered
quartz ]/i or 2^ thick (l/x= 10-3 mm.) is sometimes required to
vibrate at a frequency of several thousand cycles per second.
Recently W. F. Einthoven # has tuned such strings to radio-
frequencies, of the order 3 x 10 5 cycles per second, when the
viscous damping in air at ordinary pressures would be so great as
to render the string extremely insensitive. By enclosing the
string (1 mm. long) in a high vacuum (<10~ 3 mm. Hg), however,
the sensitivity obtained was quite satisfactory when the frequency
of the string was tuned to the incoming 'wireless ' signals. Whensuch fine strings are used the damping is of course almost entirely
air-damping. The problem of the vibration of Einthoven
'fibres' has been thoroughly investigated by H. B. Williams,")*
who gives the theory of the vibrations of a string under the action
of a uniformly distributed alternating force (the whole string,
carrying alternating current, is influenced by a strong magnetic
field). The loading effect of the air and viscous damping at
different frequencies is calculated and experimentally determined.
The agreement between these observations with very fine wires
(10-4 cm. diameter) vibrating in air and the theoretical deductions
from Stokes's theory is remarkably good.
A fine electrically conducting fibre, like the Einthoven string,
when vibrating in a magnetic field is electrically % as well as
mechanically damped. Its vibrations set up a back e.m.f., which
reacts on the input alternating e.m.f. and affects the amplitude of
vibration. This phase of the problem is, however, outside our
present consideration (but see p. 446). Einthoven, when using the
'high-frequency string,' removed almost all mechanical damping
and controlled the string by electromagnetic means.
* Proc. Koningl. Akad. von Wetenschaften te Amsterdam.
f Opt. Soc. Amer. Proc, 9, No. 2, Aug. 1924 ; and 13, No. 3, Sept.
1926.
X S. Butterworth, A. B. Wood, and E. H. Lakey, Journ. Sci. Instrs.,
4, p. 8, 1926.

TRANSVERSE VIBRATIONS OF ELASTIC BARS 107
TRANSVERSE VIBRATIONS OF ELASTIC BARS
If the ratio of diameter to length of a wire be increased, the
stiffness becomes increasingly important and the tension relatively
unimportant. The transition stage between a wire, affected mainly
by tension, and a bar, affected mainly by stiffness, is somewhat
complicated,* and we shall deal only with the ideal bar, which
is unaffected by tension.
The theory of transverse vibration of bars, even when simplified
as far as possible by the omission of quantities of secondary
importance, is still very complex in comparison with the theory
of perfectly flexible strings. In the case of strings, harmonic
waves travel with a velocity independent of the wave-length, but
in the case of bars this is not so.# A non-harmonic wave in a bar
has no definite velocity, but the motion is the sum of the separate
motions which would be due to the harmonic components each
travelling with the velocity appropriate to its own wave-length.
A thin bar clamped at both ends may, like a string, form stationary
waves vibrating in one or more loops, but the laws which regulate
the frequencies of the successive modes of vibration are entirely
different in the two cases.
In what follows it will be assumed that the vibrating bar is
straight and uniform in cross-section and density, and is not
subjected to tension or compression. It will also be assumedthat the amplitude of vibration is so small that rotary effects can
be neglected. Further, we shall suppose that in its bent condition,
when vibrating, curvatures are so small that they may be repre-
sented by d2y/dx2yand the length of the bent bar practically the
same as in the unbent condition. In the first place we require
to know the 'bending moment' M, or couple required to benda bar uniformly, so that its axis becomes an arc of a circle of
radius R, i.e. the curvature of the bar is l/R=d2y/dx2, where the
axis of x is in the direction of the length of the unbent bar and
y is in the direction of transverse displacement. The strain in
any part of the bent bar will obviously be proportional to the
curvature. Hence by Hooke's law the bending moment M is
proportional to curvature, i.e.
M=B/R,
where B is a constant depending on the size and shape of the
cross-section of the bar and on the elastic qualities of the material
* See Rayleigh, Sound, 1, pp. 256-301.

io8 TRANSVERSE VIBRATIONS OF ELASTIC BARS
of which it is made.
Fig. 32
When the bar is bent there is a neutral
surface AB at right angles
to the plane of bending,
which is neither extended
nor contracted (see fig. 32).
The material of the bar
will be stretched or com-
pressed according as it lies
on the convex or concave
side of the neutral surface
in the bent position. Con-
sider a filament ab distant r
from the neutral surface.
Let the length of the fila-
ment be Sx and area of
cross - section w. After
bending, its length be-
comes ab' =S#-f A. If Eis Young's elastic modu-lus * of the material of the
bar, we have
Now
Force stretching the filament =EwA/Sx.
Sx+A_8x A
~R whenceR+ r R' Sx R
Consequently the force stretching the filament ab is
\ =Ewr/R,
and the moment of this force about the neutral axis
=Ewr2/R.
The total moment M of all horizontal tensile and compressive
stresses acting perpendicular to the section PS about a line cd
E EI
where I is the moment of inertia of the cross-section about a line
through c at right angles to the plane PQRS. We have there-
fore, since the curvature l/R=d2y/dx2,
M=EI. d2y/dx2. . . (1)
* Defined as the ratio of stress/strain, i.e. the force per unit area ofsection divided by the extension per unit length.
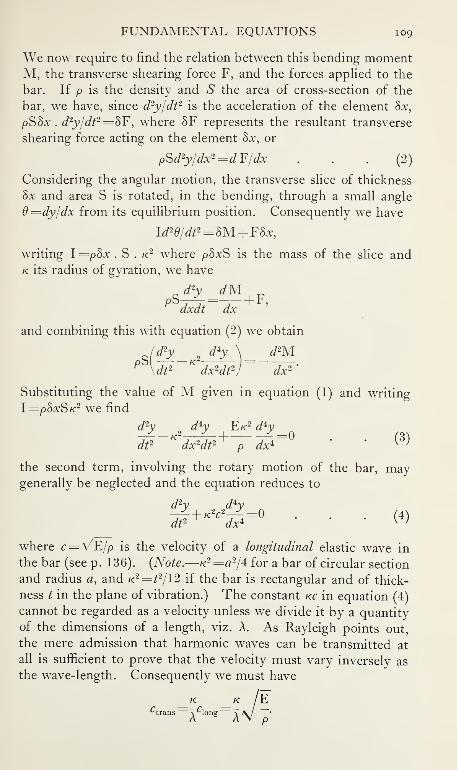
FUNDAMENTAL EQUATIONS 109
We now require to find the relation between this bending momentM, the transverse shearing force F, and the forces applied to the
bar. If p is the density and S the area of cross-section of the
bar, we have, since d2y/dt 2 is the acceleration of the element 8x>
pSSx . d2y/dt2 =$F, where SF represents the resultant transverse
shearing force acting on the element Sjc, or
pSd2y/dx2 =d¥/dx ... (2)
Considering the angular motion, the transverse slice of thickness
Sx and area S is rotated, in the bending, through a small angle
9 =dy/dx from its equilibrium position. Consequently we have
Id29/dt2=SM+ F8x,
writing I =p8x . S . k 2 where pSxS is the mass of the slice andk its radius of gyration, we have
dxdt dx
and combining this with equation (2) we obtain
ld2
y_ 2d*y \ d2M
9\dt2
Kdx2dt2
J dx2'
Substituting the value of M given in equation (1) and writing
I=P$xSk 2 we find
d2y o
d*y Ek 2 d*y
dt2 dx2dt2 p dx* 'w
the second term, involving the rotary motion of the bar, maygenerally be neglected and the equation reduces to
d2y md*y
where c= V'E/p is the velocity of a longitudinal elastic wave in
the bar (see p. 136). (Note.—x 2 =a 2/4: for a bar of circular section
and radius a, and K 2 =t 2/12 if the bar is rectangular and of thick-
ness t in the plane of vibration.) The constant kc in equation (4)
cannot be regarded as a velocity unless we divide it by a quantity
of the dimensions of a length, viz. A. As Rayleigh points out,
the mere admission that harmonic waves can be transmitted at
all is sufficient to prove that the velocity must vary inversely as
the wave-length. Consequently we must have
k /E
Plong \

no TRANSVERSE VIBRATIONS OF ELASTIC BARS
In elastic bars stationary transverse vibration is produced, as in
strings, by the interference of wave-systems which have been
reflected from the ends of the bar. The modes of such vibrations
depend on the method of clamping or supporting the bar. It
should be noted that an end fixed in direction is not a true node
since it is not a point of maximum change of slope; similarly a
free end is not a true antinode, since it is not a place where the
bar moves parallel to itself. The point of zero transverse displace-
ment nearest to a free end is also not a true node, since the change
of slope is not so great there as at the free end. The various ' end
conditions ' for a bar of finite length are
:
(1) Free End. The displacementy and the slope dy/dx may have
any small values. The curvature d2y/dx 2 and the third differential
d3y/dx3 must always be zero.
(2) Clamped End. If the clamp is rigid, the displacement yand the slope dy/dx must always be zero.
(3) Supported End. A knife-edge support (assumed rigid) pre-
vents displacement, therefore y=0, but the slope dy/dx may have
any small value. The curvature d2y/dx2is zero.
Assuming y =a cos nt, equation (4) becomes
£=h- y=mly (5)
where mi =pn 2/EK 2.
If y=ueaxis a solution,* a is a root of m4
, that is, a= ±m or
dbV— 1 .m. The complete solution is therefore
y=(A cosh rajc+B sinn mx+C cos mx-\-T) sin mx) cos nt . (6)
the expression involving the constants A, B, C, D giving the ampli-
tude at the point x. The ratios of the constants A : B : C : D and
the possible values of m are determined by the end-conditions.
When m is determined, we obtain the frequency ?i/27t from
equation (5).
Bar Free at both Ends - Consider a perfectly free bar of
length /. Taking the origin of x at the midpoint * the end-
d2y d3yconditions which must be satisfied are -t^=~t^
= at x=±\l.dx2 dx3
The four equations thus obtained give a value for m which satisfies
tan \ml=—tanh \ml . . . (7)
* See Lamb's Sound, p. 125.

FREE-FREE BAR in
in the case of the symmetrical vibrations when
y=(A cosh mx+ C cos mx) cos nt.
The roots of equation (7) are obtained most simply by graphical
construction (see fig. 33). Plotting the curves jy=tan# and
y = tan 6
-(2) y=+tanh 9lf\/I
/I f\
f r f\\
it e
~A=
2TT 371
/ x = a->/4)n (2-%)n / x = (3-%)7T
1 s = 1 / s= 2 1 s = 3
(10)
- -®y=-tanhi
Fig. 33
y = —tanh 9, the values of 9{=mlj2) at the points of intersection
are found to be closely represented by
x=ml/2 =(*-t)7r+ j3 ... (8)
where 5 = 1, 2, 3 . . . and jS is a small quantity only appreciable
in the case of the fundamental tone when s = l (see fig. 33). Thus
m=2ir(s-j)/l (9)
= vp« 2/E«2 from equation (5).
Consequently the frequency of vibration of the partials is given
closely by
n _7t(4j-1)» k /E^"2^"
8 'Wp'In the case of the fundamental vibration, the factor (4s— 1) in the
above relation should be replaced by 3-0112. It is important to
note:
(a) The frequency N is approximately proportional to (4s— l)2
where 5=1, 2, 3 . . . etc., i.e. the frequencies of the
successive symmetrical modes of vibration of the bar are
proportional to 3 2, 7 2
, ll 2,15 2
, etc., approximately. Theovertones are therefore not harmonics as in the case of
the vibrations of a string.
(b) The frequency N varies inversely as the square of the
length of the bar, indicating that NA is not constant, i.e.
the velocity of transverse vibrations in a bar is dependent on
the frequency.
(c) The frequency is proportional to VE/p, i.e. to the velocity
of longitudinal elastic vibrations in the bar.

ii2 TRANSVERSE VIBRATIONS OF ELASTIC BARS
The form of curve assumed by the bar * vibrating in its funda-
mental mode can be obtained from equation (6) subject to the
necessary end-conditions (see p. 110). The curve is shown in
fig. 34. The two 'nodes' occur at distances 0-224/ from the ends
of the bar.
Fig. 34
The next symmetrical mode, frequency (7/3)2 times that of
the fundamental, has four nodes, and so on.
It may be shown in a similar manner that the asymmetric
modes of vibration of the bar, in which an odd number of nodes
are present, have frequencies approximately proportional to
(4,+r i.e. to 5 2, 9 2
,13 2
, etc. Consequently the possible fre-
quencies of the whole series of partials are proportional to the
squares of the successive odd numbers commencing at three.
The result was discovered experimentally by Chladni,*f and has
been more accurately verified subsequently by E. H. Barton.
J
The transverse vibrations of a free-free bar in water have been
investigated by Moullin and Browne. § For an iron bar they find
Nair/Nwater=Vl+0-l^ (W=width and *=thickness of the bar).
The following table, which relates to ' free-free ' bars in air, gives
the accurate values of relative frequency and position of nodes
(true or false) for the first few tones (Seebeck and Donkin).
No. of No. ofTone. Nodes.
1 2
2 3
3 44 5
Distance of Nodes from one end(in terms of length of bar).
0-2242, 0-77580-1321, 0-5, 0-867900944, 0-3558, 0-6442, 0-90560-0734, 0-277. 0-5, 0-723, 0-9266
Relative
Fre-quencies.
3-011 2
5 2
7 2
9 2
Frequenciesas a ratio offundamentalFrequency.
1
2-7565-404
8-933
* See Rayleigh, 1, pp. 282-284.
f Chladni, Die Akustik. Leipzig, 1802.
% Phil. Mag., p. 578, Nov. 1907.
§ Proc. Camb. Phil. Soc, 24, p. 400, July 192!

CLAMPED-FREE BAR 113
Bar Clamped at both Ends - Applying the appropriate end
conditions to equation (6), it is found that the same series of
tones is obtained as for a bar free at both ends.
Bar Clamped at One End only - At the clamped end
(x= —l/2) we must have ^=0 and dy/dx=0, and at the free end
(#= -f//2) we have d2y/dx2 =0 and d3y/dx3 =0. Applying these
end conditions to equation (6), we find ultimately
tan \ml -j-. coth \ml 11)
which is most easily solved graphically. The intersections of the
curves j>=tan 6 and y= coth 9 give Q=\ml=(s±\)7T Jr fi,
where
s=0, 1, 2, 3, etc., and j8 is a small quantity which affects only the
fundamental frequency seriously. For the overtones we maywrite with sufficient accuracy
m =277(5 ±1)11=4Vpti2/Ek 2
and
N=-•(4*±1)'
/2\ (approx.) .
(12)
(13)
In the case of the fundamental (s=0) and the first overtone (s=T)
a more accurate value of N is obtained by substituting for (4s— 1)
the values 1-19372 and 2-98836 respectively. The possible fre-
quencies of the overtones are therefore approximately proportional
to 3 2, 5 2
, 7 2, . . . etc., having respectively 1, 2, 3, etc., nodes in
addition to the clamped end. The table gives the accurate
theoretical frequencies and position of nodes (true or false, but
excluding the clamped end) for the first few tones (Seebeck and
Donkin).
No. of No. of
Tone. Nodes.
1
2 1
3 2
4 3
Distances of Nodes from free
end (in terms of lengthof bar).
0-2261
01321, 0-49990-0944, 0-3558, 0-6439
Relative
Fre-quencies.
1-194 2
2-988 2
5 2
72
Frequenciesas a ratio offundamentalFrequency.
1
6-26717-55
34-39
The frequencies are again inversely proportional to the square of
the length '/'of the bar, and the partials do not form a harmonic
series.
8

ii4 TRANSVERSE VIBRATIONS OF ELASTIC BARS
Bar ' Supported ' at both Ends - We now have the end
conditions (at #=±Z/2), y=0, d2y/dx2 =0, and ultimately from
equation (6),
JmZ=7r/2 . (1, 2, 3, 4, . . . etc.)
or
w=7r//.(l,2,3,4, . . . etc.) . . (14)
and
n tts2 k E , ,N=£-r-W; • • •
(15)
where $=1, 2, 3, 4, etc. The frequencies of the partials are
consequently proportional to the squares of the natural numbers,
and the nodes are equidistant as in the case of a vibrating string.
In all cases of bars vibrating transversely it is found that the
k /E~frequency of vibration is proportional to — */ — . This relation
I2 \ p
has been verified experimentally by numerous physicists. Using
a 'free-free' bar of rectangular section (K 2 =t2/12), Barton* has
obtained all the partials up to the seventh, agreeing remarkably
well with theory as regards the nodal positions. The theoretical
conclusions relative to the vibrations of a clamped-free bar have
been similarly verified.
Methods of Excitation - Transverse vibrations in a bar maybe excited by similar methods to those used for strings, e.g.
striking, plucking, bowing, or electromagnetic methods are all
applicable. As in_the case of the string also, the partials present
in the resultant vibration depend both on the method of excitation
and on the point of application. Young's law, involving the
absence of all partials requiring a node at the point of excitation,
is applicable also to bars. The various partials of a bar may there-
fore be encouraged or otherwise by supporting and exciting it in
the required manner. Bars of circular section are liable to vibrate
simultaneously in two directions at right angles, i.e. the end of the
bar vibrates in a closed curve resulting from two rectangular
vibrations. Wheatstone's"Kaleidophone" | is a good example of
the complex motion of a bar vibrating in this way. A steel bar
of circular section has a small silvered bead attached to its free
end, the bead being suitably illuminated. When the bar vibrates
the bright spot reflected from the bead describes a brilliant line
which indicates the nature of the vibration. Extremely beautiful
* Barton, he. cit. f See Tyndall's Sound, pp. 132-134.

METHODS OF EXCITATION 115
figures are obtained with this simple contrivance. The motion
of the bar may also be regarded as a circular combined with a
radial vibration. Tyndall shows how, by suitable bowing, such
a clamped bar may vibrate with its fundamental mode with super-
posed partials "6J and 17+f- times the rate of vibration as a
whole." For most purposes, however, it is desirable that the
vibrations of the bar should take place in a particular plane. Bars
of rectangular cross-section, with the thickness in the direction
of bending, are therefore most suitable.
As we have seen above, the only method of supporting a bar
which results in 'harmonic' partials is the 'free-free' method.
This method has been applied to a musical instrument known as
the 'harmonicon' or 'dulcimer,' in which freely supported bars
of graded lengths are struck by a hammer, thus producing an
agreeable succession of musical tones.
Thin rods, or reeds, clamped at one end and excited by plucking,
have been employed in the instrument commonly known as the
'musical box.' In this device a graded series of reeds, like teeth
in a comb, are plucked by small pins fixed in the required positions
on the surface of a rotating cylinder.
A more important application of the clamped-free reed is in
combination with a suitable resonator (e.g. an air cavity) which
reinforces the fundamental mode and consequently gives a muchpurer note.* Thin reeds clamped at one end are also employed
in wind instruments—the vibrations of the reed serving to open
and close the opening which admits air to the instrument (e.g. in
the oboe, bassoon, and the clarinet group of instruments). Thecombined action of an air blast and a vibrating reed is illustrated
in the harmonium and the concertina—the frequency of the reed
here plays a predominant part in determining the pitch of the
note. When a metal reed is used in combination with a resonant
air column, as in the ' reed pipes ' of an organ, the quality of the
tone is modified by the presence of the pipe. By varying the
construction of the reeds and the shape of the pipes various
qualities can be obtained to imitate different orchestral instruments.
Electromagnetic methods of maintenance of the vibrations are,
whenever applicable, probably the most suitable for experimental
study of the vibrations of a bar. A steel bar is readily set into
transverse resonant vibration by means of a suitably disposed
electromagnet carrying alternating current—the latter being con-
veniently supplied by an oscillating valve circuit of controllable
* See Rayleigh, p. 275.

n6 TRANSVERSE VIBRATIONS OF ELASTIC BARS
frequency (see p. 79). The principle of excitation is merely that
applied in the ordinary telephone earpiece, more particularly in
the reed form designed by S. G. Brown (see p. 380). By varying
continuously the frequency of the A.C. supply the various re-
sonance frequencies of the fundamental and overtones can very
simply be determined. The positions of the nodes can also be
obtained by the simple expedient, due to Chladni, of sprinkling
fine, dry sand on the bar. The sand will collect in lines across
the bar at the nodal positions. The laws of vibration of bars are
conveniently verified in this way.
The determination of the frequencies of a steel bar of knowndimensions and density, clamped or supported in a definite
manner, provides a means of obtaining Young's modulus of
elasticity E for the material of the bar. Equations (10), (13), and
(15) all show
K»c
where C is a constant depending on the method of holding the
bar, and on the particular partial excited.
A clamped steel bar electrically maintained is sometimes em-
ployed as a rough standard of frequency. An electromagnet,
actuated by a battery in series with a contact fairly near the
clamped end of the bar, is mounted at a point about J to \-l from
the free end. In this manner the fundamental tone is maintained
and the first overtone discouraged. It should be pointed out,
however, that the ba^e of such a vibrator should be massive and
stiff, otherwise it is liable to vibrate with a comparatively large
amplitude, and react on the bar. The frequency and damping
are thereby rendered uncertain. These quantities will vary also
with the manner in which the base itself is supported. Such a
vibrator is consequently not to be recommended in accurate work.
Frequency Meters - Hartmann and Kempf * have employed
a graded series of clamped steel reeds (of calibrated frequencies),
actuated by a common electromagnet as a means of indicating
directly the frequency of alternating currents. They have con-
structed frequency meters on this principle, covering various
ranges from 1 or 2 cycles to 1500 cycles/sec. The tip of the
vibrating reed is painted white and the magnet pole is hollowed
out to permit of large amplitude resonant vibrations without fear
of the reed striking the pole. A photograph of a low-range
* Ann. d. Phys., 13, 1904; and Phys. Zeits., 11, Dec. 1910.

TUNING-FORKS 117
frequency meter in operation is shown in fig. 35. The sharpness
of tuning of the reeds is roughly indicated in the photograph.
A similar instrument may also be used to determine resonant
vibrations in machinery or other mechanical structures subject to
f % FREQUENCY INDICATOR
M35 40 45 50 55 60 65es
'
i I t i I I I i I I i I i I I ! i i ! I I I i I I i i I I I I
'"*"***"""='" -*^pW||f|^BlH|Mpwp
Fig. 35
shocks or unbalanced reciprocating forces. By means of such a
frequency determination it is sometimes possible to trace the
origin of dangerous or otherwise objectionable vibrations, and
take steps to remove it. 'Critical' or 'resonant' speeds in
mechanical or electrical machinery often induce large unbalanced
forces which may result in serious damage.
Method of Tuning a Bar - A bar clamped at one end may be
tuned to a given frequency in a number of ways. The pitch maybe lowered either by loading the free end or by reducing the cross-
section of the bar near the clamped end. Similarly the pitch maybe raised either by shortening the bar or by reducing its cross-
section near the free end. These methods of tuning are employed
in practice in the construction of reeds of musical instruments
(harmoniums, for example) and in frequency meters. A bar maybe conveniently tuned for experimental purposes by means of a
collar, a sliding fit on the bar, clamped rigidly in the position
corresponding to the required frequency. The sliding weight
may be fitted with an extra ' rider ' with fine adjustment if accurate
frequency setting is required. The nearer the sliding weight
approaches the free end of the bar the lower will be the frequency.
TUNING-FORKS
The early development of the tuning-fork is mainly due to
Konig, who excelled in making forks of great purity of tone
covering a wide range of frequency. Some of Konig's forks hada frequency as high as 90,000 cycles/sec.# During recent years
* D. C. Millar, Science of Musical Sounds ; and Winkelmann,Akustik, pp. 345-367.

n8 TRANSVERSE VIBRATIONS OF ELASTIC BARS
the tuning-fork has increased in importance as a standard of
frequency. On account of its great purity of tone and constancy
of frequency the tuning-fork has proved of great value as a means
of indicating and preserving standard pitches. Not only does it
function as a source of sound of definite frequency, but, in its
electrically maintained forms, it serves to control electrical circuits
in such a manner as to form a standard of electrical frequency of
great accuracy and of extensive range.
The tuning-fork is regarded by different writers in different
ways. The earliest investigators, Chladni for example, regarded
it as developed from a 'free-free' bar by bending in the form of
an elongated U. Other writers, Rayleigh * for example, have
regarded the fork as consisting of two ' clamped free ' bars mounted
on a heavy, stiff block of metal. Various forms of tuning-fork
are made, approximating in appearance to one or other of these
forms.|Consider first of all the bent-bar type. Theory and experiment
alike show that the effect of bending a bar is to cause the two nodes
of the fundamental tone to approach each other more and more
closely and to lower the frequency of vibration. This is illustrated
in fig. 36 (a), the various positions of the two nodes n, n being
indicated in the progressive stages
of bending of the bar. Fig. 36 (b)
indicates the form of vibration
of such a U-shaped bar. Theamplitude of vibration at the
'antinode' at the midpoint of the
rS^Tn bend is small! compared with that
(b) at the ends of the prongs. Theaddition of a stem at the bend
between the two nodes has the
double effect of adding mass at an antinode and of increasing the
stiffness of that portion of the fork between the two nodes. This
results in a further approach of the nodes towards the stem and a
reduction in the amplitude of vibration at the midpoint, i.e. of
the stem. It is this small vibration of the stem of a fork, however,
which serves to actuate a sounding-board or a resonance box whenpressed into contact with the stem. If the tip of one prong of a
vibrating tuning-fork be lightly touched, the vibration is immedi-
Fig. 36
* Rayleigh, Sound, 1, p. 58.
f See (1) D. C. Millar, Science of Musical Sounds) (2) Winkelmann,Akustik, pp. 345-367.

TUNING-FORKS 119
ately stopped in both prongs. The withdrawal of the energy of
vibration is in this case extremely rapid. If, however, the stem
of the fork be pressed on a sounding-board the vibrations maypersist a considerable time, for the amplitude of vibration of the
stem is very small and the energy is transferred relatively slowly
from the fork to the sounding-board.
Regarding the fork as consisting of a pair of symmetrical
clamped-free bars, somewhat similar conclusions may be reached
in a different manner. First of all consider a single bar (or prong)
clamped to a block of metal. In consequence of the oscillation
of its centre of gravity there will be communication of vibration
to the block. To reduce the amplitude of such vibration the
block must be firm and massive. If now a second exactly similar
bar be attached symmetrically to the block and arranged to
vibrate with exactly the same amplitude as the first bar, but in
opposite direction, the two reactions on the block will exactly
compensate each other and the centre of gravity will be unmovedin the direction in which the prongs vibrate. On account of the
circular path of the centre of gravity of the prongs, however, there
must still remain a small vibration of the centre of gravity of the
block in the direction of the length of the prongs, the extent of
which will depend on the amplitude of the fork and on the relative
mass and stiffness of the prongs and of the block. The frequency
of a fork of this construction will approximate to that of a single
clamped-free rectangular bar of thickness t, i.e. the fundamental
frequency will be
t /EN^- 1937
)2
8-Vl2^\/7 ' W=8-24 x lOH/l2
for a steel bar in which VE//o=51 x 104 cm./sec.
The frequency of a fork will vary approximately as the inverse
square of the length of the prongs, directly as the thickness of
the prongs and directly as the velocity of sound in the material
of which the fork is made. The frequency is independent of the
width of the prongs.
The overtones of a fork may be excited by bowing at a suitable
point—those overtones requiring nodes at the bowing-point being
discouraged. The traces of fork vibrations shown in fig. 37 were
obtained by the dropping-plate method. A massive low-frequency
fork with a fine bristle attached to the tip of the prong was bowedvigorously, and the bristle allowed to touch gently the smoked

120 TRANSVERSE VIBRATIONS OF ELASTIC BARS
surface of a glass plate suspended vertically. Whilst the fork was
vibrating the thread supporting the glass plate was burnt through
and a wavy line traced on the smoked surface as the plate fell past
the fork. This principle is sometimes applied as a rough labora-
tory method of determining 'g' when the frequency of the fork
is known ; or conversely. The three records shown in the figure,
obtained in this way, show clearly the overtones 6J and 17 \ times
the fundamental frequency.* By varying the point of bowing
the various partials may be obtained separately or occurring two
or three at the same time.
fundame/ifal. S~J
if*'.. :,
fimda/rie/tfal+ Overforte S«2
--/
\; ... .....;
FundamentalV 0i'er£o7ieS*3Nj N'7T^N,(app)
Fig. 37—Tuning-Fork Records (dropping-plate method)
The fundamental tone of a fork may be reirfforced by attaching
the stem to a resonance box of the same frequency—the overtones
of a fork and an air cavity of the same fundamental frequency are
widely different, so the overtones of the fork are not reinforced.
Small tuning-forks, of the types devised by Konig, have long
been used as standards of pitch for musical and scientific purposes
where a moderate accuracy was required. The method of beats
gives results of considerable accuracy in comparing the frequencies
of two forks or in comparing a fork with any other vibrating body
of approximately the same frequency. The number of beats in a
second is equal to the difference of frequencies of the two sounds.
Under favourable circumstances beats as slow as one in thirty
* See also F. H. Parker, Nature, 90, p. 361, Nov. 28, 1912 ; and E. H.Barton, Nature, 80, p. 436, Dec. 19, 1912.

TUNING-FORKS 121
seconds may be recognised. This represents very exact tuning
between two forks of say 200 p.p.s. The method of beats pro-
vides a very convenient means of investigating the factors which
produce small changes of frequency in a tuning-fork. One fork
is kept under standard conditions, whilst the other is subjected to
the influence, e.g. temperature change, which affects the frequency.
In this manner it is not difficult to show experimentally that the
temperature coefficient of frequency for an ordinary steel fork is
approximately — 10~4 per degree Centigrade rise of temperature.
The method of beats is employed in making copies of standard
tuning-forks. The substandard is modified until it gives very
slow beats when sounded simultaneously with the standard. Theaddition of a small load to the prongs of the substandard is suffi-
cient to indicate, by the change in the number of beats per second,
which of the two forks is gaining on the other.
On account of its behaviour as a double source, a tuning-
fork is a relatively poor radiator of sound energy (see p. 66).
E. A. Harrington * has found experimentally, for example, that
a certain electrically-maintained tuning-fork expended only 3 5
per cent, of its energy in producing sound, the remaining 96-5
per cent, being employed in overcoming internal friction and in
vibrating the support of the fork.
Forks are now commonly used as substandards of time. Theperiod of vibration of a fork is a very constant quantity and serves
as a convenient subdivision of a second when time intervals haveto be measured with accuracy. As a consequence of the increased
application of the tuning-fork for this purpose, methods have beendevised for increasing the accuracy and perfection of electrically-
maintained forks. Low-frequency forks of this character, giving
an accuracy greater than 1 in 10,000, are in common use. If
particular care is taken with the choice of material, design, andcontrol of the fork, an accuracy of 1 in 10 5 or even of one in a
million is possible.
Electrically-maintained Forks - Reference has already beenmade (p. 76) to the method of maintaining the vibrations of a
tuning-fork by an electromagnet. The principle involved is that
of an electric bell, the vibrations of the prongs of the fork ' making
'
and 'breaking' a current through the exciting electromagnet.
The self-maintaining action of a tuning-fork is not quite as obviousas it may appear.f -If it were not for the presence of inductance
* Journ. Opt. Sac. Amer., 17, p. 224, Sept. 1928.
f See Rayleigh, 1, pp. 68-69.

122 TRANSVERSE VIBRATIONS OF ELASTIC BARS
in the circuit, the fork would not continue to vibrate under the
action of the electromagnet. The action is as follows (see fig. 38
(#), (/;), and (c)). The fork is maintained by a battery of e.m.f.
E, in series with a pair of contacts (on the outside of one prong),
and an electromagnet M. The inductance and resistance in the
circuit are L and R respectively. As the prong moves from atoband back again, the circuit is closed (approximately for half a
period T/2), whilst from a to c and back again the circuit is open.
When the circuit closes £=0 (fig. 38 (b)) the circuit i begins to rise,
the rate depending on the values of L, R, and E. At break,
f =T/2, the current falls suddenly to zero (assuming there is no
arcing). From a to b on the outward movement of the prong,
a quantity of electricity Q x
flows (time to T/4)
through the magnet which
is then opposing the motion.
From b to a on the return
movement of the prong, a
quantity Q 2 flows (time T/4
to T/2) through the magnet
which is assisting themotion.
The difference (Q 2— Qi)represents the quantity per
cycle effectively used in
maintaining the vibration
of the fork. The sum
(Q2+ Q1) represents the
total quantity per cycle
taken from the battery. The current i at any instant ' t ' after
closing the circuit is given by /
and
whence
i=^S
l~ e **
/•T/4 /-T/2
Qi=J M, Q*=L idt>
Efficiency
Lf _?;T _RT1
Qs-Qi R 1
Qa+ Qi T L2 r(i- »)
(2)

TUNING-FORKS 123
When the inductance L is zero this ratio becomes zero also. Noenergy is supplied to the fork to compensate for frictional damping
and the vibrations are consequently not maintained. When the
inductance L is very large and R is negligible, the expression
approximates to \. This is the maximum value of the efficiency
(see fig. 38 (<:)). When L/R is sufficiently small to allow the
current to attain its maximum value in a time less than T/4, the
expression for the efficiency reduces to
Q 2-Qi = 1
Q 2+Q x TR .
2L
For intermediate values of L and R the efficiency is given byequation (2).
The above considerations illustrate the necessity for inductance
in the circuit and indicate that this should be as large as possible
^"^ "**™¥W$ "X9fWW ""
/#**•
*$m
_o_
r-S ...J ?— 3 . *-
p-i(
... "~'~
Fig. 39—Oscillograph Records of Current exciting a Tuning-Fork
to secure efficient running. A large inductance implies a large
back e.m.f. at 'break,' with consequent arcing at the contacts. It
is advisable, therefore, to include a certain amount of resistance
in the circuit, and to use a suitable condenser in parallel with thefork contacts. This reduces the risk of arcing whilst makingit possible to obtain a good running efficiency. Oscillographrecords of the current maintaining a 25 cycles/sec. fork are shownin fig. 39. The effect of added resistance in record (b) is clearly
shown in the more rapid rise of current at ' make.' The two cases
(a)
(b)

124 TRANSVERSE VIBRATIONS OF ELASTIC BARS
represent respectively 50 per cent, and 10 per cent, of maximumpossible efficiency.
When an electrically-maintained fork is to be used as a precision
time-standard, it is essential that attention be paid to certain
features of the design. In papers by Dadourian * and by the
writer f it is shown that the base of the fork must be massive andstiff, in order that mechanical coupling between the fork and its
supports (the top of a bench, for example) should be reduced to a
minimum. For this reason also it is desirable that the plane of
the prongs should be parallel to the base, and that the block sup-
porting the prongs should be very short and rigidly attached to the
base (preferably forming part of it). The best forks are milled
out of a solid steel block, but very satisfactory forks can be madeby silver-soldering two steel bars to the supporting block. Thefrequency of the fork is also affected slightly by the change
in the electrical constants of the electromagnet circuit and
on the setting and number of contact pairs operated by the
prongs. The frequency depends slightly on the amplitude of
vibration, this being partly due to the presence of the contact
springs.
Fig. 40—Electrically-maintained Tuning- Fork (low frequency)
In fig. 40 is shown a low-frequency fork (25~ or 50~) by
J. M. Ford and the writer, J in which the spring contacts were
designed to give very exact timing of the moments of ' make ' and* break ' relative to the position of the prongs. The frequency of
the fork and balance of the prongs may be regulated by means
of adjustable loads near the free ends. The positions of the
electromagnet and contacts were carefully selected to give the
best running conditions. The magnetic circuit is also more effi-
cient than the more customary form, the flux being confined to
* H. M. Dadourian, Phys. Rev., 13, No. 5, pp. 337-359, May 1919.
f A. B. Wood, Journ. Sci. Instrs., 1, No. 11, Aug. 1924.
M. Ford, journ. Sci. Instrs., 1, p. 161, 1924.I A. B. Wood and J

TUNING-FORKS 125
I Section of
k prong
Iron Enciting coil
Fig. 41—Section throughMagnet and Prongs of Fork
the shortest possible path across the prongs. See fig. 41. This
results in a considerable reduction
of the current necessary to maintain
the fork in vibration, with conse-
quent increase of 'life' of the
platinum contacts. Forks similar to
that shown in fig. 40 are often re-
quired to run continuously for long
periods whilst driving or controlling
electric motors for time-marking or
recording purposes. (See section on Sound-Ranging, p. 478.)
Valve-maintained Forks - The method of maintaining the
vibrations of a fork just described ceases to be really efficient whenthe frequency exceeds about 100 cycles/sec. W. H. Eccles* has de-
scribed a method which is particularly applicable to forks of higher
frequency (e.g. 1000 p.p.s.) and which has the additional advantage
that no mechanical contact is made with the vibrating prongs. In
the form described, two electromagnets act on the prongs, one of
these being in the grid circuit and the other in the plate circuit
of a valve (see fig. 42). These coils must be wound in opposite
directions.* The vibration of the fork induces alternating
voltage in the grid circuit, which controls the current in the plate
circuit and its magnet, the vibration of the fork being thus main-
tained. To ensure that the fork responds readily to excitation,
it is advisable to introduce a condenser across each of the magnetcoils as shown in fig. 42, so as to get approximate tuning in the
electrical circuits. S. Butter-
worth f has given a mathe-
matical analysis of the mode of
operation of a valve-maintained
fork, and has determined the
conditions essential to its suc-
cess. He deals with the pro-
blem by substituting for the
mechanical system the fork, its
electrical equivalent. In this
H.T
Fig. 42- -Valve-maintained Tuning-Fork (Eccles)
manner the variation of frequency in the neighbourhood of the
natural frequencies of both the dynamical and electrical systems
is calculated. Using a pair of valve-maintained forks, one of
* W. H. Eccles, Proc. Phys. Soc, 31, p. 269, 1919.
f S. Butterworth, Proc. Phys. Soc, 32, p. 345, Aug. 1920.

iz6 TRANSVERSE VIBRATIONS OF ELASTIC BARS
which was kept as invariable as possible, D. W. Dye * has deter-
mined, by the method of beats, the variations of frequency
produced in the second fork by changes in the experimental
conditions. Amongst other factors likely to produce changes
of frequency the following were studied: temperature, effect
of valve controls (current, H.T. voltage, etc.), polarising magnetic
field, addition of mass to base, etc. As a result of these
experiments Dye has developed the valve-maintained tuning-fork
as a precision time-standard which controls a multi-vibrator
(see p. 132) and so forms the foundation of the radio-frequency
standards of the National Physical Laboratory.
Phonic Motors - The phonic wheel, invented independently
by Rayleigh f and La Cour, is of great importance when used in
conjunction with an electrically-maintained tuning-fork as a meansof converting a vibratory into a rotary motion of constant speed.
In describing a phonic motor Rayleigh says: "... the essential
feature is the approximate closing of the magnetic circuit of an
electromagnet, fed with intermittent current, by one or more soft
iron armatures carried by the wheel and disposed symmetrically
round the circumference. If in the revolution of the wheel the
closest passage of the armature synchronises with the middle of the
time of excitation, the electromagnetic forces operating on the
armature during its advance and its retreat balance one another.
If, however, the wheel be a little in arrear, the forces promoting
advance gain an advantage over those hindering the retreat of the
armature, and thus upon the whole the magnetic forces encourage
the rotation. In like manner, if the phase of the wheel be in
advance of that first specified, forces are called into play which
retard the motion. By a self-acting adjustment the rotation
settles down into such a phase that the driving forces exactly
balance the resistances. \. . . In some cases the oscillations of
the motion about the phase into which it should settle down are
very persistent J and interfere with the applications of the
instrument."
Early forms of phonic wheel consisted essentially of a toothed
iron wheel with a small electromagnet embracing an integral
number of teeth of the wheel. These simple phonic motors
served fairly well as ' time-markers ' in optically recording systems,
* Proc. Roy. Soc, A, 103, pp. 240-260, 1923.
f Rayleigh, Nature, 18, p. Ill, 1878 ; see Sound, 1.
I A phenomenon known as ' hunting.' Rayleigh recommends a
mercury-filled fly-wheel to damp out such oscillations.

TUNING-FORKS 127
e.g. in the Einthoven string galvanometer recorder, but were useless,
however, when called upon to supply a small amount of power,
e.g. to drive a drum with a pen recorder. In 1919 J. M. Ford
j'V
Fig. 43—Phonic Motor (assembled)
and the writer designed an improved type of phonic motor (see
fig. 43) which was capable of driving an electrically-operated
chronometer * or a moving-tape pen-recorder. The magnetic
En- : • 'I, >V . y^ i /,„> // h siring
Fig. 43—Phonic Motor (parts)
circuit of this motor is so designed that even moderate exciting
currents produce a large driving torque. In one pattern the
rotor, mounted on ball-bearings, is made from a bar of soft iron
with ten slots machined longitudinally, leaving ten radial bars
* A. B. Wood and J. M. Ford, jfoum. Set. Instrs., 1, pp. 160-173, 1924.

iz8 TRANSVERSE VIBRATIONS OF ELASTIC BARS
outstanding. The stator consists of a soft-iron cylinder and two
soft-iron discs each with ten teeth corresponding to the ten bars
of the rotor. The exciting coil, connected through the fork
contacts, is a single former-wound coil which lies within the iron
shell of the stator and completely surrounds the rotor. Thetroublesome transverse vibration of the shaft experienced with
earlier forms of phonic motor is now entirely eliminated, for the
radial forces on the rotor are balanced and the tangential pull is
applied uniformly on all the bars of the rotor. The magnetic
flux has a short path and the torque is large, consequently the
motor is easy to start and relatively small driving currents through
the fork contacts are sufficient. The motors are silent whenrunning and are free from troublesome mechanical vibrations.
In addition to the more obvious applications to phonic chrono-
meters, chronographs, and stroboscope devices, these motors
have been used to control the speed of much more powerful
motors. Thus a phonic motor has been used in this way to drive
a Radio-Beacon at constant speed.* Controlled by low-frequency
forks (up to 100 p.p.s.) they have a relatively large driving torque.
At higher frequencies (100 to 1000 p.p.s.), however, the difficulties
increase, and it is necessary to use laminated iron in the rotor and
the stator. The motor can quite easily be made self-starting, if
required, by the addition of a small commutator on the shaft and
a stroboscopic synchronising device, or by a method described byD. C. Gall,f in which a special form of winding is employed. Thesimple form of motor is, however, easily spun by hand into its
synchronous speed.];
Frequency Determination of Forks
There are many simple laboratory methods of measuring approxi-
mately the frequency of a vibrating tuning-fork. The dropping-
plate method, illustrated in fig. 37, p. 120 (see also p. 221), is direct
but is somewhat inaccurate on account of the fact that the tip of the
prong touches the falling plate. In another method, the note of
the fork is compared with that of a siren, or of a toothed wheel, of
which the speed is accurately known, the frequency of the fork
being thus obtained in absolute measure. The final tuning is done
* R. L. Smith-Rose, Nature, 121, p. 745, May 12, 1928; and I.E.E.
Journ., 66, p. 256, 1928.
t D. C. Gall, Journ. Sci. Instrs., 3, pp. 351-352, July 1926.
| The tuning-forks and phonic motors shown in figs. 40 and 43 are
manufactured by Messrs. Tinsley & Co., South Norwood, S.E.

TUNING-FORKS 129
by the method of beats. A photographic record, with superposed
time marks from a standard clock, is also another possible method.
Reference has already been made to the use of the monochordin comparing the frequencies of two forks.
Phonic-Motor Method - The phonic motor provides a very
convenient and accurate method of determining the frequencies
of electrically-maintained forks, a reliable pendulum clock or
Greenwich radio time-signals being the time-standard to which
reference is made. The following method was employed by the
writer in 1919.* A tuning-fork of nominal frequency N controls
a phonic motor having n teeth, or bars. The speed of the motor
is consequently N/w revolutions per second. If the motor makes
m revolutions in t seconds, the frequency N of the fork must be
equal to nm/t. Attaching a revolution counter to the shaft of the
motor it is a simple matter therefore to count the revolutions min any time interval t. The greater the time interval the greater
the accuracy of the method. The value of N obtained in this
way is, of course, the mean value during the period of test. Asan example of the method, take the case where N=50 approxi-
mately, and n = lO. The motor-speed is consequently 5 r.p.s.
approximately. In 5 minutes m=1500, in 1 hour m= 18,000,
and in 24 hours m =432,000 revolutions. Now the value of mcan be determined with certainty to ±1 by direct observation of
the revolution counter and a standard clock. Therefore the
accuracy of the method is approximately ±l/m f°r short intervals,
and ultimately becomes equal to that of the standard clock for
long intervals. An accuracy of 1 in 10,000 is easily attained.
Dye f has successfully applied the phonic motor method to valve-
maintained forks of higher frequency. The motor-revolutions
and seconds-contacts of the standard clock are recorded side byside on a chronograph tape, whence the fractional part of a second
lost or gained by the fork during a given period of time can readily
be determined. Three runs for a particular fork, at intervals of
a month, gave the values 1000-218 ,999-99
7 ,999-87
6 vibrations per
second, the corresponding temperatures being 13-36° C., 15-23° C.,
and 16-27° C. respectively.
The phonic-motor method of counting the vibrations of a fork
in a given time lends itself readily to the study of the various
factors likely to influence the frequency of a fork. Temperature,
* See also A. B. Wood, Journ. Sci. Instrs., March and Aug. 1924.
f D. W. Dye, loc. cit. ; see also T. G. Hodgkinson, Proc. Phys. Soc,39, p. 203, 1927.
9

i 3o TRANSVERSE VIBRATIONS OF ELASTIC BARS
amplitude of vibration, spring contact pressure, magnet current,
loading of base, etc., have all an important influence on frequency.
Temperature-Coefficient of Frequency of Forks - Change of
temperature is one of the most serious causes of change of fre-
quency of a tuning-fork. This is due mainly to the variation of
the elastic properties of the material with temperature, the corre-
sponding density changes being relatively negligible. Thus Konig
found that the temperature-coefficient of frequency for a steel
fork was —1-12 xlO-4 per °C. rise of temperature. The tempera-
ture-coefficient of Young's modulus E for ordinary steels is given
byE
(=E15.{l-a(<-15°)},
where
a=2-4xl0" 4 and *=temp. °C.
For a 25-cycle fork with mild steel prongs the writer has obtained
a value of — 1T6 x 10-4 per °C. for the temperature-coefficient of
frequency at ordinary room temperatures. Dye gives a value
-115 xlO"4 per °C. between 15° and 21° C, for a fork of 1000
frequency, and Dadourian * observed a change in the coefficient
from -1-04 xlO"4 at -25° C. to -1-43 xl0~ 4 at +56° C.
"Elinvar" (elasticity invariable), one of the new nickel steels due
to Guillaume (who discovered "invar," which has a very small
expansion coefficient), has a very small temperature-coefficient of
elasticity, and is used in the best watches and chronometers.
Forks made of this material have a very small temperature-co-
efficient of frequency. A good elinvar fork, valve-maintained
and kept at a temperature constant within ±0T° C, remains
constant to within one or two parts in a million.
Variation of Frequency with Amplitude - All observations
with 'free' forks agree as regards a lowering of pitch with in-
creasing amplitude. In large low-frequency forks vibrating with
amplitudes of the order of 1 mm. at the tip of the prongs, this
effect may become of considerable importance. The effects are
more complicated in the case of electrically-maintained forks, the
increase in amplitude involving questions such as stiffness and
length of travel of contact springs, pull of electromagnet, and so
on. These additional complications modify the result.*!" ThusDadourian observed with a particular type of fork with spring
contacts, that increase of amplitude first lowered and then raised
* Dadourian, loc. cit.
f See papers by Dadourian, Wood, and others, loc. cit.

TUNING-FORKS 131
the frequency, indicating a best working amplitude (where dN/da
is a minimum) for the fork. E. Mallett * has shown that this change
of frequency with amplitude results in a distortion of the resonance
curve for a tuning-fork vibrating at large amplitudes—similar
effects being noted for vibrating reeds, vibration galvanometers
and telephone receiver diaphragms.
When a tuning-fork is to be used as a time-standard therefore,
it is important that its amplitude (and conditions of maintenance)
should be defined. A simple 'V diagram attached to the tip of
the prong is a very convenient indication of amplitude—when in
vibration the 'V assumes a double form W, the point of overlap
being well defined. By means of a series of equidistant horizontal
lines crossing the 'V symmetrically, it is a simple matter to
determine the amplitude in terms of the angle of the 'V ' and the
distance apart of the horizontal lines.
Clock-controlled Forks - Konig f devised a clock in which
the pendulum was replaced by a tuning-fork, a small escapement
mechanism controlling a train of wheels and imparting a small
impulse to the fork at each vibration. Thus the vibrations of the
fork were maintained mechanically and were counted by means of
dial wheels. D. C. Millar } has employed this ' clock-fork ' to deter-
mine the frequency of standard forks by the method of coin-
cidences. The variations of frequency of a fork running in this
manner are considerable, small errors due to various causes, e.g.
temperature changes, are cumulative, and the final error may be
serious. D. W. Dye § and the writer||independently devised
methods of controlling a low-frequency electrically-maintained fork
directly from a master pendulum clock. In the writer's method,
the fork is arranged to gain slightly on the clock. When the error
has reached a certain very small fraction of a period of vibration,
a relay causes the amplitude of the fork to increase, thereby causing
the fork to lose slightly on the clock. The process is then repeated,
the fork alternately gaining and losing on the clock. The extent
of this 'hunting' of the fork-frequency can be adjusted to any
desired value, depending on the circumstances. In this mannera fork and phonic motor have been kept in exact synchronism
with a pendulum clock for a continuous period of several days.
In Dye's method, the seconds contacts of a pendulum clock
* Mallett, Proc. Phys. Soc, 39, pt. 4, pp. 334-358, June 1927.
f Konig, Quelques Experiences, p. 173.
t Millar, Science of Musical Sounds, p. 38, etc.
§ D. W. Dye, Phys. Soc. Exhibition, Jan. 1927.
|| A. B. Wood, Phys. Soc. Exhibition, Jan. 1927.

i 3 2 TRANSVERSE VIBRATIONS OF ELASTIC BARS
give a direct impulse to the fork through the exciting magnet.
The fork itself is 'free,' i.e. carries no mechanical contacts.
Provided the frequency of the fork is sufficiently near to a whole
multiple of the frequency of the pendulum a vigorous vibration
will be maintained and the fork will be 'corrected' every second
by the impulse from the standard pendulum. The accuracy of
the fork is therefore equal to that of the master pendulum clock
at the National Physical Laboratory.
The Tuning-Fork as a Standard of Frequency (Sonic,
Supersonic, and Radio) - The Multivibrator. A valve-maintained
elinvar fork in a constant temperature enclosure is capable of
remaining constant in frequency within one part in a million.
This high order of accuracy can be attained for tuning-forks of
any frequency up to one or two thousand per second. Making
use of a device known as a "Multivibrator," invented by
H. Abraham and E. Bloch,* D. W. Dye| has applied the accuracy
of the elinvar tuning-fork to standardise supersonic and radio-
frequencies.
The multivibrator is an ingenious device which makes use of
two thermionic valves to produce a fundamental alternating
current very rich in harmonics. The circuit is shown in fig. 44.
iEZ3 P
Fig. 44
(a) Abraham-Bloch Multivibrator (b) F, valve-maintained fork ; M,multivibrator ; W, standardwavemeter ; A, amplifier
;
H, heterodyne
In a particular type of apparatus giving a fundamental of 1000
cycles per second, the values of resistances and capacities are as
follows: R^R-2 =50,000 ohms (inductively wound), r1 =r2=
75,000 ohms (non-inductive), C x and C 2 are subdivided and
adjustable condensers giving any value up to 0-008 microfarad.
* Abraham and Bloch, Comptes rendus, t. 168, p. 1105, 1919.
f D. W. Dye, (1) Trans. Roy. Soc, 224, p. 259, 1924; (2) Proc. Phys.
Soc, 38, pp. 399-458, Aug. 1926; see also Dictionary of Applied Physics ,
2, ' Electricity,' pp. 633-634; and W. Hansel, Phys. Zeits., 30, p. 274, May
1929.

VIBRATIONS OF A RING 133
The fundamental frequency of oscillation of the circuit is approxi-
mately N= ^-/(C1r1 -\-C 2r2), aU tne harmonics up to a very high
order being present also. These can be selected up to the 120th
by means of a tuned (LC) 'selector' circuit. If, therefore, the
multivibrator is controlled by an elinvar fork of frequency
1000-00 (temperature coefficient+ 12 x 10-6 per 1°C.) a 'spectrum'
of frequencies, all exact multiples of 1000, will be obtained. This
control is brought about by injecting a small e.m.f. from an
electrically-maintained elinvar fork into the multivibrator circuit.
Higher frequencies are obtained by the use of a second multi-
vibrator giving impulses at the rate of 20,000 per second. This
instrument is kept in harmonic synchronism with the fork-
controlled one by the intermediary of a fixed-frequency resonant
circuit set to 20,000 cycles/sec. With the second instrument
harmonics up to the 75th can be observed, corresponding to a
frequency of 1-5 xlO 6 cycles/sec. It is therefore possible to
obtain standard frequencies as accurate as the frequency of the
elinvar fork, at intervals of 1000 up to 1-5 million cycles/sec.
Not only can all frequencies which are multiples of 1000 be set
exactly, but a very great number of subsidiary frequencies maybe obtained within each belt of 1000 cycles. Thus, whenever the
source has a frequency very close to N=1000(/±l/r), where/and r are integers, a slow-synchronisation beat is heard. Withcare, further intermediate frequencies can be located. It is never
necessary to interpolate by more than about two cycles/sec. from
a frequency that is known. Such measurements are made possible
by the extreme steadiness of the frequency of the tuning-fork.
In this way a wide range of standard frequencies may be covered
in very small steps, the degree of accuracy being fixed by the
accuracy of the elinvar tuning-fork which stabilises the whole
system.
The frequency of the fork is determined by means of the
phonic-motor method outlined above. All frequencies are there-
fore referred ultimately to a standard pendulum clock.
Vibrations of a Ring
The problem of the vibrations of a curved bar may be regarded
as an extension of that of a straight bar. Apart from tuning-
forks, which we have just considered, the most important case is
that of a circular ring.* We shall merely quote the results of
theoretical deductions made by Hoppe (1871) and by Rayleigh.
* See Lamb, Sound, pp. 133-138.

134 TRANSVERSE VIBRATIONS OF ELASTIC BARS
(a) Flexural Vibrations in the Plane of the Ring - The frequency
N of any given partial is
where s, k, E, and p have the meanings assigned in the case of
straight bars. The mean radius of the ring is '#.' The most
important case is that of s=2, where the ring oscillates between
two slightly elliptical extreme forms. The frequencies are com-
parable with those of transverse vibration of a bar.
(b) Flexural Vibrations Perpendicular to the Plane of the Ring -
Mitchell (1889) found, for a ring of circular cross-section,
2^ vV+a+1 a*\l
E• • (2)
+ C7+ I a- v p
(cr=Poisson's ratio.)
(c) Extensional Vibrations - In this case the ring remains in its
own plane, being alternately stretched and contracted,
N=^.y- ... (3)2tt aM p
wWhen s=0 the vibrations are purely radial, the frequency being
given by the ratio of the velocity of sound to the circumference of
the ring.
The sequences of tones given by equations (1) and (2), for the
flexural vibrations of the ring, agree with those found experi-
mentally by Chladni. The flexural vibrations are not purely
radial. In case (a) when s=2 there are four nodes, the elliptical
forms cutting the mean circle in four points. At these four points
there is no radial motion, but the tangential motion is a maximum.This is exemplified by the vibrations of a partially filled tumbler
when excited by gently drawing a wetted finger along the edge,
the nodal points being indicated by the crispations of the surface
of the water in the tumbler.
The various modes of vibration of a circular plate and annular
rings have been demonstrated recently by W. Hort and M. K6nig.#
The annular rings were formed by cutting holes of increasing
radius rY in a disc of radius r2 , the ratio r1/r2 varying from to
about 0-9. The numerous radial and circular nodes which are
possible were clearly shown by means of sand figures. Even with
* Zeits. f. Techn. Physik, No. 10, p. 373, 1928.

LONGITUDINAL VIBRATIONS OF RODS 135
the narrowest annular ring (rjr 2=0-9) a circular node was
obtained approximately midway across the face of the ring. Theresults were in general agreement with theory.
The theory of vibration of rings has application in the com-
plicated study of the vibrations of bells (see p. 167).
LONGITUDINAL VIBRATIONS OF RODS
When a rod is set into longitudinal vibration, cross-sections
vibrate to and fro in the direction of the axis which remains
undisplaced. The quantities involved are the density and elastic
properties of the material. When a rod is stretched in the direc-
tion of its length the increase of length is accompanied by a con-
traction in the cross-section. If the rod is very short the motion
of a particle near the surface is not only longitudinal but also
transverse—the latter motion may be comparable with the former.
If, however, the length of the rod is large compared with the
diameter, the longitudinal motion accumulates and the transverse
motion becomes negligible. We shall, in what follows, assume
that this condition holds, viz. that all transverse sections vibrate
to and fro along the axis of the rod.
Consider a rod of uniform cross-section A, and an elementary
slice bounded by two planes, at x, distant Sx apart and at right
angles to the axis x of the rod. If a plane at x is displaced at time t
to (x+ £) the plane at (x+ Sx) will be displaced to
(x+8x+g+(dg/dx)&x),
that is, the fractional elongation of the slice Sx is d£/dx. This
change of length of the slice implies a difference in the forces
acting on its faces. The total force acting on the face at x will
be EAdg/dx}where E is Young's modulus # of elasticity. Simi-
larly at the opposite face of the slice the force will be in the
opposite sense and equal to
\dx dx2'
Consequently the resultant force acting on the slice will be
EA . ^| . ox.dx2
* Young's modulus E is determined by stretching a bar statically,
lateral contraction being permitted during the extension.

136 LONGITUDINAL VIBRATIONS OF RODS
Now the mass of the slice is equal to pASx, where p is the density
of the material, and the acceleration is d2£/dt2. Hence we obtain
the relation
d2g d2
£PASX-=EA-.8X
,
that is,
dt 2 p' dx2'
' '
' Uan equation of the same form as that obtained for the transverse
motion of a string, indicating waves travelling in opposite direc-
tions with equal velocities, c= \ E/p. The general solution is
£j=f(ct-x)+F(ct+x) ... (2)
Assuming f varies as cos nti
and
dt2 **'dx2 c**
s
Anx . nx\
A cos h-o sin -— cos ntc c
(3)
which is analogous to equations obtained for stationary waves on
a vibrating string. In a rod of finite length, the direct and end-
reflected waves interfere to form nodes and loops in accordance
with the relation c=NA that is, N=-=-yv/- ), as in the case of
A A\ p)strings.
Case I - Rodfree at both ends. Each end must be an antinode,
that is, the displacement £ is a maximum at #=0 and x=l. This
implies in equation (3) that B=0 and f=A, whence nl/c=S7T
(where s=0, 1, 2, 3, etc.). The case of s=0 is inadmissible, so
we may write for the frequencies of the partials
N,=g=|^(where*=l,2,3,etc.) . . (4)
which represents a complete harmonic series. A similar result is
obtained for a rod clamped at both ends (£=0 when x=0 and /).
Case II - Rod clamped at the midpoint. All the even harmonics
must now be absent, for the midpoint must always be a node and

FREQUENCY RELATIONS 137
the ends antinodes. The frequencies of the partials are therefore
proportional to the odd numbers, i.e.
EN
5=— ./ - (where s=l, 3, 5, etc.) . . (5)
21 y p
The fundamental has the same frequency here as in Case I.
Case III - Rod clamped at one end only. Since this end must
be a node and the free end an antinode, the length of the rod must
be an odd multiple of A 4. At the fixed end x=0, £ =0, whence
A in equation (3) is zero, whilst at the free end x =/, f is a maximum(equal to B) and nl c=s- 2 where s is an odd integer. Thepartials are therefore represented by
s /!N5=—
rN / — (where s= l, 3, 5, etc.) . . (6)
The frequencies given by equations (4), (5), (6) are all subject to
the proviso that the diameter of the rod is always small compared
with A 2, and that the lateral bulging and shrinking may be
neglected. These relations afford a convenient means of com-
paring velocities of sound in rods of different materials. Different
rods, of the same fundamental frequency, have lengths proportional
to the velocity of longitudinal waves in the material. Case II is
of special importance in this respect, since it possesses a definite
advantage over the other two methods of supporting the rod.
When an unbalanced force acts at a 'fixed' point it is essential
that this point should be very massive or rigid, otherwise slight
motion occurs and the theoretical assumptions for a node are not
fulfilled. If a rod is clamped at the midpoint, however, the twosymmetrical portions react equally and in opposite directions at
the midpoint. Consequently a very slight constraint is sufficient
to fulfil the theoretical assumption that it is a point of zero
displacement.
The frequency of longitudinal vibrations in bars is usuallv very
high compared with that of the transverse vibrations, the ratio
increasing rapidly as the dimensions of the cross-section diminish
relative to the length. In the case of a wire (a bar of verv small
cross-section) under tension T, the ratio of frequencies (longi-
tudinal to transverse) will be equal to the ratio of velocities, i.e.
v E/p to V T/pA. If the increase of length of the wire undertension T be e, then T=E<fA, and the transverse wave-velocitv
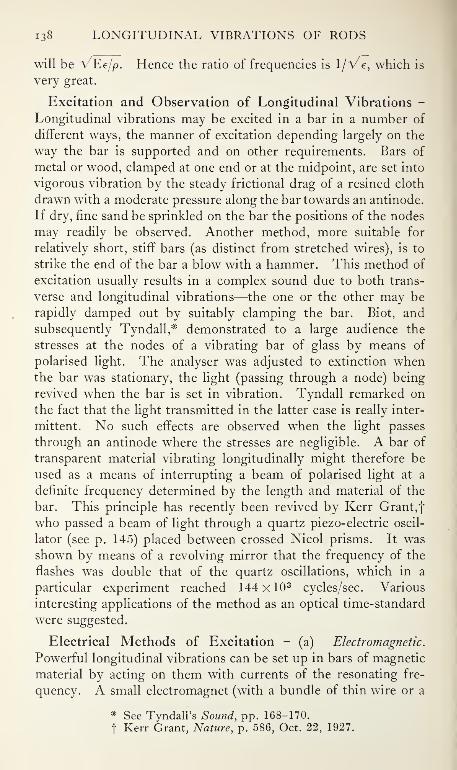
38 LONGITUDINAL VIBRATIONS OF RODS
will be VEe/p. Hence the ratio of frequencies is l/Ve, which is
very great.
Excitation and Observation of Longitudinal Vibrations -
Longitudinal vibrations may be excited in a bar in a number of
different ways, the manner of excitation depending largely on the
way the bar is supported and on other requirements. Bars of
metal or wood, clamped at one end or at the midpoint, are set into
vigorous vibration by the steady frictional drag of a resined cloth
drawn with a moderate pressure along the bar towards an antinode.
If dry, fine sand be sprinkled on the bar the positions of the nodes
may readily be observed. Another method, more suitable for
relatively short, stiff bars (as distinct from stretched wires), is to
strike the end of the bar a blow with a hammer. This method of
excitation usually results in a complex sound due to both trans-
verse and longitudinal vibrations—the one or the other may be
rapidly damped out by suitably clamping the bar. Biot, and
subsequently Tyndall,* demonstrated to a large audience the
stresses at the nodes of a vibrating bar of glass by means of
polarised light. The analyser was adjusted to extinction whenthe bar was stationary, the light (passing through a node) being
revived when the bar is set in vibration. Tyndall remarked on
the fact that the light transmitted in the latter case is really inter-
mittent. No such effects are observed when the light passes
through an antinode where the stresses are negligible. A bar of
transparent material vibrating longitudinally might therefore be
used as a means of interrupting a beam of polarised light at a
definite frequency determined by the length and material of the
bar. This principle has recently been revived by Kerr Grant,
f
who passed a beam of light through a quartz piezo- electric oscil-
lator (see p. 145) placed between crossed Nicol prisms. It was
shown by means of a revolving mirror that the frequency of the
flashes was double that of the quartz oscillations, which in a
particular experiment reached 144 xlO 3 cycles/sec. Various
interesting applications of the method as an optical time-standard
were suggested.
Electrical Methods of Excitation - (a) Electromagnetic.
Powerful longitudinal vibrations can be set up in bars of magnetic
material by acting on them with currents of the resonating fre-
quency. A small electromagnet (with a bundle of thin wire or a
* See Tyndall's Sound, pp. 168-170.
f Kerr Grant, Nature, p. 586, Oct. 22, 1927.

METHODS OF EXCITATION 139
laminated core) mounted close to the end of a steel bar, clamped
at the midpoint, serves the purpose very well. The magnet should
preferably have a D.C. winding to produce a moderate flux through
the free end of the bar, and an A.C. winding (with tuning con-
denser in parallel) coupled through an auxiliary coil to a valve
oscillator. The fundamental and harmonics (s=l, 3, 5, etc.) can
readily be obtained almost pure, i.e. any particular harmonic can
be excited free from the others and free from any transverse
vibration of the bar. The resonance is extraordinarily sharp
(indicating extremely small damping forces in the bar), and careful
tuning is required. A thin disc of soft iron firmly cemented to
the end of a bar of non-magnetic material {e.g. glass) may similarly
be employed to excite resonant vibrations.
(b) Electrostatic -J. H. Vincent # has succeeded in exciting
longitudinal vibrations in bars by an electrostatic method. Theplane end of the bar, clamped at the midpoint, is placed close to
the plane surface of a massive block of metal, the opposing surfaces
forming a condenser which is connected directly to the tuned
circuit of an oscillating valve. The alternating attraction of the
condenser 'plates' (the bar and the block) sets up oscillations in
the bar which responds vigorously at its resonance frequencies.
Bars of insulating material, such as fused silica, may be used in
this manner if plated with a thin metallic coating.
(c) Magnetostriction - Vincent f has also employed a magneto-
striction method to excite such vibrations in iron and nickel. In
this case a coil carrying alternating current (from the valve oscil-
lator) surrounds the bar. The alternations in magnetic field in
the coil induce corresponding alternations in the length of the
bar. The best effects are obtained when the bar is initially
magnetised by means of a second coil carrying direct current.
At resonance the oscillations set up may attain a considerable
amplitude. If the exciting coil forms the inductance in the tuned
plate-circuit of the valve, and a galvanometer is inserted in the
grid circuit containing a coil coupled to the plate coil, the varia-
tions in the deflections of the grid galvanometer give definite
indications of resonance in the bar. This method is, of course,
particularly useful at supersonic frequencies. A comprehensive
account and bibliography of magnetostriction phenomena is given
by S. R. Williams,J in which it is shown that longitudinal, trans-
* J. H. Vincent, Nature, p. 952, Dec. 31, 1927.
f Electrician, Jan. 1929.
% Journ. Opt. Soc. Amer., 14, p. 383, May 1927.

140 LONGITUDINAL VIBRATIONS OF RODS
verse, and torsional effects may be excited. G. W. Pierce # and
J. H. Vincent | have employed the longitudinal vibrations of
magnetostrictive bars to produce and control electrical oscilla-
tions over a frequency range from a few hundreds to morethan 300,000 p.p.s. The method involves the interaction of a
magnetostrictive bar and the electrical oscillations of a valve-
circuit. The constancy of frequency obtained compares favour-
ably with piezo- electric crystal oscillators. Pure nickel and
alloys approximating to 36 per cent. Xi and 64 per cent, iron
(stoic metal) are stated by Pierce to give very* good effects.
Xichrome (Ni, Cr, and Fe) and Monel metal (64 per cent. Ni,
28 per cent. Cu—Fe, Si, Mn) also form very powerful oscillators.
In all cases it is desirable to use an auxiliary D.C. magnetising coil
to polarise the bar magnetically. Pierce shows that the motional
impedance circle diagrams (see p. 73) of magnetostriction vibrators
indicate a very high efficiency of conversion of electrical energy
into mechanical motion. When solid bars are used the diameter
of the motion impedance circle dips considerably, indicating
hysteresis and eddy-current losses at high frequencies, but these
losses almost disappear when the magnetostriction oscillator is a
thin tube split longitudinally. Such oscillators are convenient
sources of high frequency (super sonic) vibrations. We shall
refer later (p. 262) to the application of this method to the measure-
ment of the velocity of high-frequency vibrations in bars of
magnetostrictive material.
High-Frequency Vibrations in Piezo- Electric Crystals
The principal phenomena of piezo- electricity are now fairly well
known, numerous papers having appeared within recent years
dealing with various aspects of the subject. On account of the
importance which it has attained, it may not be out of place to
refer briefly to the more important features before dealing with
the applications in sound.
Piezo Electricity - The discovery7 of the electrical effects of
pressure on asymmetric crystals may be ascribed to J. and P.
Curie. J They found that certain crystals (particularly the hemi-
hedral variety with inclined faces), when subjected to pressure,
exhibited electrical charges on their faces. The converse effect
* Amer. Acad. Proc, 63, 1, p. 1, April 1928.
f Electrician, 101, p. 729, Dec. 1928 ; and 102, p. 11, Jan. 1929.
| J. and P. Curie, Comptes rendus, p. 204, July 1880, and other papers;
see also CEuzres de Pierre Curie, Gauthier Villars ; and article on ' Piezo
Electricity,' Dictionary of Applied Physics, 2, ' Electricity,' p. 598.

PIEZO-ELECTRIC VIBRATORS
—AE
was also shown to be true—that voltages applied to the faces of
the crystal produced corresponding changes in dimensions. Theeffects were best observed in slices cut in certain directions from
the natural crvstal. The phenomena may be observed in a large
number of crvstals,* but the best known examples are quartz,
tourmaline, and Rochelle salt. Of these, Rochelle salt gives byfar the largest piezo-electric effect, but on account of the inferi-
ority of its mechanical properties its practical importance relative
to quartz and tourmaline is greatly diminished.
Referring to fig. 45, which represents a transverse section of a
quartz crystal cut in a plane per- _
pendicular to the optic axis, the
dotted lines E 1E 1 . E-E 2 . E SE 3 are
the three electric axes parallel to
the bounding faces of the crystal.
Plates or bars are cut from the
crystal having the length / per-
pendicular to one of these axes.
e.g. EoEs in fig. 45, the breadth b
parallel to the optic axis, and the
thickness t parallel to the electric
axis. When such a plate is
placed in an electric field, in the
direction of the thickness, its
length / and thickness t change
—the length increasing and the
thickness diminishing, or vice
versa. The two strains are such that there is no change of
volume in the crvstal.
:
Resonant Vibrations of Crystal Slices - It will be evident,
when alternating voltages are applied to the crystal slice, there
will be corresponding alternating stresses and strains in its
length and thickness. When the frequency of such alternating
voltage coincides with one of the possible modes of vibration of
the slice a large resonant vibration will occur. Such vibrations
may truly be regarded as longitudinal, whether they are attrib-
utable either to the thickness or to the length of the slice.
Even with the largest crystals of quartz obtainable the dimen-sions of such slices must necessarily be small and the natural
* See article by F. Pockels. Winkelmann s Handbuch der Phy: 4
pp. 766—795.

142 LONGITUDINAL VIBRATIONS OF RODS
vibrations correspondingly high. Possible frequencies of such
a bar will be
N=iJ-por =hJ~P ('=!. «.*.*>•
The value of E/p will, of course, depend on the particular axis
chosen—for the elasticity varies with direction in a crystal. Thedifference in the '/' and
i
t>
axes is, however, very small, and an
average value of c=V 1
E/p may be taken as 5-5 xlO 5 cm./sec.
A rod 5 cm. long and 0-5 cm. thick will consequently have fre-
quencies which are approximately multiples of 5-5 xlO 4 and5-5 x 10 5 p.p.s. In addition to such longitudinal modes of
vibration various flexural modes are possible.* The frequencies
are also modified by the fact that the 'bar' of quartz approxi-
mates to a plate and various complex modes of vibration are
possible and may coexist.
The piezo- electric properties of crystals have been applied to
numerous purposes. We shall consider two of the most im-
portant, viz. (a) as frequency standards, and (b) as sources of high-
frequency vibrations.
(a) Piezo-Electric Resonators and Oscillators. Quartz Standards
of Frequency - W. G. Cady f has devised an extremely ingenious
and accurate method of standardising high-frequency oscillations
by the combination of a quartz resonator (of the type just described)
and a three-electrode valve. The 'resonator' with its electrodes
is connected in parallel with the condenser of an oscillatory circuit
tuned approximately to the required resonance frequency of the
quartz. A current-measuring device in series with the induct-
ance coil of the oscillatory circuit indicates a sudden change
in current at a frequency corresponding to resonance in
the quartz. This change is due to a characteristic variation in
the effective capacity and resistance of the resonator as the fre-
quency passes through resonance. As a typical example Cady
cites a quartz resonator 30 x4 x 1-4 m.m.s. vibrating longitudinally
in the direction of its length. The fundamental frequency was
found to be 89,870 cycles/sec. The effective capacity, normally
4-5 x 10-12 farads, becomes 42 2 x 10-12 at 89,860, decreasing to
the normal value at 89,870 and becoming -32-2 xl0~ 12 at 89,880
cycles/sec. Further increase of frequency returns the capacity
* See J. R. Harrison, Proc. Inst. Radio Eng., p. 1040, etc., Dec. 1927.
f Proc. Inst. Rad. Eng., 10, p. 83, 1922 ; Phys. Rev., 19, p. 1, 1922;
Journ. Optical Soc. Amer., 10, No. 4, April 1925.

PIEZO-ELECTRIC VIBRATORS i43
gradually to its normal value again. The changes of oscillating
current and effective capacity are shown in fig. 46. It will be
seen that the current descends to an extremely sharp minimumat resonance. A variation in frequency of one part in 104 pro-
duces a marked change of current. The logarithmic decrement
of the resonator is only 00066 per cycle. The effectiveness of
the resonator as a frequency-standard is due entirely to these very
I
Current l\ /'
Cpjifd.
404 \- f1V"
31
20'
2
- :
1
- -4
1
1
1 /c
1
1
1
/
f
-201
1
1
u
89, 300 89,
Fr
300
iquem90,
*y p-p-s
000 90, 200
Fig. 46
rapid changes in effective capacity and resistance over a range of
frequency comprising only a small number of cycles near reson-
ance. Cady found also that the temperature-coefficient of the
longitudinal vibrations (in the direction of the length) was only
about 5 in 10 6 per degree C.—in the direction of the thickness
(electric axis) this becomes 20 in 10 6. Cady also constructed
compound resonators of quartz and steel vibrating at lower
frequencies, of the order 104 cycles per second. D. W. Dye *
has developed the theory of the quartz resonator, using as a basis
a theorem due to S. Butterworth,f in which the mechanical quartz
* Proc. Phys. Soc, 38, p. 399, Aug. 1926.
t Proc. Phys. Soc, 271, p. 410, 1915. See also Giebe and Schiebe,Zeits.f. Physik, 33, p. 335,- 1925 ; Mallett and Terry, Wireless World,16, p. 630, 1925 ; and Schiebe, Zeits. f. Hochfrequenztechn, 28, 1, p.15, 1926.

144 LONGITUDINAL VIBRATIONS OF RODS
system is replaced by an equivalent electrical circuit containing
a capacity C, inductance L, and resistance R in series all shunted
by a capacity Cv In a particular case of a quartz bar 7-0 x0-6 x0T5 cm., Dye found experimentally that C=008 jjl . fi fd.,
R= 1500 ohms, L = 160 henries, (^=8 /x . jjl fd., 2ttN =275,000,
giving a log. dec. 10-4, and the diameter of the motional impedance
circle (see p. 74) no less than 100 megohms. On such a basis
almost perfect agreement exists between the forms of current
curve (Cady) obtained theoretically and experimentally. In the
following table (taken from Dye's paper) are given the observed
frequencies of the partials of two quartz vibrators, with the corre-
sponding temperature-coefficients.
Bar dimensions in m.ms.Mode ofvibration.
Frequencycycles persecond.
Temperature-coefficient,
parts in a
million.Length.Thick-ness.
Breadth.
A 47-0 3-3 7-50 FundamentalOvertone, 3 segments
»> ^ ,,
7 „
58,675174,450293,750414,000
- io2
- 30-49-70
B 62-2 1-52 7-54 FundamentalOvertone, 3 segments
>> ^ )>
7 „
44,120130,850219,840304,650
- 4-0
-1503
- 5-02
-66
The frequencies of the partials are approximately in the ratio
1, 3, 5, 7, as would be anticipated from the simple theory. Theagreement is not exact, of course, for bars of such cross-sections
and lengths are not likely to conform with the simplifying assump-
tions (see p. 135) that all cross-sections vibrate in the direction of
the axis of the bar. Transverse stresses and strains must neces-
sarily exist, these becoming more important the shorter the
vibrating segments, i.e. the higher the partial. This deduction
is confirmed by the values of the temperature-coefficients. Themean temperature - coefficient of frequency for a quartz bar
vibrating longitudinally was found to be —5 x!0~ 6 per 1° C. rise
of temperature, whereas for a plate vibrating in the direction of
its thickness (the electric axis) the coefficient lies between —30and — 70xl0~ 6
. The higher temperature-coefficients for the
higher partials therefore suggest motion in the direction of the;
electric axis as well as longitudinally.

PIEZO-ELECTRIC VIBRATORS 145
Dye found slight variations of frequency according to the
method of mounting and exciting the quartz resonators, but the
reader should consult the original paper for further details.
Quartz Oscillators as Frequency Stabilisers - The work of
Cady and Dye which we have just considered deals with the
quartz resonator, which gives a transient response as the electrical
frequency passes through the resonant frequency of the quartz
bar. Cady also devised an oscillator for maintaining the quartz
at its resonant frequency. A more convenient arrangement has,
however, been devised by G. W. Pierce.* Fig. 47 represents a
similar circuit in which the
quartz 'oscillator' Q reacts in
such a manner on the valve
circuit that its oscillations are
maintained. The writer has
found it desirable, for satis-
factory working, that the natural
frequency of the tuned LC Fig. 47—Quartz Oscillator (Pierce)
circuit should be slightly lower
than that crystal mode it is desired to excite. The commence-
ment of oscillations is marked by a sudden drop in the plate
current of the valve. The frequency of these oscillations is
determined by the frequency of the quartz alone, being practically
independent of the variables in the valve circuit. The arrange-
ment may be regarded either as an electrically maintained
mechanical vibrator emitting sound waves of a definite frequency,
or as a mechanically controlled valve oscillator generating alter-
nating current of this frequency. We shall refer later (see p. 258)
to the application of this device in measuring sound-velocity in
gases.
(b) Piezo-Electric Sources of Sound - The Curies showed that
the quantity of electricity q liberated when a total force '/' is
applied to a quartz crystal slice is given by
when the force is applied in the direction of the electric axis,
q2=0
when the force is applied along the optic axis, and
g3 = -*///*
* G. W. Pierce, Proc. Amer. Acad., 59, No. 4, Oct. 1923 ; and 60,No. 5, Oct. 1925.
10

146 LONGITUDINAL VIBRATIONS OF RODS
when applied in the third direction (i.e. the length, at right angles
to both electric and optic axes). Conversely, it was shown that
the application of a voltage V to the faces at the ends of the
electric axis resulted in changes of length
S,=kV
in the direction of the electric axis, and
$3=- KN/t
in the third direction—no change of length being observable in
the direction of the optic axis. The constant k of the above
relations is given by Curie as 6-3 xlO-8 C.G.S. units of charge.
The longitudinal expansions and contractions of a strip of
quartz, subjected to alternating e.m.f. of known magnitude mayserve as a standard of amplitude at audible frequencies provided
the frequency of the e.m.f. is low relative to the natural frequency
of the quartz—a condition which is easily attained in practice.
This method of producing sound vibrations of definite amplitude
has been employed in determinations of the minimum amplitude
audible at various frequencies. It provides a convenient means
also of calibrating sound receivers in terms of known amplitudes
of vibration. Piezo-electric oscillographs # have been constructed,
in which use is made of the alternating expansion and contraction
of a strip of quartz or Rochelle salt when subjected to alternating
e.m.f. 's. The small displacements of the free end of the strip are
mechanicallyand optically amplified, and photographicallyrecorded.
The piezo-electric properties of quartz and Rochelle salt have
been applied to the production of high-frequency sound transmitters
and receivers. Thus M. Langevin f has employed a slab of quartz,
whose faces are perpendicular to the electric axis, as a transmitter
and receiver of supersonic vibrations under water—the apparatus
being used for depth sounding and the detection of submerged
bodies. % The arrangement of the Langevin apparatus is illus-
trated diagrammatically in fig. 48;'
a' is an assemblage of thin
slices of quartz crystal placed between two metal plates 'bb,y
of
* See papers by C. E. Wynn Williams, Phil. Mag., p. 289, Feb. 1925;
and A. B. Wood, Phil. Mag., p. 631, Sept. 1925.
t See article on ' Submarine Listening ' by A. Troller (La Nature,
pp. 4 and 12, Jan. 8, 1921) ; and on ' Echo Depth Sounding ' byP. Marti (La Nature, Aug. 20, 1921).
t See also 'Echo Sounding,' Nature, May 9, 1925, pp. 689-690;French Patent No. 505,903 (1918) and British Patent No. 145,691 (1920),
Langevin; also Hydrographic Review (Monaco), No. 3, 1924 ; and No.14, 1926.

PISTON-SOURCE. DIRECTIONAL PROPERTIES 147
equal thickness and calculated according to the frequency of the
sound to be emitted. One side of this arrangement is in contact
with the sea, the other being shielded by means of the watertight
box 'c' The quartz-steel 'sandwich' is operated from a source
of high-frequency energy—a power-valve oscillator—tuned to
-To A.C. Oscillator
& Receiver
c Watertight- Container.
Fig.
b_ a
Outer Electrode. Layer of Quartz Slabs.
48—Langevin Quartz Supersonic Transmitter
the frequency, say 50,000 cycles/sec. of the transmitter. Thesame device is used to receive the 'echo,' the H.F. alternating
pressures falling on the quartz slabs producing corresponding
e.m.f.'s. The electrical circuits required for receiving are similar
to those used in radiotelephony, the heterodyne (or 'beat')
principle being used to render the supersonic echo audible.
Carbon microphones and piezo- electric crystals of Rochelle
salt may also be used as detectors of high-frequency sounds if
suitably mounted in resonant structures.#
Sound Radiation from a High-Frequency Piston - Langevin's
quartz disc transmitter depends for its action on the longitudinal
vibrations set up in the direction of the thickness of the slab byvirtue of its piezo-electric properties. The whole face of the slab
vibrates with the same amplitude and phase and behaves in every
* See I. B. Crandall, Vibrating Systems and Sound, pp. 138 and 142;
Rayleigh, 2, p. 138 and pp. 162-165.

148 LONGITUDINAL VIBRATIONS OF RODS
respect like a piston oscillating to and fro at a very high frequency.
If the piston has a diameter large compared with a wave-length A
of the sound emitted into the surrounding medium, the waves set
up will be approximately plane near the piston, becoming divergent
at greater distances, the intensity ultimately varying inversely as
the square of the distance from the source. The problem of
sound-distribution around such a source is analogous to the case
of optical diffraction of plane waves passing through a small
circular hole.* If the diameter D of the hole is small compared
with the wave-length A the energy is distributed spherically with
the hole as centre. But if A is much smaller than D zones of
maximum and minimum intensity are formed around the axis
of the hole. The general expression for the amplitude at any
point P on the axis may be found, as in the analogous optical
case, by subdividing the disc into a number m of 'half-wave'
zones of equal area (see p. 300). It has been shown (p. 17)
that the resultant effect at the point P is A sin a/a, where a
is represented by half the difference in phase at P of the disturb-
ances due to the first and last zones, i.e.
1 mX 2-7T TTtn
a=2-T xT ==T-
But mX/2 =r2/2x to a first approximation (where r is the radius of
the disc and x is the length of the normal from P to the disc.
Consequently m=r2/Xx and a=7rr2/2Xx. The amplitude A,
calculated on the supposition that the disturbances all reach Pin phase is qc nr2\Xx, i.e. the area of the disc divided by Xx. Theresultant amplitude A^ at the point P on the axis is therefore
r2\
sinA sin a nr2 \2 Xxj
p a Xx '
7T r2
2'Xxi.e.
^ c • (* ^A^ 2sm[2'Yx
the intensity being, of course, proportional to the square of this
quantity. Up to the point x=r2/X there will be an approximately
parallel beam of radiation, having a succession of maxima and
minima of intensity due to interference of rays from the different
* See Schuster's Optics, p. 107 ; also S. Smith, Trans. Roy. Soc.
Canada, 3, 1923, p. 173, and 1924, p. 227.

PISTON-SOURCE. DIRECTIONAL PROPERTIES 149
zones into which the disc may be divided. When x is very large
(and sin a=a app.) the intensity, for points along the axis, will
77-V4
be proportional to ——-—the beam in this case diverging in the
form of a cone. As in the optical case, the angle of diffraction 6
for the first minimum of intensity is
6 -sin" 1 0-61 A/r,
this representing (for values of x large compared with r) the
semi-angle of the beam. The solid angle of the conical beamapproximates to
Q=0-3777A2/r2,
i.e. the divergence of the beam varies directly as the square of the
wave-length and inversely as the area of the disc.
When the point P is not on the axis of the vibrating disc, the
zones are not concentric with the aperture and the calculation
becomes more difficult. The problem may be solved analytically
by means of the fundamental equation for the velocity-potential
<j> at any point P (see equation (32), p. 62 et seq.), applying it to
elementary areas of the disc and integrating over the whole area.
The solution has been obtained in this manner by Crandall.*
The result may also be derived graphically as in optical treatises
on the passage of plane waves
through a circular aperture.
If the disc comprises only a// \/lntensityoc
AWccfew zones, the axis is sur-
rounded by diffraction rings of°' 5 "
jj \\ Ampiitudecc As^
cc
alternate maxima and minimaof intensity. Such curves of
amplitudes (A sin a/a) and
intensities (A2 sin2 a/a2) are
shown in fig. 49.
The sound beam radiated from the disc therefore consists of a
primary maximum and a number of subsidiary maxima. If the
disc has a large area, most of the energy lies in the primary beam.
When the radius r of the disc is small compared with the wave-
length A the primary beam is wide—approximating to the non-
directional case.
This directional property of a large vibrating quartz piston is
* Crandall, loc. cit., p. 137 ; Rayleigh, 2, 302 ; see also H. Stenzel,' Directional Properties of Sound Sources ' (Elecktrische NachrichtenTechnik., Bd. 4, Heft 6, pp. 239-253, 1927, and p. 165, May 1929).
Fig. 49

50 LONGITUDINAL VIBRATIONS OF RODS
utilised by Langevin * and R. W. Boyle f in locating marine
obstacles, such as ships, icebergs, rocky reefs, etc., and in depth
sounding. Boyle, Lehmann, and Reid {he. cit.) have made vis-
ible the track of high-frequency beams from such a transmitter
by means of powdered coke particles sprinkled in the track of the
beam through water (see fig. 50). The primary and subsidiary
beams are clearly shown. The reflection of the beam is also
(a) Frequency, 129,000 p.p.s.
—= 0*076
(6) Frequency, 178,000 p.p.s.
X= 0-055
D """ DFig. 50—Supersonic Beams of Sound—showing Primary and Secondaries
(Dr. R. W. Boyle)
demonstrated in this manner. Using a transmitter 15-3 cm.
diameter at a frequency of 135,000 cycles/sec, the wave-length
in water being therefore 1T1 cm. (since c= l-5xl0 5 cm./sec),
they found that the semi-angle 6 of the primary beam was
approximately 5° (which agrees with the theoretical relation
0=sin_1 0-61 X/r given above). A high-frequency source of this
nature makes it possible to investigate experimentally manyproblems in ' wave-physics ' which cannot be undertaken either
with light or with ordinary (audible) sound.
* Langevin, loc. cit.
f R. W. Boyle and C. D. Reid, ' Detection of Icebergs by an Ultra-
Sonic Beam ' {Trans. Roy. Soc. Canada, 3rd ser., 20, sect, iii, p. 233, etc.,
1926).

PISTON-SOURCE. DIRECTIONAL PROPERTIES 151
N. W. M'Lachlan* has also dealt with the directional properties
of a rigid disc vibrating axially, and has applied his theoretical de-
ductions to the case of a * loud-speaker ' emitting sounds of different
frequencies. As the theory indicates, the primary beam becomes
more and more sharply directional as the frequency of the sound
and the diameter of the disc increase. Thus the ' rigid ' cone of a
loud-speaker 10 cm. radius may be regarded as non- directional at
a frequency of 256 p.p.s., but sharply directional at 4096 p.p.s.,
frequencies which lie within the range of speech and music.
R. W. Wood and A. L. Loomis,f using a piezo- electric quartz' oscillator ' vibrating with large amplitudes at frequencies of the
order 5 xlO 5 cycles/sec, have obtained some striking results of a
physical and biological nature. In certain experiments with a
crystal vibrating under oil, they estimated the pressure of the
sound-radiation to be equal to 150 grams weight—capable of
raising the free surface of the oil into a mound 7 cm. high.
Maximum effects were observed when the distance from the
quartz to the 'radiometer' disc was a whole number of half
wave-lengths. The method of generation of the oscillations
was essentially that developed by Langevin.
The uses of Rochelle salt as a sound transmitter and receiver
have been demonstrated by Nicholson.J In one of the applica-
tions, the crystal is attached to a special needle and serves as a
gramophone transmitter. The mechanical stresses set up in the
crystal as the needle passes over the record produce corresponding
electrical effects which may be amplified to operate ' loud-speakers
'
or telephone receivers. Various commercial applications of the
piezo-electric properties of Rochelle salt are dealt with in a
'popular' paper by Russell and Cotton.§ The piezo-electric and
mechanical properties of Rochelle salt have been studied by
Valasek||and by W. Mandell.^f The latter shows that the
elasticity of Rochelle salt is very small, the crystals consequently
having low natural frequencies of vibration. Young's modulusfor Rochelle salt is of the order 3 xlO 8 as compared with 8 x 10 11
for quartz and 2 x 10 12 for steel.
* Proc. Roy. Soc, A, 122, p. 604, Feb. 1929 ; and Phil Mag., 7,
p. 1011, June 1929.
t R. W. Wood and A. L. Loomis, Phil. Mag., 4, pp. 417-436, Sept.1927.
t Nicholson, Amer. Inst. Elect. Eng. Proc, 38, p. 1315, Nov. 1919.
§ Russell and Cotton, Elect. Review, 92, No. 2361, Feb. 23, 1923.
|| Valasek, Phys. Rev., 17, pp. 475-481, April 1921 ; Phys. Rev., 20,
pp. 639-664, Dec. 1922.
If W. Mandell, Roy. Soc. Proc, A, 116, p. 623, etc., 1927.

i 5 2 TORSIONAL VIBRATIONS OF BARS
TORSIONAL VIBRATIONS OF BARS
A solid bar or a tube of circular section may be twisted by suit-
able forces in such a way that each transverse section remains in
its own plane. If the section is not circular, however, a warping
of the various layers is liable to occur and the analysis becomes
very complicated. We shall, in what follows, deal only with the
case of bars of circular section, where there is no motion parallel
to the axis of the bar. Provided we use the appropriate elasticity
coefficient (the rigidity, in this case) the problem is analogous to
the case of longitudinal vibrations. The force with which the
bar resists a twist depends on '/x,' the rigidity coefficient of the
material (denoting the ratio of stress/strain in a pure shear). Therelations between rigidity /x, Young's modulus E, the bulk
modulus k, and Poisson's ratio ct, are
Ea ^E n\
^2^+lj and *=9x^3E (1)
The rigidity /x must lie between E/2 and E/3, since u lies between
and J.
Following Rayleigh's procedure, consider a bar in the form of
a thin tube of radius r and thickness Sr, and let 9 denote the
angular displacement of any section distant x from the origin.
The ' shear ' of the material of the tube is rddjdx. The opposing
elastic force per unit area is \ir . dd/dx, and since the area of
section of the tube is 2ttt . Sr, the moment round the axis is
2/x7ir3 Sr . dd/dx,
and the restoring force acting on the slice of thickness 8x has the
moment
2jLt7rr3Sr . Sx . d2d/dx2
.
Now the moment of inertia of the slice is ZjrrSr . Sx . pr2, whence
the equation of motion is
d2d d2d
pir2 ^dx~2 - • -•
(2)
and this being independent of r, is equally applicable to tubes of
all radii or to a solid bar. The velocity of torsional wave trans-
mission is
c= V^~P .... (3)

TORSIONAL VIBRATIONS 153
i.e. VE : Vfju or V2(o-+l) : 1 relative to the velocity of longi-
tudinal vibrations. Taking Poisson's ratio o- as 0-25 for a steel bar,
the ratio of longitudinal to torsional velocities becomes 1-58.
Consequently the ratio of frequencies of longitudinal and torsional
vibrations for the same steel bar will have this value also. Thefrequency of the fundamental, midpoint clamped, will be
N4^ MNodes and antinodes for the various partial tones are formed as
in the case of longitudinal vibrations.
Torsional vibrations may be set up in solid bars by any con-
venient means of applying tangential forces to the free end, e.g.
by 'screwing' a resined leather, pressed tightly round the bar.
If the latter is rectangular in section, it is more convenient to
'bow' the opposite sides simultaneously in opposite directions.
By comparing the frequencies of the longitudinal and torsional
vibrations for the same bar the value of Poisson's ratio a may be
determined. A. O. Rankine and F. B. Young * made interesting
observations on the various modes of vibration (torsional, trans-
verse, and longitudinal) of a mild steel bar, observing the alternating
magnetic effects produced by the alternating stresses set up in the
bar on mechanical excitation. A short brass lever attached rigidly
at right angles to one end of the steel bar could be struck by a lead
hammer so as to throw the steel bar into torsional, longitudinal, or
transverse vibration. Observations with a small search coil,
connected to a three-valve amplifier and telephones, indicated
frequencies characterising the various possible modes of vibration
in the bar.
Piezo-Electric Effects produced by Torsion - Reference has
just been made to the use of a Rochelle-salt piezo-electric crystal
in a gramophone transmitter. Nicholson f has shown in the case
of Rochelle salt crystals of composite structure that a given force
produces the greatest piezo-electric effect when it is applied to
produce torsion around its principal axis, and advises this methodof use for producing electrical or mechanical results. The piezo-
electric constant of Rochelle salt subjected to shearing forces in
this manner is greater than 100 times the value for quartz sub-
jected to forces of compression.
* Rankine and Young, Phil. Mag., 38, pp. 528-532, Nov. 1919.
f Nicholson, loc. cit.

154 VIBRATIONS OF MEMBRANES
VIBRATIONS OF MEMBRANES, DIAPHRAGMS,PLATES, AND BELLS
The transverse vibrations of stretched membranes are related
to those of diaphragms and plates in a manner analogous to the
transverse vibrations of stretched strings and of elastic bars. In
the former case the vibrations are conditioned by the applied
tension and are independent of elastic forces, whereas in the
latter the elastic forces are all-important and tension almost
negligible.
Membranes - The theoretical membrane is assumed to be a
perfectly flexible, uniform, and infinitesimally thick solid lamina,
stretched in all directions by a force which is unaffected by the
motion of the membrane. In all cases of practical importance
the membrane may be regarded as having a fixed boundary.
Denoting the tension by T, and displacements by f in a direction
at right angles to the plane xy of the membrane, it may be shown
by analogy with the case of wave-motion in one dimension (i.e.
wave-motion on a string) that
m^=TW+dy) •;•(!)
where m is the surface density (mass per unit area=p x thickness)
of the membrane. The velocity of wave-motion is c= VT/m as
in the case of strings.
To obtain the modes of vibration of a membrane # with a fixed
boundary, assume f =a cos nt, so that equation (1) becomes
d2i d2
£
dx2 dy 2
where
k 2 =n 2m/T =n 2pt/T
(2)
At a fixed edge £=0. It is found that the solution of (2), subject
to this condition, is possible only for certain values of k, which
determine the frequencies of the membrane.
The complete theory of stretched membranes of various forms
(rectangular, square, circular, etc.) is mainly of mathematical
interest. The reader is referred therefore to the treatises of
Rayleigh and Lamb, where the problem is fully discussed. Thevibrations of a circular membrane have, however, certain physical
points of interest which find practical applications.
* See Lamb, Sound, p. 142.

CIRCULAR MEMBRANES 155
Circular Membranes - From a consideration of forces acting
across a circle of radius r, equation (2) for symmetrical modes of
vibration * reduces to
d2£ ,
1 d(
where
dr2 r dr
-J?
k 2 =n 2Pt/T.
This leads to a solution of the form
w*«)=o (4)
[where <2=radius of the membrane, and J a Bessel's function of
zero order of the first kind, whose roots are
foi/7r=0-7655, 1-7571, 2-7546, 3-7534 .... (5)
tending towards (m—J) where m is an integer].
The first of these roots corresponds to the fundamental mode of
vibration, of frequency
0-765 It
~2a~\l pt
('«' being the radius of the membrane). In the mth mode there
are (m— 1) nodal circles in addition to the edge. For the nodal
circle kr/7T =0-7655, r/a =0-4356. The partials do not form a
harmonic series.
Membranes, approximating in some respects to the ideal, maybe made of soap films stretched across a metal ring. The Hilger
audiometer employs a stretched circular membrane of extremely
thin collodion to record the vibrations of the air in contact with
it. Methods of preparing thin tenacious films of collodion suitable
for such a purpose have been described by H. Dewhurst.f Thevibrations of these membranes, of thickness only a few wave-
lengths of light, are examined by optical or photographic methods.
In order to examine the effect of tension on a membrane a morerobust lamina is usually employed. Thus a sheet of parchment
may be stretched until it has a fundamental frequency of several
hundreds per second. A thin steel membrane (0-002 inch thick)
may be stretched, by applying symmetrical tension via a ring,
until its natural frequency attains several thousand per second.
Wente's J condenser microphone has such a diaphragm, of fre-
* See chap, v, Lamb. f Proc. Phys. Soc, 39, p. 39, 1926.
t Phys. Rev., 10, p. 39, 1917; 21, p. 450, 1918; 19, p. 498, 1922.

156 VIBRATIONS OF MEMBRANES
quency about 5000 cycles per second. Attempts to stretch the
thin steel membrane still further usually result in disaster, the
material passing the elastic limit at greater tensions. * Loud-
speaker ' diaphragms have been constructed with highly tensioned
aluminium alloy membranes of large area and moderate thickness,
having a natural frequency such as to reinforce the lower range
of the audible scale of frequencies.*
The various modes of vibration of a stretched steel membraneare very conveniently observed by employing electromagnetic
methods of excitation. An electromagnet ('pot type') mountedsuitably with respect to the membrane, and supplied with A.C. of
variable frequency from a valve oscillator, will excite the funda-
mental and the various partials as required. The magnet system
of an ordinary telephone receiver will serve the purpose. Thenodal circles and diameters may readily be observed by sprinkling
fine, dry sand (Chladni's method), which collects at the nodes of
the vibrating membrane. Millar | has obtained similar results
using a glass membrane excited by means of organ-pipes. Theelectromagnetic method is, however, probably more convenient
and instructive on account of the wide range of continuous
frequency-variation which is possible. It provides a convenient
means also of studying the sharpness of resonance for the various
partials. Generally speaking, it will be found that the agreement
between theory and observation is only approximate. Theordinary theory takes no account of the large effect due to the
damping and loading effect of the surrounding medium, and it is
assumed that the stiffness of the membrane is negligible. These
assumptions are not realised in practice.
Membranes as Sources of Sound. Directional Proper-
ties - The application of stretched membranes to various forms
of musical instruments, drums, tambourines, etc., in addition to
the uses as a sound receiver already mentioned, brings us to an
important point.
In a drum, a membrane is stretched tightly (the tension being
adjustable for tuning purposes) over an enclosed cavity, the walls
of this cavity being relatively rigid. The air cavity resonates to
the fundamental of the stretched membrane and thereby reinforces
this note. The wave-length of the note in air will be of the order
of 10 feet (at a frequency of 100, the velocity of sound in air being
1100 feet/sec), whereas the diameter of the drum may be, say,
* Whitaker, Journ. Sci. Instrs., 5, p. 39, 1928.
f Science of Musical Sounds, pp. 151-153.

DIAPHRAGMS 157
only 2 feet. Taking this into consideration, with the fact that
only one side of the drum radiates sound into the air, the issuing
sound will spread spherically. Suppose now the same membrane
be stretched on a massive annular ring, permitting both sides to
radiate sound to the surrounding air. An observer in a position
' edge-on ' to the plane of the membrane will receive simultaneously
vibrations from opposite sides of the membrane, in opposite phase,
*
and will consequently hear little or nothing. 'Broadside-on' to
the membrane, however, the two sets of vibrations do not neutralise
completely owing to a partial screening effect of the remoter
vibration by the membrane and ring. As the vibrating membraneis rotated through 360° therefore, the observer will hear two
distinct maxima (180° apart) separated by two corresponding
minimum (or zero) positions. The maxima will be of smaller
intensity than the maximum observed when one side of the
membrane is completely screened (i.e. in the case of a drum).
This directional property of a membrane stretched on a ring
may also be demonstrated in the converse case, when it is used,
in conjunction with a small microphone attached to its centre, as
a receiver of sound.f The microphone gives zero response whenthe membrane is 'edge-on' and maximum when 'broadside-on'
to the source of sound.
Diaphragms
When the frequency of a membrane can no longer be deter-
mined without taking stiffness (or elasticity) into account, weapproach the condition of a diaphragm in which stiffness is the
primary factor and tension becomes of secondary importance, if
not altogether negligible. The complete theory of a vibrating
diaphragm is even more complex than that of a membrane. Only
approximate solutions have been obtained.
Rayleigh J determined the periods and motions of a thin
circular plate (in vacuo) rigidly clamped at the edge, regarding
the restoring forces involved in its vibration as purely elastic.
By means of a series of Bessel functions he found that the funda-
mental frequency of vibration is given by
N _2-96 h
277,
^Vp(l-C72)
'
* The membrane acting as a ' double source ' of very small, or neg-ligible, strength.
t See W. H. Bragg, World of Sound, p. 172 (Bell).
t Rayleigh, Sound, 1, p. 366, etc.

158 VIBRATIONS OF DIAPHRAGMS
where '//' is the thiekness, and '«' the radius of the diaphragm,
E Young's modulus, p the density, and a Poisson's ratio for the
material of the diaphragm. This value of the frequency is only
slightly affected when the diaphragm vibrates in air, since the
loading effect due to the added mass of air produces a negligible
lowering of frequency. Lamb * has recently dealt mathematically
with the problem of frequency and damping of thin circular
diaphragms in air and in water, more particularly in relation to
the reception and transmission of sound under water. A thin
circular plate or diaphragm is regarded as filling an aperture in an
infinite plane wall. To simplify the theoretical treatment the
wall is supposed to be rigid and the diaphragm to be firmly clamped
to it along the circumference, although these conditions are only
imperfectly fulfilled in practice. Even with these limitations, a
complete solution is not possible, but a sufficient approximation is
obtained by Rayleigh's method of an "assumed type" | of dis-
placement. It is known that the frequency thus obtained is
slightly too high. The type of displacement assumed
Mi-, .... (2)
(where $ is the normal displacement of the diaphragm at a distance
r from the centre, and A the displacement at the centre, r=0), is
justified by the fact that, in the case of the diaphragm vibrating
in vacuo, the agreement between the calculated and the observed
values is very good.
Diaphragm in Air - The frequency of the fundamentall
in
vacuo ' is thus found to be almost exactly given by
N -°'4745y^5) • • •(3)
which agrees closely with Rayleigh's value in equation (1). Lambalso determines the frequencies of the higher partials, the numerical
multiplier in (3) being replaced by 1-006 in the case of the vibration
with one nodal diameter, and by 1-827 for one nodal circle. The
partials are therefore not harmonic. Equation (3) may be
written
N =0-4745 hc/a2,
where c is the velocity of elastic waves in an infinite thin plate of
the same material and thickness.
* Lamb, Roy. Soc. Proc, A, 98, p. 205, 1920.
t See Rayleigh, Sound, 1, p. 113, etc.

DIAPHRAGMS 159
For an iron diaphragm, assuming
E=2xl0 12,
/o=7-8, o-=0-28 C.G.S. units,
we find
c=5-27 xlO 5 cm./sec,
and equation (3) becomes
N=2-50xl0 5/z/tf
2 ... (4)
Thus if h=0-l cm. and a =5 cm., the fundamental frequency
in vacuo or in air will be 1000 cycles per second.
Added Load - Lamb estimates the effective mass of an un-
loaded diaphragm of total mass M as equivalent to a mass M/5concentrated at the centre. Consequently a small additional
mass m attached to the centre of the diaphragm may be regarded
as a uniformly distributed load of mass 5m. The frequency of a
diaphragm (mass M) in air is therefore diminished by a load m(at the centre) in the ratio (l+5w/M) _i
, i.e.
he 1
NL =0-4745— .-
. . (5)a2 Vl+5m/M
Diaphragm vibrating in Contact with Water or OtherMedium - The presence of the medium (e.g. water) in contact
with the diaphragm has two effects. Firstly, the frequency is
lowered on account of the virtual increase of inertia of the dia-
phragm due to the added mass of water; and secondly, the
vibrations are damped owing to the energy radiated into the
water in the form of sound waves. Lamb has found, in the case
of a diaphragm with one side only in contact with water, that the
inertia of the diaphragm is increased in the ratio (l+j8) where
fl =0.6689^. £.-•
p h
where p 1 is the density of the water. The frequency in this case
therefore becomes
N--*H?-vT^ •
•(6)
When both sides of the diaphragm are in contact with 'infinite'
* In arriving at this result Lamb assumes that the wave-length in thewater is large compared with the diameter of the diaphragm.

160 VIBRATIONS OF DIAPHRAGMS
water, the value of /3 in this expression for frequency must bedoubled.
The frequency of a loaded diaphragm with water on one side only,
and a mass m at the centre, is clearly
he 1
NL .„ =0-4745- . . (7)
a 2 Vl +£+5m/M
The above relations for the frequency are, of course, equally
applicable whatever the medium in contact with the diaphragm,
provided the appropriate value of /3 is introduced. Thus, in the
case of a thin diaphragm of large diameter vibrating in air, where
the area of the vibrating surface is large and the mass of the
diaphragm small, the added air-load may produce an appreciable
lowering of frequency.
Damping - Equating the rate of decay of the energy of the
vibrating diaphragm (plus the load due to the medium) to the
energy emission as sound in the medium, Lamb finds that the
decay-constant, in e~ kt, is given by
5 p n 2a 2
=36 'p, ' (l+jS)^ '
'
* ( }
(where n=2ir x frequency, and c±= velocity of sound in the
medium).
The degree of persistence of the vibrations is indicated by the
number of vibrations which elapse whilst the amplitude diminishes
in the ratio 1/e, viz. n/27rk, whence from equations (6) and (8)
we find
Persistence=^~ =0-385(1 +j8)3/2^
. . (9)2ttk p Yc
Thus for a steel diaphragm 7 inches diameter and \ inch thick
(frequency 1013 in air) vibrating in water w/277&=5T6. In spite
of this small persistence, the vibrations are still far from being
'dead-beat.' The damping, though considerable, is not sufficient
to affect the frequency appreciably, this influence being of the
order k2/n 2 (see p. 35), which is less than 1 in 1000 in this case.
There is also a considerable degree of selective resonance to
external sources of sound, when the diaphragm is used as a
' receiver.' The energy of resonance falls to one half the maximumwhen the frequency of the source differs from the natural fre-
quency of the resonator by the fraction k/n approximately (see

DIAPHRAGMS 161
p. 43). Thus in the above example, where the frequency (as
modified by the water) is about 550, the range over which the
energy will exceed half the maximum is confined between the
limits 530 and 570 p.p.s. approximately.
The persistence of vibrations (measured in periods) will be
greater, and the resonance will attain a greater maximum (and
concentrated over a narrower range) the thinner the diaphragm.
The vibrations increase in persistence the greater the load on the
diaphragm, i.e. the sharpness of tuning increases with the load.
Experimental - Lamb's theoretical deductions relative to the
frequency and damping of circular diaphragms have been verified
experimentally by Powell and Roberts.* They obtained values
in good agreement with theory for the frequencies in air and in
water of diaphragms of various dimensions. The theoretical
lowering of frequency produced by a water load and by a load
concentrated at the centre of the diaphragm were also confirmed
experimentally. The resonance frequencies of the various dia-
phragms were indicated by means of a small ' button ' microphone
attached to a boss on the centre of the diaphragm. In a further
paper, Powell j* describes experiments on the damping of such
diaphragms in relation to their sensitiveness as receivers of under-
water sounds. The values of resonance-amplitude and persistence
of vibration were found to be consistent with the mathematical
deductions of Lamb quoted above.
The vibrations of diaphragms in air have been studied exten-
sively by A. E. Kenelly,J who has also, using the 'motional im-
pedance' principle (see p. 73), developed methods of measuring
the efficiency of telephone receivers in converting mechanical into
electrical vibratory energy. Kenelly's method of studying the
motion of a vibrating diaphragm is outlined on p. 222. Thevibrations of a diaphragm may be excited in a number of different
ways, e.g. by means of sound waves in tune with it, or electro-
magnetically. A novel method of excitation is described byC. W. Hewlett. § The diaphragm (of non-magnetic metal) lies
between two flat coils through which a constant direct current
flows, in such a way as to produce a radial magnetic field in the
diaphragm. Alternating current is superposed on the direct
current, and circular currents are induced in the diaphragm, which
* J. H. Powell and J. H. T. Roberts, Proc. Phys. Soc, 35, April 15,1923.
t J. H. Powell, Proc. Phys. Soc, 37, Feb. 15, 1925.
t See A. E. Kenelly, Electrical Vibration Instruments.
§ Phys. Rev., 19, p. 52, 1922.
II

162 VIBRATIONS OF DIAPHRAGMS
behaves as the secondary of a transformer. The field due to
these currents reacts on the steady field and the diaphragm is set
in vibration with the frequency of the alternating current. Con-
versely, vibration of the diaphragm, as a receiver of sound waves,
#(£ ^PPPP €1^^I
MlfMlMA. Air both sides
No load
B. As in A, butload added tocentre
J i '/ / VVAMVWAc One side in
water
D. As in A, butmicrophoneattached to
centre
(Time Marks o-oi second.)
Fig. 51—Damping of a Steel Diaphragm
reacts on the circuit and generates corresponding alternating
currents. The arrangement therefore serves as a sound generator
and receiver. It gives a pure tone of constant and measurable
pitch and intensity over a wide range of frequencies. Kerr
Grant * describes a method of exciting a diaphragm by means of
* Proc. Phys. Soc, 34, p. 104, 1922.

DIAPHRAGMS 163
an air blast. The effect is based on the Bernouilli principle by
which the diaphragm is attracted towards the jet from which the
air issues.
The records shown in fig. 51 were obtained by the writer in an
experimental study of the vibration and damping of diaphragms
under different conditions. The effects of adding a load in
reducing, and a microphone in increasing, the rate of decay of
vibrations are illustrated in records B and D. The lowering
of frequency produced by immersing one side of the diaphragm
in water is shown in C as compared with A when both sides are
in air.
L. V. King,* by applying a controlled air pressure to one side
of a diaphragm, has succeeded in tuning it continuously over a
moderate range of frequency. The method has application in
the reception of signals of a definite frequency.
The mean power radiated from a vibrating diaphragm has been
discussed on p. 63. The mean amplitude over the surface of a
vibrating diaphragm, in its fundamental mode, is approximately
one-third of the amplitude at the centre. A more accurate value
may be derived from equation (2), p. 158.
Diaphragms provide one of the most convenient means of pro-
ducing and receiving sounds. Numerous forms of diaphragm-
type telephones and microphones are in daily use in the trans-
mission and reproduction of speech sounds. Large diaphragms,
e.g. in the Fessenden oscillator (see p. 390), are used as sources of
sound-power, in the transmission of sound over large distances
under water. A diaphragm operated electromagnetically at its
fundamental resonance frequency may become a very efficient
sound generator. The choice of diaphragm will depend of
course on the purpose in view—the most important controlling
factor being the medium through which the sound is to be
transmitted. Thus a diaphragm which is suitable for transmit-
ting sound of a particular frequency into air would be quite
unsuitable for use under water and vice versa. The efficiency of
a sound generator, driven electrically, is determined most simply
from the analysis of its motional impedance over a range of
frequencies including resonance. The method has already been
described on pp. 73 to 75. Further reference will be madeto the many applications of diaphragms as sound receivers andgenerators for use in air and under water.
* Proc. Roy. Soc.y 99, p. 163, 1921 ; and Journ. Set. Instrs., 3, p. 241,
1926.

1 64 VIBRATIONS OF PLATES
Plates
The vibrations of plates are easily demonstrated experi-
mentally, but the mathematical treatment is very complex. Thesimplest case of a vibrating plate, viz. a circular disc clamped
at the edge (a diaphragm) has already been considered. As wehave seen, Rayleigh and Lamb give 0-47 hc/a 2 as the fundamental
frequency of vibration of such a disc of radius a and thickness h.
When the plate is free at the edge, however, the mathematical
treatment is extremely difficult.* Near the edge of the plate a
peculiar state of strain exists which sometimes results in abnormally
large shearing forces on sections perpendicular to the edge. Aperfectly free rectangular plate cannot vibrate like a bar, with
nodal lines parallel to one pair of opposite edges, since couples
are required about the other pair of edges to counteract the
tendency to anti- clastic curvature. The following general
remarks by Rayleigh are important: "If all the dimensions of a
plate, including the thickness, be altered in the same proportion,
the period is proportional to the linear dimensions, as in every
case of a solid body vibrating by virtue of its own elasticity. Theperiod also varies inversely as the square root of Young's modulus,
if Poisson's ratio be constant, and directly as the square root of
the mass per unit volume of the substance."
The experimental study of the vibrations of plates begins with
Chladni (1787). By the simple expedient of sprinkling fine sand
on the surface of a plate he succeeded in demonstrating very
clearly the positions of the nodal lines when the plate was set in
vibration. The figures are best obtained on a plate clamped at
the centre of symmetry, by bowing and touching certain points
on the edge. The marvellous variety of the patterns obtained
in this way is sufficient evidence of the complexity of the problem.
An illustration of a large number of possible modes of vibration
of a square plate is given in Tyndall's Sound (p. 143). Similar
results may be obtained with circular plates clamped at the centre.
Chladni preferred to use glass plates as they are easily obtained
to the required dimensions, and their transparency permits of the
fingers being used to damp points underneath which are shown to
be nodal by the sand above. It is desirable to hold the plate
where two nodal lines intersect, or at the centre of symmetry.
Simple figures usually correspond to low-frequency tones, and
the more complicated figures to the higher tones. The number
* See Rayleigh, Sound, 1, p. 372 ; and Lamb, Sound, p. 150.

PLATES 165
and variety of Chladni's figures are almost unlimited. Chladni
gives illustrations of 52 figures with a square plate, 43 circular,
30 hexagonal, 52 rectangular, 26 elliptical, 15 semicircular, and
25 triangular. Doubtless the possibilities are not exhausted by
this list.
It was found by Savart that very fine powder, such as lycopodium,
behaves differently from sand, collecting at the antinodes instead
of at the nodes. This effect was ascribed by Faraday # to the
influence of currents in the surrounding air (also in vibration).
In a vacuum, all powders move to the nodes.
Fig. 52—Vibrations of Quartz Plates (stroboscopic interferometer method)A. Circular disc at rest. B and D. Same disc as A in vibration. C Rectangular plate in vibration.
(By courtesy of Dr. D. W. Dye, F.R.S.)
A general idea of the manner of formation of Chladni's figures
may be obtained by regarding them as due to the simultaneous
* Faraday, Phil. Trans., p. 299, 1831.

166 VIBRATIONS OF PLATES
existence of two simple vibrations of the same period.* For
example, in the case of a square plate vibrating with three nodal
lines parallel to one edge of the plate, the x axis, the same type of
vibration is also possible parallel to the other edge, the y axis.
The two vibrations usually take place at the same time, but the
relative phases may vary and different figures result.
Recently D. W. Dye f has demonstrated the formation of
vibration figures at radiofrequencies (of the order 10 5 p.p.s.)
—
using small pieces of quartz (2 cm. square approximately) excited
piezo-electrically in the manner previously indicated (see p. 141
et seq.). The motion of the surface of the quartz was observed by
means of interference bands formed by reflection between it and a
fixed glass surface. The illumination was rendered intermittent
(stroboscopic) by means of a neon lamp flashing at the same
frequency as the vibrations impressed on the quartz. The various
nodes and antinodes of the numerous possible modes of vibration
could be readily observed by the resultant distortion of the
interference pattern. (See fig. 52.)
A plate of moderate dimensions, when struck with a hammer,
emits a powerful sound. This finds practical application in
numerous forms of gong. The same method of producing a
sound audible at a considerable distance has been applied by the
Submarine Signalling Company to a gong or 'disc bell' for use
under water.
Vibrations of Curved Plates. Cylinders and Bells - Thecomplex problem of the flat plate is still further complicated whenthe plate is curved, for it becomes increasingly difficult to separate
the various possible modes of vibration. Rayleigh gives for the
fundamental frequency of the flexural vibrations of a thin cylin-
drical shell
N= ^2 -!) A /M*±W3)
(1)ttVV+ 1
'
a 2^ /(3&+4/x)
where s is the number of wave-lengths into which the circum-
ference is divided, 2h is the thickness of the shell, a its radius, k the
bulk modulus of elasticity, /j, the rigidity, and p the volume density.
As in the case of a diaphragm the frequency N varies as h/a2 and
Vl/(j. Fenkner verified this result experimentally. He showed
also that the frequency is independent of the length of the cylinder,
and the vibrations may therefore be regarded as approximately
* Zeissig, Ann. d. Physik, 64, p. 360, 1898.
t N.P.L. Reports, 1928 and 1929.
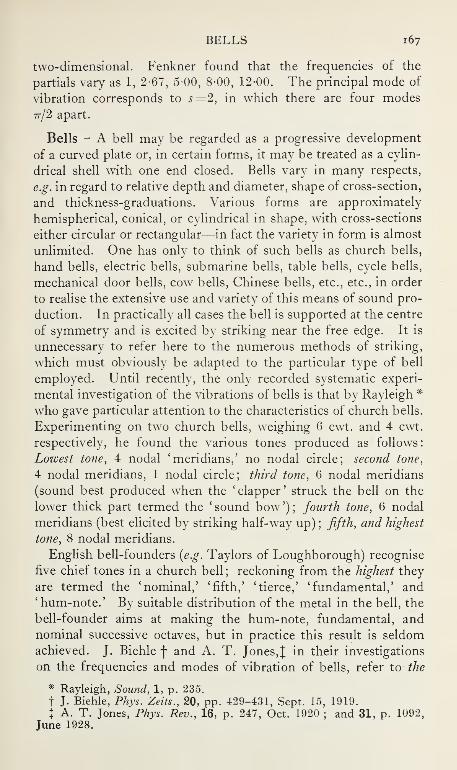
BELLS 167
two-dimensional. Fenkner found that the frequencies of the
partials vary as 1, 2-67, 500, 8-00, 12-00. The principal mode of
vibration corresponds to s=2, in which there are four modes
77/2 apart.
Bells - A bell may be regarded as a progressive development
of a curved plate or, in certain forms, it may be treated as a cylin-
drical shell with one end closed. Bells vary in many respects,
e.g. in regard to relative depth and diameter, shape of cross-section,
and thickness-graduations. Various forms are approximately
hemispherical, conical, or cylindrical in shape, with cross-sections
either circular or rectangular—in fact the variety in form is almost
unlimited. One has only to think of such bells as church bells,
hand bells, electric bells, submarine bells, table bells, cycle bells,
mechanical door bells, cow7 bells, Chinese bells, etc., etc., in order
to realise the extensive use and variety of this means of sound pro-
duction. In practically all cases the bell is supported at the centre
of symmetry and is excited by striking near the free edge. It is
unnecessary to refer here to the numerous methods of striking,
which must obviously be adapted to the particular type of bell
employed. Until recently, the only recorded systematic experi-
mental investigation of the vibrations of bells is that by Rayleigh *
who gave particular attention to the characteristics of church bells.
Experimenting on two church bells, weighing 6 cwt. and 4 cwt.
respectively, he found the various tones produced as follows:
Lowest tone, 4 nodal 'meridians,' no nodal circle; second tone,
4 nodal meridians, 1 nodal circle; third tone, 6 nodal meridians
(sound best produced when the 'clapper' struck the bell on the
lower thick part termed the ' sound bow') ;
fourth tone, 6 nodal
meridians (best elicited by striking half-way up); fifth, and highest
tone, 8 nodal meridians.
English bell-founders {e.g. Taylors of Loughborough) recognise
five chief tones in a church bell ; reckoning from the highest they
are termed the 'nominal,' 'fifth,' 'tierce,' 'fundamental,' and' hum-note.' By suitable distribution of the metal in the bell, the
bell-founder aims at making the hum-note, fundamental, and
nominal successive octaves, but in practice this result is seldom
achieved. J. Biehle f and A. T. Jones, J in their investigations
on the frequencies and modes of vibration of bells, refer to the
* Rayleigh, Sound, 1, p. 235.
t J. Biehle, Phys. Zeits., 20, pp. 429-431, Sept. 15, 1919.
X A. T. Jones, Phys. Rev., 16, p. 247, Oct. 1920 ; and 31, p. 1092,
June 1928.

168 VIBRATIONS OF PLATES
striking note which gives its name to the bell. This note cannot
be picked up from the bell by a resonator, it cannot be elicited
from the bell by resonance, and it does not beat with a tuning-fork
of nearly its own pitch. No partial tone of the bell has the same
pitch as the striking note, but the fifth partial (the 'nominal') is
an octave above it.
It is possible that the ' striking note ' is due to a ' chattering ' or
intermittent contact between the clapper and the bell. A similar
phenomenon has been observed by Bond * and others when the
stem of a vibrating tuning-fork is held lightly in contact with a
fixed surface, e.g. a table, viz. the production of so-called 'sub-
harmonics ' due to intermittent contact between the stem of the
fork and the table. Low-frequency, audible chattering mayreadily be obtained between a piezo- electric crystal, vibrating
vigorously at inaudible frequencies, and a metal plate in loose
contact with its surface—the frequency of the intermittent contact
being perhaps 1000, whilst the frequency of the crystal vibrations
may be 100,000. A. T. Jones, however, considers that this
! striking note ' is an ' aural illusion,' and such an explanation is not
unlikely. Rayleigh's remarks relating to frequency observations
on bells are of interest in this connection.'
' The highly composite,
and often discordant, character of the sounds of bells tends to
explain the discrepancies sometimes manifested in estimations of
pitch . . . when a bell is sounded alone, or with other bells in
slow succession, attention is likely to be concentrated on the
graver and more persistent elements of the sound rather than
upon the acuter and more evanescent elements, while the
contrary may be expected to occur when the bells follow one
another rapidly in a peal. In any case the false octaves with
which the table (1, p. 393) abounds are simple facts of observa-
tion. . .."
The phenomenon of beats frequently heard in the vibrations
of a church bell is explained by Rayleigh in the following manner
:
"If there be a small load at any point of the circumference, a
slight augmentation of period ensues, which is different according
as the loaded point coincides with a node of the normal or of the
tangential motion, being greater in the latter case than in the
former. The sound produced depends therefore on the plane
of excitation ; in general both tones are heard, and by interference
give rise to beats, whose frequency is equal to the difference
between the frequencies of the two tones."
* Bond, Proc. Phys. Soc, 36, p. 340, June 1924.

AIR CAVITIES 169
The Submarine Signalling Company use massive bronze bells *
under the sea in charted positions (under lightships and buoys)
as a means of signalling to ships fitted with hydrophones to
receive the sound. Sound travels much better under water than
in air, for the medium is more homogeneous and attenuation
losses, due to various causes, are far less serious. The sound of
a submarine bell can be heard at ranges of many miles under
favourable conditions. The frequency of a bell is, of course,
lowered by immersion in water, the loading effect of the water
being analogous to that already considered in the case of dia-
phragms. This loading effect is, however, different for the
different partials, as might be expected, and the general character
of the 'bell sound' is therefore completely altered.
AIR CAVITIES
Air Columns - The simplest case of a vibrating mass of air
in a solid enclosure is that of a parallel cylindrical pipe, the ends
of which may be closed or open. The longitudinal vibrations of
such a column of air (or other fluid, liquid, or gas) are analogous
to the corresponding vibrations in a solid bar (see p. 135 et seq.).
As in the case of bars, it is necessary to make certain assumptions
in order to formulate a simple theory. In the first place, the
diameter of the pipe is assumed sufficiently great to justify neglect-
ing viscous effects (see p. 317), and sufficiently small compared
with the length of the pipe and the wave-length of the sound. In
the simple theory also it is usually assumed that the walls of the
pipe are rigid. This is only approximately true, and a consider-
able correction may be involved when the pipe is liquid-filled.
With these assumptions we may regard the motion at any instant
to be uniform in any particular cross-section of the pipe. That
is, we have to deal with plane waves of sound. This plane-wave
condition inside the pipe is manifestly incorrect at an open end,
where the sound wave diverges spherically into the surrounding
medium. Sound energy is radiated into the medium, damping of
the pipe oscillations taking place, due to loss of energy to the
medium, at every reflection from an open end. Otherwise the
vibrations in the pipe would persist indefinitely. The open-end
effect results in an increase in the effective length of the pipe, with
a consequent lowering of frequency. The simple theory, which
* A description of these bells and the submarine signalling systemfor safety of ships at sea is described in a booklet issued by the SubmarineSignalling Company.

170 AIR CAVITIES
we shall now consider, also assumes small-amplitude adiabatic
changes of pressure without rotary or eddy motion. When a
cylindrical air column is set into resonant vibration, e.g. by blowing
or by means of a tuning-fork, stationary waves are set up in it due
to the combined effects of the direct and end-reflected waves, just
as in the cases of solid bars and strings, already considered. Theequation of wave-motion in the pipe is therefore
d*£JE *(dt2
P' dx2 '
' '
' Uwhich characterises a system of waves travelling in opposite
directions in the column of fluid with velocity c=VE/p, E and pbeing the appropriate elasticity and density of the fluid contained
in the pipe. Assuming £=a cos nt this equation becomes
d+7^° •• • • (2)
of which the solution is
/ nx . nx\£=(Acos hB sin — ) cos nt . . (3)
where A and B are arbitrary constants.
This equation represents a system of stationary waves in the
pipe (cf. with the case of strings p. 86, and bars p. 136). At a
node the displacement £=0, and at an antinode the condensation
dg/dx=0.
Pipes Open at both Ends. ' Open ' Pipe - A pulse of com-
pression starting from the mouth of the pipe is reflected from the
opposite open end with reversal of phase, i.e. as a wave of rare-
faction, and again traverses the pipe to the mouth. Here another
reflection takes place with reversal of phase, i.e. the reflected pulse
is now a compression like the initial pulse. Thus, the initial state
of condensation is repeated after two complete traverses of the
length of the pipe, and the frequency N of the fundamental
vibration will be c/2l where / is the length of the pipe. This
vibration has therefore a wave-length A =2/. Since the con-
densation dg/dx is zero at the open ends (at x=0 and #=/), wefind from (3) that B=0 and sin (nl/c) =0. This gives nl/c=STr
where s= l, 2, 3, etc. («=27rN), representing a complete harmonic
series of frequencies
N.=«r/2J .... (4)

CYLINDRICAL PIPES 171
A similar result is obtained in the case of a pipe closed at both
ends (f=0 at #=0 and x=l).
Pipe Closed at One End and Open at the Other. ' Closed
'
Pipe - In this case the initial pulse at the open end must traverse
the length of the pipe four times before the cycle is repeated; for
the reflection at the closed end takes place without change of
phase, and two reflections at the open end are necessary before the
reflected pulse is restored to the initial phase. The fundamental
frequency is therefore given by c/4l and the wave-length A =4=1.
At the closed end (x=0) $ =0, and at the open end (x=l) dg/dx=0,
whence from equation (3) A=0 and cos(nl/c)=0. Thus nl/c
=stt/2 where s is odd, 1, 3, 5, etc. (w=2ttN), representing a series
of odd harmonics of frequencies
Ns=sc/4:l (where s is an odd integer) . . (5)
Tubes of length /, 3/, 51, etc. (differing by A/2), will consequently
respond, in different modes, to the same note.
x x fc x:NANAOpen pipes.
Fig. 53
NANAClosed pipes.
A few of the possible modes of vibration of open and closed
pipes are indicated in fig. 53. It will be seen that the length of
the open pipe is twice that of a closed pipe of corresponding
frequency. The open pipe gives a complete harmonic series,
whereas the closed pipe only gives the odd harmonics of the series,
accounting for the difference in characteristic ' quality ' of the two
types of pipe.
End Correction - In the above theory we have supposed that
the open end of a pipe is a true antinode, and that the sound energy
in the pipe is perfectly reflected at the open ends. This is not
strictly correct, for some sound energy escapes at each reflection
and is radiated in the form of spherical waves from the end of the

172 AIR CAVITIES
pipe, e.g. the sound from an organ pipe rapidly dies away when the
air blast which excites it is cut off. The air beyond the open end
of the pipe is therefore in vibration and the effective length of the
pipe is greater than the actual length. The precise calculation of
the difference of length is a matter of considerable difficulty.
Helmholtz deduced a value R . 7r/4 as the open end correction
where R is the radius of the pipe, and Rayleigh obtained 0-82R
theoretically for a pipe with an infinite flange. Values of about
0-8R have been obtained experimentally for a pipe with a large
flange and 0-6R for an unflanged pipe. The end correction is
found experimentally by means of a pipe closed at one end by an
adjustable piston or water column, the successive lengths llf Z2 , etc.,
which resonate to the note of a tuning-fork being determined. If
there were no end correction, these lengths would be exactly
proportional to the odd numbers, i.e. we should have 3/1 =Z2 ,
5h=h> etc, exactly. Denoting the open end correction by 8, wehave approximately 3(/1 + 8)=(Z2+ 8), and so on, whence 8 maybe determined. Careful experiments give a value about 0-58R
for an unflanged pipe; whence A/4=/+0-58R for a closed pipe.
The end effect thus lowers the frequencies of all tones of a pipe.
The end correction depends slightly on the wave-length, thus the
various partials of the same pipe are not exactly a harmonic series.
The departure from such a series, however, is not sufficiently
great to be of practical importance.
Conical Pipes - The simple plane-wave theory which is
applicable to a parallel pipe is no longer valid when the pipe is
conical. In this case the wave travelling along the pipe will be
spherically divergent or convergent. Referring to the theory of
spherical waves (see p. 58, eqn. 11), the equation of wave-propaga-
tion is
d\rs)J\rs)dt2 dr 2
'K }
where r is the radius vector from the centre of disturbance, s the
condensation, and c the velocity of the sound wave (c2 =~E/p).
Assuming rs=a cos fit, this equation becomes
d2(rs)
*.v-*- • • •
(7)
the solution being given by
/'s=(Acos hB sin —)cos nt . (8)

CONICAL PIPES 173
This equation represents a system of stationary waves. Theconstants A and B are determined by the end conditions of the
pipe. We shall consider the two cases in which the cone is con-
tinued to the vertex, the base being either open or closed.
(a) Open Cone - At the open end r=l (the slant length), the
condensation s=0; at the vertex (r=0) the condensation s must
be finite whether the vertex is closed or open, therefore rs=Q.
Hence from equation (8) we have A=0 and B sin (nl/c) =0, which
gives nl/c=ni7Tywhere m is 1, 2, 3, etc. Since X=27rc/n=2l/m,
the frequency of the mthpartial is given by Nm =n/27T =mc/2l.
We see therefore that the harmonic series for a cone closed at the
vertex and open at the base is the same as in the case of an open
parallel pipe of length equal to the slant length of the cone.
(b) Closed Cone - At the closed ends where r =0 and r =1, the
condition to be fulfilled is ds/dr=0. This leads to the result,
tan (nl/c) =nl/c ... (9)
the solution of which is obtained graphically by plotting the graphs
of y =x and y= tan x, where x =nl/c. The intersections of the
straight line y =x with the tangent curves give the roots required.
In this way it is found that (wZ/ttt) =0, 1-43, 2-46, 3-47, 4-47, 5-48,
6-48 . . . etc. The frequency NTO of the mth tone is therefore
Nm =mc/2/, where m has the corresponding value of the numerical
series just given. The overtones are therefore not harmonic.
The antinodes, but not the nodes, are equidistant along the pipe.
(c) Truncated Cone (r=l1} and r=/2 at the ends) - A conical
truncated pipe with open ends has a fundamental frequency and
harmonic overtones like those for an open parallel pipe of length
equal to the slant length (l2—l±) of the conical pipe. The anti-
nodes are equidistant, but the nodes are not. If the cone is closed
at both ends, it may be shown that
tan-^-tan-^)^-/,) . . (10)
when lx =0, i.e. the cone of length l2 is continued to the vertex,
tan (nl2/c) =nl2/c which is the case of the closed cone already
mentioned. When lY and l2 are very great (the case of a truncated
cone of small angle), tan-1 (nl2jc) and tan-1 (nljc) are both oddmultiples of 77/2, so that (l2
— /x) is a multiple of A/2, in accordance
with the theory of parallel pipes.
Experiments on conical pipes have been made by Blaikley *
* Phil. Mag.,G9 p. 119, 1878.

174 AIR CAVITIES
and more recently by Webster.* The latter investigated the
pressure distribution in various types of conical horn consisting
of a parallel part closed at one end and attached to an open cone
at the other end. The experimental results were found to be in
approximate agreement with theory. Webster initiated the idea
of 'acoustic impedance' analogous to electrical impedance, and
developed the theory of pipes and cones from that standpoint.
Liquid-filled Pipes - As in the case of parallel columns of
gas, stationary waves may be set up in pipes filled with liquid.
The compressibility of a liquid is much less than that of a gas, and
is more nearly comparable with that of a solid. Consequently
the yielding of the walls of the tube cannot be neglected whenconsidering liquid-filled tubes. At a node in the liquid, where
the pressure variation is a maximum, there will be a swelling of the
walls of the tube, whilst at the antinode there is no such effect.
This swelling at the nodes produces a corresponding drop of the
pressure and a lowering of the velocity of wave-propagation in the
column of liquid, the lowering being smaller the thicker the tube.
Such an effect was first observed by Wertheim in 1847. Lamb fhas investigated the question theoretically, assuming that the
stresses in the tube adjust themselves so rapidly that the deforma-
tion has the statical value corresponding to the instantaneous
distribution of pressure in the liquid. Thus if c is the theoretical
value of sound velocity in a large bulk of the liquid and c the
actual velocity in a tube of small thickness h, then
c /c=Vl+2Ka/hE . . . (11)
where a is the internal radius of the tube, k the bulk modulus
of the liquid, and E Young's modulus for the material of the tube.
In the case where the walls are very thick c /c= V(/<:+/x)/jlc, where
/x is the coefficient of rigidity of the material of the tube. Thusif water (k=2-2 xlO 10
) is contained in a steel tube (E=2 xlO 12)
3 cm. radius and 3 mm. thick, we find c = l-lOc; if a similar
glass tube (E =6 x 10 11) were used c = 132c. Kundt and Lehmann
succeeded in obtaining 'dust' figures with fine iron filings in
resonant liquid columns just as in gases (see pp. 178 and 251).
In this way they determined the velocity of sound in liquids in
tubes of different diameters and thickness. Application of Lamb's
formula to their experimental values gives a mean value of 1436
* Nat. Acad. Set. Proc, 6, p. 316, 1920.
t Lamb, Dynamical Theory of Sound, p. 173.

ORGAN PIPES 175
metres/sec. at 19° C. for the velocity c of sound in open water,
in good agreement with other observations (see p. 246). Green *
has recently measured the velocity of sound in resonating liquid
columns contained in tubes, and has obtained results in agreement
with theory. Resonant vibrations may readily be maintained in
a liquid column contained in a tube which is closed at one end by
a steel diaphragm. The latter may be excited at any desired
frequency by means of a small electromagnet supplied with
alternating current from a valve oscillator. The resonance of
the liquid column will be observed directly by the ear, and the
yielding of the walls of the tube at the nodes in the liquid may be
examined by means of a stethoscope tube.
Hubbard and Loomis f have shown that the correction for
elasticity of the containing vessel, the tube, can be entirely
eliminated by using high-frequency sounds so that the wave-length
is small compared with the diameter of the pipe and the radiating
source. Using a piezo-electric quartz crystal (see p. 140) 10 cm.
in diameter and 1-2 cm. thick, sound waves of frequency 200,000 to
400,000 p.p. s. were generated, producing plane waves 3 to 8 mm. in
length. The velocities obtained in various liquids (distilled water,
solutions of NaCl, KC1, etc.) at different temperatures were in
good agreement with velocities determined by other observers for
such liquids in bulk. No difference in velocity could be detected
when the material and dimensions of the containing vessel were
varied (see also p. 260).
Examples of Vibrating Air Columns. Organ Pipes - Amongthe more familiar examples of resonant air columns is the organ
pipe. This usually takes the form of a cylindrical metal tube or
a wooden pipe of square section. One end of the tube is specially
constructed so that a suitable blast of air will set up resonant
vibrations in the air column. In the open 'flue' organ pipe the
blast of air impinges on a thin lip which forms the upper end of
the slit opening into the tube. When the blast is correctly
adjusted, a stable system of alternately spaced vortex filaments is
formed, one on each side of the air stream as it reaches the edge
of the slit (see also p. 205 on ^olian tones). At a certain minimumblast pressure impulses due to these vortices, constituting the' edge tone,' are of such a frequency that resonance is set up in
the air column and the pipe 'speaks' with its fundamental tone.
The higher harmonics of the pipe are excited by increasing the
* Green, Phil. Mag., 45, May 1923.
f Nature, Aug. 6, 1927 ; and Phil. Mag., 5, p. 1177, 1928.

176 AIR CAVITIES
power of the blast. In another form, known as the 'reed pipe,'
the blast of air impinges on a reed of metal which controls the
amount of air entering the pipe. The latter is usually conical,
with the reed clamped at the narrow end. The reed and the pipe
are tuned to the same fundamental frequency; the inharmonic
overtones of the reed consequently do not coincide with the
harmonic overtones of the pipe. The air blast sets the reed in
vibration and puffs of air are admitted to the pipe which is thereby
set into resonance. It should be noted, however, that the reed
cannot be regarded as a simple vibrating system apart from the
air column, for its motion is influenced considerably by the air
blast and by the resonance in the pipe. As we have seen, the
length of a vibrating column of gas is subject to a correction at
an open end. In the case of actual organ pipes, however,
Cavaille-Coll has shown that the simple formulae (see equations
4 and 5) for parallel pipes, after application of a correction 0-6R
at open ends, do not agree with observation of actual pipes. It
was found, for example, that a correction as much as 3-3R was
required to the length of a pipe open at both ends. This dis-
crepancy is partly due to the nature of the blast which excites the
pipe into resonant vibration, but the principal contribution is due
to the fact that the lower or ' blown ' end of the pipe is very muchless 'open' than the upper end. Rayleigh * remarks that if a
sensible correction (0-6R) on account of deficient 'openness' is
required at the upper end, a much more important correction is
necessary at the lower end, which is partially closed. His experi-
mental observations indicate that at practical pressures the pitch
of a pipe as sounded by wind is higher than its natural resonant
note, and that the large correction to the length found by Cavaille-
Coll is not attributable to the blast, but to the contracted character
of the lower end of the pipe, which is regarded as ' open ' in the
elementary theory. The rise of pitch due to the blast increases
with pressure, a certain pipe having its frequency raised by
10 p.p.s. due to a rise of blowing pressure from 1 inch to 4 inches
of water. With much larger pressure-increases the pipe was' over blown ' and emitted the octave of its fundamental tone.
Pipes varying in length from 20 metres to 0-5 mm., and in
frequency from 8 p.p.s. to 100,000 p.p.s., have been constructed
for various purposes. Fifes, flutes, oboes, whistles, etc., are all
examples of musical instruments employing resonant air columns.
f
* Phil. Mag., 3, p. 462, 1877, and 13, p. 340, 1882 ; and Sound, 2,
p.^218. t See Millar, Science of Musical Sounds.

HIGH-FREQUENCY PIPES 177
An interesting technical application of resonance in pipes is found
in an apparatus for detecting fire-damp in mines. Two similar
pipes are blown simultaneously, one with pure air (from a con-
tainer), the other with the 'doubtful' air of the mine. When the
'mine air' is pure the pipes are in tune, but a slight impurity
affects the velocity and therefore the resonant frequency slightly,
and beats are observed when the pipes are sounded together.
The number of beats per second serves as a measure of the extent
of impurity in the air of the mine. We shall have occasion to
refer later to the application of the phenomena of resonance in
pipes to the measurement of velocity of sound in gases and liquids,
and the determination of y the ratio of specific heats of gases (see
Kundt's Tube, p. 240).
High-Frequency Sounds from Pipes. Galton's Whistle.
Hartmann and Trolle's Air-Jet Generator - In order to deter-
mine the upper limit of audibility in human beings and in animals,
Galton devised a miniature organ pipe in the form of a whistle.
By means of a screw piston the length of the air column in the
pipe, and consequently the pitch of the note, could be varied.
In a later form of this whistle designed by Edelman * the pipe is
blown from an annular nozzle fitted with a screw to vary its
distance from the edge of the pipe. By suitable adjustment of
this distance and the pressure of the air blast the little ' pipe ' is
set into resonant vibration at a frequency corresponding to its
length and diameter. Frequencies well above the limit of audi-
bility can be produced by means of this whistle, such sounds
being easily detected by a sensitive flame (see p. 371). Hartmannand Trolle f have pro-
duced a powerful super-
sonic source of sound
on this principle. Thehigh-pressure air-jet
they employ has a
velocity greater than that
of sound. The air breaks
up into a regular series
Of pulses as It leaves the FlG 54_Schlieren photograph showing struc-
jet. When these pulses ture of jet of Hartmann and Trolle's Air-Jet
fall on the open mouth Generator
of the cylindrical pipe 'oscillator,' resonance is set up at the
correct distance (see p. 207 on Jet-tones) and the pipe emits
* Ann. derPhysik, p. 2, 1900. f Journ. Sci.Instrs.,p. 101, etc., Jan. 1927.
12

i 7 8 AIR CAVITIES
powerful supersonic vibrations as high as 100,000 p.p.s. Thewave-length of the vibrations was measured directly by spark
photographs revealing the shadows of the high-pressure nodes,
and also by means of the dust figures in Kundt's tubes
(see p. 239). With jets of hydrogen, the frequencies are found
to be about 3-5 times as high as in air, in accordance with
theory. The air-jet generator with its resonant air column is a
very suitable device for producing supersonic vibrations of high
intensity, either for experimental purposes or for signalling. The
Fig. 55—Hartmann and Trolle's Air-Jet Generator
structure of the jet is shown in fig. 54, obtained by the spark-
shadow (Schlieren) method. Fig. 55 indicates the arrangement
of jet and pipe. Even at the highest frequencies, greater than
100,000 p.p.s., it was found that the relation A/4=/+0-6R was
valid for a closed pipe (see p. 172).
Experimental Observation of the Vibrations in Pipes - Themanner in which air vibrates in a pipe can be examined in a
number of different ways, depending on the physical quantity
under consideration, e.g. displacement, pressure, density, or
temperature variation.
(a) Kundt's dust figures. One of the earliest methods, and one
which has proved most fruitful of results, is due to Kundt (1866).
To demonstrate the presence of stationary waves in a horizontal
glass tube he devised the method of sprinkling the interior of the
tube with fine, dry dust, e.g. lycopodium seed, fine sand, or cork
dust. This dust is immediately thrown into a recurring pattern
when the sound waves are excited in the gas contained in the tube.
The vibrations may be produced in a number of ways, e.g. by set-
ting up longitudinal vibrations in the glass tube itself by stroking
with a wet cloth, or by means of an independent vibrating rod with
a free end inserted in one end of the glass tube. A more con-
venient method employs as a source of vibration a telephone or
'loud speaker' connected to a valve oscillator of controllable fre-
quency (see fig. 56). At resonance, i.e. when the length of the gas

KUNDT'S DUST TUBE 179
column corresponds to a whole multiple of half wave-lengths of
the sound employed, the dust is thrown into violent vibration and
collects into equidistant little heaps at the nodes.
t
(1)
=*Dust heaps (2)
iryEnciting rod
Glass TubeLoud Speaker
/Vibrating diaphragm
(3)
Fig. 56
A.C. of variable
frequency
As we shall see later (p. 240), this simple method not only serves
to demonstrate the presence of nodes and antinodes in the gas,
but also gives a measure of the velocity of sound in the gas if the
frequency of vibration is known. For various reasons, which weshall have to consider when dealing with the measurement of sound
velocity by this method, a number of modified forms of Kundt's
tube have been developed. The simple apparatus to which wehave referred is, however, very effective in demonstrating the
state of vibration of the resonating gas column contained in the
tube.
In addition to the regular 'half-wave' pattern of dust heaps
at the nodal points, the dust tube may exhibit a regular series of
fine striations, like ribs across the bottom of the tube. This rib-
like structure is seen to consist of thin laminae formed of small
dust particles in vigorous vibration. The effect increases in magni-
tude towards the antinodes and disappears entirely at the nodes.
Konig's explanation of the formation of these striations is given
on p. 434. More recently E. N. da C. Andrade and S. K. Lewer *
have obtained greatly enhanced effects of this nature which are of
considerable interest. They employ a telephone diaphragm (a
loud-speaker unit) to excite the dust tube into resonance. Theloud speaker is supplied with alternating current of fairly pure
* Nature, 9th Nov. 1929; see also Journ. of Set. Instrs., 7, p. 52, Feb. 1930.

180 AIR CAVITIES
wave-form from a valve oscillator, the frequency of which is
adjusted to coincide with one of the resonant frequencies of the
tube. The striations to which we have just referred are readily
obtained, and in addition to this a new phenomenon is noticed
when the vibration is very vigorous. The striation effect
increases toward the antinode which, in this case, is marked by a
clearly defined disc of dust particles extending across the tube like
a barrier. These antinodal discs are of surprising sharpness, as
will be seen from fig. 57 (a photograph of the tube in resonance).
The photographs reproduced in fig. 57 (a) and (b) show a disc
as seen from a horizontal direction normal to the axis of the tube,
and a disc viewed obliquely. The striations are also clearly
shown. Measurements of the antinodal distances between the
discs permit of the determination of the velocity of sound (see
p. 242) to be made with considerable precision (to one part in a
thousand). The photographs also reveal the behaviour of very
small particles which take up the full amplitude of the air vibra-
tion, and appear as little lines of light when strongly illuminated.
These lines, shown in fig. 57 (c), have a length of several milli-
metres when the tube is sounding its fundamental with one end
open. The photograph shows the vibration of both large and
small particles, the larger ones not attaining the full amplitude of
the air vibration. The effect of a drift of some of the heavier
particles is clearly visible as a sinusoidal ' oscillograph ' record of
the vibration. Measurement of the amplitude of the vibration
of the smallest particles may yield important information relative
to the motion of the air in the tube.
(b) Konig's Manometric Capsule. Pressure amplitude. The con-
dition ofthe air in the interior of a vertical organ pipe was investigated
experimentally by Savart (1823), who lowered into the tube a small
stretched membrane on which a little fine, dry sand was sprinkled.
Near a node the sand remained undisturbed, but as a loop was
approached it danced with increasing vigour. The use of a thin
membrane to detect the presence of vibrations in the air column
was developed by Konig. In this method, the vibration is indi-
cated by a small gas flame fed through a tube in communication
with a small cavity called a manometric capsule. One wall of
this cavity is formed by a tightly stretched membrane of parch-
ment or rubber on which the sound waves are allowed to fall.
The vibrations of the membrane vary the volume of the capsule
and set up unsteadiness in the gas supply. The flame, which
serves as indicator, therefore rises and falls with the vibrations of

-f^-
"2 S.
-a .2
if
Oj "ii~
C n<u
£ a<o
oPm "3
(Ufc
3 w
p3 £Q o
|
>>
r^ OJ
LO
oO °
>>
Uh m

l82 AIR CAVITIES
Mirror
the membrane. The movements of the flame are readily observed
by means of a revolving mirror, the appearance being a serrated
band of light when in vibration. In the application to organ pipes,
a number of small manometric capsules are mounted at intervals
in the wall of the pipe in such a manner that the membranes are
in contact with the vibrating gas contained in the pipe. Thechange in the flame, observed in the revolving mirror, is very
pronounced as the capsule is moved from a node to an antinode.
Konig also made direct aural exploration inside the pipe by
means of a narrow 'exploring' tube, which could be pushed to
and fro along the axis of the pipe. This narrow tube, connected
to the ear, was designed so as not to interfere with the normal
vibrations of the pipe. The presence of nodes and loops in the
pipe were observed aurally without difficulty.
A simplified and more useful form of Konig's manometric
capsule has recently been used by E. G. Richardson * to explore
the pressure vibrations in pipes and other
forms of resonating air cavities. Thecapsule shown in fig. 58a widens out
conically from a short cylindrical portion
to a flange which supports a tightly
stretched membrane of sheet rubber
having a high natural frequency com-
pared with the range of frequencies of
the pipe under investigation. The flame is now replaced by a
small mirror (about 1 mm. square) attached by rubber cement to a
point of the membrane midway between the centre and the edge.
The vibrations of the membrane give a slight angular motion to
the mirror and consequently
to a beam of light reflected
from it to a distant scale.
Pressure variations inside the
capsule cause the spot of
light to be drawn out into ^ 20
a band. The device is call-Q ^ o w /1>0 j0in,
brated either Statically, by Pressure Change (dynes, sq.cm.)
applying various small, Fig. 58B—Calibration Curve of Mano-
steady pressures (measuredmetric Capsule (Rlchards™)
by a water manometer), or dynamically by causing a little
piston to oscillate with appropriate frequency and amplitude
in the cylindrical portion of the capsule. The manometric
* Proc. Phys. Soc, May 1928.
Rubbermembrane
Fig. 58a—ManometricCapsule (Richardson)
80
60
a 40

AMPLITUDE OF VIBRATION 183
capsule thereby becomes a useful metrical device for measuring
small alternating pressure amplitudes (see fig. 58b). The narrow
cylindrical portion is inserted at the desired point in the pipe or
resonator and the pressure amplitude read off as the width of the
band on the scale. With this simple apparatus the nodes and
antinodes in the pipe may be easily demonstrated.
(c) Displacement and Velocity Amplitudes. To obtain complete
information relative to the condition of the air in a pipe we must
know not only the pressure amplitude but also the displacement
or velocity amplitude. Measurements of the latter quantity have
Upper lip
of pipe
£ 10 20 30 40 50 60 70 80 cms.
Fig. 59A—Pressure Amplitude along a Stopped Pipe (Richardson)
been made by means of a Tucker hot wire ' microphone ' (see p. 402)
or similar device. An electrically heated platinum wire (say
0-001 cm. diameter) is cooled by a current of air, whether direct
or alternating. The cooling of the wire, as indicated by its change
of electrical resistance, is a measure of the velocity of the air
current. By measuring the change of resistance of a small heated
wire placed at successive points along the axis' of the pipe,
vmax
20
16Upper lip
of pipe
20 40 60 cms.
Richardson * obtained curves
(see fig. 59b) showing the
velocity and displacement am-plitudes in pipes and Helm-holtz resonators. Combining
these results with measure-
ments of the pressure am-plitude (see fig. 59a), using
the manometric capsule men-tioned above, he was able to
o
Fig. 59B—Displacement or VelocityAmplitude along a Stopped Pipe determine the acoustic impe-(Richardson)
dance Qr ^ mQuth of guch
resonators and compare it with theoretical deductions.
(d) Density and Temperature changes in a vibrating pipe. Thepressure and displacement fluctuations in a vibrating air columnare, of course, attended by corresponding changes of density andtemperature. The compressions and rarefactions take place
* Proc. Roy. Soc, 112, p. 521, 1926.

1 84 AIR CAVITIES
adiabatically, and the temperature at any point in the pipe must
therefore fluctuate in a similar manner. The changes of density
at the node in a vibrating gas column closed at one end were
demonstrated directly by Topler and Boltzmann * (1870), using
the principle of the Jamin interferometer. The upper, closed end
of an organ pipe was fitted with sides of optical glass which pro-
jected beyond the closed end. A beam of light passed through
the glass sides partly inside the pipe (near the closed end) and
partly outside. By well-known optical arrangements interference
was produced between the two parts of the beam. The changes
of density of the air inside the pipe when vibrating resulted in a
change of optical path of one part of the beam, with consequent
displacement of the interference bands. These bands therefore
oscillated in synchronism with the density fluctuations near the
node in the pipe. The fluctuations were observed stroboscopi-
cally and the amplitude measured, from which the change of
density could be inferred. Raps f employed the method later to
investigate the partials of an organ pipe, and recorded the displace-
ments of the interference bands photographically. The photo-
graphs show clearly how the first overtone, which is initially
absent, gradually increases in strength as the wind pressure is
increased. Careful measurements of the temperature fluctuations
in the stationary waves of a resonating pipe have been maderecently by Friese and Waetzmann.J An air column a metre
long was set in resonant vibration by a telephone diaphragm
vibrating at the corresponding frequency. The temperature of
the nodes and loops was ascertained by an electrical resistance
thermometer and valve amplifier. The wire of the thermometer,
0004 mm. thick and 18 mm. long, was carried at the end of a
thin glass tube arranged to slide on the axis of the resonating pipe.
Absolute values were found, after applying suitable corrections
for the lag in the electrical thermometer, for the temperature-
amplitudes at the nodes, whence the sound intensities were calcu-
lated. Simultaneous measurements of pressure amplitude were
made by a membrane manometer. The temperature amplitudes
calculated from S9=(y— l)d . Sp/yp agreed well with those
observed directly with the resistance thermometer, over a range
of frequencies 400 to 1000 p.p.s.
* Pogg. Ann., 141, p. 321, 1870.
f Ann. d. Physik, 50, p. 193, 1891 ; see also C. Barus, Interferometry
Applied to Acoustics, etc., Carnegie Institution, Washington.
t Zeits. f. Physik, 29, 2, pp. 110-114, 1924 ; and 34, 2-3, pp. 131-141,1925.

AIR CAVITY RESONATORS 185
Air Cavity Resonators (Helmholtz Type)
Another type of resonator which may be regarded as distinct
from a pipe is that due to Helmholtz and which bears his name.
In this type the air cavity is almost completely enclosed, with the
result that only a very small proportion of its energy is radiated
into the medium. The damping is therefore very small and the
tuning is very sharp. For these reasons it is particularly suitable
as a detector of sound waves of a definite frequency. It is quite
unsuitable as a source of sound, as the mechanical coupling
between the air contained in the cavity and the air outside is very
weak, whereas in the organ pipe the coupling is much stronger.
It must be regarded therefore as particularly suitable as a
sharply tuned detector of sound waves of feeble intensity. Asmall vibration once started in the air cavity persists for a consider-
able time on account of the small damping, and the amplitude of
vibration in the 'neck' of the resonator may be many times
greater than that in the surrounding medium. Helmholtz showed
that the vibrations throughout the air cavity were practically uniform
and negligible compared with the vibrations in the ' neck '
—
i.e. at the
opening connecting the air cavity to the outer air. Two forms of
Helmholtz resonator illustrated in fig. 60 (a) and (b) are in general
use. In one of these (a)
the length of the neck is
negligible compared with
its diameter, whereas in the
other (b) the length is com-
parable with, or greater
than, the diameter. The IG-
exact form of the cavity is unimportant, it may be spherical or
cylindrical, provided the smallest dimension is considerably greater
than the dimensions of the aperture. Rayleigh, in developing the
theory of such resonators, regards the air in the aperture as acting
like a reciprocating piston compressing and rarefying the air con-
tained in the cavity of the resonator. It is assumed also that the
wave-length A of the vibration in free air is large compared with
the dimensions of the cavity. This implies that at any instant the
condensation will be uniform throughout the cavity. The system
in its simplest form is equivalent to a mass attached to a spring,
the air-piston in the neck being regarded as the mass and the air in
the cavity the spring. If the length and sectional area of the neck
are / and S respectively, and p the normal density of the gas in

186 AIR CAVITIES
the neck, then the mass M of the 'piston' will be plS. For
adiabatic changes of volume in the cavity, we have /wY =const.,
where p and v are the pressure and volume respectively and y is
the ratio of the specific heats. Then
dp/dv = — yp/v or 8p= — ypSv/v .
The total force acting on the piston for a small change of volume
is Sp . S, and the change of volume Sv for unit displacement of
the piston is S. Thus the restoring force /per unit displacement
of the piston is equal to ~ypS 2/v or ES 2/v since E, the elasticity
of the gas, is equal to yp. The equation of undamped motion of
the piston is
M^Aft2+/£=0,
which indicates a frequency of oscillation N2ttM M'
N=~J-^- or N=-J~ . . (12)2ttV v . plS 2ttV h)
K'
since the velocity c = VlL/p. The ratio S//, of the dimensions of
a length, is called the ' conductivity ' k of the neck. For a circular
aperture in a thin wall (/=0 or very small) Rayleigh shows that
the conductivity k is equal to the diameter, whence from (12)
2ttN=c\/2ciIv . . . (13)
It is important to observe that the frequency, involving the
velocity c, depends on the nature of the gas in the neck and not
on that filling the cavity ; for the inertia of the gas in the cavity
does not come into play and the compressibility of all gases is
approximately the same. Usually, of course, the gas is the same
throughout, and this distinction does not arise. Sondhauss and
Helmholtz obtained experimentally values of frequency which
were always slightly lower than the theoretical values given above.
The difference may be ascribed to the ' open end ' effect to which
we have referred in the case of pipes. Thus in the above ex-
pression for the frequency, / must be increased to (/+0-6R),
where R is the radius of the neck.
It is understood, of course, that the frequency N refers only
to the fundamental tone of the resonator. The overtones are
relatively very high, and the simple theory given above would not
apply since it would no longer be possible to neglect the inertia
of the gas contained in the cavity.

PIPE AND RESONATOR COMPARED 187
The modulus of decay (or damping coefficient) of the vibrations
in a Helmholtz resonator (due to radiation) is readily shown to be
equal to Sttv/k 2c where k is the 'conductivity' of the neck. In
the case of a resonator with a circular opening of radius a (when
k =2a) the modulus of decay therefore varies directly as the volume
of the cavity and inversely as the area of the neck. This indicates
that the vibrations have the greatest persistence, least energy being
radiated when the volume of the cavity is large and the area of
the neck is small, i.e. when the frequency of the resonator is low.
Relation between Pipe and Helmholtz Resonator - Hitherto
we have regarded the resonant conditions of the pipe and the
resonator as entirely different. In the pipe the length is com-
parable with A and the displacement varies sinusoidally along the
column of gas due to stationary waves. In the resonator the
dimensions of the cavity are regarded as small compared with A,
and the displacement amplitude is everywhere negligible except
in the neck, which is small in diameter compared with the dimen-
sions of the cavity. Recently E. G. Richardson # has drawn
attention to the fact that these ' classical ' theories of the pipe and
resonator are mutually exclusive, and has proposed an alternative
method of treatment which results in complete reconciliation.
He shows that it is possible to obtain a formula which covers all
cases of resonant air cavities, by employing a method based on
acoustic impedance. The fundamental frequency N of a pipe
of length L is given by NL=constant, and for a cylindrical
resonator, v oc L, we have N2L=constant (see equation (12)).
These formulae fit the extreme conditions, provided a suitable
end correction 0-6R is applied to the length of the pipe, but
transition cases between a pipe and a 'resonator' are not included.
From deductions relating to the 'impedance' of the cylindrical
pipe and the orifice, Richardson arrives at the formula
tankL = K/kA . . . . (14)
where k=2irN/c, k is the conductivity of the orifice (=S//) andA is the area of the section of the cylinder. For the ideal pipe
the conductivity k of the orifice is infinite, whence tan kL = oc,
which gives NL=constant. When k is small, however, so that
tan &L=&L nearly, we obtain the resonator formula N 2L=constant. Equation (14) therefore embraces all cases of resonant
cylindrical air cavities, of whatever length and diameter of opening# E. G. Richardson, Proc. Phys. Soc, 40, p. 206, May 1928 ; see also
E. T. Hanson, Proc. Phys. Soc, 42, p. 43, Feb. 1930.

188 AIR CAVITIES
compared with the wave-length A. When the orifice is equal to
the cross-section of the pipe itself, the difference in the value of
L from equation (14) (with the appropriate values of k and k), andthe 'ideal' value given by tan kL = *> is the end-correction of the
pipe. The assumption made by Helmholtz that the motion is
confined to the neck was verified experimentally by Richardson
by means of a 'hot wire' detector (2 cm. of 0-001 cm. platinum
electrically heated in a Wheatstone's bridge circuit). Near the
neck of the resonator a large cooling effect was observed, indicating
a large amplitude of vibration, whereas inside the cavity the
cooling effect, and consequently the amplitude, was negligible.
Combining the displacement-amplitude measurements, using the
hot wire 'anemometer,' with a corresponding set of pressure
measurements, using a calibrated manometer capsule, direct
values of the acoustic impedance of various orifices were obtained.
The maxima and minima of displacement and pressure amplitudes
were observed in a similar manner inside a sounding organ pipe.*
Use of Helmholtz Resonators in Sound Analysis - Thesmallness of the damping and sharpness of tuning in these
resonators renders them extremely sensitive detectors of sounds
of a particular frequency. Helmholtz used a graduated series of
resonators of various volumes and areas of neck in his investi-
gations on the quality of musical notes, in particular to determine
which partials were present in a complex musical sound. Tocover a moderate range of frequency, however, a large number of
resonators is required. It is customary, therefore, to use re-
sonators of continuously variable volume. This may be achieved
by means of a sliding piston or a column of water of variable
height, forming the closed end of a cylindrical cavity.f Resonance
may be detected in a number of ways. In the simplest arrange-
ment the small open ' pip ' at the base of the resonator is connected
either directly, or by means of a tube, to the ear. The resonator
'speaks' when a sound of relatively feeble intensity falls on the
open end. Alternatively the open end of a small manometric
capsule, previously described (see p. 182), is inserted into the 'pip
'
of the resonator. A very sensitive method of detection, giving
metrical results, employs the hot-wire microphone of Tucker and
Paris. This is described in detail on p. 402. Another method
of observing the resonance of an air cavity is that employed by
* E. G. Richardson, Proc. Roy. Soc, 112, p. 521, 1926 ; and Proc.
Phys. Soc, 40, p. 206, May 1928.
f A. Fage, Proc. Roy. Soc, p. 107, 1925.

DOUBLE RESONATORS 189
Fournier d'Albe. A thin 'reed,' consisting of a 'slip' of mica
clamped at one end, is mounted across the mouth; the 'reed'
being tuned carefully to the frequency of the resonator. At
resonance, the vibrations of the reed become very vigorous and
are indicated by a spot of light reflected from a silvered spot on
the free end of the mica strip. A series of such resonators of
graded frequencies may be used in conjunction with the same
source of light and scale. On account of the double-tuning the
resonance may be very sharp. The arrangement responds only
to the fundamental of the cavity, the overtones of the cavity and
the reed being always in disagreement.
Double Resonators - In order to obtain a further increase
of sensitiveness Boys * suggested the use of a double resonator
consisting of a closed pipe at the end of which was fitted a Helm-holtz resonator in tune with it. Rayleigh f worked out the theory
of such a double resonator, and Paris J has recently extended the
theory to include other forms, e.g. (1) a pair of tunable Helmholtz
resonators, (2) a conical horn and a Helmholtz resonator, making
allowance for damping of the vibrations in the various parts of the
system. As generally used, the resonator consists of two tunable
cylindrical vessels connected by a short neck. When the separate
frequencies are equal, the sensitivity of the double resonator is
considerably increased by making the outer resonator of large
volume compared with the inner one. Thus Rayleigh § shows
that the 'air flow' per unit area in the two necks is in the ratio
(v/v')*' where v and v' are the volumes of the outer and the inner
cavities. The double resonator has an important application whenused in conjunction with the hot-wire microphone or the Rayleigh
disc (see pp. 402 and 426) in the measurement of sound intensi-
ties. The device is very sensitive and the tuning very sharp.
The intensity of sounds which are hardly perceptible to the ear
can be measured, provided they are in tune with the resonator.
The selectiveness of the resonator is an important feature when it
is desired to measure the intensity of a sound of a particular
frequency amidst a medley of sounds of other frequencies. This
selectiveness carries with it, however, the corresponding dis-
advantage that a large number of resonators are required to cover
a moderate range of frequency.
* Boys, Nature, 42, p. 604, 1890.
t Rayleigh, Sound, 2, p. 310, and 1, p. 45 ; Phil. Mag., 3, p. 338, 1902.
% Paris, Proc. Roy. Soc, A, 101, 1922; and Phil. Mag., p. 769, Nov.
1924, and p. 751, Oct. 1926. § Rayleigh, Phil. Mag., 2, 751, 1918.

190 AIR CAVITIES
By a suitable choice of frequencies for the two components of
the double resonator, however, and by sacrificing a little sensi-
tivity, it is possible to construct resonators which respond strongly
to a relatively wide range of frequencies. This is of considerable
practical importance in cases when the frequency of the source is
liable to small fluctuations (see p. 406).
Absorption of Sound by Resonators. Quincke Filters -
The action of a resonator in the neighbourhood of a source of
sound in tune with it is very important. A well-tuned resonator
may absorb energy from a considerable area of wave-front in the
sound field in which it is placed, diverting energy from regions
which would otherwise receive the sound waves. This 'absorp-
tion ' may extend over an area of the order A2/tt for a resonator of
small dimensions compared with a wave-length A of the incident
sound.* Quincke (1866) employed resonators to stop tones of
definite pitch from reaching the ear, the arrangement acting as a
sound filter. The complex sound to be 'filtered' is led through
a short main pipe which carries a side tube fitted with a sliding
piston. The piston serves to tune the side tube (length /=A/4)
to any frequency N it is desired to absorb from the main pipe.
Using a succession of such tuned side-tubes a corresponding
number of tones may be filtered out of the sound passing through
the main pipe. We shall have occasion to refer later (p. 457) to
the general question of sound filters, which has recently developed
into a subject of considerable practical importance.
Reinforcement of Sound by Resonators - When a vibrating
tuning-fork is brought near to the open end of an air column or
cavity tuned to the same frequency, the intensity of the sound
reaching the ear is greatly increased. It is important to consider
why the sound apparently emitted by the resonator should exceed
that which would be produced by the tuning-fork alone. Clearly
the sound-energy does not originate in the resonator. Anyincrease of intensity produced by the resonator must be due to
some reaction between it and the source of vibrations. If, as in
the case of the tuning-fork, the source is not maintained, the
presence of the resonator will cause a more rapid drainage of
energy from the source, i.e. the vibrations of the fork will be more
rapidly damped when the resonator is present than otherwise.
The increased energy output is therefore the indirect consequence
of the presence of the resonator, which clearly can supply no energy
* See p. 376 ; also Lamb, Sound, p. 275.

RESONATORS 191
itself. The energy emission W from 'simple' and 'double'
sources is given in equations (35) to (40) (pp. 63 to 64). A simple
source, for example a vibrating diaphragm, exposed to the mediumon one side only, emits sound energy at a greater rate than the
corresponding double source, a diaphragm exposed to the mediumon both sides. Lamb * shows that the presence of the resonator
produces an increase of energy emission \jk2b 2 times that of a simple
source, where £=277/A and b is the distance (assumed small com-
pared with A/2 71) of the source from the aperture of the resonator.
In the case of a double source the emission induced by the resonator
is l/&4£4 times that due to the source alone. That is, the augmenta-
tion of sound emission is proportionately much greater in the case
of the double source. This is due to the relatively small efficiency
of a double source as compared with a simple source in radiating
sound energy (see p. 65). Considering a simple 'point' source
near the mouth of a resonator in tune with it, we see that the
intensity at a distant point will be increased in the ratio l/k2b 2
(where kb is a small quantity). The introduction of the resonator
near the source provides a means whereby the pressure-variation
8p can produce a large particle velocity i with which it is in phase,
thus increasing the radiating power of the source.f In other
words, the tuned resonator decreases the radiation resistance Rand neutralises the inertia reactance of the source. The power
radiated (S/>) 2/2R (see equation 24, p. 54) may therefore be greatly
increased by diminishing R by means of the resonator. The most
simple and effective demonstration of the reinforcement of sound
by means of a resonator is that of the tuning-fork and tuned air
cavity (a bottle containing the requisite amount of water). In
considering the use of resonators in conjunction with maintained
sources of sound, it is important to bear in mind certain points
mentioned above, e.g. the action of a resonator is not to magnify
the sound after it has been produced by the source, but to enable
the latter to develop a greater sound output. This increased
output must either be supplied directly to the source or mustoriginate in an increased efficiency of radiation. The advantage
to be gained by using a resonator may be considerable if the source
is initially inefficient {e.g. a tuning-fork, or a diaphragm electro-
magnetically excited in air); with an efficient source, however,
there are better methods of increasing radiation efficiency. J
* Lamb, Sound, pp. 273-274; see also Rayleigh, 2, pp. 211-215.
t Rayleigh, Sound, 2, pp. 212-213.
X Hart and Smith, Principles of Sound Signalling, pp. 30-32 and 91-92.

192 AIR CAVITIES
Trumpets and Horns, (a) Intensifying Properties - A little
consideration will show that the difference between a resonator
and a reflector is not so great as might be supposed. A resonator
receiving sound waves in tune with it absorbs energy from the
surrounding medium and re-emits a part of this energy, thus
behaving as a secondary source of sound. In this respect all
resonators may be regarded as reflectors, for without such reflection
(or re-emission) resonance could not take place. A tuned conical
pipe or trumpet behaves, in a similar manner, like a resonator and
reflector. Again, a parabolic reflector will resonate to sounds of
suitable frequencies. * It will be seen, therefore, that the transition
from a resonant air cavity to a reflector is gradual, and that a
trumpet or a horn resembles both in that it resonates, reflects, and
possesses directional properties when the aperture is sufficiently
large.
When a trumpet or horn is used in the transmission of sound
from a small source, as in the megaphone, gramophone, or electrical
'loud-speaker,' the source is placed in a small opening near the
vertex. In this position it works at maximum efficiency, since the
radiation is emitted in the form of plane waves, the radiation
resistance of a piston source being a maximum under these con-
ditions. The function of the flared trumpet is to replace the
small source by a large, nearly flat, source working at the same rate,
this large source of nearly plane waves radiating into the surround-
ing medium with an efficiency approximating to that for plane
waves. Thus in a well- designed horn there is reflection from the
open end only at low frequencies.! Rayleigh \ shows in the case
of transmission from a conical trumpet, that the amplitude of the
sound received at a distant point varies inversely as the solid angle
a> of the cone, and the intensity as a>2
. If the diameter of the open
end is small compared with a wave-length a large proportion of
the sound energy is reflected (as at the open end of a pipe), with a
consequent reduction in the intensity of the sound radiated and
the formation of stationary waves in the horn itself. By increasing
the length of the cone, and consequently the diameter of the open
end, this reflection will be reduced and will become negligible
when the diameter of the open end is large compared with a wave-
length. Neglecting viscous effects, therefore, it would be possible
by diminishing the solid angle co of the cone to obtain sound of
* Hart and Smith, Principles of Sound Signalling, pp. 30-32 and 91-92.
f The theory of conical and exponential horns is developed by Crandall
in Theory of Vibrating Systems, pp. 152-174. J Sound, 2, p. 113.

TRUMPETS AND HORNS 193
any desired intensity and at the same time, by lengthening the
cone, to transfer this energy without loss to the surrounding
medium. Unfortunately, the practical utility of this form of horn
is limited, for a conical horn of finite length and small angle will
have little 'flare' and will therefore have serious end reflection,
and consequent resonances similar to those of parallel pipes. Thedifficulty is surmounted in practice by the use of the ' flared ' horn
of exponentially increasing cross-section. The characteristics of
the exponential horn are very good even at comparatively low
frequencies, giving ample justification for its use in ' loud-speakers,5
gramophones,* etc.
(b) Directive Properties - It is often supposed that a conical
speaking-trumpet prevents the sound which enters at the apex
from diverging outside the limits of a cone forming a continuation
of the trumpet, and that the whole of the sound energy falling on
the open mouth of a conical receiving trumpet is concentrated at
the apex. In general, both these suppositions are erroneous. Thereflecting properties of a trumpet which, as we have seen, are
dependent on the dimensions of the trumpet are sufficient evidence
that only a part of the incident energy reaches the apex of a
receiving trumpet. The directive properties of a transmitting
trumpet are also dependent on its dimensions. As Rayleigh has
shown, the problem is essentially one of diffraction, analogous to
the propagation of plane waves of light through a circular aperture,
regarding the open end of the trumpet as a source of sound in
accordance with Huyghens' principle. The problem is almost
identical with that of the radiation of sound from a piston which
we have already discussed (pp. 147 to 151). On the axis of the
trumpet the sound intensity is always a maximum, for all the
disturbances from the various elementary areas constituting the
plane of the opening arrive in the same phase. In directions
inclined to the axis the intensity is less, diminishing steadily to
zero when the difference in distance between the nearest and
farthest elements of the trumpet opening is rather more than half
a wave-length. In a direction still more inclined, the sound
increases again to an intensity 0-017 of that on the axis, passing
through successive zero and diminishing maxima values as the
inclination increases. The primary and secondary maxima, with
intermediate zero values of intensity, correspond identically with
the various bright and dark diffraction rings in the analogous
optical case. The angle 6 at which the first silence occurs, i.e.
* Crandall, loc. cit.
13

194 AIR CAVITIES
the semi-angle of the cone which delimits the primary beam, is
sin-1
(0-61 A/R) (see p. 149). Thus the primary or central beamwill be confined to a cone of small angle when the radius R of the
opening of the trumpet is large compared with a wave-length A
of the sound emitted, i.e. the directionality will be sharp when the
frequency of the sound is high. The polar distribution of amplitude
and intensity is shown in fig. 49, p. 149.
When the radius R is less than a quarter wave-length the dis-
turbances from the elementary areas of the opening combine
without much opposition in phase, and the intensity is nearly the
same in all directions—that is, the source, including the trumpet,
approximates to a point source and is practically non-directional.
The directional condition, that R/A is large, is not usually achieved
in speaking-trumpets, the advantage of which, as we have seen,
lies mainly in the increase of the output of sound-energy. Rayleigh
obtained general verification of the theory of directional trans-
mission of high-pitched sounds (such as a hiss), observing a con-
siderable concentration of sound on the axis of a trumpet of
moderate size.
The Voice - The voice is produced by an expiratory current
of air being forced through the narrow slit between the mem-branous reeds in the larynx, known as the vocal cords. These
are set into vibration, and the vibrations are communicated in turn
to the resonant air cavities formed by the larynx, the front and
back parts of the mouth (separated by the tongue), the nose and
associated cavities. During ordinary respiration the glottis, or
opening between the vocal cords, remains about half open, being
rhythmically widened at each inspiration. For the production
of voice, the free edges of the vocal cords are brought close together
so as to form a narrow slit with parallel sides. The width of the
slit and the tension of the ' cords ' are controlled by muscles, which
thereby vary the frequency of vibration. The intensity or loud-
ness of the voice depends on the strength of the current of air
through the glottis ; the more powerful the blast of air, the greater
the amplitude of vibration of the vocal cords. The precise action
of the vocal cords in setting up resonant vibrations in the upper
resonant air cavities is not definitely known. Many writers,
following Helmholtz, have regarded the vocal cords as reeds or
strings stretched across the larynx and vibrating transversely with
a frequency depending on the tension ; this vibration being com-
municated directly to the resonant air cavities above. Morerecently the view has been put forward that the function of the

THE VOICE 195
vocal cords is to induce vortex formation in the stream of air as
it passes through the slit. The phenomenon is similar in this
respect to the production of iEolian tones (see p. 205), but in the
voice the vibration of the tensioned cords also plays an important
part. It is significant that the vocal cords of men are about 1-5
times the length of those of women; whilst among men, those
with a tenor voice have shorter vocal cords than those with a bass
voice. The human voice has a range of about three and a half
octaves, although it is rare to find any individual with a range
extending over two octaves. In men, two kinds of voice can be
distinguished, the 'chest register' and the 'head register' or
falsetto. Between these two registers there is a break in the voice.
At the lower frequencies the chest voice is employed, the slit
between the cords being very narrow and long. For the higher
notes, the head voice, the vocal cords are wider apart and only
their innermost margins are set into vibration by the current of
air. The action of the vocal cords may be imitated by means of
two pieces of thin sheet rubber stretched edge to edge across
a tube. Alternatively, an artificial larynx may be made of a
stretched rubber strip fixed edgewise across a flattened air
passage. The pitch of the note emitted by such an arrangement
is determined by the tension and length of the rubber strip and
by the air pressure used to excite the vibrations.
Speech - Articulate speech is produced in the mouth and
pharynx, if there is at the same time a production of voice in the
larynx. If the latter is not called into play, the air 'breathed*
through the resonant cavities of the mouth gives rise to whispered
speech. Speech is characterised by rapid, but smooth, changes of
pitch, whereas singing usually maintains the pitch for longer
periods at a constant value. Speech sounds are divided into vowel
sounds and consonants. The analysis and synthesis of these
sounds was considerably advanced by the studies of Helmholtz,*
who formed the view that the special characters of each vowel
sound were due to a combination of harmonic components of the
'cord tones,' different for each vowel, reinforced by resonance in
the oral cavities, i.e. in the throat, mouth, and nose. This has
been called the harmonic or steady state theory of the vowel sounds.
More recently the question has been examined by Paget. In a
series of papers f he has described the results of his analysis and
* Sensations of Tone.
f Sir Richard Paget, Nature, March 1922 ; Proc. Roy. Soc, A, 102,p. 752, 1923 ; 106, p. 150, 1924 ; 114, p. 98, 1927.

196 AIR CAVITIES
synthesis of the more important vowels and consonant sounds.
Observations on ' breathed ' (i.e. without sounding the vocal cords)
vowel sounds indicated that in every case the oral cavity as a whole,
from larynx to lips, actually gives two simultaneous resonances for
each vowel sound. In certain cases, more frequent in 'American
accent,' a third resonance, due to the upper or nasal cavity, maybeintroduced. The two components are each more or less constant
for each breathed vowel sound. They consist of an upper series
of notes ranging—for a bass voice—from about 608 to 2579 p.p.s.,
and a lower series ranging from 304 to 912 p.p.s. By means of
plasticine models, Paget successfully demonstrated that recog-
nisable reproductions of vowel sounds could be made by passing
a larynx note through two resonators in series, such that whenjoined they resonate respectively to the two characteristic reson-
ances heard in the voice when the vowel is breathed. These
resonances in speech are varied by means of the lips and tongue,
which divide the oral cavity into two parts. The tongue varies
the relative volumes of the two cavities and the size of the aperture
or ' neck ' of the inner cavity. The shape of the cavities is rela-
tively unimportant. It was found that various consonant sounds
could be produced by manipulating the plasticine 'vowel models'
as had previously been done by Kratzenstein (1779), von Kempelen,
Willis (1829), and Wheatstone (1837) * in the case of a single
resonator. Using a conical reed pipe, Tyndall * produced sounds
resembling human speech: "Holding the palm of my hand over
the end of the pipe, so as to close it altogether, and then raising
my hand twice in quick succession, the word ' mama ' is heard as
plainly as if it were uttered by an infant." As a result of his
experiments Paget f concludes that the consonants are recognised
by the nature and the changes of the resonances which are set up,
and by their curves of approach or recession from the resonances of
the vowel with which they are associated, i.e. all the consonant
sounds are as essentially musical as the vowels. Willis (1829),
Hermann, and Scripture have proposed what is now described as
the inharmonic theory (in contrast with Helmholtz's harmonic
theory). It is suggested that the characteristic frequencies of
the vowel sounds are the natural vibrations of the oral cavities
excited impulsively by the more or less periodic puffs of air from
the glottis. On this view, there need be no harmonic relationship
between the vowel frequencies and the ' cord tone.' The classical
* See Tyndall, Sound, p. 198 ; see also Rayleigh, Sound, 2, p. 397, etc.
f Loc. cit.

SPEECH 197
Fourier analysis is not considered applicable to such vowel sounds.
D. C. Millar,* on the other hand, is in entire agreement with the
Helmholtz theory. He has carried out extensive investigations
on the optical recording and Fourier harmonic analysis of speech
sounds (see also p. 441). He concludes that all vowels may be
divided into two classes : (a) Those having a single characteristic
region of resonance (represented by father, raw, no, and gloom, at
frequencies 1050, 730, 460, and 326 p.p.s. respectively), and (b)
those having two characteristic regions of resonance (represented
by mat, met, mate, nwt, at frequencies 800 and 1840, 691 and
1953, 488 and 2461, 308 and 3100 p.p.s. respectively). Thesecond series are in general agreement with Paget's observations.
J. Q. Stewart f has recently reproduced vowel sounds by com-
bining transient electrical oscillations of different frequencies. AsStewart remarks, the difference between the Helmholtz theory
and the Willis theory is not serious, as the disagreement concerns
methods rather than facts. There is general agreement between
the two sets of data. A compre-
hensive investigation of speech
sounds has recently been made by
I. B. Crandall,J who employed a
Wente non-resonant condenser
microphone and a 'distortionless' |resistance-capacity valve amplifier
in obtaining oscillograph records
Energy distribution in
Speech Frequencies
(Crandall)
UJ
of the various vowel and consonant ^sounds (see p. 441). Analysis of &
the records gave the predominant ^
frequencies characterising these
sounds, and the relative amounts
of energy present at each frequency.
The results confirm and amplify
the work of Millar and Paget and
yield much fundamental informa-
tion relative to speech sounds. Fig.
61, due to Crandall, shows the energy distribution in speech
as a function of frequency. In the male voice the maximumenergy occurs at a frequency of 120 p.p.s., the female voice
having a maximum about an octave higher. Measurements
* Millar, Science of Musical Sounds, p. 215, etc.
t Nature, Sept. 2, 1922.
% Bell Syst. Techn. Journ., p. 586, 1925.
1000 2000 3 000 4000Frequency —
^
Fig. 61

i 98 MAINTENANCE OF VIBRATIONS BY HEAT
by Fletcher * on the interpretation of speech by articulation
tests, indicate that it is the high-pitched sounds which are
essential to intelligibility—in spite of the fact observed by
Crandall that the energy of the voice is mostly of low pitch ! Theclearness of speech is unimpaired if all sounds up to 500 p.p.s. are
filtered out, 60 per cent, of the total sound energy being thereby
removed. It is important to observe in this connection that the
ear has its maximum sensitivity in the region of frequency 1000
to 4000 p.p.s. Sabine f found that the rate of emission of sound
energy in ordinary conversational speech was of the order 125
ergs/second, and for public speech 2500 ergs/second. Sacia Jobtained results of a similar nature, viz. 100 ergs/second for speech,
including 50 per cent, silent intervals; and 'peak' values, in
accented syllables, rising to 20,000 ergs/second.
Maintenance of Vibrations by Heat
Vibrations may be set up in a solid or a volume of gas by the
intermittent or periodic communication of heat to some part of
the system. In almost every case the heated body expands, and
the expansion does mechanical work in compressing or displacing
some other part of the body. If the phases of the forces thus set
up are favourable—as, for example, in the analogous case of the
electromagnet and spring in an electric bell—a continuous vibra-
tion may be set up. One of the earliest and most familiar examples
of a heat-maintained vibration is known as Trevelyan's rocker.
This consists of a prism of brass or copper almost triangular in
section with one edge grooved to form two adjacent parallel
ridges. The prism rests with this grooved edge on a block of
lead with a rounded top, the end of the prism terminating in a
ball which rests on a smooth surface. When the prism is heated
and placed on the lead block it begins to vibrate, the weight being
carried alternately on one or other of the two ridges. The cause
of this vibration is ascribed by Leslie to the expansion of the cold
block at the point of contact with the hot metal, the rocking being
due to inequality of inertia of the portions of the rocker on opposite
sides of the ridge. If both surfaces are quite clean rapid com-
munication of heat is possible. The expansion of the lead under
one of the ridges of the rocker produces a 'hump,' the force of
* Phys. Rev., 19, p. 221, March 1922 ; and Bell Syst. Techn. Journ.,
p. 586, 1925.
f Sabine, Phys. Rev., p. 21, 1923.
X Bell Syst. Techn. Journ., pp. 382 and 627, 1925.

SINGING FLAMES 199
gravity throwing the rocker on to the other ridge where the opera-
tion is repeated. In order to account for the maintenance, however,
it is necessary to suppose a slight lag between contact and expan-
sion, otherwise the motion would be checked. It is important
that the block on which the rocker rests should have a large
temperature-coefficient of expansion. The rocker experiment
was repeated later by Page * in a somewhat different manner, the
local heating at the points of contact being obtained by means of
an electric current passing between the block and the rocker. Onthe same principle Gore f succeeded in producing the continuous
motion of a copper ball bridging a pair of concentric circular rails
connected to the terminals of a battery. The ' gravity ' theory of
Leslie has recently been questioned by Chuckerbutti,J who con-
cluded, as a result of a series of photographic observations of
frequency and amplitude of 'rockers,' that the gravity theory was
inadequate. He suggested that the elastic vibrations of the rocker
and handle-bar play an important part, and eventually displace
such simple gravity rocking movement as may occur in the earlier
stages. Still more recently E. G. Richardson § and Bhargava
and Ghosh|jhave examined the question experimentally, and have
obtained confirmation of Leslie's gravity theory, which requires
that the product N 2<z (N=frequency and # ^amplitude) should be
constant. No elastic vibrations, as required in Chuckerbutti's
view, were detected.
Singing Flames - Under certain circumstances, a small gas
flame introduced into a resonant chamber of air or other gas will
emit a musical sound. The fact that the note emitted has practi-
cally the same pitch as the resonant note of the cavity was noted
by Chladni (1802) in repeating the first experiments of Huggins
(1777) with a hydrogen flame. De la Rive obtained similar
effects by heating water in a thermometer bulb, and ascribed the
singing in all cases to the intermittent condensation of water-
vapour. Faraday (1818) disproved this explanation when he pro-
duced the sounds in tubes raised to a temperature above 100° C,and obtained similar results with flames of carbon monoxide.
^J
Schaffgotch and Tyndall independently succeeded in generating
very powerful sounds by burning ordinary gas flames in tubes
* Silliman's Journal, 9, p. 105, 1850.
f Phil. Mag., 15, p. 519, 1858, and 18, p. 94, 1859.
X Ind. Assoc, for Cultivation of Science Proc, 6, pts. 3 and 4, 1921.
§ Phil. Mag., 45, p. 946, 1923.
|| Phys. Rev., 22, 517, 1923.
11 See Tyndall, Sound, Lecture VI, on ' Singing Flames.'

aoo MAINTENANCE OF VIBRATIONS BY HEAT
containing air-—-incidentally showing how the flame could be
used as a sensitive detector of vibrations in tune with the tube.
Using a revolving mirror, Wheatstone proved that the flame was
intermittent, and at one phase may withdraw itself entirely within
the supply tube.* Sondhauss f showed that the singing was
due to intermittent heating of the air near the jet, and that the
length of the supply pipe was definitely related to the length of
the singing tube. He found it was necessary that the vibrations
of the gas in the supply tube and the air in the singing tube should
be in step near the jet. A satisfactory explanation of all the
phenomena was first supplied by Rayleigh,J who pointed out that
the fundamental factor of importance is the phase of the heat
supply relative to that of the vibration of the gas in the singing
tube. He showed theoretically that the heat must be supplied
at the instant of greatest condensation (or removed at the instant
of greatest rarefaction) in order to maintain the vibrations, i.e.
the driving force, the heat supply must be in phase with the
condensation. It should be observed that this differs from the
ordinary cases of forced vibration where the vibration is best
encouraged if the impressed force is a maximum when the con-
densation is zero. The difference in the present case arises from
the fact that the heat supply is intermittent, not sinusoidal. Themaintenance of the vibration in the air column may be regarded
in the following way. Sudden application of heat at the instant
when the pressure-amplitude is a maximum 'a,' increases the
pressure to (a-\-h). Apart from loss of amplitude due to viscous
forces and radiation of sound, the pressure-amplitude will there-
fore increase by 8 at each complete vibration, and will ultimately
reach a very large value. The equilibrium state is, of course,
reached when the increments of amplitude due to the heat supply
are just balanced by the losses due to friction and sound radiation.
To produce the maximum effect it is therefore important that the
flame must be placed at or near a point of maximum pressure-
amplitude, i.e. near a node in the singing tube. In addition to
this it is of course necessary that the oscillations of the flame must
maintain the required phase relationship with the vibrations in
the singing tube. The correct phase relation is made possible by
the fact that there are stationary waves set up not only in the
singing tube but also in the gas supply tube. Now the pressures
* See also Topler, Pogg. Ann., 128, p. 126, 1866.
f Pogg. Ann., 109, pp. 1 and 426, 1860.
X Theory of Sound, 2, p. 226.

SINGING FLAMES 20
1
in both tubes must always be equal at the jet. Consequently
the pressures in both tubes near the jet must be increasing and
decreasing simultaneously, i.e. the jet must be at a node in the
supply tube to correspond to the node in the singing tube. Therequired condition is fulfilled if the length of the supply tube is
an odd multiple of A/4 (where A is the wave-length, in the gas, of
the note in the singing tube). The corresponding antinodewill
be at a point where the supply pipe opens into a larger gas pipe
or reservoir.
If the gas jet is placed at an antinode in the 'singing tube,'
where the air is at its normal density, there will be no tendency to
maintain or discourage the vibrations, but the frequency of vibra-
tion of the tube will be altered. If the heat is supplied a quarter
period before the maximum pressure occurs there will be an
increase of frequency, whereas a decrease will be produced if the
heat is supplied a quarter period after the occurrence of the
maximum pressure. The various cases are illustrated graphically
in fig. 62. Of these, in case (1) only will the vibrations be main-
Phase of HeatSupply relative
to Phase ofMaximumPressure.
(1) Normal vibratio
(2) In phase
(3) Opposite phase
(4) Quarter periodbefore
(5) Quarter periodafter
Effect on
Amplitude.
n (neglecting
increasing
decreasing
Frequency.
damping)-
increase->-
decrease->-
Wave Form of Resultant Vibration.
Fig. 62
tained ; in case (2) they will be definitely discouraged ; whilst in
(3) and (4) they will die away, after excitation, due to the usual
damping forces of friction and sound radiation. The vibrations

202 MAINTENANCE OF VIBRATIONS BY HEAT
which we have considered may or may not start spontaneously.
In carrying out the experiment it is often necessary to initiate the
vibration in some other way, e.g. by blowing across the open end
of the tube or by exciting it with a source of sound of the same
pitch. It will be understood also that the fundamental tone
of the 'singing tube' will be modified by the general rise of
temperature and by the products of combustion of the gas in
the tube. E. G. Richardson * has carried out experiments on
singing tubes which verify Rayleigh's theory. The flame of a
Konig manometric capsule, attached to a singing tube on a level
with the jet, was viewed, simultaneously with the singing flame,
through a stroboscope. It was found that the two flames vibrate
in the same phase, as the theory requires, heat being given to the
air at each condensation. Stationary waves were formed both in
the 'singing' tube and in the supply tube, but the lengths of
supply tube favourable to singing were found to cover a muchwider range than Rayleigh surmised.
The tone of a singing flame is almost as pure as that of a tuning-
fork, but the frequency is liable to vary slightly with changes of
temperature and composition of the mixture of gases in the tube.
On this account a tube with both ends open is preferable. Other
forms of resonator may be employed as an alternative to the
parallel tube, e.g. Rayleigh used a large spherical vessel with a
long, narrow neck to resonate at a frequency of 25 p.p.s. when the
vibrations, although almost inaudible, were sufficiently vigorous
to extinguish the flame.
'Gauze' Tones - In 1859 Rijke observed that a sound of
considerable intensity could be produced by a heated metal gauze
stretched across the lower part of a vertical tube. The gauze was
heated by a gas flame, and the sound was heard immediately after
removal of the flame. Keeping the gauze hot by means of an
electric current Rijke maintained the sound indefinitely. Unlike
the 'singing flame' tube, which was maintained by pressure
variations near a node, the 'gauze' tube depends for the main-
tenance of its vibrations on the motion of air through the gauze,
i.e. on velocity variations. The air-flow near the gauze is the
resultant of a direct upward convection flow with a superposed
alternating flow due to the vibrations. This results in a maximumtemperature fluctuation in the direction of the upward part of
each vibration ; for cold air is drawn over the gauze at the upward
* Proc. Phys. Soc, 35, pp. 47-54, Feb. 1923.

THERMOPHONE. SINGING ARC 203
movement, and air almost at the gauze temperature on the down-
ward movement. When the gauze is in the lower half of the
tube, i.e. below the node at the midpoint, this upward resultant
assists the upward wave of compression, and as a consequence the
vibrations are maintained. It will be evident that the vibrations
would be discouraged if the gauze were situated above the node,
i.e. in the upper half of the tube. The experiment is very effective
if a large metal pipe, several feet long and about 6 inches in
diameter is used, the vibrations set up may become very violent,
but they only persist a few seconds, during the cooling of the
gauze.*
Similar principles are involved in the explanation of the comple-
mentary phenomenon observed by Bosscha and Riess.f In this
case the gauze is placed in the upper half of the tube, and a current
of hot air is passed up the tube through the cold gauze. Tomaintain the vibrations it is necessary to use a special water-
cooled gauze. As Rayleigh states : "In both Rijke's and Riess's
experiments the variable transfer of heat depends upon the motion
of vibration, while the effect of the transfer depends upon the
variation of pressure. The gauze must therefore be placed where
both effects are sensible, i.e. neither near a node nor near a loop."
Heating by Alternating Currents. The Thermophone,Singing Arc - If a conducting wire is heated by alternating
current, its temperature rises and falls once in each half-cycle of
the current, i.e. at twice the frequency of the A.C. supply. If the
wire is sufficiently thin, this temperature fluctuation is accom-
panied by corresponding changes of length. A stretched hori-
zontal wire will therefore be set into resonant vibration whenheated by a current of frequency equal to that of the wire. Inter-
esting observations relative to the production of sound by wires
heated in this way are described in a paper by E. Ludin.J
In addition to the change in length of the heated wire or strip
another important effect may be observed, namely, the heating of
the air immediately surrounding the wire. The air is alternately
heated and cooled in each half cycle of the current and, if retained
within a cover of small volume, the expansions and contractions
are observed as sound. This effect is employed in a device
invented by P. de Lange§ and known as the thermophone. A theory
* See Phil. Mag., 17, p. 419, 1859, and 7, p. 155, 1879.
f Pogg.Ann.,107,p.S±2, 1859; 109, p. 145, 1860; and 127, p. 166, 1866.
X Arch, des Sciences, 4, p. 383, Sept., Oct. 1922.
§ Proc. Roy. Soc, 91, p. 239, April 1915.

2o4 MAINTENANCE OF VIBRATIONS BY HEAT
of the instrument, which can be used as a precision source of
sound energy, has been developed by Arnold and Crandall,* whoexperimented with a simple form of thermophone using a platinum
strip 7 x 10~5 cm. thick. When an alternating current i sin nt is
passed through a fine wire of resistance R the heat developed
is proportional to Ri2 sin 2 nt=\Ri2{\ — cos 2nt). The heat de-
veloped consequently varies between and Ri2/2 at a frequency
2n/27T, i.e. at double the frequency nj2-n of the current. If, now, a
sufficiently large initial direct current i be passed through the
wire, the double frequency term, in
R(i -ri sin nt)2=R(i 2+%i2)+2Ri i sin nt-\Ri2 cos 2nt,
may be made negligible. The fluctuations of heating effect then
vary with the frequency n/2n of the current. The thermophone
is therefore used with a moderate direct current on which the
A.C. is superposed. The sound reproduction of the device is of
good quality, but is somewhat feeble relative to the response of
ordinary electromagnetic telephone receivers. Within certain
limits of frequency the thermophone has possibilities as a sound
standard of small intensity-range. Incidentally, Wente (loc. cit.)
has indicated how the device may be used as a means of measuring
the thermal conductivity of a gas, troublesome convection effects
being entirely avoided.
The Singing Arc - Duddell f showed that a continuous cur-
rent arc shunted by an inductance L and capacity C in series
would, for certain values of these quantities, emit a musical note
of frequencyN= 1/2 7rVLC. This effect is due to the superposition
of an oscillating current of frequency N on the continuous
current, with corresponding heating effects in the gases in and
around the arc. The singing property of the arc is made possible
by its so-called negative-resistance (the slope of the potential
current curve dV/di being always negative). The best effects are
obtained when the impedance of the oscillating circuit, including
the arc, is fairly small compared with the resistance in series with
the main supply of current. The singing carbon arc in air maybe used as a source of sound or of alternating current. If, how-
ever, the arc is formed in a vacuum or in an inert gas at reduced
pressure, as in the case of a tungsten arc ('pointolite') there will
be alternations of current but no sound. A carbon arc fed with
* Phys. Rev., 10, p. 22, July 1917 ; see also E. C. Wente, Phys. Rev.,
19, p. 333, April 1922. f Electrician, p. 46, 1900.

^OLIAN TONES 205
alternating current behaves as a source of sound. If a micro-
phone be coupled to the arc through a transformer, it is possible
to cause sounds to proceed from the arc similar to those falling
on the microphone. Conversely, sound waves falling directly on
an arc, produce fluctuations of temperature and consequently
of resistance and current. The current variations after passing
through a transformer may actuate a telephone receiver. It
should be noted also that the frequency of alternation of the arc
may have any desired value in or above the audible range (up to
105 p.p.s.). In this respect the singing arc is primarily of im-
portance as a means of generating high-frequency current oscilla-
tions.* The arc is, however, very inefficient either as a source
or a receiver of sound.
Spark Sound Waves - A powerful electric spark ma) be the
source of a single intense pressure pulse or, if the electrical circuit
is tuned, the spark discharged may be oscillatory with accompany-
ing pulses of alternating pressure. The pressure effects are un-
doubtedly due to the large fluctuations of temperature and density of
the medium in the path of the spark, the corresponding expansions
and rarefactions spreading as spherical sound waves which maybe sonic or supersonic according to the frequency of the electrical
oscillations in the spark discharge. We shall refer later to the
use of short wave-length spark-sounds or pulses to demonstrate
various ' optical ' phenomena.
Vortex Sounds
(a) T^Eolian Tones - When a steady flow of fluid passes an
obstacle with appreciable velocity it is usually found that eddies
are formed behind the obstacle. These eddies arise from the
forces of viscous drag between the surface of the obstacle and the
fluid. Such effects are familiar in the case of a stream of water
'swirling' past a pile or rock. Similar effects are also produced
in a stream of air. Careful observation shows that a cylindrical
obstacle, such as a rod or wire, in a stream of air sets up a double
series of vortices,-)- as shown in fig. 63. These vortices arising
on opposite sides of the wire revolve in opposite directions,
eventually becoming detached and carried along with the stream.
The stream of air past the wire is thus set into transverse vibra-
tion, as alternate left- and right-handed eddies are formed and
* See ' L'Arc Electrique,' M. Leblanc (Les Presses Universitaires deFrance) ; also Bragg, World of Sound, p. 108.
f Mallock, Proc. Roy. Soc, 9, p. 262, 1907.

206 VORTEX SOUNDS
detached. This process results in the production of alternating
pressure-waves in the stationary air outside the stream. If the
dimensions of the wire and the velocity of the air-flow are correctly
adjusted the pressure fluctuations become audible. An experi-
mental investigation of these vortex vibrations was first undertakenby Strouhal * and later by Kohlrausch, f who described the
sounds as 'reibungstone.' Strouhal stretched a wire vertically ona frame which could be revolved at various known speeds aboutan axis parallel to the wire. It was found that the frequency Nof the tone excited in this way was independent of the length and
Fig. 63—Vortices
(Bragg's World of Sound)
tension of the wire, and varied only with the thickness d of the
wire and the speed v of rotation. The results are expressed
approximately by the relation
N =0-185*;/
J
(1)
The detachment of vortices and the wavering of the stream from
side to side behind the wire is accompanied by corresponding
alternating transverse forces of reaction on the wire itself. These
forces tend to set the wire into vibration transversely to the stream. JWhen the velocity of flow is such that the value of the frequency Nin the above expression coincides with one of the natural fre-
s Itquencies of the wire, N'=— */ — (see equation {la), p. 87), the
latter is set into resonant vibration and the sound emission is
greatly increased. The music of the /Eolian harp is produced in
this way. The harp consists of a number of wires of graduated
thicknesses mounted on a sounding-board. The wires are all
tuned to the same low fundamental note which consequently has
* Wied. Ann., 5, p. 216, 1878. f Wied. Ann., 13, p. 545, 1881.
% Rayleigh, Phil. Mag., 7, p. 161, 1879 ; and 29, p. 433, 1915.

EDGE AND JET TONES 207
a wide range of overtones in the audible region. When the wind' plays ' the harp one or more of these wires will resonate and emit
the note of the appropriate overtone.
Strouhal observed further that a rise of temperature was
accompanied by a fall of pitch. Rayleigh * suggests that this
effect must be associated with change of kinematic viscosity v
of the air. In such a case the frequency X must be of the form
y;=f(v!vd).v/d ... (2)
where /is an arbitrary function; and there is dynamical similarity
if v yi id. Strouhal's experimental results indicate that v vd is
always very small.
Rayleigh (loc. cit.) gives the following formula as agreeing well
with observation,
X^-^i-^ ... (3)a id
where, for air at 20° C, the value of v=\x p=0-1505 c.g.s., and for
water at 15° C, v =0-0115. Rayleigh has also demonstrated the
general behaviour of a wire in a stream of air by the analogous case
of a pendulum dipping in a revolving tank of water. The pen-
dulum is free to swing across the stream, along a radius of the
tank, and its oscillations are sufficiently slow to be counted. E. G.
Richardson f has obtained confirmatory results with wires stretched
across a wind or a water channel. Observations were also madeon the critical values of flow past objects of aerofoil section with
the stream incident at various angles.
Examples of iEolian tones are numerous, the ' singing ' of tele-
graph wires, the 'sighing' and 'roaring' of wind in trees, and the
'whistling' of wind through tall grasses, are a few of the morefamiliar.
(b) Edge and Jet Tones - The tones produced when a stream
of gas passes a sharp edge or emerges from a jet are analogous to
the iEolian tones to which we have just referred. Edge tones
arise when a blade-shaped sheet of air or other gas streams out
from a slit and meets a more or less sharp-edged wedge. A tone
first occurs when the ' edge ' is at a certain minimum distance from
the jet, this critical distance being dependent on the velocity of the
gas issuing from the jet. J The frequency of the tone falls off
* Sound, 2, p. 413. f Proc. Phys. Soc, 37, p. 178, 1925.
X Schmidtke, Ann. d. Physik, 60, 8, p. 715, 1919.

208 VORTEX SOUNDS
inversely as the distance x of the edge from the jet. At a certain
value of x, however, the frequency 'jumps' to the octave higher,
then again falls with increase of x as before. Air emerging from
a slit-jet tends to form alternately spaced vortices on each side of
the air stream. A photograph (by the 'Schlieren' method) of a
high-velocity jet of air from a circular opening is shown in fig. 54,
p. 177, where it is clearly seen that the emergent jet is divided into
sections of nearly equal length. Kruger and Schmidtke * have
shown that the frequency of the tones given out by air or other
gases issuing from a small circular jet conforms with the relation
N=kv/D, where v is the velocity of the jet, D the diameter of the
opening, and k a constant equal to 0-045 approximately for various
mixtures of air, C0 2 , oxygen, and coal-gas. The regular vortex
structure of the jet explains the peculiar observations on edge tones.
The distance between the jet and the edge is critical, because it
must approximate to a multiple of the ' vortex separation ' in the
jet.
Wachsmuth f carried out extensive experiments on the pro-
duction of jet and edge tones. He has drawn attention to an
important application in flue organ pipes. With normal blowing
pressure, the frequency of the first edge tone should coincide with
the fundamental frequency of the air column. In the high-
frequency sound generator of Hartmann and Trolle, to which wehave previously referred (fig. 55), a small resonating column of air
is maintained in vibration by a high velocity jet having the regular
vortex structure shown in fig. 54. The 'bird-call,' a very con-
venient source of sound of high frequency, probably depends for
its action on vortex formation. A stream of air issues from a
circular hole in a thin metal plate and impinges on a similar
hole in a parallel plate held a short distance away in a tele-
scopic tube. By varying the distance apart of the holes, or
by varying the strength of the air blast, the note can be con-
trolled over a wide range of frequency, its upper limit being
quite inaudible.
The formation of a regular series of vortices with an alternating
flow of air through an orifice has been beautifully demonstrated
in a paper by Carriere.J The 'stationary stratification' of the
air near the orifice of a resonator and the formation of eddies in
an ' edge-tone ' are also clearly demonstrated.
* Ann. d. Physik, 60, 8, p. 701, 1919.
t Ann. d. Physik, 14, p. 469, 1904.
% Journal de Physique, 9, 6, p. 187, 1928.

SIRENS 209
Sirens
The earliest form of siren, due to Seebeck (1805-1849), consisted
of a revolving disc perforated with a ring of equally spaced holes
which interrupted a jet of air from a tube mounted opposite.
The frequency of the successive puffs of air issuing through
the holes is equal to the product of the number of holes and
the revolutions per second of the disc. In the later form of
siren invented by C. de la Tour, the holes in the revolving disc
were drilled obliquely and the single air jet was replaced by a
corresponding fixed ring of jets (oblique holes in a disc forming
the cover of a 'wind-chest'). The blast of air emerging from the
fixed jets impinged on the holes in the disc and, by its reaction,
set the disc in rotation. In this form of siren the intensity of the
note increases with frequency, both these quantities varying with
the strength of the air blast. Improved forms of Seebeck's siren
are now in common laboratory use. The disc of holes is nowdriven by an electric motor fitted with a speed indicator and speed
control, the arrangement forming a very convenient means of
determining the pitch of a note directly. It can be regarded as a
point source of sound of which the amplitude is approximately
proportional to the pressure of the air supply. The wave-form of
the sound is dependent on the manner in which the effective area
of the orifice (the area common to the tube and the hole) varies
with time as the disc revolves. With equal circular holes spaced
a hole-diameter apart and equal in diameter to the jet, the wave-
form will approximate to that shown in fig. 64a, indicating that
Fig. 64A—Calculated Wave-form (circular holes and jet)
a number of harmonics are present in addition to the fundamental.
It would be an interesting exercise in Fourier analysis to discover
the frequencies and relative intensities of the various harmonics
in the wave-form, and to verify the result experimentally. Milne
and Fowler * have recently devised a special form of siren of the
Seebeck type for giving pure tones. The jet is rectangular in
section and the holes are so shaped that the area of the jet exposed
varies sinusoidally. Fig. 64b shows the shape of a hole in the
* Proc. Roy. Soc, 98, p. 414, 1921.

zio SIRENS
disc of such a siren. An examination of the sound emitted by the
special siren indicates a remarkable freedom from harmonics in
comparison with the sound from the ordinary siren with circular
holes. Dove and Helmholtz produced sirens having several rings
of holes provided with corresponding air-jets, so that one or moretones could be produced simultaneously.
Fig. 64B—Rectangular Jet (1) and special-shaped Holes (2) to make Areaof Opening vary sinusoidally
Sirens driven by compressed air or steam are in common use
as sources of sound. Powerful sirens of the la Tour type, driven
by a jet of water, have also been used by Sir Charles Parsons for
signalling under the sea.*
During recent years much progress has been made in the design
of large-power sirens for use in fog-signalling from lighthouses and
lightships for the safety of ships at sea. In a paper "On the
Production and Distribution of Sound," Rayleigh f refers to an
investigation (at St Catherine's, Isle of Wight) of the relative merits
of various forms of sound generators, and concludes in favour of
a motor-driven siren operating at 180 p.p.s. with an air pressure
25 lb./sq. in. Such sirens, however, consume an amount of
energy out of all proportion to the amount of sound energy
emitted. It appears surprising that a siren to be heard eight miles
away on a ' good ' day consumes energy at the rate of 100 H.P. Thehigh note of a Scottish siren tested at St Catherine's required
600 H.P. to produce. As a contrast to this, Rayleigh estimated
the power to produce ' an unpleasantly loud blast ' of a small horn
blown by the lips to be 000027 H.P. The 7-in. disc siren used at
St Catherine's, examined in a similar way, was shown to be ex-
tremely inefficient—the maximum pressure fluctuation (calculated)
being less than 0-1 lb./sq. in. as compared with the pressure
25 lb./sq. in. actually used. L. V. King J has carried out extensive
* Engineering, p. 517, April 18, 1929.
f Phil. Mag., 6, p. 289, 1903 ; Scientific Papers, 5, p. 126.
% L.V. King, Frank. Inst. Journ., 183, p. 259, March 1917; Phil. Trans.,
218, p. 227, 1919; Hart and Smith, Principles of Sound Signalling
(Constable); E. T. Paris, Journ. Sci. Instrs., 3, p. 187, March 1926.

THE DIAPHONE 211
Air supply forDriving Piston
tests of sirens and other types of fog-signalling apparatus, using a
Webster 'phonometer' (see p. 435) to measure the sound intensity
at various distances from the source. We shall have to refer later
to his observations in dealing with transmission of sound. Using a
diaphone (see below), King concluded that of the 35 H.P. supplied
as compressed air only 2-4 H.P. actually appeared as sound, and
of this only 0-3 H.P. remained at a range of ten miles. Rayleigh
has shown that degradation of sound energy is to be expected,
and is most marked at large amplitudes. This is confirmed byKing's experiments. M. D. Hart has determined the 'degrada-
tion coefficient' in certain cases, and has shown experimentally
with a siren operated at 4 to 5 lb./sq. in. that 15-5 per cent, of the
energy is lost between 40 and 100 cm. from the source, and a very
much greater fraction be-
tween and 40 cm. For
the efficient propagation of
sound, a high intensity at
any point must therefore be
avoided.
The Diaphone - This is
a powerful long-range fog-
signalling device invented
by J. P. Northey in 1903.
It is essentially a siren of
the same class as those of
Seebeck and la Tour, since
it differs from them only
in the fact that the opening
and closing of the ports is
effected by a reciprocating
instead of a rotary motion.
The air supply causes the
piston to oscillate through
a small amplitude, and also
issues intermittentlythrough the ports to pro-
duce the sound. A section
of a diaphone by ChanceBros., Birmingham, is
shown in fig. 65. Theactual diaphone used by L. V. King was fitted with a 4J-in. dia-
meter piston having 10 ports and an amplitude of 0-15 in. The
Fig. 65—Diaphone (piston 9 ports -05 inchwide at intervals of 0-29 inch. At 30 lbs.
pressure-stroke 0-47 inch, 102 oscillations
per second, giving a sound frequency of
204 p.p.s.)
(By courtesy of Messrs. Chance Bros., Birmingham)

2i2 EXPLOSION SOUNDS
operating pressure was 25 lb./sq. in., giving 90 oscillations per
second, i.e. a. sound frequency of 180 p.p.s. The diaphone was
fitted also with a conical trumpet of semi-vertical angle 6-5 degrees,
diameter 4J to 16| in. in a length of 4 ft. 10 in., having a resonance
frequency of 180 p.p.s. at which the diaphone operated. W. S.
Tucker # describes experiments with a diaphone horn near the
Casquet Rocks, Channel Islands, in which the sound was received
by a doubly resonated hot-wire microphone (see p. 406) in tune
with the diaphone, and recorded photographically. " At a distance
of 4J miles the sound was still too intense to obtain the whole record
on the photographic strip, using full sensitivity . . . it is believed
that a range of at least 20 miles would have been recorded by the
microphone. The superiority of the diaphone (over the ordinary
siren) was clearly demonstrated."
The Centrifugal Siren - Another form of siren, which is con-
sidered by Hart and Smith f to be the most efficient, consists of
a radially vaned cylindrical rotor revolving in a stationary casing
in which ports are cut. The vanes are connected in pairs at
their outer edges by cylindrical segments, so that rotation causes
opening and closing of the fixed ports. Air is drawn through an
axial aperture where the vanes are cut away. The sound is pro-
duced by the expulsion of air through the ports by the centrifugal
action of the rotor, which may be driven by an electric motor or
by an internal combustion engine. The siren is very powerful
and efficient. It operates at a relatively low pressure, increased
sound output being obtained by increasing the area of the ports
instead of increasing the pressure. No resonator is employed,
and its directional properties are good. The centrifugal siren
combines the advantages of the Trinity House siren and the
diaphone as regards signal characteristics, and is more efficient
for long-distance signalling.
Explosion Sounds
Infra-Sound - The ejection of a shell from a gun and the
subsequent explosion of the shell are both accompanied by a large-
amplitude pressure wave which can be detected at long ranges.
The explosion at the gun is due to the relatively slow burning of
cordite as compared with the sudden detonation of T.N.T. in the
shell. The pressure waves in the two cases are therefore distin-
guished by the difference in abruptness of the wave-front. The
* Journ. Roy. Soc. Arts ,11, p. 121, Jan. 5, 1923. f Loc. cit.

EXPLOSION SOUNDS 213
' ondes de bouche ' (from the mouth of the gun) consist principally of
waves of very low frequency (of the order 1 p.p.s.), described by
Esclangon * as Infra-Sounds. These are accompanied by sounds
of audible frequency. An observer at an appreciable distance from
the gun receives what appears to be a continuous train of waves,
i.e. a 'reverberation,' due to the numerous reflections of the pulse
from objects along its track. Such reverberations may last several
seconds, the duration often depending upon meteorological con-
ditions. Gun records, obtained by means of a hot-wire micro-
phone and Einthoven string oscillograph (see p. 478 on Sound
Ranging), show extended and complicated vibrations in the case
of sounds coming 'down-wind,' the effect being due apparently
to the downward curvature of the sound ray (see p. 290) and to
the repeated reflection at the surface of the ground. With a
flank wind, the reverberation is generally negligible and the simple
character of the explosion 'sound' is retained. Reverberation
effects are similarly observed under water on the explosion of a
mine or a depth charge, the complications arising from wind, of
course, being entirely absent.
A single explosion impulse is often sufficient to set a resonator
into vibration, thereby producing a musical note or a noise byshock excitation. A sharp hammer blow on a resonant metal bar
or a sudden withdrawal of a cork from an empty bottle ('air
filled, ' to be more precise) are simple illustrations of this. Theejection of a shell from a gun results in a large-amplitude heavily
damped oscillation. The record of the gun wave, using the hot-
wire microphone and Einthoven oscillograph, clearly reveals this
effect. The longer the gun the lower its ' natural frequency ' and
the slower the oscillation. f The gun barrel may be regarded as a
stopped pipe (N=c/4Z), but the composition and temperature of
the contained gas at the instant of ejection of the shell is uncertain.
The record gives an approximate value of the frequency. Hot-
wire microphones, for use in locating guns, were consequently
fitted in 'resonators' of various possible gun-frequencies. A gunwas recognised by its 'signature.'
A rapid succession of explosions at equal intervals of time mayalso result in a sound of a more or less musical character. Theexhaust of a high-speed multi-cylinder gas or petrol engine, e.g.
* See E. Esclangon, UAcoustique des Projectiles et des Canons.
f P. Villard, Comptes re?idus, 179, p. 617, Oct. 1924, ascribes thevariation of frequency in these cases to the different weights of theexplosive used ; see also Esclangon, loc. cit.

214 SOUNDS FROM ROTATING PROPELLERS
an aero engine, emits a powerful harsh sound, having a well-
defined pitch, which varies with the speed. On account of the
impulsive nature of the pressure fluctuations in this sound, a
Fourier analysis of its wave-form would reveal a long train of
harmonics in addition to the fundamental. A similar 'musical
noise ' of high frequency is produced in the operation of a Wehnelt
electrolytic interrupter (used as a ' break ' for large X-ray induction
coils). This also is due to a regular succession of explosive im-
pulses, arising from the sudden generation of gas under the liquid.
The wave-form of such a series of impulses recorded on a cathode-
ray oscillograph indicates the abruptness of each 'detonation.'
The highly compressed spherical pulse from a powerful electric
spark, and the'
onde de choc' of a projectile (see p. 269) appear to
an observer as a sharp 'crack.' The thickness of the pulse as
revealed by spark-shadow photographs (see p. 340 and fig. 82)
is extremely small, a fraction of a millimetre, indicating a very
abrupt rise of pressure in the front of the pulse. We shall have
to refer to the applications of such impulsive waves in the study
of wave transmission.
Sounds from Rotating Propellers
The propeller, or air screw, of an aeroplane behaves as a
powerful source of sound, which may be heard, under favourable
conditions, at distances of several miles. The sound arises from
the rotation of the source and sink system associated with pres-
sure differences on the rotating blades. Using a Tucker resonant
hot-wire microphone, with a continuously variable tuning,
A. Fage * has analysed the sounds emitted from various types of
air screw. He found that the sound of rotation consists of a large
number of harmonics having as fundamental a note of frequency
equal to the product of the number of blades and the rotational
speed. In addition to these sounds, 'tearing sounds' associated
with the shedding of eddies from the blades (see p. 207 on EdgeTones) were also observed, but the frequencies were not deter-
mined. Sounds arising from the flexural vibrations of the air-screw
blades and the shaft were found to have frequencies in agreement
with calculation. The predominant frequency in the rotation
sound is very intense and can readily be detected, under favour-
able conditions of wind, temperature gradients, etc., at very long
ranges;particularly if a tuned resonator is used to receive the sound.
The greater part of the under-water sound from a moving ship
* Proc. Roy. Soc, 107, p. 451, 1925.

DIRECTIONAL SOURCES OF SOUND 215
comes from the screw propeller. As it revolves, the pressure
behind the blades is reduced and, above a certain speed, a partial
vacuum and unstable vortex cavities are formed. When such
'cavitations' collapse, either on themselves or on the blades, a
noise is produced. This noise has no predominant frequency,
although it is to some extent characterised by the beat of the
engines or the ' rush ' of the turbines which drive the propeller.
In considering the various possible causes of erosion in ships'
propellers, Parsons and Cook # arrived at the conclusion that such
cavitation effects are quite sufficient to account for the serious
erosion observed. Calculation shows that the pressure of the
blow, when a vortex cavity collapses upon a central nucleus one-
twentieth the diameter of the original cavity, may reach 68 tons
per sq. in., or 765 tons per sq. in. if the diameter of the nucleus
is only 1 per cent, of that of the cavity initially. Such enormous
forces acting on the metal blades account not only for the rapid
disintegration but also for the considerable output of noise.
Similar effects are observed with high-speed aeroplane propellers.
If the screw of a ship revolves sufficiently slowly cavitations are
not formed and the noise emitted is almost negligible. A sub-
merged submarine, wishing to avoid detection, would therefore
cruise at a 'silent speed.' At a moderate speed of say 10 or
15 knots, a surface ship could be detected at a range of several
miles by the noise emitted from its propellers.
Directional Sources of Sound
A given amount of sound energy confined to a parallel beam(plane waves) or to a cone of small angle will be transmitted to
a much greater distance than the same amount of energy spread-
ing uniformly in all directions (spherical waves). Certain types
of sound source, e.g. those of large area, double sources, etc.,
possess inherent directional properties.! Other types, e.g. small- simple ' sources, may become directional when used in conjunc-
tion with such devices as mirrors or trumpets. The latter, how-ever, must conform with the condition that the radiating area is
large. The combination of a small non- directional source and a
large reflector forms a directional source. A line, a ring, or an
area of equally spaced non-directional sources may also, under
certain conditions, function as a directional source.
* Engineering, p. 515, April 18, 1919.
f With the exception of the ' breathing ' or radially vibrating sphere(a mathematical fiction) which is non-directional, whatever its radius.

2l6 DIRECTIONAL SOURCES OF SOUND
Sources of large Area - We have already dealt with the case
of radiation from a ' piston source ' of radius R emitting a sound
of wave-length A (see p. 149). It was shown, making use of the
optical analogy of diffraction through a circular aperture, that the
semi-angle of the primary beam is sin-1
0-61A/R, the solid angle
of the cone approximating to Si =0-377rA2/R 2
. This result indi-
cates increased sharpness of direction with increased area of
source. H. Stenzel (Joe. cit.) has dealt with this case by more
elaborate mathematical analysis, making use of Rayleigh's
equations for the velocity potential in the neighbourhood of a
circular piston source in an infinite wall.* The deductions are
essentially the same as those already given (p. 147, etc.). Thepolar curves shown in fig. 66 are taken from Stenzel's paper. It
0. point source 2. 2R/\- 1/2°
l2R/x = /4 3.2fft = 1
Fig. 66
%-% % =
will be seen that the primary beam gradually improves in
directional properties as the radius of the disc R increases rela-
tively to A. When 2R is less than A/4 the source is practically
non-directional, i.e. it may be regarded as a 'point' source
radiating spherical waves. When 2R is very great compared
with A the 'beam' of sound becomes approximately parallel, like
a beam of light passing through a large aperture. The intensity
distribution around sources of sound of varying area has recently
been examined experimentally by F. W. Hehlgans.f Using a
high-frequency quartz oscillator (68,000 p.p.s., A =0-5 mm. in air)
and varying the area exposed by means of an adjustable 'slit,' he
obtained polar curves of intensity in good agreement with the
theoretical curves shown in fig. 66 due to Stenzel. The paper
describes also many other interesting properties of high-frequency
piezo-electric sound sources and receivers. In practice it would
* Sound, 2, p. 162 et seq. f Ann - der Phys., 4, 86, p. 587, 1928.

MULTIPLE SOURCES 217
be impossible to attain such a parallel beam of sound within the
audible range of frequencies, for the linear dimensions of the
source {e.g. a mirror with a point source at the focus) would have
to be many times the wave-length of the sound employed (in air
A varies from 11 ft. to 1-1 ft., over a frequency-range 100 to
1000 p.p.s.). Large concrete mirrors 20 ft. or so in diameter have
been used to receive sounds of such wave-lengths * in a fixed
direction, but there are many objections to the use of such large
reflectors as a directional source of sound. The other alternative
is to employ reflectors or other sources of moderate dimensions
and work with sounds of very high frequency. The ticks of a
watch placed at the focus of a concave mirror, say 2 ft. diameter,
may be directed along a fairly definite line and received by another
similar mirror. Rayleigh has verified the more important points
in the theory by means of a speaking-trumpet. For sounds of
moderate pitch the directional property is almost negligible, but
as the pitch rises to a hiss the trumpet emits approximately plane
waves, the sound intensity at any point appreciably off the axis of
the trumpet being very small.
Owing to the enormous loss due to viscosity and heat conduction
at high frequencies (see p. 321), it is impracticable to use sounds
of very high frequency for long-distance transmission in air. It
is an unfortunate fact that the range of transmission in air is a
maximum in the neighbourhood of 200 p.p.s. where the wave-
length of the sound is about 5 ft. A source of 'large area'
operating at such a wave-length would be out of the question.
Under water, however, Langevin, Boyle, and others f have used,
with a certain amount of success, quartz ' piston ' sources at very
high frequencies 50,000 to 100,000 p.p.s. The wave-length in
these cases is relatively short, of the order of 1 to 2 cm., con-
sequently a piezo-electric source 30 or 40 cm. in diameter would
emit a tolerably 'parallel' beam (see p. 149). The applications
of such sound transmitters have already been considered.
Multiple Sources - The double-source, consisting of twoadjacent simple sources vibrating in opposite phase, was shown
(p. 66) to exhibit directional properties. A vibrating diaphragm
supported in an annular ring, and freely exposed to the medium (air
or water) on both sides, behaves as a directional source (pp. 156 and
416), the sound intensity being a maximum in front of, or behind,
the diaphragm, and zero in the plane of the ring. The prong of a
* See Ency. Brit., 13th ed. (supplementary vols.), article on ' Sound,'A. O. Rankine. f hoc. cit., pp. 146 and 471.

2l8 DIRECTIONAL SOURCES OF SOUND
tuning-fork exhibits similar properties, due to the interaction
between the two sets of waves which radiate, in opposite phase,
from the two sides of the prong. The principle may be extended
to a large number of simple sources, suitably spaced, which maybe vibrating in the same phase. Suppose we have 'm' sources
spaced at equidistant intervals ' d ' along a straight line and vibrating
with the same frequency N, amplitude, and phase (see fig. 67a).
We require to know the polar distribution of amplitude in any
plane passing through the line of sources. It simplifies matters
if we arrange that the maximum resultant amplitude at a distant
(— dFig. 67A
point P is equal to unity, each transmitter having an amplitude
l/m. If the motion of each source is represented by — cos 277N*,m
the resultant displacement at a point P oriented at an angle a with
respect to the line of sources, will be
If [ x\ I (m— l)xR'=-Jcos27rN*+ cos2t7(N*+- )+ • • • + cos 2tt(N*-|-
v—-'
)}
The summation is conveniently performed vectorially, since each
source has the same amplitude l/m and is displaced so as to make
a phase angle P=2ttx/\ with the previous one. The magnitude
of the resultant vector (closing the polygon) represents the magni-
1 sin (mB/2}tude of the resultant amplitude — .
—
—
. -.^. (see p. 17) and itsm sin (p/2)
phase by (27rNz+(m— l)j8/2). Expressing the orientation a by
cos a=x/d, the resultant displacement at P therefore becomes
R'
mudsin l
——- . cos a\ A
ni ird
I
-7- • cos a
, Lt {ni-X) d )COS 2tt\ Nt-l- 1—
. - . COS a r12 A J
the term in square brackets being the resultant amplitude R at P.
, nd , _. sin mcf) .
Writing 0= — . cos a, we have R=—:—7, which has maximumb X msm(p

MULTIPLE SOURCES 219
values when </>=0 and 2tt. Between these positions there are
(m— 2) secondary maxima whose positions, since dR/d</)=0, are
given by the transcendental equation
m tan (/> = tan mcf),
which may be solved graphically. Combining in this equation
the value of R, we find
R8= l/(wa sin2</>+ cos 2 m^),
Fig. 67B
which is the equation of an ellipse of semi-axes 1 and l/m. Theextreme values of R, i.e. the primary and secondary maxima, all
lie on this ellipse. The greater the number of sources, the flatter
the ellipse, i.e. the more sharply directional is the 'ellipsoidal
disc' of sound. The exact positions of the secondary maximamay be obtained by solving the transcendental equation graphically.
The positions are given approximately by sin a=3X/2md> 5X/2md,
etc. Beyond m=6 the ratio of primary maximum to the largest
secondary maximum hardly increases, the increase in the numberof simple sources beyond this value therefore serves no useful
purpose. By suitably choosing the ratio d/X, many primary and
secondary maxima may be obtained between a=0 and a =77/2,
there being always (m— 2) secondaries between each pair of
primaries. The case of m=6, d=X/2 is shown in the polar curve,
fig. 67b. The value of R is zero whenever sin (77/2 . m cos a)
is zero, i.e. whenever m/2 . cos a is an integer. In the example
illustrated (m=6, d=X/2), the directions of zero amplitude in the
first quadrant are given by a =10° 48', 48° 42', and 0°, with inter-
mediate maxima as shown. The simple treatment of a line of
multiple sources given above includes, of course, the case of the
double source m=2ywhich has primary maxima at a =90° and 270°
and no ((m—2)=0) intermediate secondaries. When d=X the
primaries occur at 0° and 180°. If d is greater than A there are
more than two primaries. For further examples the reader is

22o MOTION OF VIBRATING BODIES
referred to the original paper by H. Stenzel * which deals with
the theory of numerous types of directional source. From the
above, it will be seen that a vertical line of equally spaced sources,
A/2 apart, will give a definite concentration of energy in a hori-
zontal plane at right angles to the line of sources. The import-
ance of such an arrangement as a fog- signalling device, where a
maximum energy-concentration is required in a horizontal plane
surrounding a light vessel, will be realised.
In a similar manner it may be shown that a number of equi-
distant sources arranged on a circle will give a primary maximumof intensity on the axis, with a number of zero and secondary
maxima positions as in the case of a disc.
[A lightning flash may be cited as an example of an irregular line
source of sound. Along the track of the flash we may regard the
generation of heat as uniform and instantaneous. Certain parts
of the compression pulse thus initiated arrive at the observer at the
same instant, whilst others follow at intervals depending on the
track of the flash. The effect observed by the ear is a more or less
continuous rumble broken up by short periods ofincreased intensity.
The duration of this irregular rumble depends, of course, on the
distances of the various extremities of the flash from the observer.]
The directional beam of sound obtained by means of multiple
sources may be rotated either by direct mechanical rotation of the
line of sources, or alternatively by giving artificial phase displace-
ments (e.g. electrically) to the individual sources. In the latter
case, the line of sources is fixed and the polar distribution is varied
in accordance with the relative phase changes imposed on the
sources (see also binaural compensator, p. 413, where this
principle is applied to directional reception of sound).
The directional and intensifying properties of trumpets, horns,
and concave reflectors used with small point sources of sound have
already been considered (see p. 193).
Some Methods of Observing the Motion of
Vibrating Bodies
The blurred outline of a vibrating string or the prong of a
tuning-fork is an indication that the string or the fork is in vibra-
tion with a double amplitude corresponding to the limits of
blurring. Beyond this, however, very little is revealed to the eye.
The slow to-and-fro motion of a pendulum can be followed fairly
* Electrische Nachrichten Technik, Bd. 4, Heft 6, p. 239, 1927, andp. 165, May 1929.

OPTICAL MAGNIFICATION 221
closely by the eye, but as the frequency increases the separate
swings are eventually merged into a general 'blur.' In the case
of a body vibrating with a small amplitude at high frequency it
is necessary to adopt special means to record the vibrations, or
to make them appear sufficiently 'slow' and sufficiently great in
amplitude for inspection by the eye. This may involve (a)
mechanical or optical magnification of the vibrations, (b) graphical
or stroboscopic methods of viewing. The vibrations of gases and
liquids have been studied indirectly by means of various forms of
microphone (e.g. the hot-wire type), and more directly by means
of manometric flames and membranes, and by methods of inter-
ferometry. In the following brief summary, however, we shall
be more directly concerned with the motions of vibrating solid
bodies, e.g. wires, rods, or diaphragms. The large-amplitude
vibrations of the prong of a massive tuning-fork, or any similar
vibrator, may be mechanically recorded on a smoked surface which
is moving at right angles to the line of vibration. A stiff wire or
bristle attached to the prong is allowed to touch the smoked
surface as lightly as possible. The recording surface may, for
example, be a flat plate of glass or metal falling past the vibrating
fork under the action of gravity, in which case the wavy line traced
by the bristle is drawn out as the plate accelerates. The period
of vibration is then obtained from
HJ^-m\ g
where lx and /2 are the successive lengths traversed on the plate in
m oscillations of the vibrator. The tuning-fork records shown in
fig. 37 were obtained by the 'dropping plate' method. As an
alternative, the record may be made by tracing a wavy line on the
smoked surface of a metal cylinder or disc rotated at a constant
known speed. This principle is used in the case of a gramophonerecorder, in which a vibrating diaphragm is connected by meansof a lever to a cutting stylus which engraves the vibratory motion
on the revolving disc. Such methods of direct recording are only
possible where the mass and amplitude of the vibrator are both
large and the friction and mass of the bristle are negligible. Themethod is unsuitable, for example, to record the vibrations of a
thin string vibrating with a small amplitude. In this case, an
optical method is preferable. The motion of the string may beviewed in a rotating mirror if a speck of chalk dust be attached to
the string and brightly illuminated. A better method, which is

222 MOTION OF VIBRATING BODIES
employed in the Einthoven string oscillograph, is to project a
magnified image of an element of the string on a revolving mirror
or a photographic film. If the string is very thin, e.g. an Einthoven
fibre 1/x or 2/x diameter, a microscope objective is used to focus
light on it, whilst a second high-power objective and an eyepiece
project a magnified image on the slit of the recording camera.
Details of the arrangement may be found in electrical textbooks.*
The following methods of obtaining large mechanical and optical
magnification of the displacement of the vibrating body are
instructive. They have a wide application in the experimental
study of vibrations.
(1) In certain cases, e.g. the transverse vibration of a diaphragm
or a reed, some part of the vibrating surface tilts through a small
angle relative to its equilibrium position. Provided the mass
of the vibrator is not too small, a minute fragment of mirror (e.g.
an oscillograph mirror, about 1 mm. square, of silvered micro-
scope cover-glass) should be attached at a point where the angular
motion is greatest, e.g. at a point about half the radius from the
centre of a diaphragm. The linear oscillation of a spot of light
reflected from the small mirror to a revolving mirror or photo-
graphic plate, at a distance d from the diaphragm, will be 2dd,
where 6 is the angular oscillation of the small mirror.
tirrup
A N Diaphragm
Fig. 68
Mirror (1-5 mm. side)
tip brought into contact
with diaphragm
(2) Method (1) requires a fairly large amplitude of vibration
as the optical magnification is small. A great improvement in
the method is due to A. E. Kennelly,f who made use of a high-
frequency optical lever of very light construction to explore the
small amplitude vibrations of a telephone diaphragm. In this
method, a small triangular mirror (about 1| mm. side) is attached
rigidly to a phosphor bronze strip (as used for galvanometer
suspensions) which is stretched tightly on a metal stirrup. The* E.g. see Irwin's Oscillographs (Pitman),
f Electrical Vibration Instruments.

OPTICAL MAGNIFICATION 223
tip of the mirror is arranged to press lightly on the part of the
vibrator of which the motion is required, and is adjusted to makean angle of about 45° with the direction of vibration. Themagnification factor M of the arrangement shown in fig. 68 is
2D/^cos(/». For 2D =50 cm., d=0-05 cm., <£=45°, M=1400approx. It is necessary of course that the natural frequency of
the small mirror on its phosphor bronze ' spring ' is considerably
higher than the frequency of the diaphragm under test. Also
it is necessary that the inertia of the mirror system should not
appreciably affect the vibrations of the diaphragm. This optical
lever gives a large magnification of the diaphragm movements,
a small linear displacement of the diaphragm producing a large
angular displacement of the small mirror and a correspondingly
large deflection of a spot of light reflected from it to the distant
rotating mirror or film. A good optical arrangement for use with
such small mirrors is shown in fig. 69. The method is metrical
and may be used to determine the actual amplitude of vibration.
Large PinholeCondenser
Arc
or pointolite
I.JFocussing
tens Mirror
VA
Condenser(microscope
objective)
Slit
Screen or film
Fig. 69
A somewhat similar method has been employed by the writer
in certain types of oscillograph.* Two forms of this arrangementare shown in fig. 70 adapted for longitudinal and transverse
vibrations respectively. A small oscillograph mirror M (about
2 mm. long by 1 mm. wide) is mounted by means of rubber
solution across two parallel knife edges as shown. The rubber
Vibrating
MVibrating Fixed
tZ
-Fixed
Fig. 70
solution, after setting, holds the small mirror tightly, as withan elastic band, down to the knife edges. Vibration of one of
* See A. B. Wood, ' Piezo-Electric Oscillographs,' Phil. Mag., 1, p. 631,Sept. 1925.

224 MOTION OF VIBRATING BODIES
the latter causes the mirror to rock on the other as a pivot. If
d is the effective distance apart of the knife edges and D the
distance from the mirror to the film or rotating mirror, the optical
magnification is 2~D/d. This may be as great as 10 4. The method
illustrated in fig. 70 has a useful application in a simple form
of oscillograph in which the vibrator is the reed of a Browntelephone earpiece. For moderately low frequencies this oscillo-
graph is extremely convenient in a laboratory.
(3) Another method, involving an optical lever device, is
illustrated in fig. 71, in which R is a polished cylinder of steel
and M is a small mirror rigidly attached to it. The cylinder is
Vibrating
/ Fixp.ci \Fixed
End view of rolling wire Side view - showingmirror M attached to wire
Fig. 71
held by a light pressure between a polished fixed surface and the
vibrating surface (also polished). The oscillations of the vibrator
cause the cylinder (a hard wire of polished steel) to rotate back-
wards and forwards with corresponding movements of the spot
of light reflected from the mirror M. Assuming there is no slip,
the optical magnification will be 2D/r, where r is the radius of the
wire and D the distance from the mirror to the point of observa-
tion of the spot of light. With a wire 1 mm. in diameter the
amplitude of the spot of light at 1 metre distance will be 4000 times
that of the vibrating surface in contact with the wire. Themagnification may be still further increased by reducing the
diameter of the wire, always ensuring that the wire with its
attached mirror behaves as a rigid system.
The motion of a vibrating surface has also been observed by
means of optical interferometry, the displacement of a system of
interference fringes, formed between the vibrating surface and
a fixed surface, indicating the movements of the vibrator. These
methods have been employed by Topler, Boltzmann, Raps,
Webster, and others (loc. cit.).
Stroboscopic Methods* - If a body is in motion and is illumi-
nated for a sufficiently short period of time it will appear to be at
* A comprehensive summary of stroboscopic methods is given by
J. F. Crowley in The Illuminating Engineer, p. 189, Aug.-Sept. 1923.

STROBOSCOPIC OBSERVATION 225
rest. If the motion is periodic, then by suitable devices, the body
may be exposed or illuminated at successive instants whilst it is
passing through the same space interval in the same direction.
The resultant effect of such successive momentary exposures is
equivalent to a prolonged continuous exposure. Devices which
give the appearance of rest or of slow motion to bodies in rapid
motion are known as stroboscopes.* There are four possible
ways in which the necessary interruption of vision for stroboscope
observation may be achieved, viz. by an interruption (1) of the
light between the object and the eye, (2) between the illuminant
and the object, (3) of light at the object, and (4) of the illuminant
itself. Methods (1) and (3) involve the mechanical operation of
some form of shutter at the correct frequency, such as a rotating
disc with a radial slit (or slits) which periodically comes into the
line of vision or allows the light to fall on the object. Plateau's
disc with radial slits was first used to determine the speed of
revolution of wheels and shafts. A disc with corresponding
markings was placed on the rotating shaft and illuminated bylight rendered intermittent by the slotted disc. Stroboscopic
beams of light, interrupted by such a disc placed at a focus, are
similarly used to view vibrating objects (wires, reeds, etc.).
C. V. Drysdale introduced the use of a stroboscopic tuning-fork, of
known frequency with shutters attached to the prongs, to produce
the necessary interruptions in the light. He also employed a
more elaborate disc with geometrical patterns of various shapes
for the motor-shaft, and was thus able to measure speeds in steps.
A somewhat similar apparatus, with prongs of adjustable fre-
quency, is known as the " Crompton-Robertson" stroboscopic
vibrator. In a more recent arrangement Drysdale uses the tuning-
fork to drive a phonic motor (see p. 126) with a conical drum fromwhich a slotted disc is driven by friction.f The speed of the disc
is controlled by varying its position of contact with the conical
drum, and a continuous adjustment of frequency is thus obtained.
In a still later form the slits are replaced by electrical contacts
which ' flash ' a neon lamp at the required synchronising frequency
(see Method (4) below). A good example of type (1) stroboscope
is known as the Ashdown 'rotoscope.' It consists essentially of a
viewing slit in front of which revolve a number of vanes which
permit the vibrating or rotating object to be viewed inter-
* The first practical instrument of this kind, a slotted disc for viewinga vibrating tuning-fork, is ascribed to Plateau, 1801-1883.
t The Roller Stroboscope—manufactured by H. Tinsley & Co.l 5

226 MOTION OF VIBRATING BODIES
mittently. The shutters are spring-driven, and the speed is easily
controlled and indicated on dials. The vibrations of a tuning-
fork or a string are very effectively made to appear ' stationary ' or
'in slow motion' by this apparatus. It is extremely convenient
also for viewing the vibrating reeds of a frequency meter, as
suggested on p. 41, to demonstrate phase effects near resonance.
Rotating and vibrating mirrors are frequently used for strobo-
scope work. Konig and Wheatstone both used a revolving set
of four plane mirrors to observe the fluctuations in height of a
vibrating flame. When the mirrors are rotated fast enough the
images appear as a saw-like band across the mirrors. A similar
application of rotating mirrors is used to observe the movementsof a spot of light or the image of a fibre in the Duddell and
Einthoven oscillographs. The appearance on the mirrors of the
rapidly vibrating spot is a continuous curve which represents the
instantaneous values of current or voltage applied to the oscillo-
graph. The British Woollen Research Association has recently
devised a similar mirror stroboscope for viewing high-speed parts
(spindles, etc.) in spinning-machines. Method (3), viz. interrup-
tion of the light at the object itself, is exemplified in a device due
to M'Leod and Clark (1870), who used a cylindrical drum rotating
about a vertical axis and covered on its curved surface with black
paper ruled with white lines parallel to the axis and spaced about
an inch apart. A horizontal beam of light, controlled by a mirror
on the vibrating body, is projected on this drum, its oscillations
being parallel to the white lines. When rotating at the correct
speed, a white curve is seen representing the wave-form of the
vibrations. This method is applied in the Hilger audiometer
(p. 437), in which an extremely thin collodion membrane with a
' sputtered ' silver mirror attached reflects a beam of light on the
striped drum. The black parts of the drum are used to intercept
the light to the eye, whilst the white parts reflect. When the wave
appears stationary the frequency of vibration must be the product
of the number of white lines and the revolutions per second of the
drum (or a multiple of this). In Method (4) the source of light
itself is cut off periodically. The introduction of the neon lamp *
(1911) has rendered this method practicable and extremely con-
venient. The lamp, filled with neon gas at reduced pressure,
glows brightly with a reddish coloured light when 180 volts, or
thereabouts, are applied to its electrodes. If the voltage is re-
duced to, say, 150 volts the discharge fails and the light disappears.
* Now supplied commercially as the ' Osglim ' lamp.

STROBOSCOPIC OBSERVATION 227
The effect of varying the voltage outside these limits produces
practically instantaneous response in the glow. It may, in fact,
be used as an intermittent light-source up to a frequency of the
order of 10,000 p.p.s. The flashing of the lamp may be controlled
by the Anson-Pearson method.* Using a condenser C in parallel
with the lamp and a resistance R in series, the flash frequency
may be adjusted by varying C or R. More generally, however,
the lamp is operated by a tuning-fork fitted with electrical con-
tacts which interrupt the primary current of a small induction
coil, the secondary of which is connected to a neon lamp. This
gives flashes of a fixed frequency. Alternatively the frequency maybe varied by means of a commutator revolving at any required
speed.
All the above methods depend for their success on the physio-
logical effect known as 'persistence of vision.' If the frequency
of interruption falls appreciably below 25 p.p.s. a definite 'flicker'
is observed and the image on the retina appears no longer con-
tinuous. The methods are only applicable, of course, where the
amplitude of the motion is easily perceptible to the naked eye.
For this reason it is often necessary to introduce the methods of
optical and mechanical magnification (mentioned above) before
viewing stroboscopically.
* Proc. Phys. Soc, 34, pp. 175 and 204, 1922.


SECTION III
TRANSMISSION OF SOUNDThe motion of a vibrating body is communicated to an elastic
medium with which it is in contact and longitudinal waves are
produced. The velocity with which these waves travel through
the medium is dependent, as we have seen, on the fundamental
physical quantities, elasticity and density. In fact, the satis-
factory agreement between the observed and calculated velocity
of sound waves is sufficient evidence of the longitudinal nature
of the vibrations. When sound is transmitted through an
'infinite' medium it may spread spherically, or may, theoretically
at any rate, remain in the form of a parallel beam of plane waves.
In either case there is a diminution of intensity or attenuation,
as the distance from the source increases, due to losses of a
frictional character, viz. viscosity and heat conduction. Whenthe sound waves near the source are of large amplitude, attenu-
ation (or degradation) becomes extremely serious and the wave-
velocity is also affected. Again, an infinite medium for sound
propagation is a mathematical fiction. All media capable of
transmitting sound are limited in extent, and sooner or later the
wave must stop, or change from one medium to another. Obstacles
in the medium give rise to the phenomena of reflection, refrac-
tion, interference, diffraction, etc., all of which we shall have to
consider.
VELOCITY OF SOUND WAVES OF SMALLAMPLITUDE
The velocity c of small-amplitude elastic waves in any extended
medium is given by equation (17), p. 52, viz. c= Vk/p, where k is
the appropriate elastic constant and p the normal density of the
medium. It is important to note that the variations of density
Sp involved in the transmission of the wave are always small
compared with p, otherwise the relation for c is no longer valid.
With regard to the elastic constant k, this is the bulk modulus of
elasticity in the case of a fluid medium. Solids, however, change
in shape as well as in volume, consequently the coefficient of
rigidity /x must be introduced and k replaced by k'+-|/x.
229

230 VELOCITY OF SMALL-AMPLITUDE WAVES
(A) Velocity of Sound in Gases
Newton made the first theoretical estimate of the velocity of
sound in air, assuming that the relation between pressure and
density was that given by Boyle's law, i.e. p/p=po/Po=constant.
On this assumption the bulk modulus of elasticity k (see p. 51) is
dp dp por Po^-=Po-
dv/v dp p
The velocity c will therefore be
c= Vk/Po=VpJPo (1)
for small variations of p . Taking p = 10 6 dynes/cm. 2 approxi-
mately and p =0-001293 for air at 0° C, the velocity c would be2-78 xlO4 cm./sec, which is about 16 per cent, lower than the
observed value. This discrepancy was not satisfactorily explained
till Laplace pointed out the error in deducing the elasticity from
Boyle's law, which only holds at constant temperature. Nowthe compressions and rarefactions in sound waves take place so
rapidly that the heat developed in compression, or the cooling
in rarefaction, has not time to be transferred to the surrounding
medium. That is, the changes are not isothermal, but adiabatic,
and the relation between pressure and volume or density is
given by
^=const.=^) V or —=—. that is, p=py—*Py
Poy
Poy
where y is the ratio of specific heats. From this we obtain
~T=ypy~ l
—y> whence K=Po--=yp and c= Vyp /Po (2)dp Po
y dp
This is as we should expect, since
(Adiabatic elasticity) =y . (isothermal elasticity).
The value of y for air is approximately 1 -41 , consequently the value
of the velocity obtained from Newton's isothermal formula must
be multiplied by Vy, i.e. by 1-187. We then find c=3-3xl04
cm./sec. at 0° C, which is in good agreement with observa-
tion. This agreement appears to justify Laplace's assumption
that the changes taking place in the medium traversed by the
sound wave are adiabatic. Stokes has examined the question
theoretically and has shown that the elasticity must be either

VELOCITY IN GASES 231
isothermal or adiabatic-—any intermediate condition would involve
rapid dissipation of energy and the sound waves would not travel
an appreciable distance through the air, a result which is contrary
to experience.
Since the ratio pip is constant at constant temperature, i.e.
p changes in proportion to p, the velocity is independent of the
pressure. At very high pressures, however, where departures
from Boyle's law become noticeable, this is not strictly accurate.*
Influence of Temperature - The density of a gas varies with
temperature 6° C. in accordance with the relation pe =p /(l +a#),
where a is the temperature coefficient of volume-expansion at
constant pressure. The velocity ce at temperature 6° is therefore
ce=Vrp (l+ad)/p =c V(l+ad).
Now for any gas a= 1/273 per degree Centigrade nearly, therefore
cjc„=VT/T ... (3)
where T and T are the absolute temperatures corresponding to
6° and 0° C. That is, the velocity varies directly as the square
root of the absolute temperature.
Equation (2) indicates that the velocity is independent offrequency.
It is, however, dependent on the nature of the gas, since the
ratio of specific heats y and the density p are involved. Provided
y is the same, the velocity varies inversely as the square root of the
density. For example, the velocity is four times as great in
hydrogen as in oxygen. When the values of p, p, and c are knownthe value of y may be determined. This has direct application
to the determination of the ratio of specific heats of rare gases
(see p. 240).
Influence of Moisture - The velocity is only slightly affected
by the humidity of the air. The presence of water-vapour pro-
duces a slight lowering of mean density p, the value of the ratio
of specific heats y being practically the same for dry air or air
saturated with water-vapour. The calculated velocity in air
saturated with moisture at 10° C. is from 2 to 3 ft ./sec. greater
than in dry air.
Relation between Sound-Wave Velocity and Molecular
Velocity in Gases - As we have seen, the to-and-fro vibrations
of the medium are transmitted forward from layer to layer with
* Witkowski, Bull. Acad. Cracow, p. 138, 1899; and P. P. Koch,Ann. d. Physik, 26, p. 551, 1908.

232 VELOCITY OF SMALL-AMPLITUDE WAVES
a definite velocity. Regarded from the standpoint of the kinetic
theory of gases, this to-and-fro motion must be superposed on the
ordinary random motions of the gas molecules. The velocity
with which the ' sound wave ' is propagated must depend primarily,
for small-amplitude waves, on the velocity of the molecular move-ments. Disregarding at first the adiabatic changes of temperature
which take place due to rapid alternations of pressure in the sound
wave, it is a simple matter to deduce the velocity of sound in terms
of the velocity of the molecular movement. According to kinetic
theory, the pressure in a gas arises from the to-and-fro motions
of the particles and is transmitted in all directions due to this cause.
In determining the velocity of sound we have to consider the value
of that component of molecular motion corresponding to the
direction of the sound wave. Consequently it follows that the
velocity of sound must be less than the mean velocity of the mole-
cules which move at random in all directions. In confirmation
of this we know, for example, that in air at 0° C. the velocity of
sound is 331 metres/sec, whereas the molecular velocity is given
by ^ w 2 =485 and u =447 metres/sec. {y u 2 being the root meansquare velocity and u the mean velocity of the molecules). Thekinetic theory of gases shows very simply that the pressure in a
gas is given by
p=mmu2 =lpu 2 ... (4)
where N is the number of molecules per c.c, m the mass of a
molecule, and p the density of the gas.
This relation expresses the molecular velocity in terms of the
pressure and density of the gas, thus
u2JP .... (5)
P
Since the energy of the motion of the molecules in a given direc-
tion, e.g. the x axis, is one-third of the whole energy,* we may write
u~}J- .... (6)
?
where ux now refers to the component of molecular velocity along
the x axis. But ^ u 2 is identical with the velocity c of sound
waves through the molecular system. Thus we may write
c=^=JP- ... (7)
^_P* See O. E. Meyer, Kinetic Theory of Gases, pp. 18 and 74.

MOLECULAR AND SOUND VELOCITIES 233
which is Newton's 'isothermal velocity' of wave-propagation in
the gas. If we employ the mean molecular velocity u instead of
vu2 we must write (4) in the form
TTv/:p=^'p(u) 2 since Vu2 =u\/-^- • (
8)
which leads to
>(9)
P
As we know, this relation for the velocity of sound is inaccurate
since no allowance has been made for the local heating and cooling
of the gas, i.e. the local increase and decrease in velocity of the
molecules, as the sound wave passes through it. The ratio of
pressure to density only remains constant at constant temperature.
If the latter quantity is allowed to fluctuate we must introduce
the factor y, the ratio of specific heats of the gas. Thus equation
(9) for the velocity becomes
C=*\AW? <10
)
We arrive therefore at the simple relation which exists between
the velocity c of sound in a gas and the mean velocity il of its
molecules.
This relation also involves the ratio of specific heats of the gas,
a quantity which also can be derived from molecular data. It is
shown in textbooks on heat * that
2
r
where r is the number of degrees of freedom of the molecule.
For monatomic gases . . r=3 and y=l-66.
,, diatomic gases . . . r=5 ,, y=l-40.
,, triatomic gases . . . r=l ,,y=l-29.
It will be evident that a knowledge of the velocity of sound in a
gas, at known pressure and density, provides a powerful methodof determining valuable molecular data, viz. the mean velocity of
its molecules, the ratio of specific heats and the number of degrees
* See, for example, Preston's Heat, p. 289.

234 VELOCITY OF SMALL-AMPLITUDE WAVES
of freedom of the individual molecules. In this connection the
following table is of interest :
—
Gas.
ArgonHydrogenAir
Carbondioxide
Atoms Observedper Ratio of
Mole- Specific
cule. Heats, y
.
1 1-67
2 1412 140
3 1-30
Mean Molec-ular
Velocity,
cm./sec.
3-8 xlO4
174 „
447 „
3-6
ObservedVelocityof Sound,cm./sec.
3-08 xlO4
12-86 „
3-31 „
2-57 „
cm./sec.
3-08 xlO4
12-9 „
3-31 „
2-56 „
Equation (10), which gives the velocity of sound waves through
the gas in terms of the molecular velocities, implies a small-
amplitude sound wave, in which the additional velocities imparted
to the molecules in the direction of wave-transmission are not
comparable with the ordinary molecular velocities. An example
will serve to illustrate this point. A sound wave of frequency
2000 p.p.s. and displacement amplitude 10~ 8 cm. (a sound of
moderate intensity) will impart to the molecules in air a ' particle
'
velocity of 2-n x2000 x 10~ 8 cm./sec, i.e. 1-2 xl0~4 cm./sec, which
is quite negligible compared with the mean velocity of random
motion of the molecules 447 xlO 4 cm./sec The displacement-
amplitude of the molecule due to the sound wave is in this case
comparable only with the diameter of the molecule, of the order
10~ 8 cm., and is very small compared with the mean free path of
the molecules of the order 10-5 cm. at N.T.P. It is only in the
case of large-amplitude waves, which we shall consider later, that
the wave-velocity requires a correction for the particle-velocity.
(a) Experimental Determination of the Velocity of Sound
in Free Air
The velocity of sound in free air is affected by the wind. If
the component of the velocity of the wind in the direction of the
sound is v, then the observed velocity of sound will be c±vaccording as the wind is ' with' or 'against' the sound, provided
that v is constant and not unusually great (v 2/c2 negligible) at the
time of making the observations. The temperature and humidity
affect the velocity in the manner we have seen.
Earlier Determinations - The first recorded careful deter-
mination of the velocity of sound in the open air appears to have

VELOCITY IN FREE AIR 235
been made by certain members of the Paris Academy in 1738 by
what is now known as the method of reciprocal observation, which
eliminates the wind correction. Cannons were fired at half-hour
intervals alternately at the two ends of a base line 18 miles long,
and the intervals between the flash and the report were noted by
observers at each end of the base. Reduction of their observa-
tions gave a value of 332 metres/sec. in dry air at 0° C. A second
series of experiments was made at Paris in 1822 by the Bureau
des Longitudes. The method of reciprocal firing was used at
intervals of G.ve minutes, and accurate chronometers replaced the
pendulum clocks of the first series. At 15-9° C. the mean velocity
was found to be 340-9 metres/sec, whence c=331 metres/sec.
at 0° C. In 1864 Regnault improved the method of reciprocal
observation by the use of electrical recording, by which the
'personal equation' of the observer was eliminated. Regnault
found, however, that his receiver, a stretched membrane with
an electrical contact, also had a ' personal equation ' which varied
with the intensity of the sound wave. This error was evaluated
and a correction applied. The instant of firing was recorded by
the breaking of a wire, forming part of the electrical recording
circuit, stretched across the muzzle of the gun. The mean values
of velocity at 0° C. obtained were
From to 1280 metres .... c =331-37 m./sec.
„ to 2445 „ c=330-71 m./sec.
Whence from 1280 to 2445 metres . . c =329-9 m./sec.
The decrease of velocity with diminishing intensity is, as we shall
see later, in accordance with theory.
Observations of the velocity of sound at low temperatures
(—38° F. to +35° F.) were made in the Parry Arctic Expedition.
The reduced observations give a value 331 metres/sec. at 0° C, and
an increase with temperature of approximately 0-55 metres/sec.
per °C. A. W. Greely,* experimenting at temperatures between-10° C. and -45° C, gives a value of velocity 333+0-60 metres/
sec, where 6 is the temperature in degrees Centigrade.
In 1853 J. Bosscha f determined the velocity of sound by whatis known as the method of coincidences. The method was simplified
by Konig in Paris (1863). The velocity is determined as follows :
The sound (e.g. from an electromagnetic 'hammer' or 'tapper')
is transmitted, at regular accurately known time-intervals, simul-
taneously from two points at a known variable distance apart.
* Phil. Mag., 30, 507, 1890. f Pogg. Ann., 92, 485, 1854.

236 VELOCITY OF SMALL-AMPLITUDE WAVES
When the sources are close together the taps are heard together,
but when one source is moved further away the taps are separated
by an interval, at first increasing and then decreasing till they again
coincide. Increasing the distance continuously such coincidences
are observed at equal intervals of distance. Thus if N is the
number of signals per second and d the mean distance apart of
the points of coincidence, the velocity c will be Nd. In 1864
Kahl further simplified the method by using only one source of
sound, the other being replaced by the 'image ' of the first reflected
from a wall. The observer with the tapper moves away from the
wall, noting the points at which direct sound and echo coincide.
The velocity is then c=2N<i, where d is the distance apart of the
points of coincidence. In another modification of this methodthe distance apart of the two 'tappers' (or of one and its 'echo')
is fixed, whilst the number N of taps per second is varied until the
taps are heard simultaneously. The accuracy of timing in the coin-
cidence method is, according to Szathnari (1877), about 1/400 sec.
More Recent Determinations - Probably the most accurate
measurements of sound velocity in the open air were made during
the war in connection with location of guns by sound-ranging
methods (see p. 478). E. Esclangon,* employing a refinement of
Regnault's recording method, made an extensive series of velocity
observations during 1917 and 1918 at temperatures from 0° to
20° C. and under various conditions of wind and humidity. Thesound waves from guns of various calibres were received by
electrical detectors (e.g. the tuned hot-wire microphone, see p. 402)
at distances of 1400 metres and 14,000 metres along the same line.
The instants of arrival of the sound wave at the receivers were
recorded on an Einthoven string galvanometer, the time difference
being considered accurate to ±-002 second. The final result
for the velocity of sound in dry still air at 15° C. was given as
339-8 metres/sec, as compared with Regnault's value (obtained in
1864) of 339-7 metres/sec. Angerer and Ladenburg,f also re-
cording on an Einthoven string galvanometer, measured the time
interval between firing a charge of powder, which broke a wire in
the recording circuit, and the arrival of the impulse at a micro-
phone a known distance away. In the immediate vicinity of the
explosion (where the wave is definitely of large amplitude) • the
* Comptes rendns, 168, p. 165, Jan. 1919 ; and UAcoustique des
Canons et des Projectiles, p. 254, Gautier Villars, Paris, 1925.
t Ann. d. Physik, 66, 5, op. 293-322, Jan. 1922, and Engineering, 113,
p. 529, April 28, 1922.

VELOCITY IN FREE AIR 237
velocity was found to reach 1 150 metres/sec. At greater distances,
of the order of 10 km., the mean velocity, reduced to dry air
at 0° C, was found to be 330-8 ±0-1 metre/sec. T. Vautier *
has measured the velocity of weak explosive sounds such as are
produced by electric sparks or percussion caps of an unloaded
pistol. He gives a mean value for the velocity of small-amplitude
waves of 330-57 metres/sec. at 0° C. The value generally accepted
for sound-ranging purposes in the British and French armies was
337-16 metresIsec. in dry air, or 337-6 metres/sec. in air of average
humidity, at 10° C.
T. C. Hebb f has rightly pointed out that the accuracy of sound
velocity measurements over a long base (e.g. of several miles) is
impaired by uncertainties regarding temperature, wind, and
humidity at different points along the base line. He considers
that such sources of error, combined with errors due to personal
equation and different intensities of source, are sufficient to explain
the variation between different results. To overcome such diffi-
culties, Hebb, at the suggestion of A. Michelson, made a direct
measurement in ' free air ' of the wave-length of a sound emitted
from a source of known frequency. In this method, two parabolic
reflectors M. x and M 2 (of plaster of Paris, 5 ft. diameter, 15 in.
focal length) are placed coaxially so that sound waves sent out
from the focus of M 1 are collected at the focus of M 2 . At the
focus of each mirror is placed a telephone transmitter (carbon
granular microphone), the two transmitters T x and T 2 being each
connected in series with a battery and one primary winding of a
telephone transformer. The latter has two primaries and a
common secondary winding which connects to a pair of telephones.
In addition to the microphones, a source of sound, a high-pitched
whistle (2376 p.p.s.), was placed at the focus of Mt. The sound
heard by the telephones will be the vector sum of the effects at
T x and T 2 . By varying the distance apart of M x and M 2 the
relative phase of these effects will vary, at certain points annulling
and at intermediate points reinforcing each other. This affords
a direct method of measuring the wave-length A of the sound. If
the mirror M 2 be moved a hundred wave-lengths, and if the
minima can be located to a tenth of a wave, the value of A thus
obtained will be accurate to l%o- The temperature being knownat all points between the mirrors and the frequency of the soundof the whistle adjusted to that of an accurately calibrated tuning-
* Comptes rendus, 181, p. 1055, Dec. 1925.
t Phys. Rev., 20, p. 89, 1905, and 14, p. 74, 1919.

238 VELOCITY OF SMALL-AMPLITUDE WAVES
fork, the velocity is readily obtained. Hebb gives a mean value
of velocity 331-29 ±-04 metre/sec. at 0° C, as compared with a
mean for previous reliable determinations of 331-75 metres/sec.
Assuming the value 1-405 for the ratio of specific heats y, as deter-
mined by Rontgen, the calculated velocity is 331-80 metres/sec.
(b) Velocity of Sound in Gases contained in Tubes
The majority of determinations of the velocity of sound in air or
in other gases have been made with the gas enclosed in a pipe or
tube. The reasons for this are sufficiently obvious, for the experi-
ment is not only brought within the limits of a small laboratory,
but the methods, or at any rate some of them, are applicable in
the case of gases which are obtainable only in small quantities.
The tube method also makes it possible to study the effects of
variations in the factors which influence velocity, such as tempera-
ture, density, y, pressure, and humidity. As we shall see, whenwe have to deal with attenuation in the transmission of sound
waves (p. 317), the velocity of sound may be considerably modified
due to the effects of viscosity and heat conduction when the gas is
contained in a tube. The viscous forces and the heat loss in the
gas near the walls of the tube tend to reduce the velocity, the com-
pressions and rarefactions being no longer perfectly adiabatic.
In a very narrow tube, therefore, the velocity will tend towards
Newton's isothermal value Vp/p, Laplace's adiabatic velocity
Vyp/p being applicable to tubes of large diameter only. H.
Helmholtz,* and later G. Kirchhoff,f calculated the change of
velocity due to these causes. The velocity c in the tube of radius
a is given by
C' C
}
1W47tN['
where c is the ordinary velocity in a large volume of the gas, N is
the frequency of the sound, and v is a constant known as the
'kinemetic viscosity and heat conduction coefficient,' which is
equal to 2-5 p,\p (/x being the ordinary 'static' viscosity coefficient
and p the density of the gas (see p. 319). Experimental observa-
tions of the velocity of sound in pipes may be divided into two
classes, (a) those typified by Regnault's observations, in which a
direct measurement is made of the time taken for a sound pulse
(e.g. an explosion wave) to traverse a known length of pipe ; and
(b) those based on Kundt's method in which the gas contained in
* Crellesjourn., 57, p. 1, 1859. | Pogg. Ann., 134, p. 177, 1868.

VELOCITY IN GAS-FILLED TUBES 239
the pipe is set into resonant vibration, the velocity being deter-
mined from observations of wave-length and frequency.
Direct Method - V. Regnault (1862-3),* using the electrical
recording method, measured the time taken for the pressure wave
emanating from a small explosion to travel through the air enclosed
in tubes of various lengths up to 4900 metres, and diameters vary-
ing between 10 and 110 cms. In the longer tubes intermediate
receivers were sometimes used, and in all cases a record was made
of the successive reflected waves from the ends of the tube. Hefound that the velocity increased with the diameter of the tube,
reaching the ordinary value in very wide tubes. Thus in a tube
10-8 cm. in diameter c =324-25 metres/sec, whilst in a tube
110 cm. diameter c =330-3 metres/sec. at 0° C, in agreement with
calculation. Regnault also verified in these experiments that the
velocity is independent of pressure between 247 mm. and 12,670
mm. of mercury. Subsequent analysis of Regnault's observations
by Rink gives a mean value of the velocity, in a large diameter
pipe (110 cm.), for small-amplitude waves of 330-5 metres/sec. at
0° C. We shall refer again to these experiments when dealing
with waves of large amplitude. Further observations of a similar
nature to those of Regnault were made later by Violle and Vautier f(^=331-1 metres/sec.) and by the Phys. Tech. Reichsanstalt,
Berlin, 1907 (c=331-92 metres/sec. in dry air at 0° C. and free
from CO a).
Kundt's Dust Tube Method % - Reference has already been
made to this method as a means of observing the motion of air
in pipes (see p. 178). Its main importance lies, however, in the
application to the measurement of the velocity of sound in small
quantities of gas under controlled conditions of temperature,
pressure, purity, etc. In the simplest arrangement the gas
is contained in a cylindrical glass tube (say 5 cm. diameter and
about 80 cm. long) containing a sprinkling of fine, dry powder(lycopodium seed or cork dust), and is thrown into resonant
vibration by any convenient means, e.g. (1) by the longitudinal
vibrations of a rod (clamped at the mid-point), one end of which
is inserted in the tube; or (2) by similar vibrations set up bystroking the glass containing-tube ; or (3) by means of electro-
magnetic, piezo-electric, or other form of vibrator mounted at
* Comptes rendus, 66, p. 209, 1868. f Phil. Mag., 26, p. 77, 1888.
% A. Kundt, Pogg. Ann., 127, p. 497, 1866, and 135, pp. 337, 527,1868.

240 VELOCITY OF SMALL-AMPLITUDE WAVES
one end of the tube. At resonance, the dust is thrown into
vigorous vibration, forming heaps or discs at equidistant intervals
along the wave-tube (see fig. 57, p. 181). The distance apart
of these discs can be measured with considerable accuracy, and
is equal to half a wave-length of the sound in the gas contained
in the tube. The velocity c=Vyp/p=N\=2Nd, where N is the
frequency, A the wave-length, and d the distance apart of the dust
heaps in the tube. In order that the experiment shall be successful
it is necessary that (a) the vibrator (e.g. the end of the rod) at the
end of the glass tube shall not be seriously damped by touching
the walls of the tube, (b) the length of the tube shall be adjusted
accurately for resonance, and (c) the interior of the tube and the
dust shall be carefully dried—the tube should preferably be
rotated so that the dust is on the point of slipping. If the
vibrations are set up by electromagnetic means as from the
diaphragm of a ' loud speaker ' or telephone excited from a valve-
oscillator, the length of the tube may be fixed and the frequency
of excitation varied until resonance occurs. The experiment is
capable of a number of variations having important applications
:
(1) Absolute determination of velocity of sound in a gas, the
frequency N of the sound being found by recognised methods
c=NX (\=2d).
(2) Comparison of velocities of sound in a gas and in a solid
rod (the longitudinal vibrations of the rod setting the gas in the
wave-tube into resonance),
cgas=NAgas=2NJ and £rod =NArod =2N/
(Z=length of rod).
Therefore d/l=cgJcTOd .
(3) Comparison of velocities of sound in two different gases
(double-tube method). The same rod is used to excite resonant
vibrations in two wave-tubes, one at each end. Then if d± and
d2 are the respective nodal separations in the tubes, and cx and
c2 the corresponding velocities, d1/d2 =c1/c2 .
(4) Determination of the ratio of specific heats y of a gas.
The method is the same as in (1), c= Vyp/p=2Nd,
whence y=4=N 2d2p/p.
When gases are available in small quantities only (e.g. argon,
helium, krypton, etc.) this is the only known experimental method

KUNDT'S DUST-TUBE METHOD 241
of determining y. It is also the most convenient method for the
determination of y for vapours of volatile liquids.
(5) Measurements of the variation of velocity with temperature,
pressure, humidity, or with the nature of the gas. The velocity
of sound in mixtures of gases and in vapours has been measured
by this method.
The value of the velocity determined by Kundt's tube is, of
course, subject to the Helmholtz-KirchhorT correction for the
radius of the tube (see p. 238). The correction may be eliminated
experimentally in the following manner :
—
Writing VV/47rN=& (see p. 238), the velocity in a tube
of radius ax is c1=c(l —k/a^), and in a tube of radius a 2 the velocity
c2 =c(l —k/a2), for the same gas and frequency of excitation. Thuson eliminating k, the velocity c in a large volume of gas is given
by c =(a2c2— diC1)/(a2—
a
x) . The relative values of cx and c2 maybe found by direct experiment by the double-tube method
(3) above, enclosing the same kind of gas in tubes of different
radii, and using the same source to excite the vibrations. The two
prongs of a tuning-fork may alternatively be used to excite the
two tubes.
By the dust-tube resonance method, Kundt showed for a given
gas that the velocity increased with the diameter of the tube and
with the wave-length (as Kirchhoff's correction indicates). Heshowed also that the velocity was independent of the pressure
and proportional to the square root of the absolute temperature.
Values of the velocities in different gases were also obtained in
terms of the velocity in air. No tube correction is required in
this comparison if tubes of equal diameter are employed for the
gases to be compared.
Kundt and Warburg # determined the ratio of specific heats
of mercury - vapour by the double-tube method. One tube
contained air and the other mercury-vapour at high temperature,
fine quartz dust being used to indicate the nodal points. Thevalue of y obtained was 1-66, indicating the monatomic nature
of the vapour. Rayleigh and Ramsay f determined y for argon
and helium by Kundt's tube method, obtaining a value of T66in each case. Behn and Geiger J have introduced a modification
of the double-tube method for use in such cases where the gas
is chemically pure and must necessarily be enclosed. The gas
* Pogg. Ann., 157, p. 353, 1876.
t Phil. Trans., 186, p. 187, 1895, and Proc. Roy. Soc, 8, p. 86, 1895.
X Verh. d. Deuts. Phys. Ges., 9, p. 657, 1907.
16

242 VELOCITY OF SMALL-AMPLITUDE WAVES
is led into a closed wave-tube by a T-piece at the midpoint,
which is clamped. The wave-tube is excited into vibration by
stroking or by electromagnetic means, and its frequency is tuned
to that of the enclosed gas by loading the ends. One end is then
inserted into the air-wave tube for comparison of velocities, the
vibrations of the closed wave-tube serving to excite both 'gas'
and air columns into resonance.
The method of excitation of the dust tube employed by Andrade
and Lewer (see p. 179) permits of considerable accuracy in the
measurement of the antinodal distance (A/2) between the 'dust
discs ' and of the frequency (N) of resonant vibration—data which
yield an accurate value of velocity (NA). The method is extremely
simple in practice, and many interesting phenomena relating to
the amplitude and direction of vibration of the air particles in
different parts of the tube are readily observed.
Kundt's method of determining the ratio of specific heats of
gases lends itself to a study of the number of atoms per mole-
cule in gases. Einstein # has suggested that it might be applied
to cases of partial dissociation, e.g. N 2 4~j^2N0 2 .
Velocity by Resonant Gas Column - In Kundt's methodspecial means are employed for indicating resonance in a column
of gas and for measuring the length of the stationary waves set
up in the tube. In discussing the modes of vibration of a column
of gas in a wide tube closed at one end (p. 171) it was shown that
the fundamental frequency N is given by c/4/ (where / is the
effective length of the tube), and the frequencies of the overtones
were 3, 5, 7, etc. times that of the fundamental. Consequently
if N and the effective length / are known the value of c for the
gas contained in the tube may be determined. The end correction
8 at the open end of the tube may be eliminated by finding two
successive lengths, l± and /2 , of the tube which resonate to the
same frequency N, the difference between these lengths (l2— h) must
be equal to half a wave-length of the sound in the tube (see p. 171);
the successive resonating lengths will be (A/4— 8), (3A/4— 8),
(5A/4— 8), and so on, each differing by A/2 from the one on either
side of it. This provides a useful laboratory method of measuring
the velocity of sound (c=NA) in air, a tuning-fork of known fre-
quency N being used as the source of sound. The successive
resonant lengths, adjusted aurally, may be obtained by a gradual
variation in the height of a water column closing the lower end
of a vertical tube. D. J. Blaikley f carried out an extensive
* Berlin Ber., 3, 380, 1920. f Proc. Phys. Soc, 6, p. 228, 1884-5.

VELOCITY IN TUBES 243
series of measurements of a similar nature to this. He used a
tube with a pear-shaped cavity near the mouth of a cylindrical
portion which was closed at the other end by a sliding piston.
The pipe was excited by blowing, and the object of the pear-
shaped mouth was to render the natural overtones of the pipe
inharmonic, and therefore would not affect the fundamental
vibration in any way. The tube was made to 'speak' with a
certain position of the piston, then the latter was moved outwards
to a second position which gave the same note. The distance
between the two positions of the piston is equal to A/2. Experi-
menting with tubes of various diameters, Blaikley obtained good
agreement with the KirchhofT velocity formula given on p. 238.
His final value for the velocity of small-amplitude sound waves
in free air at 0° C. was 331-68 metres/sec, and the ratio of the
specific heats T4036. G. W. Pierce* has recently used a
modification of this method as an instrument of precision. His
apparatus is shown in fig. 72. A brass resonance tube 120 cm.
Fig. 72
long and 4 cm. internal diameter, provided with a piston and
scale, was mounted in a felt-lined box containing also a telephone
earpiece S and a microphone M as shown. The telephone was
excited electrically from a tuning-fork of known frequency (995-88
p.p.s.). The distances between S, M, and the tube were so
adjusted that the sound direct from S to M just neutralised the
sound from the tube to M when the sound emitted by the tube
was a maximum. This gave a fiducial point of silence in the middle
of what would otherwise be a maximum, thus permitting of very
accurate setting and measurement of the half wave-length dis-
placements of the piston. The microphone M communicatedthrough a transformer with a telephone receiver on the head of
the observer. By means of an electric filter in this circuit the
fundamental frequency of the sound (995-88 p.p.s.) could be cut
* Proc. Amer. Acad., 60, p. 284, 1925. See also G. D. West, Journ.Set. Instrs., 6, p. 254, Aug. 1929.

244 VELOCITY OF SMALL-AMPLITUDE WAVES
out, and the harmonic 3x995-88 (=2987-8) p.p.s. used instead.
Pierce found for the velocity of sound in air 331-94^0-07 m./sec.
at 0° C, uncorrected for the effects of the tube.
Velocity of Sound in Gases and Vapours at Different
Temperatures - The resonance tube methods of determining
the velocity of sound in gases and vapours have been employed
by numerous investigators. E. H. Stevens* determined the
velocity in air and various organic vapours at temperatures
between 0° and 185° C. A. Kalahne,f using a somewhat different
arrangement, a telephone diaphragm exciting the tube into
resonance, worked up to temperatures of 900° C. In both cases
the velocity was found to vary as the square root of the absolute
temperature. Dixon, Campbell, and Parker J made observations
of velocity in argon, nitrogen, C0 2 , and methane at temperatures
from 0° to 1000° C, whilst S. R. Cook § measured the velocity
in oxygen and air at various temperatures down to —183° C.
(see following table in which velocities are expressed in metres
per second).
0° C. 300° 600°. 1000°. Observer.
Argon .
C0 2 .
MethaneNitrogen
308-5
258-3
429-2
337-5
446-5
369-3
587-3
487-2
551-1
450-9
709-2
599-4
665-5
572-5
720-6
Dixon, Camp-bell, andParker.
+ 21° C. -28-4°. -66-5°. -137-5°. -183°.
Oxygen . 328-5 282-4 264-3 210-1 173-9 S. R. Cook.
Cook's observations indicate a fall of velocity with temperature
somewhat greater than theory predicts on the assumption of con-
stant density and ratio of specific heats.
Measurements of the velocity in water vapour by various
observers||give values increasing from 401 metres/sec. at 0° C.
to 424 metres/sec. at 130° C.
* Ann. d. Phys., 1, p. 285, 1902.
f Ann. d. Phys., 11, p. 225, 1903, and 20, p. 398, 1906.
% Proc. Roy. Soc, 100, p. 1, 1921.
§ Phys. Rev., 23, p. 212, 1906.
|| W. Jaeger, Wied. Ann., 36, p. 165, 1889 ; W. Trietz, Dissert. Bonn.,1903 ; and A. Lechner, Wiener. Ber., 118, p. 1035, 1909.

VELOCITY OF SOUND IN LIQUIDS 245
(B) Velocity of Sound in Liquids
The relation c= Vk/p for the velocity of sound in gases is
equally applicable to liquids in bulk. Strictly speaking, we must
also use the adiabatic coefficient of volume elasticity y/c, not the
isothermal value found by static measurements. It is true that
in certain cases the difference between isothermal and adiabatic
volume elasticity is small, thus for water at 8° C. y= 1-001,
affecting the velocity only 1 part in 2000, but in others, e.g. ethyl
ether at 18° C. y= l-32, it may become very important. In the
case of sea-water (35°/00 salinity) y varies from 1-0004 at
0° C. to 1-0207 at 30° C. ; and for the same water at 0°
C. the ratio increases from 1-0009 at 100 bars pressure to
1-0126 at 1000 bars (1 bar =0-987 atmosphere).* For accu-
rate calculation of velocity, therefore, it is necessary to know
y the ratio of specific heats. It is shown in textbooks of
thermodynamics f that
_ 1
y~l-a%VT/<
where a=coefEcient of cubical expansion,
k6=
,, ,, isothermal elasticity,
V=volume of unit mass,
T=absolute temperature,
^=specific heat at constant pressure (expressed in ergs).
The velocity of sound in a liquid is therefore given by c=VyKe/p
where y has the above value.
(a) Liquids in Bulk - Water, either fresh or salt, is the only
liquid which permits of direct measurements of velocity over
appreciable distances. The first recorded observations in this
medium are those of Colladon and Sturm J who made a direct
measurement of the velocity of sound in Lake Geneva. A sub-
merged bell was struck by a hammer which simultaneously1
flashed ' a quantity of powder, thereby indicating to an observer
at the other side of the lake the instant of striking the bell. A' quarter-second ' stopwatch was used to measure the time-interval
between the flash and the arrival of the sound signal. Consider-
* See D. J. Mathews, ' Physical Oceanography,' Dictionary of AppliedPhysics, 3, pp. 665-692 : and Tables of Velocity of Sound in Pure Waterand in Sea Water for use in Echo-Sounding and Sound-Ranging, Hydro-graphic Dept., Admiralty, H.M. Stationery Office Publication, 1927.
t See, e.g., Poynting and Thomson's Heat, p. 289.
j Ann. d. Chim. etPhys., 36, pp. 113 and 225, 1827.

246 VELOCITY OF SMALL-AMPLITUDE WAVES
ing the circumstances of the experiment, the final value of the
velocity, 1435 metres/sec. at 8-1° C, is in surprisingly good agree-
ment with the calculated value 1436-4 metres/sec.
Practically all recent determinations of the velocity of sound
in water in bulk have been made by firing explosive charges in the
sea. These determinations were rendered imperative by the
rapid progress in methods of measurement of depths and distances
in the sea by means of sound signals. With such objects in view
experiments were organised by the French, British, and American
navies. The German hydrographic department also studied the
theoretical aspect of sound velocity in sea-water with special
reference to depth sounding.* The theoretical values of velocity
in sea-water at different temperatures, salinities, and pressures
(depths) have been calculated by D. J. Mathews (loc. cit.) using
Knudson's values of salinity and density and Ekman's f values of
elasticity. As will be seen, these calculated values are in good
agreement with direct experimental determinations.
In 1919 M. Marti % made a careful determination of velocity in
the sea in Cherbourg roadstead at a depth of 13 metres. Three
accurately surveyed hydrophones (microphones on diaphragms)
were laid on a straight line at intervals of 900 metres approxi-
mately. The sound wave was produced by an explosion of a
charge of dry guncotton on an extension of the line of hydro-
phones, first on one side then on the other, about 1200 metres from
the nearest hydrophone. The passage of the explosion wave over
the microphones was recorded automatically on a smoked drumchronograph, a tuning-fork of frequency 500 p.p.s. traced a 'time
mark' alongside the explosion records. The mean value of the
velocity reduced to a temperature of 15° C. in sea-water of density
1-026 at a pressure of one atmosphere, was found to be 1504-15
metres/sec. The agreement with the value calculated by Mathews1500-9 is not so good.
During the years 1920-22 an extensive series of velocity
measurements in the sea was made at St Margaret's at Cliffe,
Dover, for the British Admiralty by the writer and H. E. Browne,
assisted in the later stages by C. Cochrane. § Four microphone
* H. Maurer, Ann. d. Hydrogr., 52, p. 75, 1924 ; and A. Schumacker,
52, p. 780, 1924. See also F. Aigner, Unterzvasserschalltechnik, Berlin,
1922 ; and Special Publication No. 4 (March 1925) of International Hydro-graphic Bureau, Monaco.
f Public, des Circonstances de Conseil Permanent pour VExploration de
la Mer, No. 43. X Annales Hydrographiques, 1919-1920.
§ Proc. Roy. Soc, 103, p. 284, 1923.

VELOCITY OF SOUND IN THE SEA 247
receivers (hydrophones) were laid at intervals of about 4 miles,
on a line approximately N. and S., to the eastward of the GoodwinSands. The positions of these hydrophones were accurately
surveyed, from Ordnance Survey points in Kent, by the Hydro-
graphical Department of the Admiralty, the positions being knownto ± 7 ft., i.e. 1 in 10,000 of the total base line. The time intervals
of passage of the explosion wave between the various pairs of
hydrophones were recorded on a film by a six-stringed Einthoven
galvanometer with photographic recorder.* The four hydro-
phones were connected by cables to the corresponding galvano-
meter strings, whilst a fifth string was operated (through a micro-
phone circuit) by the half-second ticks of a chronometer whosedaily rate was accurately known by comparison with Eiffel TowerW/T time-signals. The sixth string of the galvanometer was used
to record a 'wireless' signal sent from a destroyer at the instant
of firing a charge. The film was traversed every tenth and
hundredth of a second by the time marks of a phonic motor con-
trolled by a tuning-fork, these time marks being checked by the
ticks of the accurate chronometer. Time-intervals could be
estimated to ±'001 second, which represents a high degree of
accuracy when it is considered that the sound wave took about
fourteen seconds to traverse the whole base line. The final
accuracy, however, depends on a knowledge of the sea conditions.
During the velocity measurements, continuous observation of sea
temperatures and salinities were made from the destroyer and at
the North and East Goodwin Lightships, using deep-sea reversing
thermometers (with N.P.L. calibrations). An electrical recording
thermometer laid near the base line gave a continuous record of
sea temperature. A correction was at first applied to measured
velocities on account of tidal flow (of the order 1 or 2 ft./sec), but
later experiments were made at neap tide slack water, when the
tidal stream ceases to flow for upwards of an hour, and no tidal
correction is required. Preliminary observations showed that
there was no difference in velocity when the explosive charge was
increased from 2J to 300 lb.—the distance of the charge from the
nearest hydrophone being about twelve miles. No certain varia-
tion of velocity with depth of charge, 10 to 108 ft., could be
detected. A considerable number of observations of velocity
were made by the Radio-acoustic Method (see p. 478), i.e. the
time-interval was measured between the instant of firing the charge,
indicated by the wireless signal, and the arrival of the sound at the
* A standard pattern made by the Cambridge Scientific Instr. Co.

248 VELOCITY OF SMALL-AMPLITUDE WAVES
t >tmax.
23456789Charge No- (in order of firing)
Fig. 73
10
hydrophones. On account of slight uncertainties (such as the
position of the charge, the exact moment of firing, the tempera-
ture and salinity of the sea at points off the base line) these results
were not relied on in estimating the velocity (although they agreed
within a few feet per second with the more accurate measurements).
In the more accurate method,
however, a serious error mayarise if the position of the
charge is uncertain in an east
and west direction (the base line
running north and south), the
'effective' length d! of the base
line then being less(=d cos 6)
than the actual length d. Toeliminate this error a new method,
known as the ' Multiple-charge
Method,' was devised. In this
method about ten small charges
1, 2, 3, etc., were fired, at
approximately equal intervals of
time and distance, along a line at right angles to an extension
of the base line of hydrophones, Hj, H 2 , H3 , etc. (see fig.
73). It will be evident that the recorded time-interval between
a pair of hydrophones will be a maximum for that charge which
is nearest 'in line.' On either __side of the base line the effec-
tive distance and consequently
the recorded time-interval will be
less. To make this clear, the
results of such a series of actual*
observations are shown in fig.
74, where the maximum time-
interval tmax is clearly shown near
charge No. 5. In this particular
case the distance apart of the
hydrophones was 70,245 ±7 ft.
and *max= 14-176;t-001 sec, whence £=4955-4^1 ft./sec, the
mean temperature and salinity on the base line being 16-95° C.
and 35-02°/oo respectively.
Experiments by this method at different seasons of the year
gave the relation between velocity and temperature. Comparative
measurements of velocity in Gareloch (Clyde) and at Dover indi-
\
(Hydrophones H1"^4
)
Maximumtime interual
(corrected)
14-176 sees
23466789 10 11 12
Charge No. (in order of firing)
Fig. 74

VELOCITY OF SOUND IN THE SEA 249
cated a salinity coefficient of velocity of +3-73 ft./sec. per l°/00
increase of salinity. The results of the complete investigation
are summarised in the following expression for velocity
—
£=4626+ 13-8*-0-12*2+ 3-73 S feet/sec.
or
c= 1410+4-2l£-0037*2+M4 S metres/sec,
where t is the temperature °C. (within the range 6° to 17° C.) and
S is the salinity in parts per thousand {e.g. 35°/00 at Dover). The
observed values of velocity indicate a value y =1-0094 ±0-0005 for
the ratio of specific heats of sea-water, of 35°/00 salinity at 17° C,
as compared with y =1-0090 calculated from thermodynamic data.
Measurements of velocity in the sea by the radio-acoustic
method have also been made by E. B. Stephenson,* who obtained
a value 1453-3=1=2 metres/sec. at 0-3° C. and S=33-5°/oo , as a
mean of four observations. Similar measurements have been
made by E. A. Eckhardt.f For the reasons given above, however,
it is considered that velocity measurements made over long
distances by this method are open to serious criticism.
A question of some importance in oceanic depth-sounding by
echo methods (see p. 467) relates to the variation of velocity with
depth. In certain oceans, for example the North Atlantic, depths
exceeding 4000 fathoms (about 4| miles) are sometimes en-
countered. The pressure near the bottom in such cases becomes
very great. The elasticity and density of the water vary with
pressure and consequently with depth, the elasticity increasing
more rapidly than the density with increasing pressure. Values
of elasticity, density, and velocity have been calculated by D. J.
Mathews J at depths from to 30,000 ft. (5000 fathoms), at which
depth the pressure reaches 1000 atmospheres (approx. 67 tons/
sq. in.), and the velocity has increased by about 160 metres/sec.
above the ' surface ' value. Heck and Service § have also published
a list of tables giving velocity in terms of pressure and depth.
In the same paper they describe an experimental investigation in
U.S.S. Guide to determine the variation of velocity with depth
by means of an echo method, using the ' Sonic depth finder
'
developed by H. C. Hayes. || The ship, equipped also with
standard apparatus for taking 'wire' soundings, temperatures,
* Phys. Rev., p. 181, Feb. 1923. f Phys. Rev., 24, p. 452, 1924.
X Loc. cit. See also Ekman {Pub. de Circ, No. 49), Maurer andSchumacker, Ann. d. Hydr., pp. 86 and 93, 1924.
§ U.S. Coast and Geodetic Survey, Publication No. 108, 1924.
|| Journ. of Frank. Inst., 197, p. 323, 1924.

250 VELOCITY OF SMALL-AMPLITUDE WAVES
water samples, etc., cruised in the North Atlantic Ocean, the
Caribbean Sea, and the Pacific Ocean, measurements of velocity
being made in depths from a few fathoms to 4500 fathoms. The'sonic' apparatus measured the time-interval for a sound impulse
to travel from the surface to the bottom and back again, it being
assumed that the echo returned from a point vertically below the
ship (the accuracy of this assumption depending on the slope of
the bottom). The results are rendered very uncertain due to (1)
the unreliability of 'wire' soundings at great depths on account
of the drift of the ship, and (2) to the weakness of the echoes at
such depths. Considering the difficult nature of the observations,
the agreement between observed and calculated velocities was
fairly good.
(b) Liquids in Tubes - In discussing the production of stationary
waves in air or gas-filled tubes, it was assumed that the walls of
the tube were rigid. The same theory would apply also to liquid-
filled tubes, were it not for the fact that the assumption regarding
the walls of the containing tube is no longer valid. At the same
frequency and intensity, the displacement-amplitude of a sound
wave in air is 60 times greater than in water, the pressure amplitude
being correspondingly less. If stationary waves are formed in a
thin-walled tube filled with a liquid such as water, the pressure
variations at the nodes may be very great and the tube will yield
radially at those points, causing the pressure to drop. Theactual pressure-fluctuation at the nodes in the liquid will therefore
be less than in the case of a rigid tube. The yielding of the wall
of a tube containing a resonating liquid column can readily be
detected, for audible frequencies, with a stethoscope applied to
the outside of the tube. The outer surface of the tube will appear
to have antinodes and nodes corresponding respectively to the
nodes and antinodes in the liquid. The yielding of the tube near
the nodes results in a lowering of the wave-velocity in the liquid.
This was first demonstrated experimentally by Wertheim (1847),
who was successful in exciting liquid-filled organ pipes into
resonance by 'blowing.' The pipes were fitted with suitable
mouthpieces immersed in the liquid, and were 'blown' with a
jet of the same liquid. In this manner Wertheim obtained, from
the frequency of the note and the length of the pipe, a value
1173 metres/sec. for the velocity in a water-filled pipe. Thecorrect explanation of this low velocity is, however, due to Helm-
holtz (1848), who predicted that the velocity would increase with
increase in the thickness of the walls and with decrease in the

VELOCITY IN LIQUID-FILLED TUBES 251
diameter of the tube. H. Lamb * has dealt with the matter
theoretically, assuming that the deformation of the tube has a
statical value corresponding to the instantaneous distribution of
pressure in the liquid. This assumption is justified by the fact
that the wave-velocities in solids (e.g. glass or steel) are consider-
ably greater than in liquids. If c be the velocity of sound in
the liquid 'in bulk,' and c the actual velocity in the tube of radius
a and thickness h (assumed small), then
c =cVl+2Ka/hE,
where k is the volume elasticity of the liquid and E Young's
modulus for the material of the tube. When the walls are very
thick it is found that
c =cV(k+h)/h,
where /x is the rigidity. Kundt and Lehmann applied the dust-
tube method (see pp. 174, 178, and 239) to the determination of
velocities of sound in liquids. Fine iron filings or powdered sand
(free from air) were sprinkled along the tube. On exciting the
liquid into resonance the powder collected at the nodes in the usual
manner. The results confirmed Helmholtz's predictions, andapplication of Lamb's formula to their experimental values gives
c = 1436 metres/sec. at 19° C. for the velocity of sound in open water(fresh). K. Dorsing f has measured in this way the velocities of
sound in air-free distilled water, salt solutions, alcohol, ether, etc.
A. Cisman J has recently measured, by a method similar to
Regnault's for gases, the velocity of sound in various liquids in
twelve different tubes. The liquids were contained in U-tubes, oneend being closed by an iron disc which, on attraction by an electro-
magnet, generated a wave of rarefaction. The time of passage of
the wave was recorded photographically. The values obtained,
after applying the necessary 'tube correction,' agreed in all cases,
within ±2 per cent., with the velocities in the free medium. Theliquids used were: distilled water, salt solutions of different
strengths, alcohol, ether, benzine, toluol, carbon disulphide, andcarbon tetrachloride.
It should be mentioned that resonance may easily be set up in
a liquid column by means of a steel diaphragm closing one end
* Dynamical Theory of Sound, p. 175.
t Ann. d. Phys., 25, p. 228, 1908.
X Journ. de Phys., 7, pp. 73 and 345, 1926; Jonescu, Journ. de Phys.,
5, p. 377, 1924 ; Veenekamp, Dissert., Gottingen, 1922; and H. G
Green, Phil. Mag., 45, p. 907, 1923.

252 VELOCITY OF SMALL-AMPLITUDE WAVES
of the tube and excited electromagnetically, using current of
variable frequency from a valve oscillator. At frequencies within
the audible range, the resonance within the liquid can be observed
by ear, and the yielding of the walls of the tube examined by a
stethoscope. This provides a very convenient laboratory method
of determining the velocity of sound in liquids.
The velocity of sound in fluid mixtures, e.g. air-water, is
considered on p. 326.
(C) Velocity of Sound in Solids
The transmission of waves through fluids is relatively simple.
Apart from surface waves, depending on surface tension s and
gravitational forces * (velocity of ripples = V27rs/p\ and of
gravity waves = VgX/2Tr), only longitudinal waves need be con-
sidered in fluid media. A perfect fluid will not transmit shearing
forces, so that transverse waves are not possible. In solids, how-
ever, which readily transmit both compressional and shearing
forces, longitudinal, torsional, and transverse waves may be set
up. We have already referred to the more important cases, viz.
:
(1) Transverse waves in wires, c= VT/m, in which the elastic
properties of the material may be disregarded (see p. 85).
1 /E(2) Transverse waves in bars, c <* t\/-~ (see p. 109), the
A V p
velocity depending on wave-length A, as well as on the elasticity E(Young's modulus) and the density p of the material.
(3) Longitudinal waves in wires and bars, c= VE/p (see p. 136).
(4) Torsional vibrations in wires or bars, c= Vpi/p (see p. 152).
In all these cases the solid is restricted in certain dimensions, e.g.
the diameter relative to the length.
(a) Solids in Bulk - Any local disturbance in an unlimited
solid medium breaks up into two types of wave, which ultimately
assume transverse and longitudinal characters. The longitudinal
or * dilatational ' wave, in which the displacement is wholly in
the direction of propagation, has a velocity c= V{k Jr ^p)lp or
V{(1— cr)E/(l— cr—
2
cr2)p}> where k is the volume elasticity, /x the
rigidity, E Young's modulus, and a Poisson's ratio. In the second
type, the transverse or ' distortional' wave, the displacement is
everywhere at right angles to the direction of propagation and the
* Rayleigh, Sound, 2, p. 344.
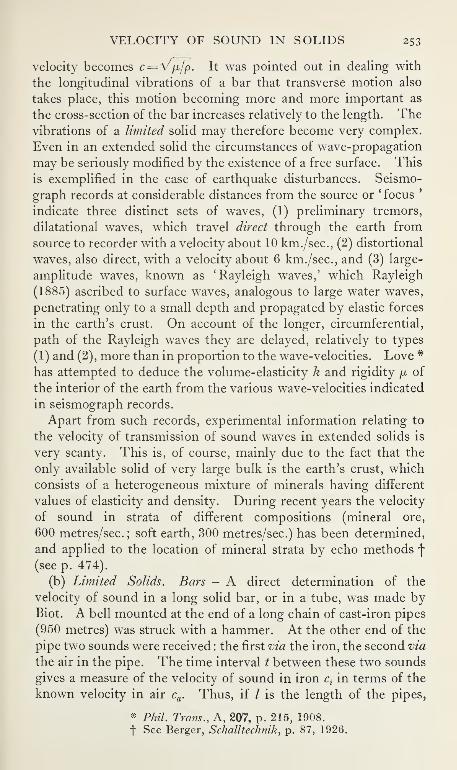
VELOCITY OF SOUND IN SOLIDS 253
velocity becomes c= Vfi/p. It was pointed out in dealing with
the longitudinal vibrations of a bar that transverse motion also
takes place, this motion becoming more and more important as
the cross-section of the bar increases relatively to the length. Thevibrations of a limited solid may therefore become very complex.
Even in an extended solid the circumstances of wave-propagation
may be seriously modified by the existence of a free surface. This
is exemplified in the case of earthquake disturbances. Seismo-
graph records at considerable distances from the source or ' focus'
indicate three distinct sets of waves, (1) preliminary tremors,
dilatational waves, which travel direct through the earth from
source to recorder with a velocity about 10 km./sec, (2) distortional
waves, also direct, with a velocity about 6 km./sec, and (3) large-
amplitude waves, known as 'Rayleigh waves,' which Rayleigh
(1885) ascribed to surface waves, analogous to large water waves,
penetrating only to a small depth and propagated by elastic forces
in the earth's crust. On account of the longer, circumferential,
path of the Rayleigh waves they are delayed, relatively to types
(1) and (2), more than in proportion to the wave-velocities. Love *
has attempted to deduce the volume-elasticity k and rigidity fx of
the interior of the earth from the various wave-velocities indicated
in seismograph records.
Apart from such records, experimental information relating to
the velocity of transmission of sound waves in extended solids is
very scanty. This is, of course, mainly due to the fact that the
only available solid of very large bulk is the earth's crust, which
consists of a heterogeneous mixture of minerals having different
values of elasticity and density. During recent years the velocity
of sound in strata of different compositions (mineral ore,
600 metres/sec. ; soft earth, 300 metres/sec.) has been determined,
and applied to the location of mineral strata by echo methods f(see p. 474).
(b) Limited Solids. Bars - A direct determination of the
velocity of sound in a long solid bar, or in a tube, was made byBiot. A bell mounted at the end of a long chain of cast-iron pipes
(950 metres) was struck with a hammer. At the other end of the
pipe two sounds were received : the first via the iron, the second via
the air in the pipe. The time interval t between these two sounds
gives a measure of the velocity of sound in iron ciin terms of the
known velocity in air ca . Thus, if / is the length of the pipes,
* Phil. Trans., A, 207, p. 215, 1908.
f See Berger, Schalltechnik, p. 87, 1926.

254 VELOCITY OF SMALL-AMPLITUDE WAVES
ci=lcj(l—tc
a ). The value thus obtained for cast iron was 3500
metres/sec. Provided the diameter of a bar or wire is small com-
pared with its length, the velocity V^E/p of longitudinal waves in
it may be determined most simply by observing its fundamental
frequency N of longitudinal vibration. The various methods of
exciting such vibrations have already been dealt with on p. 138
et seq. At audible frequencies, the most desirable point of clamp-
ing the bar is at the middle (see Case II, p. 136) when the restrain-
ing action of the clamp has a negligible influence on the frequency
of vibration. When the bar sounds its fundamental note, the
frequency, which may be determined directly by means of a siren
or a calibrated monochord, is given by N=c/2/, where / is the
length of the bar and c ( = X/E/p) is the longitudinal wave-velocity
required. When the bar is used to excite an air column into
resonant vibration, as in Kundt'stube experiment (see p. 240), the
velocity cbar may be compared directly with the velocity c.Aiv of
longitudinal waves in air. In this case
^bar/ ^air ^bar/ ^air
»
where Zair refers to the half wave-length separation of the dust
heaps in the tube.
The method is sometimes used, alternatively, to determine
Young's modulus E for a bar in which the velocity of sound is
assumed. If the bar is obtainable only in a short length, its funda-
mental frequency may be so high that it is not possible to estimate
its pitch, or it may be above the audible limit. In such a case
Kundt's tube is invaluable, for the dust heaps at the nodes in the
wave-tube give at once the wave-length of the sound in air, and
consequently the frequency N. The velocity in the bar is then
cbar=2N/ where / is its length. Such methods are, of course,
equally applicable to a wire which may be mounted on a sounding-
board and excited into longitudinal vibration by drawing a resined
leather along the wire. For the comparison of the velocities in
two wires or bars the lengths may be varied until they emit a sound
of the same frequency, then c1/c2 =l1/l2 . Wertheim measured the
velocity of sound in a series of bars of different metals, in terms of
the frequency and length, obtaining values in good agreement
with calculation (c= VlL/p). The velocities of sound in wax and
other soft solids, which are not easily excited into resonance by
recognised methods, were determined by Stefan. He cemented
the 'soft' bar on the end of a resonant metal bar in which the
velocity was known. This resonant bar was used to excite

VELOCITY OF SOUND IN SOLIDS 255
vibrations in the soft bar, the velocity being deduced by a some-
what involved calculation. In wax at 17° C. Stefan obtained
c=S00 metres/sec, —40 metres/sec. per 1° C. rise of temperature.
Warburg determined the velocities of sound in soft materials
(stearine, wax, paraffin, tallow) by coupling a bar of the material
with a bar of glass and setting the combination into transverse
vibration. The nodal distances were obtained by means of sand,
whence the longitudinal velocities could be calculated (see p. 112).
Warburg's value for the velocity in wax, 880 metres/sec. at 16° C,agreed fairly well with Stefan's estimate. More recently, Herbol-
sheimer * has determined the velocity of a pressure-pulse in gelatine
in bulk and in the form of strips or bars. Polarised light was passed
through two points, a known distance apart, and after passing
through an analyser (Biot's method f ) was received on a photo-
graphic film with time marks. The passage of the pressure pulse
produced a sudden illumination of the film, due to stress in the
gelatine rotating the plane of polarisation, and the time-interval
was recorded. The velocities in gelatine strips (containing varying
percentages of gelatine and sugar in a solution of glycerine and
water) varied between 5-90 and 10-80 metres per second, the
velocity increasing slowly with time. For gelatine in bulk, how-ever, the velocities were found to approximate to 1600 metres/sec,
i.e. in the neighbourhood of the velocity of sound in water. Kellog,
measuring the elasticity E and velocity of sound in indiarubber,
found that E varied from 2-7 x 10 7 at 0-1 p.p.s. to 6-4 x 10 7 at 200
to 600 p.p.s., corresponding to velocities of 52 and 80 metres/sec.
respectively.
In this connection it is interesting to observe that the ratio of
longitudinal wave-velocities for solids in bulk c and in the formof a bar c
tis given by
(l-o-)E /E ( (1-a) )* ,
(see p. 252),(l-o— 2<t2)/>|V p \(l-(j-2a 2
)j
where a is Poisson's ratio. Taking cr=0-49 for indiarubber,
c /cl= n. If a were equal to 0-5 the ratio would be infinite, that
is, the longitudinal wave would spread infinitely rapidly. Herbol-
sheimer's observations with gelatine strips and in bulk therefore
indicate a value of a approximately 0-5. For a substance like
cork, cr=0 approximately, whence the longitudinal wave-velocity
in a rod will be the same as in bulk.
* Zeits.f. Physik, 3, p. 182, 1920. f See Tyndall, Sound, p. 168.

256 VELOCITY OF SOUNDS OF HIGH FREQUENCY
Velocity in Crystalline Solids - The elasticity of a crystal-
line substance varies along different axes, and as a consequence
the velocity of elastic waves has a different value according to
the direction of propagation. In most crystals the variation has
no practical interest, but in the case of quartz, which is nowextensively used as a standard of high-frequency vibrations,
the question may become important. P. W. Bridgeman * has
measured the compressibility of quartz rods, cut along different
axes, and has found at 30° C. that the ratio of compressibilities
parallel and at right angles to the optic axis is
parallel 0-753x10-6 1
perpendicular 1-072 xl0~6 1-42'
whence the ratio of velocities (proportional to Vl/compressibility)
is 1-19 to 1.
The Velocity of Torsional Waves in Bars may be determined
in a similar manner to that described for measuring the velocity
of longitudinal waves. The bar, clamped at the midpoint, is
excited into torsional vibration of frequency N, whence
c=NX=2Nl,
as before. In this case, we have already seen (p. 152) c= Vfi/p y
which can be calculated from the physical constants, rigidity
fju and density p, of the material. The ratio of longitudinal to
torsional velocity is VE/Vfj, or V2(o-+l). In the case of steel,
taking a =0-3, the ratio becomes 1-6. Since o can never be greater
than 0-5, the ratio of longitudinal to torsional velocities can never
exceed 1-73 in any material. The ratio of velocities, equal to the
ratio of frequencies, is easily obtained experimentally and provides
a very simple means of determining Poisson's ratio cr for the
material of the bar.
VELOCITY OF SOUNDS OF HIGH FREQUENCYWhen the frequency of the sound is above the audible limit, or
too high to be estimated by ear, the velocity is most conveniently
measured by a method due to Rayleigh, viz. the stationary wave
method. In Rayleigh's original experiment f the source of sound
was a bird call (see p. 208) placed about two metres from a plane
* Proc. Amer. Acad., 58, p. 163, 1923. See also R. B. Sosman,Properties of Silica (Chem. Catalogue Co. Inc., U.S.A.).
t Sound, 2, p. 403.

IN GASES 257
reflector, a sheet of metal or glass. Between the source and the
reflector a sensitive flame (see p. 371) could be moved to and fro
to locate the positions of the nodes and antinodes in the stationary
waves formed by superposition of the direct and reflected waves.
The flame was least disturbed at the nodes, these positions being
well defined by the sudden cessation of flaring. The nodal
separation being A/2, the velocity may be obtained from the relation
£=NA provided the frequency is known. In the bird-call experi-
ment the frequency in general is not known, the method being
more suitable to determine the frequency in terms of an assumed
velocity. Recent developments in the production of supersonic
vibrations of accurately known frequency by piezo-electric crystals
and magnetostrictive rods (nickel, etc.) have rendered Rayleigh's
stationary wave principle a method of precision in the determina-
tion of velocities in gases and liquids. In this connection the
work of Pierce in the cases of gases, Boyle, Wood, Hubbardand Loomis for liquids, is noteworthy.
(a) In Gases - In 1907 W. Altberg * measured the wave-length
of the sounds emitted (of frequency N =340,000) from an electric
spark, and found that the product NA was in moderately good
agreement with the recognised value for the velocity of sound
in air. A. Campbell and D. W. Dye f obtained a similar result
at 900,000 p.p.s., using a high-frequency spark as source and a
Kundt's dust tube to indicate the wave-length. A series of
measurements of the velocity of sound waves of very high fre-
quency was made in 1923 by K. Palaiologos.J Supersonic
vibrations were produced in air by imposing high-frequency
alternating currents on the direct current in an arc. The arc
current was thus made to fluctuate at a frequency equal to that
of the A.C., and thereby became a source of sound (see p. 204).
The wave-length of the sound emitted was measured by meansof diffraction gratings (see p. 309); a concave mirror with the
high-frequency (short wave-length) sound source (the arc) at its
focus produced a parallel beam, which, after passing through the
grating, was focussed by a second concave mirror on the detector.
The wave-length was calculated from the usual grating formulae.
Palaiologos found, for frequencies 2 xlO 5 to 2 xlO6 p.p.s. (A= 1-7
mm. to 0-17 mm.), that the velocity of sound was constant and
equal to 335 metres/sec. at 0° C.
The oscillations of a quartz piezo-electric resonator have been
* Ann. d. Physik, 23, 1907. f Electrician, 66, p. 862, March 1911.
t Zeits.f. Physik, 12, p. 375, 1923.
17

258 VELOCITY OF SOUNDS OF HIGH FREQUENCY
applied by G. W. Pierce * to the precision measurement of the
velocity of high-frequency sounds. A crystal of quartz, cut in
the manner described on p. 141, is mounted in front of a smooth
reflecting surface as shown in fig. 75 (a). The crystal is main-
.Micro-ammetci
Quartzcrystal
Reflector
mountedon a fine
lead screw5 14
Inductance load (a)
r /a A/ \
(b) /^
\
/ /\
v V/
•
^ v
157 158 159 160Position of Reflector (screw reading mms.)
Fig. 75
tained in continuous oscillation at its own natural frequency by
means of the circuit shown. The sound waves thus produced are
reflected back to the crystal and form a system of stationary waves.
The reflector may be moved to and fro on a fine ' lead ' screw to
explore these waves and to measure the wave-length. No addi-
tional apparatus for detecting the sound is necessary, for the
reflected sound wave, falling on the emitting face of the crystal
vibrator, even when the reflector is in some cases at a distance
of 300 half-waves away, reacts on the crystal with sufficient force
to cause readings of the milli-ammeter A to fluctuate visibly in
accordance with the phase of arrival of the reflected sound wave.
In order to render the fluctuations more evident for precision
measurements, a sensitive galvanometer (or micro-ammeter) is
used at A shunted by a potentiometer as shown, to neutralise the
main current through the instrument. A set of typical observa-
tions given by Pierce is shown in fig. 75 (b). The maxima could
be located to 0-05 mm. and a hundred or more successive half-
waves may be counted. The accuracy of wave-length measure-
ment is of the order of 1 in 3000. The frequency of the vibration
of the crystal was determined by accurate wave-meter methods
as in standard radiofrequency measurements.! The ultimate
time standard in such measurements is a master clock, and the
connecting links in the measurement, a standard tuning-fork and
a multivibrator (see p. 132). It was proved by Pierce that the
reaction of the reflected waves on the crystal vibrator had a
negligible effect on its frequency. As a result of such measure-
ments Pierce came to the following conclusions :
—
* Proc. Amer. Acad., 60, p. 271, 1925. See also Hubbard and Loomis,Phil. Mag. ,5, p. 1177, 1928.
f See also Dictionary of Applied Physics, 2, Article on ' Radio Fre-quency Measurements,' p. 627.

IN LIQUIDS 259
(1) The velocity of sound in free air for a range of frequencies
between 40,000 and 1,500,000 p.p.s. varies with frequency in a
peculiar manner (see fig. 13 of Pierce's paper). At 0° C. the
values were 331-94, 332-47 (max.), and 331-64 metres/sec. at
frequencies 1000, 50,000, and 1-5 xlO 6 p.p.s. respectively. Theeffect of humidity was negligible; at 80 per cent, humidity the
velocity differed by less than 0-02 per cent, from the velocity in
dry air.
(2) In C0 2 the velocity at 0° C. was found to be 258-52
metres/sec. at a frequency of 42,000 p.p.s., increasing to 260-15
metres/sec. at 200,000 p.p.s. At still higher frequencies C0 2 was
found to become opaque to sound waves. The theoretical signi-
ficance of these results is not yet clear. They appear to suggest,
however, that the pressure variations of sound waves are not
quite adiabatic for frequencies below 50,000 p.p.s. in air, or below
200,000 p.p.s. in C0 2 . We shall refer later (p. 321) to Pierce's
observations on the absorption of high-frequency sounds in air
and C0 2 . Pierce proposes to make velocity measurements in
gases using magnetostrictive rods * (nickel-iron alloys, etc.) to
replace quartz. The new method is particularly suitable at
frequencies below the range of the quartz oscillator, i.e. below
40,000 p.p.s. The above method of measuring velocity by meansof quartz oscillators has recently been applied by E. Griffiths fas a means of determining the percentage of C0 2 (or other gases)
mixed with air. The distance apart of the nodes is an indication
of the composition of the gaseous mixture, assuming it to be
composed of gases which do not react chemically.
(b) In Liquids - The method has also been employed, in a
somewhat different manner, by R. W. Boyle and J. F. Lehmann Jto demonstrate the existence of stationary waves under water
when a beam of plane waves of high frequency is opposed by a
similar beam in the opposite direction. Two quartz transmitters
in a tank of water were arranged 60 cm. apart and face to face.
They were connected in parallel to the same valve oscillator so
that each radiated energy of the same frequency. Whilst both
were emitting sound waves of 96,200 p.p.s. particles of coke dust
were sprinkled in the track of the beam and eventually settled ona whitened plate suspended just below the centre of the energy
field. The particles of dust were forced by radiation-pressure
* Amer. Acad. Proc, 63, p. 1, 1928.
t Proc. Phys. Soc, 39, p. 300, Aug. 1927.
J Trans. Roy. Soc. Canada, 19, p. 159, 1925.

26o VELOCITY OF SOUNDS OF HIGH FREQUENCY
into the planes of minimum intensity of vibration, and ultimately
settled in lines at the base of each nodal surface, the distance
apart of these lines being A/2. In a particular experiment there
were 44 half wave-lengths in 34-86 cm., which gives a value
l-52±-03xl0 5 cm./sec. for the velocity in water at 15° C.
(waves of 96,200 p.p.s.).
R. W. Boyle and G. B. Taylor,* using a single quartz oscillator
and a reflector to produce the stationary waves, attempted to
measure the variation of velocity of sound in water at different fre-
quencies from 43,000 to 600,000 p.p.s. Their earlier results indi-
cate a falling off in velocity from 1-51 xlO5 to 1-42 xlO 5 cm./sec.
at these frequencies respectively. This reduction of velocity
with increase of frequency is not explicable on the assumption
that viscosity is the cause (see p. 318). Using a very viscous
oil at high frequencies (6 x 10⁵), they found the velocity to
be the same as at the low frequency. In a later paper,f Boyle
and Taylor ascribe the apparent decrease in water to a possible
progressive error in the wave-meter used to determine the fre-
quency. A continuation of the experiments under more exact
experimental conditions indicated no detectable change in velocity
from 29,000 to 527,000 p.p.s. The mean value of the velocity
in water over this range of frequencies was found to be 1-48 x 10 5
cm./sec. ±1 per cent, at 18-5° C. A similar set of observations
of the velocity of ultrasonic waves in castor oil of viscosity 0-50
at 20° C. gave a constant value 1-43 x 105 cm./sec. over the whole
range of frequency. R. W. Wood, A. L. Loomis, and J. C.
Hubbard J have made measurements of the wave-length of high-
frequency sounds in various liquids by a method analogous to
that of Pierce in gases. A quartz piezo- electric oscillator 10 cm.
in diameter, vibrating at frequencies 200,000 to 400,000 p.p.s.,
produced practically plane waves in a small dish of liquid placed
upon it. These waves were reflected from a plane surface im-
mersed in the liquid, a fine micrometer screw adjusting the distance
of this surface from the face of the quartz disc with which it was
parallel. As the reflector passed through each nodal point of the
stationary waves in the liquid, a neon lamp loosely coupled to
the oscillating circuit was extinguished due to the reaction of
the system of stationary waves upon the crystal. It was thus
possible to measure 20 or more half wave-lengths with a precision
* Trans. Roy. Soc. Canada, 19, p. 197, 1925.
f Ibid., 21, p. 79, 1927.
X Phil. Mag., 4, p. 417, 1927, and Nature, Aug. 6, 1927.

IN SOLIDS 26;
of 0-01 mm. Typical results are included in the following
table :
—
Velocity of Sound in Metres/Second
Temperature °C.
Liquid.
5°. 15°. 25° 35°.
Distilled Water 1439 1477 1509 1534
1 per cent. NaCl Solution . 1487 1520 15422*5 ,, ,, ,, 1510 1539 1561
5"! )> jj >> 1540 1569 1589
Mercury .... 1469 1468
Carbon Disulphide 1215 1184 .
.
Chloroform 1066 1027
No variation in velocity with frequency could be detected. Thevelocity was also independent of the material and dimensions of
the containing vessel, a result which would be anticipated with
a source (large compared with A =3 to 8 mm.) of plane waves.
It was found that small quantities of dissolved air materially
affect the velocity.
(c) In Solids - The velocity of sound c in a solid bar may at
once be deduced from a knowledge of its length / and the frequency
N of its fundamental tone when in longitudinal vibration (<:=2N/).
When the bar is very short, however, the frequency cannot be
determined by aural methods and special means for its measure-
ment are necessary. Kundt's dust tube is perhaps the simplest
of such methods. On striking one end of a short metal bar, the
other end of which is inserted in the 'dust tube,' the stationary
wave dust pattern is very easily produced, and the wave-length
in air determined, whence the frequency N of the sound can be
calculated, assuming a knowledge of the velocity in the air con-
tained in the dust tube. The velocity in the bar is then equal to
2N/, where I is the length of the rod. In this way R. J. Lang *
determined the velocity of longitudinal waves in bars of steel
and brass, varying in length from 200 to 5 cm., and in frequency
from 1280 to 50,150 p.p. s. The ratio of the velocities of the sound
waves in air and in the metal bars was found to remain constant
(within experimental error) over the whole range of frequencies.
* Trans. Roy. Soc. Canada, 16, p. 163, 1922.

262 VELOCITY OF SOUNDS OF HIGH FREQUENCY
The absolute values of velocities in steel and brass were found to
agree with the values calculated from the static elasticity E and
density p—that is, from c= VE/p. The ratio of adiabatic to
isothermal elasticities (that is y) of a metal may be calculated bythe method indicated on p. 245 for liquids. For iron, the ratio
is found to be T0026; whence it might be anticipated that the
velocity determined by direct experiment would be T3°/00 higher
than the value calculated from the isothermal or static elasticity.
This difference is, however, within the limits of error of Lang's
measurements. In a paper on "Magnetostriction Oscillators," G.
W. Pierce * describes a study of the velocity of sound, and its varia-
tion with temperature, in a number of alloys exhibiting magneto-
strictive properties. A graduated series of ' stoic ' metal bars (about
36 per cent. Ni and 64 per cent. Fe) from 20-8 to 6-9 cm. in
length give a mean value of (length X frequency) of 2079-6 ±2,and consequently a mean velocity of 4160 metres/sec. at 20° C.
No definite change in velocity was observed within the frequency-
range 10,000 to 30,000 p.p.s. of these rods. It was found that the
velocity in the Ni-Fe alloys has a minimum and the temperature
coefficient a maximum value at 36 per cent, to 40 per cent, nickel
—that is, about the composition of Invar and Stoic metal.
The velocity of high-frequency vibrations in a piezo- electric
material like quartz is best determined from a knowledge of its
linear dimensions and its natural frequencies. The latter may be
determined accurately by the methods indicated on pp. 132 and
142, or approximately by means of a Cady or a Pierce oscillator
circuit (see p. 145) combined with a simple form of electrical
wave-meter (a known variable inductance or capacity and an
indicator of resonance such as a neon lamp or an electrostatic
volt-meter). On p. 144 is given a table of frequencies of the
partials of two quartz bars of lengths 47-0 and 62-2 mm. Thefundamental frequencies are 58,675 and 44,120 p.p.s. respectively,
corresponding to an average velocity c=2N/=5-50 xlO 5 cm./sec.
in quartz. There is no indication in the table (p. 144) that there
is any progressive variation of velocity with frequency up to
3 or 4xl05 p.p.s.
The velocity of sound in a bar may conveniently be determined
if the bar is excited into resonant vibration by electromagnetic,
piezo-electric, or by magnetostrictive methods. The source of
electrical excitation is a valve-maintained oscillator of continuously
variable tuning and the frequency of resonance is determined* Amer. Acad. Proc, 63, 1, p. 1, 1928.

VELOCITY OF WAVES OF FINITE AMPLITUDE 263
from the constants of the electrical oscillating circuit or preferably
by means of a wave-meter. R. W. Boyle # has pointed out
that cautious judgment must be exercised when determining a
resonant frequency, particularly in regard to the overtones. His
observations show that the vibratory modes in high-frequency
bars may be very complex—longitudinal, torsional, and flexural
vibrations may take place simultaneously. At certain resonant
frequencies, dust particles sprinkled on the end of a cylindrical
bar in vibration arranged themselves in patterns similar to some
of Chladni's figures, e.g. four-, six-, eight-, and twelve-pointed
stars could be obtained.
VELOCITY OF SOUND WAVES OF FINITEAMPLITUDE
We have assumed hitherto that the displacement amplitude and
the condensation are always small, in which case the sound waves
travel through the medium with velocity c= V«/p without change
of type. In the majority of cases this assumption is quite justi-
fiable. When the condensation s becomes large, however, as in
an explosion wave, the velocity may be considerably modified.
The curve connecting pressure p and density p in the mediumcannot be regarded as a straight line for large fluctuations about
the normal condition. The question has been examined mathe-
matically by Poisson, Stokes, Earnshaw, Riemann, Rankine,
Rayleigh, and others, j* who show that a progressive wave of finite
condensation cannot be propagated without change of type, the
velocity of propagation in any part of the wave being dependent
on the value of the condensation s at that point. Referring to the
equations for the propagation of plane waves (see pp. 51 and 52)
we have
dt2 p dx
Now (p/po) ={plPof for adiabatic changes, and we may write
p/Po =(1 +*) =(1 + A)" 1 =(1 +d$/dx)- 1.
Consequently
/ rfA-7t
dp dH( <*A-<?+DP=PA l +±) ^d f-^l+y ,
dxjl
dx °dx2\ dxj
* Nature, p. 13, Jan. 5, 1929.
f See Rayleigh, Sound, 2, p. 32 et seq. ; Lamb, Sound, p. 174 et seq.,
and Hydrodynamics, p. 470.

264 VELOCITY OF WAVES OF FINITE AMPLITUDE
whence
dt 2Pq \ dx
"(7+ 1) dHdx2
(2)
It will be seen that for small values of (d^jdx) this equation
approximates to equation (18), p. 52, for small-amplitude waves
travelling with a velocity c = Vyp /p . The value of the velocity
c for large-amplitude waves relative to the undisturbed medium,as given by equation (2), may therefore be written
c=c,dx
-(t+1)
or7+1
c=cQ(l+s) 2
(3)
(4)
In these expressions for the velocity of a large-amplitude wave
we may write s=Sp/p. The velocity of propagation, therefore,
increases with increase of density or condensation. This results
in a change of type in the wave as it advances, for the velocity in
the more highly compressed parts of the wave is greater than in the
less compressed or rarefied portions. Consequently the parts of the
wave of greater density gain continuously on the parts of smaller
density. The wave becomes steeper in front and more gradual
behind as indicated in fig. 76. Such a process would ultimately
lead to a perpendicular wave-front beyond which the analysis has
no meaning. As Rayleigh points out, this tendency is held in
check by the divergence of the wave and the influence of attenu-
ation (viscosity and heat conduction), both of which tend to reduce
the condensation and consequently the velocity to the ' normal'
or small-amplitude values. Change of type in a progressive wave
may be illustrated by sea-waves approaching a shelving beach.
On account of the forward velocity
of the water near the crests being
greater than that near the troughs
(i.e. near the sea-bed), the crests
gain on the troughs and the wave-
fronts become steeper and steeper
until they curl over and break.
Rayleigh's explanation # of the
change of type in a pressure wave
From the ordinary theory
Fig. 76
as it advances will help to make it clear.
Sound, 2, p. 33.

VELOCITY OF WAVES OF FINITE AMPLITUDE 265
of propagation of small disturbances the wave advances with a
velocity c relative to the undisturbed medium. Imagine now a
wave so long that the fluctuations of particle-velocity and density
are insensible for a moderate distance along it, and at a place
where the particle-velocity (u) is finite we shall superpose a small
secondary wave. The velocity with which this wave travels
through the medium is c , but on account of the local motion of
the medium itself, the velocity of advance will be (c +u) and will
depend on the part of the long wave in which it is placed. This
applies to the parts of the long wave itself; thus after a time t a
point of particle-velocity u will be in advance of its original position
by a distance (c +w)£; that is, the particle-velocity u will be trans-
mitted with velocity (<: +w). Symbolically u=f{x—(c Jr u)t}, a
relation first obtained by Poisson (1808).
Experimental Observations - Measurements of the increase
of velocity of waves of finite condensation are numerous. Regnault
(1862-3) found that explosion waves in air (contained in pipes,
see p. 239) increased in velocity with size of charge, and diminished
in velocity with increasing distance. He found, as theory antici-
pates, that the limiting velocity at large distances {i.e. small con-
densation) was the same in all cases. In all such methods of
velocity measurements, which include the region of large con-
densation near the source, the velocity will be abnormally high.
Reference has already been made to the observations of Angerer and
Ladenberg (p. 236), which indicated a velocity of 1150 metres/sec.
in the vicinity of an explosion, falling to 330 metres/sec. at a
distance of 10 kilometres. The velocity at any point distant x
from such a source has been calculated by Riemann (1859), and
may be stated in the form
dx I kc=irc
\l+
x>
in which k is a quantity depending on the thickness of the highly
condensed region of the pressure pulse. It will be seen that the
velocity of the pulse of finite amplitude approximates to the
normal ' small condensation ' velocity c when the distance x from
the origin is large. The rigorous mathematical treatment of
waves of large condensation is very complex even when it is
limited to the case of plane waves. Actually, we have to deal with
spherically divergent waves in viscous media, the condensation s
diminishing as the distance from the source increases. This case

266 VELOCITY OF WAVES OF FINITE AMPLITUDE
has received a good deal of attention experimentally, and a numberof ingenious photographic methods have been devised for studying
the progress of a highly compressed pulse. The first of these to
which we shall refer is Topler's"Schlieren Method" for the
observation of atmospheric striae (described on p. 342). In 1867
Topler * showed by an original optical method that the spark
accompanying an impulsive electric discharge, as a Leyden jar,
produced a highly compressed wave or pulse in the surrounding
atmosphere. These experiments were continued by his son.f
Mach and Gruss,^ extending Topler 's experiment, demonstrated
that this pulse had a velocity greater than that of sound and that
the velocity increased with increase of spark intensity. TheSchlieren method has been employed more recently by W. Payman,
H. Robinson, and W. C. F. Shepherd,§ who have obtained very
complete data relative to the velocity and form of the pressure
pulse emerging from the mouth of a tube, due to the sudden
release of compressed air or the explosion of a gaseous mixture
or a detonator. Not only did they obtain 'instantaneous' spark
photographs of the pressure pulse at different instants after
leaving the tube, but they also obtained a continuous record
indicating the progress of the wave-front with time and distance
from the origin. From this record it is simple matter to deduce
30
;20
10
i 1 / /
i 1 / /
i 0t /,/
c'^ /'/
//
/ '&' /
§' / / "8 /
'
i
i
/ /
/ /' / /.0,VJ
!i
iy/ /
V / /
/ f/
T7 /
'J"V'
(a)
\Normal v slocity of \ound 330 m/sec.
(b)
Time JO" 4 sees.—>-
10 20 30Cms. from source —»-
40
Fig. 77
the variation of velocity with distance from the source (the open
end of the tube). A tracing from such a record is shown in
fig. 77 (a), which indicates the distance x traversed by the pressure
pulse in any time t. The slope of the curve dxjdt at any point x
* Ami. der Physik, 131, p. 33, 1867.
f Ibid., 27, pp. 1043, 1051, 1908.
% Wien Ber.y78, 2, p. 467, 1879.
§ Safety of Mines Research Board, Papers Nos. 18 and 29, 1926.

VELOCITY OF WAVES OF FINITE AMPLITUDE 267
from the origin indicates the instantaneous velocity at that point.
The derived curve, fig. 77 (b), in which dxjdt is plotted as a
function of x, therefore indicates the variation of velocity with
distance from the source.* It will be seen that the velocity of
the compressed spherical pulse falls from 1150 metres/sec. at the
source (the mouth of the tube) to about 380 metres/sec. at 30 cm.
distance. The spherical wave was still observed 6 metres away,
or about 0-03 second after firing the charge, its speed, 360
metres/sec, being then slightly greater than the normal velocity
of sound, although the gaseous products of the detonation ceased
to move forward beyond a distance of 1 metre. 'Following-
waves' due to the reflected pulse from the opposite end of the
detonating tube were also recorded, the velocities being dependent
on the composition of the burnt gases. Waves produced by solid
particles travelling at high speed (600 to 800 metres/sec.) and
breaking through the main 'sound wave' are clearly shown in
some of the photographs.
The second photographic method of observing the progress of
high-velocity impulses is known as Dvorak's Shadow Method f(described on p. 340). This method is more direct and has been
more frequently used than the Schlieren method. C. V. Boys Jin 1892 obtained photographs of bullets in flight, and the accom-
panying pressure waves in the air, by the shadow method.
Similar photographs have been obtained more recently by Quayle §
and by Cranz.|| Foley ^[ used the method to photograph the
pressure pulse sent out from an intense electric spark. Theshadow of the high-pressure region forming the envelope of
the pulse was photographed at known short time-intervals after
the instant of production of the spark, and the variation of
velocity with distance deduced therefrom. It was found that the
velocity varied from 660 metres/sec. at a distance of 3-2 mm. from
the spark to 380 metres/sec. at 18 mm. distance.
In all the experimental determinations to which we have re-
ferred the wave of finite amplitude consisted of a single pulse,
produced by sudden release of compressed gas or by some formof explosive impulse. Little or no information is available
relative to the variation of velocity of continuous waves with
* See also E. Jones, Proc. Roy. Soc, 120, p. 603, 1928.
t Ann. d. Physik, 9, p. 502, 1880. % Nature, 47, pp. 415, 440, 1893.
§ Journ. Franklin Inst., 193, p. 627, 1923, and Nature, 115, p. 765, 1925.
|| Lehrbuch der Ballistik, 2, Berlin, 1926.
If Phys. Rev., 35, p. 373, 1912, 16, p. 449, 1920, and Nat. Acad. Sci.
Proc, 6, p. 310, 1920.

268 VELOCITY OF WAVES OF FINITE AMPLITUDE
condensation, although it is well known that the change of wave-
form as a wave of finite amplitude advances has an important
bearing on the efficiency of powerful sound generators used in
long-range signalling. In this connection it may be well to
emphasise the distinction between a wave of large ' amplitude ' and a
wave of large 'condensation.' A wave of frequency N = 100 p.p.s.
and amplitude a =10~4 cm. would generally be regarded as having
a small amplitude, yet the same amplitude in a wave of frequency
N=10 6 p.p.s. would be considered large. The important dis-
tinction lies, however, in the particle-velocity u (or the condensa-
tion s). In the former case the maximum value of u=2TrNa =0-0628 cm./sec, whereas in the latter w=628 cm./sec; the corre-
sponding values of maximum condensation s=27rNa/c being
1-9 xlO-6 and 0-019 respectively, if air is the medium of trans-
mission (c=3-3 xlO 4 cm./sec). At the low frequency, therefore,
the condensation is very small and the wave-velocity will have
the normal value for small-amplitude waves, whereas at the high
frequency the condensation must be regarded as * finite ' and the
wave-velocity greater than normal. We find from equation (4),
p. 264, when 5=0-019 that c=£ (l+0-019) 1,a = l-023 c ; that is,
the velocity is about 2 per cent, above the ordinary velocity of
sound. It seems not improbable that the variations of velocity
(of the order of several parts per thousand) observed by Pierce
(see p. 259) with highly resonant quartz oscillators of high fre-
quency may be to some extent, if not entirely, due to variation of
condensation ( oc N«) rather than to variation of frequency only,
as Pierce suggests.
If we assume an amplitude 2 x 10~4 cm. for the quartz oscillator
of 50,000 frequency, the velocity will be approximately 2°/oo above
normal, which accounts for the whole of the difference observed.
Unfortunately, Pierce does not refer to observations of amplitude
of the various quartz crystals used in the measurements of velocity,
consequently we are not able to check this possibility. Pierce's
method, however, would lend itself admirably to an investigation
of the variation of velocity with condensation, provided simul-
taneous observations were made of amplitude, frequency, and
wave-velocity.
Information which is available regarding the propagation of
waves of finite amplitude in water is very scanty and unreliable.
Threlfall and Adair * made observations of the velocity of ex-
plosion waves from various charges of guncotton (9 to 64 oz.), and
* Proc. Roy. Soc.y 46, p. 496, 1889.

VELOCITY OF WAVES OF FINITE AMPLITUDE 269
obtained large increases with increasing size of charge. There is
no doubt, however, that some error in the method of observation
led to a value of 2013 metres/sec. for a 64-oz. charge, as compared
with the velocity of 1500 metres/sec. for small-amplitude waves.
More recently D. A. Keys * has employed a method suggested
by J- J- Thomson f to record the pressure wave produced by an
explosion under water. In this method the pressure affects a
piezo-electric disc of tourmaline crystals and generates a pro-
portional electrical charge. The charge is recorded instantane-
ously, and measured, by means of a cathode ray oscillograph J with
photographic recording arrangements. Measurements with two
tourmaline discs at a known distance apart, receiving an explosion
wave from 2J lb. guncotton at a distance of about 50 ft., give a
value of velocity slightly higher than that of sound. A similar
result was obtained using a single receiver subjected to the direct
pressure pulse and subsequently to the pulse reflected from the
sea-bed, at a known depth below the receiver. The method is of
interest, but the results can only be regarded as qualitative in
character.
Apart from the complicated nature of the evidence revealed by
earthquake waves, there is no available information relative to the
propagation of waves of 'finite' amplitude in solids.
Sounds from High-speed Projectiles. * Onde de Choc' (or
' Onde balistique ') - One of the best examples of the propagation
of a pressure pulse with a velocity greater than normal, is provided
by a high-speed bullet in its flight through the air. A bullet
travelling at low speeds (less than c ) compresses the air in front
of it and a spherical sound wave of normal velocity is transmitted.
If, however, the speed of the bullet exceeds the velocity of sound,
the condensation at the nose can be transmitted laterally but not
forwards. Photographs of bullets in flight, taken by Boys, Cranz,
Quayle, and others § by spark photography, reveal some very
interesting features (see fig. 78, photo by Cranz). The photo-
graph shows clearly the existence of two wave-fronts somewhatconical in shape, one from the nose and the other from the base
of the bullet. The wave from the base must also be a wave of
condensation, for Rayleigh has shown that the only kind of waveof finite amplitude which can be maintained is one of condensa-
tion. The detailed structure of the envelope of the wave, as
* Phil. Mag., 42, p. 473, 1921. f Engineering, 107, p. 543, 1919.
X See A. B. Wood, Proc. Phys. Soc, 35, p. 109, Feb. 1923, and Inst.
Elect. Eng.y 63, p. 1046, Nov. 1925. § Loc. cit., p. 267.

270 VELOCITY OF WAVES OF FINITE AMPLITUDE
revealed by the photograph, confirms this conclusion. At present,
however, we are mainly concerned with the ' bow ' wave from the
nose of the projectile. This can be simply explained by Huyghens'
principle (see p. 67). It is clearly the envelope of spherical waves
which originate at the nose of the bullet at successive instants in
its flight. If these were 'small-amplitude' waves—that is, if the
condensation at the nose of the bullet could be regarded as small—
Fig. 78—Photograph of a high-speed Bullet in Flight
(By courtesy of Prof. W. Cranz)
the envelope would be a cone of semi-angle 6 given by sin d=c/v,
where c is the velocity of sound and v the velocity of the bullet.
When v is less than c, the angle 6 is imaginary and the spherical
waves have no envelope—that is, no wave-front is formed. Nowthe condensation at the nose of the bullet is finite, and as a con-
sequence the velocity of propagation is greater than the normal
velocity of sound. The nearer to the nose of the bullet, the
greater this effect will be—that is, the angle 6 of the 'cone' will
increase towards the nose of the bullet. The actual wave-front
under such conditions will therefore be a blunted cone, and this
is what is actually observed (see fig. 78). The 'blunting' effect
is increased the flatter the nose of the bullet, for the condensation
is then much greater than that due to a sharp-nosed bullet.
(The vortex eddies in the wake of the bullet are of interest, see
p. 205.)
When a bullet or shell, travelling with a velocity greater than
sound, passes an observer it makes a sound like the ' crack ' of an

REFLECTION 271
explosion. This is described by the French as Onde de choc or
Onde balistique* A. Mallock f has shown that it is possible to
deduce the position of a gun by observing the apparent direction
of the onde de choc at different points along the track of the shell.
As the shell slows down in its flight and v approaches c, the angle
9 of the cone gradually increases, the observed direction of the
sound varying accordingly and therefore becoming less and less
inclined to the direction of flight of the shell.
CHANGE OF MEDIUM(A) Reflection
When a wave of sound meets the bounding surface between
two different media it is partially reflected, and a wave travels
in the negative direction through the incident medium with
the same velocity as it approached the boundary. The geo-
metrical laws of reflection of sound waves are the same as apply
to light waves, the angles of incidence and reflection being equal
and in the same plane. In many cases, however, the length
of the sound waves is comparable with the linear dimensions of
reflecting objects, when the geometrical laws cease to apply and
the phenomena must be regarded essentially as diffraction. For
the present, however, we shall assume the wave-length small
compared with the dimensions of reflectors, the ordinary laws of
geometrical optics being applicable.
Reflection of Plane Waves at the Boundary ofTwo ExtendedMedia - The geometrical laws of reflection and refraction follow
directly from the facts that the velocity in each medium is indepen-
dent of the direction of the wave-front and that the traces of all
wave-fronts on the plane of separation have equal velocities.
Consequently, if 6lt 9 r , and 9 2 are the angles of incidence, reflec-
tion, and refraction respectively (see fig. 79), we must have
sin U 1 sin u r sin t/ 2== =
, or #!= u r , the law of reflectionC\ C\ £2
and ———=— , the law of refraction.sin v 9 c 9
(i)
At the boundary of the two media it is necessary (a) that the com-ponent of particle velocity £ normal to the bounding surface must
* See E. Esclangon, UAcoustique des canons et des projectiles (Gautier-Villars, Paris).
f Proc. Roy. Soc, p. 115, 1908.

272 CHANGE OF MEDIUM
be continuous, and (b) that the pressure-variation Sp must also be
continuous. If suffixes i, r, and t refer respectively to the incident,
reflected, and transmitted waves, and 1 and
2 refer to the incident and transmitting
media, we may write for condition («),
itcos dx+ ir cos X
= itcos 6 2 (2)
and for condition (b),
§pi+ Spr= Sp
tor since §p = ±cp£
(see equation (25), p. 55)
ClPl£i—ClPl£r=C2p2£t (3)
Fig. 79
the negative sign in the second term of this equation indicating the
reversed direction of propagation of the reflected wave. Elimin-
ating itfrom (2) and (3) we obtain
C2P2 cos 1 —c1p 1 cos 6 2
Si C2p2 C0S ^1+ ^lPl cos $2
Similarly, by elimination of £r we find
it 2ciPi cos ei
Si (c2p2 cos 1
Jrc1p 1 cos 6 2)
(4)
(5)
These expressions not only represent the condition at the boundary,
but also at corresponding points in the respective waves. Theyare obtained without assumptions regarding wave-length and
phase and are therefore applicable to waves of any type whatever.
At Normal Incidence 61= d 2
=0 - If we denote the radiation
resistance pc by R the expressions for the reflected and transmitted
waves become respectively
and
£r_Rt— Rs
&~Ri+Rs
ii R1+R2
=r (6a)
(6b)
According to the principle of reversibility* if all velocities in a
dynamical system are reversed and there is no dissipation of energy,
* See Schuster's Optics, p. 45.

REFLECTION AT PLANE BOUNDARY 273
the whole previous motion is reversed. Consequently if the
sound wave be now transmitted from medium (2) to medium (1)
we have
2R^2i=^-V and t12t21 +r*= l . . (7)
which is independent of any assumption as to change of phase at
reflection. If Ia , I,., Itrepresent the energy in the incident,
reflected, and transmitted waves respectively, then la =I rJr l
t.
It would be wrong to conclude from this that ^2 =£r2+ ^2
because the squares of amplitudes only express relative intensities
in media of the same radiation resistance. The energy in a wave is
proportional to cp£2 (see equation (27), p. 55), consequently wemay write
that is,
£2=£ 24~£2 or **+|V=l • • (8)
Defining the normal reflection coefficient as r 2 the ratio of reflected
to incident energy, we must regard ^122(R
2/R1) as the normal
transmission coefficient.
Phase Changes on Reflection - Referring to equation (6*2), it is
important to observe (a) when R2=RX there is no reflected wave,
the transmission to the second medium being complete;
(b) when
R2>R± the radiation resistance in the first medium being less
than in the second (e.g. air to water), the particle-velocity is negative,
i.e. reversed in phase. The phase of the condensation sr=£
r/c,
however, remains unchanged because both £ and c are reversed in
sign in the reflected wave, (c) when R2<R± (e.g. water to air),
the phase of the particle-velocity £rremains unchanged, but the
phase of the condensation is reversed. Equation (6) may therefore
be written
and
st
2R!
The phase of the transmitted wave is unaffected in all cases.
(9b)
When the sound wave travels from a medium of low velocity cx
18

274 CHANGE OF MEDIUM
to a medium of higher velocity c2 (i.e. c2>c 1), we see from equa-
tion (1) that there will be a critical angle of incidence 9X when d 2
becomes 90°-—that is, when sin 1 =c1/c 2 , beyond which there is
total reflection. On account of the greater velocity of sound in
water, total reflection may occur when the waves are incident from
air on water, but not from water to air.
To illustrate the application of the above equations, take the
case of transmission from air to water. At normal incidence
equations (6a) and (9a) are applicable. For air R1 =p 1c1 =4:0,
and for water R 2 =p 2c2= l-5 xlO5
, whence the ratio of reflected to
incident amplitudes is 0-9994, indicating almost total reflection.
The phase of the condensation is unchanged (see equation (9a)),
whilst that of the particle-velocity is reversed (the nodal condition).
From water to air the reflection coefficient is again almost unity,
but the condensation is now reversed in phase, whilst that of the
particle-velocity is unchanged (the antinodal condition). In
practically all cases of sound transmission from a gaseous to a
solid or a liquid medium (or vice versa), i.e. whenever the radiation
resistances are widely different, there is almost complete reflection.
The difficulty of transmitting sounds from water (e.g. the noise of
a ship's propeller in the sea) to the air-filled ear-cavity of an
observer will be apparent. Transmission from a liquid to a solid,
however, is much more favourable, for now Rx becomes com-
parable with R 2 . Take, for example, sound waves passing from
water to steel where 1^=1-5 XlO5 and R 2=7-8 x5 xl0 5 =3-9 xlO 6
respectively. Here we find r =0-925, representing a reflection
coefficient r2 of 85 per cent., and a transmission of 15 per cent, of
the incident energy. Similarly from water to oak, where R2=
3-4 xlO 5 we find r=0-39, r2 =0-15, and 85 per cent, of the energy
is transmitted. From water to steel c1/r2 =0-33, whence the
critical angle sin-1 0-33 is 19J°; from air to water c1/c2
=0-22 and
sin-1 0-22 is 13°. In the latter case, as we have already seen, the
reflection is almost total, even at normal incidence. Such calcula-
tions have an important bearing on the possibility of detection if
objects under water, such as wrecks or icebergs, by echo methods #
(see pp. 150 and 471). The density of ice is about 0-92 and the
velocity of sound in it has been estimated at 2- 1 x 10 5,giving a value
of R2= l-9 x 10 5
, whence the reflection coefficient r2 from sea-water
to ice is 0-027. The possibility of detecting pure ice under water
by sound reflection methods would, on this estimate, be negligibly
* See Papers by Boyle and Reed, and Boyle and Taylor, Trans. Rov.Sop. Canada, 3, pp. 233 and 245, 1926.

REFLECTION FROM PLATE OF FINITE THICKNESS 275
small. Actually, however, an iceberg contains large inclusions of
rock and air-cavities, both of which are much more effective than
ice as reflectors of sound in water. It is these inclusions which
make it possible to detect icebergs by echo methods.*
Method of Images - A convenient method of regarding
problems in the reflection of sound employs the optical analogue
of ' images.' A source of sound on one side of the plane boundary
between two extended media may be regarded as having an image
at an equivalent distance on the other side of the boundary. Theresultant effect at any point in the first medium will then be
made up of the sum of the effects due to the source and its image.
It is important to attach the correct phase to the vibrations of the
image with respect to the actual source. Thus if a sound wave
in air is reflected from a solid wall or a water surface (i.e. if
R1<R 2), the image will be exactly similar to the source and at
a distant point, almost equidistant from the source and the image,
there will be reinforcement of the sound received, due to the
presence of the reflector. If, however, the sound source is under
water and its image is in air (R1>R 2), the phase of the image will
be opposite to that of the source. At a distant point, therefore,
when the paths of the direct and reflected sounds are nearly equal,
the resultant effect would be approximately zero. This result has
an important bearing on the long-range transmission of sound
through the sea. At smaller distances from the source inter-
ference phenomena (see pp. 296 and 299) are observed analogous
to Lloyd's interference bands in Optics.
Reflection of Plane Waves from a Plate of Finite Thick-
ness - This is an extension of the case we have just considered,
the thickness of the second medium now being limited. Thecase of greatest interest and practical importance is that in which
a slab of solid material is immersed in an ' infinite ' medium. Themathematical treatment is analogous to the optical case of multiple
reflection in a thick slab of glass, the boundary conditions, pressure
and particle-velocity relations, being similar to those just considered.
Rayleigh f has derived the ratio of reflected to incident amplitudes
at normal incidence, and more recently R. W. Boyle and W. F.
Rawlinson J have extended the analysis to any angle of inci-
dence. We shall be content with a quotation of Rayleigh's result,
* See Papers by Boyle and Reed, and Boyle and Taylor, Trans. Roy.Soc. Canada, 3, pp. 233 and 245, 1926.
f Sound, 2, pp. 87, 88.
j Trans. Roy. Soc. Canada, 22, 3, p. 55, 1928.

276 CHANGE OF MEDIUM
making the necessary changes in nomenclature
incidence :
&=rJh R
it VR 2
Thus for normal
2nl4 cot 2 -—+
A
R 1
+R
2
R2 Ri/)
10)
where £rand f{
refer as before to the reflected and incident ampli-
tudes, R 2 and R 2 (=piC1 and /o 2£2) are the acoustic resistances of
the medium (1) and the plate (2) respectively, / is the thickness,
and A the wave-length of the sound in the material of the plate.
The transmitted energy may readily be deduced from equations
(8) and (10), if we assume there is no loss of energy due to absorp-
tion. It will be seen that the reflected amplitude varies between
zero and a maximum amplitude as the thickness of the plate
varies. The velocity of sound in most solids is greater than in
liquids or gases, consequently for a solid plate in a fluid mediumwe may in general write c2>c1 . In such a case equation (10)
shows that cot 2 (2ttI/X) is infinite, and consequently the reflected
amplitude is zero, whenever / is zero or a multiple of A/2. Ahalf-wave plate therefore reflects none and transmits all the incident
energy. When / is a multiple of A/4 the value of cot 2 (2ttI/X) is
zero, and the reflected amplitude is a maximum. A quarter-
wave plate therefore reflects a maximum and transmits a minimumof the incident sound energy. In this case equation (10) reduces to
r=l Ri*-R,'
it Rx2+Rs
(when /=mA/4) (ii)
The square of this ratio (rs
is the energy reflection-coefficient.
These deductions are exhi-
bited graphically in fig. 80,
taken from Boyle and Raw-linson's paper. The curves
refer to large plates of dur-
alumin immersed in water.
The thickness / is expressed
as a ratio of the wave-length
A of the sound in the metal.
Assuming ^= 1-5 xlO5, p ±
=10 for water, and c2=6-5
XlO5, p 2
=2-8 for dural-
umin, then R^l^xlO 5,
R2= 18-2 xlO5
. At a frequency of 105 p.p.s., therefore, a plate of
duralumin about 1-8 cm. thick would reflect over 97 per cent, of the
0-2 0-4 0-6 0-8 10Ratio Thickness l/ivauelength A
Fig. 80

REFLECTION FROM PLATE OF FINITE THICKNESS 277
sound energy incident normally upon it. These relations for the
reflection of plane waves from flat plates have been verified experi-
mentally by Boyle and Lehmann.* They used a quartz oscillator
(see pp. 146 to 151) as the source of sound under water, at a fre-
quency of 135,000 p.p.s., and measured the reflected energy by the
torsion pendulum method (see p. 432). A number of torsion vanes
were made of lead of different thicknesses, the energy reflected from
the vane at first increasing rapidly with increasing thickness, remain-
ing practically constant (from /=0T to 0-4A) at approximately 100
per cent, reflection until the half wave-length thickness (0-765 cm.)
was approached. The critical angle of total reflection was also
determined. The results were found to be in general agreement
with the theory. Interesting practical examples of partitions
transmitting more energy with increase of thickness are mentioned
in experiments by Watson f on sound-proof partitions. Slabs of
cork, each f in. thick, closed the doorway of a room in which
an organ pipe was emitting sound. A thickness of two slabs of
this board was found to reflect less and transmit more sound than
either one or three slabs of the same material. Such examples,
however, should be regarded with caution, for deductions are
rendered uncertain by absorption in the material and by the
possibility of excitation of transverse vibrations, whereas the theory
assumes only longitudinal vibration.
Important practical applications of the theory of transmission
of sound through plates are described in a paper by H. Brillie.J
Calculations are made on the transmission of sound through the
hulls of ships, and on the choice of a material as intermediary
between water outside, and air inside the ship. Brillie considers
that a thick rubber slab or tube receiver is much more efficient
in this respect than a metal receiver (a steel diaphragm, for
example). This opinion is based on the calculation that the
acoustic (radiation) resistance of rubber is of the same order as
the geometric mean (2-4 x 10 3) of the values 40 for air and 1 -5 x 10 5
for water.
An interesting and important application of equation (10)
relates to the reflection of sound waves from a thin film of air en-
closed in a medium of much larger acoustic resistance, such as
water or rock. A film of air 0-01 cm. thick (R 2 =40) enclosed
between thin metal plates under water (R1= l-5xl0 5
) would
* Trans. Roy. Soc. Canada, 21, 3, p. 115, 1927.
f University of Illinois, Bull. 127.
X Le Genie Civil, Aug. and Sept. 1919.

278 CHANGE OF MEDIUM
according to (10) reflect about 93 per cent, of the incident energy
at a frequency of 1000 p.p.s. (Aair=33 cm.). The percentage
would be still greater if the medium enclosing the air film were
solid rock. Assuming R^ to be of the order 1-5 xlO 6 for rock,
99-93 per cent, of the energy would be reflected from the thin
air film. The significance of such a result and its bearing on
geological prospecting by echo methods (see p. 474) will be
appreciated.
Reflection from a Succession of Thin Parallel Laminae -
Tyndall # demonstrated by means of a high-pitched sound and
a sensitive flame that a material like muslin, consisting of a net-
work of fine threads, transmitted the greater part of the sound
incident upon it, only a small proportion being reflected. If,
however, the muslin be wetted, so as to close the meshes of the
net, the amount reflected is considerably increased. In explain-
ing the phenomena of iridescence in certain crystals Rayleigh futilised the partial reflection of sound from dry muslin to illustrate
an important principle. "If a pure tone of high (inaudible)
pitch be reflected from a single sheet so as to impinge upon a
sensitive flame, the intensity will probably be insufficient to pro-
duce a visible effect. If, however, a moderate number of such
sheets be placed parallel to one another and at such equal distances
apart that the partial reflections agree in phase, then the flame
will be powerfully affected. The parallelism and equidistance
of the sheets may be maintained mechanically by a lazy-tongs
arrangement, which nevertheless allows the common distance to
be varied. It is then easy to trace the dependence of the action
upon the accommodation of the interval to the wave-length of the
sound. Thus if the incidence were perpendicular, the flame
would be most powerfully influenced when the interval between
adjacent sheets was equal to the half wave-length ; and although
the exigencies of experiment make it necessary to introduce
obliquity, allowance for this is readily made." The experiment
has been more recently utilised by W. H. Bragg \ to illustrate the
reflection of X-rays from successive parallel planes of atoms in
crystals. As a means of measuring the wave-length and frequency
of inaudible sounds in air the method should be quite as effective
as the more generally known stationary-wave method. In fact,
it should be more instructive, for the parallel planes serve as a
* Sound.
t Sound, 2, p. 311, Proc. Roy. Inst., April 1889 ; Phil. Mag., 24, p. 145,
1887, and 26, p. 256, 1888. J R.I. Lectures.

STATIONARY WAVES 279
reflection grating (of the ' crystal ' type) for analysing a complex
high-frequency sound, the different wave-lengths having their
maxima at different angles of reflection, or corresponding to
different spacing distances of the reflecting laminae. In the
proposed arrangement shown in fig. 81 (a) S is a source of high-
frequency sound (a Galton's
whistle or a Pierce's oscillating
quartz crystal) at the focus of a
concave mirror M x which renders
the sound beam practically par-
allel. This beam falls on the
'muslin' sheets L^Li, L 2L 2 , etc.,
and, after reflection, is collected
by a second concave mirror
M 2 and focussed on a sensitive
flame F. If 6 is the angle of in-
cidence and d the 'spacing dis-
tance' of the planes, then the
difference of path between a ray
reflected at the first and second FlG-8l
surfaces is CB +BD in fig. 81 (b).
From the construction shown it is evident that CB=BD, and the
path difference is 2d cos 6. The maximum effect is obtained at Ftherefore when this quantity is equal to an integral number m of
wave-lengths A—that is,
mX=2d cos 9.
The value of A may be found by varying the angle 6 as in the
spectrometer method, or by varying the distance apart of the
reflecting planes with the lazy-tongs arrangement.
Stationary Waves - When plane waves are reflected at normal
incidence from the interface formed by two different media, a
reflected wave travels back into the incident medium and 'inter-
feres ' with the oncoming incident wave. We have made frequent
reference to such an effect in relation to the transverse vibrations
of strings (p. 86) and to the longitudinal vibrations of rods (p. 136)
and of gas columns in tubes (p. 170). The same mathematical
treatment is also applicable to extended media. Consider a wave
of displacement f=a cos k(ct—x), where k=27r/\=27rN/c, advanc-
ing in the incident medium towards the surface of separation
(#=0). A similar wave in the opposite direction would be

280 CHANGE OF MEDIUM
represented by f=a cos k(ct-\-x). We shall now refer to two
important cases in both of which perfect reflection is assumed, i.e.
the acoustic resistances Rx and R 2 are widely different.
Case I - 'Fixed' End. R 2 much greater than R x (e.g.
transmission through a gas to a liquid or a solid reflector). In
order to make the displacement £=0 at the interface x—0, the
resultant amplitude obtained by addition of the direct and reflected
amplitudes is
i=a cos k(ct—x)—a cos k^ct+x).
(This is the condition for the fixed end of a string or the closed
end of an air column.) On reduction this becomes
£ =2a sin (kct) sin (kx) . . (1)
representing a system of stationary waves, of amplitude varying
between and 2a, with time t and with distance x measured from
the boundary (#=0), where £ is always zero.
Case II - '
Free' End. Rx much greater than R 2 {e.g. trans-
mission through a liquid or solid medium to a gaseous reflector).
In this case the displacement f is a maximum (and the condensa-
tion d£/dx=0) when x=0. Consequently the resultant amplitude
is given by
£—a cos k(ct—x) Jr a cos k^ct+x).
(This condition is approximately fulfilled at the open end of a
pipe, or the free end of a rod.) The expression for f may be
written
f =2a cos (kct) cos (kx) . . (2)
representing a system of stationary waves with an antinode at
the boundary (#=0).
A third case, of considerable practical importance, arises whenthe reflection from the bounding surface of the two media is not
perfect, the reflected amplitude being less than the incident
amplitude.
Case III - Imperfect Reflection. (Fixed or Free End.) Weshall regard the bounding surface to be in the nature of a fixed
end R2>Rl5allowing a proportion of the incident sound energy
to be transmitted or absorbed by the reflecting medium. Theprocedure for a free end reflector is similar. Denoting the incident
and reflected amplitudes by a and r respectively, the resultant
displacement will be given by
i=a cos k(ct—x)—r cos k(ct-\-x),

ECHOES 281
which becomes
£= (#-f r) sin kct sin kx+(a— r) cos kct cos kx . (3)
The motion may thus be regarded as being due to two superposed
stationary waves, of amplitude (a-\-r) and (a—r), the nodes and
antinodes of one being a quarter of a wave-length {or tt/2) distant
from the nodes and antinodes of the other. This results in a
series of positions of maximum (a+r) and minimum (a—r)
amplitude ('pseudo' nodes and antinodes) a quarter of a wave-
length apart. In the case of perfect reflection r =a, the expression
(3) for f becomes identical with (1). If we write a= (a+r) and
j8=(a— r), then the reflection coefficient (see p. 273) will be
:YJ^YJiz^Y . .(4)
II \a+pj \l+j8/a/V
'
an expression in terms of the ratio (j8/a) of minimum/maximumamplitude in the stationary wave. This serves as a basis for
experimental methods of measuring the reflecting properties of
materials, and their absorption or transmission properties also.
We shall refer to such measurements later (see pp. 324 and 488).
The demonstration of stationary waves in air or other gases by
means of high-frequency sounds reflected normally from a plane
surface has already been mentioned (see Rayleigh's 'bird call'
experiment, p. 208, and Pierce's piezo-electric observations, p. 258).
We have also referred to Boyle and Lehmann's demonstration of
stationary waves in water (p. 260) and the measurements of Woodand Loomis with stationary waves in various other liquids #
(p. 260). See also fig. 87.
Echoes - The direct reflection of a sound of short duration
from a surface of large area such as the wall of a building or a
cliff is generally described as an echo.f The echo is only appreci-
ated by the ear, however, if the time-interval separating the direct
and reflected sounds is of the order of one-tenth of a second or
more. In such cases the best echoes are obtained when the
dimensions of the reflector are large compared with the wave-
length of the incident sound. Thus a sharp crack or a sound of
an impulsive nature gives a loud and clear echo, whereas with a
low-pitched sound of long wave-length the echo may be scarcely
perceptible. Simple echoes from surfaces of large area have been
* See also F. L. Hopwood,^07/r«. Set. Instrs., Feb. 1929.
f Many interesting examples of ' echo ' are given in Tyndall's Sound,p. 17.

282 CHANGE OF MEDIUM
utilised under certain circumstances as a convenient means of
measuring a distance in terms of the known velocity of sound c
in the medium and the time-interval t for the sound to 'go and
return' to the observer, i.e. the distance d from the reflector is
ct/2. The height of an airship above the ground or the depth of
the sea-bed beneath a ship may be found in this way (see p. 466).
Under certain circumstances, however, the echo is different in
character from the incident wave, the character of the reflection
depending on the nature and position of the reflecting surface in
its relation to the wave-form of the sound falling upon it.
Reverberation in large halls or auditoriums is due to multiple
reflections of the speaker or singer's voice from the walls, floors,
and ceiling. We shall consider the practical aspect of such rever-
beration when dealing with the acoustic properties of buildings
(see p. 484).
Scattering of Sound. Harmonic Echoes - As the wave-
length of the sound diminishes the effectiveness of a small reflector
improves. If therefore the incident sound is complex, consisting,
for example, of a fundamental tone plus a series of high harmonics,
the component tones will be reflected in increasing proportion
towards the higher frequencies, i.e. towards the shorter wave-
lengths. It has sometimes been noticed, for example, that the
pitch of the echoes returning from a group of trees appears to be
raised one or more octaves above the pitch of the fundamental
incident sound. Rayleigh has dealt with the question mathe-
matically,* referring to the reflections as 'secondary waves,' and
the phenomenon as scattering of sound. He shows that the
amplitude of the secondary waves varies directly as the volume of
the 'scatterer,' and inversely as the square of the wave-length A
of the incident sound. That is, the intensity of the sound returned
to the observer varies inversely as the fourth power of the wave-
length. As Rayleigh points out, this result might have been
foreseen without calculation. The ratio of the ' scattered ' to the
' incident ' amplitude must necessarily vary directly as the volume
V and inversely as the distance r, and in order that the result,
the ratio of amplitudes ajatmust have the dimensions of a pure
number we must divide by A 2, since A is the only other linear
magnitude involved, i.e.
asV I, V 2
_soc — or — oc ,
a{
AV I, A4r2
* Sound, 2, p. 152.

ECHOES 283
The law of scattering, I6,oe 1/A4
is also well known in optics, where
light waves are scattered by particles whose dimensions are small
compared with the wave-length of the light falling upon them.
The blueness of the sky is attributed to such a cause. Returning
to the case of sound waves, it will be seen therefore that the
higher components of a complex note are reflected back from
small scattering objects in a much greater proportion than the
fundamental tone. The octave of a tone will be sixteen times
more intense in the scattered than in the incident sound. Echoes
of such a character have been called 'Harmonic Echoes.'
A complementary phenomenon is of familiar occurrence. Thesound received on the remote side of a ' harmonic reflector ' must
also differ from the incident complex sound. In this case,
however, the change of quality is due to a deficiency in the higher-
frequency components which were present in the original sound.
The shorter wave-length components having been scattered
forwards in a much greater proportion than the fundamental, or
long wave-length component, the sound behind the obstacle
appears to be 'purified.' The total effect of any obstacle in
scattering or reflecting sound waves may be calculated by inte-
gration of the effects due to its elementary parts. In this way it
is possible to trace the transition from a small obstacle, in which
the volume but not the surface is important, to a reflector of large
area which will ultimately reflect optically.
Musical Echo from Palings. Echelon Reflection (Gratings) -
An observer walking on a hard footpath near a row of regularly
spaced, or stepped, palings, may notice that each footstep is followed
by an echo having a musical ring. Any ' sharp ' or impulsive sound
is reflected from a stepped structure in this way. The successive
elements or strips each reflect the impulse or, as we have just seen,
its higher harmonics, and the observer receives a regular succession
of reflected pulses which, if sufficiently rapid, blend into a musical
note. The frequency of the note will depend on the spacing dof the steps and on the direction 6 from which the reflections
proceed. The time between the successive pulses, i.e. the period of
the musical echo, will be 2d cos 6/c, and the frequency c/2d cos 9.
The earlier reflections, from the strips nearest the observer, will
usually be masked by the direct sound, and as a consequence only
those reflections will be heard which come from more distant
strips, i.e. when 6 is small. For example, from a row of palings
of spacing 10 cm. the frequency of the note heard by the observer
will be 3-3 x 10 5/20 =1650 p.p.s. or some multiple of this frequency.

284 CHANGE OF MEDIUM
R. W. Wood * has demonstrated the actual existence of a suc-
cession of reflected pulses from an echelon or stepped reflector bythe spark method of shadow photography (see p. 340). An echelon
reflector may serve as a diffraction grating for sound-wave analysis
just as in the optical case (see p 309).
Reflection from Curved Surfaces. Mirrors. Whispering
Galleries - The well-known optical phenomena of reflection at
spherical or parabolic surfaces have their analogue in sound, pro-
vided the dimensions of the reflector are considerably greater than
a wave-length of the incident sound. Reference has already been
made (pp. 193 and 2 1 5) to the directional or ' focussing ' properties of
spherical reflectors used as sound transmitters with a small source
at the focus. The semi-angle of the cone of the diverging primary
beam was shown to be sin-1 0-61A/V, which indicates the reflected
beam does not become 'parallel' until the wave-length A is very
small compared with the radius r of the aperture. Conversely,
the reflector acting as a collector of a parallel beam of sound does
not form an ' optical image ' unless r is very great compared with A.
The image of a point source of light was shown by Airy f to
consist of a bright disc surrounded by bright rings separated by
circles at zero intensity. The radii of these circles are given by
a =mfX/2r (where / is the focal length of the reflector and m has
successive values 1-220, 2-233, 3-238, 4-241, etc.; 0-839 of the
total energy falling on the central disc, 0-071 on the first bright
ring, and so on). The optical deductions are equally applicable
to sound waves. Thus a perfect parabolic concave reflector,
1 metre in diameter (r=50 cm.) and focal length 50 cm., would
form a diffraction image with a central 'bright' spot 2-0 cm.
diameter, if the source were a distant point emitting sound of
frequency 10,000 p.p.s. in air (c=3-3xl0 4 cm./sec), the wave-
length A being 3-3 cm. The 'resolving power' of the mirror,
which indicates the limiting angle 6 which can be recognised
between two distant point sources, may be regarded as the angle
subtended by the radius of the central disc at the pole of the
mirror, i.e. 9=af=1-22 X2r =0-61 X/'r. In the example just
mentioned this angle is 2-3 degrees. The Yerkes telescope, with
an aperture of 100 cm., resolves two distant stars subtending an
angle of 0-125 second of arc. A concave sound reflector cannot
be regarded, therefore, as a means of forming a sound image, in
the optical sense. Such reflectors, however, are very efficient in
* Phil. Mag., 48, p. 218, 1899.
t Trans. Camb. Phil. Soc, 5, p. 283, 1834.

REFLECTION FROM CURVED SURFACES 285
indicating the direction, within a few degrees, of a high-frequency
source. To demonstrate the focussing of sound waves in the
laboratory, Rayleigh's experiment with two concave reflectors, a
bird-call (or other high-pitched source), and a sensitive flame are
all that is required (see also p. 371).
The reflecting properties of concave surfaces are beautifully
demonstrated by the method of spark photography (see p. 340).
In fig. 71 a comparison is made between the reflection of the
sound pulse from a spark at the focus of a parabolic and a spherical
mirror respectively. It will be seen that the parabolic reflector
gives a tolerably plane wave (parallel beam), whereas the aber-
ration produced by the spherical reflector is clearly shown.
The well-known whispering gallery of St Paul's Cathedral owes
its peculiar properties to the reflection of sound by the curved
walls of the gallery at the base of the hemispherical dome. Aperson whispering along the wall on one side can be heard clearly
by a listener close to the wall at any other part of the gallery.
A complete explanation of all the phenomena is still to be found,
but Rayleigh * has given a theory which, at any rate, agrees with
the principal facts. He pointed out that the sound tends to creep
around inside of a curved wall without ever getting far from it.
"A whisper seems to creep round the gallery horizontally, not
necessarily along the shorter arc, but rather along that arc towards
which the whisperer faces. This is a consequence of the very
unequal audibility of a whisper in front of and behind the speaker.
The abnormal loudness with which a whisper is heard is not
confined to the position diametrically opposite to that occupied
by the whisperer, and therefore, it would appear, does not depend
materially upon the symmetry of the dome." Moreover, whis-
pered speech, which contains a large proportion of high-pitched
sounds, is heard more distinctly than ordinary-voiced speech,
especially if the speaker looks along the gallery towards the
listener. Rayleigh demonstrated these effects on a small scale
by means of a sheet of iron (12 ft. x 2 ft.) bent into the arc of a
circle, with a bird-call at one end and a sensitive flame at the other.
A narrow screen interposed radially at any point inside the
curved surface and near it prevented the sound from reaching
the flame. Rayleigh's theory shows (1) that the thickness of the
narrow belt skirting the wall decreases with diminishing wave-
length, (2) that the intensity is a maximum near the wall and
gradually diminishes awTay from it, and (3) that the intensity does
# Sound, 2, p. 126, and Scientific Papers, 5, p. 617.

286 CHANGE OF MEDIUM
not fluctuate circumferentially, i.e. parallel to the wall. Experi-
ments by C. V. Raman and G. A. Sutherland * with a high-
pitched source and sensitive flame confirm Rayleigh's conclusion
(1), but disagree with (2) and (3). A further investigation by
Raman f confirms a view held by Sabine J that the inward slope
of the wall is important for the best effect. Circumferential and
radial 'nodal' lines were observed in five different whispering
galleries, the sound intensity being a maximum at opposite ends
of a diameter. It was shown, further, that an impulsive sound
would travel several times round the gallery, a succession of
sounds separated by time intervals equal to the circumference of
the gallery divided by the velocity of sound (within ±1 per cent.)
being observed. F. L. Hopwood § has demonstrated the existence
of radial and circumferential nodal lines by means of soundwaves of
very high frequency (750,000 p.p.s.) in oil. The plane waves of
very short wave-length emitted by a quartz oscillator entered a slit
tangentially and passed round a model whispering gallery. Thestationary sound distribution inside the model was revealed bysprinkling fine coke dust (Boyle's method) in the oil. B. Ray
||
has studied the whispering gallery effect experimentally by an-
alogous optical methods. He finds, in confirmation of Raman's
views, that a succession of belts of maximum intensity are found
near to the curved surface. These maxima appear in the form
of a series of interference bands at one end of the curved strip of
mirror which has a source of light on its surface at the other end.
Rayleigh has suggested that in the propagation of earthquake
disturbances the surface of the earth behaves somewhat like a
whispering gallery. It is not unlikely also that sounds which
travel long distances in the sea are dependent on such an effect,
and on repeated reflection at the surface and the sea-bed. In a
sea of average depth, 150 ft. (the North Sea, for example), the
maximum possible range of direct transmission will be about
thirty miles, whereas ranges two or three times as great as this have
frequently been observed. The possibility of a curved path due
to temperature gradients, however, must be taken into account
in any theory of long-range transmission of sound.
Huyghens' Construction for Reflected Waves - The moreimportant features of reflection of sound waves are readily obtained
* Nature, 108, p. 42, Sept. 8, 1921.
f Indian Assoc. Cult. Sci., 7, p. 159, 1922.
X Collected Papers, p. 255. § jfourn. Sci. Instrs., Feb. 1929.
|| Calcutta Math. Soc, Bull. 12, 4, p. 225, 1922.

HUYGHENS' CONSTRUCTION FOR REFLECTED WAVES 287
by the direct application of Huyghens' principle of secondary
waves (see p. 67). This principle states that the wave-front of a
disturbance may at any instant be obtained as the envelope of the
secondary wave proceeding from all points of the wave-front at
some preceding instant. We shall consider a few simple examples.
(1) Reflection of plane waves from a plane surface. Spherical
secondary waves leave each point of the surface as soon as the
incident wave-front reaches it. Thus in fig. 82 I. (a), as the wave-
front WW' impinges on the surface WR, each point between
W and R becomes in turn a source of secondary waves. By the
time W' in the incident wave has reached R, the secondary hemi-
cylindrical wave fromW has spread over a radius WR' =W'R. Aplane RR' drawn through R and tangential to this hemicylindrical
surface will therefore also be tangential to the corresponding
surfaces emanating from the respective secondary sources between
W and R. Consequently RR' is the new plane wave-front. Thedirection of propagation is normal to the wave-front so that the
incident beam AB now becomes BC. The figure is symmetrical
about the normal, so that the angle of incidence is equal to the angle
of reflection. Fig. 82 I. (b) is an instantaneous spark photograph
by Cranz * showing a number of reflections of the head waves
from a bullet passing between two parallel plates. (2) Spherical
waves reflected from a plane surface are represented graphically on
Huyghens' construction in fig. 82 II. (a). When the spherical waves
diverging from S meet the plane surface, the reflected wave-front
formed by the secondary waves is represented by the mirror image
of that portion of the incident wave, which in the absence of the
plane would have spread beyond it. The reflected spherical
wave appears to diverge from a point S' which is the mirror image
of S in the plane reflector. Spark photographs by Foley and
Souder,f fig. 82 II. (b), show the reflection of the spherical pulse
from a plane surface. (3) Spherical waves reflectedfrom parabolic
and spherical mirrors. The Huyghens' construction for spherical
waves diverging from the focus is indicated graphically in fig. 82
II. and III. The comparative spark photographs by Foley andSouder j* and by A. H. Davis J for the parabolic and spherical
reflections respectively, are shown in fig. 82 II. and III. (b). Theresemblance between the graphical construction and the photo-
graph is very striking. In both cases the aberration of the
* Lehrbuch der Ballistik, 2, p. 452, 1926
f Phys. Rev., 35, p. 373, Nov. 1912.
X Proc. Phys. Soc, 38, p. 224, April 1926.

288 CHANGE OF MEDIUM
ten
\ (a)
SPHERICALIV
(b) (after Cram)
I(b) (after Foley)
Cb) (after Foley)
(b ) (after Dauis)
Fig. 82 (a) and (b)

REFRACTION 289
spherical reflector and the superiority of the parabolic reflector as
a means of producing plane waves is clearly shown.
It will be observed that in all cases the spark photographs exhibit
practically true optical reflection. This is only possible, as we have
seen, when the dimensions of the reflector are large compared with
the wave-length. Now a single pulse, strictly speaking, has nowave-length. The basis of comparison in such a case is the
thickness of the pulse which, as the photographs show clearly, is
small compared with the diameters of the mirrors.
(B) Refraction
The change in direction in sound waves on reaching the boun-dary between two different media is realised most simply from a
consideration of Huyghens' secondary
waves. When the incident plane wave-
front WW' (see fig. 83) reaches the
surface at W a secondary wave starts
from that point with a velocity of
sound c2 in the second medium. At
a time t afterwards the secondary waves
from W and W will have reached Rand R' respectively. Each point of pWW7
will similarly have reached a
corresponding point of RR', which is therefore the new wave-
front in medium 2. Now WR/c1=WRf
/c2 =t, tnat is>
WR sin 61/c1=WR sin 9 2/c2
orsin 6X
sin
which is the 'law of sines' to which we have already referred
(see equation (1), p. 271). Hence the normal to a wave-front in
passing from one medium to another is deviated towards or away
from the normal to the surface, according as the velocity of the
wave in the first medium is greater or less than in the second
medium. The critical angle, when 9 2=90°, is given by sin 9X =c1/c2 ,
and total reflection may take place when the sound travels from a
medium of low to one of higher wave-velocity. The particle-
velocity in the transmitted wave relative to that in the incident
wave is given by equations (5) and (6b) on p. 272. Equation (8),
p. 273, shows that the energy in the transmitted wave is ^122(R2/R1),
where Rx and R 2 are the acoustic resistances (p^ and p 2c2) and t12
19

290 CHANGE OF MEDIUM
the ratio of the particle-velocities of the incident and transmitting
media respectively. At normal incidence
f12=2R1/(R1+R2)
and the corresponding energy-ratio for the transmitted and in-
cident waves is
normal transmission coefficient= — ^^,(R-1+R-2)
which reduces to 4^ R 2 when R 2 is large compared with Rx .
Sondhauss in 1852 demonstrated the refraction of sound waves
through prisms containing various gases, and determined the
refractive index f^(=c1 !c2= sin dj sin 6 2) relative to air. He was
also successful in demonstrating the focussing action of a convex
lens of carbon dioxide enclosed in a thin envelope of collodion.
Such effects are easily obtained by means of a high-pitched source
and a sensitive name. Foley and Souder * have recently obtained
spark photographs showing the focussing action of small lens-
shaped 'balloons' filled with different gases. Lenses of liquid (in
rubber vessels) or of solid material are obviously unsatisfactory
for use in air, for the ratio R 2 Rx in all such cases is so great that
the sound is almost completely reflected at the front surface.
Refraction produced by Wind and Temperature Gradients
-
Refraction takes place whenever the wave reaches a point at
which the wave-velocity changes. This change of wave-velocity
may be brought about not only by complete change of medium,
but also by a change of properties in the same medium (if it maystill be so regarded). Thus the velocity of sound waves in air is
affected by the wind and by temperature. If these factors are not
constant over the whole wave-front and the whole track of the
sound wave, refraction will take place. It is a familiar observation
that sound travels better with the wind than against it. This is
due to the fact that the velocity of the wind increases from the earth's
surface upwards. The effective velocity of sound is consequently
equal to its normal velocity plus or minus the velocity of the
medium. Imagine a plane wave of sound travelling parallel to
the earth's surface, i.e. with its wave-front perpendicular to the
ground. In still air this condition will continue. If, however,
a steady wind is blowing in the same direction the upper part of
the wave-front where the wind-velocity is greater will travel
faster than that part of the wave-front near the ground. Theresult is that the wave-front tends to bend downwards towards the
* hoc. cit.

REFRACTION BY WIND AND TEMPERATURE 291
ground. An observer therefore hears the sound by a 'ray' which
leaves the source with a slightly upward inclination. Similarly
the wave-front travelling in the opposite direction to the wind is
bent upwards and, at a moderate distance from the source, passes
high above the head of an observer.* Similar effects may be
noticed when there is a uniform temperature gradient from the
earth's surface upwards. The warmer the air the greater the
velocity of sound (c s- \ abs. temp.). When the temperature
gradient is positive upwards, the wave-front will bend towards the
ground, and conversely when the temperature gradient is negative
upwards the sound will be deflected upwards and lost. Tempera-
ture or wind refraction in the atmosphere is analogous to the
optical phenomenon of mirage. Such wind and temperature
gradients may therefore have a very important influence on the
range of transmission of sounds in the c,
atmosphere. The method of calculation
of the curvature of a ' sound ray ' is equally
applicable to the cases of wind and tempera-
ture refraction, provided the correct sign is
introduced for the velocity-gradient up-
wards. In fig. 84, AB and A'B' represent
portions of two adjacent ' rays ' in the same
vertical plane. "YVF and W'F1
are two
consecutive wave-fronts intersecting at Cand cutting off lengths bsx and bs 2 from the
rays AB and A'B' respectively. From the construction shown we
must have — =- — , where r is the radius of curvature of ther (r— br)
element bsx and br is the separation of bs-^ and bs2 measured along
the radius. Since the lengths Ss± and bs
2 are traversed by the
wave-front in the same time interval,
bs± bs 2
c c—bc'
Eliminating bsx and bs2 from these relations we obtain
1 1 dc-=—.-r (l)
r c cirv J
* W. S. Tucker observes, however {Journ. Roy. Soc. Arts, 71, p. 132,Jan. 1923), that this rule is frequently broken. If a following wind hasa velocity which increases with height it is favourable for sound trans-mission, the same condition obtaining with an adverse wind whichdiminishes in strength with height.

292 CHANGE OF MEDIUM
If the inclination of 8s to the vertical is </>, then
dc dc . ,1 1 dc . .— =—smcp and - = sin 6 . . (2)dr dy r c dy
y being the vertical co-ordinate. This gives the curvature (1/r)
of the ray at all points, and depends on the particular assumption
in regard to (dc/dy).
In considering any problem of continuous refraction it is
important to remember the sine law of refraction is valid over the
whole track of a ray, i.e. the ratio c/sin<f>
is constant at all points
of the ray. It is possible to deduce equations (1) and (2), start-
ing with this fact as a basis. Assuming a uniform temperature
gradient (suppose negative) upwards, at a certain height the tem-
perature would fall to the absolute zero. If we take this level as
the origin and measure y downwards, the temperature will be
proportional to y and the velocity c to \/y. Writing c=A" sin </>
this becomes
y =A' sin2
<f>=A(1 - cos
2<f>) . . (3)
where A", A', A are constants. The relation represents a cycloid,
i.e. the curve traced out by a point on the circumference of a
circle which rolls in contact with a fixed straight line (in this case
the line y=0). If the temperature gradient is positive upwards,
the imaginary line y=0 of zero temperature is 'below' the earth's
surface and y is measured upwards. In this case the generating
circle of the cycloid rolls above the line y =0 and the cycloids have
their vertices downwards. Only the relatively flat portions of the
cycloids, which may be regarded as circular arcs, will, of course,
be of interest in practice. For the reasons given above it seems
not improbable that seasonal variations will be observed, apart
from rapid variations due to numerous causes, in the range of
transmission of sounds above the surface of the sea, e.g. from
light-vessels. The temperature of the sea varies slowly, and
lags behind the mean seasonal variation of the temperature of
the atmosphere above it. In the Straits of Dover, for example,
a continuously recording electrical thermometer indicated a
maximum sea temperature in September and a minimum in
March, representing a lag of about two months or so behind the
corresponding temperatures of the atmosphere. From March to
August, therefore, when the sea temperature is definitely lower
than the air temperature and the gradient upwards is positive,
a good range of transmission should be anticipated ; whereas from

INTERFERENCE 293
September to February, when the sea is warmer than the atmo-
sphere and the gradient is negative, the sound transmission should
be poor. It is interesting to refer in this connection to experiments
by E. S. Player.* Observing, from North Foreland, the sound
of a siren on a light-vessel several miles away, it is noted : FromMay to September inclusive the siren was audible on six occasions,
inaudible on two ; from October to March it was audible on two
occasions, inaudible on nine.
Temperature Gradients in the Sea - The cycloidal form of
track assumed by a sound ray in air due to wind or temperature
gradients may also be found in the sea. H. Lichte f has observed
large seasonal variations in the range of sound signals under the
sea, and ascribes the various effects to the existence of horizontal
temperature gradients in the sea, these gradients changing accord-
ing to the season of the year. In this case the cycloidal pattern
is repeated more frequently than in the casewe have just considered,
for a sound ray meeting the surface of the sea is completely
reflected down again, only to rise once more and so on, the numberof times it meets the surface in a given distance depending on the
depth of the source of sound. A reverse temperature gradient
results in corresponding effects at the sea-bed. These surface
and bottom reflections play an important part in long range sound
transmission under the sea. With a particular sound source
emitting a measured amount of power, Lichte and Barkhausen Jobserved a change in range from 10 km. in summer to 20 km. in
winter in the Baltic Sea.
Interference
One of the most important theorems applicable to sound waves
is Huyghens' Principle of Superposition (see p. 66). On this
principle the resultant displacement of a particle of the mediumthrough which two or more trains of waves are passing is obtained
by the vector addition of the separate displacements due to each
wave-train independently. This principle is also applicable to
velocities and accelerations, but not to the squares of these quan-
tities. Thus, two periodic vibrations of the same frequency, of
amplitudes a and b and phase difference e, combine to form a
periodic vibration of amplitude (a2+b2jr2ab cos e)*. If the
amplitudes are equal (a=b) and the phases the same e=0, super-
* jfourn. Roy. Met. Soc, 52, p. 354, 1926. (The observations relate
to rainy days only.) f Phys. Zeits., 20, p. 385, 1919.
X Ann. d. Physik, 62, July 1920.

294 INTERFERENCE
position gives a vibration of double amplitude 2a; but if the
phases are opposed e= 180° the resultant amplitude is zero. In
the more general case, the amplitude may vary between (a-\-b)
and (a— b) according to the phase difference e. Such super-
position of vibrations is termed interference. The term is morefrequently applied to the special case in which the resultant
amplitude varies between double the ordinary amplitude and
zero. Schuster's definition * of interference in light waves is the
following: "If the observed illumination of a surface by two or
more pencils of light is not equal to the sum of the illuminations
of the separate pencils, we may say that the pencils have interfered
with each other, and class the phenomenon as one of interference."
This definition, with the appropriate modification, is also applicable
to sound waves.
The phenomena of interference may be observed on a smooth
water surface which is disturbed simultaneously at any two points.
J. H. Vincent f has obtained
very beautiful photographs
of such effects on the sur-
face of mercury, the simul-
taneous disturbances being
produced by means of a
double ' dipper ' attached to
the prong of a vibrating
tuning-fork. Such a photo-
graph, taken from one of
Vincent's papers, is shownin fig. 85. It is clear that
in certain directions the
crests and troughs reinforce
each other, whilst in inter-
mediate directions they
neutralise. The result is
a definite ' interference pat-
tern' superposed on the
ordinary wave systems.
Analogous effects are easily
demonstrated with sound
Each prong, as it vibrates,
-Interference pattern on MercurySurface
(Dr. J. H. Vincent)
waves proceeding from the tuning-fork
* Optics, p. 57.
f Phil. Mag., p. 411, June 1897, p. 191, Feb. 1898, p. 290, Sept. 1898,
p. 338, Oct. 1899.

INTERFERENCE 295
is the source of two sets of waves in opposite phase, one side of
the prong producing a compression pulse at the same time as the
other side is producing a pulse of rarefaction. These two simul-
taneous pulses, in opposite phase, will neutralise in certain
directions and assist in others. A similar interaction goes on,
of course, between the waves from the two prongs. The result
is a region of disturbance around the fork having symmetrical
positions of comparative silence. As a vibrating fork is rotated
in a vertical position near the ear, the sound intensity rises and
falls four times per revolution. Any 'double' or 'multiple'
source of sound shows these effects, the principle being used
specifically to produce directional beams of sound. In such cases
the sound energy is concentrated, on the 'superposition or inter-
ference' principle, in certain directions whilst in other directions
the energy transmission is zero. A more direct method of demon-
strating interference between two trains of sound waves makes
use of the 'trombone' tube* shown in fig. 86. The source of
sound S should preferably ,
—
-—» _r J
, S —*~ Source of sound
emit a fairly pure note of 1 1 " (electrically operated)
moderately high pitch, e.g.
a tuning-fork of frequency
1000 p.p.s. or more, a
musical buzzer or a loud
speaker electrically main-
tained. A stethoscope
attached at L to the fixed
tube is used to convey to the
ears the sound which arrives at L via the paths STL and ST'L.
Provided these paths are equal or differ by a whole number of wave-
lengths, the two sets of sound waves arrive in the same phase and
reinforce each other at the ears of the listener. When the lengths
differ by a multiple of A/2, however, there is complete neutralisa-
tion (silence) at L. The method is very effective in demonstrating
interference, and provides a good laboratory method of measuring
the velocity of sound in a tube, the frequency of the source being
known. An important application of this method relates to the
directional reception of sound (see 'binaural compensator,' p. 413).
One of the best examples of interference of sound is that in which
stationary waves are formed between the wave-trains incident on
and reflected from a plane reflecting surface (see pp. 279 to 281).
The formation of nodes and loops in vibrating strings, rods, and
* See Tyndall, Sound, p. 261.

296 INTERFERENCE
air columns are also due to interfering wave-trains moving in
opposite directions, reinforcing and neutralising at intervals of A/4.
The phenomenon of beats (p. 19) may possibly be regarded
as an example of interference. Two vibrating tuning-forks of
nearly equal pitch produce a resultant sound, which increases and
decreases in intensity with time, the frequency of this intensity-
variation being equal to the difference of frequencies of the forks.
This ' beating ' effect is due to the fact that at certain equal time
intervals the wave-trains agree in phase and reinforce each other,
whilst at intermediate periods they are opposite in phase and tend
to neutralise each other.
As in the optical analogy, interference may take place between
sound waves from a source and its image (see p. 275), or from
two images of the same source (as in Young's double-slit and
Fresnel's biprism and inclined mirrors). The former is exem-
plified at normal incidence by stationary waves. Interference
effects are observed at all angles of incidence, the effects being
analogous to those observed when light is reflected from a single
polished surface (black glass), as in Lloyd's method of producing
interference fringes.* As an example of such interference in
sound waves we may refer to Tyndall's observations of the apparent
variations of the strength of signals from a source of sound (a fog
siren) at South Foreland. The observer on a ship noticed that
the sound intensity periodically increased and decreased as the
ship receded from the shore. The effect was clearly due to the
interference between the direct sound and the sound reflected
from the surface of the sea. At greater distances, when the path
difference between the direct and reflected waves is always less
than A/2, there can be no fluctuation of intensity, and the reflected
wave (in almost the same phase) will assist the direct wave at all
ranges. Experiments by F. B. Young and the writer j* have
•demonstrated the existence of interference of sound waves under
water also. A small source of sound of a definite frequency
(580 p.p.s.) was supported at a known depth below the surface
of a large reservoir. An exploration of the sound distribution in
a vertical plane passing through the source was made by means
of a small hydrophone 'pressure explorer' (a diaphragm with
microphone attached, mounted on a watertight case). As the
hydrophone was lowered from the surface to the bottom the
sound received passed through maxima and minima. The
* See textbooks on Optics. See also p. 299.
f Proc. Roy. Soc, 100, p. 261, 1921.

INTERFERENCE 297
positions of minima at different distances from the source were
plotted and found to lie on a festoon type of curve near the source
and then at greater distances to become indistinct. The first
section of the ' festoon ' was found to agree with the theoretical
position of the interference zone due to sound from the source
and its negative image in the surface of the water. The succeeding
zones were explained by the multiple reflections from bottom
and surface. The pressure amplitude of the sound near the
surface was consistently very low, as would be expected since all
points in the surface are equidistant from a positive source and
its negative image (that is to say, there is no pressure fluctuation
at a free end, water to air). This cancellation of the direct ray
by the surface-reflected ray has an important bearing on the long-
range transmission of sounds under water. Imagine a ship of
20-feet draught signalling with a Fessenden oscillator (see p. 390)
of frequency 500 p.p.s., and a second ship 5000 feet away receiving
the signals at the same depth 20 feet. The direct ray from ship
to ship has to travel 5000 feet, and the ray reflected from the
surface in opposite phase [i.e. A/2 equivalent path- difference, by
reflection at a free surface) has to travel (5000 2 +40 2)* =5000-16
feet. Taking the velocity of sound in the sea as approximately
5000 ft./sec, the wave-length of the sound is 10 feet. The phase
difference of the two ' rays ' on arrival at the second ship is there-
fore (0-5-0-016)A; at a range of 10 miles (say 50,000 feet) the
phase difference would be (0-5 —0-00 16) A, and so on. The surface-
reflected wave at any appreciable range, therefore, practically
neutralises the direct wave. In spite of this fact, signalling ranges
of 20 to 30 miles are not unusual. The calculation assumes (1)
that the surface of the sea is smooth, which is rarely the case,
and (2) that the sea as a medium for sound transmission is homo-geneous ; temperature gradients may, however, produce consider-
able deviations in the path of the sound wave. Another important
factor which has been neglected in the calculation is the reflection
of sound from the sea-bed. In most cases this reflection is very
efficient, and may in certain cases account almost entirely for
the sound received at long ranges. The interference between
two independent trains of high-frequency waves in water has
been demonstrated by R. W. Boyle and J. F. Lehmann.* Theymounted two piezo- electric quartz transmitters (see p. 147),
vibrating with the same frequency (96,000 p.p.s.) and amplitude,
side by side in a tank of water in such a way that their primary
* Loc. cit. t p. 150.

298 INTERFERENCE
beams overlap. Fine coke dust sprinkled in the water settled in
the nodal planes, and was ultimately caught on a whitened surface
below the sound beam, the hyperbolic interference pattern being
clearly shown. A photograph of such a pattern is produced in
fig. 87 (a). In another experiment, to which we have already
.If:
(a) {b)
: -immm
(c) (d)
Fig. 87—Interference between High-Frequency Sound Waves
(6) S;?&cforCt°r
* Frequency, 750,000 p.p.s. in oil
15 pS^rSfl^Sthowing stationary waves) J & «>"*"* of Dr"R LL H°PW0°d >
(d) Interference between two high-frequency beams. Frequency, 96,000 (by courtesy of Dr. R. W. Boyle)

DIFFRACTION 299
referred (p. 260), the two transmitters were placed face to face,
and stationary waves, indicated by the dust pattern, were formed
between them. F. L. Hopwood * has recently demonstrated by
this method the interference effects produced by reflection of
high-frequency sound waves (750,000 p.p.s.) from various surfaces
{e.g. inclined planes, spherical mirrors, and a 'whispering gallery')
(see fig. 87 (b) and (c)).
S. R. Humby,f using a high-frequency sound source in air,
has demonstrated the existence of Lloyd's interference bands in
front of a plane reflector, the observed hyperboloid 'fringes'
agreeing accurately with the theoretical positions. Similar
observations were made with two separate sources operated
electrically from the same circuit, the form of the interference
bands being, of course, the same as in the case of a single source
and its 'image source' in the plane reflector.
Diffraction
It is a familiar observation that sound waves bend round corners
whilst the propagation of light is sensibly linear. A carefully
planned experiment is necessary to show that light also 'bends
round a corner,' whereas the most casual observation reveals this
effect in the case of sound. The sound-shadow of an obstacle is
therefore not sharply defined, and appears to be much smaller
than the corresponding optical or 'geometrical' shadow. Theexplanation lies in the fact that the length of the waves of
sound is of the order of a million times the wave-length of light,
and, as we shall see, the extent of the encroachment of the
waves inside the geometrical shadow increases with increase of
wave-length. To obtain sharp sound-shadows with obstacles of
moderate size it is therefore necessary to use very short waves,
i.e. sounds of high frequency. Ail such phenomena, involving
the encroachment of waves (of any type) inside the geometrical
shadow of an obstacle, are described as diffraction. The study
of diffraction phenomena is often, inappropriately, left to text-
books on optics. In almost every branch of sound, however,
diffraction effects predominate. In the treatment of directional
emission and reception, reflection, refraction, and scattering of
sound it is generally important to specify the relationship between
the dimensions of the bodies concerned and the wave-length of the
sound—the importance of diffraction being thereby implied. Such
* jfourn. Sci. Instrs., Feb. 1929.
f Proc. Phys. Soc, 39, p. 435, 1927. See also p. 311.

300 DIFFRACTION
phenomena are conveniently studied with the aid of Huyghens'
principle of secondary waves (see p. 67). According to this prin-
ciple every point on a wave-front at any instant may be regarded as
the origin of a fresh supply of spherical waves, and the resultant
effect at a distant point P ahead of the wave will be the sum of
the effects of these secondary spherical waves. The new wave-
front as it passes through P will be the envelope of such spherical
waves. Thus if a plane wave of sound falls upon a hole of small
diameter (compared with a wave-length) in a rigid wall, the hole
becomes a source of spherical waves, and there can be no shadowof the boundary of the hole. If the hole be large the wave pass-
ing through it will be sensibly plane, but the diffraction of waves
near the edge of the geometrical shadow will ultimately give the
wave a slight divergence, depending on the relative dimensions
of the aperture and the wave. In order to obtain quantitative
data regarding the intensity fluctuations in diffracted waves it is
necessary to employ methods due to Fresnel.
Annular Half-wave Zones - In fig. 88 let WF represent
a section through a plane wave-front. We require to know the
resultant effect at a point P distant r from the pole O of the wave-
front (OP being the normal to WF). With P as centre, describe
a series of spheres of radii r, r+ A/2, r+ A, r+ 3A/2, . . . and so
on, cutting WF in AAl5 BI^, CC l5 etc. The plane wave-front
will consequently be divided into a series of circles of radii p ± =OA,
p 2 =OB, p3 =OC, each circle being distant from P by A/2 more
than its smaller neighbour. The radius
of the mthcircle will clearly be
pm ={(r +mA/2) 2-r 2}* = VmXr
approximately. The area of this circle
is therefore rrmXr, and the area of the
annular zone between the mth and the
(ra+ l)th
circle is irXr. That is, the
Fresnel annular zones are all approxi-
mately of equal area -rrXr. The con-
tributions of alternate zones to the
resultant at P will therefore be equal
in magnitude but opposite in phase
(each zone being A/2, or it farther from
P than its neighbour). The resultant effect at P will be the
vector sum of the contributions of each element of the wave-
Fig. 88

HALF-WAVE ZONES 301
front. It has been shown on p. 18 that the effect at P is
represented by a vector polygon in the form of a spiral curve,
each half-wave zone corresponding to a half-turn of the spiral.
The resultant R at P is given by
r-Ri+RlR-y±y
and the phase 9=tt/2 behind that of the vibration at O, Rx and RL
being the resultant effects at P due to the first and last zones
respectively. When the last zone is at a considerable distance
from P or is reduced by an obstacle to a negligible area, the effect
at P is then equal to half the effect of the first zone (see p. 18). This
is otherwise evident, for any zone after the first is neutralised by
half the sum of those immediately before and after it, the remaining
half of the first zone outstanding. The resultant effect of one zone
will of course be less than if its elements were all in the same phase.
When the latter is progressively increasing it is easily shown (see
p. 17) that the resultant amplitude at P is mSs . sin 9 . /#, whereas
it would have been mSs had all the elementary effects arrived in
phase, i.e. the mean effect of a zone (26 =n) is 2/77, and of the
whole infinite wave-front is I/77, times the area ir\r of the zone.
As regards its effect at P, therefore, the whole wave-front may be
replaced by a small area irXr of effective amplitude aj-n (a being the
amplitude at O).
It is possible to check this deduction by using it to calculate
the resultant amplitude at P, in the case of a plane wave, since weknow it must be the same as that at O, viz. a. Writing Ss=7rXr
and a =0/77-, we obtain from equation (33), p. 62, for the particle-
velocity i of spherical waves in a semi-infinite medium
£=—-— sin (nt— kr) where A' =a'n$s and k=-—277T A
and
£=—— cos (nt—kr),Ar
whence the amplitude at a distance r from the source as a'Ss/Xr,
which is equal to a, the amplitude in the original plane wave.
The procedure adopted for a plane wave-front is also applicable
to a spherical or a cylindrical wave-front, provided the magnitude
of the first zone be correctly estimated. Many of the simpler
cases of diffraction may be treated by this elementary method of
dividing the surface into half-wave zones. If the manner in

302 DIFFRACTION
which the zones diminish in amplitude with increasing distance
is known, the spiral method of determining the resultant effect is
invaluable.
Laminar Half-Wave Zones. Fresnel's Integrals.* Cornu's
Spiral - In certain cases, e.g. the diffraction at a straight edge
of an obstacle, it is more convenient to deal with zones or strips
parallel to the edge, regarding the incident wave as plane or
cylindrical with its axis parallel to the edge. In such cases weneed only consider the effects in a plane
section through the wave, the edge, and
the point P. This method is due to
Fresnel, who restricted his calculations
of diffraction phenomena to obstacles
bounded by straight lines of infinite
length. In fig 89 let WF represent
a section through a wave-front advanc-
ing towards a plane SS. The wave
may be regarded as cylindrical or
plane. We require to find the resul-
tant effect at a point P on SS. If the displacement in the waveat O, the 'pole' of P, be represented by cos nt the contribution
to P of an element Ss situated at Q, distant s from O and (r+ S)
from P, will be cos {nt— k(r+ 8)} . Ss. The displacement at Pdue to all the elements of the arc WF will be proportional to
I cos {(nt— kr) — k8}ds.
This may be written
cos {nt— kr) /cos kS . ds+ sin (nt— kr) /sin kS . ds.
Fig. 89
Now
k=— and §=— app., that is kS=^.X 2r
FFXr
If we write
a f ns , , a • f •ns JA cos a = cos -r— . as and A sin a = sin -— . as
J Xr J Xr
then the expression proportional to the displacement at P becomes
* A rigorous treatment of Fresnel's Diffraction Theory is given in
Drude's Optics, chap. iv.

FRESNEL'S INTEGRALS. CORNU'S SPIRAL 303
Acos(nt—kr— a). The intensity at P is proportional to A 2,
that is to2 / , „ c 2 \2
(/
ITS* \" / f . 775
cos— .asJ+ ( I sin— . as
or if we write s2 =v 2
. Xr/2 the intensity at P is proportional to
TTV*cos —- . dv
) +(Jsin^-.<fo) (1)
The expressions in brackets are known as FresneVs Integrals.
Integrating between certain limits of v> we obtain the resultant
of the secondary disturbances arriving at P and arising from that
portion of the wave-front lying between the limits of s. Thevalues of these integrals have been determined by Fresnel and
tabulated. As we gradually increase the upper limit, the integrals
pass through maxima and minima values, approaching J as a limit.
By a simple geometrical method Cornu has indicated the im-
portance of these integrals in their application to diffraction
problems. Writing
x=lJo
7TWCOS . dv and y = I sin . dv"2 (2)
and plotting x and y for various values of v, it is found that a
y
0-5
-0-5 /
J
3 ^XC ]) \
2 J
uf'2 /
05 X
-0-5
\ \\p'
3 y1
Fig. 90—Cornu's Spiral
spiral curve, known as Cornu's Spiral, results. This curve is
shown in fig. 90. When ^=0, x=y=0 also, and the curve

3o4 DIFFRACTION
passes through the origin. When v changes to — v the expression
under the integral is unaffected, but the upper limit of integration
and consequently x and y change sign. The curve is symmetrical
about the origin, and approaches asymptotically, to the points
C(J . |) and C'(— f .—
J), for values of v equal to ± °° • Fromequations (1) and (2) it is obvious that the resultant intensity at P
due to a wave-front extending from s1 to s2 (corresponding to
v1 and v 2), is given by
I x (x*+y%l ... (3)
When v x =0, that is when we are dealing with one-half of the
wave-front only, the resultant amplitude is the radius vector from
O to the point v 2 in question on the spiral, the phase being the
angle between this radius vector and the OX axis. When v 2 is
infinite and ^=0 the resultant is OC. In fact, the resultant
amplitude between the limits v 1 and v 2 is represented by the vector
joining these points on the spiral. Thus MC in fig. 90 represents
the resultant from — v to + qo. The amplitude due to the whole
wave-front, from + go to — go is CC, and to one-half the wave-
front OC=OC. It will be observed that the phase lag in the
case we are considering, viz. laminar zones, is 45° (77/4), whereas
we found that the lag in the case of circular zones was 90° (77-/2).
In this respect the spirals shown in fig. 90 and fig. 6 should be
compared.
It is instructive to regard the spiral as a vector polygon, as on
p. 18, any section of it representing the corresponding portion of
the wave-front which affects the point P. The resultant amplitude
at P is then given in magnitude and phase by the closing side of
the polygon (that is the vector joining the points v x to v 2). Each
half-turn of the spiral represents one Fresnel zone, the resultant
of any number of selected zones being given by the corresponding
chord of the spiral.
By means of Cornu's Spirals, therefore, problems of diffraction
can be solved geometrically, and the variations of intensity in the
diffraction 'pattern' plotted from measurements of the spiral.
We shall now consider a few of the more important examples.
Diffraction at a Straight Edge - Suppose WF in fig. 91 re-
presents the cylindrical or plane wave-front incident on the
semi-infinite rigid plane ES. We require to know the distribution
of amplitude or intensity at various points P in the plane P 1NP 2 .
At N, the edge of the geometrical shadow, a complete half-wave is
exposed. Consequently v±=0 and v 2
= 00, and the amplitude

SHADOW OF STRAIGHT EDGE 305
at N, from the spiral (fig. 90), is the radius OC, i.e. half the
amplitude, or one quarter the intensity, in the unrestricted wave.
As the point P recedes from N into the ' shadow ' the value of vx
gradually increases from zero to infinity, that is, the point v travels
from O along the spiral towards C.
The amplitude thus steadily dimin-
ishes from OC=0-5 at the edge to
zero when v1 =v2= -\-oo . The
vector is a line joining C with the
point vlf which travels from O to
C as the point P recedes farther and
farther into the shadow. This line
rapidly shortens without maximaor minima. Outside the geometrical
shadow P is exposed to a complete half-wave plus a variable
number of zones OE. The amplitude is therefore given by the
vector-sum of OC and OM (see fig. 90), i.e. CM. Conse-
quently as P moves outwards from N the point M (— ^1) passes
from O round the lower spiral and eventually reaches C when Pis an appreciable distance from N. As the distance P from Nincreases, the amplitude consequently passes through maximaand minima, gradually approaching the normal amplitude and
occurring closer and closer together. As an example, consider
a plane wave of sound of frequency 5500 p.p.s. (A =0-2 ft. in air)
incident on the edge. At a distance of 20 ft. behind the screen
the intensity variations shown in fig. 92 would be observed.
The widths of the successive zones are given by VmXr, i.e. 2,
2-82, 3-46, etc., ft., and the relative amplitudes (and consequently
intensities) are read off the Cornu's
spiral for successive phase changes
of tt(A/2). Thus at 5500 p.p.s. the
intensity falls off to about 3-6°/oo
at a distance of 6-3 ft. inside the
geometrical shadow. At a fre-
quency of 550 p.p.s. the same
intensity would be observed at a
distance of about 20 ft. inside the
geometrical shadow. Considering that the ear is sensitive over a
range of intensities of the order 10 12 (see p. 351) a residual
intensity of 3-6°/00 would constitute a sound of moderate loud-
ness if the intensity of the sound incident on the edge were fairly
great. The 'shadow' of the edge is thus far from perfect, even
20
0-5
JO ft.
Fig. 92

306 DIFFRACTION
at a frequency as high as 5500 p.p.s. At 55,000 p.p.s. the range
inside the shadow would be reduced to a tenth and the shadow
would be more nearly 'optical/
Parallel Aperture - In this case the amplitude of vibration at
P is measured by the chord joining the extremities of a constant
length of the spiral. The width of the aperture is measured in
terms of half-wave zones (width VmXr). If the aperture just
covers the whole of the central zone the amplitude at the midpoint
will be a maximum, whilst it
will be a minimum if the aperture
covers two zones. The variations
of amplitude on a plane whose
distance r from the aperture is
large compared with the width e
of the opening are easily obtained
directly by an approximatemethod (see fig. 93). Plane
waves fall on the aperture AB and spread to the plane CPC.When r is large we may regard BP and AP practically parallel
and making an angle a with the axis. The resultant at P is then
the sum of the effects due to elementary strips of the wave-front
in the aperture. As we have seen on p. 17, this is given by
Fig. 93
R:s . sin
ewhere 6
ire sin a
A *2
e being the width of the aperture, 8 the path difference between the
extreme ' rays,' and s the ' effective ' amplitude in the aperture. If
we write dR/d9= 0, i.e. 6 = tan 6, we obtain the values of 6 at which
the amplitude on CC is a maximum or a minimum. A graphical
solution of this relation gives 0, 1-4377, 2-4677, 3-4777, 5-4877, and
further values approximating to
13-77/2, 15-77/2, 17-77/2 and so on.
The maxima of intensity R2,
which cannot be negative, occur
at all these points, with inter-
mediate positions of zero in-
tensity (at 0=m77 (where m is
an integer)). For 6=0 the in-
tensity is s2
. Writing s2 =l
the magnitudes of the secondary maxima are 1/21, 1/61,
etc., successively. The intensity fluctuations are
0-5-
1/120,
shown in

CIRCULAR APERTURE 307
fig. 94 which indicates that the greater part of the sound
energy, over 95 per cent., is confined to the primary maxi-
mum extending from #=0 to tt on either side of N. Whene is large compared with a wave-length, practically the whole of
the energy is confined to directions for which 6 is small. Writing
NP=#, sma=x/r, and 6=nex/\r. The amount of spreading
of waves after passing through an opening depends entirely on
the relation between the wave-length and the width of the opening.
This explains the apparent discrepancy between sound and light,
which delayed so long the general adoption of the wave theory of
light.
Circular Aperture - When the aperture is such that the wave-
front emerging from it can be divided into circular zones the
resultant amplitude is easily determined for points on the axis.
If the radius P of the aperture is such that an even number of
zones is included, the amplitude at P is zero, whilst an odd numberof zones gives an amplitude double that in the unobstructed wave.
The condition for maximum and minimum amplitude is clearly
S=p 2/2r=mX/2 approximately, where r is the distance of P from
O and m is an integer, the intensity being a maximum or a minimumaccording as m is odd or even. As in the case of a parallel aperture
just considered the resultant amplitude is given by A sin 6/6.
Off the axis the intensity cannot be calculated by simple methods.
The problem has been treated mathematically by Verdet,* whoshows that the intensity at a distance of many wave-lengths from
the opening is given by
I =(ttR s
l/m\ 2 \(m
~~2\l7+
3\1J
where m=~~ . sin a, R being the radius of the aperture and a theA
angle between the axis and the line joining P to the centre of the
aperture. As a increases m will vary as sin a and the expression
in brackets becomes alternately positive and negative with inter-
mediate zero values. The energy from the aperture will therefore
be distributed in co-axial zones of maximum intensity separated
by zones of minimum intensity. The positions and relative
intensities of these maxima and minima are given in the following
table
:
* Legons cToptique physique, t. 1, p. 301. See also Airy, Math. TractsCamb., p. 259, 305, 1842.

3o8 DIFFRACTION
mjn. Intensity.
Central Maximum 1-00
First Minimum 0-61
Second Maximum 0-82 0-0175
,, Minimum 0-116
Third Maximum 1-333 0-00415
,, Minimum 1-619
Fourth Maximum 1-847 0-00165
,, Minimum 2-120
The intensities of the secondary maxima are almost negligible
compared with that of the primary or central maximum. There-
fore most of the energy is confined to the central beam, of which
the angle of divergence is determined from the value of m at the
first minimum. Denoting the semi-angle of the beam by </>,
0-61R
sin </> or sin </> =0-61R'
It will be seen that the central beam will be narrow when the
radius of the aperture is large compared with the wave-length A.
When A is greater than R, the value of sin </> is imaginary and the
beam is 'spherical,' i.e. the aperture may be regarded as a 'point'
source of Huyghens' secondary waves.
The diffraction of plane waves of sound through an aperture is
analogous to the radiation of sound from a piston source which
we have already considered on p. 147. The applications of
the theory to the directional transmission of sound by means of
quartz oscillators has been investigated by P. Langevin * and by
R. W. Boyle * (see p. 1 50). The late Lord Rayleigh * applied the
theory to the directional transmission and reception of sound by
means of trumpets, horns, and reflectors (see p. 192). Further im-
portant applications of this nature are dealt with by I. B. Crandall.*
Circular Disc. Zone Plate - The experimental demonstra-
tion by Arago that the optical shadow of a disc had a bright spot at
its centre was regarded as final proof of the wave theory of light.
Such a result for sound waves also follows immediately from the
Huyghens-Fresnel construction. The resultant intensity on the
axis of the disc is due to the action of the whole wave-front with
the exception of the zone or zones covered by the disc. Theeffect is therefore approximately equal to one-half that of the zone
* hoc. cit.

DISC. ZONE PLATE. GRATINGS 309
bordering the disc. If the latter covers only one or two zones
the intensity on the axis will be the same as if the disc were
removed. The rings of secondary maxima separated by circles
of zero intensity are similar to those already mentioned for a
circular aperture. As we shall see (p. 420) a diffraction disc with
a sensitive sound detector on its axis constitutes an important type
of directional sound receiver, the effect on the ' detector ' being a
maximum when the source is on the axis of the disc.
An interesting application of the principle of Fresnel's half-
wave zones is known as the Zone Plate. If a circular grating be
cut from a sheet of metal so that alternate zones of an advancing
wave-front are blocked out (reflected or absorbed) the remaining
active zones will arrive in phase at a point P on the axis.
Let a be the distance of a point source S on the axis and b the
distance of a small detector at P on the opposite side. Then the
radius p of the mth zone may be derived from
that is,
V(a2+p 2) + V(b*+P
2)- (a+ b) =mA/2
,
mX ab
~p*~~a+b
approximately. Such a circular grating or zone plate acts like
a condensing lens, the intensity at P being many times greater
than in the absence of the grating. On account of increasing
obliquity, there is little to be gained by employing more than a
few zones near the axis. The equivalent focal length / of the
zone plate is given by the above relation for
-=-+-=—-, whence f=p 2/m\.f a b p 2
A zone plate with a detector fixed on its axis at the focus not only
serves to increase the intensity but also gives accurate indications
of the direction of the source of sound S.
Diffraction Gratings. Reflection from Stepped or Cor-
rugated Surfaces - The diffraction grating so familiar in optics,
has its counterpart in sound. When sound waves are reflected
from a regular periodic structure such as a row of palings or a
corrugated surface, the reflected waves reinforce or neutralise in
certain directions, depending on the wave-length of the sound
and the spacing of the reflectors. Similarly, with the waves
transmitted through equidistant apertures. A plane wave incident

310 DIFFRACTION
normally on such a grating will be diffracted in accordance with
the simple relation
sin 9 = ^mX/d,
where m is the 'order' of the spectrum and has the values 1, 2, 3,
etc., 6 is the direction of a maximum, A the wave-length, and dthe grating constant (space+ strip). When d is smaller than A
there are no lateral maxima and the incident beam is reflected in
the ordinary way. Thus a row of palings or a rough wall reflects
sound of moderate pitch like a perfectly smooth surface, little or
no sound being returned towards the source except at normal
incidence. When the frequency is high, however, and the wave-
length A is short (less than d)}the sound is diffracted into the
spectra of various orders. A regular row of palings may therefore
serve as a ' reflection ' or * transmission ' grating for the analysis of
complex, high-pitched sounds, the various component wave-
lengths reinforcing in corresponding directions. In order to
obtain satisfactory results it is, of course, necessary, as in the
optical case, to use focussing devices to render the incident beamparallel and to converge the reflected or transmitted beams on a
small detector.
Experimental - As a means of demonstrating the phenomenaof diffraction, sound waves have not received the attention which
they deserve. It is not until comparatively recent years that the
importance of such phenomena in the directional transmission
and reception of sound has been fully realised. All the so-called
optical diffraction effects are easily demonstrated with high-
frequency sound waves, and experiments on a laboratory scale maybe made with very simple apparatus. Using a bird-call or a
Galton's whistle as a source of sound of short wave-length (about
1 cm. in air) and a sensitive flame as a detector, Rayleigh * demon-
strated the more obvious diffraction effects. Thus the flame
flares when it is placed at the centre of the sound shadow of a
circular disc, proving there is sound of appreciable intensity at
such a point, although a small distance off the axis there is silence
and the flame is quiescent. Tucker and Paris, j* using an electri-
cally maintained tuning-fork as a source of sound, obtained the
diffraction pattern behind a disc of wood 10 ft. in diameter and
1 in. thick. The fork was placed 30 ft. in front and on the axis
of the disc, and a hot-wire microphone connected to a tuned
* Sound, 2, pp. 142 and 143.
f Phil. Trans. Roy. Soc, 221, p. 389, 1921.

EXPERIMENTAL 311
vibration galvanometer was used to explore the sound distribution
behind the disc. The diffraction pattern consisted of a central
maximum equal in intensity to the unobstructed sound sur-
rounded by a ring of zero intensity and a further secondary
maximum. The disc, with the microphone fixed behind it near
the centre, served as an accurate means of locating the direction
of the incident sound. Rayleigh also demonstrated effectively the
antagonism between the parts of a wave corresponding to the first
and second Fresnel's zones. The distances '#' and '6' of the
bird-call and sensitive flame respectively from a screen with a
hole 20 cm.diameter were adjusted so that the hole corresponded to
the first two zones, the flame is then unaffected. On reducing the
aperture to 14 cm. diameter corresponding to the first zone only,
the flame flares violently. A similar effect is produced if the central
zone is blocked off, leaving the outer zone to transmit the sound
to the flame. A metal zone plate of eight zones and focal length
f=p 2/m\=4:8 cm. was constructed and found to give results in
accordance with the simple theory. More recently S. R. Humby *
has demonstrated quantitatively the various interference and
diffraction effects of high-frequency sound waves, using as de-
tectors both sensitive flames and the ear. A telephone excited
by alternating currents from a valve oscillator (see p. 79) was used
as a steady source of sound of a known high frequency. This
form of source has distinct advantages over the older high-pitched
sources such as Rayleigh's bird-call or Galton's whistle. Theexperiments on interference gave results analogous to the optical
interference experiments of Lloyd (see p. 260), Fresnel, and
Newton, and very close agreement was obtained between measured
and calculated positions of points on the hyperboloid fringe
systems. An experiment was made in which results analogous to
certain 'Heaviside layer effects' were obtained. The ordinary
diffraction effects could be demonstrated easily over a large
frequency range using such telephone 'whistles.' Diffraction
effects could be detected at the straight edge of a large woodenscreen. The gradual and progressive weakening of the effect on
the flame as it passes into the geometrical shadow and the presence
of maxima and minima outside the shadow were clearly observed.
With a rectangular aperture 20 cm. wide by 43 cm. high and a
source 40 cm. away, a central maximum and several secondary, or
lateral, maxima were measured at 40 cm. beyond the screen, using
a wave-length of 4-4 cm. The bright spot at the centre of a
* Proc. Phys. Soc, 39, p. 435, 1927.

312 DIFFRACTION
circular disc 33 cm. diameter was observed and two other zones
inside the geometrical shadow were located. Zone plates were
found to have focal lengths in accordance with theory. A diffrac-
tion grating made of cardboard strips fixed across an opening in
a large screen proved effective. The grating had nine openings,
each 3-4 cm., with strips 1-7 cm. wide. The source was placed
at the focus of a metal mirror 80 cm. from the grating, the fre-
quency being 11,600 (A =2-9 cm.). With the sensitive flame
70 cm. behind the grating a number of maxima were observed
9-2 cm. apart. Diffraction gratings were used in 1907 by
W. Altberg * to measure the wave-length of high-frequency
sounds produced by an electric spark. The grating consisted of
a series of parallel glass rods (1 to 6 mm. diameter) 1 cm. apart
and the spark was placed at the focus of a concave reflector which
thereby directed plane waves on the grating. A similar mirror
received the diffracted sound and brought it to a focus on a
sensitive detector. The sound spectrum was obtained by rotation
of the grating with respect to the source and the receiver. Wave-lengths of the order of a millimetre, corresponding to 330,000
p.p.s., were measured in this way. More recently K. Palaiologosf
Fig. 95
(By courtesy of A. L. Foley)
has used reflection gratings of spacing 0-6 mm. to measure wave-
lengths as short as 0T7 mm., the sound waves being detected and
their intensity measured by means of a Rayleigh disc (see p. 426).
In fig. 95 is reproduced a spark shadow photograph by Foley and
Souder, showing clearly the Huyghens' spherical wavelets trans-
mitted through and reflected from a small grating having four
parallel slits. No interference is, of course, possible with a single
* Ann. der Physik, 23, p. 267, 1907. See also Dieckmann, Ann. der
Phvs.,27,p. 1066, 1908; and Neklepajow, Ann. derPhys., 35, p. 175,1911.
t Zeits.f. Physik, 12, 6, 375, 1923.

OBSTACLE IN SOUND WAVE 313
pulse of this character, consequently the reinforcement in certain
directions is not shown. For this purpose ripple photographs
similar to those obtained by J. H. Vincent are necessary. In
these photographs a continuous train of ripples passes through
the grating and the various orders of spectra are clearly shown.
Apart altogether from laboratory demonstrations of the above
character, diffraction phenomena play an important part in the
directional transmission and reception of sound. With regard to
the former, reference has been made to the increasing directional
efficiency of horns and concave reflectors as the wave-length
diminishes, and to the sound beams of small divergence emitted
from the Langevin quartz disc transmitter. In such cases, the
mouth of the horn or reflector and the face of the quartz disc
behave like an aperture through which plane waves are diffracted.
The smaller the ratio A/R the smaller the angle of divergence of
the beam. Remembering that sound waves are of the order
10 5 or 106 times the length of light waves, the relative difficulty
of producing a parallel beam or an image of the source in the two
cases will be appreciated. With regard to reception, the ' bright
sound-spot ' at the centre of the shadow of a disc has been employed
as an accurate means of locating a sound source even at low
frequencies.* A sensitive detector on the axis of the disc gives
a maximum response when the source, on the opposite side of
the disc, is also on the axis ; a few degrees on either side, and the
response is zero.
Disturbance produced in a Sound Wave by a small
Obstacle - We have already referred to the scattering of sound
waves by a small obstacle (see p. 282), the amplitude in the scattered
wave varying inversely as the square of the wave-length. Let us
now consider the nature of the disturbance produced by a rigid
obstacle of small dimensions compared with a wave-length. In the
first place the obstacle behaves like a simple source due to its great
rigidity. Relatively to the medium which it displaces the bodyvirtually expands and contracts as the adjacent medium contracts
and expands, thus giving rise to secondary waves in the samephase as the incident wave. A second wave-system is set up, due
to the greater density of the obstacle which, on this account, fails
to swing to and fro with the same amplitude as the medium whichit displaces. The secondary waves therefore correspond to
virtual oscillations of the obstacle exactly equal and opposite to
* See Ency. Brit., 13th ed., Supplementary Vols., ' Sound,' A. O. Rankine.

3H DIFFRACTION
that of the medium, tending to give rise at the surface facing the
source to vibrations in the same pressure-phase as the primary
waves, and at the remote surface to waves in the opposite pressure-
phase. It thus behaves also as a double source. In this case,
however, if the dimensions of the obstacle are small, the motion
may result in 'local flow' from the positive to the negative side
of the obstacle. F. B. Young and the writer * have made careful
quantitative measurements of the acoustic disturbances produced
by small bodies in plane waves transmitted through water.
Observations were made of the sound distribution around various
small discs (10 in. diameter) placed in the path of plane sound
waves (580 p.p.s., A=8|ft.)in a large reservoir. The following
measurements were made at a large number of points around each
disc : (a) the direction of oscillation of the water particles, (b) rela-
tive amplitudes of displacement of the water particles, and (c)
relative amplitude of the pressure-oscillations. For the purposes
of (a) and (b) a small Tight-body' hydrophone (see p. 419) was
employed. This consisted essentially of a hollow ebonite sphere
(1 in. diameter) containing a
'button' carbon granule micro-
phone (see fig. 96). Thearrangement responds readily
to sound waves which travel
in a direction parallel to the
axis of the microphone, but is
insensitive to those arriving
'edge on' or parallel to the
microphone diaphragm. Thedevice acts as a directional
hydrophone with an accuracy
of about 5° at the 'minimum'position, the response at the' maximum ' position being pro-
portional to the displacement or
velocity of the water particles.
Relative pressure - amplitudes
were measured by means of a
Velocity {displacement)
receiver
' Pressure receive!
Microphone
Fig. 96
small button microphone mounted on a thin diaphragm forming
the cover of a small cylindrical brass box (1 in. diameter). These
'velocity' and 'pressure' explorers could be traversed under
water in a horizontal plane passing through the centre of the disc,
* Proc. Roy. Soc, 100, p. 261, 1921.

SOUND DISTRIBUTION AROUND OBSTACLE 315
and measurements of direction, displacement, and pressure-
amplitudes made at known points relative to the disc. Theprincipal phenomena observed were of two distinct types according
as the 'sound field' is produced around (1) a solid body, or (2) a
hollow (air-filled) body.
(1) Solid Bodies - The charted sound field around a lead disc,
I in. thick, in water (see fig. 97) is typical of solid bodies,
which exhibit the following characteristics : (a) The lines of
direction bend round the edges of the disc. At the same time
a considerable portion of the sound energy is transmitted
directly through it. The direction is clearly defined at every
point, (b) There is a general diminution of displacement
amplitude near either face of the disc, and (c) no variation of
pressure amplitude (greater than 10 per cent.) is observable.
B//e
I
|4 |'
4-5 S1 '7-lK>
/f/8
v° \\
\ W\\V\\8
Inches
I I ]
Pressure amplitudes: no variation detected
Numbers indicate displacement amplitudes
(relative to 10 in. undisturbed wave)
Fig. 97—Sound Distribution round a Lead Disc in Water
The observations in all respects confirm the view that the obstacle
acts as a simple and a double source as outlined above. Theform of the ' stream lines ' in the charts is explained if they are
regarded as the resultant of the primary oscillations and the
secondary lateral oscillations. The absence of any appreciable
effect due to the rigidity of the disc is to be expected from its
small thickness, § in., relative to a wave-length (about 8 ft. in water
or in lead). Discs of wood, rubber, and paraffin-wax produced
no definite disturbance, but appeared completely transparent to
the sound waves in the water.
(2) Hollow (air-filled) Bodies - The oiled silk disc (shown in
fig. 98) may be regarded as the simplest type of this class.

3i6 DIFFRACTION
It consists of two sheets of oiled silk stretched over a light
wooden ring, and is therefore a 'disc of air' in the water.
The sound distribution shows the following characteristics:
(a) The lines of direction converge on, or diverge from, the
faces of the disc, (b) marked increases are produced in the
displacement-amplitude near either face, (c) marked diminution
of pressure-amplitude is produced near the faces, (d) regions of
confused direction are produced in which the oscillations of the
water particles are no longer rectilinear, and (e) marked changes
of quality are produced if the incident sound is not pure. If the
bounding wall of the disc consists of material having appreciable
rigidity, such as tinplate, the surface appears to vibrate in sections,
producing very sharply marked and localised disturbances with
corresponding changes of quality. The 'hollow disc' in water
9 10
9 iCHt
_ \j33 „30 A
LLLLULi lncheSDisplacement amplitudes thus 25 <M
, ? ? 9Inches
to — —Pressure amplitudes thus ^
Fig. 98—Sound Distribution round an " Air-Disc " in Water
may in some respects be regarded as the converse of the solid disc.
The 'air disc ' shown in fig. 98 is more compressible than water,
and will therefore tend to act as a simple source. The density of
the disc being also less than that of water, the amplitude of the
disc as a whole will exceed that of water particles in the undisturbed
field. The disc will therefore behave as a double source. In the
case of the air disc the phases of the vibrations of the simple and
double sources will be opposite to the corresponding vibrations
in the case of the solid lead disc. Various compromises between
solid and hollow body characteristics may be produced by suitably
constructed discs, the more pronounced hollow body effects
tending to predominate. The above method of investigation has
been applied to examine the sound distribution round more
complicated structures in water, e.g. the single-plate directional

ATTENUATION OF SOUND WAVES 317
hydrophone and its baffle plate (see fig. 125). In such cases the
method has thrown a good deal of light on complex problems
of sound distribution which are not amenable to mathematical
treatment.
Attenuation of Sound Waves
Energy Loss due to Viscosity and Heat Conduction - Wehave hitherto assumed that spherical sound waves spread in an
infinite homogeneous medium without loss of energy, in accord-
ance with the law of inverse squares. It is found, however, that
the rate of diminution of sound intensity with distance in extended
media is much more rapid than this simple law of spreading
would indicate. It is true that in certain cases, where the sound
waves are confined between reflecting surfaces, the rate of de-
crease of intensity is reduced. Thus in the sea, sounds travel in
a two-dimensional rather than a three-dimensional medium, with
a correspondingly increased range. The increase of range ob-
tained by means of speaking-tubes, confining the sound waves to
one dimension only, is well known. Were it not for certain
frictional effects, which we shall now consider, sound energy
might be conveyed without loss to very great distances.
Apart from other considerations, energy loss must take place
whenever there is relative motion between the various particles
comprising the medium, such loss being due to ordinary viscous
forces which tend to degrade the sound energy into heat. Aperfect fluid is one in which tangential stresses cannot exist. In
actual fluids, however, whether liquid or gas, such stresses do exist
in varying degrees depending on the factor which is termed
viscosity. It is this viscosity which tends to damp out relative
motion between the various parts of a fluid. In the case of a
fluid flowing over a plane solid surface, the layer in immediate
contact with the solid must be at rest, the velocity of successive
strata of the fluid increasing with increase of distance from the
solid surface. The tangential stress between any two successive
layers will tend to accelerate the lower or more slowly movinglayer, and to retard the upper more rapidly moving layer. Thetangential stress between the layers is proportional to the velocity
gradient, i.e. Stress <x dvjdy or Stress =fjidv/dy, where /x is the
coefficient of viscosity. The viscous effect when relative motion
of layers of a fluid takes place may be explained on the Kinetic
Theory as being due to an interchange of molecules between the
different layers, there being a loss of momentum by the higher

3 i8 ATTENUATION OF SOUND WAVES
velocity layers to those of lower velocity. This loss of momentumis the cause of the 'drag' or viscous force tending to prevent
relative motion. Similar forces of a frictional character are pre-
sent in solids as well as in liquids and gases. The vibrations of a
cast-iron bar die away much more rapidly than those of a similar
steel bar, the difference being due to the greater frictional forces
in the cast iron. Returning to the case of gases, both theory
and experiment indicate that the viscosity is, within wide limits,
independent of the density or pressure of the gas, but increases
with rise of temperature. It will be seen that the viscosity p. in
a liquid is equivalent to the rigidity, or resistance to shearing,
in a solid body. The equation of motion of plane waves in a
medium of density p and elasticity k is
d*£_dpPaY~dx'
which, according to Rayleigh,* in the case of a medium of viscosity
\i becomes
^L*^:+4 ^ *i_ (i)
dt2 p dx 2, 3 p' dxdt
The solution of this equation indicates a wave advancing with
the usual velocity c=Vk/p, diminished by a small amount due
to viscosity. It can be shown that this velocity is given by'
4 A 2k 2 (', 2tt 2ttN\
In most cases the second term is negligible.
As Maxwell pointed out, the effect of viscosity in modifying
the motion is dependent on the ratio of pu/p rather than on p,
alone. Consequently he called this ratio p,/p=v1 the 'kinematic*
coefficient of viscosity. Commencing with a simple harmonic
wave of the form £=cos nt, the solution of (1) indicates, at a
distance x from the origin of the wave,
g=Ae~ ax cos (nt— fix) \
in which I . (3)
P=n/c and a =2iv* a/3c8J
The wave advances therefore with diminishing amplitude, falling
to l/e of its initial value when #= l/<x, i.e. when
«=2^i °r ^N* ... (4)
* Sound, 2, p. 315 ; and Lamb, Sound, p. 185.

VISCOSITY AND HEAT CONDUCTION 319
This deduction has an important bearing on the range of trans-
mission of sounds of various frequencies and in different media.
At constant frequency the range will vary directly as the cube
of the wave-velocity in the medium and inversely as the kinematic
viscosity. In the same medium the range of transmission will
vary inversely as the square of the frequency. The values of vx
for air and water are 0T32 and 0-013 respectively at 10° C,whilst c air =0-331 xlO 5 cm./sec. and c water= 1-5 xlO 5 cm./sec.
Before considering practical applications, however, we must refer
to another equally important factor which influences the range of
transmission of sound waves. It was first pointed out by Kirch-
hofl that the loss of energy due to heat conduction in the mediumcannot be neglected. To include such heat losses Maxwell
multiplied the value of vx given above by 2-5. Thus the kinematic
'viscosity' coefficient v=2-5 p,/p when it includes losses of this
nature. Stokes (1851), referring to the loss of energy due to heat
radiation, remarked that vibrations of very low frequency should
travel isothermally (with equalisation of temperature in the wave),
whereas vibrations of very high frequency should travel adiabati-
cally (with no heat transfer). In a gas therefore waves of very
low frequency would have the Newtonian velocity VP//0, and
waves of very high frequency the Laplacian velocity VyF/p. For
intermediate frequencies we should therefore anticipate inter-
mediate values of velocity. In the extreme cases the sound waveshould be propagated without attenuation due to heat transfer,
whereas in the intermediate case it should be rapidly stifled.
W. F. Herzfeld and F. O. Rice * have recently remarked, how-ever, that Stokes's view of the matter appears to be incorrect.
They say, "An erroneous opinion on the influence of the fre-
quency on the completeness of the adiabatic state seems to be
often held. It is believed that while ordinary sound frequencies
are sufficiently high to guarantee the adiabatic condition, weshould expect Newton's velocity for very low frequencies. But
a close scrutiny shows that the adiabatic state is best guaranteed
for the low frequencies, while for the higher frequencies the
influence of heat conduction is larger. . . . The result comesabout in the following way : while it is true that with decreasing
frequency the time allowed for heat conduction increases, the
amount of heat conducted at a given moment decreases muchmore rapidly. The latter is proportional to d2T/dx 2 (T =tempera-ture), and for a given amplitude this expression is inversely
* Phys. Rev., 31, p. 691, 1928.

3 2o ATTENUATION OF SOUND WAVES
proportional to A2. Therefore the heat conducted during one period
increases proportionally with frequency because of the increasing
steepness of the temperature gradient."
Referring now to equation (4), we can calculate the distance
x plane waves may travel before the amplitude is reduced to
1/cth. In air v = 2-5 x 0-132 = 0-33, whence x = 41 x 10 10/N 2
metres. For low frequencies (e.g. N=200, #= 1000 km.) the
value of x is large and attenuation of this nature is negligible.
At high frequencies, however, the effects of viscosity and heat
conduction are more serious; thus, when N=104 or 105, #=410
metres and 4 metres respectively. There is consequently an
upper limit of frequency for the propagation of vibrations
to appreciable distances. In water v =0033 and c= l-5 xlO 5
cm./sec, whence #=3-84 xl0 13/N 2 metres. At a frequency of
1000 p.p.s., therefore, #=3-84 x 104 km., and at 10 4 p.p.s. the value
is 384 km. In water, therefore, the effects of viscosity are unimportant
relatively to those occurring at the same frequency in air. This
partly explains the relatively large ranges of transmission of sound
under the sea as compared with those obtained in air. A small
charge of guncotton (9 oz.) exploded under water can be detected
and recorded with certainty under the sea at a distance of 40 miles.
It is very unlikely that such a range would be obtained in air.
Strictly speaking, the comparison should be made with continuous
sound waves from a source with a constant energy output in the
two media. There is ample evidence to show, however, that
bell sounds and other noises under water are attenuated far less
than in air. Even in air, the influence of frictional forces (viscosity
and heat losses) are not likely to be serious unless the frequency
of the waves approaches or exceeds the upper limit of audibility.
Rayleigh refers to the ' mellowing ' influence of sounds by distance,
as observed in mountainous countries, and suggests that the effects
may be due to friction by which the higher and harsher com-
ponents of the sound are gradually eliminated.
On account of attenuation due to viscosity, the intensity of a
sound wave spreading in an infinite medium therefore falls off
more rapidly than the inverse square law of distance indicates.
This effect is still more marked when the waves are of large
amplitude. In such cases—as, for example, the pressure pulse
from a gun or the wave from a powerful sound-signalling source-
it is probable that the large temperature fluctuations in each
cycle of pressure may be such as to involve serious heat losses
due to conduction and radiation. This heat 'loss' is actually a

OBSERVATIONS AT HIGH FREQUENCIES 321
transfer of heat from the regions of high pressure to those of low
pressure, the tendency being to produce equalisation of pressure,
i.e. to suppress the wave. Such effects become more serious at
large amplitudes—that is, near the source In this connection
experiments by M. D. Hart, to which we have already referred
(p. 211), are of considerable importance. He found that the
sound intensity near a siren source diminished extremely rapidly
at first, then more slowly as the distance increased. On such
grounds he concluded that sources of small intensity and large
area are likely to be more efficient than sources of great intensity
and small area. This result has an important bearing on the
design of sound-signalling devices for use in air, and indicates
that high-pressure intensities must be avoided if attenuation is
to be negligible.
Observations at very High Frequencies - In measuring the varia-
tion of velocity with frequency, G. W. Pierce * observed that
carbon dioxide absorbed sound energy more readily than air.
At frequencies of 10 5 and 2 xlO 5 the absorption in C0 2 was re-
spectively four times and more than eighty times the absorption
in air. At a frequency of a million p.p.s. C0 2 was found to be
opaque. Pierce's experiments have been extended by T. P. Abello,f
who measured the absorption coefficient for high frequency waves
in mixtures of air with C0 2 , N 20, H 2 , and He. A beam of
sound waves of frequency 6Txl0 5 p.p.s. from an oscillating
quartz crystal was passed through various known mixtures of the
gas and air contained in the tube. In the first series of experi-
ments the sound intensity at the distant end of the tube was
measured by means of a torsion vane pendulum (see p. 432) with
quartz fibre suspension. Later, the emergent beam was allowed
to fall on another tuned quartz crystal connected to a vacuumtube voltmeter.]; A logarithmic decrease in the emergent
intensity was observed as the percentage of C0 2 , H 2 , etc., was
increased. For example, the intensity was reduced to half-value
by the addition of 8 per cent. C0 2 or of 13 per cent, hydrogen.
In argon no absorption was observed. As we have already
remarked on p. 259, Pierce noticed also a progressive small
increase of velocity in C0 2 , combined with increased absorption
* hoc. cit.yp. 259. See also N. Neklapajev and P. Lebedew, Ann. d.
Physik, 35, p. 171, 1911.
t (1) Nat. Acad. Sci. Proc, 13, p. 699, 1927, and (2) Phys. Rev., 31,
p. 1083, 1928. See also K. F. Herzfeld and F. O. Rice, Phys. Rev., 31,
p. 691, 1928.
% See, for example, E. B. Moullin, Journ. I.E.E., 61, p. 295, 1923.
21

322 ATTENUATION OF SOUND WAVES
at very high frequencies. From equation (2) (p. 318), it is
possible to calculate the diminution of velocity with increase of
frequency. Thus for C0 2 , v=2-5, /x/p =0-185, and c=2-59 xlO 4
cm./sec, whence Sc= — 9 xlO_8N 2. At a frequency 10 5 p.p.s.
there should, on account of viscosity and heat conduction, be
a decrease of 9 m./sec. in velocity, whereas Pierce observed
an increase of 1-4 m./sec. A possible explanation of Pierce's
anomalous results is offered on p. 268. Boyle and Taylor* have
looked for such a change of velocity in water in which v =0-013
and c= l-5xl0 5 cm./sec. The value of Sc, calculated from
equation (2), is 0-028 cm./sec. at 6 xlO 5 p.p.s., a change which is
undetectable. Even in a very viscous oil at this frequency Boyle
and Taylor could detect no certain diminution of velocity.
S. L. Quimby f has determined the viscosity of glass and metals
under the rapidly alternating strains due to longitudinal waves.
At frequencies of the order 40,000 p.p.s. he found viscosity co-
efficients of the order 10 3 for glass, aluminium, and copper,
whereas the constants determined by static methods are of the
order 10 8. Oscillograph records, showing the decay of longitudinal
oscillations in steel bars supported on threads, indicated that the
fractional loss of energy per cycle due to internal friction in solid
media is a constant of the material independent of the speed of
performance of the cycle. The internal damping in solids mayalso be determined from observations of the sharpness of reson-
ance. The difference in resonant properties between a steel and
a copper bar are sufficiently obvious; a similar large difference
in internal damping is noted by W. G. Cady between quartz
and steel resonators (see p. 143). Viscosity in metals is also
discussed in a paper by R. W. Boyle, J who observed the
decay of amplitude in short steel bars by means of a high fre-
quency granular microphone electrically coupled to a valve oscil-
lator generating alternating currents of nearly the same frequency
as the bar. The heterodyne or beat-note could be heard clearly
even at 4 xlO 5 p.p.s., its duration giving an indication of the rate
of decay of the oscillations, and consequently the damping or
viscosity factor.
Sound Absorption in Narrow Tubes and Cavities.
Porous Bodies - The viscous and heat conduction losses which
* Loc. cit., p. 260.
t Phys. Rev., 25, p. 558, 1925, and 31, p. 1113, 1928.
X Trans. Roy. Soc. Canada, 16, p. 293, 1922. See also Ronda andKonno (Phil. Mag., 42, July 1921).

NARROW TUBES AND CAVITIES. POROUS BODIES 323
we have just been considering have an important bearing on the
explanation of the absorption of sound by porous bodies. Certain
types of sound-absorbing media may be regarded as a mixture of
gas-solid or gas-liquid. Thus cork and felt are examples of the
gas-solid 'mixture' and frothy liquids as a gas-liquid mixture. It
is always found that sound waves are greatly attenuated in their
passage through such materials. The effects of viscosity and heat
conduction in degrading the sound energy are greatly increased
when a gaseous medium (air, for example) is brought into contact
with a large surface area of solid or liquid. The viscous forces
are increased because the tangential motion of the gas layers is
hindered by the proximity of the solid wall. Lamb # shows that
the linear magnitude /z=(47rv1/N) 1/2 (where v1 =kinematic viscosity
and N=frequency) may be regarded as a measure of the extent
to which the viscous ' dragging ' effect penetrates into the gas. At
this distance the velocity is within 2°/00 of the normal value at an
infinite distance from a solid surface. In air, in which 1^=0-13,
we find h= l-29/N- cm. At a frequency of 1000 p.p.s. the viscous
drag therefore extends 004 cm. from a solid surface. When the
diameter of a tube is small, the conduction of heat from the centre
of the air column to the wall becomes more and more rapid.
Ultimately in a very narrow tube the temperature of the gas
remains throughout the same as that of the solid conducting wall
;
the rarefactions and compressions being isothermal, as if no heat
were developed at all. The velocity of sound in such a tube must
be Newton's isothermal value Vic/p, and heat conduction will not
appear in the viscosity factor. In the case of a narrow tube of
circular section (radius r), Rayleigh f shows that the form of the
wave at a distance x along the tube is represented by
eax
cos nt where a=2Vv1yn/cr.
The attenuation constant a therefore varies directly as the square
root of the product of kinematic viscosity vly the ratio of specific
heats y and the frequency N(=n/27r), and varies inversely as the
product of the velocity of sound c and the radius of the tube r.
In the case of air ^=0-13, y=l-41, c=3-3 xlO4, whence
a=0-65xlO-4 \/N/r.
At a frequency of 1000 p.p.s. the attenuation constant in a tube of
radius 0-001 cm. is therefore a =2-05, the amplitude falling to l/e
of its initial value in 0-5 cm. approximately. When the diameter
* Sound, p. 192. f Sound, 2, p. 331.

3 24 ATTENUATION OF SOUND WAVES
of the tube is so great that the thermal and viscous effects extend
only a relatively small distance from the wall we arrive at the case
already considered on p. 238, which refers to the velocity of sound
in tubes as a function of the radius of the tube. Rayleigh's treat-
ment of the absorption of sound in very narrow tubes is of course
applicable in principle to any form of air cavity in which the gas
is everywhere in close proximity to a solid wall {i.e. all distances
are less than ' h '). The smaller the radius of the cavity the greater
are the viscous forces and the more rapidly is the sound energy
absorbed as it passes along the cavity. The absorbent properties
of hangings, carpets, cushions, and such-like air-permeated bodies
have long been appreciated as a means of suppressing reverbera-
tion. In large halls and public buildings where such commodities
are not always available special sound absorbent materials are
now frequently used as a remedy for excessive reverberation. Weshall have to consider this question in greater detail later. It is
convenient, however, to refer here to a laboratory method of
measuring the absorption coefficients of porous materials such as
felt, cork, wool, and various forms of 'acoustic plasters and tiles.'
Stationary-Wave Method of Measuring Absorption Co-efficients of Porous Materials - We shall assume that the sound
energy which is incident on the surface of the porous substance
is either reflected or absorbed, none being transmitted. This
condition is obtained in practice by backing the porous material
with a perfect reflector. On p. 281 it has been shown that the
reflection coefficient of an imperfect reflector, on which plane
waves are incident normally, is given by
r\ 2 fl-P/a
a J \l+j8/a,
where a is the incident and r the reflected amplitude, and j3/a is
the ratio of minimum and maximum amplitudes observed in the
stationary wave formed by interference between the direct and
reflected waves. The coefficient of absorption is, by definition, the
fraction of the incident sound energy lost at reflection, i.e.
(a 2 -r 2)
4~^~ °r
(2 + a/P+P/a)'
This expression is due to H. Taylor,* but the stationary-wave
method of determining absorption coefficients was first proposed
* Phys. Rev., 2, p. 270, 1913.

ABSORPTION COEFFICIENTS 325
by J. Tuma,* and was followed by the experimental observations
of F. Weisbach.f More recently E. T. Paris X has improved the
technique of the method and has obtained much valuable informa-
tion relating to the reflection and absorption properties of mate-
rials. The arrangement which he used (see fig. 99) consisted of a
Felt'- lined box
Bcickincj lb
specimen
PcicUinu
Cover
1, 1 , 1 Feef W$>**^?M?\Fig. 99
(From Davis and Kaye, Acoustics of Buildings)
large earthenware pipe (30 cm. diameter, 226 cm. long) closed at
one end by the specimen of porous material, backed by a good re-
flecting material. At the other end, a large ' loud speaker ' actuated
from a valve oscillator, supplied a sound of constant frequency and
intensity. By means of a calibrated resonant hot-wire microphone
(see p. 402) the amplitude along the axis of the tube was measured,
the ratio of the maximum and minimum values, a and /3, being
then utilised in the above relation to calculate the absorption
coefficient. The method is simple, direct, and accurate, and only
small quantities of absorbing material are required. It is used in
a slightly modified form at the National Physical Laboratory, and
at the Bureau of Standards (Washington). Paris determined in
this way the absorption coefficients of various kinds of acoustic
tiles and plasters, values from 0T0 to 0-36 being observed. As the
theory of absorption indicates, the absorption coefficients were
* Sitz. K. Akad. d. Wiss., 3, p. 402, 1902.
t Ann. d. Physik, 33, p. 763, 1910. Also Eckhardt and Chrisler,
Bureau of Standards, No. 256, 1926.
X Proc. Phys. Soc, 39, p. 269, 1927 ; Proc. Roy. Soc, 115, p. 407, 1927,
and Phil. Mag., 4, p. 907, 1927.

326 ATTENUATION OF SOUND WAVES
found to increase with the frequency of the incident sound ; in a
particular specimen the successive values were 0T3, 0-26, and 0-31
at frequencies 380, 512, and 650 p.p.s. The coefficient of absorp-
tion was found to increase also with increasing thickness of porous
material, approaching an upper limit when further increase of
thickness produced no change in the amount of energy absorbed.
A layer of 4 in. of loosely packed cotton-waste was found to absorb
91 per cent, of the sound energy incident upon it, the frequency
being 512 p.p.s.
Absorption of Sound Waves in Turbid Media - Theoretical
investigations such as those of Rayleigh and Lamb lead to the
conclusion that absorption of sound energy by a medium contain-
ing suspended particles increases as the wave-length diminishes.
Tyndall's fog experiments indicate, however, that waves of the
order 1 metre long are not appreciably affected. Altberg and
Holtzmann,* using wave-lengths of the order 1-5 cm. to 6-5 cm.,
found increased absorptionby smoke as the wave-length diminishes.
The waves were set up in a tube, and the intensity of sound passing
through the tube was measured by a torsion pendulum. It was
found that a layer of smoke 56 cm. thick, the concentration being
7-3 x 10~ 6 grm./c.c, varied from 24 per cent, for A =5-6 cm. to
70 per cent, for A= 1-5 cm.
Absorption of Sound by Gas-Bubbles in Liquids. Velocity of Soundin Fluid Mixtures - The phenomena of sound absorption in porous
solids are exemplified also in ' porous liquids,' if it is permissible to
use the term. A tumbler full of water is resonant and rings clearly
when struck with a hard object, but emits a dull, non-resonant
sound when the water is frothy or full of gas-bubbles. The effect
is simply demonstrated with a spoonful of effervescent salt in half
a tumbler of water. As the bubbles disappear the resonant quality
returns. The air-bubbles, therefore, cause a marked increase
of damping. The phenomenon has been examined theoretically
by A. Mallock,f who shows that the damping is due to increase
of distortion of the liquid separating the bubbles. The pressure
variations act almost entirely on the volume of gas and scarcely at
all on the relatively incompressible fluid. Bubbles in a solid cannot
behave in this way since their volume is fixed by the rigidity of the
surrounding medium. A material like spongy rubber, however,
can behave like bubbly water, by turning forward compression
into sideways expansion.
* Phys. Zeits., 26, p. 149, 1925.
t Proc. Roy. Soc, 84, p. 391, 1910.

TURBID MEDIA 327
To determine the velocity of sound in a mixture of two fluid
media (e.g. small non-resonant air-bubbles in water) we shall
assume that the velocity is the same as that in a homogeneous
fluid of the same mean density p and mean elasticity E as in the
mixture. Let pjEj^ arid p2E 2 represent the density and elasticity
of the constituents 1 and 2 respectively. Then let .x:=the pro-
portion of the first constituent by volume and (1—#)=the pro-
portion of the second constituent by volume. The mean density
p is therefore
p=xp1 +(l-x)p2 (1)
We must have also
1 x (1 —x)
whence the mean elasticity
E= ^ ... (2)
and the mean velocity
c=/E= /
E XE 2
V p V{JcE 2+ (l-x)E1}{xp1 +(l-x)/
)2}'
{)
These expressions are applicable to a mixture of any two fluid
media, which do not react chemically. We shall apply equation
(3) to determine the velocity of sound in a mixture of non-resonant
air-bubbles and water. In this case we have
for air p1==0-0012 E1=l-2xl0«,for water p2
= 1-0 E 2=2-25 x 10 10
.
Employing these values in equation (3) for the mean velocity and
substituting various values of x (the fraction of air by volume) weobtain the curve shown in fig. 100. Here it is seen that a pro-
portion of 1 part air in 10,000 parts water lowers the velocity of
sound in the water by about 40 per cent. The curve also reveals
that the velocity reaches a minimum value when the volume of air
exceeds one-tenth that of the water. This minimum velocity is
only about one-tenth (36 metres/sec.) of the velocity of sound in
air alone. Under such conditions the mixture may be regarded
as 'froth,' the water merely serving to load the air-bubbles (the
springs) and consequently to lower the velocity of transmission,
On these grounds a small lowering of velocity might be anticipated
in the case of sound transmitted through dense mist or fog—that

32* ATTENUATION OF SOUND WAVES
is, in air loaded with fine particles of water. So far as the
writer is aware, there is no experimental information bearing on
this point. It will be seen
from the curve, as is other-
wise obvious, that the
velocity becomes equal to
the velocity in water or
air respectively as x is
equal to zero or unity.
The damping being due
to the large volume varia-
tions in the liquid sur-
rounding each bubble, it
may be calculated in the
case of a spherical bubble
surrounded by a sphere of
viscous (but incompres-
sible) fluid subjected to a
simple harmonic variation
of radius. The efficiency
of the bubbles in damp-
ing vibrations increases
rapidly both as their dia-
meter and distance apart
diminishes. This may be
verified experimentally.
From expressions (1) and (3) above we may deduce the reflec-
tion coefficient of a mass of air-bubbles in water. The acoustic
resistance (pc) of the mixture is clearly
1600
1400
1200
w 1000
<1 800
3.0
1 600
400
200
N
\
\\
Air
Water
Fig. ioo-
10"* I0"d 10"^ 10" 1
Fraction by volume of air in water1
Air
-Velocity of Sound in Air-WaterMixtures
pc-- VEiE 1E 2{xPl +(l-x)p2}
#E 2 +(1 —x)E ±
(4)
The reflection coefficient of a "thick ' (semi-infinite) layer is from
equation (6a), p. 272.
-)2
(5)pc^-p 2c2
where pc refers to the mixture of air and water (see equation (4))
and p 2c 2 refers to the clear water. The reflection from a layer
of bubbly water of relatively small thickness may similarly be
calculated using equation (10), p. 27G. The percentage energy

ATMOSPHERIC TRANSMISSION 329
30
t6
in
20
1Q-6 -10-5 10-4 10"3 10-2 1Q-1
Ratio of air to water (by volume)
Fig. ioi—Reflection of Sound from Air-Water Mixtures
reflected (r2) is plotted as a function of x (the ratio by volume of
air to water) in fig. 101.
This curve illustrates the serious reduction of intensity which
might occur when a sound 100
wave encounters a mass of
air-bubbles in the sea. The -^
noise of a ship's propeller <£.
is seriously reduced by the §
bubbly water in the wake. ^60
In such cases, as the fore- ggoing remarks will show, § 40
the incident energy is par- |tially reflected and partially §
absorbed, the loss increasing <£
rapidly as the proportion of
air to water increases.
Transmission of Soundthrough the Atmosphere.Audibility ofFog-Signals -
The various factors affecting sound transmission, which wehave hitherto considered independently, all combine in vary-
ing degrees to influence the range of propagation of sounds
in air. Wind, temperature gradients, reflection, scattering,
refraction, interference, diffraction, and viscosity all have an
important influence on the character of the wave-front as it
advances from a source of sound through a heterogeneous mediumsuch as the atmosphere. The influence of the meteorological
conditions on sound transmission through the atmosphere has long
been recognised. The first experimental study of such influences
was made by Tyndall # in connection with the audibility of fog-
signals sent out from Trinity House sirens mounted at South
Foreland Lighthouse and on various light-vessels. The import-
ance of such investigations in relation to the navigation of ships in
foggy weather, when lights cannot be seen, need not be stressed
here. There is not only a large annual loss of life due to fog, but
in addition to the loss of ships by collision the pecuniary loss is
also very great when large numbers of vessels are prevented from
entering harbour on account of fog. The systematic use of sound
signals for marine protection is of comparatively recent date in
spite of the fact that Tyndall and, later, Rayleigh had long ago
indicated its possibilities and devoted special attention to its
* Phil. Trans. Roy. Soc, 1874.

33© ATTENUATION OF SOUND WAVES
development. Tyndall came to the conclusion that 'temperature
refraction' and a flocculent condition of the atmosphere, arising
from the unequal heating and humidity, were responsible for the
large fluctuations frequently observed in the range of audibility
of fog-signals. Contrary to the opinion generally held at that time,
he found that the presence offogfavoured the transmission of sound
signals, the atmosphere being then in a more homogeneous con-
dition, particularly with respect to temperature gradients. Therefraction of the sound wave by temperature gradients would be
reduced and the condition of the atmosphere would be more
favourable to the propagation of sound. The scattering effect of
the minute fog particles would be very small for wave-lengths of
the order of 5 ft. Tyndall observed the duration of the reverbera-
tion of the blast of a siren situated on a cliff overlooking the sea
(South Foreland). On a clear day with a smooth sea the echo of
gradually diminishing intensity sometimes lasted 15 seconds. Theexplanation offered, namely, that the echoes were returned from
invisible 'acoustic clouds,' seems not improbable. On this
hypothesis Rayleigh offers an explanation of certain anomalous
results obtained by Tyndall. The latter found that different
kinds of signals did not always preserve the same order of effective-
ness, a siren (giving a continuous blast) being sometimes better
and sometimes worse, as regards range of audibility, than a gun
giving a single impulse. Rayleigh points out, on the grounds that
energy cannot be lost by reflection or refraction, that the intensity
of radiation at a given distance from a continuous source of sound
is not altered by the acoustic 'cloud,' the loss due to the interven-
ing parts of the cloud being compensated by reflection from those
which lie beyond the source. "If the sound is of short duration,
however, the intensity at a distance may be very much diminished
by the cloud on account of the different distances of the reflecting
parts and the consequent 'drawing out' of the sound, although
the whole intensity, as measured by the time integral, may be the
same as if there had been no cloud at all."
The work of Tyndall and Rayleigh has in recent years been
extended by a number of workers, notably G. I. Taylor, L. V. King,
E. A. Milne, W. S. Tucker, E. T. Paris, M. D. Hart, E. S. Player,
and others.* Such experimenters have dealt chiefly with two
types of phenomena: (a) scattering effects due to acoustic clouds,
* E. A. Milne, 'Sound Waves in the Atmosphere' (Phil. Mag.,July 1921) ; W. S. Tucker, Journ. Roy. Soc. Am, 71, No. 3659, Jan.1923 ; Hart and Smith, Principles of Sound Signalling (1925).

ATMOSPHERIC TRANSMISSION 331
fog banks, air vortices, and other atmospheric discontinuities, and
(b) reflection and refraction effects due to more or less continuous
variations in such factors as wind, temperature, and humidity,
which may influence the velocity of the wave-front. W. S.
Tucker and his staff have made a study of ' meteorological acoustics
'
at a station situated near North Foreland, selected on account of
its favourable situation relative to a number of light-vessels fitted
with sirens. As an instance of the remarkable fluctuations of
intensity of the received sound on a typical English summer day
when the sky is clear or possibly flecked with white cumulus cloud,
Tucker refers to a record of the sound emitted at one-minute
intervals from the North Goodwin light-vessel siren (seven miles
away). The record shows irregular variations of the order 30 to 1
in intensity within the space of a few minutes. On certain
occasions the sound is 'scattered' by atmospheric 'patches' of
abnormal acoustic resistance, and it sometimes becomes impossible
to determine the direction of the source of sound although it
is clearly audible. This diffusion or scattering of the sound is
analogous to the effect of light penetrating a fog. A large collec-
tion of data of this nature correlated with weather, temperature,
and humidity conditions has thrown a good deal of light on this
complicated problem. The apparatus used by Tucker and Paris
for measuring the strength of fog-signals has recently been
described by Paris.* It consists essentially of a hot-wire resonated
microphone tuned to the frequency of the sound and connected
to a sensitive indicating or recording galvanometer (e.g. the
Einthoven string galvanometer). With this apparatus an inter-
esting acoustic survey f was made of the sound emitted in different
directions from a diaphone fitted in the Caskets Lighthouse. Avessel carrying the tuned microphone and recorder circled round
the lighthouse at a constant distance of two miles and the ampli-
tude of the received sound signal was plotted as a function of the
bearing of the ship with respect to the diaphone. The horn of
the latter pointed upwards, so there could be no directional effect
at the source. A south-easterly wind of 2 miles per hour wasblowing and the atmosphere was clear. The result of such a
survey is shown in fig. 102. The normal temperature gradient was
such as to refract the rays of sound upwards from the surface of
the sea. Thus to the south-east the tendency of the wind wouldbe to enhance such an effect, whilst to the north-east the tendency
* Journ. Sci. Instrs., 3, 6, p. 187, 1926.
f See also L. V. King, Phil. Trans., 218, p. 219, 1919.

332 ATTENUATION OF SOUND WAVES
WINDS.E. 2 miles per hour
Fig. 102
would be towards neutralisation. This is clearly shown in the
polar curve of amplitudes. The fluctuations of observed ampli-
tudes from blast to blast are of the kind generally encountered in
this class of work and are not unusually large. They are no doubt
due to atmospheric conditions,
possibly to moving eddies.
Tucker refers to records of a
sound arriving by two distinct
paths on a clear day with a
strong following wind whose
velocity alternately increased
and decreased with increase
of height. The effect heard
by the observer was the same
as if every blast of the siren
were doubled. E. S. Player *
considers that the only factor,
apart from wind and tempera-
ture gradients, in which the
changes are at all comparable
with the large and sudden variations in the range of audible
transmission is humidity. Comparative charts of humidity
and audibility (loudness) of a siren indicate a close correlation.
Player refers also to an exceptional example of temperature
effect. With an off-shore wind with a bad gradient (12 m.p.h.
at the ground level, rising to 20 m.p.h. at 1000 ft.) the listen-
ing conditions were distinctly adverse, yet the galvanometer
gave abnormally large deflections which were confirmed aurally.
The explanation was found in the fact that the wind had passed
over many miles of hot ground (during a summer drought), the
lower layers being cooled as they passed over the sea, with the
result that a 'favourable' temperature gradient was produced,
sufficient to neutralise the adverse effects of the wind and to set
up good conditions for sound transmission. Sufficient has been
said to indicate that sound is conveyed in a very capricious waythrough the atmosphere. Apart from the large variations of
intensity to which we have referred, it is not exceptional to
encounter large areas of silence in different directions and at
different distances from the sound source. Such inconsistencies
tend to make signalling through the atmosphere somewhat
unreliable.
* Quart. Journ. Roy. Met. Soc, 52, p. 351, 1926.

ZONES OF SILENCE 333
Explosive Sounds. Zones of Silence - The firing of a gun
or the detonation of an explosive charge is accompanied by a
pressure wave of very large amplitude which, in some cases, maybe detected at very great distances (of the order of a hundred miles)
from the source. Such effects are comparable in magnitude with
'natural' explosions accompanying a flash of lightning. Wavesof such enormous intensity reveal abnormalities which are not
noticed with ordinary sounds of small amplitude. The high
velocity near the source where the amplitude is large, and the
change of wave-form as the wave progresses are two of these
abnormalities which have already been mentioned. Wherever a
sound wave from a large explosion can be detected it is always
accompanied by a succession of pressure pulses arriving by
different paths after reflection or refraction in the atmosphere.
A phenomenon common to all large explosions in air is the
occurrence of regions where the sound is not audible (or otherwise
detectable), whilst at greater distances the sound is quite distinct.
Tyndall refers to such zones of silence experienced with ordinary
fog-signals, a signal being audible, for example, from to 2 and
from 4 to 6 miles, but quite inaudible between 2 and 4 miles.
The explosion effects to which we now refer are similar, but the
scale is much greater. When a large charge is exploded, the
resulting noise may, for example, be heard for a distance of
60 miles or so surrounding the charge, and again beyond 100
miles, but not within the range 60 to 100 miles. Within the inner
zone of audibility the sound travels at first with abnormally high
velocity and subsequently with the normal velocity of sound.
The direct wave is steadily attenuated in its passage over the
earth's surface, and at an average distance of about 60 miles
becomes inaudible. The sound waves reaching the outer zone
of audibility appear to have travelled with an abnormally low
velocity, but this is not the case. Actually, the sound heard in
this zone has travelled by an abnormally long path, via the higher
atmosphere and ultimately down to the ground again. There is
some divergence of opinion as to the actual mechanism of this
abnormal wave, whether it is bent downwards into the outer
audible zone by refraction (due to air currents and temperature
gradients) or whether it is reflected from a layer of the stratosphere
30 km. or more from the ground, at which level the velocity of
sound increases with height. The effects doubtless arise as a
result of the peculiar meteorological conditions at the time of the
explosion. As an example we may refer to the explosion of a

334 ZONES OF SILENCE
large ammunition dump at Oldebroek, Holland, in January 1923,
which was recorded at various distances up to 500 miles, but was
not detected between 60 and 100 miles from the origin. Similar
observations were made of the Oppau and La Courtine (May 1924)
explosions. Numerous observations and explanatory theories
were immediately forthcoming, in connection with which we maymention the names of Dufour, Deslandres, Esclangon, Villard,
Maurain, Collignon, and others.* Dufour and Villard point out
that records of explosions at long ranges (in the outer 'audible'
zone) show no trace of vibrations of audible frequency which
would constitute the noise of the explosion, the principal effect of
the explosion at La Courtine being a pressure fluctuation in Paris
(230 miles away) of frequency about one period per second.
Villard considers that such slow oscillations are the primary effect,
whereas the noise is an accessory phenomenon of negligible
importance.
An interesting example of a large explosion wave being heard
in two zones separated by a zone of silence has been recently
described by F. J. W. Whipple, f the source of sound being a
detonating meteor (September 6, 1926). From numerous observa-
tions it was deduced that this meteor exploded at a height of
30 to 40 km. (20 to 25 miles approximately). The sound of the
explosion was heard (like thunder) at distances up to 60 or 70 km.,
then a zone of silence followed by a second audible zone. Thehypothetical track of the sound rays from such an ' explosion ' is
shown in fig. 103, taken from Whipple's paper. It is not outside
328%290°->
60
09
co ^%:s^ 32
|
20 -S
,3
c5 290°gv
\-- "1 12
20 40 60 I
Normal Audibility
JO 100 120 140 16C
Zone of Silence
180AbnormalAudibility
Fig. 103
the bounds of possibility that the explosion sounds of a 'deto-
nating ' meteor are produced by the ' onde de choc ' as the meteor
passes through the air at high speed (estimated in this case to be30 km. per second).
* See Comptes rendus, 178 and 179, 1924.
t Monthly Notices R.A.S., p. 89, Oct. 1928.

TRANSMISSION THROUGH SEA-WATER 335
Transmission of Sound through the Sea - The sea is a muchmore homogeneous medium for sound transmission than the
atmosphere. As we have seen, large fluctuations of intensity and
changes of apparent direction of sounds in air are not infrequent
and are liable to occur in a short space of time. In the sea the
conditions are much more consistent. The effects of tidal
currents, analogous to wind, are practically negligible, a 5-knot
tide (about 9 ft./sec.) affecting the velocity of sound (5000 ft./sec.)
only slightly. Temperature gradients in the sea, although less
serious than in the atmosphere, under certain circumstances maybecome important. Thus H. Lichte * has observed seasonal
variations in the range of transmission of under-water signals,
which he ascribes to the refraction produced by temperature
gradients in horizontal layers of the sea. As we have seen (p. 293)
such gradients may cause a sound-ray to curve upwards or down-
wards (according to the sign of the temperature gradient), the wavebeing continued to greater distances by successive reflection at
the surface or the bottom. On account of the smaller absorption
of sound waves in water and the limit to the vertical spreading,
considerably greater ranges are obtainable in water than in air
for the expenditure of a given amount of power. Thus a
Fessenden oscillator (see p. 390) having a 50 per cent, efficiency
and consuming about 1 kw. can be heard at 20 or 30 miles under
the sea, whereas a siren (of 10 per cent, efficiency) consuming
100 kw. in air can be heard at a range of about 10 miles only.
A 9-oz. charge of guncotton exploded under water can be heard,
and recorded, at a distance of 30 or 40 miles. The sounds fromthe propellers of a large vessel at speed may sometimes he heard
at 8 or 10 miles, but the range of detection of such sounds (of a
non-musical character) is liable to vary greatly according to the
state of the sea or, more precisely, according to the intensity of
extraneous ' water noises ' (due to breaking waves, etc.). Systematic
observations of the ranges of transmission of sounds of various
frequencies have been made by Barkhausen and Lichte # in the
Baltic Sea. Their results indicate that the decrease in amplitude
of the sound wave with distance is exponential, energy dissipation
due to various causes being more important than the effect of
spreading. With a Fessenden oscillator, at a frequency of 517
p.p.s., they observed an attenuation equivalent to a fall of amplitude
to half value every 2 to 3 km. Such a large attenuation cannot
be explained on the basis of viscosity and heat losses in the water
* See Unterwasserschalltechnik, F. Aigner (Berlin, 1922).

336 VARIATION OF PITCH WITH MOTION
—it was shown on p. 320 that a sound of frequency 1000 p.p.s.
would travel about 4xl0 4 km. before its amplitude fell to 1/eth
due to viscosity. A possible explanation may be found byassuming the presence of large masses of suspended air-bubbles
in the sea, which increase the damping as indicated on p. 328.
Variation of Pitch with Motion. Doppler Effect
The pitch of a sound of constant frequency is dependent on
the motion of the source and the observer. It is obvious that an
observer approaching a source of sound will encounter moresound waves per second than if he remained stationary, and,
similarly, if the source is approaching the observer. The two
cases differ, however, in certain respects.
Source Stationary, Observer in Motion - In fig. 104 (a) let
S be a stationary sound source and P an observer moving with
velocity v along a line AOB distant OS=d from the source.
A P^
Fig. 104
The observer approaches S with velocity v cos #, and the apparent
velocity of the sound waves arriving at P is (c-\-v cos 6). Conse-
quently, if N is the actual frequency of the source, N' the fre-
quency of arrival of waves at P (i.e. the apparent frequency of the
source), and A the wave-length of the sound, we must have
C+VC0S9:A,thatisNWl+?cosA . (1)
c
N N'
or writing
cos 6- N'=N(Hv.x
Vx 2 -\-d2(2)
Vx2+d2
Plotting N' as a function of x for various values of d, we obtain a
series of curves of the form shown in fig. 88 (b), curves (1), (2),
and (3), representing increasing values of d. In all cases when x
is large compared with d,
Nv dN'(N'-N) =±— and^^O. ., , (3)
c ax

DOPPLER EFFECT 337
approximately. As the observer passes through O, however, the
value of (N'—N) changes sign, and dN'/dx reaches a maximumvalue (when x=0) of Nv/cd.
Observer Stationary, Source in Motion - In the case we have
just considered, viz. the observer in motion and the source
stationary, the change of frequency is due to the change of rate
at which the sound waves pass the observer—that is, to an apparent
change of velocity of propagation, the wave-length remaining
constant. If in fig. 104 (a) we now regard P as a moving source
and S a stationary observer, we obtain a somewhat different
result. There is in this case an apparent change of wave-length
due to the motion of the source towards the observer, the velocity
of sound propagation remaining the same.* The observer,
instead of receiving waves spaced c/N apart will now receive them
at distance intervals of (c—v cos 0)/N. That is to say,
\'=(c-v cos 0)/N
and
N'=p=N(5)... (4)
A \c—v cos 6/
or
(c—v cos 6)
the maximum value of which is
Nv(N'-N)max=±— ... (6)
c—v
This value is attained when 6 is zero or 77—that is, when x is large
compared with d.
If we substitute in equation (4) the ratio x/Vx2jrd2 for cos 9
and differentiate with respect to x, we obtain an expression for
the rate of change of frequency dN'/dx. This expression indicates
(1) When x is large compared with d
dx
(N'—N) having the maximum value ±N©/(c—v).
* As Rayleigh points out (Sound, 2, p. 156), the mathematical treat-
ment of a moving source is difficult. In the above simple procedure wehave neglected any disturbance of the medium produced by the motion ofthe source or the observer.
22

338 VARIATION OF PITCH WITH MOTION
(2) When x is zero
~dx~~c~d(7)
the frequency difference (N' —N) changing sign.
It will be seen that for small values of d, the source passing
close to the observer, the apparent frequency at first remains at
a constant high value and suddenly changes to a constant low
value. When d is large the change is more gradual and is not
so easily noticed unless v is large also. It should be noted
that the rate of change of frequency is directly proportional
to the actual frequency and inversely proportional to d. Thefirst of these cases is illustrated by the familiar example of the
express train whistling whilst rushing at high speed through a
station. A sudden drop of pitch in the note as the engine passes
close to the observer cannot fail to be noticed. The second case
is illustrated by a high-speed aeroplane passing overhead. Thechange of pitch is more gradual on account of the large value of d,
but it is still quite easy to detect because v is large also. When an
aeroplane passes an observer at high speed (v large) and at a
short distance (d small) the effect is somewhat sensational, since
dN'/dx=Nv/cd is then very great.
Observer, Source, and Medium in Motion - In the cases just
considered the medium and either the source or the observer were
at rest. Let v now represent the velocity of the source relative
to the medium (v indicating that component of velocity in a direc-
tion towards the observer). Also let u represent the velocity
with which the observer is moving (relatively to the medium)away from the source, i.e. in the same direction positive as v.
Then the wave-length will be
A' :
N
and the apparent velocity c'=(c—u). Consequently the observed
frequency will be
N'=f-'=N— ... (8)A c—v
(Note.—The minus sign in the numerator of the expression on
the right arises from the fact that the velocity of the observer is
in a direction away from the source.) It is more convenient
perhaps to express (8) in terms of velocities relative to some ' fixed
'

DOPPLER EFFECT 339
body—for example, the ground. We must therefore substitute
for u and v the values (u —w) and (v' —w) where v' , u' > and w are
the velocities of the source, observer, and medium relative to the
ground, c being the velocity of sound relative to the medium.
Thus the observed frequency
c—u -\-wN"=N
,... (9)c—v -\-w
When u' and v' are the same in magnitude and direction the fre-
quency is unchanged whatever the velocity of the medium. Anyrelative motion between observer and source, giving u' and v'
different values, will result in a frequency change which is affected
also by the motion of the medium. The effect produced by the
latter is equivalent to a change in the velocity of sound. A wind
in the same direction as the sound lessens the change of pitch due
to the motion of the observer and source.
The principle of change of apparent frequency by relative
motion is due to Doppler, who first applied it to the changing
colour of certain stars as they approached or receded in the line
of sight. The Doppler effect, as it is called, is not unfamiliar in
these days of high-speed traffic. Interesting hypothetical cases of
sources and observer moving with velocities greater than that of
sound will be left to the ingenuity of the reader. Rayleigh {Sound,
2, p. 154) instances a case in which a high-speed observer (u=2c)
listening to a musical piece hears it in correct time and tune but
backwards. The onde de choc and the shriek of high-speed bullets
serve as further examples for consideration.
The Doppler effect has been demonstrated, and the principle
verified in a number of ways. In the earliest recorded experi-
ments Buijs Ballot * and Scott Russell observed the changes of
pitch of musical instruments carried on locomotives. A labora-
tory method devised by Mach f employed a whirling tube with a
whistle at one end, air being supplied to the whistle along the
axis of the tube. An observer in the plane of rotation could hear
a rise and fall of pitch as the whistle approached and receded.
Konig J used two tuning-forks, giving a few beats per second whenstationary. If one of the forks were made to approach towards
or recede from the ear whilst the other remained at rest, the
number of beats per second was changed in accordance with
Doppler's principle. A similar instance of this was recently
* Pogg. Ann., 66, p. 321.
f Pogg. Ann., 112, p. 66, 1881, and 116, p. 333, 1862. % Loc. cit.

34© EXPERIMENTAL STUDY OF WAVE TRANSMISSION
demonstrated by S. R. Humby * at A. O. Rankine's suggestion.
Two telephone earpieces were actuated simultaneously at a high
frequency from the same oscillating valve circuit. A sensitive
flame was used to detect the high-frequency vibrations. Whenone of the telephones was moved towards or away from the flame,
the ' beat ' frequency was shown clearly by the fluctuating response
of the flame. In carrying out such an experiment, care must be
taken to avoid complications due to stationary waves or inter-
ference effects.
Experimental Study of Wave Transmission
Many of the so-called 'optical' characteristics of sound to
which we have referred may be studied on a laboratory scale
provided the wave-lengths employed are sufficiently small. It is
unnecessary to refer again to the many beautiful experiments of
this nature which may be performed by means of high-frequency
sound waves in air and in water (see reference to R. W. Boyle
and others f ). For many purposes, the methods which we shall
now consider are convenient and instructive, and are applicable
to complex as well as to simple 'optical' cases. With the object
of studying the reflection of waves from typical mirrors, model
sections of buildings, etc., much use has been made during
recent years of two relatively old methods. The 'spark pulse'
and the ' ripple ' methods have both proved extremely convenient
in the lab orator}7 as a means of following the progress of a wave
from its initiation to any subsequent moment.
Spark-Pulse Photography - When a small intense electric
spark is produced in air, a thin spherical pulse in which the mediumis highly compressed spreads outwards from it. The high-
pressure layer forming the wave-front has a density and a refractive
index considerably greater than that of the undisturbed mediumat normal pressure. Two different processes have been devised
to photograph the wave-front, both of which make use of this
change of refractive index and employ a second spark to illuminate
the pulse produced by the first. These are known as the
'Schlieren' and the 'Shadow' methods. As the latter method
is simpler, it will be described first.
(a) The Shadow Method of Dvorak J is illustrated in principle
in fig. 105. Actually this represents diagrammatically the appar-
* Loc. cit.
t See, for example, F. L. Hopwood, Journ. Sci. Instrs., Feb. 1929.
X Ann. der Phys., 9, p. 502, 1880.

SPARK-PULSE PHOTOGRAPHY 34i
atus used by A. H. Davis at the National Physical Laboratory,*
which is an improvement on that described by Foley and Souder.f
The principle of the method is briefly as follows. The sound
pulse is produced by an intense electric spark, the 'sound spark,'
followed by a second spark, the 'light spark,' at a known short
interval of time. The highly compressed envelope of the sound
pulse casts a shadow, when illuminated by the light spark, on a
ground-glass screen or a photographic plate. As shown in the
figure, an electrical machine capable of generating 100,000 volts
charges two sets of leyden jars connected to trigger spark gaps.
Llcjhf Spark Sound Spark Lfahf Piahf Box
Phofbgraphic
Plate
Electrical Machine
C C Tricjqer Spark Gaps
lars
EarthFig. 105
(From Davis and Kaye, Acoustics of Buildings)
When the glass plates, shown in fig. 105, are inserted in or removed
from the gap, the condensers are discharged through two spark
gaps marked ' sound spark ' and ' light spark.' These are arranged
in a long blackened box as shown, in line with a viewing screen
or the photographic plate. The slight delay which is required
between the sound spark and the light spark is controlled bymeans of the condenser C3 across the gap of the light spark. Thelatter is formed between two magnesium wire electrodes within
a small capillary tube, a point source giving good definition
being thereby obtained. The magnesium electrodes give a
very brilliant and photographically active light spark. A liquid
* See Davis and Kaye, Acoustics of Buildings, p. 32 (Bell), and Journ.Sci. Instrs., 3, p. 393, 1926. f Loc. cit.

342 EXPERIMENTAL STUDY OF WAVE TRANSMISSION
rheostat R is used to control the longer time-intervals, although
the sparks are reduced in intensity. The sound spark-gap is
arranged at a suitable point inside the reflecting surface which it is
desired to study. Light from the sound spark is prevented from
reaching the photographic plate by projecting discs mounted on
the electrodes. To obtain photographs which show the progress
of the sound pulse, a succession of exposures is made with a
graduated series of time-intervals, obtained by varying the
condenser C3 and the rheostat R. The principle of the shadow
method has been used by C. V. Boys * and others to photograph
rifle bullets in flight, and by Quayle,f Foley and Souder,J
and others to photograph sound pulses from sparks. Photo-
graphs of reflection and diffraction phenomena obtained by
Foley and Souder by this method are shown in figs. 71 and 82.
It is interesting to note in connection with these shadow photo-
graphs of a pulse of compressed air, that the shadow of a spherical
pulse always appears as a bright circle accompanied by a dark one.
Whether the bright circle is inside or outside depends on whether
the sphere is of greater or less density than the surrounding
atmosphere. The shadows of jets of hydrogen and carbon dioxide
in air are respectively darker and lighter than the background^
(b) The Schlieren Method - Topler's|| method is essentially an
ingenious application of a device due to Foucault for testing lenses
or mirrors for chromatic and spherical aberration. ^} Light from a
suitable source is brought to a focus, by means of a concave mirror,
on to the object-glass of a telescope (or a photographic camera),
and the latter is focussed on the mirror, the view in the telescope
being the surface of an illuminated mirror (see fig. 106). If nowan opaque screen be drawn gradually across the object-glass of the
telescope until it enters the focus of the light from the mirror,
the image becomes darker and darker as more and more light
is cut off, and ultimately a critical position will be reached whenthe mirror appears quite dark. In this position the screen
covers a little more than half of the object-glass. Actually
the screen is set a little in advance of this position so that
about half of the object-glass is covered. It is important that
the mirror should be of good optical quality, otherwise its im-
* Nature, 47, pp. 415, 440, 1893.
f Journ. Frank. Inst., 193, p. 627, 1922.
X Phys. Rev., 35, p. 373, 1912 ; 14, p. 143, 1919 ; 20, p. 505, 1922.
§ See Payman and Robinson, Safety of Mines Research Board, PaperNo. 18. || Pogg. Ann., 131, p. 33, 1867. See also note above.
H See Edser, Light, pp. 98 and 99.

SCHLIEREN METHOD 343
be in the
perfections wiH be revealed in the telescope or the camera, as
Foucault originally intended. Since each point of the mirror
has its corresponding position in the image, if the path of a ray
be deflected at any particular point, the screen wil
critical position for all points
except that one. Provided the
deflection is in the right direc-
tion, the ray of light will pass
beyond the edge of the screen
s into the lens and a bright
image will be formed in its
true position. It will be seen
therefore that a pressure pulse passing in front of the mirror in the
direction AB (see fig. 106) will result in a corresponding band of
light across the image which
will therefore represent the
shape of the advancing pres-
sure pulse. If the latter passes
some distance in front of the
mirror, as at AB, the telescope
must be focussed on that
plane whilst pointing directly
at the mirror. Using a lens in-
stead of the mirror, Topler ob-
tained excellent photographs of
the pressure pulse from an
electric spark, similar to those
obtained by Dvorak's shadowmethod. These experiments
were continued by his son* and
extended by Machf and others.
R. W. Wood J used the methodto illustrate the focussing of a
beam of light by a concave
mirror. Allen § and Cranz||
used the Schlieren method for
Fig. 107—Schlieren Photograph of Ex-plosion Pulse emerging from Tube(Payman and Robinson)
(By courtesy of Safety in Mines Research Board)
the photography of flames, whilst the latter also photographed the
pressure waves emanating from bullets in flight (see fig. 78).
* Ann. der Physik, 27, pp. 1043, 1051, 1908.
t Ann. der Physik, 159, 330, 1876 ; 41, p. 140, 1890.
X Phil. Mag., 48, 218, 1899 ; 50, p. 148, 1900.
§ Proc. Roy. Phil. Soc. Glasgow, 33, p. 71, 1902.
||Lehrbuch der Ballistik, 2, Berlin, 1926.

344 EXPERIMENTAL STUDY OF WAVE TRANSMISSION
More recently W. Payman and W. C. F. Shepherd * have madeexcellent use of the method in photographing the explosion
impulse emerging from the mouth of a steel tube when various
gas mixtures and detonators were fired in it (see fig. 107). Asin the shadow method, a timed light spark was used to illuminate
the field of view after the formation of the pressure pulse. In
a further investigation a continuous record of the movement of
the wave (see fig. 108) was obtained by using a continuous
source of illumination (an arc) instead of an instantaneous spark
discharge of a leyden jar. A special ' wave-speed ' camera, giving
an effective time of exposure of 10~5 second, was designed for the
purpose. The photographs provided direct information relative
to the velocity of the wave-front as it proceeded from the mouthof the tube (see p. 266). Specimen photographs obtained by the
Schlieren method are shown in figs. 107 and 108.
i'-r*
1 r
20cm. 10cm.Distance from Tube
Fig. io8—Schlieren Photo of Pressure Wave (Payman, Shepherdand Robinson)
(By courtesy of Safety in Mines Research Board)
Ripple Tank Method - Results of a similar character may be
obtained by means of the ripple tank. Tyndall made use of the
analogy of ripples on the surface of water and mercury to illus-
* Safety of Mines Research Board, Papers 18 and 29, 1926.

RIPPLE TANK 345
trate the principle of superposition and the interference and
reflection of sound waves.* Later, J. H. Vincent f obtained ex-
cellent photographs of ripples in a small wooden trough contain-
ing mercury, and demonstrated the various ' optical ' phenomena of
wave motion—reflection, refraction, interference, and diffraction.
Kelvin X has shown that the velocity V of waves on the surface of
an inviscid, incompressible liquid under the action of gravity gand surface tension T is given by
Hb+^r- • • • «where p is the density of the liquid and A the wave-length. WhenA is large, the waves are controlled mainly by gravity and the
velocity approximates to VgX/2Tr. On the other hand, when A is
small, the influence of surface tension predominates and Vbecomes V2irT/p\. Solving (1) for A in terms of V, it is found
that for no wave-length can V be less than V =(4T<§
f
/p)i
. Thevalue of A corresponding to the minimum velocity is \ =2iT(T/gp) i
,
1 /4<^
3p\
i
and the critical frequency N is consequently — (-=—
J. Kelvin
defines a ripple as a wave whose length is less than that of a wavewhich is propagated with the minimum velocity. In order to
obtain true ripples, therefore, it is necessary to use vibration
frequencies above a certain value. For ordinary mercury (T being
300 to 400 C.G.S. units) waves less than 1-3 cm. long are ripples,
a frequency of about 15 p.p.s. producing the longest waveswhich may be regarded as ripples. Frequencies of 200 p.p.s.
and upwards therefore give rise to true capillary ripples controlled
by surface tension only. In water (/o=l, T=76) we find the
limiting velocity V =23T cm./sec, A = l-71 cm., and N = 13-6.
Lamb § has shown mathematically that the equations of motionof gravity waves on the surface of a liquid are closely analogous to
those for cylindrical waves of sound. More recently A. H. Davis||
has pointed out, in the case of ripples in a small tank, that the
analogy loses its generality, for the velocity of sound is independentof wave-length, whereas in the case of ripples there is a definite
dependence upon wave-length. Provided, however, the depth
* Sound, Lecture 7. He refers also to Weber.f Phil. Mag., 43, p. 17, 1897 ; 45, p. 191, 1898, etc. (loc. tit.).
X Phil. Mag., 42, p. 375, 1871.
§ Hydrodynamics. Arts. 172 and 189.
|| A. H. Davis, Phys. Soc. Proc, 50, p. 75, 1925.

346 EXPERIMENTAL STUDY OF WAVE TRANSMISSION
of liquid is greater than one-half the wave-length of the small,
simple, harmonic ripples, the analogy is still perfect. Evenimpulsive ripples, in spite of the accompanying subsidiary
wavelets, bear a striking resemblance to impulsive sound waves.
The comparative photographs of a ripple and a sound pulse
reflected from a hemicylindrical mirror (see fig. 109 (Davis)) are
(a) Spar] (b) Ripple
Fig. 109—Comparison of Spark and Ripple Reflections from concave Surface(Dr. A. H. Davis)
sufficient proof of this. The ripple pulse is produced by a round-
headed dipper which is suddenly withdrawn from the water
by means of an electromagnet. To prevent confusion due to re-
flections from the ends of the ripple tank, a ' shelving beach ' is
fitted which rapidly damps out the vibrations of the incident
waves. This property of a beach was pointed out by J. H.
Vincent. When continuous ripples are required, a style attached
to one prong of an electrically maintained tuning-fork (say
50 p.p.s.) is used and the ripples are viewed stroboscopically,*
e.g. by using a neon lamp illumination of the same frequency as
that of the tuning-fork—preferably excited through an electrical
contact on the other prong. Davis uses a ripple tank, 3 ft. X 5 ft.,
containing 2 in. of water, the bottom of the tank being of plate
glass. Intermittent illumination is obtained by means of an arc
and stroboscopic sectored disc driven by a phonic motor con-
trolled by the tuning-fork. The light from the arc 10 ft. distant
is passed vertically upwards through the glass bottom of the
tank, and casts a shadow of the ripples on a horizontal screen
suitably mounted about 5 ft. above. With the stroboscopic
arrangement the ripples appear stationary and are easily photo-
graphed. A 'slow motion' may be given to the appearance of
* See Rayleigh, Sound, 2, p. 345, and Collected Papers, 3, p. 383.

BULLET PHOTOGRAPHY 347
the ripples by driving the sectored disc independently at a speed
slightly different from that of the fork. The ripple tank method
has the advantage over the spark methods of demonstrating
visually the actual progress of waves. It is easily and quickly
adaptable to illustrate a wide variety of wave phenomena.*
Refraction effects are obtained by varying the depth of the water
in the tank (i.e. by varying the wave-velocity) ; reflection and
diffraction by introducing suitably shaped obstacles in the path
of the waves. The method has been extensively applied to a
study of reflections from complex structures such as model
sections of auditoriums, but we shall have to refer to this question
again in dealing with the acoustics of buildings (see p. 484).
Davis has used a kinematograph camera to photograph the
complete progress of a wave. He has also illustrated the trans-
mission of sound waves through Quincke filters (see p. 190),
curved conduits (such as loud-speaker horns), and vibrating
partitions.f In the case of the curved horn, the ripple method
revealed a pronounced stationary vibration (transverse to the
axis) at a certain bend in the horn, indicating that the bend was
behaving as a wave-filter over a moderate range of frequency.
J
At other frequencies the waves emerged freely from the flare of
the horn.
Bullet Photography - A method which has occasionally
been used to demonstrate wave phenomena (reflection and
diffraction) employs the highly compressed 'bow-wave' from a
flying bullet. A spark shadow photograph is taken of the bullet,
or rather its accompanying wave, in its flight past the object to be
studied. Thus an early photograph by C. V. Boys shows an
excellent reflection of the pulse from a plane obstacle in its path.
The photographs in fig. 82 by Cranz, showing the reflection of
bullet waves from two parallel planes, require no additional ex-
planation. As a method of studying wave transmission, however,
it is, of course, far less convenient than the other two methods
just described.
* See Davis and Kaye, Acoustics of Buildings ; and Bragg, World ofSound (Bell).
f Phys. Soc. Proc, 40, p. 90, 1928.
X See also A. L. Foley, Phvs. Rev., 20, p. 503, Dec. 1922.


SECTION IV
RECEPTION, TRANSFORMATION, ANDMEASUREMENT OF SOUND ENERGY
The manner in which sound energy is abstracted from the mediumthrough which it is passing is dependent on a wide variety of
circumstances. The choice of a 'receiver' of the wave energy
will depend, for example, on (a) the character of the sound wave
itself, involving considerations of wave-form, frequency, and
amplitude; (b) the nature of the medium which transmits the
wave, questions of radiation resistance, density, and velocity being
involved; and (c) the ultimate object for which the sound energy
is required, this aspect of the question involving the transforma-
tion of the energy of sound waves into a more convenient form.
A comprehensive classification of sound receivers on these lines is
practically impossible, for in many instances a number of con-
ditions must be simultaneously fulfilled, and the most suitable
receiver cannot be classified in one particular group. Before
dealing in detail with particular types therefore a few remarks on
receivers in general may not be out of place. It is clear that a
sound receiver which is sensitive in air may be quite unsuitable
for use in another medium, such as water or earth. Sounds
differing widely in frequency, say 50 to 50,000, require entirely
different treatment. If the sound is to be employed in long-range
signalling it is important that the receiver should be sensitive to
very weak signals at extreme ranges. This raises the question of
tuning the receiver to the frequency of the sound wave used to
transmit the signals. In such cases a knowledge of the resonant
frequency and the degree of damping is important, whilst dis-
tortion of wave-form is a secondary consideration. In certain
circumstances, however, when a faithful record or reproduction
of the sound is required, energy and sensitiveness are subordinated
to faithfulness in the reproduction of wave-form. A resonant
receiver would be useless, or at any rate very undesirable, for such
a purpose. We have therefore to distinguish between resonant
and non-resonant receivers where sensitiveness and faithfulness
are respectively of primary importance. Similarly we may require
to distinguish between pressure and displacement receivers according
349

350 CLASSIFICATIONS OF SOUND RECEIVERS
as the sensitive element {e.g. some form of ' microphone ') is placed
at a point of maximum pressure fluctuation and minimum dis-
placement or vice versa.
With certain reservations, it may be said that all forms of sound
receiver require the introduction of an obstacle in the path of the
sound waves. The receiver must either partake of, or otherwise
influence, the motion of the particles of the medium or must respond
in some way to the pressure variations on its surface. Thereceiver, regarded as a rigid obstacle, must reflect some of the
incident energy in the ordinary way, and, regarded as a vibrator,
it must re-radiate a certain proportion of the energy which excites
it into vibration. If, however, the receiver is to fulfil its purpose
efficiently, a reasonable proportion of the incident sound energy
must be absorbed and converted into another form of energy most
convenient for the purpose in view. This conversion of energy
may, for example, be a direct mechanical transformation of
longitudinal vibrations into transverse vibrations, as when sound
waves in air fall on a diaphragm. Such a transformation may be
followed by a conversion of mechanical energy into electrical or
thermal energy. In sound reception we have therefore to con-
sider (a) the transformation of one form of mechanical motion into
another form, and (b) the transformation of mechanical into
electrical or thermal energy. The simplest example is the ordin-
ary telephone 'transmitter.' * Longitudinal vibrations from the
mouth of a speaker are converted into transverse oscillation of the
diaphragm. These in turn affect a microphone and set up corre-
sponding electrical oscillations. The converse process takes place
at the ' receiver ' end of the telephone line.
A distinction is sometimes made between electrical sound
receivers which convert sound energy directly into electrical
energy (analogous to a dynamo) and those in which the conversion
is indirect (analogous to a relay); these are exemplified respec-
tively by the electromagnetic telephone and the carbon granular
microphone.
Another type of mechanical transformation is sometimes
utilised when it is required to increase or reduce the displacement
or pressure amplitude of a vibrator. This is a true transformer
action analogous to the electrical transformation of current and
voltage. As we shall see, numerous examples of the application
* The term transmitter in this case is used to imply electrical trans-
mitter—actually the transmitter is a receiver of sound waves, and vice
versa.

THE EAR 351
of this principle are to be found in sound producers and receivers,
e.g. in the gramophone sound-box and in various signalling devices.
Mechanical 'amplifiers' (or reducers), such as mirrors, trumpets,
or resonators, or electrical amplifiers (microphones and valves) are
also available for similar purposes.
Metrical forms of sound receiver such as the Rayleigh disc and
the sound pressure radiometer form another class of 'receivers,'
which might also include the various 'phonometers,' hot-wire
microphones, and piezo-electric devices. When sound vibrations
are to be recorded as directly as possible, various optical devices
may be utilised. The vibrations of a diaphragm on which the
sound falls may be recorded optically by means of a minute
tilting mirror. Vibrations of the medium may be recorded still
more directly by means of such devices as optical interferometry,
sound-shadow photography, or by means of sensitive flames.
The above remarks will be sufficient to indicate the difficulty
of attempting a broad classification of sound receivers.
THE EAR
In order of importance the human ear is the foremost of all
receivers of sound. This 'organ of hearing,' as it is sometimes
called, has a marvellous range of frequency and sensitivity; it
can appreciate vibrations of frequency varying from 20 to 20,000
periods per second, and can distinguish changes of intensity
over a range of 10 12 to 1. The ear with its associated nerve-
endings has also remarkable powers of analysis, being able to
resolve qualitatively a complex note into its Fourier components,
and to discriminate between a number of different sounds at the
same time. Before proceeding to deal with the structure of the
ear and the mechanism of hearing, it will be well to refer to a
number of experimental observations which must be explained
on any theory of audition.
Sensitivity of the Ear to Changes of Intensity and Fre-
quency. Weber-Fechner Law - The physical stimulus, or
intensity, which produces the sensation of loudness is, as we have
seen on p. 54, proportional to the square of the product of ampli-
tude and frequency, when the vibration is simple harmonic. If
the frequency is constant, then the intensity is proportional to the
square of the amplitude of vibration. The measure of the sensa-
tion of loudness, however, is not so easy to define. The diffi-
culty may be circumvented in a manner indicated by Weber's law-

352 THE EAR
" The increase of stimulus to produce the minimum perceptible
increase of sensation is proportional to the pre-existing stimulus."
That is, commencing with a certain sound intensity the increase
of intensity SE which produces a noticeable change of sensation SS
may be measured. From Weber's law Fechner derived the
relation SS=&SE/E or S=&logE, where S is the magnitude of
the sensation, E the intensity of the stimulus, and k a constant.
Although it is not possible to measure S directly, it is not difficult
to determine the ratio SE/E as a function of intensity E. In
certain experiments by F. B. Young and the writer,* in which
sounds of moderate intensity were compared, it was found that
the value of SE/E at a frequency of 580 p.p.s. was approximately
0-10 under favourable conditions, i.e. in the absence of extraneous
noises. V. O. Knudsen,f in an experimental investigation of the
Fechner-Weber law, determined the sensitiveness of the ear to
changes of intensity and frequency N. For the purpose, a
telephone receiver actuated from a valve oscillator, of wide range
of power and frequency, was used as a source of sound. Theintensity or frequency could be varied periodically, about once
a second, by changing automatically the resistance or capacity
in the oscillating circuit. The method of observation was to
change SE or SN continuously until the ear could only just
distinguish the variation. Independent experiments with the
telephone receiver showed that the sound energy emitted was
proportional to the electrical input. The latter therefore served
to measure the relative sound intensities at a fixed frequency.
The frequency scale was determined by calibration. The experi-
mental curves obtained for various values of E and N, indicated
an agreement with a modified form of the Weber-Fechner law,
as proposed by Nutting J for the eye, namely,
where E is the 'threshold' intensity and k=0-10 approx. Theexponent m varies somewhat with frequency, being 1-65 for 200
p.p.s. and 1-05 for 1000 p.p.s., but at the same loudness level, e.g.
10,000 E , the ratio SE/E is nearly independent of frequency,
showing only a 10 per cent, variation from 100 to 3200 p.p.s.
For moderate and large intensities (E much greater than E ), the
* Proc. Roy. Soc, 100, pp. 264 and 266, 1921.
t Phys. Rev., 19, p. 261, 1922, and 21, p. 84, 1923.
X Bureau of Standards Bull., 3, No. 1. 1907.

SENSITIVITY 353
expression reduces to SE/E=/<=0T0 at any frequency, a result
which agrees with that of Young and the writer. At a frequency
near 1000 p.p.s. it was found that the normal ear could distinguish
about 400 gradations or ' steps ' of loudness between the threshold
and a painful intensity 10 12 times as great.
As regards frequency sensitivity, at the same intensity (or loud-
ness level), Knudsen found that the ratio SN/N diminished from001 at 55 p.p.s. to 0-003 at 600 p.p.s., remaining constant at this
value up to a frequency of 3200 p.p.s. This result refers to dis-
crimination between two sounds of slightly different frequency (SN)
sounded independently. The frequency sensitivity of the ear is of
course much better than this if the two sounds are excited simul-
taneously, a frequency difference of 1 in 20,000 being detectable by1
beats.' Observations of a similar nature to those of V. O. Knudsenhave been made by H. Fletcher and R. L. Wegel # using a
valve-actuated air-damped telephone receiver over a frequency-
range 60 to 6000 p.p.s. By means of a specially constructed
attenuator the current entering the telephone could be varied
about three millionfold by turning a dial switch. The arrangement
was carefully calibrated so as to give alternating air pressure on
the ear cavity in terms of the indications of the dial switch. Acurve representing an average of 93 normal ears, which gives
the pressure fluctuation hp required to produce a perceptible
change of sensation at different frequencies, shows that Sp=0-l
dyne/cm. 2 at 60 p.p.s., falling to a minimum Sp =0-0007 dyne/cm. 2
at a frequency of about 2000 p.p.s. Careful observations mademore recently by R. R. Reisz f are in general agreement. Hefinds that Weber's law SE/E =constant holds true for moderate
intensities, and that as a function of frequency it reaches a minimumvalue at about 2500 p.p.s., the minimum being less sharply defined
at high intensities than it is at low. The maximum sensitivity
of the ear to detect slight differences of intensity therefore occurs
at a frequency near 2500 p.p.s. Reisz finds that the ear can
detect the greatest number of gradations of loudness, viz. 370, at
a frequency of 1300 p.p.s. A very instructive diagram, see fig.
110 (a), has been obtained by Wegel, J indicating the range of the
average human ear with respect to intensity and frequency. Theupper curve in the diagram represents a more or less arbitrary
* Nat. Acad. Sci. Proc., 8, p. 5, 1922.
f Phys. Rev., 31, p. 867, May 1928. See also Steinberg, Phys. Rev.,
26, p. 507, 1926 ; F. W. Kranz, Phys. Rev., 22, p. 66, 1925 ; and Kings-bury, Phys. Rev., 29, p. 588, 1927.
X Bell System Techn.Journ., 1, Nov. 1922.
23

354 THE EAR
upper limit to the range of auditory sensation. It may be regarded,
in fact, as the 'threshold of feeling* at which the loudness is so
great that the effect is somewhat painful, and further increases
of amplitude are not perceived as increases of loudness. Thelower curve represents the
104
^3C^ 10S 2
£ 101
^10"
^esholtf offe
f««
s"
\
\\
(a)
1
1
N A1
/
k%I
/
M&mi //' t Ds
Frequency (log?)
Fig. iio (a)
sity.
other extreme, or the lower
limit of amplitude at which a
sound can be detected. Thearea enclosed between the two
curves, from the threshold
of audibility to the thres-
hold of feeling, has been
described as the 'auditory
sensation area.' * Outside
this area sounds are not
'heard' whatever the inten-
This does not mean that they are always unperceived,
for large amplitude vibrations may be felt at very low fre-
quencies, the ear in these circumstances behaving like a simple
pressure indicator. The infrasonic waves to which Esclangon frefers, in connection with the pressure-wave from the mouth of a
gun (' onde de bouche ') may have a sufficiently large amplitude to
affect the ear, in spite of the fact that the frequency is of the order
of 1 p.p.s. only. At the other extreme also, powerful supersonic
waves of sufficiently great inten-
sity may be felt rather than heard.
The sensitiveness of the ear is
shown graphically in fig. 1 10 (b) as
a function of frequency. The or-
dinates, expressing sensitivity, are
the reciprocals of the minimumamount of energy (in ergs/cm. 2
sec.) required to produce an aud-
ible sound, the abscissae represent
the values of frequency plotted
logarithmically. There appears to
be general agreement in the state-
ment that the maximum sensitivity
of a normal ear occurs at a frequency near 2000 to 2500 p.p.s. At
this frequency, Fletcher and Wegel have found that the ear can
* See H. Fletcher, Bell System Techn. Journ., 4, p. 375, 1925
Speech and Hearing (Macmillan). t Loc. cit.
JMO
-10'
iio7
10k
-b
o M. Wiena Fletcher & Wegela F. N. Kranz• Swan
I I
100 400 1600 6400Frequency (logarithmic)
Fig. iio (b)
and

ABNORMAL HEARING. MASKING 355
respond to a pressure-amplitude of the order of 10~ 3 dyneIcm.2 or
10-9 of an atmosphere. In air this corresponds to a displace-
ment-amplitude of 10" 9 cm., which is about ]/30th of the
diameter of a molecule of oxygen, or about 10~4 of the mean free
path of the molecules in air at N.T.P. It is interesting to note
that Rayleigh # obtained a value of minimum condensation
audible 5=4-6 xlO-9 by observing the period of time t that the
vibrations of a tuning-fork (384 p.p.s.) can be heard. From a
knowledge of the initial amplitude of the fork (at t=0) and the
exponential decay constant (the ' log dec. ') of its vibrations, the
amplitude after a time t is readily calculated. Similar results
were obtained by Wien f by an entirely different method.
Abnormal Hearing. Masking Effect of Other Sounds - Theobservations mentioned above refer only to 'normal' ears under
ideal conditions of test. It is evident that the lower curve of
fig. 110 (a) may have to be raised considerably if the observer
is somewhat deaf, a greater pressure amplitude being required in
this case to reach the threshold of audibility. Experiments by
J. P. Minton J not only demonstrate this effect, but also show
that in certain cases of nerve deafness a person may be absolutely
deaf to a certain limited range of frequency, whilst remaining
sensitive to other frequencies (analogous to colour blindness).
Minton has obtained audibility curves (1) for normal ears, (2) for
ears diseased only in the middle ear, (3) for ears diseased only
in the internal ear, and (4) combinations of (2) and (3). Theresults appear to have an important bearing on theories of audi-
tion. Abnormality in the conditions of tests may also modify
the normal curve considerably. It is obvious that the presence
of extraneous noises during the test will reduce the apparent
sensitivity of the ear and raise the threshold curve of audibility.
Measurements of this nature have been made by R. L. Wegeland C. E. Lane,§ a telephone receiver being supplied with current
of two different frequencies of adjustable intensities. The amountof 'masking' by tones of frequency 200 to 3500 p.p.s. was deter-
mined for frequencies from 150 to 5000 p.p.s. The magnitude
of a tone was taken as the logarithm of the ratio of its pressure
to the threshold value, and masking was taken as the logarithm
of its threshold value with masking to that without. The curves
of masking as a function of magnitude were found to approximate
to straight lines. Except when the frequencies were so close
* Sound, 2, p. 439. f Wied. Ann., 36, p. 834, 1889.
X Phys. Rev., 19, p. 80, 1922. § Phys. Rev., 23, p. 266, 1924.

356 THE EAR
together so as to produce beats, the masking was greatest for
tones nearly alike. When the masking tone was loud it maskedtones of higher frequency better than those of frequency lower
than itself; there was little difference, however, if the masking
tone was weak. At intensities considerably above minimumaudibility they found that there was no longer a linear relation
between the sound pressure and the response of the ear, this
non-linearity accounting for the combination tones and 'subjective
overtones' observed in certain cases. H. Fletcher* has also
made experiments on the masking effect of one tone on another,
and has found, contrary to statements by A. M. Mayer,f that
higher tones may mask lower ones. This problem of masking
is not only of importance in relation to theories of hearing, but
has a very wide, practical significance in telephony and signalling
in general, where it is often necessary to listen intently to a
particular sound in the presence of other disturbing noises.
Perception of Quality and Pitch - A fundamental law in
physiological acoustics was formulated by Ohm J (the author of
Ohm's law in electricity), in the statement that the ear recog-
nises as pure tones only those due to simple harmonic vibrations,
and that it resolves any other complex vibration into its harmonic
components, perceiving them as a summation of pure tones.
This amounts to saying that the ear is capable of analysing a com-
plex tone into a Fourier harmonic series of simple tones. As
everyone is aware, the ear is particularly sensitive to that character-
istic of a sound which we call quality, which depends essentially
on the number, intensity, and distribution of the harmonic
components into which a sound can be analysed. Notes of the
same pitch from a tuning-fork, a violin, a piano, a clarinet, and
an organ are, to the ear, entirely different in quality and are
instantly recognisable. Using such a wide selection of 'quality'
in sounds, H. Fletcher § has recently made experiments on the
effects of cutting out certain harmonic components. He used
a telephone system to reproduce the sounds, and electrical filter
circuits (see p. 457) to eliminate any desired frequency-range.
As a result of his observations he claims to have proved that only
the quality and not the pitch of such musical sounds is changed
when a group of low- or high-frequency components is cut out.
* Frank. Inst, Journ., 196, p. 289, 1923.
f Phil. Mag., 11, p. 500, 1876.
X G. S. Ohm, Pogg. Ann., 59, p. 513, 1843; and 62, p. 1, 1844.
§ Phys. Rev., 23, p. 427, 1924.

PERCEPTION OF QUALITY AND PITCH 357
For example, he maintains that the pitch remains the same whenthe fundamental and the first seven overtones were eliminated
from the vowel ' ah ' sung by a baritone voice at an ordinary pitch.
Ohm's law says nothing about the relative phases of the harmonic
components into which the ear analyses the sound, although in the
Fourier analysis of a complex sound phase relationships are just
as important as amplitudes and frequencies. To examine this
point, Konig # made experiments with double sirens, constructed
in such a manner that the phase of one component sound could
be shifted relative to the other by displacing the 'fixed disc' of
one siren relative to its normal position. His observations led
to the conclusion that the phase effect, if it existed at all, must be
due to secondary causes. Experimenting with a harmonic series
of electrically-maintained tuning-forks, Helmholtz found that
the quality depends solely on the number and relative strengths of
the partial, simple tones, and in no respect on their differences
of phase. Lloyd and Agnew,f by a more refined electrical
method of producing the tones and varying the phases, have
confirmed Helmholtz's conclusion.
Minimum Duration for Identification of Pitch. ' Persist-
ence of Audition.' Aural Fatigue - Experiments by Kohl-
rausch to determine the lowest number of vibrations required to
excite the sensation of pitch, indicated that a fair estimate (within
3 per cent.) may be formed if only two impulses reach the ear.
Listening to musical sounds in a telephone circuit which could
be completed for a known fraction of a second, G. Gianfranceschi Jfound that the minimum duration required for identifying the
pitch was the same for all frequencies, and amounts to 1/40 sec.
A specially trained ear might reduce this period to 0-01 second.
Similar experiments have been made by E. Lubcke § in the case
of a sound of frequency 1000 p.p.s. In air or in water, with a
feeble or strong signal, a sound lasting 9 or 10 periods (0-01 sec.)
was found to be necessary for the production of a definite ' tone-
impression.'
Experiments which have an important bearing on this question
have been made, in an entirely different manner, by Weinbergand Allen.
||A continuous sound issued through a hole in a felt-
* See Rayleigh, Sound, 2, p. 469 ; and Wied. Ann., 14, p. 392, 1881.
f Bureau of Standards Bull., 6, 255, 1909.
X Accad. Lincei. Atti, May 1914.
§ Zeits. Techn. Phys., 2, 1921.
|| Phil. Mag., 47, pp. 50, 126, and 141, 1924.
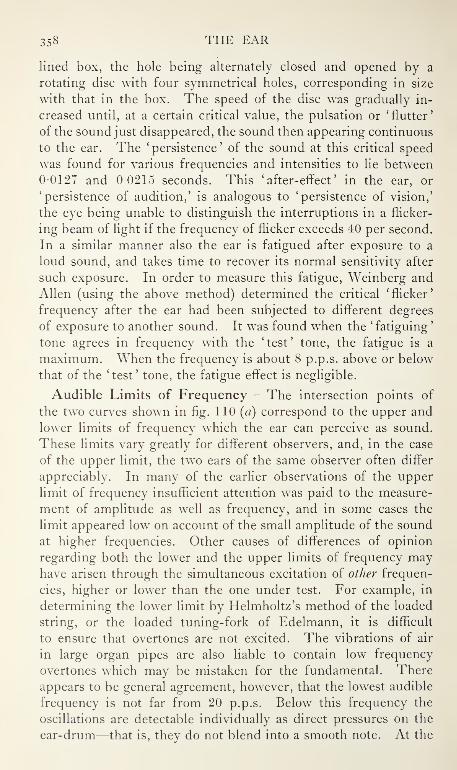
358 THE EAR
lined box, the hole being alternately closed and opened by a
rotating disc with four symmetrical holes, corresponding in size
with that in the box. The speed of the disc was gradually in-
creased until, at a certain critical value, the pulsation or 'flutter'
of the sound just disappeared, the sound then appearing continuous
to the ear. The ' persistence ' of the sound at this critical speed
was found for various frequencies and intensities to lie between0-0127 and 0215 seconds. This 'after-effect' in the ear, or
'persistence of audition,' is analogous to 'persistence of vision,'
the eye being unable to distinguish the interruptions in a flicker-
ing beam of light if the frequency of flicker exceeds 40 per second.
In a similar manner also the ear is fatigued after exposure to a
loud sound, and takes time to recover its normal sensitivity after
such exposure. In order to measure this fatigue, Weinberg and
Allen (using the above method) determined the critical 'flicker'
frequency after the ear had been subjected to different degrees
of exposure to another sound. It was found when the ' fatiguing
'
tone agrees in frequency with the 'test' tone, the fatigue is a
maximum. When the frequency is about 8 p.p.s. above or below
that of the 'test' tone, the fatigue effect is negligible.
Audible Limits of Frequency - The intersection points of
the two curves shown in fig. 110 (a) correspond to the upper and
lower limits of frequency which the ear can perceive as sound.
These limits vary greatly for different observers, and, in the case
of the upper limit, the two ears of the same observer often differ
appreciably. In many of the earlier observations of the upper
limit of frequency insufficient attention was paid to the measure-
ment of amplitude as well as frequency, and in some cases the
limit appeared low on account of the small amplitude of the sound
at higher frequencies. Other causes of differences of opinion
regarding both the lower and the upper limits of frequency mayhave arisen through the simultaneous excitation of other frequen-
cies, higher or lower than the one under test. For example, in
determining the lower limit by Helmholtz's method of the loaded
string, or the loaded tuning-fork of Edelmann, it is difficult
to ensure that overtones are not excited. The vibrations of air
in large organ pipes are also liable to contain low frequency
overtones which may be mistaken for the fundamental. There
appears to be general agreement, however, that the lowest audible
frequency is not far from 20 p.p.s. Below this frequency the
oscillations are detectable individually as direct pressures on the
ear-drum—that is, they do not blend into a smooth note. At the

PERCEPTION OF DIRECTION. BINAURAL AUDITION 359
other extreme of the frequency scale the divergence of opinion
is still greater. Rayleigh * states that bird-calls cannot be heard
above 10,000 p.p.s., although a sensitive flame can still detect
the vibrations up to 50,000 p.p.s. There is no doubt, however,
that the vibrations of short steel bars, electromagnetically excited,
can be heard up to 20,000 p.p.s., and by some persons at fre-
quencies even higher than this. A good average range of fre-
quency for the human ear may be taken as 20 to 20,000 p.p.s.
At very high frequencies, however, the ear loses its power to
discriminate variations of pitch. Electrical wave-filter experi-
ments on the reproduction of speech and music indicate that
frequencies above 4000 or 5000 p.p.s. need not be considered,
for above this frequency the ear is very insensitive and has lost
its power of appreciating pitch. The frequency-range employed
in music extends from about 40 to 4000 p.p.s.
Perception of Direction. Binaural Audition - The charac-
teristics of hearing which we have hitherto considered apply
equally well to one ear alone or to a pair of ears acting as inde-
pendent receivers. One of the most important functions of the
ears—namely, perception of direction—can only be fulfilled
satisfactorily, however, when they are used as a pair. This
instinctive 'sense of direction,' which is so familiar, presents a
scientific problem which is still only partially solved. For the
progress already made towards its solution we are indebted
principally to Rayleigh.f Binaural hearing has been likened bysome writers J to stereoscopic vision, but the analogy is of doubtful
application, for it is possible to estimate with considerable
accuracy the direction of a source of light, using one eye only,
but in the case of sound both ears are necessary. The two eyes
help us to estimate range as well as direction, but the two ears
are incapable of this additional function. An average person
with closed eyes is usually capable of estimating the direction of
a sound within a few degrees, whether the sound be continuous
or of short duration. The directional accuracy is fairly good if
the sound proceeds from the right or the left, but may be in error
by 180° if the sound approaches from behind or in front. Theestimation of direction is usually spontaneous and does not require
a movement of the head.
Intensity and Phase Theories - For high-pitched sounds of short
wave-length these effects might be explained by the difference
* Sound, 2, p. 433. t Sound, 2, p. 440.
X See, e.g., Geiger and Scheele, Handbuch der Physik, 8, p. 538.

360 THE EAR
of intensity of the sound reaching the two ears, the head
acting to some extent as a screen to the ear farther away
from the sound source. At lower frequencies, however, whenthe wave-length exceeds the circumference of the head, the
intensity theory alone cannot explain the observations, for the
directional effect is still good in spite of the fact that the
intensity difference at the two ears must be very small. Regard-
ing the average head as a rigid sphere of radius a, Rayleigh *
has calculated the variation of sound intensity around it for
sounds of wave-length A proceeding from a distant source.
Denoting the front, rear, and side positions by A, B, and Crespectively, the relative intensities are given in the table, where
2ttci is the circumference of the 'head.'
2na/L = 2-0. = 10. = 0-5.
A 0-69 0-50 0-29
B 0-32 0-28 0-26
C 0-36 0-24 0-23
For still smaller values of 2iraj\, the difference of intensities
A and B is given approximately by -( —r—)
, that is, the difference
varies inversely as the fourth power of the wave-length. Regard-
ing the 'head' as a sphere of circumference, 2na=2 ft. at a
frequency of 256 p.p.s., the ratio 27ra/X=0-5, and the difference
of intensities for positions A and B is only about 10 per cent.
—i.e. would be just detectable under favourable conditions.
When N = 128 p.p.s. the difference would be less than 1 per cent.,
and at lower frequencies would be still less. Now the ears are
capable of perceiving sound direction without difficulty at fre-
quencies considerably lower than 128 p.p.s., so the intensity
theory must fail. Rayleigh says, ''When a pure tone of low pitch
is recognised as being on the right or the left, the only alternative
to the intensity theory is to suppose that the judgment is founded
upon the difference of phases at the two ears. But even if weadmit, as for many years I have been rather reluctant to do,
that this difference of phase can be taken into account, wemust, I think, limit our explanation upon these lines to the
cases of not very high pitch. . . . Now it is certain that a
* Nature, 14, p. 32, 1876 ; Phil. Mag., 13, p. 214, 1907 ; and Scientific
Papers, 5, p. 347.

PERCEPTION OF DIRECTION. BINAURAL AUDITION 361
phase retardation of half a period affords no material for a
decision that the source is on the right rather than on the left,
seeing that there is no difference between retardation and an
acceleration of half a period. It is even more evident that a
retardation of a whole period, or of any number of whole
periods, would be of no avail. ... It would seem that at high
pitch (above 512) the judgment is based upon intensities, but
that at low pitch, at any rate below 128, phase differences must
be invoked." Rayleigh found if the same tone were led to the
two ears by different paths, that the sound could be made to
appear to come from ' right ' or ' left ' at will, by adjusting the relative
path length, i.e. by varying the relative phase. The sound was
always stated to be on that side on which the phase is in ad-
vance by less than half a period. This result has been confirmed
by many other observers, but it remains unexplained. G. W.Stewart * has made careful observations of the apparent change
of direction produced (a) by varying the relative intensity at the
two ears of an observer, keeping the phases constant, and (b) byvarying the phase difference and keeping the intensity constant.
In the former case, writing 6 as the apparent direction, and IRand IL the intensities at the right and left ear respectively, it was
found that 9 was approximately equal to k log (IE IL), the 'con-
stant' k decreasing somewhat with frequency for certain indi-
viduals. In series (b) the direction 6 was given by k'S, where
S is the phase difference and k is a 'constant' which is a linear
function of frequency.
Stewart found that the upper limit of the phase- difference
effect lies between 1000 to 1500 p.p.s., and concludes that this
is the most important effect in the localisation of a pure tone
of frequency lying between 100 and 1200 p.p.s. He points out
also that there are more factors in actual localisation than the
theory assumes, for example, reflection and changes of quality
may have an important influence. Above the limit of the phase
effect, 1200 p.p.s., the intensity must become an important factor.
Rayleigh suggested, in explanation of the phase- difference pheno-
mena, that "the nerve processes must themselves be vibratory,
not in the gross mechanical sense, but with preservation of the
period and retaining the characteristics of phase." This view
of the matter raises physiological difficulties. It has been sug-
gested that the phase effects may still resolve into a difference
* Phys. Rev., 15, pp. 425 and 432, 1920. See also Hartley and Fry,Phys. Rev., 13, p. 373, 1919, and 18, p. 431, 1921.

362 THE EAR
of intensity due to interference between the direct and transmitted
vibrations. The latter are supposed by Myers and Wilson * to
pass from one ear to the other through the bones of the head,
the resultant, depending on the phase difference at the ears,
ultimately passing to the auditory or 8th nerve centre in the brain.
Time-difference Theory - Hornbostel and Wertheimer f have
suggested that the directional properties of the ears might be
due to the time difference of arrival of the sound at the two ears.
Their measurements indicate a possible variation from to
6-3 xl0~4 second, as the source passes from the median plane
to a 90° position (directly right or left). The time difference
6-3 xlO-4 second corresponds to a path difference of 19 cms.,
which is not necessarily the distance apart of the ears, but a
constant k in the relation d=k sin <j> where d is the path difference
and<f>the direction-angle which the sound makes with the median
plane of the head. Hornbostel and Wertheimer attempt to recon-
cile this theory to explain the case of continuous pure tones,
which the ears can readily locate even if they were 'stopped'
at the instant when the sound commenced. W. Kunze \ has
pointed out that if the head is immersed in water, when a source
of sound is moved through 180° (from 90° right to 90° left), the
impression is received that the source moves only from about
20° right to 20° left.
An interesting observation made by S. P. Thomson § in 1877
is the production of binaural beats. A sound led into one ear,
through a telephone earpiece, is capable of giving beats with
another sound, of slightly different frequency, led into the other
ear through another earpiece. Combination tones are not pro-
duced under these conditions. This subject has been studied
recently by C. E. Lane,|| who considers the experimental evidence
to indicate that the beats are not due to cross-conduction through
the head, but are of central origin and result from the sense of
binaural localisation of sound by phase. If the beats are slow
they are generally recognised as an alternate right and left locali-
sation, the sound appearing to 'revolve round the head.' Fast
beats (more than one per second) are generally recognised as an
intensity fluctuation.
* Proc. Roy. Soc, 80, p. 260, 1908. See also Bannister, Phil. Mag.,2, 144 and 402, 1926.
f Preuss. Akad. Wiss. Berlin, Ber. 20, p. 388, 1920.
% Phys. Zeits., 22, p. 649, 1921; and Zeits. Techn. Phys., 3, p. 40, 1922.
§ Phil. Mag., 4, p. 274, 1877. See also Stewart, Phys. Rev., 9, p. 502,
1917.|| Phvs. Rev., 26, p. 401, 1925.

COMBINATION TONES 363
Rayleigh's phase theory of hearing involves a principle which
has an important application in the directional transmission and
reception of sounds (see p. 412).
Combination or Sum and Difference Tones - When the
ears are assailed by two sounds of nearly equal frequency N x and
N 2 , the phenomenon of beats (see p. 120) is observed—that is, the
sound appears to have a mean frequency N=(N 1+N 2)/2, fluctuat-
ing in intensity with a frequency (N 2—
N
2). In 1745 Sorge, a
German organist, and in 1754 Tartini, an Italian violinist, dis-
covered independently that the union of two distinct musical tones
sometimes produced a third or 'resultant tone,' which was quite
distinct from either of the primary tones. For a long time it was
supposed that this resultant tone was simply the 'beat tone' of
frequency equal to the difference of the primary frequencies
(N x—
N
2). The discovery by Helmholtz of a second resultant
tone of frequency equal to the sum of the primary frequencies
(N 1+N 2) reopened the question, and the 'beat tone' theory had
to be abandoned. Helmholtz described the combination tones
as the 'sum and difference tones.' It is essential for the satis-
factory production of combination tones that the two primary
tones should be loud and sustained, and that their frequencies
be so chosen that the frequency of the combination tone should
be about the middle of the audible range. Thus to hear a differ-
ence tone two high notes separated by a frequency interval of, say,
400 or 500 p.p.s. should be sounded loudly. The summationtone is more difficult to hear, and it is preferable that low notes
should be used. The writer has observed the difference tone,
600 p.p.s., due to two intense but almost inaudible primary tones
of frequencies 12,000 and 12,600 p.p.s. (obtained by exciting
two small steel diaphragms electromagnetically). Barton * gives
details of methods of observing sum and difference tones whenthe primary tones are produced by different instruments (double
whistle, two fifes, two organ pipes, harmonium, or pianoforte).
To make the combination tone more easily observed he suggests
sounding first that primary which lies near in pitch to the com-bination tone to be produced. As we have seen, when two notes
of the same intensity produce beats, the intensity varies from zero
to four times that of one primary alone, even when the primaries
are feeble. Actually, however, the difference tone is only heard
when both primaries are loud, and even then it is of much smaller
intensity than either of them. The question arises as to the
* Sound, p. 386.

364 THE EAR
objective existence of the combination frequencies of vibration
in the medium itself, it being at least possible that the effect is
entirely subjective, the 'combination' being performed in the ear.
The objective reality of the tones has been demonstrated by manyobservers, by using a sensitive resonator tuned to the expected
tone (Nx—
N
2) or (N^+N^). For this purpose tuning-forks,*
Helmholtz resonators,! and other devices for indicating the
presence of a particular tone have been used. As we shall see,
this does not exclude the possibility of subjective combination
tones also.
Objective Combination Tones - As already stated, it is often
necessary for the production of these tones that the primary sounds
should be loud. In such cases the restoring forces called into
play are not proportional to the displacements, as in small-
amplitude vibrations, but require a term involving the square of
the displacement. In other words, the relation between force
and displacement is not linear, and the displacement due to the
simultaneous operation of two forces is not the simple sum of
the separate effects. Neglecting damping forces, the equation of
motion of a particle of the medium (cf. p. 37) is consequently
of the form
md2x/dt2jr ax Jr^x 2=F1 cosp 1t-\-F 2 cos (pzt— S),
the solution of which is expressed in terms of cos (2/)^), cos (2/> 2f),
cos (/>!—p 2)t, and cos (p1 -\-p^)t. That is, the resultant tone has
component tones which are octaves of the primaries, and also
the sum and difference tones which we are now considering.
The amplitude factors of these tones require Fxand F 2 to be
large, before they are appreciable. This theory is due to Helm-holtz, and is sufficient to explain the principal experimental
observations on objective combination tones.
Subjective Combination Tones - It is not an uncommon cir-
cumstance to observe a difference tone when the primary tones
are relatively feeble. The effect cannot be explained either on
the ' beat tone ' theory or the Helmholtz theory of large amplitudes.
An explanation which appears generally satisfactory has been
given by Waetzmann,J who attempts to reconcile Helmholtz's
theory of combination tones and Konig's theory of beat tones.
He lays stress on the fact that there is not only asymmetry in
* Rucker and Edser, Proc. Phys. Soc, 13, p. 412, 1895.
f Helmholtz, Sensation of Tone; C. V. Boys, Phil. Mag., 14, p. 186,
1882; and Rayleigh, Sound, 2.
X Zeits.f. Physik, 1, pp. 271 and 416, 1920.

DISCORD AND HARMONY 365
the restoring force in the medium vibrating with a large amplitude,
but also there is asymmetry in the ear itself, consisting as it does
of a diaphragm (the drum) heavily and unsymmetrically loaded
on one side by the bones of the ear. As an example of such
effects he records the vibrations of a diaphragm with a central
mass attached to one side only. The free vibrations are un-
symmetrical about the position of zero displacement. When such
a diaphragm is excited by means of two pure tones of different
frequency, for example by means of two tuning-forks, the re-
sultant record is similar to that of beats (see fig. 7, p. 20), but
the curve lies mainly above the line of zero displacement. Theeffect is analogous to that of a poor quality rectifier in an electrical
circuit passing current of two different frequencies. A carbon
granular microphone is, in fact, a convenient means of demon-
strating the asymmetry of motion of a diaphragm; oscillograph
records obtained with such microphones always show this asym-
metry, but the effect is partly due to another cause with which
we are not concerned here. Waetzmann's view of the matter is
therefore that the ear acts as an asymmetric vibrator and a partial
rectifier of the vibrations incident upon the drum. On this view
the various overtones, and sum and difference tones, are all
readily explained.
Discord and Harmony - Before the Christian era the Greeks,
and possibly others before them, studied musical harmony and
discord. Pythagoras made the noteworthy observation that a
string, divided into two vibrating segments, emits sounds which
are more nearly in perfect harmony the simpler the ratio of the
lengths of the two parts, i.e. the combination of two notes is morepleasing to the ear the smaller the two numbers which express
the ratio of their vibrations. Sauveur in 1700 recognised that
" octaves and other simple concords, whose vibrations coincide
very often, are agreeable and pleasant because their beats are
too quick to be distinguished." Helmholtz confirmed this
observation that discords are due to 'unpleasant beats,' the un-
pleasantness arising through fatigue and irritation of the ear. Asin the optical case, a very slow 'beat' or flicker is not irritating,
the ear (or eye) having time to recover between successive stimuli.
At a high rate of flicker the 'persistence' of audition (see p. 358)
is such that the sensation is continuous, in spite of the fact that the
stimulus is intermittent, hence there is no irritation in this case
either. Weinberg and Allen * give values in the neighbourhood
* hoc. cit.

3 66 THE EAR
of 80 per second as the upper limit of the rate of sound flicker
which is detectable, the frequency of the sound being 280 p.p.s.
When the frequency of the flicker lies between these extreme
cases, however, the effect becomes irritating to the auditory nerve,
which is at one moment stimulated very strongly and at the next
moment allowed to recover, but before recovery is complete is
stimulated again, and so on. At frequencies in the neighbourhood
of 500 p.p.s., Helmholtz found that the maximum irritation or
discord occurred at a beat-frequency of 33 per second, the effect
disappearing altogether when this frequency reached about 80 per
second. The harshness or discord produced by two notes of
different frequency depends upon (1) the beat-frequency, (2) the
quality of the sounds, (3) the absolute pitch or sound-frequency
of the notes. With regard to (2) it is not difficult to understand
that beats of irritating frequency may be produced when two
tones, rich in harmonics, are sounded together. Although the
fundamental tones are separated by an interval too great to
produce discord, it frequently happens that certain overtones of
one sound may 'beat' with other overtones of the second sound.
As an example of this we may refer to Tyndall's analysis # of the
tones emitted from two strings, the ratios of whose fundamental
frequencies are 1:2, 2:3, 3:4, 4:5, and 5: 6, the fundamental
tone of one string being always 264 p.p.s. The overtones form
a complete harmonic series in each case. The lowest beat-fre-
quencies between any pair of partials are for these combinations
264, 132, 88, 66, and 53 respectively, indicating that there is no
serious tendency to discord until the ratio of the fundamental
tones reaches 4:5. A tuning-fork vibrating with a small amplitude
at a frequency of 250 p.p.s. will harmonise with another fork
vibrating at any frequency above 350 p.p.s., the beat-frequency
being sufficiently high and tuning-forks free from harmonics.
Similar notes on a stringed instrument, a piano for example,
would be discordant, for the third harmonic (750 p.p.s.) of the
first tone would 'beat' at an irritating frequency (50 p.p.s) with
the second harmonic (700 p.p.s.) of the second tone. Although
the harmony or discord due to two notes depends mainly on their
frequency- ratio and the harmonics present, it is also dependent
on the absolute frequency. Thus 200 and 300 are concordant
whatever harmonics are present; but 100 and 150, the same ratio,
are discordant if the first four harmonics in each are present. In
general, the lower the notes the simpler must be the ratio, or the
* Sound, p. 302.

STRUCTURE 367
fewer the harmonics, to avoid discord. At very high frequencies
beats are rarely noticed. The choice of chords and musical
intervals must recognise the foregoing principles. A considera-
tion of music and harmony would, however, lead us too far astray.
The reader is recommended to consult more specialised text-
books on these subjects.
Structure of the Ear - It is beyond the scope of a book of
this nature to deal at all adequately with a complex anatomical
subject such as the detailed structure of the ear. For further
information a standard textbook of anatomy or physiology
should be consulted. The following remarks must be looked
upon as a guide rather than a description. In human beings
the ' organ of hearing ' is divided anatomically into three principal
parts: the outer, the middle, and the inner ear. The general
arrangement is shown in fig. 111a. The outer ear consists of
the relatively large external
' shell ' or collector which leads TME: HUM^ EA«
into the auditory canal and
thence to the drum ('membrana
tympani'). In the loweranimals the external shell is
provided with muscles and is
very movable, presumably to
collect sounds from different
directions ; whereas in man this(From Bra^%"^/ sound)
function is rudimentary, so that
he can hear almost as well with his ear cut off. The auditory
canal in the average adult has a length from 2-1 to 2-6 cm., a
volume of about 1 c.c, and an opening of 0-3 to 0-5 cm. 2. The
middle ear (or tympanum) is separated from the outer canal by
the drum, a thin layer of fibrous tissue covered with skin ex-
ternally and with mucous membrane internally. Its average
dimensions are 1-00 cm. major axis (horizontal), 0-85 cm. minor
axis (vertical), the area being approximately 0-65 cm. 2. Then
comes the chain of three bones : the hammer (malleus, 23 mg.),
the anvil (incus, 25 mg.), and the stirrup (stapes, 3 mg.), which
stretch across the middle ear and connect the outer auditory
canal to the inner ear. The ' handle ' of the hammer is attached
eccentrically to the inner side of the drum-skin, dragging the
latter slightly inwards. The middle ear leads via the Eustachian
tube to the throat, the tube being normally closed but opening
in the act of swallowing. The object of this connection is clearly

368 THE EAR
to provide a means of equalising the pressure on opposite sides of
the drum-skin, thereby preventing damage due to possible large
variations of pressure. The inner wall of the middle ear presents
two openings known as the oval and the round windows. Theformer opens into the ' vestibule ' of the inner ear and is normally
closed by the base of the ' stirrup ' bone and a marginal membrane.
The round window leading into the 'scala tympani' of the
cochlea is closed by an elastic membrane. The inner ear (the
labyrinth) is highly complex, and contains the nerve-endings
which respond to the vibrations of sound. It connects to the
middle ear via the oval window (end of stirrup) and the round
window. The labyrinth is a bony cavity (200 mm. 3) containing
a membranous labyrinth of similar form filled and surrounded
by lymph {endoXyrcvph inside and perilymph, outside)— a fluid like
water. The cavity consists of three parts : the vestibule (at the
oval window), the semicircular canals (the organ of 'balance'),
and the cochlea (the ' snail shell ' containing the hearing processes
and nerve-endings). The cochlea is a remarkable structure—
a
spiral tube of bone (20 to 30 mm. long), divided along its length
Fig. i i ib—Section of one turn of Cochlea(Geiger and Scheele, Handbuch der Physik)
by the 'lamina spiralis' and the basilar membrane into two
cavities, the 'scala tympani' and the 'scala vestibuli,' which
intercommunicate at the tip of the spiral at the end of the lamina
spiralis. A section of one turn of the cochlea is shown in fig. 1 1 1b.
The membranous labyrinth, almost triangular in section, is formed
by the ' membrana vestibuli ' and ' membrana basilaris. ' The

THEORIES OF HEARING 369
latter is kept in tension by the fibrous structure ending in the
spiral ligament (see fig. 111c). Forming an arch, of triangular
section, over a portion of the basilar membrane are the 'rods
of Corti' which support the hair-like cells and nerve-endings
over which hangs the membrane tectoria. All these structures
gradually diminish in size as the cochlea winds from its base
near the oval window to its tip.
Sensitive cells
Laminaspiralis -^L_.ossea '%f%j
Arch of Corti Membrana basilans
Fig. 1 iic—End Apparatus(Geiger and Scheele, Handbuch der Physik)
Theories of Hearing - The progress of a sound wave downthe auditory canal, affecting the drum-skin and the three bones
and passing along the cochlea over the basilar membrane, can
readily be imagined, but the actual conversion of sound energy
into nervous energy is not so easy to follow. The gradation in
size of the structures from the base to the tip of the cochlea forms
a strong temptation to suggest that they were designed to respond
sympathetically to vibrations of all frequencies within the range
of audibility. It was thought at first that the rods of Corti
served this purpose ; but more recently the basilar membrane,
with its fibres stretched radially like a harp throughout the
spiral, has received special attention. This view of the matter
is generally spoken of as Hehnholtz's Theory of Audition* but
there are earlier references to a similar theory. According to
this theory, the sound wave advancing along the cochlea excites
into resonance that particular radial strip of the basilar membranewhich is in tune with it. The vibration thus set up is com-
municated directly to the corresponding hair cells and the spiral
nerve fibres which are supported between the rods of Corti and
the basilar membrane (see fig. 111c). Any theory of the action of
the ear must, of course, account for all the experimental observa-
tions to which we have referred above. The facts of Ohm'slaw, that the ear can resolve a complex tone into its harmonic
* Sensations of Tone.
24

37o THE EAR
components ; the fact that a musician can name the notes forming
a chord struck on the piano; the wide range of intensity and
frequency over which the ear is sensitive ; binaural perception of
direction, and many other, as yet, obscure phenomena, must all
be explained. The form of the curve of sensitiveness of the
ear with variation of frequency (see fig. 110 (b)) suggests that the
mechanism is either multi-resonant or considerably damped, or
both. Such possibilities are not unlikely, when we consider the
chain of mechanical operations; through the air in a resonant
cavity (the auditory canal), the membranous diaphragm, three
solid bones (not rigidly connected), then a liquid-filled cavity
containing stretched fibres. Observations by Barkhausen # on
the damping of the ' ear-resonators ' indicate a logarithmic
decrement A=0T2 over a range of frequencies 500 to 1500 p.p.s.
It may not be without interest to note also that the resonant
frequency of the outer ear cavity (the auditory canal), regarded as
a closed pipe of effective length about 3 cm., approximates to
2700 p.p.s., which coincides approximately with the frequency at
which the ear is found to be most sensitive (see fig. 110). Thebehaviour of the three bones is an interesting mechanical study in
itself. There appears to be an attempt here to reduce the dis-
placement and increase the pressure-amplitude in transferring
the vibrations of the drum (in air) to the liquid-filled cochlea,
very low- or very high-frequency vibrations would not pass well
through such a system. Returning to the far more complicated
problem of the function of the cochlea and basilar membrane,various theories have been advanced as alternatives to that of
Helmholtz.-f An objection which has been raised to the resonance
theory is that there is not enough difference between the lengths
of the fibres of the basilar membrane to account for the range
of sounds which it is possible to perceive and analyse. It has
therefore been suggested by Ewald J that the whole basilar
membrane vibrates in the form of stationary waves, so that a
nodal pattern is impressed on the nerve-endings, which are
stimulated, presumably, at the antinodes.
Another theory which avoids the difficulty altogether is due to
* Phys. Zeits., 25, p. 537, 1924.
f See Fletcher, Journ. Frank. Inst., p. .312, 192.3. H. E. Roef, Phil.
Mag., 43, p. .34!), 1 922. A comprehensive account of the ear and Theoriesof Hearing, is given in Geiger and Scheele's Handbuch der Physik, 8,' Akustik,' p. 477, where numerous references to publications will befound. Sec also H. Fletcher, Speech and Hearing.
X Pfluger's Archiv., 93, p. 485, 1903.

SENSITIVE FLAMES AND JETS 371
Rinn (1865), and assumes that the basilar membrane vibrates
as a whole. The impulses ascending the whole auditory nerve
differ in quality, reproducing physiologically the character of the
primary physical disturbances. On this view, the whole process
of analysis is relegated to the auditory centre in the brain. Thecomplicated structure of the cochlea would seem, however, to be
quite unnecessary for such a purpose.
None of the theories of hearing hitherto proposed can be
regarded as completely satisfactory, but the resonance theory
certainly appears to hold most promise.
SENSITIVE FLAMES AND JETS
The upper limit of frequency at which the ear becomes useless
as a means of detection is in the neighbourhood of 20,000 p.p.s.
At frequencies much lower than this, however, it is insensitive,
and alternative methods of detection of the vibrations are pre-
ferable, if not indeed necessary. Perhaps the oldest and best-
known receiver or detector of high-frequency sounds is the
sensitive flame which is generally associated with the name of
Tyndall who, subsequently to its discovery by Leconte,* brought
it to a high degree of perfection. Those interested in the subject
should read Tyndall's detailed description f of sensitive flames
and jets as used to detect high-frequency sounds. As the pressure
of the gas supply to a flame is gradually increased, the flame
increases in size, but if the pressure exceeds a certain critical
value the flame shortens and flares. This effect is most marked
if the gas issues through a pinhole orifice, in which case the flame
is long and narrow until it begins to flare. If such a flame be
adjusted to the critical pressure, just on the point of flaring, it
will be found to be sensitive to external sounds, particularly to
those of high pitch. Tyndall found that the taller the flame
the more sensitive it becomes ; he succeeded in obtaining a flame
24 in. high, 'the slightest tap on a distant anvil' reducing its
height to 7 in. Such flames require rather greater gas pressures
than the gas companies supply in the mains ; but it is possible to
operate shorter flames of somewhat less sensitivity at ordinary
pressures, provided the diameter of the jet is suitably chosen. JAny high-frequency sound, the rattle of a bunch of keys or coins,
a hiss or a sharp metallic sound are equally effective. Tyndall
* Phil. Mag., 15, p. 235, 1858. See also Barrett, Phil. Mag.. March1867. f Sound, p. 230.
X See, for example, S. R. Humby, Proc. Phys. Soc, 39, p. 435, 1927.

372 SENSITIVE FLAMES AND JETS
showed that the effects are practically the same if im-ignited jets
of coal gas, carbon dioxide, hydrogen, or air are used, such jets
being rendered visible by smoke. ' Smoke jets' of this character
were found to exhibit a sensitiveness in some cases even greater
than that of the flames. Another method of making the sensitive-
ness of an air-jet visible is to allow it to play on a flame which
merely serves as an indicator. A somewhat different type of
sensitive flame is one in which the coal gas is ignited on the
upper side of a wire gauze held at a suitable distance from the
jet. Rayleigh # describes a further modification which requires
smaller gas pressures and is sensitive to sounds of lower frequency
also. Ridout f found that fishtail flames, formed by the union at
a small angle of two similar jets (as in an acetylene cycle-lamp),
exhibited directional properties with respect to the source of
high-frequency sound. The response was zero when the direc-
tion of the sound was at right angles to the line of the jets (i.e.
in the plane of the flame). Screening a long sensitive flame
from the incident sound waves from a high-frequency source, it
is a simple matter to demonstrate that the tip of the jet is the seat
of the sensitivity of the flame. This sensitiveness is undoubtedly
due to the instability accompanying vortex motion at the jet.
The phenomenon is very complicated and is imperfectly under-
stood. That it is due in some way to the viscous drag on the
moving jet of the fluid as it leaves the orifice cannot be doubted.
Rayleigh's view of the matter J is as follows: " At the root of the
jet, just after it issues from the nozzle, there is a near approach
to discontinuous motion and a high degree of instability. If a
disturbance of sufficient intensity and of suitable period have
access, the regular motion is lost and cannot afterwards be
recovered. But the instability has a very short duration in which
to produce its effect. Under the influence of viscosity the
changes of velocity become more gradual, and the instability
decreases rapidly if it does not disappear altogether. Thus, if the
disturbance be insufficient to cause disintegration during the
brief period of instability, the jet may behave very much as though
it had not been disturbed at all, and may reach the full develop-
ment observed in long flames and smoke-jets. This temporary
character of the instability is a second feature differentiating
strongly these jets from those of Savart, in which capillarity has
an unlimited time of action." E. G. Richardson § has shown
* Sound, 2, p. 402. f Nature, 18, p. 604, 1878.
X Sound, 2, p. 408. § Nature, 116, 171, 1925.

EFFICIENCY OF SOUND RECEIVERS 373
that the relation between the velocity V and the length / of a jet
of water, in a tank of water, when turbulence sets in is approxi-
mately a hyperbola. In a jet issuing from a circular nozzle
vortices are formed having a frequency N given by V/ND =con-
stant, where D is a linear quantity depending on the diameter of
the nozzle. On this view a jet should show a maximum response
when the incident sound has a frequency N corresponding to
the particular velocity V of the jet, and on account of the hyper-
bolic relation V/ ^constant, the change of length over a certain
small range of jet velocity might be very great. The frequency-
velocity relation suggests that the higher the velocity of the jet
the higher the frequency to which it gives maximum response.
Humby * refers to sensitive flames responding to particular
frequencies, but gives no data relative to the dimensions of the
jets. He states, however, that the frequencies of response were
unaffected by small changes of gas pressure, although the
sensitiveness fell off rapidly as the pressure was lowered from
the critical stage at which roaring begins.
Sensitive flames may be used as indicators of vibrations in
air at practically all frequencies up to, and possibly beyond,
100,000 p.p.s. A quartz rod oscillating in a Pierce circuit (see
p. 145) at this frequency provokes a vigorous response. Withsuch an arrangement almost all the optical analogies between
sound and light waves can be readily investigated. In metrical
work, a suggestion made by W. E. Benton f is worth remembering,
viz. that a small gas-pressure governor as used by gas companies
would keep the jet-pressure constant within 2 per cent, for a
100 per cent, increase in the supply pressure. The chief difficulty
in the practical use of sensitive flames is the maintenance of a
constant gas pressure.
FACTORS GOVERNING THE EFFICIENCY OFSOUND RECEIVERS
Before proceeding to deal in detail with other forms of sound
receiver it may be well to consider certain features which have an
important bearing on the * efficiency ' of receivers of all types. %A sound receiver may, in general, be regarded as a device for
converting the energy of wave-motion in the medium into some
* hoc. cit. f Proc. Phys. Soc, 39, p. 443, 1927.
X See F. Aigner, Unterwasserschalltechnik, p. 138 (Berlin, 1922) ; andGeiger and Scheele, Handbuch der Physik, 8, ' Akustik,' pp. 117 and 544
;
and H. Lichte, Phys. Zeits., 18, p. 393, 1917, and 19, p. 17, 1918.

374 EFFICIENCY OF SOUND RECEIVERS
other form of mechanical, thermal, or electrical energy. In somecases, to which we shall refer, the 'receiver' also acts as an
amplifier, either of displacement or pressure, but for the momentwe are not directly concerned with this aspect of the matter. In
the first place, we shall regard the receiver as represented by a
mass controlled by a spring and opposed by a certain resistance
to motion (damping). This system is subjected to an alternating
field of force. The vibrations are therefore represented by
mx Jrrx-\-sx=F cos pt . . (1)
The solution of this equation and its physical significance have
already been discussed (see p. 37, etc.). In every sound receiver,
of whatever type, the damping factor r in this equation is com-
posite. In the simplest case, which we shall now consider, it
consists of two parts : (a) the external damping factor re , which
represents the loss of energy, from the vibrating element of the
receiver, to the medium, i.e. the damping due to re-radiation;
and (b) the internal damping factor riy
representing the energy
absorbed by the receiver. If therefore we write
r -\~T- s Fr=r„-\-r
iand -^-
—
l
-=k, - =rc 2 and - =/ . (la)2m m m
we find (as on pp. 37 and 39) that
/ sm €
aW=//[(»2-i>
2)a+4W2
• • (2)
and
*^=px^=PM(n 2-f-)
2+*kY] 112(3)
Now the mean power E absorbed in internal damping is |^i2max ,
that is
F_ P2f\
2[(?i2-p 2y+4:k 2
p2]
'
'
A small receiver absorbs energy from an area of the wave-front
greater than the actual area exposed to the wave. As we have
already shown, in the case of resonant receivers, this effective
area S x may exceed greatly the actual area S. In the present case,
the energy passing per second through unit area normal to the
direction of propagation (i.e. the intensity of the sound) is given
IP 2
byl= (see p. 54) where P is the pressure-amplitude. The

RESONANT RECEIVERS 375
energy passing per second through an area S x is therefore
But this is the power absorbed by the resonator of effective area S x ;
that is
t?l P2q u q
2PcE iK \E=-—Sj whence Sx=^- . . (5a)
or
S9Cfi%
(5b)1
¥*[(n 2-p 2y+4ky-] '* *
v }
Resonant Receivers - If we write n=p in the above ex-
pressions, we obtain the conditions for tuned receivers. Thusthe power E absorbed by the resonator is from (4)
f2r- F 2
r-
F = = (Q>)
8k* 2(re-\-r
{y '
K }
It will be observed that this quantity E has a maximum value when
'«=*« (=^ *ay)(7)
whence
(8)
where r the total damping =2 x (internal or external damping),
and S is the actual area of the resonator.
These results are very important in the design of a good
receiver. They indicate, for resonant receivers, that the rate of
absorption of energy is a maximum when two conditions are
fulfilled, viz. :
—
(a) when the internal damping r{is as small as possible, and
(b) when the external damping re
is equal to the internal
damping rt
—that is, when the energy absorbed is equal to
the energy radiated.
These conclusions, expressed in (6), (7), and (8), may profitably
be compared with the analogous electrical relations.
It appears necessary, therefore, in the design of a resonant
receiver to ensure first of all that the internal damping is reduced
E -^ orp2g2
4r
SimilarlyF
*max-W orPS
nr
andF
orPS]
r

376 EFFICIENCY OF SOUND RECEIVERS
to a minimum, and then to adjust the dimensions so that the
damping condition (b) is satisfied.
Effective Area of a Resonant Receiver - At resonance the
effective area Sj of the receiver may be derived from equation (5b)
by substitution of the values of/ and k from equation (la) and
writing n =/>, thus
Sin,aX=g5 orP~ (since F=PS) . (9)
where S is the actual area of the receiver. It has been shown by
Rayleigh # that the radiation resistance of a small surface vibrating
with uniform amplitude and radiating in all directions is given by
r=7i^S 2/A2 .... (10)
Substituting this value for r' we obtain
S1=A2/4tt . . . . (11)
By a similar process, commencing at equation (4), we may show
that a resonator with no internal damping (rt-=0), i.e. one which
re-radiates all the energy which it receives, obtains this energy
from an effective area
S 2 =A 2/tt .... (12)
a result to which we have already referred (see p. 190). In any
practical form of resonator some internal damping is inevitable,
in which case the most efficient receiver possible has an effective
area given by equation (11). For example, if a resonator of
frequency N=1000 p.p.s. (corresponding to a wave-length
A =33 cm. in air) and an actual area S of 0-6 cm. 2, the maximum
effective area Si would be A2/477=87 cm. 2 and the displacement-
amplification factor S 1/S=145. The volume v of this resonator,
c Idcalculated from N=— . /— (equation 13, p. 186), would be
33 c.c. Let us now return to consider the practical importance
of equations (6), (7), and (8), which require the external dampingto be equal to the internal damping and both to be as small as
possible for maximum response. Suppose we require to determine
the best form and size of Helmholtz resonator for use at a par-
ticular frequency N, which we may therefore regard as fixed.
After choosing the type which has least internal damping, i.e.
making rias small as possible, we proceed to determine the best
* Sound, 2, p. 165.

PRESENCE OF A DETECTOR 377
area S of neck, varying the volume, of course, in accordance with S
to ensure the same frequency. From equation (8) we see that
the maximum amplitude in the neck is given by xmax ^F/nr or,
since F is proportional to S and (from equation (10)) r is pro-
portional to S 2, xmax is inversely proportional to S. From this
point of view, therefore, it is desirable to reduce the area of the
neck, and consequently the volume of the resonator as much as
possible. But the internal damping riy
due to viscosity and
eddies, increases rapidly as the size of the neck diminishes, so werequire on this account as large a neck as possible. There is
consequently a best area of neck which, as we have shown, must be
determined by the equality of external and internal damping.
The exact value of this area can be calculated in a particular case
when the law of internal damping, which gives riin terms of S,
is known.
Presence of a Detector - This brings us to a second point
of importance. It is usually, but not always, necessary to introduce
into the receiver some form of detector, which itself absorbs
energy and thereby increases the damping. In such a case, which
represents by far the greater proportion of resonant receivers used
in practice, the energy consumed by the detector may be regarded as
useful, whilst that lost in viscosity and eddies is wasteful. Con-
sequently we must write ri=ru -\-rw , where ru is the useful damping
in the detector and rw is the wasteful damping. Equation (6) for
a resonant receiver must consequently take the form
. . . (13)2(ru+rw+rey
Differentiating this with respect to ru and equating to zero, weobtain
ru=rw+re
• • • • (14)
as the condition for maximum overall mechanical efficiency. Theinternal mechanical efficiency in this case is ru/(ru -\-rw), and the
overall mechanical efficiency is ru/(ruJr rw
Jr re) y
which may reach
a maximum value of 50 per cent, when ru =(rw -\-re). Returning
again to the Helmholtz resonator illustration, when the particular
form of detector has been chosen, for example, a hot-wire micro-
phone, and its damping ru determined, the size of the neck should
be such that the damping due to radiation reand viscosity rw
should together be equal to that of the microphone. To take
another illustration, the damping of a small resonant diaphragm

378 EFFICIENCY OF SOUND RECEIVERS
in water varies in proportion to the area, the amplitude being
theoretically a maximum when the energy radiated is equal to the
energy absorbed internally (friction and vibration of supports, etc.).
If, in addition, some form of detector, such as a microphone or an
electro-magnetic device, be attached to the diaphragm, the best size
of diaphragm will be larger than before, in order that the radiation
(and friction) damping may be increased to equality with the
damping of the detector. In all cases it is desirable in the first
instance to reduce the wasteful damping to a minimum.
Untuned Receivers of Small Area - The effective area S M
of an untuned receiver is given by equation (5b). Writing Stas
the effective area of a timed receiver, we have therefore
St
Et
(n 2-p 2)2+4k 2
p2
'
which was obtained on p. 43, equation (15). This ratio falls to
| when (n 2—p 2
)
2 =^k 2p
2—that is, when p2jn=\±_kjn (approx.).
In the case where k is small, only a very small departure from
exact tuning of the receiver will result in a drop of 50 per cent, in
the energy received. If the frequency- ratio departs seriously
from unity the sensitiveness of the untuned receiver will be almost
negligible compared with that which is tuned.
The Receiver as an Obstacle to Sound Waves - A point of
some importance which has hitherto been disregarded relates to
the behaviour of the sound receiver as an obstacle which reflects
or scatters the energy incident upon it. As we have seen on
p. 282 the energy scattered from a small obstacle varies directly
as the square of its volume and inversely as the fourth power of the
length of the waves incident upon it. A small diaphragm tele-
phone receiver, for instance, in air will reject a large proportion
of the energy incident upon it, in spite of the fact that its diaphragm
may be tuned. The effect on the sound field of the vibration of
the solid surface of the diaphragm is relatively negligible (see also
p. 423 on Sound Measurement).
Receivers of Large Area - If the dimensions of the receiver
are large, i.e. of the order of several wave-lengths, the effective
area S xapproximates to the actual area S. The power available
in this case is therefore
1 P 2 1
E= . S=-ri 2
2 Pc 2max >

PRESSURE AND DISPLACEMENT RECEIVERS 379
and at resonance, when x2mas.=F2/r2 , we find r=pcS, which is
equal to the radiation resistance of a corresponding area S of the
medium. In this case, therefore, the resonator may absorb the
whole of the energy incident upon it. Unlike the small resonator,
it does not draw energy from a relatively large surrounding area.
Pressure and Displacement Receivers - The energy in the
sound wave may be detected in as many ways as there are changing
physical characteristics in the sound wave : particle displacement,
velocity or acceleration, pressure and density variations, tempera-
ture changes, and so on. Of these, pressure and displacement
variations are of most frequent application. Of necessity, a
'pressure' receiver must also require a little displacement for its
satisfactory operation, or there could be no absorption of energy
(for energy absorbed is given by JPmax^max)- Similarly a so-called
displacement or velocity receiver also requires a small pressure
variation. Neither a 'pure' pressure receiver nor a pure dis-
placement receiver could therefore be efficient, for both would
serve as total reflectors of the incident energy. On this basis,
therefore, they could have no practical value. A pressure receiver
absorbing no energy implies a completely sound-resistant body(analogous to an electrical insulator), whilst a displacement re-
ceiver absorbing no energy would behave as a completely sound-
conducting body (analogous to an electrical conductor of infinite
conductivity in which no potential difference is possible). Thedistinction between pressure and displacement receivers is, how-ever, a useful one, and in some respects is analogous to that
between voltmeters and ammeters used in electrical measure-
ments. A voltmeter is essentially an electrical pressure-measuring
device although it requires a small current, whilst an ammeter is
primarily a current-measuring instrument requiring a small
potential difference across its coils. The same energy and dampingconditions which we have just been considering apply, however,
to both types. Outstanding examples of these types are readily
found. As a typical displacement receiver we may instance the
Helmholtz resonator, fitted with a sensitive device for detecting
the motion of the air in the neck where the pressure-fluctuation
is relatively small (but not zero). A good example of pressure
receiver is the Langevin piezo-electric quartz disc (see p. 147)
used for generating and receiving sounds of high frequency underwater. The pressure-fluctuations at the surface of the receiver
in the water compress the quartz slightly, and thereby produce
corresponding fluctuations of electrical charge which can be

380 EFFICIENCY OF SOUND RECEIVERS
detected by suitable apparatus. This receiver depends essentially
on pressure fluctuation, but the elastic displacement of the quartz
cannot be disregarded. Various types of diaphragm receivers are
generally classed as pressure receivers, although the displace-
ment amplitude may be considerable. If we employ the same
receiver in air and in water it may serve as a pressure receiver
in the former and a displacement receiver in the latter, because
the acoustic resistance of the water is about 3500 times that of air.
Similarly the same receiver in a medium of high acoustic resistance
will offer a resistance which varies with the frequency of the
incident sound wave—a diaphragm, for example, changing from a
displacement receiver to a pressure receiver as the frequency is
decreased. In air, with its low acoustic resistance (pc^AO), all
receivers having solid surfaces (diaphragms, piezo-electric crystals,
etc.) may be regarded as pressure receivers, and the above considera-
tions do not arise. In water, however, a medium of much higher
acoustic resistance, a diaphragm may be regarded either as a
pressure or a displacement receiver according to the frequency
of the incident sound relative to that of the diaphragm.
Mechanical Transformers. The Lever Principle - Just as
it is often necessary to transform electrical power from high to low
voltage, with corresponding current changes, so it is frequently
necessary also to transform mechanical power from high to low
pressure and vice versa. For example, in transforming sound
energy from water to air, or conversely, we are confronted with
a serious difficulty, viz. that the radiation damping factor (pro-
portional to pcS 2) is, for a given area of vibrating surface, far
greater in water than in air (pc =40 for air, and 1*5 X 10 5 for water).
If, however, we can devise some method of transforming the
relatively large pressure fluctuation (of small displacement
amplitude) in water, to large displacement fluctuation (of small
pressure amplitude) in air, the sound energy may become more
readily available. Examples of mechanical vibration trans-
formers are to be found in the gramophone sound-box and in
various types of sound measuring and 'amplifying' devices. For
such purposes, particularly for use in underwater sound genera-
tors and receivers, Hahnemann # has devised a mechanical lever
of a novel type. An ordinary lever, with loose pivots and links,
would be useless as a means of transmitting vibrations of even
* W. Hahnemann and H. Hecht, Phys. Zeits., p. 187, 1920; and Inst.
Radio. Eng.y 11, p. 9, 1920. See also F. Aigner, Unterwasserschall-
technik, p. 133 (Berlin, 1920).

MECHANICAL TRANSFORMERS 381
moderate frequencies. In a vibrating system, such as a diaphragm
or a tuning-fork, the 'mass' and the 'spring' of the vibrator
are inseparable, an alteration of one necessitating an alteration of
the other. The case is analogous to an inductance coil having
self-capacity and consequently its own free period of oscillation.
Hahnemann prefers to separate 'mass' and 'spring' for tuning
purposes, just as it is more convenient to separate inductance and
capacity in tuning an electrical circuit. The principle of Hahne-
mann's 'lever'—the mechanical analogue of the electrical trans-
former—is illustrated in fig. 112 (a). Two rigid masses m 1 and m 2
are connected by a spring of length / and strength s. At resonance
the system will vibrate about its centre of gravity O, this point
being undisplaced and functioning as a node at which the system
may be supported. When the system vibrates longitudinally it is
evident that m1 and m 2 move in opposite directions, so as to makem
1x1 -\-
m
2x2 =0, where xx and x 2 are the accelerations of m 1 and m 2
respectively. Neglecting the sign of these accelerations we find
—= — similarly —=—=— . . (1)™2 **1 "*2 1 1
that is, the accelerations, velocities, and displacements are inversely
proportional to the respective masses. The relative amplitudes are
consequently
a1_m 2 _l1—— —— . . . [Z)a 2 m x l2
where /x and l2 are the lengths into which the spring is divided bythe point O, the centre of
.
X2
gravity of the system. Therelative energies of the two j^ii^F
masses (J . mv 2) are also in-
versely proportional to the 1 1 ? _n-u • mA H ": (b)
masses, lhese are very 1m- [_Jportant facts, applicable to all
forms of resonant sound
sources and receivers. The hrmm^ TmnrorefrQ (c)
mfrequency of vibration of the mA
system is obviously that of FlG II2
the mass m1 on a spring of
length lY or the mass m1 on a spring of length l2 . Consequently
277V iff, 2ttN m\ mj 2ttV \m, mJ

382 EFFICIENCY OF SOUND RECEIVERS
If one of the masses, mx say, is very great compared with the other,
i /7the frequency N becomes — v / — and the point O practically
2-\ m 2
coincides with m 1} so that l± =l and /2 =0, the motion of m Y being
extremely small. A practical attempt to construct such a system
at 1000 p.p.s., for example, soon shows the necessity of replacing
the spiral spring of fig. 112 (a) by an arrangement in which the
elastic element combines the smallest possible mass with the
greatest elastic strength, e.g. a longitudinally strained rod or tube
as shown in fig. 112 (b). A stiff diaphragm with a central load
serves a similar purpose. In the case of the rod of elasticity E,
area of cross-section A and length /, the frequency of the system
becomes
1 /EA/ 1,
1 \ntWtU+sJ . . . (*)
neglecting the mass of the rod. A correction for the latter is
easily applied. As we have seen, the system acts as a lever in
amplifying or reducing the motion imparted to one of the masses.
Similarly, at resonance, if a force F ± cos nt be applied to the mass
m1 we must have
F]_ cos ?it=rx1 (since m1x1 -\-s1x1=0 at resonance), and at m 2
we have
T7 * •t,
F i *i m* (~\bo cos nt=rx 2 , whence —-=—=—
.
. (5)r 2 x2 m 1
that is, the forces are also inversely proportional to the masses.
Again, if E x and E 2 are the respective kinetic energies of the
masses, we have
Ex m xx^ m<
2^2nioXo mfrom (5) . . . (6)
Consequently if m1 is much smaller than m 2 , E ±will be much
greater than E 2—that is, the energy will reside principally in the
smaller mass. The analogy with the 'static lever' is very close;
a small effort exerted over a long distance producing a large force
acting over a short distance. The familiar terms 'mechanical
advantage,' 'velocity ratio' and 'mechanical efficiency' may, with
circumspection, be applied, therefore, to the vibratory as well as
to the static lever. The above simple deductions have a very wide
practical application in the design of sound sources and receivers.
Almost all forms of vibrating system are reducible to this mechan-

THE LEVER PRINCIPLE 383
ical lever or transformer. An elastic diaphragm mounted on a
heavy ring vibrates with a large amplitude and small force, whereas
the ring (of large mass m^) has a negligible amplitude, but mayexert a considerable pressure. As we have just shown, the energy
of the vibrating system resides principally in the smaller mass, i.e. in
the diaphragm. A tuning-fork on a heavy base provides a similar
illustration. In the above arrangement the 'mechanical coupling'
between the two masses is perfect. Circumstances sometimes
require, however, that the coupling should be relatively 'loose.'
This result can be achieved by means of a mass mz which is commonto both m 1 and m 2 as in fig. 112 (c). Here m 1 and mz are the masses
of one system, s Y the connecting elastic element, m2 and mz the
masses of the other system, and s 2 the elastic connection. The' coupling coefficient ' k of the two systems is expressed by
mjno
(m 1—m3)(m 2
—m3y
analogous to the coupling coefficient k2=M.2 L XL 2 of two electrical
circuits of mutual inductance M and self-inductances L 2 and L2 .
When mz is zero we arrive at the simple case considered above,
k2 =l where the 'coupling' is 'perfect.' If m3 is very large com-
pared with m Y and m 2 the value of k 2is very small and the
coupling said to be 'loose.'
By means of the above principles of the mechanical trans-
former and the electrical analogy it is possible to deal with
somewhat complicated mechanical systems used in sound sig-
nalling. Hahnemann has designed on these principles very
efficient sound generators and receivers for use under water.
A diagram of his submarine
electromagnetic transmitter (or
receiver) with its accompanying
mechanical 'circuit diagram' is
shown in fig. 1 1
3
(a). A steel dia-
phragm on a heavy mounting ' a'
is actuated by a powerful electro-
magnet, the armatures b and c of
which are connected by elastic
tubes or rods ff, the magnet alternately attracting and repelling
b and c against the elastic-restoring forces of the tubes. Aswill be seen, there are two oscillating systems, one of which
consists of the masses b and c with the spring ff, the other
of the masses a and b with the spring ee. The coupling
(a)
Fig. 113 (a)—Sound Transmitter(Hahnemann)

384 SOUND ENERGY INTO ELECTRICAL ENERGY
coefficient is determined by the relation between the commonmass b and the two others a and c. To obtain the best coupling
coefficient and the other desired results it is also necessary to
tune the separate systems and to have suitable damping in each
1/-^ Elastic tubes
1Gap of '/rutp/ift
jSthV™" •z'^'^ff^s
P* / [}i&phmt/m
.
-
Fig. 113 (6)—Sound Transmitter (Hahnemann)
of them in relation to the coupling employed, just as is usually
done in electrical circuits. A good electromagnetic transmitter,
designed on such principles, forms a satisfactory receiver also,
for the lever principle is reversible. A photograph of this trans-
mitter is shown in fig. 113 (b).
CONVERSION OF SOUND ENERGY INTOELECTRICAL ENERGY
The majority of sound receivers in use at the present day are of
an electrical nature. The reason is not far to seek, for electrical
methods offer a wide variety and flexibility in their application.
By electrical methods sounds may be received in one place and
reproduced or recorded in another. Electrical amplification offers
a means for utilising special forms of sound receiver which would
otherwise be too insensitive to be of service. By electrical methods,
also, the effects of two or more receivers may be added vectorially,
the necessary adjustments of phase being a comparatively simple

ELECTRICAL SOUND RECEIVERS 385
matter in the electrical circuits. The frequency and intensity of
sounds of feeble intensity (or outside the range of audibility) maybe determined conveniently by electrical methods. These are
sufficient to indicate the many advantages of the conversion of
sound energy into electrical energy.
In many cases, with which we shall have to deal, an electrical
sound generator is also used as a sound receiver. This reciprocal
process is analogous to that in which an electrical machine maybe driven mechanically as a dynamo to generate electrical power,
or conversely the machine may be supplied with electrical power
to drive it as a motor to produce mechanical power. Many forms
of electrical sound-apparatus may be regarded either (a) as a sound
receiver, converting vibratory mechanical motion into alternating
electrical power (the dynamo principle) or (b) as a sound generator,
converting electrical power into mechanical vibratory power (the
motor principle). This analogy between sound apparatus and
electrical machinery is of more than superficial significance, the
principles underlying the one system being very closely applicable
in the other.
Some writers * have gone so far as to classify sound receivers
as
—
(a) those which convert the energy of sound vibrations directly
into electrical energy (on the dynamo principle), and (b) those in
which the sound vibrations control the electrical energy indirectly.
In the former class, the electrical energy which the receivers
generate bears a definite relation to the mechanical energy of
vibration; whilst in the latter, the amount of electrical energy
'released' by the vibration may, at any rate in principle, be as
large as desired. Outstanding examples of these two types are
(a) the electromagnetic or electrodynamic receiver (a simple
telephone earpiece), and (b) the granular carbon microphone.
Although this method of classification is 'at first sight' very
attractive, there are border-line cases which do not fall readily into
either category. For example, certain forms of hot-wire micro-
phone, the condenser microphone, piezo-electric and magneto-
striction receivers could be regarded equally well in class (a) or
class (b). We shall, therefore, avoid such a definite classification
in what follows, although there is nothing better to offer. Other
alternatives which may be suggested classify receivers as resonant
and non-resonant, displacement and pressure, atmospheric andsubmarine, directional and non-directional, and so on. Little is
* See Geiger and Scheele, Handbuch der Physik, 8, ' Akustik,' pp. 551and 553; article by H. Sell.
25

386 SOUND ENERGY INTO ELECTRICAL ENERGY
gained, however, by such classification, and there is grave danger
of repetition.
Electromagnetic Receivers - (Moving Iron Type.) Theoldest, simplest, and most familiar of all electrical receivers is the
electromagnetic telephone, invented in 1876 by Graham Bell.
Numerous modifications are in existence, designed with the
object of improving its efficiency or output, but the fundamental
principle remains the same. In its most common form,* a thin
diaphragm of magnetic material (steel or ferrotype) is clamped
rigidly at the edge, whilst the central portion bridges across the
pole pieces of a permanent magnet. The diaphragm is usually
about 2 in. diameter and -006 to -012 in. thick, and is situated with
respect to the magnet poles so as to be just not pulled into contact.
The pull on the diaphragm is approximately proportional to the
square of the magnetic flux B from pole to pole through the
diaphragm. Small increases or decreases of flux, due to changes
of magnetic reluctance as the diaphragm approaches or recedes
from the poles, produce corresponding changes of current in the
coils wound on the tips of the magnet poles. The vibrations of
the diaphragm on which sound waves are incident therefore
induce corresponding variations of current in the windings. The
MagnetAluminium cone
Mirror mounted on knife edges
Laminated
Plan P°le8 e(cover removed)
Section [Phone used as an Oscillograph.]
Fig. 114—Brown Reed Telephone(By courtesy of S. G. Brown & Co.)
sensitiveness is proportional to the product BdB/dH, where B is
the magnetic flux passing through the diaphragm. Provided Bis not too small and does not approach too near the saturation
value, where dB/dH is small, the sensitiveness may be fairly high.
The vibrating diaphragm is in certain forms of receiver, notably
* See Dictionary of Applied Physics, 2, p. 843, for description of con-struction and theory of Electromagnetic Telephone Receivers.

MOVING IRON RECEIVERS 387
one designed by S. G. Brown,* replaced by a clamped-free reed
(see fig. 114). The latter is a strip of soft iron or mild steel clamped
firmly at one end, whilst the free end lies across the gap in the
magnetic field. The poles of the magnet are adjusted to approach
the reed until a critical position is reached, beyond which the stiff-
ness of the reed is suddenly overpowered by the attraction of the
magnet. Attached to the reed by its apex is a light aluminium
cone which serves to collect the sound energy incident on the
receiver. In other forms of receiver an electromagnet is used to
provide the steady magnetic flux, independent windings on the
pole-tips being employed as before to carry the alternating current
developed by the vibration of the diaphragm or the reed. Theefficiency of such a receiver may be determined by making a series
of measurements of its electrical (motional) impedance at various
frequencies near resonance by the method f described on p. 73.
Such measurements indicate the amount of electrical power con-
sumed by the receiver, when used as a transmitter, at these
frequencies. The difference between two series of observations
with the diaphragm or reed, (a) free to vibrate and (b) clamped,
give the amount of mechanical power consumed by the vibrating
diaphragm. A convenient approximate view of the behaviour of
the diaphragm is to regard it as equivalent to a tuned 'L. C.
circuit' shunting a part of the telephone winding. J In air, only
a small proportion of the power consumed by the diaphragm is
radiated as sound, the energy losses due to insufficient clamping
of the edges, internal friction, etc., being usually very serious
in comparison. The efficiency of an electromagnetic telephone
receiver used in air rarely exceeds 1 per cent, at resonance. If,
however, the receiver is used under water (the electromagnetic
system being mounted on a suitable diaphragm enclosing a water-
tight cavity), the efficiency may be greatly increased, on account of
the increased radiation damping of the water being more nearly
comparable with the internal electromagnetic damping of the
receiver. Designed on the lines of Hahnemann's electromagnetic
transmitter, a receiver may reach a very high efficiency when used
under water.
Generally speaking, diaphragm receivers exhibit marked re-
sonance at certain frequencies. When used to receive signals of
a definite frequency such resonance is desirable, but when it
* See Patent, Specification 29833/1910.
f See, for example, E. Mallett, Journ. I.E.E., 62, p. 517, 1924.
X See W. H. Eccles, Handbook of W/T. f p. 280.

388 SOUND ENERGY INTO ELECTRICAL ENERGY
is required that the sound shall be faithfully reproduced special
care must be taken in the design to avoid resonance. In such
cases it is usually the practice to arrange the diaphragm frequency
to be very much higher or very much lower than the frequency-
range it is desired to receive. Alternatively the diaphragm should
be heavily damped, such damping unfortunately being wasteful.
These methods of avoiding resonance necessitate a considerable
loss of sensitiveness, but the use of a non-selective valve-amplifier
{e.g. resistance-capacity type) will, to a large extent, compen-
sate for such loss. The theory of electromagnetic receivers of the
diaphragm type for use in air has been developed by R. L. WegeL*On account of the relatively high iron losses (hysteresis and eddy
currents) in such receivers, it is of course essential to laminate all
iron sections which have to carry alternating flux. Hysteresis loss
is proportional to frequency and eddy current loss to the square
of the frequency, consequently it is necessary in a good receiver
to use thin laminations of high resistivity iron (silicon-iron or
stalloy). At frequencies much above 14,000 p.p.s. the losses
become very serious in spite of such precautions—it is fortunate
that the ranges of speech and music lie mainly below this frequency.
The action of all forms of electromagnetic receivers is reversible,
sound being produced by the diaphragm when the coil is supplied
with alternating current, and current being generated when sound
falls upon the diaphragm.
Electrodynamic Receivers - (Moving Coil Type). A conduct-
ing wire or strip of length / carrying a current i in a magnetic field
of strength H experiences a force H/z, tending to displace the wire
at right angles to its length and to the direction of the field. Con-
versely, if the wire is displaced in the magnetic field by the same
force, a current i will be generated in it. These simple principles
are fundamental to the design of electric motors and generators.
The same principles apply to electrodynamic 'sound motors and
generators.' If a coil of wire attached to a vibrating system, such
as a diaphragm, lies in a strong magnetic field, a vibration to and
fro in the field will generate corresponding alternating e.m.f.'s
in the coil ; or conversely, alternating currents in the coil will cause
it to oscillate at the same frequency in the magnetic field and the
diaphragm to which it is attached will generate sound waves. In
the form shown in fig. 115 a coil having a large number of turns
of fine wire is wound on a thin cylindrical former attached to the
vibrating member (a diaphragm or a reed and cone). The coil
* jfourn. Amer. Inst. Elec. Eng.y 40, p. 791, 1921.

MOVING COIL RECEIVERS 389
lies in a corresponding cylindrical gap (with radial field) of a ' pot
'
electromagnet. The more intense the field the greater the e.m.f.
developed in the coil and the greater the electromagnetic (useful)
damping. When used to receive sounds under water the area
S of the diaphragm (of predetermined frequency) and the dimen-
sions of the electromagnetic circuits are chosen as far as possible
-Thin paper
edging
Casing
D.C.
magnet coil
Fig. 115
to make the electromagnetic damping equal to the radiation
damping ( oc pcS 2/\
2), use being made of Hahnemann's lever prin-
ciple, if required, to secure increased amplitude of vibration of
the coil lying in the magnetic field. The efficiency of such a
receiver may be determined from measurements of its motional
impedance.
The Marconi-Sykes receiver #is an example of the electro-
dynamic type in which the elastic forces and moving masses are
very small and the system is heavily damped (mechanically). It
consists essentially of a 'pot' electromagnet with a thin annular
coil of aluminium wire suspended in the gap. The coil in one
method of mounting is supported on an annular pad of cotton-
wool, whilst in another it is held in the gap by a trifilar suspension
of silk thread. Such a receiver, although very insensitive, gives
remarkably good reproduction of complex vibrations, such as those
of ordinary speech. On this account it has been used extensively
in 'broadcasting.'
Perhaps the simplest type of electrodynamic receiver or generator
is the vibrating strip receiver of Gerlach and Schottky,\ similar in
principle to the Einthoven string galvanometer. A very thin
strip (3 /x) of metal foil (aluminium or Al-alloy), a few millimetres
wide, lies without appreciable tension in a magnetic field parallel
to the plane of the strip. When it is set in vibration by the
* H. J. Round, Wireless World, 15, p. 260, Nov. 1924.
f Phys. Zeits., 25, pp 672 and 675, 1924.

390 SOUND ENERGY INTO ELECTRICAL ENERGY
incident sound waves, electrical currents are induced in it. Themagnetic field is so strong that the useful (electromagnetic)
damping may reach the optimum value, i.e. equal to the radiation
damping, when the receiver becomes very efficient. This device
has been used by Gerlach * as a means of measuring absolute
sound intensities (see p. 440). The forces on the strip due to
the incident sound waves are determined by a 'null' method.
The strip is brought to rest by means of a known auxiliary current,
adjustable in magnitude and phase. This current sets up forces
in the strip exactly equal and opposite to those due to the incident
sound waves. The point of zero vibration is detected by an
auxiliary device such as a stethoscope or a very small sensitive
microphone. The forces on the strip due to the sound waves
are then known in terms of the dimensions of and current through
the strip, and the strength of the magnetic field. It is important
to observe that the method is applicable at any frequency whether
at resonance or not, the sensitiveness reaching a maximum at
resonance when small forces produce large displacements.
Induction Type - A novel and extremely efficient form of
electrodynamic sound generator and receiver is the Fessenden
oscillator f for use in sound signalling under water. The apparatus
(see fig. 116) consists essentially of an electrical transformer, the
secondary of which is free to move in a very strong radial magnetic
field of strength B. The primary winding is wound on the inner
pole face of the electromagnet in close proximity to the secondary.
The latter consists of a single turn of copper (a tube, in fact),
which has a very low electrical resistance. The current i induced
in it is consequently very great, and the force Bli is also very great
(B =15,000 lines/cm. 2 approx.). The copper cylinder therefore
experiences a large alternating force corresponding to the alter-
nations of current. This alternating force is applied to a steel
diaphragm, in contact with the water, the amplitude of which
at resonance becomes very large. As a transmitter this apparatus
has a sound-output of several kilowatts at a high efficiency.
When used as a receiver of signals of the same frequency the
process is reversed. The vibrations of the diaphragm with the
attached copper cylinder induce e.m.f.'s in the latter which are
' stepped up ' in the coil on the pole face. This coil is connected
through a valve amplifier circuit to a pair of telephones or an
* Wiss. Verofft. d. Siemens-Konzern, 3, 139, 1923 ; and 3, p. 67, 1924.
t See Electrician, 59, p. 484, 1907 ; Elect. Review, 60, p. 369, 1907;
also W. Meissner, Zeits.f. Phys., 3, p. Ill, 1920.

FESSENDEN OSCILLATOR 39i
indicating device. A similar principle is involved in Hewlett's
sound generator described on p. 161. In this case the diaphragm
itself acts as a single-turn 'winding' of a transformer, inducing
currents by its vibration, in adjacent 'pancake' coils.
Steel diaphragm
I
I ,!?
winding
Soft iron core qqenciting coil
Fig. 116—Fessenden Oscillator
A great advantage of the electrodynamic receiver is the facility
with which the mechanical and electrical quantities involved in its
design can be adjusted. The frequency, size, and damping of the
receiving surface (for example, a diaphragm) can be calculated,
and the design of the electromagnetic system and its associated
circuit adjusted to give the maximum sensitivity. From the
electrical point of view it is superior to the electromagnetic
(moving iron) type on account of the entire absence of troubles
due to hysteresis and eddy current losses in iron. Care must be
taken, of course, to ensure that eddy current losses in non-magnetic
conductors are reduced to a minimum. The coil carrying the
high-frequency alternating current must therefore be kept at a
distance from solid masses of metal ; or, as in the case of the
Fessenden and Hewlett types of receiver, the vibrating element
must form a closely coupled short-circuiting secondary to the
primary winding, thus eliminating primary self-induction and
eddy currents in neighbouring metallic masses (e.g. the iron of

392 SOUND ENERGY INTO ELECTRICAL ENERGY
the electromagnet). Under such conditions it is possible to deal
efficiently with very high frequencies which would be entirely
suppressed in an electromagnetic (moving iron) system. On this
account a moving coil or strip receiver is more suitable for the
faithful reproduction of speech sounds, which require an accurate
rendering of the high-frequency components characterising indi-
vidual speech. An electromagnetic receiver would becomedecreasingly efficient towards the higher frequencies, whereas
the losses in the electrodynamic system remain practically the
same up to the highest frequencies which it is required to receive
(of the order 10,000 p.p.s.).
Electrodynamic receivers may be divided into three classes,
according to the method of control of the moving system. All
such receivers are essentially 'velocity receivers,' the e.m.f. devel-
oped in the moving coil being proportional to the rate of cutting
lines of force in the magnetic field—that is, proportional to x
the velocity of the coil.
Type (a). If the receiver is very heavily damped, so that the
equation of motion can be written rx=¥ cos pt at any frequency,
then the velocity is given by x=¥ cos pt/r—that is, the e.m.f.
generated, which is proportional to the velocity, is directly propor-
tional to the pressure ¥ cos pt applied to the receiving surface,
and is independent of the frequency. A heavily damped electro-
dynamic system is therefore essentially a pressure receiver, equally
sensitive -at all frequencies, but of low sensitivity (since r is large
in the expression for x). Such a system, approximately achieved
in the Marconi- Sykes receiver to which we have referred, is
consequently of particular value for its faithfulness of reproduction.
Type (b). If the vibrating system may be regarded as a 'pure
mass m'—that is, the frictional damping and the restoring force
are both small and the system is of very low natural frequency,
then the equation of motion is sufficiently represented by
mx=¥ cos pt or x=¥ sin pt/mp.
The electrodynamic receiver will in this case develop an e.m.f.
inversely proportional to the frequency of the incident sound.
Type (c). Similarly, if the damping and the mass may be
neglected, we have a very high-frequency system, in which
sx=¥ cos pt, whence x=p¥ sin pt/s,
that is, the e.m.f. in the moving coil is directly proportional to
the frequency of the incident sound.

PIEZO-ELECTRIC RECEIVERS 393
By suitable choice of the form of the receiving surface and the
mechanical system it is therefore possible to arrange that the
response of the electrical system is either dependent in a certain
manner, or is entirely independent, of frequency. Such flexibility
is the great asset of these receivers. The chief drawback is the
relative insensitiveness (compared with other forms of receiver
described later), but this may be easily overcome nowadays by
the use of valve amplifiers. Here, again, the flexibility of the
system may be extended to the design of the amplifier, which
can be made to reinforce particular frequencies or frequency
ranges, or to give a uniform amplification over a wide range.
Electrodynamic receivers combined in this way with amplifiers
are invaluable in all kinds of metrical observations on sound.
Piezo-Electric Receivers - The phenomena of piezoelec-
tricity and the application of piezo-electric crystals in the pro-
duction of high-frequency sounds have already been considered
(see pp. 140 et seq.). The alternating mechanical stresses set upin such a crystal (quartz or Rochelle salt, for example), whenalternating e.m.f.'s are applied to its faces, produce corresponding
pressure fluctuations in the surrounding medium. Conversely,
if alternating mechanical pressures are applied to the faces of
the crystal, corresponding electrical fluctuations take place. Asalready stated (p. 146), the Langevin quartz 'transmitter' is also
used as a receiver of sounds of the same frequency, viz. the echo of
a transmitted beam, or signals from a similar transmitter in tune
with it. As in the case of electrodynamic receivers, the 'dynamoand motor' principle is applicable to piezo-electric receivers also,
the only difference being that we are now dealing with electro-
static effects. Rochelle salt, which is very sensitive in comparison
with quartz, has been found by Nicholson (see p. 151) to respond
readily to mechanical vibrations, in proof of which he has used
a crystal as a gramophone 'pick-up.' A great increase of effi-
ciency was obtained by thorough desiccation, static compression,
application of torque, and a suitable choice of poles and the
method of growth. The best effects are obtained when the applied
forces, due to the incident sound waves, twist the crystal about
its principal axis. Russell and Cotton # have also used Rochelle salt
crystals in a piezo-electric gramophone reproducer. They have
used such crystals, attached to metal diaphragms, as receivers
of sounds under water (piezo-electric hydrophones). The sound
waves falling on the diaphragm produce an alternating torque
* Loc. cit., p. 151.

394 SOUND ENERGY INTO ELECTRICAL ENERGY
on the Rochelle salt crystal, the resulting electrical effects being
amplified and detected in telephones. The crystal may be used
directly—that is, without the intervening diaphragm, as a meansof detecting sound waves. In this condition, however, it is very
insensitive, but the electrical fluctuations are a very faithful
reproduction of the alternating mechanical pressures. The lack
of sensitivity may be compensated by valve-amplification.
Magnetostriction Receivers - Under 'magnetostriction' is
classed a large group of magnetic phenomena * in which there
are changes in dimensions accompanying magnetisation, and, con-
versely, changes in magnetic properties accompanying mechanical
stresses. As in the case of piezo-electricity there is a recip-
rocal relation : f If a magnetic field increases the length of a
ferro-magnetic rod, then a mechanical pull will increase its
permeability beyond that of the unstretched rod. The phenomenaof magnetostriction in iron, nickel, cobalt, and manganese and
their various alloys have received the attention of a large numberof investigators. The effects are best demonstrated with a bar
or wire of nickel magnetised by means of a solenoid carrying direct
current on which is superposed an alternating current of the
desired frequency. The alternating magnetisation produces cor-
responding variations in length of the rod which emits a note
of the same frequency. If this frequency coincides with the
resonant frequency of the rod the vibrations may become very
powerful. G. W. Pierce J has applied this principle to the pro-
duction of sounds having a wide range of frequency, from audible
to supersonic, depending on the dimensions and mode of vibration
of the magnetostrictive material. He has also made use of the
converse principle in the design of sound receivers. Sound
vibrations falling on a 'piston-diaphragm' {i.e. a disc having
uniform amplitude all over its surface) caused the latter to compress
and stretch alternately a rod or a series of rods of nickel (or other
suitable material), to which it is rigidly attached. A magnetising
coil surrounding each nickel rod serves to detect the variations
of magnetisation due to the alternating stresses, the induced
currents being detected, after amplification, by telephones or a
measuring instrument. Pierce employs the ' lever principle ' when
* A good summary and bibliography of magnetostriction phenomenais given by S. R. Williams, Journ. Opt. Soc. Amer., 14, 5, p. 383, 1927.
See also numerous papers by Honda, Phil. Mag., 1902, etc.
f J. J. Thomson, Application of Dynamics to Physics and Chemistry,
p. 43, 1888. X Patent No. 283116, Magnetostrictive Devices, 1928.

MAGNETOSTRICTION AND E.S. RECEIVERS 395
the apparatus is used to generate or receive sounds in air. Therod or strip of nickel which produces large pressure fluctuations
with small displacement forms part of a lever system, the com-
plementary part of which vibrates with a much larger displace-
ment at reduced pressure. Magnetostriction sound receivers maybe made non-resonant for faithful reproduction (when large valve-
amplification is required), or resonant for maximum sensitivity at
one particular frequency. In the latter case, the best effects are
obtained by using a tuned lever system, the mechanical advantage
of the lever being adjusted according to the medium from which
the sound energy is to be abstracted. It may be of interest to
observe in passing, that Pierce has used magnetostriction vibrators
as frequency meters, frequency stabilisers, vibrators for trans-
mission and reception of underwater sound signals, as a generator
of alternating current, and in association with microphones as a
wave-detector or audio-frequency amplifier.
The Condenser Microphone - (Electrostatic.) The history
of this type of microphone commences in 1863 with the discover}-
of the ' speaking condenser ' by William Thomson. Pollard and
Garnier used a polarised condenser as a telephone receiver in
1874, two years before the invention of the electromagnetic
receiver by Bell. Numerous other individuals have experimented
since that time on the production of a condenser transmitter and
receiver of sounds, the most successful being E. C. Wente * and
H. Riegger.f The singing of a condenser carrying alternating
current of audible frequency is well known, the effect being due
to the varying force of attraction between the plates as the current
rises and falls. Conversely, if a charged condenser, connected
to an external circuit, be subjected to vibratory mechanical
stresses producing variations in the separation of its plates, then
an alternating e.m.f. will be set up in the circuit due to the changing
capacity of the charged condenser. Wente's condenser micro-
phone shown in section in fig. 117 is based on this principle. It
consists essentially of a steel diaphragm (0-002 in. thick) stretched
nearly to its elastic limit on a massive steel ring. This diaphragm
forms one plate of an electrical condenser, the other plate being
an insulated steel disc lying parallel to the diaphragm and separated
from it by an air gap of about 0-001 in. This condenser of capacity
* Phys. Rev., 10, p. 39, 1917 ; 21, p. 450, 1918 ; 19, p. 498, 1922.See also W. H. Martin and H. Fletcher, Jonrn. Amer. I.E.E., 43, p. 230,1924.
f Wiss. Verofft. a. d. Siemens-Konzern, 3, 2, p. 67, 1924 ; and Elec.
Techn. Zeits., p. 655, 1909.

396 SOUND ENERGY INTO ELECTRICAL ENERGY
C is connected in series with a battery of voltage E and a resistance
R. When the diaphragm is set in vibration by the incident soundwaves the capacity of the condenser at any instant is given byC^Cq+ C! sin pt> and the voltage across the resistance R varies
Stretching ringStretched steel diaphragm
1 O'OOl" from bach plate
.M^^^^M^ Ji ^m
HBH tp^>|p|nt!w
w?Ma\.nJ^L^^r^*
Insulation Insulated bach plate (grooued)
Fig. 117
accordingly. Wente shows that the alternating voltage e across R(when this resistance is large compared with l/C p and C x is small
compared with 2 C ) is given by
Ri-EC XR
C V(1/C ^ 2)+R 2. sin {pt +(/>),
a relation which indicates that the condenser microphone may be
regarded as an alternating current generator giving an open circuit
e.m.f. (ECj/Cq) . sin (pt-\-(f>) and having an internal impedance
l/C />. The alternating e.m.f. is proportional to the applied direct
voltage E, and in this respect the device may be regarded as a
'microphone.' Its action is reversible, however, an applied
alternating voltage producing mechanical vibration of the dia-
phragm and emission of sound energy. In this respect it is more
properly regarded in the same category as the electromagnetic and
electrodynamic receivers. [It is important to note that a receiver
of sound is often described, particularly in telephony, as a trans-
mitter (of alternating electrical power)—thus Wente's condenser
microphone, used as a receiver of sound, is described by some
writers (including Wente) as the condenser transmitter. Through-
out this book, however, a transmitter refers to a sound generator
or source of sound.] The permissible voltage E which may be
applied to the condenser microphone is about 300 volts; above
this there is risk of breaking down the insulation, 0-00 1" of air,
between the plates (the minimum value of the sparking potential
in air is about 400 volts). The steel backing plate forming part
of the condenser is grooved radially so as to give the diaphragm
the desired natural frequency and damping. Provision is also

CONDENSER MICROPHONE 397
made for equalising the pressure inside and outside the micro-
phone by means of a flexible rubber membrane, which serves also
to exclude moisture. Wente determined the sensitivity of the
microphone (a) at low frequencies by means of a small reciprocating
piston device (' pistonphone ') which applied measurable alternat-
ing pressures to the diaphragm arranged to form one wall of a small
air-enclosure, and (b) at high frequencies, by means of a thermo-
g0-6
09
£0-4
w 0-3
IS 0-2
\
\
$o-i
ccc
> c
I IcI ii C
1 i> *
Fi
I I5 c
u
Frequ
G. I]
I g5 C> «
ency
[8
> c
i r-
) cc
a
9000
10,000
phone method due to Arnold and CrandalL* Fig. 118 is a
curve for a particular microphone having a fairly constant sensi-
tivity of 0-35 millivolt/dyne over a range of frequency from 500
to 5000 p.p.s. Even outside this range, from to 8000 p.p.s., the
variation of sensitiveness is comparatively small. The natural
frequency is over 10,000 p.p.s. and the damping constant 14,000
approx. A better idea of the sensitiveness maybe obtained from
the fact that the male voice in ordinary conversation exerts a
pressure of about 10 dynes/cm. 2 at a distance of 3 cm. from the
mouth of the speaker. With a three-stage amplifier, thermocouple
and galvanometer, pressures as low as 01 dyne/cm. 2 may be
measured, whilst it is possible to measure pressures barely per-
ceptible to the ear if a pure tone from an electrical source is used
and measurements are made with an alternating current potentio-
meter. Combined with an amplifier of ordinary design the device
has an overall sensitivity which is practically uniform from 25
to 8000 p.p.s. It is therefore remarkably well adapted for the
measurement of intensities of complex tones and for the dis-
tortionless conversion of speech sounds into the corresponding
electrical oscillations. For this reason it has been used in a large
number of investigations relating to speech analysis and recording.
* Phys. Rev., 10, p. 22, 1917.

398 SOUND ENERGY INTO ELECTRICAL ENERGY
On account of the heavy air-damping and the non-resonant
character of the diaphragm the sensitivity of the condenser micro-
phone is not very great. By means of electrical tuning and valve
amplification, however, it becomes sensitive and selective over a
wide range of frequencies. When properly calibrated, the instru-
ment may be used in the converse process (the motor principle) as
a precision source of sound.
In the condenser microphone of H. Riegger a very thin mem-brane of metal foil lies between two thick plates, one of which
contains a number of holes to admit the sound waves. The air
damping on this extremely light membrane, between two air-
films, is very great. The condenser formed by the membraneand the metal plates is included in a high-frequency valve circuit
so that incident sound waves modulate the high-frequency oscilla-
tions. F. Trendelberg,* who has described the instrument, states
that it functions well as a faithful receiver of complex sound waves.
A condenser microphone of a different type has been recently
described by A. L. Foley.f In this type the condenser is formed
by two thick metal plates {not diaphragms) separated by an air
space. The sound waves passing between the plates produce
alternate condensations and rarefactions of the air. As the air
serves as the dielectric of the condenser formed by the plates, the
rapid changes of density produce corresponding fluctuations of
electrical capacity, with the accompanying alternations of current
in the circuit. Such a condenser microphone eliminates dia-
phragm resonance altogether, and, by suitable design, resonance
in the air cavity formed between the plates may also be rendered
unimportant within the range of speech frequencies. Foley's
condenser microphone has a possible application in broadcasting
and in the faithful recording of vibrations.
The Carbon Microphone - Almost simultaneously with Bell's
invention of the electromagnetic telephone, Hughes (1878)
discovered the action of the 'microphone.' J He found, what is
now a very familiar observation, that a loose contact in a circuit
containing a battery and a telephone may give rise to very loud
sound in the telephone, due to vibrations of the loose contact.
The sounds arise from the current fluctuations in the circuit as the
* Wiss. Verofft. a. d. Siemens-Konzern, 5, 2, p. 120, 1926 ; and 3, 2,
p. 43, 1924.
f Nat. Acad. Sci., April 1929. See also Nature, p. 733, May 11, 1929.
X The original microphone, a carbon rod held loosely between a pair
of carbon blocks, is now in the Science Museum, South Kensington.

CARBON MICROPHONE 399
resistance of the contact varies. The precise behaviour of carbon
or metal surfaces held in contact by a light variable pressure has
formed the subject of numerous researches, but the information
available is still of a general character only. R. Holm,* investi-
gating the variation of resistance with pressure between spherical
and plane surfaces of metal or carbon, has arrived at the conclusion
that the actual area of contact is made up of a large number of
very small areas (almost 'points'), the sum of which is usually far
less than the theoretical area of contact determined from the applied
pressure and elasticity of the surfaces. For very small pressures
the effective contact area remained almost constant, but as the
pressure increased the number of contact points increased until
at last the actual area approximated to the calculated area of con-
tact. Such observations explain the general behaviour of a micro-
phonic contact. Single-contact microphones are now rarely used,
having been replaced by the very common form of telephone
transmitter microphone. The latter consists essentially of a
diaphragm of metal or carbon covering a small cavity containing
loosely packed carbon granules or pellets. The pressure between
the pellets is gravitational, and the current is led in and out through
two carbon plates, one of which may be the receiving diaphragm.
The small pressure-variations produced in the microphone whensound waves excite the diaphragm produce changes of electrical
resistance of the multiple contacts, which are indicated by current
fluctuations when a battery and telephones are connected to the
microphone. The process is essentially a relay action, since
the alternating electrical power obtainable from the microphone
circuit is drawn from a battery, and may greatly exceed the
mechanical power absorbed by the microphone. By increasing
the battery power in the primary circuit of the microphone (using
a transformer to separate the alternating from the direct current)
the electrical power output for a given amplitude of vibration is
also increased. The limit is set by heating and arcing at the carbon
contacts, these effects resulting in loud hissing and ' frying ' sounds
heard in the telephone. This burning of the carbon contacts, once
started, tends to grow more serious, with eventual failure of the
microphone. Commercial forms of microphone are described in
various textbooks on telephony.f Two of these types are shownin fig. 119. Type (a) is similar to those in general use in telephony.
A carbon or metal diaphragm about 2 in. diameter serves to
* Zeits.f. Techn. Phys., 3, pp. 290, 320, 349, 1922; 6, p. 166, 1925, and
8, p. 141, 1927. f See Dictionary of Applied Physics, 2, p. 585.

4oo SOUND ENERGY INTO ELECTRICAL ENERGY
receive the sound waves and to compress the carbon granules byits vibrations. The diaphragm is suitably damped by means of
flannel or cotton-wool washers, to avoid pronounced resonance
effects which would tend to distort the voice of a speaker. Thesecond type (&), the 'button' microphone, is smaller (about
J to f in. diameter) and is designed for attachment as required
Carbondiaphragm
.Flannel
packing
Carbon'discs
W% -^Carbon""
granules
Cotton
wool
-Metal case (b)
(a)
Fig. 119—Carbon Granule Microphones
to a diaphragm or any other form of vibrator. Two parallel carbon
discs are supported in a little brass capsule, one on a mica disc, the
other soldered to the brass body. A soft felt ring surrounds the
carbons and presses lightly on the mica disc. Two-thirds of the
cavity thus formed is filled with carbon granules or pellets. Such
a microphone, screwed on the vibrating surface, may be used
either with its back fixed {'solid back') or free ('free back' or
'inertia'). In the latter case the wire connection to it must be
very light and flexible, exercising no appreciable restraint on the
vibration of the microphone. Such microphones attached to
diaphragms form very sensitive receivers of sound, but in spite of
their great sensitivity they have many drawbacks. One trouble
is known as 'packing,' the carbon granules clinging together, due
to moisture or wedging in the lower part of the cavity. In such
cases the resistance falls to an abnormally low value and the
microphone becomes insensitive. The 'frying' noises to which
we have referred not only set a limit to the maximum current
which the microphone can carry safely, but also to the use of valve
amplifiers which magnify both the signals it is desired to receive
and also the 'parasitic' noises. For general purposes, as in tele-
phones or in submarine hydrophones, where accurate reproduc-
tion is not essential, granular microphones are extremely useful.

CARBON MICROPHONE 401
They undoubtedly introduce distortion, however, (a) due to the
free vibrations of the microphone itself, the mica disc with
attached button forming a resonant system with only a moderate
degree of damping, and (b) due to the ' push ' and ' pull ' action of
the vibrations producing unequal changes of resistance, e.g. a
microphone of 100 ohms normal resistance cannot possibly vary
more than this amount in one direction, but may exceed it manytimes in the other direction ; the curve connecting resistance and
pressure (including tension) is not a straight line. The distortion
due to (a) can be reduced by increased mechanical damping,
whilst that due to (b) can be compensated by using a double
'push-and-pull' microphone, equivalent to two microphones
arranged in opposite ways on the same vibrating surface. A novel
type of granular microphone, sometimes used in 'broadcasting,'
employs a large area (about 3 in. square) of granules covered by a
non-resonant sheet of insulating material.* The current through
the microphone flows from side to side, instead of from face to
face as is customary, and the sound waves fall on the thin lamina
covering the granules. It is claimed that these ' transverse current
microphones' give a fairly uniform response to sound waves of
all frequencies encountered in speech and music. The damping
effect of a microphone attached to a diaphragm may be consider-
able, as shown in the oscillograph records of a rubber microphone
on a steel diaphragm in fig. 51, p. 162. When such a combination
is used to receive sounds of a particular frequency, therefore, it is
desirable for maximum sensitiveness to choose the area of the
diaphragm so that the radiation damping is equal to the micro-
phone damping,| the thickness of the diaphragm being subse-
quently chosen to give the desired frequency. R. W. Boyle X nas
constructed carbon granular microphones to respond to the very
high-frequency sounds emitted from quartz oscillators and short
steel rods. The granules are held loosely in a cavity formed
between two small steel discs with attached carbon plates, electri-
cally insulated from one another. These steel discs have a high
natural frequency corresponding to that of the sounds they are to
receive; they are relatively insensitive to sounds of audible
frequency. In using the high-frequency microphone it is necessary
to couple the secondary of its transformer to a 'heterodyne'
circuit so that the beat note may, after amplification, be heard in
* The Marconi-Reisz and the Igranic microphones are examples ofthis type.
t See, for example, J. H. Powell, Proc. Phys. Soc, 37, p. 84, 1925.
X Trans. Roy. Soc. Canada, 3, xvi, p. 293, 1922.
26

402 SOUND ENERGY INTO ELECTRICAL ENERGY
telephones. Alternatively the H.F. secondary currents may be
measured on some sensitive form of electrostatic voltmeter (e.g.
a Moullin voltmeter or a Lindemann electrometer). Boyle used
microphones in this way up to a frequency of 42,000 p.p.s. for
detecting sounds under water.
Unless precautions are taken, granular microphones are un-
suitable for accurate metrical work. As detectors of feeble sounds
they have a wide application in submarine signalling, and the
detection of ship's noises and explosion impulses at long ranges.
Whenever possible, however, they are being superseded by
electromagnetic or electrodynamic receivers (magnetophones),
coupled with valve amplifiers. The carbon granular microphone
is a good example of an electrical sound receiver which does not
operate on the dynamo principle ; its action is irreversible.
Thermal Receivers. Hot-Wire Microphones. Resonators -
We have hitherto considered only the direct mechanical conversion
of sound energy into electrical energy, using diaphragms or similar
vibrators as intermediaries. A method of sound reception which
has attained considerable importance makes use of the thermal
effects produced by an alternating current of air on an electrically
heated wire or strip. In certain respects the method may be
regarded as the converse of the thermophone principle (see
p. 203), in which alternating electrical currents set up an
alternating flow of air in the neighbourhood of a heated wire.
The cooling effects produced on an electrically heated wire in
streams of air of different steady velocities have been studied by
L. V. King,* A. E. Kenelly,-f J. S. G. Thomas, J and others,
'hot wire anemometers' having been devised on this principle.
As a means of detecting and measuring alternating air-flow (as
in a sound wave), the hot-wire principle has been developed
mainly by W. S. Tucker and E. T. Paris.
§
The Tucker hot-wire microphone was designed in the first
instance for the detection of enemy guns during the war, but
latterly it has been modified so that it can be used for the detec-
tion and measurement of continuous sounds. The instrument
consists of an electrically heated 'grid' of fine platinum wire
mounted in the neck of a Helmholtz resonator. The platinum
* Phil. Trans., 214, p. 373, 1914.
t Amer. Phil. Soc. Proc, 53, p. 55, 1914.
% Phil. Mag., 39, p. 518 ; and Proc. Phys. Soc, 32, p. 291, 1920.
§ Trans. Roy. Soc, 221, p. 389, 1921. See also R. S. Maxwell, Phil.
Mag., 6, p. 945, Nov. 1928.

HOT-WIRE MICROPHONE 403
grid is held in a small rod of glass enamel mounted on a mica
disc, the latter having a pair of annular silver electrodes attached
to its faces (see fig. 120). The grids are made in the first place
of Wollaston wire, the silver coating being removed by meansof nitric acid after the wire has been mounted in position. Thewire, about 0-0006 cm. diameter, carries a maximum current of
about 30 milli-amperes. The average resistance of the grid at
10° C. is about 140 ohms, and about 350 ohms when carrying
a safe working current of 25 to 28 milli-amperes, which heats the
grid to just below a red heat. The natural frequency of the
resonator, of course, depends on the volume v of the container and
the form of the neck, N (see p. 186). With a neck 2-2
±_Glass enamelrod
PL grid
C
277' \ V
cm. long, 0-75 cm. internal diameter, a volume of 290 c.c.
gives the resonator a frequency of 116 p.p.s., whilst a volume of
68 c.c. gives it a frequency
of 240 p.p.s. For frequen-
cies below 200 p.p.s., brass
tubing 2 to 2J in. diameter
is used, whilst at higher
frequencies tubing about 1
in. diameter is the most
suitable. It was found that
the material from which the
resonator was made, and
the thickness and rigidity
of the walls have a marked
effect on its resonating pro-
perties. For experimental
purposes it is often desir-
able to use a microphone
whose natural frequency
can be varied continuously.
This is easily arranged byfitting a plunger inside the
brass container, or by mak-
ing the container in two
Neck of Helmholtzresonator
Fig. 120—Hot-Wire Microphone (Tucker)
tubular parts, one sliding over the other. Another method of
tuning is to alter the length of the neck, but on account of the
effects of draughts on the hot grid it is inadvisable to make the
neck shorter than 1 cm. When the air in the neck is set in
vibration by a sound of suitable frequency, the hot grid is cooled

4o4 SOUND ENERGY INTO ELECTRICAL ENERGY
and a change in resistance, which may be regarded as partly
oscillatory and partly steady, takes place. There are thus two
ways of using the microphone
:
(a) The Amplifier Method - The oscillatory effect is intro-
duced into a low-frequency valve-amplifier circuit, and the output
current passed through telephones or a tuned vibration galvano-
meter. With a suitably designed amplifier the magnitude of the
output current may be used to estimate the amplitude of a sound.
(b) Wheatstone 's Bridge Method - This is preferable to method(a) on account of its greater simplicity and freedom from variations
of sensitivity. The hot-wire grid forms one arm of a balanced
bridge circuit, the bridge current being adjusted to give the
requisite heating current through the grid (360 ohms when hot).
In most cases it is sufficient to take the deflection of the galvano-
meter as a measure of the intensity of the sound affecting the
microphone; but other methods may, of course, be used, such as
measuring the increase of current required to bring the grid back
to its initial resistance or determining the change of resistance
when the current is maintained constant. It is found that the
change of resistance SR produced by a sound varies with the total
resistance R of the hot grid, so that SR=0-2(R—
R
), R being
the cold resistance of the grid. Therefore by varying R, or what
is the same thing by varying the heating current, the sensitivity
of the grid can be varied in a perfectly definite manner. Thequantity SR/R for a sound of ' standard ' intensity might therefore
be used to define the sensitivity of the grid. The calibration of
the grid is carried out in steady air streams of known velocity,
and in both -\-ve and — ve directions. It is found that the change
of resistance SR in a steady stream of velocity U is expressed by
the relation
SR=SR +tf(U-V )2+6(U-y )4+ . . .etc.,
where SR is the maximum increase in resistance occurring whenU=V , the current U being taken as -\-ve when flowing into
the resonator. Applying these observations to alternating air-
currents of small amplitude, the resultant effect is found to consist
of three parts: (1) a steady drop in resistance S^cc U 2; (2) a
periodic change of resistance SR 2qc U sin pt\ and (3) a periodic
change SR3<x U 2 cos 2pt. The third effect is found to be quite
negligible, the note of double frequency 2p being utterly obscured
by the fundamental p in (2). It will be seen, therefore, (a) that
the steady drop in resistance, proportional to U 2, is a measure of

HOT-WIRE MICROPHONE 405
sound intensity, and (b) the alternating effect in (2), proportional
to U, is a measure of amplitude. The former of these quantities
is measured directly on the Wheatstone's bridge, and the latter
by the amplifier method. Introducing the appropriate constants
in SRX and SR 2 from the 'direct flow' calibration, the absolute
value of U can be determined. It should be noted that this value
of U is the particle-velocity in the neck of the resonator, not in the
undisturbed sound field. Tucker and Paris checked these deduc-
tions by measuring the sound intensity, by the Wheatstone's bridge
method, at different distances from an electrically maintained
tuning-fork in the open air. It was found that the relation
between the vibration galvanometer deflection 8 and the dis-
tance r was Sac 1/r 2, indicating that the deflection is proportional to
the sound intensity. The instrument has a wide application in
comparative measurements of sound intensity and distribution of
sound—Tucker and Paris refer to its use, for example, in deter-
mining the magnifying and directional properties of trumpets,
the diffraction effects with a large circular disc (see p. 310), etc.
In addition to its use in metrical work, the microphone serves
as a sensitive tuned detector of signals at long ranges whilst re-
maining relatively insensitive to neighbouring sounds of other
frequencies. In this respect it is much superior to the granular
carbon microphone, for example. The damping of the micro-
50
40
s:
•2 30-to
^20
10
/ \
/ \
/ \/ \
VV210 220 230 240 250 260 270
Frequency (p.p.s.)
Fig. i 21 a—' Resonance Curve ' of
Hot-Wire Microphone—Single
Resonator
!<iU
/\
75
50
25
^i
vV60 65 70 7 5 80 85 90
Fig. 121B—Resonance Curve withDouble Resonator
phone is fairly small, in a particular case of frequency 240 p.p.s.,
shown in fig. 121a, the response fell to 0-1 of its maximumvalue by detuning 7 per cent.
—
i.e. the ratio n/p= l±0-01. The
magnitude of the response depends, of course, on the degree of

406 SOUND ENERGY INTO ELECTRICAL ENERGY
damping, and therefore to obtain great sensitivity and 'selectivity'
the damping must be small. For some purposes, however, sharp
resonance may be a disadvantage, as, for example, when the
source of sound is liable to small variations of pitch, or whenallowance must be made for the Doppler effect—whilst at the
same time it may be desired to retain a high degree of sensitivity.
To meet such requirements a modified Boys' Double Resonator
(see p. 189) has been used.* This may consist of two parts,
(i) a resonator of the ' stopped pipe ' variety, and (ii) a resonator
of the Helmholtz pattern. These are combined by inserting
the neck of the latter into a small hole in the stopped end of
the pipe. Such an arrangement has two resonant tones, which
are separated by a frequency-interval depending on the relative
dimensions of the various parts of the compound resonator. Thetheory of the method is given by Rayleigh and has been extended
in various papers by E. T. Paris,f who also deals with combina-
tions of two or more resonators arranged in various ways.f
In the simple case with which we are now dealing, the resonator
shows the usual characteristics of a coupled system having two
resultant tones, given by
irn 2ttg In n 1tan—- = nA
2n ck \tij_ n
where n and n ± are the 'independent' frequencies of the pipe
and the resonator respectively; k is the 'conductance' of the
neck of the resonator, and c is the velocity of sound in air.
The possible values of n are best obtained by a graphical solution
of this equation. Paris has found that the resonant frequencies and
forms of the resonance curves are in agreement with calculation.
The hot-wire grid is placed in the neck connecting the two resonant
cavities, where the motion of the air is greatly increased (see p. 189).
Tucker and Paris have used the doubly resonated hot-wire micro-
phone as a means of measuring the strengths of very weak sound-
signals at long distances from sirens mounted on light-vessels and
lighthouses. The best condition of tuning from a practical stand-
point was found to be that in which two resonance peaks of equal
magnitude are obtained with a relatively small dip between them
(see fig. 121b). In the midst of disturbing sounds this instru-
ment has been used to pick up, at long distances, signals which
* See C. V. Boys, Nature, 42, p. 604, 1890 ; Rayleigh, Sound, 2,
p. 45 ; and E. T. Paris, Proc. Roy. Soc, 101, p. 391, 1922 ; Phil. Mag.,48, p. 769, 1924, and 2, p. 751, 1926. f hoc. cit.

HOT-WIRE MICROPHONE 407
are quite inaudible.* When used out in the open or on board
ships the aperture of the resonator is protected from disturbing
draughts by a ' loofah ' screen. As might be anticipated, a thermal
microphone of this nature has a certain lag determined by the
heat capacity of the wire. Consequently it becomes increasingly
sensitive towards the lower frequencies. In fact, the hot-wire
microphone was first employed to detect 'infra-sound'—that is,
the very low-frequency sound emitted from the mouth of a gun(pnde de bouche), the Helmholtz resonator in such a case having
a large volume (10 to 20 litres). Using this type of microphone,
vibrations of the order of 1 p.p.s. from a large explosion in Holland
were recorded at Woolwich (262 miles away). The effect of such
low-frequency 'sounds' may be simulated by the opening and
closing of a door. The upper limit of usefulness of the micro-
phone is reached at a frequency near 500 or 1000 p.p.s., when the
thermal lag becomes more serious.
As we have stated above, the effective area of a resonant receiver
which re-radiates the whole of its energy to the medium is equal
to A 2/-"-, where A is the wave-length of the incident sound. In
the most efficient receiver which utilises 50 per cent, of the total
energy, the effective area is A 2/47r. This implies that the energy
density in the neck of a small resonator is greater than that in
the undisturbed field, in the ratio X 2/ttS or A 2/47rS respectively,
where S is the actual area of the orifice. Since the driving force
Sp is not amplified by the resonator, these ratios also represent
the velocity or displacement amplification coefficients. The radiation
resistance of an area S in the undisturbed plane wave is equal to
pcS (see pp. 55 and 376), the radiation resistance R of the orifice
(diameter small compared with A) is pcS X 7rS/A2—that is
R=tt/x:S 2/A2=^2S 2/477C (where X=27rc/n),
which is much less than that of the same area S of wave-front.
The pressure variation therefore produces a much larger velocity
amplitude in the neck of the resonator than in the medium.
f
The expression for R must be multiplied by 4 if half the energy
of the resonator is absorbed in a detecting device, e.g. the hot-
wire microphone.
A. v. Hippel J has examined, theoretically and experimentally,
the possibilities of using thermal methods for the faithful conver-
* See W. S. Tucker, Roy. Soc. Artsjourn., 71, p. 121, 1923.
t See I. B. Crandall, Sound, etc., p. 175.
t Ann. der Physik, 75, p. 521, 1924 ; and 76, p. 590, 1925.

408 SOUND ENERGY INTO ELECTRICAL ENERGY
sion of mechanical vibrations into alternating electrical currents.
In the first place he has determined the ' node effect'—that is, the
direct heating effect in a thin wire due to pressure fluctuations in
the surrounding medium.* A wire of platinum 5 p, thick placed
at a point in air where the pressure amplitude is 10-4 atmosphere
(about 100 dynes/cm.'2) at a frequency of 100 p.p.s. will have
a temperature-amplitude 3-5 xlO-6 degree C. The effect is
therefore too small to have any practical significance. He also
deals with the velocity (or antinode) effect in cooling a heated
wire, and shows that a convection current of air flowing past a hot
wire is necessary if the cooling-frequency is to be the same as the
sound-frequency—the analogy being that of the permanent magnet
in an electromagnetic telephone—otherwise the frequency would
be doubled.
Underwater Receivers. Hydrophones! - The detection of
sounds under water presents analogous problems to those already
considered in the case of air. The generalprinciples to be observed
in the design of efficient underwater receivers are the same as in
air, but the methods of applying these principles may be markedly
different. The difference arises principally from the fact that the
acoustic resistance (pc) of water is of the order 1-5 x 10 5, whilst that
of air is only 40, the ratio of these quantities water/air being
3750: 1. Now it has been shown, p. 54, that the intensity I in
a sound wave is expressed by
1 p2 —
I = - - 22 whence pmax qc VpcL pc
for sounds of the same intensity in different media. Consequently
the relative pressure amplitudes for waves of the same intensity
and frequency in water and air would be 61:1 approximately.
Similarly the expression for intensity I may be written in terms of
velocity or displacement-amplitude a; since p=cp£ (see p. 55)
or
p
max =cp£max =cpna; we have
I =\pcn 2a 2, whence a qc l/pc
for sounds of the same intensity and frequency in different media.
* See also Friese and Waetzmann, Ann. der Physik, 78, 39, 1925.
f See C. V. Drysdale,>wrw. I.E.E., 58, p. 575, 1920; and Mechanical
Properties of Fluids, p. 290 ; also F. Aigner, Unterwasserschalltechnik,
pp. 202-238; W. H. Bragg, World of Sound, p. 169 ; and Engineering, 107,
p. 776, 1919 ; Nature, July 1919 ; F. L. Hopwood, Nature, Aug. 1919;
H. C. Hayes, Amer. Phil. Soc. Proc, 59, 1, pp. 1 and 371, 1920 ; andA. Troller, La Nature, 49, p. 4, 1921.

HYDROPHONES 409
The relative displacement amplitudes for sounds of the same
intensity and frequency in water and in air is therefore 1 : 3750. It
is not surprising to learn, therefore, that the most sensitive sound
receivers in air are ' displacement ' receivers (Helmholtz resonator
type), whereas in water they are 'pressure' receivers. Of course,
it is sometimes advantageous, when sensitiveness is not of primary
importance, to use pressure receivers in air and displacement
receivers in water. The majority of subaqueous receivers are,
however, of the pressure type (see, however, p. 379).
One of the earliest forms of underwater receiver consists simply
of a thin membrane stretched tightly across the end of a tube, the
lower end of which dips under the water, whilst the upper end
leads to the observer's ear. Such a device was used, for example,
by Colladon and Sturm in Lake Geneva to receive the sound of a
bell struck under water. This simple device has been elaborated
in various ways, e.g. in the Broca tube, which consists of a small
metal capsule (like an aneroid barometer) fixed to the tube. Asimilar, but less resonant, receiver of this nature employs a thick-
walled rubber bulb or tube to replace the diaphragm. This
modification, in addition to reproducing sounds more faithfully,
possesses the advantage of more efficient transmission of the vibra-
tions from water to air ; this latter improvement being ascribed to
the fact that the radiation resistance of rubber is intermediate
between that of water and air (see p. 277). Such simple receivers,
although fairly effective, are neither very sensitive nor very con-
venient to use. No provision is made for amplifying the sound,
and the loss of intensity and change of quality in transmission
through long and winding pipe-lines is very serious. At the
present time, therefore, practically all underwater sound-receivers,
or hydrophones as they are called, are of an electrical character.
They consist usually of microphonic, electromagnetic, or electro-
dynamic detectors attached in various ways to diaphragms in con-
tact with the water. Microphones are frequently used on account
of their great simplicity and sensitivity, but with the development
of valve-amplifiers electromagnetic and electrodynamic detectors
are in many circumstances preferable. The simplest and most
common form of hydrophone is shown in fig. 122. It consists of
a massive lenticular metal disc on which is rigidly clamped a metal
diaphragm with a carbon ' button ' microphone screwed on a small
boss at the centre. A cable passing through a watertight gland con-
nects the microphone to a battery, transformer, and telephones at
the listening-post. The frequency and damping of the diaphragm

4 io SOUND ENERGY INTO ELECTRICAL ENERGY
Watertight
gland
Massive brasscarcase
Fig. 122—Non-directional Hydrophone
may be calculated in the manner indicated on p. 159. Theloading effect of the water is an important consideration in under-
water diaphragm receivers. This load is equivalent to a mass of
water f-nr3 spread uniformly over, and moving with, the diaphragm
of radius r (or it may be regarded alternatively as a mass of one-
t fifth this amount 'attached'Cat)le
l m, Mto the centre). I he vibrating
mass in a receiver of appreci-
able diameter may therefore
be fairly large. Consequently,
in accordance with the lever
principle (see p. 380), it is im-
portant that the mass of the
metal ring on which the dia-
phragm is mounted should be
many times greater than the
effective mass of the dia-
phragm. Otherwise an ap-
preciable proportion of the
energy of vibration of the whole system would reside in the
mounting. It is important also that the diaphragm should be
rigidly attached to the mounting, otherwise excessive vibration
of the edge of the diaphragm will be set up and energy will be lost
in local flow and in frictional damping. In the case of electro-
magnetic receivers the damping due to radiation and friction losses
must be made approximately equal to the useful damping. This
can be done, of course, with microphone detectors, but it is not
usually so important in this case. A rough idea of the sensitive-
ness of an ordinary hydrophone (granular microphone type) maybe obtained from the observation that the sound of a Fessenden
oscillator (emitting \ H.P. at 500 p.p.s.) is readily detected, without
amplification, at 20 or 30 miles distance in the sea. It is of
interest to compare this with the case of a siren of 200 H.P. used
to transmit signals in air, the limiting range with the most sensitive
detector available being in the neighbourhood of 10 miles. In air,
as we have seen, the efficiency of power-sources of sound is very
low and the attenuation in transmission is very great, whereas
underwater sound sources are very efficient and attenuation losses
are not so serious as in the atmosphere.
For signalling purposes, the diaphragm and microphone of a
receiver may both be tuned to the frequency of the signals, the
resonant properties of a diaphragm being in such cases advan-

HYDROPHONES 411
tageous. If, however, it is desired to use a hydrophone as a means
of detecting and recognising complex sounds under water, such as
the propeller noise of a submarine, it is better to use a non-resonant
receiver. For this purpose, hydrophones have been constructed
of thick rubber to which a microphone with a rubber diaphragm
(to replace the mica) is attached. With a heavily damped micro-
phone of this nature the noise of a ship is more characteristic.
Even with a resonant diaphragm hydrophone it is easily possible
to distinguish between the reciprocating 'beat' of a trawler and
the turbine 'rush' of a cruiser. Hydrophones carried by ships
are of various kinds : (a) the portable type (used chiefly on small
vessels, drifters, etc.), which is slung outboard when required;
(b) inboard type built flush with the hull, the diaphragm being in
direct contact with the water; (c) inboard type, in which the
receiver hangs in a water-filled tank inside the hull—the sound
reaching the receiver after penetrating the hull and the water
in the tank; (d) towed hydrophones in which microphones are
enclosed in rigid or flexible streamline bodies towed astern of the
ship.
The principal trouble, common to all types of microphonic
hydrophones, is that due to 'water-noise'—the movement of the
ship through the water, breaking waves, eddies and bubbles
carried down from the bows, etc., all contributing towards the
general noisiness of the microphone, the granules of which are
particularly sensitive to any form of shock excitation. Conse-
quently electrodynamic and electromagnetic receivers (magneto-
phones) are now more generally used, their lack of sensitiveness
being compensated by means of valve amplifiers. Fixed hydro-
phones, mounted on tripods resting on the sea-bed, are relatively
free from disturbing noises, and are used as sentry hydrophones
in particular localities, or on surveyed base-lines for sound-
ranging purposes (see p. 483). In modern underwater signalling
apparatus the sound generator, as we have seen, often serves as a
receiver also. Examples of this are to be found in the Fessenden
and Signalgelleschaft transmitters, and the Langevin piezo-
electric high-frequency transmitter. We shall refer to other moreimportant types of hydrophone in dealing with directional recep-
tion of sound.
DIRECTIONAL RECEPTION OF SOUNDThe problem of directional reception is analogous in most
respects to that of directional transmission. In the latter case we

4 i2 DIRECTIONAL RECEPTION OF SOUND
are concerned, however, mainly with questions of energy, the range
obtainable with an approximately parallel beam being obviously
greater than with a spherically divergent beam. In signalling,
also, questions of secrecy may be involved. As regards reception,
it is of little advantage in many cases to have an extremely sensitive
receiver if it gives no indication of the direction of the source from
which the sound emanates. The question of directional reception
is, therefore, at least as important as that of sensitiveness. Thereceivers to which we have hitherto referred may be regarded as
non-directional, the sensitivity being the same in all orientations.
As in the case of transmitters, directional properties may be
obtained by the use of surfaces of large dimensions, compared with
a wave-length of the incident sound, e.g. the use of reflectors,
trumpets, etc., with a small receiver at the focus, or by means of a
large sensitive disc such as the quartz plate in a Langevin piezo-
electric receiver. Alternatively we may obtain directional effects
by means of two or more receivers suitably arranged as in the case
of multiple sources of sound. The principles involved in such
methods of directional reception are essentially the same as in
directional transmission described on p. 215, etc. In what follows
we shall therefore refer only to special types of receivers, most of
which may be classified in the manner just indicated.
Binaural Methods - The perception of direction by means
of a pair of ears has already been considered on p. 359. The prin-
ciples involved in this binaural (two-ear) method have been widely
extended for sound reception both in air and in water. Thebinaural effect, according to Rayleigh's view, is dependent on the
phase difference of arrival of the sound wave at the two ears ; but
there can be little doubt that other factors, such as intensity differ-
ences, must also be invoked in order to explain all the relevant
facts. The phase- difference theory, however, provides a useful
basis and has at any rate been fruitful in its application to ' artificial
'
binaural reception. For example, if it is desired to locate a dis-
tant aeroplane at night when the unaided ears can only form a very
rough estimate of its direction, a pair of large receiving trumpets
mounted so as to rotate in azimuth and elevation may be used. In
the first place, the amount of sound energy reaching the ears is
increased by means of the trumpet-collectors ; and, secondly, the
directional accuracy is increased by increasing the distance apart
of the trumpets. Assuming the axes of the trumpets to be in the
same plane as the source of sound, rotation of the platform support-
ing the trumpets will vary the path difference of the sound reach-

BINAURAL METHODS 413
ing the two ears (one connected to each trumpet). As this path
difference will decrease on one side and increase on the other, the
impression received will be that of the sound crossing over from
one ear to the other. At the exact point where the 'cross over'
occurs, i.e. of 'binaural balance,' the common axis of the trumpets
will be directed towards the source of sound. The accuracy
obtainable in air is of the order of ±2 or 3 degrees under good
listening conditions. Errors are likely to arise from the motion
of the sound source, and due to temperature and wind refraction.
In practice, the necessary corrections for such effects are tabulated.
Actually four trumpet receivers were mounted on a commonplatform, one pair in azimuth and the other pair in elevation (about
12 ft. apart). The former had an observer who operated the
control (for all the receivers) in azimuth, whilst a second observer,
listening on the other pair, made the elevation adjustment. Themethod was employed extensively during the war in the location
of aeroplanes, a number of binaural receivers at triangulated
positions serving to give a 3-dimensional instantaneous position
of the rapidly moving source.
The same principle has been developed, mainly in America,
for the directional location of sources of sound under water, moreparticularly in the location of submarines.* In this case it is
necessary to increase the separation of the receivers to obtain the
same directional accuracy, for the velocity of sound in the sea is
about 4|- times that in air, the phase differences being reduced
in corresponding proportion. In order to avoid the practical
difficulties of rotating a long arm carrying the receivers under
water, the principle has been slightly modified.
Binaural Compensator - Instead of rotating the line of re-
ceivers in order to determine the direction of zero phase differ-
ence, it is sometimes more convenient to compensate for this
difference by introducing artificially an increased path-length in
the side which is nearer the source. The principle is similar to
that employed to demonstrate interference between sound waves
from the same source, travelling by different paths (two tubes) to
the same receiver,! the phase difference of arrival being measured
by the change of length necessary in one of the tubes to bring the
two trains of waves directly 'in phase' or 'out of phase.' Let us
suppose two receivers M 2 and M 2 a distance d apart, respectively
distant x and (x4-8w,) from a source of sound S, to be connected
* See Hayes, Drysdale, and others, loc. cit.
f See Tyndall, Sound, p. 261.

414 DIRECTIONAL RECEPTION OF SOUND
through suitable circuits to two telephone earpieces T 2 and T 2 ,
these in turn being connected to the ear through two air-tubes
of adjustable lengths l± and /2 . When 8^=0, that is, the source
is symmetrical with regard to M. ± and M 2 , let /1 =/2 =/. If the
receivers are in water in which the velocity of sound is cwi wemust have for binaural balance 8 w/cw =$l/ca , where the suffixes
w and a refer to water and air respectively, and SI is the ' com-
pensation' necessary to make the total path-lengths from the
source S to the two ears of the observer equal. Consequently
SI, which is directly observed at the point of binaural balance, is
a measure of Sw , and therefore of the bearing 6 of the source
of sound S relative to the line M 1M 2 joining the receivers. For
S^^cos 6 if d is small relative to the distance x from M. ± or
M 2 to S, whence 6= cos~1(Sw/d) = cos_1(8/ . cjdca), which, in the
case of transmission through water cJca =4t-5, 6= cos-1(4-5S//d).
In the application of the method a circular form of compensator
(known as the American Binaural Compensator) is used, shown
diagrammatically in fig. 123. It consists essentially of a fixed plate
in which two circular grooves,
not quite complete, are cut as
shown. A rotatable coverplate,
fitting closely over this fixed
plate, carries two stoppers ss,
which close the grooves. Onboth sides of these stoppers are
cut in the upper plate two radial
bypass grooves which connect
the inner and outer groove of
the lower plate. The sounds
from the telephones T x and T 2
pass around a portion of the
outer groove and return via the
inner groove to the stethoscope
which connects to the ear. Ro-
tation of the upper plate, and
consequently the stoppers ss, increases the length of one of
these paths and diminishes the other, a pointer attached to the
plate indicating directly the bearing 6 of the source of sound.
The zero position of the scale is obtained by adjustment on a
source known to be symmetrical with respect to the receivers
(Sw =0). The principle is applicable to any type of receiver in
air or in water. The use of one pair of receivers in this way
From Telephone
No.l ~
Fig. 123-
From Telephone- No. 2
To ears of observer
-Binaural Compensator(American)

GEOPHONES 4i5
sometimes leads to an ambiguity in direction, only the line of the
source being determined. If, however, a third receiver is added,
the three forming an equilateral triangle, ' binauralling ' on each
pair removes the ambiguity.
Binaural Geophones * - The binaural principle has been used
not only to determine the direction of sound in the atmosphere
and in the sea, but in the ground also. The requirement of a
sound-direction apparatus arose during the war in connection with
the location of enemy trenching and mining operations. Apparatus
known as the geophone was devised to detect the sounds involved
in such underground operations, and a pair of receivers employed
to give the direction from which the sounds proceeded. A single
To ears of observer
or to binauralcompensator
Mica discs
Mercury
Air cavities
Fig. 124—Geophone
geophone, used simply as a detector of underground sounds, con-
sists of a hollow wooden box, 3 in. in diameter by 2 in. deep,
divided into three compartments by two mica discs (see fig. 124).
The space between the discs is filled with mercury whilst the two
outer air cavities connect to the ears by stethoscope tubes. Onaccount of the large inertia of the mercury, vibrations affecting
the box as it lies in contact with the ground produce fluctuations
of volume of the air cavities and corresponding compressions in
the ear of the observer. The device is very sensitive to ' thudding
'
sounds. When two geophones are used on the binaural principle
only one cavity in each geophone is required. The observer
adjusts the line of the geophones on the ground until the binaural
' cross over' is obtained. Assuming the direction of propagation
* See H. S. Ball, Inst, of Mining and Metallurgy, April 10, 1919 ; see
also Bragg, World of Sound, p. 179.
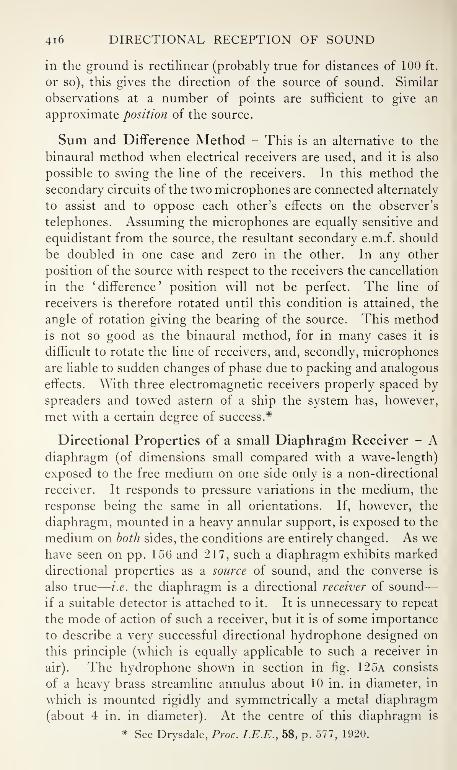
416 DIRECTIONAL RECEPTION OF SOUND
in the ground is rectilinear (probably true for distances of 100 ft.
or so), this gives the direction of the source of sound. Similar
observations at a number of points are sufficient to give an
approximate position of the source.
Sum and Difference Method - This is an alternative to the
binaural method when electrical receivers are used, and it is also
possible to swing the line of the receivers. In this method the
secondary circuits of the two microphones are connected alternately
to assist and to oppose each other's effects on the observer's
telephones. Assuming the microphones are equally sensitive and
equidistant from the source, the resultant secondary e.m.f. should
be doubled in one case and zero in the other. In any other
position of the source with respect to the receivers the cancellation
in the 'difference' position will not be perfect. The line of
receivers is therefore rotated until this condition is attained, the
angle of rotation giving the bearing of the source. This methodis not so good as the binaural method, for in many cases it is
difficult to rotate the line of receivers, and, secondly, microphones
are liable to sudden changes of phase due to packing and analogous
effects. With three electromagnetic receivers properly spaced by
spreaders and towed astern of a ship the system has, however,
met with a certain degree of success.*
Directional Properties of a small Diaphragm Receiver - Adiaphragm (of dimensions small compared with a wave-length)
exposed to the free medium on one side only is a non-directional
receiver. It responds to pressure variations in the medium, the
response being the same in all orientations. If, however, the
diaphragm, mounted in a heavy annular support, is exposed to the
medium on both sides, the conditions are entirely changed. As wehave seen on pp. 156 and 217, such a diaphragm exhibits marked
directional properties as a source of sound, and the converse is
also true
—
i.e. the diaphragm is a directional receiver of sound
—
if a suitable detector is attached to it. It is unnecessary to repeat
the mode of action of such a receiver, but it is of some importance
to describe a very successful directional hydrophone designed on
this principle (which is equally applicable to such a receiver in
air). The hydrophone shown in section in fig. 125a consists
of a heavy brass streamline annulus about 10 in. in diameter, in
which is mounted rigidly and symmetrically a metal diaphragm
(about 4 in. in diameter). At the centre of this diaphragm is
* See Drysdale, Proc. I.E.E., 58, p. 577, 1920.

DIRECTIONAL HYDROPHONE 4i7
turned a small watertight cavity in which is fixed a carbon granular
microphone (button type, free-back). Sound waves reach both
sides of the diaphragm, either directly or by diffraction around the
annulus, and the resultant vibration is indicated by the response
Jiaphragm
\ Microphone 1 80 Plane of diaphragm
Section Polar Curve of Sensitiveness.
Fig. 125A—Bi-directional Hydrophone
of the microphone. When the plane of the diaphragm coincides
with the direction of the sound waves, there is no pressure differ-
ence between the two sides of the diaphragm, and the microphone
is 'silent.' If, however, the hydrophone is broadside-on to the
incident sound waves, the pressure-amplitude on the front face
of the diaphragm exceeds that at the back face, which is screened
somewhat by the heavy annulus. There is probably a phase
effect also, but we need not be concerned with it here. In the
broadside position, therefore, the response is a maximum. It will
be seen that a rotation of the hydrophone through 360° will
result in the microphone response passing through two positions
of maximum and two of minimum (zero) intensity. On account
of the sensitivity of the ear to weak sounds the zero setting is
most accurate in practice. This position gives the line of propaga-
tion of the sound, but is still ambiguous, for the source may lie
in either of twro diametrically opposite directions. The hydro-
phone is for this reason designated 'bi-directional.' By means of
a suitable screen or ' baffle plate ' mounted at the correct distance
on one side of the hydrophone as in fig. 125b, the directional
properties are changed in such a manner that there is now only
one maximum and one minimum, when the unscreened and
screened faces of the diaphragm are respectively facing the source
of sound The exact behaviour of the baffle, which must contain
air and must be suitably damped (a hollow xylonite disc filled
with lead shot), is not understood completely, but in practice the
device is very successful. In average weather a directional
accuracy of ±3° is possible with the uni-directional hydrophone.
The distribution of pressure and displacement-amplitude around
27

4i8 DIRECTIONAL RECEPTION OF SOUND
a bi-directional and a uni- directional hydrophone in a sound field
has been determined experimentally by F. B. Young and the
writer,* who have also advanced a theory of the behaviour of the
hydrophone and baffle. The theory indicates that the maximum
Plane of diaphragm
Cable
Rubber suspension
Cable gland
Heavy metal annulus
Box containing carbongranule microphone
Diaphragm
a. Baffle plate
Polar Curve of Sensitiven
Fig. 125B—Uni-directional Hydrophone
sensitiveness {i.e. in the 'broadside' position) of the bi-directional
hydrophone should be approximately a quarter of that of a similar
hydrophone with one side only in contact with the water—
a
deduction which was confirmed by experiment.
Directional Displacement Receivers. Directional Pro-
perties of ' Button ' Microphones - A special type of directional
receiver, which is applicable more particularly to water as a mediumof sound transmission, is due toW. H . Bragg (1916). He suggested
a simple form of directional hydrophone, consisting of an elongated
body of rigid but light construction, in which was mounted a
carbon granule microphone of the button type. Such a body,
lighter than the medium (water) which it displaces, was expected
to have a displacement amplitude greater than that of the surround-
ing medium, the amplitude of the motion depending on the shape
of the body. If, for example, the body is ellipsoidal, its motion
will be greatest when the longest axis coincides with the direction
* Proc. Roy. Soc, 100, p. 261, 1921.

LIGHT-BODY HYDROPHONE 419
of the sound wave. The response of the enclosed microphone
will vary therefore with the orientation of the ellipsoid, and the
'light-body' will constitute a directional hydrophone. Professor
H. Lamb supplied the necessary data with regard to the loading
effect of the medium (water), and F. B. Young and the writer *
made a series of experiments to test the theory. Preliminary
tests with a hollow glass ellipsoid indicated a direction-ratio of
20 or 40 : 1, whereas the theory indicated only 2:1. This
discrepancy led to an examination of the button microphone,
which was found to show marked directional properties. In
some cases a ratio of 40 or 50 : 1 in current amplitude was observed,
when the axis of the microphone was parallel and at right angles
respectively to the direction of vibration. To test the light-body
principle, therefore, a hollow ellipsoid of ebonite was constructed
as in fig. 126, the microphone being mounted in a hollow, rotat-
able plug fitted tightly in the ellipsoid as shown. A series of
Air cauity Glass or ebonite ellipsoid
3-5 cm.
30 cm.KPlug (rotatable)
containing' microphone
Fig. 126
observations of the apparent direction of the sound, for different
orientations of the microphone relative to the major axis of the
ellipsoid, yielded the information that the direction-ratio of the
ellipsoid (apart from the microphone) was 1-56 as compared withthe value 1-60 calculated from Lamb's data. The maximumpossible direction-ratio of any ellipsoidal light body consistent
with practical limits of rigidity and mean density was estimated
to be about 2-3. This is negligible compared with the direction-
ratio obtainable with a well-mounted microphone. Hence it
appears that there is little to be gained by adhering to the ellip-
soidal form, a microphone mounted in a light sphere being equally
effective and possessing the advantages of greater compactnessand rigidity. Light body hydrophones of this spherical type havebeen constructed with success of glass, ebonite, and paraffin-wax.F. B. Young and the writer # have used such hydrophones (1 in.
* Proc.Roy.Soc, 100, pp. 252 and 261, 1921. The experiments weremade in 1916.

420 DIRECTIONAL RECEPTION OF SOUND
diameter (see fig. 96)) in exploring the sound distribution
(direction and amplitude) around various bodies submerged in
water. Larger hydrophones containing electromagnetic detectors
have also been constructed on this principle.*
The 'displacement,' or velocity hydrophone, as it should be
called, is less sensitive than a ' pressure ' (diaphragm) hydrophone
of comparable dimensions, but it serves not only as a detector
but also as a direction indicator. The pressure variations in the
medium have no direction, but the displacements take place in the
direction of propagation. The small spherical 'light body' there-
fore vibrates with maximum amplitude in this direction and with
zero amplitude parallel to the wave-front. Consequently the
carbon granular microphone gives its maximum response whenits axis coincides with the direction of the source and zero
response in the 90° position.
So far as the writer is aware, a directional displacement receiver
of this type has not been made for use in air. If it were possible,
however, to construct such a receiver of mean density as small as
possible relative to air and sufficiently rigid so as not to yield to
the pressure variations, its properties should be the same as those
of the light-body hydrophone.
Diffraction Methods. Diffraction Disc and Zone Plate - Asan alternative to binaural methods of determining the direction
of a source of sound in air, use is sometimes made of a diffraction
effect, to which we have already referred (see p. 308). If plane
waves of sound fall normally on a circular disc, which either
reflects or absorbs sound, the 'shadow' cast behind it on any
parallel surface will have a diffraction pattern surrounding its
centre point. On the axis of the disc the intensity will be a
maximum and equal to that in the undisturbed sound wave.
At points slightly off the axis the intensity rapidly diminishes,
eventually falling to zero. Still farther from the axis the intensity
rises again to a secondary maximum, succeeded by a second zero
position, and so on. If, now, the source of sound is not on the
axis in front of the disc the primary maximum of intensity (the
bright spot) will not fall on the axis behind the disc, but at some
point displaced in accordance with the direction of the incident
sound waves. Consequently, if a sensitive detector, such as a
hot-wire microphone, be fixed at a point on the rear axis and the
whole receiver (disc and microphone) rotated slowly, the response
of the microphone will be a maximum when the axis of the disc
* See Drysdale, loc. cit.

RECEIVERS OF LARGE AREA 421
points to the source of sound (see p. 310). Similar effects are
observed when a zone-plate is used (p. 309). On account of
the long wave-lengths of the low-frequency sounds emitted by
an aeroplane, discs of large diameter (20 ft. or so) have been
employed for accurate location by the diffraction method. Such
large discs being fixed in a horizontal position, the relation
between the direction of incidence of the sound and the position
of maximum intensity may be calculated. This method provides
one of the most reliable means of determining the direction of
air-borne sounds.*
Receivers of Large Area - As in the case of directional
transmission of sound waves, a surface of dimensions large com-
pared with a wave-length has directional properties. Soundreflectors 20 ft. or more in diameter have been used to 'focus*
low-frequency aeroplane sounds, but, as we have already seen
(pp. 149 and 307), such a focus is in reality a diffraction pattern;
just as a sound beam transmitted by a reflector with a small source
at the focus, consists of a primary beam surrounded by a succes-
sion of secondary beams of diminishing intensity. In fact, it maybe stated as a general principle that transmission and reception of
wave energy are reciprocal problems—a directional receiver will
act as a transmitter having similar directional properties. Wemay therefore refer directly to p. 148 and pp. 215 to 220, where
the directional transmission of sound from sources of large area
has already been considered. Piezo-electric discs (Langevin type),
mirrors, trumpets, and such-like receivers, all exhibit directional
properties characterised by the relation 9= sin-1 0-61 A/r, whereis the semi-angle of the primary cone (or the semi-angle subtended
by the inner diffraction circle at the 'pole'), A is the wave-length
of the sound, and r the radius of the disc or aperture. It is
important to observe that the sharpness of direction increases as
A diminishes with respect to r—that is, every receiver of this type
has a tendency to favour the sounds of higher frequency—apart
altogether from resonance and similar phenomena. A trumpet,
disc, or a mirror should therefore be used with caution if it
is desired to reproduce faithfully a sound of complex wave-
form
—
i.e. a sound containing harmonics of widely different wave-lengths. For example, a small parabolic reflector which wouldfocus the sharp 'crack' of a pistol or an electric spark very
efficiently, would be quite useless as a means of concentrating a
* Ency. Brit., 13th ed. (suppl. vols.), 1926 ; Sound, ' Detection andPerception of Direction,' A. O. Rankine.

422 DIRECTIONAL RECEPTION OF SOUND
continuous wave of frequency 200 p.p.s. (A =5 ft. approx.).
Another way of looking at the matter is to regard the concave
reflector in terms of Fresnel's zones. If the 'focal length' is
considerable and the wave-length A of the incident sound is not
small, the first Fresnel zone is fairly large ; consequently there is
little to be gained by making a reflector of such dimensions con-
cave. If, however, the sounds are of very short wave-length, the
number of Fresnel zones in a reflector of moderate dimensions
may be large and the energy concentration at the focus appreci-
able, the advantages of the concavity are then more apparent.
Multiple Receivers - The treatment which has been given
for the directional properties of multiple sources (p. 217) is also
applicable to multiple receivers. A straight line, a circle, or
a surface covered with equidistant 'point' receivers will have
a maximum resultant response when the incident sound wave
reaches all the receivers in the same phase. If, for example, six
similar receivers are spaced along a straight line at intervals of
half a wave-length, the resultant response for different orientations
will be that indicated in fig. 67 (p. 219) for a line of six similar
sources. In such a case the maximum amplitude occurs whenthe line of receivers is 'broadside' to the incident wave. It is
of course important that all receivers in the ' line ' should operate
in the same phase, when the sound wave arrives simultaneously,
i.e. in the 'broadside-on' position. This necessitates that they
should either be all non-resonant or should all be tuned exactly
to the same frequency. The principle employing lines of receivers
has been applied in submarine detection by M. Mason * on behalf
of the American Navy. The M.V. hydrophone, as the system
was called, consisted of a row of twelve simple receivers (non-
resonant rubber ' teats ' fixed on the ends of metal tubes) spaced
at equal intervals on a line 10 ft. long. Two such rows of re-
ceivers were fitted below water on the port and starboard sides
of a ship. The binaural compensator principle (described on
p. 413) was extended, by a 'progressive compensation' in a single
instrument, to twelve receivers. This 'line' receiver had marked
directional properties, and under suitable conditions could locate
a moving vessel with considerable accuracy. The principle has
since been applied in marine 'depth sounding.' f A device
employing a large number of similar receivers covering a large
area was invented by Walser (in the French navy). A 'blister*
* Proc. Amer. Phil. Soc, 59, No. 1, 1920 ; and Marine Review, Oct.1921. t See H. C. Hayes, Journ. Frank. Inst., 197, March 1924.

SOUND MEASUREMENT 423
on the side of a ship was covered with small diaphragms, and
an observer inside the ship located the position of the primary
maximum by means of a small trumpet and stethoscope receiver.
This and other directional devices of a similar nature have been
described by C. V. Drysdale.*
Location of Impulsive Sources - The methods described
above are applicable when the source emits continuous waves
of sound, and fail completely when the ' sound ' consists of a single
impulse—as, for example, the detonation of an explosive charge.
In such cases special methods of location have been devised,
which we shall consider later in connection with Sound Ranging
(see p. 478).
SOUND MEASUREMENT. ANALYSIS ANDRECORDING
The characteristics of a sound wave at any point in a mediummay be regarded as completely defined when the amplitude,
frequency, and phase of its Fourier components are known.
The term 'amplitude' to which we refer here may relate to dis-
placement, pressure, density, or to some other physical quantity
which represents the condition of the medium at the point
in question. The measurement of frequency and phase is, in
comparison with the measurement of intensity (or amplitude) a
relatively simple matter. Intensity measurement is full of pit-
falls, and great care and judgment is necessary in making ' absolute
'
determinations. Many instruments have been devised which are
said to measure intensity, but in many cases it is necessary to makecertain assumptions, often unjustifiable, to convert their indications
into absolute measure. All known measuring devices are limited
to certain ranges of frequency and intensity ; they are best suited
to a particular medium through which the sound waves pass, and
their indications are dependent on the dimensions relative to the
wave-length of the incident sound. A condenser microphone,
for example, would have very different properties as a receiver
in air and in water, not only in regard to the frequency range but
also in regard to its behaviour as an 'obstacle,' the wave-length
of sounds of the same frequency being in water four and a half times
the corresponding frequency in air. It is necessary to remember,
therefore, that the resulting indication of any type of receiver is
dependent, amongst other influences, on the following factors:
* Proc. I.E.E., 58, p, 577, 1920 ; and Mechanical Properties of Fluids.

424 SOUND MEASUREMENT
(a) the wave-length of the incident sound;
(b) the law of pressure-
volume variation assumed in the neighbourhood of the obstacle
(the measuring device and its mounting) placed in the path of the
sound wave; (c) the scattering and diffraction of sound-energy
from the obstacle, 'the receiver' (involving its compressibility,
density, and modes of vibration, the frequency of the incident
sound, and the nature of the 'incident' medium).
It is often assumed in sound intensity measurements that the
pressure fluctuation at the surface of the receiver is the same as
that which would occur in the undisturbed sound wave. Some-times the other extreme view is taken that the pressure is doubled
by reflection. It is clear that the former assumption approximates
to the truth when the sound field influenced by the receiver maybe regarded as a 'point'-—i.e. very small compared with a wave-
length ; whilst the latter assumption is more nearly correct whenthe receiver approximates to an infinite rigid plane, i.e. its dimen-
sions are large compared with the wave-length of any sound falling
upon it. In practice neither of these ideals can be attained, but
it is often possible to define the experimental conditions so that
the results agree approximately with one of them. It is interesting
to note, in a recent paper by S. Ballantine,* that this aspect of
sound intensity measurement is now receiving more consideration.
Using a Wente condenser microphone to measure sound intensity,
Ballantine attempts to
t
/^lA
make the uncertainty
less serious by mount-
ing the receiver in a
'standard sphericalbody.' The whole is
then regarded as a rigid
sphere amenable to Ray-
leigh's mathematical dif-
fraction treatment.! In
fig. 127 the curves, due
to Ballantine, show thepressure- ratio p/p J at different frequencies for spheres 6 in.
and 12 in. in diameter. It will be seen that the spherical
receiver 12 in. in diameter can only be regarded as small at
100 1000
Frequency p.p.s. (logarithmic)
Fig. 127
* Phys. Rev., 32, p. 988, Dec. 1928.
f Theory of Sound, 2, pp. 218 et seq.
% The ratio of pressure amplitude p on the receiver to that p in theundisturbed medium.

ABSOLUTE INTENSITY 425
frequencies below 80 p.p.s. Above this frequency the pres-
sure-amplitude measured varies rapidly with frequency, ulti-
mately reaching the double-pressure at very high frequencies
(>10,000 p.p.s.). In this treatment it has been assumed that
any form of pressure receiver may be used, and that the sphere
is rigid. The latter assumption, which may easily be attained
for air-borne sounds, is not so easy of attainment in a mediumsuch as water. A body wThich may be regarded as rigid in water
carrying sound waves is not known. In such a case, therefore,
a further correction would be necessary to allow for the elas-
ticity of the sphere. It must be remembered that the directional
properties of a receiver depend on the ratio AD, where A is the
wave-length and D the diameter of the receiver (assumed circular).
As the frequency increases therefore, A diminishes, and the re-
ceiver becomes more and more sharply directional (see pp. 216
and 421). The orientation of the receiver with respect to the
incident sound becomes increasingly important therefore the
higher the frequency.
'Absolute' sound intensity measurement is very difficult. It
must not be supposed, however, that sound intensity measure-
ments are useless, for there are many forms of receiver which,
when used with due caution, give results approximating to
'absolute' measure. Comparative sound-intensity measurements
are possible with almost all forms of sound receiver, but some
forms are decidedly better than others. Resonant receivers have
proved of great value in comparing sound intensities at a particular
frequency, but comparison of intensities of different frequencies
with different tuned receivers is rendered uncertain on account
of the difficulty of estimating the 'amplification factor' of such
receivers. Certain forms of measuring device may be calibrated,
so that their indications form an approximate measure of sound-
intensity within prescribed limits of intensity and frequency.
To summarise : the term ' absolute ' applied to a sound-intensity
measuring device should always be used with great caution.
Various types of sound receivers and recorders are known which
give a fairly uniform response over a limited range of frequency
and intensity; within such limits their indications may be corre-
lated to the sound-intensity, and, subject to certain corrections,
they may be used in sound analysis. Among the many methodsused in intensity measurement and comparison, the following maybe mentioned: (1) the Rayleigh disc (with or without resonator)
;
(2) the sound-pressure radiometer; (3) hot-wire microphone (with

426 SOUND MEASUREMENT
or without resonator); (4) motion of a diaphragm observed by
optical means (various types of ' phonometers') ; (5) interferometer
methods of observation of the variation of refractive index; (6)
use of electromagnetic, electrodynamic, piezo-electric, or suchreceivers, in conjunction with auxiliary electrical circuits (valve-
amplifiers) and recorders (oscillographs).
The frequency analysis of a complex sound by variable tuning
devices (mechanical or electrical) or by oscillographic and strobo-
scope methods is a relatively simple problem.
The Rayleigh Disc - It is shown in textbooks of hydro-
dynamics # that the lines of flow, or ' streamlines ' around an
obstacle of ellipsoidal form, are such that the obstacle tends to set
in a stable position with its least axis in the direction of undisturbed
flow. In the case of a plane lamina inclined at 45° to the stream,
the lines of flow are as
shown in fig. 128, these
being unaltered if the direc-
tion of flow is reversed.
The points A and Bwhere the hyperbolic arcs
meet the lamina are points
of zero velocity,and there-
fore of maximum pres-
sure. The fluid pressures
on the lamina are there-Fig. 128—Streamlines of Flow past a Disc
fore equivalent to a couple tending to set it broadside-on to the
stream. In the case of a circular disc of radius a in a fluid of
density p }the normal to the disc, making an angle 6 with the
direction of the undisturbed stream, the couple M tending to
reduce the angle 6 is given by
M=$pa*v 2 sm2d (1)
In this relation it will be seen that the torque is proportional to
v 2—that is, independent of the direction of flow. The relation is
therefore equally applicable to direct or alternating flow, provided
the value of v 2 in the latter case represents the mean value over a
cycle. The torque is a maximum when 0=45°. The effect was
demonstrated experimentally by Rayleigh, f who observed the
rotation of a small paper disc, suspended on a fine fibre, at an angle
of 45° to the plane of the opening of a Helmholtz resonator in
* Lamb, Hydrodynamics, pp. 94 and 178, 1895. f Sound, 2, p. 44,

RAYLEIGH DISC 427
vibration. Rayleigh subsequently designed a simple instrument,
based on this principle, for comparing the intensities of sounds of
definite pitch—the intensity being proportional to v 2, which is
measured directly by the torque M. A tube f A in length is open
at one end and closed with a glass plate at the other. At an anti-
node, distant A/4 from the closed end, a light circular mirror is
hung by a fine fibre at an angle of 45° to the axis of the tube. Asmall glass window at the side allows the light reflected from the
mirror to fall on a scale outside. When the tube is set in resonance
the alternating air-flow round the mirror causes it to rotate. For
small angles of deflection the rotation is proportional to the sound-
intensity in the tube, and consequently to the intensity in the un-
disturbed field. The actual value of the torque may, if required,
be determined by means of a torsion head which brings the mirror
back to its initial position. A double resonator with such a mirror,
supported by a fine quartz fibre in the connecting neck (see fig. 129),
forms a much more sensitive arrangement (due to Boys,* see
Window Suspended Disc
Second Resonator First" Resonator
To Scnle
Fig. 129(From Davis and Kaye, Acoustics of Buildings)
p. 189). The velocity of the air at the mirror is in this case
greatly amplified by the second resonator. The sensitiveness is
comparable with that of the ear. The system is, of course, very
sharply tuned, and a number of similar instruments would, there-
fore, be required to cover a moderate range of frequency. Theoriginal form, suggested by Rayleigh, but fitted with a continuously
variable tuning arrangement, is more generally useful, but is of
course less sensitive. It is important to observe, in all forms,
that the diameter of the disc should be small compared with a
wave-length of the incident sound. The device has been used
extensively as a means of comparing sound intensities, and has
often been used to check other methods. Thus E. Meyer j has
* Nature, 42, p. 604, 1890.
f Elec. Nach.-Techn., 3, p. 290, 192( and 4, p. 86, 1927.

428 SOUND MEASUREMENT
shown that concordant results are obtained over a wide range of
frequencies when it is compared with the thermophone (see p. 203)
and the condenser-microphone (see p. 395). Mallet and Dutton *
have used the Rayleigh disc to determine the efficiency of tele-
phone receivers from the curves of amplitude-frequency near
resonance, the results agreeing well with motional-impedance
measurements. The device has a very wide application in explora-
tions of sound fields.
f
A modification in the method of use of a Rayleigh disc has
recently been suggested by L. J. Sivian.J In this method the
amplitude of the sound wave to be measured is modulated with a
frequency equal to that of the free vibration of the suspended disc.
The measurement consists in reading the amplitude of the oscilla-
tions corresponding to the modulating frequency rather than a
steady deflection of the disc. The disturbances caused by spurious
air currents are thus largely reduced. If in equation (1) above,
we write v=v sin nt as in a sinusoidal sound wave, the expression
for the torque M becomes
M=ipa* sin 20(J—J cos 2nt)v 2 =B . \v Q2-B . Jz>
2 cos 2nt . (2)
which contains a rectified and a double-frequency component.
The former accounts for the deflection observed in the static
method, the latter being usually too small for observation owing
to the high resistance to motion of the disc at sound-frequencies.
If, now, the sound wave be modulated, so that
v=v (l + sin wt) sin nt,
the torque, acting on the disc, is
M,=B . |V[f
+
2 sin wt-\ cos 2wt](l- cos 2nt).
The subsequent motion is therefore of the form L/>+ R</>-}-S</>=M
the modulating frequency w being chosen so that \w 2—s=0. In
the steady state the deflections produced by the modulated torque
are:
3 1 i
(1) D 1=-B» ". -, that is, D
1oc a*/S since B <*
(2) D 2 =Bv 2-—, that is, D 2
oc \jw since R*a (3)
(R=^/xtf3 for a thin disc)
(3) A negligible effect of double frequency.
* Journ. I.E.E., 63, p. 502, 1925.
t Stewart and Stiles, Phys. Rev., 1, p. 309, 1913 ; 32, p. 248, 1911;
33, p. 467, 1911. \ Phil. Mag., 5, p. 615, 1928.

PRESSURE OF SOUND WAVES 429
In the first of these expressions, T>1is the deflection observed in
the static method, proportional to a 3. The second expression
giving D 2 , the amplitude observed in the dynamic method, is in-
dependent of the disc radius, provided the period of the disc
(oc l/w) remains constant. The distinction is very important in
high-frequency measurements, since the diameter of the disc must
always be small compared with the wave-length. The dynamic
method, which measures intensity ( * v 2) in terms of D 2 ,
possesses
the great advantage that it is not disturbed by slow drifts and
sudden puffs of air, which are sufficient to vitiate entirely results
obtained by the static method.
Pressure of Sound Waves
Sound waves, like light waves, exert a pressure on any sur-
face, reflecting or absorbing, on which they fall, and radio-
meters for measuring sound energy have been constructed on
this principle. The theoretical aspect of the matter has re-
ceived considerable attention from Rayleigh, Larmor, Poynting,
and others. In order to illustrate in as simple a manner as
possible how this pressure arises, we cannot do better than
quote Poynting:* "In sound waves there is at a reflecting
surface a node—a point of no motion but of varying pres-
sure. If the variations of pressure from the undisturbed value
were exactly proportional to the displacements of a parallel
layer near the surface, and if the displacements were exactly
harmonic, then the average pressure would be equal to the
normal undisturbed value. But consider a layer of air quite
close to the surface. If it moves up a distance y towards the
surface, the pressure is increased. If it moves an equal distance v
away from the surface, the pressure is decreased, but by a slightly
smaller quantity. To illustrate this, take an extreme case and, for
simplicity, suppose that Boyle's law holds. If the layer advances
half-way towards the reflecting surface the pressure is doubled.
If it moves an equal distance outwards from its original position
the pressure falls, but only by one-third of its original value ; and
if we could suppose the layer to be moving harmonically, it is
obvious that the mean of the increased and diminished pressures
would be largely in excess of the normal value. Though we are
not entitled to assume the existence of the harmonic vibrations
when we take into account the second order of small quantities,
yet this illustration gives the right idea. The excess of pressure
* Address on Radiation Pressure, Phys. Soc, 1905.

43Q SOUND MEASUREMENT
in the compressed half is greater than its defect in the extension
half, and the net result is an average excess of pressure—a quantity
itself of the second order—on the reflecting surface. This excess
in the compression half of a wave-train is connected with the extra
speed which exists in that half, and makes the crests of intense
sound waves gain on the troughs." The following simple treat-
ment, which proves the existence of radiation-pressure by an
indirect method, is due to Larmor* The case considered is that
of plane waves incident normally on a perfectly reflecting wall.
The latter is pushed with velocity v to meet the advancing train
of waves. The energy density in the incident wave-train of velocity
c is E, and in the case of a stationary reflector, the total energy
density due to both incident and reflected wave-trains is 2E. In
unit time the length of the wave-train incident on the wall is
(c-\-v). On account of the approach of the wall this is compressed
into a space of length (c— v). Consequently the energy density
in the reflected wave is increased in the ratio
E+SE_c-K_ 2v
E c— v c
since v is very small, whence SE=2^E/c. In a region of length
c in front of the wall, the increase in total energy is therefore
c . $E=2vE. This must necessarily be the work done by the wall
in compressing the radiation. Consequently, if P is the radiation-
pressure, the work done by the wall in unit time is Yv, whence
Vv=2vE or P=2E (1)
The radiation-pressure is therefore equal to the mean energy density
in the medium in front of the reflector.
In the case of a perfectly ' absorbing ' wall, there would be no
reflected wave and P would be equal to E.
Rayleigh f has dealt with the problem by more rigorous mathe-
matical methods. The gas is regarded as enclosed in a long
cylinder of length / closed by a piston subjected to the additional
pressure due to the sound waves reflected from it. The calcula-
tion is quite general and is applicable to a gas (or any fluid) in
which the pressure is any arbitrary function of the density p=f(p).If p Yp Y denote the pressure and density at the piston and p p
* Article on 'Radiation,' Ency. Brit., 11th ed., 22, p. 786, 1911;
see also Crandall, Sound, p. 179.
f Phil. Mag., 10, p. 364, 1905. See also Phil. Mag., 3, p. 338, 1902;
and Scientific Papers, 5, pp. 41 and 262.

PRESSURE OF SOUND WAVES 431
the normal values in the absence of vibrations, then it may be
proved that
U* *V* i ,
Po2f"(Po) \ (
(
WJxdt
where U is the resultant velocity at any point and/ '(p ) and/ "(p)
are the first and second differentials of f(p ). The integral on
the left of this equation is the mean additional pressure on the
piston, i.e. the mean radiation-pressure P which is required. Theequation expresses this pressure in terms of the mean kinetic
energy. If the relation between pressure and density is adiabatic,
that is, (/>//>o)=(/)/Po)7
»equation (2) becomes
•U 2
(y+l)Po jJ T .dxdt . . (3)
In this expression p / /— . dxdt represents the volume density of
the total energy—that is, double the volume density of the kinetic
energy. Denoting the latter quantity by E, we have therefore
P=(y+i)E .... (4)
which, in the case of a gas obeying Boyle's law (y= l), reduces to
P=2E .... (5)
in agreement with the expression (1) obtained by Poynting and
Larmor. As Poynting has explained, if the reflection of a train
of waves exerts a pressure on the reflector, it must be due to the
momentum of the wave-train. The value of the momentum M is
obtained at once from the above expressions for P in accordance
with the usual definition of this quantity M. Rayleigh shows that
waves of finite condensation propagated without change of type
(/>= const —c 2p -fp) exert no pressure on a reflecting surface. "It
would seem that pressure and momentum are here associated
with the tendency of waves to alter their form as they proceed on
their course."
R. W. Wood * demonstrated the existence of a radiation-pressure
by means of a concave mirror which was used to focus intense
sound pulses from powerful electric sparks, on a set of vanes like
a radiometer, causing them to rotate when situated at the focus.
In such a case the sound wave is distinctly unsymmetrical and a
mechanical pressure would be anticipated on elementary grounds.
* Phys. Zeits., 1, p. 22, Jan. 1905.

432 SOUND MEASUREMENT
It has been shown on p. 54 that the intensity I of sound waves
is equal to the product of energy density E and wave-velocity c.
Thus, if P is the radiation-pressure exerted on a reflecting surface,
we may write
I=Ec=Pc/(y+l) ... (6)
a simple relation which forms the basis of an ' absolute ' methodof measuring sound intensity.
Sound Radiometers. (Torsion-Vane Pendulum) - The steady
pressure exerted by sound waves on reflection from a plane solid
wall was measured by Altberg.* A hole in the wall was closed
by a loosely fitting piston attached to one end of the arm of a
torsion pendulum, a balance weight (not exposed to the radiation)
being fixed at the opposite end. The arm wras supported, at the
centre of gravity of the system, by a fine torsion wire or fibre,
and a mirror (with lamp and scale) indicated any deflection of the
piston. The latter was restored to its zero position by means of
a torsion head. In the case of a piston of small area S, at an
effective distance r from the point of suspension, the torque Tis given by T=SPr. This is counterbalanced by the torsion of
the suspension. If the torsion constant of the latter is k, and
an angle of twist 9 is required to restore the arm, against
the pressure, to its initial position SPr=k9, whence F=k6/Sr,
the value of the sound intensity being obtained at once from
equation (6).
Altberg employed this method to measure the intensity of sound
emitted from a Kundt's tube excited by the powerful longitudinal
vibrations of a glass rod. Altberg's radiometer method was also
used by N. Neklapajev f to measure the intensity of high-frequency
waves, and to determine the law of absorption in air. T. P. Abello J
has employed the same method to measure sound absorption at
high frequencies in various mixtures of gases. The same principle
has also been applied by P. Langevin § and R. W. Boyle||to the
measurement of high-frequency sound intensities under water.
The torsion vane was a disc of metal of appropriate thickness (or
* Ann. der Physik, 11, p. 405, 1903.
f Ann. der Physik, 35, p. 175, 1911; see also P. Lebedew, Ann. der
Phvsik, 35, p. 171, 1911.
% Phys. Rev., 31, p. 1083, 1928 ; Proc. Nat. Acad., 13, p. 699, 1927;
see also Altberg and Holtzmann, Phys. Zeits., 26, p. 149, 1925.
§ International Hydrographic Bureau, Monaco, Special Publication
No. 3, p. 28, 1924, and No. 4, 1926.
ilProc. Roy. Soc. Canada, 3, p. 167, 1925.

REACTION BETWEEN BODIES IN A SOUND FIELD 433
alternatively an air-film enclosed between mica discs) supported
from a fine phosphor bronze or steel wire. The deflection of the
vane, under the action of the supersonic beam from a quartz
transmitter, was observed by means of a telescope, and a torsion
head was used to restore the vane to its zero position. In these
measurements no 'guard plane' was used, so that it became
necessary to correct the observations for diffraction effects at the
edges of the vane. This troublesome correction is of course
entirely avoided if the vane forms a part of a reflecting plane of
large area.
Sound radiometers are very insensitive, and are consequently
quite unsuitable for the detection of feeble sounds. They pro-
vide, however, a very convenient means of measuring the intensity
of continuous sounds of large amplitude—particularly at high
frequencies when the wave-length is small. In this respect they
have a wide application in the measurement of the energy emission
from sources of sound.
Forces of Reaction between Bodies in a Sound Field - It is
convenient to refer here to a few interesting phenomena relating
to the attraction or repulsion between various bodies in vibration,
or under the influence of the vibrations of a medium carrying a
train of sound waves.
(a) Repulsion of Resonators - Dvorak and Meyer # independently
discovered that an air resonator of any kind, when exposed to a
powerful source of sound, experiences a force of repulsion directed
from the mouth inwards. Four light resonators mounted on a
pivot, after the fashion of an anemometer, may be caused to
rotate continuously under the action of this repulsion. Rayleigh
(Sound, 2, p. 42) has dealt with the mathematical side of the
question, and has proved that the mean pressure inside a resonator
is greater than that in the surrounding medium, i.e. there mustbe a force at the mouth acting inwards.
(b) Attraction between a Vibrating Body and a Neighbouring
Obstacle - Kelvin has shown that the mean pressure at a place
where there is motion is less than in the undisturbed medium:
i(Pi-po)dt= -iP j\J 1*dt i
where Uj. is the velocity and p ± the pressure at any point in a
medium of density p and undisturbed pressure p (see also
equations (2) and (3), p. 431). This theorem was used to explain
* Pogg. Ann., 157, p. 42, 1876 ; and Phil. Mag., 6, p. 225, 1878.
28

434 SOUND MEASUREMENT
certain observations by Guthrie * relating to the attraction of a
suspended disc of paper by the prong of a vibrating tuning-fork.
The behaviour of the disc depends on the fact that the meanvalue of U 2
is greater on the face exposed to the fork than uponthe back. The action depends essentially on the proximity of the
source of disturbance. When the flow of liquid, whether steady
or alternating, is uniform over a large region the effect on the
obstacle is a question of shape (see, for example, the Rayleigh disc
which rotates in a uniform sound field, whilst a sphere is un-
affected).
(c) Attraction or Repulsion between Spherical Particles in a Sound
Field - In a uniform sound field the force on a single sphere is
zero. If, however, two spheres, at a moderate distance apart, lie
in a line parallel to the alternating flow they will be repelled.
If, on the other hand, the line joining their centres is at right
angles to the flow they will be attracted. These statements are
due to Konig,f who thereby explained the peculiar nature of the
striations observed in the Kundt's dust-tube experiment. Theforces between neighbouring particles are such as to cause the
particles to collect in laminae across the tube, the effect being a
maximum at the antinodes. Konig showed that the force acting
between two spheres of radii ax a 2 , and situated a distance r
apart, is given by (i) a repulsion 'K=6irpa 13a 2
3v 2/r 4: when the pair
is 'end-on' to the stream of velocity v, and (ii) an attraction
Y =3TTpa1Ba 2
3v 2/r 4: when 'broadside' to the stream. The force
therefore increases extremely rapidly with diminishing distance
of separation of the particles. R. W. Boyle and R. W. Woodhave independently referred (loc. cit.) to the rapid coagulation of
small particles of coke or other powder in a liquid through which
high-frequency sound waves of great intensity are passing. It
is not unlikely that the effects are, at any rate, partly due to this
cause.
Interferometer Methods - The ideal method of measuring
the intensity of a sound wave is one in which the 'receiver or
indicator' does not modify in any way the sound distribution at
the point of the medium under consideration. A solid obstacle,
such as a microphone, electrodynamic receiver, or a resonator,
does not comply with this condition, for it behaves as a secondary
source and scatters some of the incident sound energy. A method
* Proc. Roy. Soc, 19, p. 35, 1870, and 19, p. 271, 1871.
t Wied. Ann., 42, p. 353, 1891.

PHONOMETERS 435
approximating to the ideal case is one to which we have already
briefly referred (p 184), viz. the interferometer method introduced
by Topler and Boltzmann,* and developed later by Raps.f In
this method a beam of light traverses the medium through which
the sound waves pass, and produces a set of interference fringes
with a second beam of light outside the path of the sound waves.
The changes of density in the medium traversed by the first beamresult in corresponding changes of optical path, and displace the
interference fringes accordingly. It is important to observe in
such measurements that the interferometer mirrors and mountings
are not set in vibration by the sound wave, otherwise large errors
may occur. So far as the writer is aware, the method has only
been applied to cases of large sound intensity
—
e.g. Raps studied
the changes of density near the node of an organ pipe. As an
approximation to an absolute method it is, however, worthy of
more consideration than it has hitherto received.
Phonometers- The Webster Phonometer % is a useful detecting
and measuring device based on the principle of a tunable Helm-holtz resonator (see fig. 130). The motion of the air in the mouthof the resonator is indicated by means of a small mica disc sup-
ported by three coplanar stretched wires, which serve also to tune
the disc. The system is therefore doubly tuned. The movement
Tuned Resonator
Eyepiece containing Scale
ncz
i
Plate Glassr
lima Kei. {or Wires
|Ljl^-StVcl"chcd V.Torsion Strip—
(carrumu Small Mirror}^ Diaphragm
lx Needle Poinl*
Adjustable Holde
£^=^Swircn for Lamp Connection To Dru Cells Container (or Drij Cells
o I 2 3 4,,i i i i i i I 3—
<
Inches
Fig. 130
(From Davis and Kaye, Acoustics of Buildings)
of the disc is indicated by means of a thin steel torsion-strip carry-
ing a small concave mirror, which tilts when the disc vibrates.
Light from a lamp (not shown in fig. 130) with a vertical, straight
filament is reflected from the mirror into an eyepiece alongside it.
* Pogg. Ann., 141, p. 321, 1870. f Ann. der Physik, 50, p. 193, 1891.
X Nat. Acad. Sci. Proc, 5, p. 173, 1919 ; and Engineering, 3, p. 763,1921 (R.I. discourse).

436 SOUND MEASUREMENT
A calibrated scale in the eyepiece serves to measure the amplitude
of the diaphragm. Using a total optical magnification of the order
of 1500 times a deflection of 0-1 mm. in the eyepiece, corresponds
to a displacement of 4 x 10⁻⁶ cm. of the disc. The instrument is
calibrated, by an interferometer method, to give 'absolute'
measurements of amplitude. L. V. King # used the Webster
phonometer in measurements of the acoustic efficiency of fog-
signalling machinery. The instrument was able to detect, and
measure, the signals when out of range of the ear (see p. 211).
A somewhat similar device, in that it employs a Helmholtz
resonator with a diaphragm-mirror combination, was used byM. Wien.f The usual opening of the resonator was, however,
completely closed by a thin 'aneroid' diaphragm in tune with
the resonator and the incident sound.
The Millar Phonodeik J- The diaphragm sound receiver, devised
by D. C. Millar to record musical sounds, is typical of many other
forms of diaphragm receiver. A diaphragm of glass (0-003 in.
thick) is held lightly between soft rubber rings and closes the
apex of a conical horn. Behind the diaphragm is a minute steel
spindle mounted on jewelled bearings, and attached to the spindle
(of weight 0-002 grm.) is a tiny oscillograph mirror. A silk fibre,
or platinum wire (0-0005 in. thick), is attached to the centre of
the diaphragm, and, after wrapping once round the spindle, is
fixed to a spring tension-piece. Light from a pinhole is focussed
by a lens and reflected by the mirror to a moving film or rotating
mirror. Vibration of the diaphragm causes oscillatory rotation
of the mirror with corresponding displacements of the spot of
light—an optical magnification of 2500 being possible. Thearrangement responds to frequencies up to 10,000 p.p.s., but
suffers from the serious defect of resonance at particular fre-
quencies, these frequencies corresponding to the various possible
modes of vibration of the glass diaphragm and of the air column
in the conical horn. By a somewhat laborious process, Millar
determines a calibration curve (consisting of a series of resonance
peaks) for the instrument, and applies it to the correction of the
record of a sound subject to analysis. S. H. Anderson § has
* Frank. Inst.Journ., 183, p. 259, 1917.
f Wied. Ann., 36, p. 834, 1889.
X Meaning ' to show, or exhibit, sound,' Phys. Rev., 28, 151, 1909;
Science of Musical Sounds, p. 79.
§ Opt. Soc. Amer.Journ., 2, p. 31, 1925. See also C. J. Lapp, ibid.,
1, p. 661, 1923 ; E. H. Barton and H. M. Browning, Phil. Mag., 50,
p. 957, 1925, and 2, p. 955, 1926.

PHONOMETERS 437
recently described a modified form of phonodeik in which only
the natural frequency of the diaphragm needs to be considered,
the horn and tension spring being eliminated. The instrument
is sensitive enough for the quantitative examination of the quality
of musical tones within the range 128 to 8200 p.p.s. The device
is calibrated, using electrically-maintained tuning-forks as sources
of simple 'vibromotive forces.'
Various other types of diaphragm recorder have been introduced
since the phonodeik
—
e.g. A. E. Kenelly used a tilting mirror
arrangement described on p. 222. The Hilger Audiometer* is a
convenient form of sound recorder of the diaphragm type, but this,
like the others, suffers from inconvenient resonances. In this
device the diaphragm or membrane is an extremely thin film of
collodion (about 1 \x thick) stretched on a metal ring. A mirror
of silver or platinum is sputtered (cathodically) on a small area
of the film half-way along a radius. The total mass of the film
and its attached mirror is extremely small and the air damping
fairly large. Sound waves falling on one side of the membraneset it in vibration and tilt the mirror, causing a spot of light to be
deflected in the direction of the axis of a rotating drum carrying
a * stroboscopic observation strip ' (see p. 226), or a photographic
film. Various thicknesses of membrane have been used, having
resonance-frequencies ranging from 80 to 3000 p.p.s. The most
suitable frequency of membrane must be chosen according to the
purpose in view. With this apparatus photographic records have
been made of the sounds of speech and various musical instru-
ments, and of the noises arising from machinery in motion. Theactual interpretation of the records of noises which include the
resonant frequencies of the instrument is necessarily a matter of
considerable difficulty.
Nearly all the earlier methods of recording sound made use
of a diaphragm as the sensitive receiver. In the Scott-Konig
Phonautograph (1859) a membrane actuated by sound waves
carried a stylus which traced the vibrations on a smoked paper
carried on a rotating cylinder. The records were not only small
in size but were considerably distorted by numerous resonances
and by friction between the stylus and the surface of the paper.
Konig's Manometric Capsule (1862) employs a diaphragm to
receive the sound and fluctuate the pressure of the gas whichfeeds a lighted jet. Nichols and Merritt,f using an acetylene
flame of increased luminosity, photographed its vibrations when
* Engineering, 117, p. 108, Jan. 1924. f Phys. Rev., 7, 93, 1908.

438 SOUND MEASUREMENT
the exciting membrane was subjected to the sounds of ordinary
speech. Alternatively, the vibrations of the flame are observed in
a revolving mirror. A similar device has recently been demon-strated by E. W. Scripture.*
In the first Edison Phonograph (1877) the record of the move-ment of a diaphragm was made by indentations of a stylus in a
sheet of tinfoil supported over a spiral groove in a metal cylinder.
In more recent forms, the vibrations of the diaphragm cause a
needle to cut grooves on the surface of a prepared cylinder or
disc. Greatly enlarged copies of such records are obtained
photographically by means of a tracing point carrying a small
mirror, which reflects a spot of light. Not until recently, how-
ever, have such direct methods of sound recording, with diaphragm
receivers, proved of value as a means of measuring or comparing
sound intensities at different frequencies. All such methods are
seriously restricted in application on account of resonance in the
diaphragm or some other part of the apparatus.
Electrical Methods
Improvements in the design of non-resonant electrical receivers
have led to a considerable development of electrical methods of
measurement and recording of sound vibrations. Such methods
have many advantages over the more direct mechanical methods.
The electrical apparatus is often more sensitive and is more easily
controlled. ' Distortionless valve amplifiers ' may be used when the
sounds are very feeble, and electrical oscillographs having a fairly
constant sensitivity over a wide frequency range are available for
observing or photographing the vibrations. Moreover, it is often
possible in electrical circuits to compensate for defects in the
receiver
—
e.g. a troublesome resonance peak or a region of reduced
sensitiveness in the receiver may be reduced or increased re-
spectively by suitable design of the amplifier circuits. It should
be pointed out, to avoid misapprehension, that the design of
mechanical sound-recording and reproducing apparatus (gramo-
phones and loud-speakers) is nowadays proceeding on similar
lines, with unmistakable improvement.
Non-resonant receivers such as the Wente condenser micro-
phone, the Marconi- Sykes magnetophone (moving coil), the
piezo-electric crystal and the like are now almost universally
employed when it is desired to measure or record complex
* Phys. Soc. Exhibition, Jan. 8, 1929.

ELECTRICAL METHODS 439
vibrations such as are encountered in music and speech. Whenthe sound wave is simple in character, i.e. a pure tone, such
receivers as the resonant hot-wire microphone, the Webster
phonometer, the Rayleigh disc, and the Gerlach strip receiver are
very suitable measuring devices.
Resonated Hot-Wire Microphone - As a means of comparing
sound intensities at a particular frequency, this device, in the
hands of W. S. Tucker and E. T. Paris, has developed into an
extremely useful instrument of considerable precision. Reson-
ators of continuously variable tuning are also very valuable in the
frequency analysis of complex sounds. The instrument and its
applications have already been described on p. 402, and further
reference is unnecessary here.
Electromagnetic and Electrodynamic Receivers have a wide
application in sound measurements. If the sound is a pure note
the receiver may be resonant, e.g. of the simple clamped-diaphragm
type. An example of the method of use of such a receiver (of the
moving-coil type) is given by T. S. Littler.* When the receiver
is placed in a field of sound the diaphragm is forced into vibration
with an amplitude proportional to the pressure-amplitude of the
sound wave. The coil, moving with the diaphragm, cuts the
lines of the magnetic field at right angles, and an e.m.f. is generated
in it. If the motion of the diaphragm is represented by
x=A cos wt,
the e.m.f. generated in the coil is
e=27rrnNA sin wt,
where N is the flux- density, r the coil radius, and n the numberof turns. The moving coil may be connected to the low-resistance
primary of a step-up transformer, when the measured secondary
e.m.f. is proportional to the sound-pressure amplitude for a con-
stant frequency. An alternative method compares this second-
ary e.m.f. with another known e.m.f. of the same frequency
obtained from the secondary of a variable mutual inductance.
The e.m.f. 's to be compared are applied alternately to the input
of a resistance-capacity amplifier, in the output of which is a
rectifying device and direct-current measuring instrument. In
another arrangement the transformer is replaced by additional
inductance and a tuning condenser, which gives the required
voltage-amplification without distortion.
* Journ. Sci. Instrs., 4, p. 337, Aug. 1927.

440 SOUND MEASUREMENT
Null Method of Sound Measurement - An important principle
to which we have already referred (p. 390) is due to Gerlach.*
The vibrations set up by the incident sound waves in an electro-
dynamic strip receiver are neutralised in amplitude and phase by
corresponding vibrations set up in the strip electrodynamically.
This is achieved by passing a known alternating current, of adjust-
able phase, through the strip until some auxiliary detector (the
ear or a small microphone which does not draw much energy
from the vibrating strip) indicates that its motion has ceased. Aknowledge of the alternating current, together with the electrical
and magnetic constants of the apparatus, thus enables the observer
to calculate the mechanical forces acting on the strip. The great
advantage of the method lies in the fact that the motion of the
measuring device (the receiver) is neutralised, and therefore it
interferes as little as possible with the sound distribution in the
medium. This null method has been called an ' absolute ' method,
but this description requires some qualification, for the pressure
which is measured by the receiver is a function of the size of the
receiver and the wave-length of the incident sound. The mount-
ing of the strip interferes with the sound distribution, and it is
not easy to determine whether the device measures the actual
pressure of the sound wave or double that pressure (by reflection),
or some intermediate value (see p. 424). Apart from such con-
siderations, however, Gerlach's 'null' method is very valuable,
and is applicable in principle to all forms of electrodynamic
receiver. For example, in the Hewlett tone generator (see pp. 161
and 391), or the Fessenden oscillator, used in reception, the
motion of the diaphragm can be stopped by a current of the correct
strength, frequency, and phase injected into the coils—whence
the force acting on the receiver is directly calculable. The method
becomes somewhat involved, however, if the incident sound
departs from the simplest case of a pure tone.
Another important method of sound intensity measurement,
due to F. D. Smith,f in some respects resembles that of Gerlach,
since it depends upon a balance between the effects produced on
a sensitive amplifying circuit by the unknown sound wave and
a known small electromotive force. A moving coil receiver is
employed, and the received signal, after amplification, is compared
with, or balanced against, the signal produced by a small known J
* Wiss. Verofft. d. Siemens-Konzern, 3, p. 139, 1923.
t Proc. Phys. Soc, 41, p. 487, Aug. 1929.
X See ibid., 41, p. 18, Dec. 1928.

SOUND ANALYSIS 441
electromotive force e injected in series with the receiver. Whenthe two signals are equal in intensity it is shown that the following
simple relation connects the total pressure P on the receiver with
the electromotive force e,
V=emizm ,
where H is the strength of the magnetic field in which the moving
coil (of a length / of the wire) moves, and zm is the motional
impedance (see p. 74) of the receiver at the frequency of the
sound. The choice of indicating instrument, to denote equality
or balance between the two e.m.f.'s, depends on the frequency
and intensity of the sound to be measured (a voltmeter, vibration
galvanometer, or telephones may be used). Since the measure-
ment is independent of the amplifying circuit, it is possible to
use a high degree of amplification and very feeble sounds maytherefore be measured. The method gives the total sound
pressure P on the receiver when it is prevented from vibrating.
In some special cases, the absolute value of the sound pressure pper unit area in the medium can be inferred. If S is the area
of the vibrating surface of the receiver, then F=kpS, where k
is a constant which may have any value between 1 and 2 as the
linear dimensions of the receiver vary from a small to a large
value compared with a wave-length of the incident sound.#
Sound Analysis
Non-resonant Receiver : Amplifier : Oscillographs-A recent
investigation of speech sounds by I. B. Crandallf is typical
of present-day methods of sound measurement and analysis, and
it may be well to refer to it here in illustration. In this in-
vestigation Crandall employed a calibrated Wente microphone
(see p. 395) coupled to a seven-stage valve amplifier. A special
oscillograph of practically constant sensitivity up to 5000 p.p.s.
was connected to the output terminals of the amplifier. Theoverall sensitivity characteristic of the system (microphone, am-plifier, and oscillograph) showed that the amplitude of the
oscillograph per unit of pressure-amplitude on the diaphragm of
the condenser microphone remained practically constant up to 5000
p.p.s., a slight divergence being noticeable at frequencies below
200 p.p.s. The reader is referred to Crandall's original paper
for details of the resistance-capacity distortionless amplifier,
* Ballantine, loc. cit.y p. 424.
f Bell System Techn. jfourn,, 4, p. 586, 1925. See also E. Lubcke,Zeits.f. Techn. Physik, 10, p. 378, 1929.

442 SOUND MEASUREMENT
or to numerous ' wireless ' publications dealing with similar appar-
atus. A severe test of the accuracy of any recording system is to
apply a 'square-topped wave,' or impulse, and compare it with
the actual record. Crandall applied such a test to his appar-
atus in the following way. An electrode resembling the back
plate of the condenser microphone was mounted in front of the
diaphragm. Between the electrode and the diaphragm was
applied a high potential which was made alternately positive
and negative by a commutator. This arrangement produced the
desired positive and negative displacements of the diaphragm.
The calculated and observed wave-forms were in all cases found
to be in close agreement, and indicated by harmonic analysis
that accurate records could be expected over a range of 80 to
5000 p.p.s. The apparatus was sufficiently sensitive to record
sounds spoken in the ordinary tone of voice, with the speaker's
mouth about three inches from the microphone. A key was
pressed by the speaker just before the sound was produced, this
releasing a shutter placed before a rotating film drum on which
the record from the oscillograph vibrator was traced. Alongside
the complex speech record a separate * timing-wave ' was recorded
on the film by means of a vibrator of known frequency. Thespeech records were analysed into Fourier series (see p. 25) in
order to determine the relative amplitudes and frequencies of the
component vibrations.
Somewhat similar methods of recording are described by Max-field and Harrison,* who also deal with the mechanical problem of
sound-reproduction based on the electrical analogy. S. Ballantine
has used a Wente condenser microphone mounted in a rigid
sphere to obtain an absolute measure of sound intensity (see
p. 424). The microphone is first calibrated (see p. 397) by means
of the ' pistonphone ' and the 'thermophone,' and a correction
for frequency applied in accordance with the curves shown in
fig. 127, p. 424.
Crandall's work on speech-sound measurement and analysis
is typical of modern practice in dealing with complex sounds.
If desired, an independent frequency analysis may be carried
out by the various resonance methods already described, or
by means of electrical harmonic analysers.f Alternatively the
oscillograph record is analysed by one of the many harmonic
* Bell System Techn. jfourn., 5, p. 493, 1926.
f See Cockroft and Miles Walker, jfourn. I.E.E., 63, p. 69. Manu-factured by H. Tinsley and Co.

OSCILLOGRAPHS 443
analysers mentioned by D. C. Millar (see p. 33). On account
of the importance of wave-form recording and analysis of com-
plex sounds by such methods, it may not be out of place to refer
briefly to various types of electrical oscillograph in use at the
present time and to indicate the range of possible application.
Electrical Oscillographs for Sound-wave Recording and
Analysis - The name oscillograph was invented by Blondel # to
denote an instrument for indicating the instantaneous value of an
electrical current. The moving or indicating system of the oscillo-
graph must be capable of following the current fluctuations
even when these are very rapid. Progress in oscillograph design
has consequently followed the lines of diminishing the mass of
the moving system ; the heavy moving-iron system first used
by Blondel having been succeeded by the relatively light bifilar
strip-conductor of Duddell, the conducting quartz fibre used by
Einthoven, and ultimately the beam of cathode rays, which is the
ideal ' massless ' moving element.
(a) The Duddell Oscillograph f has been described in many text-
books^ particularly in reference to electrical engineering practice,
but on account of its relatively high natural frequency it has proved
of value in recording sound waves. The instrument consists of a
powerful electromagnet NS which produces an intense magnetic
field across a gap in which lies a bifilar strip of phosphor bronze
carrying the alternating current from the electrical sound-receiver
(or amplifier), see fig. 131. Between the strips ss is a narrow tongue
of soft iron which reduces the magnetic reluctance of the gap.
The alternating current passes up one strip and down the other,
the plane of the strip tilting to and fro in the magnetic field,
analogous to the rotation of a suspended coil of a galvanometer
carrying current which alternately reverses in direction. Theoscillation of the plane of the strips is indicated by a small mirrorM(1 mm. xO-3 mm.) attached to both at the midpoint and reflect-
ing a spot of light from an arc to a moving film. By means of a
tensioning device P the natural frequency of the system may be
brought up to 10,000 p.p.s. in air, the tension in each strip being
about 50 grm. In order to eliminate resonance in the strips, the
clearances at the sides and the channels in which they lie are madeas small as possible and the space around them is flooded with oil.
* La Lumiere Electrique, 41, p. 401, 1891.
f Duddell, British Assoc, 1897, Electrician, 39, p. 636.
X The reader should consult Irwin's Oscillographs (Pitman) for a goodgeneral account of Oscillographic recording.

444 SOUND MEASUREMENT
The latter produces some lowering of frequency (about 33 per
cent.) and renders the system practically dead-beat. This oscillo-
graph may be used without correction up to a frequency of about
1000 p.p.s. Above this frequency it requires careful calibration
Fig. 131
(By courtesy of Cambridge Inst. Co.)
and must be used with caution. The instrument at its normal
frequency is not very sensitive, requiring rather large alternating
currents to produce measurable photographic deflections. This
limits its use to recording sounds of fairly large intensity, or,
alternatively, considerable valve amplification is required.
(b) The Einthoven String Oscillograph * consists essentially of a
fine conducting wire or fibre stretched at right angles to a strong
magnetic field B. Fig. 132a is a diagrammatic view of the
arrangement and 132b is a photograph of an actual instru-
ment. When a current i passes through the fibre of length / a
force Bli tends to displace it in the field in a direction at right angles
to the field and to the fibre. An alternating current produces
corresponding oscillations of the fibre. The motion of the latter
is magnified (about 500 times) by means of a microscope objective
mounted in one pole-piece of the large electromagnet. In the
opposite pole-piece is a second microscope objective serving as a
condenser lens to illuminate the fibre for observation and projec-
tion on a photographic film. The light is obscured at regular
intervals by the spokes of a wheel mounted on the spindle of
* See Irwin's Oscillographs, p. 23. Manufactured by Camb. Inst. Co.See also H. B. Williams, Opt. Soc. Amer. Journ., 9, p. 129, Aug. 1924,
and 13, p. 314, Sept. 1926.

OSCILLOGRAPHS 445
a phonic motor controlled by a tuning-fork (see p. 126). Theresulting record therefore appears with thin white lines, or 'time
marks,' which divide the record into equal periods of time, for use
in frequency analysis. The sensitivity of the oscillograph is
governed by the strength of the magnetic field (of the order 20,000
lines/cm. 2) and the natural frequency of the fibre. The frequency
Fig. 132A Fig. 132B
(By courtesy of Cambridge Inst. Co.)
is controlled by means of a tensioning screw. The thickness of
the fibre may vary from 1 or 2 \x quartz or glass, to 15 or 20 /x
copper, aluminium, phosphor-bronze, or tungsten (i/z = 10-4 cm.).
A silvered quartz fibre 2 \x diameter has a mass per cm. length of
about 10-7 grm. and an area of cross-section 3TxlO-8 cm. 2.
Taking the tensile strength of a quartz fibre as 10 10 dynes/cm. 2
(Kaye and Laby's tables, p. 28) and a safe working limit as
10 9 dynes/cm. 2, we can deduce the maximum safe tension Tmax and
frequency Nmax of the fibre. Thus
2 l~3lT. 31 dynes and N^^-^ . ^ :3-5xl0 4
//.
The upper safe limit of frequency of a quartz fibre of length
/=10 cm. would therefore be about 3500 p.p.s. With thin metal
wires the maximum frequency is considerably lower than this on
account of the increased mass per unit length and diminished
tensile strength. The thinnest fibres of quartz or glass are almost
critically damped (or dead-beat) in air at ordinary frequencies,
but this is not the case with the heavier metal filaments. Irwin*
has described a method of damping the natural vibrations of
* hoc. cit.

446 SOUND MEASUREMENT
(a)
(b)
(e)
ftJJftM»illftl**J«JIA ArQ Shunt
an Einthoven fibre by means of a 'resonant shunt.' The latter
consists of a condenser C, inductance L, and resistance R in series.
The best combination of C, L, and R for critical damping has been
determined by S. Butterworth, A. B. Wood, and E. H. Lakey.* Theshunt constants must be so chosen that the free electrical oscillation
in the shunt when short-circuited is an exact copy of the free
mechanical oscillation of the string when short circuited. This fixes
the values of LC and R/L for the shunt. The absolute value of Ldepends upon the degree of damping required, small inductances
giving large damping. For practically undamped strings, critical
damping is obtained if the coil reactance at the resonant frequency
of the string is equal to one
^^flPTlfT^PT,||^P|riF^^| half the resistance of the
- 1 1 i * * ,% f
string. Subject to such
conditions, records have
* , * been obtained with copper
^^^. or phosphor-bronze fibres
(14 /x thick) which showed
no trace of the resonant
oscillation. The damping
of a high resistance, air-
damped, silvered quartz
fibre is relatively simple.
The resonant shunt method
of damping a fibre makes
it possible to obtain the
maximum degree of sensi-
tiveness consistent with the
condition of critical damp-
ing. If accurate records of
sound vibrations are to be
obtained the latter condi-
tion is essential, and a
high, free frequency of
vibration of the fibre is
desirable. Records (a) and
(b) in fig. 133 illustrate the
effect of the resonant shunt,
when a small voltage was suddenly applied (the ' square-wave test')
to a fibre of frequency 1500 p.p.s. The advantages of the resonant
shunt are obvious. The shunted record still shows traces of the
* Journ. Sci. Instrs., 4, p. 8, Oct. 1926.
liiillil\B Withresonant'ShuntfS^
iharmonicstfUpmsent)
UtUL AJLJk mi\C WthfivoresonantSAimts/J^karmtwwremoved;
Fig. 133—Oscillograph Records illustrating
damping of Einthoven fibre by ' Resonant-Shunt ' Method

OSCILLOGRAPHS 447
third harmonic (4500 p.p.s. of the string; this is removed, if
necessary, by a second shunt of the corresponding frequency—see
fig. 1 33 (c)). The Einthoven oscillograph is frequently used in the
analysis of sound waves. It is considerably more sensitive than
the Duddell oscillograph, and consequently may be used to record
sounds of reduced intensity, or, alternatively, less amplification
of the currents from the sound receiver is required. On the other
hand its upper limit of frequency, unless exceptionally short fibres
are used, is somewhat low—as we have seen a very high value is
3500 p.p.s. for a 10 cm. fibre of quartz.
(c) The Abraham Rheograph #is an interesting example of a
moving coil galvanometer used as an oscillograph. Abraham #
succeeded in making the inertia and damping of the moving coil
negligible by introducing new electrical forces to balance them—
-
the coil being shunted by a special compensating circuit containing
inductance, capacity, and resistance. The arrangement is particu-
larly suitable for recording instantaneous or impulsive effects. It
possesses the great advantage of simplicity, and the optical arrange-
ments permit of a fairly large mirror attached to the moving coil.
Another simple form of oscillograph is a modified telephone re-
ceiver of the Brown reed-type (see fig. 97) . This device, sometimes
described as an optiphone, employs a small optical lever to magnify
the motion of the tip of the vibrating reed when small alternating
currents {e.g. from a microphone) are passed through the windings.
A small oscillograph mirror is mounted by means of rubber solu-
tion across two parallel knife edges about 0-1 mm. apart. One of
these knife edges is carried by the tip of the vibrating reed and the
other by a fixed pillar screwed into the body of the telephone.
Vibration of the reed tilts the mirror and produces corresponding
displacements of a spot of light on a revolving mirror or mov-ing photographic film. Although its indications are only faithful
at comparatively low frequencies, this inexpensive and simple
arrangement has many useful applications.
(d) Electrostatic Oscillographs - An E.S. string oscillograph for
recording voltage oscillations has been designed by Ho and Kato.fA fine fibre carrying the alternating electric charge lies in a strong
electrostatic field, which causes the fibre to oscillate with the
frequency of the electrical supply. A piezo- electric oscillograph \(see p. 146) has been designed by the writer, but this is generally
* See Irwin, Oscillographs, p. 51 ; and jfourn. de Phys., 4, p. 265, 1909.
t Manufactured by Camb. Inst. Co.
X A. B. Wood, Phil. Mag., p. 631, Sept. 1925.

448 SOUND MEASUREMENT
too insensitive for use in recording sound vibrations of average
intensity.
(e) Cathode Ray Oscillographs - For low frequencies (up to
1000 or 1500 p.p.s.) the Duddell and Einthoven oscillographs fulfil
a very useful purpose, but they fail entirely at very high frequencies.
Even at frequencies above 1000 these oscillographs require the use
of troublesome correction factors involving the relation between
the natural frequency of the moving element and the impressed
frequency. The cathode ray oscillograph, on the other hand, is
equally sensitive at allfrequencies from zero to the highest frequency
which is conceivable in an electrical circuit ; for the cathode ray is,
after all, an electron in motion, and can therefore execute any
oscillation which can be performed by other electrons oscillating
in electrical circuits. As we have seen, the mass per unit length
of the thinnest quartz fibre obtainable is 10-7 grm., whereas the
mass of a low-velocity electron is of the order 10-27 grm. (e/m
1-772 x 10 7 E.M.U. and e = 1-59 X 10- 20 E.M.U.). The mechanical
inertia of a moving electron is therefore a quantity which is entirely
negligible in comparison with that of a mechanical system such as
a fine Einthoven fibre or Duddell strip. The first attempt to
design an oscillograph employing a beam of cathode rays, an
electron stream, is due to Braun. He made use of the facts
that a pencil of cathode rays in a vacuum is easily deflected by
magnetic and electrostatic fields, and that the rays produce phos-
phorescent and photographic effects under suitable conditions.
The Braun tube consists, in principle, of a vacuum tube in which
a stream of cathode rays is produced by means of a high tension
supply of the order of 50,000 volts. Some of these cathode rays
pass through a fine tube or pinhole in the anode and thence
between the poles of an electromagnet and a pair of electrostatic
deflecting plates. Variations of current in the magnet (or of
voltage on the deflecting plates) produce corresponding deflections
of the pencil of cathode rays, which ultimately falls on a screen of
phosphorescent material (willemite, calcium tungstate, etc.) and
is thus rendered visible. Attempts to photograph alternating
current wave-forms with this oscillograph were unsuccessful until
an automatic method was devised which caused the cathode rays
to retraverse exactly the same path a large number of times in
succession. Such a multiple-exposure method is in many cases
impossible, e.g. if the electrical effect to be recorded is a single
impulse or an oscillation having a complex wave-form. In such
cases it is essential that the record should be obtained in a single

OSCILLOGRAPHS 449
traverse of the film. The first oscillograph achieving this condi-
tion was designed by M. Dufour.* The instrument is essentially
an improved form of Braun tube in which the cathode stream,
produced at a voltage of 60,000, is very intense. With this
oscillograph Dufour has obtained beautiful records of electrical
oscillations up to a frequency of 10 8 p.p.s. Now the electrostatic
sensitivity of a cathode ray oscillograph is inversely proportional
to the voltage V accelerating the cathode stream, consequently
Dufour's instrument is somewhat insensitive. To overcome this
difficulty Sir J. J. Thomson f employed an electrically heated,
lime-coated filament as the source of the cathode stream, and
accelerating voltages of the order of 3000 volts were found to give
satisfactory results. With this apparatus, used in conjunction
with a piezo-electric (tourmaline) receiver, D. A. Keys J obtained
records of the rapidly varying pressures of gaseous and under-
water explosions. A more robust and reliable form of this type
of oscillograph was designed by the writer. § A section through
one form of this instrument is shown in fig. 134, which, in view of
the foregoing remarks, will be self-explanatory. On account of
the relatively low velocity (1000 volts) of the cathode rays their
penetrating power is very low and they are rapidly absorbed by
the gelatine of ordinary plates. It is advisable, therefore, to use
plates with a low gelatine, i.e. high silver bromide, content so that
the maximum amount of energy of the rays may be expended in
ionising the silver granules. The 'spot' is traversed across the
photographic plate at a known speed by an electromagnetic method,
depending on the finite time of rise of a current in an inductive
circuit. Whilst it crosses the plate, the electrical oscillation
applied to the E.S. deflecting plates produces the necessary deflec-
tion at right angles and the wave-form is recorded on the plate.
The 'square-wave test' to which we have referred above in the
case of other oscillographs, reveals the great superiority of this
form over all others. A record of a voltage instantaneously
applied to the deflecting plates is shown in fig. 135 (a), the spot
traversing the plate in 001 second. As far as it is possible to
judge, the change from one position to the other is absolutely
instantaneous, and there is no overshoot. That is, the record is
perfect from the point of view of recording high-frequency
* This instrument is described in a paper by the writer, Journ. I.E.E.,
63, p. 1046, Nov. 1925. f Engineering, 107, p. 543, 1919.
t Phil. Mag., 42, p. 473, 1921.
§ A. B. Wood, Phys. Soc. Proc, 35, p. 109, 1923 ; and Journ. I.E.E.,
63, p. 1046, 1925.
29

45o SOUND MEASUREMENT
oscillations. The oscillograph is essentially an electrostatic in-
strument, and for that reason is best used in conjunction with
electrostatic sound receivers, e.g. the piezo-electric (Rochelle salt)
Ebonite Cap
Spiral Filament
Tungsten or Platinum
(Lime coated}
E.S Deflecting Plates^
Shutter Open
Shown Dotted
Closed Position
Plug to rotate
Hexagonal Plate-Holder
Brass Body-
carrying
6 Plates
Fig. 134—Cathode Ray Oscillograph (section)
(By courtesy of the Physical Society)
type. A record of a complex, heavily damped sound-impulse
under water is shown in fig. 1 35 (d). Fig. 1 35 (c) and (b) are similar
records of a pure tone and one with superposed harmonics. The

FREQUENCY MEASUREMENT 45
1
voltage-sensitivity of the instrument depends entirely on the poten-
tial applied to accelerate the cathode rays and on the dimensions
of the deflecting plates (length, distance apart, and distance
from photographic plate). In the records shown in fig. 135 the
sensitivity was approximately 4 volts per cm. deflection.
With a condenser microphone, or a piezo-electric receiver, and
a good distortionless amplifier (e.g. capacity-resistance type) the
cathode ray oscillograph gives good results. The oscillograph
r[f rpt r>^f
-•V'V^
Fig. 135—Cathode Ray Oscillograph Records
itself is quite free from distortion, and the limits of accuracy are
defined by the imperfections of the receiver and the amplifier.
As we have seen, a piezo-electric receiver has a very high natural
frequency, and may therefore be expected to give faithful repro-
duction at all frequencies within the audible range. A third type
of cathode ray oscillograph, operating on 300 volts, has been
designed by J. B. Johnson # for visual observations. It is very
sensitive, but is generally unsuitable for observing transients or
complex wave-forms. No provision is made for photography,
and the * soft ' vacuum is liable to result in distortion of wave-form.
For general laboratory purposes, particularly in the observation of
stationary patterns and Lissajous' figures, it is very convenient.!
Measurement of Frequency
In dealing with typical sources of sound, reference has often
been made to the determination of the frequency of vibration.
* Opt. Soc. Amer., 6, p. 701, 1922.
t See D. W. Dye, Proc. Phys. Soc, 37, p. 158, April 1925.

452 SOUND MEASUREMENT
The various methods of frequency measurement may be classified
broadly into 'absolute' and 'comparative.' It will be sufficient
now to draw attention to some of the methods already described,
and to add a few others.
Absolute Methods - In this class we include all methods in
which the number of complete vibrations per unit time is deter-
mined by direct reference to a standard clock. All methods in
which the wave-form is directly recorded on a film crossed bystandard time-marks are therefore absolute. The phonic motor
method of counting the vibrations of a tuning-fork (described on
p. 129) is an absolute method, applicable to electrically maintained
forks. As we have seen (p. 132), a tuning-fork standardised in
this way, or driven directly from a standard clock, forms an
electrical standard of frequency over a range extending up to
10 6 p.p.s. The multi-vibrator circuit controlled by such a
standard fork then becomes a standard of radio-frequency, and as
such is used to determine the frequencies of quartz piezo-electric
vibrators, which may then be regarded as substandards (see p. 132).
A convenient laboratory method of determining absolute fre-
quency is the electrically-driven siren fitted with revolution-
counting mechanism. The siren note is matched, by the 'beat'
method, to the note whose frequency is required, and the absolute
frequency determined from a knowledge of the number of holes
in the siren disc and the revolutions indicated by the counter in
a known period of time.
Comparative Methods - The frequency of any pure tone maybe determined by direct comparison with a standard—the latter
having been checked by an absolute method. Tuning-forks serve
as frequency standards over the audible range of frequency, and
in addition to their use as sound sources for such purposes are
also used to provide 'time scales' in comparative records (e.g.
smoked drum, photographic, etc.). If the frequency to be deter-
mined is sufficiently near to that of the fork, the simplest methodis that in which the number of beats per second is counted, care
being taken to observe which has the higher pitch—the standard
or the 'unknown.' This observation is easily made by adding a
small load to the fork and observing the change in the numberof beats per second. A number of standard forks may be used
to calibrate a monochord (or sonometer), which may subsequently
be used as a substandard of frequency having a continuous varia-
tion within the limits of calibration. Graphic methods are fre-
quently employed to compare a standard frequency (e.g. that of

FREQUENCY MEASUREMENT 453
a fork) with the frequency of an unknown, and possibly complex,
sound. If the latter is of feeble intensity it may be received by
a microphone, amplified and recorded by means of an oscillo-
graph, the record being traversed by standard time-marks.
Observation of Lissajous' figures is another method equivalent to
the beat method (but of wider application) often used in frequency
comparison. The frequency-analysis of a complex sound is
conveniently made by means of a Helmholtz resonator of con-
tinuously variable tuning (using a piston or a rising water surface),
and fitted with a sensitive device such as a hot-wire microphone
(see, for example, Fage's analysis of the sounds from an airscrew,
pp. 188 and 214). The response curve of the microphone will show
a peak at each predominant frequency, the latter being determined
from the known position of the piston in the resonator. Stern's
' tonvariator ' * is a resonator of continuously variable tuning used
as a source of sound for comparison of frequencies. The frequency
of a vibrating body may in many cases be determined by strobo-
scope methods (see p. 224). Sounds of very high (inaudible)
frequency may be compared by 'beat' or heterodyne methods.
The high-frequency sound is converted into an electrical oscilla-
tion, and superposed upon a second electrical oscillation of variable
frequency. After rectification a beat or heterodyne note will be
heard in the observer's telephone, the frequency of which can be
determined by the usual methods. A knowledge of the super-
posed high-frequency oscillation and the beat-frequency is sufficient
to determine the unknown frequency of the sound. The methodof Lissajous' figures may also be applied in the case of high
frequencies, using a cathode-ray oscillograph with two pairs of
electrostatic deflecting plates (mutually at right angles) to indicate
when the unknown and the known frequencies coincide. Fre-
quency may be determined indirectly by measurement of wave-
length, and assuming a value for the velocity of sound in the
medium through which the waves are passing. For example, to
determine the frequency of a quartz oscillator emitting high-fre-
quency sound waves, Pierce's method (p. 258) is very convenient.
Kundt's tube serves a similar purpose in the case of sound waves
of high or low frequency.
Interrupter Method of Analysis - An interesting method of
sound analysis has been developed by G. Barlow and H. B.
Keene.f The receiver must be of an electrical type. The
* Deut. Phys. Ges. Verh., p. 302, 1904.
f Roy. Soc. Phil. Trans., 222, p. 131, 1922.

454 SOUND MEASUREMENT
alternating electrical currents generated by the sound waves pass
through a direct current galvanometer and a motor- driven inter-
rupter, of which the speed can be varied over the whole range
of frequency to be investigated. Generally the intervals during
which the circuit is open and closed are equal. When the inter-
ruptions synchronise with any component A sin nt of the current,
the galvanometer responds by giving a steady deflection of magni-
tude depending on the phase difference. In making the analysis,
the frequency of interruption is slowly increased over the whole
range. Barlow and Keene used the method to analyse the sounds
from a tuning-fork, a voice, an organ pipe, diaphragms, and re-
sonators. Using hydrophone receivers (microphonic and electro-
magnetic), they also analysed sounds produced under water by
ships' propellers.
Vibration Galvanometers are often employed in the frequency
analysis of sounds received electrically. If the sound to be
analysed has a frequency below 200 p.p.s. the Campbell # vibration
galvanometer is a very suitable instrument. It consists essentially
of a small coil of wire suspended in a strong magnetic field by a
phosphor-bronze strip of adjustable tension which controls the
tuning. The Duddell vibration galvanometer responds to higher
frequencies (up to 1500 p.p.s.), and consists of a bifilar conducting
phosphor-bronze strip (with mirror attached). Adjustments in
tension and in length provide for a continuous frequency control.
In both these instruments the principle involved is simply that
of a moving coil galvanometer in which the coil and suspension
are timed mechanically to the frequency of the current. This results
in a resonant vibration, and a spot of light reflected from the
mirror is drawn out into a continuous band. At resonance the
band has its maximum length on the scale. A similar instrument
has been designed by P. Rothwell f with a number of elements
of the Campbell type tuned in succession over a range of fre-
quencies. In frequency analysis the alternating electrical currents
set up in a microphone receiving sound waves are passed through
the vibration galvanometer, the frequency of which is varied con-
tinuously, the width of the light-band being observed at the various
frequency settings of the instrument. The galvanometers have a
graduated scale of frequencies, calibrated by alternating currents
of standard frequencies. They are not only useful in frequency
analysis, but also serve a very useful purpose in comparing small
* A. Campbell, Phil. Mag.y 14, p. 494, 1907; and Proc. Phys. Soc,
26, p. 120, 1913. f Journ. Set. Instrs., 2, p. 251, 1925.

AMPLITUDE OF VIBRATING SURFACE 455
alternating currents of any frequency within the range of the
instrument. That is, they may be used in the comparison of
sound intensities if the sound is pure and the receiver generates an
electrical current. At a particular frequency the length of the
band of light on the scale is proportional to the alternating current,
the latter being a measure of some function of the amplitude of the
sound (according to the type of receiver employed). F. B. Youngand the writer # (in 1916) used a vibration galvanometer to calibrate
a shunted-telephone system for comparing sound intensities with
a microphone receiver under water.
Measurement of the Displacement-Amplitude of a Vibrating
Solid (Sound Source) - Before leaving the question ofmeasurement
of sound waves, it may not be inappropriate to refer to one or two
interesting methods of measuring the displacement-amplitude of
a solid surface, such as a diaphragm in vibration and emitting
sound waves. The first method employs a very simple and
effective device due to Sir W. H. Bragg.
f
Bragg's amplitudemeter , as it may be
called, is really an acceleration meter.
The principle is as follows. A small
mass m supported by a spring s is brought
into contact with the vibrating surface,
and the clamped end of the spring dis-
placed a distance A towards the surface
(see fig. 136), until there is no longer1
chattering ' between the small mass and
the vibrator (let us say a diaphragm).
Up to this point the maximum accelera-
tion of the diaphragm, tending to throw
off the small mass, exceeded the accelera-
tion of the mass (under the action of the
spring) towards the diaphragm. At the
point at which chattering just ceases the maximum acceleration
of the diaphragm is just equal to that of the mass attached to the
spring. Thus if a and n and A and N represent the maximumamplitude and the free frequency of the diaphragm and of the
loaded spring respectively, we must have
Maximum acceleration =an 2=AN 2 or a=KN 2/n 2,
'J4 Vibratingv, surface
j> Amplitude a
I
Fig. 136
* hoc. cit.
f Engineering, p. 777, June 13, 1919 ; and Journ. Set. Instrs., 6, p. 196,
June 1929.

456 SOUND MEASUREMENT
a very simple relation giving the displacement-amplitude a of the
diaphragm in terms of the displacement A of the spring and the
ratio of the squares of the frequencies of the loaded spring and
the diaphragm. If N is small compared with n, as will always
be the case, the displacement A will be large compared with a,
the 'magnification' being in the ratio n 2/N 2. In practice, the
chattering is observed electrically, a pointer instrument or a pair
of telephones being connected in series with a battery and the' microphonic ' contact formed between the loaded spring and the
diaphragm (which must be electrically conducting). The fre-
quency of the loaded spring, if sufficiently low, may be 'timed'
directly, or determined by stroboscopic or photographic methods
if too high for direct observation. For example, if N= l p.p.s.,
^ = 1000 p.p.s., and A is found by experiment to be 1 cm., then
a=l0~6 cm. The method permits of the measurement of very
small amplitudes provided the surface is vibrating sinusoidally.
It is important to observe, of course, that the measuring device
is sufficiently light so as not to interfere with the motion of
the vibrating surface whose amplitude is required. The same
principle is applicable even at very high frequencies when it maybe necessary to replace the loaded spring by a vibrator of fairly
high (audible) frequency. Under such circumstances when a is
very small, A will be rather small also, and great care must be
taken in making the measurement.
A special case is of interest. When objects rest by gravity on
a vibrating surface, of which the motion may be represented by
a sin ?it, chattering takes place if an 2is greater than g, the accelera-
tion of gravity. The weight of the object is immaterial provided
it does not impede the motion of the vibrating surface on which
it rests. Thus if n( =2 tt x frequency) is equal to 10 3, and the
amplitude a is adjusted to the chattering-point, we have an 2 =g,
whence <z = 10~ 3 cm. approximately. If a quartz crystal of fre-
quency-number w=T0 5 just produces chattering with a particle
of sand on its surface, its amplitude is about 10 7 cm. As a simple
means of determining the amplitude of sinusoidal vibrations of
this nature Bragg's method is very valuable.
The second method, used by Webster,* makes a vibrating surface
one of the reflectors of a Michelson interferometer, the second
surface being fixed. The displacement of the interference fringes,
photographed as a wavy line, gives a measure of the amplitude
in terms of the wave-length of the monochromatic light which is
* Nat. Acad. Set., 5, p. 179, 1919.

WAVE-FILTERS 457
used. H. A. Thomas and G. W. Warren * have recently employed
a modification of the method to measure the amplitude of small
vibrations of reeds and diaphragms in 'loud-speakers.' Theinterference fringe pattern is observed by eye, and the alternating
current in the loud-speaker is gradually increased from zero.
When the vibration is very small the fringes become blurred and
will ultimately disappear, but if the amplitude of vibration be
increased till the peak value is A/4 (A being the wave-length of
the light) they will reappear as a new set of fringes displaced half
a fringe-width from the initial position. If the amplitude is still
further increased, the fringes will again disappear and will re-
appear when the maximum amplitude is 2A/4, 3A/4, 4A/4, and so on
(in general mA/4). A curve may be plotted showing the values
of current for various integral values of m in raA/4. The method
is applicable when the vibrating body is too light to permit of a
glass reflector being attached, in this case a thin metal mirror being
sputtered cathodically on the surface. It is important to note
also that the accuracy of the method is in no way impaired if the
surface is not optically flat, the observed effects being independent
of the straightness or otherwise of the interference fringes. Adiaphragm or other vibrator calibrated in this way may be em-
ployed as a standard source of sound—its absolute amplitude being
known for various exciting currents.
Wave-Filters. Electrical and Mechanical
The passage of an electric current through a long telephone line
or cable is, in the absence of special precautions, accompanied by
distortion of wave-form. This effect is particularly noticeable in
the transmission of complex wave-forms, as in the case of speech,
through long lines. Heaviside showed that this distortion was due
to the distributed electrical capacity of the line filtering out certain
components of frequency from the wave during transmission, and
he suggested the use of inductance or ' loading coils ' to compensate
for this distributed capacity. Heaviside's suggestions were first put
into practicable form by Pupin and G. A. Campbell. f The latter
extended Heaviside's theory and showed how it was possible in
practice to distribute inductance and capacity in electrical trans-
mission lines so that certain selected ranges of frequency are
* Phil. Mag., 5, p. 1125, 1928.
t Phil. Mag., March 1903, and Bell System Techn. Journ., Nov. 1922.
See also various papers by Zobel, Carson, Johnson, Shea, and others,
in Bell System Techn. Journ., 1923, 1924 ; G. M. B. Shepherd, Electrician,
7, p. 399, 1913 ; P. David, Onde Electrique, 5, pp. 5 and 72, 1926.

458 SOUND MEASUREMENT
transmitted with negligible attenuation, whilst other frequencies
are suppressed almost entirely. In the simple form of the theory
the transmission line is regarded as a repeated network or chain
of impedances arranged in series and in shunt as in fig. 137. The
current in its passage along the chain from left to right is attenuated,
some frequencies more than others. Denoting each of the series im-
pedances by Zj and the shunt impedances by Z 2 , we can determine
the attenuation factor. The line A'B'C'D' in fig. 137 represents
an 'impedanceless line,' for convenience all the series impedances
being 'lumped' in the line ABCD. Denoting the currents in the
parts AB, BC, and CD of the line by im_ lt im , and im+1 respectively,
we must have : current through BB' z=im-1—im and through CC =im —-im+li equating e.m.f.'s acting round the mesh BCC'B' we obtain
Jllm Jr J 2V'm tm+l)—^J 2\ tm-l lm)
or
that is,
lm+ l:2+
z,(1)
Now the ratio of the current in one section to that in the preceding
one is a constant in such a chain system as this, consequently wemay write
vm+ l
(2)-m+ 1 lm-\-2
where A is defined as the 'propagation' constant. We maytherefore write for equation (1)
or
ex +e-
cosh A
-I1 Z2
1 +2Z"
(3)
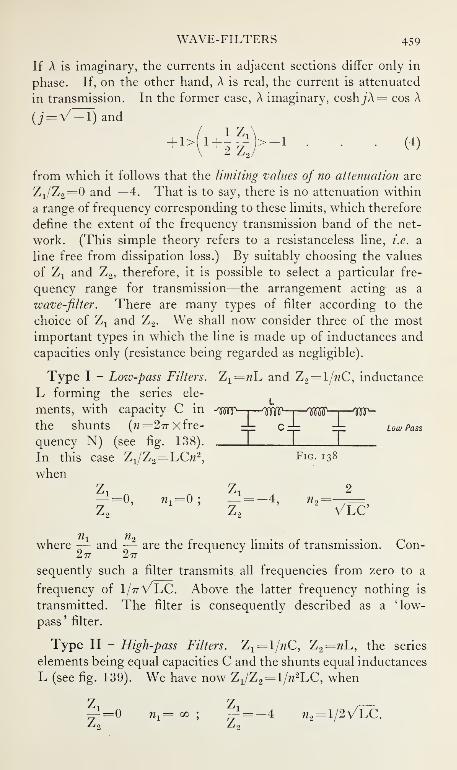
WAVE-FILTERS 459
If A is imaginary, the currents in adjacent sections differ only in
phase. If, on the other hand, A is real, the current is attenuated
in transmission. In the former case, A imaginary, coshj"A= cos A
(j=V — 1) and
1 z;+2z-;;
>- 1• «
from which it follows that the limiting values of no attenuation are
Z xjZ 2=§ and —4. That is to say, there is no attenuation within
a range of frequency corresponding to these limits, which therefore
define the extent of the frequency transmission band of the net-
work. (This simple theory refers to a resistanceless line, i.e. a
line free from dissipation loss.) By suitably choosing the values
of 2, 1 and Z 2 , therefore, it is possible to select a particular fre-
quency range for transmission—the arrangement acting as a
wave-filter. There are many types of filter according to the
choice of Z x and Z 2 . We shall now consider three of the most
important types in which the line is made up of inductances and
capacities only (resistance being regarded as negligible).
Type I - Low-pass Filters. Z x =wL and Z 2 =l/nC, inductance
L forming the series ele-
ments, with capacity C in -^Rnnp—1—WiP-i
—
WP—1—W-the shunts (n =2n X fre- zjz C rjr
=J=Low Pass
quency N) (see fig. 138). T T TIn this case Z^Z.-LOz 2
,
Fig. 138
whenZ Y
Z x2
=0, n ± =0; ^ = -4,Z2
' z 2' ' VLC
where — and — are the frequency limits of transmission. Con-
sequently such a filter transmits all frequencies from zero to a
frequency of I/77VLC. Above the latter frequency nothing is
transmitted. The filter is consequently described as a 'low-
pass ' filter.
Type II - High-pass Filters. Z 1= l/nC, Z 2 =?zL, the series
elements being equal capacities C and the shunts equal inductances
L (see fig. 139). We have now Z1/Z2 ^=l/n2hC
iwhen
=*=0 nl= co
; ^= -4 n 2= l/2VLC.

460 SOUND MEASUREMENT
1
1
cj|
1
1
I
.
The filter therefore trans-
' J '' J ' ' T '
i mits all frequencies fromSj L§ 3 High Pass , , . _. /-if
-7> • r» • < •
y 7 y 1/477VJ^C to infinity, and is
consequently described as a' high-pass ' filter.
Type III (a) -Band-pass Filters. Z1 =l/»C1,Za=(«L-l/»CB),
capacities C x forming the
series elements, with indue- J I .—LI I—
.
1
1
, 1 1
—
tances L, and capacities C 2 S L I 1 Band Pass
in series forming the shunt -p c2-r- -j-
elements (see fig. 140). Fig. 140
NowZj_ 1 _ 1
Z~ „ I 1 T \ "C^-^LCV
when
nC>[ncr
nL
2-^=0 we have wL= l/wC 2 and »1=1/VLC.^9
when
Zi 1 / 1
4 we find, similarly, w 2=o\/f7^ +Z2
—»» j. - 2'VLC1'LC 2
g^gJ^
Type III (b) - Band-pass Filters. Z^l/nC^ ^=( nC2-^J J
I j
Oj,
.
.
j
. in this case the shunt ele-
ments are made up of in-Band Pass , T j •. ^ductance L and capacity C 2
~in parallel, the series elements
Fig. 141 f'
being capacities C^ as before
(see fig. 141). We now have
Z, C 2 1 Zx
1
Z 2 Cx w^LCi Z 2 VLC 2
— = —4 we find n 2=——
Zo v
When
A/L(C 2+4C 1 )
In Types III (a) and III (b) it will be seen that the filter transmits
only between certain finite values of frequency (given by n^-nand Wo/277). Such an arrangement is consequently described as
a 'band-pass' filter.

WAVE-FILTERS 461
The foregoing simple examples will serve to illustrate the
principles on which electric wave-filters are designed. Thenumber of possible combinations is, of course, very large, and in
actual cases ohmic resistance cannot always be neglected. Thegeneral behaviour of simple low-pass and high-pass filters is easily
understood when it is remembered that the impedance nL of an
inductance L increases with frequency, whereas the impedance
IjnC of a capacity C decreases with frequency. Both the in-
ductance and the capacity have therefore a selective influence in
regard to currents of different frequencies, the inductance trans-
mitting low and 'choking' high frequencies, whilst the condenser
functions in the reverse manner. Electric wave-filters have been
extensively used not only in practical telephony, but also in
laboratories as a means of analysing complex sounds. Thevarious sounds of speech, converted by a microphone receiver
into the corresponding electrical currents have been analysed bywave-filters to determine the frequency range which is essential
to intelligibility.# Other applications of a similar nature are self-
evident.
We must now consider the question of mechanical filters, the
theory of which is in all respects parallel to that of electrical filters.
The development of mechanical or sound filters is due primarily
to the work of G. W. Stewart. f A simple example of a filter is a
Helmholtz resonator with a small ear-opening which transmits a
sound wave of one particular frequency only. Cylindrical tubes
such as those shown in fig. 142 also serve as filters, Type I trans-
mitting the resonating frequency of the
column a b, and Type II, a Quincke (1)
filter, absorbing that frequency. The a fj
filters with which we are now concerned,
however, are somewhat different in prin- (2)
ciple, as they do not depend directly upon —resonance effects but on the interaction
between the successive links in the ' chain
'
of a mechanical transmission line (as in the electrical case we have
just considered). The various sections or links in this chain have
over-all dimensions which are small compared with a wave-length
of the sound passing through them. There seems no reason for
doubting that every electrical filter has its mechanical analogue,
* See, e.g., E. K. Sandeman, Proc. I.E.E., Nov. 1923.
f Phys. Rev., 20, p. 528, 1922. See also F. Canac, jfourn. de phys.
et le radium, 7, p. 161, 1926 ; W. P. Mason, Phys. Rev., 31, p. 283, 1928.

462 SOUND MEASUREMENT
although the latter may not always be practicable. Stewart deals
with three kinds, analogous to those we have just considered in
the electrical case. The following conditions are necessary to
preserve the electro-mechanical analogy: (1) The length of anyselected section of an acoustic * line ' or conductor must be regarded
sufficiently small compared with a wave-length that no change of
phase occurs within it. (2) Acoustic impedance is defined as the
complex ratio of the pressure difference applied and the rate of
change of volume displacement (analogous to the complex ratio
of applied p.d. and current in the alternating electrical case). (3)
The algebraic sum of the volume displacements at any junction
of lines is zero (the equivalent of KirchhofFs first law). Com-paring electrical and mechanical equations (see p. 71) we have,
in the usual notation
LQ+RQ+Q/C-E cos nt (electrical)
and
mx-\-rx-\-sx=P cos nt (mechanical)
(a)
The latter equation, when we are dealing with volume changes
(Sx), must be written
m r s
^+^+§ 2x =P C0Snt • • • (b)
where S is the area subjected to a pressure P=pS and a linear
displacement x. Comparing equations (a) and (b) in the case of
a system having inertia only, and regarding p in (b) as the equi-
valent of E in (a), we find m/S 2=L—that is, the inertance m/S 2is
equivalent to the inductance L ; and in a system having stiffness
only s/S 2 =l/c that is, the compliance S 2/s is equivalent to the
capacitance C. Substituting for inductance L and capacitance Cthese values of the inertance and compliance, in our equations for
electrical wave-filters, we obtain the analogous equations for
mechanical filters. The mechanical values of Zx and Z 2 whenboth inertance and compliance are present, are obtained as in the
electrical case. Thus, compliance and inertance in series (e.g.
in a Helmholtz resonator) have a mechanical impedance Z given by
nm s=~S 2 ~n~S 2
'
In a Helmholtz resonator the mass m is that of the air-piston
in the neck (m=pS 1l) and the stiffness s is that of the air in the

WAVE-FILTERS 463
1-0
•9
1-7
|-6
"^V\^—J \
=XE JTr^s
-
Low Pass Filter
(Stewart)
1 1 1 1
Frequency (log. scale)
Fig. 143
2 2°°°
cavity (s= S 2$p)- It is a simple exercise to prove that the fre-
quency N is that obtained by other methods in equations (12),
p. 186 (remembering that the corresponding electrical frequencv
N=1/2tt N LC).
Construction and Test of Mechanical Filters of the ThreeTypes - Stewart* states: "Low-pass filters were made, for
example, by two concentric cylinders joined by walls equally
spaced and perpendicular
to the axes. Each chamber
thus formed had a row of
apertures in the inner
cylinder which served as
the transmission tube. In
one case the volume of each
chamber was 6-5 c.cm., the
radius of the inner tube 1-2
cm., and the length be-
tween the apertures 1-6 cm.
A chamber and one such
length of the inner tube is called a section. Four such sections
were found to transmit 90 per cent, of the sound from zero to 3200
p.p.s. approx., where the attenuation became very high." Other
similar filters of different dimensions showed transmissions having
wider or narrower frequency ranges. The general construction
of the low-pass filters and the experimental transmission curve
are shown in fig. 143.
"High-pass filters were
made with a straight tube
for transmission and short
side tubes, for example, 0-5
cm. long and 0-28 cm. dia-
meter, opening through a
hole with conductivity 0-08
into a tube 10 cm. long
and 1 cm. diameter. Six
sections of such a filter
would transmit about 90
per cent, of sounds above800 p.p.s., but would refuse transmission to sounds of lower fre-
quency." The cross-section of a simple two-section filter ofthis type, with its transmission curve, is shown in fig. 144.
* hoc. cit. See also V. L. Hartley, Engineer, 143, p. 624, 1927.
Frequency (log. scale)
Fig. 144

464 SOUND MEASUREMENT
0-7
•6
2 •*>
§5
1-4
Band Pass Filter
(Stewart)
Frequency (log. scale)
Fig. 145
Single band-pass filters are a combination of the other two types,
having side tubes leading to chambers of considerable volume.
Such a filter and its transmission characteristics are shown in
fig. 145. The agreement with theory is fairly good, for it is
possible to construct filters to
meet certain specified condi-
tions. In the laboratory,
filters may be used in the
elimination of undesirable
components in a sound wave,
and for certain types of sound
analysis, e.g. in observations
relating to the intelligibility
of speech. A filter has the
advantage over a resonating
device in that it is able to
select a frequency-band of adjustable width. Regarding its
practical usefulness, the filter has direct application to the
gramophone and wireless telephone in the removal of un-
desirable frequencies, e.g. needle-scratch or microphone and
valve noises. Stewart suggests also that the device makes possible
the simultaneous reception of an indefinite number of radio
messages with the same antenna. Filters have also an application
in the design of megaphones for use with loud-speaking devices.
Maxfield and Harrison * have made use of the electrical analogy
in the design of mechanical sound reproducers (the gramophone).
The introduction of the filter phenomena may ultimately affect the
design of musical instruments.
A difficulty which is inherent in mechanical filters is due to the
continuous structure of the medium within the transmission
'line.' The inertia and stiffness factors are not so definitely
' lumped ' as in the analogous electrical case. Dissipation effects,
due to the viscosity in the small holes and side tubes, cannot be
ignored. In a later paper Stewart f takes these factors into
account to explain certain experimental observations of multiple
resonance effects in filters—accounting for certain cases of failure
of the low-pass filter to suppress very high frequencies.
* Bell System Techn. Journ., 5, p. 493, 1926.
f Phys. Rev., 25, p. 90, 1925. See also Peacock, Phys. Rev., April
1924.

SECTION V
TECHNICAL APPLICATIONS
In the present section it is proposed to deal with a few of the
more important technical applications of the principles of sound,
apart from those already mentioned. The last ten or fifteen years
includes a period of marked progress in such applications of sound.
The Great War stimulated the development of apparatus for
detecting, identifying, and locating sounds at long ranges. Manyforms of directional sound-receivers, sound-ranging, and signalling
devices were realised and applied to urgent practical problems on
land and sea. Since the war these methods have been applied
for more peaceful purposes, e.g. echo depth-sounding, surveying,
and navigation. Considerable advances have also been made in
the study of the acoustics of buildings, initiated by the work of
Sabine. The phenomena of piezo-electricity, discovered in 1880
by Curie, have developed into a means of standardising mechanical
and electrical frequencies up to millions of vibrations per second.
In this respect, also, improvements in tuning-forks and phonic
motors have played an important part. Another important
application of piezo-electricity, initiated by Langevin and developed
by Boyle, employs the supersonic oscillations of quartz in depth-
sounding at sea and in the echo detection of icebergs. At the
other extreme of the frequency scale, Constantinesco has developed
a system of transmission of low-frequency, alternating, mechanical
power through water-filled pipes. For this purpose he employs
generators, motors, transformers, and transmission ' lines ' closely
analogous to the corresponding electrical devices. The growth
of radio-telephony and ' broadcasting ' has stimulated the develop-
ment of improved methods of reproducing sounds of audible
frequency. The elimination of objectionable resonances from
gramophones and 'loud-speakers' represents an important step in
the reproduction of speech and music. The study of the character-
istics of speech and hearing, notably the work of the Bell Telephone
Laboratories, U.S.A., has not only increased our knowledge of
these subjects but has proved of great value in the improvement
of telephone apparatus, microphones, transmission lines, etc., and
in the design of all forms of sound-reproducing mechanisms. In
465 30

466 MEASUREMENT OF DISTANCE BY SOUND
this respect also the introduction of the conception of acoustical
impedance and the mechanical-electrical analogy of filter circuits,
has proved of great value in dealing with complex mechanical
systems. The general question of reduction of traffic noise is
becoming increasingly insistent, and it is noteworthy that the
problem is now receiving a certain amount of public attention.
In a recent discourse before the Royal Aeronautical Society,
W. S. Tucker has dealt with the similar problem of noise-reduction
in aircraft.
Measurement of Distance by Sound
The principle involved in the most direct method of measure-
ment of distance by means of sound waves is the converse of that
employed in the determination of the velocity over a measured
base line. Provided the velocity of propagation c is known, the
unknown distance d between two points is determined by the
time-interval t taken by the sound to travel from one point to
the other, then d=ct. For example, if two microphone receivers,
A and B, are situated a distance d apart, and are connected
electrically to a recording device, e.g. an Einthoven oscillograph
with time-marker, and a sound wave takes 5 seconds to travel
from A to B, the distance apart of the microphones will be 5500
feet, assuming 1100 ft./sec. to be the value of the sound-velocity
in air at the time of the experiment. A modified form of the
method requires, under certain circumstances, only one receiver.
In this case, which we shall describe as the reflection method, the
sound wave after passing the receiver A subsequently falls on
a reflecting surface and the returning wave passes A again after
an interval t=2d/c, where d is the distance of the receiver from
the reflector. The direct method of determining distance is not
always possible, however, and another method, also very familiar,
may be used instead. We shall describe this alternative as the
differential velocity method—it is sometimes called the ' synchronous
signalling' method.* Two sets of waves initiated at the same
moment travel outwards with different velocities. An observer
at a distant point receives the high-velocity v x wave first, and
after a measurable time-interval t he receives the wave of lower
velocity v 2 . The distance d of the observer from the source is
consequently derived from the simple relation
—
_d _dL
^2 Vl
* See J. Joly, Phil. Mag., 36, p. 1, 1918.

ECHO DEPTH-SOUNDING 467
If the velocity v 1 is very large compared with the velocity v2l the
relation simplifies still further to t=djv 2 . The waves need not
necessarily be of the same type
—
e.g. those of high velocity v x
may be electromagnetic waves (light or 'wireless') travelling with
a velocity of 3 x 10 8 metres/sec. compared with the velocity of
sound of the order 3 x 10 2 metres/sec. in air or T5 x 10 3 metres/sec.
in water. This case corresponds to that of all the earlier methods
of measuring the velocity of sound in air (p. 234) or in water
(p. 245), in which a flash of light signals to the distant observer
the instant of firing a gun or a charge of explosive. Strictly
speaking, the observer sees the flash slightly after the instant at
which it occurs, but the error involved in the estimation of the
distance is only that due to neglecting 10~8 in (10~2— 10-8), an
error which is quite insignificant. As we shall see, this principle
has been extended to a very important method of locating a
simultaneous source of sound and * wireless ' waves. The two sets
of waves may alternatively be of the same nature but travelling in
different media with different velocities. Thus sounds may be pro-
duced simultaneously in air and in water, the velocities vx (water) and
v2 (air) being of the order 333 and 1500 metres/sec. respectively.
In such a case the distance d reduces to d=4zS0t metres, approxi-
mately, when t is measured in seconds. If the sound wave in air
were replaced by a light flash we should have d=\500t metres.
We shall now consider a few of the important technical applica-
tions of these simple principles.
(A) Echo Depth-Sounding
The process of measuring the depth of water beneath the keel
of a ship has, from time immemorial, been described as 'sound-
ing.' Until comparatively recent times this operation has been
performed by the simple and direct method of the lead-line.
Latterly this has been replaced on the larger ships by the well-
known Kelvin sounding machine in which a weighted wire
carrying a 'chemical tube,' closed at one end, is lowered to the
bottom. The depth of water is estimated from the amount of
compression of the air enclosed in the tube; the encroachment
of the sea-water up the tube being indicated by the chemical
action on the material coating the inside of the tube.
These methods, involving the use of a weighted line, require
a ship to reduce speed to something below eight knots; this in-
volves expense and loss of time. Again, in hydrographic surveys
it is often necessary to take soundings in very deep water. Such

468 MEASUREMENT OF DISTANCE BY SOUND
operations are very slow and tedious; a single sounding in 3000
or 4000 fathoms might take several hours to carry out satisfactorily.
The risk of long wires breaking under such conditions, and the
errors arising from uncertain knowledge of currents at varying
depths, make observations of this nature somewhat unreliable.
It is not inappropriate therefore that the method of sounding by
wire should be replaced by sounding by sound waves. This newmethod involves the simple principle of measuring the time
interval for a sound wave to travel (with known velocity) from
the surface to the bottom and back again. The velocity of sound
in the sea under varying conditions of salinity and temperature
is known with considerable accuracy (see p. 248). The various
methods of echo sounding are distinguished primarily by the
methods of determining the time interval. They differ in detail
also as regards the type of sound source, receiver, and indicator.
The advantages of the echo method are obvious. A sounding
in 4000 fathoms can be made in about 10 seconds, as compared
with several hours by the old 'wire ' method. Again, the observa-
tions of depth can be made whilst the ship is in motion, up to
speeds of 15 to 20 knots, resulting in a great saving of time and
inconvenience. Echo-sounding systems have been devised in
America, France, Germany, and Great Britain.*
(1) American Systems, (a) Fessenden Rotating-Disc Method -
Fig. 146 illustrates diagrammatically a device invented by R. A.
f77>
Fessenden
Oscillator
Alternator
H
Motor
FT
G -=-
Microphone
/Transformer
nE^S kltf
Telephones
Fig. 146—Echo Sounding Apparatus (Fessenden)
Fessenden.-f
A is a disc of insulating material driven at con-
stant speed by a motor B. The disc carries a conducting segment
* See H. C. Hayes, Journ. Frank. Inst., 197, March 3, 1924; and ' Echo
Sounding,' Intern. Hydr. Bureau, Spec. Pubns., No. 3, 1924, and No. 14,
1926. t U.S. Patent, No. 1217585.

ECHO DEPTH-SOUNDING 469
C which closes the electrical circuit through a submarine
sound transmitter (a Fessenden oscillator) D when it passes
beneath the brushes E, thereby sending out a short sound signal.
This segment subsequently closes a circuit through the telephones
F when it passes across the brushes G. If the echo of the signal
arrives at the microphone receiver H at the instant when the
segment C short-circuits the brushes G it will be heard in the
telephones. The time taken by the sound to travel from the
transmitter to the sea-bed and back to the microphone H will
then be equal to the time required for the segment C to travel
the angular distance between the two pairs of brushes. This is
indicated by a pointer I on a circular scale J. The adjustment is
made by rotating the brushes G around the disc A by means of the
handle K. This apparatus has a number of defects in actual use,
e.g. the conducting segment C which closes the telephone circuit
at each revolution of the disc produces a ' click ' in the phone (due
to contact e.m.f.) which might be mistaken for an echo. TheFessenden oscillator used to produce the sound signal is designed
to give a continuous sinusoidal sound wave, whereas a sharp,
heavily damped impulse is most suitable for echo purposes.
(b) Angle of Reflection Method - A system developed in the
x\merican navy measures the depth of water beneath the ship
by observation of the angle of reflection of a continuous sound
wave transmitted from one end of the ship and received at the
other. In its simplest form the sound source may be the propellers
of the ship, and the receiver any form of directional hydrophone
fitted near the bows. If 2d is the distance separating the source
and the receiver, and the received sound wave makes an angle 6
with the horizontal, then the depth h of the water beneath the
ship is given by h=d tan 6. In practice a Fessenden oscillator is
used as the sound source and a line of Mason hydrophones (see
p. 422), fitted with binaural compensator, gives the required
direction. To eliminate errors due to a shelving bottom it is
necessary to employ two sets of transmitter and receiver—trans-
mitting first from one end of the base line (the length of the ship)
and then from the other. The mean depth is then obtained from
the ' mean angle ' of reflection observed. This method of depth-
sounding breaks down for depths so great that the angle 6 approaches
a right angle. It has been found in practice that the method gives re-
liable soundings to depths equal to three times the length of the base
line—for most vessels this will cover depths up to 100 fathoms.
(c) Stationary Wave Method - A source of continuous sound

47o MEASUREMENT OF DISTANCE BY SOUND
of variable frequency is employed (e.g. over a range 500 to 1500
p.p.s.), and an accurate frequency indicator included in the circuit
which supplies current to the sounder. The operator's phones
are connected one to the microphone receiver (the hydrophone),
and the other to a coil coupled to the sound transmitter circuit.
The two sounds heard in the phones will at all times have a
definite phase relationship, which will depend on the phase of
arrival of the sound waves at the receiver. If the operator adjusts
the frequency correctly he can make the sound heard in the phones
have the same phase and can recognise this condition by the fact
that the resultant sound in the ears will be binaurally centred.
If the sounds are in phase therefore, the sound path from trans-
mitter to receiver, via the sea-bed, will be given by an integral
number m 1 of wave-lengths at the frequency N x . Calling this
distance s, and the velocity of sound c, we have s=m1c/N1 . Thevalue of m x can be found by raising the frequency of the sound
until a second condition of binaural centring is observed, then
^=(/«1fl)f/N2=%t;N1 , which, on eliminating m±i gives
s=c (N 2—NJ.Knowing the separation of the sound source and the microphone,
the depth h is readily deduced.
This method has proved accurate for measuring shallow depths
—in which case a greater change of frequency (N 2=N 1) is required
to change the number of waves in the standing-wave system. At
greater depths it fails for similar reasons. A modification of this
method consists in sending out a continuous series of short sound
signals separated by equal time-intervals, and means for varying
continuously the time-interval between successive signals from
about 0-1 second to 10 seconds in such a manner that the time-
interval between successive signals can be accurately determined.
(2) German Systems - A. Behm of Kiel has designed a
depth-sounding apparatus based on a different principle, viz.
measurement of the intensity of the echo. A source of sound on
one side of the ship sends out continuous waves which are reflected
from the bottom and received by a resonant chamber which causes
a tuning-fork to vibrate. The intensity of reflection is measured
by the amplitude of the fork, observed by means of a microscope
—
the arrangement being first calibrated in known depths of water.
This method fails for a number of reasons. It is extremely diffi-
cult to keep a sound source operating continuously at a constant
intensity and frequency, and to ensure also that the receiver shall

ECHO DEPTH-SOUXDIXG 471
always be accurately tuned and of constant sensitivity*. A moreserious difficulty, however, is that of making allowance for varia-
tions of the coefficient of reflection from the sea-bed—a quantity
which may vary rapidly (from rock to mud or sand) in relatively
short distances. Realising the weakness of this method Behmdeveloped an alternative method, now in use as the Behm-Echolot
System in which the time between signal and echo is measured.
The sound source is an electrically fired detonator which gives a
single impulse to the water. The receiver on the opposite side
of the ship, screened from the direct blow, receives the reflected
impulse from the bottom. An electromagnetic device at the
instant of firing the detonator releases a disc which commences to
rotate. The rotation is arrested suddenly, however, when the
echo reaches the receiver. The edge of the disc is graduated in
metres to indicate depths directly. This apparatus gives reliable
soundings up to 80 fathoms. It has also been used on airships
as a means of determining heights above the ground.
(3) French System. Langevin Piezo-Electric Oscillator * -
The Langevin system is based on a suggestion made, at the time of
the Titanic disaster (April 1 9 1 2), by L. F. Richardson, who proposed
the use of a beam of supersonic waves as a means of detecting
submerged objects, such as icebergs or wrecks, by 'echo.' Theproposal was made possible by the development of Langevin's
high-frequency piezo- electric oscillator to which we have already
referred (see fig. 48, p. 147). The high-frequency vibrations of a
slab of quartz, of diameter equal to several wave-lengths, set upcorresponding vibrations in the water. The sound wave is dis-
tributed in the form of a primary beam with more or less insignifi-
cant secondaries. The angle of spread of this primary beam is
sin-1 (1-22A D); with a large ratio D A, therefore, the beam maybe regarded as almost 'parallel. ' To adjust the frequency of the
quartz disc to a suitable value, e.g. 50,000 p.p.s., steel discs are
rigidly attached to its faces as shown in fig. 48. The alternating
e.m.f., from a high-tension spark oscillator}' circuit, is applied to
these discs and tuned to the resonant frequency of the 'steel-
quartz-steel' oscillator. Under these conditions the supersonic
transmitter, as it is called, works at its maximum efficiency. Asignal of short duration, consisting of a single train of dampedhigh-frequency waves, is emitted from the transmitter and, after
travelling to the sea-bed, where it is reflected, falls upon the quartz
* See International Hvdrographic Bureau, Special Publications on' Echo Sounding,' No. 3, 1924, and Xo. 14, 1926.

472 MEASUREMENT OF DISTANCE BY SOUND
oscillator again. During the short interval in which this takes
place a switch connects the oscillator to the receiving circuit. Thetime-interval between the emission of the signal and the arrival
of the echo may either be observed visually on a scale or may be
directly recorded. The emission or reception of a sound pulse is
indicated by means of a small oscillograph which reflects a spot
of light on a scale graduated in fathoms or metres. This spot of
light is caused to traverse the scale at a uniform speed, and the
switches are so arranged that the supersonic impulse is transmitted
and a slight deflection of the spot occurs at the instant when it is
passing the zero position on the scale. On the arrival of the echo,
the spot undergoes another slight deflection at a point farther
along the scale. The graduations of the latter are so arranged
that the reading at which the echo deflection occurs represents the
depth of water beneath the transmitter. This is easily arranged
when the velocity of sound in sea-water and the rate of traverse
of the spot along the scale are known—remembering, of course,
that the distance travelled by the sound wave corresponds to twice
the depth of the sea. When it is required, signals are transmitted
once per second and a continuous record of the depth is obtained.
The advantages of such a procedure in navigation are obvious.
The Langevin-Florisson system, as it is called, has been employed
not only in echo depth-sounding but in the location of wrecks and
icebergs. In the latter connection, the work of R. W. Boyle is
noteworthy (see p. 150).
(4) British System * - The British Admiralty system employs
a sonic, or audible-frequency, source of sound with a device
for the indirect measurement of the time-interval between signal
and echo. In some respects this method resembles that of
Fessenden already described, but it differs in certain important
particulars. The source of sound is a steel diaphragm (about
5 in. diameter) which is caused to emit, three times per second,
a heavily damped train of waves (frequency about 2000 p.p.s.).
The diaphragm is excited into vibration by a sudden blow from
an electromagnetically operated hammer ; current through an
electromagnet causes the hammer to compress a spring which,
at the instant the current is cut off, drives the hammer into sudden
and violent contact with a boss on the diaphragm. A small hydro-
phone receiver (a button microphone mounted on a diaphragm on
a water-tight container) receives the echo from the sea-bed and
* See F. E. Smith, Proc. Roy. Inst., 24, p. 342, 1924; also AdmiralDouglas, Roy. Geog. Soc. Journal, 74, No. 1, p. 47, July 1929.
ECHO DEPTH-SOUNDING 473
a small amount of the direct sound. The transmitter and receiver
are mounted in water-filled tanks on opposite sides of the ship,
the hull forming a partial screen to the direct sound. The direct
and reflected sound waves consequently pass through the hull of
the ship to or from the sea. A constant-speed motor at the observ-
ing-post drives two commutators through suitable gearing. Oneof these, which consists of a metal disc with an insulated segment,
serves to excite the electromagnetic transmitter three times per
second, the hammer being released and striking the diaphragm
when the insulated segment passes the brushes. The second
commutator, running on the same shaft, short-circuits the tele-
phones in the receiving circuit, except for a brief period (about
1/300 second) provided by an insulating segment ; during this
short period it is possible for the telephones to 'listen.' There
will consequently be nothing heard in the telephones unless the
insulating segment in the telephone-commutator happens to
coincide with the position of the brushes at the instant when the
transmitter is actuated or at the instant of arrival of the echo from
the sea-bed. The position of the brushes in the telephone circuit
can be displaced by hand relative to the brushes in the transmitter
circuit so that an interval of time, proportional to the angular
displacement of the brushes, elapses between the initial impulse
and the instant at which the telephones ' listen.' When the trans-
mitter gives three impulses per second, one completed revolution
of the brushes is equivalent to a time-interval of 1/3 second, i.e.
360°= 1/3 second. Assuming a velocity of sound in sea-water of
4920 ft./sec. at a particular temperature and salinity, a displace-
ment of the telephone brushes of 60° to reach the echo position
indicates a time-interval of 1/3x60/360 = 1/18 sec. and a depth
of 136 ft. approximately. In the actual apparatus, calculations
are unnecessary, the depths being indicated directly on a dial
carrying the telephone brushes. In very shallow water allowance
must be made for the inclination of the path of the reflected wavefrom the transmitter to the receiver—the correction is automati-
cally applied by means of a simple cam device which causes the
dial to advance at a somewhat different rate from that of the brushes.
The general diagram of the apparatus is shown in fig. 147. Theform just described is used to measure depths up to about 200
fathoms. Another type, employing a more powerful transmitter,
pneumatically operated, and a different timing device, has beenused successfully in oceanic depths up to 4000 fathoms. Theshallow-water, echo-sounding apparatus is valuable in navigation

474 MEASUREMENT OF DISTANCE BY SOUND
as a quick and simple means of measuring depths without reducing
the speed of the ship. A line of echo soundings, compared with
those marked on a chart, is sufficient to give a navigator the ship's
position, and may in this way assist and safeguard navigation
Transformer To Ship's mains
Hydrophone ^ r^_^-"7 ^Scund transmitter\ /
\ /
\ /
\ /
\ /
\ /
\ /
Fig. 147-
Sea bed
-Echo-Sounding Apparatus (British Admiralty system)
under conditions of bad visibility. The apparatus is extensively
used on H.M. ships and survey vessels, in the mercantile marine,
and in fishing-vessels. The latter have found the echo sounder
valuable as a means of locating 'fishing-holes' in the North Sea
and in the vicinity of Iceland.
Geological Prospecting by Echo and Seismic Methods -
Various attempts # have been made to apply analogous methods
to determine the depths of geological strata, containing valuable
minerals or oil, below the earth's surface. Complications arise
due to the heterogeneous nature of the earth's crust and the
presence of ' faults ' and inclusions of air or gas between the strata.
In certain cases, however, where the general structure is knownfrom independent geological data, seismic methods have been
found sufficiently practicable. As a rule, the source employed
is an explosive charge detonated on, or below, the surface, the
receiver being a sensitive seismograph or some form of shock-
microphone connected to an oscillograph (such as the Einthoven
string type fitted with a time-marking device). An examination
* See, for example, Berger, Schalltechnik, 87, 1926
Nature, 121, p. 359, March 1928.
and A. S. Eve,

GEOLOGICAL PROSPECTING 475
of the records obtained for various positions of the explosive charge
and the receivers sometimes reveals the required information.
Dealing with the application of physical principles to the
problem of oil-finding, A. O. Rankine # has recently described in
some detail a seismographic method of locating the depth and
contour of oil-bearing strata. This method, which has been
applied with some success in the oilfields of Texas and Persia,
involves novel principles due to Professor Mintrop. Preliminary
tests showed that ordinary depth-sounding methods, e.g. the
British Admiralty system described on p. 472, were unsatisfactory
on account of the heavy damping of sound waves or impulses in
the surface layers of the ground. Consequently an entirely newprinciple f was invoked, depending on the fact that the velocity
of sound or earthquake waves in the lower-lying strata is greater
than that near the surface. For example, the following velocities
have been measured:
—
Locality. Stratum.Velocity,
Metres/Sec.
Texas
Persia
Salt dome (oil-bearing) .
Clay and sand overlying salt domes .
Limestone strata (oil-bearing) .
Overlying soil .
5300200047003700
In order to penetrate to the deeper layers in which oil is usually
found, it is necessary to employ a very powerful initial impulse
—
in fact, an artificial earthquake wave is created by means of a large
explosion on the surface of the ground. The explosion waveafter travelling through the ground is received, by means of sen-
sitive recording seismographs, at a number of points at varying
distances away. The seismograph, which will record vibrations
of low, inaudible frequency, is preferable to the microphone onaccount of the smaller damping of such vibrations. The instant
of firing the charge is indicated by means of a wireless signal
controlled from the firing circuit. Reference to fig. 148 indi-
cates three possible paths for the explosion impulse at O to reach
the seismograph at A, viz. :
—
(1) The direct path OA, through the surface layer;
* Inst, of Mining and Metallurgy Bull., 295, p. 28, April 1929; and
Nature, pp. 684 and 718, May 1929. Report of R.I. Lectures, Feb. 21and 28, 1929.
f See H. Jeffreys, ' On Compressional Waves in Two SuperposedLayers,' Proc. Camb. Phil. Soc.
f 23, p. 472, 1926.

476 MEASUREMENT OF DISTANCE BY SOUND
(2) The path ODA reflected from the interface, travelling
entirely in the surface layer; and
(3) The ' diffraction-path ' OBCA, passing through both the
surface and the underlying layers.ON MA
Fig. 148
If c x and c 2 are the velocities of sound in the upper and lower
layers respectively, then it is seen that these disturbances arrive
at A at times t{, t 2 , and t3 ,given respectively by t1 =OA/c1 ,
/ 2 =(OD+DA)/^, and *3 =20B/c1+ (OA-20N)/<: 2 . The seismo-
graph record should therefore indicate three arrival times. In
practice, however, the reflected disturbance travelling by the path
like ODA is obscured by the violent initial disturbance preceding
it and continuing for a relatively long period. In the case of the
third disturbance, however, via OBCA, above a certain critical value
of the distance OA this impulse arrives before the direct impulse,
since c2 is greater than cx . It is easily shown, in the critical case
when the times t± and t3 are equal and OA =d, that the distance d is
related to the depth h of the interface in the following manner:
—
h 1— sin 6
2 cos(where 6= sin
-1(c^c^)).
If a time-graph is plotted with the time-intervals t between the
instant of the explosion and
that of the initial disturbance
of the seismograph as ordinates
and the distances x between
explosion and seismograph as
abscissae (see fig. 149), it will
display a break at P where the
times of arrival of direct and
diffracted disturbances are
equal. Moreover, the slope of OP, which corresponds to the
direct disturbance, is proportional to l/clt whilst the slope of

GEOLOGICAL PROSPECTING 477
PQ, which relates to the indirect disturbance, is proportionalto l/c
2 , thus
sin d=Cl/c2 =(slope of PQ)/(slope of OP),
32L \ , !
™£&L^
1-0
Fig. 150—Seismograph Records usedin locating the depth of a Salt Domecontaining Oil
(Rankine, Nature, May 1929)
a, Diffracted wave
b, Direct wave
'/ZOQa^cZZ^
f&Cfrn^C
"/' _JL _ft
00IftSee
Ar **-/6ao»*-*~£~c4
Se/s/HK
fa t
f
tv/r
o-o
.t?;«* ita^VsV*vvw
2o,
Seuj>*-ic
-z^.So**&**
w/ra
00*
' ". * '
»•« sec. 2-o
whence the critical angle 6 can be determined. Using this valueof 9 in the above equation, together with the value of the criticaldistance d (the value of x at the point P), the value of A, the depthof the interface may be at once calculated. For example, if c
y
and c2 are 2000 and 5300 metres/sec. respectively (as in the Texas

47« MEASUREMENT OF DISTANCE BY SOUND
oilfields), and the discontinuity at P occurs at a distance x=d= 1000
metres, we rind
sin 0=^2 =0-38, whence 0=22-5° and cos 0=0-924.
Consequently h=d(l — sin 0)/2 cos 0=335 metres approximately.
A reproduction of a series of actual records used in the location
of a salt dome (containing oil) is given in fig. 150. The rela-
tively feeble diffracted impulse (path OBCA) is shown at '«'
in each record, the direct impulse OA arriving atl
b.' Thereflected impulse ODA is obscured by the after-effects of '6.'
In a paper read to the Institute of Mining and Metallurgy,*
Rankine deals with more complicated cases in which the interface
may change in slope, as for example at the edge of a salt dome. Asurvey of the Anglo-Persian oilfields has recently been made by
the Geophysical Co., Ltd., employing very successfully the seismic
method outlined above. A description of the various forms of
portable recording seismographs used in such surveys is given in
the translation of a book by R. Ambron.f
(B) Sound Ranging
The methods which we have hitherto described for determin-
ing the direction of a source of sound (see p. 411) are inapplic-
able when the sound consists of an isolated impulse or shock,
as distinguished from a continuous or frequently repeated sound.
Special methods have therefore been devised for locating sources
of sound, such as a gun firing or a charge exploding. In fact,
the location of hostile guns on land and of explosions under
the sea was one of the most important practical applications
of sound during the war. The method universally employed in
such circumstances was known as the ' multiple-point method ' of
sound ranging. Since the war another more simple and direct
method known as the ' radio-acoustic method ' has been developed,
but in this case the co-operation of the 'source' of the impulse is
required, a condition which is clearly impossible in war, -Weshall consider the second method first, on account of its simplicity.
(a) Radio-Acoustic Method - This is a direct application of the
' differential-velocity,' or ' synchronous signalling ' system, to which
we have already referred (p. 466). It was first proposed by J. Joly,
and has been developed recently by H. E. Browne and the writer
for the British Admiralty J as a means of locating explosive charges
* Loc. cit.
t Elements of Geophysics (M'Graw-Hill Publishing Co., 1928).
X See A. B. Wood and H. E. Browne, Proc. Phys. Soc, 35, p. 183, 1923.

SOUND RANGING 479
fired under water. The following outline of the method refers
to this particular application, but it will, of course, be understood
that the same principles are applicable also to impulsive sounds in
air. It consists essentially of the simultaneous emission of a
'wireless' signal and an explosion impulse, the former travelling
with the velocity of light (186,000 miles/sec), whilst the latter
travels in the sea with a velocity approximately 1 mile/sec. (an
accurate expression for this velocity is given on p. 249). At a
shore station a multi-stringed Einthoven oscillograph records on
one string the arrival of the radio-signal, i.e. the instant of detona-
tion of the charge, and on other strings the arrival of the sound
wave at the successive hydrophones. The record is crossed by
time-marks every hundredth and tenth of a second. It is there-
fore a simple matter to determine the various time-intervals
t\, t 2 , t3y etc., between the instant of firing the charge and the arrival
of the sound wave. The distances of the explosion from the
various hydrophones are consequently given by ctx , ct 2 , ct3} etc.
Now the positions of the hydrophones are accurately known from
an independent survey, so that the position of the explosion is
accurately defined by the common intersection of circles of radii
ctly ct2 , etc., described with the respective hydrophone positions
as centre. In practice four (tripod) hydrophones were laid on
the sea-bed in surveyed positions on a 12-mile base-line outside
the Goodwin Sands, and connected by cables to a recording
station at St. Margaret's Bay, near Dover. The six-stringed
Einthoven galvanometer to which they were connected was fitted
with an automatic developing and fixing arrangement, and the
resulting record, on bromide paper strip, showed six parallel lines
broken suddenly at the respective instants of arrival of the radio-
signal and the sound impulse. Time-intervals could be read off
quickly to ±0-01 second (=±50 ft. in range), or to ±0001second by estimation. The 'simultaneous' radio-acoustic signal
was produced in various ways according to the degree of accuracy
required. In the simplest case where only an approximate
estimate of position was wanted, the W/T operator on the ship
pressed his transmitting key at the instant of feeling the shock
of the explosion in the water. This introduces the personal error
of the operator. For more accurate work a double key is used.
One half of the key sends the radio signal whilst the other fires
the charge electrically. The error in time introduced by this
method is negligible (±0 001 seconds ±5 ft. range). A 9-oz.
charge of guncotton can be located accurately in this way at

480 MEASUREMENT OF DISTANCE BY SOUND
40 miles, whilst larger charges have been located at 80 miles or
more. At 80 miles the sound wave through the sea reaches the
hydrophones1 J minutes after the charge is fired—the use of head
phones and an ordinary stopwatch (indicating fifths of a second)
instead of an elaborate recording system would therefore indicate
the distance with a probable accuracy of ±1/5 mile. With the
more accurate method of recording it will be realised therefore
that the radio-acoustic method permits of very great accuracy,
and has important applications in navigation and hydrographical
survey. For navigational purposes, a ship calls up the recording
station and asks for her position. The record is made and the
position determined, within a radius of half a mile, in about
seven minutes after receiving the request. In hydrographical
surveys greater care is taken in reading the record; the method
has been used successfully in fixing accurately the positions of
certain buoys and light-vessels out of sight of land.
As an alternative to the Einthoven photographic recorder
system of measuring time-intervals, J. M. Ford and the writer*
in 1919 devised an instrument known as the Phonic Chronometer.
This may be described as a stopwatch operated electromagneti-
cally and fitted with three sets of dials for measuring three
independent time-intervals. The speed of the chronometer is
governed by a tuning-fork and a phonic motor, giving an accuracy
of 1 in 10,000. Time-intervals are indicated directly on the dials
to 0-001 second. Special explosion shock-receivers were de-
signed for use with the chronometer. The radio signal, through
a relay, started all the dials, these being stopped in turn as the
sound wave passed the respective shock receivers. The three
time-intervals were thus indicated directly on the dials. Asingle-dial phonic chronometer (see fig. 151) has, of course, manyother applications involving the accurate measurement of a time-
interval.
The Geodetic Survey of U.S.A. is at the present time using a
modified form of the R/A method in surveying coastline and
banks and in locating marking buoys. f The method has been
thoroughly tested under working conditions. It has proved
accurate and reliable by day or night, in rough or foggy weather,
and at all seasons of the year. Joly J has made a number of
* A. B. Wood and J. M. Ford, Journ. Sci. Instrs., March 1924. Seealso Drysdale, Mechanical Properties of Fluids.
f U.S. Coast and Geodetic Survey, Spec. Pubn., No. 107, 1924 and1928. X hoc. cit.

SOUND RANGING 481
ingenious proposals to safeguard ships in fog, by the application of
radio-acoustic methods. For example, a light-vessel should send
a simultaneous radio-acoustic signal followed by twenty radio
'dots' at intervals of half a second. A ship hearing the acoustic
signal between the seventh and eighth dot in the W/T series would
at once know it was 3} to 4 miles from the lightship (assuming the
velocity of sound in water to be approximately 1 mile per second).
FT
Startingknob
Dial indic&tmtfthousandths ofit- second
Differentialmtiditet -—
-
Drivingwheel
'J~
Duil h/ifcls
Fig. 151—Phonic Chronometer
(Journal of Scientific Instruments^
(b) Multiple-point Sound Ranging - This is primarily a ' war
'
method, for the source of sound, a gun or a mine, has no
desire to co-operate in the 'location.' The observer must find
the source of sound by means of the sound wave only. For this
purpose three or more receivers are mounted at known positions
on surveyed base-lines. Suppose the spherical wave-front WW(see fig. 152), which originated at the explosion source, passes in
succession over the receivers 0, 1, 2, 3 at the instants 0, tlf t2 ,
and t3 respectively. The simple construction shown in the diagram
indicates how the origin of the wave-front may be determined.
3i

482 MEASUREMENT OF DISTANCE BY SOUND
If c is the velocity of sound appropriate to the medium, describe
circles of radii o, ctx , ct2 , and ct3y with centres at 0, 1, 2, and 3
respectively. The wave-front WW must be tangential to all these
circles; the origin of the
sound wave, the explosion,
must therefore be at the
centre of a circle of which the
circumference touches all the
small circles. The explosion
may be located more accu-
rately by calculation. Taking
any pair of receivers, it is
evident that the explosion
must lie on a curve such that
the difference of the radius
vectors from any point Pon it to the respective receivers must be a constant (ct)—that is, the explosion must lie on the hyperbola, with foci
at and 1, and the difference ±(P1 —*P0)=ct1 . Similarly,
it must also lie on the hyperbolae, in which the differences are ct2
and ct3—that is, the explosion lies at the intersection of these
hyperbolas. For approximate determinations of distant explosions
it is sufficient to find the intersection of the asymptotes of the
hyperbolae, a special 'asymptote correction' being applied in
accurate determinations.
(i) Army Sound Ranging - In the location of enemy guns a
base-line 900 yards long with six receivers was generally used,
the three additional receivers being employed in case of failures
and to provide check 'locations.' A special type of microphone,
the Tucker hot-wire microphone (described on p. 402), was used.
This was mounted at the mouth of a large Helmholtz resonator
of about 16 litres capacity, the system responding only to sounds
of very low frequency such as the gun-wave (the ' onde de bouche'
ox 'infra son '), whilst ignoring sounds of higher, audible frequency.
A six-stringed Einthoven oscillograph with timing device and
automatic photographic arrangements was used to record the
arrival of the wave at the various microphones. A typical record
is shown in fig. 153 (a). The record was started when an advanced
observer, or a ' sentry ' microphone, heard the gun—a few seconds
before the arrival of the pulse at the recording microphones. In
all cases it was necessary to make corrections for wind and tempera-
ture. The corrections become somewhat involved when these

SOUND RANGING 483
quantities vary with height. Under certain conditions of wind-
gradient, sound ranging was not possible. The corrections were
in some cases avoided entirely by recording not only the enemygun but also the 'answering' shell-burst, and 'adjusting' the latter
to coincide with the former.
k—-/second—
<~ 1secondRecord or Gua' F/rlvc•>
Record of Explosion ijader Hater
(«)
(b)
Fig. 153—Sound-ranging Records
(ii) Navy Sound Ranging - The same principles were applied
to locate explosions of mines, depth-charges, and torpedoes in the
sea. The only differences were in detail—hydrophones (steel
diaphragms with carbon granular microphones) were used instead
of hot-wire microphones, four of these being spaced over a base-
line 12 miles long and about 20 miles from the recording station.
As before, an Einthoven oscillograph with six strings recorded the
sound impulses and measured the time-intervals. A specimen
record is shown in fig. 153 (b). The hydrophones were carefully
surveyed from Ordnance Survey points on shore and their positions
and distances apart were known within a few feet. Explosions
taking place up to 100 miles or so away from the base-line were
located with great accuracy. The sea is an excellent medium for
sound transmission, it is very homogeneous and there are no
'meteorological' corrections as in transmission through the
atmosphere—it is only in very accurate work that tidal corrections
(a few feet per second) have to be applied to the sound velocities.
Values of the latter are tabulated for different temperatures of the
sea (see p. 249) and an electrical thermometer, with recorder on

484 ACOUSTICS OF BUILDINGS
shore, is laid on the base-line of hydrophones. The temperature
fluctuations in the sea are, however, usually very slow and very
small—covering a range from 6° to 17° C. annually in the North
Sea between England and Holland. The multiple-point sound-
ranging method has been used very successfully also in hydro-
graphical survey. The positions located are extremely accurate,
and may be obtained much more quickly than the alternative
astronomical methods hitherto employed. As previously stated,
a 9-oz. guncotton charge is sufficient to cover a range of 40 miles
in the sea.
Acoustics of Buildings*
A common defect in the acoustics of large halls and auditoriums
is that due to excessive reverberation. The slow decay of the
sounds of speech or music in such a hall is due to the repeated
reflections occurring at the hard, smooth surfaces of its walls
before the energy is dissipated. The obvious cure is to introduce
rougher and more porous surfaces—that is, to cover the walls and
floor with sound-absorbent materials, such as hangings and carpets.
It is possible, however, to ' over correct ' the reverberation, thereby
producing a ' deadening ' effect on the voice of the speaker or singer.
Sabine,f who first placed the subject on a scientific footing, laid
down three simple rules which must be followed if satisfactory
results are to be obtained, viz. (1) the sound heard must be loud
enough; (2) the quality of the sound must be unaltered, i.e. the
relative intensities of the components of a complex sound must be
preserved ; and (3) the successive sounds of speech or music must
remain distinct, i.e. there must be no confusion due to overlapping
of syllables. In certain cases distinct echoes may be heard in a
hall. These may be reduced in intensity or removed entirely by
changing the angle of the wall or by covering the existing surface
with absorbent material. Curved surfaces, such as domed ceilings,
sometimes focus sounds in an objectionable manner. From a
scientific point of view the design of an acoustically perfect hall
involves three principal factors—reverberation, interference, and
resonance. The means of controlling these factors are the
materials used in construction, the dimensions, and the shape of
the hall.
* The following account of the subject is mainly derived from Acoustics
of Buildings, by Davis and Kaye (Bell, Publishers), to which the reader is
referred for further details.
t Collected papers on Acoustics, 1922.

ACOUSTICS OF BUILDINGS 485
Reverberation - The theoretical study of reverberation com-
menced in 1900 with the work of Sabine, and was extended later
by Jager,* Buckingham,! Watson, J and others. All theories are
based on the fact that sound in an ordinary room undergoes two
or three hundred reflections before it becomes inaudible. It is
consequently assumed that the sound energy rapidly becomes
uniformly distributed throughout the room—interference and
such like effects being ignored. If I is the mean intensity (energy
per unit volume) in the room at any given instant, then the change
of intensity SI by absorption in a time St is SI = — lanSt, where a
is the mean absorption coefficient and n the number of reflections
per second. By a statistical method Jager proved that w=cS/4V,
where V is the volume of the room, S the total surface area, and c
the velocity of sound. Denoting the rate of emission of sound
energy from the source by E, the rate of energy change per unit
volume of the room is given by
dl E caSI
It=V~W ' '
( )
a fundamental equation. The intensity at a time t after stopping
the source is therefore
4FI=—e~ ca^Y. ... (2)
caSV ;
The intensity at a time t after starting the source is
4FI=-^(l-<r CrtS'/4V
) ... (3)caS
The intensity in the room finally attains a steady value given by
1 J&(4)max „ o .... y=j
cao
Equation (2) may therefore be written I/Imax=e~caSf/4v
, which is
a very convenient form. Expressing the standard initial condi-
tion as an intensity Imax equal to 10 6 times the 'threshold' value
(minimum intensity audible) we have 10 6 =e-caST/4V, whence
T=55-2V/caS, where T maybe regarded as the standard duration
* Acad. Wiss. Wien, 120, 2a, p. 613, 1911.
f Bureau of Standards Set. Paper, No. 506, 1925.
X Acoustics of Buildings , 1923.

486 ACOUSTICS OF BUILDINGS
of audibility. Assuming a value 1100 ft./sec. for the velocity of
sound c, we have
T=0-05V/aS.... (5)
as the theoretical standard reverberation period. The duration of
reverberation therefore varies directly as the volume V of the
room and inversely as the surface area S and mean absorption
coefficient a of its walls. This relation has been accurately verified
experimentally by Sabine. He first used automatic recording
methods to measure the exponential decay of sound intensity in a
room, but later preferred to rely on direct aural observation. Thesource of sound was an organ pipe blown at a definite pressure
and emitting a note of definite pitch and uniform intensity. Theinstant of cutting off the sound and the instant at which the
observer considered it inaudible were recorded on a chronograph
drum. Sabine considered that an average accuracy of ±0-05
second in the measurement of T was possible by this simple
method, e.g. he obtained consistently for a particular lecture roomvalues lying between 5-45 and 5-62 seconds, with a mean of 5-57
seconds, which was repeated after an interval of three years. It
was found (1) that the duration of reverberation was almost inde-
pendent of the positions of the source and of the observer in the
room; (2) the effect of a given amount of absorbent was also practi-
cally independent of its position in the room. Sabine used an
open window as his standard unit of absorption, expressing other
results in 'open-window' units. In this manner he determined
the mean absorption coefficients of various absorbent materials,
obtaining results varying from a=10 for the open window to 01
for hard surfaces, such as glass or plaster. He found that each
member of an audience was equivalent in absorbing power to
about 4| square ft. of open window.
Optimum Reverberation - With a committee of musical
experts Sabine determined the degree of reverberation most
suitable for speech and music in rooms of different dimensions.
The reverberation period was adjusted in each room until all
were agreed that the conditions were neither too reverberant nor
too 'dead.' For piano music a mean of all observations, ranging
from 0-95 to 1T6, gave T a value of 1-08 seconds. Eckhardt,#
using the reverberation equations given above, has discussed the
optimum reverberation conditions for syllabic speech, indicating
graphically how the syllables overlap seriously in rooms of low
* Frank. Inst.Joum., 195, p. 799, 1923.

ABSORPTION COEFFICIENTS 487
absorbing power, whilst they may be entirely separated in a roomof high absorbing properties. Estimates by other observers #
appear to indicate that the optimum period increases with the
volume of the room or hall and varies with the nature of the sound.
In a theatre of volume 60,000 cub. ft. Sabine regarded IT to 1*5
seconds as satisfactory, whereas 2-3 seconds was prescribed for
theatres of volume 250,000 cub. ft. and 650,000 cub. ft. Broadly
speaking, the optimum period appears to lie between TO and 2-5
seconds; for speech and 'light' music towards the lower value,
and for orchestral or 'grand' music it may approach the upper
limit.
Determination of Absorption Coefficients - In order to
correct a room for excess or deficiency of reverberation it is
necessary to know the absorption coefficients of the various
materials present in the room. The methods of measuring such
absorption coefficients may be divided broadly into two classes:
(a) full-scale measurements—reverberation methods, and (b) small-
scale measurements—direct laboratory measurements using small
test specimens.
(a) The full-scale method is exemplified by Sabine's experi-
ments. The duration of reverberation was first measured in an
empty room for various initial intensities of the source. Todetermine the rate of decay of sound intensity in a roomobservations are made of the durations of audibility t± whena certain source is used, and the duration t 2 with a source of mtimes the intensity. Since the intensity decays to the same limit
in each case, it follows from equation (2), p. 485, that
logewi=(^-^)cflS/4V ... (6)
whence the mean absorption coefficient a can be determined,
c, S, and V being known. The absorbing power of different objects
or materials may similarly be determined by measuring the rever-
beration period for two strengths of source both with and without
the objects in the room. As already mentioned, the procedure
usually adopted by Sabine was a substitution method, the absorb-
ing power of the object being expressed in terms of that of a knownarea of open window.
(b) The stationary wave method of measuring absorption co-
* Lifshitz, Phys. Rev., 25, p. 391, 1925 ; 27, p. 618, 1926 ; Watson,Frank. Inst. Journ., 198, p. 73, 1924 ; Knudsen, Phys. Rev., 22, p. 206,
1923.

4&8 ACOUSTICS OF BUILDINGS
efficients described on p. 324 is an extremely convenient and
accurate laboratory method in which only small specimens of
absorbent material are required. The specimen, in the form of a
flat sheet, closes one end of the tube, in which stationary sound
waves are set up by means of a source at the opposite end
(see fig. 99). The degree of 'imperfection' of the maxima and
minima serves to measure the ratio of incident and reflected ampli-
tudes, whence the absorption coefficient may be calculated in the
manner indicated on p. 324. This method measures only the
reflection at normal incidence, whereas the sound reflected to and
fro in a room meets the walls at all angles of incidence. E. T.
Paris * has examined this question theoretically, and has shown
that as the angle of incidence d increases from 0° at normal
incidence to about 80°, the absorption coefficient increases slowly
at first then more rapidly. In a particular case, that of a porous
plaster, the absorption coefficient increased from 0-28 at normal
incidence (0=0) to 0-76 at 83°. Thereafter the absorption
dropped rapidly to zero at grazing incidence (0=90°). These
deductions explain why the absorption coefficients obtained in
large scale experiments (all angles of incidence) are always higher
than those determined by the stationary wave method (normal
incidence). Paris has obtained theoretically the correction
necessary to the 'normal incidence' absorption coefficients to
make them applicable to the case of 'all angles of incidence.'
This correction brings the experimental values obtained by the
stationary-wave method into good agreement with those obtained
from Sabine's full-scale reverberation experiments.
Tables of absorption coefficients obtained by various methods
are given by Davis and Kaye (loc. cit.). These values vary over
wide limits according to the porosity of the material—e.g. 0-01 for
various hard surfaces such as wood, glass, or metal; 0-5 for thick
carpets, audiences, 'acoustic tiles and plasters,' and hair- felt;
1-0 for an open window. As the theory of absorption in porous
bodies indicates, the absorption increases with the pitch of the
incident sound; but other factors also enter into the question.
For example, it was found experimentally that a certain hair-felt
had values 0-09, 0-25, 0-43, 0-63, 0-33, 0-35 for the absorption
coefficient at frequencies 128, 256, 512, 1024, 2048, and 4096 p.p.s.
respectively, the maximum absorption occurring at a frequency
near 1000 p.p.s.
Two factors are involved in the selection of a good anti-
* Proc. Roy. Soc, 115, p. 407, 1927.

SPARK-PULSE AND RIPPLES 489
reverberation material; it must reflect as little as possible and
must absorb a maximum of the incident sound energy. Theformer condition implies that the acoustic resistance of the
absorber must be as nearly as possible equal to that of the incident
medium, and the latter condition requires a maximum amount of
viscous damping to suppress the transmitted sound in a relatively
thin layer of absorbent material. The methods of correction of
defective acoustical conditions in a room or hall by the introduc-
tion or removal of absorbent surfaces will be sufficiently obvious.
Materials, such as porous tiles and plasters, containing asbestos or
cork constituents are specially manufactured as a means of adjust-
ing the reverberation periods of large auditoriums to the optimumvalue. Such materials, their properties and uses, are fully described
by Davis and Kaye (loc. cit.).
Study of the Shape of an Auditorium - The reflecting
characteristics of various shapes of auditorium are conveniently
studied by the spark-pulse and the ripple-tank methods described
on p. 340. The spark method was first applied to this purpose
by Sabine in 1913. A sectional model of the auditorium is
mounted between a ' light '-spark gap and a screen (or a photo-
(«)
Fig. 154—Ripple Tank (with model section of auditorium)
(From Davis and Kaye, Acoustics of Buildings)
graphic plate), a ' sound-spark ' being produced at the required
point inside the model. The shadow cast on the screen or
plate reveals the position of the pulse after reflection from the
walls of the model. A succession of photographs at varying
time-intervals after the production of the sound-spark indicates
the progress of the sound-pulse and its reflection from the walls

490 ACOUSTICS OF BUILDINGS
of the model auditorium. Results of a similar nature may be
obtained more easily by means of the ripple tank (see p. 344).
This method is based on the fact that the wave-length of the
ripples on the surface of water is usually comparable with the
size of any models concerned. The general arrangement is shownin fig. 154 (a). Fig. 154 (b) and (c) are comparative photographs
showing the marked resemblance between sound-pulse and
(b)
(c)
Fig. 154—Comparative Spark and Ripple Photographs (A. H. Davis)
(From Davis and Kaye, Acoustics of Buildings)
ripple photographs for similar model sections (Davis and Kaye).
Cinema records of this nature are valuable as a means of following
the progress of the multiply- reflected waves as they spread from
a source, a speaker, or singer to an audience. The three-
dimensional study of echoes has not yet been undertaken on a
model scale, but Watson # has described a ' ray method ' of tracing
the reflections of a high-pitched sound in a large auditorium. In
his experiments Watson used as the source of sound the hiss
from an alternating current arc at the focus of a parabolic mirror.
The light from the arc assisted in the location of the sound
* Univ. of Illinois Eng. Expt. Station, Bull. No. 3.

REPRODUCTION OF SOUND 491
echoes. Such model and full-scale experiments indicate that
markedly smooth curved surfaces should preferably be avoided
from an acoustic standpoint, as they result in the focussing of
sound in particular directions. It is considered by those whohave wide experience of such matters that reflected sounds
arriving within an interval of T^ second (equivalent to a path-
difference of 75 ft.) will contribute usefully in raising the level of
loudness of speech, whilst reflections arriving later are undesirable
and should be weakened as much as possible by absorption or
scattering. Troublesome echoes are not likely to arise, therefore,
except in large halls, more especially those with domed or curved
ceilings. It is important that such surfaces are covered with
absorbent material or broken up by coffering to scatter the
sound. Resonant surfaces, panelling, etc., should be suitably
damped, otherwise sounds of appropriate pitch will be reinforced
with unpleasant results. Such resonant vibration is most
noticeable when the source of sound is very powerful, e.g. a church
organ will frequently set in vibration resonant panelling or
window panes of low frequency. The phenomenon of inter-
ference gives rise to maxima and minima of sound, but the effect
in a room ' lagged ' with sound-absorbent materials is usually
unimportant.
The Reproduction of Sound *
(a) Gramophones and Loud-Speakers - The history of the
mechanical recording of the sounds of speech and music may be
said to date from 1864, when the Phonautograph of Scott and of
Konig was invented. In 1877 Edison obtained sound records
by a somewhat similar device, but instead of using a smokedsurface the recording stylus engraved its vibrations on a tinfoil
or waxed cylinder. A re-traverse of the ' record ' by the stylus
resulted in the reproduction of sounds by the diaphragm somewhatsimilar to the sounds which produced the record. From these
early efforts have developed the excellent recorders and repro-
ducers of sound which may be heard to-day. The great progress
made in the development of such devices is largely due to the
* The reader is recommended to consult (a) Proc. Inst. Elec. Eng.,1
Discussion on Loud Speakers, etc.,' Nov. 1923;
(b) Maxfield and Harri-son, Bell System Techn.Journ., 5, p. 493, 1926
;(c) S. T. Williams, Journ.
Frank. Inst., 202, p. 413, Oct. 1926 ; and (d) A. Whitaker, Journ. Sci.
Instrs., 5, p. 35, Feb. 1928, from which much of the following informationis derived. See also 'Wireless Loud-Speakers,' N. W. McLachlan{Wireless World, Pub.).

492 REPRODUCTION OF SOUND
application of electrical principles to mechanical operations. Thestriking electro-mechanical analogy which has been found so
convenient in studying complex mechanical problems is nowhere
more clearly illustrated than in the design of sound-reproducing
apparatus such as the gramophone and the loud-speaker. Before
dealing with this aspect of the question, however, it may be well
to refer to some of the requirements of good sound-reproduction.
First of all, it is desired to produce sounds at one place which are
a faithful copy of those originating at another place. Secondly,
it is desirable that the reproduced sounds should be of consider-
able intensity—approximating at least to the intensity of the
original sounds. In other words, the ideal ' reproducer ' would
be a secondary source equivalent in every respect to the primary
source of whatever nature. Mechanical transformation of com-
plex wave-forms, e.g. from one type of vibration to another,
or from one amplitude of vibration to another ; or conversion of
mechanical into another form of energy (e.g. electrical or thermal)
involves distortion. Only the simple harmonic type of vibration,
the pure tone, is transmitted without distortion; but in speech
and music we are almost invariably concerned with the trans-
mission of complex types. The chief danger is that due to
resonance. In aiming at loudness there is a temptation to
employ resonance—the majority of diaphragm sound-reproducers
(telephones, loud-speakers, etc.) have resonance peaks more or
less flattened by damping. Such resonances, unless great
precautions are taken to counteract them, inevitably lead to
distortion, those components of the sound to be reproduced
which coincide most closely with the resonant frequencies being
disproportionately emphasised. It is perhaps fortunate that the
ear is sufficiently accommodating to ignore fairly large defects
in sound reproduction. For example, a 10 per cent, error in
intensity, or even more than this, would generally pass unnoticed.
The accuracy of intensity reproduction need not be very great to
conform with such a standard. With regard to frequency repro-
duction, however, the ear is much more exacting, slight errors
in pitch (or to be more precise, slight errors in the relative
pitch of component sounds) being readily observed. It is
fortunate that the practical difficulties involved in frequency
reproduction are far less serious than in intensity reproduction.
Reproduction of sound involves the preliminary processes of
reception, and possibly of recording, transmission, and amplifica-
tion. In dealing with sound reception and recording we have

ELECTRO-MECHANICAL ANALOGY 493
already considered various types of mechanical and electrical
receivers and the important factors influencing the choice of
a receiver for distortionless recording or transmission. Theprocess of sound recording and reproduction is best illustrated in
the case of the gramophone. Recent development # has followed
the lines of regarding the mechanical system as analogous to an
electrical band-pass filter circuit, which may be so designed that
it transmits a certain range of frequencies without loss whilst
disregarding all other frequencies. Both the recording and
reproducing systems are good examples of the use of this analogy.
It would require too lengthy a description, however, to deal with
this analogy in detail, but the diagram shown in fig. 155, taken
from Whitaker's paper, may serve as an illustration of the point.
In recording it is necessary to have a mechanism such that for
equal input energies at any frequency the maximum velocity of
Band Pass Filter
GramophoneSound-box Filter
-!h
Constant Lateral Velocity Record
Needle compliance
Leuer arm transformer
Leuer arm muss
Leuer arm compliance
Spider arm compliance
Diaphragm mass
—<— Diaphragm compliance
Air chamber compliance
'i|—imnmnp—Air chamber transformer
>l| JUmMSL 1
,lj—^WvVy^ ' Horn "riPedancc
Fig. 155
(After A. Whitaker, Journal of Scientific Instruments)
the cutting stylus is constant, the amplitude of vibration varying
inversely as the frequency. Velocity in the mechanical system is
equivalent to current in the electrical network. Stiffness repre-
sents capacity, or compliance the reciprocal of capacity. Masses
represent inductances, and frictional forces or non-reactive loads
are equivalent to resistances. In deriving the equivalent circuit
of any mechanical device a stiffness between two consecutive
* See, for example, Maxfield and Harrison or Whitaker, loc. cit., also
Bell Laboratories Record, Nov. 1928.

494 REPRODUCTION OF SOUND
moving members is represented by a shunt capacity, and between
a moving member and a rigid support a series capacity. A great
difficulty in designing such mechanical systems is the lack of
satisfactory non-reactive mechanical resistance. Maxfield and
Harrison describe a recording system, designed on the lines of a
filter system, which has no prominent resonances within the
range of speech frequencies. The frequency characteristic of
such a recording system is approximately a horizontal straight
line (constant amplitude) from 250 to 5000 p.p.s. A gramophone
reproducer is designed on similar lines. Recently the electrical
gramophone reproducer has developed ; the needle is attached to
a * pick-up ' which converts the mechanical vibrations into
electrical oscillations, these being amplified and used to operate
loud-speakers. This system and the corresponding electrical
recording system have many advantages over the older method
of direct mechanical recording and reproduction. The flexibility
in the design of the electrical system to give any desired frequency-
characteristic is a great advantage. The design of the loud-
speaker must be considered, in this case, in relation to the
electrical circuits with which it is used. The desirable features
in gramophones and loud-speakers are dealt with in a number of
papers by various authorities in the Proceedings of the Electrical
Engineers, November 1923.* The practical considerations are far
too numerous to mention here, but the essence of the problem
of faithful reproduction lies in the avoidance of prominent
resonant frequencies in the electrical and mechanical systems.
Such a result may be achieved to a certain extent (a) by arranging
that the natural frequencies of all the elements of the system are
far removed from any frequency it is desired to reproduce;
(b) by
the introduction of heavy damping ; or (c) by making use of multiple
resonance f or band-pass filter circuits (mechanical and electrical).
On account of the relative insensitiveness of methods (a) and (b)
the third method is often preferred. Nicholson has employed
piezo-electric crystals of Rochelle salt, having a very high natural
frequency, as a means of reproducing sounds electrically (see p . 3 9 3)
.
(b) Optical Methods of Recording and Reproducing Sound.
The Photophone. Phonofilms - Hitherto it has been customary
to record sounds optically by transverse vibrations such as, for
example, the trace made by a vibrating spot of light on a moving* See also Proc. Phys. Soc, 36, p. 114, Feb., and p. 211, April 1924.
f See Rothwell, Nature, Feb. 24, 1923 ; and Porter, Phys. Soc. Proc,Feb. 1924.

OPTICAL METHODS 495
photographic film. The record thus obtained does not lend
itself readily to sound reproduction. If, however, the sounds
are recorded photographically by means of changes of intensity of
a beam of light, reproduction is a relatively simple matter. This
process was tested by Ruhmer * in 1900, but his methods were
not very satisfactory. A simple and effective method is de-
scribed by A. O. Rankine,f making use of a device known as the' photophone.' In this device, designed for the transmission of
speech by light, X the light from a point source is collected by a
lens of about a metre focal length and an image formed on a small
concave mirror which is attached to the diaphragm of a gramophone
sound-box or to the reed of a telephone earpiece. The light
diverges and passes through a second similar lens, which projects
it to the distant station. Two similar grids are mounted—one in
front of each lens. An image of the first grid is superposed on
the second by reflection in the small concave mirror. When the
latter oscillates under the vibrations of speech the dark spaces of
the image-grid move over the openings of the second grid, thus
producing fluctuations of intensity in the beam. In the photo-
phone this fluctuating light is received by a collecting lens or
mirror and focussed on a selenium cell in circuit with a battery
and telephones. The resistance changes of the selenium result
in the reproduction of the original sounds in the telephones. If,
however, the sounds are to be recorded, the beam of fluctuating
intensity is focussed on a slit of which an image is formed by a
lens on a moving photographic film. Examples of the resulting
record are shown in fig. 156, which represent the fluctuations of
light intensity due to a tuning-fork and various spoken words.
The sound picture actually represents an 'instantaneous ' view of
the succession of compressions and rarefactions in the associated
sound wave. For reproduction of the sounds light from an
illuminated slit is focussed on the film, behind which is placed a
selenium cell connected to a telephone or loud-speaker circuit.
As the film moves, the intensity of the light reaching the cell
varies in accordance with the density of the film, and the corre-
sponding sound is reproduced. A somewhat similar process is
used in the production of phonofilms or ' speaking pictures.' §
* Ernst Ruhmer, Wireless Telephony, 1907.
f Proc. Phys. Soc, 32, p. 78, 1920.
X Proc. Phys. Soc., 31, p. 242, 1919. See also Proc. Opt. Convention,pt. ii, 1926.
§ See C. F. Elwell, Wireless World and Radio Review, 15, p. 466,
Jan. 7, 1925.

496 REPRODUCTION OF SOUND
The sounds from the speaker are received by a sensitive micro-
phone, amplified, and the current variations used to fluctuate the
light emitted from a special form of lamp (invented by T. W. Case).
The light is focussed on a fine slit placed close to the cinema film
and occupying a width of OT in. of the film. The variations of
intensity are thus recorded on the continuously moving film in
Photographic records of sounds. Film Speed 48 HI
:
LiiUiillllliiliiililiiiiiiiiiiiiiiiii
Tuning fork; frequency 508 pep second
urn ii
""fork"MMMnmn
made
R 'iJlHitiS*'11
mmmm Ml* i _^^^_^^^^^^^^^
ive
Fig. 156—Sound-film Records
(By courtesy of Prof. A. O. Rankine and The Optical Convention)
the form of a band of varying blackness. The reproduction of
the sound takes place by passing light through a similar slit in
contact with the continuously moving film, beyond which is a
sensitive photo-electric cell—the Case Thalofide cell.* Thecurrent fluctuations on the cell, as before, are amplified and passed
through a loud-speaker, which is mounted near the screen on which
the moving pictures are projected. It is important to observe
that the sound is recorded and reproduced on a continuously
moving film, i.e. on the film before it enters the ' gate' where the
motion is made intermittent (15 to 20 p.p.s.) for cinematography.
This method of producing phonofilms guarantees perfect
synchronisation between the sound and the picture, for the
sound-record is made near the edge of the film simultaneously
with the cinema picture.
The sound-recording system for talking films as developed by
* Thallium oxysulphide on a quartz disc with graphite electrodes.

ALTERNATING POWER TRANSMISSION 497
the Bell Laboratories * utilises the variable density photographic
method and the Wente ' light valve.' The latter comprises a loop
of aluminium tape centred under tension in the gap of an electro-
magnet to form a window 2 x 256 mils. Light through this slit
is accurately focussed as a line 1 xlOO mils, perpendicular to and
near the edge of the standard photographic film. The resonant
frequency of the aluminium strip is very high (about 7000 p.p.s.).
As it vibrates it varies the amount of light passing through the
slit—hence the description 'light valve.'
Numerous other optical methods have been examined, with
varying degrees of success, to modulate a beam of light as a means
of sound reproduction. Use has been made of the Kerr electro-
optical effect, and the Faraday magneto-optical effect, and of
the luminous electric discharge in gases. Kerr Grant,f in co-
operation with Messrs. Hilger & Co., has recently succeeded
in interrupting light at very high frequency by means of a quartz
piezo-electric resonator placed between crossed Nicol prisms, but
attempts to photograph the flashes at 144,000 p.p.s. were not
successful. The intensity of the flashes could be modulated byvarying the oscillating voltage applied to the crystal.
Alternating Power Transmission
The close analogy which exists between mechanical wave trans-
mission and alternating current electric power transmission is
demonstrated in a most impressive manner in a system devised
by M. Constantinesco.J The method of transmitting hydraulic
power with which we are most familiar utilises water at a pressure
of, say, 1000 lb ./in.2 supplied from a pump and forced through
pipe-lines to a 'D.C. motor.' This may be described as the
'Direct Current' system, as it requires a continuous or direct
flow of water. It is also possible to supply energy to a columnof water enclosed in a pipe by applying alternating pressures at
one end. By virtue of the elastic properties of the fluid in the
pipe-line this energy is transmitted in the form of longitudinal
vibrations through the column, and may be used to drive an' Alternating Current ' (mechanical) motor. A number of applica-
tions of this method have been patented by M. Constantinesco,
* See Bell System Techn.Journ., 8, Jan. 1929.
t Loc. cit., p. 138.
X See The Theory of Sonics (Proprietors of Patents Controlling WaveTransmission, 132 Salisbury Sq., E.C., 1920); also Mechanical Pro-perties of Fluids, pp. 221-228 (Blackie, 1923).
32

498 ALTERNATING POWER TRANSMISSION
who has employed it to transmit large amounts of mechanical
power by alternating pressures in water, the frequency being
sufficiently high, e.g. 50 p.p.s., to be described as 'sonic' Thetheory of the wave-transmission of power in pipes follows exactly
the same lines as that of propagation of ordinary sound waves.
The source A is a reciprocating plunger, which sends waves of
compression and rarefaction along the water column ; the ' receiver
'
B is the motor at the opposite end of the pipe-line. As in the
case of ordinary sound also, stationary waves are set up by reflec-
tion at the end, or at any point of discontinuity of the pipe. If
the system is used efficiently the 'receiver' piston B will absorb
all the energy and there will be no reflection; if more energy is
introduced by the piston A than is absorbed by B, reflected waves
will be formed, and energy will accumulate in the pipe, which
would ultimately burst. This is avoided by introducing near the
piston a closed vessel filled with liquid, and having a volume large
compared with the volume-variation produced by the piston.
With a motor at the end B of the line, absorbing only a fraction
of the energy emitted from the generator A, the stationary wave
system is similar to that which we have already considered for
a pipe closed by an imperfect sound reflector (see p. 324), i.e.
the effect may be regarded as being due to two superimposed
stationary waves of amplitudes (a-\-r) and (a—r), the nodes and
antinodes of one being A/4 distant from those of the other.
(Alternatively the wave-motion may be regarded as being com-
pounded of a simple stationary wave with a travelling wave con-
veying energy.) Under these conditions, therefore, a motor con-
nected at any point of the pipe will be able to absorb energy to
perform useful work. Constantinesco has devised a 'three-pipe
system,' which is analogous in all respects to the 'three-phase'
electrical system. The 'generator' in this case is a high-pressure
reciprocating pump with three pistons and cranks 120° apart,
the sonic power being transmitted through three pipe-lines to
three-phase motors of similar construction. The three-phase
system is usually employed as giving a more uniform torque and
ease of starting. The mean pressure in the system is maintained
by a pump, which returns any water leaking past the pistons.
The principle of the transformer has also been introduced into the
system. The single-phase system has been applied commercially
to reciprocating rock drills and riveters, the alternating pressures
being applied through flexible pipes comparable with electric
cable. As in the corresponding electrical case there are energy

NOISES 499
losses in the transmission line due to friction (equivalent to
electrical resistance), the maximum amplitude diminishing expon-
entially along the pipe. The theory of wave-transmission in
liquid-filled pipes has been given by H. Moss.*
Other Technical Applications
(1) The Problem of Noise Reduction - Vibration of Machines
and Complex Structures. We live in noisy times, and the problem
of noise reduction is daily becoming more acute. In all parts
of the civilised world there has been a steady increase in machinery
and traffic noise during the past few years. Noise in excess con-
tributes to fatigue and lowers the general efficiency. It has been
proved, if proof were required, that excessive noise in an office
results in a considerable lowering of output. Medical men have
repeatedly expressed the opinion that noise is the cause of muchsuffering,f and also of 'educational waste' (' brain-wasting ' noise
is the term employed). Noises to some are pleasant, whilst to
others they are the reverse ; Milton liked to hear a cock crowing
near his quiet retreat at Chalfont St. Giles ; Carlyle was annoyed
by it. A certain background of 'indefinite' noise is sometimes
soothing, but when it exceeds a critical intensity and irregularity
it may have the opposite effect. A world of utter silence, as in
a desert or a mausoleum, would be unbearable, but the other
extreme is undesirable also. The noises of machinery in work-
shops or in road vehicles are produced in an almost infinite
number of ways. In any particular machine, however, it is often
possible to locate the principal sources of noise and, in manycases, to provide a remedy. A considerable amount of research has
recently been made, for example, to reduce the noise in electric
motors and high-speed gears. Noise implies wear and is objection-
able in other ways. By electrical recording of the noise and sub-
sequent Fourier analysis of the wave-form, Metropolitan Vickers %have succeeded in tracking down the various sources of the noise,
and have as a consequence effected considerable improvements
in the design of A.C. motors, and faults have been located in
the master-wheels of gear-cutting machines. Vibration of turbine
blades has also been studied with a view to rendering them more
* Proc. Inst. Mech. Engs., 1923.
t See H. J. Spooner in The Times, May 2, 1928. See also April 7,
1928, Educ. Suppl. to The Times, and Aug. 31, 1928, p. 13.
% Engineering, p. 766, Dec. 21, 1928. See also T. Spooner and J. PFoltz, Amer. Inst. Elec. Eng.Journ., 48, p. 199, March 1929.

5oo OTHER TECHNICAL APPLICATIONS
silent when running at very high speeds. It is manifestly im-
possible to deal, in a limited space, with more than a small fraction
of the possible causes of noise in machinery ,* but we may mention
three of the more important types :
(a) Lack of Balance in Rotating Parts - A wheel or a cam which
is dynamically out of balance and is rotating at a high speed pro-
duces an unbalanced reaction on its bearings once per revolution.
This force of reaction is communicated to the base of the machine,
or the body of the vehicle, and sets it in vibration. At certain
speeds the frequency of the force may coincide with one or more
of the natural frequencies of some part of the machine or its
mounting. Large amplitude vibrations are then set up, and the
sounds emitted may reach serious proportions. The remedy in
such cases is obvious.
(b) Shock Excitation - Sudden accelerations or retardations of
high-speed parts of a machine produce corresponding reactions
on the framework. The impulsive forces thus generated are ideal
for setting in vibration resonant structures, such as rods, plates,
or tubes. Unless all such structures are carefully damped the
noise may become excessive. A badly sprung vehicle travelling
over an imperfect road is subjected to such sudden accelerations,
which 'jolt' all loose parts, setting them in vibration and trans-
mitting the impulses to other parts of the structure which mayresonate at audible frequencies. The noise from a tramcar f or
an improperly tended motor lorry with solid tyres is an extreme
example of this. In a good engine or machine the only noises
of this character are the high-frequency sounds resulting from the
impact of valves on their seatings. Such noises can be reduced
by screening.
A problem involving very low frequencies arises in the case
of vibrations set up in railway bridges when heavy engines pass
over them at various speeds. The unbalanced forces due to
revolving and reciprocating masses in the engine impart shocks
to the bridge. If these shocks are repeated at the appropriate
time-intervals, i.e. at a certain speed of the engine, serious
resonant vibration may be set up in the bridge, which may result
in serious overstrain or damage to the structure.]; In order to
investigate the phenomena and to determine the fundamental
* See J. H. Hyde and H. P. Lintern, Proc. Inst. Civil Engs., Jan. 1929.
f See ' Reduction of Noise in Tramcars,' G. H. Fletcher (Elect. Review,
105, p. 90, July 12 and 19, 1929).
X Sir A. Ewing, ' Vibration of Railway Bridges,' Roy. Soc. Arts, 77,
May 1929. See also Engineering, pp. 143 and 187, Feb. 1929.

NOISES 501
frequency of vibration of the bridge a special 'bridge-oscillator'
was designed. This consisted of a heavy truck on which was
mounted motors driving a pair of geared axles running in opposite
directions and carrying heavy weights which could be varied
according to the impulse it was desired to impart to the bridge
at each revolution of the shaft. By varying the speed of the
motor the frequency of the impulses could be adjusted to produce
'resonance' in the bridge. The oscillations of the bridge were
recorded by means of the Collins' recording accelerometer (Camb.
Sci. Inst. Co.). The resonant frequencies of numerous bridges
were determined in this way, values lying between 2 and 12 p.p.s.
being found for bridges varying in span from 40 to 350 feet.
The low-frequency vibrations of the hulls of ships have been
studied by A. D. Browne, E. B. Moullin, and G. M'Leod Paterson*
in conjunction with the Cunard Steamship Co. Damped harmonic
vibrations are set up in the ship's plating due to the impact of a
wave on the hull. The relation between the amplitude of vibra-
tion of the deck and the rate of revolution of the engines was also
determined, recording seismographs being used to measure the
amplitude and frequency of the vibrations. Resonance effects
were observed at certain engine speeds. Fluctuations of propeller-
torque, causing vibration of the hull, were recorded when the
ship was pitching in a heavy sea.f
(c) Explosive Noises - The exhaust from the cylinders of oil-
driven engines is a frequent cause of irritating noise. The gas
from the cylinders is expelled at high pressure into a medium at
low pressure. As it leaves the ejection pipe large-amplitude
oscillations follow the main explosion pulse. The only remedyfor this is an efficient ' silencer ' or ' pressure reducer. ' A large pro-
portion of the noise from an aeroplane engine is due to this cause,
and, in the case of civil aircraft, efforts are being made to reduce
it. Motor bicycles are the most frequent offenders on the roads.
On a railway, noise proclaims defects in the track and looseness
in the vehicles; on the track it tells the civil engineer that the
road bed is uneven, and the mechanical engineer that the gears
are not accurate and that the body and chassis are unsatisfactory.
As an example of the research that is being undertaken to reduce
such noises may be quoted the case of the underground tube
railways in London. J These railways have a much more difficult
noise-problem to solve than the surface railways, for the noise
# See Engineering, p. 650, May 24, 1929.
t Loc. cit. % See Tlie Engineer, Oct. 12, 1928.

502 OTHER TECHNICAL APPLICATIONS
made by the wheels and coaches as they roll on the steel rails is
confined by the steel walls of the tube, and the sound reverberates
in the tube with very little diminution of intensity. A coach
which would be relatively silent on a surface railway might there-
fore be extremely noisy in a tube. Analysis of the noises on the
underground railways * has led to further experiments to makethe coaches sound-proof and to ' silence ' the tube track. Rapid-
motion photographs show that the wheels of a train are not in
continuous contact with the rails—that is, they do not roll along
the rails smoothly, but proceed in rapid jumps. The impact of
the wheels as they jump on the steel rails produces noise of great
intensity. Attempts to reduce this noise by shrouding the
wheels proved unsatisfactory7, however, but lagging the walls and
roof with sound-absorbent material, e.g. asbestos quilting, led to
a little improvement. The noise appears to increase at a rate
considerably greater than the increase in speed of the train.
Experiments have also been made in connection with the track,
the space between the sleepers being filled with ballast to absorb
and damp out the vibrations. A section of the Piccadilly Tubetreated in this way showed some improvement.
The noise problem is also a very important one in connection
with the development of civil aircraft. In fact, the noise at present
experienced in the cabins of aeroplanes is sufficiently serious to
be regarded as a hindrance to commercial development. Thequestion has been studied by W. S. Tucker,f who has analysed
the sources and principal characteristics of such noises. Oneremedy is to line the cabins with sound-absorbent material
(e.g. balsam wool) ; this reduces the sound to about -oVth of that
in a non-absorbent cabin. Hitherto little or no improvement has
been possible in regard to the reduction of the propeller and
exhaust noise. It is important to note, however, that such ques-
tions are now being regarded seriously, and that public interest
has been aroused in the general problem of reduction of traffic noise.
The New Motor Car (Excessive Noise) Regulations, dated
June 3, 1929, make it an offence for any person to use a motor
vehicle which causes excessive noise as a result of any defect in
design or construction, or lack of repair or faulty adjustment. It
is also an offence under the regulations to use a vehicle which
makes an excessive noise due to faulty packing or adjustment
of the load. 'Excessive noise' is, however, a term which is very
difficult to define.
* See The Engineer, Oct. 12, 1928. f Proc. Roy. Aero. Soc, Jan. 19, 1928.

OTHER TECHNICAL APPLICATIONS 503
(2) Sound Signalling - Frequent reference has been madein the text to sound-signalling devices for use in air and in the
sea. In the section on sound sources we have dealt with various
forms of siren and the diaphone for use in air, and have mentioned
the Fessenden oscillator and the Signal Gesellschaft electro-
magnetic transmitter for use in water. Various directional sound
transmitters have also been described. In the section on the
transmission of sound the important questions of attenuation and
refraction have received particular attention in relation to sound
signalling.
If the reader requires further information the following biblio-
graphy may prove useful
:
Signalling in Air - Various published papers by L. V. King,
W. S. Tucker, and E. T. Paris; The Pri?iciples of Sound-
Signalling, by Hart and Smith.
Signalling in Water - Various published papers by R. A.
Fessenden, Hahnemann, Hecht, and Lichte; Unterwasserschall-
technik, by F. Aigner (Berlin, 1922); publications by the Sub-
marine Signalling Co. (Friar's House, London) and Hydrographic
Bureau, Monaco.
(3) Supersonics - The piezo-electric quartz oscillator as a
source of high-frequency inaudible vibrations has been described
(see pp. 140 et seq.). The technical applications of such oscillators
(a) in the Langevin depth-sounding apparatus, (b) as a means of
standardising the frequency of electrical circuits, and (c) as a tool
in physical and biological investigations have been mentioned.
Further reference should be made to the original papers.
(4) Musical Instruments - An adequate treatment of the
technical applications of sound to the design and construction
of musical instruments would require a volume in itself. On the
grounds that anything short of such a detailed treatment would
fail in its purpose, the writer has refrained in the text from enter-
ing into particular descriptions of musical instruments. Reference
has been made to them only in so far as they serve to illustrate
points of definite scientific interest raised in the text. It must
not be supposed, on this account, that the writer has neglected
so important a branch of the subject, but rather that he considers
that the reader should consult specialised treatises. For example,
D. C. Millar's Science of Musical Sounds, E. H. Barton's article
in The Dictionary of Applied Physics, and E. G. Richardson
The Acoustics of Orchestral Instruments and of the Organ, contain
much valuable information.

504 TEXTBOOK OF SOUND
3o
U
uz<Hi—
i
W
„ um HU p
Z < ^a - ^
i—
i
uohJ
>
oCOwPQ
Acoustic
Resistance
*~1 lO CO
ho<n«h^nhnhhh6 6666I—
1
0)
Id
>
Tor- sion
O «0 CO tHcDCOhHN^ON05©iX)Oh1 | |
• || |
•
pq
00
lO^
2^O>OHC<|c£)t>P0(M O • •\
• * * • •
Longi-tudinal bar
CD
"> lO 00 lC »C CO ^H 03 Cq *° lO lO 00 CO CO lO
4i
+
19^qiHcpcob-cpb-owobrtooiiodjiot-^obio • • • • • •
X 1—1 1—1 H <N (N H r—l +->
CO
Poisson's
Ratio a
COQ-l(NlOI>COlOHOOCOI> OhncoiMN^rtcono a , [
6 '
' « '*>
6 °
Rigid- ity
d coi CO 10 COS^io^THiot-asoio • •
X(NTHTHob6b-(NCqO ^
Young's
Modulus E
00 T—
1
3 t-h cq co0*0 <M n lO O lO OS O COHocoiooco^ffi^ £ co 00 <—locoas
HH(M C<1 1—1 lO i—l
Bulk Modulus ki-l COr« CO Oi ^2'*H |X)HO |SOi(NO O • * • * • • 1
j
xt^-coch)obiot>-oioo ^1—
1 1—1 1—11—1 rH X?
CO
Density Qin co ^ ^cp ? t: co^cpi9coiooggg Hai § 00 ^
Solid
Aluminium
Copper
Iron
(cast)
.
Steel
.
Lead
.
NickelSilver
Tin
.
Brass
.
Glass
.
Quartz
IvoryPitch
.
Paraffin-wax
Rubber
Oak
.
Ice

APPENDICES 505
.a , "^to to Ps , ^ ^coco^co iO
X r—1 O 1—< O i—l
IO GOr-H OS
1—
1
>* ^ •
Velocit
c
(cal-
culated
cm.
/sec O **H tr- CD iO CO rH COrH ^ rH CO t- "^X ,—1 1—( 1—1 O 1—
1
i-H i—l
'ftu
^ O*> ,— * H(ObHO O CO
Rat SpeHegCO H/l <N CM O O rH
. <+H
Coeffi-
cient
Cubic
Expan-sion a
1 O CO "# Oi t- co coO H0 05 10H CM i—l
X t-H 1—1 O T-H O
bo © CO »H lO GOGO
1—1 CO
C3
O
W rl t*i co t- cp i-H
CM CM tH rH »*
Oi rH
CO O
Cfi 1 1—
1
-H CO£ 0* CO CM IO O CO co
id IO ">* HH O a>a,go
O u O O O O r-< O O^ ,-s
rt 1 Is S N O5 00 (M * CM© CO CO CM CO O CO COrH 1—1 O 1—
1 O CM cm 10
5wj x 66666 O CMw a
1—
i
10iO co
3£) C<5 ^ t> ic t- t-(M CO H tH O 05 O
O O
>^ IOOi iO
w 05 H/i t- Oi CMC Qj t- t- GO t- Oi O CO
Q OOOOO rH CO1—
1
" 4-i
a<v
*h •
<u
Oh
TJ IO3 COO*
J CD co rj
cj <u <u• • .3 * »h «3 >"> ^+J
/i'.t-M v—'
OJ S C c« rt
•-3 uB 3c3 HCO cu
§
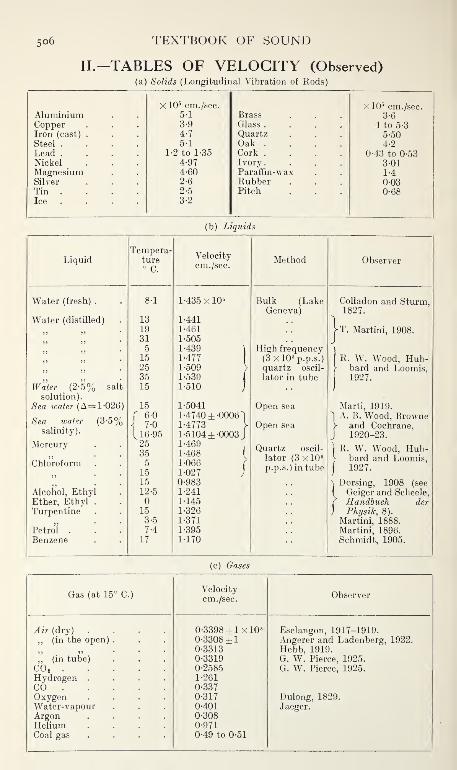
506 TEXTBOOK OF SOUND
II.—TABLES OF VELOCITY (Observed)(a) Solids (Longitudinal Vibration of Rods)
xlO5 cm. /sec. x 105 cm./sec.Aluminium 51 Brass 3-6
Copper 3-9 Glass . 4 to 5-3
Iron (cast) . 4-7 Quartz 5-50Steel . 5-1 Oak . 4-2
Lead . 1-2 to 1-35 Cork . 0-43 to 0-53Nickel 4-97 Ivory. 3-01
Magnesium 4-60 Paraffin-wax 1-4
Silver 2-6 Rubber 0-03Tin . 2-5 Pitch 0-68Ice 3-2
(b) Liquids
LiquidTempera-
ture° C.
Velocitycm./sec.
Method Observer
Water (fresh) . 8-1 1-435 xlO 5 Bulk (LakeGeneva)
Colladon and Sturm,1827.
Water (distilled) 13 1-441 1. 19 1-461 >>T. Martini, 1908.. 31 1-505 J
5 1-439 \ High frequency15 1-477 (3xl0 s p.p.s.) R. W. Wood, Hub-
>j25 1-509 > quartz oscil- - bard and Loomis,
. 35 1-539 lator in tube 1927.Water (2-5% salt 15 1-510 J
solution). ~
Sea water (A= 1-026) 15 1-5041 Open sea Marti, 1919.
Sea water (3-5% f6-0 1-4740 ±-0006] 1 A. B. Wood, Browne
< 7-0 1-4773 V Open sea > and Cochrane,salinity).
L 16-95 1-5104 ±-0003 J J 1920-23.Mercury 25
355
15
1-469.
1-468 I
1-066 (1-027 ;
Quartz oscil-)R. W. Wood, Hub-
) bard and Loomis,
j1927.
Chloroformlator (3 xlO 5
p.p.s.)intube
15 0-983 \ Dorsing, 1908 (see
( Geiger and Scheele,Alcohol, Ethyl 12-5 1-241
Ether, Ethyl . 1-145 f Handbuch der
) PhysiJc, 8).Turpentine 15 1-326
. 3-5 1-371 Martini, 1888.Petrol . 7-4 1-395 Martini, 1896.Benzene 17 1-170 Schmidt, 1905.
(c) Gases
Gas (at 15° C.)Velocitycm./sec.
Observer
Air (dry) .... 0-3398 ±1 xlO 5 Esclangon, 1917-1919.
,, (in the open) 0-3308 ±10-3313
Angerer and Ladenberg, 1922.Hebb, 1919.
,, (in tube) 0-3319 G. W. Pierce, 1925.
CO, . 0-2585 G. W. Pierce, 1925.Hydrogen . 1-261
CO . 0-337
Oxygen 0-317 Dulong, 1829.Water-vapour 0-401 Jaeger.ArgonHelium
0-3080-971
Coal gas 0-49 to 0-51

INDEXThe numbers refer to pages. Names of persons are printed in italics.
Abello, T. P., 321, 432.
Abnormal Hearing, 355.
Abraham, #.,132.Abraham Rheograph, 447.
Absolute Measurement of Intensity,
423.
Absorption by Resonators, 190.
by Gas Bubbles in Liquids, 326.
Coefficients of Materials, 324, 487.
in Porous Bodies, 322.
in Turbid Media, 326.
Acceleration of Vibrating Particle, 10,
50.
Acoustic Resistance (see Radiation
Resistance).
Tables of, 504.
Acoustics of Buildings, 347, 484.
Adair, 268.
Adiabatic Elasticity, 230, 245, 262.
Aeolian Harp, 206.
Tones, 205.
Aeroplane Sounds, 214.
Agnew, 357.
Aigner, F., 335, 373, 408, 503.
Air Cavities, 169.
Jet Generators, 177, 208.
Airships (Height of), 282, 466.
Airy, 307.
Alexanderson's Alternator, 79.
Allan, E., 90.
Allen, 343, 357, 365.
Altberg, W., 257, 312, 326, 432.
Alternating Currents (Heat Soundsproduced by), 203.
Current (Sources of), 76.
Power Transmission, 497.
Ambron, R., 478.
Amplifiers, Valve, 81, 438, 441.
Amplitude of Vibrating Body(Measurement of), 455.
Analogy, Electro-mechanical, 69, 70,
385, 462, 493.
Analysis of Sounds, 188, 441.
of Speech, 397.
Anderson, S. H., 436.
Andrade, E. N. da C, 179, 242.
Angerer, 236, 265.
Anson-Pearson (Neon Lamp), 47, 227.
Aperiodic Vibrations, 36.
Applications, Technical, 465.
Army Sound-ranging, 482.
Arnold, 204, 397.
Arons, L., 103.
Ashdown Rotoscope, 41, 225.
Atmospheric Transmission, 329.
Attenuation, 317.
Audibility of Fog- Signals, 329.
Audible Limits of Frequency, 358.
Audiometer, Hilger, 155, 226, 437.
Audition (see Hearing).
Auditorium, Experimental Study of
Shape of, 489.
Auditory Sensation Area, 354.
Aural Fatigue, 357.
Ball, H. S., 415.
Ballantine, S., 424, 441.
Ballot, B., 339.
Banerji, B., 96.
Bannister, 362.
Barkhausen, 293, 335, 370.
Barlow, G., 453.
Bars, Longitudinal Vibration of, 135.
Methods of Excitation, 114.
Torsional Vibration of, 152.
Transverse Vibration of, 107.
Barton, E. H., 102, 112, 120, 363, 503.
Barus, C, 184.
Beams of Sound, 149, 150.
Beats, 19, 120, 168, 296, 339, 363, 453.
Beckett, 97.
BehmEcholot System of Sounding,470.
Behn, 241.
Bells, 167.
Submarine, 166, 169.
Benton, W. E., 373.
Berger, 253, 474.
Bernouilli, 94, 163.
Berry, G. H., 96.
Bhargava, 96, 199.
Biehle, J., 167.
Binaural Audition, 359.
Beats, 362.
Compensator, 413, 469.
Geophones, 415.
Methods of Reception, 412.
507

5o8 TEXTBOOK OF SOUND
Biot, 253.
Bird Calls, 208, 256, 281, 285, 310,
359.
Blackburn's Pendulum, 23.
Blaikley,D.J., 173, 242.
Blau, L. W., 38.
Block, E., 132.
Blondel, 443.
Boltzmann, 184, 435.
Bond, W. N., 168.
Bosscha,y., 203, 235.
Boyle, R. W., 150, 217, 257, 259, 260,
263, 275, 277, 281, 297, 308,
322, 340, 401, 432, 434, 472.
Boys, C. V., 189, 267, 269, 342, 347,
406, 427.
Bragg, W. H., 157, 278, 408, 418, 455.
Braun Tube, 448.
Bridgeman, P. W., 256.
Brillie, H., 277.
Broca Tube, 409.
Brown S.G. Telephone, 116, 387.
(Used as Oscillograph), 386,
447.
Browne, A. D., 501.
Browne, H. E., 246, 478.
Browne, 112.
Browning, H. M., 45.
Bryan, G. H., 96.
Buckingham, 485.
Bulk Modulus (k), 51.
Bullet in Flight, 270.
Photography, 269, 287, 342, 347.
Butterworth, S., 106, 125, 143, 446.
Button Microphone (see Micro-
phones).
Buzzers, 77.
Cady, W. G., 142, 143, 262, 322.
Campbell, A., 78, 257, 454.
Campbell, 244.
Campbell, G. A., 457.
Canac, F., 461.
Carbon Dioxide, Opacity of, at HighFrequency, 259, 321.
Carbon Microphone, 398, 483.
Carriere, Z., 208.
Case, T. W., 496.
Cathode Ray Oscillograph, 25, 47,
269, 448.
Cavaille-Coll, 176.
Cavitation, 215.
Centrifugal Siren, 212.
Chance Bros. Diaphone, 211.
Change of Medium, 271.
Chladni, 112, 134, 164, 199, 263.
Chrisler, 325.
Chronometer, Phonic, 481.
Chuckerbutti, 199.
Church Bells, 167.
Circle Diagram, 72.
Circular Aperture (Diffraction), 148,
307.
Disc (Diffraction), 147, 216, 308,
310.
Membranes and Diaphragms, 155.
Cisman, A., 251.
Clamped-free Bar, 113.
Clark, 226.
Closed Pipes, 171.
Cochrane, C, 246.
Cockeroft, 442.
Coefficient of Coupling, 45, 383.
Coincidence Method of Velocity
Measurement, 235.
Coke Dust Indicator for High- Fre-quency Sounds, 150.
Colladon and Sturm, 245.
Collignon, 334.
Combination Tones, 363.
Commutator, Motor-driven, 76.
Comparison of Frequencies, 452.
Composition of S.H.M.'s, 15.
Compressibility, 51.
Condensation(s), 51.
in Waves of Finite Amplitude, 263.
Condenser Microphone, 395, 398,
424, 441.
Conductivity of Neck of Resonator,
186, 462.
Conical Pipes, 172, 192.
Consonance and Dissonance, 365.
Constantinesco System of Alternating
Power Transmission, 497.
Conversion of Sound into Electrical
Energy, 384.
Cook, 215.
Cook, S. R., 244.
Cornu's Spiral, 302.
Cotton, 151, 393.
Coupled Systems, 44.
Crandall, I. B., 62, 147, 149, 193, 197,
204, 308, 397, 407, 441.
Cranz, 267, 269, 287, 343, 347.
Critical Angle, 289.
Damping, 36.
Crowley, J. F., 224.
Crystals, Quartz Piezo-Electric, 140.
Velocity of Sound in, 256.
Curie, J. and P., 140.
Cycloidal Track of Sound Rays, 292.
Cylinders, Vibration of, 166.

INDEX 509
Dadourian, H. M., 124, 130.
Damped Vibrations, 33.
Damping Coefficient, 35.
of Diaphragms, 160, 162.
of Einthoven Galv. String, 446.
of Helmholtz Resonator, 187.
of Sound Receivers, 374.
Das, P., 97.
David, P., 457.
Davis, A. H., 287, 340, 345, 484.
Deafness (see Abnormal Hearing),
355.
De Lange, P., Thermophone, 203.
Density-amplitude in Pipes, 183.
Depth-sounding, Echo, 246, 249,
467.
Deslanders, 334.
Detonating Meteor, 334.
Dewhurst, H., 155.
Dey, 96.
Diaphones, 211, 331.
Diaphragms, 157, 387, 436, 491.
Amplitude of Vibration, 163, 158,
222, 455.
Damping of, 160, 162.
in Water, 159, 410.
Loaded, 159.
Radiation from, 63.
Tunable, 163.
Diatonic Scale, 3.
Difference Tones, 363.
Diffraction, 299, 420.
at a Straight Edge, 304, 311.
Circular Aperture, 193, 307.
Disc, 308, 420.
Grating, 257, 309, 312.
of Plane Waves, 148.
Direction, Perception of, 359.
Directional Hydrophones, 414, 416.
Properties of Diaphragms, 156, 217,
416.
of Double and Multiple Sources,
217.
of Horns, 193.
of Membranes, 156.
of Piston Source, 148.
Receivers, 313, 412.
Sources of Sound, 148, 215, 313.
Discord, 365.
Displacement Amplitude in Pipes,
183.
of Source, 455.
Receivers, 379, 409, 418.
Distance Measurement by Sound, 466.
Distribution of Sound Around anObstacle, 313, 420.
Dixon, H.B.,24,4,.
Dolezalek Toothed Wheel Alternator,
78.
Donkin, 90.
Doppler Effect, 336.
Dorsing, K.y251.
Double Resonators, 189, 406, 427.
Sources, 64, 215, 314.
Douglas, H. P., 472.
Dove Siren, 210.
Dropping Plate, Method of Record-
ing, 120, 221.
Drums, 156.
Drysdale, C. V., 225, 408, 416, 420,
423.
Duddell Alternator, 79.
Duddell, W., 78, 204, 454.
Oscillograph, 443.
Dufour, A., 334, 449.
Dulcimer, 115.
Dust Tube (Kundt), 178, 239, 241.
Striations in, 179.
Dutton, 428.
Dvorak, 267, 340, 433.
Dye, D. W., 25, 103, 126, 129, 131,
143, 166, 257, 451.
Ear, 351.
Sensitivity, 351.
Structure of, 367.
Earthquake Waves, 475.
Eccles, W. H., 125, 387.
Echelon Reflector, 283.
Echo, 281.
Depth-sounding, 246, 249, 467.
Detection of Icebergs, Wrecks, etc.,
471.
Methods of Geological Prospecting,
253, 474.
Musical, 283.
Eckhardt, E. A., 249, 325, 486.
Edelmann, 177.
Edge Tones, 207, 214.
Edison, T., 438, 491.
Edser, E., 364.
Effective Area of Resonant Receiver,
376.
Efficiency of Electrically-driven SoundSources, 73.
of Sound Receivers, 373, 387.
Radiation, 191.
Einstein, A., 242.
Einthoven Galvanometer (see Oscillo-
graphs).
Einthoven, W. F., 106.
Ekmann, 246.

5io TEXTBOOK OF SOUND
Elasticity (volume), 51.
Electrical Energy, Conversion of
Sound into, 384.
Electrical Filters, 457.
Methods of Sound-Measurement(Analysis and Recording),
438.
Vibrations, 69.
Electricallv-maintainedTuning-Forks,
121.
Electrodynamic Receivers, 388, 439.
Electrolytic Interrupters, 77.
Electromagnetic Receivers, 386, 439.
Transmitter (Hahnemann), 383,
387.
Electromechanical Analogy, 69, 70,
385, 462, 493.
Electrostatic Oscillographs, 447.
Elinvar Forks, 130, 132.
Elwell, C. F., 495.
End-correction for Pipes, 171, 176.
Energy Density, 54, 430.
Dissipation at Resonance, 43.
Distribution in Speech, 197.
of a Particle (S.H.M.), 13.
of Plane Waves, 53.
Equation of Continuity, 56.
Esclangon, E., 213, 236, 334.
Eve, A. S., 4:14:.
Ewald, 370.
Ewing, A., 500.
Explosion, location of, 423, 478.
Pressure Wave from, 266, 269.
Sounds, 212, 333, 335, 501.
Exponential Horn, 193.
Fage, A., 188, 214, 453.
Faraday, M., 199.
Fechner-Weber Law, 4, 351.
Fenkner, 166.
Fessenden Echo-sounder, 468.
Oscillator, 163, 297, 335, 390, 410,
503.
Filters (Wave), 356, 457.
Band-pass, 460, 464, 493.
High-pass, 459, 463.
Low-pass, 459, 463.
Mechanical, 461.
Finite Amplitude, Waves of, 263.
Fixed-free Bar, 113.
Flames, Sensitive, 371.
Singing, 199.
Fletcher, H., 198, 253, 356, 370, 395.
Fletcher, G. H., 500.
Flue Pipe, 175.
Flux (Sound), 61.
Focussing of Sound, 284, 309.
Fog Signalling, 210, 326, 329, 333,
406, 436, 503.
Foley, A. L., 267, 287, 290, 312, 341,
398.
Foltz,J. P., 499.
Forced Vibrations, 36.
Amplitude of, 38.
Initial Stages of, 38.
Phase of, 39.
Ford, J. M., 124, 127, 480.
Fortesque, C. L., 78.
Fourier Series, 25, 93.
Fournier d'Albe, E., 189.
Fowler, 209.
Free-free Bar, 110.
Frequency, 11.
Analysis, 453.
Comparison of, 452.
Determination of Forks, 128, 221.
Effect of Damping on, 35.
Measurement, 451.
Meter or Indicator, 41, 116.
of Cylindrical Pipes, 170.
of Diaphragms, 157.
of Forks (factors influencing), 126,
130.
of Longitudinal Vibration of Rods,
136.
of Membranes, 165.
of Transverse Vibration of Bars,
111.
of Vibrating Ring, 134.
String, 87.
Stabilisers (Quartz), 145.
Standards, 105, 120, 132, 452.
Fresnel's Integrals, 302.
Zones, 300, 422.
Frictional Forces, 33, 317.
Friese, 184, 408.
Frothy Liquids, Absorption by and
Velocity of Sound in, 326.
Fry, 361.
Gall, D. C., 125.
Gallon's Whistle, 177, 279, 310.
Gas Bubbles in Liquids, Absorption
by, 326.
Gauze Tones, 202.
Geiger,H., 241.
Geological Prospecting (Echo), 253,
474.
Geophones, 415.
George, W. H., 96, 97, 100, 101.
Gerlach, 389, 440.
Ghosh, 96, 199.

INDEX 5ii
Gianfranceschi, G., 357.
Giebe, 143.
Gill, F., 78.
Gongs, 166.
Gore, 199.
Gramophone, 491.
Grating Circular, 309.
Diffraction, 257, 309, 312.
Reflection, 283.
Greely, A. W., 235.
Green, H. G., 175, 251.
Griffiths, E., 259.
Gruss, 266.
Guillaume, 130.
Guthrie, 434.
Hahnemann, W., 380, 383, 387, 503.
Half-wave Zones, 300.
Hansel, W., 132.
Hanson, E. T., 187.
Harmonic Analysers, 33, 442.
Echoes, 282.
(Even and Odd), 32.
Series, 25.
(Strings), 93.
Harmony, 365.
Harrington, E. A., 121.
Harrison, J. R., 142.
Hart, M. D., 191, 192, 211, 212, 321,
330, 503.
Hartley and Fry, 361.
Hartley, V. L., 463.
Hartmann, 116, 177.
Hayes, H. C, 249, 408, 442, 466.
Hearing, Abnormal, 355.
Theories of, 369.
Heat Conduction, 317.
Heat-maintained Vibrations, 198.
Heaviside, O., 457.
Hebb, T. C, 237.
Hecht, H., 380, 503.
Heck, 249.
Hehlgans, F. W., 216.
Helmholtz, H., 96, 97, 98, 195, 210,
363.
Helmholtz-Kirchhoff Relation (Pipes),
238, 241, 243.
Resonators, 183, 185, 379, 402,
462, 482.
Theory of Audition, 369.
Henrici, 33.
Herbolsheimer, 255.
Hermann and Scripture, 196.
Herzfeld, W. F., 319.
Hewlett, C. W. (Sound Generator),
161, 391, 440.
High-Frequency Microphone, 401.
Pipes, 177.
Piston, 147.
Sounds, Intensity Measurement,432.
Sounds, Velocity of, 256.
Source (Quartz), 146.
Vibrations, 140, 298, 310, 321,340.
High-speed Projectiles, 269.
Hilger Audiometer, 155, 226, 437.
Hippel, A. von, 407.
Ho and Kato, 447.
Hodgkinson, T. G., 129.
Holm, R., 399.
Holtzmann, 326.
Honda, 394.
Hoppe, 133.
Hopwood, F. L., 281, 286, 299, 408.
Hornbostel, 362.
Horns, 192, 220, 347.
Hort, W., 134.
Hot-wire Microphone, 183, 188, 212,
213, 236, 325, 331, 402, 439,
482.
Hubbard, J. C., 175,257,260.Hughes, 398.
Humby, S. R., 299, 311, 340, 370.
Huvghens Construction (Reflection),
286.
(Refraction), 289.
Principle, 66, 193, 270, 293, 300.
Secondary Waves, 67, 287, 289,
312.
Hyde, J. H., 500.
Hydrographical Survey, 480, 484.
Hydrophones, 247, 296, 393, 408, 483.
Directional, 316, 414, 416.
Light Body, 314, 419.
Image of Sound Source, 275, 296.
Impedance, Motional, 63, 73, 144,
387, 428.
Networks, 458.
Infra Sound, 213, 482.
Intensity, 54, 405.
Interferometer Method, 434.
Measurement, 423.
Null Methods, 390, 440.
Radiometers, 432.
Rayleigh Disc, 189, 312, 426.
Interference, 293, 296, 299.
Between Source and Image, 296.
Interferometer (Optical), 166, 184,
224, 434, 456.
Internal Damping, in Gases, Liquids,
and Solids, 321.

512 TEXTBOOK OF SOUND
Interrupter (Electrical), 76.
Method of Frequency Analysis,
453.
Intervals, 3.
Irwin, J. T., 222.
Jaeger, W., 244.
Jager, 485.
Jeffreys, H., 475.
Jet Tones, 177, 207.
Johnson, J. B., 451.
Joly, J., 466, 478, 480.
Jones, A.T., 167.
Jones, E., 267.
Jonescu, 251.
Kahl, 236.
Kalahne, A., 244.
Kaleidophone (Wheatstone's), 24, 114.
K'aio, 447.
Kaufmann, 96.
i&rye, G. W. C, 341, 484.
Km*e, i?. B., 453.
^//o^, 255.
Xe/wn, 345, 433.
Kempelen, von, 196.
Kempf, 116.
Kennelly, A. E., 73, 161, 222, 402,
437.
Kerr Grant, 138, 162, 497.
Keys, D. A., 269, 449.
Kinematic Viscosity, 238.
Kinetic Theory of Molecules (Velo-
city), 231.
King, L. V., 163, 210, 330, 402, 436,
503.
Kingsbury, B. A., 353.
Kirchhoff, G., 238, 319.
Knudsen, 352, 487.
Koch, P. P., 231.
Kohlrausch, 206, 357.
Konig, W., 25, 117, 131, 180, 202,
235, 339, 357, 434.
Konig, M., 134, 357.
Konno, 322.
Kranz, F. W'., 353.
Kratzenstein, 196.
Kruger, 208.
Kundt, 174, 239.
Kundt's Dust Tube, 178, 239, 241,
251, 254, 257, 261, 432, 453.
Striations in, 179, 434.
Kunze, W., 362.
La Cour, 126.
La Courtine Explosion, 334.
Ladenberg, 236, 265.
Lakey, E. H., 106, 446.
Lamb, H., 59, 64, 110, 133, 154, 158,
174, 191, 251, 263, 323, 345,
418.
Lane, C. E., 355, 362.
Lang, R. J., 261.
Lange, P. de, 203.
Langevin, P. (Quartz Supersonic
Transmitter), 146, 150, 217,
308, 393, 421, 432, 471, 503.
Laplace, 230, 238, 319.
Lapp, C.J., 436.
Large-amplitude Waves, 263.
Larmor, 429.
La Tour's Siren, 209.
Law of Sines, 271, 289.
Lebedew,P., 321.
Lechner, A., 244.
Lecomte, 370.
Lees, C. H., 45.
Lehmann, 174, 251.
Lehmann, J. F., 150, 259, 277, 281,
297.
Lens, 290.
Lever Principle, 380, 394, 410.
Lewer, S. K., 179, 242.
Lichte, H., 293, 335, 373, 503.
Lifschitz, 487.
Light Body Hydrophone, 419.
Valve, 497.
Lightning Flash, Sound from, 220.
Line Source of Sound, 220.
Lintern, H. P., 500.
Liquid-filled Pipes, 174.
Lissajous' Figures, 24, 97, 453.
Littler, T. S., 439.
Lloyd, 357.
Lloyd's Interference Bands, 296, 299.
Loaded Diaphragms, 159.
Strings, 91.
Local Flow, 65.
Location of Impulsive Sources, 423,
478.
Logarithmic Decrement, 35.
Longitudinal Vibration of Rods, 135.
Loomis, A. L., 151, 175, 257, 260, 281.
Loudness, 4.
Loud-speakers, 491.
Love, 253.
Lubcke,E., 357,441.
Ludin, E., 203.
Lyle, T. R., 45.
Mach, 266, 339, 343.
McLachlan, N. W., 151, 491.

INDEX 5i3
McLeod, 226.
Magnetostriction, 139, 259, 262, 394.
Magnification of Vibrations (Mechani-
cal and Optical), 220.
Mallett, E., 131, 143, 387, 428.
Mallock,A., 205, 271,326.
Mandell, W., 151.
Manometric Capsule, 180, 182, 202,
437.
Marconi-Sykes Receiver, 389.
Marti, M., 246.
Marti, P., 146.
Martin, H., 105.
Martin, W. H., 395.
Masking Effect of Sounds, 355.
Mason, M., 422, 469.
Mason, W. P., 4:61.
Mathews, D. J., 245, 249.
Maurain, 334.
Maurer, H., 246.
Maxfield and Harrison, 442, 464, 491.
Maxwell, J. C, 318.
Maxwell, R. S., 402.
Mayer, A. M., 356.
Measurement of Absorption Coeffi-
cients, 324, 487.
of Displacement Amplitude of
Solid Vibrators, 455.
of Distance by Sound, 466.
of Frequency, 451.
of Sound Energy, 423.
. Electrical Method, 438.
Mechanical Coupling, 44, 382.
Filters, 457.
Transformers, 380.
Meissner, W., 390.
Melde's Experiment, 92.
Membranes, 154, 156, 226, 437.
Merritt, E., 437.
Mersenne, 87.
Meteor, Detonating, 334.
Meteorological Acoustics, 331.
Meyer, E., 232, 427, 433.
Michelson, A., 237.
Microphone Button, Directional Pro-
perties, 418.
Carbon, 161, 163, 314, 398, 409,
417.
High Frequency, 401.
Condenser, 395, 398, 424, 441.
Hot Wire, 183, 188, 212, 236, 325,
331, 402, 439, 482.
Hummers, 77.
Transverse Current Type, 401.
Miles, Walker, 442.
Millar, D. C, 117, 131, 156, 197, 503.
Millar Phonodeik, 436.
Milne, E. A., 209, 330.
Minimum Amplitude Audible, 354.
Minton, J. P., 355.
Mintrop, 475.
Mirage, 291.
Mirrors, Concave, 192, 215, 217, 220,
284, 288, 421.
Stroboscopic, 326.
Modulus of Decay of Vibrations, 35.
Molecular Velocities, 231.
Monochord, 88, 103.
Moss, H., 499.
Motional Impedance, 63, 73, 144,
387, 428.
Circle, 74.
Motion of Source, Receiver andMedium, 336.
Moullin, 112.
Moullin, E. B., 501.
Moullin Voltmeter, 321, 402.
Multiple-charge Method of Velocity
Measurement, 248.
-point Sound Ranging, 481.
Receivers, 422.
Sources, 217.
Multivibrator, 132, 258.
Musical Echoes, 283.
Instruments, 95, 115, 156, 175, 176,
503.
Intervals, 3.
Myers and Wilson, 362.
Narrow Tubes and Cavities, 322.
Navy Sound Ranging, 483.
Neklapajev, N., 321, 432.
Neon Lamp, Flashing, 47.
Stroboscopic, 225.
Newton's Isothermal Velocity, 230,
233, 238, 319.
Nichols and Merritt, 437.
Nicholson, A., 151, 153, 393, 494.
Noise of Traffic and Machinery, 499.
in Underground Railways, 501.
on Aeroplanes, 502.
Northey, J. P., 211.1 Null ' Method of Intensity Mea-
surement, 390, 440.
Nutting, 352.
Observation of Vibrating Bodies, 220.
Obstacle in Sound Waves, 313, 378,
423.
Ohm, G. S., 356.
Ohm's Law (Mechanical Analogue),
33

514 TEXTBOOK OF SOUND
Oil-bearing Strata, Location of, 474.
Onde de Choc, 269.
de Bouche, 213.
Opacity of C0 2 to Sound Waves of
High Frequency, 259, 321.
Open Pipes, 170.
Optical Magnification, 220.
Recording and reproduction, 494.
Optiphone, 386, 447.
Organ Pipes, 175, 184, 188.
Orlick, E., 103.
Oscillator, Pierce, 145.
Valve, 79.
Oscillograph, 443.
Cathode Ray, 25, 47, 269, 448, 451.
Duddell, 443.
Einthoven, 106, 213, 222, 226, 236,
247, 331, 444, 474, 479, 482.
Electrostatic, 447.
Piezo-Electric, 146, 223, 447.
Record of Neon Lamp Flashing,
47.
of Tuning-fork Current, 123.
of Wehnelt Interrupter, 47.
Reed Telephone Type, 386, 447.
Page, 199.
Paget, R. A. S., 195.
Palaiologos, K., 257, 312.
Parallel Aperture (Diffraction), 306.
Paris, E. T., 188, 189, 310, 325, 330,
402, 406, 439, 488, 503.
Parker, 244.
Parker, F. H., 120.
Parsons, C, 211, 215.
Particle-Velocity, 10, 50.
Payman, W'., 266, 344.
Pendulum, Blackburn's, 23.
Simple, 12.
Spherical, 22.
Perception of Direction, 359.
of Quality and Pitch, 356.
Persistence of Audition, 357.
Phase-change on Reflection, 273.
Phonautograph (Scott-Konig), 437.
Phonic Chronometer, 127, 480.
Motors, 126, 129, 133, 346.
Phonodeik, 436.
Phonofilms, 494.
Phonograph, 438.
Phonometer, 435.
(Webster), 435.
Photophone, 494.
Pianoforte, 96.
Pierce, G. W'., 73, 140, 145, 243, 258,
262, 268, 321, 394, 453.
Piezo-electric Effects, 140.
Oscillators and Resonators, 142,175, 257, 262, 268, 279, 281,
297, 471.
Oscillographs, 146, 223, 447.
Pressure Measurement in Water,269.
Receivers, 147, 379, 393, 421.
Sources of Sound, 145.
Torsional Effects, 153.
Vibrators, 141.
Pipes, 169, 238.
and Resonators, Relation of, 187.
Conical, 172, 192.
Density and Temperature Changesin, 183.
End Effects, 171, 176.
High-frequency, 177.
Liquid-filled, 174.
Organ, 175, 184, 188.
Pressure and Displacement Ampli-tude in, 180.
Piston-source, High-frequency, 147,
216, 308.
Pitch, 3, 356, 357.
Plane Waves, 49.
Plateau's Disc, 225.
Plates, 164.
Player, E. S., 293, 330, 332.
Pockels, F., 141.
Pol, B. van der, 45, 47.
Polar Curves of Directional Sources
and Receivers, 216, 219, 417.
Porous Bodies, Absorption by, 322,
488.
Porter, 494.
Potentiometer, Alternating Current,
397.
Powell, J. H., 161,401.
Power, Alternating, Transmission of,
497.
Dissipation, 41.
of Source Radiating Plane Waves,54.
Spherical Waves, 62.
Output Motional ImpedanceMethod, 73.
Wattmeter Method, 75.
Radiated from Diaphragm, 63.
from Double Source, 65.
Poynting, J. H., 429.
Pressure Amplitude in Pipes, 180.
of Sound Radiation, 429.
Receivers, 379, 392, 409.
Principle of Reversibility, 272.
of Superposition, 66.

INDEX SiS
Projectiles, Sounds from, 214, 269.
Propeller Sounds, 214, 452.
Quality, 92, 356.
Quartz, Frequency Stabilisers, 145.
Piezo-electric Vibrations, 140.
Plates, Vibration Forms, 166.
Resonators, Oscillators, and Re-ceivers, 142, 216, 257, 259,
268, 308, 321, 373, 393, 433,
497.
Standards of Frequency, 142.
Velocity of Sound in, 256, 262.
Quayle, 267, 269, 342.
Quimby, S. L., 322.
Quincke Filters, 190, 347, 461.
Radiation Pressure of Sound, 429.
(or Acoustic) Resistance, 54, 272,
328, 462.
Radio-Acoustic, Location of Source,
478.
Velocity Measurement, 247.
Radiometer, Sound-pressure, 432.
Raman, C. V., 89, 99, 286.
Ramsay, 241.
Rankine, A. O., 153, 217, 340, 421,
475, 495.
Raps, 184, 224, 435.
Ratio of Specific Heats (of Gases),
233, 240.
(of Liquids), 245.
Rawlinson, W. F., 275.
Ray, B., 286.
Ray, S., 89.
Rayleigh, 66, 90, 91, 107, 115, 118,
126, 149, 157, 164, 166, 176,
189, 200, 207, 210, 216, 241,
253, 263, 278, 285, 329, 359,
430, and others.
Rayleigh Disc, 189, 312, 426.
Reaction between Resonators, 433.
Spherical Particles, 434.
of Medium on String, 105.
Receiver as an Obstacle, 378, 423.
Receivers, Binaural, 412.
Directional, Diaphragm, 156, 217,
416.
Diffraction Disc, 420.
Displacement, 418.
of Large Area, 421.
Multiple, 422.
Displacement, 379.
Amplification Factor of, 376.
Efficiency of, 373.
Receivers
—
continued.
Electrodynamic (Moving-coil), 388,
439.
Electromagnetic (Moving-iron),
386, 439.
Induction Type, 390.
Magnetostriction, 394.
Microphone, 398.
Non-resonant, 378, 438, 440.
of Large Area, 378, 421.
Piezo-electric, 142, 393.
Pressure, 379, 392, 409.
Resonant, 375.
Thermal, 402.
Under-water, 408.
Velocity, 392.
Reception of Sound, 349.
Reciprocal Observation in Velocity
Measurement, 235.
Recording Sounds, 491.
Reed Organ Pipe, 176.
Reeds, 115.
Reflection, 271.
at Boundary of Two ExtendedMedia, 271.
Coefficients, 273, 281, 324.
from Air-film in Water or Rock, 277.
from Bubbles in Water, 328.
from Curved Surfaces, 192, 215,
284.
from Plate of Finite Thickness,
275.
from Stepped and CorrugatedSurfaces, 309.
from Thin Parallel Laminae, 278.
Gratings, 283.
Imperfect, 280.
of Waves on a String, 86.
Phase Changes at, 273.
Total, 274.
Refraction, 289.
by Wind and Temperature Gradi-
ents, 213, 290, 332.
in the Sea, 293, 335.
Regnault, V., 235, 239, 265.
Reid, CD., 150.
Reisz, R. R., 353.
Relaxation Oscillations, 45.
Reproduction and Recording (Optical
Methods), 494.
Faithful, 491.
Resonance, 36.
Resonant Gas Column, 169.
Shunt Method of Damping Oscillo-
graph, 446.
Vibration of Quartz Crystals, 141.

Si6 TEXTBOOK OF SOUND
Resonators, Double, 189, 406, 427.
Helmholtz, 183, 185, 379, 402,
462, 482.
Liquid Column, 174.
Reinforcement and Absorption of
Sound by, 190.
Reverberation, 485.
Revolving Mirror (Wheatstone), 200.
Rheograph, Abraham, 447.
Rice, F. O., 319.
Richardson, E. G., 182, 187, 199, 202,
207, 372, 503.
Richardson, L. F., 471.
Ridout, 372.
Riegger, H., 395, 398.
Riemann, 265.
Riess, 203.
Rijke, 202.
Ring Source of Sound, 220.
Rings, Vibration of, 133.
Ripple Tank, 344, 489.
Roberts, J. H. T., 161.
Robinson, H., 266.
Rochelle Salt, 141, 146, 151, 153, 393,
494.
Rods, Longitudinal Vibration of, 135.
Torsional Vibration of, 152.
Transverse Vibration of, 107.
Roef, H. E., 370.
Ronda, 322.
Rothwell, 494.
Rothivell, P., 454.
Round, H. J., 389.
Riicker, 364.
Riihmer, E., 495.
Russell, 151.
Russell, S., 339, 393.
Sabine, W. C, 198, 484.
Sacia, C. F.y198.
Sandemann, E. K., 461.
Savart, 90, 165, 180.
Scattering of Sound, 282.
Schaffgotch, 199.
Schiebe, 143.
Schlieren Method, 178, 266.
Schmidtke, 208.
Schottky, 389.
Schumacher, A., 246.
Scripture, E. W., 196, 438.
Secondary Waves (Huyghens), 67,
287, 289, 312.
Seebeck, 209.
Seismic Waves, 253, 474.
Selenium Cell, 495.
Sell, H., 385.
Sensitive Flames and Jets, 257, 285,
290, 340, 371.
Sensitivity of the Ear, 351.
Service, J., 249.
Shadow Method, Dvorak, 267, 287,
312, 340.
Sharpness of Resonance, 43, 161.
Shepherd, G. M. B., 457.
Shepherd, W. C. F., 266, 344.
Shock Excitation of Resonance, 213.
Ship's Propeller Sounds, 214.
Signalling (see Fog Signalling).
under Water, 163, 166, 169, 210,
383, 410, 503.
Silent Zones, 333.
Simple Harmonic Motion, 9.
Spherical Waves, 61.
Sources, 64, 313.
Singing Arc, 78, 204, 257.
Flames, 199.
Sirens, 209.
Centrifugal, 212.
Power, 210, 410.
under Water, 210.
Sivian, L.J., 428.
Smith, F. D., 440.
Smith, F. E., 472.
Smith, S., 148.
Smith, W. W. {and Hart), 191, 192,
212, 503.
Smith-Rose, R. L., 128.
Sondhauss, 199, 200, 290.
Sonic Depth-finder, 472.
Sonometer, 88, 103.
Sorge, 363.
Souder, 287, 290, 312, 341.
Sound Ranging, 213, 236, 478.
Receivers (Electrical), 384.
Sounding-board, 100.
Sources of Alternating Current, 76.
of Sound of Large Area, 149,
216.
Piezo-electric, 146.
Spark Sounds, 205, 267, 346.
Photography, Schlieren Method,266, 342.
Shadow Method, 267, 287, 312,
340, 489.
Speech, 195.
Analysis and Recording, 397.
Energy Distribution, 197.
Transmission by Light, 495.
Spherical Waves, 56.
Spirals, 18.
Cornu's, 302.
Spooner, T., 499.

INDEX 5i7
Square-wave, Fourier Analysis of, 27.
Test of Oscillographs, 442, 44(5,
449.
Standards of Amplitude, 146, 204.
of Frequency, 132, 142, 452.
of Intensity, 423.
(sub-) of Time (Forks), 121.
Stationary Waves, 279, 295.
in Pipes, 170, 184.
in Rods, 136.
on Strings, 86.
Wave Method of Measuring
—
Absorption, 324.
Depth of Sea, 469.
Velocity, 239, 256, 258.
Stefan, 254.
Steinberg, 353.
Stenzel, H., 149, 216, 220.
Stephenson, E. B., 249.
Stern's Tonvariator, 453.
Stevens, E. H., 244.
Stewart and Stiles, 428.
Stewart, G. FT., 361, 461.
Stewart, J. Q., 197.
Stiffness of Strings, 90.
Stokes, G., 66, 105, 319.
Stratton, 33.
Strength of Source, 61, 63.
Stringed Instruments, 95.
Strings as Source of Sound, 100.
Excited by Bowing, 97.
by Plucking or Striking, 94.
Electromagnetically, 102.
Methods of Excitation, 92.
Motion at Node of, 89.
Stiffness, 90.
Transverse Vibration of, 84.
Strip Receivers (Gerlach), 389, 440.
Stroboscope, 166.
Stroboscopic Methods, 224.
Mirrors, 226.
Neon Lamp, 225.
Photography, 346,
Tuning-fork, 225.
Vibrator (Crompton - Robertson),
225.
Strouhal, 206.
Sturm, 245.
Sub-harmonics, 168.
Submarine Signalling, 163, 166, 169,
210, 383.
Sum and Difference Method of
Location of Source, 416.
Summation Tones, 363.
Superposition, Principle of, 66, 293.
Supersonic Vibrations, 140.
Supersonics, 146, 150, 503.
Sutherland, G. A., 286.
Tait, 85.
Tartini, 363.
Taylor, G. B., 260.
Taylor, G. I., 330.
Taylor, H., 324.
Technical Applications, 465.
Telephone Diaphragm, Amplitude of,
222.
Motional Impedance of, 73.
Receiver, 73, 161, 311.
Brown-Reed Type, 116, 386.
Temperature Changes in Pipes,
183.
Coefficient of Tuning-forks, 130.
Refraction, 290, 293, 335.
Terry, 143.
Thalofide Cell, 496.
Theories of Hearing, 369.
Thermophone, 203.
Thomas, H. A., 4:57.
Thomas, J. S. G., 402.
Thomson, J. J., 269, 394, 449.
Thomson, S. P., 362.
Threlfall, R., 268.
Thunder, 220.
Tone Generator, Hewlett, 161, 391,
440.
Tdpler, 184, 200, 266, 342, 435.
Torsion Pendulum, 321, 326, 432.
Piezo-electric Effects by, 153.
Torsional Vibration of Bars, 152.
Waves, Velocity of, 256.
Total Reflection, 274.
Tourmaline, 141, 269.
Transmission Coefficient, 273, 290.
of Alternating Power, 497.
of Sound, 229.
through the Atmosphere, 329.
through the Sea, 320, 329, 335.
Transverse Vibration of Bars, 107.
of Strings, 84.
Trendelberg, F., 398.
Trevelyan's Rocker, 198.
Trolle, B., 177, 208.
Troller,A., 146, 177, 408.
Trombone Tube (Interference), 295.
Trumpets, Binaural, 412.
Directive Properties, 193, 217, 220,
421.
Intensifying Properties, 192.
Tucker, W. S., 183, 212, 291, 310,
330, 402, 439, 502.
Tuma, J. t325.

5i8 TEXTBOOK OF SOUND
Tuning-forks, 60, 117, 226.
as Frequency Standard, 132, 452.
Clock Controlled, 131.
Effect of Temperature on, 130.
Electrically-maintained, 70, 121,
340.
Frequency of, 119, 128, 221.
Interrupter, 70.
Low Frequency, 121, 124.
Proximity of Resonator, 25.
Overtones of, 120.
Stroboscopic, 225.
Valve-maintained, 125.
Variation of Frequency with Ampli-tude, 130.
Turbid Media, 320.
Tyndall, J., 115, 138, 190, 199, 255,
278, 290, 320, 329, 333, 344,
300, 370, 413.
Underwater Detection of Sub-
marines, 411.
Receivers, 408.
Signalling, 103, 100, 109, 210, 383,
410.
Sirens, 210.
Sound Generators, 147, 103, 383,
390.
Sounds, 214, 411.
Valasek, 151.
Valve Amplifiers, 81, 438.
-maintained Forks, 125.
Oscillators, 79, 180, 311.
Vautier, T., 230, 239.
Vector Polygon, 17.
Veenekamp, 251.
Velocity of Explosion Waves in Air,
230.
in Water, 240.
of Sound, 229, 504.
Effect of Viscosity on, 318.
in Air, 234.
in Air at Low Temperatures, 235.
in Earth's Crust, 253, 475.
in Fluid Mixtures, 320.
in Gases (in Bulk), 230.
(in Tubes), 238.
and Vapours at Different Tem-peratures and Humidities,
231, 241, 244.
in Liquids (in Bulk), 245.
(in Tubes), 250.
in Mixtures of Gases, 259.
in Relation to Molecular Velo-
city, 231.
Velocity of Sound
—
continued.
in Rods, 130, 240, 253.
in Soft Bodies, 254.
in Solids, 252.
(Crystalline), 256.
in Water, 245.
Isothermal and Adiabatic, 230,
245, 319, 323.
Method of Coincidences, 235.
Multiple-charge Method, 248.
of High Frequency, 250.
Radio-acoustic Method, 247, 249.
Stationary Wave Methods, 239,
250, 258.
Tables of—Appendices.
Variation with Frequency, 259,
319, 322.
Waves of Finite Amplitude, 203.
of Small Amplitude, 52, 229.
of Torsional Waves, 250.
of Transverse Waves in a Bar, 109.
on a String, 85, 89.
of Wave Transmission, 51.
Potential of, 59.
Receivers of, 392.
Verdet, 307.
Vibration Figures on Quartz, 100.
Galvanometers, 311, 454.
of Machinery, 499.
Vibrations of the Medium, 47.
Villard, P., 213, 334.
Vincent, J. H., 139, 140, 294, 313, 345.
Vinycomb, T. B., 0.
Viscosity, 317.
of Solids, 322.
Voice, 194.
Vortex Sounds, 175, 205.
Vowel Sounds, 190.
Wachsmuth, 208.
Waetzmann, 184, 304, 408.
Walser, 422.
Warburg, 241, 255.
Warren, G. W'., 457.
Water Noise, 335, 411.
Watson, 277, 485, 487, 490.
Wave-filters, 347, 457.
-length, Measurement of, 237, 240,
254, 200, 295, 453.
-motion, 47.
of Finite Amplitude, 263.
Condensation, 208.
Transmission, 340.
Weber-Fechner Law, 4, 352.
Webster, A. G., 174, 224, 450.
Webster Phonometer, 211, 435.

INDEX 5i9
Wegel, R. L., 353, 388.
Wehnelt Interrupter, 47, 77.
Weinberg, 357, 365.
Weisbach, F., 325.
Wente, E. C, 204, 395, 497.
Wente's Condenser Microphone, 155,
395, 398, 424, 441.
Wertheim, 174, 250, 254.
Wertheimer, 362.
West, G. D., 243.
Wheatstone, 196.
Kaleidophone, 24, 114.
Revolving Mirror, 200, 226.
Whipple, F. J. W., 334.
Whispering Galleries, 284.
Whitaker,A., 156, 491.
White, G. W., 99.
Wien, M., 436.
Williams, C. E. W., 146.
Williams, H. B., 106, 444.
Williams, S. R., 139, 394.
Williams, S. T., 491.
Willis, 196.
Wind Refraction, 213, 290, 332.
Wire Interrupters, 76.
Witkowski, 231.
Wolfenden, 102.
Wolf Note, 99.
Wood, A. B., 124, 127, 129, 131, 146,
223, 246, 296, 314, 419, 446,
447, 449, 478, 480.
Wood, R. W., 151, 260, 281, 284, 343,
431, 434.
Yielding of Supports of String, 91
.
Young, F. B., 153, 296, 314, 352, 419,
455.
Young's Law, 95, 104.
Zobel, 457.
Zone Plates, 308, 312, 420.
Zones of Silence, 333.


QC225.W6MUSIC
wood , A3
B5002 °°259 6109
A textbook of sound : being an account o
139606
music LmAftt?
QC
225¥6