A Sustainability-Based Risk Assessment for P3 Projects Using ...
22
Citation: Bakhtawar, B.; Thaheem, M.J.; Arshad, H.; Tariq, S.; Mazher, K.M.; Zayed, T.; Akhtar, N. A Sustainability-Based Risk Assessment for P3 Projects Using a Simulation Approach. Sustainability 2022, 14, 344. https://doi.org/10.3390/su14010344 Academic Editor: António Abreu Received: 21 October 2021 Accepted: 25 December 2021 Published: 29 December 2021 Publisher’s Note: MDPI stays neutral with regard to jurisdictional claims in published maps and institutional affil- iations. Copyright: © 2021 by the authors. Licensee MDPI, Basel, Switzerland. This article is an open access article distributed under the terms and conditions of the Creative Commons Attribution (CC BY) license (https:// creativecommons.org/licenses/by/ 4.0/). sustainability Article A Sustainability-Based Risk Assessment for P3 Projects Using a Simulation Approach Beenish Bakhtawar 1 , Muhammad Jamaluddin Thaheem 2, * , Husnain Arshad 1 , Salman Tariq 1 , Khwaja Mateen Mazher 3 , Tarek Zayed 1 and Naheed Akhtar 4 1 Department of Building and Real Estate, The Hong Kong Polytechnic University, Hung Hom, Hong Kong; [email protected] (B.B.); [email protected] (H.A.); [email protected] (S.T.); [email protected] (T.Z.) 2 Geelong Waterfront Campus, School of Architecture and Built Environment, Deakin University, Locked Bag 20001, Geelong, VIC 3220, Australia 3 Department of Construction Engineering and Management, King Fahd University of Petroleum and Minerals, Dhahran 31261, Saudi Arabia; [email protected] 4 Department of Civil Engineering, Abasyn University, Islamabad 44000, Pakistan; [email protected] * Correspondence: [email protected] Abstract: Integrating sustainability in the risk management process is an emergent problem, es- pecially for efficient infrastructure delivery. For the case of complex projects like public–private partnerships (P3), traditional management practices offer a limited capacity to address long-ranging risk impacts on the social, economic, and environmental fabric within and around the project bound- aries. Although P3 projects are objective-based contracts, present risk models rarely delineate risk impacts on focused project objectives. The relevant studies are very scarce creating a limited under- standing of available approaches to conducting sustainability-based risk management for P3 projects. As risk and sustainability are two inherently subjective concepts with multiple interpretations, their combined assessment within a single framework demands a pragmatic approach. Therefore, the current study presents a model for conducting a sustainability-based risk assessment of P3 infras- tructure projects through global data. Monte Carlo simulation is employed to further define the probabilistic risk ranges and risk ranks over relevant triple-bottom-line-based sustainability indicators for highway sector P3 projects. Findings are further demonstrated through two highway case studies and relevant mitigation strategies are also suggested. In the end, an implementation framework and future recommendations for the application of study findings on actual projects are also suggested. The study has useful implications for practitioners and researchers alike aiming for the delivery of sustainable complex projects. Keywords: public–private partnership; sustainability; risk assessment; infrastructure; Monte Carlo; highways 1. Introduction The public–private partnership (P3) provides an alternative procurement approach to deliver infrastructure projects of national importance. P3s have been embraced by both developed and developing economies owing to their flexible payment mechanism, access to private capital, and innovative financial models [1]. In a typical P3, both public and private sectors bring their complementary skills to reach a common goal i.e., project success. However, this is based on proactive project risk management (PRM) to achieve long-term project success [2]. The role of risk assessment in the long-term success of infrastructure P3s has become more important after the announcement of UN Sustainable Development Goals (2015) which encouraged the implementation of “effective public, public–private, and civil society partnerships” to “share knowledge, expertise, technology, and financial resources”. Sustainability 2022, 14, 344. https://doi.org/10.3390/su14010344 https://www.mdpi.com/journal/sustainability
-
Upload
khangminh22 -
Category
Documents
-
view
2 -
download
0
Transcript of A Sustainability-Based Risk Assessment for P3 Projects Using ...

�����������������
Citation: Bakhtawar, B.; Thaheem,
M.J.; Arshad, H.; Tariq, S.; Mazher,
K.M.; Zayed, T.; Akhtar, N. A
Sustainability-Based Risk Assessment
for P3 Projects Using a Simulation
Approach. Sustainability 2022, 14, 344.
https://doi.org/10.3390/su14010344
Academic Editor: António Abreu
Received: 21 October 2021
Accepted: 25 December 2021
Published: 29 December 2021
Publisher’s Note: MDPI stays neutral
with regard to jurisdictional claims in
published maps and institutional affil-
iations.
Copyright: © 2021 by the authors.
Licensee MDPI, Basel, Switzerland.
This article is an open access article
distributed under the terms and
conditions of the Creative Commons
Attribution (CC BY) license (https://
creativecommons.org/licenses/by/
4.0/).
sustainability
Article
A Sustainability-Based Risk Assessment for P3 Projects Using aSimulation ApproachBeenish Bakhtawar 1, Muhammad Jamaluddin Thaheem 2,* , Husnain Arshad 1, Salman Tariq 1 ,Khwaja Mateen Mazher 3, Tarek Zayed 1 and Naheed Akhtar 4
1 Department of Building and Real Estate, The Hong Kong Polytechnic University, Hung Hom, Hong Kong;[email protected] (B.B.); [email protected] (H.A.);[email protected] (S.T.); [email protected] (T.Z.)
2 Geelong Waterfront Campus, School of Architecture and Built Environment, Deakin University,Locked Bag 20001, Geelong, VIC 3220, Australia
3 Department of Construction Engineering and Management, King Fahd University of Petroleum and Minerals,Dhahran 31261, Saudi Arabia; [email protected]
4 Department of Civil Engineering, Abasyn University, Islamabad 44000, Pakistan;[email protected]
* Correspondence: [email protected]
Abstract: Integrating sustainability in the risk management process is an emergent problem, es-pecially for efficient infrastructure delivery. For the case of complex projects like public–privatepartnerships (P3), traditional management practices offer a limited capacity to address long-rangingrisk impacts on the social, economic, and environmental fabric within and around the project bound-aries. Although P3 projects are objective-based contracts, present risk models rarely delineate riskimpacts on focused project objectives. The relevant studies are very scarce creating a limited under-standing of available approaches to conducting sustainability-based risk management for P3 projects.As risk and sustainability are two inherently subjective concepts with multiple interpretations, theircombined assessment within a single framework demands a pragmatic approach. Therefore, thecurrent study presents a model for conducting a sustainability-based risk assessment of P3 infras-tructure projects through global data. Monte Carlo simulation is employed to further define theprobabilistic risk ranges and risk ranks over relevant triple-bottom-line-based sustainability indicatorsfor highway sector P3 projects. Findings are further demonstrated through two highway case studiesand relevant mitigation strategies are also suggested. In the end, an implementation framework andfuture recommendations for the application of study findings on actual projects are also suggested.The study has useful implications for practitioners and researchers alike aiming for the delivery ofsustainable complex projects.
Keywords: public–private partnership; sustainability; risk assessment; infrastructure; MonteCarlo; highways
1. Introduction
The public–private partnership (P3) provides an alternative procurement approach todeliver infrastructure projects of national importance. P3s have been embraced by bothdeveloped and developing economies owing to their flexible payment mechanism, accessto private capital, and innovative financial models [1]. In a typical P3, both public andprivate sectors bring their complementary skills to reach a common goal i.e., project success.However, this is based on proactive project risk management (PRM) to achieve long-termproject success [2]. The role of risk assessment in the long-term success of infrastructure P3shas become more important after the announcement of UN Sustainable Development Goals(2015) which encouraged the implementation of “effective public, public–private, and civilsociety partnerships” to “share knowledge, expertise, technology, and financial resources”.
Sustainability 2022, 14, 344. https://doi.org/10.3390/su14010344 https://www.mdpi.com/journal/sustainability
Sustainability 2022, 14, 344 2 of 22
Even though the UN acknowledged the significance of P3s in sustainable development,practitioners and researchers struggle to integrate sustainability concepts in the P3 riskassessment process [3].
This is important because the inherent complex P3 structure and augmented projectboundaries expose them to a multi-layer risk system demanding comprehensive assessmentover the lengthy P3 project life [4]. Moreover, P3 is a multi-stakeholder complex proneto adversarial relationships due to the conflicting goals of each party [5]. In this scenario,the risk impacts within these projects are long-ranging, unpredictable, and interrelatedrendering traditional risk management practices following a short- or medium-term ap-proach largely futile and incompatible with the P3 structure. Studies addressing P3 riskmanagement majorly focus on the effect of threats to project success envisioned in termsof iron-triangle project controls (time, cost, and quality) [6]. Moreover, in these studies,the project objectives and success criteria against which risks are measured are mostlyill-defined, offering only an ambiguous description and referring to iron-triangle controlsonly implicitly [7]. This ambiguity creates a major limitation in present project risk manage-ment (PRM) frameworks to clearly interpret the nature and expression of risk in P3 projectstranslating into failure in sustainable project delivery. Specifically, deficiencies such as poorrisk identification, ambiguous risk assessment, misplaced risk allocation, and insufficientmitigation plans make these projects highly sensitive and prone to failure [8]. Owing to thestrong demand for the delivery of sustainable P3s, a more robust and comprehensive riskassessment system is required [9].
The existing studies on risks in sustainable P3s are scarce and focused only on theassessment of ‘sustainability risks’ i.e., the environmental and social risks [10,11]. But thatis not enough to cater to the complex nature of P3 projects which demand a deeper insightinto the synergies between risk, sustainability, and P3 [12,13]. Risk and sustainability aretwo of the most widely interpreted concepts whose inherent epistemological and executionincompatibilities make it difficult to develop a convergent construct for integrated assess-ment. Thus, to make the case for developing a sustainability-oriented risk assessment, acertain level of pragmatism must be adopted drawing on practical interpretations of bothrisk and sustainability for project success. A major constraint for sustainability-oriented riskassessment is that presently the project and sustainability performances are assessed sepa-rately. To address this issue, sustainability must be brought under the project managementumbrella. In a notable work, Silvius and Schipper [14] conceptualized this integration assustainable project management and defined it as “planning, monitoring and controlling ofproject delivery and support processes, with consideration of the environmental, economicand social aspects of the life-cycle of the project’s resources, processes, deliverables, andeffects, aimed at realizing benefits for stakeholders, and performed in a transparent, fairand ethical way that includes proactive stakeholder participation”. Thus, it is apparent thatthe practical application of sustainability involves interrelated project and process levels.Furthermore, risk identification and management are suggested as a major area of potentialsustainability impact in project management. In this regard, relevant studies make the fol-lowing recommendations: (1) Extension of risk identification to include environmental andsocial risks, (2) Reorientation of risk management towards sustainability, and (3) Inclusionof sustainability stakeholders in decision-making [9,15–19].
Some studies attempt to conduct a sustainability-oriented risk assessment for infras-tructure projects. For example, Diaz-Sarachaga et al. [20] proposed a sustainable riskassessment plan for the sustainable delivery of road infrastructure projects. Shahriaret al. [21] and Wang et al. [13] adopted graphical risk assessment techniques to profileconsequences on the triple bottom line of sustainability. Qazi et al. [22] used the MonteCarlo approach for probabilistic risk assessment for environmental risks. These studiesadopted useful approaches but either only studied risk relationships or focused on theassessment of sustainability risks. They did not focus on integrating sustainability inthe risk management process. Based on this gap, the current study develops a detailedmethodology for sustainability-based risk assessment of P3 projects. The methodology

Sustainability 2022, 14, 344 3 of 22
involves: (1) linking P3 risks and sustainability indicators through impact matrix, (2) eval-uating probabilistic risk indices using a Monte Carlo approach, (3) testing the practicalimplementation of the methodology on two real case studies from the highway sector, and(4) suggesting mitigation strategies for real case risks and implementation framework forstudy findings.
2. Integrating Risk and Sustainability for P3 Delivery
Various authors have acknowledged the P3 model for its potential to foster sustainabledevelopment [3]. Content analysis of sustainability-related research in P3 projects, in theperspective of construction management, reveals three potential areas for integration ofsustainability-related criteria in decision-making: policy, process, and product. At thepolicy level, sustainability-related outcomes act as an ideological cover for the P3 strategy.In this regard, legislative, regulatory, and procedural instruments are deployed by govern-ments to create a favorable environment for sustainable P3 delivery [23]. This ultimatelypaves way for product-level sustainability integration. Some studies have addressed aproduct-level sustainability integration: the use of the P3 model for delivery of social in-frastructure [24] and environment-friendly projects [25]. However, the P3 implementationframework rarely endorses a sustainability agenda creating a gap for process-level inte-gration. To make the P3 development processes sustainable, a whole life-cycle perspectiveis required. The decision-making in P3 projects mainly includes consideration of projectviability, feasibility, risk, contracts, stakeholder, and project management. Multiple studieshave focused on the development of sustainable practices for P3 project delivery [26–28]suggesting the incorporation of sustainability considerations in various P3 life-cycle phasesto improve sustainability performance. However, the focus has been limited to incentiviz-ing sustainability through the inclusion of sustainability-related bidding criteria, adoptingflexible contract approaches, effective negotiation, and stakeholder satisfaction [29]. Littleattention has been given to explicitly addressing sustainability-related objectives duringproject planning. In this regard, consideration of life-cycle critical success factors, theinclusion of life-cycle cost during financial evaluation, use of advanced technologies forP3 life-cycle performance evaluation, life-cycle risk management, and stakeholder engage-ment are some of the areas of incorporation currently explored [7,30]. Despite a plethoraof sustainability-related frameworks, one major missing link is the unexplored relationbetween risk and sustainability. Several studies propose a focused risk assessment asa solution to sustainability challenges [9,16,17,19,21]. As P3 projects are structured in along-term contract, orienting risk assessment towards sustainability is beneficial for effec-tive assessment. Adopting a life-cycle perspective facilitates considerations of changingproject dynamics in the risk management process essential to reach optimal risk allocationsolutions [7]. Otherwise, long-ranging environmental and social risks remain unaddressedimpairing sustainability [31].
Sustainability and risk are two multi-dimensional concepts open to subjectivity asper the context of the application. Although there are many definitions of risk, The ISO31,000 defines risk in any PRM as the effect of uncertainty on project objectives. Theproject management institute (PMI) further explains risk as a probable uncertain eventor a condition which upon occurrence can affect one or more project objectives, nega-tively or positively [32]. Though there are other definitions of risk in the literature, wetake a project view of risk where it is a measurable uncertainty potentially affecting theoutcomes of a project. In construction and infrastructure projects, risk and sustainabilityare usually seen as two contrasting or complementing concepts which may or may notaffect each other [33,34]. However, in a generic perspective, their relationship has long beenestablished [35]. Traditional risk assessment approaches consider short- to medium-termdisturbances affecting time, cost, and quality. The focus on only these objectives can com-promise the sustainability objectives of the project. From the sustainability perspective,risks have a higher level of uncertainty, and point-based risk assessment using traditionalrisk matrices may not offer sufficient decision-making support to P3 practitioners. On

Sustainability 2022, 14, 344 4 of 22
the other hand, sustainability assessment mostly follows a triple-bottom-line frameworkusing the concepts of longevity and security aiming at assessing long-term impacts over theproject life. Moreover, sustainability is focused on project objectives while risk assessmentis focused on minimizing the probability of threats to project objectives or probability offailure [36]. These complementary features help develop a pragmatic framework for ajoint assessment. A major constraint for sustainability-oriented risk assessment, however,is that presently the project and sustainability performances are assessed separately inconstruction and infrastructure projects. This division of labor deprives the assessmentof the necessary sophistication to understand and act upon the complex outcomes. Toaddress this issue, sustainability must be brought under the project management umbrella.In a notable work, Silvius and Schipper [14] conceptualized this integration as sustainableproject management, defined as “planning, monitoring, and controlling of project deliveryand support processes, with consideration of the environmental, economic and socialaspects of the life-cycle of the project’s resources, processes, deliverables and effects, aimedat realizing benefits for stakeholders, and performed in a transparent, fair and ethical waythat includes proactive stakeholder participation”. For this purpose, sustainability can bedefined per the triple-bottom-line (TBL) framework which can be further broken downinto indicator groups and sub-groups forming a mix of qualitative and quantitative indica-tors [37]. Using these synergies, a focused risk assessment can be performed by assessingthe vulnerability of sustainability indicators towards the risk nucleus of P3 projects. This is ascarcely explored yet useful approach to uncover the sustainability consequences of projectrisks. Shahriar et al. [21] analyzed risk using graphical risk assessment techniques to profileconsequences on triple-bottom-line sustainability areas. Diaz-Sarachaga, Jato-Espino, andCastro-Fresno [20] developed a rating system for sustainable road infrastructure projects.In the framework, a sustainable risk management (SRM) plan has been identified as one ofthe important criteria for assessing managerial requirements for the sustainable assessmentof road infrastructure projects. Such a framework is developed for aligning project devel-opment and implementation with the sustainability goals and criteria [38]. However, thesestudies only explore risk relationships or managerial suggestions. To prioritize P3 risks forsustainability, analytical or metric based assessment needs to be carried out.
Existing literature on risk assessment in P3 projects is either context-oriented ormethodology-oriented. The context-oriented studies focus on exploring the effect of riskthrough varying contextual dynamics. The country of project execution, type of projectbeing delivered, characteristics, procurement method, and life cycle phases [7] are someof the relevant variables explored in these studies. Additionally, exploring the effect andperception of risk on various other contract design constraints, for example, concessionperiod, NPV [39], and contract timing, is an important area of study in P3 literature. Onthe other hand, the methodology-oriented studies focus on improving the ranking of risksthrough the application of modeling and simulation techniques. These include but are notlimited to fuzzy-logic [40,41] game theory [42], artificial neural networks [43], neuro-fuzzytechniques [44,45], IRMS [46], and fuzzy-AHP [47]. However, these studies are focusedon improving the precision of the risk analysis process, i.e., achieving greater precisionin risk measurement. There is limited research related to P3 risk management focused onanalyzing risk for developing sustainable P3 projects. Furthermore, the use of advancedmodeling and simulation approaches has lower practicality in terms of industry adoption.Hence, a compatible approach with existing industry practices needs to be explored. In thisregard, Qazi et al. [22] used a Monte Carlo based risk assessment for sustainability risksin construction projects. This approach helps in developing the stochastic risk ranges forthe project incorporating the uncertainty of project associated risks and prioritizing criticalrisks according to practitioners’ risk appetite. This approach has high compatibility withthe existing risk matrix-based assessment which is the main attraction of the process.
The current study uses a similar approach for risk prioritization of P3 projects linkingP3 risks with sustainability indicators through process integration. Overall, a process-based approach is adopted for conducting a sustainability-based risk assessment for P3

Sustainability 2022, 14, 344 5 of 22
projects. In this regard, sustainability considerations are included in every phase of thePRM. For the development of methodology, multiple relevant studies surrounding theintegration of risk and sustainability were considered [9,12,19,48–50]. In the developedapproach, expert opinion has also been taken into account through a rigorous survey ofexperts, which conforms with the multi-criteria decision-making approach (MCDM) usedfor triple-bottom-line sustainability assessment in projects [51]. The approach can be usedin the early decision stages of the project life of complex projects like P3 which are basedon long-term contracts. These projects face many risks and have a direct impact on thecountry’s economy. Therefore, the developed approach can help choose between variousproject alternatives available, and also aid in identifying proactive management approachesfor risks [36,52].
3. Selection of Sustainability Indicators and P3 Risk Factors
A detailed systematic literature review for the identification of P3 risks and sustain-ability indicator groups was conducted, as explained in this section. A systematic reviewof P3 literature published during the period 2000–2020 was carried out to develop theliterature-based process level framework for risk-sustainability integration. Articles wereextracted from different indexing databases such as Web of Science (WoS) and Scopus, andpublishers like Taylor and Francis, ASCE and Elsevier, using keywords “public-privatepartnership”, “P3”, “BOT”, “DBFM”, “TOT”, “BOO”, and “P3”. The systematic screeningof relevant articles is shown in Figure 1.
Sustainability 2022, 14, x FOR PEER REVIEW 5 of 23
The current study uses a similar approach for risk prioritization of P3 projects linking P3 risks with sustainability indicators through process integration. Overall, a process-based approach is adopted for conducting a sustainability-based risk assessment for P3 projects. In this regard, sustainability considerations are included in every phase of the PRM. For the development of methodology, multiple relevant studies surrounding the integration of risk and sustainability were considered [9,12,19,48–50]. In the developed approach, expert opinion has also been taken into account through a rigorous survey of experts, which conforms with the multi-criteria decision-making approach (MCDM) used for triple-bottom-line sustainability assessment in projects [51]. The approach can be used in the early decision stages of the project life of complex projects like P3 which are based on long-term contracts. These projects face many risks and have a direct impact on the country’s economy. Therefore, the developed approach can help choose between various project alternatives available, and also aid in identifying proactive management ap-proaches for risks [36,52].
3. Selection of Sustainability Indicators and P3 Risk Factors A detailed systematic literature review for the identification of P3 risks and sustain-
ability indicator groups was conducted, as explained in this section. A systematic review of P3 literature published during the period 2000–2020 was carried out to develop the literature-based process level framework for risk-sustainability integration. Articles were extracted from different indexing databases such as Web of Science (WoS) and Scopus, and publishers like Taylor and Francis, ASCE and Elsevier, using keywords “public-pri-vate partnership”, “P3”, “BOT”, “DBFM”, “TOT”, “BOO”, and “P3”. The systematic screening of relevant articles is shown in Figure 1.
Figure 1. Process map of systematic literature review.
For these articles, a thematic analysis revealed several research themes from which journal articles directly contributing to the domains of ‘sustainability in P3 projects’ and ‘PRM for P3 projects’ were selected. As the crossover research for sustainability and risk
Figure 1. Process map of systematic literature review.
For these articles, a thematic analysis revealed several research themes from whichjournal articles directly contributing to the domains of ‘sustainability in P3 projects’ and‘PRM for P3 projects’ were selected. As the crossover research for sustainability and riskmanagement for P3 projects is still evolving, the 23 articles on ‘sustainability in P3 projects’were used to select the sustainability indicators for assessment, whereas the 152 articlesidentified for ‘PRM for P3 projects’ were further screened to include articles contributing tothe development of P3 risk taxonomy.

Sustainability 2022, 14, 344 6 of 22
3.1. Sustainability Hierarchy
The current study uses the triple-bottom-line (TBL) of sustainability which repre-sents a combination of indicator groups and sub-groups of qualitative and quantitativenature [37,53]. These indicators can be used to perform a focused risk assessment by assess-ing the vulnerability of sustainability indicators towards the risk nucleus of P3 projects. Inrelevance to road projects, various studies proposed the traditional TBL breakdown for thesustainability assessment of P3 projects [31,54]. In the existing literature, the sustainabilityindicators for TBL tend to focus on procurement, planning, or design [28,31]. However, nosingle study has offered a clear, standardized, and global set of indicators for sustainabilityassessment at a holistic and overall project performance assessment level. The use of astandard and global set of indicators, covering a comprehensive range of impacts, is morehelpful for decision-making. As in the case of P3, the indicators should be enforceable atthe policy level as well. Thus, relevant literature was reviewed to select indicators in eachsustainability area, as shown in Table 1.
Table 1. Triple-bottom-line sustainability indicators.
Sustainability Area Code Indicators
Financial Sustainability (FS)I1 Initial cost
I2 Life-cycle cost
Social Sustainability (SS)
I3 Socio-economic repercussions
I4 Health and safety
I5 Cultural heritage
I6 Governance
I7 Human rights
Environmental Sustainability (ES)
I8 Resource damage
I9 Ecosystem damage
I10 Human health
Within these indicator groups, inventory level indicators can be specified varying fromproject to project. As the aim of the study is to help decision-makers initiate the integrationof sustainability into the PRM framework, technical level inventory indicators have not beenused but can be assessed in future studies. For environmental sustainability, Goedkoop,et al. [55] have proposed human health damage, ecosystem damage, and resource damageas environmental indicators, which further contain a detailed variety of impacts [56]. Forsocial sustainability, UNEP/SETAC guidelines and methodological sheets have been usedfor the selection of impact categories [57]. These categories are stakeholder-based. For thisstudy, five impact categories are selected as shown in Figure 2. This is in line with Ahmadand Thaheem [58]. For financial sustainability, literature establishes the initial capital andlife-cycle costs as two main indicators [59]. These are directly related to the functions of NetPresent Value (NPV) and Internal Rate of Return (IRR), which are used for an economicevaluation of P3 projects [60,61]. Therefore, this study used initial and life-cycle costs asfinancial sustainability indicators.

Sustainability 2022, 14, 344 7 of 22
Sustainability 2022, 14, x FOR PEER REVIEW 7 of 23
Similar factors were merged into representative categories and sub-categories, consisting of 70 unique global risk factors. A detailed taxonomy of these factors is shown in Table S1. To synthesize the risk factors for assessment, 20 risk factors (R) were shortlisted for further analysis from 70 unique factors based on a higher relative literature score as shown in Figure 2. This literature score was calculated based on both quantitative and qualitative assessments through Equation (1) [62,63] LiteratureScore QualitativeScore QuantitativeScore (1)
For quantitative assessment, the frequency of occurrence (f) of a certain risk factor was noted at first. The factors were then qualitatively analyzed for their impact over a range of low (1), medium (3), or high (5) scales through a full-text content analysis of the journal articles. The articles were thoroughly scrutinized to explore the contextual signif-icance of the risk factors. Finally, the two scores were combined to form a literature score as per Equation (2) [62,64]. LS QualitativeScorex( Frequencyofrisk(f)Totalfrequency xHighestScore) (2)
Cumulating the literature score, the risk factors contributing to over 50% of the over-all literature score were shortlisted.
Figure 2. Shortlisted P3 risks.
As shown in Figure 2, 20 risk factors (R) were shortlisted for further analysis based on the values of LS determined through Equation (2). Please note that in the taxonomy, each risk factor is shown with notation Risk Name (QS, CS, and Rank) representing its name along with qualitative score (QS), cumulative score (CS), and assigned rank. The description of all the shortlisted risks is provided in Table S2.
4. Research Methodology To conduct a sustainability-based risk assessment, the study followed a three-phase
process as shown in Figure 3. At first, a ‘study concept’ is developed based on a prelimi-nary literature review. Based on this, three phases of project risk management are high-lighted for the incorporation of sustainability considerations. These phases are labeled as A, B, and C and later explained in Section 4.1. The methodology corresponding to each phase is subsequently labeled as ‘research methodology’ in the figure and explained in Section 4.2.
Figure 2. Shortlisted P3 risks.
3.2. Critical Risks of P3
Studies published between the years 2000 to 2020 were identified through rigorouscontent analysis for identifying risks relevant to P3 infrastructure projects. For the litera-ture review synthesis, 134 risk factors were recognized initially from 44 relevant studies.Similar factors were merged into representative categories and sub-categories, consistingof 70 unique global risk factors. A detailed taxonomy of these factors is shown in Table S1.To synthesize the risk factors for assessment, 20 risk factors (R) were shortlisted for furtheranalysis from 70 unique factors based on a higher relative literature score as shown inFigure 2. This literature score was calculated based on both quantitative and qualitativeassessments through Equation (1) [62,63]
Literature Score = Qualitative Score × Quantitative Score (1)
For quantitative assessment, the frequency of occurrence (f) of a certain risk factor wasnoted at first. The factors were then qualitatively analyzed for their impact over a range oflow (1), medium (3), or high (5) scales through a full-text content analysis of the journalarticles. The articles were thoroughly scrutinized to explore the contextual significanceof the risk factors. Finally, the two scores were combined to form a literature score as perEquation (2) [62,64].
LS = Qualitative Score ×(
Frequency of risk (f)Total frequency × Highest Score
)(2)
Cumulating the literature score, the risk factors contributing to over 50% of the overallliterature score were shortlisted.
As shown in Figure 2, 20 risk factors (R) were shortlisted for further analysis basedon the values of LS determined through Equation (2). Please note that in the taxonomy,each risk factor is shown with notation Risk Name (QS, CS, and Rank) representing itsname along with qualitative score (QS), cumulative score (CS), and assigned rank. Thedescription of all the shortlisted risks is provided in Table S2.
4. Research Methodology
To conduct a sustainability-based risk assessment, the study followed a three-phaseprocess as shown in Figure 3. At first, a ‘study concept’ is developed based on a preliminaryliterature review. Based on this, three phases of project risk management are highlightedfor the incorporation of sustainability considerations. These phases are labeled as A, B,

Sustainability 2022, 14, 344 8 of 22
and C and later explained in Section 4.1. The methodology corresponding to each phase issubsequently labeled as ‘research methodology’ in the figure and explained in Section 4.2.
Sustainability 2022, 14, x FOR PEER REVIEW 8 of 23
Figure 3. Research Methodology.
4.1. Sustainability-Based Risk Assessment Methodology First, a systematic review of published literature was performed to identify P3 risks,
called critical risk factors (CRFs) and suitable sustainability indicator groups explained in Sections 3.1 and 3.2, respectively. Further, an impact matrix is developed to highlight sig-nificant risk–sustainability relationships (R S )through structured interviews. Then, the probability (Pi) and impact (Ij) of the risk factors are estimated through expert opinion through an international questionnaire survey. The survey results are then modeled using the Monte Carlo simulation (MCS) method and identified probabilistic risk ranges. By using multi-step regression analysis, risk weightings of all sustainability indicators are measured. The findings of the study are finally validated through real-life case studies and mitigation strategies are developed for CRFs using semi-structured interviews. De-tails of the methods adopted for the research outcomes have been fully explained in Sec-tion 4.2.
4.2. Data Collection The data collection has four main parts: (i) structured interviews for shortlisting risk-
sustainability relationships, (ii) an international survey for conducting a probability-im-pact assessment of risks, (iii) semi-structured interviews for devising risk mitigation strat-egies and rating of risks, and (iv) contextualizing and validating the findings through pro-ject case studies.
4.2.1. Structured Interviews To shortlist the significant relationships between individual impact categories (SI1–
SI10) and risk factors (R1–R20), structured interviews were conducted. For this purpose, a qualitative impact matrix of 20 × 20, consisting of 200 possible relationships was formu-lated. A focus group of five professionals from academia, having a relevant background to the study, was selected. The demographics of the respondents for the focus group study are shown in Table 2 which increases the credibility of these findings since both academic
Figure 3. Research Methodology.
4.1. Sustainability-Based Risk Assessment Methodology
First, a systematic review of published literature was performed to identify P3 risks,called critical risk factors (CRFs) and suitable sustainability indicator groups explainedin Sections 3.1 and 3.2, respectively. Further, an impact matrix is developed to highlightsignificant risk–sustainability relationships (RnSx) through structured interviews. Then,the probability (Pi) and impact (Ij) of the risk factors are estimated through expert opinionthrough an international questionnaire survey. The survey results are then modeled usingthe Monte Carlo simulation (MCS) method and identified probabilistic risk ranges. Byusing multi-step regression analysis, risk weightings of all sustainability indicators aremeasured. The findings of the study are finally validated through real-life case studies andmitigation strategies are developed for CRFs using semi-structured interviews. Details ofthe methods adopted for the research outcomes have been fully explained in Section 4.2.
4.2. Data Collection
The data collection has four main parts: (i) structured interviews for shortlisting risk-sustainability relationships, (ii) an international survey for conducting a probability-impactassessment of risks, (iii) semi-structured interviews for devising risk mitigation strategiesand rating of risks, and (iv) contextualizing and validating the findings through projectcase studies.
4.2.1. Structured Interviews
To shortlist the significant relationships between individual impact categories (SI1–SI10)and risk factors (R1–R20), structured interviews were conducted. For this purpose, aqualitative impact matrix of 20× 20, consisting of 200 possible relationships was formulated.A focus group of five professionals from academia, having a relevant background to thestudy, was selected. The demographics of the respondents for the focus group study are

Sustainability 2022, 14, 344 9 of 22
shown in Table 2 which increases the credibility of these findings since both academic andindustry domains are represented by substantially qualified and experienced professionals.
Table 2. Interviewee Details.
Sr. No. Degree Relevant Experience Area of Expertise Country Background
1 PhD 6 years SustainabilityAssessment Pakistan Academia
2 PhD 12 yearsSustainabilityAssessment/Roads/P3s
Pakistan Academia
3 MS 8 yearsRisk
Management/Roads/P3s
Pakistan Industry
4 PhD 9 years P3s/Risk Management Pakistan Academia
5 MS 28 years P3s/Roads/Risk Management Pakistan Industry
Each of the respondents was asked to rate the impact of each risk on individual sustainability indicators on a5-point Likert scale (1—Very Low, 2—Low, 3—Medium, 4—High, and 5—Very High). All the relationships, havinggreater than two impact levels were considered significant. Based on this method, 68 significant relationshipswere identified.
4.2.2. Questionnaire Survey
To conduct a probability-impact assessment on the shortlisted 68 relationships, aninternational online survey was conducted using Google Forms. Adopting this methodhelps reduce response bias of social desirability, extreme opinion, and demand character-istics of being involved in a survey [65]. Following the snowballing technique [66], over1500 experts from industry and academia were approached via emails and online socialand professional networks. This helped ensure a random sample to prevent any samplingbias. The respondents were asked to rate the probability of occurrence of each risk-indicatorrelationship in the format shown in Figure 4. To control the contextual interpretation of theposed questions based on the predisposition and perception of the respondents [67], eachquestion was supplemented with relevant details to maintain coherence and reduce anyresponse bias.
Sustainability 2022, 14, x FOR PEER REVIEW 9 of 23
and industry domains are represented by substantially qualified and experienced profes-sionals.
Table 2. Interviewee Details.
Sr. No. Degree Relevant Experience Area of Expertise Country Background
1 PhD 6 years Sustainability Assessment Pakistan Academia
2 PhD 12 years Sustainability Assessment /Roads/P3s
Pakistan Academia
3 MS 8 years Risk Management/Roads /P3s
Pakistan Industry
4 PhD 9 years P3s/Risk Management Pakistan Academia
5 MS 28 years P3s/Roads/
Risk Management Pakistan Industry
Each of the respondents was asked to rate the impact of each risk on individual sus-tainability indicators on a 5-point Likert scale (1-Very Low, 2-Low, 3-Medium, 4-High, and 5-Very High). All the relationships, having greater than two impact levels were con-sidered significant. Based on this method, 68 significant relationships were identified.
4.2.2. Questionnaire Survey To conduct a probability-impact assessment on the shortlisted 68 relationships, an
international online survey was conducted using Google Forms. Adopting this method helps reduce response bias of social desirability, extreme opinion, and demand character-istics of being involved in a survey [65]. Following the snowballing technique [66], over 1500 experts from industry and academia were approached via emails and online social and professional networks. This helped ensure a random sample to prevent any sampling bias. The respondents were asked to rate the probability of occurrence of each risk-indi-cator relationship in the format shown in Figure 4. To control the contextual interpretation of the posed questions based on the predisposition and perception of the respondents [67], each question was supplemented with relevant details to maintain coherence and reduce any response bias.
Figure 4. Questionnaire Survey Format.
4.2.3. Semi-Structured Interviews Furthermore, relevant project experts with a minimum of ten years of experience
were interviewed regarding issues faced during project implementation and relevant risk mitigation strategies to overcome such issues for future projects. This was a lesson learned exercise giving useful insight into the on-ground reality of project execution. They were
Figure 4. Questionnaire Survey Format.
4.2.3. Semi-Structured Interviews
Furthermore, relevant project experts with a minimum of ten years of experiencewere interviewed regarding issues faced during project implementation and relevant riskmitigation strategies to overcome such issues for future projects. This was a lesson learnedexercise giving useful insight into the on-ground reality of project execution. They were alsoasked if they agreed with the model results, identified critical risks, rankings developed,and any other risk that they would like to suggest. Interviewees’ information is shownin Table 3.

Sustainability 2022, 14, 344 10 of 22
Table 3. Interviewee Demographics.
Sr. No. Relevant Experience (yrs.) RelevantOrganization
Designation inOrganization
1 16 Private Sector Manager P3 projects2 8 Private Sector Asst. Manager P3 projects3 15 Public Sector Director P34 28+ Public Sector General Manager P35 16 Public Sector Manager Planning6 10 Public Sector Deputy Director P3
4.2.4. Case Study Development
To demonstrate the model, two comparative case studies of P3 motorway projects wereidentified. The information of the case studies was collected through project documentssuch as feasibility reports, evaluation reports, risk registers, newspaper articles, and expertopinions. The projects are briefly described in Table 4.
Table 4. Project Case Data.
Project Name M2 (Lahore-Islamabad MotorwayOverlay and Modernization)
M11 (Construction of Lahore-SialkotMotorway)
Budget Approx. PKR 46 Billion Approx. PKR 44 Billion
The financial mix of the projectPKR 25.78 billion from debtPKR 11.05 billion and PKR 9.18 billionfrom toll during construction
PKR 12.6 billion from debt PKR 6.8 billionand PKR 1.4 billion from toll duringconstruction, and PKR 18 billion and PKR5 billion from Govt. of Pakistan (GOP)contribution and GOP loan respectively.
Financial Close December 2014 December 2015
Project Timeline
Construction period 3 years (including6 months financial close period),Operations period 17 years (including7 years debt repayment period)
Financial close period 6 months,Construction period 2.5 years, Operationsperiod 22 years (including 8 years debtrepayment period)
Length 367 Km 90 Km
Project Status In the operations phase since 2016 In the operations phase since 2020
Expected Financial Profit to Government NHA revenue share PKR 209Billion GOP taxes PKR 57 billion GOP taxes worth PKR 28.65 billion
Concessionaire
M/s Motorway Operation &Rehabilitation Engineering (Private)Limited—a subsidiary of M/s FrontierWorks Organization (FWO), Pakistan
M/s Motorway Overlay andRehabilitation Engineering Company(MORE)-a consortium of FWO, BinNadeem Associates (BNA), and ZeerukInternational
Concession Period 20 Years 20 Years
5. Development and Implementation of the Model
The model’s development and implementation have three parts. First, the possiblerelationships of risk factors and sustainability indicators are explored in Section 5.1. Af-terward, a probability-impact assessment is conducted for the significant relationships inSection 5.2. Finally, the model for sustainability-based risk assessment is presented andsimulation results are discussed in Section 5.3.
5.1. Impact Matrix for Significant Risk–Sustainability Relationships
Based on the rating through structured interviews, 68 significant relationships wereidentified as shown in Figure 5. It is difficult in P3 infrastructure projects to trace theimpact of a certain risk on relevant sustainability indicators. Therefore, the impact matrix

Sustainability 2022, 14, 344 11 of 22
helps decision-makers in reaching a less complicated strategy for further assessment ofselected risks. From the figure, it is apparent that life-cycle cost (I2), a financial sustainabil-ity indicator, shares a significant relationship with all the shortlisted risks. This impliesthat all significant risks directly or indirectly affect the life-cycle financial performance ofthe project. Similarly, socio-economic repercussions (I3), which is a social sustainabilityindicator, are affected by 15 significant risks. On the contrary, cultural heritage (I5), re-source damage (I8), and ecosystem damage (I9) show only one significant risk relationship.Notably, the number of risk–sustainability relationships provides an overall insight into theconsideration of relationships in the later stage of the analysis. For example, resettlementand rehabilitation risk (R6) is the only risk significantly impacting cultural heritage (I5) butit has a significant relationship with 5 out of 10 sustainability indicators. Thus, a detailedanalysis of these relationships is required to obtain a deeper insight into the complex risksystem for sustainability.
Sustainability 2022, 14, x FOR PEER REVIEW 11 of 23
5.1. Impact Matrix for Significant Risk–Sustainability Relationships Based on the rating through structured interviews, 68 significant relationships were
identified as shown in Figure 5. It is difficult in P3 infrastructure projects to trace the im-pact of a certain risk on relevant sustainability indicators. Therefore, the impact matrix helps decision-makers in reaching a less complicated strategy for further assessment of selected risks. From the figure, it is apparent that life-cycle cost (I2), a financial sustaina-bility indicator, shares a significant relationship with all the shortlisted risks. This implies that all significant risks directly or indirectly affect the life-cycle financial performance of the project. Similarly, socio-economic repercussions (I3), which is a social sustainability indicator, are affected by 15 significant risks. On the contrary, cultural heritage (I5), re-source damage (I8), and ecosystem damage (I9) show only one significant risk relation-ship. Notably, the number of risk–sustainability relationships provides an overall insight into the consideration of relationships in the later stage of the analysis. For example, re-settlement and rehabilitation risk (R6) is the only risk significantly impacting cultural her-itage (I5) but it has a significant relationship with 5 out of 10 sustainability indicators. Thus, a detailed analysis of these relationships is required to obtain a deeper insight into the complex risk system for sustainability.
Figure 5. Significant risk factor–sustainability relationships (Impact Matrix).
5.2. Sustainability-Based Risk Assessment Model Development The risk model was demonstrated using the interrelationships assessed from the im-
pact matrix. Model inputs and outputs were defined based on dependent and independ-ent variables, and their interrelationships. Each of the 68 probabilistic risk distributions of individual risk-sustainability indicator relationships was used as an independent input to the model. The developed generic statistical model is given in Equations (3) and (4) where R is the indicator risk index, P is the probability of risk impacting sustainability indi-cator, I is the impact of risk, and R is the risk index for total sustainability.
RiskIndexforanysustainabilityindicator R ∑ (P I )→ (3)
RiskIndexfortotalsustainability R ∑ R→ (4)
The model is based on the following assumptions and limitations: (1) All risks are threats, and all sustainability impacts are positive benefits and opportu-
nities. (2) All risks occur independently. (3) Data is not assumed to be normally distributed.
First, the risk index value for each relationship ( ) was obtained following the Vose [68] PI model for risk measurement. The risk index values were then normalized
Figure 5. Significant risk factor–sustainability relationships (Impact Matrix).
5.2. Sustainability-Based Risk Assessment Model Development
The risk model was demonstrated using the interrelationships assessed from the im-pact matrix. Model inputs and outputs were defined based on dependent and independentvariables, and their interrelationships. Each of the 68 probabilistic risk distributions ofindividual risk-sustainability indicator relationships was used as an independent input tothe model. The developed generic statistical model is given in Equations (3) and (4) whereRsi is the indicator risk index, Pri is the probability of risk impacting sustainability indicator,Iri is the impact of risk, and Rts is the risk index for total sustainability.
Risk Index for any sustainability indicator = Rsi = ∑i→n1 (Pri × Iri) (3)
Risk Index for total sustainability = Rts = ∑i→n1 Rsi (4)
The model is based on the following assumptions and limitations:
(1) All risks are threats, and all sustainability impacts are positive benefits and opportu-nities.
(2) All risks occur independently.(3) Data is not assumed to be normally distributed.
First, the risk index value for each relationship (RnSx) was obtained following theVose [68] PI model for risk measurement. The risk index values were then normalizedusing the divide-by-maximum (DBS) method [69]. To find the best-fit curve for each of therelationships assessed, distribution fitting was applied using the chi-squared statistic [70].MCS was then run using the mean values Rsi to assess the sensitivity of the indicators

Sustainability 2022, 14, 344 12 of 22
towards the risks. The analysis was run for 1 simulation and 5000 iterations using Latinhypercube sampling, which uses random stratified sampling [71]. MCS uses stepwisemultiple regression to rank each indicator based on their level of risk, the generalizedregression models for which are represented by Equations (5) and (6).
Risk on sustainability (Rts) = ∑ni→n rci × Rsi + ci (5)
Risk on sustainability indicators (Rsi) = ∑ni→n rci × ri + ci (6)
5.3. Probability-Impact Assessment
Using the shortlisted risk-sustainability relationships, a PI-based risk assessment wasconducted for which the data for the probability (P) and impact (I) of each relationship wascollected using the international survey which was further used for simulating risk impacts.
5.3.1. Statistical Characteristics of International Survey Data
A total of 150 valid responses were obtained against the required sample size of96 responses for a population size of 40,000+ with a sampling error of ±10% at 95% confi-dence [72]. The demographic information of respondents is shown in Figure 6. Figure 6ashows that consultants and project engineers represent the largest cohort of the respon-dents, and the three main stakeholders (consultant, client, and contractor) were sufficientlyinvolved in data collection as shown in Figure 6b. Furthermore, almost three-fourths of therespondents (72%) had a postgraduate qualification (Figure 6c) and almost half of them(48%) had a professional experience of over 10 years (Figure 6d). Lastly, all the majororganizational types, government, semi-government, and private, were significantly repre-sented by the respondents (Figure 6e), and almost three-fourths of them (74%) belonged tolower-middle-income countries (Figure 6f).
Sustainability 2022, 14, x FOR PEER REVIEW 12 of 23
using the divide-by-maximum (DBS) method [69]. To find the best-fit curve for each of the relationships assessed, distribution fitting was applied using the chi-squared statistic [70]. MCS was then run using the mean values R to assess the sensitivity of the indica-tors towards the risks. The analysis was run for 1 simulation and 5000 iterations using Latin hypercube sampling, which uses random stratified sampling [71]. MCS uses step-wise multiple regression to rank each indicator based on their level of risk, the generalized regression models for which are represented by Equations (5) and (6).
Riskonsustainability(R ) ∑ rc xR c→ (5)
Riskonsustainabilityindicators(R ) ∑ rc xri c→ (6)
5.3. Probability-Impact Assessment Using the shortlisted risk-sustainability relationships, a PI-based risk assessment was
conducted for which the data for the probability (P) and impact (I) of each relationship was collected using the international survey which was further used for simulating risk impacts.
5.3.1. Statistical Characteristics of International Survey Data A total of 150 valid responses were obtained against the required sample size of 96
responses for a population size of 40,000+ with a sampling error of ±10% at 95% confidence [72]. The demographic information of respondents is shown in Figure 6. Figure 6a shows that consultants and project engineers represent the largest cohort of the respondents, and the three main stakeholders (consultant, client, and contractor) were sufficiently involved in data collection as shown in Figure 6b. Furthermore, almost three-fourths of the re-spondents (72%) had a postgraduate qualification (Figure 6c) and almost half of them (48%) had a professional experience of over 10 years (Figure 6d). Lastly, all the major or-ganizational types, government, semi-government, and private, were significantly repre-sented by the respondents (Figure 6e), and almost three-fourths of them (74%) belonged to lower-middle-income countries (Figure 6f).
Figure 6. Respondent demographics.
(f) (e)
Figure 6. Respondent demographics.
For the international survey, several statistical methods were applied using SPSSStatistics 24 to test the validity of survey responses. The metrics of Cronbach’s Alpha (α)and corrected item-total correlation (CITC) were utilized to check the internal consistencyand reliability of the scale. In total, 136 relationships were tested for which values of α

Sustainability 2022, 14, 344 13 of 22
and CITC were in the ranges 0.513–0.912 and 0.7–0.956, respectively. Both these rangesare above the recommended limits; >0.5 for CITC and >0.7 for α [70]. Furthermore, therespondents belonged to three major groups based on income: lower-middle, upper-middle,and high-income as per World Bank classification. As the number of groups was >2, thedatasets were unequal and not assumed to be normally distributed. Therefore, Kruskal-Wallis H-test and effect size (ES) was performed to test if the responses were significantlydifferent based on their geo-economic distribution. Out of the 136 tested cases, H0 wasrejected for 32 cases. Since, Cohen [50] suggested that if ES < 2xSD (standard deviations),the effect can be regarded as insignificant, and the results can be generalized for the entiredataset. For all the cases tested, ES was within 1xSD. Thus, the data was found to beinternally consistent, homogenous, and reliable. Moreover, the concern for bias in theresponses has been addressed qualitatively while designing the questionnaire instrumentand selecting methods explained before.
5.3.2. Modeling and Simulation
For each sustainability indicator, the probability density functions (PDF) were sim-ulated using MCS to obtain probabilistic mean risk ranges as per Equations (3) and (4).The simulation results are summarized in Table 5. The probabilistic risk distributions werethen modeled to reflect the overall risk impact of total sustainability through Equation (5).Overall, the mean risk index value for sustainability is 24.83 with a 45% probability that therisk will be above this value as shown in Figure 7a. However, the minimum and maximumrisk limits can be used to develop risk threshold or tolerance limits. Overall, there is a90% probability for the risk being in the range of 20.1–29.8. This implies that there is a95% chance that the mean risk will be 24.83. The minimum value of the overall risk forsustainability is 17.82 and the maximum is 68.18. This implies that for a given P3 highwayproject, the overall estimated threat level ranges between 17.82 and 68.18 on a true scaleif all the considered risk factors act together. These values can be used as minimum andmaximum risk threshold levels for decision-making. A tornado diagram for overall sus-tainability ranking is shown in Figure 7b where human health is found as most sensitive torisk with the highest range for completion risk. This implies that if projects fail to completewithin the stipulated time, the most significant impact will be on human health due to theincreased and prolonged exposure to pollution, emissions, dust, and smoke causing bothphysical and emotional trauma.
Table 5. Simulation Results.
SI No. of RisksProbability Distribution Statistics Risk Ranking
Min Mean Max 5% 95% SD 1 2 3 4 5
I1 9 0.76 3.04 7 1.6 4.66 1.39 R20 R16 R19 R15 R17
I2 20 3.37 7.29 12.24 5.12 9.73 0.92 R3 R20 R19 R17 R16
I3 15 1.85 5.04 10.7 3.18 7.18 1.22 R20 R3 R18 R16 R8
I4 4 0.04 1.47 5.26 0.57 2.67 0.67 R18 R9 R9 R15 R12
I5 1 0.02 0.37 2.27 0.01 0.92 0.29 R6 R6
I6 7 0.41 2.73 6.51 1.46 4.17 0.82 R8 R16 R19 R20 R17
I7 3 0.01 1.18 3.35 0.299 2.15 0.57 R16 R17 R15
I8 1 0.02 0.37 6.95 0.01 1.08 0.42 R18
I9 1 0.002 0.45 1 0.005 0.99 0.35 R18
I10 7 0.516 2.67 55.01 1.11 5.03 2.66 R10 R18 R7 R8 R9
TS 15.7 24.6 73.8 20.1 28.3 3.67 I10 I2 I3 I1 I6

Sustainability 2022, 14, 344 14 of 22
Sustainability 2022, 14, x FOR PEER REVIEW 14 of 23
Notably, the life-cycle cost has a maximum number of risks acting on it but is ranked lower than human health. This is due to the often-predictable nature of cost impacts with well-defined mitigations [51]. For social sustainability, the socio-economic repercussions indicator has the highest value of the risk index. This is because of the contextual variation between projects. Unforeseen risks can also create wide-ranging impacts and socio-eco-nomic repercussions. Regression modeling was then carried out for all the sustainability indicators to calculate the weights of their impact on total sustainability as expressed in Equations (5) and (6). The results revealed the sensitivity of every sustainability indicator for P3 risk factors. The same is represented here in Figure 7b through a tornado chart which ranks the dependent variables (risks) on basis of their effect on independent varia-bles (sustainability indicators) based on their comparative regression coefficients.
(a) (b)
Figure 7. (a) Probabilistic risk distribution for sustainability. (b) The overall ranking of sustainability indicators.
In the case of total sustainability, this ranks the indicators in order of their impact on the overall sustainability risk on the project presented in Equations (5) and (6). Generally, the regression coefficient value signifies the measure of the change in output per unit change in input. It is noted that the effect of each risk is assessed independently. Therefore, this analysis is useful to identify the focus of a risk chain on a particular impact. The de-rived regression equations for each of the sustainability indicators are represented as Equations (8)–(14) in Table 6.
Table 6. Regression Equations for all indicators and total sustainability.
Indicator Regression Equations Eq. No.
TS Rts 2.9 0.25I1 0.38I2 0.34I3 0.18I4 0.08I5 0.23I6 0.15I7 0.11I18 0.1I9 0.72I10 (7)
IC R 0.04 0.39 ∗ R20 0.39 ∗ R16 0.38 ∗ R19 0.36 ∗ R17 0.31 ∗ R1 0.31 ∗ R6 0.3 ∗ R20.28 ∗ R3 (8)
LCC R 1.37 0.26R3 0.26R20 0.26R19 0.25R17 0.25R16 0.24R4 0.24R15 0.24R90.23R7 0.23R10 0.22R12 0.22R18 0.21R8 0.21R14 0.2R11 0.19R1 (9)
SER R 0.02 0.28R3 0.28R18 0.28R20 0.27R16 0.27R19 0.27R8 0.25R5 0.25R120.25R17 0.25R6 0.24R7 0.22R10 0.22R14 0.22R4 0.2R15 (10)
H&S R & 0.55R18 0.52R9 0.44R15 0.42R12 (11) Gov R 0.01 0.43R19 0.43R8 0.42R16 0.37R20 0.35R17 0.34R12 0.31R15 (12) HR R 0.01 0.64 ∗ R16 0.6 ∗ R17 0.52 ∗ R15 (13) HH R 2.73 0.71R10 0.7R18 0.07R7 0.06R8 0.06R9 0.06R6 0.06R12 (14)
Figure 7. (a) Probabilistic risk distribution for sustainability. (b) The overall ranking of sustainabil-ity indicators.
Notably, the life-cycle cost has a maximum number of risks acting on it but is rankedlower than human health. This is due to the often-predictable nature of cost impactswith well-defined mitigations [51]. For social sustainability, the socio-economic repercus-sions indicator has the highest value of the risk index. This is because of the contextualvariation between projects. Unforeseen risks can also create wide-ranging impacts andsocio-economic repercussions. Regression modeling was then carried out for all the sustain-ability indicators to calculate the weights of their impact on total sustainability as expressedin Equations (5) and (6). The results revealed the sensitivity of every sustainability indicatorfor P3 risk factors. The same is represented here in Figure 7b through a tornado chart whichranks the dependent variables (risks) on basis of their effect on independent variables(sustainability indicators) based on their comparative regression coefficients.
In the case of total sustainability, this ranks the indicators in order of their impact onthe overall sustainability risk on the project presented in Equations (5) and (6). Generally,the regression coefficient value signifies the measure of the change in output per unitchange in input. It is noted that the effect of each risk is assessed independently. Therefore,this analysis is useful to identify the focus of a risk chain on a particular impact. Thederived regression equations for each of the sustainability indicators are represented asEquations (8)–(14) in Table 6.
Table 6. Regression Equations for all indicators and total sustainability.
Indicator Regression Equations Eq. No.
TS Rts = −2.9 + 0.25I1 + 0.38I2 + 0.34I3 + 0.18I4 + 0.08I5 + 0.23I6 + 0.15I7 + 0.11I18 + 0.1I9 + 0.72I10 (7)
IC RIC = 0.04 + 0.39∗R20 + 0.39∗R16 + 0.38∗R19 + 0.36∗R17 + 0.31∗R1 + 0.31∗R6 + 0.3∗R2 + 0.28∗R3 (8)
LCC RLCC = 1.37 + 0.26R3 + 0.26R20 + 0.26R19 + 0.25R17 + 0.25R16 + 0.24R4 + 0.24R15 + 0.24R9 +0.23R7 + 0.23R10 + 0.22R12 + 0.22R18 + 0.21R8 + 0.21R14 + 0.2R11 + 0.19R1 (9)
SER RSER = −0.02 + 0.28R3 + 0.28R18 + 0.28R20 + 0.27R16 + 0.27R19 + 0.27R8 + 0.25R5 + 0.25R12 +0.25R17 + 0.25R6 + 0.24R7 + 0.22R10 + 0.22R14 + 0.22R4 + 0.2R15 (10)
H&S RH&S = 0.55R18 + 0.52R9 + 0.44R15 + 0.42R12 (11)
Gov RGov = −0.01 + 0.43R19 + 0.43R8 + 0.42R16 + 0.37R20 + 0.35R17 + 0.34R12 + 0.31R15 (12)
HR RHR = −0.01 + 0.64∗R16 + 0.6∗R17 + 0.52∗R15 (13)
HH RHH = −2.73 + 0.71R10 + 0.7R18 + 0.07R7 + 0.06R8 + 0.06R9 + 0.06R6 + 0.06R12 (14)
Sustainability 2022, 14, 344 15 of 22
6. Model Validation through Case Studies
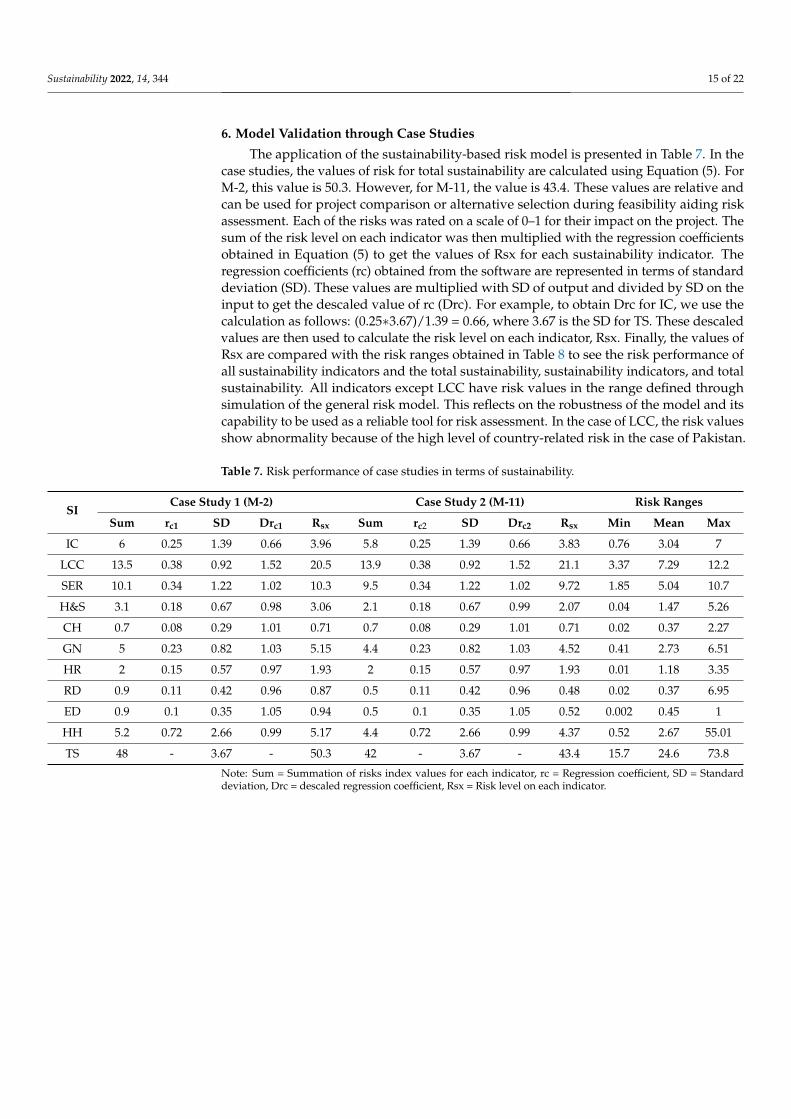
The application of the sustainability-based risk model is presented in Table 7. In thecase studies, the values of risk for total sustainability are calculated using Equation (5). ForM-2, this value is 50.3. However, for M-11, the value is 43.4. These values are relative andcan be used for project comparison or alternative selection during feasibility aiding riskassessment. Each of the risks was rated on a scale of 0–1 for their impact on the project. Thesum of the risk level on each indicator was then multiplied with the regression coefficientsobtained in Equation (5) to get the values of Rsx for each sustainability indicator. Theregression coefficients (rc) obtained from the software are represented in terms of standarddeviation (SD). These values are multiplied with SD of output and divided by SD on theinput to get the descaled value of rc (Drc). For example, to obtain Drc for IC, we use thecalculation as follows: (0.25∗3.67)/1.39 = 0.66, where 3.67 is the SD for TS. These descaledvalues are then used to calculate the risk level on each indicator, Rsx. Finally, the values ofRsx are compared with the risk ranges obtained in Table 8 to see the risk performance ofall sustainability indicators and the total sustainability, sustainability indicators, and totalsustainability. All indicators except LCC have risk values in the range defined throughsimulation of the general risk model. This reflects on the robustness of the model and itscapability to be used as a reliable tool for risk assessment. In the case of LCC, the risk valuesshow abnormality because of the high level of country-related risk in the case of Pakistan.
Table 7. Risk performance of case studies in terms of sustainability.
SICase Study 1 (M-2) Case Study 2 (M-11) Risk Ranges
Sum rc1 SD Drc1 Rsx Sum rc2 SD Drc2 Rsx Min Mean Max
IC 6 0.25 1.39 0.66 3.96 5.8 0.25 1.39 0.66 3.83 0.76 3.04 7
LCC 13.5 0.38 0.92 1.52 20.5 13.9 0.38 0.92 1.52 21.1 3.37 7.29 12.2
SER 10.1 0.34 1.22 1.02 10.3 9.5 0.34 1.22 1.02 9.72 1.85 5.04 10.7
H&S 3.1 0.18 0.67 0.98 3.06 2.1 0.18 0.67 0.99 2.07 0.04 1.47 5.26
CH 0.7 0.08 0.29 1.01 0.71 0.7 0.08 0.29 1.01 0.71 0.02 0.37 2.27
GN 5 0.23 0.82 1.03 5.15 4.4 0.23 0.82 1.03 4.52 0.41 2.73 6.51
HR 2 0.15 0.57 0.97 1.93 2 0.15 0.57 0.97 1.93 0.01 1.18 3.35
RD 0.9 0.11 0.42 0.96 0.87 0.5 0.11 0.42 0.96 0.48 0.02 0.37 6.95
ED 0.9 0.1 0.35 1.05 0.94 0.5 0.1 0.35 1.05 0.52 0.002 0.45 1
HH 5.2 0.72 2.66 0.99 5.17 4.4 0.72 2.66 0.99 4.37 0.52 2.67 55.01
TS 48 - 3.67 - 50.3 42 - 3.67 - 43.4 15.7 24.6 73.8
Note: Sum = Summation of risks index values for each indicator, rc = Regression coefficient, SD = Standarddeviation, Drc = descaled regression coefficient, Rsx = Risk level on each indicator.

Sustainability 2022, 14, 344 16 of 22
Table 8. Mitigation Strategies for Case 1.
Risk Relevant to Project Relevant Sustainability Indicator Suggested Mitigations
Accident due to negligenceand poor workmanship Health and Safety (H&S)
S1-Performance monitoring and procedural control systemover project life-cycleS2-Design adherence to safety standardsS3-Design requirements for access to people and animals
Corruption Human Rights (HR) S4-Strong accountability system
Frequent toll changes andpublic opposition
Governance (GOV) S5-Translation of organizational experiences into policyprocedures
Cultural Heritage (CH)
S6-Guarantee on toll rateS7-Additional revenue streamsS8-Better relationship management with the localcommunity and government
Lack of confidence in localresources
Ecological Damage (ED) E1-Recycle and reuse waste material (asphalt)E2-Proper hydrological studies before design
Human Health Damage (HH) E3-Environment and safety controls/Strict EPA criteria
Availability of resources Life Cycle Cost-(LCC)
F1-Innovative design techniquesF2-Alternative construction techniques or resources locallyavailableF3-Appointing QA/QC inspector
Air Pollution and Risk ofraised soil toxins
Ecological Damage (ED) E4-Environmental monitoring over life-cycle
Resource Damage (RD)
E5-Implementation and safeguard of environmental policiesE6-Appointing environmental specialists in the project teamE7-Tree plantationE8-Selection of environment-friendly materials
6.1. Lahore-Islamabad Motorway Overlay and Modernization Project (M-2)
During the construction, the project faced a lack of coordination and communicationbetween the stakeholders as quoted by the DPM office. The increased risks of reworkwere due to poor quality management and the rushing through of the work. A follow-upinspection issued nonconformance for a 6-km patch and was served a reconstruction notice.Since the road has gone into operation, accidents occur frequently on several blind sections,especially the section crossing the salt range. Patrício and Ferreira [73] surveyed roadusers to identify the influencing accidents on motorway M-2. It was found that carelessdriving, dozing off at the wheel, a continuous crossing of the yellow line while driving,brake failure in hilly areas (salt range), tire burst, and improper informatory signs on M-2are significant causes. Apart from human life loss in accidents, animals are also frequentlyhit by passing cars as the motorway is located in rich habitat. A study reported the fatalityof at least 392 animals during a two-year study period [74]. In this scenario, mitigationstrategies S1, S2, and S3 can significantly help improve the health and safety situation onM-2 as suggested in Table 8. When the value of risk on LCC is compared with the definedlimits, it surpasses the expected values. This can be attributed to the fact that on M-2,project demand and frequent contract variations are high. These risks are translated intothe unexpected rise in toll rates increasing the risk of public opposition to the project. Inthe contract for M-2, it was the responsibility of the client, the National Highway Authority(NHA), to issue a public notice before any increase in toll, or changes in the contract.However, the toll was increased by 10% in 2020 without warning. This is in line with theissues identified by experts. The relevant mitigation measures for such a risk can be S4, S5,S6, S7, and S8. It should also be noted that the use of recycled asphalt was considered in theM-2 project, but this was not used after initial lab tests due to apparent non-conformance ofstandards. The mitigation strategies E1, E2, and E3 can help reduce the risks. The risk of theavailability of resources remained very high in the project. For example, it was envisaged inthe project documents that the performance grade bitumen/super pave method would be

Sustainability 2022, 14, 344 17 of 22
used but the required machinery and experienced staff were not available. The suggestedmitigation strategy, in this case, can be F1, F2, and F3 (see Table 8). The risk-on resourceand ecosystem damages are very high for the M-2 project due to an increase in air pollution.Khalid, et al. [54] found significantly raised levels of carbon and nitrogen in the vegetationin surrounding areas of M-2. So, E4, E5, E6, E7, and E8 are the relevant mitigation measuresthat can help keep toxicity levels under control.
6.2. Lahore–Sialkot Motorway Project (M11)
Like M-2, risks on financial sustainability indicators were quite high for M-11. Thisis prevalent from the increase in budget from 14 to 44 billion, devaluation of the currency,and delay of the project for several years. Such a risk scenario can be better managed byadopting F1, F2, F3, and F4 strategies (see Table 9). On the motorway, the safety risk is highdue to lack of traffic police invigilation, and a high number of accidents, robberies, andeven sexual assault have been reported deeply impacting governance and discouragingtravelers from using the road, impacting the project revenues. Strategies S1, S2, S3, S4, andS5 can be used to overcome these issues (see Table 9). Additionally, there are no serviceareas or petrol pumps on the motorway which causes a nuisance, especially for nighttimetravelers, increasing the risk of social disapproval. Strategies S6 and S7 can be beneficialfor the improvement of this issue. This situation has worsened over the recent COVID-19pandemic, as the number of on-duty staff has reduced due to social distancing. Situatedvery near the border, the motorway also holds a strategic position in case of border tension.It has also been reported that the local language is not written correctly on the signboardshurting public sentiment and increasing the risk of damaging cultural heritage. To reducecultural heritage impacts, strategies S7, S8, S9, and S10 can be used. From this discussion, itcan be deduced that prior detailed assessment can prevent hidden long-term impacts ofthe projects.
Table 9. Mitigation Strategies for Case 2.
Risk Relevant to Project Relevant Sustainability Indicator Suggested Mitigations
Financial Risk Initial Cost (IC)
F1-Prioritization of projects with lesser political risksF2-Government investment to ensure support (VGF)F3-Selection of the appropriate P3 modelF4-Appointing financial experts
Unsafe Roads Health and Safety (H&S)
S1-Performance monitoring and procedural controlsystem over project life-cycleS2-Design innovation (use of intelligenttransportation system)S3-Design adherence to safety standardsS4-Road Surveillance at nightS5-Emergency response service dedicated to everyroad section with clear roles and responsibilitystructure
Lack of sufficient petrolstations and rest areas causingsocial disapproval
Socio-Economic Risk (SER)S6-Public feedback mechanismsS7-Conducting detailed socio-economic impactassessment
Health and Safety (H&S) S8-Design requirements for managing access andestimating user requirements properly
Hurting Public Sentiment Cultural Heritage (CH)
S7-Conducting detailed socio-economic impactassessmentS9-Better relationship management with the localcommunity and governmentS10-Considering social factors in selecting roadalignment

Sustainability 2022, 14, 344 18 of 22
7. Proposed Implementation Framework
A heuristic framework to enable sustainable risk management in actual P3 projects ispresented in Figure 8. Incorporating risk assessment and case study results, the frameworkproposes a reformed risk register for the purpose, which can be used as a tool for theassessment of the project (refer to Figure 8). Firstly, a risk breakdown structure is developedcategorizing the risks over the P3 project life compatible with sustainability ideology. Forshortlisting risks for further assessment, the identified risks are rated individually. Secondly,to perform a sustainability integrated risk assessment, a life-cycle approach is adoptedmodifying the risk assessment process. Although the current study has not extendedthe risk assessment to analyze the changes in risk impacts during different project stagessystematically, it has addressed the notion of life-cycle dynamics by analyzing the risks(Rx, Ry, Rz, . . . . . . Rn) for their impact on sustainability indicators (SIxn, SIyn, . . . . . . SIzn)having both short- and long-ranging TBL impacts on the project environment. Analyzingthe risk and sustainability impact interaction holistically is crucial in overcoming the short-term approach of the risk assessment process. This is a challenging task, attempted inthe current study by a PI-based model by simulating the risk levels into probabilisticranges and regression analysis for assessing the impact of individual critical risks on thesustainability indicators.
Sustainability 2022, 14, x FOR PEER REVIEW 18 of 23
7. Proposed Implementation Framework A heuristic framework to enable sustainable risk management in actual P3 projects is
presented in Figure 8. Incorporating risk assessment and case study results, the frame-work proposes a reformed risk register for the purpose, which can be used as a tool for the assessment of the project (refer to Figure 8). Firstly, a risk breakdown structure is de-veloped categorizing the risks over the P3 project life compatible with sustainability ide-ology. For shortlisting risks for further assessment, the identified risks are rated individ-ually. Secondly, to perform a sustainability integrated risk assessment, a life-cycle ap-proach is adopted modifying the risk assessment process. Although the current study has not extended the risk assessment to analyze the changes in risk impacts during different project stages systematically, it has addressed the notion of life-cycle dynamics by analyz-ing the risks (R , R , R ,…… . R ) for their impact on sustainability indicators (SI , SI , …… . SI ) having both short- and long-ranging TBL impacts on the project en-vironment. Analyzing the risk and sustainability impact interaction holistically is crucial in overcoming the short-term approach of the risk assessment process. This is a challeng-ing task, attempted in the current study by a PI-based model by simulating the risk levels into probabilistic ranges and regression analysis for assessing the impact of individual critical risks on the sustainability indicators.
Figure 8. Implementation framework for the study. Figure 8. Implementation framework for the study.

Sustainability 2022, 14, 344 19 of 22
Project stakeholders are key to enabling risk–sustainability integration. An externally-based risk assessment is a keystone of efficient stakeholder engagement during the earlyplanning of P3 projects, ensuring sustainability in (and of) the planning process. For thispurpose, modifications in the risk register are proposed including columns for ‘affectedstakeholders’ for each critical risk and how they will be affected by each CRF if it occurs byassessing the ‘nature of the impact on each stakeholder’. This can result in cost and timesaving for separate stakeholder analysis, and social impact assessment forming integratedresponsible teams. The developed risk register can be updated periodically to includedynamic life cycle changes. For example, stakeholders in P3 projects are of two main types:external (Ea, Eb, Ec, . . . . . . En), and internal (Ii, Ij, Io, . . . . . . In). Both have different stakesin the project over the P3 contract duration. This is a possible future direction of the study.Other directions include studying the risk allocation structure for sustainability-basedrisk assessment.
In the current study, the sustainability indicators used for assessment are the sub-categories of sustainability indicators. For a purely quantitative study, inventory indicatorsneed to be specified against these sub-categories for the desired application area throughappropriate selection of the unit of analysis as presented in the “Future work” section ofFigure 8. This will enable project managers to interpret sustainability under the projectmanagement umbrella and help conveniently and factually assess the real measure ofrisk impacts. In the proposed micro-level assessment at this stage, consideration of riskinterrelationships, causalities, and the interrelations between sustainability indicators canbe useful in proactively revealing issues. Though it may be impossible in concrete terms,various dynamic modeling techniques, like system dynamics, can be used for this purposein the future.
8. Conclusions and Recommendations
The study has evaluated the impact of P3 risks on sustainability TBL. The impact ofvarious risks is traced using a semi-quantitative approach. Through MCS, probabilisticrisk ranges and risk levels are highlighted. This study helps P3 decision-makers to explorethe long-ranging risk impacts over the dynamic project environment. Results reveal thathuman health damages are the most sensitive sustainability impact category sharing a verysignificant relationship with completion risk, creating unforeseen, comprehensive negativesustainability impacts. The study also reveals rich data for conducting more refined andsophisticated studies. The relationships established between the risks and sustainabilityindicators through the impact matrix help practitioners identify new causal informationbetween the risk-sustainability interaction. The presented implementation frameworkin Section 6 also guides the practitioners to use our work in practice. In Figure 8 ofSection 6, a risk matrix has been presented based on the results of this study which includessustainability indicators that can serve as a simple tool of preliminary risk assessment interms of sustainability.
Limitations of the study include the possibility of self-bias in risk categorization. Tocurb this, relevant literature has been consulted to keep logical consistencies in reasoningand theoretical constructs have been developed for the sake of a pragmatic assessment.Additionally, all the interviewees consulted for case studies had the same country ofexperience, Pakistan. Despite this, countries, where P3 is usually a natural choice forinfrastructure projects, can benefit from the findings of the current study. Application ofmitigation strategies in countries with different socio-political conditions and risk exposuremay still be difficult. Future studies can improve upon this limitation. Another limitationof the study is its assumption of risks to be independent. Therefore, as a possible prospect,it is recommended to delve deeper into the quantification of impacts on inventory-levelsustainability indicators. For a more accurate assessment, it can be useful to look intothe life cycle assessment frameworks and identify the quantitative level indicators forsustainability-risk integration. Sophisticated dynamic modeling for risk assessment undermicro-level risk interaction can be considered for this purpose. Future studies can consider

Sustainability 2022, 14, 344 20 of 22
modeling approaches such as agent-based modeling (ABM) or System Dynamics (SD) forthe assessment of microlevel impacts. The use of fuzzy modeling can help quantify thequalitative factors in the study. Additionally, for future assessment, positive risks, and risksoccurring due to the inclusion of sustainability criteria in P3 projects can be two interestingperspectives of the problem.
Supplementary Materials: The following supporting information can be downloaded at: https://www.mdpi.com/article/10.3390/su14010344/s1, Table S1. Literature Review Synthesis for Short-listing Risk Factors; Table S2. Description of shortlisted risks.
Author Contributions: Conceptualization, M.J.T. and B.B.; methodology, B.B., H.A. and M.J.T.;software, B.B. and H.A.; validation, B.B., M.J.T. and K.M.M.; formal analysis, B.B., M.J.T., S.T. andN.A.; investigation, B.B., M.J.T. and T.Z.; resources, M.J.T., T.Z. and N.A.; data curation, B.B. andM.J.T.; writing—original draft preparation, B.B. and M.J.T.; writing—review and editing, S.T., K.M.M.,T.Z. and N.A.; visualization, B.B. and H.A.; supervision, M.J.T. and T.Z.; project administration, B.B.and M.J.T.; funding acquisition, M.J.T. All authors have read and agreed to the published version ofthe manuscript.
Funding: This work was supported by the Higher Education Commission (HEC), Pakistan [grantnumber 20-4638].
Informed Consent Statement: Informed consent was obtained from all subjects involved in the study.
Acknowledgments: We acknowledge the help and support of experts in data collection and organi-zational support in developing case studies.
Conflicts of Interest: The authors declare no conflict of interest.
References1. Tallaki, M.; Bracci, E. Risk allocation, transfer and management in public–private partnership and private finance initiatives: A
systematic literature review. Int. J. Public Sect. Manag. 2021, 34, 709–731. [CrossRef]2. Tariq, S.; Zhang, X. Critical Analysis of the Private Sector Roles in Water PPP Failures. J. Constr. Eng. Manag. 2021, 147, 04021015.
[CrossRef]3. Cheng, Z.; Wang, H.; Xiong, W.; Zhu, D.; Cheng, L. Public–private partnership as a driver of sustainable development: Toward a
conceptual framework of sustainability-oriented PPP. Environ. Dev. Sustain. 2021, 23, 1043–1063. [CrossRef]4. Kumar, L.; Jindal, A.; Velaga, N.R. Financial risk assessment and modelling of PPP based Indian highway infrastructure projects.
Transp. Policy 2018, 62, 2–11. [CrossRef]5. Grimsey, D.; Lewis, M. Public Private Partnerships: The Worldwide Revolution in Infrastructure Provision and Project Finance; Edward
Elgar Publishing: Cheltenham, UK, 2007.6. Liu, J.; Love, P.E.D.; Sing, M.C.P.; Smith, J.; Matthews, J. PPP Social Infrastructure Procurement: Examining the Feasibility of a
Lifecycle Performance Measurement Framework. J. Infrastruct. Syst. 2017, 23, 04016041. [CrossRef]7. Zou, P.X.; Wang, S.; Fang, D. A life-cycle risk management framework for PPP infrastructure projects. J. Financ. Manag. Prop. Constr.
2008, 13, 123–142. [CrossRef]8. Shrestha, A.; Chan, T.K.; Aibinu, A.A.; Chen, C.; Martek, I. Risk Allocation Inefficiencies in Chinese PPP Water Projects.
J. Constr. Eng. Manag. 2018, 144, 10. [CrossRef]9. Silvius, G. Integrating sustainability into project risk management. In Global Business Expansion: Concepts, Methodologies, Tools, and
Applications; IGI Global: Hershey, PA, USA, 2018; pp. 330–352.10. Yuan, J.; Li, W.; Guo, J.; Zhao, X.; Skibniewski, M.J. Social Risk Factors of Transportation PPP Projects in China: A Sustainable
Development Perspective. Int. J. Environ. Res. Public Health 2018, 15, 1323. [CrossRef] [PubMed]11. Ma, H.; Zeng, S.; Lin, H.; Zeng, R. Impact of Public Sector on Sustainability of Public–Private Partnership Projects.
J. Constr. Eng. Manag. 2020, 146, 04019104. [CrossRef]12. Planning, S. Risk Management Planning, Sustainability Risks Management, and Risk Stakeholders. In Risk Management Strategies
in Public-Private Partnerships; IGI Global: Hershey, PA, USA, 2017.13. Wang, Y.; Wang, Y.; Wu, X.; Li, J. Exploring the Risk Factors of Infrastructure PPP Projects for Sustainable Delivery: A Social
Network Perspective. Sustainability 2020, 12, 4152. [CrossRef]14. Silvius, A.G.; Schipper, R.P. Sustainability in project management: A literature review and impact analysis. Soc. Bus. 2014, 4, 63–96.
[CrossRef]15. Martens, M.L.; Carvalho, M.M. Key factors of sustainability in project management context: A survey exploring the project
managers’ perspective. Int. J. Proj. Manag. 2017, 35, 1084–1102. [CrossRef]
Sustainability 2022, 14, 344 21 of 22
16. Aarseth, W.; Ahola, T.; Aaltonen, K.; Økland, A.; Andersen, B. Project sustainability strategies: A systematic literature review.Int. J. Proj. Manag. 2017, 35, 1071–1083. [CrossRef]
17. Kivilä, J.; Martinsuo, M.; Vuorinen, L. Sustainable project management through project control in infrastructure projects.Int. J. Proj. Manag. 2017, 35, 1167–1183. [CrossRef]
18. Yu, M.; Zhu, F.; Yang, X.; Wang, L.; Sun, X. Integrating Sustainability into Construction Engineering Projects: Perspective ofSustainable Project Planning. Sustainability 2018, 10, 784. [CrossRef]
19. Anderson, D.R. The critical importance of sustainability risk management. Risk Manag. 2006, 53, 66.20. Diaz-Sarachaga, J.M.; Jato-Espino, D.; Castro-Fresno, D. Methodology for the development of a new Sustainable Infrastructure
Rating System for Developing Countries (SIRSDEC). Environ. Sci. Policy 2017, 69, 65–72. [CrossRef]21. Shahriar, A.; Sadiq, R.; Tesfamariam, S. Risk analysis for oil & gas pipelines: A sustainability assessment approach using fuzzy
based bow-tie analysis. J. Loss Prev. Process. Ind. 2012, 25, 505–523. [CrossRef]22. Qazi, A.; Shamayleh, A.; El-Sayegh, S.; Formaneck, S. Prioritizing risks in sustainable construction projects using a risk matrix-
based Monte Carlo Simulation approach. Sustain. Cities Soc. 2021, 65, 102576. [CrossRef]23. Pinz, A.; Roudyani, N.; Thaler, J. Public–private partnerships as instruments to achieve sustainability-related objectives: The state
of the art and a research agenda. Public Manag. Rev. 2018, 20, 1–22. [CrossRef]24. Javed, A.A.; Lam, P.T.; Chan, A.P. A model framework of output specifications for hospital PPP/PFI projects. Facilities
2013, 31, 610–633. [CrossRef]25. Fantozzi, F.; Bartocci, P.; D’Alessandro, B.; Arampatzis, S.; Manos, B. Public–private partnerships value in bioenergy projects:
Economic feasibility analysis based on two case studies. Biomass Bioenergy 2014, 66, 387–397. [CrossRef]26. Patil, N.A.; Laishram, B. Public–private partnerships from sustainability perspective—A critical analysis of the Indian case.
Int. J. Constr. Manag. 2016, 16, 161–174. [CrossRef]27. Atmo, G.; Duffield, C. Improving investment sustainability for PPP power projects in emerging economies: Value for money
framework. Built Environ. Proj. Asset Manag. 2014, 4, 335–351. [CrossRef]28. Koppenjan, J.F. Public–Private Partnerships for green infrastructures. Tensions and challenges. Curr. Opin. Environ. Sustain. 2015,
12, 30–34. [CrossRef]29. Xiong, W.; Yuan, J.-F.; Li, Q.; Skibniewski, M.J. Performance objective-based dynamic adjustment model to balance the stakehold-
ers’ satisfaction in PPP projects. J. Civ. Eng. Manag. 2015, 21, 539–547. [CrossRef]30. Love, P.; Liu, H.; Matthews, J.; Sing, C.P.; Smith, J. Future proofing PPPs: Life-cycle performance measurement and Building
Information Modelling. Autom. Constr. 2015, 56, 26–35. [CrossRef]31. Agarchand, N.; Laishram, B. Sustainable infrastructure development challenges through PPP procurement process Indian
perspective. Int. J. Manag. Proj. Bus. 2017, 10, 642–662. [CrossRef]32. PMI. A Guide to The Project Management Body of Knowledge (PMBOK Guide); Project Management Institute: Newton Square, PA,
USA, 2017.33. Marchese, D.; Reynolds, E.; Bates, M.E.; Morgan, H.; Clark, S.S.; Linkov, I. Resilience and sustainability: Similarities and
differences in environmental management applications. Sci. Total Environ. 2018, 613, 1275–1283. [CrossRef]34. Bocchini, P.; Frangopol, D.; Ummenhofer, T.; Zinke, T. Resilience and Sustainability of Civil Infrastructure: Toward a Unified
Approach. J. Infrastruct. Syst. 2014, 20, 04014004. [CrossRef]35. Gray, P.; Wiedemann, P.M. Risk management and sustainable development: Mutual lessons from approaches to the use of
indicators. J. Risk Res. 1999, 2, 201–218. [CrossRef]36. Park, J.; Seager, T.P.; Rao, P.S.C.; Convertino, M.; Linkov, I. Integrating Risk and Resilience Approaches to Catastrophe Management
in Engineering Systems. Risk Anal. 2013, 33, 356–367. [CrossRef] [PubMed]37. Shen, L.; Tam, V.W.; Gan, L.; Ye, K.; Zhao, Z. Improving Sustainability Performance for Public-Private-Partnership (PPP) Projects.
Sustainability 2016, 8, 289. [CrossRef]38. Heravi, G.; Hajihosseini, Z. Risk Allocation in Public–Private Partnership Infrastructure Projects in Developing Countries: Case
Study of the Tehran–Chalus Toll Road. J. Infrastruct. Syst. 2012, 18, 210–217. [CrossRef]39. Ye, S.; Tiong, R.L.K. NPV-at-Risk Method in Infrastructure Project Investment Evaluation. J. Constr. Eng. Manag. 2000, 126, 227–233.
[CrossRef]40. Jin, X.-H.; Doloi, H. Interpreting risk allocation mechanism in public–private partnership projects: An empirical study in a
transaction cost economics perspective. Constr. Manag. Econ. 2008, 26, 707–721. [CrossRef]41. Xu, Y.; Chan, A.P.C.; Yeung, J.F.Y. Developing a Fuzzy Risk Allocation Model for PPP Projects in China. J. Constr. Eng. Manag.
2010, 136, 894–903. [CrossRef]42. Medda, F. A game theory approach for the allocation of risks in transport public private partnerships. Int. J. Proj. Manag.
2007, 25, 213–218. [CrossRef]43. Jin, X.-H.; Zhang, G. Modelling optimal risk allocation in PPP projects using artificial neural networks. Int. J. Proj. Manag. 2011,
29, 591–603. [CrossRef]44. Jin, X.-H. Model for Efficient Risk Allocation in Privately Financed Public Infrastructure Projects Using Neuro-Fuzzy Techniques.
J. Constr. Eng. Manag. 2011, 137, 1003–1014. [CrossRef]45. Jin, X.-H. Neurofuzzy Decision Support System for Efficient Risk Allocation in Public-Private Partnership Infrastructure Projects.
J. Comput. Civ. Eng. 2010, 24, 525–538. [CrossRef]
Sustainability 2022, 14, 344 22 of 22
46. Li, H.; Al-Hussein, M.; Lei, Z. Incentive genetic algorithm based time–cost trade-off analysis across a build–operate–transferproject concession period. Can. J. Civ. Eng. 2011, 38, 166–174. [CrossRef]
47. Li, J.; Zou, P.X.W. Fuzzy AHP-Based Risk Assessment Methodology for PPP Projects. J. Constr. Eng. Manag. 2011, 137, 1205–1209.[CrossRef]
48. Müller, A.B.; Avellán, T.; Schanze, J. Risk and sustainability assessment framework for decision support in’water scarcity–waterreuse’situations. J. Hydrol. 2020, 591, 125424. [CrossRef]
49. Sexton, K.; Linder, S.H. Integrated Assessment of Risk and Sustainability in the Context of Regulatory Decision Making.Environ. Sci. Technol. 2014, 48, 1409–1418. [CrossRef]
50. Shiroyama, H.; Yarime, M.; Matsuo, M.; Schroeder, H.; Scholz, R.; Ulrich, A.E. Governance for sustainability: Knowledgeintegration and multi-actor dimensions in risk management. Sustain. Sci. 2012, 7, 45–55. [CrossRef]
51. Arshad, H.; Thaheem, M.; Bakhtawar, B.; Shrestha, A. Evaluation of Road Infrastructure Projects: A Life Cycle Sustainability-BasedDecision-Making Approach. Sustainability 2021, 13, 3743. [CrossRef]
52. Linkov, I.; Satterstrom, F.; Kiker, G.; Batchelor, C.; Bridges, T.; Ferguson, E. From comparative risk assessment to multi-criteriadecision analysis and adaptive management: Recent developments and applications. Environ. Int. 2006, 32, 1072–1093. [CrossRef]
53. Akber, M.Z.; Thaheem, M.J.; Arshad, H. Life cycle sustainability assessment of electricity generation in Pakistan: Policy regimefor a sustainable energy mix. Energy Policy 2017, 111, 111–126. [CrossRef]
54. Patil, N.A.; Tharun, D.; Laishram, B. Infrastructure development through PPPs in India: Criteria for sustainability assessment.J. Environ. Plan. Manag. 2016, 59, 708–729. [CrossRef]
55. Goedkoop, M.; Heijungs, R.; Huijbregts, M.; De Schryver, A.; Struijs, J.; Van Zelm, R. ReCiPe 2008: A Life Cycle Impact AssessmentMethod Which Comprises Harmonised Category Indicators at the Midpoint and the Endpoint Level. In Report I: Characterisa-tion, 1st ed.; 2009; Volume 1, Available online: https://www.leidenuniv.nl/cml/ssp/publications/recipe_characterisation.pdf(accessed on 20 October 2021).
56. Menoufi, K.; Castell, A.; Navarro, L.; Pérez, G.; Boer, D.; Cabeza, L.F. Evaluation of the environmental impact of experimentalcubicles using Life Cycle Assessment: A highlight on the manufacturing phase. Appl. Energy 2012, 92, 534–544. [CrossRef]
57. Benoît-Norris, C.; Vickery-Niederman, G.; Valdivia, S.; Franze, J.; Traverso, M.; Ciroth, A.; Mazijn, B. Introducing theUNEP/SETAC methodological sheets for subcategories of social LCA. Int. J. Life Cycle Assess. 2011, 16, 682–690. [CrossRef]
58. Ahmad, T.; Thaheem, M.J. Developing a residential building-related social sustainability assessment framework and its implica-tions for BIM. Sustain. Cities Soc. 2017, 28, 1–15. [CrossRef]
59. Ahmad, T.; Thaheem, M.J. Economic sustainability assessment of residential buildings: A dedicated assessment framework andimplications for BIM. Sustain. Cities Soc. 2018, 38, 476–491. [CrossRef]
60. Fitch, G.J.; Odeh, I.; Kautz, F.; Ibbs, C.W. System Dynamics Models for the Valuation of Real Options in P3 Concession ProjectAgreements. J. Infrastruct. Syst. 2018, 24, 13. [CrossRef]
61. Shen, L.Y.; Li, H.; Li, Q.M. Alternative Concession Model for Build Operate Transfer Contract Projects. J. Constr. Eng. Manag.2002, 128, 326–330. [CrossRef]
62. Ahmad, Z.; Thaheem, M.J.; Maqsoom, A. Building information modeling as a risk transformer: An evolutionary insight into theproject uncertainty. Autom. Constr. 2018, 92, 103–119. [CrossRef]
63. Ullah, F.; Ayub, B.; Siddiqui, S.Q.; Thaheem, M.J. A review of public-private partnership: Critical factors of concession period.J. Financ. Manag. Prop. Constr. 2016, 21, 269–300. [CrossRef]
64. Bilal, M.; Khan, K.I.A.; Thaheem, M.J.; Nasir, A.R. Current state and barriers to the circular economy in the building sector:Towards a mitigation framework. J. Clean. Prod. 2020, 276, 123250. [CrossRef]
65. Krumpal, I. Determinants of social desirability bias in sensitive surveys: A literature review. Qual. Quant. 2013, 47, 2025–2047.[CrossRef]
66. Noy, C. Sampling Knowledge: The Hermeneutics of Snowball Sampling in Qualitative Research. Int. J. Soc. Res. Methodol. 2008,11, 327–344. [CrossRef]
67. Roumboutsos, A.; Anagnostopoulos, K.P. Public–private partnership projects in Greece: Risk ranking and preferred risk allocation.Constr. Manag. Econ. 2008, 26, 751–763. [CrossRef]
68. Vose, D. Risk Analysis: A Quantitative Guide; John Wiley & Sons: New York, NY, USA, 2008.69. Milligan, G.W.; Cooper, M.C. A study of standardization of variables in cluster analysis. J. Classif. 1988, 5, 181–204. [CrossRef]70. Hosmer, D.W.; Lemesbow, S. Goodness of fit tests for the multiple logistic regression model. Commun. Stat. Theory Methods 1980,
9, 1043–1069. [CrossRef]71. Schmidt, R.; Voigt, M.; Mailach, R. Latin Hypercube Sampling-Based Monte Carlo Simulation: Extension of the Sample Size
and Correlation Control. In Uncertainty Management for Robust Industrial Design in Aeronautics; Springer: Cham, Switzerland,2019; pp. 279–289.
72. Dillman, D. Constructing the Questionnaire. Mail and Internet Surveys; John Wiley & Sons: New York, NY, USA, 2000.73. Patrício, L.D.; Ferreira, J.J. Blockchain security research: Theorizing through bibliographic-coupling analysis. J. Adv. Manag. Res.
2020, 18, 1–35. [CrossRef]74. Tahir, H.M.; Khan, S.Y.; Arshad, M. Motorway (M 2): A Threat to the Wild Animals. Pak. J. Zool. 2013, 45, 1447–1451.