a survey of the evaluation of pupil - OhioLINK ETD Center
408
A SURVEY OF THE EVALUATION OF PUPIL PROGRESS IN SELECTED SECOLTDARY SCHOOLS OP OHIO DISSERTATION Presented in Partial Fulfillment of the Requirements for the Degree Doctor of Philosophy in the Graduate School of The Ohio State University By GUY W. BUDDEMEYERj B. S. in Ed., M. A, The Ohio State University 19^3 Adviser
-
Upload
khangminh22 -
Category
Documents
-
view
1 -
download
0
Transcript of a survey of the evaluation of pupil - OhioLINK ETD Center

A SURVEY OF THE EVALUATION OF PUPIL PROGRESS IN SELECTED SECOLTDARY SCHOOLS
OP OHIO
DISSERTATION
Presented in Partial Fulfillment of the Requirements for the Degree Doctor of Philosophy in the
Graduate School of The Ohio State University
By
GUY W. BUDDEMEYERj B. S. in Ed., M. A, The Ohio State University
19^3
Adviser

ACKNOWLEDCMEMTS
The wi'iter is deeply indebted to many persons for their participation and oo-operation which made possible the successful completion of this study# It is impossible to make adequate acknowledgment of all persons contributing to the study# The writer is particularly indebted to his major adviser. Dr# W. R# Flesher, for his encouragement, assistance, and constructive criticism, to the members of the advisory committee. Dr. D# H# Eikenberry and Dr# Lowry W# Harding for their helpful suggestions, and to Robert E# Hubbard and Victor W# Doherty for their co-operation and collaboration in developing the general design for the group of studies of which this is a part#
To others, including authorities in evaluation, teachers in Ohio secondary schools, principals in secondary schools in Ohio, and members of the staff of the Ohio State Department of Education sincere appreciation is expressed for their co-operation in providing information essential to the study# The writer also appreciates the assistance and suggestions of members of the staff of The Ohio State University, typists, and secretaries in connection with technical and detailed matters necessary to the completion of the study#
ii

TABLE OF CONTENTS
CIi4PTEE PAGEI ORIENTATION TO THE STUDY.................... 1
Need for the Study ................. 3purposes for the Study . . . . . . . . i;Scope of tbs Study............. 6Plan of the Studjr..................... 16Saiapling Techniques................. .. 22Inquiry Returns. . . . . . . . . . . . 28
II DEVELOPMENT OF THE THEORYOF EVALUATION OF PUPIL PR0ŒU2S8IN AMERICAN EDUCATION................ 39
Appraisal of pupü progressin Early American Schools........ .. 3P
The Measurement Movement . ......... U8Emergence and Grovjtli of theEvaluation Concept . . . . . . . . . . 6Î4.
Ill PRINCIPLES FOR EVALUATING PUPILPROGRESS. . 73
Derivation of Principles forThis Studjr , ......... 7U
Judgnents of Authorities inEvaluation Regarding Principles. . . . IO9
IV EVALUATION PFIAGTICES OF TEACHERS........ 119Formulating and Establishing
Educational Objectives ......... . 123Methods and Procedures used in
Evalua ti o n . . . * . . . . . . . . . . II4.OTypes of ]hf annation Recordedin Cumulative Records. . . . . . . . . 168
Marking and Reporting practices. . . . . 173Guidance Services. ................. I8U
V PROGRAMS OF EVALUATION..................191Testing Programs ............... 192Cumulative Records................. . 2lUReporting to parents ........... 219Related Aspects of Evaluation..... 223
iii

TABLE OF CONTEI'TTS (Conbimed)
CHAPTER PAGEVI JUDGMENTS OF TEACHERS AND PRINCIPALS
REGARDINC EVALUATION PRACTICES ANDPROGRAMS................................ 235
Judgments of Teachers............. . 236judgments of Principals* ......... 2k9
V U SUMMARY j CONCLUSIONS ANDRECCM4ENDATIDNS......................... 256
Smnmaiy cf the Status of Principles, Practices,and Programs of Evaluation . . . . . . . 257
General Sujnmary*.................... « 275Conclusions......................... 277Recommendations* .................... 282
APPENDIX: A...................... .......... 287
APPENDIX B.............................. 296
APPENDIX C............................... * 312
APPENDIX D.............................. 3I4IBIBLIOGRAPHY............................. 377
XV

I.l/i':' 7 -
1 T"'::AC:P:PS P.TY. A:Cv.J:Tiai VTLL'VP-J, A 3 m e -11 .Sn!AinLS'LI6Tl:3 IP pji': ijc p c p o R T Cl'' :':i: si'ATE DEPj\irf:3iri'
CATICP CmLcJ.'^-'IED PYr..',"IOiS OV STAY A. ....................... 2S
2 .AT. F] p .'A ' e c j t o o r a S l 'j lE C T ie j TOR l A H T p TLI5C, eiASüPAIKD py TYPL OF SCAOOL DÏSY . TYPy OY 3..':70CL (TlTAYrZAT YOP^ATT T., 'lO:. C.1'' 2HE ÜTATF.................... 26
6 ixTY. Àl.Y: 06 066001;:; Ti.' Y2IC : lU'PiTYY; l-WPRIYL:TPAI5 JLYI T':AC:6FPS IVEIY-: OE:/.rCIAOOYT'ED TYJ'O OF SC60C1 0P.F.A6'i':'2'.'T'06\Tl'TF Y" OCYC'T, '" IS " " : '''':'. \:P T T F 1C 6Y P -ASSCO.LA'YYr: PIOTAIOT........................ 2?
6 OF T:YiC.Y2t;j TO VAYP! T.}^PY6i.''Y'i/C' Y GYYT^ YlASOY'IFP PY T'IT: 0? OCj'fYjL OR6Ap;:YL\TIOi'I_, T"PF OF SOPOOT, P'TS'u'TOT,A’Y P'F'Vrnp CF T 6: 0TA66 ..........'. . , . 2y
,6 ilT-Y'E! CF TYACF'ZFS TG YijOÀ: imi.rp.-t-pTVPTF... : OF,AT, CI/LOOYFIFD ''Y TYPO 02''OCjiOOl, Q:6AI:6Z\6YCP6 TYT'F rpr SrppOOT, j]T5Tr,:]:,T;\ AJ3 T:'iACAKP-A60OCATI0rfD J'ST llIC IT ..............................................................................................3 0
6 ouPYAAT OP lA^YIKY RETuPAS..................................................... 32
7 IR.1.PFH 0'/' 30-600LS EYY: vnîICIIFOR PRlYCirAJJS VRÜPF RECEjAPTD CIASSIF'33 BY TY1Y2 OF SCIÎ001 ORGANIZATION, TYPE OF SCHOOL DISTRICT, AI3 TmCÆR-ASSOCIATIONDISTRICT...................................................................................................33
6 im ilE i-l OF SCHOOL) FltOR VfPICN li'QUIE^IESFOR TiY.Ci£RS AYI'E RECEIVED, CLASSIFXED EY TYPE OF SCHOOL QRGAujIZATICN, TYPE OF SCHOOL D ISTR IC T, AID TEACrlER-ASSOmATION DISTRICT'. . . ............................. 3U
9 iiYE:":: 0:1 T Y A ciza s Fi-'OP wnoi.i i i^ i t in im sVmPE 6'CEIVED, CLASS IFIZD BY TYPE OFSCHOOI, ORGANIZATION, TYPE OF SCHOOLD ISTRIC T, AND TZA C l^-A SSO C IA TIO ND ISTRICT...................................................................................................37
V

LIST 01'' TA LSS (Continued)
TA IA': PAGE1 0 EZrETT OF AOREFITZiZf AI£OI'*Q 21 AmTlO:'-. I T ICES
I i ; EVALUATION vrCTH THE H flU G IPLESACCEPTED IK TKIS STIDY....................................................................... 112
1 1 RATIIv-S OF SIGî:iVTCAIiCE OR IMPORTAI:CEFOR SACiï P R inC IP L E OF EVAIFATIOW ACCEPTEDIK THIS STiroi% BY AliTHGP.lU’lT’S IM EVALllA-ÏIO N IPiO AGREED AITK TEE PTHUCIPLE...................................... 115
12 HP AIJD PER OS FT OF T lA C U m S IHDICATIU:- TIAT ED"CATIOîAL OBÆCTPGPS HAD BEEH FORmHA.TET) a i læ-IPOlPllTED IH THE CT.P.REPl'SCHOOL REAP............................................................................................... » 125
15 TiACHIP'S IIDICA TIH H T 'A T CSRTATF FACIORS APEIWCŒPGKAGED II: TiiS FORPUIATIOH OF OBJECI'IVESFŒ: THE TP. O.TH T E A C H Il'P .......................................................................12 ?
1 5 I'TUTUE A 2D PER CEHT QT T FAC: U PS ST AT I ID TI ATOT^,IECTIVEo -OR T iE E I 3TDJECT APIA 27ERE FORIUîLATED BY DIl-FlFIEKT SCHOOL PHPSONEEL . . . . 129
15 TPl'Tvp AHD p e r C M ' OF TEACIERS IID'DAT^'NCTHE PUT EFT TO UillCU THEY PART'CIPATEP IN FCRI.rr.IIATTO!'.! OR PE-EXAEIPAl'IOH OF OB,TGCTP/ES FOR THEIR SUBJECT A P I A ..................................................... 132
l 5 IR ITER AID PT'P CE:T OF T A C Ill'.S ILDICATTHCT AT THEIR SCHOOL STAFF'S I AD o TID IED V/AYS 0" FVALIATIIJG T jS ATTAIrH.IEITI' OF SCHOCL OFJl'ICTTGES BY P U P I lID ............................................................................ 135
IT m IP E R AID CEÎF OF TEACHERS D D IC A T IIFTHE EXT IF F TO VHÏICH PUPILS HELP PLAN FIAT THEY F IL L STKDY OR DO IN C L A S S ..................................................137
18 TEACHERS I I D I CAT INC THAT THEY I.rSE EVALUATION1ŒTHQDS AIvTD 'i FCHNJ3TU-2S LLISTED....................................................... lU 2
19 MTPIFL AND PEP. CENT OF T.^iACIEPS IHDICATTNO THAT THEY USE OBSERVATION ONLY. TESTING O il,Y .CR A COlSIIpLTION OF OBSERVATION AID TI3STIN:- IN EVALUATING DIFFEPENI ASPECTS OF PU PILPROGRESS...............................................................................................................15 6
2 0 EXTENT OF USE NADE BY TEACHERS OF CLASSIC OOPTESTS IM THE EVALTATIOH OF PU PIL PROGRESS . . . . ll|.8
v l

L3ST OF TABLES (Continued)TABLE PAGE
21 NUMBER AMD PER CENT OF TEACHERS STATIIGTHAT THEY USE VARIOUS TYPES CF TESTS CR TEST QUESTIONS REGULARLY WHO HAD INDICATED THEY THEY USE CLASSROOM TESTS FRBQUEOTLY,OR OCCASIONALLY.................................. 1^1
22 NUMBER AND PER CENT CF TEACHERS INDICATINGTHAT THEY EMPLOY VARIOUS PRACTICES REGULARLY IN THE USE CF CIA88R0QM TESTS WHO STATED THATTHEY USED SUCH TESTS FEtEQUENTLY................... 152
23 NUMBER AND PER CENT CF TEACHERS INDICATINGTHAT THEY EMPLOY VARIOUS PRACTICES REGUIARLY IN THE USE OF CLASSROOM TESTS WHO STATEDTHAT THEY USED SUCH TESTS FREQUENTLY ............l5h
2h NUMBER AND PER CENT CF TEACHERS IIDIGATINGTHAT THEY USE STANDARDIZED ACHIEVEMENT TESTS . . . 157
25 NmîBER AND PER CENT OF TEACHERS INDICATINGUSE CF STANDARDIZED TESTS IN DURERENT SCHOOLGRADES— SUMMARY F Œ TEACHERS WHO STATEDTHAT THEY USE SUCH TESTS.........................160
26 PRACTICES IN THE ADMINISTRATION OFSTANDARDIZED TESTS AS INDICATED BY TEACHERS. . . . l62
27 NUMBER AND PPR CENT CF TEACHERS INDICATINGTHE EXTEND TO WHICH PUPHS HELP DECIDE ONWHAT THEY WILL BE TESTED CR EVALUATED............. 16U
28 NUMBER AND PER CENT CF TEACHERS INDICATINGTHE EXTEND TO WHICH PUPIIS PARTICIPATE IN THE COIBTRUCTION OF TESTS CR PLANNING OFOTHER MEANS CF EVALUATION.........................l66
29 NUMBER AND PER CENT CF TEACHERS INDICATINGTHE EXTENT TO WHICH PUPILS DISCUSS VARIDIB OUTCCMES OF THEIR SCHOOL WORK— SUMMARYFOR ALL RESPONDENTS.............................. l6p
30 NUMBER AND HIR CENT OF TEACHERS INDICATING THETYPES CF INFORMATION RECORDED IN THE CUMULATIVE RECCRDS USED IN THEIR SCHOOLS, BY TYIE CFSCHOOL DISTRICT AND TOTAL......................... 171
vii

LIST OF TABLES (Continued)TABIE mOE
31 NUMBER AND PER CENT OF TEA.CHERS INDICATINGTHAT THEY USE VARIOUS METHODS OR COMBINATIONS OF METHODS CR REPORTING PUPIL PROGRESSTO PARENTS................................. *175
32 NUMBER AND PER CENT OF TEACHERS INDICATINGTHAT THEY USE VARIOUS METHODS OF REPORTING PUPIL PROGRESS— SUMMARY FOR EACH METHOD REGARDLESS OF COMBINATIONS IN 19HICH USED. . . • 1?6
33 NUMBER AND PER CENT OF TEACHERSINDICATING PARTICIEATION BY DIFFERENT PERSONNEL IN SELECTING FCEM OF REPORTINGUSED......................................... 177
3U NUMBER AND PER CENT OF TEACHERS INDICATINGVARIOUS BASES ON milCH GRADES CR RATINGS IN SUBJECT ACHIEVEMENT ARE GIVEN................. 178
35 NUMBER AND PIR CENT - OF TEACHERS INDICATINGFACTORS IN ADDITION TO ACHIEVEMENT THAT ARE USED IN DETERMINING SUBJECT GRADES CE RATINGS WHO STATED THAT SUCH FACTORSARE CONSIDERED........................ 161
3 6 NUMBER AND PER CENT CF TEACHERS INDICATINGTHAT THEY ATTEMPT TO ASSIGN MARKS FCR ACHIEVEMENT ACCORDING TO THE NCRMALFREQUENCY DISTRIBUTION........................ 183
37 NUMBER AND PER CENT CF TEACHERS STATINGTHAT GUIDANCE SERVICES ARE AVAILABLEIN THEIR SCHOOLS.............................. 185
38 NUMBER AND 1ER CENT CF TEACHERS STATINGTHAT THEY REFER PUPIIS TO SPECIAL GUIDANCE PERSONNEL FCR REAS Cl'S SHCWN...................186
39 NUMBER AND PER CENT OF TEACIERS STATINGTHAT THEY REFER PUPIIS TO SPECIAL GUIDANCE PERSONNEL FOR REASONS SHOWN...................188
ho NUMBER AND PER CENT CF PRINCIPALS INDICATINGTHAT VARIOUS TESTS ARE GIVEN SOME TIME DURING THE SECONDARY SCHOOL PROGRAM........... I9h
viii

LIST OF TABJJÏS (Continued)TABLE PAGE
iil NUÏ'IBER AND PER CEtiT OF FRDsfCIPALS INDICATINGTHE NTJKBER OF TIMES VARIOUS TESTS ARE GIVEN during the SECONDARY SCHOOL PROGRAM-SUMMARY,ALL TYPES OF SCHOOLS............................. 196
h2 NUMBER AND PER CENT OF CITY AND EXEMPTEDVILLAGE SCHOOL PRINCIPALS DIDICATING THE NUMBER OF TIMES VARIOUS TESTS ARE GIVEN DURING THE SECONDARY SCHOOL PROGRAM............ 197
h3 NUMBER AND PER CBTT OF LOCAL SCHOOL PRINGIPAISINDICATING THE NUMBER OF THREES VARIOUS TESTS ARE GIVEN DURING THE SEGQIDARY SCHOOL PROGRAM . . 198
Ifh NUMBER AND PER CEJT OF PRINCIPALS INDICATINGTHAT VARIOUS TESTS ARE GIVEN IN THE DIFFEREI'JT GRADES— SU1#ARY, ALL TYPES OF SCHOOLS.......... 199
hë NUMBER AND PER CENT OF PRINCIPALS INDICATINGTHAT VARIOUS TESTS ARE GIVEN IN THE DIFFERENT GRADES— JUNIOR-HIGH SCHOOLS ONLY................ 200
h6 NUMBER AND PER CENT OF PRINGIPAIS INDICATINGTHAT VARIOUS TESTS ARE GIVS-I IN THE DIFFERENT ŒADES— FOUR-YEAR, FIVE-YEAR, AND SENIOR- HIGH SCHOOLS Œ L Y ............................. 201
U7 NUMBER AND PER CENT OF PRINCIPALS INDICATINGTHAT VARIOUS TESTS ARE GIVEN IN THE DIFFEREI'JT GRADES— SIX-YEAR HIGH SCHOOLS ONLY.............. 202
h8 NUÎ4BÏR AND PER CENT OF miNCIPALS INDICATINGTHE TIMES OF YEAR THAT VARIOUS TESTS ARE ADMINISTERED— SUMMARY, ALL TYPES OF SCHOOLS , . . 20^
h9 NUiem AND PER CEETT OF PRINCIPALS INDICATINGTHAT CEETABT SCHOOL PERSONNEL ADMDIISTER TESTS— SUMMARY, ALL TYPÎCS OF SCHOOLS . . . . . . 20?
^0 NUMBER AND PER CENT OF PRINCIPALS INDICATINGTHAT CERTAIN SCHOOL PERSONNEL ADMINISTER TESTS— CITY AND EXEIOTID VILLAGE SCHOOLS ONLY. , 208
5l NUI#PR AND PER CEIT OF PRINCIPALS INDICATINGTHAT CERTAIN SCHOOL PERSONNEL ADMINISTER TESTS— LOCAL SCHOOIS ONLY..................... 209
±x

LIST OF TABLES (Continued)TABIE PAGE
52 HUMBER AH) PHI CEMF OF PRINGIPAIS IHDICATIHG THAT RECORDS OF TEST RESULTS ARE KEPT IN THE LOCATIONS SHOWN— SUMMAET, ALL TYISSOF SCHOOLS................................. 210
53 NUMBER AND PER CENT OF HIINCIPALS INDICATINGTHAT TESTS ARE USED FOR THE PURPOSES LISTED . . . . 212
5U NUMBER AND PER CENT OF PRINCIPALS INDICATINGTHAT TESTS ARE USED FOR THE PURPOSES LISTED . . . . 213
55 NUMBER AND PER CENT OF PRINGIPAIS IM)ICATINGTHE TYPES OF INFORMATION RECORDED IN THE CUMULATIVE RECORDS USED IN THEIR SCHOOIS, BYTYPE OF SCHOOL DISTRICT AND TOTAL...........2l6
56 NUMBER AND PER CENT OF PRINGIPAIS INDICATING THAT CUMULATIVE RECORDS ARE KEPT IN THE LOCATIONS SHOWN, BY TYPE OF SCHOOL DISTRICTA m TOT'AL................................. 216
57 SCHOOL GRADES IN WHICH VARIOUS METHODS OF REPCETING PUPIL PROGRESS ARE USED, AS INDICATED BY11)5 PRINCIPAIS..............................220
58 FREQUENCY OF USE OF VARIOUS METHODS OF REPORTING AS INDICATED BY 1U5 PRINCIPAIS—SUMMARY, ALL TYPES OF SCHOOIS...............221
59 NUMBER Am PER CENT OF PRINCIPAIS INDICATING THAT DIFFERENT TYPES OF INFIRMAT ION ARE INCLUDED IN REPORTS TO PARENTS, SHOWN ACCORDING TO METHODSOF REPORTING..................................... 222
60 SCHOOIS HAVING NO SPECIALIZED GUIDANCE PERSONNEL. . 221;61 NUMBER OF SCHOOIS HAVING SPECIALIZED GUIDANCE
PERSONNEL WITH EVALUATION RESPONSIBILITIES—SUMMARY FOR ALL TYIES OF SCHOOIS.................. 225
62 NUMBER AND PER CENT OF PRINCIPAIS INDICATII-JGTHAT CERTAIN DUTIES ARE PERFORMED BT PERSONNEL HAVING EVALUATION RESP0N5IBILIPIES IN THEIR SCHOOLS— SUMMARY FOR ALL TYPES OF SCHOOIS........ 22?
X
LIST OF TABLES (Continued)TABIE PAGE
63 NL1ÏBER AM) PER GENT OF PRINCIPALS IMDICATINGTHAT CERTAIN DUTIES ARE PERFORMED BY PERSONNEL HAVING EVALUATION RESPONSIBILITIES IN THEIR SCHOOIS— SUMMARY FOR ALL TYPES OF SCHOOLS. . . . 228
6h NUMBER AND PER CENT OF PRINCIPAIS INDICATINGTHAT TEACHERS HAD RECEIVED IN-SERVICE TRAINING IN THE PAST TIREE YEARS IN VARIOUS ASPECTS OF EVALUATION.................................. 22?
65 NUMBER AND PER CENT CF PRINCIPAIS INDICATINGTHAT TEACHERS HAD RECEIVED IN-SERVICE TRAINING IN THE PAST THREE YEARS IN VARIOUS ASPECTS CF EVALUATION, SHCOTN BY METHODS OF TRAINING USED. • 231
6 6 NUMBER AND PER CENT OF HIINCIPALS INDICATINGTHAT CERTAIN TYPES CF PHYSICAL EXAMINATIONS ‘ARE ADICENISTERED IN THE DIFPERENT SCHOOL GRADES. 232
67 NUMBER AND PER CENT OF PRINCIPALS INDICATINGTHE NUMBER OF GRADES IN WHICH CENTRAL TYPESOF PHYSICAL EXAMINATIONS ARE ADMINISTERED. . . . 232
68 NUMBER AND PER CENT OF IRINCIPALS INDICATINGTHAT DEOTAL, VISION, AND HEARING EXAMINATIONS ARE ADMINISTERED IN EACH OF THE DIFFERENT SCHOOL GRADES WHO INDICATED THAT GENERAL PHYSICAL EXAMINATIONS ARE ADMINISTERED......... 23U
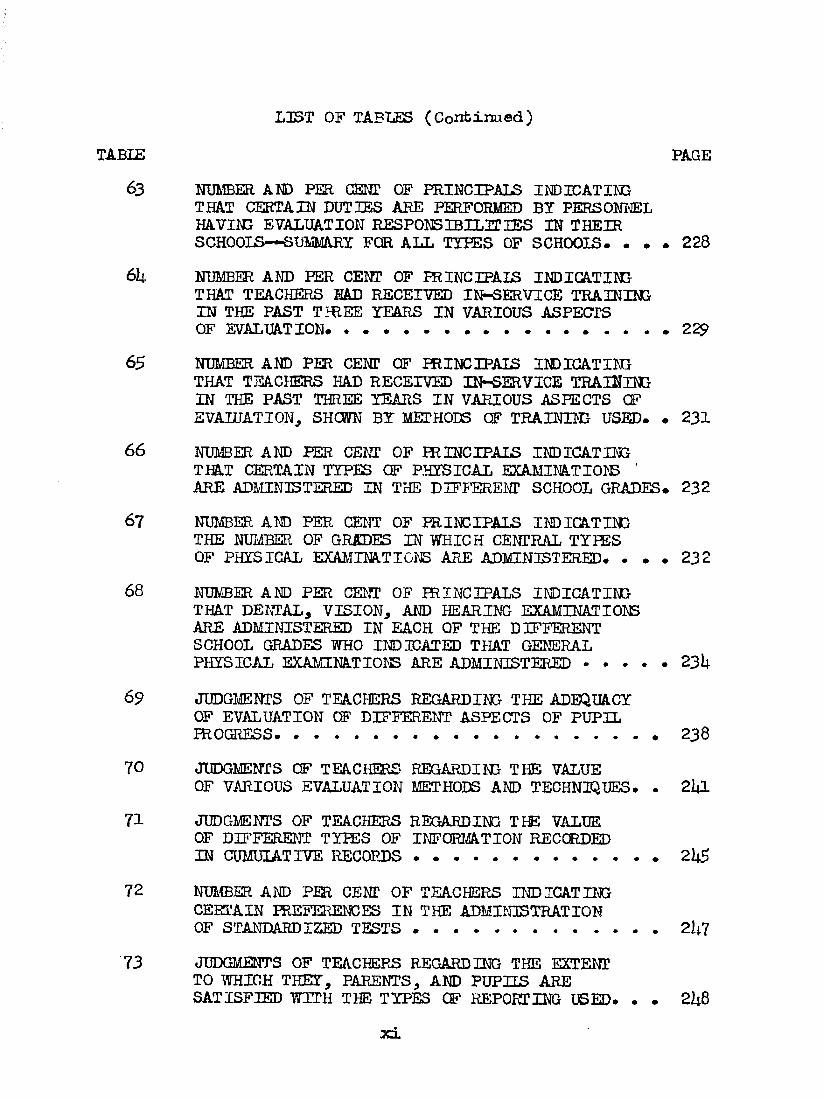
69 JUDGMENTS OF TEACHERS REGARDING THE ADEQUACYOF EVALUATION OF DIFFERENT ASPECTS OF PUPIL PROGRESS.......................................238
70 JUDGMENTS CF TEACHERS REGARDING THE VALUEOF VARIOUS EVALUATION METHODS AND TECHNIQUES. . 2I4I
71 JUDGMENTS OF TEACHERS REGARDING THE VALUEOF DIFFERENT TYPES OF INFORMATION RECORDEDIN CUMULATIVE RECORDS......................... 2k$
72 NUMBER AND PER CENT OF TEACHERS INDICATINGCERTAIN PREFERENCES IN THE ADMINISTRATIONOF STANDARDIZED TESTS......................... 2^7
73 JUDCMENTS OF TEACHERS REGARDING THE EXTENTTO TVHICH THEY, PARENTS, AND PUPILS ARESATISFIED WITH THE TYPES OF REPORTING USED. . . 2it8
XX

LIST OF TABLES (Continued)TABLE PAGE
Ih NmîBER AND PER CENT OF TEACHERS INDICATINGVARIOUS FACTCRS WHICH THEY BELIEVE ARE HIEVENTING SATISFACTCRY EVALUATION OFPUPIL PROGRESS................................. 2$0
1$ NUMBER AND PER CENT OF PRINCIPAIS INDICATINGTHAT THEY BELIEVE THE EVALUATION PROGERANB IN THE]R SCHOOIS ARE INADEQUATE......................251
76 NUMBER AND PER CENT OF PRINCIPALS INDICATINGVARIOUS FACTORS WHICH THEY BELIEVE ARE PREVENTING DEVELOPMENT OF AN ADEQUATE EVALUATION IROGRAM. . • 25L
77 STATUS OF DIFFERENT METHCDS OF REPORTING TOPARENTS AS INDICATED BY SCHOOL IRINCIPAIS-SUMMARY ALL TYEES OF SCHOOLS......................255
78 NUMBER AND PER CENT OF TEACHERS INDICATINGTHAT THEY USE CERTAIN EVALUATION METHODS AND TECHNIQUES^ BY TYPE OF SCHOOL DISTRICT ANDSELECTED GROUPS IN NUMBER CF TEACHER PER SCHOOL. . 313
19 NUMBER AND PER CENT OF TEACHERS INDICATINGTHAT THEY USE CERTAIN EVALUATION METHODS AND TECmnQUESj BY TYPE OF SCHOOL ORGANIZATION . . . . 315
80 NUMBER AND PER CECT CF TEACHERS INDICATINGTHAT THEY USE CERTAIN EVALUATION METHCDS AND TECHNIQUES, BY SEX AND SELECTED AGE GROUPS . . . . 317
81 NUMBER AND PER CENT OF TEACHERS INDICATINGTHAT THEY USE CERTAIN EVALUATION METHODS AND TECIWIQUES, BY SEIECTED (HOUPS ACCCHDING TOEXTENT CF TRAINING AND TEACHING EXPERIENCE . . . . 319
82 NUMBER AND PER CENT OF TEACHERS INDICATING THATTHEY USE CERTAIN EVALUATION METHODS AND TECHNIQUES,BY SELECTED GROUPS WITH REFERENCE TOIECENCY OFTRAINING AND WHETHER COURSE IN TESTS ANDMEASUREMENT WAS TAKEN IN PROFESSIONAL TRAINING . . 321
83 NUMBER AND PER CENT OF TEACHERS INDICATINGTHAT THEY USE CERTAIN EVAI.UATION METHODS AND TECHNIQUES, BY AVERAGE ENROLLMENT IN CLASSES • . . 323
8U NUMBER AND PEE CENT OF TEACHERS INDICATING THATTHEY USE CERTAIN EVALUATION METHODS AND TECHNIQUES,BY SUBJECT AREAS................................. 325
xL±

LnST OF TABLES (Continued)TABLE PAGE
85 NUMBER AND PER CEI® OF TEACHERS INDICATINGTHAT THEY USE CERTAIN EVALUATION METHODSAND TECHNL5UES, BY SUBJECT AREAS................... 32?
86 NUMBER AND PER CENT OF TEACHERS INDICATING THAT THEY USE CERTAIN EVALUATION METHODS AND TECHNIQUES, BY SUBJECT AREAS.....................
87 NUMBER AND PER CENT OF TEACHERS INDICATING THEEXTENT TO WHICH PUPIIS DISCUSS THEIR WRITTENWCRK IN CLASS...................................... 331
88 NUMBER AND PER CENT OF TEACHERS INDICATimTHE EXTENT TO WHICH PUPILS DISCUSS WORK ÎRODUCTS IN CLASS ........................................ 333
89 NUMBER AND PER CENT OF TEACHERS INDICATING THEEXTENT TO WHICH PUPILS DISCUSS THE EFFECTIVENESSOF GROUP DISCUSSIOI® IN CLASS....................... 335
90 NUMBER AND PER CENT OF TEACHERS i m H A T i m THE EXTENTTO WHICH PUPIIS DISCUSS THE OUTCOMES OF GROUP UNDERTAKINGS IN CLASS.............................. 337
91 NUirBER AND PER CENT OF TEACHERS INDICATING THEEXTENT TO WHICH PUPIIS DISCUSS THEIR W ΠK HABITS
CLASS........................................ 33992 JüDGIsÆENTS CF TEACHERS REGARDING THE ADEQUACY
OF EVALUATION OF SUBJECT ACHIEVEMENT OF PUPIIS. . . 3U293 JUDGMENTS OF TEACHERS REGARDmC THE ADEQUACY
OF EVALUATION OF ATTITUDES ΠPUPIIS............. 3kh
9U JUDGMENTS OF TEACHERS REGARDING THE ADEQUACYOF EVALUATION OF INTERESTS OF PUPIIS.............. 346
95 JUDGMENTS CF TEACHERS REGARDING THE ADEQUACYOF EVALUATION OF PERSONAL-SOCIAL ADJUSTMENTOF PUPILS. ........................................347
96 JUDŒimCS OF TEACHERS REGARDING THE ADEQUACYOF EVALUATION OF WORK HABITS CF PUPIIS..............349
97 JUDGMEmS OF TEACHERS REGARDING THE ADEQUACYOF EVALUATION OF THE HEALTH OF PUPILS................ 35l
xiil

LIST OF TABLES (Corrbinusd)TABLE PAGE
98 AVERAGE VALUE RATINGS INDICATED BY TEACHERSFCE VARIOUS EVALUATION METHCDS AND TECHNTiUES, BY TYPE OF SCHOOL DISTRICTAND TYPE OF SCHOOL CEGANIZATION................ 353
99 AVERAGE VALUE RATINGS INDICATED BY TEACHERSFOR VARIOUS EVALUATION METHODS ANDTECHNIQUES, BY SEX AND SELECTED AGE GROUPS. . . 355
100 AVERAGE VALUE RATINGS INDICATED BY TEACHERSFCR VARIOUS EVALUATION METHODS AND TECHNIQUES, BY SELECTED GROUPS ACCORDINGTO EXTE IT OF TRAINING AND TEACHING EXPERIENCE • 357
101 AVERAGE VALUE RATINGS INDICATED BY TEACHERSFCR VARIOUS EVALUATION METHCDS AM) TECHNIQUES,BY SELECTED GROUPS WITH REFERENCE TO RECENCY OF TRAINING AND WHETHER COURSE. IN TESTS AND MEASUREMENT l,mS TAKEN IN PROFESSIONAL TRAINING. 359
102 AVERAGE VALUE RATINGS INDICATED BY TEACHERS FCRVARIOUS EVALUATION METHCDS AM) TECHNIQUES, BY AVERAGE ENROLLMENT IN CLASSES................... 361
103 AVERAGE VALUE RATINGS INDICATED BY TEACHERSFOR VARIOUS EVALUATION METHODS AND TECHNIQUES,BY SUBJECT AREAS..................... 363
lOU AVERAGE VALUE RATINGS IldlCATED BY TEACHERSFOR VARIOUS EVALUATION METHCDS AND TECHNIQUES,BY SUBJECT AREAS................................... 365
105 AVERAGE VALUE RATINGS INDICATED BY TEACHERSFCR VARIOUS EVALUATION METHODS AND TECHNIQUES,BY SUBJECT AREAS............................. 36?
106 AVERAGE VALUE RATII'JGS INDICATED BY TEACHERSFOR DIFFERENT TYPES OF INFCRMATION IN CUMULATIVE RECCRDS, BY TYPE OF SCHOOL DISTRICT AND TYPE OF SCHOOL CRGANIZATION............................. 369
107 AVERAGE VALUE RATINGS INDICATED BY TEACHERSFCR DIFFERENT TYPES OF INFORiATION IN CUMULATIVE RECORDS, BY SEX AND SELECTED AGE GROUPS........... 370
108 AVERAGE VALUE RATINGS INDICATED BY TEACHERS FORDIFFERENT TYPES OF INFORMATION IN CUMULATIVE RECORDS, BY SELECTED GROUPS ACCORDING TO EXTENTOF TRAINING AND TEACHING EXPERIENCE...............371
xiv

LIST CF TABIES (Continued)TABLE PAGE109 AVERAGE VALUE RATINGS INDICATED BY TEACHERS
FOR DIFFERENT TYPES OF INFORMATION IN CUMUIATITE RECORDS^ BY SELECTED GROUPS CCTH REFERENCE TO RECENCY OF TRAINING AND WHETHER COURSE IN TESTS AND MEASUREMENT WAS TAKEN IN PROFESSIONAL TRAINING.................... 372
n o AVERAGE VALUE RATINGS INDICATED BY TEACHERSFOR DIFFERENT TYPES OF INFORMATION IN CUMUIATIVE RECORDS, BY AVERAGE ENROLLMENT IN CIASSES....................................... 373
m AVERAGE VALUE RATIIfIS INDICATED BY TEACHERSFOR DIFFERENT TYPES OF INFORMATION INCUMULATIVE RECORDS, BY SUBJECT AREAS..............37U
112 AVERAGE VALUE RATINGS INDICATED BY TEACHERSFOR DIFFERENT TYPES CF INFORMATION INCUMULATIVE RECORDS, BY SUBJECT AREAS..............37^
133 AVERAGE VALUE RATINGS INDICATED BY TEACHERSFOR DIFFEREI\T TYPES CF IIFQRMATION INCUMUIATIVE RECORDS, BY SUBJECT AREAS..............376
X V

LIST OF FIGURES
FIGURE PAGE1 NUMBÏE M D HER GENT OF SCHOOLS
FROM WHICH TOQUIRIES FOR PRINCIPALS WERE RECEIVED, BY TEACHER^SSOCIATION DISTRICTS............................... 35
2 NTJÎ'ÎBEE AND PER CENT OF SCHOOLS FROMWHICH INQUIRIES FOR TEACimRS V/ERE RECEIVED, BY TEACHER-ASSOCIATIONDISTRICTS................................ 36
3 NUMBER AND PER CENT OF TEACHERS FROMWHICH INQUIRIES WERE RECEIVED, BY TEACHER-ASSOCIATION DISTRICTS............. 38
XVI

A SURVEY CF THE EVALUA.TION OF PUPIL PROGRESS IN SELECTED SECONDARY SCHOOLS
OF OHIO
CHAPTER I
ORIENTATION TO THE STUDY
Evalmtion is a crucial aspect of the educative process. It is the process in which philosophy and practice are examined, reexamined, and reconstructed on the basis of experience and evidence for the purpose of giving direction to an educational program. In this process philosophy and practice come into an interacting relationship which may result in significant changes in either or both. Although it is assumed technically that a philosophy must be accepted before evaluation can take place, this merely serves the purpose of determining a starting point from which the process can proceed, and does not preclude the possibility that the philosophy itself may be modified, redirected, or reconstructed in the process. This is merely recognizing the validity of the nature of experience and the theory that experience is a moving, changing process. Evaluation, therefore, is not merely a concomitant of experience, but an essential part of it in which the judgment and values of the individual are involved.
This view of evaluation logically leads to the conclusion that the single most important aspect of evalmtion is the evaluation of piç)il progress or growth. The judgment and values of the individual, the values of the society in which he lives, and the
1

2nature of his experience must be brought into a relatively stable and meaningful relationship. This is the function of education and the school is the social agency which has as its primary purpose the attainment of this relationship. Thus, the most in^ortant function of evaluation, although not the sole one, is the evaluation of the progress and development of tiie individual pupil.
Inç)lications of this evaluation of the progress of the individual extend to every level of the educational system. Consequently, the value of any study in this area would be enhanced by including as much of the total range of education as possible. Furthermore, since evaluation is basic to the educational process, certain principles or characteristics will probably be common to all levels of formal education. In view of these considerations, a series of three doctoral studies to include elementary, secondary, and teacher education in Ohio was undeartaken in which individual investigators co-operated and collaborated in those phases which involved procedures applicable to all three studies, or which concerned background and theory common to the studies.
This dissertation is a report of the survey of evaluation of pupil progress at the secondary education level. Ençihasis is given to the practices and programs in the secondary schools of Ohio with some substantiating evidence regarding the principles of evaluation to be used in interpreting the survey data obtained from teachers and principals.

Need for the Study
An acceptance of the critical significance of evalxiation of pupil progress suggests a general basis of the need for study of this important phase of education* The fundamental nature of evaluation suggests further that such study should concern itself with the theoretical as well as the practical aspects of evaluation in order to provide a more comprehensive picture of its status*Past efforts in this area have tended to emphasize certain specific activities or aspects of evaluation in which theory was introduced implicitly. This suggests a need for an over-all survey which includes theoretical as well as practical aspects of evaluation.
The more general indication of need for a stuc of this typeis fortified by the absence of an over-all study for Ohio. Manystudies in the broad area of evaluation have been conducted, butnone for the purpose of attempting to obtain an over-all conceptionof current practice. A study by Fickes in the area of elementaryeducation approaches most nearly this type of study, but it wasrestricted to the value of certain evaluation techniques for teachers
1and was not based on data obtained solely from teachers in Ohio*Additional indications of need are provided by recurring
references in the literature and in professional contacts with teachers that evaluation is considered one of the most difficult
1James A. Fickes, "The Comparative Values of Selected Evalua
tive Techniques to Elementary-School Teachers," Iftipublished Doctor's dissertation, Columbus, Chios The Ohio State university, I9I4P,pp. 10-1 2 .
h
problems in teaching. Not only is it considered a perplexing problem area, but it is also an area in which expressions of a desire for greater competency and adequacy are frequently encountered. An expressed desire to make some progress can not be overlooked in establishing a need for this studg .
The basis of need suggested by these conditions is augmented by the necessity of knowing the present status with reference to generally accepted theory. In this respect the need for the stucÿr may be predicated on one or more of the principles accepted for the study and developed as a basis for interpretation of results. Principles particularly applicable are those dealing with the need to secure evidence regarding a variety of aspects of a situation and the need for determining present status. This stu^y does not presume to be truly evaluative in conformity with the principles of evaluation that are developed and accepted, but the basis for need of the study and suggestions regarding approaches to a study of evaluation are implied by such principles.
Purposes of the St^dy
Invoking certain principles deemed to be applicable to evaluation may establish a general basis of need for study and suggest ty implication purposes for which the study may be useful. An explicit statement of purposes, however, is needed to give direction to the study and to facilitate establishing the scope of the

5investigation. These purposes for this stu<^ are succinctly- stated as followst
1. To develop a comprehensive series of basic principlesapplicable to the evaluation of pupil progress or growth.
2* To determine the extent of agreement among authorities in evaluation regarding the validity and importance of the principles developed in the study.
3. To ascertain the evaluation practices enç>loyed by teachers in the secondary schools of Ohio, the judgments of teachers regarding the value of such practices, and the opinions of teachers concerning the adequacy of evaluation of pupil progress*
li* To ascertain the nature of programs of evaluation in the secondary schools of Ohio.
5- To study the practices of teachers and programs ofevaluation in the secondaiy schools of Ohio in relation to proposed principles of evaluation.
6. To determine the problems, difficulties, and needs in the field of evaluation of pupil progress.
Although this appears to be an imposing list of purposes, a general survey must necessarily include as margr phases of the problem area as possible. Practical limitations -will restrict the extent of treatment of any given phase, but an attempt should be made to obtain as mai%r relevant data as is feasible. Limitations imposed on the writer nske it necessary to recognize that this study must be considered a preliminary, general survey rather than an elaborate, exhaustive study. The latter type of investigation would require prolonged effort and a large variety of skilled, experienced research workers in education and otiier areas.

6In addition to the specific purposes listed, the recommenda
tions and conclusions of the study should have important implications for teachers, administrators, and personnel engaged in the professional preparation of teachers. This general statement of purpose of course is applicable to any survey, or status study.It is, however, particularly appropriate in this study because evaluation is fundamental to the educative process. Reference is made to this general purpose to indicate that the more specific purposes are not considered isolated or segregated elements, but represent the major emphases in this study which seemed practicable within the limitations.
Scope of the Study
The scope of this study is determined by the fact that it was conducted in conjunction with two other studies, by the purposes stated, and by certain practical limitations imposed on the writer# Limitations occasioned by these three factors are briefly summarized below:
1. The study of practices and programs of evaluation is limited to selected public secondary schools of Ohio.
2. A stuj^ of evalxiation of pupil progress, or growth, rather than a general investigation of evaluation in education was undertaken.
3» The principal sources of data are limited to questionnaire surv^ data, with some documentary evidence regarding principles of evaluation and findings in other studies.

ii* The survey data with respect to practices andprograms of evaluation in secondary schools include wliat appear to be the most significant practices and activities in the area of evaluation of pupil progress in relation to the guiding principles accepted for the study.An extensive study of specific methods or techniques of evaluation is not undertalcen.
6 , Analysis of the data from teachers and school principals is limited to a study of the data with reference to certain basic information about schools and teachers; a detailed internal analysis of the data is not attempted.
In the general planning for the series of studies, the three investigators decided that the best approach to the problem would be one in which the commonly, recognized educational levels were accepted as the basis for determinj.ng the phase of the problem in which each individual investigator was to work. This approach resulted in acceptance by mutual consent among the three individuals concerned of three commoiily recognized educational areas — elementary education, secondary education, and teacher education.The allocation of each area was also agreed to by mutual consent on the basis of expressed interest in each of the areas. This plan, therefore, limited this particular study to secondary education.
Tlie critical significance of the evaluation of pupil progress served to further define the limits of the series of studies. Acceptance of this definite, key aspect of evaluation provided a direction for the study vdiich appeared to offer the best opportunities for obtaining data regarding practices in the field of evaluation.

8Sources of data are limited to questionnaire survey informa
tion and documentary evidence because of limitations in finances and time available to the writer. An individual investigator attempting to secure extensive data must necessarily accept a compromise solution in the matter of the methods used for collecting data. The questionnaire method has been criticized frequently and severely in education and in other fields. However, numerous studies of the method have been made, and from such studies certain general conclusions recur frequently. First, the validity of the questionnaire method is directly related to the select character of the group of respondents and the interest of respondents in the subject of the questionnaire; second, a fifty per cent return usually establishes a trend in the data that is unlikely to change with a higher per cent of return; third, the familiarity of the respondents with the subject of the questionnaire increases the validity of the data obtained; fourth, the reliability of opinion questions tends to be as high or higher than that for questions of a factual type.
VThile this evidence supports the questionnaire method, it must be recognized that this method involves the problem of semantics in which the investigator has no oppoirtunity to make clarifications; neither can the investigator be certain that the sample of respondents is a representative sample. It is also impossible to check the relationship between the responses and practices in actual situations without employing other methods of research, or conductir^ prolonged

9technical study of large populations to establish techniques for judging the validity of responses by inference through internal analysis. These limitations are recognized in this study, and the interpretation of results must necessarily be made in view of them. With respect to the factors regarding reliability and validity it is believed that the questionnaire method is appropriate for the population used and the types of data sought. Extensive sampling, careful study in the construction of inquiries, and trial administration of inquiries were used in attempting to safeguard the validity of the data obtained.
The data of this study include information regarding the major aspects of the evaluation of pupil progress insofar as these could be ascertained from an extensive review of the literatture, experiences in university courses and seminars, personal teaching experience, and conferences with advisers. Aspects of evaluation included are:(l) formulating or establishing objectives, (2 ) techniques and methods of evaluation, (3 ) scope of evaluation, (ij.) cumulative records, (5 ) testing practices, (6 ) marking and reporting, (7 ) testing programs, (8 ) procedures used in evaluation, (9 ) participation by persons concerned with or affected by evaluation of pupil progress, (1 0 ) in-service training, (1 1) special personnel, (1 2) guidance, (1 3 ) self-evaluation, (1 4.) principles of evaluation, and (iS) factors preventing satisfactory evaluation. Sub-items to be included in the inquiries with respect to each of these aspects were

10selected on the basis of their probable value in revealing the extent to which the var-Ious principles developed in this study are being realized in practice.
Since this study is a general survey, specific methods, techniques, or practices are not studied intensively, nor is a detailed internal anaJ ysis of the data undertalcen. Detailed analysis is limited to study of the data with respect to certain basic information about schools and teachers. Internal analysis, therefore, is linited to certain relationships among items revealed in the process of analysis wi.th respect to basic information about schools and teachers. Within the personal limitations of the -writer, practical limitations imposed upon hi_m, and the limitations of the data this general restriction in scope appeared to be essential*
Reference to the general sources for determining the scope of this study with respect to aspects of evaluation has been noted. Selected references are cited briefly to substantiate the inclusion of the various aspects. This documentation also indicates that an attempt has been made to include a relatively comprehensive range of techniques, methods, and procedures related to evaluation. Principles are not included in this documentation, except incidentally, since they are discussed in Chapter III, -diich is devoted exclusively to this subject, Reference -will be made in succeeding pars,graphs to several survey studies related to the current investigation.Further reference to related studies will not be made in subsequent

11chapters of the dissertation, Althougli there is a large body of literature in the general field of evaluation, only a few studies were found which appeal'ed to be closely related to the present investigation.
A discussion by Trax].er entitled "Individual Evaluation" is pertinent to this study in showing some of the aspects to be considered,' Traxler defines the five essentials of effective individual evaluation as, (1) sampling, (2) expression of measures in comparable unzLts, (3) reliability, (U) use of techniques shot'Oing growth, and ( ) a continuous research program. He then discusses in more detail some characteristics of an effective program of individual evaluation in relation to the five essentials stated. Some of these essentiaJ_s are outside the scope of this studj , and others are controversial; but the characteristics described by Traxler suggest some major points of emphasis to be included. The principal characteristics discussed by Traxler are:
1, Stating objectives and selecting evaluative techniques appropriate to the objectives,
2, Studying each individual pupil in terriis of objectives,3, Obtaining information concerning mental ability, achieve
ment and growth in different fields of study, health and physical development, special aptitudes, interests, attitudes, and personal qualities.
2Arthur E. Traxler, "Individual Evaluation," New Directions
for Measurement and Guidance, American Council on Education, pp. 17-30.

12U, ut-ill70* np, cnmii] atlve records to show growth,S. Stvxly by the school staff leading to agreement
regarding objectives is desirable.Troyer and Pace in a more general statement have defined
3what they term the "tasks" involved in the process of evaluation.'The tasks identified are: (1) formui.ation of objectives, (2)defining objectives in terms of specific behavior, (3) identifying the sources of evidence, (U) developing methods for getting evidence, and ( ) interpreting results. These general statements suggest many of the aspects of evaluation for which an attempt is made to obtain data in this study,
A more specific indication of the range of practices and procedures in evaluation is indicated by hnchaelis in surveys of evaluation practices in county and city school systems of California conducted in 19L8^ and 19U9^ respectively. These surveys were based on information obtained from handbooks for teachers, school bulletins, a check list of selected aspects of evaluation, and conferences with personnel in charge of the evaluation program*The surveys revealed that evai-uative instruments and techniques used in school systems included, the following:
3Maurice E, Troyer ynd C, Robert Pace, Evaluation in Teacher
Education, pp. 1-2.
^ J, U. Michaelis, "EvaZI.nation in California County School Systems," California Joui'nal of EL^entary Education, 17 (August, 19U8), pp. 12-20,
^ J, U, Michaelis and C, Howard, "Current Practices in Evaluation in City School Systems in California," Journal- of Educational Research, k3 (December, 19ii9), pp. 2^0-60,

131 . Tests 1Ü. Diaries2 . Interviews IS. Sociograms3. Case studies 1 6 . Follow-up studiesh. Case conferences 17. Autobiographies
Croup discussion 18. Clinics6 . Anecdotal records 1 9 . Social case work7. Observations 2 0. Evaluative criteria8 , Files of sample materials 2 1. Stenographic reports9. Questionnaires 2 2. Recordings
1 0. Rating scal.es 23. Interaction content records1 1. Check lists 2lu Photographs1 2. Inventories 2S. Movies1 3. Logs 2 6. Pupils * graphs
Michaelis also found that the tests used quite extensively -were;(1) mental, (2) general achievement, (3) subject area, (U) personality, (5 ) interest, (6 ) aptitude, (7) work study habit,(8 ) language, and (9) sociometric tests. The most complete cumulative record systems provided: (1) personal information, (2 ) enrollment and attendance data, (3 ) home and community information, (I4.) school achievement and curricular experience data, (3 ) test scores, (6 ) health information, (7) special interest data, and (8 ) supplementary material. These findings provide some evidence of commonly used evaluation techniques and of the general nature of certain aspects of evaluation programs. Most of the classifications listed by Michaelis with respect to evai.uative techniques and

lUcumulative records are also included in this study. Certain differences and omissions ■will be apparent since one of the purposes of the present study is to find the methods and techniques used by classroom teachers and individual schools in the more immediate task of evaluating progress of pupils through the school program. Some of the techniques of evaluation included ty Michaelis appear to be directed primarily toward curriculum inçjrovement, specialized evaluation services, long-range evaluation of the work of the school systems, and programs of research*
Another study related to one inçiortant part of this study, techniques and methods of evaluation used by teachers, provides additional evidence. Fickes in 19U9 completed a doctoral dissertation at The Ohio State University in which he presented a list of twenty- nine techniques of evaluation.^ This list included a variety of techniques ranging from unrecorded observation to highly technical evaluative aids such as aptitude tests and projective methods.Although this list was developed for a study involving elamentary- school teachers, there is a great deal of similarity of basic methods of evaluation used at different educational levels, and the stu^y by Fickes represents an attempt to develop a relatively conplete list of techniques used in evaluation.
Albezd^y has stressed the need for determining the goals toward 5-----------
James A. Fickes, op. cit., pp. 65-66.

■wliich students and teachers are working. In this connection he has emphasized the need for co-operation, pupil-teacher planning, and a consideration of the means of evaluation from the beginning of a unit of study. This emphasizes the procedures to be employed among the participants in evaluation rather than specific techniques, although examples of the latter are also presented in a series of suggestive proposals.'
Mendenhall and Arisman have similarly stressed the importance of the procedures involved as well as the need to formulate objectives in terms of observable behaviors. addition, they indicate a needfor (1) methods of recording evidence that are clearly understood and readily available, (2) pupil-teacher co-operation in interpretation of data, (3) using results to project new plans, (U) self- evaluation, (5) establishing group as well as individual goals,(6) and relating needs and aspirations of the pupil to standards of appraisal. They also note the primary inçjortance of observation as an evaluation and appraisal technique.®
Documentation in the preceding pages indicates the great range of activities and procedures related to evaluation of pupil progress. Some of these are more directly relevant to practices and techniques used in the classroom, others to the broad area of evaluation of an educational program, and still others imply need for a consistent
7Harold Alberty, Reorganizing the High-School Curriculum, on. 318-26. ^ ' ^
8 C. B. Mendenhall and K. J. Arisman, Secondary Education, pp. 281-297. ""----

16philosopiQr in developing procedures that provide for greater participation in the evaluation process. This documentat 1 on is introduced to substantiate to some extent the various aspects of evaluation which are included in this study. Although the evidence obtained may be limited in many respects, an attempt was made to secure some data regarding all of the major phases of evaluation suggested by these citations and other sources noted previously.
Plan of the Study
The general design of this stui^ conforms with the design developed for the series of studies of which it is a part. This design was developed with the objective of securing data from a number of sources with respect to principles of evaluation and practices in evaluation in elementary, secondary, and teacher education in Ohio. Principles proposed in the studies were used as guides in determining the data to be collected and in interpreting the findings. It is believed that this approach will give a mere complete view of the status of evaluation of pupil progress, or growth, than a more narrowly delimited study. Data regarding principles of evaluation were collected from writings in the field of evaluation and a jury of authorities in evaluation. Data regarding practices of teachers and phases of evaluation that usually affect an entire school were obtained from teachers and principals in selected schools in Ohio for the studies in the elementary and secoadary

17areas; data regarding practices and programs of evaluation in teacher education were obtained from professional educators in colleges of education in Ohio, This general design thus provides evidence regarding both principles and practices. It also provides a basis for interpreting the findings with respect to practices and programs of evaluation, while at the same time indicating the practical limitations that are operative with respect to the principles.
The larger study was subdivided into three distinct investigations dealing with evaluation in elementary, secondary, and teacher education to be conducted by individual investigators interested in the respective areas. In each of these studies, however, the general design was used and the co-operative effort of the three investigators was utilized in those phases that were common to tlie three studies. This co-operative effort included the derivation and development of principles of evaluation, planning the general design for the stu^y, constructing inquiries and schedules to be used, and developing methods of tabulating and organizing data.
Since the principles proposed in this study are also the subject of one aspect of the survey conducted, they are discussed in detail in Chapter III with respect to sources of derivation, development, and present status as indicated by a survey of experts. This survey was acconplished by means of an inquiry form providing for a rating of agree-undecided-disagree for each principle and a rating on a three-point scale with respect to the inportance of each principle

18that was given an "agree" rating* A copy of this inquiry is included in Appendix A*
Basic data with reference to practices and programs of evaluation in selected secondary schools of Ohio were obtained through the use of instruments to be completed by teachers and principals. These instruments will hereafter be referred to as inquiries since certain characteristics of questionnaires, schedules, and rating scales are incorporated in them. The inquiries were designed subsequent to the development of the list of principles with the objective of obtaining data that could be interpreted in relation to the principles. This approach provided a means of obtaining some indication of the effectiveness of the principles in practice among workers in the field as well as serving as a guide to interpreting data regarding practices.
These instruments consisted of one inquiry for teachers and one for school principals. Copies of the inquiries are included in Appendix A. The organization of the inquiries was designed to present the request for data in an order which it was believed would appear to be a logical and convenient sequence to the respondent. This organization does not parallel either the organization of the data in this report ot* any logical ordering of the principles. The type of organization required for presenting data frequently differs from the organiarational manner of collecting it, and data of the type sought were relevant to several principles in inaxy instances

19which precluded any reasonable organization in this manrjer. Furthermore, it was desired to avoid influencing the respondents unduly by suggesting that their responses should conform to some ideal or pattern»
The primary purpose of the inquiries was to obtain extensive data regarding the major aspects of evaluation of pupil progress. Tentative drafts were submitted to teachers and graduate students for suggestions, criticisms, and general reactions. A number of changes indicated by this trial administration were incorporated in the inquiries which were re checked with graduate students and faculty membei's. These final approved forms were then reproduced in quantity in mimeograph form for mailing to teachers, principals, and authorities in evaluation.
Each of the inquiries was constructed so as to include only the type of data with which each of tte different groups of respondents could reasonably»- be assumed to have considerable familiarity. This principle of questionnaire construction indicated the inclusion of the following general aspects of evaluation for each of the groups.
INQUIRY FCR TEACHERS
1. TechniqtBss and methods of evaluation used in the classroom2. Scope of evaluation3» Formulating and establishing objectivesU* Cumulative records5* Testing practices
206. Marking and reporting practices 7* Pupil self-evaluation8. Guidance9. Factors preventing satisfactory evaluation10. Participation ty different persons concerned with the
evaluation11, Procedures used in evaluation
INQUIRY FCR FRINCIPAIS
1. Testing program2. Cumulative records 3* Reporting to parents U, In-service training 5* Special personnel6, Procedures used in evaluation?• Factors preventing development of a satisfactory program
of evaluation
INQUIRY FCR AUTHORITIES IN EVALUATION
1. Principles of evaluation of pupil progressa. Each principle to be rated as agree-undecided-
disagreeb. Each principle eliciting an "agree" rating to
be rated on a three-point scale regarding its importance or significance

212, Free response for addition of other principles or for
comments and criticisms regarding the principles presentedm general, the items of information requested in the inquiries
were designed to permit the respondent to answer by checking, circling, or entering a number or letter in a blank space provided. Blanks for entry of other responses were provided where responses different from those listed were likely to occur. This type of inquiry seemed to be most suitable since it is easily answered, it facilitates organization and tabulation of responses, and it is easily coded for the use of business machines in tabulating and analyzing data.The last mentioned advantage was particularly important in this stucfy.
All responses, except free responses, were coded and punched on IBM cards. Tabulation and analysis of data were accomplished ty using IBM card-sorting and tabulating equipment. The number of respondents and the length of the inquiries required the use of every means available to reduce the time and effort expended in tabulation. Moreover, the use of business machines tends to increase the accuracy of tabulation.
In summary, the principal characteristics of the design of the stucty are* (1) development of a comprehensive list of principles applicable to evaluation, (2) construction of inquiries designed to collect evidence relevant to the principles, (3) a survey of the data collected, (U) interpretation of the data in relationship to
22principles, and ($) a co-operative approach on common problems by tliree investigators studying evaluation at three educational levels — elementary, secondary, and teacher education*
Sampling Techniques
Three separate sanples were required within the general design of this study: (1) a selected list of authorities in the field ofevaluation, (2) a sample list of schools to whidi inquiries were to be sent, and (3) a sample list of teachers to whom inquiries were to be sent. The technique used in selecting each of these samples is explained in the order in which they are referred to above*
The general criteria used for selecting authorities in the field of evaluation were that the sample should include persons who had made significant contributions to the literature, who had had extensive experience as teachers in the area of evaluation, or who had conducted research or programs in evaluation. The list of authorities developed in accordance with these criteria did not include all persons who might be considered authorities with respect to one or more of the criteria, but a selected group who appeared to have had a prolonged interest in the field of evaluation and were, therefore, likely to have given consideration to the basic principles applicable to evaluation* This sample of authorities, therefore, was not an extensive one, but a select list which Included persons pursuing a variety of interests and careers in evalmtion in

23education. The final sample included the names of twenty-seven persons with professional interests in evaluation extending beyond the general interest that all professional educators have to some extent with reference to evaluation of their own work* The names along with the professional positions of these persons as of January 1, 1953 are presented in Appendix B*
The primary objective in the sampling procedure used to determine the teachers and schools to which inquiries were to be sent was to obtain proportionate numbers of teachers for each region of the state ty types of school districts. The definition of regions is given in Table 1 and in Appendix B. Secondary consideration was given to the proportionate number of schools in each region, and to the types of school organization represented in the list of schools selected. (See Appendix B) This technique cannot be considered a true representative sanple in the technical sense, but due to the size of the sample and the attempt to include approximately the correct proportion of schools according to different types of districts and different types of school organisation this is considered to be adequate to obtain typical data for this study.
A mailing list for teachers was compiled by selecting the name of every second teacher from the principals' reports for the schools selected on file in the State Department of Education. The mailing list for principals was conpiled from the Directory of the State Department of Education. Inquiries were mailed to teachers and principals in April, 1952. Characteristics of the teaciBr, including

2Umajor teaching assignment, age, sex, experience, professional training and so on, were not considered in making the selection.These factors were assumed to be distributed ty chance approximately in proportion to the true distribution among the total number of teachers in Ohio.
The total number of secondary-school teachers in each of the four regions of the state is presented in Table 1, classified by- types of school district and by total. This table shows the percentage of the total number of teachers in the state that are found in each region. Table 2 shows the number of schools selected in each region of the state, classified by types of school organization. Numbers in parentheses in this table indicate the number of schools that should have been included in the sample if mathematical distribution had been followed. This mathematical distribution was not followed exactly because of fractions involved and the detailed analysis required to obtain representativeness for type of school organization. The distribution of schools by teacher-association districts is shown in Table 3» It should be noted that the procedure of dividing the state into four arbitrary regions was adopted for convenience in computation. All future reference in the stut^ will be to subdivisions of the state by teacher-assod a tion districts. After the original computations had been made, teacher-association districts were used on the inquiries to provide teachers an opportunity to indicate in which part of the state they were teaching. Subsequent to the development of the inquiries it

25was decided to i;ise a code number to identiiy each inquiry which would have permitted omission of this item of data from the inquiries.
TABLE 1NUMBER^ OF TEACHERS IN CITY, EXEMPTED VILLAGE, AND LOCAL SCHOOIS LISTED IN THE DIRECTORY OF THE STATE DEPARTMENT OF EDUCATION (1951 - 5 2 ), CLASSIFIED BT REGIONS-» OF THE STATE
Type of school district Northeast
Region* of state Northwest Southeast Southwest
City 5 ,0 7 7 1 ,3 5 0 1,342 2,064Exempted village 1;08 272 225 289Local 2,U5U 1,626 _ 1,437 1 ,8 3 8
Total 7,939 3,2U8 3 ,0 0 4 4 ,1 9 1
Per cent of total in each region U3 18 16 23
* Region of state - an arbitrary subdivision including twenty-twocounties in eachof the regions designated.
1Does not include teachers in vocational and night schools.

26table 2
SAMPLE OF SCHOOLS SELECTED FOR MAILING LIST, CIASSIFIED BÏ TYPE OF SCHOOL DISTRICT, TYPE OF SCHOOL ORGANIZATION, AND REGION^ OF THE
STATE
Region of Junior- Four-year Senior- Six-yearstate high high high high Total
City schoolsNortheast 12 (1 1 ) 5(8) .' W ) 8 (U) 29Northwest 3(2) 3(2.5) 1 (1 ) 2(2.5) 9Southeast U(U) 3*(2) 1 (1 ) 3(2) 11*Southwest 5(ii) _ 2 (U)_ 2 (2 ) 6(4) 15
Total 2U(2 1 ) 13*(16.5) . 8 ( 9 ) . 19(12.5) 64*Exempted village schools
Northeast 2 (1 ) 2C3T 4Northwest 1 (1 ) 3(3) 4Southeast 1 (1 ) 3(3) 4Soubinrest K .5 ) _ 1(.S)_ _ 2(3)____ 4Total K .5 ) S(3.5)_. . 1 0 (1 2 1 16
Local schoolsNortheast 10(9) 36(36) 46Northwest l ( - 5 ) 8(8.5) 28(29) 37Southeast 10*(7.5) 20(18.5) 30*Southwest .. . 2(1.5) 6(7) . 31(25.5) 39
Total 3(2) 3hH32) 115(109) 152*
Grand Total 28 52** 8 144 232**
* Includes one five-year high school. -N"* Includes two five-year high schools.
IRegion of state - an arbitrary subdivision including 22
counties in each of the regions designated.Not et Numbers in parentheses indicate approximate number of schools
which should have been included in the study according to mathematical calculations. This mathematical distribution was not followed strictly because of fractions involved and the departure from the original sampling technique that would have resulted from rigid acceptance of this mathematical distribution, (i e Appendix B. )

27TABLE 3
NUMBER OF SCIIOOIS TO WHICH INQUIRIES FOR PRINCIPALS AND TEACHERSWERE SENT, CLASSIFIED BY TYPE OF SCHOOL ORGANIZATION, TYPE OF
SCHOOL DISTRICT, AND TEACHER ASSOCIATION DISTRICT
Teacheiv associât ion district
Junior-high
Four-year Senior- high high
Six-yearhigh Total
City schoolsNortheastern 12 ir^ 3 8 27Northwestern 1 3 1 2 7Central 6 1 3 3 13Southeastern 2* 1 3*S out hire stem il 2 il 10Eastern 1 1 1 1 ilTotal 2li 1 3* 8 19 6ii*
Exeng>ted village schoolsNortheastern IL 1 2Northwestern 1 3 ilCentral 2 2Southeastern 2 2Southarestern 1 1 1 3Eastern 2 1 3
Total 1 5 10 16
Local schoolsNortheastern 10 27 37Northwestern 1 7 25 33Central 1 il* 30 35*Southeastern 3 8 11S out hwe stern 1 5 11 17Eastern S 111 19Total 3 3ii* ii5 l52*Grand Total 28 52** 8 iWi 232**
Includes two five-year high schools*
28but since there was no assurance that respondents would not destroy the identification number this item was retained in the inquiries as a second source of data for tabulating returns. Tabulation of returns with respect to this item was confirmed by means of the cocfe number. Da relatively few cases did this response prove to be incorrect.
In Tables U and 5 the distributions of the selected sample of teachers for the regions of the state and teacher-association districts are shown, classified by type of school district and type of school organization. These tables are self-explanatory and are included to show that the sample was based on the distribution of teachers in Ohio. Data in these tables when compared with data on inquiry returns reveal that the returns are not unduly influenced by responses from a particular area in Ohio.
Diquiry Returns
All of the data in this stucty" are based on returns obtained without employing follow-tç) procedures. Since it appears that the general trends established are not affected to any great extent after a $ 0 per cent return is attained, it was deemed desirable not to use follow-up if this percentage of return could be approached approximately. This decision was supported also ty the possibility that biased responses might result from repeated requests for information, and by the need for limiting costs.

29TABLE h
NIMBER OF TEACHERS TO TNHOM INQUIRIES WERE SENT, CLASSIFIED BY TYPE OF SCHOOL CRGANIZATION, TYPE OF SCHOOL DISTRICT, AND REGION^ OF THE
STATE
Region of state Juniorhigh
Four—year Senior- high high
Six-yearhigh Total
Northeast 187Ci^ schools
l o r ^ m 123 539Northwest 37 67 10 2U 138Southeast 36 29* 29 71 165*Southwest 78 15 59 lilt 266
Total 338 216* 222 332 1108*
NortheastExempted village15
schools ■.. 21 ■ 36Northwest 8 37 U5Southeast U 21 25Southwest 5 8 26 39Total 35 io5 iu5
NortheastLocal schools
U8 189 237Northwest h 30 137 171Southeast 53* 115 168*Southwest 11 Uh iWl 199
Total 15 175* 585 775*Grand Total 358 If.26** 222 1022 2028**
Tncludes two five-year high schools.
Region of state - an arbitrary subdivision including 22counties in each <a£ the regions designated.

30TABLE 5
NUMBER OF TEACHERS TO WHOM INQUIRIES 19ERE SENT, CLASSIFIED BÏ TYPEOF SCHOOL ORGANIZATION, TYPE OF SCHOOL DISTRICT, AND TEACHER-ASSOCIA
TION DISTRICT
Teacher-associationdistrict
Junior-high
Four-year Senior- high high
Six-yearhigh Total
City schoolsNortheastern 195 93 lùp 123 520Northwestern 10 67 10 2h 111Central 5h 1 1 88 91 211Southeastern 18* 9 27*Southwestern 69 15 59 113Eastern 10 12 _ 26
Total 33^ èl6* 2È2 332 iio8*Exempted village schools
Northeastern 9 12 21Northwestern 6 37 15Central 19 19Southeastern 15 15Southwestern 5 8 13 26Eastern 10 9 19Total 5 35 115
Local schoolsNortheastern 13 lU6 189Northwestern h 33 111 151Central 6 31* 153 190*Southeastern 18 53 71Southwestern 5 26 67 98Eastern 2U .52 76
Total 15 175* 5B5 775*Grand Total 358 1426** 222 1022 2028**
■Ü-» Includes two five-year high schools*

31The ntnnber of respondents and per cent of return for the
different types of inquiries are presented in a series of tables and figures in the pages immediately following* In Table 6 a general summary of all returns is shown. Data for the returns from authorities in evaluation are shown only in this table since no analysis of distribution of these returns is possible. Returns from teachers and school principals are analyzed as to distribution by schools among teacher-association districts, types of school districts, and types of school organization. In Tables 7 and 8 are shown the number and per cent of schools from which responses of principals and teachers were received. In Figures 1 and 2 the totals are presented on maps showing the extent of returns from different teacher-association districts. Since the inquiry to principals involved only one person in each school, no further analysis of these returns is necessary.An analysis of returns from teachers is shown in Table 9 and Figure 3* This analysis is also made as to distribution among types of school districts and types of school organization for each teacher- association district.
In all instances except for the number of teachers responding to the inquiry, the percentage of return exceeded 50 per cent.Returns from authorities amounted to 78 per cent and those from principals to 63 per cent. The per cent of schools from which inquiries for teachers were received reached 91 per cent. For the one exception, number of teachers, the per cent of response approached the 50 per cent level closely with U5-U per cent of return. These figures and

32all data in the study relating to returns are based on the number of usable inquiries returned. The number of inquiries -which were returned, but which were not usable, are listed belcw. Since the number was relatively small, only the total is shown and computations of per cents are omitted.
NUMBER OF INQUIRIES RETURNED WHICH WERE NOT USABLE
Type of inquiry NumberTeachers 15Principals 3Authorities in evaluation 0
Most of these inquiries were returned because the individuals concerned were no longer teaching, had changed positions, or had personal reasons, such as accidental injuries, for not completing the forms*
TABLE 6 SUMMARY OF INQUIRY RSTURÎB
classification of returns Number returned Per cent of return
Authorities in evaluation 21 78Teachers 921 hS
Principals II4.6 63
Schools from which inquiries for teachers were received 211 91

33TABLE 7
NUMBER OF SCHOOLS FROM WHICH INQUIRHES FCR PRINCIPALS WERE RECEIVED,CLASSIFIED BY TYPE OF SCHOOL ORGANIZATION, TYPE OF SCHOOL DISTRICT,
AND TEACHER-ASSOCIATION DISTRICT
Teache3>-association district
Junior- high
Four-year Senior- Six-year high high high
Total Per cenofreturn
City schoolsNortheastern 9 1 S 1 19 70Northwestern 1 3 1 2 7 100Central 3 1 1 3 8 62Southeastern 1* 1 2* 67Southwestern h 1 1 6 67Eastern 1 1 2 50
Total 17 8* 5 Ih iUi* 70Exençited village schools
Northeastern 0Northwestern 1 2 3 75Central 1 1 50Southeastern 2 2 100Southwestern 1 1 33Eastern 1 1 2 67Total 2 ? 9 56
Local schoolsNortheastern 7 l6 23 61Northwestern 1 k 16 21 6UCentral 1 19 25* 69Southeastern 1 1 2 18Southwestern 1 2 8 11 65Eastern h 7 11 58
Total 3 23* 61 93* 6oGrand Total 21 27-»Ht 5 95 1Ù6** 63* Includes one five-year high school.** Includes two five-year high schools.

3k
TABLE 8
NUMBER OF SCHOOLS FROM WHICH INQUIRIES FCR TEACHERS WERE RECEIVED,CLASSIFIED BY TYPE OF SCHOOL ORGAN EAT ION, TYPE OF SCHOOL DISTRICT,
AND TEACHER-ASSOCIATION DISTRICT
T e ache rt» a s so c ia tion district
- Junior- high
■ Four-year high
Senior-high
Six-yearhigh
Total Percent of return
City schoolsNortheastern 12 3 2 10 27 100Northwestern 1 3 1 2 7 1 0 0Central 5 1 3 k 13 100S o uthea stern 2-K- 1 3* 100Southwestern h 2 3 9 90Eastern 1 1 1 3 75Total 23 12* 7 26 62* 97
Exempted village schoolsNortheastern 1 1 2 100Northwestern 1 3 k 100Central 2 2 100Southeastern 2 2 100Southwestern 1 1 1 3 100Eastern 1 1 33Total 1 3 10 ih 33- ■■
Local schoolsNortheastern 8 33 89Northwestern 1 6 22 29 88Central 1 7* 2k 32* 91Southeastern 3 8 11 100Southwestern 1 3 11 15 88Eastern 3 12 15 pTotal 3 lo* 162 135-* Ü9Grand Total 27 7 132 211** 91* Includes one five-year high school .
Inclixies two five-ysar high schools.

WILLIAMS LUCAS [GEAUGA' WOOD TRUMBULL
ERIEdefiance.Jme TSUMMIT
SENECANorth western Northe as tePAULDINGPUTNAM31 SC70 pe STARKr ce n t ,JwyandotVAN WERT I 42 sch(|oïs
! 64 per icentRROLL
MarionMERCERAUGLAIZE
COSHOCTON I HARRISON !k uiSHELBYDELAWARE1 LICKINGCHAMPAIGN
! CentralGUERNSEYschools Der c _ J nc)blb
GREENE
PtRRY FAIRFIELD~1
A ^HOCKING --j--1Southaa^tè.I ATHEN VINTON L
6 sc
FAYETTE
i BUTLER / ROSS
JSouthweste^
FIGURE
NUMBiR AND PER C0JT OF SCHOOLS FROM WHICH INQUIRIES FOR PRINCIPALSWERE RECEEVHD, BY TEAGHER-ASSOCIATION DISTRICTS

— IWILLIAMS
LUCAS [GEAUGAOTTAWA' WOOD TRUMBULL iCUYAHOGASANDUSKY
DEFIANCE PORTAGEJmeiNorthelastebn
MEDINA I SUMMITPAULDING^ SENECANorthwestern.
HANCOCKlools
PUTNAM40 sc
VAN W E R -T jJ 9 1STARKc e n t r'WYANDOT COLUMBIANA6 2 sohc
! 9 4 p e rHOLMES
-----LgharrisonH kCOSHOCTONSHELBYDELAWARE
I CHAMPAIGNMIAMI C e n t r a l
MUSKINGUM GUERNSEY19 school 7E per_r<re
hCLARK
Jnoble[PERRY FAIRFIELDl
HOCKING
PREBLE
FAYETTE
S O U the a a t e JtinI ATHENSBUTLER CLINTO / ROSSVINTON L16 Bchpols
î0Q-.jpe|’ offifiRtJACKSON
Jsouthv e s t e
FIGURE 2NUTffiER A m FEE CENT OF SCHOOLS FROM WHICH INQUIRIES FOR TEACHERS
WFRE RECEIVED, BY TEAGHER-ASSOCIATION DISTRICTS
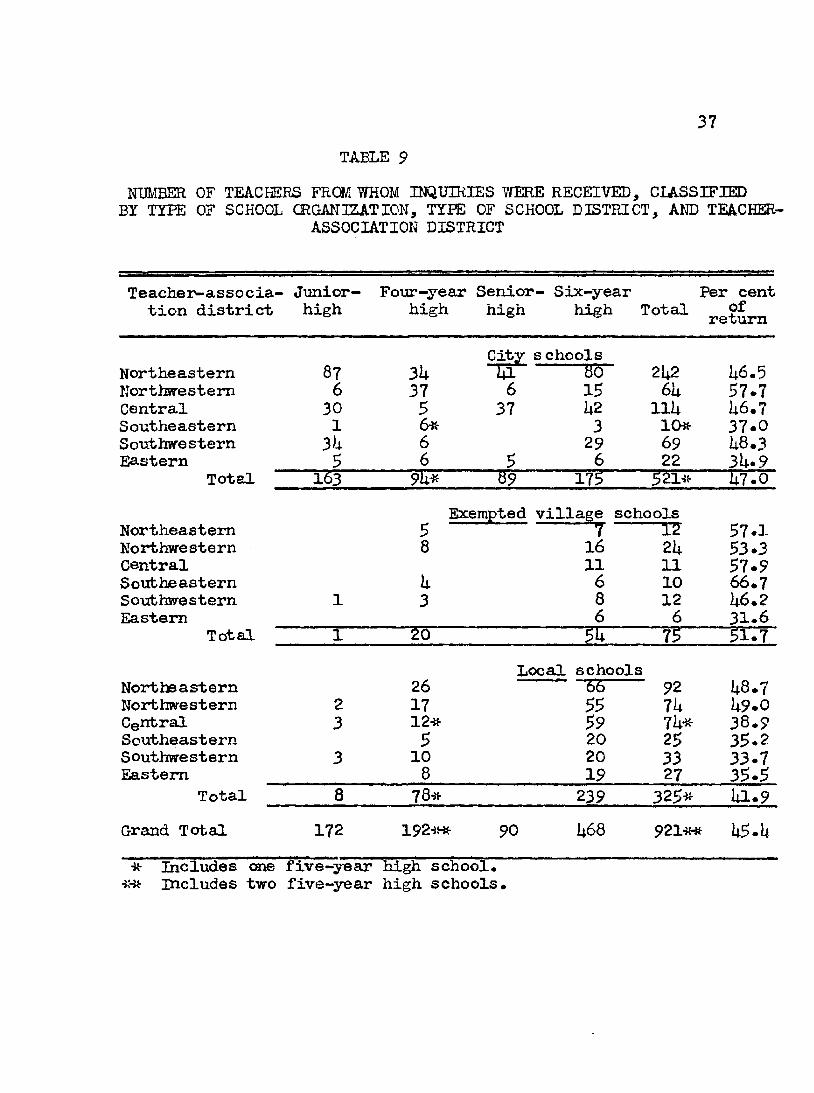
37TABLE 9
NUMBER OF TEACHERS FROM WHOM INQUIRIES WERE RECEIVED, CLASSIFIED BY TYPE OF SCHOOL ORGANIZATION, TYPE OF SCHOOL DISTRICT, AND TE&CHER-
ASSOCIATION DISTRICT
Teacher-associa- Junior- Four-year Senior- Six-year Per centtion district high high high high Total ofreturn
City schoolsNortheastern 87 3U I4I 80 21+2 U6.5Northwestern 6 37 6 15 6U 5 7 .7Central 30 5 37 U2 llU U6 .7Southeastern 1 6* 3 lOi 3 7 .0Southwestern 3h 6 29 69 L8.3Eastern 5 6 5 6 22 3U.9Total 163 89 17è 521* li7.0
Exempted village schoolsNortheastern 5 7 12 5 7 .1Northwestern 8 16 21+ 5 3 .3Central 11 11 5 7 .9Southeastern k 6 10 66.7Southwestern 1 3 8 12 86.2Eastern 6 6 3 1 .6
Total 1 ±0 75 5 1 .7
Local schoolsNortheastern 26 66 92 8 8 .7Northwestern 2 17 55 7h 8 9 .0Central 3 12* 59 7i+* 3 6 .9Southeastern 5 20 25 3 5 .2Southwestern 3 10 20 33 3 3 .7Eastern 8 19 27 3 5 .5
Total 8 78* 239 3 2 5* 8 1 .9
Grand Total 172 192** 90 U68 921** 85.8*-3HÎ- Includes two five-year high schools.

LUCAS 1WILLIAMS FULTON fCÊAUOA
OTTAWA1____SANDUSKY
' WOOD CUYAHOGAdefiance PORTAGE
SENECANorth r/estern or thePAULDINGHANCOCK
162 teachers ___5 3 P ' ^ r cenÿw Y A N D O T
Fallen' f1____1 STARKchers cent |snflfi$LL
VAN WERT 346 tea
taARIONMERGER HOLMESAUGLAIZELOGAN COSHOCTON L_
DELAWAREDARKECHAMPAIGN
i Central rI _ h
Eaj^e r — rKÎNiÜM raUERNSEY |MUSKINGUiTTaUERNSEY | BELMONT53 tea.chejrs
PREBLECLARK j S
I 199 tea/cherafmontgomerÿI— pei cent
greene' PIfŸËTTË
PICKAWAY
/ ROSS ‘----
jPERRYFAIRFIELD 1
h— 'HOCKING ,Southea^J-e _^ ATHENSVINTON I45 teacpera
p4l-iper fc««ttb’
WARREN
Southv,
BUTLER CLINTO
%este
3? pe^nrü^t.JnÔBLE [MONROE
MORGAN
WASHINGTON
GALLIA
FIGURE 3NUl'lBER AND PER. CENT OF TEACHERS FROM WHOM INQUIRIES WSRE RECEIVED,
BY TEACHERWISSOCIATION DISTRICTS

CHAPTER II
DEVELOPMENT CF THE THEORY OF EVALUATION OF PUPIL PROGRESS IKAMERICAN EDUCATION
The lise of the term "evaluation” with reference to tlie progress of piq)ils toward the attainment of the objectives of an educational program is a relatively recent development in education. The concept was developed in the Eight-Year Stuc^ and has been elaborated and supplemented since that time. Originally, one of the fundamental principles of evaluation was that objectives must be known and analyzed in order to evaluate the progress of pipils in an educational program. This principle is still a basic premise in evaluation theory. Although this principle has been articulately stated only in very recent years, it should not be assumed that no planned appraisal of pupil progress was made prior to the formulation of this rationale* Evaluation as a concept grew out of the extension and broadening of the objectives of education, and a continuing reinterpretation of democratic philosophy. Prior to this change in philosophy and purpose, various methods and concepts of determining pupil progress were prevalent, all of which were more or leas related to the educational objectives of the time. The purpose of this chapter is to trace briefly some of the outstanding highlights in the development of this function in American education*
Appraisal of Pupil Progress in Early American Schools
In early American schools the primary concerns were memoriter39

Uolearning and pupil conduct. The almost exclusive domination of these two factors in the educational program is illustrated by "An Account of School Life at Phillips Andover Acadeny, 1780."
School begins at eight o'clock with devotional exercises; a psalm is read and sung. Then a class consisting of four scholars repeat memoriter two pages in Greek Grammar, after which a class of thirty persons repeats a page and a half of Latin Grammar; then follows the "Accidence Tribe," who repeat two, three, four, five, and ten pages each. To this may be added three who are studying arithmetic; one is in the Rule of Three, another in Fellowship, and the third is in Practice. School is closed at night by reading Dr. Doddridge's Family Expositor, accompanied by rehearsals, questions, remarks and reflections, and by singing of a hymn and a prayer. On Monday the scholars recite what they can remember of the sermons heard on the Lord's Day previous; on Saturday the bills are presented and punishments administered.^Ih these schools the method as well as the substance of edu
cation was frequently quite rigidly prescribed. The Code of Regulations for Middlesex County, Connecticut, 1799 reveals this approach to educational method. The Code provided:
Proper lessons in two or more days may be a review of the preceding lessons of those days, and one lesson in each week a review of the studies of that week. The sum of this review, fairly written or noted in the book studied, may be carried by the scholars, each Saturday, to their respective parents or guardians.
Scholars equal in knowledge ought to be classed together. Those whose progress merits advancement should rise to a higher class, and those who decline by negligence should be degraded.^
TEdgar W. Knight and Clifton C. Hall, Readings in American
Educational History, pp. U69-70.2Ibid., pp. U76-77.

laThat the theory and practice in education remained quite
rigid and changed little from the time of the nation’s founding is apparent in Payne * s revision in 1885 of Page ’ s Theory and Practice of Teaching originally published in 18 7» In this authoritative work the purposes of formal education were defined as follows:
1* To develop the intellectual faculties, so as to produce robustness of mind and habits of ready and accurate thinking.
2. To furnish the mind with knowledge for use.3* To impart skill in the use of instrumental knowledge.-Even in that day, however, education had additional purposes
as indicated by Page and Payne. In a chapter on responsibilities of the teacher the following were enç)hasized:
1. The teacher is in a degree responsible for the bodily health of the child.
2. The teacher is mainly responsible for the intellectual growth of the child.
3* The teacher is in a degree responsible for the moral training of the child.
U. The teacher is to some extent responsible for the religious training of the young.b
3 W. H. Payne, Theory and Practice of Teaching, p. 102.h Ibid., pp. 35-5U.

U2These responsibilities, however, were hardly puiposes in the
full sense of the term. They were accepted as subsidiary aims to facilitate teaching, to protect the pupil from the method of the school, and to insure that morality and religion taught in the home were bolstered so that the main purpose of the school - intellectual training - would not be turned to evil ends.
Payne shews clearly that the methods of determining pupil progress were the assignment of lessons, recitation, review, oral examinations, and the use of the "common-place book.” While it was emphasised that review should not merely be that of questions of the textbook, but the “application of principles to practical life” as well, and although many teaching practices recommended would be acceptable and desirable today, the dominance of mechanical ritual is apparent. The chief means employed by teachers for detemining progress of pupils were recitation, review, and in some cases oral examinations." Examinations were within the scope of tlie teacher's work in certain communities only, and under favorable circumstances apparently contributed to helping the teacher judge the progress of pupils.
The oral examinations were introduced in Boston as early as 1709 and were required by legislation in all schools in Massachusetts by 1789. During the l8U0's thej'’ were common practice in all schools, but were about to disappear from eleraentaiy education. In the oral,
5Ibid., pp. 137-5Ur 286-90.

U3or stated examinations,the school committees were charged with periodic inspections of schools, varying from term inspections to anneal inspections in different localities, in which each pxç»il was examined in scholarship. These examinations were generally public and in practice they were often as much an appraisal of the teacher as of the pupils.^
By iSUSj the annual inspection in Boston iiad become a mere formality due to increases in enrollments. In that year the committee appointed to inspect the Boston schools decided to use printed questions in addition to the oral examinations. The results of the survey were published by Horace Mann, but th^ had little immediate influence other than to create a brief flurry of violent criticism of the method*^
Thus, with some minor changes in curriculum and the rapid development of public high schools after about 18$0, the educational practices of the time followed a marked uniform course. Some modifications of the strictly memoriter learning of colonial days were made. Most of these, however, were attempts to inçjrove the recitation by showing the relevance of subject-matter to practical situationso Di 1885, Payne was still guardedly approving the oral examinations and giving full endorsement to the practices of teaching
6I. L. Kandel, Examinations and Their Substitutes in the
Ifctited States, pp. 22-25.7 Otis W. Caldwell and S. A. Courtis, Then and Now in Education,
pp. 5-8.

hh
that had been recommended by Page forty years earlier. Although certain practices such as home visitation, contacts Tïith parents, and safeguarding pupil health were to be concerns of the teacher, an almost exclusive emphasis on formal subject-matter and teacher appraisal of achievement and conduct characterized the educational practice of the nineteenth century. Consideration of other factors, although apparently not entirely lacking, was subsidiary to the main purpose of education — intellectual development.
The one great development during the nineteenth century in methods of appraising pupil progress was the written examination. IThile written examinations had no immediate popularity following their use in the Boston survey of 18U5, they were introduced in Chicago schools in 1857 for admission to high school, and in most schools gradually replaced oral examinations which had become largely public displays of brilliant pupils. The Board of Regents of New York began in 1865 to conduct examinations at the close of the elementar r school program; in I678 Regents examinations were
gestablished for secondaiiy schools. The latter have been used continuously in New York down to the present time, reflecting generally the evolution of tests and examinations described throughout this discussion.
Examinations were also used extensively by colleges as a basis for selecting students to be admitted. The College Entrance Examination Board, a voluntary organization, was established in I9OO to
" ' .I. L. Kandel, op. cit., pp. 25-27; 37-UO.

U5improve the examination system* The Board did not introduce any innovations in conducting examinations, but its establ is liment is indicative of the importance of written examinations during the period as well as an awareness that examinations should be improved
9to provide a more reliable method of appraisal.During the half century that written examinations dominated
American secondary education, an effort was made to solve the problem of articulation between secondary schools and colleges through the accrediting system. Originally adopted by the University of Michigan in I87O, accrediting was extended by the North Central Association of Colleges and Secondary Schools, the Northwest Association of Secondary and Higher Schools, and the Association of Colleges and Preparatory Schools of the Southern States.The accrediting system had little effect on actual practices except to eliminate the college entrance examinations.^^ This effect, hcwever, was limited largely to state colleges and universities.The accrediting 33/-stem relied heavily on the unit system growing out of the reports of the Committee of Ten and the Committee on College Entrancement Requirements which exercised great influence over the curriculum of secondary schools for at least three decades. This influence tended to stabilize the curriculum of basic subjects which was compatible with the refined types of examinations that were to grow out of the measurement movement.
9 Ibid., p. 3 7. Ibid., p. 35; lOU.

U6Although widely accepted^written examinations became the
subject of criticism after 1880 because they encouraged pupils to stu(%r for marks and because they stressed uniformity* It was argued by the critics that teachers were as competent to determine comparative achievement of their pupils as they were to mark examination papers. Charles W* Eliot, J. Rendall Harris, and other influential educators supported the criticism of examinations and eiiphasized the need to adapt education to individual differences. Examinations as a basis for promotion were gradually discontinued and cumulative records of pupils* standing and judgment of teachers became the basis for promotion,. This procedure, however, merely gave the teacher, who relied on his own examinations and recitations to determine pupils * standings, a greater direct responsibility.
Issues of democracy and science in education were also being posed during this period. The peculiar form in which these were presented seems foreign at present, bub in retrospect also seems to point toward the new direction about to rise out of turmoil and confusion. In I89O, J. Rendell Harris in a paper, "The Right Rgform of Examinations," reasoned:
Our purpose is to shew how unequal students are to one another; and the right way to do this is not by setting up a standard of passing or failing, as if there were only two conceivable students A and not A (the elect and the non-elect), nor by the a priori assumption that there are four conceivable classes of students, say. A, B, C, D, of which D stands for the non-elect; but11
Ibid., pp. 29-37.

U7by recognizing that there are in reality as many classes as there are students, aand trying to make this fact as patent as possible by the process of examinations, we can come to the question of ticketing or bracketing afterward.
Harris further argued:I repeat, however, that the whole process of classifi
cation of students is an induction, based upon the observation of dispersion. And it follows, therefore, that the democratic method, which aims at producing the greatest possible number of equal and similar molecules, each ticketed with the same alphabetical symbols, is unscientific, since it reduces dispersion almost to the lowest possiblepoint.12Dewey had not yet propounded his theory of the integral nature
of science and democracy. Yet, science appeared already to have become the basis of argument in educational problems, even though the inconsistency of social and political conceptions seemed to stand opposed to scientific inquiry. Nor can the relationship of the issue to school marks in Harris's discussion be overlooked. A problem which is perhaps as unsettled today as then.
Thus, teacher judgment and examinations dominated the appraisal of pupil progress. While discussions such as that by Harris vaguely- suggested a potential new approach, the idea of examinations contained also potentially, some fundamental concepts which developed into what was to be known as the measurement movement. Acceptance of recorded evidence of the pupil's success and progress had already created a foundation for what was to be educational measurement. Refinement and statistical procedures were yet to be developed
12Ibid., pp. 33-3U.

U8but a precedent had also been established — the acceptance of recorded evidence.
The Measurement Movement
Educational measurement, which had tremendous influence after 1900, was the essence of the scientific movement in education in the early decades of the 20th century. The critics of examinations had identified a new need. The criticism of opinion as the basis of appraisal and decision in education further stimulated exploration of methods which would be more adequate. The pioneers in this search apparently drew much of their inspiration from Europe where Wundt, Galt on, Binet, and otiiers were probing into new directions for methods of studying human traits and development. European influence was almost inevitable at that time because many studfôits completed their education in European universities.
James McKeen Cattell, a student of Wundt, continued his studyof individual differences in America, but largely in the fields ofsensory discrimination and reaction time. The study of piyslcalabilities was considered to be fundamental to developing a scienceof psychology, and Wundt was one of the influential proponents ofthis theory. However, as early as I89O Cattell had suggested theterm mental tests, a field of investigation which he personally
13did not pursue extensively. Although his direct contribution toI 3 C. C. Ross, Measurement in Today's Schools, p. 3 6.

19later educational measurement was not great, he did establish a new direction in psychology by giving it an investigative rather than an introspective orientation. Observable facts, carefully measured, characterized this approach to psychology. The theory of science was beginning to be applied to psychology and education; a theory which has changed in interpretation, but which has not disappeared from education.
While Cattell was occupied with developing a scientific psychology which eventually seemed to have minor significance in explaining and describing behavior, J. M. Rice, who had also been a student under Wundt, applied measurements in a still more practical way. m his famous spelling investigation begun in I89U, he studied the spelling ability of school children in relation to the amount of time spent on that subject. This study which was highly controversial at the time was the first important attempt to measure achievement hy the use of conparative tests.
Rice has been called the inventor of educational measurement, but the real leader of the movement was Edward L* Thorndike. In I90I4 he published his Introduction to the Theory of Mental and Social Measurements which was followed by extensive writings in statistics and educational measurement. Most of the early achievement tests and scales were developed by Thorndike and his students In a very few years a whole series of tests and scales had been ÏH---------Ibid., p. U;.
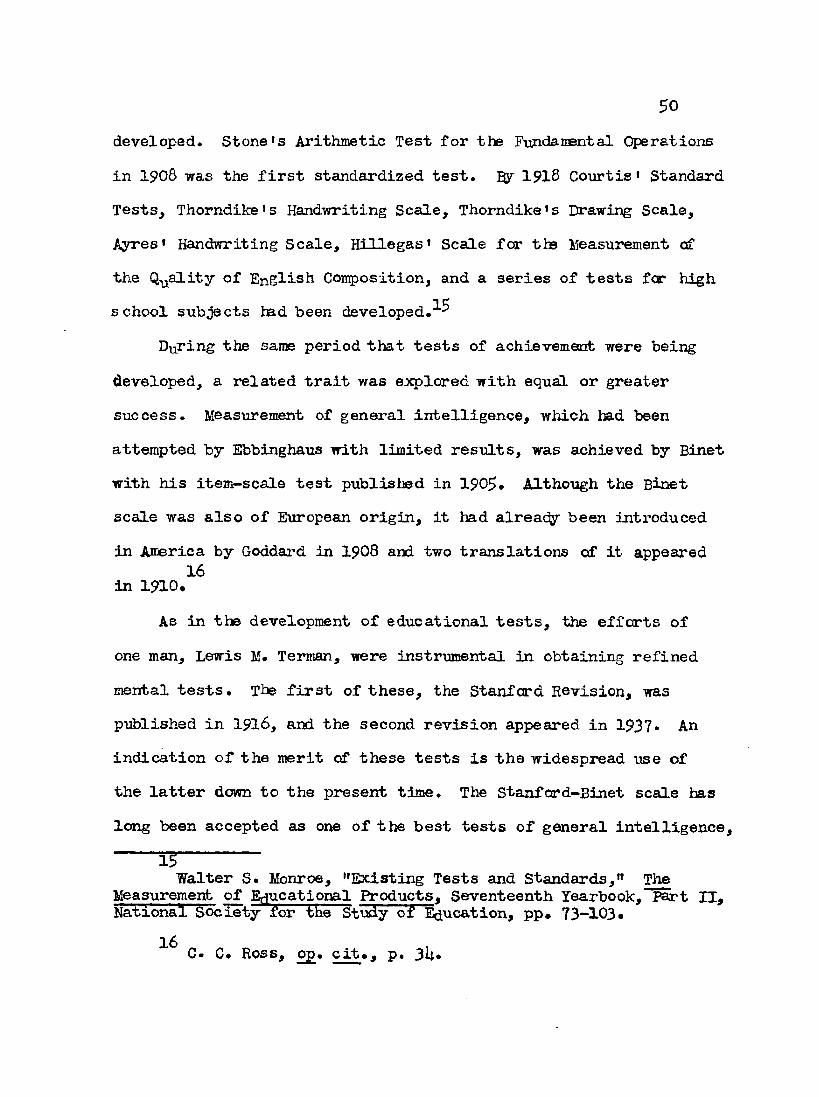
50developed. Stone's Arithmetic Test for the Fiindamental Operations in 1908 was the first standardized test. By 1918 Courtis' Standard Tests, Thorndike's Handwriting Scale, Thorndike's Drawing Scale, Ayres' Handwriting Scale, Hillegas' Scale for ths Measurement of the Quality of English Condos it ion, and a series of tests for high school subjects had been developed.
During the same period that tests of achievement were beingdeveloped, a related trait was explored with equal or greatersuccess. Measurement of general intelligence, which had beenattempted by Ebbinghaus with limited results, was achieved by Binetwith his itemr-scale test publisted in 190$, Although the Binetscale was also of European origin, it had already been introducedin America by Goddard in I9O8 and two translations of it appeared
16in 1910.As in the development of educational tests, the efforts of
one man, Lewis M. Terman, were instrumental in obtaining refined mental tests. The first of these, the Stanford Revision, was published in I916, and the second revision appeared in 1937* An indication of the merit of these tests is the widespread use of the latter down to the present time. The Stanfcrd-Binet scale has long been accepted as one of the best tests of general intelligence.
15Walter S. Monroe, "Existing Tests and Standards," The
Measurement of Educational Products, Seventeenth Yearbook, Part II, National Society for the Study of Education, pp. 73-103#
C. C» Ross, o£. cit., p. 3U#

51butt its ijse is limited to time-cons inning individual testing*
The need for a basis for classifying men in the krW In World War I stimulated the development of a group intelligence test which liad already been undertaken by Otis. This need was partially met lay the Arny Alpha Test. It was soon supplemented, however, with the Beta test especially designed for illiterates.
m two decades ideas which had been expressed vaguely by critics of opinion in education became realities in educational tests; intelligence or mental tests, hardly conceivable in 1900, were relatively refined instruments of measurement. Both were accepted with greater enthusiasm than later experience seemed to justify. Serious questionsuere later to be raised as to the desirability of educational tests because of their influence on the curriculum and on pupils. While originally it was argued that the new educational tests would not tend toward uniformity in curriculum because they were more comprehensive than essay tests, this proved to be an argument of questionable validity. Also, while valuable, group intelligence tests were subsequently to be referred to as academic aptitude tests.
Nevertheless, these instruments were providing what appeared to be a true basis for a science of education. Ability and achievement could now be compared. In addition, intelligence tests and achievement tests were peculiarly suited to educational conditions and problems of the period. Growth of the common school required

52increased efficiency in determining progress in the basic skills and increases in enrollment in high school created a need for differentiated education of an increasingly heterogeneous school population.
The general philosophy of tests and measurement prevailing during this period is apparent in the I918 Yearbook of the National Society for the Study of Education. The principal uses of measurement in solution of school problems were classified under six headings as follows:
1. Changes in classification of pupils2. Changes in school organization3* Clianges in course of study1|. Changes in methods of instruction
Changes in time devoted to subject176. Clianges in methods of supervision
The same report indicated that educational tests were considered to have diagnostic value, but mary teachers were unable to use the tests because of inadequate training in statistics and the
18uses of measurement . Establishment of research bureaus and use of tests in school surveys were also reflected in this review of Tf---------M. E. Haggerty, "Specific Uses of Measurement in the Solution of School Problems," The Measurement of Educational Products, Seventeenth Yearbook, Part II, National Soceity for the Study of Education, p. 25.
1 fi Frank W. Ballou, "General Organization of Educational Measurement in City School Systems," The Measurement of Educational Products, Seventeenth Yearbook, Part II, National SoceityTor the Study of Education, p. 50.
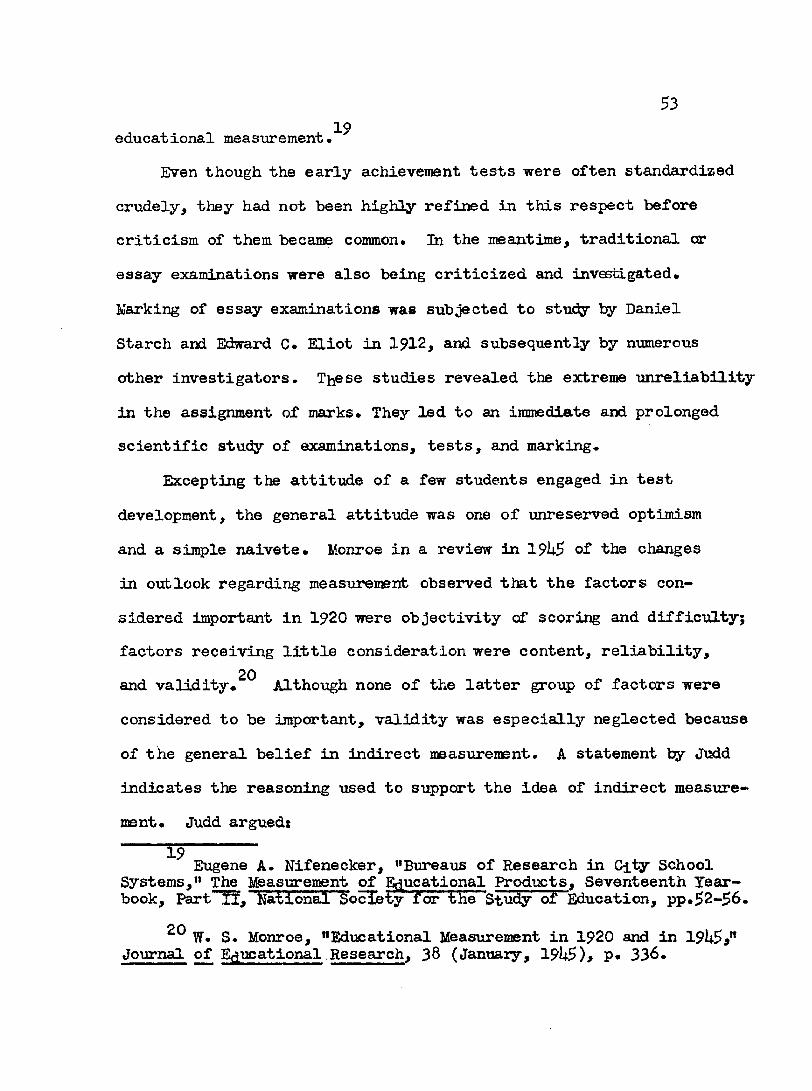
53loeducational measurement.
Even though the early achievement tests were often standardized crudely, they had not been highly refined in this respect before criticism of them became common. In the meantime, traditional or essay examinations were also being criticized and investigated.Marking of essay examinations was subjected to study by Daniel Starch and Edward C. Eliot in 1912, and subsequently by numerous other investigators. These studies revealed tte extreme unreliability in the assignment of marks. They led to an immediate and prolonged scientific study of examinations, tests, and marking.
Excepting the attitude of a few students engaged in test development, the general attitude was one of unreserved optimism and a simple naivete. Monroe in a review in 19U5 of the changes in outlook regarding measurement observed that the factors considered important in 1920 were objectivity of scoring and difficulty;factors receiving little consideration were content, reliability,
20and validity. Although none of the latter group of factors were considered to be important, validity was especially neglected because of the general belief in indirect measurement. A statement by Judd indicates the reasoning used to support the idea of indirect measurement. Judd argued:
19 Eugene A. Nifenecker, "Bureaus of Research in City School Systems," The Measurement of Educational Products, Seventeenth Yearbook, Part II, National Society f or ihe Stu^ of Education, pp.52-56.
W. S. Monroe, "Educational Measurement in 1920 and in 19U5>” Journal of Educational Research, 38 (January, 19U5), p. 336.

Sh
Some of ue might be entirely willing to rest the case after asking whether in practical school life anyone ever saw a teacher thoroughly canpetent in teaching ideals but neglectful of reading and arithmetic. The fact is that the conscientious teacher always gives attention to both, and the successful teacher is able without omitting one to cultivate the other.The theoretical possibility of thinking of the two results separately has little significance in dealing with real teachers and real schools. Good reading is a school virtue, and when one has measured good reading, he has measured more than the trivial or formal side of education.21This genuine belief in the all-inclusive value of measure
ment distinguished this early period from the future of measurement. Testing has frequently been used to identify this period and this theory of measurement.
Measurement was not the only phase of education involving scientific study. Curriculum study as well was conducted by the so-called scientific method. In lpl8 the first book detailing this philosophy and general method in curriculum-making was published by Bobbitt. Ife noted that scientific method was being applied to every inçiortant phase of education, but that curriculum construction was just beginning to be conducted scientifically. The general procedure recommended was "particularizing" the purpose of education, discovering the specific human activities in which formal education is required, ard developing the subjects or courses in
22the curriculum so that these specific objectives can be attained. ---------
Charles H. Judd, "A Look Forward," The Measurement of Educational Products, Seventeenth Yearbook, PartII, National Society for the Stuc y a£ Education, pp. 157-58*
pp Frçuiklin Bobbitt, The Curriculum, pp. Ul-52.

55This method of curriculTmi-makiiig was typical in the succeeding
two decades, and the practice is quite common at present. The primary concern was to find some basis other than the opinion of educators izr determining what should constitute the curriculum.While this method was carried to a high degree of refinement by the comparatively small number of curriculum experts, it set the pattern, and teachers engaged in building courses of study centered around general objectives which were analyzed into specific aims for the various subject areas. During this same period teachers made their own objective tests. If the aims could be made specific, then the attainment of these aims could be measured by teacher- made objective tests and standardized tests. The measurement movement and curriculum-making were thus quite compatible.
Even though practice seemed to be relatively stable during this period, educational philosophy was not stagnant. The Cardinal Principles of Education, promulgated by the Commission on the Reorganization of Secondary Education in 1918, pointed toward an expanded program of education. Even more significant was the growing influence of Dewey's pragmatic philosophy and the struggle to interpret it and apply it in education. Science and democracy were gradually acquiring new meanings. The close relationship between experience and science was coming to be recognised. As this reinterprétâtion proceeded, it also became apparent that a reverence for objectivity was not really science. These general trends, stated more specifically, came to mean a belief in educational

56opportunity based on needs and turning toward experience as the basic element in all education.
Theory, however, had little immediate effect on practice. Measurement and an inert curriculum were reinforcing factors. Carefully constructed standardized tests had not yet been achieved when McCall suggested a new type of test for the classroom teacher in an article in 1920. This new type of test consisted of true- false items similar to those used in standardized tests, but the process of standardization 7/as omitted. Thus, the early growth of the measurement movement was so rapid that new developments appeared before previous methods and techniques were thoroughly studied. The purposes for which the ne?f instruments were used received little attention since indirect measurement was a general assuDÇ)tion. Consequently, the basic conception of determining pig)il progress during this period of the measurement movement has been described as testing. The term is currently in common use, particularly with reference to the use of teacher-made tests, and educators and teachers who accept this conception at present rely to a large extent on tests in determining the progress of pupils.
The new type, or objective tests, soon became popular after McCall's suggestion in 1920. Ruch, who was an active proponent and worker in this area, published a volume The Ingjrovement of the Written Examination^^ in 192U which was followed in 1929 by The
—W. A. McCall, "A New Kind of School Examination," Journal
of Educational Research, 1 (January, 1920), pp. 33-U6.
C. C. Ross, o£. cit., p. 60.

57Objective or New-Type Examination. In the latter Ruch observedthat the essay examination was probabl r most frequently used, but
25that the use of objective tests was increasing rapidly. this text the advantages and disadvantages of objective tests were summarized, indicating that the limitations of tests were being recognized. The advantages and disadvantages noted ty Ruch were;
Advantages1. Objectivity in scoring2. Extensive sampling3* High reliability per unit of working time 1|. Econoiiy of scoring 5* Freedom from bluffing6. Greater control of the examination system by the
teacher.Disadvantages
1. No prevision for language training2. Open to guessing and chance3* Reported to measure only factual memory U« Said to be an unnatural method of using school-
acquired information 5« Test recognition rather than spontaneous recall
■ 5G. M. Ruch, The Objective or New-Type Examination, p. 20.
26Ibid., p. 112.

58The advantages and disadvantages of objective tests were live
issues at the time, but they have subsequently been accepted quite generally. Extensive use of objective tests has made them a tradition in education at nearly all levels.
Measurement, which was originally limited largely to achievement and intelligence tests, was rapidly extended to other traits and on the basis of other theories. Tests of specific intelligence,or aptitudes, were developed after 1915 when the Seashore Test of
27Musical Talent first appeared* Within twenty years aptitude testshad been developed for maiy of the school subjects and for activitiesand vocations involving artistic, mechanical, and clerical abilities*In more recent years this exploration has continued on the assunptioithat intelligence consists of a general factor aid a cluster ofspecific factors. Probably the most familiar of these attempts isthat by Thurstone to identify so-called primary mental abilities*
Other directions which were pursued are typified by certaininstruments and methods which were developed early, but that havebeen extended increasingly since about 1930. Woodworth’s PersonalData Sheet appeared in 1917 and was first used to measure theability of soldiers to adjust to military life. In 1923 it was
28adapted to school use* Attitudes began to be accepted as an important clue to causes of behavior and a refined measurement
27C* C* Ross, o£* cit., p. Ul.
28Ibid., p. 55»

59procedixre in this area was introduced by Thurstone in 1928,Interests had been studied sporadically since about 1900 and hadbeen recognized as an important factor in education for a muchlonger period. G. Stanley Hall had studied interests of childrenwith the questionnaire in 1907 and Paul A, Witty, Harvey 0. Lehman,
29and others pursued the study of interests in the 20* s» Probably the most comprehensive instrument devised was the Strong Vocational Interest Blank; the Kuder Preference Record developed in the 30 *s has been widely used in secondary education.
Personality itself became the subject of investigation by measurement. Woodworth *s Personal Data Sheet was in a sense a personality test since it attempted to obtain data regarding symptoms considered important by psychiatrists. Most of the work in this area is still exploratory and experimental, so that the purposes and validity of these instruments are perhaps no better defined than they were for educational tests 35 years ago. The specific techniques in this vast area of measurement range from questionnaires requiring objective-type ans>xers to projective technqiues based on shapes or forms requiring a subjective interpretation by the subject. Even more recently attempts have been made to measure values themselves.
Measurement has been closely identified with the scientific movement in education. This movement has been described briefly.
29 Ibid., pp. 55-56.

60and although the term suggests an identifiable era in education, its limits in time can hardly be established precisely. As recently as 1938, the National Society for the StucÇ7 of Education published a yearbook titled The Scientific Movement in Education. To a certain extent the scientific movement still exists, although as will be seen in the last section of this chapter, the concept as described in previous pages of this section has been replaced to a large extent since I9U0. In reality the fundamental differences arising since that time originate in a change in psychological approaches to education and in reinterpretation of the philosophy and social psychology of John Dewey.
In a review of the development of measurement and the means of determining pupil progress, the associated psychological theories must be recognized. The first of these theories, faculty psychology, was consistent with and to a large degree responsible for the outlook toward curriculum and the purposes of education until about 1900. The basic tenet of this psychology was that faculties (aspects or abilities) of the mind existed and that these faculties could be trained. A fundamental assumption was that there is a distinction between mind and matter. Consequently, the curricul’om and the methods of education were directed toward exercising desired faculties to which given school subjects were believed to contribute regardless of the practical significance of content. This served as a fundamental basis for most fornal education until the scientific movement.

61The impact of science in all areas of living tended more and
more to discredit this theory at the turn of the century. In place of faculty psychology the behavioristic or stimulus-response theory was substituted. With the acceptance of the latter theory, which seemed quite logical as medicine, psychology, and anatomy became the subjects of scientific investigation, education for specific purposes replaced to a large extent training of the mind. This, again, was consistent with educational developments during the early part of the scientific movement in education and supported the scientific analysis of human activities; tlie selection of the proper subject material to be learned now became important, but in a subtle way the general theory of exercising faculties still had a limited applicability. Drill, review, and repetition now were used for specific rather than general purposes. Measurement was admirably adaptable to determining progress in specifics.
In the preceding discussion the term evaluation has been deliberately avoided. It should be noted, however, that there has always been evaluation in education when the term is accepted in its broad, general meaning. Since the term evaluation now has a technical meaning in education, this intentional omission was made. The current educational definition of evaluation is discussed more fully in Chapter III.
This sketch of the development of measurement as a movement is necessarily extremely limited. The purpose is merely to establish the broad outlines or trends that are related to secondary education

62and evaluation. Detailed documentation or discussion of numerous technical issues is not undetaken. Such issues and problems have contributed to the development of these trends, but they are only indirectly related to this study. Diagnostic tests, for example, are not discussed since their early development was emphasized in elementary education, and subsequently all measurement has aimed toward diagnosis. This diagnostic principle has not always been applied in a uniform manner, but varies according to the psychological dimension which is of primaiy concern in a given type of measurement.
To recapitulate the salient changes in the methods of determining pupil progress in the period prior to the introduction of the evaluation concept the following summary is presented. Horace Mann in 18U5 had recommended the written or "newer" examination in lieu of the oral examination to be added to the customary recitation and review. It was accepted gradually under pressure of increasing enrollments and the expansion of the educational system at all levels. About 1880 critics of the examination indicated a need for reorientation in the appraisal of pupil progress so as to give the teacher a more active and decisive role in the process.
Rice refined the method of gathering evidence in his famous spelling investigation bij- relating the examination to the definite problem of econony of time in education which was an issue of considerable inç>ortance in an expanding educational system enrolling a proportionately greater number and variety of pupils. Cattell and

63Thorndike pioneered the application of statistical procedures and theoiy to educational data. Measurement vra.s related directly to curriculum and placed in the hands of the teacher after World War I, Measurement has been extended to many phases of education; this extension is still proceeding and the theory of social measurement is an issue as well as a problem. Reliability and human judgment are the general criteria used as a basis from which to infer validity. An ever-increasing awareness of this seemingly inherent limitation has resulted in recognition of measurement as an aid rather than a self-sufficient incontrovertible means and end unrelated to philosophical and psychological theoi'y.
Although these changes have often been viewed as discontinuous or revoluntionarj’- events, they reveal a trend from acceptance of gathering recorded evidence to refining the process of gathering data from and about pupils, and eventually to relating the gathering of data to the curriculum. The desirability of some of these changes has been questioned educationally. On the other hand, the growth and acceptance of these basic ideas is not unrelated to evaluation.It is "evaluation" in a limited sense and is more closely related to concepts and philosophies of education prevailing at different times than to any other factor. Broadening the concepts and objectives of education required broadening the means of determining the progress of pupils in an educational program.

6hEmergence and GrOTrbh of the Evaluation Concept
In the preceding section a developmaital relationship betweenmeasurement and evaluation was suggested. The primitive, naivefaith in measurement as the basis of an indisputable science wasgradually modified through more thorough study. Science as a processwas turning in upon its own results for further inquiry. However,the growth of measurement also created an awareness of a neglectedconcept in psychology and education— individual differences. TMsconcept was not nevr, Rousseau had stated the fundamental idea ina form acceptable even today, but it had little influence in the
30theory or practice of education.The major provision for individual differences in secondary
schools was the establishment of multiple curricula; a trend whichcontinued during the entire period that measurement was stressed.These curricula, however, provided for group differences more thanfor individual differences, Billett in the National Survey ofSecondary Education concluded that provision for individual differences
31in high schools was an innovation,- It is still one of the fundamental problems of education. Evaluation is related as directly to it as to objectives or the curriculum. The problem, which has not been satisfactorily solved, is the formulation of objectives that have a
Ibid,, p, h23m31 Ibid,, p. k2k.

65wide applicability and the organization cf the curriculum within this broad structure to permit individualization of teaching and learning# Experimentation and new theories regarding the curriculum in recent years provide ample evidence that the struggle to individualize education is not ended* The important role of evaluation in this area is evident from the need for it expressed in all recent concepts of curriculum organization and planning.
Although evolutionary, fluctuation also characterizes the trends in practices of determining pupil progress. At the time when examinations were the primai'y means of determining pupil progress a movement arose of permitting greater teacher responsibility and participation; measurement soon tended to reverse this trend, but the realization of the limitations of measurement has again revived the need for participation. Now it is favored nob only for the teacher bub for pupils and parents as well. A significant contribution of measurement to evaluation is the recognition that continuous evidence is needed for each individual rather than opinion based on isolated sampling*
A recognition of the need for and feasibility of obtaining extensive evidence for each individual relates measurement to evaluation historically and at presenb. This relationship, however, should not be taken as the sole or even the primary factor in the origin of the evaluation concept. While the origin of evaluation has never been established clearly, perhaps because of the evolutionary character of educational change, other significant evenbs contributed
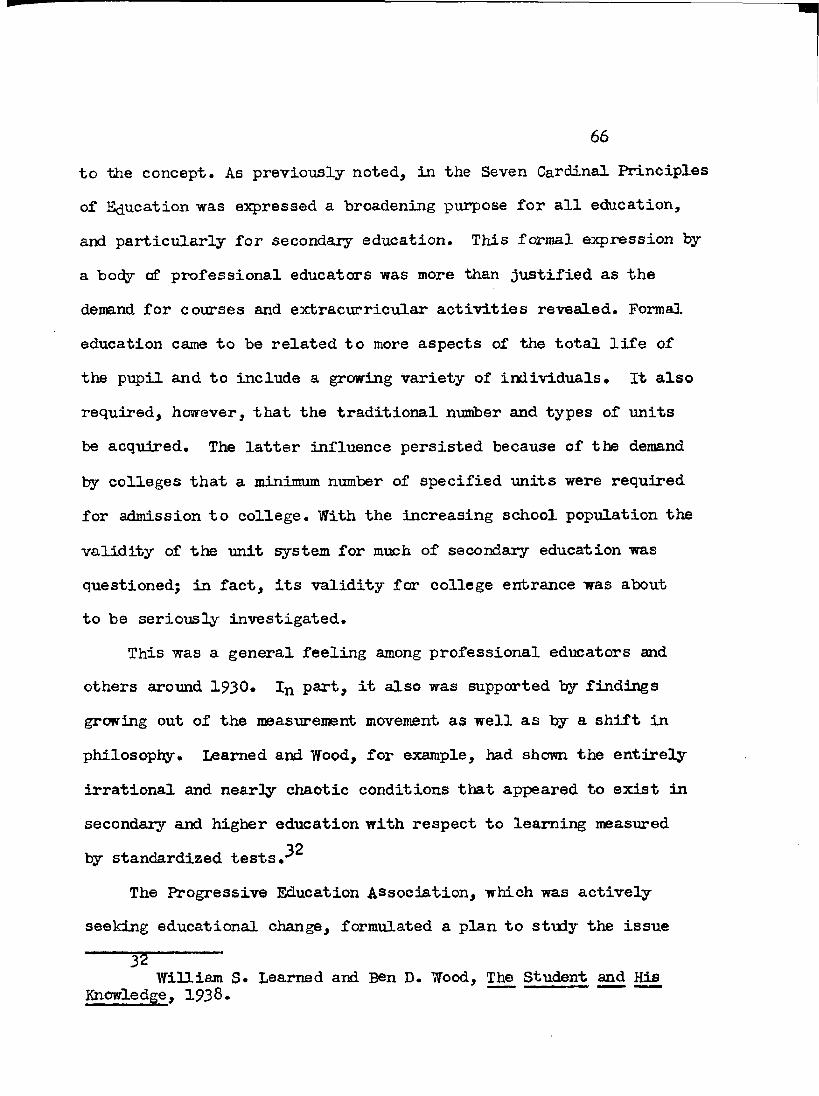
66to the concept. As previously noted, in the Seven Cardinal Principles of Education was expressed a broadening purpose for all education, and particularly for secondary education. This formal expression ty a bocfy cf professional educators was more than justified as the demand for courses and extracurricular activities revealed. Formal education came to be related to more aspects of the total life of the pupil and to include a growing variety of individuals* It also required, however, that the traditional number and types of units be acquired. The latter influence persisted because of tl» demand by colleges that a minimum number of specified units were required for admission to college. With the increasing school population the validity of the unit system for much of secondary education was questioned; in fact, its validity for college entrance was about to be seriously investigated.
This was a general feeling among professional educators andothers around 1930. part, it also was supported by findingsgrowing out of the measurement movement as well as by a shift inphilosophy. Learned and Wood, for example, had shown the entirelyirrational and nearly chaotic conditions that appeared to exist insecondary and higher education with respect to learning measured
12by standardized tests.^The Progressive Education Association, which was actively
seeking educational change, fcrmulated a plan to study the issue32 William S. Learned and Ben D. Wood, The Student and His
Knowledge, 1938.

67of college entrance requirements and the relationships between secondaiy school and college. Although this question is only one aspect of the problem of evaluation in education it was particularly significant since the plan, the Eight-Tear St dy, ultimately was concerned with the most fundamental area of evaluation — evaluation of pupil progress. The general concept of evaluation developed in the Eight-Tear Study is widely accepted in education at present.
Strands of the evaluation idea can be traced here and there, as for example, to Thorndike, or Frederic Burk and J. Rende11 Harris. These were, however, relatively isolated expressions which never really matured into a broad or general movement in education. Thorndike in I918 stated:
Another important group of uses centers around the problem of giving the individual pupil the information about his own achievement and improvement which he needs as a motive and a guide. It is interesting to note that the first of the newer educational scales, which was expected to be used chiefly by scientific investigators of the teaching of handwriting, now hangs on the wall of thousands of classrooms as a means for pupils to measure themselves. There are ma^y other purposes, and important ones, such as the detection and removal of gross prejudices on the part of teachers in their own evaluations of certain educational aims and products.33Thus, ideas of extending evaluation are not altogether new.
Hçwever, the Eight-Tear Study first provided a strategic approach to the problem of determining the values of an educational program with respect to the individual pupil. In so doing, it inevitably became concerned with the progress of the individual.
33 Edward L. Thorndike, "The Nature, Purposes, and General Methods of Measurements of Educational Products," The Measurement of Mucational Products, Seventeenth Tearbook, Part II, National Society for the Study of Education, pp. 19-20.

68As the Eight-Year Study progressed a systematic procedure was
established for evaluating the progress of pupils in the schools being studied. The basic method defined for the study consisted of the following steps.
1. Formulating objectives2. Classification of objectives3» Defining objectives in terms of behaviorU. Suggesting situations in which the achievement of
objectives will be shown5* Selecting and trj ing promising evaluation methods6. Developing and improving appraisal methods
]7« Interpreting resultsTyler as director of evaluation in the Eight-Year Study is
often credited with this refined rationale. However, the evolutionary hypothesis proposed throughout this discussion would appear to be a more probable explanation of the growth of the general concept.
The findings of the Eight-Year Study showed that students who went to college from the participating schools did somewhat better than the comparison group whether success was judged by college standards, by the student’s contemporaries, or by the individual student himself. The schools had been released from all formal college entrance requirements and each school developed its own
3U Eugene R. Smith and Ralph W. Tyler, Appraising and Recording Student Progress, pp. 15-2$.Wilfred M. Aikin, The Story of the Eight-Year Study, p. 112.
69
program* The significance of tliis study is the impact it has had and still exercises on educational theory at the secondary level and the subsequent trend to dispense with formal credit requirements in many colleges and universities. Its effect on actual practice in secordary schools has been less pronounced and indirect* Perhaps its greatest contribution was the concept of evaluation of pupil progress itself*
A related investigation, the Cooperative Study of Secondaiy School Standards, also contributed to the basic idea of evaluation* The stu( of school staidards is not directly related to the present study, but it provides additional evidence of the primary concern of the period. The extensive criteria for evaluating secondary schools and the principles of evaluation developed in the study of school standards represent the outstanding effort to build a comprehensive rationale for evaluation. The Evaluative Criteria reveal the broadened scope of a program of education considered to be adequate * ^
Evaluation has not been static since the period of climactic interest in the 30*s* A theory of evaluation has tended to become more firmly established, more comprehensive, and more refined. The early literature shows a tendency on the part of each author to emphasize certain key characteristics or principles. Criticism of an evaluation program of the type used in the Eight-Year St idy was 35----------Evaluative Criteria. 19^0 edition. Cooperative Study of Secondary-School Standards, 305 pp.

70occasionally expressed. In 19U0, Grata in a discussion of this general approach commented as follows:
Measurement has often been condemned for the lack of validity of its evidence; evaluation does not seem to offer a much better and more valid measure of pupil progress, and besides it suffers from lack of reliability quite as much as did the old type of essay examination. Measurement has been criticized for its emphasis on standardized patterns or answers; evaluation has its own patterns and answers. Measurement stresses quantitative assessment cf the qualitative aspects of behavior; evaluation does nothing different. The fact that evaluation is often less exact and precise may only mean that it is more vague and confused than measurement.37Admittedly the plan of the Eight-Year Study enphasized thinking
in an academic sense to a large extent. This apparently was one basis of Grata’s criticism. The nature of the change since the Eight-Year Study can be judged only inadequately since current educational thought and practice can be viewed in but short perspective. However, certain new techniques and a more mature philosopl^ indicate that change is substantial. Almost all recent books in educational method enphasize evaluation with frequent discussions of a more extensive list of principles than was generally found earlier. Teacher-pupil planning and co-operation in establishing objectives and criteria for evaluation have been markedly emphasized. A trend from mechanical to more subjective, or personal, means of evaluation is typified by such writers as Harold Alberty, Lindley J. Stiles,C. B. Mendenhall, Louis E. Raths, Douglas E. Scates, and others.
37 Pedro T. Grata, “Evaluating Evaluation," Journal of Educational Research, 33 (May, 19U0), p. 6 1.

71Greater emphasis on techniques such as anecdotal records, socio- metry, and various types of questionnaire instruments is also apparent •
Conversely, the field of evaluation is not without its areas cf disagreement and issues. In psychology the term appraisal is used more frequently and in many cases almost synonymously with évaluation. Reliability is an issue among some writers in the field; those who tend to emphasize tests and other instruments stress the inçiortance of reliability while others holding a point of view which stresses the totality and quality of experience tend to disparage the need for reliability.
Troyer has even denied that accuracy and validity are a sufficient basis for evaluation. He holds that the primary essential in all evaluation is democratic procedures.^® The relationship between objectives and evaluation is a point of some difference of opinion; some authorities enç>hasize the need to evaluate objectives as well as outcomes during the learning process; others stress the need to establish objectives, but do not accept evaluation of them as an integral part of the learning activities for which the objectives are established.
The primary purpose of evaluation is viewed in different ways; guidance of the pupil, curriculum improvement, determining desirable objectives, and realizing democratic procedures are varying points 5B----------
Maurice E. Troyer, Accuracy and Validity in Evaluation Are Not Enough, 16 pp.

72of view which appear to be related as much to the primary interests of their respective proponents as to a fundamental rationale.
A point of view accepted in this study is presented in the following chapter. This procedure does not represent an attempt to presume that the field of evaluation is crystallized, but rather that a coBç>rehensive series of principles based on present knowledge is needed to give meaning to the stuc^.

CHAPTER III
PRINCIPLES FCR EVALUATING PUPIL PROGRESS
In Chapter I reference was made to certain principles which are believed to be fundamental in evaluation. These principles were used as guides by the doctoral students conducting the three related studies to determine the types of information to be obtained for the studies and as a general basis for interpeting the data secured. Inasmuch as principles serve as a frame of reference in any type of investigation, some attention must necessarily be given to the origin, the neaning and interpretation, and the status of such basic statements. An attenpt is made in this chapter to accomplish these requirements .
In the first section the derivation of the principles for this study is briefly discussed; in the second part a concept or philosophy of evaluation is presented including additional substantiating evidence from authorities in the field of evaluation; the last part of the chapter concludes with some data on the current judgments of authorities in evaluation regarding the principles of evaluation accepted for the study.
A general basis for including the principles used is the evidence in the literat’ore that such principles have gained widespread acceptance. Since evaluation is a relatively new concept, and as noted earlier, subject to different interpretations depending on the area of education in which it is used, the principles of evaluation cannot all be documented to the same extent. Further-
73

7h
more, since a comprehensive list of principles was desired, stated in a form that would be applicable to practices of teachers and broader programs of evaluation, a series of discussions by the tliree doctoral students engaged in the related studies was undertaken to formulate the principles in general statements that could be construed as applicable to programs as well as practices. These generalized statements of the principles are frequently implicit rather than explicit in much of the literature on evaluation#
Derivation of Principles for Tills Study
The origin of the basic ideas of the principles is the literature. The formulation of the principles as accepted for the study includes these ideas stnd certain additional factors which seemed significant, but which were seldom emphasized in the literature.
As noted in Chapter II, the first attenpt to develop a rationale for evaluation of pupil progress was that made in the Eight-Year Study. This consisted of a recognition (1) that objectives should be formulated and classified, (2) that objectives need to be defined in terms of behavior, (3 ) that situations must be identified in which achievement of objectives would be shown, and (U) that techniques and methods must be selected for various objectives. In this apparently obvious and logical rationale are implied many of the principles that have since been stated more specifically, bub ejqDlicitly it provides only the structural basis of evaluation.

75Procedures and purposes are not identified or alvrays implied in the rationale. Portions of the various reports of the Eight-Year Study indicate that procedures were by no means ignored, nor were purposes undefined; but since it was a formal research study, neither the procedures nor purposes of evaluation were defined as succinctly as they should be for the over-all problems of a teacher or a school.
This basic rationale has been elaborated and extended during recent years, and principles encompassing more of the total educational program as well as the total range of concerns of the classroom teacher have been formulated. It is difficult to trace with accuracy the changes in evaluation theory. Dissatisfaction of the iype expressed by Grata, which was referred to in Chapter II, may be found in a few articles,^ Soma writers such as Scates and Raths have broadened the conception that was originally stated.Scates emphasizes the need to measure values — a field only
2tenuously and unsuccessfully explored. Raths has stressed the need for co-operation and personal involvement, or self-evaluation.^ 1 ------
Pedro T. Grata, "Evaluating Evaluation," Journal of Educational Research, 33 (May, 19U0 ), pp. 6I1I-6 1.
Clifford, Woody, "Nature of Evaluation," Journal of Educational Research, 35 (March, 19U2), pp. U81-91*
2 Douglas E. Scates, "Fifty Years of Objective Measurement and Research in Education," journal of Educational Research, Ul (December, 19^7), p. 251*
3 Louis E. Raths, "Toward Better Evaluations," Educational Leadership, 8 (November, 1950), pp. 70-72.

76Troyer has criticized accuracy and validity as insufficient bases for evaluation; he contends that democratic procedures are the prime and ultimte essential.^
These specific indications that evaluation is in a rudimentary stage of development or involves undesirable practices point toward a transition; they do not suffice to establish the general trend that has appeared since the Eight-Tear Study. The writer believes that the basic factor that has caused a gradual modification in evaluation is the philosophical reorientation and reinterpretation tliat has continued since the decline of the measurement and scientific movements. Increased emphasis on such themes as teacher-pupil planning, co-operation, equality of educational opportunity, organismic conceptions of learning, and differential patterns of growth are illustrative of recent changes in educational philosophy and psychology. While these changed conceptions Isve not revolutionized education, they have tended to broaden the scope of education and have influenced educational theory and practice in numerous ways.A major purpose of this study is to ascertain more definitely what present practice and theory appears to be with respect to the development of evaluation of pupil progress in a transitional period.
Principles which it is believed encompass this rather rapid and yet metamorphic growth of evaluation were originally derived from writings of Ralph W. Tyler, J. Wayne Wright stone, Maurice E. Troyer,
U----------Mauri ce E. Troyer, Accuracy and Validity in Evaluation Are
Not Enough, 16 pp.

77C. Robert Pace, H. H. Reramers, N. L. Gage, Louis E. Raths, HarryA. Greene, Albert N. Jorgensen, J. Raymond Gerberich. Douglas E.Scates, Eugene R. Smith, Arthur E. Traxler, and William McCall.Specific references and citations particularly relevant to eachprinciple are given in the following section in which the principlesare elaborated and interpreted. The writer's participation as astudent in Education 852 during the Winter Quarter, 1951, at TheOhio State Ifiiiversity, taught by W. R. Fiesher, and Flesher'stwenty-two "platitudinous preachments" which were discussed inthat course, served as a very helpful integrating influence in theattempt to develop a comprehensive concept of evaluation.
These references revealed marked variations in emphasis bydifferent writers within the past fifteen years, ranging fromdiscussions concerned almost solely with tests to others whichstressed self-evaluation with secondary consideration of techniquesof evaluation. Recent literature shows a marked trend to develop amore integrated and comprehensive list of principles. Michaelislias recently stated eleven principles which he considers indispensableat the elamentary-school level; Mendenhall and Arisman have notedat least ten principles with some subordinate considerations supple-
6menting these; in the California State Department of Educationhandbook on evaluating pupil progress six characteritics of evaluation
5 John U. Michaelis, Social Studies for Children in a Democracy, pp. 37L-86.
6 0. B. Mendenhall and K. J. Arisman, Secondary Education,pp. 278-9 3.

78in addition to the basic rationale of the Eight-Year Study are considered fundamental.? Many other publications in the last several years have shorn a similar trend to extend the principles of evaluation .
On the basis of this evidence a series of principles was formulated by the students conducting the three related studies in wiaich an attempt was made to include all of the fundai ental concepts discernible in the literature. The reader may observe some omissions or differences wîiich tend to refute the relative comprehensiveness of the principles accepted in this study. Examples of apparent omissions are such statements as: (l) "Evaluative evidenceshould be put to use," or (2) "Interpretation of evaluative evidence must be made in terras of the child*s level of development." The writer does not believe that such examples are in reality omissions, but rather that they are subsumed under or Included in the general principles as formulated and elaborated. On the other hand, an arbitrary claim to have included all principles is not advanced; the formulation of the principles is based on two assumptions: (1) that the principle must be significant in relation to evaluation practices of teachers, and (2) that it is not necessary to state certaD.n self- evident conditions to be fulfilled such as that evaluative evidence must be used.
It is believed that the general philosophy of evaluation developed7Evaluating Pupil Progress, California State Department of
Education, Bulletin, 21 No. (April, 1952), pp. lt-8.
79
in this dissertation will to some extent mitigate the need for a profuse list of principles wiiich would be so detailed as to include every conceivable factor related in some minor way to evaluation,Tlie general theory advanced in the introduction, i. e,, that evaluation is an integral part of experience, supports the infeasibility of complete comprehensiveness. The range of experience is so great that any assumption to have covered every facet would be obviously presumptive.
An elaboration and interpretation of the principles accepted in this study is presented in the folloxd.ng section. An effort is made to present an integrated c one ept of evaL uation even though each principle is discussed separately.
Elaboration and Interpretation of Principles
In this section the principles accepted for this study are elaborated to indicate more specifically the aspects of the evaluative process to which they are applicable. Implications which are significant in interpretation of the principles are also presented.For each principle certain significant sources are cited or quoted to aid in clarifying it and to support its use in this study by indicating that it is a principle accepted for some time by authorities in the field of evaluation tAio originally developed the concept or made significant contributions to extending its meaning and implications. Direct quotations are identified by footnotes; other

80particularly pertinent sources are indicated by numbers in parentheses which identify references in the bibliography.
Principle — Evaluation of the growth or progress of indiviauals should be conducted in terms of purposes or objectives established in a clear and understandable fashion.
In the brief review in Chapter II of the historical development of evaluation, it was noted that there is a strong tendency for results of specific methods of evaluation or appraisal to determine the objectives of the educational program. This is particularly true when some new device or method becomes dominant.The major contribution of the Eight-Year Study was to create an
Qavrareness of and a general plan for obviating this danger. It is now generally recognized that evaluation requires that the objectives be clearly perceived and that this is possible only by analysis of objectives in terms of behavior.
The broadened scope of education to include interests, appreciations, attitudes, social skills, use of skills and information, as well as knowledge of facts, makes this principle a very crucial one. If all of these broad aspects of behavior are to be concerns in the educational program, then some definite statement of the attitudes, interests, use of skills, and so on, must be made. This is axiomatic if evaluation is to function in determining the extent 5-----------
Eugene R. Smith, Ralph W. Tyler, and Others, Appraising and Recording Sfudent Progress, pp. 15-25.

81to which purposes of education are beir^ achieved. Remmers and GagSj Tyler, Raths, Troyer, and Wrightstone have repeatedly emphasized that objectives must be clearly established. These writers have also stressed in various ways that evaluation methods must be valid. Reramers and Gage have most tersely commented, "This point of view that the first and 3a st steps in educational evaluation should be, respectively, the formulation of objectives andthe validation of the evaluating instrument against the objectives
9in so appealing as to seem platitudinous."Although this point of view way be platitudinous, it is
essential that validity be continually studied. This process of validating can be carried on most effectively by stating definite outcomes in terms of behavior. Only when objectives are so stated does the point of view become platitudinous. The principle regarding objectives as stated for this study is assumed to imply this definite statement of objectives so as to insure validity and the possibility of studying validity (U, 26, U2, 1, 53, 63, 6U, 65, 76, 81, 82,83, 8U, 89, 98).
Principle — Evaluation should be a co-operative under- taking of all persons concerned with or affected by the evaluation.
This principle serves as a means of implementing the basic rationale that evaluation should be conducted in terms of purposes or objectives. It defines a procedure to be used that is consistent
H. H. Remmers, and N. L. Gage, Educational Measurement and Evaluâtion^ p. 19»

82with the functional theory of learning and a democratic philosopi^ of education. Inasmuch as establishing objectives and evaluating progress toward objectives are highly related, this principle must be construed to apply to both of these functions. If the established objectives are to become effective as guides to action and learning, then they must not only be understood, but also must be accepted ly all individuals directly related to the learning situation (U, U2,51, 6U, 65, 76, 83, 8U, 8 9).
While the principle of co-operation is related to establishing objectives, it also has an intrinsic purpose. Co-operation will provide an opportunity for the individual pupil to give expression to his needs, to understand his strengths and weaknesses, and to recognize acceptable goals that he can realize.
The co-operative principle, hcwever, is not limited to the teacher-pupil relationship. It becomes essential in staff relationships and the efforts of the school staff to develop the purposes, objectives, evaluation procedures and techniques of the total school program. The principle extends out into the home and community. The extent of participation may not be comparable for all concerned, but it is nevertheless essential that general agreement exist among individuals and groups concerned. Misunderstanding or lack of acceptance tends to reduce the effectivess of evaluation and ultimately of the objectives as well. Burton has defined generally the exterib of co-operation needed in terms of participation. He states:

83Modem evaluation is participatory; everyone
from test technician to the pupils themselves takes part. It is of basic importance to have pupils learn to evaluate objectively their own achievement* Evaluations should be included in which pupils do not participate, but for which, on the basis of their experience, they can clearly see the why and the how.^^
Smith and Tyler indicate that co-operation in evaluation was enphasized in the Eight-Year Study, but the emphasis was largely on co-operation among members of the school staffs. More recently the co-operative concept has been broadened and more attention is being given to teacher-pupil co-operation. This point of view has recently been stated lucidly by Raths as follows:
If purposes are really made clear to the students, if I can help to clarify them, if students are almost continually thinking about them, then it is relatively simple for them and for me to recognize their progress in achieving them.Especially so when over and over again I say to them, "How would you know that you are makirig progress along this line?" As they give more and more examples of what progress would mean, these exanples become landmarks or guideposts of successful efforts.^
Both types of co-operation are needed. The more dramatic type discussed by Raths has received greater consideration in recent years; it is educationally exfremely significant; co-operation among staff members and others should not, however, be minimized in developing a comprehensive program of evaluation. The realization
10 William H. Burton, "Implications for Organization of Instruction and Instructional Adjuncts," Learning and Instruction, Fcrty- Ninth Yearbook, Part I, National Society for the S+udy of Educatioi, p. 2U8.
^ Louis E. Raths, "Toward Better Evaluations," Educational Leadership, 8 (November, 19^0), p. 71»

8Uof the co-operative principle in education generally has been a serious problem. En^basis on teacher-pupil co-operation and cooperative effort among teachers and others concerned indicates that this principle is an important one in evaluation of pupil progress (I4., Si, 76, 81, 83, 3U, 89)«
Principle — The process of evaluating the growth orprogress of individuals should have continuity.
Ciianges in behavior are the outcomes to be evaluated. Such changes result from experience and are evidence of learning. Objectives are established to give direction and purpose to these changes. The function of the process of evaluation is to guide experience and thereby inprove learning by making possible progressive prediction of future learning. Defining learning in terms of experience gives evaluation a continuous character which cannot be isolated from experience. If evaluation is to improve learning, it is evident that the integral nature of learning and experience requires that evaluation be continuous (51, 62, 6h,
65, 70, 8i+).Learning and experience are characterized by continuity;
evaluation to be effective must also have continuity. Evaluation of some type is being carried on at all times in the flow of experience; it may be subtle or obvious, and it may be inconsequential or effective; the problem is one of maintaining continuity with reference to known objectives so that learning will be improved

8Srather than confused as it might be if objectives are vague or not accepted by the learner. Scates has described the basic need for continuity on a less generalized or abstract level. In a discussion of the limitations of measurement Scates observed:
.difficulty in providing adequate evidence through measurement is connected with what we may refer to as immediacy. Formal testing cannot be continuous, bub the need for watchful observation and interpretation is continuous. This need arises from several conditions.The first is tiie fact that some tendencies are revealed only by fleeting manifestations....
A second condition which gives rise to the need for immediate kncwrledge and evaluation grows out of the necessity of controlling incipient trends. The teacher must detect changes in attitude, in effort, in cooperative spirit as quickly as they begin to manifest themselves.••»
Another condition.••.arises from the teacher’s need for guidance in his own creative eff art....any worker must have immediate and relatively continuous means of evaluation....
A fourth large area in which scientific concepts of measurement depart from the teacher's course of interests is connected with the homogeneity of pupil development.To the scientist the trait measured by a test is uniform throughout its range; to the teacher, growth representsstages of development.^2Evaluation has an intrinsic quality of continuity. However,
the principle of continuity extends beyond this intrinsic nature of the evaluative process. In view of other principles and facts, continuity acquires additional implications. Although the individual is valuing during the course of experience, it is necessary
12Douglas E. Scates, "Differences Between Measurement Criteria
of Pure Scientists and of Classroom Teachers," Journal of Educational Research, 37 (September, 19Ü3), pp. 7-8.

86to supplement the record of personal experience with additional means to give greater perspective to evaluation. Since such supplementary means are outside the continual integrating influence of the individual, they must necessarily be periodic. The principle of continuity, however, is also applicable to this aspect of evaluation.
Wrightstone has suggested that the need for continuity extends beyond the immediate program and process of evaluation. He believes.
Follow-up studies of a conç>rehensive nature should be made. It is important to know not only the immediate and short-range effects of an educational program and experiences but also the long- range effects.^3Traxler lias stated this as a need for a continuous research
program and techniques for showing growth. For the latter, Traxler recommends particularly the cumulative record.
Continuity in this instance implies that some evidence should be gathered at periodic intervals regarding facets of behavior that should be in a process of change in the light of objectives established or that may be affected by conditions not observable in the immediate situation (1;, 26, U2, $1, 63, 65, 67, 81, 82, 8 9, 98).
Continuity is not unrelated to the principle of planning to be discussed subsequently. Conversely, it is also related to 13-----------J. Wayne Wrightstone, "Evaluation," Encyclopedia of Educational Research, p. UO6 .
lU Arthur E. Traxler, "Individual Evaluation," New Directions for Measurement and Gui^ancQ, American Council on Education, p. 30»
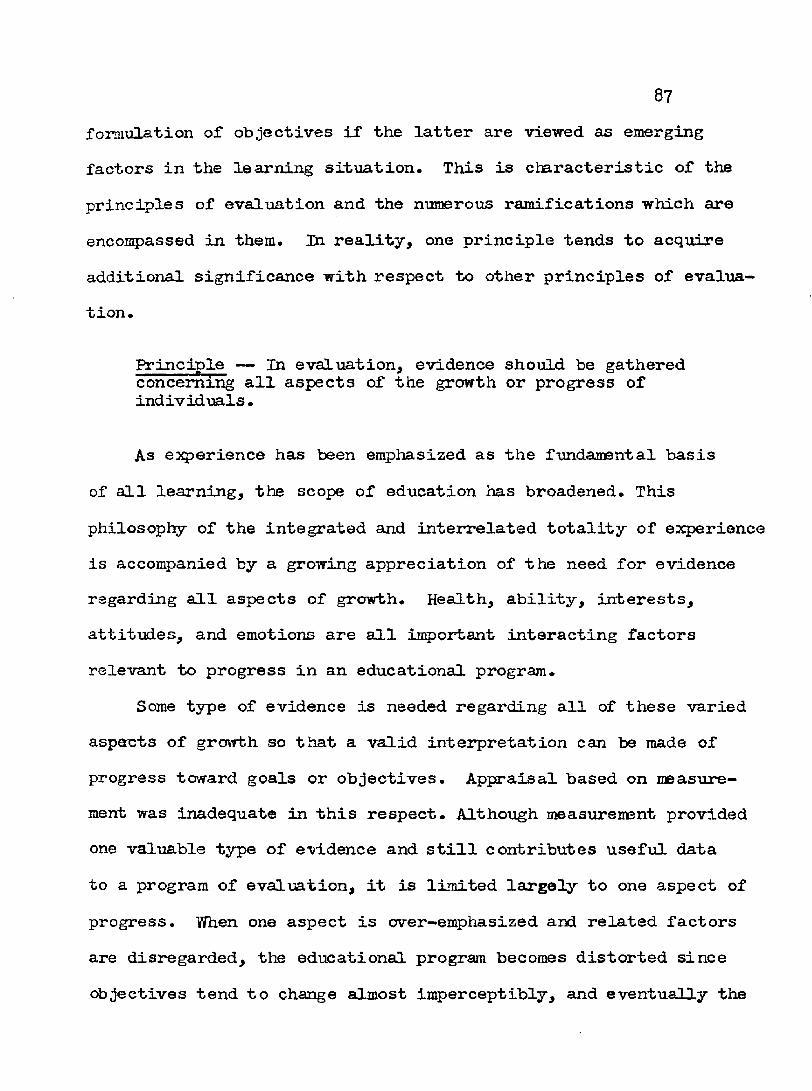
87formulation of objectives if the latter are viewed as emerging factors in the learning situation. This is characteristic of the principles of evaluation and the numerous ramifications which are encompassed in them. In reality, one principle tends to acquire additional significance with respect to other principles of evaluation.
Principle — In evaluation, evidence should be gathered concerning all aspects of the growth or progress of individuals.
As experience has been emphasized as the fundamental basis
of all learning, the scope of education has broadened. This
philosophy of the integrated and inteirrelated totality of experience is accompanied by a growing appreciation of the need for evidence regarding all aspects of growth. Health, ability, interests, attitudes, and emotions are all important interacting factors relevant to progress in an educational program.
Some type of evidence is needed regarding all of these varied aspects of growth so that a valid interpretation can be made of progress toward gosils or objectives. Appraisal based on measurement was inadequate in this respect. Although measurement provided one valuable type of e-vldence and still contributes useful data to a program of evaluation, it is limited largely to one aspect of progress. When one aspect is over-emphasized and related factors are disregarded, tlie educational program becomes distorted since objectives tend to change almost imperceptibly, and eventually the

88test rather than the progress it is assumed to measure becomes the objective of the pupil in the program. Thus, limited appraisal may become invalid even for the aspects which presumably are to be evaluated.
As the objectives of education have broadened, the need to consider all aspects of growth has increased. Thus, the need is more fundamental than merely assuring that objectives do not become subordinate to some method of evaluation. A basic need exists for evidence regarding a variety of factors which have variable effects on learning. This does not imply that objectives should be isolated from evaluation. Identifying objectives; is necessary to maintain the validity of the total evaluation process. This validity is more probable when all of the various aspects of development are given consideration in evaluation; evaluation and restablishing objectives are related functions (L, 51, 6 3, 65, 70, ?6, 83, 6U,89, 9 8).
Remmers and Gage have expressed this principle in the generalterm "comprehensiveness” as followst
The comprehensiveness of the evaluation process refers to its extent over the whole personality of the pupil, rather than merely his intellectual achievementRaths has observed,
I T ----------H. H. Remmers and N. L. Gage, op. cit., p. U.

89The evaluation is incomplete in the sense that
there are significant aspects of student achievement which have been omitted. These include such characteristics of student development as industry, the student's tendency to plan his activities, the student's health, his ability to get along with others and to adjust in a variety of situations, and the like.16Some objection to the use of the phrase "aH aspects" in
this principle is anticipated. With education and evaluation broadening in scope, it is difficult,if not impossible, to delimitprinciples such as this one with certain general adjectives, e.^.,"significant" or "appropriate." ]n a theoretical and academic sense, it is true that "all" of any situation or subject is never known, and less is probably known of "all" aspects of growth andexperience than of most other phenomena.
However, recognizing that experience, education, learning, and evaluation all connote continuously changing conditions, it is deemed necessaiy to pennit flexibility in the principle. It is precisely because "all" is an emerging, changing condition that evaluation is needed at all. If this were not the case, then measurement of known factors or elements would suffice much more adequately. The principle cannot be restricted so that the inflexibilities which have tended to characterize educational practice from time to time become an inevitable certainty. Obviously, the extent to which different aspects of progress or growth can be evaluated is not the same, nor are the different types of evidence ^ --------
Louis E. Raths, "Newer Concepts of Evaluation," Educational Research Bulletin, 17 (March 16, 1938), p. 6l.

90equally related to the different aspects. These relationships are subject to human judgment, capabilities, and status of kncwledge in a particular area at a given time. Such limitations, however, must not be stç>ported by a principle which would in^ly a limitation on future inquiiy, change, or progress.
Principle — Evaluation should be an integral part of the teaching—learning process.
Evaluation is directed toward ascertaining the quality of learning and toward predicting learning. Ha previous discussion it was noted that this purpose derives from the fact that learning involves changes in behavior which are to be influenced by education. Inasmuch as education is merely experience directed toward helping the individual become capable of achieving self-direction, evaluation should be an integral part of the teaching-learning process. Troyer and Pace have been most adamant concerning integration of evaluation and the teaching-learning process. Their statement, "Evaluation can be made an integral and ongoing part of the instructional program, is suggestive of a resolute position in the face of dubious critics. Earlier citations from Raths also emphasized this principle.
The immediate key elements in the teaching-leaming process in school are the teacher and the pupil. If the learner is to become increasingly capable of self-direction, then he must have ^ -------
Maurice E, Royer and C, Robert Pace, Evaluation in Teacher Education, p. 6.

91ample opportunity to participate in discerning the value of experiences in school. Lack of participation is likely to lead progressively to weakening the major purpose of education rather than to strengthening it. Participation does not impl r that the pupil will exercise eventually whatever whims or fancies of the moment may seem most significant; it means that he will be able progressively to perceive differences between transient purposes and fundamental purposes (k2 , 51> 6L|. 6^, 8l).
The effectiveness of learning is enhanced when the learner perceives the values of a learning experience. Such values are dependent on the society, the teacher, and the pupil; they are dependent on subjective impressions as well as objective evidence; interests, aspirations, needs, abilities, aptitudes, the existing situation, and so on, all bear some relationship to the total process of evaluation in the teaching-learning process. To attempt to separate evaluation from this process is to ensure that learning will become less effective or redirected toward false or unidentified purposes. McCall has noted "The best way to help apupil realize his future purposes is to help him realize better,
1 Pand criticize more discerningly, his present purpose."Hilgard and Russell enphasize the necessity of making evalua
tion part of the teaching-leaming process because of direct effects on learning. They also indicate the close connection between these
IBWilliam A. McCall, Measurement, p. 322.
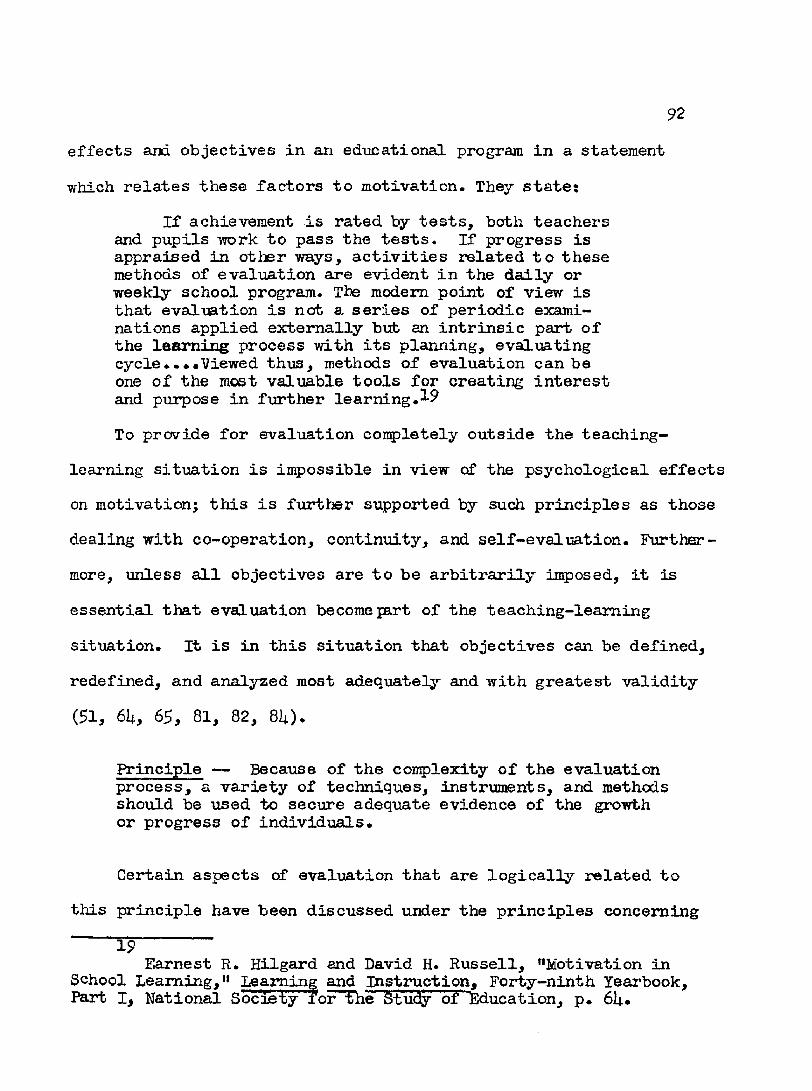
92effects and objectives in an educational program in a statementwhich relates these factors to motivation. They state:
If achievement is rated ty tests, both teachers and pupils work to pass the tests. If progress isappraised in otlier ways, activities related to thesemethods of evaluation are evident in the daily or weekly school program. The modem point of view is that evaluation is not a series of periodic examinations applied externally but an intrinsic part of the learning process with its planning, evaluating cycle....Viewed thus, methods of evaluation can be one of the most valuable tools for creating interest and purpose in further learning.To provide for evaluation coiiçjletely outside the teaching-
learning situation is impossible in view of the psychological effectson motivation; this is further supported by such principles as thosedealing with co-operation, continuity, and self-evaluation. Furthermore, unless all objectives are to be arbitrarily imposed, it is essential that evaluation become part of the teaching-leaming situation. It is in this situation that objectives can be defined, redefined, and analyzed most adequately and with greatest validity(51, 6h, 65, 81, 82, 8U).
Principle — Because of the complexity of the evaluation process, a variety of techniques, instruments, and methods should be used to secure adequate evidence of the growth or progress of individuals.
Certain aspects of evaluation that are logically related to this principle have been discussed under the principles concerning
Ï9Earnest R. Hilgard and David H. Russell, "Motivation in
School Learning," beaming and Instruction, Forty-ninth Yeai’book,Part I, National Society for the Study of Education, p. 6U*

93all aspects of growth and the teaching-learning process* It israther evident that different aspects of growth may require avariety of methods for obtaining evidence* Troyer and Pace deemthis to be inevitable and relate it to the coniprehensive principle*They concludes "A comprehensive evaluation program inevitablydraws data from a variety of sources and with a variety of
20techniques.” It is also apparent that different learning activities may require quite different methods of evaluation. Some elaboration with respect to ”conç)lexity” and ’'variety,” however, is needed to clarify the implications of this principle (U, 26, U2, $1 , S3>63, 6h, 67, 76, 81, 82, 83, 8U, 98).
Complexity arises from two main causes: (1) the interrelatedness of the various aspects of growth, ©•£•, physical health, mental ability, interests, emotional involvement, aptitudes, and so on and (2 ) the range of variation of such aspects of development among different individuals. In order to accomplish effective evaluation with respect to the first type of complexity, it is manifestly desirable to obtain as much evidence as possible. This is frequently facilitated by employing a number of techniques or methods. A discussion ty Scates, previously referred to, cites this type of complexity as "a second area of difference between the observations of the scientist and those of the teacher.” He maintains "The scientist has a direct interest in elements; the teacter ^ -------
Maurice E. Troyer and C. Robert Pace, o£. cit., p. 162.

9k21has a direct interest in the functioning organism,” Scates then
describes the inç)ort for the classroom teacher of this difference in approach to complexity in relation to the differences in "rigor" demanded and the need for timeliness in evaluation. These iniplica- tions have been noted under the principle of continuity.
The second condition, variability among individuals, requires a variety of methods to verify continually the validity of the evaluation itself and of the methods used. While this may seem to be more nearly a problem of technical or formal research than of classroom practice, it is equally essential in the more informal school situation. Evidence from a variety of points of view will strengthen and validate any evaluation attempt at the individual, class, or school-wide level (U2, 51, 53, 63, 6k, 83, 69)#
A variety of techniques, instruments, and methods cannot be construed to mean that variety is an end in itself; that is, that as the variety of methods increases, the effectiveness cr validity of evaluation will increase. While this is generally true, it is not necessarily true for every detail of the evaluation process or program. As will be noted in subsequent discussion, evaluation always involves an element of human judgment and interpretation. This judgment is not absent in any consideration of the means or aids used to evaluate — eventually evaluation practices themselves are evaluated. It must be observed that evaluation is in reality
51Douglas E. Scates, op. cit., p. 6.

science tempered with jiidgment; science based on evolving experience rather than fixed criteria based solely on past experience* Any other interpretation would seem to require a modification of democratic philosophy and the psychological theories of the functional and organismic nature of learning*
Principle — Insofar as possible evaluation should be a planned process•
Evaluation is inevitable. It may not be valid if purposes and the means of determining progress toward objectives are not clear, but some conclusions regarding the relative values cf objects, experiences, and practices are made nevertheless. If objectives are to be established at a level of conscious recognition, it is essential that evaluation be as carefully planned. Only through such planning can the process of defining objectives be maintained. Greene, Jorgensen, and Gerberich have stated the need for planning quite clearly as followss
In most fields of human endeavor the most efficient results are attained when the worker has definite goals tomrard which to work and dependable instruments for determining progress...# If....the goals of instruction are clear-cut and accurate, means of determining progress are provided, the probability of a timely arrival at the goal is greatly increased.
This statement indicates the need for planning, but does not referto the reciprocal relationships between objectives and evaluation. ^ -------
Hariy A. Greene, Albert N. Jorgensen, and J. RaymondGerberich, Measurement and Evaluation in the Secondary School, p. 2.

96Evaluation nmst also serve the purpose of aiding in the establishment of realistic and attainable objectives.
The latter function has been stated more directly and specifically by Raths. While the definite statement is not made that evaluation is the basis on which objectives should be establislied, it is very strongly implied in Raths* statement:
The plan of evaluation should satisfy school-wide purposes, and the various tests, records, and other evidence should have value for teachers and pupils, and the data should serve the guidance officer, the principal, the parents, and society generally.^3
Educational planning can be no better than the planning for evaluation upon which it depends (5 1 , 62, 6 3, 6U, ?6 ,8l, 8 3, 8U, 8 9 ).
This principle has frequently been stated in more positive terms in rather terse statements, for example, "Evaluation should be planned," or "Evaluation must be planned." The general need thus positively defined is not denied, questioned, or abrogated in the statement of the general principle in this study. It has been expressed or implied in preceding discussion. On the other hand, the nature of human experience prevents perfect prediction, a changing world upsets even imperfect predictions, and the danger of crystallizing evaluation into fixed patterns based on a priori selection is always present.
The nature of evaluation described in previous discussion indicates the desirability and necessity of maintaining flexibility to be consistent with democratic philosophy and human needs.
23Louis E. Raths, o^* cit., pp. 57-58-

97Opportunity must be provided to incorporate unforeseen events and data into the over-all evalva,tion plan. Failure to do so would frequently lead to absurd conclusions. Although it may be said that the numerous aspects of evaluation provided for in other principles will usually prevent any fixation of the evaluation process, for example, the principle of continuity or of integration with teaching-learning, other principles should not imply that the flexibility needed with respect to such principles is superseded or denied by inconsistency. Consequently, it has been phrased in this study to facilitate and incorporate flexibility consistent with other principles.
Principle — Evaluation should include both subjective judgment and objective appraisal.
Previous discussion has implied that subjective judgment is inevitable in evaluation. Subjectivity and objectivity are terms that have led to extensive disagreement and confusion in education. It is generally accepted that "subjective" denotes a personal impression; and "objective," an impersonal fact. "Subjective" is considered to be biased opinion; "objective," to be unbiased opinion. These general conceptions, usually vaguely defined, are inaccurate if not entirely erroneous. Time objectivity could be attained only by eliminating man as a factor in the explanation, measurement, and interpretation of phenomena. In the most unbiased measurement a certain subjective element is always present*

98In a social field such as education this element is present to an even greater degree. It would seem tliat a better definition of objectivity would be that it is the process of describing phenomena in such a way that a number of individuals conceive the same, or nearly the same, subjective meaning. In this sense, objectivity merely is the delimitation and classification of subjective experiences.
Subjectivity has another connotation for which there is no opposite condition. In this second sense,subjective means a uniqueness of conception, or experience, by the individual.Although Thorndike viewed everything as measurable, there is no experimental evidence or logical reason to indicate that the more that is measured that much more all individuals come to have experiences con^osed of equatable factors. All individual experience retains a certain uniqueness which no amount of measurement will objectify into equivalent units. In this instance subjective means personal, but there is no impersonal except inanimate phenomena, nor is there possibility of complete agreement or understanding by other individuals.
Evaluation should give consideration to information and measurements on which there is general agreement — in other words, objective data. Conversely, it must be recognized that the subjective element is also an important factor in education. There would be little need for an extended concept such as evaluation if all educational experiences and data were measurable in the objective sense.

99All of the writers referred to in this section recognize that the data to be used in evaluation must be interpreted, and that diagnosis is an essential function of. evaluation. This recognition of the importance of interpretation supports the inevitability of subjective jud^nent (26, 1+2, Si, 5 3, 61+, 7 0, 8 9, 9 8 ).
Principle — Evaluation should take into account differences among individuals being evaluated.
Recognition of a unique quality in all individual experience requires that provision be nade in evaluation for differences among individuals. Didividual differences, hcwever, have been substantiated by methods other than informal observation and introspection. The measurement movement created a growing awareness of the fact of individual differences. It is almost universally recognized that such differences are highly variable, and that provision must be made for them if an educational program is to be effective. Traxler has stated the problem and thereby extended the concept of evaluation. He says:
I should like to call attention to the fact that while it is very desirable for the staff of a school to reach an agreement concerning the objectives for the whole group, the basic idea of individual evaluation is not so much the setting dcmn of group objectives through a reflective process on the part of the faculty as it is tlie derivation of objectives for each individual pupil by means of a thorough study of the individual’s potentialities. If a school were to formulate and adhere relentlessly to a set of objectives for the entire group, it would merely emulate totalitarian methods on a small scale2n Arthur E. Traxler, "individual Evaluation," New Directions
for Measurement and Guidance, American Council on Education,pp. l8-19<

100The consideration of each individual with respect to objectives
and evaluation so as to take account of individual differences involves two general factors: (1) differences of the individualas he develops through time, and (2) differences among individuals in a group at different times. The principle stated above is presumed to be applicable to both types of differences. Explicitly it refers to differences among individuals; but the existence of such differences, the recognition that change and progress in learning occur through experience, implies that individuals themselves differ and change as they develop (26, U2, $3, 6U, 67, 70).
It is primarily because of variable differences in the individual as he develops that evaluation rather than measurement is needed. This need carries implications for and supports certain other principles, particularly those dealing with diagnosis, guidance, self-evaluation, and variety of techniques and methods of evaluation. Learning may be blocked or diverted by physical, mental, emotional, or social factors. The teacher needs extensive information regarding all of these aspects of experience, needs it continuously, and must constantly attempt to achieve as valid an interpretation as possible regarding their interacting influences(U, U2, 51, 53, 6U, 70).
Consequently, this principle is not viewed as including purely competitive types of comparison or appraisal and excluding all other types. The unique, subjective aspects of experience are also recognized and are the theoretical basis for evaluation ultimately.

101This basis is merely extended and broadened by the fact of individual differences which are subject to objective, ençjirical proof. On the other hand, competitive, or comparative, types of appraisal are not entirely excluded in this conception. Although individuals differ, patterns of growth, abilities, aptitudes, and so on must be determined to realize the purpose of evaluation through establishing reasonable goals and for providing guidance in the attainment of such goals.
Comparative appraisal is necessarily a part of the total evaluative process and its validity in part is based on the fact that many likenesses or similarities exist among individuals. The importance of likenesses or similarities is not denied by the emphasis in preceding discussion. While such likenesses are important, they have been assumed more readily and provided for to a greater extent in evaluation than have differences*
Principle — Evaluation should include a consideration of both tlie beginning status and growth or progress of individuals.
Individual differences provide a veiy logical reason for knowing the beginning status of individuals. If individuals differ and past experience determines to a large extent readiness for future learning, then the status of individuals must be known before valid immediate objectives can be established which will serve as means of attaining the general purposes of education. Learning, which is the ultimate outcome to be evaluated, also establishes the need for this principle. Learning is continuous; it is affected by numerous personal and

102
situational factors; it is influenced by individual differences; and it becomes apparent through changed behavior. Because learning is characterized by continuity and is affected by changing conditions, the individual's status at the beginning of some period must be determined so that his progress may be evaluated at a later time(k, U2, $1, 6U),
The main reason for ascertaining present status is to provide a basis for establishing immediate objectives. A knowledge of status at the beginning of a learning experience, unit, year, and so on is also essential, however, if consideration of individual differences is to continue to retain any significance as the learner progresses. The principal reference point must be the individual himself; it is the avowed purpose of evaluation to determine progress with reference to the individual's needs, interests, abilities, and aspirations. Instruments and te cliniques used in evaluation may provide comparative data with respect to others, but such data should be used to make individual evaluation more valid and effective.
Ascertaining the pupil's status is not inconsistent with the principles of continuity and the integration of evaluation in the teaching-learning process. At the level of experience of immediate concern the pupil and the teacher are engaging in it. Psychologists have often termed this "progressive goal setting." Status may also be determined more periodically, for example, by the use of different types of tests or cumulative records. This provides additional

103data regarding status at longer intervals, but also contributes to a knowledge of progress by enlarging the perspective on the total development pattern, of the individual ( 1, 6U, 7 0, 8I4., 8 9, 98).
Most writers have recognized this principle only indirectly in discussions of individual differences and of establishing objectives. Of the writers referred to in this section only Traxler appears to have stated it specifically with reference to evaluation* The emphasis generally has been on employing knowledge of present status to determine valid objectives and to provide a favorable learning situation by recognizing individual differences. In addition to these two reasons it seems desirable to state this principle independently to show more definitely how evaluation proceeds*
Principle — Individuals should be given assistance in developing the ability to evaluate their own progress cr growth.
At many points in previous discussion self-evaluation wassuggested or implied. Sources already quoted also suggested thatself-evaluation is directly related to and the most effective meansof improving learning. Troyer and Face have taken the position that"self-appraisal is a variety of evaluation that is also practically
2éuniversal in all education.” This point of view is quite similarT 5 ----------Arthur E. Traxler, Ibid., pp. 29-30.26 Maurice E. Troyer and C. Robert Pace, op. cit*, p. 5»

louto that accepted in this study. However, it is recognized that the principle can function effectively only if the objectives of the educational program are understood and accepted by the pupil.The latter condition has previously been accepted in this study and provides the basis for validating evaluation. Nevertheless, evaluations will be made by pupils irrespective of this condition.Such evaluations will be concerned with personal purposes; and when these are appreciably different from those of the educational program being developed, then the curriculum becomes irrelevant and the pupil’s learning is diverted from the ostensible purpose toward some other purposes (U2, $1, 6U, 65, 67, 81).
There thus seems to be a potential conflict between individual purposes versus purposes of an educational program. Otiier principles of evaluation, particularly co-operation, concern for individual differences, and integration of evaluati.on 7/ith teaching-leaming mitigate this influence. However, in reference specifically to this principle, it cannot be concluded hastily that an irreconcilable difference exists betvreen self-ovaluation and external evaluation, Self-evaluation and external evaluation are interrelated.Only when objectives are entirely imposed does the hiatus between self-evaluation and external evaluation become absolute.
Under more favorable conditions, external evaluation provides additional evidence for making adequate self-evaluation. When external evaluation is conducted in the light of principles previously

10^stated, it in fact encourages self-evaluation and prevents the latter from becoming dangerously hypercritical or misdirected.
The immediate effectiveness of self-evaluation is, therefore, dependent on acceptance of objectives. This is best achieved by permitting other principles to become functional. One can only speak of the value of self-evaluation with reference to an educational program when provision is made for participation in determining objectives and in the total program of evaluation. In the absence of this, the whole concept of evaluation loses meaning, at least with reference to any objectives ostensibly established for the learner, but without consideration of and participation by the learner (U2, ^1, $3, 6U, 65, 81, 8U).
Principle — In evaluation, all available evidence should be used f’or the diagnosis of the growth or progress of each individual.
Diagnosis is essential if progress toward consciously conceived objectives is to be determined. If learning is to be improved, then the factors that are inhibiting cr interfering with desired learning must be identified, and the areas of weaknesses and strengths must be recognized. This function of evaluation is, of course, greatly facilitated if objectives are clearly defined and expressed as behaviors (i*, 2 6, U2, 5 1 j 6 3 , 6U, 6 5 , 6 7, 7 6, 6U>89).

106The purpose of diagnosis is to make intelligent guidance
possible. Eoss has stated the problems and functions of diagnosis in a general way that goes beyond mere diagnostic testing, remedial teaching, and specialized guidance service. His philosophy is that under the enlarged concept of education it is no longer possible to limit the scope of diagnosis to locating the causes that interfere with academic progress; that diagnosis is much larger than the use of tests and examinations. Ross's basic theory is that "Diagnosis seeks not so much to describe or explain educational maladjustment as to correct or prevent it. Adequate diagnosis is the basis of all intelligent guidance and effective teaching.
Principle — The results of evaluation should be used inplanning future teaching-leaming activities.
Theoretically this principle is derived from the nature of experience and learning. Establishing objectives and goals is based on past experience and evaluation of experience. The data of evaluation and conclusions based on such data will inevitably assist in planning more purposefully and adequately future teaching- leaming activities. This principle is obviously applicable to both the teacher and the pupils; both need to know the conditions of effective learning and the extent of progress toward objectives previously stated (26, ij.2, $1, 63, 6U, 6?, 8U). 57----------
C. C. Ross, Measurement in Today>s Schools, p. 36U«

107Within the general concept of evaluation developed for this
study the principle is all but platitudinous. Conversely, the application of the principle has frequently been neglected, partially because of lack of continuity in the educational process, and in large part because of emphasis on segregated or isolated objectives conceived in terms of sub je ct matter rather than pupil behavior.
It should be noted that the principle is applicable not only to the immediate classroom situation, but to the total school program and indicates a need for data extending over longer periods of time to make intelligent planning for each pupil possible (U2, 63, 65, 8U, 89).
Principle — Evaluation should have guidance of theindividual as its primary puipose.
The statement of a philosophy of evaluation in this sectionstresses evaluation of pupil progress and suggests other purposesonly indirectly. Other purposes are important, bub are not directlyrelated to this study, A final principle is stated indicating thatthe primary purpose of evaluation is guidance. The principle hasbeen enphasized by most writers, but few have committed themselvesto stating it as the primary purpose, Tyler in a genaral statementon evaluation has asserted that guidance is one of the important
28purposes, Raths has expressed this principle in substance as2B Ralph W, Tyler, "General Statement on Evaluation," Journal
of Educational Research, 35 (March, 19U2), p. U93*

108follows: "The information I seek •will give me evidence about pastprogress, bub it must also help me and my students to decide about
29next steps." Troyer and Pace have stated tirie idea as "The responsibility of the teacher and the evaluation specialist is primarily one of guidance
The assertion that the primary purpose of evaluation is guidance is not based merely on the fact that the present study is concerned with pupil progress. In general, the principle holds whether the teacher, the pupil, the school staff, or the community is the referent. Within the general concept developed in previous statements, the effectiveness of evaluation in guidance indicates the validity of the hypotheses and purposes of the school program* Since the school exists solely for the pupil, its ultimate purpose must be guidance of the pupil# Evaluation must be concerned with the long-range task of improving educational practices as well, but it must above all provide some basis for helping the pupil achieve desirable purposes currently (26, U2, 62, 6U, 6?, 70, 76, 81) .
If guidance for the individual does not result from evaluation, it is doubtful if education can be improved since evaluation would lose its validity and meaning. This does not mean that there will ^ ---------
Louis E. Raths, "Toward Better Evaluation," EducationalLeadership, 8 (November, 1950), p. 70.
30Maurice E. Troyer and C. Robert Pace, o£. cit., p. 91»

109be no failures or shortcomings in guidance of the pupil; it means that other purposes of evaluation can be achieved only with refera to the results of evaluation appraised with respect to guidance of the individual. Any inadequacies or contemplated changes in the educational program must be discerned from the giidance function of education, and i^rpotheses toward improving the situation may then be advanced.
The general philosoply presented in this section indicates only in broad outline what should be ideally the concerns of individuals engaging in evaluation, what procedures should be employed, the purposes for which evaluation should be conducted, and the relation of evaluation to the learning process. These general guides served as a basis for determining the types of information to be sought from teachers and school principals. The detailed aspects of practices and programs of evaluation are preser in the following three chapters.
Judgments of Authorities in Evaluation Regarding Principles
It has been indicated that principles of evaluation are deemed to be important in providing a basis for developing a concept of evaluation and in giving direction to the evaluation process. Consequently, one part of this study was devoted to obtaining some indication of the present status of the principles accepted by the

110three doctoral students involved in the series of studies. Since the basic ideas in the principles were derived from the literature, tlie most promising source for this aspect of the study was considered to be authorities who had contributed to or had been concerned about the development of principles. Evidence from this source would establish current views typical of the most advanced thought in evaluation. The results of the survey of experts are presented in this section.
The principles accepted in this study were listed in an inquiry, a copy of which is included in Appendix A. The inquiry was designed to secure ratings of agree-undecided-disagree and of importance based on a three-point scale, m the latter scale, a rating of "1" indicated "little or no importance," a rating of "2" indicated "some importance," and a rating of "3” indicated "great importance." These ratings were to be made only if the rater had agreed with the principle. An "agree," "undecided," or "disagree" rating was to be made for each principle by the rater.
These rating inquiries were sent to twenty-seven authorities in evaluation selected according to criteria described in ChapterI. The list of authorities is included in Appendix B. Twenty-one inquiries were returned, all of which were completed in accordance with instructions to the extent that the respondent believed he could actually rate the principles. Some respondents indicated in the case of a few of the principles that they did not believe

Illthey co-uld mal e the rating requested. These omissions were generally explained by a fre&-response item or by marginal notations regarding the particular principle. These comments provided evidence regardiig the reasons for not rating a principle as well as additional ideas of authorities regarding evaluation.
In Table 10 the responses to the agree-undecided-disagree portion of the inquiry are shown. These responses indicate that rather extensive agreement exists among authorities that the principles are applicable to evaluation of pupil progress. Twenty respondents agreed with three of the principles, which is almost a unanimous consensus. One respondent rated only one of the principles, which accounts for the "No response" tabulations for each of these items. The three statements ranking high in agreement were those concerned with (1) formulation of objectives, (2) need for a variety of techniques and methods, and (3) continuity in evaluation. The principle ranking particularly low was the one stating that the primary purpose of evaluation is guidance. The free - response statements indicated that some respondents did not believe tliat a primary purpose for evaluation could be established; others stated that they believed purposes such as curricular change or research were at least equally important.
The "undecided" and "disagree" responses for other principles generally reflect beliefs of raters that they could not agree with the comprehensiveness of the principle or that it was ambiguously stated. A study of the general distribution of the raters showed

112TABIE 10
EXTSOT OF AGREEMENT AMONG 21 AUTHORITIES IN EVALUATION WITH THEPRINCIPLES ACCEPTED IN THIS STUDY
Principle Number of authorities indicating NoAgree Ifridecided Disagree response
Evaluation of the growth or 20 1prepress of individuals should be conducted in terms of purposes or objectives established in a clear and understandable fashion.Evaluation should be a co- 13 h 3 1operative undertaking of all persons concerned with or affected by the evaluation.The process of evaluating 20 1the growth or progress of individuals should have continuity.In evaluation, evidence should 15 2 2 2be gathered concerning all aspects of the growth or progress of individuals.Evaluation should be an integralpart of the teaching-learning 19 1 1process.Because of the complexity of 20 1tlie evaluation process, a variety of techniques, instruments, and methods should be used to secure adequate evidence of the growth or progress of individuals.Insofar as possible evaluation 19 should be a planned process.
(Continued)

113
TABLE 10 (Concluded)
Principle Number of authorities indicating NoAgree Undecided Disagree response
Evaluation should include both subjective judgment and objective appraisal.
16 3 2
Evaluation should take into account differences among individuals being evaluated.
17 1 1 2
Evaluation should include a consideration of both the beginning status and growth or progress of individuals.
19 2
Individuals should be given 19 assistance in developing the ability to evaluate their own progress or growth.
1 1
In. evaluation, all available evidence should be used for the diagnosis of the growth or progress of each individual.
16 2 1 2
The results of evaluation should be used, in planning future teaching-learning activities.
19 2
Evaluation should have guidance of the individual as its primary purpose.
10 h 2

n uthat one respondent rated only one principle and made comments regarding a niomber of other principles; seven respondents agreed with all principles stated, and two of the seven rated all principles as of "great importance"; two respondents expressed disagreements and criticisms indicating that they agreed with only about 50 per cent of the principles.
The ratings of importance for each principle by authorities who agreed with the principle are summarized in Table 11, The principle relating to evaluation in terms of purposes clearly established ranks above all others with unanimous consensus of "great importance." Ratings of importance on all other principles reflect a predominance of "great importance" ratings, but with approximately one-fourth of the ratings falling in the "some importance" category. Five principles were not rated on this scale by a considerable number of respondents: the principles stating that (1)evaluation should be co-operative, (2) evidence should be gathered concerning all aspects of progress, (3) evaluation should include both subjective judgment and objective appraisal, (U) evaluation should take into account differences among individuals being evaluated, and (5) the primary purpose of evaluation should be guidance.
These ratings of importance also indicate a large exrbent of agreement but agreement which is not so high as the ratings of agreement with the principles per se, A greater distribution of responses is, of course, to be anticipated since an individual rater

115TABLE 11
RATINGS OF SIGNIFICANCE OR IMPORTANCE FOR EACH PRINCIPLE OF EVALUATION ACCEPTED IN THIS STUDY, BY AUTHORITIES IN EVALUATION WHO AGREED
WITH THE PRINCIPLE
Princ iple _____Ratings of authorities____Little or àome Great No
no importance importance importance response
Evaluation of the growth or progress of individuals should be conducted in terms of purposes or objectives established in a clear and understandable fashion.Evaluation should be a co-operative undertaking of all persons concerned with cr affected by the evaluation.The process of evaluating the growth or progress of individuals should have continuity.In evaluation, evidence should be gathered concerning all aspects of the growth or progress of individuals.Evaluation should be an integral part of the teaching-leaming process.Because of the complexity of the evaluation process, a variety of techniques, instruments, and methods should be used to secure adequate evidence of the growth or progress of individuals.Insofar as possible evaluation should be a planned process.
20
8
lU
11
lU
15
15
(Continued)

116TABLE 11 (Concluded)
Principle Ratings of authoritiesLittle or
no importanceSome
importanceGreat No
importance responseEvaluation should include both subjective judgment and objective appraisal.Evaluation should taice into account differences among individuals being evaluated.Evaluation should include a consideration of both the beginning status and growth or progress of individuals.Individuals should be given assistance in developing the ability to evaluate their own progress or growth.In evaluation, all available evidence should be used for the diagnosis of the growth or progress of each individual.The results of evaluation should be used in planning future teaching-learning activities.
12
11
lU
15
lU
16
Evaluation should have guidance of the individual as its primary purpose*
10

117who agreed with a principle would not necessarily believe it to be as important as other principles, whereas any appreciable distribution on the agree—undecided—disagree scale would indicate in effect that a general definition of evaluation has not been established or that the concept was in a process of redefinition.
The responses summarized in Tables 10 and 11 were supplemented by free-response statements on many of the inquiries. A summary of these statements showed that comments were concentrated with respect to principles concerned with (1) co-operativeness, (2) continuity, (3) all aspects of growth, (U) evaluation in the teaching-leaming process, (5) subjective judgment, (6) individual differences, (7) diagnosis, and (8) guidance. Most of the ccsnments regarding these principles may be classified as expressions of uncertainty or disagreement whether a primaly purpose for evaluation can be stated, criticisms of the all-inclusive nature of certain statements of principle, and criticisms regarding ambiguity.
In general, the extent of agreement with the principles among authorities in evaluation appears to be almost unanimous if problems of semantics could be clarified. However, while the conclusion seems warranted that there is extensive agreement at the abstract level, there is also a strong indication that evaluation tends to be a rather nebulous concept which results in extensive disagreement regarding its ultimate purpose. Many respondents seemed to view the purposes as interrelated or also subject to evaluation-

118Procedures employed in evaluation and use of evaluative evidence also elicited some disagreement and uncertainty. Differences of opinion regarding procedures and use of evaluative evidence were expressed particularly with reference to the principles stating that evaluation should be co-operative, that evidence should be gathered concerning all aspects of growth, and that all evidence should be used for diagnosis.

C^HAPTER IV
EVALmTION Ï'R-ACTICES OF TEACHERS
Principles of eval^t j_on of pupil progress suggest numerous factors that require cons txieration and indicate or inply various activitieSj procedures, xi functions that comprise the total evaluation process. In the foil cwing three chapters information relative to the practices and progr ams of evaluation in selected secondary schools in Ohio is analyse^ and. summarized. The term "practices'* refers to activities and f‘>mctions performed ty the teachers and pupils in the evaluation p irocess; "programs" by limited definition includes techniques, met-'ic>cd.s, and procedures that are used school- wide vhiich are not usually dependent on the discretion of the individual teacher. The letter, of course, may also become directly related to the te-Kuching situation, but generally serve additional broad and long—%-ange purposes. This distinction is by no means absolute; it is ozne of convenience and practicability in obtaining and organizing d^ta. Data regarding practices were secured directly from teac^jers, and inf or nation with respect to programs as defined was ob'^ained from school principals because each of these persons would likely be most familiar with the two respective phases of evaluation. Some overlapping in areas such as recording and reporting is inevitable and is perhaps desirable since it may provide eviderice of the familiarity of different school personnel with tho Evaluation program.
119

120This distinction between practices and programs is main
tained in presenting the data in the following chapters. Chapter IV contains data of a relatively objective type regarding practices of teachersj Compter V is concerned with certain aspects of evaluation programs; in Chapter VI the judgments of teachers and principals with respect to the values of evaluation techniques and practices, the adequacy of evaluation, and deterrent factors affecting evaluation are presented.
The survey of practices in this chapter includes those which seemed to be significant in the light of the principles accepted.The primary purpose of this survey of practices of Ohio teachers is t o provide an over-all or panoramic description of the prevailing status of evaluation at the level where it is inevitably most directly implemented and most important.
The data presented are organized into five sections. First, practices of teachers in formulating objectives; second, evaluation techniques and procedures used by teachers; third, recording pupil progress; fourth, marking and reporting; and fifth, specialized guidance. The different "types of information obtained from teachers with respect to these broad phases of evaluation are classified according to certain basic characteristics of teachers and schools. The general plan followed in presenting these data is based on the following criteria for attaining as much brevity and compactness as possible.

1211. The presentation of data for all characteristics for
types of imformation which might be affected by differences in characteristics.
2. The presentation of data for certain characteristics only when other characteristics obviously could not be related in any meaningful way to those data.
3« The presentation of data for the total of all respondents only when trends in the data in all classifications revealed no appreciable differences.
In addition to the application of these general criteria, four characteristics of teachers — age, years of training, years of teaching experience, and last period of teacher training — weie analyzed only for selected extremes of the distributions of respondents for these characteristics. This procedure seemed justifiable because the general pattern of responses for the remainder in a given distribution may be inferred which in almost all instances varied so slightly that further analysis seemed unwarranted. The general similarity of patterns of responses for different groupings of teachers provides additional justification for the acceptance of the criteria noted above and the specific limitations described. Data were not analyzed by the type of teacher training institution attended because only relatively small numbers of teachers reported attending only one of each of the types of institutions. Data are presented by size of school in the case of the number of teachers using various evaluation

122techniques only. For all other data, an extremely close similarity existed between large schools and city schools, and between small schools and local schools.
In the attempt to present the data in a comprehensive as well as a compact manner, a general plan of tabular design was adopted. This plan provides information on (1) number and per cent of respondents, (2) number and per cent making different responses or ratings, and (3) the summary for all respondents regardless of classification according to basic characteristics (the summary figure can be verified only by adding the figures either for types of school district^ types of school organization, or subject areas —
other classifications will not verify the total because of intentional omissions or small numbers of "no data" classification for a particular item). Number and per cent of respondents refer to the responses of respondents to given items on usable inquiries received and not to the number and per cent of inquiries returned.The latter are treated in Chapter I,
It should also be noted that the number of respondents in various tables differs markedly from the number that might be anticipated on the basis of 921 inquiries returned. Such differences occur whenever particular items in a table are dependent on the responses to the previous item on the inquiry. These differences may be verified and understood by referring to the table containing the data regarding the previous item.

123The information relative to methods and techniques used by
teachers along with certain data concerning pupil participation in evaluation is presented in summary tables only in the text of the chapter. These data, however, were tabulated for all analyses and are included in Appendix C. The methods and techniques of evaluation are listed in all tables in order of rank based on the number of teachers using them. All other data that are presented in tables showing related items are not ranked, but are shown either according to the order in which they appeared on the inquiry or in the order that was most convenient for practical reasons*
The various procedures described have been employed in the presentation of all data in tabular form in this chapter and subsequent parts of the dissertation. Although the criteria and limits discussed above appear to destroy certain details, these deletions in detailed reporting were made only on the basis of similarity of responses or on the basis of criterion 2 stated above*
Formulating and Establishing Educational Objectives
Establishing objectives is essential to any valid evaluation of pupil progress. Because objectives are needed, teachers were asked to indicate the practices followed in their schools and classes with respect to salient aspects of establishing objectives that are stated or implied in principles of evaluation. Points

12Uof particular inçortance are: (1) whether objectives have beenformulated or re-examined, (2) factors considered in establishing objectives, (3) personnel participating in establishing objectives,(U) extent of participation by teachers, (5) study of ways to evaluate the attainment of objectives, and (6) extent of pupil participation*
In Table 12 the number and per cent of teachers indicating that objectives had been formulated or re-examined for their school and their subject area are shewn for each of the classifications of teachers that could be related in some significant way to these procedures. Since the number of teachers stating that they studied objectives individually for their subject areas is rather low as will be indicated in discussion of Table lU, further analysis would provide no additional significant findings in this area. Table 12 shows that about one-third of all respondents stated that objectives had been studied for the entire school, and that approximately two-fifths indicated this had been done for their subject area for the current school year.
Study of objectives for the entire school is somewhat more common in city schools than in exempted village and local schools; study of objectives in subject areas as compared with stu(%r of objectives for the entire school is reported slightly more frequeiily by c ity teachers, by a little over one-third of local teachers compared with slightly under one-fourth for the entire school, and by

TABLE 12NlHiBER AMD FER CEMT OF TEACHERS IMDICATIMG THAT EDHCAT^mLOBJECTIVES HAD BEEN FQRMUUTED CR RE-EXAMINED
IN THE CIERENT SCHOOL YEAR
Classification of teachers RespondentsTeachers indicating study of objectives for the entire school
RespondentsTeachers indicating study of objectives for their subject area
N i N N % N %All respondents 902 9b,Ù 297 32 .9 .. 'PW 97.7 559 39.9
City schools 509 97.7 202 39.7 508 97.5 227 44.7Exempted village schools 75 100.0 20 26.7 75 100.0 20 26.7Local schools 318 97.8 75 23.6 317 97.5 112 35 .4
Subject areasAgrioidture 23 95.8 4 17 .4 23 95.8 16 69.6Art 18 9U.7 8 44.4 17 89.5 10 58.8Business education 81 98.8 20 24.7 81 98.8 21 25.9English 148 99.3 54 36.5 147 99.3 58 39.5Foreign language 37 97.4 11 29.7 37 97.4 12 32 .4
Home economics 71 98.6 22 31 .0 71 98.6 25 35.2Industrial arts 57 98.3 20 35.1 57 98.3 34 59.6Mathematics 103 96.3 26 25.2 103 96.3 30 29.1Music 40 97.6 11 27.5 40 97.6 12 30 .0Piçrsical education 60 100.0 25 41.7 60 100.0 27 45.0Science 96 100.0 38 39.6 96 100.0 43 44.8Social studies 141 95.9 50 35.5 141 95.9 62 44.0Other 27 96.4 8 29.6 27 96.4 9 33.3
Kvn

126the spie proportion of exençïted village teachers for both types of objectives. The analysis by subject areas in the same table shows a rather erratic pattern of responses for objectives for the entire school. This is probably insignificant since it may reflect the higiter per cents for city schools in certain subject areas because such schools tend to have a more varied curriculum or it may be related to selection factors tending to bring teachers from certain curricular areas into the study of objectives for the entire school.
For establishing objectives in the subject areas a more definite pattern appears. Foreign language, mathematics, music, and business education are considerably lower than other areas. Other academic subjects, home economics, and physical education are in the middle of the distribution with from 35 to LtB per cent of teachers indicating study of objectives; industrial arts, agriculture, and art are at the top with about 60 per cent. The nature of the subject area seems to correlate with the extent to which teachers state that they study objectives for a given year. Teachers in areas having a relatively fixed, defined body of knowledge reported the practice most infrequently; other areas show increases in apparent relation to the extent to which no orthodox body of subject matter exists in most secondary school curricula.
Table 13 shows in summary form the number and proportion of teachers stating that they consider certain factors which are frequently associated with formulating objectives. This item was

127TABLE 13
TEACHERS INDICATING THAT CERTAIN FACTORS ARE INCORPORATED IN THE FORMtEATION OF OBJECTIVES FOR THEIR OffN TEACHING
Factor Number Per cent
Teacher responsibilities 699 79.8Course content to be covered 661 7 5 .5
Specific pupil behaviors to be sought 596 68.1Broad pupil goals to be attained 66k 7 5 .8
Other 17 1.9
Number and per cent of respondents 875 9 5 .0
asked specifically with reference to the teacher*s individual practice because the approaches for schools or subject areas may vary markedly and also because the respondent might not be informed in regard to the broader problems of establishing objectives. Cafer a summary is presented because variations for all analyses were very small. This table shows that three-fourths of all teachers consider teacher responsibilities, course content, and broad p\q>il goals in formulating objectives. Somewhat less, slightly below 70 per cent, consider ^ecific pupil behaviors. Thus, the factor specifically deemed most important in principle ranks lowest in the distribution among various factors. While it is not particularly

128lower, the fact that the distribution of response is so nearly the same suggests that tie re are extremes in practice as well as large variations among teachers in the conception of and approach to formulating objectives for their teaching. Extreme cases reporting only one of the factors cannot be inferred from the table, but a number of such cases for each factor were identified in tabulating the data. Most respondents checked either two or three of the factors.
Ih the principles of evaluation the need for co-operation and participation by various individuals concerned with evaluation is stressed, üi Table II4. data are presented showing the different personnel and groups formulating objectives for subject areas in the school curriculum. In general, formulation of objectives by the principal or supervisory personnel is reported infrequently except for local and exenpted village schools in which slightly over 25 per cent of teachers indicated that administrative personnel undertook this task independently. Over 70 per cent of all respondents reported either that a committee of teachers or a committee of teachers and supervisory personnel formulated the objectives for subject areas. Those respondents classified as "other" usually stated that they undertook formulation of objectives as individuals or in co-operation with their principals or supervisors. This category probably includes a considerable number of teachers whose work is highly specialized or which is not believed to be related very closely to other areas of the curriculum so that wider partici-

TABLE HiNUMBER AND PHI CENT OF TEACHERS STATING THAT OBJECTIVES FŒ THEIR SUBJECT AREA TIÏERE FORMULATED BY
DIFFERENT SCHOOL lERSONNEL
Classification of teachers Respondents
Types of personnel
Principal SupervisorPrincipal
andsipervisor
Committeeof
teachersCommittee ofteachers and principal or sipervisor
Other
N i N N % N % N N N %All respondents 31*2 950 26 7.6 19 5.5 6 1.8 92 26.9 11*8 1*3 .3 51 ll*.9City schools 219 960 2 0.9 12 5.5 5 2 .3 72 32.9 101* 1*7.5 21* 10.9Exençibed village schools 19 95.0 5 26.3 1 5.3 9 1*7.1* 1* 21.0local schools 101* 92.9 19 18.3 7 6.7 1 1.0 19 18.3 35 33 .6 23 22.1Subject areas:Agriculture 15 93.7 7 1*6.7 1 6.7 1 6.7 2 13.3 1* 26.7
, Art 10 100.0 1 10.0 1* 1*0.0 1* 1*0.0 1 10.0Business educatim 19 90.5 1 5.3 1 5.3 5 26.3 5 26.3 7 36.8English 51* 93.3 3 5.5 11* 25.9 31 57.1* 6 11.1Foreign language 12 100.0 1 8.3 6 50.0 5 1*1.7Home economics 22 88.0 2 9.1 3 13 .6 6 27.3 8 36.1* 3 13.6Industrial arts 32 9l*.l 3 9.1* 3 9.1* 1 3 .1 7 21.9 13 1*0.6 5 15.6Mathematics 30 100.0 3 10,0 1 3.3 11 36.7 9 30 .0 6 20.0Music 11 91.7 1* 36.1* 1 9 .1 1* 36,1* 2 18.2Physical education 26 96.3 3 11.5 1 3 .6 8 30.8 12 1*6.2 2 7.7
Science 1*2 97.7 1 2.1* 1 2.1* 10 23.8 20 1*7.6 10 23.8Social studies 61 98.1* 5 8.2 1 1.6 2 3 .3 18 29.5 32 52.5 3 li.9Other 8 88.9 1 12.5 2 25.0 3 37.5 2 25.0
HroVO

130pation may seem infeasible. Although these data suggest a general tendency toward a committee approach among staff personnel in attempting to fomiulate objectives, it is to be noted that this is applicable to only about UO per cent of teachers reporting that objectives were studied at all; also, that in city schools 30 per cent more teachers reported this practice than in local and exençted village schools.
Practice in the different subject areas does not deviate particularly from the general condition described except in a few instances based on small numbers of respondents. Such deviations occur particularly in agriculature and foreign language. Agriculture is notewoirbhy because of predominance of supervisory personnel and the foreign language area for almost complete absence of mention of such personnel separately. With respect to this condition, teachers in agriculture and local schools are not consistent since in Table 15 no respondents in agriculture and far fewer in local schools stated that they participated either "none,” or "little*" This suggests that a few teachers, particularly in these classifications, did participate with supervisory personnel, but that they viewed the procedure as one which was largely initiated or pursued by such personnel with the assistance of the teacher. Other hypotheses could be advanced, but this seems the most likely in view of the organizational and procedural practices common in these areas. Other exceptions in this connection are exceedingly small and in any event not necessarily inconsistent.

131Table 15, already referred to, reveals the general status of
the extent to which teachers believe they participate in formulation of objectives for their subject areas. Theses data are characteristic of the general consistency of responses revealed throtighout this study. Such consistency does not imply similarity in types of responses to all of the different items in the inquiry, but it does extend usually throughout the analysis for given items. A. study of Table 15 shows that about 85 per cent of teachers stating that objectives had been studied in their subject area in the current school year indicated that they participated “some" or “much," and that the respondents are about equally divided between the two categories. Some variation between these categories is revealed in analysis, but the total for the two categories remains almost constant. Additional variations in these data appear with reference to interrelated factors of age, professional training, and teaching experience. About 15 per cent more of younger, less-experienced teachers reported the extent of participation as “none" or "little" than is generally indicated, but a slightly larger proportion also indicated "much" in these classifications.
Formulation of objectives in subject areas appears to be done largely by teachers and in a majority of the schools in which study of objectives is undertaken ty some type of group approach to the problem. In local schools, and in certain subject areas based on small numbers of respondents, practices differ somewhat from this
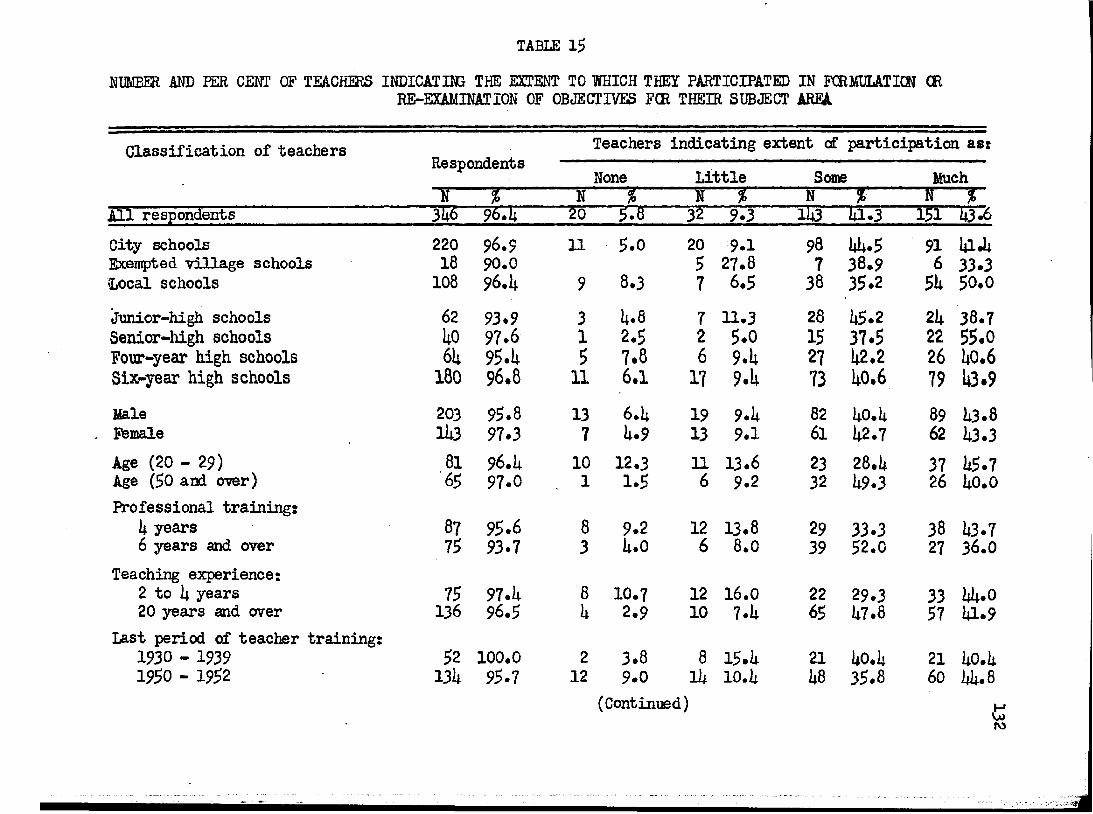
TABLE 15KBMBER MD FER CENT OF TEACHERS INDICATING THE EXTENT TO WHICH THEY PARTICIPATED IN FCRMULATICN CR
RB-EYAMINATION OF OBJECTIVES FCR THEIR SUBJECT AREA
Classification of teachers RespondentsI T
Teachers indicating extent of participation as:NoneT N T Little
iî iSomeN T
(Continued)
Much1— TAll respondents 316 96'.li.... 2o 5.8 32 9.3 ih3 ia.3 i5i I43.6City schools 220 96.9 11 5.0 20 9.1 98 Wi.5 91 iaJ;Bxençïfced village schools 18 90.0 5 27.8 7 38.9 6 33.3Local schools 108 96.U 9 8.3 7 6.5 38 35.2 51; 50.0
Jnnior-high schools 62 93.9 3 U.8 7 11.3 28 li5.2 21; 38.7Senior-high schools Lo 97.6 1 2.5 2 5.0 15 37.5 22 55.0Fotr-year high schools 6L 95.L 5 7.8 6 9.1 27 1|2.2 26 li0.6Six-year high schools 180 96.8 11 6.1 17 9.L 73 I4O.6 79 I43.9
Male 203 95.8 13 6.h 19 9.ii 82 hO.h 89 i;3.8Female 1U3 97.3 7 1.9 13 9.1 61 1|2.7 62 1;3.3Age (20 - 29) 81 96.U 10 12.3 11 13.6 23 28.1; 37 1;5.7Age (50 and over) 65 97.0 1 1.5 6 9.2 32 I19.3 26 iiO.OProfessional training:
li years 87 95.6 8 9.2 12 13.8 29 33.3 38 1;3.76 years and over 75 93.7 3 l.O 6 8.0 39 52.0 27 36 .0Teaching experience:
2 to 1+ years 75 97.U 8 10.7 12 16.0 22 29.3 33 14;. 020 years and over 136 96.5 h 2.9 10 7.ii 65 ii7.8 57 ia.9Last period of teacher training:
1930 - 1939 52 100.0 2 3.8 8 I5.1i 21 ll0.it 21 hO.U1950 - 1952 I3i* 95.7 12 9.0 111 10.1; 1|8 35.8 60 14;. 8
ro

TABLE 15 (Concluded)
Classification of teachers RespondentsTeachers indicating extent of participation as:
None Little Some MuchN _ . . . N % . N % N % N %
Course in educational tests andmeasurements:
Yes 230 96.2 10, U.3 16 7.0 101 U3.9 103 UU.8No 115 96.6 10 8.7 16 13.9 U2 36.5 U7 U0.9
Average enrollment in classes:20 and below 57 91.9 U 7.0 5 8.8 16 28.1 32 56.121 - 30 152 97.U 7 U.6 15 9.9 62 U0.8 68 UU.731 - UO 117 97.5 9 7.7 9 7.7 55 U7.0 UU 37.6Over UO 18 9U.7 3 16.7 8 UU.U 7 38.9
Subject area:Agriculture 16 100.0 5 31.3 11 68.7Art 10 100.0 1 10.0 1 10.0 6 60.0 2 20.0Business education 19 90.5 2 10.5 8 U2.1 9 U7.UEnglish 57 98.3 U 7.0 5 8.8 a 36.8 27 U7.UForeign language 12 100.0 6 50.0 6 50.0Hcsne economics 23 92.0 2 8.7 3 13.0 10 U3.5 8 3U.8Bidustrial arts 32 9U.1 2 6.2 3 9.U 11 3U.U 16 50.0Mathematics 30 100.0 2 6.6 20 66.7 8 26.7Music 12 100.0 2 16.7 6 50.0 u 33.3Physical education 27 100.0 2 7.U 3 11.1 9 33.3 13 U8.1Science UO 93.0 2 5.0 3 7.5 16 Uo.o 19 U7.5Social studies 61 98.U 7 11.5 7 11.5 2U 39.3 23 37.7Other 7 77.8 • 1 1U.3 1 1U.3 5 71.U
üV*J

13Ugeneral condition, with more emphasis on an individual attack hy varioue personnel in formulating objectives.
Closely related to formulating objectives is the determination of ways to evaluate attainment of objectives. Much of the value of establishing objectives may be lost if the means of evaluating are not clearly understood. In Table 16 the number and propoortion of teachers stating that ways of evaluating had been studied are shown for those teachers who had stated that objectives were formulated or re-examined. Nearly one-half of these teachers reported that some study of this phase of evaluation had been conducted. Proportionately more teachers in city schools reported this practice than in exenpted village or local schools. The pattern is similar to that revealed in the item concerned with establishing objectives. This means, however, that less than one- half of the UO per cent of teachers who had indicated study of objectives is reporting this practice. Thus, only about 20 per cent of all respondents are stating that ways of evaluating have been studied. The pattern of responses in subject areas is relatively uniform except for agriculture, music, and industrial arts in which the percentage of teachers is noticeably lower. Other classifications vary somewhat, but these variations probably reflect differences in selective factors in personnel policies between city schools and schools in other districts.
In Table 17 data are presented concerning the extent of pupil participation in establishing immediate class objectives. These
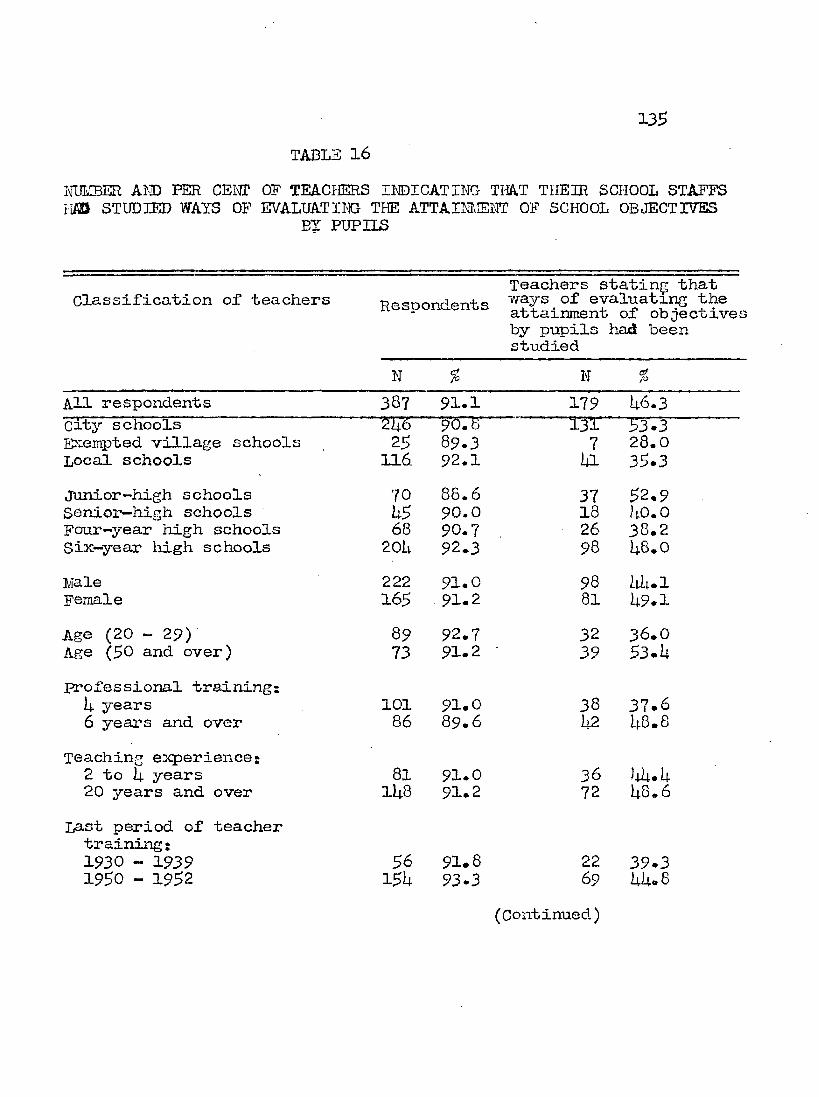
135TABLE 16
mJMBER A m PER CEI^ OF TEACHERS I1©IGATING THAT THEIR SCHOOL STAFFS im STUDIED WAYS OF EVALUATi m TPE ATTAimEIdT OF SCHOOL OBJECTIVES
BY PUPHS
Classification of teachers RespondentsTeachers stating that •ways of eval-uating the attainment of objectives by pupils had been studied
N % N %
All respondents 387 91.1 179 U6.3city schools 21:6 90.8 I3I 53.3E^zempted village schools 25 89.3 7 28.0Local schools 116. 92.1 la 35.3junior-high schools 70 86.6 37 52.9senior—high schools 1:5 90.0 18 80.0Four-year high schools 68 90.7 26 38.2Six—year high schools 20U 92.3 98 88.0Male 222 91.0 98 1:1:. 1Female 165 91.2 81 89.1Age (20 - 25?) 89 92.7 32 36.0Age (50 and over) 73 91.2 ■ 39 53.8professional training;
U years 101 91.0 38 37.66 years and over 86 89.6 U2 88.8
Teaching experience*2 to U years 81 91.0 36 88.820 years and over 1U8 91.2 72 88.6
Last period of teacher training;1930 - 1939 56 91.8 22 39.31950 - 1952 15U 93.3 69 88.8
(Continued)

TABLE 16 (Concluded)136
Classification of teachers
RespondentsTeachers stating that ways of evaluating the attainment of objectives by pupils had been studied
N c/ N
Course In educationaltests and measurerne nt:Yes 263 91.0 122 U6.UNo
Average enrollnient In122 91.0 56 U5.9
classes:20 and below 65 9 0 .3 25 3 8 .521 - 30 172 92.0 7U U3 . 031 - Uo 129 90.8 68 52.7Over Uo 19 86.U 10 52.6
Subject area:Agriculture 16 100.0 U 25.0Art 12 100.0 5 Ul.7Business education 25 89.3 11 UU.0English 68 9luU 28 Ui.lForeign language lU 100.0 7 5 0 .0
Home economics 29 85.3 16 55.2Industrial arts 29 82.9 10 3U.5Mathematics 3 h 9 1 .9 15 UU.iMusic 15 93.7 h 26.7Physical education 26 8 9 .7 15 57.7Science U7 88.7 25 53-2Social studies 63 91.3 33 5 2 .uOther 9 90.0 6 66.7

TABLE 17NÏIMBER AKD PER CENT OF TEACHERS INDICATING THE EXTENT TO WHICH PUPILS HELP PLAN WHAT THEY WILL
STUDY CR DO IN CLASS
Classification of Teachers Respondents Extent to which pupils help plan what they will stntfy or doNone Little Some Much
N 2 " ^ $ a $ N NAll respondents 98.6 1Ô2 11.3 279 30.7 1:26 1:6.9 lOl 11.1City schools 513 98.5 71 11:. 1: 161: 32.0 222 1:3.3 53 10.3Exempted village schools 7L 98.7 1: 5.1: 21 28.1: 1:2 56.7 7 9.5Local schools 321 96.8 21: 7.5 .91: 29.3 162 50.1 la 12.8Junior high schools 168 97.7 20 11.9 1:8 28.6 81 1:8.2 19 11.3Senior high schools 90 100.0 15 16.7 30 33.3 38 1:2.2 7 7.8Four-year high schools 187 97.9 19 10.2 66 35.3 88 1:7.0 Ih 7.5Six-year high schools 1:63 98.9 1:8 10.it 135 29.1 219 1:7.3 61 13.2Male 1:78 99.0 63 13.2 160 33.5 210 1:3.9 hS 9.1:Female 1:28 98.2 39 9.1 118 27.6 215 50.2 56 13.1Age (20 - 29) 202 99.0 19 9.1: 58 28.7 95 1:7.0 30 li:.9Age (50 and over) 162 98,2 22 13.6 52 32.1 73 1:5.1 15 9.2Professional training:
years 257 98.5 28 10.9 77 29.9 121 1:7.1 31 12.16 years and over 192 98.5 16 8.3 65 33.9 86 li.8 25 13.0
Teaching experience: 2 to years 180 98.9 16 8.9 6l 33.9 81: 1:6.7 19 10.520 years and over 3hÔ 98.6 1:0 11.5 112 32.2 169 1:8.6 27 7.7
Least period of teacher training 1930 - 1939 11:6 98.6 19 13.0 56 38.3 62 1:2.5 9 6.21950 - 1952 351 99.2 38 10.8 99 28.2 162 1:6.2 52 1L.8
(Continued)

TABLE 17 (Concluded)
Classification of Teachers
RespondentsExtent to which pupils help plan idiat they will stucjy or do
None Little Some MuchJL X ja t JL X JL
Course in educational tests and measurements:
Yes 621 99.0 72 11.6 189 30.4 300 48.3 60 9.7No 281 97.9 30 10.7 89 31.7 122 43.4 40 14.2
Average enrollment inclasses:20 and below l?li 98.3 12 6.9 46 26.4 78 44.8 38 21.821 - 30 ii08 99.0 57 14.0 131 32.1 181 44.4 39 9.531 - ho 281 98.6 31 11.0 91 32.4 139 49.5 20 7.1Over ho 37 97.4 2 5.4 10 27.0 24 64.9 1 2.7
Subject area;Agriculture 2h 100.0 2 8.3 10 41.7 12 50.0Art 19 100.0 12 63.2 7 36.8Business education 82 100.0 9 11.0 30 36.6 42 51.2 1 1.2English li|8 99.3 10 6.7 55 37.2 71 48.0 12 8.1Foreign language 38 100.0 7 18.4 16 42.1 15 39.5Home economics 69 95.8 4 5.8 7 10.2 31 44.9 27 39.1industrial arts 57 98.3 12 21.1 7 12.3 26 45.7 12 21.1I thematics 107 100.0 24 22.4 47 43.9 33 30.9 3 2.8Music iiO 97.6 1 2.5 9 22.5 27 67.5 3 7.5physical education 5L 90.0 5 9.3 14 25.9 31 57.4 4 7.4Science 96 100.0 10 10.4 39 40.6 43 44.8 4 4.2Social studies 1L7 100.0 18 12.2 47 32.0 75 51.0 7 4.8Other 27 96.4 2 7.4 6 22.2 10 37.1 9 33.3
OD

139data reveal a significantly different pattern from those of Table 1 5. However, all respondents presiaaably could reply to this item. When this difference is taken into account a closer similarity is revealed, but the number of teachers reporting "much” is lower.For all respondents, 14.6 .9 per cent indicated "some" participation by pupils, 3 0 .7 per cent reported "little," and 11.3 and 11.1 per cent reported "none" and "much" respectively, local and exempted village classifications are somewhat higher than city schools in this practice. An unusually high proportion of agriculture, art, and home economics teachers reported participation of pupils as "some" or "much," and foreign language and mathematics teachers reported considerably less participation with better than 60 per cent in "none” and "little" categories. Again, subject areas with a highly formalized content tend toward less participation than areas that are likely to be more variable in content. Recency of attendance at teacher training institution appears to be a factor related to this practice to some extent, but differences are not great.Variation in other respects is negligible.
In summary, approximately one-third of teachers reported that some study of objectives was made for the entire school during the current school year, virtually I4O per cent indicated study of objectives for subject areas, and most respondents for the latter indicated that the committee approach to the problem was used. For those teachers stating that objectives were studied, slightly less than one-half reported that ways of evaluating were considered. A

lltOgreat range and variety of methods of formulating objectives for the classroom is indicated; in certain subject areas, participation by staff and pupil personnel seems to be sought or facilitated; and, pupil participation, in general, is reported, as "little" or "some," with the largest number of teachers indicating the latter.
Methods and Procedures Used in Evaluation
A second broad aspect of evaluation involves the techniques and procedures used in obtaining evidence. Xn the general philosophy discussed earlier in this report it was suggested that this phase of evaluation is not limited to certain instruments or mechanical aids and their use, but includes observation, informal methods of evaluating experiences and class activities, teacher-pupil relationships, and pupil participation in evaluation. Evaluation becomes an integral part of teaching and learning. Certain outstanding elements and factors in this broad phase of evaluation, alone an extensive field of investigation, have been selected for this study. Even these selected factors had to be treated in a general and limited way because of the scope and detail of this aspect of evaluation.
The data of the section are organized under four major headings: (1 ) methods and techniques used by teachers, (2 ) basis of evaluation of different aspects of pupil progress, (3 ) testing practices, and (ii) pupil participation in evaluation. Data for the first and fourth topics are presented in summary form only within the chapter; detailed

liatabulations have been included in Appendix C. Other topics are treated within the chapter to the extent that teachers were the source of data. Some additional information obtained from school principals, particularly with respect to testing, is incorporated in Chapter V. Cross references are made to clarify or augment the over-all description.
Teachers were requested in the survey to indicate which methods and techniques they use in evaluation. A summary for all respondents to this part of the inquiry is presented in Table 18. Each of the items listed is stated as a general, broad category within each of which may be included a number of variations. This procedure may have resulted in the omission or obliteration of the identity of certain specific techniques, but it provides a description of more of the total range of methods and techniques than would otherwise be practicable. The list is presented in order of rank based on the number of teachers stating that they use the methods or techniques.
A wide range in the proportion of teachers using the different methods or techniques is revealed in this table in which "observing classroom activities" ranks highest with 92.9 per cent and "making sociograms" lowest with 15«6 per cent. The range and the distribution of responses suggest that great variation prevails in the techniques used by teachers. This variation which was verified in processing the data ranged from a low of only three items checked

1U2
TABLE 18TmCHERS INDICATING THAT THEY USE EVALUATION METHODS AND
TECHNIQUES LISTED
Method or technique Ifoniber Per CentObserving classroom activities 8U8 9 2 .9Examining class written work 810 88.7Using objective tests 779 85.3Conducting question-answer periods 767 8U.0Talking informally with pupils 7U7 81.8Examining home written work 702 78.0Conducting pupil discussions 682 7 5 .8Talking informally with other teachers 6 7 6 7U.0Listening to individual oral reports 637 6 9 .8Keeping your own record of class activities 617 6 7 .6
Examining work products 597 65.hUsing essay-type tests 59h 6 5 .1Using cumulative records 585 6U.1Using standardized or published tests 576 6 3 .1Observing pupils in out-of-class activities 5 7 2 62.6Holding conferences with other teachers 5U5 5 9 .7Holding conferences with parents at school 51U 56.3Planning activities with pupils 512 56.1Examining pupil notebooks U81 5 2 .7Listening to panel discussions h39 U8.1Holding planned conferences with pupils U31 U7.2Looking at pupil scrapbooks 3U7 3 8 .0Visiting pupils * homes 3hO 37.2Iteing attitude, interest, and personality tests, scales 3 2 5 35.6Looking at pupil collections 292 3 2 .0Keeping growth charts 276 3 0 .2Using check lists 26h 28.9Using rating scales 255 2 7 .9Reading pupil autobiographies 2 3 0 2 5 .2Making tape or wire recordings of class activities 226 2U.7Using work habit inventories 216 2 3 .7Examining pupil diaries of class activities 156 17.1Using sociodrama 1U7 16.1Making sociograms 1U2 1 5 .6Number and per cent of respondents 913 9 9 .1

1U3tiy a few respondents to several iiho had checked each item* Conversely, it also indicates that certain techniques are used so extensively that it seems likely that they constitute the major basis on which evaluation is conducted. This inference is supported ty data in Chapter VI which shew that generally higher value ratings were given to the same techniques that are used by most teachers. Table 18 also shows the predominance of techniques that are largely teacher initiated and teacher centered. The only exceptions to this general tendency are "planning activities with pupils,” and "holding planned conferences with pupils." Although only about one-half of the respondents stated that these two techniques were used, this group of respondents gave each of the two items higher than average value ratings. These techniques, however, also may be largely teacher centered. Data in subsequent parts of this section substantiate the fact that a lower percentage of teachers reported argr extensive participation by pupils in planning for evaluation than had indicated use of "planning activities" and "conferences with pupils" in Table 18.
It is also evident that techniques related to academic achievement are prominent at the top of the list* The exceptions in the first ten techniques listed are four which deal with informal talks with teachers and pupils, observation of class activities, and pupil discussions in class. Concentrated at the bottom of the list are techniques requiring instruments other than tests and those

related to personal interests and social aspects of pnpil development.
An analysis by classifications of teachers according to certain characteristics of teachers and schools is included in Appendix C. With few exceptions, this analysis reveals considerable similarity among classifications of teachers to the pattern established in Table 18 for all respondents. Prominent differences appear in the subject areas, particularly mathematics, science, physical education, industrial arts, agriculture, art, and music. In a second major classification, average enrollment in classes, a lower proportion of teachers with classes of more than 1+0 average enrollment indicated use of most of the techniques. A third, less pronounced, but general difference is the lOTer percentage of teact^rs in large schools reporting use of the various techniques than in small schools.
The largest differences in mathematics occur for methods dealing with oral reports, discussion, essay-type tests, and notebooks which are reported by 15 to 30 per cent fewer teachers than for all teachers. Science teachers rank higher in the use of oral reports, notebooks, and collections than the total group of respondents to about the same extent. The number of art, music, physical education, and industrial arts teachers is generally lower for methods involving discussion, testing, and writing activitias. Many of these teachers appear to rely on a comparatively small number of different methods. The major differences for business education

lh$teachers are the lower number of teachers using discussion methods and notebooks, but with more teachers using standardized tests and written work of pupils* Agriculture teachers reported conferences with pupils, home visitation, and pupil records much more frequently than did other teachers. These differences apparently are related to the adaptability of different techniques to particular subject areas; similarity of patterns of responses in other analyses substantiates this conclusion.
Irrespective of otlier differences, observation of classroom activities is indicated by about 90 per cent of teachers in all classifications as a method used in evaluating pupil progress*In Table 19 a summary of the number of teachers reporting the use of observation only, testing only, or a combination of the two in evaluating different aspects of pupil development is shown.Observation again appears as the most prominent method, and for all aspects except subject achievement and work habits, "observation only" is reported by more teachers than a "combination of testing and observation." These rather general data reveal the absence of measurement types of evidence for mary teachers in all areas except subject achievement. For personal—social adjustment the absence of measurement data is particularly evident.
In the area of subject achievement a "combination of observation and testing" is reported by a vast majority of teachers. Teacher- made tests constitute a large part of the testing in the combination.

TABLE 19NUMBER m > FER CENT QF TEACHERS INDICATING THAT THEY IBE OBSERVATION ONLY, TESTING ONLY, CR A COMBINATION OF OBSERVATION AND TESTING IN EVALUATING DIFFERENT ASPECTS OF PUPIL PROGRESS
Aspect of pupil progress Respondents Teachers -who indicated that they use:Observation only Testing only Combination
N % N % N % N ......
Subject achievement 862 99.2 60 7.0 75 8.7 727 8U.3Attitudes of pupils 838 99.3 570 68.0 Ih 1.7 251 30.3interests of pupils 817 98.5 176 58.3 25 3.1 316 38.7Personal-5ocial-adjustment of piçjils 758 97.9 583 76.9 17 2.2 158 20.9
■JTork habits of pupils 8U5 98.6 W8 18.3 21 2.5 lil6 L9.2Health of pupils 771 97.2 li08 52.9 36 U.7 327 U2.U
g
1U7Table 20 shows the extent to which this is true. Two-thirds of all respondents reported that such tests were used "frequently" and one-fourth indicated ”occasionally.” Ih the subject areas of art and music the percentage is appreciably lower in the category of "frequently” and somewhat higher for "occasionally” than the proportion for all respondents; agriculture, industrial arts, and physical education vary in the same manner to a lesser degree.Younger teachers seem to use tests somewhat less frequently; in other classifications of teachers not related to age the extent of use indicated is nearly the same as for all respondents.
A number of types of classroom tests or test items have become common. The different types measure or require somewliat different kinds of achievement. Recognition, recall, and organization or synthesizing are the three major abilities or types of achievements generally held to be emphasized in varying degrees. While the matter of different types of test questions is not of great ingportance in this study, one item was included in the inquiry since classroom tests are known to be used extensively as a method for evaluating achievement. This provides some indication of the types of achievement stressed by teachers and is related to the principle of the desirability of a variety of techniques. Table 21 shows the percentage of teachers reporting the use of various types of test items. Proportionately fewer teachers reported use of tlie different types of test items who had stated that they used tests "occasionally”

TABLE 20EXTENT OF IBE MADE BY TEACHERS OF CLASSROOM TESTS IN THE EVALUATION OF PUPIL FROCBSSS
Classification of teachers Respondents Teachers stating that they make and use classroom tests; Never Seldom Occasionally Frequently
N i N N i N ÿ N iAll respondents 911 90.9 15 1.6 k9 5.E 2ÏŸ 575 615 67.5City schools 515 98.8 10 1.9 37 7.2 127 2E.7 3E1 66.2Exempted village schools 73 97.3 1 l.E 3 E.l 21 28.8 E8 65.7Local schools 323 93.8 h 1.2 9 2.8 8E 26.0 226 70.0Junior-high schools 171 99.L 8 E.7 10 5.8 hS 26.3 108 63.2senior-high schools 89 98.9 2 2.3 5 5.6 18 20.2 6E 71.9Four-year high schools 189 99.0 1 0.5 9 E.8 51 27.0 128 67.7Six-year high schools k62 98.7 k 0.9 25 5.E 118 25.5 315 68.2Male E80 99.E 9 1.9 31 6.E 131 27.3 309 6E.EFemale 129 98.E 6 l.E 18 E.2 101 23.5 30E 70.9Age (20 - 29) 202 99.0 k 2.0 13 6.E 77 38.1 108 53.5Age (50 and over) l6l 97.6 9 5.6 23 IE.3 129 80.1Professional training:k years 260 99.6 9 3.5 15 5.8 89 3E.2 1E7 56.56 years and over 191 97.9 11 5.8 38 19.9 1E2 7E.3
Teaching experience:2 to E years 179 98.E 5 2.8 12 6.7 67 37.E 95 53.120 years and over 3h9 98.9 2 0.6 17 E.9 71 20.3 259 7E.2
Last period of teacher training:t1930 - 1939 1E5 98.0 2 l.E 10 6.9 30 20.7 103 71.01950 - 1952 351 99.2 8 2.3 23 6.5 106 30.2 2lE 61.0
(Continued)Hg

TABLE 20 (Concltded)
RespondentsN
Teachers stating that they make and use classroom tests; Never Seldom Occasionally îi’equently
!>-------N % N N N TCourse in educational tests and measurement:Yes 621 99.0 7 1.1 30 U.6 1U9 2U.0 U35 70.1No 283 98.6 7 2.5 19 6.7 81 28.6 176 62.2
rerage enrollment in classes20 and below 176 99.U 1 0.6 12 6.8 57 32.U 106 60.221 - 30 U06 98.5 5 1.2 22 5.U 91 22.U . 288 71.031 - UO 285 100.0 8 2.8 9 3.1 76 26.7 192 67.UOver Uo 36 9U.7 6 16.7 7 19.U 23 63.9ibject areaAgriculture 2U ]00,0 1 U.2 12 50.0 11 U5.8Art 19 100.0 1 5.3 8 U2.1 9 U7.U 1 5.3Business education 82 100.0 2 2.U 21 25.6 59 72.0English 1U6 98.0 2 l.U 2U 16.U 120 82.2Foreign language 38 100.0 1 2.6 U 10.5 33 86.9Home economics 69 95.8 2 2.9 29 U2.0 38 55.1Industrial arts 57 98.3 2 3.5 6 10.5 27 U7.U 22 38.6Mathematics 107 100.0 U 3.7 16 15.0 87 81,3Music 39 95.1 3 7.7 10 25.6 23 59.0 3 7.7Physical education 59 98.3 7 11.9 9 15.2 21 35.6 22 37.3Science 96 100.0 13 13.5 83 86.5Social studies 1U7 100.0 1 6.8 26 17.6 120 81.6Other 28 100.0 2 7.2 3 10.7 7 25.0 16 57.1

150than was indicated by those using tests "frequently.” Of the group of teachers stating that they use tests "frequently,” 75 per cent indicated use of completion items and roughly 50 per cent indicated use of each of the other types. Respondents for the type of test item designated "other" generally indicated that they used mathematical problems. Only a very small number reported use of one kind of test only.
The distribution of responses does not indicate any unusual enphasis on particular types of test items. No great differences in distributions of responses for various classifications of teachers were noted except in mathematics which accounts for most of the "other" responses. The data in Table 21, the analj>-sis of these data, and variation in responses observed in processing inquiries indicate that there is great variation among teachers in the use of types of classroom tests and test questions.
Tables 22 and 23 are more informative and significant with respect to the use of classroom tests. Certain common uses or purposes of tests as indicated by teachers are summarized in these tables. Patterns of responses in these data again are remarkably similar for all classifications of teachers. Practices reported by a particularly large majority of teachers, over 85 per cent, are (1) assigning a grade (mark), (2) returning tests with errors marked, (3) talking with pupils about errors or weaknesses, and (U) planning instruction to remedy weaknesses. Some 70 per cent indicated that they return tests with ivritten notations. Talking with pupils about

151TABLE 21
NUMBER AND PER CENT OF TEACHERS STATING THAT THEY USE VARIOUS TYPES OF TESTS OR TEST QUESTIONS REGULARLY WHO HAD INDICATED THAT THEY USE CLASSROOM: TESTS FREQUENTLY,-» OR OCCASIONALLY-»»
Type of test or test question
Teachers using frequently
Teachers using occasionally
N % N %
True-False 28U I4.6 . 6 115 5 0 .UCompletion U62 7 5 .7 1U2 62.2Simple recall 328 5 3 .6 93 U0 .8
Matching 3h6 56.7 H 3 U9 . 6
Multiple choice 353 5 7 .5 112 U9 .IEssay 3hh 56.it 113 U9.6Oral quiz 293 U8.0 91 3 9 .9
Other 106 1 7 .U 29 1 2 .7
-»Number and per cent of respondents
■»»Number and per cent of respondents
6 1 0 99.2228 9 8 .2

TABLE 22HUMBER AM) PER CENT OF TEACHERS INDIGATIHG THAT THEY EMPLOY VARIOUS HiACTICES REGULARLY IN THE USE OF
CLASSROOM TESTS WHO STATED THAT THEY IBED SUCH TESTS FREQUENTLY
Classification of teachers Respondents Assign gradePractices in the use of classroom tests______
Return tests fetuiii tests Talk with pupilswith errors marked
with written about errors or notations weaknesses
N N N N % N " T - - - - - - - - -All respondents 60^ 99.0 539 "88:3" 56? 93.Ï li3 'W S ■
City schools 336 98.5 298 88.7 306 91.1 227 67*6 288 85.7Exempted village schools It8 100,0 Itit 91.7 it7 97.9 35 72.9 li3 89.6Local schools 225 99.6 197 87.6 21it 95.1 177 78.7 196 87.1
Junior high schools 106 98.1 9k 88.7 100 9it.3 7it 69.6 85 80.2Senior high schools 63 98.it 58 92.1 60 95.2 ii2 66.7 57 90.5Four-year high schools 127 99.2 112 88.2 nit 89.8 92 72.it n o 86.6Six-year high schools 313 99.it 275 87.9 293 93.6 231 73.8 275 87.9&Wle 307 99.it 272 88.6 28it 92.5 195 63.5 266 86.6FOmale 300 98.7 266 88.7 281 93.7 2it2 80.7 260 86.7Age (20 - 29) 106 98.1 98 92.5 99 93.il 80 75.5 85 80.2Age (50 and over) Professional training:
128 99.2 Hit 89.1 120 93.8 85 66.it n2 87.5
It years Ht6 99.3 128 87.7 135 92.5 nit 78,1 122 83.66 years and over litO 98.6 120 85.7 126 90.0 97 69.3 12it 88.6
Teaching experience:2 to It years 9lt 98.9 88 93 .6 87 92.6 71 75.6 80 85.120 years and over
Last period of teacher training:256 98.8 22it 87.5 238 93.0 177 69.1 225 87.9
1930 - 1939 101 98.1 88 87.1 96 95.0 71 73.3 91 90.11950 - 1952 21it 100.0 190 88.8 197 92.1
(Contint© d)159 7I1.3 181 8it.6 rv3

TABLE 22 (Concluded)
Practices in the use of classroom tests
Classification of teachers Respondents Assign gradeReturn tests with errors marked
Return tests Talk with piqpils with written about errors or notations weaknesses
N % N % N % N % N %Course in educational tests
and measurement:Yes h31 99.1 384 88.3 403 92.6 311 71.5 379 87.1No 174 98.9 151 86.8 160 92.0 125 71.8 145 83.3
Average enrollment in classes:20 and below 106 98.2 99 93.4 100 94.3 87 82.1 95 89.621 - 30 286 99.3 248 86.7 268 93.7 210 73.4 253 88.531 - itO 190 99.0 170 89.5 176 92.6 126 66.3 153 80.5Over iiO 21 91.3 17 81.0 17 81.0 12 57.1 21 100.0
Subject area: Agriculture 11 100.0 9 81.8 9 81.8 9 81.8 8 72.7ArtBusiness education
1 100.0 59 100.0 54 91.5 56 94.9
1 100.0 46 78.0
155
100.093.2
English U 8 98.3 103 87.3 110 93.2 100 84.7 102 86.4Foreign language 32 97.0 31 96.9 30 93.8 25 78.1 31 96.9Home economics 38 100.0 32 84.2 35 92.1 31 81.6 32 84.2Industrial arts 22 100.0 21 95.5 20 90.9 15 68.2 20 90.9Mathematics 87 100.0 77 88.5 85 97.7 61 70.1 75 86.2Music 3 100,0 2 67.7 2 67.7 1 33.3 3 100.0Physical education 20 90.9 17 85.0 17 85.0 7 35.0 19 95.0Science 82 98.8 73 89.0 74 90.2 45 54.9 67 81.7Social studies 120 100.0 109 90.8 115 95.8 85 70.8 100 83.3Other 16 100.0 11 68.8 14 87.5 13 81.3 14 87.5
S

TABLE 23NUMBER AND PER CENT OF TEACHERS INDICATING THAT THEY EMPLOY VARIOUS TRACT ICES REGULARLY IN THE USE CF
CLASSROOM TESTS WHO STATED THAT THEY USED SUCH TESTS FREQUENTLY
Classification of teachers RespondentsTalk Tidth pupils about strong points
Practices in the use of classroom tests Talk withparents about results
Plan instruc- Plan instruction ticn to remedy to capitalize on ureaknesses strong points
N N " T .... N' N 1 ---- NAll respondents 609 99.0 325 55.4 l02 16.7 544 89.3 205 33.7City schools 336 98.5 180 53.6 61 18.2 303 90.2 116 34.5Exempted village schools 18 100.0 31 64.6 6 12.5 43 89.6 19 39.6Local schools 225 99.6 114 50.7 35 15.6 198 88.0 70 31.1Junior high schools 106 98.1 51 48.1 21 19.8 94 88.7 30 28.3Senior high schools 63 98.4 38 60.3 11 17.5 57 90.5 24 38.1Four-year high schools 127 99.2 63 49.6 14 11.0 114 89.8 37 29.1Six-year high schools 313 99.4 173 55.3 56 17.9 279 89.1 114 36.4Male 307 99.4 l6l 52.4 58 18.9 271 88.2 107 34.9Female 300 98.7 163 54.3 44 14.7 271 90.3 97 32.3Age (20 - 29) 106 98.1 50 47.2 13 12.3 93 87.7 28 26.4Age (50 and over) 128 99.2 75 58.6 25 19.5 119 93.0 47 36.7Professional training:L years 146 99.3 69 47.3 21 14.4 126 86.3 40 27.46 years and over 140 98.6 88 62.9 29 20.7 131 93.6 54 38.6
Teaching experience:2 to i|. years 94 98.9 49 52.1 14 14.9 82 87.2 30 31.920 years and over 256 98.8 148 57.8 53 20.7 235 91.8 90 35.2
Last period of teacher training:1930 - 1939 101 98.1 53 52.5 23 22.8 88 87.1 32 31.71950 - 1952 214 100.0 114 53.3 33 15.4 191 89.3 76 35.5
(Continued)

TABLE 23 (Concluded)
Practices in the use of classroom testsClassification of teachers Respondents
Talk with pupils about strong points
Talk with parents about results
Plan instruc- Plan instruction tion to remedy to capitalize on weaknesses strong points
N % N % N % N % N %Course in educational tests and measurement:
Yes 99.1 2hh 56.1 75 17.2 388 89.2 151 3I1.7No nh 98.9 79 ii5.U 27 15.5 152 87.I1 53 30.5Average enrollment in classes 20 and belcw
1:106 98,2 55 51.9 15 111. 2 91 85.8 28 26.il
2 1 - 3 0 286 99.3 165 57.7 52 18.2 260 90.9 100 35 .031 - 1|0 190 99.0 88 I16.3 31 16.3 168 88.il 62 32 .6Over Û0 21 91.3 13 61.9 li 19.0 19 90.5 11 52.I1
Subject area:Agriculture 11 100.0 36.I1 li 36.I1 6 5I1.5 3 27.3Art 1 100.0 1 100.0 1 100.0 1 100.0 1 100.0Business education 59 100.0 35 59.3 3 5 .1 52 88.1 21 35.6English U8 98.3 66 55 .9 17 lli.li 105 89.0 3I1 28.8Foreign language 32 97.0 20 62.5 12 37.5 31 96.9 111 li3.8Home economics 38 100.0 18 li7.li 6 15.8 33 86.8 10 26.3Industrial arts 22 100.0 111 63.6 3 13.6 21 95.5 7 31.8Mathematics 87 100.0 li3 li9.il 15 17.2 81 93.1 28 32.2Music 3 100.0 2 67.7 1 33.3 3 100.0 1 33.3Physical education 20 90.9 8 liO.O 3 15.0 18 90.0 6 30 .0Science 82 98.8 li3 52. li 12 lii.6 73 89.0 33 I1O.2Social studies 120 100.0 6ii 53.3 22 18.3 107 89.2 iiO 33.3Other 16 100.0 7 li3.8 3 18.8 13 81.3 7 li3.8
vn

156strong points and planning instruction to capitalize on strong points -were reported by one-half and one-third of the respondents, respectively. Talking with parents about test results was indicated by only one-sixth of the teachers.
Thus, most teachers use classroom tests in a negative way and apparently en^hasize remedial practices; a positive approach in the use of tests in planning instruction on the basis of strengths revealed is recognized by only one teacher out of three. These conditions also suggest that instruction in all areas is based on a given body of subject matter or achievement deemed to be inportant by each teacher. This is sizgpported by the fact that classroom tests are widely used as a basis for assigning marks.
Data on the use of the second major type of educational test, that is the standardized test, are presented in T^ble 2U. Nearly Uo per cent of all teachers reported that such tests are used. Since standardized tests have been developed largely in the areas of business education, English, foreign language, mathematics, science, and social studies, it is inevitable that most of the respondents should be in these groups. The proportion of teachers in these groups using standardized tests consequently is higher than the average, ranging from Uo to over 60 per cent in each of these subject area. The number of younger teachers using these tests is proportionately lower than for older teachers and it is also lower for teachers with small classes as compared with those having classes of average size.A similar difference for teachers of large classes may not be

TABLE 2ii
NUMBER AND PER CENT OF TEACHERS INDICATING THAT THEY USE STANDARDŒD ACHIEVEMENr TESTS
Classification of teachers Respondents Teachers using standardized tests
N . - i .-... N " T .........-A U respondents 901 97.6 358 39.6City schools 511 98.1 203 39.7Exempted village schools 73 97.3 29 39.7Local schools 317 97.5 126 39.7Junior high schools 167 97.1 65 38.9Senior high schools 90 100.0 31 3^.EFour-year high schools 185 96.9 70 37.8Six-year high schools 159 98.1 192 ia.8Male 176 98.6 175 36.8Female E23 97.0 182 E3.0Age (20 - 29) 201 98.5 62 30.8Age (50 and ever) 162 98.2 85 52.5
Professional training:1+ years 256 98.1 83 32.E6 years and over 187 96.k 93 L9.7
Teaching experience:2 to E years 178 97,8 58 32.620 years and over 3L7 98.3 156 li5.o
Last period of teacher training:1930 - 1939 lh6 98.6 66 ii5.21950 - 1952 3E8 98.3 133 38.2
(Continued)

TABLE 2li (ConclWed)
Classification of teachers Respondents Teachers using standardized testsN % N %
Course in educational testsand measurement:
Yes 6l6 98.2 253 hl.lNo 278 96.9 101 36.3
Average enrollment in classes:20 and below 173 97.7 h7 27.221 - 30 hOh 98.1 165 ho.831 - iiO 279 97.9 I3h h8.0Over ho 37 91-k 9 2h.3
Subject area:Agriculture 2h 100.0Art 19 100.0Business education 80 97.6 h5 56.3English lh6 98 .0 91 62.3Foreign language 37 97.h 19 5l.hHome economics 68 9h.h 8 11.8Industrial arts 57 98.3 6 10.5Mathematics 106 99.1 61 57.5Music ho 97.6 h 10.0Physical education 57 95.0 9 15.8Science 96 100.0 he 50.0Social studies lh5 98.6 58 ho.oOther 26 92.9 9 3h.6
03

1^9
significant becatise of the small number of cases.The distribution of use of standardized tests among grades
7 to 12 is presented in Table 2$, Approximately one-fourth of the teachers using standardized tests reported use of these tests in the seventh grade and progressively larger percentages are indicated for each successive grade through grade 11 with 5U»U per cent; the proportion of teachers using the tests drops only slightly to U9«3 per cent in grade 12. This more extensive use of standardized tests in the higher grades is not limited to certain types of schools and does not therefore reflect any erratic influence that might be introduced by variability in numbers of schools or in practices in different types of school organization. For senior high schools the condition described is very pronounced but four-year and six- year schools are also above the average. In junior-high schools the distribution is rather uniform. It must be concluded that this condition is a general one in all types of secondaiy schools.
The desirability of teacher participation in the administration of tests and of making test results available to teachers have been generally recognized. The extent to -which these practices are employed in the use of standardized tests is shown in Table 26.It is apparent that botn of these practices are widespread. Ideally they should perhaps be universal since validity and the value of tests are dependent in large part upon these practices.
Teachers were also asked to indicate the extent of preparation of pupils for state scholarship examinations. These items were

TABLE 2S
NUMBER AND PER CENT OF TEACHERS INDICATING USE OF STANDARDIZED TESTS IN DIFFERENT SCHOOL GRADES— SUMMARTFOR TEACHERS WHO STATED THAT THE! USE SUCH TESTSSchool grades
Classification of teachers Respondents Seven Eight Nine Ten Eleven Twelve% N % U i N % k i N i N . %
All respondents 272 76.0 7E 27.2 107 39.3 127 1|6.7 128 1*7.1 11*8 5i*.l* 131* 1*9.3City schools 151 liO 26.5 59 39.1 68 ii5.0 60 39.7 71* 1*9.0 71 1*7.0Exengjted village schools 20 69.0 6 30.0 5 25.0 9 1*5.0 13 65.0 11 55.0 10 50.0Local schools 101 80.2 28 27.7 ii3 i|2.6 50 ii9.5 55 51*.5 63 62.1* 53 52.5Jmior-high schools hS 71.8 20 ÜL.7 31 6L.6 28 58.3Senior-high schools 22 71.0 1 1*.5 13 59.1 20 90.9Four-year high schools kS 61.3 22 I18.9 33 73.3 35 77.8 30 66.7Six-year high schools 157 81.6 5E 3h.h 76 1*8.it 76 1*8.1* 82 52.2 93 59.2 87 55.1*Male 137 78.3 3h ,2ii.8 50 36.5 61 l*ii.5 66 1*8.2 75 51*. 7 68 1*9.6Female 13it 73.6 39 29.1 57 i|2.5 66 1*9.3 60 1*1*. 8 75 56.0 65 1*8.5Age (20 - 29) 52 83.9 18 3ii.6 26 50.0 20 38.5 25 1*8.1 23 1*1*.2 21 1*0.1*Age (50 and over) 60 70.6 12 20.0 21 35.0 33 55.0 21* 1*0.0 29 1*8.3 26 1*3.3Professional training:L years 62 71.7 20 32.3 31 50.0 26 1*1.9 27 1*3.5 31 50.0 30 1*8.1*6 years and over 69 7k.2 13 18.8 20 29*0 31 1*1*.9 35 50.7 1*3 62.3 39 56.5
Teaching experience:2 to E years W 82.8 17 35.il 23 ii7.9 21 1*3.7 23 1*7.9 20 1*1.7 18 37.520 years and over 115 73.7 27 23.5 38 33.0 58 50.1* 55 1*7.8 69 60.0 63 51*.8
Last period of teacher training:1930 - 1939 53 80.3 13 2I1.5 18 31.0 25 1*7.2 21* 1*5.3 31 58.5 26 1*9.11950 - 1952 109 82.0 3L 31.2 1*8 i*i*.0 ii5 1*1.3 53 1*8.6 58 53.2 55 50.5
(Continued) Ho\o

TABLE 25 (Concluded)
Classification of teachers Respondents SeVéh Eight School grades Eine Tsr Eleven Twelve
N N i N 2 N i N i N N iCourse in educational tests and measurement:
Yes 189 71.7 h9 25.9 71 37.6 90 47.6 90 47.6 101 53.4 93 49.2No 81 80,2 25 30.9 36 Wi.b 37 45.7 36 44.4 45 55.6 40 49.4
Average enrollment in classes:20 and below 37 78.7 8 21.6 9 2k.3 15 40.5 17 45.9 29 78.4 26 70.32 1 - 3 0 126 76.4 29 23.0 là 3k.9 64 50.8 62 49.2 66 52.4 62 49.231 - ho 100 ih*e 36 36.0 52 52.0 46 46.0 42 42,0 47 47.0 42 42.0Over iiO 7 77.8 1 lii.3 2 28.6 2 28.6 5 71.4 4 57.1 3 42.9
Subject area: Agriculture ArtBusiness education English
00
317L
0.00.0
68.981.3 28 37.8 36 I18.6
838
25.851.4
1736
54.848.6
2939
93.552.7
2733
87.144.6
Foreign language 11 67.9 1 9.1 1 9.1 11 100.0 7 63.6 2 18.2 2 18.2Home economics 6 75.0 2 33.3 2 33.3 3 50.0 3 50.0 5 83.3 5 83.3Industrial arts 66.7 2 50.0 3 75.0 2 50.0 2 50.0 1 25.0 2 50.0Mathematics he 75.I4 18 39.1 31 67.4 28 60.9 20 43.5 16 34.8 15 32.6lÉisic 2 50.0 2 100.0 2 100.0 1 50.0 1 50.0 1 50.0 1 50.0Physical education 6 66.7 2 33.3 2 33.3 3 50.0 4 66.7 3 50.0 2 33.3Science 37 77.1 5 13.5 10 27.0 19 51.4 14 37.8 24 64.9 22 59.5Social studies he 82.8 13 27.1 19 39.6 12 29.0 19 39.6 24 50.0 22 45.8Other 7 77.6 1 lii.3 1 14.3 2 28.6 5 71.4 4 57.1 3 42.9
H

162TABLE 26
PRACTICES IN THE ADMINISTRATION OF STANDARDIZED TESTS ASINDICATED BY TEACHERS
Practice Respondents Teachers stating that practice is in use
N % N %
Tests administered by teachers 355 99*2 273 76.9Tests results available to teachers 3U5 96.U 328 95.1Scored test forms for each pupil available to teachers 335 93*6 303 90.h
included to give an indication of the extent to which tests maybe influencing teaching practices and objectives. The responses to the two items dealing with preparation of pupils for scholarship examinations revealed that less than 3 per cent of the teachers using the tests believed that they spent "much" time in such preparation and about three-fifths stated that no time was given to preparation for such examinations. The remainder of the respondents were about equally divided between the two descriptive categories of "little" and "some."
In the philosophy presented earlier in this report, the participation of pupils was enphasized as being essential to

163effective evaluation* The remainder of this section is concerned with certain practices with respect to this facet of the evaluative process. Tables 27 and 28 show the extent to which pupils participate in (1) deciding on what they will be tested or evaluated, and (2) the extent to which pupils participate in planning tests and otlier means of evaluation as reported by teachers. Responses for both practices are so similar that the two tables are discussed together. A majority of teachers indicated that pupil participation is "little" or "none." Approximately 65 per cent responded in these two categories for participation in deciding the factors to enter into evaluation and slightly over 75 per cent for participation in planning means of evaluation. Over one-fourth of the respondents indicated "none." A relatively small per cent reported "much" for both items. Thirty-nine per cent of teachers in local schools reported participation ty pupils as "some" in deciding on what they will be evaluated as compared to approximately 25 per cent of teachers in city and exempted village schools. Other deviations from this general pattern are very slight for almost all classifications of teachers.
In respect to certain other practices, notably formulation of objectives and use of techniques in^lying pupil participation, which were reported by proportionately more teachers in particular subject areas, the data in Table 27 and 28 suggest that this participation is limited in extent and is influenced more by the content than by deliberate attempts to employ the practice.

TABLIÜ ZYNUMBER AND PER CENT OF TEACHERS INDICATING THE EXTENT TO TffllCH PUPIIS HELP DECIDE ON WHAT THEY WILL
BE TESTED CR EVALUATED
Classification of teachers Respondents Extent to vAiich pupils help decide on idiat they will be tested or evaluated
None Little Some MucïïN i N N % N i N
All respondents 902 97.9 ~Si9 27.6 344 38.2 27? 30.? 32 3.5City schools 507 97.3 170 33.5 189 37.3 131 25.8 17 3.4Exempted village schools 71 98.7 18 2L.3 33 44.6 21 28.4 2 2.7Local schools 321 98.8 61 19.0 122 38.0 125 39.0 13 4.0Junior high schools 165 95.9 53 32.1 60 36.4 45 27.3 7 4.2Senior high schools 87 96.7 30 3k.5 31 35.6 23 26.4 3 3.5Four-year high schools 168 98.1i 16 2L.5 86 45.7 52 27.7 4 2.1Six-year high schools 162 98.7 120 26.0 167 36.1 157 34.0 18 3.9Male 177 98.8 128 26.8 183 38.4 152 31.9 14 2.9Female 1|23 97.0 120 28.4 161 38.1 124 29.3 18 4.2Age (20 - 29) 201 98.5 k9 24.4 84 41.8 59 29.3 9 4.5Age (50 and over) 160 97.0 52 32.5 57 35.6 47 29.4 4 2.5Professional training:li years 251 97.3 72 28.3 100 39.4 73 28.8 9 3.56 years and over
Teaching experience:192 98.5 hk 22.9 72 37.5 70 36.5 6 3.1
2 to b years 180 98.9 ii6 25.6 81 45.0 46 25.5 7 3.920 years and over Last period of teacher training:
3kk 97.5 98 28.5 131 38.1 108 31.4 7 2.0
1930 - 1939 lk$ 98.0 56 38.6 45 31.1 38 26.2 6 4.11950 - 1952 350 98.9 93 26.6 131 37.4(Continued)
113 32.3 13 3.7H

TABLE 27 (Concluded)
Classification of teachers Respondents Extent to which pupils help decide on what they will be tested or evaluated
None Little Some MuchN % N % N % N ^ N %
Course in educational tests and measurement t
Yes 618 98.6 163 26.I4 2k2 39.2 192 31 .1 21 3.3No 277 96.5 86 31.0 100 36 .1 80 28.9 11 It.orerage enrollment in classest20 and below 175 98.9 3h 19.4 67 38.3 66 37 .7 8 lt.621 - 30 U03 97.8 118 29.3 155 38.lt lilt .28.3 16 it.o31 - ho 280 98.2 87 31.1 109 38.9 78 27.9 6 2.1Over 1;0 36 9h.7 10 27.8 10 27.8 15 ia.7 1 2.7ibject area;Agriculture 2k 100.0 3 12.5 8 33.3 11 lt5.9 2 8.3Art 17 89.5 6 35.3 1 5 .9 8 k7.1 2 11.8Business education 82 100.0 20 2l+.li 39 U7.6 21 25 .6 2 2,ltEnglish IkQ 99.3 la 27.7 67 1,5.3 37 25 .0 3 2.0Foreign language 38 100,0 13 3U.2 15 39.5 9 23.7 1 2.6Home economics 69 95.8 13 18.8 22 31.9 28 ltO.6 6 8.7Industrial arts 57 98.3 20 35.1 18 31.6 17 29.8 2 3.5Mathematics 107 100.0 39 36. U 37 31.6 29 27.1 2 1.9Music 39 95.1 15 38.5 13 33.3 10 25.6 1 2.6Physical education 53 88.3 16 30.2 16 30.2 21 3 9 .6Science 95 99.0 20 21.0 U5 U7.1i 25 26.3 5 5.3Social studies lii6 99.3 38 26.0 55 37.7 lt9 3 3 .6 It 2.7Other 27 96.L 5 18.5 8 29.6 12 ltlt.5 2 7.lt
H'St

TABLE 28NUMBER AND PER CENT OF TEACHERS INDICATING THE EXTENT TO WHICH PUPILS PARTICIPATE IN THE CONSTRUCTION
OF TESTS OR PLANNING OF OTHER MEAIB OF EVALUATION
Classification of teachers Respondents Extent to which pupils participate in the construction of tests <r planning of other means of evaluation
MuchNone Little Some"T"" " ■■■- r - T " N % N i N
All respondents 899 97.6 33h 37.2 i n r 38.1+ 200 22.2 2o 2.2City schools 508 97.5 218 1+2 .9 178 35.0 100 19.7 12 2.1+Exempted village schools 72 96.0 23 31.9 30 1+1 .7 18 25.0 1 1.1+Local schools 319 98.2 93 29.2 137 1+2.9 82 25.7 7 2.2Junior high schools 166 96.5 69 1+1 .6 61 36.7 31 18.7 5 3 .0Senior high schools 87 96.7 1+3 1+9.1+ 30 31+.5 12 13.8 2 2.3Four-year high schools 187 97.9 59 31.6 78 1+1 .7 1+7 25.1 3 1.6Six-year high schools 159 98.1 163 35.5 176 38.3 UO 21+.0 10 2.2Male his 98.3 183 38.5 180 37.9 102 21.5 10 2.1Female 1+22 96.8 150 35.5 161+ 38.9 98 23.2 10 2.1+Age (20 - 29) 201 98.5 72 35.8 73 36.3 51 25.1+ 5 2.5Age (50 and over) 161 97.6 61 37.9 63 39.1 31+ 21.1 3 1 .9
Professional training:L years 252 96.6 109 1+3.3 86 3I+.I 55 21.8 2 0.86 years and over 191 97.9 59 30 .9 75 39.3 1+9 25.6 8 1+.2
Teaching experience:2 to U years 179 98.1; 66 36.9 76 1+2.5 35 19.5 2 1.120 years and over 3l3 97.2 133 38.8 131 38.2 72 21.0 7 2.0
Last period of teacher training: 1930 - 1939 11+3 96.6 61+ I+I+.7 55 38.5 20 ll+.O 1+ 2.8 S1950 - 1952 350 98.9 135 38.6 121+ 35 . 1+ 82 23.1+ 9 2.6
(Continued)

TABLE 28 (Concluded)
Classification of tea;:hers Respondents Extent to which pupils participate in the construction of tests cr planning of other means of evaluationNone Little Some Much
w % N % N % N _
Course in educational testsand measurement:
Yes 615 98.1 220 35.8 244 39.7 139 22.6 12 1.9No 277 96.5 114 41.2 97 35 .0 58 20.9 8 2.9
Average enrollment in classes:20 and below 17U 98.3 52 29.9 71 40.6 47 27.0 4 2.321 - 30 W2 97.6 157 39.1 147 36.5 88 21.9 10 2.531 - ho 279 97.9 111 39.8 108 38.7 54 19 .4 6 2.1Over ii.0 36 9b.7 14 38.9 16 44.4 6 16.7
Subject area:Agriculture 2k 100.0 5 20.6 10 41.7 8 33.3 1 4.2Art 17 89.5 7 41.2 4 23.6 3 17.6 3 17.6Business education 82 100.0 32 39.0 33 40.3 16 19.5 1 1.2English IhB 99.3 50 33.8 68 45.9 28 18.9 2 1.4Foreign language 38 100,0 17 44.7 16 42.1 4 10.5 1 2 .6Home economics 69 95.8 20 29.0 22 31 .9 24 34.8 3 4.3Industrial arts 56 96.6 28 50.0 15 26.8 13 23.2Mathematics 107 100.0 47 43.9 40 37.4 19 17.6 1 0 .9Music 38 92.7 18 47.4 15 39.5 4 10.5 1 2.6Physical education 52 86.7 24 46.1 16 30.8 12 23.1Science 96 100.0 31 32.3 46 47.9 17 17.7 2 2.1Social studies li+5 98.6 49 33.8 52 35 .8 41 28.3 3 2.1Other 27 96.4 6 22.2 8 29.6 11 40.8 2 7.4
M

168Pupil participation in evaluation of the oubcomes or effective
ness of school experiences is complementary to pupil participation in planning. Probably the most effective means for such participation is discussion. As an indication of the extent of pupil participation in evaluating outcomes and achievements, five broad types of outcomes were selected that were likely to be evaluated in most teaching situations. The extent of pupil participation in this phase of evaluation is shown in Table 29. An analysis of these data showed only slight variations as compared with this general summary; a detailed analysis is included in Appendix C.
It will be noted that participation in discussion of the two tangible outcomes, written work and work products, representing specific pupil achievements is reported by more teachers than for other outcomes. Almost UO per cent indicated participation as "much" and nearly $0 per cent as "some." Discussion of other less specific outcomes is reported by a somewhat larger proportion of teachers than was indicated for pupil participation in planning evaluation; approximately U5 per cent indicated "some," about 25 per cent "little," and 20 per cent "much." Pupil participation in dynamic, interpersonal efforts in evaluation of outcomes is, therefore, somewhat above that found in planning for evaluation.
Types of Information Recorded in Cumulative Records
The introduction and use of cumulative records were stimulated

TABLE 29NUMBER AND PER CENT OF TEACHERS INDICATING THE EXTENT TO WHICH PUPILS DISCUSS VARIOUS OUT-
COMES OF THEIR SCHOOL WORK — SUMMART FCE ALL RESPONDENTS
Outcome Respondents Extent of pupil discussionNone Little Some Much
N i N % N % N % N '%
Written work 857 93-1 23 2 .7 88 10.3 ltl9 W.9 327 38 .1
Work products 802 87.1 26 3.2 88 11.0 368 as.9 320 39.9
Effectiveness of group discussions 73h 19*1 108 lit. 7 197 26.8 30a ai.a 12a 16.9Outcomes of group undertakings 139 80.2 77 lO.U lii8 20.0 3ai a6.2 173 23.aWork habits 831 90.2 55 6.6 223 26.8 398 a7.9 155 18.7
170by the measurement movement in education. In recent years it has been strongly advocated that such records should contain a variety of information about the pupil, including health, physical development, social and economic background, different kinds of school e:q>eriences, interests, and other pertinent data in addition to test scores and school achievement. Such records would assist in describing inç)ortant related factors affecting the total personality of pupils and therefore would provide for more adequate evaluation.
Table 30 shows the number and per cent of teachers stating that they record different types of information in the cumulative records in their schools. The classifications of types of information shown are broad categories that are frequently found in the literature in slightly varied terminology. These types of information were illustratively described in the inquiry sent to teachers. These descriptions appear in Appendix A in the sample inquiry.Four types of data— personal information, enrollment and attendance data, school achievement and curricular experience, and results of intelligence tests— are reported by over 90 per cent of teachers as being recorded. Recording of home and family information and extra-curricular experiences is reported by more than 80 per cent of the respondents. Special-interest data and supplementary information are recorded by nearly two-thirds of the teachers* Recording of achievement test scores is indicated by more than 70 per cent and for most other test scores by between I4.O and per cent of the respondents. The only sizeable differences between

TABLE 30NUMBER AND PER CENT OF TEACHERS INDICATING THE TYPES OF INFORMATIΠRECORDED IN THE CUMULATIVE
RECORDS USED IN THEffi SCHOOLS, BY TYES OF SCHOOL DISTRICT AND TOTAL
Teachers indicating information is recorded
Types of information Cityschools
Exemptedvillageschools
Localschools
Total (all respondents)
N i N ■ % N % N iPersonal information L83 99.8 72 100.0 301 99.1; 856 99.6Enrollment and attendance data U76 98.3 71 98.6 301 99.1; 812 98.7Home and family information School achievement and L37 90.3 51; 75.0 260 85.8 755 86.9curricular experience k69 96.9 67 93.0 287 9l;.7 823 95.8
Extra-curricular experiences 85.6 52 72.2 227 71.9 693 80.8Health information k20 86.8 53 73.6 214; 80.5 717 83.6Special-interest data 3kO 70.2 35 18.6 155 51.1 530 61.9Supplementary information 359 7U.2 38 52.8 160 52.8 557 65.0TEST RESULTSIntelligence L56 9U.2 65 90.3 266 87.8 787 91.6Achievement 369 76.2 1;7 65.3 199 65.7 615 71.6Special aptitude 273 56.U 1;2 58.3 150 49.5 465 54.1Diterest 218 kS>0 28 38.9 126 ia.6 372 43.3Personality 219 U5.2 28 38.9 123 L0.6 370 43.1Reading, survey 278 57.1; 35 i;8.6 125 I4I.3 438 51.0Reading, diagnostic 269 55.6 30 ia.7 122 UO.3 421 49.0Attitudes 192 39.6 28 38.9 100 33.0 320 37.3Other 7 l.U 1 1.1; 2 0.7 10 1.2
Number and per cent of respondents l;8lt 95*3 72 96.0 303 96.8 859 96.0 H

172types of school districts are records of special-interest and supplementary information -which are reported by fewer teachers in local and exenpted village schools.
In Chapter VI it may be observed that the average value ratings for the types of information recorded is generally higher for those types recorded ty large numbers of teachers. It is also to be observed tloat considerable discrepancies appear between the percentage of teachers reporting that certain types of information are recorded and the percentage of principals indicating that such records are made. (See Table 55)• "Special-interest data" and all test scores except "intelligence" are reported by proportionately smaller numbers of principals than by teachers. Although the principals and teachers do not represent the same schools to the same extent in each case, they do represent in large part the same schools as groups, and the general consistent patterns in the data do not suggest any strong selection factor between the two groups. A higher percentage of return from principals could account for these differences. On the other hand, certain items of the data for teachers seem unreasonably high. There is little evidence, for exanple, in the literature or in other parts of this study tliat substantiates that almost ij.0 per cent of teachers record attitudes test scores. It seems probable that the data from principals reflect more accurately the actual situation regarding cumulative records*The familiarity of many school personnel, particularly teachers, with the cumulative records and their contents seems questionable on the

173basis of these data, especially since most of the data in this study are in relatively close agreement in many other respects,
A comparison of these data with the methods and technqiues most commonly used by teachers as revealed in Table l8 as well as the average value ratings given to the different types of information in the cumulative records shown in Table 71 indicates that health information, special-interest data, and supplementary information are probably rather inadequate in many cases. The additional facts tiiat 35 per cent of teachers indicated they do not use cumulative records and another 17 per cent believe they are of "little" value substantiate the conclusion that cumulative records generally are not contributing effectively to evaluation for at least one-half of the teachers responding.
Marking and Reporting Practices
An in^ortant link between school and parents is the reporting of pupil progress. Such reports are perhaps the most significant single communication from the school to parents. Traditionally they have consisted of the periodic assignment of marks, cr "grades," In recent years marks have been criticized as inadequate because it is not evident wliat aspects of growth or progress are included in determining them, what they mean even when an effort is made to define what they represent, and because they are often highly unreliable for both con^arative and predictive purposes. To overcome the difficulties and inadequacies recognized in marking, vnritten

17Ureports describing the development of pupils and conferences vrith parents have been advocated by many educators as more effective metnods of reporting.
\Vhile it is generally known that these newer methods have not come into widespread use, data regarding the extent of use of the different types of marking and other forms of reporting are included in this study along with information concerning the practices of teachers in assigning marks because thqy are relevant to evaluation* These data may also contribute to interpretation of other data in the study, particularly in the areas of techniques and methods of evaluation, adequacy of evaluation, and problems or difficulties in evaluation.
In Table 31 the percentages of teachers using the various methods or combinations of methods of reporting are presented.Table 32 shows the percentage of teachers using each method regardless of whether it is used alone or in combination with other methods. Both of these tables show that systems of marking are used almost universally and that tlie five-point system is by far the most common, being reported by 80 per cent of the respondents. Eighteen per cent use other methods of marking. Fifteen teachers indicated that they did not use marks; these teachers, however, do not represent schools that have no marking system, but only special subject areas in which marking is not used in a few schools. Rating of pupil traits is reported by fewer than one-third of the respondents, use of parent

175TABLE 31
NUMBER AND PER CENT OF TEACHERS INDICATING THAT THEY USE VARIOUS METHODS OR COMBINATIONS OF iETHODS OF REPORTING
PUPIL PROGRESS TO PARENTS
Methods of reporting TeachersN
using methods %
One method only: Five-point grading U08 hh-7Four-point grading 61 6.7Three-point grading 8 0.9Two-point grading 12 1.3Percentage grading 23 2.5Other k O.U
Combinations of methods:Five-point grading and written reports to parents Ih 1.5Five-point grading and conferences with parents 32 3.5Five-point grading and rating of pupil traits on report card 195 21.UFive-point grading, rating of pupil traits, and written reports to parents 13 l.UFive-point grading, written reports to parents, and conferences with parents 21 2.3Five-point grading, rating of pupil traits, and conferences with parents 1 6 1.8Five-point grading and one or more other methods not listed 31 3 . U
Four-point grading and rating of pupil traits on report card 2U 2.6
Three-point grading and rating of pupil traits on report card k o.U
Other combinations U6 5.0Number and per cent of respondents 912 99.0

176TABLE 32
NUMBER AND PER CENT OF TEACHERS INDICATING THAT THEÏ USE VARIOUS METHODS OF REPCETING PUPIL PROGRESS — SUMMARY FCR EACH METHOD
REGARDLESS OF COMBINATIONS IN WHICH USED
Method of reporting Teachers using methodN %
Five-point grading 730 80.0Four-point grading 86 9-UThree-point grading 12 1.3Two-point grading 12 1.3Percentage grading 23 2.5Other methods of grading 35 3.8Rating of pi^il traits 261 28.6Written reports to parents 35 3.8Conferences with parents 71 7.8
conferences by 7«8 per cent, eind written progress reports by only 3.8 per cent.
Types of personnel participating in the selection of the means of reporting used are shown in Table 33» Administrative or supervisory personnel are mentioned most frequently with 56»9 per cent; combinations of administrative personnel and teachers are reported by 23 per cent of the teachers; only ^.2 per cent indicated that other personnel such as PTA groups, citizen*s groups, or pupils were involved.
The responses of teachers with respect to the three different bases for assigning marks are presented in Table 3U» Relatively few teachers, 17»It- per cent, indicated that they base marks on

TABLE 33NUMBER AND PER CENT OF TEACHERS INDICATING PARTICIPATION BY DIFFERENT PERSONNEL IN SELECTH\G FORM
OF REPCETING IBSD
Type of school district
Respondents
Types Administrative or supervisory personnel
of personnelAdminis trative
Teaohorsteachers
Other Don't knew
N % N % N % N $ N i N %
City schools U88 93.7 251 5I.U 34 7.0 137 28.1 27 5.5 39 8.0Exempted village schools 69 92.0 33 47.8 8 11.6 23 33.3 2 2.9 3 4.4Local schools 309 97.1 209 67.6 22 7.1 39 12.6 16 5.2 23 7.5
Total 866 91.0 493 56.9 64 7.4 199 23.0 45 5.2 65 7.5
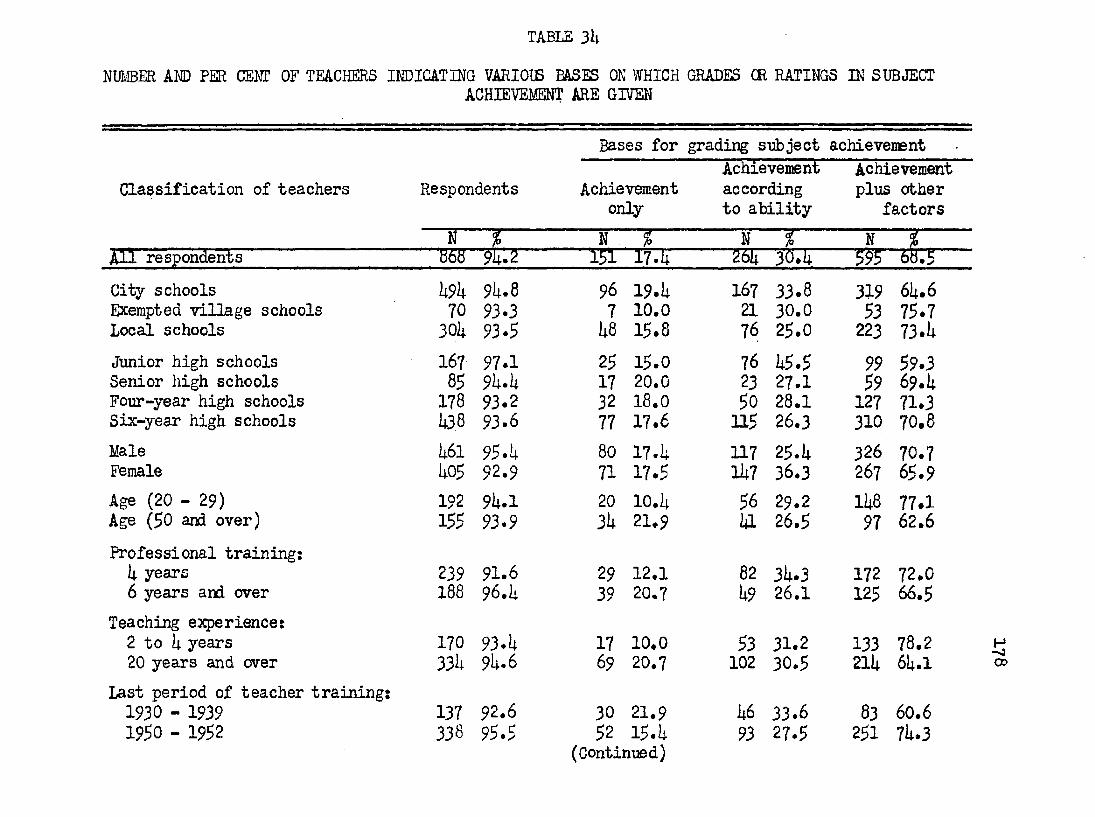
TABLE 3h
NUîffiER AMD PER CEKT OF TEACHERS INDICATING VARIOIB BASES ON WHICH GRADES CR RATINGS IN SUBJECTACHIEVEMENT ARE GIVEN
Classification of teachers
Bases for grading subject achievement
Respondents Achievementonly
Achievement according to ability
Achievement plus other
factorsN % N ,'""i ■ ■ ■ ■ ■ N L N
All respondents " '868 . . "'151" 17.4 2'S4" 30.4 595 60.5City schools i;9ii 9L.8 96 19.4 167 33.8 319 64.6Exempted village schools 70 93.3 7 10.0 21 30.0 53 75.7Local schools 30li 93.5 48 15.8 76 25.0 223 73.4Junior high schools 167 97.1 25 15.0 76 45.5 99 59.3Senior high schools 85 9h-h 17 20.0 23 27.1 59 69.4Four-year high schools 178 93.2 32 18.0 50 28,1 127 71.3Six-year high schools 138 93.6 77 17.6 115 26.3 310 70.8Male L6l 95.L 80 17.4 117 25.4 326 70.7Female h05 92.9 71 17.5 147 36.3 267 65.9Age (20 - 29) 192 9h.l 20 10.4 56 29.2 148 77.1Age (50 and over) 155 93.9 34 21.9 41 26.5 97 62.6Professional training:U years 239 91.6 29 12.1 82 34.3 172 72.06 years and over 188 96.1 39 20.7 49 26.1 125 66.5
Teaching experience:2 to h years 170 93.4 17 10.0 53 31.2 133 78.220 years and over 331 94.6 69 20.7 102 30.5 214 64.1
Last period of teacher training:1930 - 1939 137 92.6 30 21.9 46 33.6 83 60.61950 - 1952 338 95.5 52 15.4
(Continued)93 27.5 251 74.3
00

TÂBIE 3h (Concluded)
Classification of teachers RespondentsBases for grading subject achievement
Achievement Achievement Achievement according plus other
only to ability factorsN % N % N % N %
Course in educational testsand measurement
Yes 595 94.9 109 16.3 176 29.6 398 66.9No 266 92.7 41 15.4 84 31.6 193 72.6Average enrollment in classes:
20 and belosr 165 93.2 22 13.3 43 26.1 127 77.021 - 30 387 93.9 75 19.4 115 29.7 257 66.431 - iiO 271 95.1 47 17.3 93 34.3 178 65.7Over iiO 37 97.4 5 13.5 11 29.7 28 75.7
Subject area:Agriculture 23 95.8 8 34.8 21 91.3Art 17 89.5 3 17.6 5 29.4 12 70.6Business education Ik 90.2 18 24.7 13 24.7 45 61.6En^ish iko 94.0 23 16.4 51 36.4 87 62.1Foreign language 36 94.7 12 33.3 13 36.1 20 55.6Home economics 66 91.7 12 18.2 27 40.9 44 66.7Industrial arts 50 86.2 5 10.0 13 26.0 38 76.0Mathematics 102 95.3 27 26.5 21 20.6 64 62.7Music 38 92.7 4 10.5 11 28.9 30 78.9Physical education 57 95.0 4 7.0 18 31.6 45 78.9Science 92 95.8 19 20.7 16 17.4 67 72.8Social studies 146 99.3 20 13.7 55 37.7 103 70.5Other 27 97.4 4 14.8 8 29.6 19 70.4 H
VO

180"achievement only"; one-third reported that they attempt to assign marks on the basis of ability, and 70 per cent indicated use of a complex base including other factors. Some overlapping exists in the responses between the last two categories since some-teachers indicated "ability" as well as "other factors,"
Table 35 shows the extent to which effort, conduct, interest, and attitude are reported by this group of teachers as being reflected in school marks. The category’' "other" is comprised largely of respondents who indicated that attendance or "extra credit" work are considered. Effort and attitude stand partieularly high in this group of factors. Conduct and interest are only slightly lower. Age and experience of teachers seem, to be related to the importance of conduct since this factor is repoi'ted by fewer teachers in the older age group than in the group with over twenty years experience.
Another aspect of the issue of assigning marks is tiie use of the normal frequency distribution. The validity of the use of the normal distribution is generally recognized to be dependent on the number of cases and selection factors affecting the population. Numerous free-response comments of teachers indicated that large numbers of teachers recognize these factors and do not use the normal distribution for one or both of these reasons, A considerable number of teachers also indicated that they used a rough approximation of the normal distribution, but that they did not adhere to it strictly. Approximately one-third of the respondents stated that
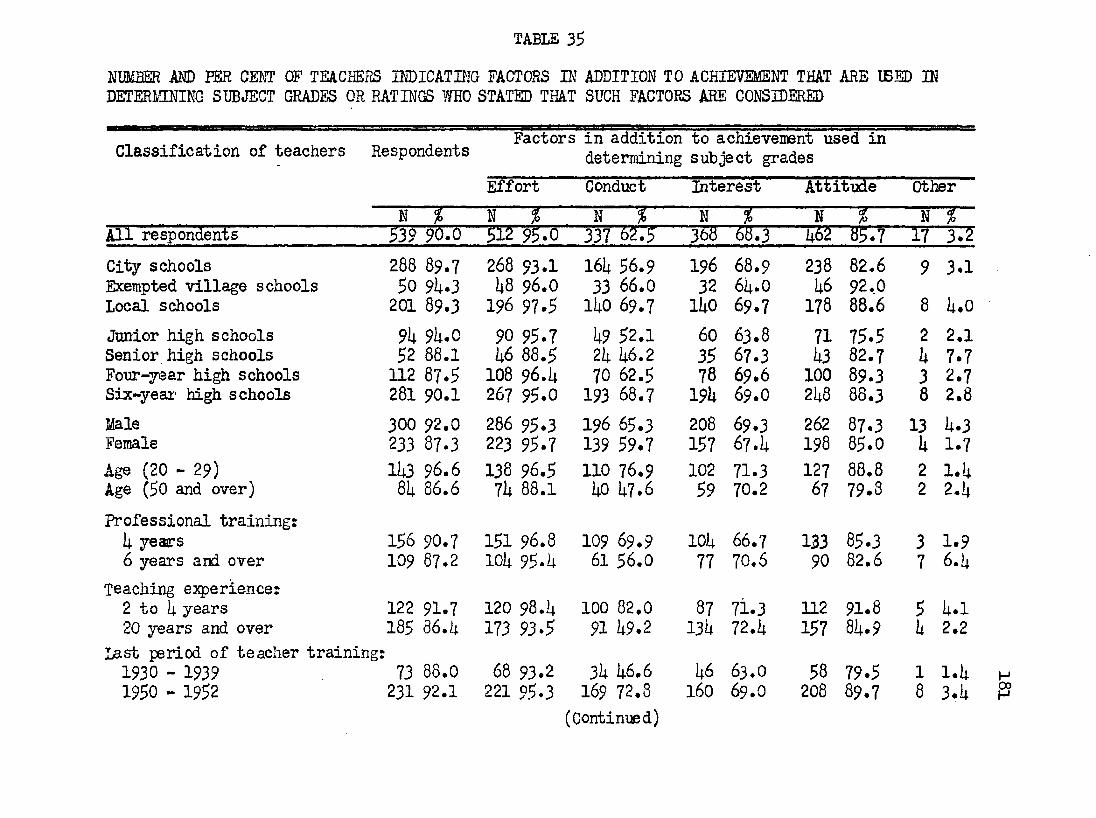
TABLE 35NUMBER AND PER CEllT OF TEACHERS INDICATING FACTORS IN ADDITION TO ACHIEVEMENT THAT ARE ÏBED IN DETERraiNG SUBJECT GRADES OR RATINGS WHO STATED THAT SUCH FACTORS ARE CONSIDERED
Classification of teachers Respondents Factors
Effort
in addition to achievement used in determining subject grades
AttitudeConduct Interest OtherN % N % N % N % N N i
All respondents $39 90.6 51 95.0 337 62.5 368 68.3 U62 85.7 17 3.2City schoolsExempted village schools
288 89.750 9k>3
268 93.11;8 96.0
161; 56.9 33 66.0
19632
68.96U.0
238U6
82.692,0
9 3.1
Local schools 201 89.3 196 97.5 I W 69.7 lUO 69.7 178 88*6 8 U.oJunior high schools 9L 9li.O 90 95.7 t9 52.1 60 63.8 71 75.5 2 2.1Senior high schools 52 88.1 h6 88.5 21; 1;6.2 35 67.3 U3 82.7 u 7.7Four-year high schools 112 87.5 108 96.1; 70 62.5 78 69.6 100 89.3 3 2.7Six-year high schools 281 90.1 267 95.0 193 68.7 19U 69.0 2U8 88.3 8 2,8Male 300 92.0 286 95.3 196 65.3 208 69.3 262 87.3 13 U.3Female 233 87.3 223 95.7 139 59.7 157 67.U 198 85.0 U 1.7Age (20 - 29) lh3 96.6 138 96.5 110 76.9 102 71.3 127 88.8 2 l.UAge (50 and over) 81; 86.6 71; 88.1 UO U7.6 59 70.2 67 79.8 2 2.UProfessional training:k years 156 90.7 151 96.8 109 69.9 10)4 66.7 133 85.3 3 1.96 years and over
Teaching experience:109 87.2 101; 95.U 61 56.0 77 70.6 90 82.6 7 6.U
2 to U years 122 91.7 120 98.1; 100 82,0 87 71.3 112 91.8 5 U.l20 years and over
Last period of teacher training:185 86.1; 173 93.5 91 U9.2 I3U 72.U 157 8U.9 U 2.2
1930 - 1939 73 88.0 68 93.2 3U U6.6 U6 63.0 58 79.5 1 l.U1950 - 1952 231 92.1 221 95.3 169 72.8
(Continued)160 69.0 208 89.7 8 3.U
HH

TABLE 35 (Concluded)
Classification of teachers Respondents Factors in addition to achievemeit used determining subject grades
inEffort Conduct Interest Attitude Other
N K ? N i N i H i NCourse in educational testsand neasurement:
Tes 360 90.5 3it7 96.lt 222 61.7 252 70.0 308 85.6 11 3.1No 171 88.6 161 9lt.2 112 65.5 lUt 66.7 150 87.7 6 3.5Average enrollment in classes:20 and below 120 9I1.5 118 98.3 88 73.3 83 69.2 107 89.2 5 ii.221 - 30 229 89.1 216 9I1.3 138 60.3 157 68.6 19lt 81t.7 7 3.131 - ko 155 87.1 118 95.5 89 57.lt lOlt 67.1 131 81t.5 3 1.9Over ko 27 96.I1 26 96.3 20 7lt.l 21 77.8 26 96.3 2 7.L
Subject area:Agriculture 20 95,2 19 95.0 18 90.0 13 65.0 16 80.0 2 10.0Art 9 75.0 6 88.9 6 66.7 555.6 7 77.3Business education 111 91.1 ItO 97.6 27 65.9 27 65.9 36 87.8 1 2.I1English 73 83.9 69 9k.S lt6 63.0 50 68.5 65 89.0 1 l.llForeign language 19 95.0 19 m o 10 52.6 lit 73.7 18 9lt.7 1 5.3Home economics liO 88.9 39 97.5 31 77.5 31 77.5 3lt 85.0Industrial arts 36 91.7 3I1 9k.lt 25 69.lt 22 61.1 31 86.1 1 2.8Mathematics 60 93.7 59 98.3 2!t ItO.O 3lt 56.7 It3 71.7Music 29 96.7 25 86.2 23 79.3 21 72.lt 27 93.1 3 10.3Physical education ii3 95.6 lt2 97.7 32 7lt.ll 35 8l.lt 39 90.7 3 7.0Science 62 89.9 60 96.8 36 58.1 lt3 69.lt 56 90.3 2 3.2Social studies 92 88,5 8lt 91.3 itS 52.2 63 68.5 77 83.7 3 3.3Other 15 78.9 lit 93.3 u 73.3 10 66.7 13 86.7
HCDN»

183they did spply the normal distribution as shown in Table 36, The larger percentage of teachers in exempted village schools reporting the practice is an unusual, deviation, and the reason for this difference is not apparent. Teachers with small classes and those in special subject areas reported the practice less frequently. Fewer than 20 per cent in these classifications used the normal distribution.
TABLE 36Nm©ER AND PER CENT OF TEACHERS INDICATING THAT THEY ATTEMPT TO ASSIGN MARKS FCR ACHIEVEMENT ACCORDING TO THE NCRMAL FREQUENCY
DISTRIBUTION
Classification of teachers Respondents Teachers stating that practice is used
N % N %City schools 500 96.0 IL6 29.2Exempted village schools 69 92.0 32 Uo.iiLocal schools 311 92.7 91 29.3
Total 880 92.2 269 30.6

18UGuidance Services
In the philosophy of evaluation discussed earlier in this report, it was indicated that guidance is the primary purpose of evaluation. In this concept it was implied also that guidance must eventually be largely realized in the teaching-learning situation and through self-evaluation. Specialized guidance services, however, supplement guidance in the classroom, which is virtually synoi rmous with teaching in this concept, by giving assistance to pupils with problems that cannot be adequately provided ty the teacher and by integrating the educational and vocational guidance functions of the school. Relevant points of interest in this section are the extent to which such specialized guidance services are available as reported by teachers and the reasons for which teachers refer pupils to specialized guidance personnel. Other aspects of specialized guidance services are treated in Chapter V based on data obtained from principals.
Table 37 shows the marked difference in numbers of teachers to whom guidance services are available in tbs different types of school districts. Almost three times as many city teachers in terms of per cents indicated availability of such services as was reported by teachers in local schools. Although this table reveals impressive differences between different types of schools, this is probably not as significant as these figures taken alone seem to indicate. Some teachers in free—response statements suggested that

IBSTABLE 37
NIM3ER AND PER CENT CF TEACHERS STATING THAT GUIDANCE SERVICESARE AVAILABLE IN THEIR SCHOOLS
Classification of teachers Respondents Teachers stating
services arethat guidance available
K % N i
City schools 510 9 7 .9 U06 7 9 .6
Exempted village schools 7U 98 .7 31 ill.9Local schools 321 98 .8 86 27.u
Total 905 98 .3 525 58.0
they believed the services were limited to educational guidance or in the number of pupils for whom specialized personnel were able to provide assistance. In Chapter V it can also be noted that most of the personnel reported by school principals are classified as guidance counselors or as deans. A comparison of the responsibilities of conferring with teachers and counseling with pupils reported most frequently by principals with the reasons teachers gave for referring pupils (Tables 38 and 39) suggests tiiat a large part of the guidance function of such personnel is given to pupils that are maladjusted in school or that are not achieving according to ability. There is little evidence that such personnel are providing guidance services to all pupils or

TABLE 38NUMBER AND PER CENT OF TEACHERS STATING THAT THEÏ REFER PUPILS TO SPECIAL GUIDANCE PERSONNEL FCR
REASONS SHOm/N
Reasons far referring pupils
Classification of teachers
Respondents Slcwrlearners
“Problem"pupils
Emotionallyunstablepupils
Pupils with speech defects
N % H % N % N % N %All respondents ^07 96.6 255 50.3 310 61.1 28È 5F3 ' T 23 44.0City schools 392 Exempted village schools 28 Local schools 8?
96.690.398.9
2091333
53.3U6.ii37.9
2li8 63.3lit 50 .0 kB 55.2
230lit38
58.7 50.043.7
191428
48.714.332.2
Junior high schools Senior high schools Four-year high schools Six-year high schools
1198285221
96.0 98.8 96.696.1
60
36n i
50.1 58.5 I2,h50.2
78 65.553 6it.6k9 57.6
130 58,8
734632
131
61.3 56.1 37.659.3
65453182
54.654.936.537.1
MaleFemale
256250
97.096.2
127127
L9 .650.6
139 5U.3171 68.it
122160
47.764.0107116
41.846.4
Age (20 - 29)Age (50 and over)
80116
93.097.5
3866 ii7*5
56.9it9 61.3 75 64.7
446855 .058.6
3458
42.550.0
Professional training: I4. years6 years and over
llii128
9U.297.7
5960
51.816.9
67 56.6 77 60.2
6168 53.5
53.14859
42.146.1
Teaching experience: 2 to L years 20 years and over
72231
91.196.7
31121 ii3.152.b
38 52.8153 66,2
33132
45.857.1
27107
37.546.3 &Last period of teacher training:
1930 - 1939 88 1950 - 1952 162
96.796. Û
U676
52.316.9
59 67.0 93 57.it
4587
51.153.7
4070
45.543.2
(Continued)

TABLE 39NüliBER AND PER CENT CF TEACHERS STATING THAT THEY REFER PUPILS TO SPECIAL GUIDANCE PERSONNEL
FCR REASONS SHCM
Classification of teachers
Respondents
Reasons for referring pupilsPupils not
achieving according to ability
Giftedchildren
All pupils at least once
Other
N % N % N 1 N % N %All respondents 507 9&^ É60 51.3 93 18.3 106 20.9 36 7.1City schools 392 96.6 198 50.5 68 17.3 82 20.9 26 6.6Exempted village schools 28 90.3 . 19 67.9 6 21.4 2 7.1 1 3 .6Local schools 87 98.9 h3 1:9.1 19 21.8 22 25.3 9 10.3Junior high schools 119 96.0 55 1:6.2 14 11.8 16 13.4 4 3 .4Senior high schools 82 98.8 W 52.1: 18 22.0 11 13.4 9 11.0Four-year high schools 85 96.6 h3 50.6 14 16.5 17 20.0 9 10.6Six-year high schools 221 96.1 119 53.8 47 21,3 62 28.1 14 6.3Male 256 97.0 130 50.8 51 19.9 52 20.3 21 8.2Female 250 96.2 130 52.0 42 16.8 54 21.6 15 6.0Age (20 - 29) 80 93.0 35 1:3.8 12 15.0 15 18.8 4 5.0Age (50 and over) 116 97.5 69 59.5 22 19.0 24 20.7 8 6.9Professional training:
4 years 111: 9k.2 50 1:3.9 18 15.8 16 14.0 8 7 .06 years and over 128 97.7 65 50.8 24 18.8 30 23.4 11 8.6Teaching experience:
2 to L years 72 91.1 31 1:3.1 15 20.8 13 18,1 4 5.620 years and over 231 96.7 133 57.6 44 19.0 58 25.1 16 6.9
last period of teacher training;1930 - 1939 88 96.7 1:5 51.1 14 15.9 19 21.6 7 8.01950 - 1952 162 96.1: 76 46.9 32 19.8 30 18.5 11 6.8
H00CO
(Continued)

TABLE 38 (Concluded)
Reasons for referring pupilsClassification of teachers
Respondents Slowlearners
"Problem”pupils
laaotionaiiy inipiis wixn unstable speech pupils defects
N % N % N % N % N %Course in educational tests
and measurenent:les 352 96.9 176 50 .0 215 61.1 201* 58.0 153 1*3 .5No 150 9k. 9 76 50.7, 93 62.0 78 52.0 69 1*6.0
Average eni'ollment in classes: 20 and below 59 95.2 27 U5.8 35 59.3 25 1*2.1* 15 25.1*21 - 30 2ià 96.ii 125 51.2 11*9 61.1 11*1 57.8 111* 1*6.731 - liO 175 97.2 92 52.6 110 62.9 105 60.0 85 1*8.6Over UO 20 95.2 6 30.0 13 65.0 9 1*5 .0 6 30.0
Subject area: Agriculture Art 7
13100.0
98.735
1*2.038.5 6 1*6.2 6 1*6.2
15
ll*.338.5Business education 3h 100.0 16 1*7.1 21 61.8 15 l*l*.l 9 26.5English 79 98.7 la 51.9 58 73.1* 55 69.6 38 1*8.1
Foreign language 28 96.6 17 60.7 13 1*6.1* 17 60.7 12 1*2 .9Home economics 33 91.7 21 63.6 21* 72.7 23 69.7 20 60.6Industrial arts 39 100.0 17 1*3.6 25 61*. 1 21 53.8 15 38.5Mathematics 56 98.2 35 62.5 35 62.5 29 51.8 30 53.6Music 22 100.0 7 31.8 15 68.2 12 51.5 8 36.1*Pi sical education 35 89.7 8 22.9 20 57.1 16 1*5 .7 11 31.1*Science Bk 98.2 30 55.6 29 53.7 29 53.7 21* l*l*.l*Social studies 68 96.7 ii5 51.1 55 62.5 51 58.0 1*5 51.1Other 19 90.5 10 52.6 9 1*7.1* 8 1*2.1 5 26.3
HCO-0

TABLE 39 (Concluded)Reasons for referring pupils
Classification of teachers
RespondentsPupils not
achieving according Gifted All pupils to ability children at least once
Other
N N N % N % N %
Course in educational tests and measurement:
les 352 96.9 188 53 .4 67 19.0 76 21.6 19 5.1*No 150 9b.9 72 U8 .0 25 16.7 28 18.7 17 11.3
Average enrollment in classes:20 and below 59 95.2 33 55.9 11* 23.7 15 25.1* 7 11.921 - 30 2hh 9 6J4 130 53.3 1*2 17.2 1*2 17.2 21 8.631 - UO 175 97.2 87 U9.7 32 18.3 1*3 2i*.6 7 1*.0Over liO 20 95.2 7 35.0 1* 20.0 3 15.0 1 5 .0
Subject area:Agriculture 7 100.0 3 1*2.9 3 1*2.9 1 ll*.3 2 28.6Art 13 98.7 h 30.8 2 15.1* 1* 30.8 3 23.1Business education 3h 100.0 21 61.8 1* 11.8 10 29.1* 2 5.9English 79 90.7 hh 55.7 15 19.0 9 u.U 1* 5.1Foreign language 28 96.6 Ik 50.0 3 10.7 8 28.6 1 3 .6
Home economics 33 91.7 17 51.5 7 21.2 6 18.2 1 3 .0Industrial arts 39 100.0 21 53.8 11 28.2 7 17.9 5 12.8Mathematics 56 98.2 29 51.8 10 17.9 10 17.9 2 3.6Music 22 100.0 11 50.0 3 13.6 7 31.8 2 9.1Physical education 35 89.7 13 37.1 5 ll*.3 8 22.9 3 8.6Science $h 98.2 35 6i*.8 12 22.2 11* 25.9 1* 7.1*Social studies 88 96.7 h2 U7.7 15 17.0 18 20.5 1* 1*.5Other 19 90.5 6 31.6 3 15.8 1* 21.1 3 15.8 MCO\o

190that they are serving an integrative function except as this may be achieved indirectly through assisting certain types of pupils.
Tables 38 and 39 indicate also that there is considerable variability in the reasons for which teachers refer pupils. Of the first five reasons listed, at least four rather definite problems are represented; the classifications of "problem pupils" and emotionally unstable pupils" are interrelated, and this tended to be reflected in many of the responses of teachers since both were often checked by the same teachers. The uniform distribution of responses in these five categories suggests that the function of guidance services as viewed by teachers varies greatly. It is also evident that the use of guidance services by teachers is limited largely to pupils having sonfâ difficulty in the school program.

caxFim V
FROGRAMS OF EVALUATION
Evaluation extends beyond the imoediate practices of the teacher and pupils in the classroom situation. This has been implied at several points in the previous chapter, but in that chapter were presented only those phases of these broader school- wide evaluative methods and activities that are affected by or dependent on the use made of them by the individual teacher. Certain other phases of evaluation that are not directly dependent on the individual teacher for their initiation or inclusion in the school program are presented in this chuter. These have been called the "program" of evaluation by definition; in reality, everything that is done in evaluation will constitute the program of evaluation, but this designation seemed appropriate for this study to distinguish conveniently between two major parts of the problem.
The chapter is divided into four parts: (1) testing programs,(2) recording pupil progress, (3) reporting pupil progress, and(U) related aspects of the evaluation program. Some data in allof these areas are duplications of types of information obtainedfrom teachers. Di part, this was inevitable since teachers areinvolved in these phases of evaluation; in this respect some ofthe data are supplementary and corroborative. However, in somecases the information in this chapter elaborates certain aspectscovered in only a general way in data obtained from teachers.All data in this chapter were obtained from school principals
191

192
because it is believed that they would generally be better informed than teachers with respect to the information requested.
Testing Programs
Educational measuring instruments have been one of the most prominent means of appraising abilities and achievement. Their function has been redefined with the advent of the evaluation concept, and new instruments have been developed for facets of human behavior other than abilities and achievement. It is, therefore, no longer technically accurate to refer to all of these different types of instruments as tests. However, for clarity and brevity the term "tests" is hereafter used to refer to the various types of instruments since they are not discussed from a technical point of view. Tests are still considered a useful means of collecting data; data which, however, are to be interpreted in the light of other evidence rather than accepted arbitrarily as the basis for making decisions regarding the pupil. New tests have been developed, particularly with respect to special aptitudes, interests, attitudes, and personality. While criticism has frequently been made of tests and the manner in which they are used or misused, they still contribute significantly to evaluation because of the relative comprehensiveness of information obtained and, in general, because of their reliability. In this section the extent of use of various types of tests and certain practices in the use of them are summarized.

193Of the 1U6 principals who siapplied data for this study, 139j
or 95-2 per cent, stated that some type of testing program, is conducted in their schools. The percentages for the different types of districts differed only slightDy; 98.1 per cent of the principals in city and exempted village schools, and 93»5 per cent in local schools reported that some testing is done regularly.
The number of schools in which the different types of tests are given is summarized in Table UO. Intelligence tests are reported by slightly over 80 per cent of principals; the group of three Ohio scholarship tests ranks second in frequency; achievement, aptitude, and interest tests are each mentioned by about one-third of the respondents; personality and reading survey tests are indicated somewhat less frequently, and attitudes and diagnostic reading tests are reported rather rarely, l&ider "other" are included certain special tests which may be classified in most cases as aptitude tests.
Three major differences appear in these data. In local schools the different tests are reported slightly less frequently with the exception of the group of Ohio scholarship tests and personality tests. The Ohio tests are used in an appreciably larger percentage of local schools, varying from about 20 to 35 per cent higher for the different tests. Principals in city schools reported the use of reading survey tests much more frequently than is indicated for local schools.

TABLE UONUMBER AND FER CEI T OF FRINCIPALS INDICATING THAT VARIOUS TESTS ARE GIVEN SOME TIME
DURING THE SECONDARY SCHOOL PROGRAM
Type of test City and exempted village schools
Localschools
TotalN % N % N %
Intelligence ii3 81.1 • 69 80.2 112 80.6Ohio Every Pupil 19 35.6 59 68.6 78 56.1Ohio State Scholarship 30 56.6 63 73.2 93 66.9Ohio Senior Scholarship 31 58.5 69 80.2 100 71.9Achievement, couplets battery 15 28.3 17 19.8 32 23.0
Achievement, partial battery 9 17.0 11 12.8 20 lii.liSpecial aptitude 19 35.8 27 31.1 ii6 33.1interest 21 39.6 25 29.1 L6 33.1Personality 10 18.? 18 20.9 28 20.1Attitudes 5 9.ii 6 7.0 11 7.9Reading, survey 22 a.5 11 16.3 36 25.9Reading, diagnostic 8 15.1 8 9.3 16 11.5Other 5 9.k 1 1.2 6 k-3
H

19$
Tables i|l through h3 show the number of times that different tests are given during the school program. In Table I4I a summary for all schools is presented and the foUoidng two tables contain similar data classified by (1) city and exempted village schools,and (2) local schools. Excepting the Ohio tests which are usually given in all appropriate grades in most schools where they are used, the tables reveal a great variability in the nunfoer of times tests are administered during the secondaiy-school program#This is evident for all types of schools. In part, this is caused by differences in school organization, but an analysis on this basis revealed a veiy similar variability within the different types of organization. Although the practice in a majority of schools is to give tests either once or twice during the program,
a considerable number administer such tests as intelligence, interest, and personality far more frequently than seems desirable or necessaiy# In an additional number of schools no definite policy appears to exist since the third most common pattern is to administer tests
in different grades from year to year. It is possible that tests may be administered to all children either under a scheme of alternation or by giving certain tests to several grades in one year, but this is likely to lead to expediency, is difficult to plan, and creates an unbalanced program, particularly if the latter alternative is followed.
The extent of variation in the grades in which tests are administered is further substantiated in Tables I4I; through ij.7# In these tables the number of schools administering tests in each of

TABLE UlNUMBER AW FER CENT* OF PRINCIPALS INDICATING THE NUMBER OF TIMES VARIOUS TESTS ARE GIVEN DURING THE
SECONDARY SCHOOL HOGRAM-SUMMART, ALL TYPES OF SCHOOIS
Type of test Once Twice Threetimes
Fourtimes
Fivetimes
Sixtimes
Not always same grades
N % N % N % N % N % N i N %
Intelligence 36 25.9 32 23.0 Ik 10.1 6 ii.3 8 5.8 16 11.5Ohio Every Pupil 3 2.2 3 2.2 3 2.2 16 11.5 1 0.7 39 28.1 13 9.1iOhio State Scholarship 12 8.6 2 I.I4 1 0.7 55 39.6 10 7.2 8 5.8 5 3 .6Ohio Senior Scholarship 100 71.9Achievement, conpletebattery Ik 10.1 8 5 .8 3 2.2 1 0.7 k 2.9 2 l.liAchievement, partialbattery 11 7.9 2 l.k 3 2.2 1 0.7 3 2.2Special aptitude 27 19.1 6 h.3 3 2.2 2 l.li 1 0.7 7 5.0Interest 25 18.0 k 2.9 1 0.7 7 5 .0 2 I.J4 7 5 .0Personality 15 10.8 2 l.li ii 2.9 7 5.0Attitudes h 2.9 3 2.2 ii 2.9
Reading, survey 17 12.2 9 6.5 5 3 .6 1 0.7 ii 2.9Reading, diagnostic 6 U.3 5 3 .6 1 0.7 1 0.7 3 2.2Other 2 l.k 3 2.2 1 0.7
^ Based on responses of 139 principals who indicated that some testir is done in their schools*
H\oOv

TABLE U2
NmiBER AÎŒ PER CEOT* OF G ITT AI® EXEMPTED VILLAGE SCHOOL HINCIPALS DffilGATBD THE NUMBER OF TIMESVARIOUS TESTS ARE GIVEN DURING THE SECONDARY SCHOOL PROGRAM
Type of test Once Twice Threetimes
Fourtimes
Fivetimes
Sixtimes
Not always same grades
N % N % N % N ■ % N % N %Intelligence 18 31.0 15 28.3 5 9.4 2 3.8 3 5.7Ohio Every Pupil 1 1.9 1 1.9 7 13.2 1 1.9 4 7.5 5 9.4Ohio State Scholarship 7 13.2 1 1.9 1 1.9 16 30.2 2 3.8 1 1.9 2 3.8Ohio Senior Scholarship 30 56.6Achievement, completebattery 10 18.9 3 5.7 1 1.9 1 1.9
Achievement, partialbattery 5 9-h 1 1.9 2 3.8 1 1.9Special aptitude 11 20.8 k 7.5 1 1.9 3 5.7interest 13 2U.5 2 3.8 2 3.8 4 7.5Personality 6 11.3 1 1.9 3 5.7Attitudes 2 3.8 3 5.7
Reading, survey 13 24.5 5 9.4 3 5.7 1 1.9Reading, diagnostic 3 5.7 3 5.7 1 1.9 1 1.9Other 1 1.9 3 5.7 1 1.9
■sfBased on responses of 53 principals who indicated that some testing is done in their schools.H-«Û
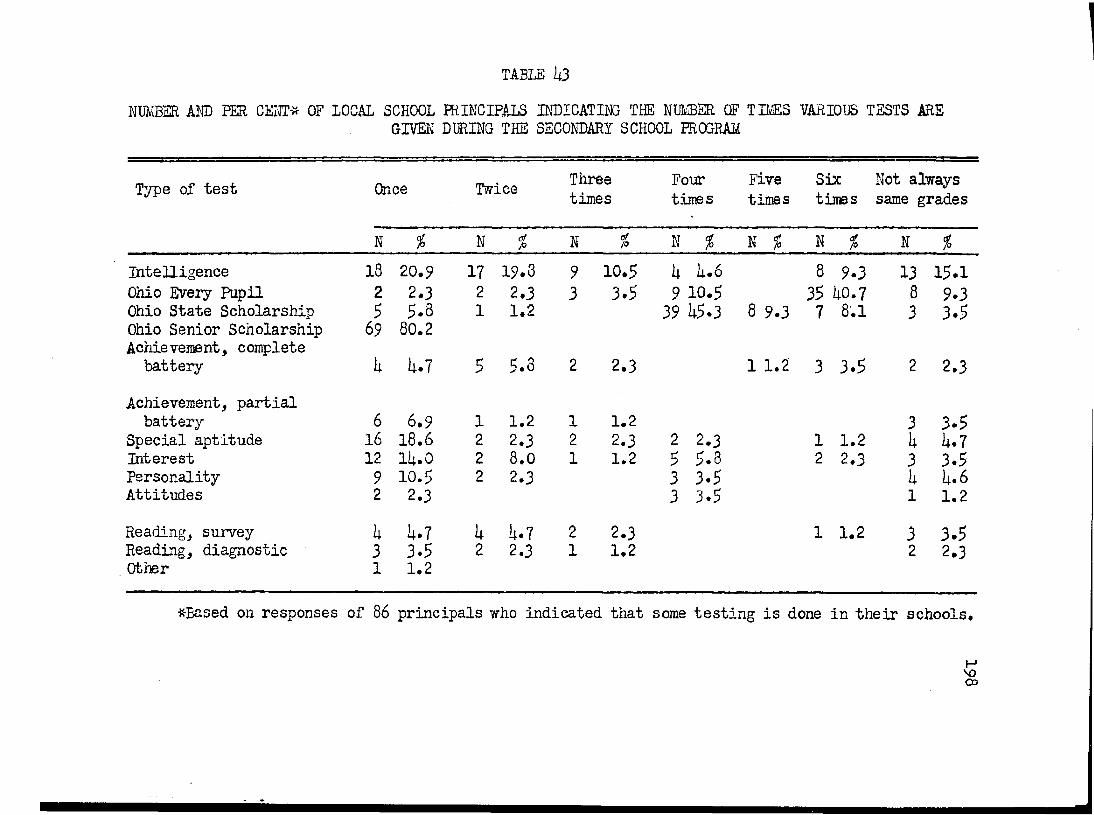
TABLE h3NmiBER X m PER CELT* OF LOCAL SCHOOL PRINCIPALS INDICATING THE NCMBER OF TPÆS VARIOUS TESTS ARE
GIVEN DURING THE SECONDARY SCHOOL PROGRAM
Type of test Once Twice Threetimes
Fourtimes
Fivetimes
Sixtimes
Not always same grades
N % N % N % N ^ N ^ N % N %
Intelligence 18 20.9 17 19.8 9 10.5 k 4.6 8 9.3 13 15.1Ohio Every Pupil 2 2.3 2 2.3 3 3.5 9 10.5 35 40.7 8 9.3Ohio State Scholarship 5 5.8 1 1.2 39 45.3 8 9.3 7 8.1 3 3.5Ohio Senior Scholarship 69 80.2Achievement, completebattery ii ii.7 5 5.3 2 2.3 1 1.2 3 3.5 2 2.3
Achievement, partialbattery 6 6.9 1 1.2 1 1.2 3 3.5
Special aptitude 16 18.6 2 2.3 2 2.3 2 2.3 1 1.2 4 4.7Interest 12 14.0 2 8.0 1 1.2 5 5.8 2 2.3 3 3.5Personality 9 10.5 2 2.3 3 3.5 4 4.6Attitudes 2 2.3 3 3.5 1 1.2Reading, survey ii ii.7 ii ii.7 2 2.3 1 1.2 3 3.5Reading, diagnostic 3 3.5 2 2.3 1 1,2 2 2,3Other 1 1.2
*Based on responses of 86 principals who indicated that some testing is done in their schools.
V)C O

TABLE hh
NUlffiER AND PER CEOT* OF PRINCIPALS INDICATING THAT VARIOUS TESTS ARE GIVEN IN THE DIFFERENT GRADES-SUMMARY, ALL TYPES OF SCHOOIS
Type of testSchool grades
Seven Eight Nine Ten Eleven TwelveN % N % N % N • % N % N %
Intelligence 33 23.7 21 15.1 h3 30.9 20 lU.il 26 18.7 31 22.3Ohio Every Pupil h2 30.2 ii5 32.Ü 59 U2.il 56 Uo.3 57 Ul.O 57 Ul.OOhio State Scholarship 8 5.8 21 15.1 78 56.1 7U 53.2 7U 53.2 79 56.8Ohio Senior Scholarship 100 71.9Achievement, completebattery 12 8.6 17 12.2 10 7.2 8 5.9 7 5.0 11 7.9
Achievement, partialbattery U 2.9 3 2.2 3 2.2 2 i.U U 2.9 5 3.6
Special aptitude 5 3.6 10 7.2 Ih 10.1 8 5.8 7 5.0 18 12.9Dit ere st k 2.9 3 2.2 15 10.8 15 10.8 13 9.U 20 1U.UPersonality 2 l.U 2 l.k 8 5.6 8 5.8 5 3.6 10 7.2Attitudes 1 0.7 3 2.2 2 I.U 2 I.U u 2.9
Reading, survey 20 ik-k 11 7.9 7 5.0 5 3.6 3 2.2 1 0.7Reading, diagnostic 9 6,5 7 5.0 1 0.7 1 0.7 1 0.7Other 2 l.ii 3 2.2 2 l.U 1 0.7 1 0.7 2 I.U
*Based on responses of 139 principals who indicated that some testing is done in their schools.
H

TABLE hSNUMBER AND PER CENT# OF PRINCIPALS INDICATING THAT VARIOUS TESTS ARE GIVEN IN THE DIFFERENT
GRADES— JUNIOR-HIGH SCHOOLS ONLY
Type of testSchool grades
Seven • Eight NineN % N i N %
Intelligence 9 5 26,3 6 31.6Ohio Every Pupil 1 5.3 1 5.3 1 5.3Ohio State Scholarship 2 10.5 h 21.1Ohio Senior ScholarshipAchievement, complete battery 2 10.5 5 26.3 h 21.1Achievement, partial batteiy 2 10.5 1 5.3 1 5.3Special aptitude 1 5.3 6 31.6 6 31.6interest h 21.1Personality 1 5.3 1 5.3Attitudes 1 5.3Reading, survey 6 31.6 3 15.8 1 5.3Reading, diagnostic 3 15.8 2 10.5Other 1 5.3 1 5.3 1 5.3
#Based on responses of 19 junior-high school principals who indicated that some testing is done in their schools.

TABLE k6miBER AMD PER CEMT-K- OF ERINCIPAIB IMDICATIMG THAT VARIOUS TESTS ARE GIVEN IK THE DIFFERENT
GRADES— FOUR-YEAR, FIVE-YEAR, AND SENIŒ-HIGH SCH00I5 ONLY
Type of test School gradesEight Nine Ten Eleven TwelveN i N % N % N % N %
Intelligence 11 28.9 5 13.2 8 21.1 8 21.1Ohio Every Pupil lii 36.8 Ik 36,6 IL 36.8 lii 36.6Ohio State Scholarship 1 2,6 15 39.5 16 L2.1 16 ii2.1 19 50.0Ohio Senior Scholarship 31 8ii.2Achievement, complete battery 1 2.6Achievement, partial battery 1 2.6 1 2.6Special aptitude 2 5.3 3 7.9 1 2.6 h 10.5Interest 2 5.3 3 7.9 2 5.3 6 15.8Personality 2 5.3 3 7.9 1 2.6 1 2.6Attitudes 2 5.3 1 2.6 1 2.6 1 2.6Reading, survey 3 7.9 2 5.3Reading, diagnosticOther
->Based on responses of 38 high school principals who indicated that some testing is done in their schools.
rog

TABIE hi
NUMBER AND PER CENT* OF HINCIPALS INDICATIM} THAT VARIOUS TESTS ARE OWEN IN THE DIFFERENTGRADES— 6n-YEAR HIGH SCHOOLS ONLY
Type of test School gradesSeven Eight Nine Ten Eleven TwelveN % N N N % N of/o K %
Intelligence 25 29.L 17 20.0 26 30.6 19 22.4 16 21.2 23 27.1Ohio Every Pupil W 47.1 43 50.6 43 50.6 42 49.4 43 50.6 43 50.6Ohio State Scholarship 8 9.4 18 21.2 59 69.4 58 68.2 58 68.2 60 70.6Ohio Senior Scholarship 69 81.2Achievement, complete battery 10 11.8 12 14.1 6 7.1 8 9.4 7 8.2 10 11.6
Achievement, partial battezy 2 2.4 2 2.4 2 2.4 2 2.4 3 3.5 4 4.7Special aptitude h 4.7 4 4.7 6 7.1 5 5.9 6 7.1 14 16.5Interest h 4.7 3 3.5 9 10.6 12 14.1 11 12.9 14 16.5personality 1 1.2 2 2.4 5 5.9 5 5.9 4 4.7 9 10.6Attitudes 1 1.2 1 1.2 1 1.2 3 3.5
Reading, survey 13 15.3 7 8.2 3 3.5 3 3.5 2 2.4 1 1.2Reading, diagnostic 6 7.1 4 4.7 1 1.2 1 1.2Other 1 1.2 2 2.4 1 1.2 1 1.2 2 2.4
*Based on responses of 85 principals who indicated that some testing is dons in their schools.
ro8

203
the different grades is analyzed. In Table a siunraaiy for all schools is presented and the following tables show distributions for schools of different types of organization. In each table the number of schools administering tests in different grades is distributed throughout the range of grades in nearly all cases. For the Ohio Every Pupil tests and the Ohio State Scholarship tests this is to be anticipated because most schools in which these tests are used reported that such tests are administered in all grades.For other tests there will inevitably be a certain amount of distribution because some schools give tests in more than one grade. However, these tables show no unusual concentration as might be expected if there were general practices of giving tests in certain grades.
The time of year when tests are administered is an inq>ortant factor influencing the usefulness of results in most cases. Intelligence tests may be an exception, but the reasons tViat are usually advanced for attaining maximum use of tests as influenced by the time of year at which th%r are administered are also applicable to them. The early part of the school year is generally recommended by test specialists and educators who have studied the problem. Administering tests early in the year is advocated because the test results will be available to use in planning the current school program in the light of needs, strengths, and wealcnesses revealed. This practice also facilitates the use of test results by teachers

20U
if they participate in administering them. By giving them early it is much more likely that results will be available for use without the extra burden of checking school records from the preceding year. Furthermore^ the prospect of recording results to be filed shortly before the end of the year is a psychological deterrent 1-rith respect to both teachers and pupils as to the value of the test results. The validity of test results may also be affected by a lapse in time between administration and use of results. In certain situations, for exaznple the use of interest tests, it may be desirable to administer them in one year so that results may be used in the foUovjing year. Even in such cases the results will need to be supplemented by counseling, intervievring, and other types of recorded data and there is, therefore, little justification for delaying administration of them until late in the school year.
Between one-fourth and one-iialf of the schools administer tests of different types in the fall as revealed in Table U8, Administration of reading tests in the fall rises to about 70 per cent when those schools that administer such tests in the spring and fall are included. Except for Ohio Every Pupil tests, other tests are given by veiy few schools in both fall and spring; the general distribution described is not affected materially by these few cases. In the remainder of schools there is a %fide variation distributed among "midyear," "spring," and "indefinite" categories.The Ohio Scholarship tests are, of course, exceptions to this general pattern since they are administered on a schedule established at the state level which is generally from midyear to spring.
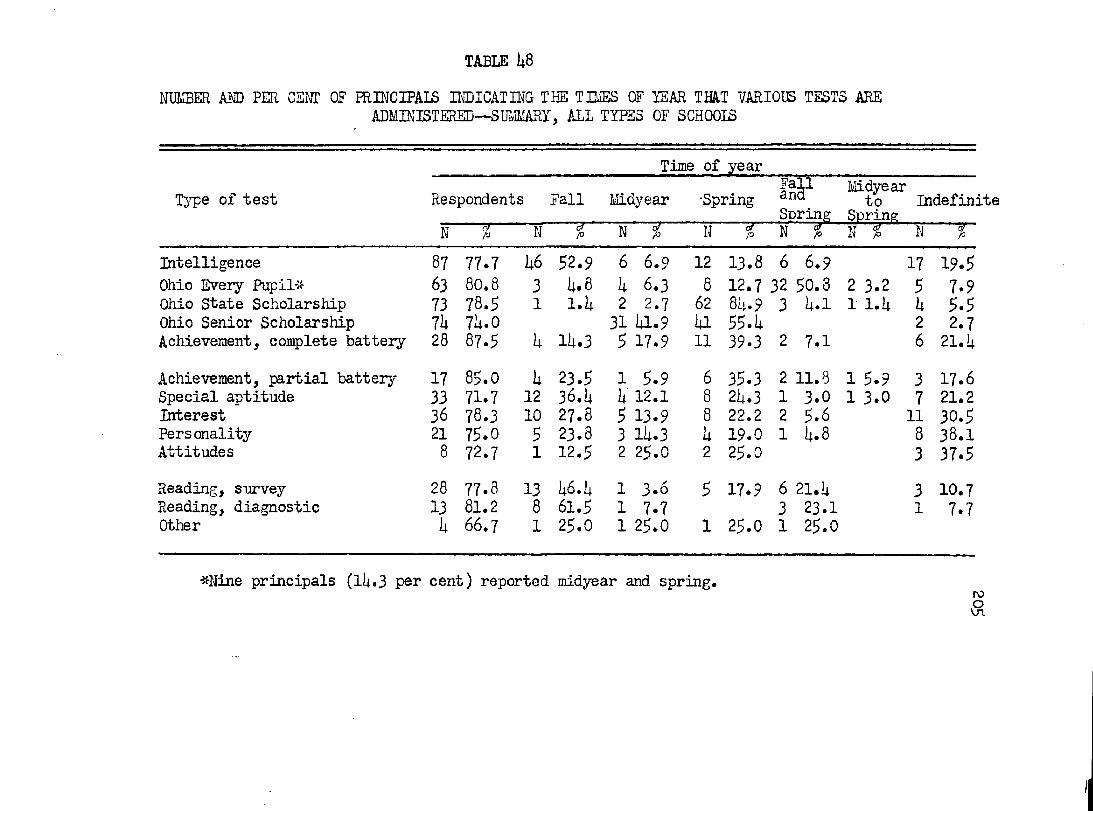
TABLE ii8NliîBER AND PER CEMT OF PRBCIPAIB INDICATING THE TILiES OF lEAR THAT VARIOUS TESTS ARE
ADMINISTERED— SUliMARY, AIL TYPES OF SCHOOIS
T3T30 of testTime of year
Respondents Fall Midyear •Spring FanandSpring
Midyearto Indefin; SpringN % N i N % K Of
P N % N % N %
Intelligence 87 77.7 U6 52.9 6 6.9 12 13.8 6 6.9 17 19.5Ohio Every Pupil-x- 63 80.8 3 ii.8 i; 6.3 8 12.7 32 50.8 2 3.2 5 7.9Ohio State Scholarship 73 78.5 1 l.ii 2 2.7 62 8ii.9 3 ii.l 1 l.ii ii 5.5Ohio Senior Scholarship 7li 7U.0 31 lil.9 hi 55.ii 2 2.7Achievement, complete battery 28 87.5 U lii.3 5 17.9 11 39.3 2 7.1 6 21. iiAchievement, partial battery 17 85.0 ii 23.5 1 5 .9 6 35.3 2 11.8 1 5 .9 3 17.6Special aptitude 33 71.7 12 36.1; ii12.1 8 2ii.3 1 3.0 1 3.0 7 21.2Interest 36 78.3 10 27.8 5 13.9 8 22.2 2 5.6 11 30.5Personality 21 75.0 5 23.8 3 lii.3 ii 19.0 1 ii.8 8 38 .1Attitudes 8 72.7 1 12.5 2 25.0 2 25.0 3 37.5
Reading, survey 28 77.8 13 i;6.ii 1 3 .6 5 17.9 6 21.L 3 10.7Reading, diagnostic 13 81.2 8 61.5 1 7.7 3 23.1 1 7.7Other 4 66,7 1 25.0 1 25.0 1 25.0 1 25.0
*Uine principals (II4.3 per cent) reported midyear and spring. roa

206As indicated earlier, the a dininistration of tests try teachers
is generally to be desired. This tends to facilitate and encorna ge use of test resuitsj it may frequently be an important factor affecting the validity of results; and it is generally desirable since the purposes for which the tests are administered are more likely to be realized. The extent of this practice is shown in Tables I4.9 through $1, Participation of teachers in the administration of tests varies greatly for different types of tests. Intelligence tests are administered by only about 20 per cent of teachers in city and exempted village schools; reading survey and Ohio Every Pupil tests are administered by teachers more than other types. Interest, personality, and attitudes tests are administered in more schools by central staff personnel than is usually the practice for other types of tests. Generally, teacher administration of tests is not as common as might be anticipated. It is also to be noted that the percentage of principals indicating participation by teachers in test administration differs somewhat from that reported by teachers as shown in Table 26. The percentage of teachers participating is greater as shown in Table 26 than in Table h9» Mary teachers apparently based their responses on the administration of Ohio Every Pupil tests.
Table S2 shows the locations in which test results are kept. There was virtually no difference in practices for different types of schools. Therefore, only a summary of the data is presented. Principals indicated that it is almost universal practice to keep

TABLE h9NUMBER AND PER CENT OF PRINCIPALS INDICATIM} THAT CERTAIN SCHOOL PERSONIŒL ADMINISTER
TESTS— SUMMARY, ALL TYPES OF SCHOOIS
Type of test Respon
Personnel
dents Classroomteacher Principal Central
staffN % N <sf/O N % N %
Intelligence 107 95.5 10. 38.3 53 1:9.5 21: 22.ilOhio Every Pupil 72 92.3 67 93.1 7 9.7 . 2 2.8Ohio State Scholarship 91 97.8 25 27.5 k9 53.8 22 21:. 2Ohio Senior Scholarship 89 89.0 9 10.1 29 32.6 55 61.8Achievement, complete batter)'- 30 93.7 15 50.0 11 36.7 6 20.0Achievement, partial battery 16 80.0 6 37.5 8 50.0 2 12.5Special aptitude a 89.1 18 Ü3.9 15 36.6 10 21:. 1:Interest ill 89.1 Hi 3ii.l Hi 3L.1 15 36.6Personality 25 89.3 9 36.0 6 2I1.0 10 1:0.0Attitudes 9 81,8 2 22.2 3 33.3 h là.5Reading, survey 32 88.9 21 65.6 8 25.C 6 18.8Reading diagnostic IL 87.5 7 50.0 7 50,0 1 7.1Other h 66.7 1 25.0 1 25.0 2 50.0
roO-vj

TABLE 50NUÎÆBER AM) PER CEIW OF PRUJCIPALS IKDICATIKG THAT CERTAIN SCHOOL PERSONNEL ADMINISTER
TESTS— CUT AND EXEMPTED VILIAGE SCHOOLS ONLY
Type of test RespondentsPersonnel
C^ssroom PrincipalteacherCentralstaff
N % N % N % N %
Intelligerce h2 97.7 8 19.0 19 L5.2 19 li5.2Ohio Every Pig)!! 18 91.7 16 88.9 2 11.1 2 11.1Ohio State Scholarship 29 96.7 h 13.8 15 51.7 11 37.9Ohio Senior Scholarship 28 90.3 h Ü1.3 10 35.7 17 60.7Achievement, complete battery 15 100.0 9 60.0 5 33.3 3 20.0Achievement, partial battery 6 66.7 2 33.3 3 50.0 1 16.7Special aptitude 16 .81;. 2 9 56.2 3 18.3 k 25.0Interest 19 90.5 6 31.6 3 15.8 11 57.9Personality 9 90.0 2 22.2 7 77.8Attitudes 3 60.0 2 66.7 1 33.3
Reading, survey 20 90.9 11; 70.0 3 15.0 6 30.0Reading, diagnostic 6 75.0 1; 66.7 2 33.3Other 3 60.0 1 33.3 2 66.7
f\3oC O

TABUS 51NiarBER AND PER CEIvT OF ffilNCIPALS H®ICATING THAT CERTAIN SCHOOL PERSONNEL ADMINISTER TESTS—
LOCAL SCHOOIS ONLY
Type of test RespondentsPersonnel
classroom principal teacnerCentralstaff
N % N % N % N %
Intelligence 65 9h.2 33 50.8 34 52.3 5 7 .7Ohio Every Pupil Sh 91.5 51 94.4 5 9.3Ohio State Scholarship 62 98.4 21 33,9 34 54.8 11 17.7Ohio Senior Scholarship 61 68.4 5 8.2 19 31.1 38 62.3Achievement, complete battery 15 88.2 6 40.0 6 40.0 3 20.0
Achievement, partial battery 10 90.9 4 40.0 5 ■ 50 .0 1 10.0Special aptitude 25 94.6 9 3 6 .0 12 48.0 6 24.0Literest 22 88.0 8 36 .4 11 50.0 4 18.2Personality 16 88.9 7 43.7 6 37.5 3 18.8Attitudes 6 100.0 3 50 .0 3 50 .0
Reading, survey 12 85.7 7 58,3 5 41.7Reading, diagnostic 8 100.0 3 37.5 5 62.5Other 1 100.0 1 100,0
ro§

TABLE 52imSER AID FER CENT OF PRINCIPALS INDICATING THAT RECORDS OF TEST RESULTS ARE KEPT IN THE
LOCATIONS SHOTN— SUMMARY, ALL TYPES OF SCHOOLS
Type of test RespondentsLocations
Central, available to teachers
Not available to teachers
Teacners' records Other
If % N % N % N ^ N ^Intelligence 101 90.2 99 98.0 2 2.0 7 6.9 2 2.0Ohio Every Pupil 65 834 56 86.2 1 1.5 18 27.7Ohio State Scholarship 81 87.1 77 95.1 2 2.5 7 8.6 1 1.2Ohio Senior Scholarship 76 76.0 73 96.1 3 3.9 h 5.3Achievement, conçlete battery 28 87.5 28 100.0 5 17.9 1 3.6Achievement, partial battery 16 80.0 15 93.8 1 6.2 2 12.5 2 12.5Special aptitude 38 82.6 3k 89.5 1 2.6 6 15.8 2 5.3Interest 38 82.6 3h 89.5 k 10.5 2 5.3Personality 23 82.1 20 87.0 1 4.2 1 h»2 2 8.6Attitudes 9 81.8 7 77.8 2 22.2Reading, survey 32 88.9 31 96.9 6 18.8 1 3.1Reading, diagnostic 13 81.2 13 100.0 3 23.1 1 7.7Other h 66.7 Ii 100.0 1 25.0
roHo

211test results In a central location available to teachers. Having test results available in teachers’ records is apparently an exceptional practice. On the average, only about 10 per cent of schools repoirted that results are kept in such records when all tests are considered. Reading tests and Ohio achievement tests stand slightly higher with about one—fourth of the principals stating that results are available in teacliers ' records.
The purposes for which test results are used may reveal to a certain extent the effectiveness of them in the evaluation program. A summary and analysis of the purposes in relation to other data regarding testing programs may also be indicative of the likelihood that the purposes reported can be attained. Tables 53 and 5U summarize the responses of principals with respect to this critical phase of the testing program. The major emphases in the use of test results shown in this summary are "survey of classes or school," "diagnosis," "planning classroom instruction," and "counseling." Although reported somewhat less frequently, "grouping of pupils" and "placement of pupils in curricula" are not uncommon. For the last-mentioned purposes, intelligence, achievement, special aptitude,reading and interest tests are reported most frequently; reading tests are reported in this connection by as high as 50 per cent of the respondents who use such tests. The distributions in these tables indicate again that a great variation exists in the conception of the uses of evaluation techniques that has been observed at a number of other points in this study.

TABLE 53NUMBER AND PER CENT OF PRDJGIPALS INDIGATBD THAT TESTS ARE USED FOR THE PURPOSES LISTED
Type of test Respondents
Purposes for which tests are usedSurvey of Planning classes or Diagnosis classroom schools Instruction
Counseling
N % N % N % N % N %
Intelligence 106 9 .6 ii7 Wi.3 61 97.9 96 52.8 84 79.2Ohio Every Pupil 72 92.3 1|6 63.9 46 63.9 36 90.0 19 26.4Ohio State Scholarship 72 77.L 33 45.8 29 40.3 14 19.4 31 43.1Ohio Senior Scholarship 73 73.0 20 27.4 21 28.8 9 6.8 44 60.3Achievement, complete battery 30 93.7 13 43.3 22 73.3 14 46.7 19 63.3
Achievement, partial battery 17 85.0 6 35.3 12 70.6 7 41.2 11 64.7Special aptitude 39 8L.8 7 17.9 16 41.0 6 19.4 34 87.2Interest k3 93.9 5 11.6 16 37.2 7 16.3 38 88.4Personality 26 92.9 3 11.5 12 46.2 2 7.7 23 88.5Attitudes 9 81.8 1 11.1 9 99.6 1 11.1 8 88.9Reading, survey 31 85.1 lli 49.2 17 94.8 19 61.3 10 32.3Reading, diagnostic Ik 87.5 k 28.6 14 100.0 8 97.1 6 42.9Other 3 50.0 1 33.3 3 100.0 2 66.7 1 33.3
roK

TABLE 5hKUÎvSER AM) PER CELT CF PRINCIPALS IM)ICATIN3 THAT TESTS ARE USED FOR THE PIEPOSES LBTED
Type of test RespondentsPurposes for which tests are used
Grouping of pupils
Placement of pupils in curricula
Promotion other
N % N % N % N % N i
Intelligence 106 9b.6 31 29.2 UO 37.7 9 8.5 h 3.8Ohio Every Pupil 72 92.3 5 6.9 6 8.3 3 U.2 1 l.liOhio State Scholarship 72 77.U 5 6.9 7 9.7 3 b.2 15 20.8Ohio Senior Scholarship 73 73.0 2 2.7 2 2.7 3 k-1 12 l6.kAchievement, complete battery 30 93.7 6 20.0 12 Uo.o 6 20.0Achievement, partial battery 17 85.0 3 17.6 3 17.6 2 11.8Special aptitude 39 8k,8 3 7.7 12 30.7 2 5.1Interest h3 93.5 k 9.3 17 39.5 2 U.7Personality 26 92.9 1 3.6 2 7.7 2 7.7Attitudes 9 61.8 1 11.1 1 11.1 2 22.2Reading, survey 31 85.1 13 U1.9 10 32.3 2 6.5Reading, diagnostic Ik 87.5 7 50.0 3 21.i|Other 3 50.0 1 33.3 2 66.7 1 33.3
roHw
J
21UIt is indicated in the data in these tables that the types of
tests that are considered to have most value for planning classroom instruction are those concerned with academic achievement reflected in the strong representation of intelligence, achievement, and reading tests. This was also noted in Chapter V in the analysis of te cliniques used by teachers. Of additional significance is the frequent mention of ’'diagnosis'* for personality tests and Ohio achievement tests. It is not generally recognized that those tests are particularly valuable for diagnostic purposes; this suggests that these types of tests are frequently used for purposes for which they are not suitable. It is also indicated in those tables as compared with Table U8 that achievement tests are reported as useful in ’’planning classroom instruction" by about 50 per cent of respondents, but that only approximately 20 per cent had indicated that these tests are given in the fall of the year. This difference suggests that the use of educational tests is not consistent with desirable practice directed toward attaining maximum usefulness from the results of such tests.
Cumulative Records
The types of inforamtion recorded in the cumulative records as reported by teachers were discussed in Chapter IV. It was noted that a larger proportion of teachers indicated that special interest data, supplementary information, and certain test scores are recorded than was reported by school principals. Recording of other types
215of information was reported by nearly an equal proportion of principals and teachers. In this section a summary of the responses of principals is presented to .show a comparison for types of school districts; it is also believed that these data probably reflect more accurately the types of information recorded than was indicated by teachers. Additional data regarding cumulative records are also included.
Table 55 reveals that local school records are less likely to include home and family information, special-interest data, supplementary information, record of extra-curricular experiences, and test scores than are those of city and exempted village schools. Results of tests are apparently recorded in fewer local schools than in other types because they are not administered in as many local schools. Almost all schools maintain a record of personal information, enrollment and attendance data, school achievement and curricular experience, and intelligence test scores. Other types of information are recorded in varying proportions of schools. The percentage of schools in which various test results are recorded varies in some cases considerably from tiie proportion in which tests are reported to be administered. This variation may arise because test scores are not recorded or are recorded in lower grades prior to the enrollment of students in the schools reporting.
The tjipe of record form used is indicative of the adaptability of the recording system to changing educational conditions and differing needs with respect to individual pupils. A folder type

TABLE 55NUMBER AND PER CENT OF PRINCIPALS INDICATING THE TYPES CF INTCEIATION RECORDED IN THE
CUMULATIVE RECORDS USED IN THEIR SCHOOLS, BY TYPE OF SCHOOL DISTRICT AND TOTAL
Type of information City and exempted village schools
Localschools Total
N % N % N ^Personal information ‘53 100.0 86 97.7 139 98 .6Enrollment and attendance data 51 96 .2 82 93.2 133 94.3Home and family information 92.5 67 76 .1 116 82,3School achievement and curricularexperience 51 96 .2 82 93.2 133 94.3
Extra-curricular experiences ho 75.5 hi 53.U 87 61 .7Health information h2 79.2 65 73.9 107 75 .9Special-interest data 27 50.9 21 23 .9 48 3 4 .0Supplementary information 35 66.0 I4I ii.6.6 76 5 3 .9
TEST RESULTSIntelligence 51 96.2 77 87 .5 128 90 .8Achievement 37 69 .8 U8 54.5 85 60.3Special aptitude 18 3ii.O 27 30 .7 45 31 .9Interest 18 3i|.0 23 2 6 .1 41 2 9 .1Personality 12 22.6 22 25 .0 34 2 4 .1
Attitudes 11 20.8 15 1 7 .0 26 18,4Reading, survey 22 m.5 20 22.7 42 29.8Reading, diagnostic 18 3i|.0 19 21.6 37 26.2
Number and per cent of respondents 53 100.0 88 100.0 i4i 100.0 roH0\

217of record will generally provide better opportunity for recording different types of data and for including a variety of types of information. Nearly 60 per cent of all schools use this type of recordj one-third use a cumulative record card, and 10 per cent use a combination of cards and folders; virtually no difference from this general condition was observed for different types of schools.
The locations in which cumulative records are kept is shown in Table 56. The same general condition is reflected in these data as was noted in Table 52 regarding the recording of test scores. A few schools reported a duplicate system of records: one for the central office and another for the classroom. Three schools indicated that records are maintained in a central location not available to teachers.
To maintain cumulative records for all pupils some procedure is needed to obtain records from other schools for transfer pupils* Ninety-five per cent of the respondents stated that a regular procedure was established in their schools to obtain records. Of these, 60 per cent indicated that a transcript of grades was requested, and the remainder indicated that an attempt is made to secure a complete cumulative record. Since even these requests may not all be fulfilled, and with a majority of principals indicating that only transcripts of grades are requested, there are unquestionably large numbërs of pupils for whom only limited information if available.

TABLE 56
NUÎŒER AND PSR CEOT Œ PRINCIPALS IIŒICATING THAT CUMULAT IVE RECORDS ARE KEPT IN THELOCATIONS SHO?®, BY TYPE OF SCHOOL DISTRICT AND TOTAL
Location City and exempted village schools • Local schools Total
N % N f N i
Central location available to teachers h9 92.5 81 95.3 . 130 9k. 2
Central location not available to teachers 1 1.9 2 2.h 3 2.2
The classroom 5 9.1 2 2.1 7 5 .1
Other 1 1.9 1 0.7
Number and per cent of respondents 53 100.0 85 9 6 .6 138 9 7.!
roH00

219Reporting to Parents
The importance of reporting progress of pupils to parents was noted in Chapter IV. The responses of teachers revealed that report cards are universally used in schools and that only a very small number of teachers in special subject areas do not assign marks to be reported. The information from teachers indicated also that written progress reports and parent conferences were used by only about U and 8 per cent of teachers, respectively. Additional evidence from school principals corroborates the practices reported by teachers.
In Table 57 the extent of the different types of reporting in use in schools as indicated by principals is summarized by types of school organization. It appears from these data that more schools use written progress reports and parent conferences than was reported by teachers. However, Table 58 shows why this difference is probably insignificant. Teachers had been asked whether they used each of the methods regularly, whereas principals were asked how frequently the method was used. Most principals stated that iTritten progress reports and parent conferences were used occasionally or for the specific purposes shown in Table 58. This table shows also that the practice of reporting by report cards every six weeks is practically universal.
The types of information included in the different methods of reporting is summarized in Table 59» Tabulations for written progress reports and parent conferences are probably of little

TABLE 57SCHOOL GRADES IN ïfflICH VARIOUS METHODS OF REPORTING PUPIL PROGRESS ARE USED, AS INDICATED
BY lli5 PRINCIPALS
Method of reporting Grades* in which used7-9 10-12 9-12 7-12 TotalN % N % N i N % N i
Report cards 20 13.8 5 3.U 33 22.8 87 59.3 11+5 100.0Written prepress reports k 2.8 1 0.7 2 l.U 15 10.3 22 15.2Parent conferences 10 6.9 2 l,k 9 6.2 28 19.3 i+9 33.8Other 1 0.7 1 0.7 3 2.1 3 2.1 8 5.5
•«All per cents are based on total number of respondents (N-li|.5)
fV3f V )o

TABLE 58
FRSQUENCÏ OF USE OF VARIOUS ÐODS OF RBPOITING AS INDICATED BY 1Î5 PRINCIPALS— SUMMARY,ALL TYPES OF SCHOOIS
Frequency or occasion Report cards Written progress reports
ParentConferences
. K i N % N %
Every five weeks 1 0.7Every sis weeks 138 95.2 5 3.it 5 3.liEvery nine weeks 2 1.1*Every ten weeks 1* 2.7Ever}'- semester 1 0.7 2 l.liAnnually 1 0.7Occasionally 6 ii.l 12 8.3At request of parents 2 l.iiAs needed \x 2.8 21 lli.5Failure of pupil 3 2.1 1 0.7When parents will come 2 l.iiDepends on problem 2 l.liTotal 11*5 100.0 21 lii.5 1:6 31.7
roH

TABLE 59NTimER AND PER CENT OF PRINCIPALS ETOIGATING THAT DIFFERENT TYPES OF INFORÎ&TION ARE INCLUDED
IN REPŒTS TO PAREI'ITS, SHOÏÎN ACCORDING TO IffiTHODS OF REPORTING
Types of informationMethod of reporting Respondents
Subject Progress grades or according Fiç>il ratings to ability traits
Health
N % N ^ N ^ N % N %
Report cardsYi/ritten progress reports parent conferences
iWi 98.612 5L.519 là. 2
lUi 100.0 23 16.0 52 36.1 6 5 0 .0 9 75.0 6 50.0 8 1 2 .1 11 57.9 12 6 3 .2
(Continued)
15 1 0.L 3 2 5 .016 84.2
TABLE 59 (Concluded)
Types of informationMethod of reporting iocial adjustment Attendance Recommendationsto parents Other
N % N % N % N i
Report cardsWritten progress reports Parent conferences
26 18.1 7 58.3
16 8U.2123 85.k 39 2 7 .15 ia.7 9 7 5 .0
10 5 2 .6 17 8 9 .5
9 5 .61 8 .32 1 0 .3
(\3roro

223significance because of the small number and proportion of respondents as well as the rather erratic practice in using them which was noted above. Report cards, it is to be noted, contain only marks and attendance in a large majority of schools.
Related Aspects of Evaluation
Certain services and practices which are a part of the evaluation program but which are not necessarily conducted by or dependent on the personnel of a given school are included in this section under the heading of related aspects of evaluation. Data regarding three related functions, in-service training, special evaluation services, and physical examinations, seemed appropriate for inclusion in this section. Each of these related functions can contribute significantly to the total program of evaluation and provide assistance and information which would otherwise not be available.
Table 60 shows the number and per cent of schools classified by types of districts and types of organization in which no specializedguidance personnel of any kind are available. Sixty per cent ofall schools in the sample used for this study have no such personnel; in local schools it rises to 77»2 per cent and in city schools itis significantly lower at 31*5 per cent.
The number of schools in which specialized guidance personnel

22h
TABLE 60SCHOOLS HAVING NO SPECIALIZED GUIDANCE PERSOI^NEL
Type of school Number Per centAll schools 88 60.3
City and exempted village schools 17 31.5Local schools 71 77.2
Junior-high schools 8 20.0Senior-high schools and
high schools 23 60.5Six-year high schools 57 6U.8
are available is shown in Table 6l classified according to the number of personnel of each of the different tj'pes. Deans of boys, deans of girls, and guidance counselors are reported most frequently with 18, 22, and 36 principals, respectively, stating that these personnel are available. More than one-half of the schools indicating that deans of boys and deans of girls are employed reported that such persons are engaged full time in this work. Guidance counselors are on a part-time basis in about two- thirds of the schools where they are employed if it is assumed that those principals dieeking "guidance counselors" but not indicating tiie number represent schools employing part-time counselors. All other types of personnel listed are reported by a very small number of schools. Psychologists ranlc highest in the remainder of the list and only 7 per cent of the principals

TABLE 61
NIEBER* OF SCHOOLS KâVING SPECIALIZED GHIDAHCS PERSOHNEL 701'H EVALIJATION RESPOlJSIBILiriES—SUMMARY FŒ ALL TYPES OF SCHOOLS
Less than Checked,Type of personnel Number of personnel •full number Total
One Two Three Four time not given
Guidance counselors 5 6 .2 1 11 11 36Psychologists 6 2 2 10Research workers 2 2Evaluation specialists 1 1Test specialists h 1 h 9Deans of boys 11 h 3 18Deans of girls 10 2 5 5 22Social workers 2 1 3Supervisors 2 1 k 7Other 1 1 3 5
■«■Based on the responses of 113 secondary-school principals.
roro

226indicated that psychologists are provided in their schools.
Since a large proportion of nearly all of these special personnel are on a part—ti^e basis^ their services are probably liniited as previously noted. This limitation is also indicated in Tables 62 and 63, which show the major responsibilities of special personnel as indicated by school principals. Counseling with pupils and conferring with teachers are mentioned most frequently. Testing is mentioned somewhat less frequently than counseling with pupils and conferring with teachers. Compared with the reasons given by teachers for referring pupils (see Tables 38 and 39)> it appears that most of the services of specialized guidance personnel are devoted to "problem" pupils and pupils not achieving according to ability.
The number of schools in which in-service training in various aspects of evaluation has been conducted in the past three years is presented in Table 6U. "Specialized evâuation services" and "other methods of evaluation" are indicated for only four and eleven schools respectively. The first of these two is relatively low in frequency of mention even when the per cent of sciiools for which it is reported is computed on the basis of schools having specialized services. On this basis only 7 per cent of such schools repoz^ed this type of in-service training. Other types of training listed are reported by from 15 to 20 per cent of tlie schools. The distribution among different types of schools is relatively uniform.

TABLE 62
NIMBER AND PER CENT OF PRDICIPALB INDICATING THAT CERTAIN DUTIES ARE PERFORMED BY PERSONNELHAVING EVALUATION RESPCNSIBUTTIES IN THEIR SCHOOLS— SUMMARY F(E ALL TYPES OF SCHOOLS
One responsibility listedType of personnel Respondents Conferring
with teachers Testing(2)
Counseling with pupils
Construct-
N % N ^ N i N % K i
Guidance counselors Psychologists Research workers Evaluation specialists Test specialists
36 100.0 10 100.0 2 100.0 1 100.0 9 100.0
1 10.0 1 50.0
1 2,72 20,0
2 22.2
9 25,0
2 22.2
Deans of boys Deans of girls Social workers Supervisors Other
16 100.0 22 100.0 3 100.0 7 100.0 5 100.0
1 5.51 li.5
8 hh»k 10 U5.5 2 66,71 20.0
fV>rv>

TÂEI£ 63NBBER k m PER CENT QF PRBICIHIS IKDIGATIWG THAT CERTAIN DUTIES ARE PERFORMED BY PERSONNEL HATOI'D EVALUATION RESPOÎSIBILITIES IN THEIR SCHOOLS— SULIMARY FOR ALL TYPES OF SCHOOLS
Type of personnel Respondents Combinations# of responsibilities1 & 3 1 & h 1 & 2 1,2,&3 2 & 3 Other
N % N % N ^ N ^ N % N % N %
Guidance counselors 36 100.0 6 16.7 s 13.9 7 i9.il 8 22.2Psychologists 10 100.0 1 10.0 1 10.0 3 30.0 1 10,0 1 10.0Research workers 2 100.0 1 50.0Evaluation specialists 1 100.0 1100.0Test ^ecialists 9 100.0 1 11.1 2 22.2 2 22.2
Deans of boys 18 100.0 k 22.2 3 16.7 2 11.1Deans of girls 22 100.0 6 27.3 1 ii.5 1 h.S 3 13.6Social workers 3 100.0 1 33.3Supervisors 7 100.0 It 57.1 2 28.6 1 li|.3Other 5 100.0 2 iiO.O 1 20,0 1 20.0
■«■Numbers for the combinations indicate identification numbers appearing in Table 62.
roroCD

TABLE 61i
NUMBER AMD PER CEÎ i OF PRINCIPALS lîffilCATING THAT TEACHERS HAD RECEIVED IN-SERVICE TRAININGIN THE PAST THREE YEARS IN VARIOUS ASPECTS OF EVALUATION
School divisionsAspect 01 evaluation Junior-
highSenior-high or high
Junioi andsenior-high Total
N % N % N % N
Teacher-made tests h 2.8 h 2.8 17 11.9 25 17.3Standardized tests 6 L.2 5 3.5 17 11.9 28 19.6Other methods of evaluation 1 0.7 10 7.0 11 7.7Philosophy of evaluation 2 l.k 1 0.7 18 12.6 21 IU.7Reporting to parents 7 h.9 3 2.1 19 13.3 29 20.3Cumulative records k 2.8 2 l.ii 19 13.3 25 17.5Specialized evaluation services 1 0.7 3 2.1 li 2,8Classroom guidance 8 5.6 3 2.1 21 lli. 7 32 22.hOther 1 0.7 1 0.7 2 l.h
*A11 per cents are based on total number of respondents (N-lW)
rorv)VO

230The most common method of training in the in-service program
for evaluation is the teachers* meeting as indicated in Tahle 6 5.More than one-half of the principals reporting that in-service training was conducted indicated that the teachers* meeting was used and approximately one-third indicated "study groups.""Workshops," "consultants," and "materials published by school" were mentioned by only a few principals for each of the types of in-service training conducted by these methods.
Data for the third related aspect of evaluation, physical examinations, are summarized in Tables 66 and 6 7. Of 1^3 principals responding to this part of the inquiry, $1 indicated that no physical examinations are administered. The responses of the remaining 65
per cent shown in Table 6? indicate a wide range of variation in the number of grades in which examinations are given. The general tendency is for more schools to administer examinations in the lower grades than in the higher grades, with a sharp decrease in the number giving physical examinations beyond grade ten, Fewer than 30 per cent of all schools administer a given type of examination in a given grade. The combinations of grades for those schools in which an examination is administered in more than one grade varies greatly. Although such variation is not necessarily indicated in Table 66, it was verified in analyzing and tabulating.
Some duplication occurs in Tables 66 and 6? among the different types of examinations, that is, some respondents indicated dental, vision, and hearing examinations for the same grades in which they

TABLE 65NlttlBER AMD PSR CENT* OF PRIWCIPAIS II0ICATING THAT TEACHERS HAD RECEIVED IN-SERVICE TRAINING
IN THE PAST TmSE YEARS IN VARIOIS ASPECTS OF EVALUATION, SHŒÎN BY METHODS OF TRAINING USED
Methods of training
Aspect of evaluation Workshop
Teachers• meetings
Studygroups
Consultants
Materials published by school
Other
N % N % N of N % K % N ^
Teacher-made tests k 2,8 18 12.6 I 2.8 2 l.ii ii 2.8 1 0.7Standardized tests 5 3.5 19 13.3 U 7.7 7 1.9 2 l.LOther methods of evaluation 3 2.1 6 ii.2 3 2.1 1 0.7Philosophy of evaluation 3 2.1 18 12.6 8 5.6 h 2.8 2 l.iiReporting to parents 5 3.5 26 18.2 5 3.5 5 3.5 ii 2.8Cumulative records 3 2.1 2k 16.8 h 2.8 3 2.1 5 3.5Specialized evaluation services 3 2.1 2 l.h 1 0.7Classroom guidance 7 L9 26 18.2 10 7.0 h 2.8 9 6.3 2 l.h
Other 1 0.7 1 0.7
■»A11 per cents are based on total number of respondents (ll;3)*
t\)V)H

TABLE 66
NUMBER AID PER CENT-* OF PRIÏÏCIPAI3 IIOICATIffi TH/IT CERTAB TYPES OF PHYSICAL EXAMINATIONS AREADMINISTERED IN THE DIFFERENT SCHOOL GRADES
Type of examination Seven Eight_Grades in which physical examinations are administered
Nine Ten Eleven Twelve Total schools inwhich administered
N N i N i N àP N C?
P N i N %G eneral p h y s ic a l 33 23.1 22 15J4 3I1 23.8 28 19.6 19 13.3 22 15.h 56 39.2D ental 26 18.2 19 13.3 25 17.5 20 lii.O 11 7.7 12 8.il k3 30.1V isio n I4I 28.7 28 19.6 30.1 36 25.2 30 21.0 29 20.3 71 ii9.7H earing 38 26.6 23 16.1 36 2S.2 30 21.0 2h 16.8 28 19.6 55 38.5
M U per cents are based on total number of respondents (M-lli3)*
TABLE 67NUliBER A # pm CEÎT-*- OF PRINCIPALS II®ICATIKG TfS NUMBER QF GRADES IN 'ffilCII C2CPAIN TYPES QF
PHYSICAL EXAMINATIONS ARE AHdEJISTERED
Type of examinationNumber of grades
One Two Three Four Five SixN ^ N % N % N ^ N N ^
General piwsical 18 12.6 111 IQ.p 8 5.6 3 2.1 13 9.1Dental 16 11.2 8 5.6 9 2x3 3 2.1 8 5.6Vision 22 i5.il 13 9.1 9 6.3 11 7.7 1 0.7 15 10.5Hearing 21 lit. 7 15 10.5 8 5.6 6 i|.2 1 0.7 111 10,0
M U per cents are based on total number of respondents (Nlii.3)«roOjro

233had indicated "general physical." Variation in tne definition of tæse tj'pies of examinations is almost inevitable; medical experts would probably not agree exactly as to theii' definition. That in itself suggests tirat there may be some variation in the adequacy or extensiveness of the different types of examinations.
i n Ta-ble 63 are shown the number of respondents indicating dental, vision, and hearing examinations who had also indicated general physical examinations. Comparison of tiie data in this table with those in Table 66 reveals that approximately one-half of the principals who had indicated "general physical" also stated that the other tliree types of physical examinations are administered. Thus, variation apparently is not limited to the factor of frequency already discussed, but is also in evidence regarding the nature of a general physical examination, differences in number ofrespondents by grades in this analysis and the fact that about one-haIf of the respondents indicated other types of examinations along with "general physical" suggest that general piiysical examinations may or may not include one or more of the other types of physical examinations.
Tiie "Total" column in Table 66 shows the number of schools in which the different types of examinations are administered regardless of number of grades in which administered. The figures in this column which include duplication indicate that vision examinations are most ccxnmon with 71> or $0 per cent, of principals stating that they are administered; other types are reported by approximately 30 per cent of respondents.

TABLE 68
NUMBER A}ID PER CENT CF PRINCIPALS DEDICATING THAT DEITTAL, VISION, AND HEARING EZCAl.ENATIONS ARE ADMINISTERED IN EACH OF THE DIFFERENT SCHOOL GRADES WHO INDICATED THAT GENERAL PHYSICAL EXAMI
NATIONS ARE ADMINISTERED
Ti'pe o f ex am in a tio nGrades in w hich p h j^ s ice l ex am in a tio n s
i s t e r e da re adm in-
Seven S ig h t Nine Ten E leven Twelve
D en ta l 21 12 15 13 7 8
V is io n 26 13 15 16 9 13R earing 2i| 12 17 15 9 12
l\5VjO

CHAPTSR VI
JüDGLSMTS Œ TEACHERS AI® PRINCIPALS REGARD DIG EVALUATIONPRACTICES k m PROGRAMS
In a d d i t i o n t o p r o v id i n g i n f o r m a t i o n o f a f a c t u a l ty p e co n
c e rn in g p r a c t i c e s a n d p ro g ra m s o f e v a l u a t i o n , t e a c h e r s w e re a s k e d
to i n d i c a t e t i i e i r Ju d g m en ts r e g a r d i n g c e r t a i n a s p e c t s a n d p h a s e s
o f e v a l u a t i o n a s w e l l a s t o m ake g e n e r a l Ju d g m e n ts r e f l e c t i n g
f a c t o r s w h ic h t h e y b e l i e v e d w e re p r e v e n t i n g s a t i s f a c t o r y e v a l u a t i o n .
W henever ju d g m e n ts w e re t o b e e x p r e s s e d a s r a t i n g s , e i t h e r a t h r e e -
or f o u r - p o i n t s c a l e w a s u s e d a s seem ed m o st a p p r o p r i a t e t o a
p a r t i c u l a r i t e m .
In g e n e r a l , t h e r a t i n g s u s e d w ere t h e d e s c r i p t i v e c a t e g o r i e s
o f " l i t t l e , " " s o m e ," a n d "m uch" w i t h p r o v i s i o n f o r " n o n e " o r " n o t
a t a l l " w h e n e v e r r e q u i r e d . S l i g h t v a r i a t i o n s i n t e r m in o lo g y w e re
u sed to make t h e t e r m s c o n s i s t e n t w i th t h e c o n t e x t . S u ch r a t i n g s
w ere c o n s id e r e d v a l u a b l e i n e s t a b l i s h i n g m ore d e f i n i t e l y t h e s t a t u s
o f e v a l u a t i o n w i th r e s p e c t t o a d e q u a c y a s v ie w e d by t e a c h e r s an d
w ere u s e d i n c o n n e c t io n w i t h e v a l u a t i o n t e c h n i q u e s t o p r o v id e a m ore
a d e q u a te d e s c r i p t i o n o f t h e i r s t a t u s a s w e l l a s t o f a c i l i t a t e i n t e r
p r e t a t i o n o f o t h e r d a t a d i s c u s s e d i n C h a p te r IV . S c h o o l p r i n c i p a l s
w ere a s k e d o n ly t h r e e q u e s t i o n s o f t h i s t y p e : (1) t h e i r Ju d g m en t
as t o w h e th e r t h e e v a l u a t i o n p ro g ra m w as a d e q u a te , ( 2 ) t h e s t a t u s
o f d i f f e r e n t t y p e s o f r e p o r t i n g , and ( 3 ) t h e f a c t o r s p r e v e n t i n g
d ev e lo p m en t o f a n a d e q u a te e v a l u a t i o n p ro g ra m . A d d i t i o n a l q u e s t i o n s
o f a Judgm ent ty p e w e re a s k e d o f t e a c h e r s b e c a u s e i t i s b e l i e v e d
235

236t h e i r r e s p o n s e s w o u ld b e m o re v a l i d t i i a n t h o s e o f t h e p r i n c i p a l s .
The j u s t i f i c a t i o n f o r t h i s p r o c e d u r e a n d b e l i e f r e s t s l a r g e l y on
th e f a c t t h a t e v e n t u a l l y t h e p r a c t i c e s o f t e a c h e r s a r e t h e m o s t
c r i t i c a l l i n k i n t h e t o t a l e v a l u a t i o n p ro g ra m a n d t i i a t s u c h p r a c t i c e s
a r e c l o s e l y r e l a t e d t o th e b e l i e f s and ju d g m e n ts o f t e a c h e r s .
D a ta f o r e a c h i t e m i n t h i s c h a p t e r t h a t i n v o lv e a d e q u a c y o r
v a lu e r a t i n g s a s d e s c r i b e d ab o v e a r e su m m arized i n a n " a v e r a g e
v a lu e r a t i n g . " The t e c h n i q u e u s e d i n o b t a i n i n g t h e s e a v e r a g e
r a t i n g s w as t o a s s i g n a r b i t r a r y n u m e r ic a l v a l u e s o f 1 f o r " l i t t l e , "
2 f o r " so m e ," a n d 3 f o r "m u c h ," o r t o r e s p e c t i v e e q u i v a l e n t d e s c r i p
t i v e te rm s w h e n e v e r te r m in o lo g y w as v a r i e d to s u i t th e c o n t e x t .
In e ac h c a t e g o r y t h e num ber o f r e s p o n d e n t s w a s m u l t i p l i e d t y t h e
n u m e r ic a l v a lu e a s s i g n e d . T h e se p r o d u c t s w e re t h a n a d d e d a n d
d iv id e d by th e t o t a l num ber o f r e s p o n d e n t s t o o b t a i n t h e a v e r a g e
v a lu e r a t i n g , "mien t h i s p r o c e d u r e w a s a p p l i e d t o p r a c t i c e s w ii ic h
c o u ld be assu m ed t o be d e s i r a b l e w i t h i n t h e c o n c e p t o f e v a l u a t i o n
d e v e lo p e d e a r l i e r i n t h e s tu d y , t h o s e r e s p o n d e n t s i n d i c a t i n g "n o n e "
or " n o t a t a l l " w e re a l s o i n c l u d e d i n th e d i v i s o r u s e d t o o b t a i n
th e a v e ra g e v a lu e r a t i n g ; i n c a s e s i n w h ic h s u c h a n a s s u m p t io n
c o u ld n o t b e made t h e num ber o f s u c h r e s p o n s e s w a s o m i t t e d i n t h e
c o m p u ta t io n .
Ju d g m e n ts o f T e a c h e r s
Ju d g m en ts o f t e a c h e r s w e re o b t a in e d f o r t h e f o l l o w i n g : (1 )

237adeqiiacy o f e v a l u a t i o n o f v a r i o u s a s p e c t s o f p u p i l p r o g r e s s , ( 2 )
v a lu e o f s tu d y in g w ay s t o e v a l u a t e p u p i l p r o g r e s s t o w a r d a c h i e v e -
n e n t o f o b j e c t i v e s , (3 ) v a lu e o f e v a l u a t i o n m e th o d s a n d t e c h n i q u e s ,
(h) p r e f e r e n c e s r e g a r d i n g t e s t i n g p r a c t i c e s , ( 5 ) v a l u e o f in f o r m a
t i o n i n c u m u la t iv e r e c o r d s , (6 ) s a t i s f a c t i o n o f t e a c h e r s , p a r e n t s ,
a n d p u p i l s w i t h m e th o d s o f r e p o r t i n g , an d ( 7 ) f a c t o r s p r e v e n t i n g
s a t i s f a c t o r y e v a l u a t i o n .
The f i r s t t y p e o f ju d g m e n ts , a d e q u a c y o f e v a l u a t i o n o f v a r i o u s
a s p e c t s o f p u p i l p r o g r e s s , s h o u ld b e p r e d i c t a b l e f ro m p r e v io u s d a t a
of t h i s s tu d y w h ic h i n d i c a t e d t l i a t c e r t a i n p r a c t i c e s seem ed t o b e
em p h asized m ore t h a n o t h e r s . T h is i s g e n e r a l l y t r u e a n d m ay be
o b s e rv e d m o s t n o t i c e a b l y w i t h r e s p e c t t o " p e r s o n a l - s o c i a l a d j u s t
ment " and " h e a l t h " i n T a b le 69. IV hile t h e s e a s p e c t s a r e th e m o s t
e l u s i v e an d r e q u i r e s u b j e c t i v e ju d g m en t i n m any c a s e s , t h e y a r e
th e a s p e c t s f o r w h ic h th e known m e th o d s an d t e c h n i q u e s o f o b t a i n i n g
in f o r m a t io n shov^ed g r e a t e s t v a r i a t i o n i n p r a c t i c e . T ii is w as
p a r t i c u l a r l y n o te d i n t e c h n i q u e s an d m e th o d s o f e v a l u a t i o n u s e d
by t e a c h e r s an d i n t h e r e s p o n s e s o f p r i n c i p a l s c o n c e r n in g p l i y s i c a l
e x a m in a t io n s .
The d a t a i n T a b le 69 i n c l u d e t h e n u m b er a n d p e r c e n t o f t e a c h e r s
re s p o n d in g i n e a c h o f t h e f o u r c a t e g o r i e s show n and a t th e r i g h t an
a v e ra g e a d e q u a c y r a t i n g f o r e a c h a s p e c t o f p r o g r e s s . T he b a s i s u s e d
f o r co m p u tin g t h i s a d e q u a c y r a t i n g w as t h e t o t a l num ber o f r e s p o n d e n t s
f o r e a c h i t e m s in c e i t i s a ssu m ed t h a t e v a l u a t i o n o f t h e s e v a r i o u s
a s p e c t s s h o u ld b e m ad e. "N o t a t a l l " r e s p o n s e s a r e t h e r e f o r e i n c l u d e d .
S u b je c t a c h ie v e m e n t i s r a t e d h i g h e s t , w i t h a n a v e r a g e r a t i n g o f 2 . 2 ,

TABLE 69JUDGIvm’TS CF TEACHERS REGARDDD THE ADEQtACI OF EVALUATION OF DXFIEREI'ÎT ASPECTS OF PUPIL PROGRESS
A spect of p u p i l p ro g re s s R espondentsT each ers in d ic a t in g t h a t a s p e c t o f p ro g re s s
i s e v a lu a te d : A verageNot a t a l l In a d e q u a te ly F a i r ly w e ll A de cju a t e ly adequacy
r a t in gN N N (if/■3 N A' N %
S u b je c t ach ievem ent 893 97 .0 2ii 2.7 58 6.5 li93 55.2 318 35 .6 2.2
A tt i tu d e s 901 97.8 57 6.3 200 22.2 ii50 50 ,0 191 21.5 1.9I n t e r e s t s 897 97 .1 68 7.6 197 22.0 Ü22 17.0 210 23.k 1 .9
p e r s o n a l - s o c ia l a d ju s t iæ n t 886 9'o.2 112 12.6 282 31.8 371 UI.9 121 13.7 1.6Work h a b i t s 899 97.6 ll2 L 7 153 17.0 L57 50.8 2L7 27.5 2,0H ealth 893 97.2 102 11.1; 231 23.8 366 L0 .9 196 21.9 1.7
roU)O'j

239ivork nabits second with a rating of 2,0, interests and attitudes were each rated 1.?, and health and personal-social adj us tuent 1.7 and 1.6, respectively. These findings appear to be correlated -vrath tne extent of use of various techniques and practices that pre- simably can provide information relative to tlie different aspects of progress, H'lasmuch as observation, discussion, and infcrmal conversation and activities were also reported frequently tiie data in fable 69 probably also reflect in part tine major concerns of teachers in evaluating pupil progress.
A detailed analysis by characteristics of teacners is presented in Appendix D. Although no persistent differences in patterns of responses appear in this analysis, the following should be noted. Teachers in city schools rated the adequacy of evaluation of health at 1.9 in contrast vritn a rating of 1.5 by teacliers in local (county) school districts. Teachers in mathematics, science, and music rated "interests" lower than other teachers with ratings of 1.6, l.?j and 1.5, resT^ectively. Ratings subject areas for personal- social adjustment and work habits are extremely variable as compared to tlie range and variability evidenced in all other ratings, both as to classification of teachers and aspects of progress.
It should be noted that the lower average ratings for personal- social adjustment and health are caused in large part by a larger number of respondents wlio indicated "not at all" for these aspects. Thus, the major differences arise from the comparatively large number of teachers indicating "adequateljr" for subject achievement and

2U0"not at all" for the other two aspects referred to above.
In one item in the inquiry, teachers who stated tnat they nad studied ways of evaluating established objectives were a sked to rate the value of such study. As previously noted, in Chapter r/, this group consisted of about 20 per cent of all respondents, Si-xby per cent of these teachers rated such study as having "some" value and 20 per cent indicated "much." Only 3*5 per cent stated tint study of ways to evaluate progress had no value. As is Characteristic of mainy ratings of this type in the study, moderate ratings predominate. However, the proportion of teaciiers who recognise some value in this procedure is large and therefore suggests that such study would be a positive factor in improving evaluation.
A third aspect of evaluation, the methods and techniques used by teachers, was believed to be an important area in which judgments of teachers would be valuable in interpreting other data and in providing a more comprehensive description of evaluation generally. It was noted in Chapter IV that the value ratings for tiie various techniques tended to correlate positively with the number of teachers using the tecimiques. This tendency may be observed in Table 70. Four techniques in the list, (1) observing classroom activities, (2) exajîiining class written work, (3) keeping your ovm record of class activities, and (U) examining work products, ’.vere rated exceptionally high, with average ratings of 2.5 or above. The preponderance of "great value" ratings required to attain

TABLE 70JlDGLiEivTS OF TEACHERS'* REGARDIM} T:iE VALUS OF VARIOUS EVALUATION 13TH0DS ALI) TECHNIQUES
Method or technique Teachers not using
Teachers rating method or as having:
Little value Some value
technique
Great valueTeachersusing
Averagevalue
N ^ K % N % N < ratingobserving classroom activities 6 5 ^ 1 21 2.5 163 17.9 664 72.7 “W T 2 . 9 2.8Examining class written work 103 11.3 6.0 260 28.5 495 54.2 810 88.7 2.6Using objective tests Conducting question-answer
131) 14.7 75 8.2 363 39.8 341 37.3 779 85.3 2.3period 146 16.0 95 10.4 354 38.6 318 34.6 767 84.0 2.3Talking informally with pupils 166 18.2 # 3.6 345 37.8 367 40.2 747 81.8 2.4
Examining home written work 201 22.0 249 27.3 342 37.5 121 13.2 702 78.0 1.8Conducting pupil discussions Talking informally with
221 24.2 62 648 285 31 .2 345 37.8 682 75.8 2.4other teachers
Listening to individual oral237 26.0 135 14.8 391 42.8 150 16.4 676 74.0 1.8
reports Keeping your own record of
276 30.2 138 15 .1 339 37.2 160 17.5 637 69.6 2.0, class activities 296 32 .4 27 3.0 204 22.3 386 42.3 617 67 .6 2.6Examining work products 316 34.6 49 5 .4 191 20,9 357 39 .1 597 65.4 2.5Using essay“type tests 319 34.9 150 16 .4 270 29.6 174 19.1 594 65.1 2.0using cumulative records Using standardized or
328 35.9 158 17.3 295 32.3 132 14.5 585 64.1 2.0published tests
Observing pupils in out-of- class activities337 36.9 178 19.5 280 30.7 118 12.9 576 63.1 1.9341 37.4 62 6.8 308 33.7 202 22.1 572 62.6 2.2
Holding conferences withother teachers 368 I1O.3
Holding conferences vdth parents 399 1)3*7 planning activities with pupils 1)01 1)3» 9 Examining pupil notebooks 1)32 1)7.3Listening to panel discussions 1)71) 5l«9
181 1222 2'L1)7 5.2 90 9 125 13.7
8
gg21)3279195
30 .623.926.630.62 1.1)
(Continued)
85Ih
222112119
24.312.3 13 .0
Silt U'.l512 56.11)81 52.7 1)39 1)8.1
2.32.02.0
ro

TABLE 70 (Concluded)
Method or technique Teachers not using
Teachers rating metnod or technique as having:
Little value Some value Great valueTeachersusing
Averagevalue
N ^ R % 11 % R % N N ratingHolding planned conferences with pupils 482 52.8 6k 7 .0 208 22.6 1$9 17.k k31 k7.2 2.2
Looking at pupil scrapbooks 566 62,0 133 Ik. 6 172 16.6 k2 k.6 3k7 38 .0 1.7Visiting pupils' homes $73 62.8 130 Ik. 2 121 13.3 89 9.7 3kO 37.2 1 .9using attitude, interest, personality tests, scales $88 6L1: 116 12.7 136 Ik. 9 73 8.0 32$ 3S.6 1.9
Looking at pupil collections 621 63.C 10$ 11.$ lk3 1$.7 kk k.8 292 32 .0 1.8Keeping growth charts 637 69.8 H7 12.8 9$ 10. k 6k 7 .0 276 30.2 l.kUsing check lists 6k9 71.1 62 6.8 Iko 15.3 62 6.8 26k 28.9 2.0using rating scales 6$8 72.1 7$ 8.2 137 15.0 k3 k.7 2$$ 27.9 1 .9Reading pupil autobiographies 683 7k.8 111 12.2 73 8.0 k6 $.0 230 2$.2 1.3Making tape or wire recordings 687 7$.3 12k 13.6 66 7.2 36 3 .9 226 2k.7 1.6Using work habit inventories 697 76.3 88 9.6 90 9 .9 38 k.2 216 23.7 1.6Examining pupil diaries of class activities 7$7 82.9 10k 11. k 36 3 .9 16 1.8 1$6 17.1 l.k
using sociodrama 766 83,9 8$ 9 .3 kk k.8 18 2.0 lk7 16.1 1.6Iviatcing sociograms 771 8k.k 103 11.3 29 3 .2 10 1.1 lk2 15.6 1.3
■iIfumber of respondents - 9I3. All per cents based on total number of respondents.
roro

2U3this average is evident from a brief study of this column in the table. These techniques with unusually high ratings appear in the first eleven techniques listed. All others in the first eleven, except "examining home written work" and "talking informally with other teachers," are rated 2.0 or above.
Considering the entire list of techniques, one finds that three major types are dominant among those obtaining higher than a 2.0 rating. These may be classified as (1) observation, (2) study or examination of pupil achievements, and (3) discussion and conference techniques directly involving pupils. Generally ranking low are(1) techniques requiring special instruments or equipment, (2) conferences with parents and teachers, (3) techniques related to pupil achievements outside the immediate class situation, (U) techniques more closely related to personal interests of pupils.Other t '-pes of techniques with about average ratings include (1) all types of tests except teacher-made tests, (2) cumulative records and other types of records except those kept by the teacher or pupil, (3) fonial types of reporting and discussion, and (U) home visitation.
The ratings by classifications of teachers are included in Appendix D* A comparison of the responses of these different groups 01 teachers shows only slight variations for most classifications except in the groupings by subject areas. The differences in this instance are so numerous tiiat a detailed analysis of them is beyond the scope of this study. However, a study of these differences witiiin

2UUtœ limits of analysis made indicates that the same general tendencies appear as were observed with reference to the use of techniques suggesting tiiat certain techniques are more adaptable to some subject areas than others. It also suggests, however, that certain activities and processes have become so traditional in given areas that efforts to employ other techniques would improve evaluation in tne se areas and in tiie total school program as well.
The value of different types of information in cumulative records as rated by teachers is generally consistent witii the ratings for methods and techniques used by teachers. Table 71 shows that "school achievement and curricular experience" and results of achievement tests rank highest with 2.1; average value ratings; intelligence test results ranlc second with a 2.3 average rating; ratings for all other tyrpes of information vai’y only slightly from one another between 1.9 and 2.2 average ratings. Since these ratings as well as the tabulations of number and per cent of respondents in tiie different categories are based on tiie number of teachers indicating that they record different types of information, the data cannot be compared directly with the responses of teachers concerning the value of cumulative records presented in Table 70.A comparison of these two tables shows, however, tiiat over 200 more teachers rated "personal information" as at least of "some value" in Table 71 than had indicated this rating under use of cumulative records in Table 70. Similar differences of varying magnitude are revealed for types of information that can be compared in the two
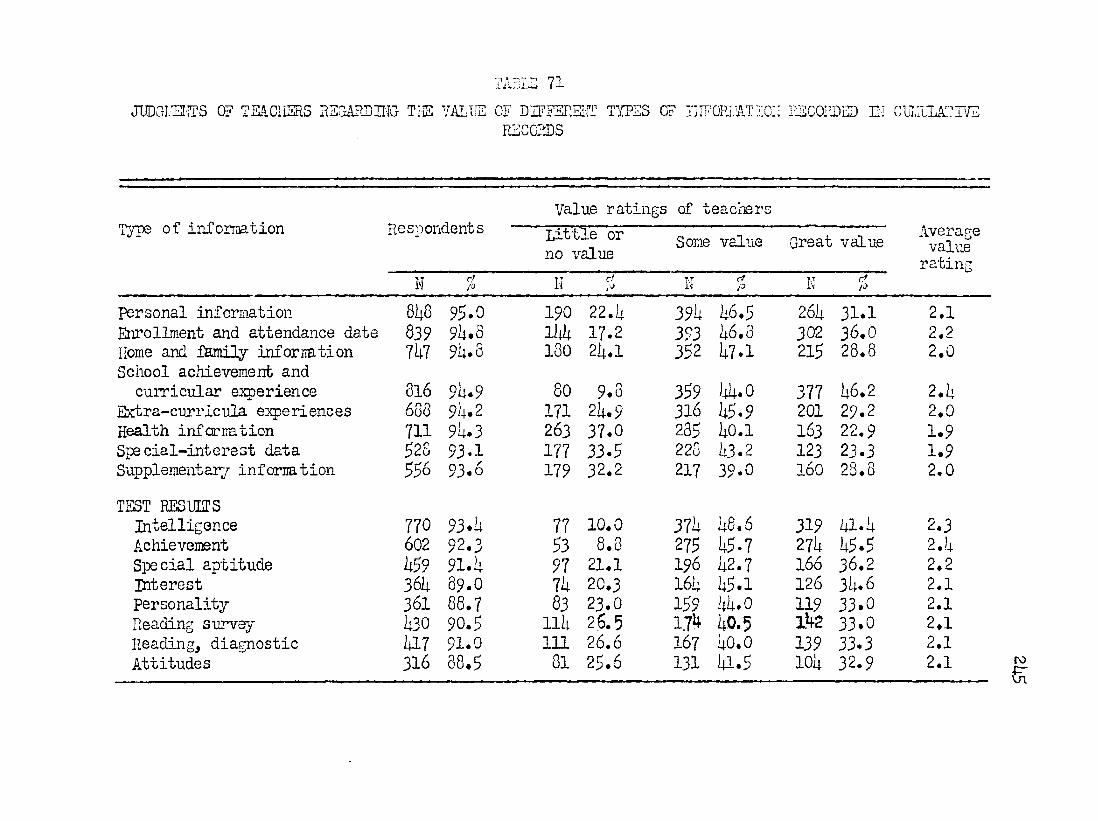
ta: 71JUDCtL O T S of TEA.GIIERS AFGARDniG T IE VALLE OF DLFFEPEFT TYPES OF
RFCCEDSIiIFORl.ATIOi: PECORDED B CUI,:ULATIVE
Value ratings of teacrersTyp® of iniorraation Respondents Little or
no value Some value Great value Averagevaluerating
N % K 0' N cfP K Ct
personal information 8it8 95.0 190 22 .4 394 46.5 264 31.1 2 .1Enrollment and attendance date 839 9b.8 114: 17.2 393 46.8 302 36 .0 2.2Home and famiiy inform ti on Ihl 9li*3 180 24.1 352 47.1 215 28.8 2.0School achievement andcurricular experience 816 9L.9 80 9.3 359 44.0 377 46.2 2.4
Ertra-curricula experiences 688 91.2 171 24.9 316 45.9 201 29.2 2.0Health informtion 711 91.3 263 37.0 285 40.1 163 22.9 1.9Special-interest data 28 93 .1 177 33.5 228 43.2 123 23.3 1.9Supplementary inform tion 93.6 179 32.2 217 39.0 160 28.8 2.0TEST RESULTSIntelligence 770 93.h 77 10.0 374 48,6 319 41.4 2.3Aciiieveimnt 602 92.3 53 8.8 275 45.7 274 45.5 2.4Special aptitude 1:59 91.1: 97 21.1 196 42.7 166 36.2 2.2Interest 36L 89.0 74 20.3 164 45.1 126 34 .6 2.1personality 361 88.7 83 23.0 159 44.0 119 33.0 2.1Reading survny 1:30 90.5 nil 25.5 1.74 40.5 142 33.0 2.1Reading, diagnostic I4I7 91.0 111 26.6 167 40 .0 139 33.3 2.1Attitudes 316 88.5 81 25 .6 131 41.5 104 32.9 2.1 ro
61

2hô
tables. These differences appear plausible since 35 per cent of the teachers do not use cumulative records, but may be engaged in collecting or recording data, and consider the infonaation obtained ill the process of value to thean.
The average value ratings for types of information recorded in cumulative records for different classifications of teachers are included in ApgendixD. Among the classifications tvYo types of differences are revealed: (1) older teachers rate the value of all tj.'pes of information somewhat higher tiian do younger teachers, and(2) ratings by teachers according to subject areas vary to some extent but not as greatly as for the methods and tecimiques of evaluation used. With respect to the first difference, it also appears in the classifications according to professional training and e'Ç)erience since these two characteristics are both apparently related to age. The second type of difference, that among the various subject areas, appears to be related to some e^ctent to the relevance of a given tj'pe of information to particular subject areas, as for exanple the high ratings for achievement test results by teaciiers of mathematics, science, and English. Conversely, some of the ratings cannot be explained on this basis as may be noted for art and home economics teachers who also rate achievement test results high. This variation may be caused by differences in the adequacy of records if this is related to the extensiveness of curricular offerings or to the importance generally attached to certain types of information in particular schools. Essentially, however, the basis for these differences remains obscure and is

2U7sommyhat unusual as coirrpared with, the consistencjr of other data in this study.
The preferences of teachers regarding administration and the availability of tlTB results of standardized tests are included in this section since they are essentially an expression of opinion ratl er than a report of a practice employed. These data are presented in summar^^ form in Table 72. Since they do not differ appreciably from the responses of teachers to similar questions regarding actual practice which were presented in Chapter TV, additional discussion seems to be unnecessary. Apparentlj'- they reflect general satisfaction with prevailing conditions.
TABLE 7 2
I'RJlvEBER Aim ESR CENT OF TEACHERS INDICATBD CERTAIN PREFERENCES JM THE ADPUNISTRATIQN OF STANDARDIZED TESTS
Preference Respondents Teachers indicating preference
N % N
Test be administered by teacher 3U0 95.0 251 73.8
Results of tests be available to teacher 338 9U-U 33k 98.8
Scored test forms for each pupil be available to teacher 328 91.2 318 97.0
Teachers 1 judgments regarding the extent to which they^ the parents^ and pupils are satisfied with the types of reporting used

2U8vrere also requested. Inasmuch as types of reporting other than report cards are rarely -used, detailed data are not presented.The suiuJiBi " of the responses of teachers to these three items is shCT-m in Table 73. Only sliglrt variations appeared in an analysis of responses by classifications of teachers; a similar comparison
TABLE 73JiSDGilDNTS OF TEACHERS REGARDING THE EXTENT TO Y/IIIGH THETj PARENTS,
A ® PUPIIS ARE SATISFIELD WZTH THE TYPES OF REPORTING USED
Respondents Notsatisfied
partiallysatisfied Satisfied
N % N % N % N iTeachers 909 98.7 152 1 6 .7 U.96 261 28.7Parents 86L 93.8 31 3 .6 290 3 3 .6 5U3 62.8Pupils 882 95.8 30 3.U 311 3 5 .3 5ÜL 6 1 .3
of the responses of teachers who had indicated "five point grading only" with those who reported "five-point grading and pupil traits" also differed only sliglibly. These data indicate that more teachers are less satisfied with the reporting system than they believe parents and pupils to be.
In the last item on the inquiry, teachers were asked to indicate the factors that they believed were preventing satisfactory evaluation if they were not fully satisfied with the evaluation of pupil progress

2h9
in their schools. Eighty-five per cent responded to this item Tmich suggests that there is a widespread belief among teachers tiiat evaluation is not entirely adequate. The frequency of mention of the different factors is shown in Table "lack oftime" was checked ty more than 75 per cent of the respondents;"lack of useful techniques and instruments" and "lack of special personnel" were mentioned by a little over one-third of the respondents and "lack of finances" by slightly more than 25 per cent. The importance of the first of these factors could be anticipated since a chronic problem in teaching is finding adequate time. On the other hand, the evidence in this study does not indicate very strongly that evaluation is as well integrated iito the teaching-learning situation as it might be. Many of the tecimiques rated highly as to use and value require great amounts of the teacher's time outside the class situation; also the participation of pupils in evaluation was not particularly emphasized in the different items concerned with that aspect.
Judgments of Principals
The responses of principals to a question concerning the adequacy of evaluation programs indicated that 71 per cent believed that programs are inadequate. The proportions were so ne what lovrer for city schools and junior-high schools. Only 53 per cent of junior-high school principals stated that they believed their

TABLE 7UNUMBER AND PER CEITT OF TEACHERS B]DICAT3'D VARIOUS FACTORS MIGHITHEI BELIEVE ARE PREVENTBD
' SATISFACTORY EVALUATION OF'PUPIL PROGRESS
Factor City Exemptedvillage Local Total
N cf N % N % N %Lack of finances 100 23.7 - 20 29.9 93 31.5 213 27.2Lack of time 3S6 79.6 51 80.6 215 72.9 605 77.2Lack of administrative assistance 83 19.7 19 28.L 77 26.1 179 22.8
Lack of useful techniques and instruments 128 30.3 29 lt3.3 128 it3.U 285 36.I;
Lack of special personnel 135 3 2 .0 26 33.6 121; 12 .0 285 36.1+Lack of loiOTfledge of how to
obtain and use tests and instruments 61 11.5 17 25.U 58 19.7 136 17.3
Glasses too large 16 3.8 h 6 .0 3 1 .0 23 2 .9Other 15 3.6 1 1.5 12 k.l 28 3 .6
Number and per cent of respondents 1 22 81.0 67 89.3 295 90.8 781+ 85.1
roV J T .o

251programs of evaluation are inadequate, but this percentage is based on a relatively small number of cases. The responses of principals are summarized in Table 75 by t} )es of schools.
TABLE 75NIJILER AhD PER CENT OF HIINCIPAIE IMDICATIHG THAT THEY BELIEVE
THE EVALUA.TIGN HÎ0GRAI.5S H'l THEIR SCHOOLS ARE imDEQHATE
Classification of principals Respondents Principals indicating they
believe programs are inadequateN % N %All respondents 137 93.8 lOh 71.2
Cities and exempted village schools 50 92.6 31 62.0Local schools 88 95.7 73 03.0junior-high schools 19 95.0 10 5 2 .6
High schools and senior- high schools 35 92.1 27 77.1
Six-year high schools 8U 9U.3 67 79.8
Thus, a large majority of principals as vrell as teachers believe that evaluation is not entirely satisfactory. This dissatisfaction was expressed with reference to programs of evaluation as defined in this stuc^ and does not, therefore, reflect the opinions of principals regarding the practices of teachers. Since great variation was apparent among schools with respect to programs of evaluation, tlxLs expression of inadequacy is not surprising, fn this connection, it is to be noted that variation

252in practices among teachers is not necessarily undesirable or an indication of inadequacy^ but tliat the tremendous variation found among schools ivith respect to programs of evaluation must necessarily imply inadequacy to some extent if it is assumed that a testing program, in-service training, specialised personnel, and so on are important in an educational program. This conclusion with respect to variation among programs does not apply to reporting pupil progress, wloich it was revealed consisted almost entirely of report cards, but it does appear to be applicable to other aspects included in tlie principals» inquiry.
Trie factors considered by principals to be preventing the development of an adequate evaluation program are presented in Table ?6. The three factors reported most frequently (by about 50 per cent of principals in each instance) are "lack of finances," "lack of time," and "lack of personnel qualified to develop the evaluation program." Local-district school principals reported lack of qualified personnel much more frequently than did those in city schools. This difference is to be anticipated since local schools rarely have specialized guidance personnel and generally have staffs with less training and experience. Lack of time is not reflected as a factor as frequently in the responses of principals as was noted for teachers, but it is still an important influence in the judgment of principals. Lack of finances may indicate a general difficulty encountered in the administration of many schools rather than a very definite in-

253adequacy with respect to evaluation. In this connection, lack of useful tecimiques and instruments is reported infrequently y/hile lack of qualified personnel is reported by nearly one-half of tiie principals. Both of these factors are presumably influenced by finances but are not reported to the same extent. The contention that tcacljers are concerned about evaluation stated in Chapter I is also supported by the data in Table 76 indicating tliat verjr few principals believe lack of interest of teachers is a factor preventing development of an adequate evaluation program.
The third item regarding judgments of principals concerns the status of different methods of reporting. This item did not elicit responses from all principals as it was presumed it would, but largely from those reporting the use of a given method of reporting. The responses of those principals reporting their judgments are shovm in Table 77. Although an assumption, this situation suggests that most principals have no definite intention of introducing other forms of reporting tiian those now being used. About one-third of the principals indicated that they intend to modify or improve methods now being used, and most of the remainder of the principals indicated that they intend to retain the methods being used in their present form.

TABLE 76NUMBEE AMD PER CEMT OF KIHCIPALS HffilCATIIC VARIOUS FACTŒS V/HICH THEY BELIEVE ARE BEVEHTIHG
DEVSLOHOT OF AH ADEQUATE EVALUATIOH PROGRAIi
FactorsCity and exempted Local
Senior-high, junior- four and five- Six-year All
village high year high high respondentsH-53 V H-90 % N-20 % M-3Ü % IMS % H-lii3 %
Lack of finances 23 k3>h S3 S8.9 7 35.0 22 S7.9 17 SS.3 76 53.1Lack of time 19 3S.8 S3 S8.9 h 20.0 18 ii7.it SO S8..8 72 SO.3Lack of interest of teachersin evaluation 3 S.7 8 8.9 2 10 .0 2 S.3 7 8.2 11 7 . 7Lack of useful techniques andinstruments 8 15.1 2h 26.7 2 10 .0 8 21.1 22 25.9 32 22.ilLack of knovfledge of havr toobtain and use existing testsand instrunKsnts 3 S.7 9 10.0 1 S.c 2 S.3 9 10.6 12 B.iiLack of personnel qualified todevelop the evaluation program 16 30.2 S 29.0 lit 36.8 it? SS.3 66 ii6.2Other 3 S .7 3 3.3 0 2 S.3 it it. 7 6 i|.2
Humber and per cent of resoondentsS3 98 .1 90 100.0 20 100.0 33 100.0 85 96.6 lii3 97.9
rovnp-

TABLE 77
STATUS OF DIFFERSIjT LET HODS OF REPORTIIÎG TO PAREHTS AS IliDICATED BY SCHOOL FRINCIPALS-SÜÎ.LAHYALL TYPES OF SCHOOLS
Status
Method of reporting RespondentsIntend to introduce
Intend to discard
mtend to modify or improve
Yh'tehd to retain in present form
uo hot intend to use
N ^ IÎ r) N ^ N % K % L ^Report cards 131 89.7 1 ( 8 51 33.9 79 60,3
Written progress reports 32 21.9 3 9»h 10 31.3 9 28.1 10 31.3
Conferences -vvith parents m 38.1 10 2k* h 17 W..5 12 29.3 2 h.9
V avri

CHA.FTER VII
SUlvIIAJlY, CONCLUSIONS, AND RECŒ.3.ZNDATI0NS
Tlie data presented in Chapters III, r/, V; and VI, consisting of information from authorities in evaluation, from secondary- school teachers, and from secondaxy-school principals, are suinmarized in this chapter. The judgments of authorities regarding principles of evalua.tion are summarized briefly in the first paragraph of the
more complete description of the responses of authorities in evaluation appears in the last section of Chapter III.Tiie findings vri-th respect to information from teachers and principals are grouped in broad, general classifications and are discussed in relation to the principles of evaluation accepted in the study. The purpose of tills summary is to establish in a general way the relative effectiveness of the different principles of evaluation of pupil progress in Ohio secondary schools. On].y the most pertinent data that appear to be directly related to each principle arc used. Many, if not aU., of the different types of information may be related in some way to each principle. Sucii more indirect or subtle relationships, hoi'iever, could be inferred or substantiated only by observation or participation by the investigator in each of the educational programs which are represented by the responses of participants in this study. Consequently, in the treatment in this chapter, only tlis data that are apparently relevant are used. While this method cannot be exliaustive or detailed, it provides a summary of broad scope indicating the status of

257evaluation in terms of principles.
Summary of the Status of Principles. Practices. and Programs of Evaluation
In theory, the principles of evaluation used in this study are widely accepted as indicated hy the responses of authorities in evaluation. Principles dealing with (l) co-operation in evaluation, (2) gathering evidence on all aspects of growth, (3) subjective judgment and objective appraisal, (4) individual differences, and (5) guidance as the primary purpose of evaluation elicited most disagreement and criticism. The bases of disagreement in most cases were ambiguity of the statement of principle, the all-inclusive nature of some statements, and doubt that a primary purpose of evaluation could be established. Generally, agreement appears to exist at the abstract level, but disagreement arises in the meaning of evaluation in a specific context or area,
Princiole— Evaluâtion of the growth or progress of individuals should be conducted in terms of purposes or objectives established in a clear and understandable fashion.
The study of objectives for the entire school was reported by about one-third of the teachers participating in this study and by nearly 40 per cent for study of objectives in subject areas. These data indicate that an organized or formal study of objectives is not conducted to any great extent. While it may not be necessary

2$6
to study or re-examine obj ectlves eveiy year because education ultimately consists of generally accepted purposes that are applicable in many different communities, such things as changing conditions, changes in staff personnel, and the need to clarify objectives on the basis of past experience suggest that this practice is not as common as is desirable in view of the key importance of the principle of establishing objectives.
This conclusion is further suppoited by the indication by teachers that objectives for their teaching are formulated in a laige variety of ways, that factors other than specific pupil behaviors are slightly more dominant in establishing objectives, and that over 30 per cent of the teadiers do not establish objectives in terms of specific behaviors. Other related facts bearing on the effectiveness of study of objectives are that fewer than one-half of the teachers reported any study of ways to evaluate progress who had indicated study of objectives in subject areas, that in-service training in philosofdiy of evaluation for a three-year period is reported by only 13 per cent of school principals, and that most of the relatively small percentage of teachers reporting that a study of ways to evaluate objectives had been made indicated that such study had at least "some" value. The last of these related facts indicates that the study of objectives and means of evaluation in relation to each other is recognized by teachers as valuable, but that this practice is not very widespread.
An attempt is apparently made by a majority of teachers individually to apply the principle. Organized study directed

259tavard integrating the various activities or functions of the school tlirough a study of objectives of broader scope is not regularly conducted extensively and is of widely differing quality and scope as revealed by the related facts discussed above.
principle — Evaluâtion should be a co-operative undertaking of all persons concerned with or affected by the evaluation.
In contrast to the conditions prevailing with respect to the principle concerning objectives, the conditions requiring or encouraging co-operation ane generally functional among different types of staff personnel whenever studj^ of objectives of a broader type than those rsed for the immediate class situation is undertaken. Thus, in this connection, this principle seems to be operative in the stucfy- of objectives when undertaken, but it is limited by the fact that the practice of studying objectives is reported by fewer than one-half of the teachers.
A more apparent wealmess in realizing the principle of cooperation is evident in all those aspects of evaluation and related activities dealing Trith the study of ways to eva].uate, pupil participation in formulating objectives and in determining ways to evaluate, selection of the methods of reporting, and the administration of standardised tests. Data in this stu<^ relating to these various practices indicate that fewer than one-half of the teachers reported participation or involvement in most of these practices. The strongest point with respect to these practices is that concerned

260w ith p a r t i c i p a t i o n b y p u p i l s i n h e l p i n g t o p l a n W ia t th e y w i l l do
i n c l a s s . T h i s p r a c t i c e i s r e p o r t e d b y n e a r l y 60 p e r c e n t o f
t e a c h e r s , b u t e v e n w i t h r e s p e c t t o i t , t h e m a j o r i t y o f r e s p o n d e n t s
i n d i c a t e d t h a t t h i s i s done t o "som e" e x t e n t . R e g a rd in g t h e r e a l i z a
t i o n o f t h i s p r i n c i p l e i n t h e f o r m u l a t i o n o f o b j e c t i v e s a n d d e t e r
m in in g t h e m eans o f e v a l u a t i n g p r o g r e s s to w a r d o b j e c t i v e s , t h e d a t a
i n d i c a t e t h a t t h e c o - o p e r a t i v e a p p r o a c h i s m uch m ore l i k e l y t o b e
u se d i n s u b j e c t a r e a s w h ic h do n o t h a v e a w e l l - d e f i n e d c o n t e n t .
The implication of these findings points to a need for definite planning designed to promote co-operation. Since it is also indicated that co-operation is much more frequently reported in subject areas that are less likely to have a traditional content, co-operation may depend on the development of a concept of the interrelatedness of establishing objectives and determining means to evaluate objectives.
Principle— The process of evaluating the growth or progress of individuals should have continuity.
The effect of the principle of continuity in one respect is nearly inevitable since evaluation is integrally related to experience as was noted in Chapter III. The responses of teachers indicate the validity of this premise and an awareness on tlie part of teachers that such continuity is essential in evaluation* Observation, discussion, and informal conversation generally rate high in frequency of mention, extent of use, and value for purposes

261of e v a l - u a t io n . The p r e v a l e n c e o f t h e s e t e c h n i q u e s a n d a c t i v i t i e s
p ro v id e s o p p o r t u n i t i e s f o r t lx i s t y p e o f c o n b in u i ty *
The e x t e n t t o v riiich p u p i l s a r e l e d t o r e c o g n i t i o n o r r e a l i z a
t i o n o f t h i s p r i n c i p l e i s c o n s id e r a b l y l e s s t h a n t h e a c h ie v e m e n t o f
i t by t e a c h e r s . T h is p r e s u m a b ly i s r e f l e c t e d i n t h e r e s p o n s e s o f
t e a c h e r s i n d i c a t i n g t h a t p u p i l s do n o t h a v e a p a r t i c u l a r l y im p o r ta n t
r o le i n d e te r m in in g t h e m eans o f e v a l u a t i o n i n r e l a t i o n t o im m e d ia te
o b j e c t iv e s i n t h e c l a s s s i t u a t i o n .
The second aspect of continuity^ involving the use of techniques for obtaining data, the use of cumulative records, and the methods of reporting, all of which are adaptable to attaining continuity over longer periods of time and designed primarily to extend continuity, is probably achieved in lesser degree than the more immediate type of continuity. This is most evident from the data indicating that about 50 per cent of teachers believe cumulative records have little or no value, tliat in 60 per cent of tiie schools a transcript of grades only is requested for pupils transferring from other system, that standardized tests are •used much more frequently by teachers in higher grades than in tlie first years of the secondary—school program, and that reporting to parents is done largely ty use of report cards which in almost two-tliirds of the sdiools include only subject grades or ratings and attendance data.
W ith r e f e r e n c e t o c o n t i n u i t y t h e c o n c lu s io n seem s w a r ra n t ,e d
t h a t t e a c h e r s r e c o g n iz e i t s im p o r ta n c e i n a s h o r t - t e r m s e n s e b u t
do n o t r e a l i z e i t o v e r l o n g e r p e r i o d s o f t i m e , t h a t p ro g ra m s o f

26'evaluation in schools are oriented more toward determining outcomes at the end of the school program rather than throughout the program, and that records in many cases eventually become fragment aiy because no plan exists to obtain data for transfer students other than subject grades or ratings. There is also some evidence suggesting that pupils are not given the opportunity to realize continuity by participating in establishing objectives. This conclusion may also be elaborated to include the contrast between teachers* recognition of continuity and the realization of it by pupils through participation in evaluation.
Principle— m evaluation, evidence should be gathered concerning all aspects of the growth or progress of individuals.
For til is principle as for the one concerning continuity, the data of this study indicate a schism or tendency toward separation between the practices of teachers and the over-all program of evaluation. The emphasis on observation, discussion, informal personal relationsliips, and appraisal of achievements of pupils contrasted with the differing degrees of adequacy with which teachers believe they are able to evaluate pupil progress suggests that most teachers recognize the need to consider vai’ious aspects of development, but that the adequacy vrith which they are able to evaluate is conditioned in part by inadequacies in the total program, by limitations in techniques in certain areas, and by failure to use important specific sources and techniques, pn this

263connection, it was noted that teachers rated adequacy of evaluation of subject acliieveraent higher than all other factors, and that about one-tenth of the teachers indicated they did not evaluate personal-social adjustment or health at all. Consequently, a small minority of teachers apparently have a veiy limited concept of evaluation, but the general conclusion that most teachers recognize the need to consider various aspects of development otherwise seems tenable. Hcwever, in contrast vfith the practices most frequently reported and generally valued most highly, a number of factors regarding the program of evaluation indicate that inadequacies stem from a lack of a balanced program as wel 1 as from certain inabilities of teachers. The predominance of achievement and intelligence tests in the testing program, tlie great variation in the administration of tests relative to the number of grades in which given, tiie time of year wlien administered, and tiie low percentage of teachers administering the tests are factors that appear as hindrances in this phase of the program of evaluation. Additional factors in the program that Imve adverse effects are the lack of specialized personnel with guidance functions, erratic physical examinations or complete lack of them, and considerable variation in the types of information recorded in cumulative records.
The indication by teachers that guidance services are used by them largely to assist maladjusted pupils and those low in achievement suggests a limitation of the services as well as an

26Uincomplete use of them. The facts that only about 50 per cent of tiie teachers use cumulative records and that such records are not considered particularly valuable also appear to be limitations on the part of teachers to extend the application of this principle.
Other factors, such as the predominant practice of basing school marks on a complex of factors, the general limitation in reporting to include only marks and attendance, and the discrepancy between the smaller number of teachers reporting use of cumulative records and the larger number indicating that the different types of information have some value are indications of contradictions and lack of integration between practices and program. This distinction and division appear at a number of points, individuals seem to be attempting to follow the principle, but the over-all program is not integrated to assist in achieving it.
Pi-'inciple— Evaluation should be an integral part of the teaching-learning process.
In the summary for the principles v/hich dealt with establishing objectives and with continuity, it ivas concluded that most teachers are attempting to realize these tvfo principles in practice. However, it was also noted that such efforts as apparently are made are more effective tovcard directing the teaciier than toward assisting the individual pupil in developing an integrative learning experience tnrough participation in evaluation as -well as in deciding on immediate objectives in the class situation. With respect to
j this principle, these conditions indicate that at best the principle

26$is only partially realized since about UO per cent of tlie teachers indicated "little" or "none" for pupil participation in deciding on iirmediate objectives and -even larger percentages responded in these categories for the items dealing with pupil participation in evaluation. The data indicating that discussion of varL ous aspects of school work is a much more common and extensive practice are factors tending to ameliorate the conclusion. Such discussion, however, implies a considerable element of an incidental character, and the planned aspect of pupil participation, therefore, is of a rather dubious extent.
Other factors related to this principle and indicating generally that it is not too well realized are* (1) practices in the adninistration of standardized tests, (2) the frequency of indication ty teaciiers that they liave insufficient time for satisfactory evaluation, and (3) the indication by school principals that some tests, particulariser personality and aciiievement, may be misused and that others such as intelligence tests are used in only one- half of the schools in planning classroom instruction.
principle— Because of ccmplexity of the evaluation process, a variety of techniques, instruments, and methods should be used to secure adequate evidence of the grovrth or progress of individuals*
Data concerning the extent of use and the value of 3U different methods or techniques of evaluation indicated that teachers generally use a number of different means in evaluating pupil progress and tiat great variation exists in the combinations of

266techniques used by different teachers. However, a more careful studyof the techniques listed in Table 18 also shows that those reported most frequently could be classified as observation, discussion, informal conversation, and examination or study of pupil achievements.It also seems evident from data in Table 19 that observational typos of techniques are predominantly used for aspects of development other than subject achievement and that teachers believe that subject achievment is evaluated somewhat more adequately as shown in Table 69. These differences and the limited use as well as lower value ratings for a large number of other techniques suggest that this principle is functional in the area of subject achievement, but that its effects for other aspects of development are limited to a relatively small number of teachers and that these teachers do not believe that these other types of techniques are of very great value.In some subject areas, particularly special subjects such as art and music, many teachers appear to rely on a small number of techniques.
Testing practices of teachers appear to involve the use of a variety of types of classroom tests, but the testing program of most schools is limited largely to intelligence and achievement tests. The status of cumulative records is somevdiat the converse of that for testing. Records appear to contain a considerable variety of information but are not too extensively used by teachers.In addition to these conditions, the use of guidance services for remedial purposes and the limited and erratic use of physical examinations should be considered with respect to this principle.

267These different t T es of data point to an effort on the part
of teachers to use a variety of techniques which is limited, however, to subject achievement to a large extent. The limited application of this principle is evident in part from the data regarding the use and value of different tj'pes of techniques and is supported by the belief by teachers that other aspects of development are not evaluated as adequately as subject achievement. Tho evidence with respect to programs of evaluation indicates that they are limited in extent, but that teachers in many cases do not use or have not been able to use effectively the information provided by the program.
principle— Insofar as possible evaluation should be a planned process.
Most of the data in this study that re Date to this piûnciple are the responses of school principals regai’ding tlie program of evaluation. Some evidence in the responses of teachers tends to shoiv that planning ty group or co-operative methods is not done by many teachers. The extent of the study of objectives and of pupil participation in planning evaluation are the major points substantiating this conclusion. To determine whether teachers individually plan evaluation is probably impossible except from extensive observation.
Data from that part of tiie study concerning programs of evaluation are rather variable. Many schools apparently have a

268definitely planned testing program, while others have an indefinite scheme of administering tests. Recording and reporting are a,:parently planned although the adequacy of these parts of the program, may be questionable in many cases, in-service training is generally conducted by means requiring planning. Conversely, records in most schools must become gradually more incomplete for each class as it progresses through the school program because records, except for transcripts of grades, are not available for transfer pupils in many schools. Formulating or establisiiing objectives for the entire school may also be considered inadequate largely because of the complete absence of activity in this area in a majority of schools.
The general impression is one of planning which has not been G)ctended adequately in scope— teachers have not involved pupils and schools have not involi^ed teachers extensively so as to peimit development of integrated planning.
Brinciple— Evaluation should include both subjective Judgment and objective appraisal.
In the elaboration of the principles of evaluation it was observed that subjective Judgment was inherent in education, but that objective data providing for impartial appraisal were also needed. Subjective Judgment as a factor ±r\ evaluation is revealed at a number of points in this study. That such Judgment has a significant role in evaluation is supported by the emphasis given

269by teachers to observation, discussion, and conversation; it is also evident in the practice of attempting to base maries on a complex of factors. The - belief that subject achievement is more adequately evaluated tiian other aspects of development, although the latter are more frequently evaluated by observation only, tends to discredit the value of subjective judgment, and also suggests that teachers may exercise subjective judgment more in respect to subject achievement than for other aspects of gravtli. However, subjective judgment apparently is important for all of 'the different aspects of growth, and inadequacy or ineffectiveness in certain aspects be caused by the difficulty of kno\'/ing the significance of behavior or information. That tj,npe of subjective judgment involving the expression of individual interests, purposes, or values is apparently not as well provided for as suggested by rather limited participation by pupils in evaluation.
Objective appraisal, as indicated by the data of this study, is not as prominent as might be supposed unless the tendency to empiiasiae subject achievement were to be considered evidence of objective appraisal. This interpretation is not placed on the term "objective" in this study and is, moreover, not indicated as valid in the light of the practices reported by teachers. The rather mediocre position of objective types of appraisal is indicated by only moderate to infrequent use of standardised tests and instruments designed to objectify information, the moderate value ratings by teachers for standardized tests, and the specialized

270uses of tiieüi such as survey^ counseling^ and diagnosis. The general indication is tiiat objective appraisal has a supplementary role in evaluation.
principle— Evaluation should talie into account differences ' among individuals being evaluated.
Conclusions m t h reference to tiiis principle are of necessity derived from an ovei'vievf or summary of many types of data already discussed. The interrelatedness of data with reference to different principles is inescapable as is evident in the preceding discussion of otJier principles. Consequently^ dichotomous, contradictory, or paradoxical conditions ivill tend to reappear at various points.Thus, apparently teachers use a considerable variety of techniques in evaluation which suggests some consideration of individual differences; nevertheless, pupil participation in planning evaluation is not as evident and apparently is somerwhat incidental as noted previously in the discussion of the extent to which pupils discuss various aspects of their school work in the summary for the principle dealing with integration of evaluation in the teaching- learning process. The ratîier limited use of cumulative records and teciiniques related to personal interests and social development also indicate a limitation in the consideration of individual differences. Contrari-wise, the responses of teachers showing that a large majority attempt to include a number of factors in school marks suggest that individ-ual differences are considered, but in

271a submerged fashion that may be confusing rather than diagnostic and consequently may not be very helpful. Testing practices and the testing program are apparently used in most instances to contribute to a knowledge of individual differences. The greatest wealmesses are a rather evident negative approach in the purposes for -ïdiich tests are used in the classroom and the limited number of teachers administering standardized tests which may affect the validity of results adversely.
Principle— Evaluation should include a consideration ofboth the beginning status and growth or progress of individuals.
The techniques and methods used by teachers provide many opportunities for teachers to determine the status of pupils at different times as may be necessary. While there is an indication that in the use of the techniques and methods achievement may be over-emphasized, conditions in this respect may be characterized as fairly adequate.
Probably the greatest insuiequacies revealed in the practices of teachers are the rather insignificant role of cumulative records and the absence of pupil participation in evaluation. Use of records and pupil participation could assist materially in making this principle more effective. The indication that only 30 per cent of teachers assign marks for achievarœnt according to ability is a secondary iype of inadequacy, but this is a controversial type of practice and as evidence is probably more relevant to the difficulty
272in education generally to ascertain and reflect beginning status in school marks.
Tlie outstanding wealuiesses as with reference to several other ■jrinciples^ particularly continuity and planning in evaluation, are the numerous inadequate testing programs, the tendency to administer tests more frequently in the last years of the educational program, the scheduling of many tests toward the close of the school year, the failure to obtain a coinplete record for transfer pupils, and tlie liuiitations of reports to parents consisting of marks and attendance only.
principle— Individuals should be given assistance in developing the ability to evaluate their o v t o progress or grov'rth.
A summaiy for this principle is in effect included in discussions of other principles above. Certain outstanding facts are, therefore, recapitulated only briefly. There is little evidence of encouraging planned self-evaluation, but numerous opportunities appear to exist for incidental self-evaluation. The practices of teachers in the use of classroom tests are apparently often directed tcn-rard assisting pupils in self-evaluation in the subject achievement aspect of evaluation. The techniques used by teachers are sufficiently varied to possibly compensate to a certain e>rbent for lack of planning, but such compensation is necessarily limited and cannot be a substitute for planning.

273principle— ZDi evaluatiorij all available evidence should
be used for the diagnosis of tte growbh or progress of each individual.
It is obviously impossible to substantiate vÈiether evidence or information regarding pupils is being used for the diagnosis of the progress of individuals. Data concerning the practices of teachers in the classroom dealing m t h techniques, establishing objectives, testing practices, and the rather infrequent and cautious use of the normal distribution in the assignment of marks indicate tlst teachers attempt to diagnose the progress of pupils. Differences in adequacy ratings for various aspects of progress, homver, also suggest that diagnosis is moi’e effectively accomplished in subject acliievement than for other aspects of development. Consequently, the extent and validity of diagnosis in mai%y cases are questionable. The data with respect to programs of evaluation indicate that teachers must necessarily rely on their OT/n abilities, initiative, and resources for diagnosis. Testing programs, records, pi%rsical examinations, and guidance services are limited in many schools and the last two are often not available*
Principle— The results of evaluation should be used inplanning future teaching-learning activities.
The practices of teachers that have thus far been summarized in relation to principles suggest tiiat the use of evaluation in planning for future teaching-learning activities is probably more incidental in nature rather than deliberate. Teaciiers tlie ms elves use teciiniques tiiat uill permit planning for future activities.

27 k
IJOTever, the data available in this study also indicate that the planning that is done must be based largely on the techniques used by teachers in the.classroom situation and that it is generally conducted by them individually. Planning of a scope extending beyond the class situation is not reported extensively and frequently does not include consideration of the means of evaluating* For pupil participation conditions are similar to that found in planning of a broader scope, interests and purposes of pupils^ therefore^ in mary cases can only be revealed incidentally. The practices of teachers in the use of classroom tests indicate that planning for future activities is an important factor, but that it tends to be short-term planning by most teachers for remedial piuposes. Standardized tests are not used as e:ctensively as classroom tests in planning instruction, and cumulative records appear to be of mediocre importance to many teachers. The effectiveness of this principle is comparable to tiiat found for the principle dealing with continuity and may be characterized as limited largely to short-range planning conducted by teachers.
Principle— Evaluation should have guidance of the individual as its primary purpose.
This principle as stated is the crux of evaluation according to the concept developed in this study. Therefore, all data and conclusions discussed under other principles are related to this principle concerning guidance. In reality, all of the principles

275above may be applied to guidance. Consequently^ certain out- staaiding generalizations that appear at various points in earlier discussion are repeated here in an attempt to provide a general description of the status of guidance.
Specialized guidance services are quite limited in most schools in which they are provided at all. The majority of schools do nob liave such services in any form; tiiis condition arises from tlie large proportion of local schools in which no guidance services are provided. Consequentlyj guidance is largely the responsibility of teachers, administrators, and supeivisorj'- personnel. The guidance functions of teachers are limited in scope because other aspects of development such as interests, attitudes, personal-social adjustment, ard health are not evaluated as effectively as subject achievement. Guidance also apparently is based largely on the judgment of teachers established tiirough direct e:<perience and personal observation; recorded and objective types of data are not greatly in evidence in the program of evaluation except for subject achievement. There is, tin ref ore, a strong tendency toward short-term guidance. From data regarding the program of evaluation it also appears that guidance is emphasized for pupils having some type of difficulty in the school program.
General Summary
The findings of this study with respect to principles of evaluation and evaluation in the secondary schools of Ohio are
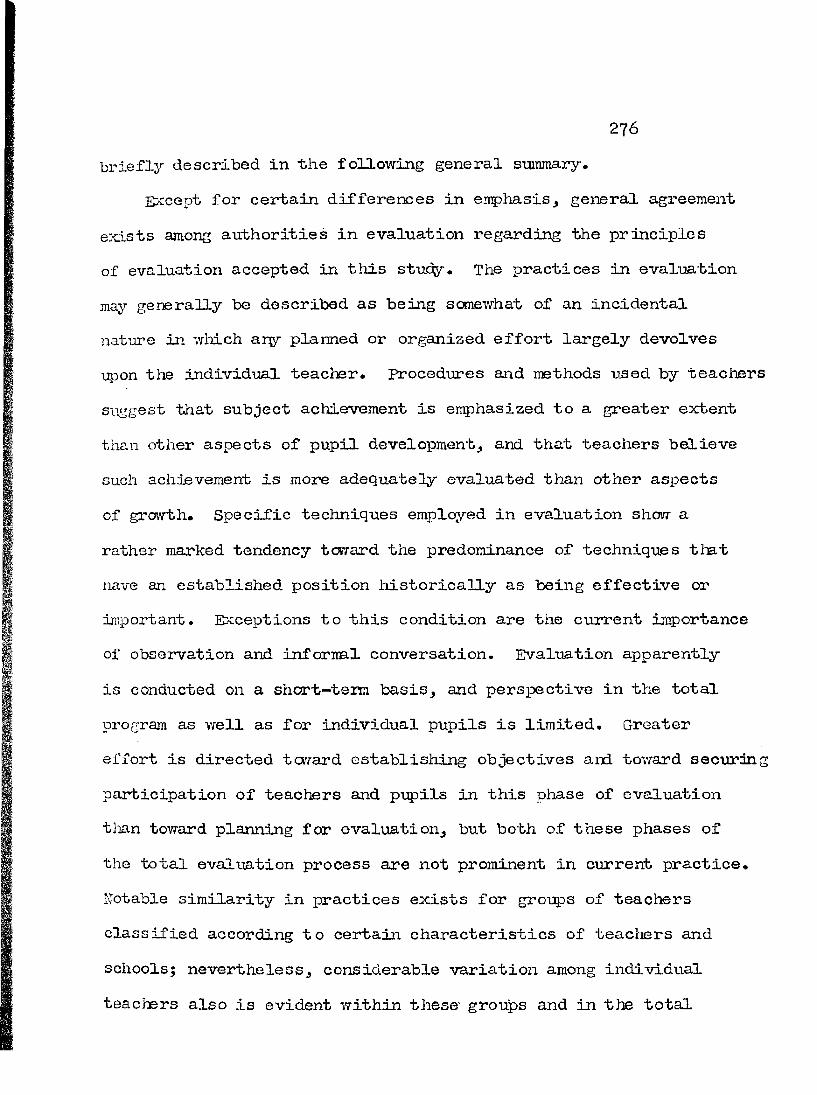
276briefly described in the following general snmmary.
Except for certain differences in emphasisj general agreement exists among authorities in evaluation regarding the principles of evaluation accepted in this stucty. The practices in evaluation may generally be described as being somewhat of an incidental natijre in which ary planned or organized effort largely devolves upon tlie individual teacher. Procedures and methods used by teachers suggest that subject achievement is emphasized to a greater extent than other aspects of pupil development, and that teachers believe such achievement is more adequately evaluated than other aspects of growth. Specific techniques employed in evaluation show a rather marked tendency tovrard the predominance of techniques tlmt nave an established position liistorically as being effective or inport ant. Exceptions to this condition are the current importance of observation and informal conversation. Evaluation apparently is conducted on a shoct-tem basis, and perspective in the total program as well as for individual pupils is limited. Greater effort is directed tcvj-ard establishing objectives and toward securing participation of teachers and pupils in this phase of evaluation tlmn tovrard planning for evaluation, but both of these phases of the total evaluation process are not prominent in current practice. Notable similarity in practices exists for groups of teachers classified according to certain characteristics of teachers and schools; nevertheless, considerable variation among individual teachers also is evident within these groups and in the total

277sGüaple of teachers^ greatest variation for groups of teachers appears among the different subject areas* School-wide evaluation procedures and activities, defined in this study as "program" of evaluation, are extremely variable; cumulative records are probably the strongest element in the programs, but they are not used e:ctensively ty teaciiers and are not considered by teachers to be particularly valuable. The integration of the program of evaluation to serve an effective role for teachers in the classroom situation is also apparently a problem*
Conclusions
The analysis of data and the summaiy of the results of this survey appear to warrant a number of rather definite conclusions.In the summary in the preceding section the findings of the sttdy were discussed in relation explicitly to the principles of evaluation accepted in the study. The general conclusions which follow are based on one or more of the principles accepted, bub are stated so as to provide a general synthesis rather than an explicit statement ivith reference to a given principle of evaluation*
1* The principles of evaluation used in this study are widely accepted among authorities in evaluation.Greatest indecision and disagreement arise for principles dealing with co-operation, evaluating all aspects of

270gTOTvthj subjective judgment and objective appraisal, the use of all available evidence, and guidance as the primary purpose of evaluation. Explanations in free- response statements regarding disagreement and the tendency for about one-third of the authorities to rate each principle, except tlie one concerned with establishing objectives, as of only "some," or "little or no" importance suggest differences in emphasis rather than a fundamental question of the validity of the principle.
2, The practice of organized or formal study of objectivesis reported by only about one-third of the teachers, and is not as common as the importance of this phase of planning the educational program would justify or demand.
3* Whenever formal study of objectives is undertaken, itis usually conducted by some-type of committee approach.
U. Consideration of the means of evaluating pupil progresstovj-ard the achievement of objectives is not a prominent feature of school-wide planning, and pupils are not generally included in this piiase in the classroom situation.
5* Continuity in evaluation is limited to a large extentto tlie continuity that the teacher can maintain over relatively short periods of time for given pupils;

279continuity for pupils is limited because of tlie lack of their participation in planning.
6. Cumulative records are not serving effectively as aidsin evaluation for many teachers; teachers do not consider them particularly valuable; tie types of information recorded are limited in mary cases; and the completeness of the record systems tends to decrease as pupils progress through school.
7. Greater emphasis is given to subject or academic achievement than to other aspects of development; planning is apparently limited to a large extent to t’ne subject achievement aspect of development.
Q* The techniques used in evaluation consist to a large extent of means for evaluating subject achievement; effectiveness of the teciiniques particularly adapatable to evaluating a number of aspects of development appears to be limited for aspects other than subject achievement.
9» Techniques other than tests and wi'itten work of pupils that would provide some type of record for teachers are not used extensively.
10, Teachers do not evaluate other aspects of developmentsuch as interests, attitudes, personal-social adjustuBnt, work habits, and health as effectively as subject

280achievement •
11, A strong tendency toward short-term evaluation and guidance is indicated in the practices of teachers and in the schools' programs of evaluation.
12, Pupil self-evaluation is largely incidental to the practices of teachers and is dependent on the effectiveness with which teachers use the practices for this purpose.
13. Guidance and evaluation in most schools are determined by the individual teacher's concepts and must be conducted almost entirely by teachers acting independently of other staff members,
li|.. The information^ activities, and procedures of the evaluation program do not appear to support tlrie practices and needs of teachers in the classroom situation, fn part this is caused hy inadequacies in programs, but it is also indicated in the limited use of information and lack of participation of teachers in the program of evaluation.
15* Specialized guidance services are extremely limited,except for a few schools, and are not available in most schools.

281l6. Great variation exists in tlie evaluation programs of
different schools; intelligence and achievement tests are enphasized in testing programs; other types of test data are limited in most schools; practices in the administration of tests are frequently not facilitating the use of test results; cumulative records are perhaps the strongest feature of programs of evaluation; in- service trad.ning in evaluation is conducted rather infrequently; physical examinations are limited to a few schools.
17» Methods of reporting have not been improved or eacbended in most schools; in the majority of schools even report cards do not include information other tlian marks and attendance although some method of reporting pupil traits^ citizenship, or personal-social characteristics has been recommended by educators for many years.
13. Teachers apparently are interested and concerned about evaluation and are aware of inadequacies, but tie great variation in practices among individual teaciiers and among subject areas indicates a need to develop a balance in practices among teachers so that all aspects of development will be considered.

282Recommendations
The data presented in this studÿ' reviewed in relation to principles of eval-uation seem to warrant a number of suggestions and recommendations. Since the principles are ideals rather than criteria based on empirical evidence or the most common practice, such recommendations must of necessity be general rather than specific, Hcnirevor, the value of such suggestions may be eniiianced by the fact that they ivi.ll serve as guides to indicate directions •bo be talcen, areas to be explored, and phases of evaluation to be strengthened in order to develop a better balanced program of evaluation. This in reality is the purpose of principles and is in keeping with the underlying premise in evaluation that experience, e:qjerimentation, and objectives are interrelated functions. Therefore, in the following recommendations, tbie ivriter recognizes that they are not definitive solutions to problems and is also aware that a critical connotation seems to be expressed in most of these final statements. This does not imply an unawareness of the problems and difficulties in evaluation, but a certain inevitable outcome to be faced when conditions are viewed in relation to principles*
1 . A study of objectives in conjunction -wilth tlie means of evaluating progress tov/ard objectives is highly desirable, This is substantiated by the responses of teachers in this study. Attenpts should be made to integrate these functions to such an extent that activities
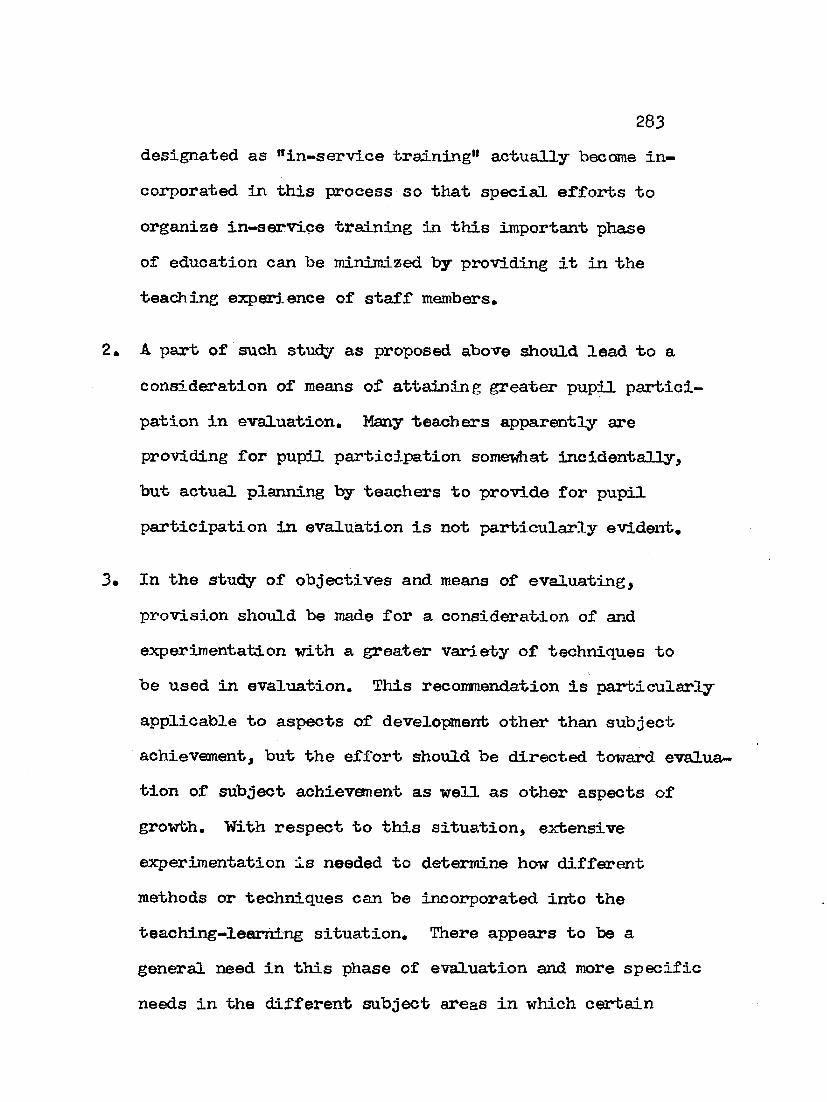
283designated as "in-service training" actually become incorporated in this process so that special efforts to organize in-service training in this important phase of education can be minimized by providing it in the teaching expert.ence of staff members*
2. A part of such study as proposed above should lead to a consideration of means of attaining greater pupil participation in evaluation. Many teachers apparently are providing for pupil participation somei iat incidentally, but actual planning by teachers to provide for pupil participation in evaluation is not particularly evident,
3* In the study of objectives and means of evaluating, provision should be made for a consideration of and experimentation with a greater variety of techniques to be used in evaluation. This recommendation is particularly applicable to aspects of development other than subject achievement, but the effort should be directed toward evaluation of subject achievement as well as other aspects of growth. With respect to this situation, extensive experimentation is needed to determine how different methods or techniques can be incorporated into the teaching-learning situation. There appears to be a general need in this phase of evaluation and more specific needs in the different subject areas in which certain

28Utechniques tend to be the major means for securing inf oimati on.
U. Teacher-preparing institutions shonLd seriously examine their present programs and practices with a definite aim of attempting to improve conditions with respect to the above recoimnendations. Prospective changes should not merely provide additional formal instruction and observational types of learningbut should include attempts to institute these practices effectively in the program and provide direct experience with them.This recommendation is applicable to both teaciier education and programs for administrative and supervisory personnel.
5« Programs of evaluation should be extended^ expanded, and planned so as to become more comprehensive and more functional in the school program. Factors particularly important as revealed by this study are: (1) facilitatingand improving the use of information pi’ovided tiirough a program to provide additional types of information other than subject achievement, attendance, and home and family information, (3) extending as rapidly as possible the participation of teachers in the administration of different types of tests in all cases not requiring specially trained personnel, (L) providing for continuity

28^in record systeins by obtaining the most complete record available for all types of transfer students, (5) extending the objective types of evidence available through the program which at present in mary schools consist largely of data on intelligence and achievement tests, and (6) providing for methods of reporting to parents that obviate the necessity of including a conrolex of factors in school marks.
6. Since observation and the day-to-day social relationships of the teacher T/ith pupils constitute the major source of information for evaluating different aspects of development, teacher preparation should provide numerous opportunities and extensive experience in effective use of and practical means of systematizing or recording such information.
Although some of these recommendations require a more concerted effort than mere changes in individual schools or school systems, and also are suggestive of needed research, initiative by schools in these phases of the evaluation program must bo the primary means of attempting to improve practices to avoid purely academic consideration of the problems and the limitations in formal research of being unable to determine the effects of local conditions.

286These I'ocoramendations all imply a need for research in obtaining
more adequate evidence and in developing techniques for effectively implementing the practices recommended. Other specific types of research are also suggested by this stuc^. Research is apparently needed to determine how a greater variety of evaluative techniques and evaluative information be obtained in different areas of education, and to determine ho?r teachers make effective use of different means in different areas.
Evidence in this study also indicates that some teachers believe that evaluation is adequate in almost all aspects of development whereas others maintain that it is inadequate in most aspects. Additional research is needed to identify the characteristics of teachers and other factors in the school situation that are related to these differences. Such research would be pertinent with respect to differences for all of the different aspects of development considered as a group and for differences in adequacy between given aspects of grovrbh or development to be evaluated.

APPENDIX A
287

288PRINCIPLES OF EVALUATION OF PUPIL AND STUDENT GROWTH OR PROGRESS
FloasG rate the principles "below on the two scales provided. The first is the agroe-undecidod-disagree scale, which is represented "by the letters "A," "U," "D." If you agree with the statement, indicate "by circling the ”A. " If you are undecided or if you disagree with the statement, indicate "by circling either the "U" or the "D" respectively. Tho second pcslo, represented "by the numbers 1, 2, and 3» is to be used only if you circle the "A" (agree) for the item. The purpose of this scale is to determine your opinion of the importance of each item with which you agree. The code for this scale is as follows:
1. The principle is of little or no importance.2. The principle is of some importance.3. The principle is of groat importance.
1. Evaluation of the growth or progress of individuals A 1 2 3should be conducted in terms of purposes or objectives U established in a clear and understandable fashion. D
2. Evaluation should bo a cooperative undertaking of all A 1 2 3 persons concerned with or affected by the evaluation, U
D3. The process of evaluating the growth or progress of A 1 2 3
individuals should have continuity. UD
h. In evaluation, evidence should be gathered concerning A 1 2 3all aspects of the growth or progross of individuals. U
D5. Evaluation should be an integral part of the teaching- A 1 2 3
learning process. UD
6. Because of the complexity of the evaluation process, A 1 2 3a variety of techniques. Instruments, and methods Ushould bo used to secure adequate evidence of the Dgrowth or progress of individuals.
7* In so far as possible evaluation should be a planned A 1 2 3process. U
DS. Evaluation should include both subjective judgment A 1 2 3
and objective appraisal. U

z 3 99. Evaluation ahould take into account differences among A 1 2 3
individuals "being evaluated. U33
10. Evaluation should include a consideration of both tho A 1 2 3beginning status and growth or progress of individuals. U
E11. Individuals should bo given assistance in developing A 1 2 3
the ability to evaluate thoir own growth or progress. UD
12. In evaluation, all available evidence should be used A 1 2 3for the diagnosis of the growth or progress of each Uindividual. E
13. The results of evaluation should be used in planning A 1 2 3future teaching-learning activities. U
E
14. Evaluation .should have guidance of the individual as A 1 2 3its primary puruose. U
E
15. A 1 2 3
K. A 1 2 3
17. A 1 2 3
TSignaturéT"
Please return completed form to: Evaluation Division, Bureau of Educational Research, Ohio State University, Columbus 10, Ohio

Bureau of Educational Reiearch The Ohio State University' Columbus 10. Ohio April n. 1962
2P0
D e a r T e a c h e r :T h e attached inquiry is one of three different types being sent to selected teachers in the e l e m e n t a r y , secondary, and teacher-training schools of Ohio. It is one part df ah extensive study o f t e s t i n g a n d evaluation practices in these schools.It is the purpose of this inquiry to determine the status of testing and evaluation of pupil p r o g r e s s in the public schools of Ohio, and especially to get the opinions of teachers concerning how e f f e c t i v e they believe their testing and evaluation practices are. Three research Assistants in the
Bureau of Educational Research wilt analyze and interpret the data: it is anticipated that summaries o f t h e investigation will be published in periodicals that have extensive circulation in Ohio schools.The inquiry, which may appear lengthy, has been given to several teachers in trial form ,
and the average time required to complete it was 22 m inu tes. It is rapidly and easily completed since only check marks or circles are required for the majority of respoiues.
Your cooperation in cosnpleting and returning this inquiry will be be very sincerely appreciated, and will be an invaluable help in the survey we are making. You will find a code number ui the upper right hand corner of the inquiry. This number will be used only for the purpose of sending reminders in case inquiries are not returned. We assure you that your answers wilt be treated vwh the utmost confidence, and that no effort will be made to identi^ any teacher's name with hie or her questionnaire. '
_ Sincerely yours.
/JUrîyW. R, Plesher, HeadEvaluation DivisionBureau of Educational Research
INQUIRY CONERNING EVALUATION OF PUPIL PROGRESS IN THE SECONDARYSCHOOLS OF OHIO
Part I - Basic Information
1. In what type of school district is your school located?— City— Exempted village
Local
2. In which education association district is your school located?— Northeast — Southeast— Northwest Southwest ™ Central
3.4.
5.
1.
How many teachers are there in your high school ( including principal ( s ) ) ?Type of school ( s ) in which you,ate teaching?— Junior-high( 7 - 9) ' Senior-high(1 0 -1— High school ( 9 - 12 ) ___ Six-year nigh ( 7 -— Male ___ Female 6 . Age
Number of years of: (Place appropriate numbers in spaces provided)I— Professional training Teaching experience
%

8,9.10.
11.
The last year in which teacher training institution was attended? _____-Have you ever had a course in educational tests and'measurements? Yes NoAt what type f s ) d f institution,( s ) did you receive youf tekcWpgpreparation? State college or university Private college or university , , Municipal college or university
Please check below the areas in which you are teaching: ' ' Agriculture_____________________________ Industrial Arts— ,-Art — -.Mathematics Business Education____________________ ___ _ Mu^c ; .
„ Core ___ Physical Education Science Social science Other ( s p e c % ) _ _ ---- ----
. Home Economics-------------------------------------Other ( specify) —— ____
English— Foreign Languages— Health and Safety
12. Which of these teaching areas do you consider as your major teaching assigtiihent? ___
13. What is the average ehrollmeht in your classes in tb a a u b j^ ureaUvhich you consider to be
21 - 25 ___3 6 - 4 0 26 - 30-------------------------------------------------Over 40
PLEASE RESPOND TO THE INQUIRY WITH REFERENCE TO YOUR MAJOR TEACHING ASSIGNMENT ONLY
Part II - - Techniques and Methods Used in Evaluation* .'f: u . tFor each of the following techniques, and methods of evaluation which you use, circle the letter on the right to indicate whether that method has been of little (L), some (S), or great (G) value to you in gaining an understanding of the status and progress of your pupils. Rate only those methods wHTch you use. This may well be only pan of the list below.
1.2.3.4.5.6.7.8. 9.10.11.12.13.14. 16.16.IT.'18.
Examining class written m>rk L S GExamining home written work L S GObserving classroom activities L S GExamining work products L S GListening to panel discussions L S GListening to Individual oral reports L S GConducting question-answer periods ( recitations ) L S GConducting pupil discussions L S GHolding conrer'ences with other teachers L S GHolding conferences withÇarents at school L S G
alking informally with other teachers L S GUsing cumulative records L S GUsing objective tests / L S GUsing essay-type tetfs L S GUsing standardised dr other published tests L S GKeeping growth charts L S GMaking tape or wire recordings of class activities L S GLooking at pupil scrapbooks L 'S G
19. Looking a t pupil collections20. Using attitude, interest, and per
sonality tests, scales, etc.21. Examining pupil diaries of ciass
activities22. Reading pupil autobiographies23. Examining pupil notebooks24. keeping your own record of
class activities25. Using check lists26. Using rating scales27. Usiiw work nabit inventories28. Maidng socibgrams23. Holding pl^rmed conferences .
with pupils30. Talking informally with pupils31. Visiting pupih'. homes32. Plartning activities vdth pupils33. Using sociodrama34. Observirig ptipils In out-Of-class
activities35. Other ( describe ) ___ -----36. Other ( describe ) ___ .... ..... .
L S GL S GL S G L S GL S GLLLLLLLLLL
S G S G 5 G S G S G
GGGGG
L S G L S G L S G

Part Π-- Scope Qf Evaluation
B.
291A. P l e a s e indicate boiv well you ate able, with exittlng facilities, records, and personnel, to
" " ' aqiectf pf pupil progress listed below. Circleevaluate the a' evaluate
scalei N » Not evaluated; I - Inadequately ■ Adequately evaRSfeai^
SUBJECT ACHIEVEMENT. ( Undqr^andiac of principles and processes, knowledge of factual information: ability to solve problems; ability to think critically and logically; ability to organise and prment information, etc.. ) N 1 P A
PUPIL ATTITUDES. < ( Attitudes toward social values such as honesty, courtesy, loyalty: ptcjpdices; dispositions to.be kind, cruel, ftiendly negative, conceited; attitudes toward school; attitudes toward family; etc, ) N I F A
PUPIL INT^STS. ( Sportt, games, and amusement interests; readily interests; hobbles: travel Interests; occupational interests; school activities: acconmiWiments: etc. ) N I P A
PUPIL PERSONAL-SOCIAL ADJUSTMENT. ( Self-direction: partic^ation in group activities; abnormal behavior sudi at crying, aggression, withdrawal, daydreaming, etc,) ■ N I P A
W ΠK HABITS. ( Ability to conmlete tasks undertaken; ability tocooperate in group tasks; ability to work without constant direction; abiuty to mane good use of work, time; ability to use materials efficiently; etc. ) N I F A
HEALTH, ( Difficulties in vision; difficulties.toj hearing,* matauttition; nervouioess: deotol defects: inmtentivenessr serious injury history;hygienic practices such as cleanlhiess. Mercise, posture, dim, etc, ) N 1 P A
For each of the above aspects of pupil progress vdüch you evaluate to at least some extent, indicate whether your evaluation is based on: O r observation entirely, T - tests or other measuring devices entirely. or.OT - a combination'oT'tjie Ciicle appr^naiF IStSr ( s).
SUBJECT ACHIEVEMENT O T OTPUPIL ATTITUDES O T OTPUÀL INTERETS 0 T OTPUPIL PERSONAL-SOCIAL ADJUSTMENT O T OTWORK HABITS O T OTHEALTH O T OT
' ' • Check to appropriate spacm belowHave educational objectives been formulated or re-examined this year for your:1. entire school? - Yes Mo , 2. subject area? Yes No.If both answers above are "No” proceed to section C.
If objectives have been re-examined or fmmulated for the subject area to urihich you teach, were they worked out by:1. the principal?
_ a supervisor?a committee of teachers?
_ a comhtittee of teachers and the principal or a st^ervisor?_ other ( describe ) .. ■ - -.. ...... ..... ......
3.4.5.To what extent did you participate?L Hone ' 3. _ ‘ Little 3. Some 4.. Much
If objectives h&vd bden formulated either for, the entire schbol m for the subject area in which ydu t^aito, baf thbre b ^ hoy study by the staff of the ways to evaluate Dupllachieyemeut of those olîjeçtivesfI. . , 2 . , _ , No . ;

If so, to what extent has such study-helped you better to evaluate the attainment of those objectives by youi pupils?1 , None 2. -------- Little 3. Some 4. Much
C. As a riile, do you formulate objectives for your-own teaching th tecrtu oft -TEACHER RESPONSIBILITIES? ( For example: conduct âTrêview Of basic facts;
make outlines as stui^ aids; supervise study; arrange' a Aeld tt^ i etc. j COURSE CONTENT TO BE COVERED? ( For exan^lei books to be read; exercise to
be ptacticedi assignments to bOcovered; etc. ) ' : ; ^ SPECIFIC PUPIL BEHA^ORS TO BE SOUGHT? ( FCr exathplet abiUty to màke an
outline; ability to' conduct a meeting: ability to follow instructions in particular situations; ability to complete a given task: ability to write concise' sentences; etc. )
BROAD PUPIL GGALg ^TO BE ATTAINED? ( For example) gbod health; mastery of . 'fundamentals; social adjustment; ability to commitnicate effectively; development of desirable attitudes; etc. ) ' ■ ’ > / •
_ OTHER ( specify, give example ) _ _ ---- _ _— _ -----
Patt IV - Cumulative Records(Note: Check here if no cumulative record cards or folders are kept in your schooland proceed to Pan V.) - u ; : r:Below are listed types bf information frequently found in cumulative records. Please check in the blanks below the types of information recorded in the cumulative record card or kept in the cumulative recOrd folder for your pdpilSl For each type'of information kept circle the letter at.the right v^hich Indicates hôw'vàinable that information has been to you in gaining a better understanding bf the status Or progress of your pupils. The letters should be interpreted as follows. , .
L - little or no value, indicates that the information has been of lUtle or no value to^?5ulh gaCilng a better understandibg of the status or. progress of your pupils, or that it Is used primarily for. reports and administrative purposes.
S" some value, indicates that the information is used oniy occasionally or that it is of li'ihlied' value in gaining an understanding of the status or p r o g ^ of your pupils
G* great value, indmates that the information is used freqûentk, that it is indispensable toT^ainB^a better understanding of the status or progress of your pupils.
Check here if recorded
Type of InfOrrnatibh
.PERSONAL INFORMATION ( e .g ., date of birth, age, nationality, homeaddress, height, weight, etc. )
ENROLLMENT AND ATTENDANCE DATA ( e. g. , days absent, tardiness,other schools attended, etc. )
HOME AND FAMILY INFORMATION ( e. g . . occupation and education ofparents, records of teacher visits to home, records of parent visits to school, etc.) ' ' r . , .
SCHOOL ACHIEVEMENT AND CURRICULAR EXPERIENCES ( e .g . , Schoolmarks, courses taken, written progress reports, etc. }
EXTRACURRICULAR EXPERIENCES ( e. g. athletics, cIbbsV class . v.offices, school work experience, etc, )
HEALTH INFORMATION ( e .g ; . immunizations, reports of nurse Or ,,physician, etc. ■ H- ■
SPECTAL INTEREST DATa ( e. g .. hobbies, special skills sports.reading interests, out-of-schooI experiences, etc. ■
— SUPPLBMEOTARY INFORMATION ( e. g . . reports of psychologists.social wbfkers; anecdotal mcords of teachers; etc/ ) ' , ‘
TEST SCORES * \ - i-r.-v- tnrelllgence
^Achievement ‘ ,
.PërsbnalÜy ' 1
.Reading, survey .
.Reading, diagnostic
.Attitucms ■ • ,
. Other (describe) _
LL
LLLL.,LL
"L:-LLLLLLLL
Circlevalue
S G
5 G
S G S G
S G -,S G \S G té G
GGGGGGGGG

Part V f - Tewing Praciice# — 292Check in appropriate tpactet V
A To what extent do you make and use classroom tests to evaluate the progress of your pupils?1. _ frequently a. ^ Occasionally 3. _ Seldom C _ — Never
If you use such tests do you regularly:assign a grade? -f-----return testa to pupils with errors marked?
return tests toptmlls with written notations about the work done? talk with pupHs about enors or weaknesses?
talk with pupils about strong pôints shown in results? talk with parents about results? plan instruction to remedy weaknesses: revealed? plan instruction to capitalise on strong points revealed?Which of the following type ( s ) of tests or test questions do you use regularly?1. True-false . 6 .___ Multiple choice2 . Completion 6 .— Essay3 . Slm0c recall 7 .— Oral quiz4 . Matching 8 . Other ( describe ) —^ ------
B. To what extent do your pupils help to plan what they will study or do in class?1, ____ None 2. __ 1 Little 3. ____ Some 4. ----- MuchTo what extent do your pupils help decide those things on which they will be tested or evaluated? 1. _____ None 2, ______ Little 3. _ — Some 4. MuchTo what extent do your pupils participate in the construction of tests or in the planning of other means of evaluating their progress?1. None 2. ______ Little 3. Some 4.------ Much
C. Ate standardized achievepient tests given in the subject area which you consider to be your major teachihg assignment?1, Yes 2. ___ No. 3. If so, in which grades?--------------------------
If so are the tests usually administered by you?1___ Yes 0. — No. •Do you prefer to administer them ?1. Yes 2 . ------- , 0Are summaries of the test results made available to you as a rule?1. Yes 2. _____ NoDO you jgPefer that they be made available to you?Arelhie scroted achievement test forms for each pupil made available to you as a rule?1___ _ Yes 2. No ^Do you prefer that they be made available to you?1. ___ Yes 2. ___ No
D. How much time do you spend preparing pupils for:state scholarship examinations?1.______ None 2. Little 3. Some 4. ___ Muchsenior scholarship examinations?1. _____ None 2. Little 8. _____ Some 4 .------ Much
Part VI - - Marking and Reporting PracticesCheck in appropriate spaces
Which of the following methods are used in your subject area to report pupil progress to patents? ' ^1. _____ Report cards with five-point grading scale for subject achievement2. - - . Report cards with four-point grading scale for subject achievement3. _____ Report cards with three-point grading scale for subject achievement4 . Ke^on cards with two-point grading scale fpr subject achievement
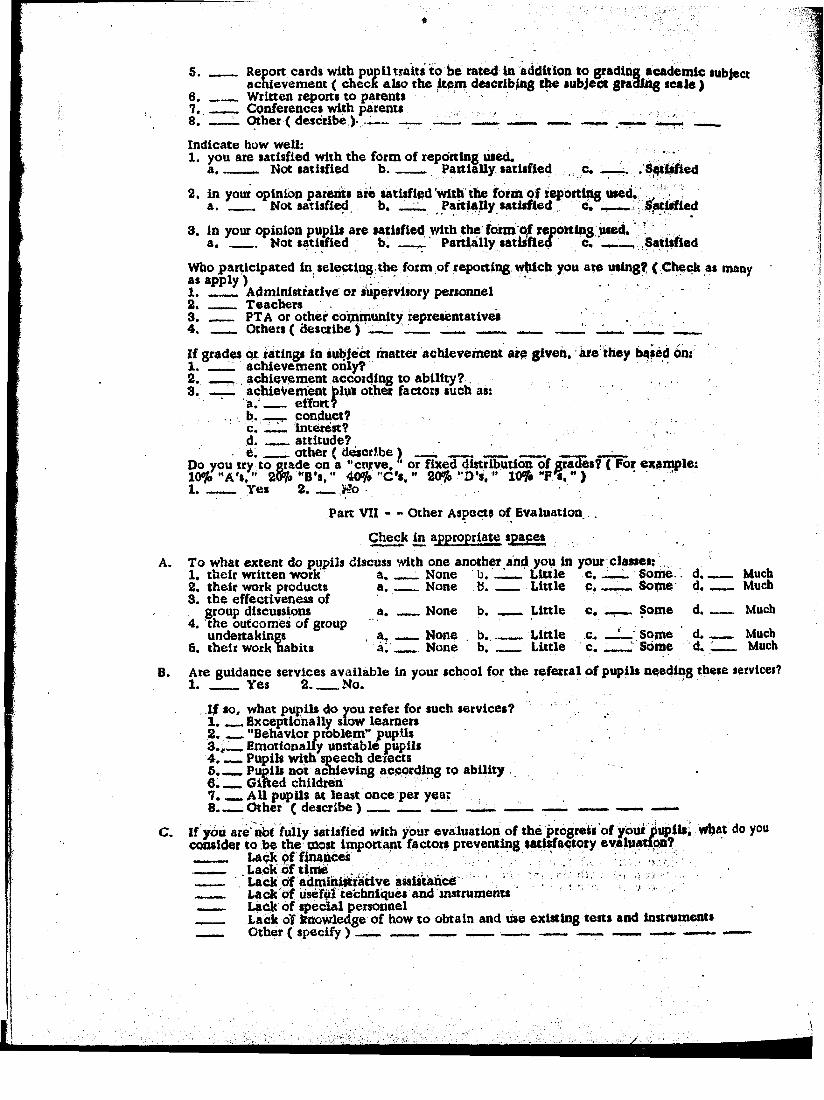
5.
A.
B.
Report cards with pupil traits to be rated in addition to grading academic subject actUevement ( check alto the item describing tW subject grading scale )
6 . Written reports to parents7. ____ Conferences with parents8. L Other ( describe ) :— —— —Indicate how well:1. you are satisfied with the form of reporting used,
a . Not satisfied b . Partially satisfied c. .SqtWed2. in your opinion parents ain satisfied'with the form of reporting used. , \
a. __ Not satisfied b. Partially satisfied c, ____ giatisfied3. in your opinion pupils are satisfied with the form of repotting used.
a . Not satisfied b. ____ Partially satlsAed c.____ .^tlsfiedWho participated in selecting the form of reporting which you are using? ( Check as many as apply )1 . ___ _ Administrative or supervisory personnel2. ___ Teachers ,3. ___ PTA or other community representatives4. __ _ Others ( describe ) ................ _____ 1 J___ _____ ____If grades or ratings in subject matter achievement arp given, ère they based On:1. ___ achievement oiily?2 . ____ achievement according to ability?3. ----- achievement plus other factors such as:
a . effort?b conduct?c. _ _ interest?d. attitude?e . __ other ( describe ) ________ ___ _ _____
Do you try to grade on a "curve, or fixed distribution of grades? ( For example:10% "A'S, " 2 # , "B's, " 40% "C'S," 20%-D's, " 10% "F^. ** )1. __ Yes 2 Wo .
Part VII - " Other Aspects of Evaluation .Check m appropriate spaces
To what extent do pupils discuss with one another and you in your classes:1. their written work a . __ _ None b, ____ Little c. _—_ Some.. d. _2. their work products a . ___ None b . ___ Little c, —,—, Some d. «3. the effectiveness of
group discussions a.____None b. ____ Little c. _____ Some d. _4. the outcomes of group
undertakings , a_ ____ None b. _____ Little c. —1—. Some d. _5. their work habits à: .. None b, ___ Little c. Some d. .
MuchMuchMuchMuchMuch
Are guidance services available in your school for the referral of pupils needing these servicer? 1. - Yes 2____No.
If so, what pupils do you refer for such services?i. Exceptionally slow learners2.I:'6,.6..7.8..
. "Behavior problem" pupils
. Emotionally unstable pupils
. Pupils with speech deiectsPupils not achieving according to ability Gifted children
. All pupils at least once per year
. Other ( describe ) _____ _
C. If ydu are nbt fully satisfied with your evaluation of the progress of ybuf pupils; viihat do you consider to be themost important factors preventing satisfactory evaluation? ‘ Lack of administrative assistahcd . . ; ' ; ’_____ Lack of useful telcbniques and instruments
Lack of spemal personnel Lack 0Ï knowledge of how to obtain and use existing tests and instruments Other ( specify ) ____ ___ _____ ------------------ _ — —— • — —

Bureau of Edub^tidiial Reaeaich The Ohio Stare University Columbus 10, Ohio April @8, 1962
293
Dear Principal:
The purpose of this inquiry to School principals is to determine what is being done school-wide in the* * * - - * ' * — -— --- —— . —* Ohio "*** a —
use in teaching.
Three research assistants In the Bureau of Educational Research will analyze and interpret the data; it is anticipated that summerles of the total Investigation will be published in periodicals that have extensive circulatton in Ohio schools.
The completion of this inquiry may appear at first glance to be quite a task; actually, since most of thequestions require only a check mark, the inquiry may be completed rapidly and easily.
Tour cooperation'in completing and returning this inquiry will be very sincerely appreciated, and will be an invaluabte help in the survey we are making. You m il find a code number in the upper right-hand comer of the inquiry. This number will be used only for the purpose of sending reminders in case inquiries ace not returned, we assure vou that your answers will be treated Mth the utmost confidence, and that noeffort will be made to identity any principal's name or sqhool with his or her questionnaire.
Sincerely, yoiirs, /
W. R. Plesm. Head Evaluation Division Bureau of Educational Research
INQUIRY CONCERNING TESTING AND EVALUATION PROGRAMS IN THE SECONDARY SCHOC^SOF OHIO
Part 1 — Basic InformationI
1. In what type of school district is your school located? City Exempted village— Local
2. Type of school of which your are principal? Junior-high ( 7 - 9 ) High school ( 9 - 12 )— Senior-high f 10 - 12 ).— Six-year nigh < 7 - 12 )
3. Please dieck in which education association district your school is located: Northeast Southeast Northwest Southwest Central
4. How many teachers are employed in your school?_________

Patt 11 — Standardized Teat*
(CHECK HERE IF NO STANDARDIZED TESTS ARE GIVEN REGULARLY• IN YOUR SCHOOL AND PROCEED TO PART HQ
In the form below please indicate the tlme(s) of year the different types of standardized tests are given in your school by placing an F (FalQ, Kt (Midyear). S (Spring), or I (Indefinite) under the yades in which the te«* are given. Include only those tests given aimually or more often.
Type of Test
Group intelligence
Times of year in which tests arc administered in the different gradei:
8 10 11 13TJôTàlwj the same gradei
Ohio Every PupilState ScholarshipSenior Scholarship Achievement
Complete batteryPartial battery
Special aptitudeInterestPersonalityAttitudesReading
SurveyDiagnostic
Other ( specify )
Indicate by checking in the appropriate spaces in the form below: 1 - who generally administers the various type: of standardiaied tests used in your school, and II - where test results are. kept.
Type of Test
I - Administered by:Classroomteacher
Principal
Centralstaffpersonnel
II - Records are kept:In central location available to teacher
In files, not available to teacher
In teacher’s own records
Group intelligenceOhio Every PupilState ScholarshipSenior ScholarshipAchievement
Complete batteryPartial battery
Special aptitudeInterestPersonalityAttitudesReading
SurveyDiagnostic
Other ( çecify )

29Ule check to the focm below the m aid poipose(iij) for which the results of standardised test# given in your school tt»ed. F o r a n y g iv e n test, check all major purposes for which the test is used.
Type of TestSurvey of classes or school
Diagnosis
Planning classroom in- scrumion
■.> t -■ .r. ■ i ■ '
Coun-sellng
Grouping of pupils
Placement of PupIDin curricula .
Promotion
Other(describe
Group intellinencenhio Every Pupilstate Scholarship __Senior ScholardiipAchievement
Complete batteryPartial battery
special aptitudeiflteien < V
penonality 'Attitude*Reading
SurveyDiagnostic .
Other ( specify ) Ï '
Part in - - Cumulative Records
(CHECK: HEM IF NO CtlMUi^TIVE RECORD CARD OR POLDER IS |N USE IN YOVR SCHOOL' A fp PROCEED TO PARt
Below are listed types of information li^ciuently found ih cumidative records. Please check in the appropriate space(4 the types of information recorded in the cumulative record cards ot folders in usé In your school, ' If yon are in the process of introducing a new cumulative record system respond on the basis of the new form.
- ' : ' i ■ ■ PERSONAL INPCNUvlATION ( e .g ., date of birth, age, nationality, home address, height,
weight, etc. ) ENRCH.LMENT AND A^ENDANCE DATA ( e. g . . days absent, tardineu, other schools
attended, etc. ÿ. r ■ HOME AND FAMILY INFORMATION ( e. g . , occupation and education of parents, records of
teacher visits to home, records of parent visits to school, etc. ) SCHOOL achievement AND CUMUCULAR EXPERIENCES ( e .g .sc h o o l marks, courses taken,
written progreü reports, etc.")- — EXTRACURRICULAR EXPÉRIENCES ( e;.g. , athletics, clubs, class offices, school work
erqrerienee. «C* )HEALTH INFORMATION ( e. g . , immunisations, reports of nurse and physician, etc. )
SPECIAL INTEREST DATA (e. g ., hobbies, special skills, ^orts, reading iitterehs,out-ofrschool achievements, etc. ) * ;
SUH»LBMENT ARY INFORMATION ( e. g ., rq?oru of psychologists, social wtwkers;anecdotal recwds of teachers, etc. )
TEST RESULTS — - Intelligence Achievement Special Aptitude- — Interest OTHER ( describe ) __
Personality Attitudes Reading; survey Reading, diagnostic
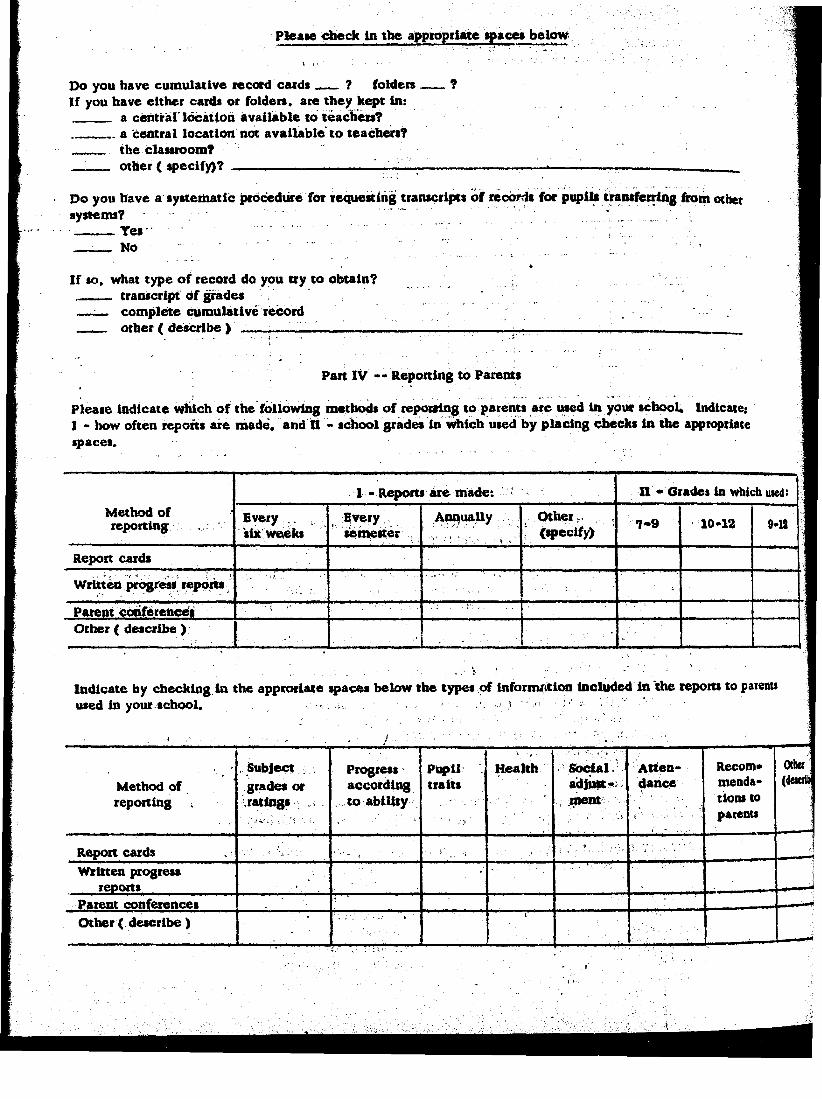
Please dieck in the appropriate y aces below
Do you have cumulative tecotd cards ? foldersIf you have either cards or folden. are they kq»i In: ___ a central'location available to teacHien? a central location not available to teachers? the classroom? ___ other ( specify)? ----- '
Do you have a systematic procedure fbr requesting transcripts of records for pupils transferring from othersystems? - ‘ ' . . 2 . i' Yes.................. No
If so, what type of record do you try to obtain? transcript of grades— L_ complete cumulative record other ( describe ) ■
Part IV -- Reporting to Parents
Please indicate Wiich of the following methods of repotting to parertts are used in your school. Indicate: I - how often reports are tnade. and Ù - school grades in which used by placing checks in the a(q>t<q>tiate spaces.
Method of reporting
I - Reports are made: n • Grades in which uied:
Every six weeks
. :very semester 1' 'I I.
. Other (qiecify) 7-9 10-12 9>U
Report cards
Written progress reports ;
Patent ConférencesOther ( describe )
Indicate by checking, in the approriase spaces below the types of informa tion Included in the reports to parent* used in your school. -■ s
Method of reporting
. Subject ; . grades w ratings
Progress according to ability
pupiltraits
Health Sbcdai.adjii#-ment
Attendance
Recom* mends- tions to parents
Otha#
Report cards 1Written progress
reports> -g
Parent conferencesOther ( describe )

295
WhatIl the statut ii) you: school of the différent medtods of reporting to parents? Check in appropriate spaces.
Method of reporting
Repoit cards
Wtlnen progress reports
Intend to Introduce
Intend to discard
Intend to modify or improve
Intend to retain in present form
Do not intend to use
p«fént conferencesOther ( describe )
Part V — Other Aspects of the Program
A, If the teachers in your school have received any in-service training in testing and evaluation during the past three years, please check in the appropriate spacefs) opposite the typefs) of training: I • the division(4 of the school in which such training was conducted: and H - the method of training. Use space "Other" for additioiial types if necessary,
(CHEQC HERB— TEACHERS HAVE RECEIVED NO IN-SERVICE TRAINING IN TESTING AND EVALUATION IN THE LAST THREE YEARS AND RtOCEED TO SECTION %
Type of Training
I - Division
Junior-high
Senior-highor
II " Method of Training
Workshop
Teachers'meetings
Studygroups
i
Consultants
Materials ptdilidied by your school
Other(describe)
Tescber-ooadeteat
StandardizedteasOther methods of evaluationPblksophy o f evaltiatignReporting to patentsCumulativerecords
^>eciali|KdevaluationservicesClassroomguidanceOther ( describe )

B. Please indicate in the blank to the left of each of the types of personnel listed below the number of peitont in your school who devote all or part of fheir tinae to teithlg. guidance: and evaluation. Ule fractions if necessary to Indicate the amount of time devoted specifically to these duties. Then check In the appropriate spacefs) to the right the principal resonsibiUties of these workers.
(CHECK HERE IP THERE ARE NO SPECIAL PERSONNEL IN YOUR SCHOŒ., PROCEED TO SECTION q
Number of Personnel
Conferring with teachers
Testing Counielingwithpupils
Constructing tests
Conducting la* service ttainlaj in testing and evaluation
Guidance counselotfOPsyebologistfs) __Research worket(sJ|___Evaluationspecialistfs) ____Test q»ecialist(4 _Dean of boys ____Dean of girls _____ Social wdrkec(s) ____ Sig*ervisor(s) _ _ _ Other ( specify )
C. Indicate with a circle the grades in which the following types of exanünations are given each year:
Type of Examination Circle grade(4f in udiich given:
1. General physical2. Dental3. Vision,4. Hearing
D. Do you believe that your evaluation program is genwally adequate? Y e s No
? 8 9 10 11 121 8 9 10 11 127 8 9 10 11 127 8 9 10 11 12
If ncK, please check the factors that are in your/opinion preventing the development of an adequate evaluation program in your sehooL
Lack of finances Lack of time
Lack of interest of teachers in evaluation Lack of useful techniques and instruments Lack of knowledge of bow to Obtain and use existing tests and instruments Lack of personnel qualified to develop the evaluation program Other ( specify) : . .. . '

APPENDS B
296
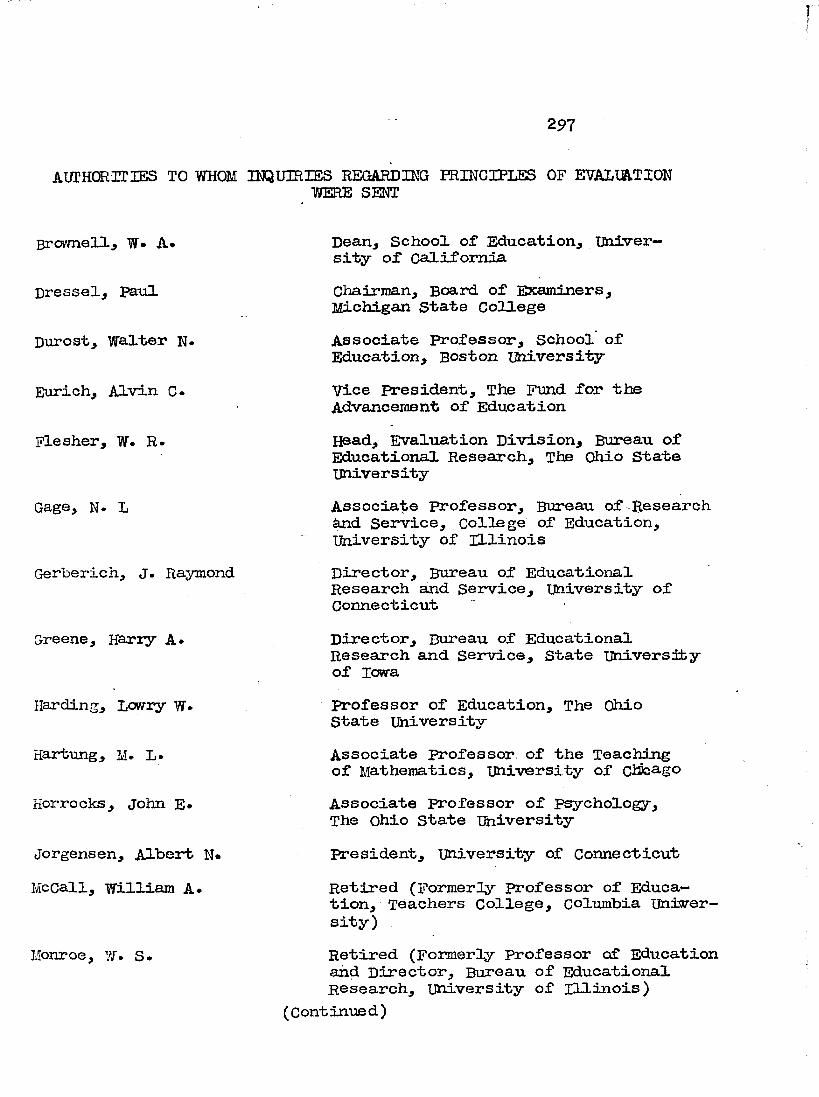
297
AUTHOR Tins TO WHOM IMQimilES REGARDING FRINGIPLES OF EVALUATIONWERE SENT
BrovmeUj W» A*
Dressel, Paul
Durost, Walter N.
Eurich_, Alvin C-
Plesher, W. R-
Gage, N. L
Gerberich, J. Raymond
Greene, Hariy A»
Harding, Lowry W.
Hartung, M. L*
Horroclcs, John E*
Jorgensen, Albert N« McCall, William A.
Monroe, W. S.
Dean, School of Education, University of CaliforniaChairman, Board of Examiners,Michigan State CollegeAssociate Professor, School of Education, Boston universityVice President, The Fund for the Advancement of EducationHead, Evaluation Division, Bureau of Educational Research, The Ohio State universityAssociate professor. Bureau of Research ànd Service, College of Education, University of IllinoisDirector, Bureau of Educational Research and Service, university of ConnecticutDirector, Bureau of Educational Research and Service, State university of IowaProfessor of Education, The Ohio State UniversityAssociate Professor of the Teaching of Mathematics, university of ClScugoAssociate professor of Psychology,The Ohio State TMiversityPresident, university of ConnecticutRetired (Formerly Professor of Education, Teachers College, Columbia University)Retired (Formerly professor of Education and Director, Bureau of Educational Research, university of Illinois)
(Continued)

298Orleans, Jaco”b
Pace, 0. Eotert
Saths, Louis E,
Bemmers, H. H.
Binsland, Henry D.
Scat es, Douglas E.
Smith, B. O.
2ravers, Eohert M. W,
Trajcler, Arthur B,
Tyler, Ealph W.
Wood, Ben D.
Wright S t one, J, Wayne
Wrinkle, William L.
Professor and Director of Eesearch and Evaluation, College of City of Hew YorkDirector, Evaluation Service Center, Syracuse UniversityDirector, Center for Eesearch and Service, School of Education, New York UniversityDirector, Division of Educational Eeference, Purdue UniversityProfessor of Education, University of OklahomaProfessor of Education, Queens CollegeProfessor of Education, University of IllinoisAssistant Director, Office of Eesearch and Evaluation, Teacher Education Division, Board of Higher Education, New York CityExecutive Director, Educational Eecords BureauDean, Division of Social Sciences, University of ChicagoDirector, Bureau of Collegiate Educational Eesearch, Columbia College, Columbia UniversityDirector, Bureau of Educational Eesearch, New York City SchoolsEducational Affairs Adviser, Office of the United States High Commissioner for Germany, Office of Public Affairs, Information Division

299CITY SCHOOIS TO WHICH INQUIRIES WEEIE SEIOT, LISTEDALPHABETICALLY BY TEACHER-ASSOCIATION DISTRICT
NortheasternAkron, Garfield High School (9-12)Alcron, West High School (9-12)Ashtabula, park Junior High School (7-9)Bay Village, Bay High Sc^^cl (7-12) canton, McKinley High School (9-12 )Cleveland, Glenville High School (10-12)Cleveland, Lincoln High School (7-12)Cleveland, Albert Bnshnell Hart Junior High School (7-9) Cleveland, CoHinwood High School (7-12)Cleveland, Myron T. Herrick Junior High School (7-9) Cleveland, West High School (7—12).Cleveland Heights, Heights High School (10-12)Conneaut, Conneaut Junior High School (7-9)East Cleveland, Vf. H. Kirk Junior High School (7-9)East Palestine, E^st Palestine High School (9-12)Euclid, central Junior High School (7-9)Lakewood, Jjakewood High School (10-12)Lorain, Hawthorne Junior High School (7-9)Mansfield, Johnny Appleseed Junior High School (7-9) Mayfield, Mayfield High School (7-12)North Olmsted, North Olmsted High School (7-12)Ravenna, Ravenna High School (7-12)Shaker Heights, Sliaker Heights junior High School (7r9) Warren, Harry B. Turner Junior High School (7-9) Willoughby, Eastlake Junior High School (7-9)Youngstown, North High School (7-12)Youngstown, James Hillman Junior High School (7-9)
Ncrt hwe stemBryan, Bryan High School (7-12)Findlay, Donnell Junior High School (7-9) Galion, Galion Senior High School (10-12)Port Clinton, Port Clinton High School (7-12) Sandusky, Sandusky High School (9-12)Toledo, Libbey High School (9-12) van Wert, Van Wert High School (9-12)

300CnTY-SCHOOIS TO WHICH INQUIRIES WERE SEMT, LISTED ALPHABETIGALLY
BY TEACHER-ASSOCIATION DISTRICT
CentralCircleville, Circle ville High School (9-12) Colturibus, Norbh High School (10-12)Golumbvis, Champion junior School (7-9)ColTimbvis, mdianola Junior High School (7-9) Colimbiis, west Junior High School (7-9)Dayton, Roosevelt High School (7-12 )Delaware, Frank B* Willis High School (7-12) Uarion, Vernon Heights Junior IÜ.gh School (7-9) Newark, Central Junior High School (7-9)Oakwood, Oakwood Senior High School (10-12) Springfield, Springfield High School (10-12) Springfield, Snyder park Junior High School (7-9) Wasliington C. H», Washington High School (7—12)
SoutheasternIronton, Fronton High School (8—12)Nevf Boston, Glenwood High School (7-12) Wellston, We liston High school (9-12)
SouthwesternCincinnati, Walnut Hills High School (7-12) Cincinnati, Bloom Junior High School (7-9) Cincinnati, Washington Junior High School (7-9) Hamilton, Roosevelt Junior High School (7-9) Dockland, wayne High School (9—12)Middletown, Roosevelt junior High School (7-9) Reading, Reading High School (9-12)St. Bernard, St. Bernard High School (7-12) Wyoming, wypming High School (7-12)Xenia, East High School (7-12)
EasternCambridge, Cambridge High School (10-12) Marietta, Marietta High School (7-12)Toronto, Toronto High School (9-12)Zanesville, Roosevelt junior High School (7—9)
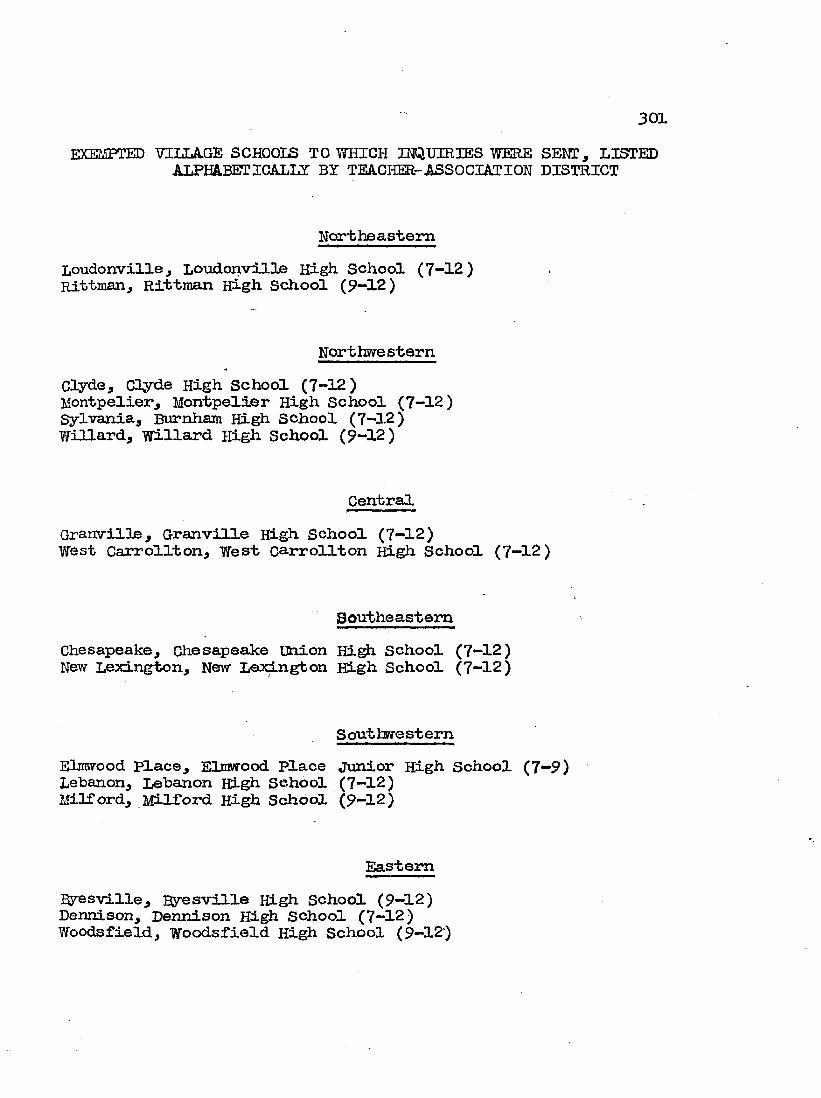
301
EXmïPTED VHiIAGE SCHOOIS TO TOIGH INQUIR3SS WERE SENT, LISTEDALPHA.BETICALLX BY TEAGHEE-ASSOCIATION DISTRICT
Norths astemLoudonvillSj Loudonville High School (7-12) Rittman, Rittman High School (9-12)
NorthwesternClyde, Clyde High School (7-12) Montpelier, Montpelier High School (7-12) Sylvania, Burnham High School (7-12) Willard, Willard High School (9-12)
CentralGranville, Granville High School (7—12)West Carrollton, West Carrollton High School (7-12)
SoutheasternChesapeake, Chesapeake union H i ^ School (7-12) New Lexington, New Lexington High School (7-12)
S out hsrfe sternElmwood place, Elmwood Place Junior High School (7—9) Lebanon, Lebanon High School (7-12)Milford, Milford High School (9-12)
Eastern%res ville. Ryes ville High School (9-12) Dennison, Dennison High School (7-12) Woodsfield, Woodsfield High School (9-12)

302
LOCAL SCHOOLS TO WHICH lîîQüIRIES WERE S M , LISTED ALPHABETICALLYBY comp IBS K3R EACH TEACHERrASSOCIATION DISTRICT
NortheasternAshland Coimty
Jeromesville High School (7—12)Sullivan High School (7-12)
Ashtabula CountyAndover High School (7-12)EdgeiTood High School (7—12) pierpont High School (9-12)WilliamsfieId High School (9-12)
Columbiana CountySalineville High School (9-12)
Cuyohoga CountyCuyahoga Heights High School (7-12) Independence High School (7-12)Solon High School (7-12)
Geauga CountyChardon High School (9-12)
Holmes CountyBerlin High School (9-12)Ripley High School (Big Prairie) (7-12)
Late CountyKirtland High school (7-12)
Lorain CountyAvon High School (7-12)Camden High School (7—1.2)Grafton Village Local High School (7-12) South Amherst High School (7-12)
Mahoning CountyFitch High School (Austintown) (7-12) Noith Lima High School (7-12)
Medina CountyHinckley High School (9-12)Seville High School (7-12)
Richland countyMadison High School (9-12)
(Continued)

303Northeastern
Stark CountyBeach City ~ Wilmot High School (9-12) Hartville High School (7-12)Naverre High School (9-12)Uhiontomi High School (7-12)
Summit CountyHudson High School (7-12)Revere High School (7-12)
Trumbull CountyBloomfield High School (7-12)Cortland High School (7-12)Hartford High School (7-12)Lordstown High School (7—12)Vernon High School (7-12)
Wayne CountyCliippewa High School (9-12)Milton High School (7-12)Salt Creek High School (7-12)
NorthwesternAllen county
Auglaize High School (7-12)Perzy Junior High School (7-5)
Auglaize CountyWaynesfield High School (7-12)
Crawford County&It. Zion High School (7-12)Whetstone High School (7-12)
Defiance CountySherwood — Delaware High School (7-12)
Erie CountyHellys Island High School (7-12)
Fulton CountyChesterfield - Dover High School (7-12) Metomora High School (9-12)
(Continued)

30UHancock Ccunty
Cory - Rawson High School (9-12)Vanlue High School (7-12)
Hardin CountyMcGuffey - McDonald High School (9-12)
Henry CountyDêshler High School (7-12)Malinta - Grelton High School (7-12)
Huron CountyNew Haven High School (7-12)
Lucas CountyOttawa Hills l&gh School (7-12)
Qttavra CountyDanbury High School (7-12)
Paulding CountyAuglaize-Brovm High School (7-12)
Putnam CountyColumbus Grove High School (7-12) Leipsic High School (7-12)Sugar Creek High School (7-12)
Sandusky CountyGreen Springs High School (7-12)
Seneca CountyAttica High School (7-12)jackson-Liberty High School (7-12)
van Wert CountyConvey High School (7-12) union High School (7-12)
Williams CountyFlorence-Edon High School (9-12)West unity High School (7-12)
Wood CountyLake High School (7-12)North Baltimore High School (9-12)Troy High School (9-12)
Wyandot CountyMcCutchenvHle High School (7-12) Wharton High School (9-12)
(Continued)

305Central
Chançaign CountyHarris en - Adams High School (7-12) Woodstock High School (7-12)
Clark countyNevr Carlisle Junior High School (7-9) South Charleston High School (7-12)
Darke countyHollansburg High School (7-12 ) Franklin High School (7-12)
Delaware CountyBig walnut High School (8-12)Liberty High School (9-12)
Fayette CountyMadison Mills High School (7-12)
Franklin CountyLincoln High School (7-12)Washington High School (7-12)
Greene CountyJefferson High School (7-12)
Knox CountyFredericktown High School (7-12)
Licking CountyAlexandria High School (7-12)Hebron High School (7-12)
Logan CountyDeGraff High School (7-12)Stokes High School (7-12)
Madison CountyFairfield High School (7-12)Mb. Sterling High School (7-12)
Marion CountyGreen Camp High School (7-12)Pleasant High School (7-12)
Mercer CountyFt. Recovery High School (7-12)
(Continued)

306
Miami Com-byBethel High School (7-12)Statmton High School (7-12)
Montgomeiy CoiantyJackson - Farmersville High School (9-12) phillipsburg High School (7-12 )
Morrow CountyCardington High School (7-12)Washington - Bloomfield High School (7-12)
Pickaway CoimtyDar1::y High School (9-12)Pickaway High School (7-12)
Ross CountyBuckskin High School (7-12)Twin High Scliool (7-12)
Shelby CountyBotkins High School (7—12)Periy High school (7-12)
Union CountyNorthwestern High School (7-12)
SoutheasternAthens County
Carthage - Trey HLgh School (7-12)Gallia County
Racoon High School (7-12)Hocking County
Laurelville Hi#i School (7-12)Jaclcson County
oak Hill High School (7-12)Lawrence County
Rock Hill High School (7-12)Meigs County
Rutland High School (7-12 )Morgan County
Homer — union High School (9—12)(Continued)

397perrjr Comty
New S'braitsvil.le High School (7-12)pike County
Piketon High School (7-12)Scioto County
ICLnford High School (9-12 )Vinton County
Allensville High School (9-12)
SouthwesternAdams County
Jefferson High School (7-12)West union High School (7-12)
Broem CountyHamersville High School (7-12)Sardinia High School (7-12)
Butler CountyNew Miami Junior High School (7-9)
Clermont CountyBatavia High School (9-12)New Richmond High School (7-12)
Clinton CountyChester High School (7-12)NeiT Vienna High School (7-12)
Hamilton CountyAnderson High School (9^12)Loveland High School (9-12)Terrace Park union High School (9-12)
Highland CountyMarshall High School (9-12)
Preble CountyGratis High School (7-12)West Alexandria High School (7-12)
Warren CountyKings l/iills High School (7-12)Wayne High School (7-12) (Continued)

308
EasternBelmont County
Belmont High School (7-12)St. Glairsville High School (9-12)
Carroll ComityAugusta High School (7-12)
Coshocton CountyRoscoe High School (7-12 )
Guernsey CountyCumberland - Spencer High School (7-12) Senecaville - Rlchlaud High School (7-12)
Harr iso n CountySherrodsville - Richland High School (7-12)
Jefferson countyBergholz High School (7-12)Jefferson Uhion High School (7-12)
Muskingum CountyFrazeysburg High School (7-12)Roseville High School (7-12)
Tuscarawas CountyBaltic High School (7-12)Stone Creek - Jefferson High School (7-12)
Monroe CountyHannibal High School (7-12)
Noble countyBeaver High School (9-12)Forest Grove High School (9-12)
Washington CountyBartlett High School (9-12)NoTvport High School (7-12)Waterford High School (9-12)

309SAUPLDÎG TECHNIQUES USED nî SELECTU^ ERINCIPAIS AND TEACHERS TOVfHQLl DQUiaiBS WERE SENT
The te cliniques used in selecting samples of schools and of teachers were closely interrelated. Consequently, the development of these two sarcples is presented together. For purposes of clarity the principal steps of the technique are listed first. Modifications, limitations, and other details are discussed immediately following this list.
1. A sample of approocimately- 2000 teachers was accepted as adequate for purposes of this study. This number represents about 10 per cent of the secondary—school teachers in Ohio from which it was anticipated that approximately 50 per cent would respond.
2. The total number of public secondary schools in Chio was obtained from the Directory of the State Department of Education.
3* The state was divided into four regions arbitrarily selected, consisting of 22 counties in each region.These regions were designated as NE, NViT, SE, and SW corresponding to the general geographical location of each region within the state.
U* The proportion of schools and teachers in each regionto the total nuniber of schools and teachers T/as computed.

310Tlie proportion of teachers for each region was multiplied by the proposed sample for the entire state to find the number required in each region.
6. The average number of teacliers per school was computed foreach region and divided by two because it was considereddesirable to limit the number of teachers surveyed in anygiven school to ^0 per cent.
7. The number of teachers in the sample for each regionwas divided by the average computed in Step 6 to• determine the number of schools required for the given number of teachers in the sample.
8. Tlie total number of schools in each region was divided by the required number of schools to determine the interval to be used in selecting schools from the list in the Directory of the State Department of Education —
for exanple, every fifth school,
p. Schools were selected by regions according to theinterval derived for each region.
TvTO additional computations were made to provide an approximate check on the number and proportion of schools to be selected in different types of districts_, and the distribution of schools in each region according to type of school organization for each of tlie three types of districts. These are added as Steps 10 and 11.
3 HHcy<Tever, the basic steps are those listed in 1 through 9 above.
10. The number of schools required in city, exempted village, and local districts was computed according to tlie proportionate number of each type in each region.
11. The number and proportion of different types of school organization represented in tiie different types of school districts was computed for each region.
This technique provided a sample list of schools for each region which corresponded very closely with the number required.The list of schools also included the approximate number of teachers required, m a few instances it was necessary to add a few schools to the basic list obtained, particularly in the lists of local schools and in the list for the SE region of the state because averages of teachers per school were unduly influenced by a few large schools or a large number of small schools. Schools added to these lists were selected by arbitrarily taking schools which had about the average number of teachers to make the sample complete, or by computing a new interval for the remaining number of teachers requii'ed and selecting from the total list of schools according to tliis interval. The latter alternative was applied to the SE region only. Inasmuch as an exact number of participants for tlie study was not being determined, this approximate approach to the sampling problem was adopted.

APPENDIX G
312

TABLE 78NUMBER AND PER CENT ΠTEACHERS INDICATING THAT THEY USE CERTAIN EVALUATIΔ METHODS AND TECHNIQXES, BY
TYPE OF SCHOOL D3BTEICT AND SELECTED (210ÜPS Bi NUMBER OP TEACHERS PER SCHOOL
Type of 8oteel district Teachers per acheeT 3-^ kO and mêF~Methed or technique
N ■ i N i N i N i N f
Observing classroom activities 1*72 91.7 67 89.3 309 95.7 135 96.it 266 90.8Examining (OLass written work W 86,0 67 89.3 300 92.9 128 92.1 260 88.7using objective tests 1*23 82.1 69 92.0 287 88.9 132 95.0 236 80.6Condncting qaestion-ansirer periods lil3 80.2 63 81*.0 291 90.1 126 91.6 227 77.5Talking informally with pi^ils 1*13. 80.2 65 86.7 279 86.1* 118 81*.9 231 78.8
Examining home written work 383 7l*.l* 59 78.7 270 83.6 116 83.5 223 76.1Condncting pnpil discnssiens 373 72.1* 59 78.7 260 81.5 H 5 82.7 209 71.1*Talking informally with ether teachers 360 69.9 65 86.7 258 79.9 110 79.1 198 67.6listening to individual oral reports 31*9 67.8 1*8 6I4.O 2hO 72.3 105 75.5 189 61*.6Ee^iz^ your own record of class act. 350 68.0 1*1* 58.6 223 69.0 90 61*.8 193 65.9Examining wcrk products 333 61*.7 1*6 61.3 ae 67.5 95 68.3 181* 62.8using essay-type tests 316 61.3 50 66.7 228 71.6 99 71.2 175 59.7W h g cumulative records 332 61*.5 50 66.7 203 62.8 86 61.9 188 61*.2Using standardized or published tests , 300 58.3 1*9 65.3 217 71.3 ICO 71.9 161* 56.0Observing ptqpils in out-of-class act. 297 57.7 50 66.7 2 5 69.7 98 70.5 157 53.6Holding conferences with other teachers 303 58.8 111 51*.7 201 62.2 86 61.9 161 51*.9Holding conferences with parents 302 58.6 37 1*9.3 175 51*.2 73 52.5 157 53.6Planning activities with pupils . 276 53*6 1*8 61*.0 188 58.2 83 59.7 11*6 1*9.8Examining pupil notebooks 271 52.6 36 1*8.0 171* 53.9 88 63.3 11*1* 1*9.1Listening to panel discussions 237 1*6.0 32 1*2.7 170 52.7 72 51.8 119 1*0.6
(C(aitinuBd)V j J
G
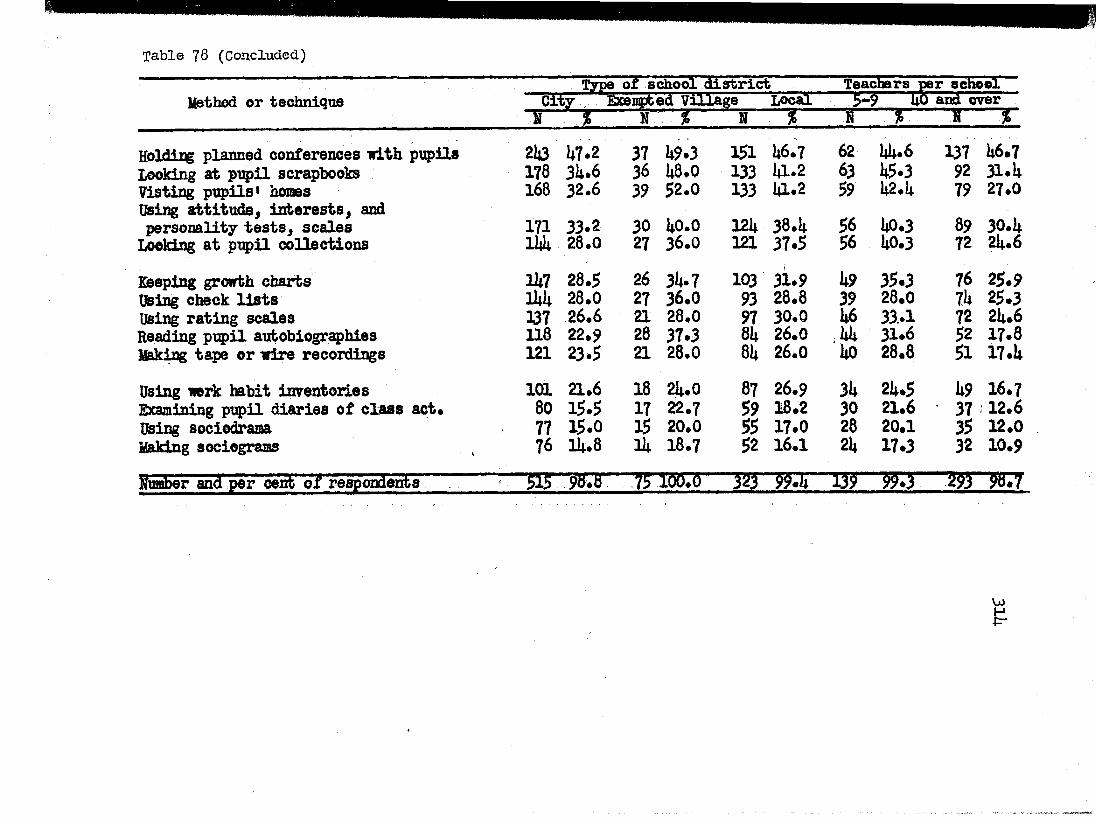
Table 78 (Concluded)
Method or techniqueType of school district Teacmrs per school
City Exenpted Village Local 5-9 hu and overN % N % N H % N %
Holdii planned conferences uith pipils 2li3 U7.2 37 U9.3 151 U6.7 62 Wi.6 137 U6.7Looking at piq)il scrapbooks 178 3I1.6 36 U8.0 133 m .2 63
59li5.3 92 3i.il
Visting pupils' homes 168 32.6 39 52.0 133 U1.2 ll2.il 79 27.0%ing attitude^ interests^ and
56 1*0.3 89personality tests, scales 171 33.2 30 llO.O 12k 38.il 30.ilLooking at ptgpil collections llà 28.0 27 36.0 121 37.5 56 I1O.3 72 2I1.6Keeping growth charts 1U7 28.5 26 3I1.7 103 31.9 ii9 35.3 76 25.9using check lists M 28.0 27 36.0 93 28.8 39 28.0 7ii 25.3using rating scales 337 26.6 21 28.0 97 30.0 1*6 33.1 72 2I1.6Reading ptpil autobiographies 118 22.9 26 37.3 8ii 26.0 31.6 52 17.8Making tape or vire recordings 121 23.5 21 28.0 81i 26.0 ilO 28.8 51 i7.ilUsing verk habit inventories 101 a .6 18 2I1.O 87 26.9 3ii 2I1.5 U9 16.7Examining piq>il diaries of class act. 80 15.5 17 22.7 59 18.2 30 21.6 37 12.6Using sociodrama 77 15.Û 15 20.0 55 17.0 28 20.1 35 12.0Making sociograms 76 lL.8 111 18.7 52 16.1 21* 17.3 32 10.9Number and per cent o t respondents . . 9d.b 75 I0Ô.Ô 323 33^ ^•3 293 ?B.7
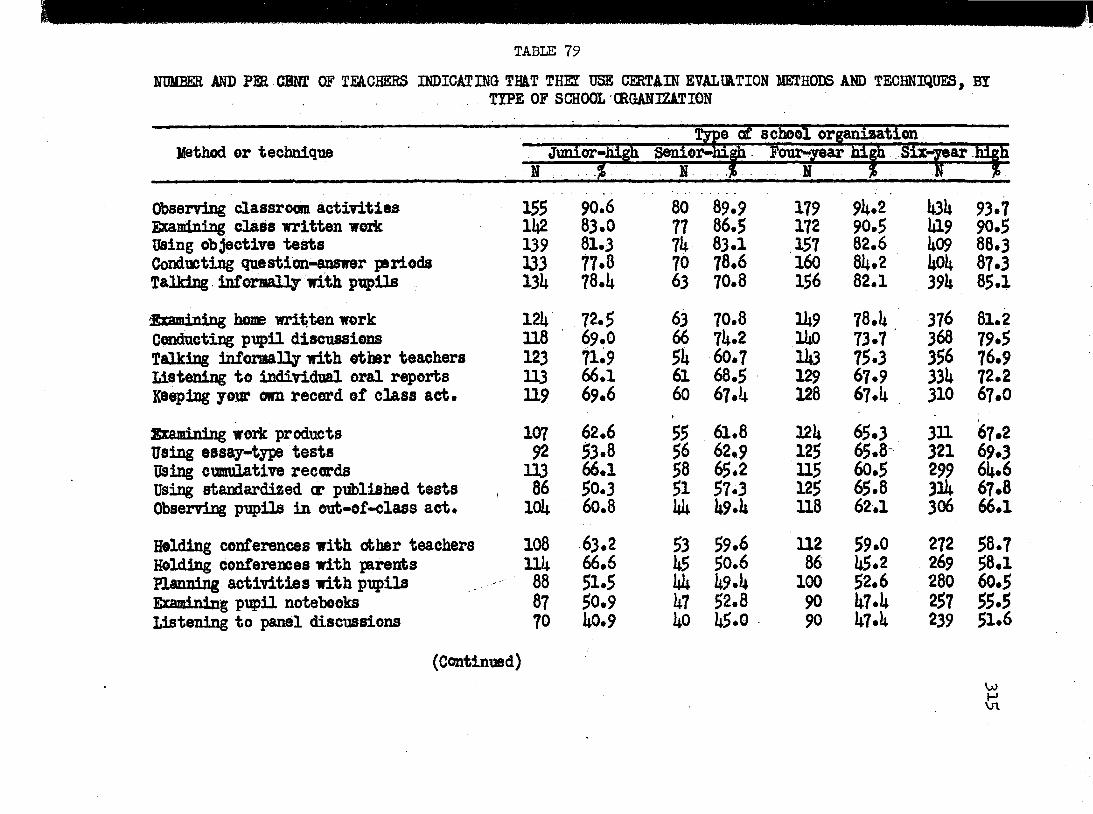
TABLE 79î AND PER CBNT OF TEACHERS INDICATING THAT THET USE CERTAIN EVALUATION METHODS AND TECHNDiUES, BI
TYPE OF SCHOOL (EGANIZATION
Type of sobool organization"Method or technique
N i N i M N
155 90.6 80 89.9 179 9it.2 it3lt 93.7ihZ 83.0 77 86.5 172 90.5 itl9 90.5139 81.3 7it 83.1 157 82.6 it09 88.3133 77.8 70 78.6 160 8it.2 itOit 87.313U 78.it 63 70.8 156 82.1 39it 85.112k 72.5 63 70.8 Ht9 78.lt 376 81.2U 8 69.0 66 7lt.2 litO 73.7 368 79.5123 71.9 5it 60.7 Hi3 75.3 356 76.9113 66.1 61 68.5 129 67.9 33lt 72.2119 69.6 60 67.it 128 67.it 310 67.0107 62.6 55 61.8 12lt 65.3 311 67.292 53.8 56 62.9 125 65 «8 321 69.3113 66.1 58 65.2 115 60.5 299 6lt«686 50.3 51 57.3 125 65.8 3Ht 67.8
10k 60.8 kk it9.it 118 62.1 306 66.1108 63.2 53 59.6 112 59.0 272 58.7n k 66.6 hS 50.6 86 ii5.2 269 58.188 51.5 kk lt9.it 100 52.6 280 60.587 50.9 kt 52.8 90 lt7.lt 257 55.570 itO.9 ItO lt5.0 90 ii7.it 239 51.6
Observing dassrocsa activitiee SxasriniDg class irrltten wozk %ing objective tests Conducting question-ansirar periods TaUdng Informally with pupils
'Examining home written work Conducting pxpU discussions Talking informally with ether teachers Listening to individual oral r^orts Keeping your own record of class act.
Examining woxk productsUsing essay-type testsUsing cumulative recordsUsing standardized cr published testsObserving pi:q>lls in out-of-class act.
Holding conferences with other teachers Holding conferences with parents Planning activities with ptç>ils Examining piçil notebooks Listening to panel discussions
(Continued)w

TABIE 79 (Concluded)
Method or techniqueType of school organizatlm
Junior-high Senior-high Four-year high Six-year highN % N %
Holding planned conferences with piq>ils 7lt 1*3.3 1*5 50.6 66 1*5.2 226 1*6.8Looking at piq>il scrapbooks 65 38.0 18 20.2 71* 38.9 190 1*1.0Visiting pupils' homes 61 35.7 21* 27.0 61* 33.7 191 1*1.3Hslng attitude, interest, andpersonality tests, scales 61 35.7 26 29.2 67 35.3 171 36.9
Looking at pxpil collections 55 32.2 20 22.1* 65 3l*.2 152 32.8
Keeping growth diarts 1*5 26,3 21* 27.0 67 35.3 11*0 30.2Using check lists 39 22.8 28 31.1* 56 29.5 11*1 30.1*Using rating scales 35 , 20.5 23 25.9 56 29.5 11*1 30.1*Reading pupil autobiographies 37 21.6 17 19.1 51 26.8 125 27.0Making tape or wire recordings 1*3 25.1 16 18.0 51* 28.1* 113 2l*.l*
Using work habit inwenbories 32 18.7 18 20.2 1*5 23.7 l a 26.1Examining pnpil diaries of class act. 25 ll».6 11 12.1* 1*1 21.6 79 17.1Using sociodrama 2lt IL.O 10 11.2 37 19.5 76 16.1*Making sociograms 22 12.9 10 11.2 38 20.0 72 15.5
Nmdber and per cent of respondents Ifl 99.1* 89 98.9 190 99.5 1*63 98.9
KjJH0\

TABLE 80NUMBER AND PER CENT OF TEACHERS INDICATING THAT THEY USE CERTAIN EVALUATION METHCDS AND TECHNIQUES, BY
SEX AND SELECTED AGE GROUPS
"ssr Selflcied age groups"Method or technique Male Female 20 to 29 yrs 50 yrs and over
N % N N % N %Obeerving classroom activities hül 92.3 lt05 93.5 I92 95.0 lit5 89.9Exmnining class written work lao 85.8 398 91.9 181 89.6 Ht9 9i.ltIMng objective tests li08 85.L 369 85.2 168 83.2 138 81t.7C^uoting question-answer periods 399 83.5 366 8U.5 168 83.2 1I4I 86.5Talking informally with ptçils 373 78.0 372 85.9 165 81.7 127 77.9Examining hme written work 356 lk.S 351t 81.7 158 78.2 126 77.3Conducting piQ>il discussions 3L3 71.8 3kl 80.1 Ht7 72.8 128 78.5Talking infozûâlly with other teachers 339 70.9 335 77.lt 155 76.7 113 69.3listening to individual oral reports 32k 67.8 3H 71.8 137 67.8 120 73.6Keeping your own record of class act. 310 6U.8 305 70.lt 122 60.U 122 7lt.6
Examining work products 320 67.0 275 63.5 136 67.3 96 58.9using essay-type tests 302 63.2 290 67.0 133 65.8 103 63.2using cumulative records 298 62.3 285 65.8 121 59.9 98 60.1Using standardized or published tests 293 61.3 281 6ii.9 109 51t.O 107 65.6Observing ptpils in out-of-class act. 281 58.8 289 66.7 136 67.3 92 56.5Holding conferences with other teachers 279 58.lt 261t 61.0 lilt 56.lt 102 62.6Holding conferences with parents 263 55.0 2lt9 57.5 101 50.0 96 58.9Planning activities with piçils 213 50.9 267 61.7 113 55.9 87 53.ltExamining piqiil notebooks 259 51t.2 220 50.8 95 U7.0 91 55.8Listening to panel discussions 230 lt8.1 207 lt7.8 101 50.0 81 lt9.7
(Continued)
VjJ

TABLE 8G (Concltided)
£»ex Selected age groupsMethod or technique Male tamale 20 to 2 yrs 50 yrs and wer
K % N. % N % k %
Holding planned conferences ilth pipils 211 hh.l 218 50.3 80 39.6 82 50.3Leeking at pig)il scrapbooks 160 33.5 186 U2.9 80 39.6 50 30.7Visiting pi^ils* homes 179 37.lt 160 37.0 75 37.1 59 36.2%ing attitude^ interest and persenali'fy tests, scales ^0 35#6 m 35*6 72 35,7 55 33,7
Ixwking at piçil collections 155 32.lt 136 3i.it 56 27.7 50 30.7
Keeping grarth charts Hà 30.1 130 30.0 59 29.2 it6 28.2%ing check lis ts 23$ 28.2 128 29.5 6it 31.7 a 25.1Using rating scales 233 27.8 121 28.0 5it 27.8 it2 25.8Reading p içil autobicgr^hies 93 i 9.it 135 31.2 it6 22.8 36 22.1Making tape or idre recordings 126 26.3 99 22.9 55 27.2 27 16.6
using work habit imrenteries 111 23.2 lOlt 2lt.O it6 22.8 31 19.0Examining piq)il diaries of class act. 89 18.6 66 15.2 3it 16.9 23 lit.lUsing sociodrama 75 15.7 71 I6.lt 39 19.3 25 15.3Making sociograms 79 16.5 62 lit.3 35 17.3 20 12.3HuAer and per cenb of respondents WB 99.6 1*3 99.3 202 99.0 " W 98.8
Va)HCü

TABLE 81NUMBER AND PER CENT OF TEACHERS INDICATING TiftT THEY USE CERTAIN EVALUàTION METHCDS AND TECHNIQUES, BY
SE^CTED GROUFS ACCORDING TO EXTENT. OF TRAINING AND TEACHING EXPERIENCE
~ — - — ; jprofessiepal irainlpg Teaching experienceMethod or technique R .yeaM 6 years and curer 2 to It jnrs SO yrs.and over
r ::j ' .■ tf j r"". ir — r " ■Observing classreen activities EYAmiMng class iTritten werk Using objective tests Gonducting question-answer periodsTalking informally with pi^ils
'Examining home written werk Cwiducting p ^ il discusslcais Talking inf crmally with other teachers Listening to individual oral reports Keeping your own record of class act.
Examining work productsUsing essay-type testsUsing cumulative recordsUsing standardized or published testsObserving piq)ils in out-of-class act.
Holding conferences with other teachers B»lding conferences with parents Haiming activities with pipils Examining piq>il note books .Idstaiing to panel discussions
(Continued)
2kl 9H.6 177 92.2 173 95.6 311* 90.022$ 86.2 173 90.1 159 87.9 308 88.3213 81.6 168 87.5 11*9 82.3 295 81*.5216 82.7 168 87.5 11*5 80.1 297 85.1208 79.7 156 81.3 151* 85.1 278 79.7
I9k 71.3 357 81.8 137 75.7 267 76.5185 70.9 156 81.3 127 70.2 269 77.1193 7U.0 11*2 73.9 11*1* 79.5 21*2 69.3165 63,2 11*9 77.6 125 69.1 21*2 69.3162 62il 11*2 7l*.0 1Q5 58.0 251 71.9
168 6H.L 135 70.3 118 65.2 219 62.7167 61*.0 131* 69.8 116 61*.l 213 61.0198 60.5 132 68.8 107 59.1 221 63.3151 57.8 11*1 73.5 102 56.1* 222 63.6iSk 59.0 116 60.lt 126 69.6 200 57.3
150 57.5 123 61*.0 106 58.5 207 59.3133 51.0 129 67^2 92 50.8 201* 58.511*1 51.0 110 57.3 101 55.8 177 50.7126 1*8.3 112 58.3 91* 51.9 196 56.2112 1*2.9 112 58.3 89 1*9.2 160 1*5.9
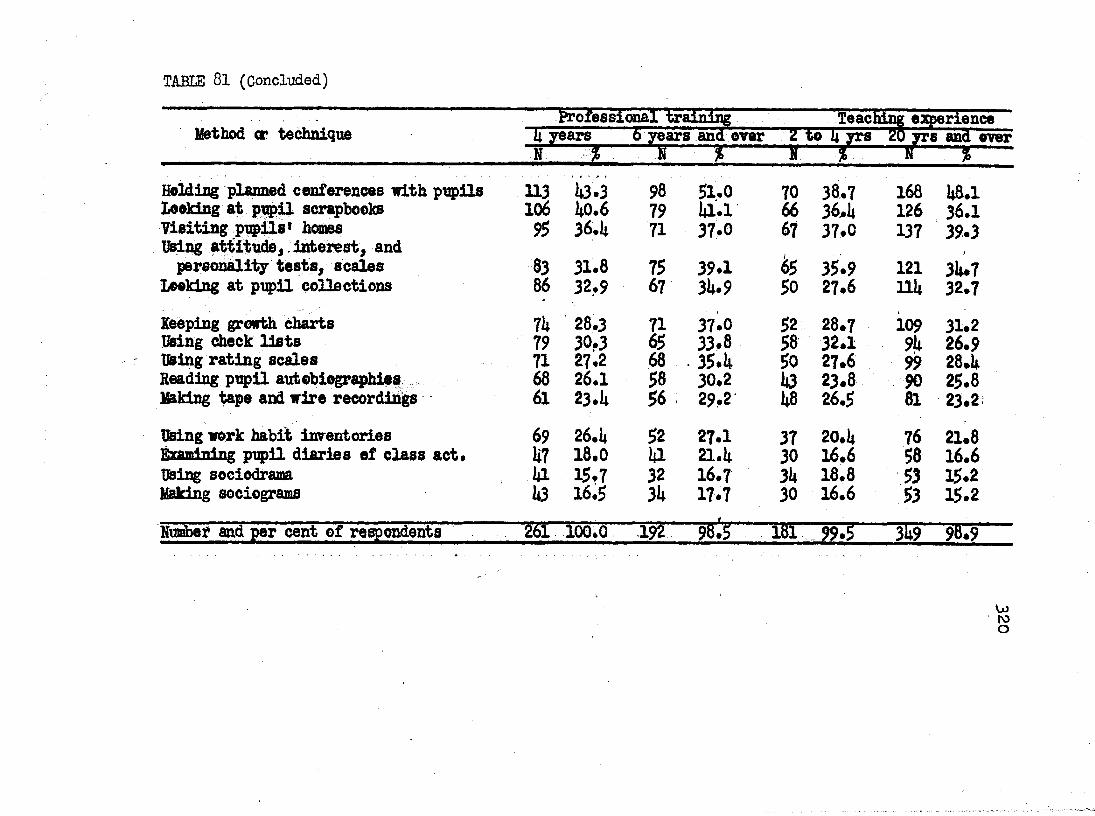
TABIS 81 (Concluded)
Method cr techniquejProfessional training Teaching e^q^rience
Ü years 6 years and ever Z to h yrs zo yris and overN ? N % N % N %
Holding planned conferences with ptgpils 113 Û3.3 98 51.0 70 38.7 168 48.1iKioking at p p il scrapbooks 106 lio«6 79 41.1 66 36^4 126 36.1Visiting pigpils* homes 95 36,li 71 37,0 67 37,0 137 39.3Ifising attitads, interest, and
personality tests, scales 83 31.8 75 39,1 &5 35,9 121 34,7looking at pig>H collections 86 32,9 67 34.9 50 27.6 114 32.7
Keeping growth charts Ik 28.3 71 37.0 52 28.7 109 31.2Using check lists 79 30,3 65 33,8 58 32.1 94 26.9Using rating scales 71 27,2 68 . 35.4 50 27.6 99 28.4Reading ptqpil autobiographies , 68 26.1 58 30.2 43 23.8 90 25,8Making tape and wire recordihjgs 61 23.L 56 • 29,2 48 26.5 81 23.2
Using work habit inventories 69 26.lt 52 27.1 37 20.4 76 21.8Examining piqpil diaries of class act. U7 18.0 111 21,4 30 16.6 58 16.6Using sociodrama Itl 15.7 32 16.7 34 18.8 53 15,2Making sociograms 1*3 16.5 34 17.7 30 16.6 53 15.2
Number and per cent of respondents 661 ioo.o 196 ^ .5 IBI 99,5 349 98.9
wroo

TABLE 82HT3MBER AHD ÏER CEHT OF TOCHERS INDIGATIB} THfcT THET IBE CERTAIN EVALUATION METHCDS AND TECHNHÜES, BT SELECTED QBODFS WITH REFERENCE TO RECENCY OF TRAININC AND WHETHER COIRSE IN TESTS AND MEAStREUENT WAS
i TAKEN IN PROFESSIONAL TRAINING
iast period of teacher training
- 1 ^ 9 WMethod cor techniqne
l « 0-i?3? M ~ TCourse in educational tests aai measurement tesT T
NoN %
Observing classroom activities 13U 90.6 331 9W 577 92.8 26!t 93.0Examining class written work 135 91.2 310 88.1 559 89.lt 2it8 87*3Using objective tests 122 82.U 299 8L9 51i5 87.2 231 81.3Ccmducting questim-answer periods 127 85.8 286 81.3 528 81*.5 236 83.1Talking informally with piçils 117 79.0 291 82.7 518 82.9 226 79.5Examining home written work 122 82.1i 276 78.V k93 78.9 216 76.0Conducting ptpil discussions 107 72.3 268 76.1 U77 76.3 212 7lt.6Talking informally with other teachers 111 75.0 261 7i4.1 h sr 73.1 2X$ 75.7listening to individual oral reports 106 71.6 2i*6 69.9 li31 69.0 203 71.5'Keeping your own record of class act. 98 66.2 220 62.5 hkS 71.2 170 59.8
Examining work products 86 58.1 216 69.6 1*19 67.0 176 62.0Using es8€Qr-type tests 93 62.9 228 6ii.8 lt08 65.3 183 61t.ltUsing cumulative records 101 68.2 218 62:0 li09 65.lt 175 61*6Using standardized or published tests 100 67.6 211 59.9 105 67.lt 158 55.6Observing ptpils in oub-of-class act. 80 5W 23li 66.5 399 63.8 171 60.2
Holding conferences with other teachers 89 60.1 20L 58.0 382 61.1 160 56.3Holding conferences with parents 83 56.1 192 5^.6 366 58.6 Ht6 5l.ltHanning activities with ptqpils 70 it7.3 206 58.5 3I48 55.7 161 56.7Examining piqpil note books 81 51i.7 178 50.6 337 53.9 iWt 50.7Listening to panel discussions 6h 10.3 178 50.6 308 lt9.3 130 lt5.8 w
H(Continued)

TABIE 82 (Concluded)
Method or technlqœÏASt period of teacher training
1930-1939 1950-1952
Course in educational tests and neasuronent
N T N TTes
N T -NNor
Holding planned conferences nith pupils 70 1*7.3 191* 1*3.8 297 1*7.9 132 1*6.9Looking at pupil scrapbooks k9 33.1 11*2 1*0.3 232 37.1 111* 1*0.1Visiting piçils < hmss 1*9 33&1 131 37.2 233 37.3 106 37.3Using attitude,.interest, and
personality tests, scales 92 39.3 131 37.2 237 37.9 86 30.3Looking at pupil collections 1*9 30.1* 111* 32.1* 205 32.8 85 29.9Keeping grosth charts 1*9 33.1 101* 29.6 199 31.9 77 27.1using checklists 39 26,3 101 28.7 190 30.1* 71* 26.1Using rating scales. 1*3 29.0 91* 26.7 182 29.1 73 29.7Reading pupil autobiographies 39 26,3 99 27.0 158 29.3 72 29.3Making tape and wire recordings 37 29.0 99 27.0 11*8 23.7 77 27.1Using work habit inventories 37 25.0 86 2l*.l* 191* 2i*.6 62 21.8Examining pupil diaries of class act. 39 26.3 63 17.9 111 17.8 1*9 15.9Using sociodrana 29 16.9 97 16.2 101 16.2 1*6 16.2Making sociograms 26 17.6 60 17fl 99 19.9 1*3 15.2Nmber awf per cent of respondents 11*B 1ÔQ.0 ?52 99.1* 6É5 9 .7 281* 99^ïï'"
u>roro

TABLE 83NIMBER JUÏD PER CENT QF TEACHERS INDICATING THAT THET USE CERTAIN EVALUATION METHODS AND TECHNIQUES, BT
AVERAGE ENRQLLUBNT IN CLASSES
Msthod or techniqueiverage enrollment in classes vdiich respondents teachzo and below zi - 3 0 31 - 1»0 Over I4ON N i N %
Observing classroom activities 169 95.5 385 93.7 255 90.1» 33 89.2Examining class written work 156 88.1 382 90.5 250 88.7 27 73.0Using objective tests 155 87.6 359 87.1» 235 83.3 25 67.6Conducti%% questien-answer periods 151 85.3 351 85.1» 21|0 85.1 21 56.7Talidi^ informally with piçils 139 78.5 337 82.0 236 83.7 30 81.1
Examining home written work 131 71.0 336 81.8 221» 79.1» 17 1»5.9Conducting p içil discussions 137 77.it 315 76.6 217 76.9 17 1»5.9Talking informally with other teachers 132 7lt.6 300 73.0 215 76.3 23 62.1Listening to individual oral reports 109 61.6 296 72.0 208 73.8 18 1»8.6Keeping your cam record of class act. 120 67.8 277 67.1» 197 69.9 18 1»8.6
Examining wwk products 138 77.9 271» 66.7 162 57.5 18 1»8.6Using essay-type tests 111 62.7 286 69.6 177 62.8 17 li5.9using cumulative records 99 55.9 279 67.9 183 61».9 21 56.7Using standardized or published tests 10k 58.7 269 65.5 179 63.5 21 56.7Observing pipils in out-of-class act. 110 62.1 255 62.0 179 63.5 2& 59.1»
Holding conferences with other teachers 9k 53.1 251» 61.8 172 61.0 22 59.1»Holding conferences with parents Bk lt7.3 226 55.5 176 62.lt 21 56.7Planning activities with pupils 106 59.9 230 55.9 151 53.6 22 59.1»Examining pupil note books 89 50.3 230 55.9 l!»7 52.1 11 29.7Listening to panel discussions 78 207 50.1» lia 50.0 11 29.7
(Continted) U)0?

TABLE 83 (Concltided)
Average enrollment in classes which respondents teachMethod or technique 20 and below 21 - 30 31 - ho Over UO
H N ^ . N
Holding planned conferences with pupils 7$ b2.b 200 b8.7 138 b8.9 15 bo.5Looking at piçil scrapbooks 58 32.8 163 39.7 115 bo.8 8 21.6Visiting pupils' homes 75 b2.b lb2 3b.5 107 37.9 lb 37.8Hsing attitude, interest, and
personality tests, scales 62 35.0 156 37.9 9b 33.3 10 27.0Looking at piQ>il coUSCtions 27.7 ib i 3b.3 91/ 32.3 8 21.6
Keeping growth charts 5b 30.5 130 31.6 79 28.0 11 29.7using check lists 52 29.b 029 31.b 73 25.9 9 2b.3using rating scales là 2b.9 127 30.9 72 25.6 10 27.0Heading pipü autobiographies 35 22.1 109 26.3 75 26.6 7 18.9Making tape or wire recordings 3b 19.2 110 26.8 71 25.2 9 2b.3%ing work habit inventories 51 28.8 102 2b.8 55 19.5 7 18.9Examining pupil diaries of class act. 2b 13.6 79 19.2 b9 17.b b 10.8Using seciedrama 2b 13.6 76 18.5 bl lb.6 5 13.5Making sociograms 22 12.b 71 17.3 bb 15.6 5 13.5
Number and per cenb of* respondents 177 100.0 bill 99.? ' 282 ^8.1 3Y 9t.U
wro4=-

TABLE BhNUMBER AND 1ER CENT OF TEACHERS INDICATING THAT THET USE CERTAIN EVALUATION METHCDS AND TBGHNU)UES, BT
SUBJECT AREASàubjeci area which teachers consider major teaching asaigament
Method or technique Agriculture Art Business EducationN % % N % N %
Observing classro<m activities 22 91.7 17 89.5 79 96.3 135 91.2Examining class irrltten ircrk 2k 100,0 8 lt2.1 79 96.3 lit3 96.6Using objective tests 22 91.7 8 it2.1 72 87.8 138 93.2Conducting questim-anseer periods 22 91.7 6 31.6 61 7it.it 139 93.9Talking infomally with pupils 18 75.0 15 78.9 68 82.9 133 89.9
Examining ham erltten work lit 58.it it 21.1 76 92.7 135 91.2Conducting pupil discussions 18 75.0 13 66 .U 57 69.5 132 89.2Talking informally irith ether teachers 17 70.8 9 lt7.it 60 73.2 129 87.2Listening to individual oral reports 18 75.0 8 lt2,l 39 it7.6 132 89.2Keeping your oen record of class act. 15 62.5 12 63.2 62 75.6 103 69.6
Examining werk products 21 87.5 18 9it.7 63 76.8 90 60.8Using essay-type tests 18 75.0 7 36.9 it? 57.3 129 87.2Using cumulative records 17 70,8 6 31.6 51 62,1 109 73.6Using standardized or published tests lit 58.3 2 10.6 68 82.9 no 7it#3Observing piçils in out-of-class act. 15 62,5 11 57.9 56 56.1 n3 76.3
Holding conferences with other teachers 16 66.7 8 it2,l it7 57.3 100 67.6Holding conferences with parents 15 62.5 9 it7.it 39 it7.6 9it 63.5Planning activities with pipils 15 62.5 12 63,2 it5 5it.9 96 611.8Examining pipil note books 20 83.3 it 21.0 33 itO.3 9it 63.5Listening to panel discussions 15 62.5 5 26,3 30 36.6 91 61.5
(Continued)

TABIE 81; (concluded)
Method or technique Agriculture Art Business Education English« N W .....% N % K %
Holding planned conferences with pipils 17 70.8 7 36.9 39 47.6 79 53.4Looking at pt$)il scrapbooks 11 U5.8 7 36.9 26 31.7 66 44.6Visiting piQ>jls' homes 22 91.7 5 26.3 22 26.8 S3 35.8Using attitude, interest.personality tests, scales 10 ia.7 k 21.1 36 43.9 58 39.2
Looking at piçil ccdlections 8 33.1; 9 47.1; 19 23.2 46 31.1
Keeping growth charts 11 i;5.8 3 15.8 43 52.4 40 27.0Using check lists 10 liL.7 k 21.1 28 34.1 41 27.7Using rating scales 7 29,2 2 10.6 33 40.2 43 29.1Reading piqpil autobiogrfgphies k 16.7 1 9.3 17 20.7 82 55.4Making tape or wire recordings 12 50.0 2 10.6 21 25.6 69 33.1Using work habit inventories 6 25.0 k 21.1 23 28.1 32 21.6Examining pnqpil diaries of class act. 8 33.1; 2 10.6 12 14.6 29 19.6using sociodrama . 3 12.5 1 5.3 13 15.8 28 18.9Making sociograms 5 20.8 1 5.3 11 13.4 22 14.8
ttoniber and per cent cf respondents Sli ïdo.ù I9 ioo.o bt idPIb' 1];8' "99V3
wro0\

TABLE 85NUMBER AND 1ER CENT OF TEACHERS IHDICATIIG THAT THE! IBE CERTAIN EVAlIttllON METHCDS AND TECHHIQDES, BI
SUBJECT AREAS
Method or techniqueSubject area which teachers consider an jar teaching asBignment Foreigi language Home ecmomics Ihduetrial arts MAtbemtice
%N N N NObserving dassrocan activities 36 9k.l 65 91*4 53 91.3 103 96.3Examining class written work 37 974 61* 88.9 38 61*. 9 106 99.1Using objective tests 33 86.8 60 83.3 1*5 77.2 92 86.0Conducting question-answer periods 36 9k.7 66 91.7 la 70.2 86 80.1*Talking informally with piçils 35 92.1 80.6 1*2 71.9 79 73.8Examining home written work 37 974 52 72.2 22 36.8 102 95.3Conducting pipil discussions 27 71.1 67 93.1 31 52.6 61* 59.8Talking informally with other teachers 29 76.3 57 79.2 32 51*.l* 78 72.9Listening to individual oral reports 27 71.1 58 80.6 26 1*3.9 51* 50.5Keeping your own record of class act. 28 73.7 1*8 66.7 1*0 68.1* 67 62.6Examining work products 20 52.6 66 91.7 53 91.2 60 56.1Using essay-iype tests 31 81.6 51 70.8 22 36.8 111* 1*1.0Using cumulative records 2k 63.2 ii5 62.5 33 57.1 76 71.0Using standardized or published tests 2h 63.2 35 1*8.6 23 38.6 80 7l*.8Observing piq)ils in out-of-class act. 25 65.8 1*8 66.7 25 1*2.1 56 52.3
Holding conferences with other teachers 21 55.2 39 51*.l 23 38.6 67 62.6Holding ccnferences with parents 25 65.8 la 56.9 21 35.1 60 56.1Planning activities with pupils 23 60.5 1*6 63.9 26 1*3.9 ill 38.3Examining ptpil note books 16 1*2.1 1*6 63.9 26 1*3.9 31 29.0Listening to panel discussions 16 1*2.1 38 52.8 18 29.8 31 29.0
(Continued)wro

TABLE 85 (Concluded)
Method or techniqueSubjecti area which teachers consider mjar teaching asisignmentForeign language Home economics Jhdustrial arts l thematics
N % N % N % N %
Holding planned conferences with pi ils 17 Wt#8 32 W*.L 19 31.6 1*6 1*3.0IiGoking at pupH scrapbooks 17 ip. 56.9 9 iU.0 22 20.6Visiting pupils» homes 12 31.6 38 52.8 20 33.3 33 30.8Being attitude, interest,personality tests, scales • lit 36.8 2ii 33.3 20 33.3 30 28.0
Looking at pupil collections 13 3k.l 28 38.9 11 17.6 23 21.5Keeping grcwth charts 10 26.3 18 25.0 19 31.6 31* 31.8Using check lists 13 3U.2 3U 1*7.2 18 29.8 , 18 16.8Using rating scales 12 31.6 21* 33.3 16 26.3 25 23.1*Heading pupil autobiographies 9 23.7 20 27.8 7 10.5 15 ll*.0Making tape or wire recordings 13 31.2 8 11.1 7 10.5 17 15.9
Using work habit inventories 9 23.7 29 1*0.3 18 29.8 17 15.9Examining pupil diaries of class act. 9 23.7 10 13.9 7 10.5 13 12.1Using sociodrama 12 31.6 13 18.1 8 12.3 11 10.3Making sociograms 9 23.7 12 16.6 6 8.8 11* 13.1
Number and per cent of respondents 3Ü 1ÔÔ.Ô n ÏÔÔ.Ô 57 98.3 i(5b.6
wro03

TABLE 86NUMBER AND PER CENT ΠTEACHERS INDICATING THAT THEY USE CERTAIN EVALUATION METHODS AND TECHNIQUES, BT
SUBJECT AREAS
Subject area which teac'iiers consider major teaching assignmenT Music Piw-sical education Science Social st^es
~ W ^ " N T H---%... K i ---Method cr technique
Observing classroom activities 35 89.7 53 89.8 87 90.6 137 93.2Examining class written work 23 59.0 41 69.5 88 91.7 137 93.2Using objective tests 21 53.9 43 72.9 90 93.8 136 92.5Conducting question-answer periods 20 51.3 36 61.0 90 93.8 143 97.3Talking Informally with pupils 33 84.6 51 86.9 73 76.1 122 83.0
Examining hcaoe written work 17 43.6 28 47.4 81 84.4 129 87.7Conducting pupil discussions 20 51.3 34 57.6 80 83.3 129 87.7Talking informlly with other teachers 28 71.8 41 69.5 71 74.0 110 74.8Listening to individual oral reports 21 53.8 27 45.8 81 84.4 129 87.7Keeping your own record of class act. 21 53.8 44 74.6 60 62.5 102 69.4
Examining work products 16 46.2 19 32.2 65 67.7 86 58.5Using essay-type tests 14 35.9 26 44.1 65 67.7 123 83.7Using cumulative records 16 la.o 36 61.0 58 60.4 100 68.0Using standardized cr published tests 16 I4I .0 25 42.4 63 65.6 102 69.4Observing piçils,in out-of-class act. 26 66.7 40 67.8 54 56.2 97 66.0
Holding conference with other teachers 21 53.8 39 67.1 51 53.1 99 67.4Holding conferences with parents 22 56.4 31 52.5 49 51.0 92 62.6Planning activities with piçils 24 61.6 35 59.3 47 48.9 85 57.8Examining ptpil notebooks 14 35.9 19 32.2 71 74.0 94 63.9Listening to panel discussions 16 41.0 19 32.2 42 43.8 102 69.4
(Continued) wI V >\D

TABIiE 86 (Concluded)Subject area which teachers consider major teaching assignment
Method or technique Music Physical education Science Social studiesN N. % N % N %
Holding planned conferences irith pupils 16 Itl.O 22 37.3 lilt lt5.8 79 53.8looking at pigil scrapbooks lit 35.9 20 33.9 39 ltO.6 68 U6.2Visiting pipils* homes 17 lt3.6 18 30.5 27 28.1 61 I1I .5Using attitude, interest,
personality tests, scales lit 35.9 22 37.3 26 27.1 58 39.5looking at pi^il collections 9 23.0 lit 23.7 52 51t.2 53 36.0
Keeping growth charts 8 20.5 2lt ltO.7 18 18.8 111 27.9using check lists 12 30.8 20 33.9 18 18.8 I40 27.2Using rating scales 9 23.0 18 30.5 20 20.8 111 27.9Reading piçil autobiogrsphies 10 25.6 11 18.6 lit llt.6 36 24.5Making tape or wire recordings 27 69.2 10 16.9 15 15.6 111 27.9
Using work habit inventories 10 25.6 9 15.3 18 18.8 35 23.8Examining ptgpil diaries of class act. 8 20.5 11 18.6 11 11.5 32 21.8Using sociodrama 8 20.5 9 15.3 7 7.3 31 21.1Making sociograms 7 17.9 9 15.3 9 9.it 32 21.8
Number and per cent of respondents 39 5 .1 59 5W.3 96 IÔÔ.Ô lU7 IÜÔ.0
U)wo

TABLE 87
NUMBER AND PER CENT CF TEACHERS INDICATING THE EXTENT TO NHICH P13PII5 DISCTBS THEIR IfRITTEN WORK INCIASS
Respondents Extent to which pig)il8 discuss their written work"Classification of teachers None Little Some Mtch
N N i N i N i n—All respondents ' ”'H57 93.1 23 2.7 88 Ï0.3 419 48.9 3&7 18.1City schools 1*78 91.7 17 3.5 54 11.3 214 44.8 193 40.4Exempted village schools 71 94.7 1 1.4 13 18.3 34 47.9 23 32.4Local Schools 308 94.8 5 1.6 21 6.8 171 55.5 111 36.1Junior-high schools 156 90.7 7 4.5 20 12.8 54 34.6 75 48.1Senior-high schools 83 92.2 4 4.8 6 7.2 36 43.4 37 44.6Four-year hi^ schools 178 93.2 2 1.1 20 11.2 108 60.7 48 27.0Six-year high schools làO 94.0 10 2.3 42 9.5 221 50.2 167 38.0m e Ui9 93.0 21 4.7 60 13.4 2a 49.2 147 32.7Female i*06 93.1 2 0.5 28 6.9 196 48.3 180 44.3 ;Age (20-29) 199 97.5 6 3.0 a 10.6 103 51.7 69 34.7Age (50 and over) 11:9 90.3 4 2.7 15 10.1 60 40.2 70 47.0Professional training:1; years 239 91.6 6 2.5 22 9.2 123 51.5 88 36.86 years and over 184 94.4 2 1.1 21 11.4 85 46.2 76 41.3
Teaching e^eriencet2 to U years 174 95.6 7 4.0 18 10.4 86 49.4 63 36.220 years and over 317 89.8 7 2.2 29 9.1 145 45.8 136 42.9
Last period of teacher training: 1930 - 1939 133 89.9 1 0.8 12 9.0 58 43.6 62 46.6 H1950 - 1952 336 94.9 12 3.6 44 13.1 163 48.5 117 34.8
(Continued)

TABLE 87 (Concluded)
Classification of teachersRespondents Extent to which pupils discuss their written work
None Little Sme MuchN N % N % N % N %
Course in educational tests andmeasurementt
les $89 93.9 20 3.1; 51; 9.2 295 50.1 220 37.3No 262 91.3 3 3.1 3k 13.0 122 1;6.6 103 39.3
JGverage enrollment in classes:20 and below 165 93.2 1 0.6 19 11.5 86 52.1 59 35.821-30 39I4 92.7 8 2.0 37 9.1; 190 i;8.2 ll;7 37.331-W 272 95.U 11 U.O 26 9.6 123 U5.2 112 J4I.2Over i*0 31 81.6 3 9.7 6 19.1; 17 5L8 5 16.1
Subject area •
Agriculture 23 95.8 2 8.7 11 U7.8 10 I13.5Art 11 57.9 2 18.2 1; 36.1 5 1)5.1;Business education 79 96.3 8 10.1 W 60.8 23 29.1English li*9 100.0 7 k.7 81 54.k 61 bO.9Foreign language 38 100.0 11; 36.8 21; 63.2
Heme economics 67 93.1 5 7.5 I;0 59.7 22 32.8Industrial arts U8 82.8 6 12.5 10 20.8 23 1;7.9 9 18.8Mathematics lOli 97.2 2 1.9 12 11.5 30 28.9 60 57.7Music 31 75.6 3 9.7 10 32.2 11; 1;5.2 k 12.9Physical education li7 78.3 8 17.0 9 19.2 22 L6.8 8 17.0
Science 92 95.8 8 8.7 50 54.3 3k 37.0Social studies iWt 98.0 k 2.8 11 7.6 76 52.8 53 36.8Other 2k 85.7 k 16.7 6 25.0 11; 58*3
U)VjJro
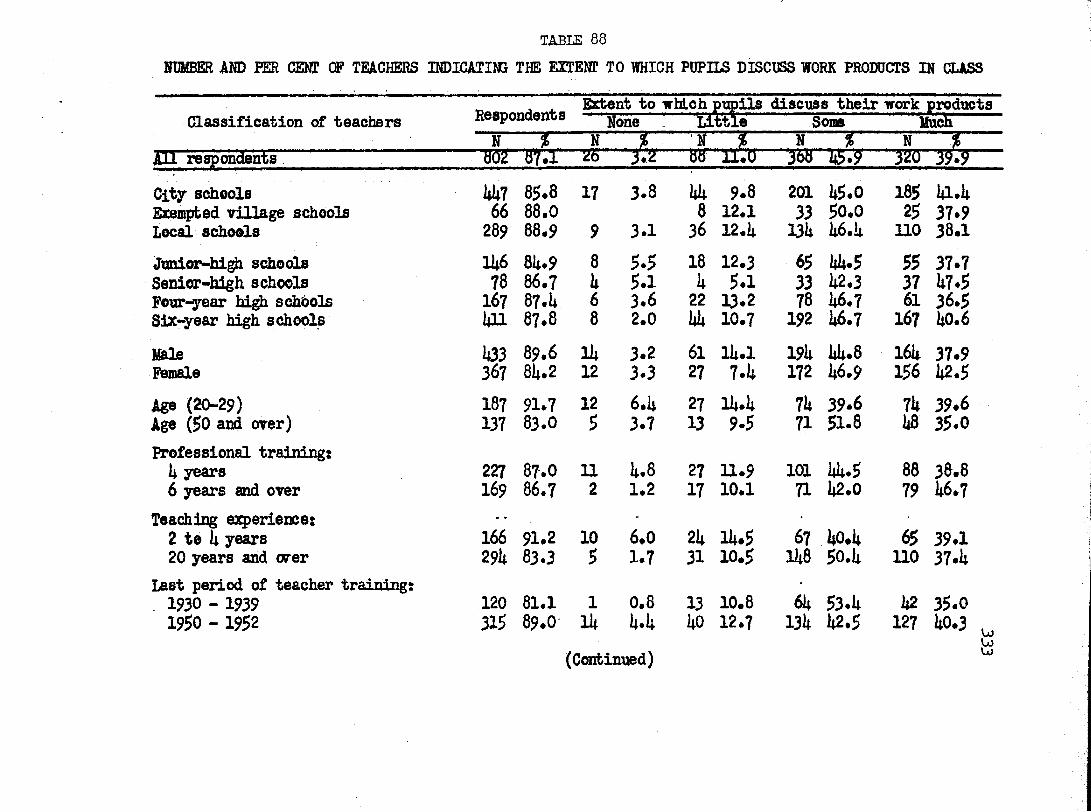
TABLE 88NUMBER AND PER CENT OF TEACHERS INDICATING THE EXTENT TO WHICH PUPILS DISCUSS WORK PRODUCTS IN CLASS
Classification of teachers Respondents ■ oneExtent to whLch pimils discnss their work productsÏ3!tiië Some MuckN N A N N N J .All respondents 8Ô2 87.1 26" 3.2 88 " m o 368 l & T ' 320 39.9
City schools kk7 85.8 17 3.8 là 9.8 201 1*5.0 185 1*1.1*Exempted village schools 66 88.0 8 12.1 33 50.0 25 37.9Local schools 289 88.9 9 3.1 36 12.4 131* 1*6.1* 110 38.1jhnlor-hi^ schools 1U6 81*.9 8 5.5 18 12.3 65 là.5 55 37.7Senior-high schools 78 86.7 k 5.1 h 5.1 33 1*2.3 37 1*7.5Peur-year high schools 167 87.1 6 3.6 22 13.2 78 1*6.7 61 36.5Six-year high schools liH 87.8 8 2.0 là 10.7 192 1*6.7 167 1*0.6Mais h33 89.6 Ih 3.2 61 ii*.i 191* là.6 161* 37.9Female 367 8L.2 12 3.3 27 7.1* 172 1*6.9 156 1*2.5Age (20-29) 187 91.7 12 6.U 27 ii*.i* 71* 39.6 71* 39.6Age (50 and over) 137 83.0 5 3.7 13 9.5 71 51.8 1*8 35.0Professional training:U years 227 87.0 11 L8 27 11.9 101 là.5 88 38.86 years and over 169 86.7 2 1.2 17 10.1 71 1*2.0 79 1*6.7
Teaching esqperience: - - ' •
2 te E years 166 91#2 10 6.0 2lt ll*.5 67 ào.l* 65 39.120 years and orer 29lt 83.3 5 1.7 31 10.5 11*8 50.1* 110 37.1*
Last period of teacher training: -
1930 - 1939 120 81.1 1 0,8 13 10.8 61* 53.1* 1*2 35.01950 - 1952 315 89.0 Ik LL 1*0 12.7 131* 1*2.5 127 ‘*0-3 u
(Continued) Ü

TABLE 88 (Concluded)
Classification of teachers Respondents Extent to -which pupils discuss their work products None Little Some Much
N % N % N % N N %
Gonrse in educational tests andmeasnrement;
les 87.2 15 2.7 62 11.3 21*7 1*5.2 223 1*0.8No 21i8 86.1* 11 l*.l* 25 10.1 118 1*7.6 91* 37.9
Average enrolLsent In classes s20 and belcw 162 91.5 1* 2.5 13 8.0 58 35.8 87 53.721-30 359 87.1 11* 3.9 1*3 12.0 162 1*5.1 11*0 39.031-liO 239 83.9 8 3.3 26 10.9 121* 51.9 81 33.9Over ho 33 86.8 5 15.2 18 54.5 10 30.3
Subject area:Agriculture 2k 100.0 1 1*.2 7 29.2 16 66.7Art 17 89.5 3 17.6 11* 82.4Business education 70 85.1* 1 1.1* 5 7.2 35 50.0 29 41.1*English 129 86.6 3 2.3 12 9.3 77 59.7 37 28.7Foreign languages 3h 89.5 3 8.8 1 2.9 18 53.0 12 35.3Hme economics 68 9l*.l* 1 1.5 3 l*.l* 17 25.0 1*7 69.1Industrial arts 55 9l*.8 1 1.8 18 32.7 36 65.5Mathematics 83 77.6 3 3.6 16 19.3 31 37.3 33 39.8Music 37 90.2 2 5.1* 8 21.6 12 32.1* 15 40.6Bgrsical education 1*6 76.7 6 13.1 7 15.2 22 1*7.8 11 23.9Science 89 92.7 1 1.1 13 14.6 50 56.2 25 28.1Social studies 126 85.7 5 l*.o 18 ll*.3 70 55.5 33 26.2Other 21* 85.7 1* 16.7 8 33.3 12 50.0
VjJVjJ4=-

table 89
NUMBER AND PER CENT CF TEACHERS INDICATING THE EXTENT TO WHICH PUPILS DISCUSS THE EFFECTIVENESS OFCROUP DISCUSSIONS IN CLASS
Classification of teacbws Respondents Extent to which piQ>il8 discuss effectiveness of groTg discussions
None little Some MackM J N N i N %
All respondents Ûk 79.7 1Ô9 301i iii.ii 12it 16.9Ciiy schools 397 76.2 61 I5.ii 103 25.9 166 ia.6 67 16.9Exempted village schools 62 82.7 7 n.3 19 30.6 29 li6.8 7 11.3Local schools 275 8U.6 111 lli.9 75 27.3 109 39.6 50 18.2Junior-high schools 129 75.0 30 23.3 31 2U.0 Ii9 38.0 19 lli.7Senior-high schools 67 7li.lt 10 Hi.9 11 16.U 3ii 50.8 12 17.9Four-jear high schools l6l 81.3 18 11.2 5k 33.5 67 lil.6 22 13.7Six-year high schools 377 80.6 51 13.5 101 26.8 15U liO.8 71 18.8Ifiale liOl 83.0 65 16.2 108 26.9 171 li3.Ii 51i 13.5Female 331 75.9 lili 13.3 88 26.6 129 39.0 70 21.1Age (20-29) 178 87.3 38 21.3 55 30.9 60 33.7 25 lli.lAge (50 and ever) 117 70.9 20 17.1 27 23.1 51 W.6 19 16.2Professional trainings
1* years 213 81.6 liO 18.8 63 29.6 80 37.5 30 lli.l6 years and over 159 81.5 12 7.5 39 2k.5 73 li5.9 35 22.0
Teaching experiences2 to U years 157 87.3 29 18.5 18 30.6 60 38.2 20 12.720 years and over 256 72.5 32 12.5 69 26.9 110 li3.0 ii5 17.6
Last period of teacher trainings 1930 - 1939 107 72.3 17 15.9 31 29.0 39 36.1 20 18.7 ^1950 - 1952 301 85.0 li9 16.3 91 30.2 115 38.2 1*6 15.3
(Continued)

TABLE 89 (Concluded)
Classification of teachers Respondents Extent to which pupils discuss effectiveness ofgroup discussions
None Little Some MuchH % N N i N N %
Course in educational tests and measurement:
Yes 503 80.2 68 13,5 139 27.6 211 1*2.0 85 16.9Ko 221* 78*0 1*0 17.9 57 25.1* 89 39,7 38 17.0
Average enrollment in classes:20 and belcw 1L3 80.8 22 15,1* 1*5 31,5 1*7 32.9 29 20.321-30 331 80.3 38 11,5 89 26.9 11*1* 1*3.5 60 18.131-10 221* 78.6 1*3 19,2 52 23.2 96 1*2.9 33 11*. 7Over itO 29 76.3 6 20.7 10 31*,5 12 1*1.1* 1 3,1*
Subject area:AgricultureArt
2010
83.352.6
3 15.0 1* 20.0 1* 1*0.0 9 1*5,0 1*6
20.060.0
Business education 55 67.1 8 ll*,5 19 3l*,5 20 36.1* 8 ll*,5English 131 87.9 11 8.1* 1*3 32.8 59 1*5.0 18 13,7Foreign language 27 71.1 9 33,3 7 25.9 8 29.6 3 11.1Home economics 60 83,3 5 8.3 15 25.0 21* 1*0.0 16 26.7industrial arts 15 77.6 10 22.2 11* 31,1 33 28.9 8 17.8Mathematics 67 62.6 13 19,1* 20 29.9 26 38.8 8 11.9Music 32 78.0 9 28.1 8 25.0 10 31,3 5 15,6Physical education 1*8 80.0 12 25.0 10 20.8 20 ia.7 6 12.5
Science 83 86.5 15 18.1 18 21.7 1*3 51,8 7 8.4Social studies 132 89.8 33 9,8 28 21.2 61* 1*8.5 27 20.5Other 21* 85.7 1 1*.2 7 29.2 8 33.3 8 33,3
wU)On

TABLE 90NUMBER ifflD PER CENT OF TEâCHHîS INDICATING THE EXTENT TO WHICH PUPIIS DISCUSS THE OUTCOMES OF GROUP
UNDERTAKINGS IN CIASS
Classification of teachers Respondents Extent to which pupils discuss out comes of groupundertakings None Little Some Much
N % N » % N %All respondents 739 8o.2 io.lt UtB 3ltl lt6.ë lt3 23.itCity schools 393 75.li kS 11.5 71 18.1 186 lt7.3 91 23.2Exempted village schools 6k 85.3 6 9.1t 16 25.0 30 lt6.9 12 18.7Local schools 282 86.8 26 9.2 61 21.7 125 Wt.3 70 2it.8Jnnioivhigh schools 127 73.8 18 llt.2 27 21.2 56 ltlt.l 26 20.5Senioivhigh schools 71 78.9 7 9.9 11 15.5 36 50.7 17 23.9Four-year high schools 15h 80.6 lit 9.1 31 20.1 78 50.6 31 20.1Six-year high schools 387 82.7 38 9.8 79 20.lt 171 lilt.2 99 25.6
Male 396 82,0 lt8 12.1 82 20.7 188 lt7.5 78 19.7Female 3ia 78.2 29 8.5 65 19.1 153 ltlt.9 9lt 27.6
Age (20-29) 179 87.7 28 15.6 29 16.2 86 lt8.1 36 20.1Age (50 and over) 121 73.3 lit 11.6 28 23.1 57 li7.1 22 18.2Professional trainings
li years 213 81.6 37 i7.lt Itl 19.2 91 lt2.7 Itlt 20.76 years and over 161 82.6 5 3.1 25 15.5 83 51.6 it8 29.8
Teaching experiences2 to b years 157 86.3 25 15.9 27 17.2 7lt lt7.1 31 19.820 years and orer 255 72.2 18 7.0 62 2lt.3 119 lt6.7 56 22.0
Last period of teacher trainings1930 - 1939 . 103 69.6 9 8.7 26 25.3 38 36.9 30 29.1 y1950 - 1952 308 87.0 33 10.7 63 20.5 llt8 it8.0 61t 20,8
(Continued)

TABLE 90 (Concluded)
Classification of teachers Respondents Extent to which pupils discuss outcomes of grotpundertakingsNone Little Some Much
N % N % N % N % N %Course in educational tests andmasurement:
Tes 510 81.3 51 10.0 105 20,6 238 I46.7 116 22.7No 222 77.14 26 11.7 I4I 18.5 100 145.0 55 2I4.8
Average enrollment in classes:20 and belcw Hil 85.3 12 8.5 26 18.i4 67 I47.5 I46 32.621-30 322 78.2 35 10.8 7I4 23.0 H49 I46.3 6I4 19.931-UO 226 79.3 25 11.1 I42 18.6 108 147.8 51 22.5Over ko 31 71.6 5 16.1 5 16.1 12 38.7 9 29.1
Subject area:Agriculture 22 91.7 3 13.6 7 31.8 12 5I4.5Art 11 57.9 1 9.1 1 9.1 3 27.3 6 5I4.5Business education Si 69.5 5 6.8 10 17.5 33 57.9 9 15.8En^ish 128 85.9 l4 3.1 37 28.9 65 50.8 22 17.2Foreign language 28 73.7 11 39.3 I4 II4.3 10 35.7 3 10.7Home econmics 65 90.3 1 1.5 8 12.3 28 li3.1 28 I43.Iindustrial arts kk 75.9 10 22.7 7 15.9 17 38.7 10 22.7Mathematics 62 57.9 12 19.14 16 25.8 27 I43.5 7 11.3Music 37 90.2 5 13.5 I4 10.8 12 32.I4 16 I43.3Physical education SO 83.3 7 II4.0 12 214.0 19 38.0 12 2I4.OScience 82 85.14 8 9.7 16 19.5 I45 54.9 13 15.9Social studies 129 87.8 10 7.8 28 21.7 65 50.I4 26 20.1Other 214 85.7 3 12.5 2 8.3 10 I4I.7 9 37.5
\jüw00

TABLE 91NUMBER AND PER CENT CF TEACHERS INDICATIMÎ THE EXTEHT TO WHICH PUPILS DISCUSS THE]R WCEK HABITS IN
CIASSExtent to which pnpUs discuss work habits
Respondents None mLittle Some UochN N * N N N T ” ’ -
All respondents 831 90.2 55 6.6 223 26.8 398 1*7.9 155 18.7Cllgr schools k5k 87.2 30 6,6 97 a.l* 232 51.1 95 20.9E%en#ed village schools 70 93.3 3 li.3 22 31.L 35 50.0 10 11*.3Local schools 307 9it.5 22 7.1 lOli 33.9 131 1*2.7 50 16.3Junior-high schools IW 86.0 7 k.7 3k 23.0 83 56.1 21* 16.2Senior-high schools 78 86.7 7 9.0 12 15.1* 1*1 52.5 18 23.1Four-year high schools 173 90.6 15 8.7 52 30.1 80 1*6.2 26 15.0Six-year high schools k32 92.3 26 6.0 125 29.0 191* 1*1*.9 87 20.1Male lt35 90.1 3h 7.8 13k 30.8 200 1*6.0 67 15.1*Female 39k 90.1i 21 5.3 89 22.6 196 1*9.7 88 22.3Age (20-29) 193 9k.6 21 10.9 63 32.6 77 39.9 32 16.6Age (go and over) 137 83.0 8 5.8 32 23.1* 71* 51*.0 23 16.8Professional trainings
years 2ia 92.3 21 8.7 78 32.% 101 1*1.9 1*1 17.06 years and over 170 87.2 9 5.3 37 21.8 81* 1*9.1* %0 23.5
Teaching experience:2 to k years 171 9b.O 16 9.1 k9 28.7 77 1*5.0 29 16.920 years and over 301 8g.3 Ik k.7 73 2%.2 159 52.8 55 18.3
Last period of teacher trainings1930 - 1939 127 85.8 10 7.9 35 27.6 60 1*7.2 22 17.319^0-1952 331 93.5 30 9.1 90 27.2 153 1*6.2 58 17.5 w
(Continued) VO

TABLE 91 (Concluded)
Classification of tsachers Hespondents Extent to which pupils discuss work habits N(me Little Some Much
N % N % N % N % N %
Course in educational tests and measurement:
Tes 575 91.7 32 5.6 165 28.7 271* 1*7.6 101; 18.1No 2h9 86.8 23 9.2 56 22.5 120 1*8.2 50 20.1
Average enroUaenb in classes:20 and beloir 166 93.8 13 7.8 1*8 28.9 63 38.0 1*2 25.321-30 367 89.1 25 6.8 103 28.1 178 1*8.5 61 16.631-W 259 90.9 16 6.2 65 25.1 130 50.2 1*8 18.5Over liO 31 81.6 1 3.2 6 19.1* a 67.7 3 9.7
Subject area:Agriculture 22 91.7 1 1*.5 7 31.8 7 31.8 7 31.8ArtBusiness education
1271
63.286.6 1* 5*6
217
16.723.9
633
50.01*6.5
1*17
33.321;.0English 1U3 96.0 3 2.1 la 28.7 83 58.0 16 11.2Foreign language 3h 89.5 6 17.6 3 8.8 19 55.9 6 17.7Home economics 69 95.8 3 1*.3 11* 20*3 28 1*0.6 21* 3l*.8Industrial arts 53 91.1* 3 5.7 11* 26.1; 20 37.7 16 30.2Mathematics 90 81*.l 5 5.6 28 31.1 1*5 50.0 12 13.3Music 38 92.7 1* 10.5 8 21.1 18 1*7.1* 8 21,1Itysical education 1*7 78.3 5 10.6 35 31.9 18 38.3 9 19.2
Science 89 92.7 7 7.9 26 29.2 1*6 51.7 10 11.2Social studies 139 91*.6 13 9.1* 1*0 28.8 67 1*8.2 19 13.6Other 21* 85.7 1 1*.2 8 33.3 8 33.3 7 29.2
u>g

APPEÎ'JDIX D
3ia

TABLE 92
JTDGMENTS OF TEACHERS REGARDING THE ADEQUACY OF EVALIATION OF SUBJECT ACHIEVEMENT OF PUPILS
Classification of teachers
Teachers indicating achievement of pupils
Respondents Not at all Inadequately Fairly well Adequately
ISAverageadequacyrating
% N % N % - N .. % N %City schools h96 95.2 13 2.6 27 5.5 252 50.8 204 41.1 2.3Exempted village schools Ik 98.7 1 1.3 9 12.2 39 52.7 25 33.8 2.2Local schools 323 990 10 3 .1 22 6.8 202 62.5 89 27.6 2.1Junior high schools 165 95.9 7 k-2 12 7.3 86 52.1 60 36.4 2.2Senior high schools 86 95.6 2 2.3 2 2.3 U7 51,7 35 40.7 2.3Four-year high schools 183 95.8 7 3.8 18 9.8 102 55.8 56 30.6 2,1Six-year high schools 159 98.1 8 1.7 26 5.7 258 56.2 167 36.4 2.3Male U77 98.8 Ih 2.9 27 5.7 27i; 56.L 162 34.0 2.2Female 101; 95.0 10 2.i| 31 7.5 217 52.L 156 37.7 2.3Age (20 - 29) 201 98.5 k 2.0 16 8.0 129 64.1 52 25.9 2.1Age ($0 and over) 156 91.5 5 3 .2 9 5.8 81 51.9 61 39.1 2.3Professional training:k years 2li8 95.0 8 3.2 19 7.7 1Ü9 60.1 72 29.0 2.16 years and over 189 96.9 h 2.1 13 6.9 95 50.3 77 40.7 2.3
Teaching experience:2 to h years 180 98.9 6 3.3 11 6.1 113 62.8 50 27.8 2.120 years and over
Last period of teacher training:3iO 96.6 7 2.1 18 5.3 175 51.3 141 41.3 2.3
1930 - 1939 lli2 95.9 2 l.ll U 7.7 7L 52.1 55 38.7 2.31950 - 1952 3kh 97.2 13 3.8 23 6.7(Continued)
213 61.9 95 27.6 2.1

TABEE 92 (Concluded)
Classification of teachers RespondentsTeachers indicating that subject achievement of pupils is evaluated; AverageNot at all Inadequately Fairly well Adequately adequacy
ratingN ^ N % ___N_ . 2 . N % % -
Course in educational testsand measurements;
les 613 97.8 12 1.9 36 5.9 31+2 55.8 223 36.1+ 2.3No 271+ 95.5 12 1+.1+ 22 8.0 11+9 51+.1+ 91 33.2 2,2
Average enrollment in classes;20 and below 170 96.0 3 1.8 11+ 8.2 100 58.8 53 31.2 2.221 - 30 1+01 97.3 11 2.7 17 1+.2 223 55.6 150 37.1+ 2.331 - iiO 280 98.2 10 3.6 23 8.2 11+9 53.2 98 35.0 2,2Over 1+0 3L 89.5 1+ 11.8 18 52.9 12 35.3 2,2
Subject area;Agriculture 23 95.8 2 8.7 11 1+7.8 10 1+3.5 2,3Art 17 89.5 1 5.9 1 5 .9 10 58.8 5 29.1+ 2,1Business education 79 96.3 5 6.3 1+8 60.8 26 32.9 2.3English 11+7 98.7 1+ 2.7 11+ 9.5 78 53.1 51 3I+.7 2,2Foreign language 37 97.1 2 5.k 1 2.7 16 1+3.2 18 1+8.7 2.1+Home economics 69 95.8 1 1.1+ 7 10.2 1+2 60.9 19 27.5 2.1Industrial arts 56 96.6 3 5.1+ 1+ 7.1 33 58.9 16 28.6 2.1Mathematics 105 98.1 1+ 3.8 55 52.1+ 1+6 1+3.8 2,1+Music 39 95.1 1+ 10.3 1+ 10.3 23 58.9 8 20.5 1.9Physical education 56 93.3 5 8.9 6 10.7 29 51.8 16 28,6 2,0Science 95 99.0 2 2.1 5 5.3 1+8 50.5 1+0 1+2.1 2,3Social studies 11+5 98.6 2 1.1+ 5 3.1+ 87 60.0 51 35.2 2.3Other 25 89.3 13 52.0 12 i+8.0 2,5
er

TABIS 93JUDGMENTS OF TEACHERS REGARDING THE ADEQUACY OF EVALUATION OF ATTITUDES OF PUPILS
Classification of teachers RespondentsTeachers indicating that attitudes of
pupils are evaluated:Not at all Inadequately Fairly well Adequately
Averageadequacy
N N % N i N % N i ratingCity schools $03 96.5 3h 6.7 102 20.3 255 50.7 112 22.3 1 .9Exempted village schools 73 97.3 1 l.ii 23 31.5 37 50.7 12 16. k 1.8Local schools 325 100.0 22 6.8 75 23.1 158 k8.6 70 21.5 1.8Junior high schools 165 95.9 lli 8.5 31; 20.6 80 k8.5 37 22,k . 1.8Senior high schools 88 97.8 6 6.8 13 Ik.8 k7 53.k 22 25.0 2.0Four-year high schools 187 97.9 12 6.ii 1|2 22.5 96 51.3 37 19.8 1.8Six-year high schools li6l 98.5 25 5.ii 111 2k. 1 227 k9.2 98 21.3 1.8Male m 98.1 26 5.5 119 25.1 236 k9.8 93 19.6 1.8Female I&25 97.5 31 7.3 81 19.0 212 k9.9 101 23.8 1.9Age (20 - 29) 203 99.5 22 30.8 39 19.2 10k 51.3 38 18.7 1.8Age (50 and over) 158 95.8 11 7.0 22 13.9 92 58.2 33 20.9 1.9Professional training:It years 2li8 95.0 21 8.2 50 19.6 13k 52.5 50 19.6 1.86 years and over 189 96.9 7 3.7 k5 23.8 92 k8.7 k5 23.8 1.9
Teaching experience:2 to b years 181 99.5 15 8.3 32 17.7 9k 51.9 kO 22.1 1.920 years and over 3ia 96.9 15 k»k 60 17.6 191 56.0 75 22.0 2.0
Last period of teacher training: 1930 - 1939 lii3 96.6 6 L2 32 22.k 70 k8.9 35 2k.5 1.91950 - 1952 318 98.3 28 8.0 9k 27.0 151 k3.k 75 21.6 1.8
(Continued)VjJ

TABIS 93 (Concluded)
Classification of teachers T? o s-n nnH n+. sTeachers indicating that attitudes of
pupils are evaluated: AverageNot at all Inadequately Fairly well Adequately adequacyratingN % N % N % N ^ N %
Course in educational tests and measurement s î
Yes 615 98.1 39 6.3 ll3 23.3 300 18.8 133 21.6 1.9No 279 97.2 18 6.5 57 20.1 117 52.7 57 20.1 1.9
Average enrollment in classes:20 and below 175 98.9 13 7.1 lo 22,9 82 16.8 10 22.9 1.92 1 -3 0 loo 97.1 25 6.3 89 22.2 207 51.7 79 19.8 1 .931 - 1|0 281 98.6 19 6.8 65 23.1 138 19.1 59 21.0 1.8Over IiO 37 97.1 6 16.2 19 51.1 12 32.1 2.2
Subject area: Agriculture 23 95.8 1 1.3 6 26.1 10 13.5 6 26.1 1.9Art 18 91.7 2 11.1 2 U.l 10 55.6 h 22.2 1.9Business education 80 97.6 2 2.5 17 21.2 16 57.5 15 18.8 1.9English 118 99.3 8 5.1 32 21.6 7l 50.0 31 23.0 1.9Foreign language 37 97.1 k 10.8 10 27.0 19 51.1 h 10.8 2.2Home economics 70 97.2 8 11. li 13 18.6 30 12.9 19 27.1 1.9Industrial arts 55 91.8 k 7.3 13 23.6 26 I7.3 12 21.8 1.8Mathematics 103 96.3 11 10.7 28 27.2 50 18.5 11 13.6 1.7Music n 100.0 k 9.7 7 17.1 23 56.1 7 17.1 1.8Physical education 59 98.3 2 3.1 9 15.2 25 12.1 23 39.0 2.2Science 95 99.0 2 2.1 23 21.2 17 19.5 19 20.0 1.8Social studies 115 98.6 3 2.1 32 22,0 79 51.5 31 21.1 2.0Other 27 96.1 2 7.1 8 29.6 11 10.8 6 22.2 1.8 VjO

TABIS 9h
JUDGiæNTS QF TEACHERS REGARDING THE ADEQUACY OF EVALUATION OF INTERESTS OF PUPILS
Classification of teachers RespondentsTeachers indicating that interests of
pupils are evaluated: AverageNot at all Inadequately Fairly well Adequately adequacy
N % N % _ N..2 . ..N.__ ...1 N %rating
City schools 500 96.0 I43 8.6 101 20.2 21|2 li8.lt nil 22.8 1.9Exempted village schools .98.7 1 l.ll 21| 32.I1 30 I1O.5 19 25.7 1.9Local schools 323 99.k 2I4 7.I1 72 22.3 150 li6.lt 77 23.8 1.9
Junior high schools 165 95.9 111 8.5 38 23.0 70 1|2.1| 43 26.1 1.9Senior high schobls 814 93.3 9 10.7 16 19.0 lt5 53.6 111 16.7 1.8Four-year high schools 185 96.9 15 8.1 ll3 23.3 92 li9.7 35 18.9 1.8Six-year high schools L63 98.9 30 6.5 100 21.6 215 l|6.it 118 25.5 1.9Male 1|73 97.9 39 8.2 119 25.2 220 I16.5 95 20.1 1.8Female 122 96.8 29 6.9 78 18.5 202 1i7.8 H3 26,8 1.9Age (20 - 29) 203 99.5 16 7.9 5I1 26.6 85 111. 9 I18 23.6 1.8Age (50 and over) 158 95.8 15 9.5 35 22.1 78 lt9.lt 30 19.0 1.8Professional training:
L years 252 96.6 111 5.6 61 2i|.2 117 lt6.it 60 23.8 1 .96 years and over 189 96.9 13 6.9 i|0 21.2 95 50.2 111 21.7 1.9Teaching experience:
2 to b years 181 99.5 15 8.3 1|6 25.lt 78 li3.1 42 23.2 1.820 years and over
Last period of teacher training:96.6 31 9.1 65 19.1 169 I19.5 76 22.3 1.9
1930 - 1939 llili 97.3 12 8.3 28 19. It 80 55.6 24 16,7 1.91950 - 1952 3I46 97.7 23 6.6 92 26.6
(Continued)153 Itlt. 2 78 22.6 1.8 L

TABLE 9h (Concluded)
Classification of teachers RespondentsTeachers indicating that interests of
pupils are evaluated:Not at all Inadequately Fairly well Adequately Averageadequacy
ratingN K % N N % N %Course in educational tests and measurementSî Yes 610 97.3 1+9 8.0 132 21.6 283 1+6.1+ 11+6 23.9 1 .9No 280 97,6 19 6.8 65 23.2 133 1+7.5 63 22.5 1.9
Average enrollment in classes 20 and below "l7% 97.2 11 6.1+ 1+5 26.2 76 1+1+.2 1+0 23.2 ' 1.621 - 30 1+02 97.6 39 9.7 78 19.1+ 200 1+9.8 85 21.1 1.831 - Lo 279 97.9 15 5.1+ 66 23.7 127 1+5.5 71 25.1+ 1.9Over 1+0 36 91+.7 3 8.3 8 22.2 15 1+1.7 10 27.8 1.9
Subject area; Agriculture 23 95.8 1 1+.3 3 13.1 13 56.5 6 26.1 2.0Art 18 91+.7 2 11.1 1+ 22.3 6 33.3 6 33.3 1.9Business education 78 95.1 1+ 5.1 21 26.9 35 I+I+.9 18 23.1 1.9English lii7 98.7 13 8.8 20 13.6 73 1+9.7 1+1 27.9 2.0Foreign language 38 100.0 3 7.9 8 21.0 21 55.3 6 15.8 1.8Home economics 71 98.6 7 9.9 17 23.9 32 1+5.1 15 21.1 1.8Industrial arts S1+ 93.1 7 13.0 12 22.2 26 1+8.1 9 16.7 1.7Mathematics 103 96.3 11 10.7 32 31.1 1+6 1+1+.6 11+ 13.6 1.6Music W 97.6 5 12.5 12 30.0 20 50.0 3 7.5 1.5Physical education 59 98.3 3 5 .1 21+ 1+0.7 32 54.2 2.5Science 95 99.0 9 9.5 30 31.6 1+1 1+3 .1 15 15.8 1.7Social studies 11+1+ 98.0 5 3.5 32 22.2 68 1+7.2 39 27.1 2.0Other 27 96.1+ 1 3.7 3 11.1 17 63.0 6 22.2 2.0
LuKt»

TABIE 95
JUDGMENTS OF TEACHERS REGARDING THE ADEQUACY OF EVALUATION OF PERSONAL-SOCIAL ADJIBTMENT OF PUPILS
Classification of teachers Respondents jjQ-t at all"N N T
Teachers indicating that personal-social adjustment of pupils is evaluated;]jiadequatel7 Fairly well Adequately
N N T NAverageadequacyrating
City schools l9l 91.8 59 11.9 151 30.6 206 ÜL.7 78 15.8 1.6Exempted village schools 73 97.3 8 11.0 2k 32.9 29 39.7 12 16.1; 1.6Local schools 319 98.2 hS lk.l 107 33.6 136 1:2.6 31 9.7 1.5
Junior high schools 163 91.8 22 13.5 39 23.9 72 là. 2 30 18.1; 1.7Senior high schools 83 92.2 12 1L.5 25 30.1 31 37.3 15 18.1 1.6Four-year high schools 183 95.8 2k 13.1 59 32.2 86 L7.0 11; 7.7 1 .5S ix -y ea r h ig h schools hSl 97.6 5k 11.8 159 34.8 182 39.8 62 13.6 1.6Male 16? 96.7 60 12.8 171 37.3 181 38.8 52 11.1 1.5Female iP-7 95.6 52 12.5 107 25.7 189 L5.3 69 16.5 1.7Age (20 - 29) 202 99.0 3k 16.8 66 32.7 80 39.6 22 10.9 1.1;Age (50 and over) 155 93.9 16 10.3 ks 31.6 72 I46.5 18 11.6 1.6Professional training:k years 251 96.2 35 lU.o 82 32.7 101 1:0,2 33 13.1 1.56 y ea rs and over
Teacüiui dxperiencet185 9U.9 16 8 .6 56 30.3 81 U3.8 32 17.3 1.7
? io i yeârs m H i éi 33.5 êi 31.i 23 1 3 .3 1 .520 y ea rs and over 335
Last period of teacher training:9h.9 39 11.6 106 31.7 lh.6 U3»6 hk 13.1 1 .6
1930 - 1939 li|2 95.9 15 10.5 Ul 28.9 61; U5.1 22 15.5 1.61950 - 1952 3hh 97.2 53 15.1 120 31.9
(Continued)126 36.6 k5 13.1 1.5 5

TABIE 95 (concluded)
Classification of teachers RespondentsTeachers indicating that personal-social adjustment of pupils is evaluated; Averageadequacyrating
Hot at all Inadequately Fairly well AdequatelyN _ % % . _ N % H ( H %
Course in educational tests and measurements:les 60ii 96.3 68 11.3 192 31.8 254 42.0 90 14.9 1.6Ho 275 95.8 kh 16.0 88 32.0 116 42.2 27 9.8 1.5
Average enrollment in classes:20 and below 171 96.6 28 16.14. 50 29.2 74 43.3 . 19 11.1 1.521 - 30 39h 95.6 hi 11.9 127 32.2 166 42.2 54 13.7 ' 1.631 - kO 279 97.9 35 12.5 90 32.3 116 41.6 38 13.6 1.6Over UO 3k 89.5 2 5.9 13 38.2 12 35.3 7 20.6 1.7
Subject area:Agriculture 23 95.8 k n.k 9 39.1 6 26.1 4 17.4 1.4Art 15 78.9 k 26.7 7 16.7 2 13.3 2 13.3 1.1Business education 78 95.1 13 16.7 21: 30.8 32 41.0 9 11.5 1.5English 1U7 98.7 12 8.2 1:8 32.7 64 43.5 23 15.6 1.7Foreign language 38 100,0 ii 10.5 9 23.7 17 44.7 8 21.1 1.8Home economics 70 97.2 15 21.k 15 21.1: 30 42,9 10 14.3 1.5Industrial arts 55 9k.8 9 16.b 21 38.2 22 40.0 3 5.4 1.3Mathematics 99 92.5 13 13.1 35 35.1: 42 42.4 9 9.1 1.5Music 39 95.1 5 12.8 10 25.7 17 43.6 7 17.9 1.7Physical education 58 96.7 9 15.5 ll: 21:. 1 23 39.1 12 20.7 1.7Science 95 99.0 n 11.6 38 1:0.0 38 40.0 8 8.4 1.5Social studies 1U3 97.3 12 8.1: k3 30.1 69 48.2 19 13.3 1.7Other 26 92.9 1 3 .9 9 34.6 9 34.6 7 26.9 1.8
5C O

TABIE 96JUDGMENTS OF TaCEERS REGARDING THE ADEQUACY OF EVALUATION OF WEK HABITS OF PUPILS
Classification of teachersTeachers indicating that work habits
_____________ of niioils are evaluated;______itesponaemis Inadequately Fairly well Adequately Averageadequacy
N % N % N % N % N % ratingCity schools soh 96.7 19 3 .8 70 13.9 2k9 k9.k 166 32.9 2.1Exempted village schools 73 97.3 7 9 .6 10 13.7 kO 5k.8 16 21.9 1.8Local schools 322 99.1 16 k.9 73 22.7 168 52.2 65 20.2 1.9Junior high schools 168 97.7 8 k.8 25 Ik. 9 83 k9.k 52 30.9 2.1Senior high schools 88 97,8 2 2.3 7 8.0 k5 51.1 3k 38.6 2.3Four-year high schools iBli 96.3 11 6.0 37 20.1 91 k9.k k5 2k.5 1.9Six-year high schools k$9 98.1 21 k.6 8k 18.3 238 51.8 116 25.3 2.0Male hlS 98.3 17 3.6 92 19.k 2k9 52.k 117 2k.6 2.0Female 1|22 96.8 25 5.9 61 Ik. 5 206 k8.8 130 30.8 2.0Age(20 - 29) 201 98.5 Ik 7,0 38 18.9 105 52.2 kk 21.9 1.9Age (50 and over) 161 97.6 5 3 ,1 25 15.5 76 k7.2 55 3k, 2 2.1Professional training:
1; years 25k 97.3 15 5.9 k5 17.7 136 53.6 58 22.8 1 .96 years and over 190 97.k 6 3,2 31 16.3 95 50.0 58 30.5 2.1Teaching experience:
2 to b years 179 98.k 10 5 .6 36 20.1 91 50,8 k2 23.5 1.920 years and over Last period of teacher
3k3training:
97,2 10 2.9 5k 15,7 171 k9.9 108 31.5 2.1
1930 - 1939 lk5 98.0 6 k.l 21 lk.5 69 k7.6 k9 33,8 2.01950 - 1952 3k7 98.0 21 6.1 66 19.0
(Continued)180 51,9 80 23.0 1 .9
w

TABEE 96 (Concliided)
Classification of teachers RespondentsTeacherà indicating that work habits
of pupils are evaluated; AverageadequacyratingNot at all Inadequately Fairly well Adequately
N % N % N i N % NCourse in educational testsand measurements; I
res 615 98.1 27 it.it 107 i7.lt 306 it9.7 175 28.5 2 .0No 277 96.5 15 5.it it5 16.2 lit? 53.1 70 25.3 , 2 .0
Average enrollment in classes20 and below 172 97.2 7 it.l 23 i3.it 92 53.5 50 29.0 2.121 - 30 ii06 98.5 lit 3.it 68 16.8 211 52.0 113 27.8 2.031 - ko 278 97.5 18 6.5 55 19.8 137 it9.3 68 2it.it 1.9Over UO 35 92.1 3 8.6 6 17.1 lit itO.O 12 31.3 2.0
Subject area;Agriculture 23 95.8 1 it.3 1 it.3 12 52.2 9 39.2 2.3Art 16 8b.2 2 12.5 8 50.0 6 37.5 2.3Business education 78 95.1 2 2.6 7 9.0 lt5 57.7 2lt 30.7 2.2English 149 100.0 10 6.7 28 18.8 75 50.3 36 2it.2 1.9Foreign language 37 97.1 8 21.6 15 itO.6 lit 37.8 2,2Home economics 70 97.2 8 ll.lt 8 ll.it 30 it2.9 2it 3it.3 2.0industrial arts 56 96.6 7 12.5 22 39.3 27 lt8.2 2.itMathematics 106 99.1 2 1.9 2it 22.6 61 57.6 19 17.9 1.9Music 10 97.6 6 15.0 9 22.5 15 37.5 10 25.0 1.7Physical education 55 91.7 3 5.5 12 21.8 28 50.9 12 21.8 1.9Science 95 99.0 2 2.1 19 20.0 52 5it.7 22 23.2 2.0Social studies lit? ODOjO 7 it. 8 23 15.6 83 56.5 3it 23.1 2.0Other 25 89.3 2 8.0 it 16.0 13 52.0 6 2lt.0 1.9
U)vaO

TABLE 91JUDGMENTS OF TEACHERS REGARDING THE ADEQUACÏ OF EVALUATION OF THE HEALTH CF PUPH-S
Classification of teachers RespondentsTeachers indicating that the health
of pupils is evaluated: AverageNot at all Inadequately Fairly well Adequately adequacy
N % N % N % N % N %rai
City schools 502 96.li 39 7.8 105 20.9 221 kk.O , 137 27.3 1.9Exempted village schools 73 97.3 7 9.6 27 37.0 2 7 3 7 .0 12 I6.k 1.6Local schools 320 98.5 66 17.5 99 30.9 118 36.9 k7 Ik. 7 1.5Junior high schools 165 95.9 11 6.7 28 16.9 80 k8.5 k6 27.9 2 .0Senior high schools 89 98.9 9 10.1 15 16.9 ko kk.9 25 28.1 1.9Four-year high schools I8li 96.3 26 lk.l 59 32.1 6k 3k«8 35 19.0 1.6Six-year high schools 157 97.6 56 12.3 129 28.2 182 39.8 90 19.7 1.7
Male klO 97.3 62 13.2 136 28.9 192 kO.9 80 17.0 1.6Female 123 97.0 ko 9.5 9k 22.2 17k kl.l 115 27.2 1.9Age (20 - 29) 201 98.5 36 17.9 53 26.k 66 32.8 k6 22.9 1.6Age (50 and ever ) ■ 159 96.k 12 7.5 32 20.1 81 51.0 3k 21.k 1.9Professional training:ii years 251 96.2 32 12.7 6k 25.5 10k kl.k 51 20.3 1.76 years and over 188 96.k 15 8.0 k7 25.0 8k kk-7 k2 22.3 1.8
Teaching experience:2 to li years 180 98.9 28 15.6 5k 30.0 61 33.9 37 20.5 1.620 years and over 3i|5 96.9
Last period of teacher training:30 8.8 81 23.7 159 k6.5 72 21.0 1.8
1930 - 1939 lk5 98.0 15 10.3 ko 27.6 56 38.6 3k 23.5 1.71950 - 1952 3k3 96.9 59 17.2 98 28.6
(Continued)116 33.8 70 20.k 1.6

TABLE 91 (Concluded)
Classification of teachers RespondentsTeachers indicating that the health
of pupils is evaluated: AverageNot .at all Inadequately :Fairly well Adequately adequacyratingN % N % N % N % N %
Course in educational tests and measurements:
les 611 91*h 62 10.1 165 27.0 245 40.1 139 22.8 1.8No 277 96.5 39 lii.l 65 23.5 118 42.6 55 19.8 1.7
Average enrollment in classes: 20 and beloisr 168 9k.9 3k 20.2 ii9 29.2 . •58 34.5 27 16.1 1.521 - 30 iiOli 98.1 38 9.ii 112 27.7 162 40.1 92 22.8 1.831 - ko 280 98.2 25 8.9 61 21.8 129 46.1 65 23.2 1.8Over W 35 92.1 ii ll.ii 8 22.9 11 31.4 12 34.3 1.9
Subject area: Agriculture 23 95.8 7 30.ii 8 34.8 6 26.1 2 8.7 1.1Art 16 8Ü.2 li 25.0 3 18.8 2 12.5 7 43.7 1.8Business education 79 96.3 11 .13.9 23 29.1 36 45.6 9 11.4 1 .5English 11:8 99.3 13 8.8 iiii 29.7 62 41.9 29 19.6 1.7Foreign language 38100.0 ii 10.5 2 5.3 16 42.1 16 42.1 2.2Horae economics 69 95.8 5 7.3 16 23.2 31 44.9 17 24.6 1.9Industrial arts 53 91.1i 9 17.0 17 32.1 19 35.8 8 15.1 1.5Mathematics 106 99.1 9 8.5 30 28.3 51 48.1 16 15.1 1.7Music ho 97.6 6 15.0 6 15.0 19 47.5 9 22.5 1.8Physical education 58 96.7 3 5 .2 lii 24.1 14 24.1 27 46.6 2.1Science 95 99.0 lii lii. 7 30 31.6 34 35.8 17 17.9 1.6Social studies lii5 98.6 15 10.3 34 23.4 63 43.5 33 22.8 1.8Other 25 89.3 2 8.0 4 16.0 13 52.0 6 24.0 1.9
\jCVIro

TABIE 98AVERAGE VALUE RATINGS INDICATED BY TEACHERS FOR VARIOUS EVALUATION METHODS AMD TECHNIQUES, BY TYPE OP
. SCHOOL DISTRICT AND TYPE OF SCHOOL ORGANIZATION
Method or techniqueExempted Junior-
City village Local high schools schools schools schools
Senior- Four-year high high
schools schoolsN R* N R* N R# N R* M R*
77 2.5 Ik 2.h70 2.k63 2.5
63 1.8 66 2.65k 1.9
61 2.0
60 2.8II!51 1.9
hh 2.2
N R*172 2.5157 2.k160 2.3 156 2.5
Ik? 1.8 IkO 2.klk3 2.1 125 2.1 128 2.6 12k 2.6125 2.0115 1.9125 1 .9
■118 2.2
Six-yearhighschoolsN R*
-piTZTkl9 2.5 ■ k09 2.3 kOk 2,3 39k 2.k376 1.8 368 2.k356 2.0 33k 2.0 310 2.5
299 1.9 31k 1.9 306 2.3
Observing classroom activities k72T2.8 67*2.7 309.2*7Examining class written work kk3 2.6 67 2.5 300 2.5Usipg objective tests k23 2.k 69 2,3 287 2.3conducting question-answer periods kl3 2.3 63 2.2 29I 2.3Talking informally with pupils kl3 2.5 65 2.5 275 2,5Examining home written woik 383 1,8 59 1.8 270 1.8Conducting pupil discussions 373 2.k 59 2.k 260 2,kTalking informally with other teacher Q q 58 2 1 258 2 0Listening to individual oralreports 3k9 2.0 k8 1*9 2kO 2.0Keeping your own record of classactivities 350 2.6 ■ kk 2,5 223 2.5Examining work products 333 2.5 k6 2.5 218 2,kUsim essay-type tests 316 2.0 50 2.0 228 2.0using cumulative records 332 2.0 50 1.9 203 1.8Using standardized or publishedtests 300 1.9 k9 2,0 217 1.9Observing pupils in out-of-classactivities 297 2.2 50 2,k 225 2.3
155 2.8lk2 2.6139 2.k
12k 1.8118 2.k123 2.1
113 2.0119 2.6 107 2.5
86 1 .9
10k 2.2
Holding conferences with other teachers 303 1.8Holding conferences with parents 302 1.8planning activities with pupils 276 2.3Examining pupil notebooks 271 2.0Listening to panel discussions 237 2.0
2.6 36 1.932 2.0
201 1.8 175 1.6 188 2.317k 2.1 170 2.0
(Continued)
108 1.9
8jlit
2.12.k kO 2.2
86 1.%100 2.k 90 2.1 90 2.0
272 1.8269 1 .7280 2.3257 2.0239 1.9
U)5

TAEffi 98 (Concluded)
Method or technique Ci-tyschoolsExempted village Local schools schools
Junior-highschools
Senior- Four-year high high schools schools
Six-yearhighschools
% R# N R# N R* N R-* H R* K N k*Holding planned conferences T,vith pupils 2k3 2.2 37 2.1 151 2.1; Ih 2.3 45 2.3 86 2.2 226 2.2Looking at piç)il scrapbooks 178 1.7 36 2.0 133 1.7 65 1.8 181,5 74 1.7 190 1.8yisiidng pupils» homes 168 1.8 . 39 1.9 133 2.0 61 1.8 24 1.8 64 1.8 191 1.9using attitude, interest, and personality tests, scales 171 1.9 30 2.0 121; 1.8 61 2.0 26 1.8 67 1.9 171 1.8Looking at pupil collections Ihh 1.7 27 2.0 121 1.8 55 2.0 20.1.5 65 1.7 152 1.8
Keeping gro rth charts 1I&7 1.8 26 1.8 103 1.8 li5 2.0 24 1.8 67 1.8 140 1.8Usiig check lists liii; 2.0 27 2.0 93 2.0 39 2.2 28 2.0 56 2.0 141 2.0Using rating scales 137 1.9 21 1,9 97 1.9 35 2.0 23 1.9 56 1.8 141 1.9Reading pupil autobiographies 118 1.7 28 1.8 81; 1.7 37 1.8 17 2.0 51 1.6 125 1.7Making tape or -wire recordings 121 1.6 21 1.7 81; 1.5 1;3 1.7 16 2.0 54 1.6 113 1.6using work habit inventories 101 2.0 18 1.8 87 1.8 32 1.7 18 1.7 45 1.6 121 1.9Examining pupil diaries of class activities 80 1.5 17 1.3 .59 l.h 25 1.6 11 1.5 41 1.4 79 1.4Using sociodrama 77 1.6 19 1.3 55 1.3 21; 1.8 10 1.7 37 1.5 76 1.5Making sociograms 76 l.k lit 1.1 52 1.3 22 1.3 10 1.1; 38 1.4 72 1.3
Average value rating.wvn

TABLE 99AVERAGE VALUS R ^ I U G S HffilGAl'ËD BT TEACHERS FOR VARIOUS EVALUATION IffiTTHODS AND TECH N IQ U ES, BY SEX
AND SELECTED AGE GROUPS
sex Selected age groupsMethod or technique Male Female 20 to 29 yrs. 50 yrs. and over
N R* N R* N Ri N E*hid è.7 ii05 2.8' ' 192 2.7 115 X'H 'I4IO 2.5 398 2.6 181 2.3 11:9 2.706 2.3 369 2.3 168 2.3 138 2.1;399 2.1 360 2.3 168 2.2 Ihl 2.3373 2.% 372 2.5 165 2.1; 127 2.h356 1.8 35L 1.9 158 1.9 126 1.83h3 2.1 3hl 2.ii lit7 2.3 . 128 2.5 .339 2.0 335 2.1 155 2.0 113 2.0321 2,0 311 2.1 137 1.9 120 2.1310 2.5 305 2.6 122 2.3 122 2.7320 2.5 275 2.6 136 2.5 96 2.6302 1.9 290 2.1 133 2.1 103 2.0298 1.9 285 2.0 121 1.7 98 2.2293 1,8 281 2.0 109 1.8 107 2.1281 2.2 289 2.3 136 2.3 92 2.1279 1.7 26it 1 .9 Uli. 1.9 102 1.9263 1.6 1.8 101 1 .5 26 1.92li3 2.2 267 2.5 113 2.3 87 2.3259 2.0 220 2.0 95 2.0 91 1 .9230 1 .9 207 2.0 101 1.9 81 2-0 . . .
Observing classroom activities Examining class written work using objective tests Conducting question-answer periods Talking informally with pupilsExamining home written work Conducting pupil discussions Talking informally with other teachers Listening to individual oral reports Keeping your own record of class activitiesExamining work products Using essay-type tests Using cumulative records using standardized or published tests Observing pupils in out-of-class activitiesHolding conferences with other teachers Holding conferences with parents planning activities vdth pupils Examining pupil notebooks Listening to panel discussions
(Continued) %

TABLE 99 (Concluded)
Method or techniqueSex Selected age groups
Male Femal 2 0 to 2 9 yrs. 5 0 yrs. and overF Rir N R* n R* K R*
HoIdiiTg planned conferences vdth pupils 2 1 1 2 . 1 218 2.3 8 0 2 . 1 82 2.3Looking at pupil scrapbooks 1 6 0 1 . 7 186 1 . 8 8 0 1.7 5 0 1.7Visiting pupils homes 179 1 . 8 1 6 0 1.9 75 1.9 59 1.9using attitude, interest, and personality tests, scales 1 7 0 1 . 8 151 1 . 9 7 2 1 . 9 55 2 . 0
Looking at pupil collections 155 1 . 8 1 3 6 1 . 8 56 1.7 5 0 1 . 8
Keeping growth charts Ikh 1.7 1 3 0 2 . 0 59 1 . 7 h6 1 . 8
Usipg check lists 1 3 5 2.0 128 2.0 ■ 6k 1.8 la 2.0using rating scales 133 1.8 121 1.9 . 51 1.8 1;2 1 . 9Reading pupil autobiographies 93 l*h 1 3 5 1 . 9 16 1 . 5 3 6 1.8Making tape or wire recordings 126 1.6 99 1.6 ' 55 1.7 2 7 1.1;
Usipg work habit inventories 111 1.7 lOL 1.9 16 1.7 3 1 1.8Examining pupil diaries of class activities 89 l.Ii 66 l.ii 31; 1.1; 2 3 1 . 3Using sociodrama 75 l.ii 7 1 1.7 39 1.1; 2 5 1.8Making sociograms 79 1.3 62 1.5 35 1.2 20 1.1;
*Average value rating.
U»vnO
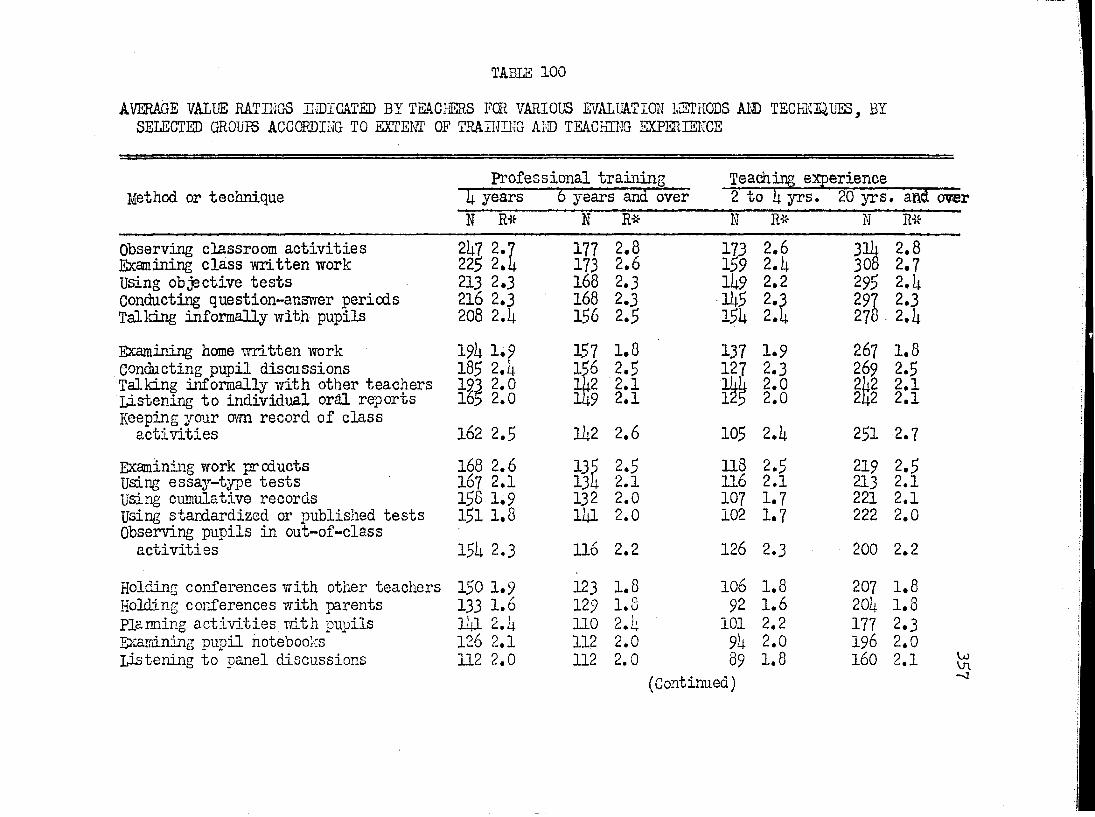
TABIS 100AVERAGE VALUE RATIEGS H-iDIGATED BY TMCl-ERS ECR VARIOUS EVALUATION IvISTHODS AID TECHNIQUES, BY SELECTED GRÛURS ACCORDING TO EXTENT OF TRAINING AND TEACHING EXPERIENCE
Method or techniqueprofessional training
U years 6 years and overTeaching experience
N R# N R* N R* N RiObserving classroom activities 2L7 2.7 177 2.8 173 2.6 2.8Examining class mitten work 225 2.1 173 2.6 1 5 9 2.b 308 2.7Using objective tests 213 2.3 168 2 . 3 lb9 2.2 2 9 5 2,bConducting question-answer periods 216 2.3 168 2.3 lb5 2.3 2 9 7 2.3Talldng informally with pupils 208 2.ii 156 2.5 15b 2.b 278 2.bExamining home ivritten work 19U 1.9 157 1.8 137 1.9 267 1.8conducting pupil discussions 185 2.4 156 2.5 127 2.3 269 2.5Talking informally with other teachers lh2 2.1 m 2.0 2.1Listening to individual oral reports Keeping your a m record of class
165 2.0 lb9 2.1 125 2,0 2b2 2,1activities 162 2.5 lb2 2.6 105 2.b 251 2.7
Examining work products 168 2.6 1 3 5 2 . 5 ns 2 . 5 2 1 9 2.5Using essay-type tests 167 2.1 13b 2.1 1 1 6 2.1 2 1 3 2.1using cumulative records 156 1.9 132 2.0 107 1.7 221 2.1Using standardized or published tests Observing pupils in out-of-class
151 1.8 Ibl 2.0 102 1.7 222 2.0activities 15b 2.3 116 2.2 126 2.3 200 2.2
Holding conferences with other teachers 150 1.9 123 1.8 106 1.8 2 0 7 1.8Holding conferences with parents 133 1.6 129 1.8 9 2 1.6 20b 1.8Planning activities mth pupils I4I 2.b no 2.b 101 2.2 177 2.3Examining pupil notebooks 126 2.1 112 2.0 9b 2.0 1 9 6 2.0Listening to panel discussions 112 2.0 112 2.0 89
(Continued)1.8 160 2.1 t

TABLE 100 (Concluded)
Method or tecimiqueProfessional training Teaching experience4 3rears 6 years and over 2 to 9 yrs. 20 Ts.and overN m R* K R*
Holding planned conferences Tâth pupils 113 2.3 98 2.3 70 2.2 168 2.3Looking at pupil scrapbooks 106 1.8 79 1.7 66 1.7 126 1.6Visiting pupils' homes 9S 1.7 71 1.7 67 1.9 137 1.8using attitude interest, andpersonality tests, scales 83 1.9 75 1.9 65 1.8 121 1.8
Looking at pupil collections 86 1.3 67 1,8 50 1.8 119 1.8Keeping grovrth chart a 74 1.7 71 1.3 52 1.7 109 ' 1,9Using check lists 19 2.0 65 2.1 58 1.8 99 2.0Using rating scales 71 1.8 68 1.9 50 1.6 99 1.9Reading pupil autobiographies 68 1.9 58 1.8 93 1.6 90 1,8Making tape or wire recordings 61 1.6 56 1.6 98 1.8 81 1.5Using Tfork habit inventories 69 1.7 52 1.9 37 1.6 76 1.7S'camining pupil diaries of classactivities 47 l.h 9i 1.9 30 1.5 58 1.9
Using sociodrama 1.9 32 1.6 39 1.5 53 1.5Making sociograms 43 1.3 39 1.2 30 1.2 53 1.9
Average value rating.U)\nCD

TABIE 101AVERAGE VALUE RATIÜG6 INDICATED BT TEACHERS FOR VARIOUS EVALUATION METHODS AND TECHNIQUES, BT SELECT
ED GROUPS 1ÏITH REFERENCE TO REGENCY OF TRAINING AND WHETHER COURSE IN TESTS AND MEASUREMENT WAS TAKENIN PROFESSIONAL TRAINING
Method or techniqueLast period of teacher training
Course in educational testa and measurement
1 9 3 0 - 1 9 3 9 1 9 5 0 - 1 9 5 2 Yes NoN R* N R# N R* N R*
Observing classroom activities Examining class v/rittcn work 1% 2.8 331 2 . 7 577 % 8 261: 2.7
135 2 . 6 3 1 0 2 .1: 559 2.5 21:8 2 . 6Using objective tests 1 2 2 2.k 2 9 9 2.3 5L5 2 . 3 2 3 1 '2.3Conducting question-answer periods 1 2 7 2 . 1 286 2.3 5 2 8 2.3 2 3 6 2 . 3Talking infomally vdth pupils 117 2 . 1 2 9 1 2 .1: 5 1 8 2.1: 2 2 6 2 .1:
Examining home vfritten work 1 2 2 1 . 8 2 7 6 1 . 8 1:93 1 . 8 2 1 6 1 . 8 'Conducting pupil discussions 1 0 7 2.k 2 6 8 2,1: 1:77 2.1: 2 1 2 2.1:Talking informally with other teachers 1 1 1 2 . 0 2 6 1 2 . 1 1:57 2 . 0 2 1 5 2 . 0Listening to individual oral reports 1 0 6 2 . 1 21:6 2 . 0 1:31 2 . 0 2 0 3 2 . 0
Keeping your am record of class activities 98 2.7 2 2 0 2.5 1:1:5 2 . 6 1 7 0 2 . 6
Examining work products 8 6 2 . 5 21:5 2.1: liL9 2 . 5 1 7 6 2.5using essay-type tests 93 2.1 228 2.0 1:08 2.0 1 8 3 2.1using cumulative records 101 2.0 a8 1.8 4 0 9 2.0 1 7 5 1.9Usirg standardized or published tests 100 2.0 211 1.8 ia5 1.9 158 1.9Observing pupils in out-of-class activities 80 2.2 2 3I:2.2 3 9 9 2.2 1 7 1 2 . 3
Holding conferences vdth other teachers 8 9 1.8 2 0L 1.8 382 1.8 1 6 0 1 . 9Holding conferences with parents 83 1.8 1 9 2 1.6 3 6 6 1.7 II16 1.8planning activities with pupils 7 0 2.3 2 0 6 2 . 3 31:8 2 . 3 161Bcamining pupil notebooks 8 1 1.9 1 7 8 2.0 337 2.1 2.0 mListening to panel discussions 6k 2.0 1 7 8 1 . 9 3 0 8 2.0 1 3 0 2.1
(Continued)

TABIE 101 (concluded)
Method ctr techniqueLast period of teacher training
course in educational tests and measuremenb
1 9 3 0 - 1 9 3 9 1 9 5 0 - 1 9 5 2 les NoN m N N R* N
Holding planned conferences with pupils 7 0 2.2 151 2.1 297 2.2 1 3 2 2 . 3Looking at pupil scrapbooks h9 1 . 7 Hr2 1.8 2 3 2 1.8 111 1.7Visiting pupils' homes h9 1.8 1 3 1 1,9 233 1.8 106 2.1Usirg attitude, interest, and personalitytests, scales 5 2 1.8 1 3 1 1.8 2 3 7 1.9 86 . 1.9
Looking at pupil collections hS 1.7 111 1.8 2 0 5 1.8 85 1.8Keeping grarth charts k9 1.9 lOl 1.7 199 1.8 77 1.8Using check lists 39 2.0 1 0 1 1.9 1 9 0 2.0 7l 1 . 9using rating scales ii3 1.8 9h 1.9 182 1.9 73 1.8Reading pupil autobiographies 39 1.8 95 1.6 158 1.7 7 2 1.8Haloing tape or wire recordings 37 1.6 95 1 . 7 118 1,6 77 1.6using work habit inventories 37 1.6 06 1.7 151 1.8 62 1.6Examining pupil diaries of class activities 39 1.3 63 1.1 111 l.l 15 1.5Using sociodrama 25 l.ii 57 l.l 101 1.5 16 1.6Making sociograms 26 1.3 60 1.3 99 1.3 13 1.3
irAverage value rating.
wOnO

TABIE 102
AVERAGE VALUE RAT DIGS DOIGATSD BY TEACHERS FOR VARIOUS EVALUATION WETHQD5 AND TECHNIQUES, BY AVERAGEEmOLIDEIff DÎ CLASSES
Method or techniqueAverage enrollment in classes which respondents teach
Observing classroom activities Examining class written work Using objectif tests Conducting question-answer periods Talking informally with pupilsExamining home written work Conducting pupil discussions Talking informally with other teachers Listening to individual oral reports Keeping your m m record of class activitiesExamining work productsUsing essay-type testsUsing cumulative recordsUsing standardized or published testsObserving pupils in out-of-class activitiesHolding conferences with other teachers Holding conferences mth parents Planning activities with pupils Examining pupil notebooks Listening to panel discussions
20 and below 2 1 - 3 0 3 1-hO Over i;0N R* k R* N R* H
w 2^ "385''2;T‘ ' 255 2.7 35 2.8156 2.5 382 2.5 2 5 0 2.6 2 7 2.1155 2.2 359 2.3 235 2.5 2 5 2 . 3151 2.2 351 2.3 2h0 2. A 21 2.2139 2.5 337 2.k 2 3 6 2.h 3 0 ■ 2 . 5
131 1.8 336 1.8 22k 1 . 9 1 7 1.6137 2.U 315 2.L 2 1 7 2.1; 1 7 2.1;132 2.0 3 0 0 2.0 2 1 5 2.1 2 3 2.11 0 9 2.1 2 9 6 2.0 208 2.0 18 2.2120 2.5 2 7 7 2.6 1 9 7 2,6 18 2.7138 2.7 2 7k 2 . 5 1 6 2 2.1; 1 8 2.6111 2.1 286 2.0 1 7 7 2.0 1 7 2.199 1.6 2 7 9 1 . 9 1 8 3 2.0 21 2.1
lOli 1.7 2 6 9 1 . 9 1 7 9 2.0 21 1 . 7u o 2.2 2 5 5 2.2 1 7 9 2 . 3 22 2.59l 1.9 251 1.8 1 7 2 1.9 22 2.081 1.5 2 2 8 1 . 7 1 7 6 1.8 21 1.8
1 0 6 2.1 2 3 0 2 . 3 1 5 1 2.3 22 2.589 2.0 2 3 0 2.0 1U7 2.1 11 2.078 1.7 2 0 7 2.0 lia 2.0 11 2.1;
(Continued)U)

TABLE 102 (Concluded)
Average enrollment in classes which respondentsteach
Method or technique 20 and below 21-30 31-uo Over kON m N N R* H R*
Holding planned converences with pupils 75 2.2 200 2.2 136 2.2 15 2.0Looking at pupil scrapbooks 58 1,7 163 1.7 115 1 ,9 6 1.9Visiting pupils » homes 75 2.1 Jh2 1.8 107 1.9 111 1.6Using attitude, interest, and personality tests, scales 62 1.8 156 1.7 9k 2.1 10 2.0
Looking at pupil collections h9 1,7 lia 1.7 91 2.0 8 1.9Keeping growth charts 51 2.0 130 1.7 79 1.7 11 2.2Using check lists 52 2.0 129 2 .0 73 2.1 9 1.9using rating scales Ui 1,7 127 1.7 72 2.1 10 1.8Reading pupil autobiographies 39 1.6 109 1 .6 75 1.9 7 1.7Making tape or wire recordings 3h 1.5 no 1.5 71 1.6 9 2.I1Using work habit inventories 51 1.9 102 1.7 55 1.7 7 1.9Examining pupil diaries of class activities 2k 1.5 79 1.3 k9 1.5 li 1.6Usipg sociodrama 2k 1.5 7 6 1.5 la 1.7 5 1.6Making sociograms 22 1.2 711.3 lA 1.5 5 l.ii
Average value rating.
Vaj0\ro

TABLE 103
AVERAGE VALUE RATINGS IlffilCATED BY TEACHERS FOR VARIOUS EVALUATION METHODS AND TECHNIQUES, BY SUBJECTAREAS
Method or techniqueSubject area which teachers consider major teaching
English.Agriculture r ________Art Business education
Obserdng classroom activities Examining class ivritten work Using objective tests Conducting question-answer periods Talking informally with pupilsExamining home Trritten work Conducting pupil discussions Talking informally with other teachers Listening to individual oral reports Keeping your own record of class activitiesExamining work productsUsing essay-type testsUsing cumulative recordsUsing standardized or published testsObserving pupils in out-of-class activitiesHolding conferences with other teachers Holdiig conferences with parents Planning activities with pupils Examining pupil notebooks Listening to panel discussions
N_ N R-55- N - M N
22 2.6 17 1).9 75 ' 2,8 135 2.72h 2.5 8 2.1 79 2.7 1U3 2.822 2.0 8 1.8 72 2.3 138 2.222 2.1 6 1.8 61 2.0 139 . 2.h18 2.h 15 2.6 68 2.3 133 2.5Ih l.h h 1.3 76 1.8 135 2.018 2.6 13 2.2 57 2.2 132 2.h17 1.6 9 2.2 60 2.1 129 2.018 2.0 8 2.1 39 1.9 132 2.215 2.1 12 2.7 62 2.6 103 2.621 2.8 18 3.0 63 2.7 90 2,h18 2,2 7 2.0 h7 1.7 129 2.317 1.6 6 1.3 51 2.0 109 2.0Ih 1.5 2 1.5 68 2.2 110 2.015 2.h 11 1.9 h6 2,2 113 2.316 1.9 8 2.3 h7 2.0 100 1.915 2.0 9 1.8 39 1.6 9h 1.715 2.5 12 2.8 h5 2.2 96 2.h20 2.h h 2.5 33 2.1 9h 2.015 1.9 5 1.8 30 1.6 91 2.1
(continued)

TABLE 103 (Concluded)Subject area which teachers consider major teaching
assignment__________________Agriculture Art Business education EnglishMethod or technique
N R* N R* N R* N R*Holding planned conferences Tdth pupils 17 2.6 7 2.3 39 2.1 79 2.3Looldng at pupil scrapbooks 11 1.7 7 2.1 26 1.5 66 1.7Visiting pupils» homes 22 2.7 5 2.2 22 1.5 53 1.9Usiig attitude, interest, and personality tests, scales 10 2.1 h 1.8 36 1.7 58 1.9
Looking at pupil collections 8 1.5 9 1.7 19 1.5 16. 1.7Keeing grarth charts 11 1.8 3 2.7 h3 2.3 UO 1.8Using check lists 10 1.7 h 2.3 28 2.0 la 2.0Using rating scales 7 1.1 2 2.0 33 1.9 k3 1.8Reading pupil autobiographies k 1.0 1 1.0 17 l.b 82 2.2Making tape or wire recordings 12 2.1 2 1.5 21 1.3 69 1.3Using work habit inventories 6 1.3 k 1.8 23 1.8 32 1.UExamining pupil diaries of class activities 8 1.8 2 1.0 12 1.3 29 1.8using sociodrama 3 1.0 1 1.0 13 1.1; 28 1.9Making sociograms 5 1.6 1 1.0 11 1.1 22 1.7
*Average value rating.
KjJOnfr

TABIE lOUAVERAGE VALUS RATHG-S DIDIGATED BT TEACHERS POR VARIOIS EVALUATION METHODS AND TECHNIQUES, BT SUBJECTAREAS
Method or techniqueSubject area lAlch teachers consider major teaching
assignmentForeign language Home economics industrial arts Mathematics
Observing classroom activities E):aiiining class Tjritten work using objective tests Conducting question-ans?rer periods Talking iikorraally mth pupilsExaminifig home written work Conducting pupil discussions Talking informally with other teachers Listening to individual oral reports Keeping your own record of class activitiesExamining work productsU s ^ essay-t;^e testsUsing cumulative recordsusing standardized cr published testsObserving pupils in out-of-class activitiesHolding conferences with other teachers Holding conferences mth parents Planning activities with pupils Examining pupil noteboolîs Listening to panel discussions
N R-Î-C N R* N R* N R*36 2.9 52 2.9 103 2.737 2.8 6k 2.3 37 2 .1 106 2.733 2.5 60 2.k kk 2.3 92 2.536 2.6 66 2.2 ko 1.9 86 2.235 2.6 58 2.6 kl 2.3 ' 79 2.k37 1.9 52 1.9 21 1.3 102 1.927 2.3 67 2.k 30 2.2 6k 2.229 2.0 57 1.9 31 2.0 78 2.027 1.8 58 2,1 25 1.6 5k 1.728 2.6 kS 2.8 39 2.6 67 2.620 2.3 66 2.9 52 3.0 60 2.231 2.1 51 2.2 21 1.9 kk 1.72k 1.9 k5 1.9 32 1.9 76 2.12k 2.2 35 1.7 22 1.5 80 2.125 2.1 k8 2.3 2k 1.9 56 1.921 1.9 39 1.7 22 1.6 67 1.725 2.0 kl 1.6 20 1.5 60 1.823 2.3 k6 2.7 25 2.5 la 2.016 1.0 k6 2.0 25 2.0 31 2.016 1.8 38 1.9 17
(Continued)1.7 31 1.5
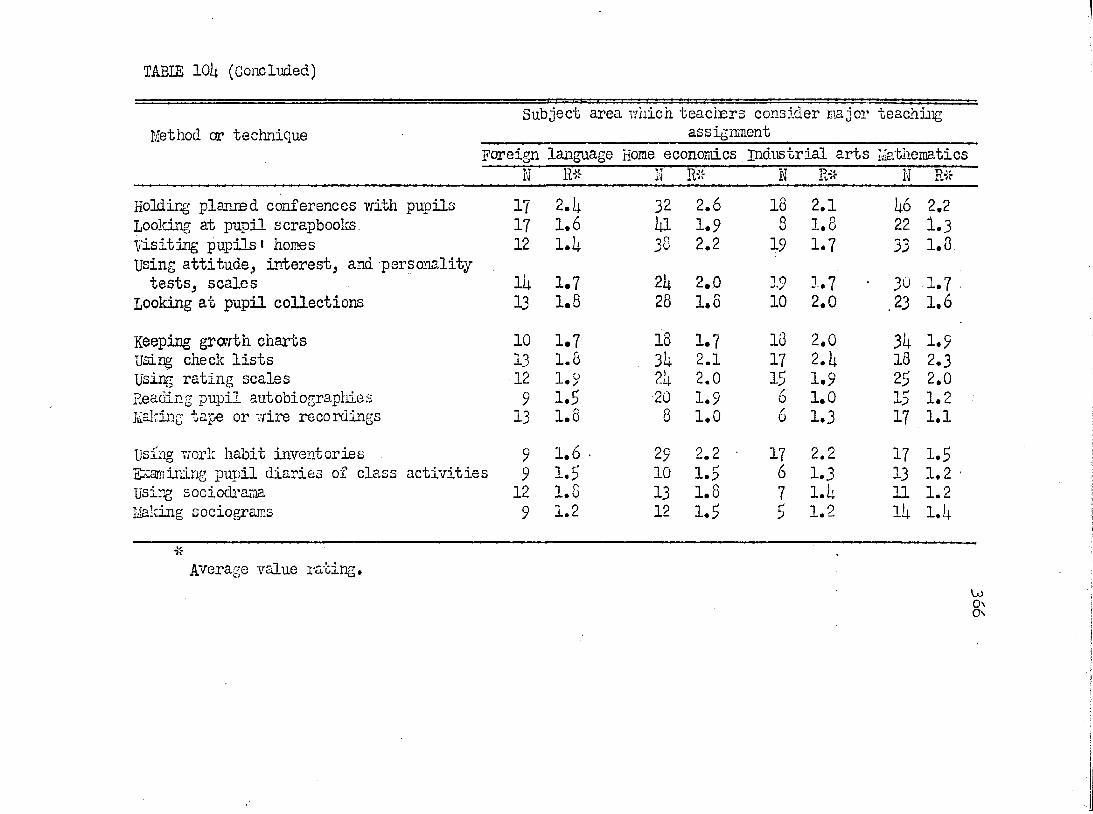
TABIE lOU (Concluded)
Subject area which teachers consider major teachingMethod or technique assignment
Foreign language Home economics industrial arts MathematicsK N K Rif R Rif
Holding planned conferences with pupils 17 2.k 32 2.6 18 2.1 h6 2.2Looking at pupil scrapbooks. 17 1.6 ill 1.9 8 1.8 22 1.3visiting pupils ' homes 12 l.ii 30 2.2 19 1.7 33 1.8Using attitude, interest, and personalitytests, scales IL 1.7 2ii 2.0 19 1.7 • 30 1.7
Looking at pupil collections 13 1.8 28 1.8 10 2.0 ,23 1.6
Keeping grarth charts 10 1.7 18 1.7 13 2.0 3h 1.9using check lists 13 1.6 3ii 2.1 17 2,h 18 2.3Using rating scales 12 1.9 2h 2.0 15 1.9 25 2.0Reading pupil autobiographies 9 1.5 20 1.9 6 1.0 15 1.2Mailing tape or wire recordings 13 1.6 8 1.0 6 1.3 17 1.1using work habit inventories . 9 1.6 • 29 2.2 ■ 17 2.2 17 1.5Examining pupil diaries of class activities 9 1.5 10 1.5 6 1.3 13 1.2Using sociodrama 12 1.8 13 1.8 7 l,h 11 1.2Making sociograms 9 1.2 12 1.5 5 1.2 lii l,li
Average value i-ating.U)8

TABIE 105AVERAGE VALUE RATINGS INDICATED BY TEACHERS FOR VARIOUS EVALUATION KSTHQDS AND TECHNIQUES, BY SUBJECT
AREAS
Method or techniqueSubject area which teachers consider major teaching
assignmentMusic physical education Science Social studiesN R'jS- N Ri , N R* N R*
Observing classroom activities 35 2.8 53 2.8 87 2.7 137 2.7K amining class written work 23 1.8 i|l 2.0 86 2.1: 137 2.6Using objective tests 21 2.0 1:3 2. it 90 2.1: 136 2.5Conducting question-answer periods 20 2.3 36 2.2 90 2.1: 11:3 2.5Talking informally with pupils 33 2.6 51 2.it 73 2.3 122 2.5Examining home written work 17 1.6 28 1.7 81 1.7 129 1.8Conducting pupil discussions 20 2.2 31: 2.3 80 2.5 129 2.7Talldng informally with other teachers 28 2.3 Id 2.1 71 2.0 n o 2,0Listening to individual oral reports 21 2.0 27 1.7 31 2.1 129 2.1Keeping your otm record of class activities21 2.1: Id 2.0 60 2.5 102 2.6Examining work products 18 2.2 19 2.2 65 2.5 86 2.2using essay-type tests IL 1.6 26 1.7 65 1.9 123 2.1using cumulative records 16 1.7 36 2.2 58 1.9 • 100 2.0using standardized or published tests 16 1.5 25 1.6 63 1.8 102 1.8Observing pupils in out-of-class activibies 26 2.k 1:0 2.3 51: 2.2 97 2.3Holding conferences with other teacliers 21 2.0 39 1.9 51 1.6 99 1.9Holding conferences with parents 22 1.8 31 1.6 1:9 1.7 92 1.7Planning activities with pupils 21| 2.5 35 2.3 1:7 2.1 85 2.3Examining pupil notebooks lit 1.9 19 1.8 71 2.2 91: 2.0Listening to panel discussions 16 1.8 19 1.8
(Continued)1:2 2.0 102 2.2
u

TABIS 105 (Concluded)
Method or techniqueSubject area which teachers consider major teaching
assignmentMusic Piçrsical education Science Social studiesK 11 H R* U R*
Holding planned conferences with pupils 16 1.9 22 2.1 Wi 2.1 99 1.9Looldng at pupil aorapbooks Ik 1.9 20 1.5 39 1.8 66 1.8Visiting pupils « homes 17 1.6 19 1.6 27 1.6 61 1.9using attitudej interest and personality tests, scales Ih 1.9 22 2.2 26 1.8 58 1.9
Looking at pupil collections 9 1.7 Ih l.ii 52 2.0 53 1.9Keeping grovvth charts 8 l.It 2k 1.8 18 1.6 1*1 1.3Usirg check lists 12 1.6 20 2.1 18 2.1 1*0 1.9using rating scales 9 1.3 18 2.2 20 2.1 la 1.6Reading pupil autobiographies 10 l.ii 11 1.1 lii 1.2 36 1.7Making tape or wire recordings 27 2.3 10 1.1 15 1.7 la 1.3using work habit inventories 10 1.7 9 1.2 18 1.7 35 1.6Examining pupil diaries of class activities 8 1.5 11 1.1 11 1.5 32 1.3Using sociodrama 8 1.5 9 1.2 7 1.1 31 1.5Making sociograms 7 1.0 9 1.1 9 1.2 32 1.3
Average value rating,
c\CO

TABIS 106
AVERAGE VALUE RATIÎJGS INDICATED BY TEACHERS FŒ DIFFERENT TYPES OF EffOPJtATION El CUIIULATE/E RECORDS,BY TYPE OF SCHOOL DISTRICT AND TYPE OF SCHOOL CRGANIZATION
Type of information Cityschools
Exemptedvillageschools
Localschools
Junior-highschools
Senior-highschools
Four-yearhigh
schools
Six-yearhighschools
N m R-Jf N** R* N-K* R- IRHt R'K N** R# M** R- N-x* R*personal information Ü77 2.2 71 1.9 300 2.0 162 2.2 79 2.1 170 2.1 1:37 "27T”"'Enrollment and attendance data hlO 2,2 70 2.1 299 2.1 162 2.2 76 2.2 169 2.1 1:32 2.2Home and family information h33 2.1 5ii 1.9 260 2.0 lh6 2.3 72 2.1 lh3 1.9 386 2.0School achievement and curricular experience 2.1 66 2.3 285 2.3 157 2.L 76 2.5 159 2.3 h2k 2.4Extra-curricular experiences IfLl 2.1 51 2.0 227 2.0 133 2.0 71 2.2 132 2.0 352 2.1Health information W.6 2.0 51 1.7 2Wl 1.6 lk6 2.0 70 1.9 121 1.8 374 1.8Special-interest data 339 2.0 35 1.9 151 1.8 121 2.0 60 2.0 81: 1.7 263 1.9Supplementary information 358 2.1 38 1.8 160 1.8 132 2.1 62 2.1 89 1.8 273 1.9
TEST RESUITS Intelligence hh2 2,k 65 2.3 263 2.2 152 2,k 70 2.1: 151: 2.3 394 2.3Achievement 359 2.k ij-7 2.2 196 2.3 127 2,5 56 2.5 102 2.3 317 2.3Special aptitude 269 2.2 12 2.0 1L8 2.1 87 2.2 he 2.2 77 2.1 249 2.1Interest 211 2.2 28 2.1 125 2,0 70 2.2 h2 2.1 61: 2.2 188 2.1Personality 212 2.2 23 2.0 121 2.0 67 2.1 39 2.2 65 2.0 190 2.1Reading, survey 271 2.2 35 1.8 12L 1.9 95 2.2 ue 2.2 76 1.9 213 2.0Reading, diagnostic 265 2.2 30 1.9 122 1.8 95 2.1 50 2.2 68 2.0 204 2.0Attitudes 191 2.1 28 2.0 100 2.0 6L 2.1 35 2.3 55 1.9 162 2.0* Average value rating.Differs slightly from number of teachers shown in Chapter IV because a few respondents did
not indicate ratings.\jO

TABLE 107
AVERAGE VALUE RATBGS BŒUCATED BI TEACHERS FOR DIFFERENT TYPES OF INFORMATION ffi CQMATIVE RECCRDS,BY SEX AND SELECTED AGE GROUPS
Tj'pe of information Sex Selected age groupsMale Female 20 to 29 yrs. 50 yrs. and overN R* N R-K N R* N R*
personal information 2.1 "H'01 188 1.9 ISO Z7'~Enrollment and attendance data WL 2.2 396 2.2 187 2.0 149 2.2Home and family information 398 2.0 3h7 2.1 160 2.0 126 2.1School achievement and curricular experience h2k 2.3 390 2.k 185 2.3 146 2.5Extra-curricular experiences 365 2.1 321 2.0 lh6 1.9 126 2.2Health information 377 1.8 332 1.9 151 1.7 128 2.0Special-interest data 285 1.8 2la 2.0 101:1.5 100 2.0Supplementary information 291 1.9 263 2,1 113 1.8 104 2.0
TEST RESULTS , intelligence 106 2.3 362 2.1 165 2.2 i4o 2.4Achievement 326 2.3 27l 2.5 118 2.2 116 2.5Special aptitude 256 2.1 202 2.2 97 1.9 84 2.2interest 206 2.1 157 2.2 86 2.0 65 2.2Personality 199 2.1 I6l 2.2 80 1.9 67 2.3Reading survey 228 2.0 201 2.2 90 1.8 85 2.2Readingj diagnostic 221 2.0 19li 2.2 83 1.7 83 2.3Attitudes 182 2.0 133 2.1 69 1.9 60 2.2*Average value rating,
->3O

TABLE 108AVERAGE VALUE RATimS IlffllGATED BI TEACHERS FŒ DIFFERENT TIRES OF BFQRmTIOÎÎ IN GUMUIATIVE RECORDS BI
SELECTED ŒOUPS ACCORDING TO EHENT OF TRAINING Aî® TEACHING EXPERIENCE
Tj'pe of inf carnation professional training Teaching ejqerienceli years 6 years and over 2 to k yrs,, 20 yrs. and ove:N Rit- N R* N Ri N R*
personal information È3Ü 2 .0 178 2.1 166 2.0 320 2.2Enrollment and attendance data 2hO 2.1 177 2.2 165 2.1 313 2.2Home and family information School achievement and curricular
217 2 .0 153 2.2 lk6 2.1 279 2.1
experience 230 2.3 177 2.5 160 2.2 308 2.kSctra-curricular experiences 191 1.9 lk6 2.1 127 2.0 265 2.1Health information 20k 2.0 lk9 2.0 138 1.7 271 1.9Special-interest data lii8 1.9 116 2.0 96 1.8 217 2.0Supplementary information 157 1.8 118 2.1 109 1.9 21k 2.0 :TEST RESULTS
Intelligence 21k 2.2 165 2.3 150 2.2 293 2.kAchievement 160 2.3 137 2.k 111 2.2 236 2.5Special aptitude 136 2.0 95 2.2 96 1.8 17k 2.2interest 106 2.0 81 2.2 80 2.0 13k 2.2Personality 103 1.9 78 2.2 78 1.9 137 2.2Reading, survey 122 1.9 102 2.1 81 1.6 l6k 2.1Reading, diagnostics 113 1.8 99 2.2 80 1.7 159 2.2Attitudes 88 1.9 73 2.2 72 2.0 118 2.2
Average value rating.

TABIE 109
AVERAGE VALUE RATINGS INDICATED BY TEACHERS FOR DIFFERENT TYPES OF INFORMATION Ei CUMUIATIVE RECORDS,BI SELECTED GROUPS WITH REFERENCE TO RECENCY OF TRAINE-IG AID WIETHER COURSE TESTS AND IHSASURH NT
WAS TAKEN IN PROFESSIONAL TRAIWM}
Type of informtionLast period of teacher training
Course in educational tests and measuremenb
1930-1939 1950-1952 Yes NoN R- N Ri N R* N R*
Personal information 133 2.1 3S7 2.0 588 2.1 255 2.0'Enrollment and attendance data 131 2.1 . 321 2.1 586 2.2 248 2.1Home and family information 117 2.0 280 2.0 529 2.0 215 2.1School achievement and curricular experience 127 2,h 312 2.3 567 2.4 245 2.3Extra-curricular experiences 106 2.0 256 2.0 181 2.0 203 2.1Health information llii 1.9 268 1.8 502 1.9 203 1.9Special-interest data 80 1.9 189 1.9 367 1 .9 158 1.9Supplementary information 83 2 .0 205 1.9 388 2,0 165 2.0
TEST RESULTSIntelligence 12k 2.3 296 2,2 510 2.3 226 2.3Achievement 91 2.5 235 2.3 L30 2.4 169 2.3Special aptitude 6g 2.2 183 2.1 328 2.2 129 2.1interestpersonality
2.12.2
147141
2.12.0
265261
2.12.1
9899
2.22.1
Reading, survey’- 63 2.1 158 2,0 310 2.1 120 2.0Reading, diagnostic 63 2.1 150 2.0 298 2.1 118 2.0Attitudes 38 2.1 130 2.0 233 2.1 83 2.1
Average value rating. VjJrOTO

TABIE 110AVERâGE VALUE RATDJG8 DffllCATED BY TEACHERS FOR DIFFEPÆiT TYPES OF IMFCiRîATIOil DI GUMUIATIVE RECORDS,
BY AVERAGE EHROmEEHT H CLASSES
Type of informationAverage enrollment in classes which respondents teach20 and below 21-30 31-1 0 Over hoN R* N R* R* N R-Jf
Personal information 166 2 .0 372 2.1 70 2.2 33 2.2Enrollment and attendance data 16? 2.2 367 2.1 261 2.3 3k 2.3Home and family information Iit3 2.0 322 2.0 2hh 2.1 33 2 .0School achievement and curricular experience 1^9 2.3 359 2.3 259 2.1: 33. 2.5Extra-curricular experiences 128 2.0 303 2.0 223 2.1 28 2.3Health information 128 1,7 31ii 1.8 236 2 .0 27 2 .0Special-interest data 85 2,0 232 1.8 185 1.9 21 2.0Supplementary information 95 1.9 250 1.9 187 2.0 19 1.9TEST RESULTS
Intelligence 139 2.2 315 2.3 219 2.1: 31 2.3Achievement 103 2.2 272 2.h 197 2.5 26 2.hSpecial aptitude 8L 2.0 210 2.2 1I&2 2.2 20 2.3Interest 65 2.2 176 2.1 106 2.2 15 2.3Personality 63 2.1 166 2.0 112 2.1 18 2.1:Reading, survey 68 2.0 193 2.1 11:8 2.1 18 2.0Reading, diagnostic $8 1.9 167 2.1 11:9 2.1 19 2.1Attitudes 50 2.1 lli5 2.0 103 2.1 16 2.1:
Average value rating.
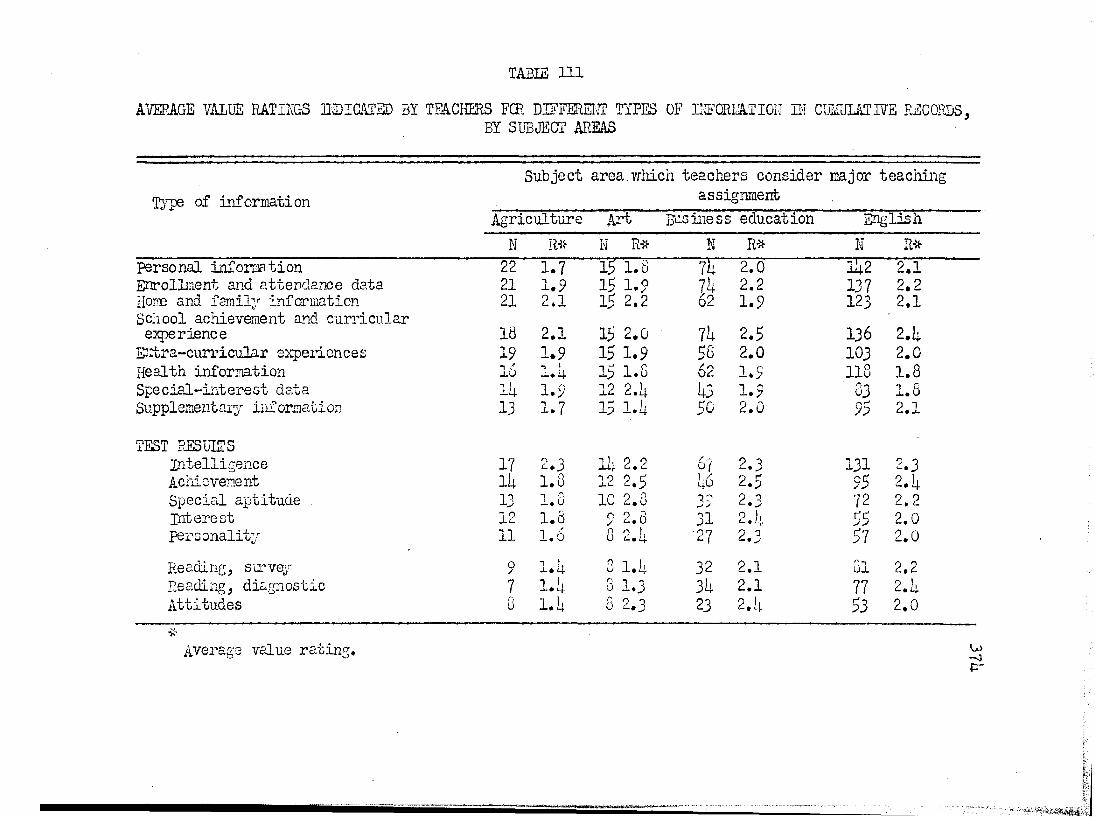
TABIE 111AVERAGE VAIÜE RATINGS BIDIGATED BY TEACHERS FŒ DIFFERENT TYPES OF INFORIATION IN GUMUIATIVE RECORDS,
BY SUBJECT AREAS
TjTe of in fo rm atio n
S u b jec t a rea .w h ich te a c h e rs co n sid e r m ajor te a c h in gassignm ent
A g ric u ltu re A rt Business education E n g lish
N RÜ- N R* N R* N RieP ersonal in fo rm atio n 22 1.7 15 1.8 7l 2.0 142 2.1Enrollm ent and a tten d an ce d a ta 21 1.9 15 1.9 74 2.2 137 2.2Home and fam ily in fo rm ation 21 2.1 15 2.2 62 1.9 123 2.1School achievem ent and c u r r ic u la r
experience 18 2.1 15 2.0 74 2.5 136 2.4Ip c tra -c u r r ic u la r experiences 19 1.9 15 1.9 56 2.0 103 2.0H ealth in fo rm atio n 16 1.4 15 1.8 62 1.9 118 1.8S p e c ia l - in te r e s t d a ta 111 1.9 12 2. 43 1.9 83 1.8Supplem entary in fo rm ation 13 1.7 15 1. 50 2.0 95 2.1TEST RESUITS
In te ll ig e n c e 17 2.3 lb 2.2 67 2.3 131 2.3Achievement lit 1.8 12 2.5 46 2.5 95 2.4S p ec ia l a p ti tu d e . 13 l.G 10:^8 39 2.3 72 2.2I n te r e s t 12 1.6 9 2.8 31 2.4 55 2.0p e rs o n a li ty 11 1.6 8 2,k ■27 2.3 57 2.0Reading, surv^r 9 l.It G 1.4 32 2.1 Si 2.2Reading, d ia g n o s tic 7 l.i; 8 1.3 34 2.1 77 2.4A ttitu d e s 8 l.It 6 2.3 23 2.4 53 2.0
Average value r a t in g . wçr
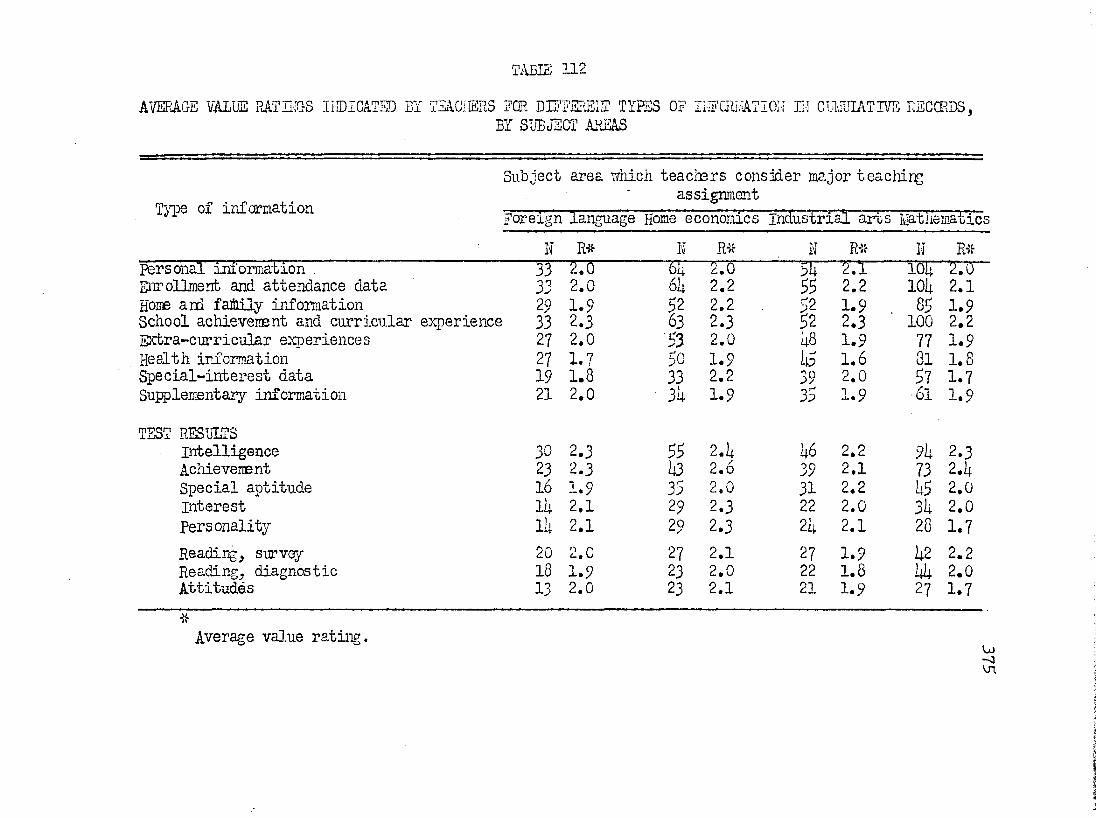
TABIZ 112AVERAGE VALUE RATINGS INDICATED BY TEACHERS FOR DIFFERENT TYPES OF INFüRüATION IH CUMULATIVE RECORDS,
BY SUBJECT AREAS
Type of informationSubject area which teachers consider major teaching
assignmentForeigh language Home economics Industrial arts Mathemab'ics
N R* N R* N R'«- IJ R*Personal information 33 2.0 2.0 5U 2.1 ioii 2.0Enrollment and attendance data 33 2.0 6ii 2.2 55 2.2 lOli 2.1Home and family information 29 1.9 52 2.2 52 1.9 . 85 1.9School achievement and curricular experience 33 2.3 63 2.3 52 2.3 100 2.2Extra-curricular experiences 27 2.0 53 2.0 48 1.9 77 1.9Health information 27 1.7 50 1.9 It5 1.6 81 1.8Special-interest data 19 1.8 33 2.2 39 2.0 57 1.7Supplementary information 21 2.0 3I4 1.9 35 1.9 61 1.9
TEST RESULTSIntelligence 30 2.3 55 2.1 46 2.2 9k 2.3Achievement 23 2.3 h3 2.6 39 2.1 73 2.1:Special aptitude l6 1.9 35 2.0 31 2.2 L5 2.0Interest Ih 2.1 29 2.3 22 2.0 3k 2.0Personality IL 2.1 29 2.3 2k 2.1 28 1.7Reading, survey 20 2.0 27 2.1 27 1.9 12 2.2Reading, diagnostic 18 1.9 23 2.0 22 1.8 2.0Attitudes 13 2.0 23 2.1 21 1.9 27 1.7
Average value rating. Oj-cvn

TABIE 113
AVERAGE VALUE RATHD5 IIDICATED Bï TEACiiERS FGR DIFFEIiE:]: TYPES OF IBCmiATIO:: HI CUIUIATIVE RECORDS,BY SUBJECT ARE&5
Type of informationSubject area idiich teadiers consider major teaclnni
assignmentliisic piiysical education Science Social studiesH Rif K R* W R-X- N R*
Personal information 36 2.0 5 k 2.3 86 2.1 137 2.2Enrollment and attendance data 37 2.1 5h 2.2 63 2.2 135 2.3Home aid family information 3ii 1.9 50 2.3 77 2.1 121 2.0School achievement and curricular experience 36 2.1 51 2.3 80 2.1 132 2.5Extra-curricular exjDeriences 32 2.2 50 2.3 71 2.0 113 2.2Health information 32 1.9 19 2.3 77 1.8 116 2.0Special-interest data 25 1.9 10 1.8 56 1.8 88 2.0Supplementary information 25 1.9 36 1.8 59 1.9 93 2.1
TEST RESULTSIntelligence 32 2.3 53 2.1 81 2.2 128 2.1Achievement 29 2.3 39 2.1 69 2.3 103 2.5Special aptitude 25 2.2 35 2.1 52 2.0 70 2.2Interest 19 2.2 29 2.2 13 2.0 55 2.1Personality 19 2.0 30 2.2 15 2.1 57 2.2Reading, survey 26 1.7 29 1.7 W 2.1 71 2.3Readirg, diagnostic 21 1.7 30 1.7 12 2.2 78 2.2Attitudes 19 2.0 2G 2.3 31 2.1 13 2.2-«•Average value rating,
C\

BIBLIOGRAPHY
1. Al kin, Wilfred M. The Story of the Eight-Year Study. Nevf York;Harper and Brothers, 15? pp.
2. Alborty, Harold. Reorganizing the High-School Curriculum. NewYork: The Macmillan Company, 1^501 I&SB' pp.
3. American Council on Education, Educational conference, 1951»Measurement and Evaluation in the improvement of Educaticn. Washington, D. C.: The Council, I95I. TTDTpp.
U. _____________ , The Committee on Measurement aixL Guidance. NewBi^i^Gctlons for Measurement and Guidance. Tfashington, D. C.: The Council, 1913%% 101 pp.
5. "Are There Better Ways of Evaluating, Recording, and Reportingpupil progress in the Junior and Senior High Schools?" Bulletin of the National Association of Secondary School principals, lU (March, 1950), pp. 73-79"; 7^-U9.
6. "A Symposium on Evaluation in Modem Secondary Education,"California journal of Secondary Education, 28 (February, 1953)] pp. 61-10$.
7. Bobbitt, Franklin. The Curriculum. New York; Houghton MifflinConçiany, 1918. Zp5 pp.
8. Bolmeier, E. C. "Reporting Pupil Progress," B'üEetin of theNational Association of Secondary school Principals,30 (April, I9U6 },' pp.T8-üh, Ihl.
9» Caldwell, Otis w. and Courtis, S. A» Then and Now in Education. Yonlcers-on-Hudson: World Book Coupany, l l'h. UDtTppI
10. Courtis, S. A- "Educational Measurement Movement in perspective;Current Criticisms of Educational Measurement; past and present Trends in Educational Measurement," Review of Educational Research, 8 (December, 1938), pp. 5h5-5^
11. . "Fact and Fancy in Educational Measurements," I^^6iana university School of Education Bulletin, 18 (Sepbember, l9h2), pp. 8-2TTT
12. . "Next Steps in Educational Measurements,"Indiana University School of Education Bulletin, 18 (September^, 19h2 ), pp. ZS-ZO".
377

37813» CrOTf L» D. "Achievement Tests aixl the uen Education," Educational
Forum, 1? (March, 1953), pp. 319-23*II4. Diederich, Paul B. "Design for a Comprehensive Evaluation
Program," School Review, $8 (April, 1950), pp. 225-32.15. Durost, Walter N. "What Constitutes a Minimal School Testing
program?" Education Digest, I3 (November, 19h-7)j pp.L8-52.
16. Flicker, paul E. "Looking At a Testing program for Secondary-School Youth," Bulletin of the Rational Association of Secondary SçhooT"Principals 314 (May, 195o), pp. 183-BT.
17. Enrich, Alvin C. "Changed Conception of Evaluation," CaliforniaJournal of Secondary Education, lU (October, 1939), pp.331-33'."
18. Evaluating Pupil ITogress, California State Department of Edu-cation. Bulletin, Vol. 21, Ro. 6, April, 1952. 18U pp.
19. "Evaluation in the Secondary School," Bulletin of the RationalAssociation of Secondary School princirais,"3'2 (April,I9W), pp. 3^ 07. ^
20. "Evalmtion Program," California Schools, 18 (July, 19^7),pp. 15.9-51.
21. Evaluative Criteria. 1950 edition. Co-operative Stuc^ ofSecondary School Standards, 305 pp.
22. Fickes, James A. . "Tlie Comparative values of Selected EvaluathreTechniques to Elanentary-School Teachers." "Unpublished Doctor«S dissertation, Columbus, Ohio: The Ohio StateUniversity, 1959. 527 pp.
23. Findley, "Warren G. "Educational Evaluation: Recent Developments," Social Education, 15 (May, 1950), pp. 206—10.
25. Fisher, Bernard. "Psychologist•s Evaluation of Teachers»Reports, and Suggestions for Their Dnprovement," Educational Administration and Supervision, 38 (March, 1952), pp. 175-79.
25* Frederick, Leo. "Teacher Evâuation of Pupil Learning," Bulletinof the National Association of Secondary School principals 317 (December, I95O), pp. 26CP69«
26. Greene, Harrj'- A. j Jorgensen, Albert N., and C-erberich, J,Raymond. Measurement and Evaluation in the Secondary School. Reiv "York: Longmans, Green anE Compary, 1953 •639 pp.

37927. Grim, Paul R. "Comprehensive Concept of Evaluation — A Reply,"
Curriculum Journal, 11 (januaz^r, I9U0), pp. 32-35.20. H3.S tings, j. Thomas. "Vfliat Kind of Testing program in Today «s
Secondarj' Sciiool?" Bulletin of the National Association Association of Secondary SchooT Principals, 36 (April,1952), pp. 13E-SÔ:
29. HoiT To Evaluate a Secondary School. I9U0 edition, cooperativeStudy of Secondary School Standards, 139 PP»
30. Kandel, I. L. Examinât!ons and Their Substitutes in the unitedStates. Nevf York: The Car neige Foundation for the Advarcejænt of Teaching, Bulletin No. 28, I936. I83 pp.
3 1. Kirkendall, L. A. "problems of an Evaluation program," W u -cational Administration and Supervision, 29 (September, IPUTTpp: 37T-lf2-.---------------------
32. Knight, Edgar W. and Hall, Clifton C. Readings in American ,Educational History. Neu- York: Aopleton-CenEury Croft.s,w . T i m v ■ w p p .
33» KVaraceus, Vf. C. "Prerequisites to an Effective Testing Program," School Revlevr, 60 ( January, 1952), pp. 2U-29.
3U» Lass, A. H. and Vfrightstone, J. Waj’-ne. "Evaluation in the Secondary Schools of New York City," High Points, 28 (March, 19^6), pp. 11-12.
35. Learned, William S. and Wood, Ben D. The Student and HisKnovfledge. New York: The Carneige Foundation for the Advancement of Teaciiing, 1938. Ij.06 pp.
36. Lee, J. Murray and Segel, David. Testing Practices of Kigh-School Teachers. United States office of Education Bulletin, 1936, No. 9j Government printing Office, Washington, D. C», 1936. L2 pp.
37» Lefever, D. Welty, "The Teacher's Role in Evaluating PupilAchievemenb," Education, 7I (December, 1950), pp. 203-9.
38. LeTiTerens, A. S. "Ke\T Developments in Evaluating Achievement in the public Schools of Los Angeles," Education, 71 (December, 1950), pp. 237-lib.
39» Linde camp, Clearies p. "Host Should the Secondary School Evaluate and Record Student Progress?" Bulletin of the National Association of Secoriiar '- School principals*,' 36 (March,1952), pp. 13F-W:
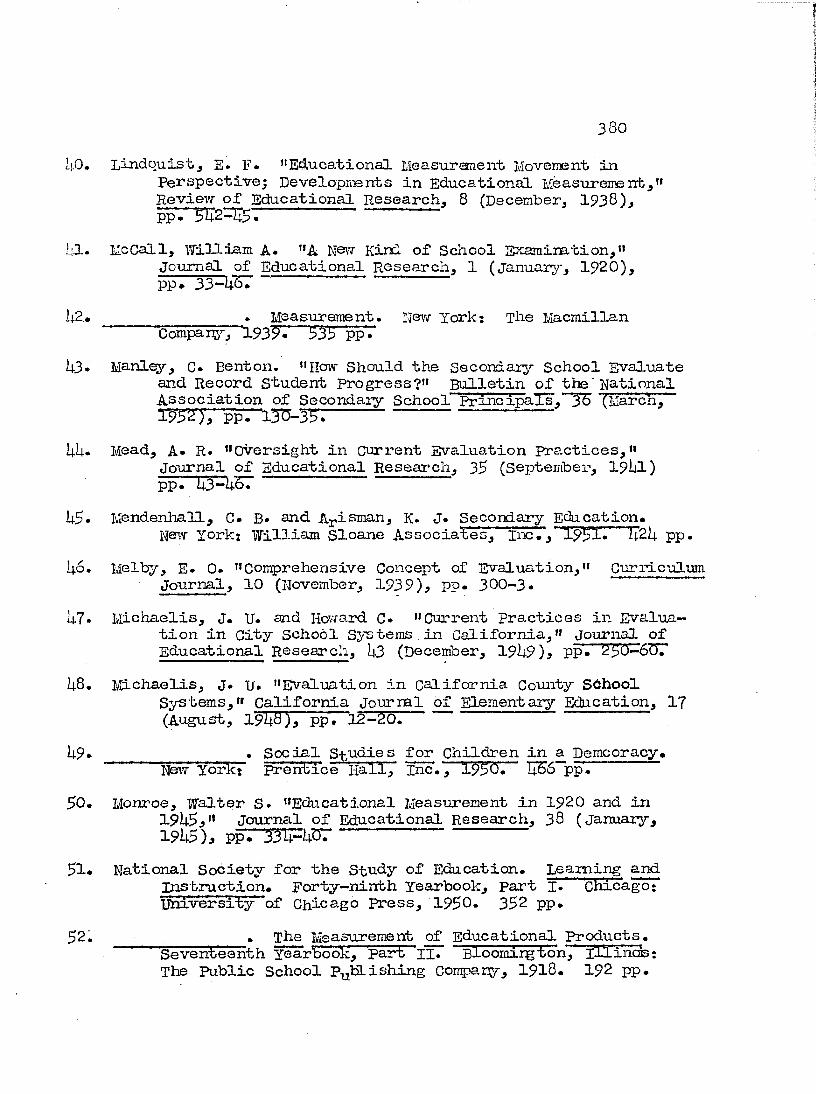
380
I|.0, Lindquist^ E« F- "Educational Measurement Movement inPerspective; Developriients in Educational Measurement Review of Educational Research, 8 (December, 1938),ppTVl2-=JlS-.----------------------
i j l . McCall, William A* "A New Kind of Scliool E%amination,"Journal of Educational Research, 1 (January, 1920),PP* 33“U57
U2. . Measureme nt. New York: The MacmillanCcjnparo'j 193^ 535 PP*
U3» Manley, C. Benton. "How Should the Secondary School Evaluate and Record Student Progress?" Bulletin of the National Association of Secondary School FrincipaTs, 36 (March, " 1 9 5 ^ 1 7 ^ ^ 5 ^ - 3 5 7 — ----------------------
hU. Mead, A- R. "Oversight in Current Evaluation Practices,"Journal of Educational Research, 35 (September, I9I1I) pp. li3~U57
U5- Mendenhall, C# B» and A^isman, K. J. Secondary Education.New York: William Sloane Associates, fnc., 1 9 5 ïï2h pp.
h6. Melby, E. 0. "Comprehensive Concept of Evaluation," Curriculum Journal, 10 (November, 1939), pp. 300-3.
U7. Michaelis, J. U. and Howard C. "Current Practices in Evaluation in City school Systems in California," Journal of Educational Research, U3 (December, 19h9), pp. 230-6Ur
U6. Michaelis, J. U. "Evaluation in california County SchoolSystems," California Journal of Elementary Education, 1? (August, 1914,8), pp. 12-È0.
Î4.9. _______________ . Social Studies for Children in a Demcoracy.New York; prentice Hall, Inc., 1950* 7^6 pp.
50. Monroe, Walter S. "Educational Measurement in 1920 and in19U5," Journal of Educational Research, 38 (January,I9h5), pp. 33U-Unr
51. National Society for the Study of Education. Learning andInstruction. Forty-ninth Yearbook, Part I. Chicago: University of Chicago Press, 1950. 352 pp.
52. . The Measurement of Educational Products.Seventeenth Yearbook, part II. sioomiig ton, 'lUinos:The Public School p,^bLishing Company, 1918. 192 pp.

38153* _________ » The Measwemsnt of Understanding. Forty-fifth
Yearbook, Part %. Chic ago: University of Chicago Press, 19^6. 338 pp.
5U. __________ . The Scientific Movement in Education. Tliirty-seventh Yearbook, part II. Bloorair^ton, Illinois : ThePublic School P-u hLishing Gonpary, 1938. $03 pp.
55. Ojemann, R. H. and Me Candle ss, R. A* "Suggestions for aFundamental Revision of Report Cards," Educational Administration and Supervision, 32 fFebruary, l9U6 ), ppTT[0=I^----------------------
56. Grata, Pedro T. "Evaluating Evaluation," Journal of Edu-cational Research, 33 (May, 19U0), pp.’ 6bl-61.
57. Payne, W. H. Theory and Practice of Teaching. Nev/ York:American Book Company, 1Ü85. (Enlarged edition of Theory and Practice of Teaching by David P. Page, 18U7).ïï2?Tp . ----------------------------
58. Pratt, K. G« "I7hat Is the Legitimate Role of the Concepts ofGrowth and Progress in Educational Mea-sureme nt ? Educational Administration and Supervision, 25 (March, 1939), pp.2YÜ-YÜ'.---------------------- ----------------
59. Pupil Appraisal Practices in Secondary Schools. United StatesOffice of Education Circular, 1$52, No. 363, Government Printing Office, Washington, D* C.j 1952.
60. Ramseyer, j. A. "Effective Ways of Measuring, Recording, andReporting Pupil Progress," Bulletin of the National Association of Secondary School principals, 35 (March,1951), pp. 12F-30.
61. Raths, Louis E ."Approaclies to the Measurement of Values,"Educational Research Bulletin, 19 (hUsff- 8, I9I4.O), pp.275-8'2.- - - - - - - - - - - - - - -
62. . "Basis for Comprehensive Evaluation," Edu—c^tiohal Research Bulletin, l5 (September 11, 1936),pp . '2èO'-'2TÛ
63. '______________ . "Navrer Concepts of Evaluation," EducationalResearch Bulletin, 17 (March 16, I938), pp. 57~'81i.
6[|. . "Tavard B@tter Evaluations," EducationalLeadership, 8 (November, 1950), pp. 70-72.
65. Remmers, H. H. and Gage, N. L. Educational Measurement andEvaluation. New York: Harper and Brothers, I9I43. '580 pp.

33266. RockowltZj "Know Thyself* Tecniques in pupil Self-
Evaluation,»» High Points, 33 (October, 1951), pp. 50-56.67. Ross, C. C. Measurement in Today is Schools. NeiT York;
prentice-Hall, lnc.,T9ij?(. 551 pp.6u. Ruch, G. M* The Objective or Ne\-/-Type Examination. Chicago;
Scott, Foresmah and Company, 1$29. Lt?b pp.69. Rummel, J , F» Know your Pupils j A.n Introductory Manual on
pupil Evaluation. Portland, Oregon; Oregon Departîœnb of Education, 1951. 37 PP«
70. Scates, Douglas E* "Differences Between Measurement Criteriaof Pure Scientists and of Classroom Teachers^" Journal of Educational Research, 37 (September, 19U3), pp. 1-15.
71. _____________ . ’'Fifty Years of Objective Measurement andResearch in Education," journal of Educational Research, ill (December, I9U7), pp. 211-52.
72. Segel, David. "Some Newer Practices in Evaluation," SchoolLife, 26 (June, I9II), pp. 269-70.
73» Sims, ■ V. M. "Educational Measurements and Evaluation," Journal of Educational Research, 38 (September, I9UU), pp. Ib-Slj..'
7U. Smallenburg, Harry, "Evaluating Pupil Progress," EducationalLeadership, 2 (April, 19U5), pp. 290-93.
75. Smith, B. 0. Logical Aspects of Educational Measurement.■ New York; Columbia University Press, I93Ü. Iü2 pp.
76. Smith, Eugene R. and Tyler, Ralph W* Appraising and RecedingStudent Progress. New York; Harper and Brothers,550 pp.
77. State Testing and Evaluation prcgram. united States Officeof Education Circular, 1951V No. 320, Government Printing Office, Vfashiigton, D. C., 1951. 38 pp.
78. Traxler, Arthur E. "Fifteen Criteria of a Testing Program,"Clearing House, 25 (September, 1950), pp. 3-7.
79. . Techniques of Guidance. New York;Harper and Brothers, l9l5. J9U pp.

38380. Troyer^ liaurice H. Accuracy and Validity in Evalviation Are
Not Enough. (The J. Riciiard Street Lecture for l^hT)' Syracuse, ijeiT York: Syracuse University press. Ip! 1.7.16 pp.
81. Troyer, Maurice E. and Pace, C. Robert. Evaluation in TeacherEducation. Washington, D. C.t American Council^onEducation, 19hh» 368 pp.
82. Tyler, Ralph W. "An Appraisal of Teclaniques of Evaluation - ACritique," Official Report, American Educational ReseorchAssociation, May, IpI O, pp. 72-77.
83. ________________ • "Evaluation; A Challenge and an oppartiurityto Progressive Education," Educational Record, I6 (January/, 1935)j pp. 121-31,
u k . ______________ . "General Statement on Evaluation," JournalEducational Research, 35 (March, ipUS), pp. L92-50T.
85« ________________. "Place of Evaluation in Modern Education,"BTeiffijirbary School journal, Ll (September, IpUO), pp. 19-27.
86. YiToody, Clifford. "Mature of Evaluation," Journal of Educational Research, 35 (March, I9I42), pp. U81-9T,
67. Wrightstone, J. Wayne. "Analysing and Measuring Democracy inthe Classroom," Nation*s Schools, 11 (May, 1933),pp. 31-35.
88. . "Appraisal Te cliniques in Education," journal' Educational Sociology?-, lU (September, I9U0), pp. 27-32.
69. . "Evaluation," Encyclopedia of EducationalResearch, 1*950» PP » h03-7 •
90. . "Evall.uation of General Ability to ManageEtqperiences," Harvard Education Review, 9 (October, 1939), pp. UI43-5I.
91. . "Design for Evaluation for High Schools,"High points, 26 (Februaiy, 19hh), pp. 27-32.
92. . "Evaluation Procedures with Special Reference t o the Appraisal of the GrC/vth and Developme:± of Gifted Youth," (In Pennsylvania University School of Education, Roads to the Future, 19hl), pp. 298-306.
93. ________ _____ . "Evaluation, Trend and survey Studies,"Review oï‘ Educational Research, 18 (December, I9U8), pp. 396^ 09.

38Lpit. _____________ . " H w can Teachers Tor king Individually and in
Groups, Eliminate tte Confusion of Assigning I,larks in Subject-Matter Fields and in personality characteristics?(In Pennsylvania UirLversity School of Education, Educational planning for Peace, I9UU). pp. 21S-21.
95• _____ _____ . "Eevf Developments in Evaluating Achievement intine High Sciiool," Education, 71 (December, 1950), pp. 210-16.
96. _____________ . "Ner.'j- Emphasis and Broader Scope for Tests andMeasurements," Nation's Schools, U3 (March, 19U9)j pp.39-m.
97. ______ . "Techniques for Measuring Neuer Values inEducation," Journal of Educational Research, 35 (March, 19U2), pp. 517 5TI:
98. . "Trends in Evaluation," Educational Leader- ship, d~~^November, 1950), pp. 91-95.
99* T/rinlcle, Vf. L. Improving Marking and Reporting practices in Elementary and Secondary School's. NevT YorîFl RineiiaôrE' and Coîiç>ary,' 'l'9ii7. ÏS'O’ pp.

38S
AUTOBIOGRAPHY
I, Guy William Buddemeyer^ wao born near Hew Kno:cviZU% Ohio, September 13, 1916. I attended a rural elementary school in Auglaize County, Qlriio, and received my secondary education in the public schools of Hew Knoxville, Qliio. llj undergraduate work was taken at BovYling Green State University, Bowling Green, Ohio, from which I received the degree Bachelor of Science in Education in 1939. My teaching experience, which was interrupted bj'- five years of service in the united States A omy, consists cf one year as a teacher in the elementary schools of Botkins, Ohio, and four years as a teacher in the secondary school at Sharon Centex', Ohio* FoUo%'d.ng attendance at summer sessions, I received the degree Master of Arts from The Ohio State university in I9S0. After completing the requirements for the master«s degree, I continued to attend The Ohio State University to establish the residence requirement for the Ph. B. degree. From January 1952, I served as Research Assistant in the Bureau of Educational Research at The Ohio State university, during idiich time I completed the requii’ements for the degree Doctor of philosoplxy.