Identification of Inflammatory and Regulatory Cytokines IL-1 ...
Upload
independentCategory
view
2download
0
Journal of Neuroimmunology xxx (2014) xxx–xxx
JNI-475932; No of Pages 8
Contents lists available at ScienceDirect
Journal of Neuroimmunology
j ourna l homepage: www.e lsev ie r .com/ locate / jneuro im
A study of oxidative stress, cytokines and glutamate in Wilson diseaseand their asymptomatic siblings
Jayantee Kalita a,⁎, Vijay Kumar a, Usha K. Misra a, Abhay Ranjan a, Hamidullah Khan b, Rituraj Konwar b
a Department of Neurology, Sanjay Gandhi Post Graduate medical Sciences, Lucknow, Indiab Division of Endocrinology, CSIR-Central Drug Research Institute, Lucknow, India
Abbreviations:ADL, activities of daily living; BFM, Burkliver disease; Cu, copper; EDTA, ethylene diamine tetra-acKayser–Fleischer; LPO, lipid peroxidation; MRI, magnemalonodialdehyde; MMSE, Mini Mental State ExaminationTAC, total antioxidant capacity; TNFα, tumor necrosis facWilson disease.⁎ Corresponding author at: Department of Neurology
Institute of Medical Sciences, Raebareily Road, Lucknow2494169; fax: +91 522 2668811.
E-mail addresses: [email protected], jkalita@sgpg
http://dx.doi.org/10.1016/j.jneuroim.2014.06.0130165-5728/© 2014 Published by Elsevier B.V.
Please cite this article as: Kalita, J., et al., A stuNeuroimmunol. (2014), http://dx.doi.org/10
a b s t r a c t
a r t i c l e i n f oArticle history:
Received 21 April 2014Received in revised form 13 June 2014Accepted 17 June 2014Available online xxxxKeywords:Wilson diseaseGlutathioneLipid peroxidationCytokineGlutamateCopper
Background: Free copper in Wilson disease (WD) is toxic and may reduce antioxidant, increase oxidative stressmarker and thereby cytokine release and excitotoxic injury, but there is paucity of studies in humans. We reportoxidative stressmarkers, cytokines and glutamate in neurologicWD and correlate thesewith their clinical sever-ity, laboratory findings and extent of Magnetic resonance imaging (MRI) changes.Methods: 29 patients with neurologic WD and 9 asymptomatic WD siblings were included and their clinical,treatment history, disease severity, biochemical findings and MRI changes were noted. Glutathione (GSH),total antioxidant capacity (TAC) andmalonodialdehyde (MDA)weremeasured by spectrophotometer, cytokinesby cytokine bead array and glutamate by the fluorometer.Results: In WD patients, the glutathione (mean ± SEM, 2.20 ± 0.06 vs. 2.73 ± 0.04 mg/dl, P b 0.001) and TAC(1.70 ± 0.03 vs. 2.29 ± 0.02 Trolox_Eq_mmol/l, P b 0.001) were reduced, and MDA and glutamate (23.93 ±0.54 vs. 19.96 ± 0.27 μmol/l; P b 0.001) were increased (4.7 ± 0.11 vs. 3.03 ± 0.52 nmol/ml, P b 0.001) com-pared to controls. The serum IL6 {median (IQRs), 9.42(10.92) vs. 5.2(5.34) pg/ml; P = 0.001}, IL8
{12.37(10.92) vs. 5.63(5.52) pg/ml; P b 0.001}, IL10 {8.33(8.3) vs. 2.05(1.37) pg/ml; P = 0.001} and TNFα{6.14(8.95) vs. 3.61(3.58) pg/ml; P b 0.001} were also increased in WD patients compared to controls. Thesechanges were more marked in the neurologic WD compared to asymptomatic WD and in the untreated com-pared to treated patients. TAC correlated with duration of illness, serum free copper, 24 hour urinary copperand serum ceruloplasmin, and glutamate with MDA, TNFα, ceruloplasmin and 24-hour urinary copper.Conclusions: InWDpatients, antioxidants are reduced andMDA, cytokines and glutamate are increasedwhich aremore marked in symptomatic neurologic WD than asymptomatic patients.© 2014 Published by Elsevier B.V.
1. Introduction
Wilson disease (WD;OMIM#277900) is an autosomal recessive dis-ease caused by mutation in ATP7B gene spanning more than 80 kb ge-nomic DNA on chromosome 13q4.2–q21 (Thomas et al., 1995). ATP7Bgene has 21 exons, encodes 1465 amino acids and its gene productshelp in transporting copper (Cu) into the secretary pathway for incor-poration into apoceruloplasmin and excretion into the bile (Vrabelova
e–Fahn–Marsden; CLD, chronicetic acid; GSH, glutathione; KF,tic resonance imaging; MDA,; ROS, reactive oxygen species;tor-alpha; IL, interleukin; WD,
, Sanjay Gandhi Post Graduate226014, India. Tel.: +91 522
i.ac.in (J. Kalita).
dy of oxidative stress, cytokin.1016/j.jneuroim.2014.06.013
et al., 2005). Mutation of ATP7B gene results in impaired trafficking ofCu in and through the hepatocytes resulting in excessive accumulationof Cu in various organs such as the liver, cornea, lens and brain.
In the blood, Cu is found in the bound and in the free states. Inthe bound state, Cu is covalently linked to ceruloplasmin, while freeCu in the blood loosely binds to albumin and other small molecules.The level of loosely bound Cu is increased in WD, although the totalserum Cu and ceruloplasmin levels usually remain low (Ogihara et al.,1995). In a normal individual, free Cu is only 10–15%, which is greatlyincreased in WD (Chen et al., 2012). Free Cu level is highly toxic, cancross blood–brain barrier and induces oxidative damage to the braintissue (Choi and Zheng, 2009). Since 1993, total antioxidant capacity(TAC) of a hydrophilic antioxidant is measured in biological sam-ples to learn how the human body reacts to oxidative and nitrosactiveinjury. TAC measures hydrophilic antioxidants and is highly influencedby serum uric acid level (Bruha et al., 2011). Glutathione (GSH) isa water-soluble antioxidant and is widely expressed in most of theorgans. Free Cu level in WD increases and there is a reduction in the
es and glutamate inWilson disease and their asymptomatic siblings, J.

2 J. Kalita et al. / Journal of Neuroimmunology xxx (2014) xxx–xxx
level of glutathione and other antioxidants (Schulz et al., 2000; Attriet al., 2006; Nagasaka et al., 2006) hence, there is an increase in reactiveoxygen species (ROS) and lipid peroxidation (LPO) (Lovell et al., 1995;Hensley et al., 2000; Halliwell, 2001; Dalgic et al., 2005; Schlief andGitlin, 2006). ROS are known to activate NF-Kappa B which in turn acti-vates growth factors and anti-apoptoticmolecules resulting in excessivecell proliferation (malignancy), inflammatory cytokines and adhesivemolecules (Karin and Greten, 2005). In WD, Cu induces oxidative stressand thereby cytokine and glutamate release, which may be responsiblefor cellular injury. Insignificantly higher levels of both inflammatoryand anti-inflammatory cytokines in WD patients compared to controlshave been reported (Goyal et al., 2008). In another study, TAC was re-duced in WD patients compared to controls and was more marked inneurologic WD which was correlated with disease severity (Bruhaet al., 2011). Evaluation of antioxidant, oxidative stressmarker, cytokineand glutamate together may help in understanding the mechanism ofcellular injury in WD. In the available medical literature, we could notfind any study correlating these markers in neurologicWD. In this com-munication, we therefore report the antioxidant (glutathione and TAC),oxidative stressmarker [Lipid peroxidation product; malonodialdehyde(MDA)], cytokines and glutamate levels in neurologicWD and correlatethese with clinical, MRI and biochemical markers of severity of WD.
2. Subjects and methods
In this study consecutive patients with neurologic WD attendingto neurology service of a tertiary care teaching hospital were includedprospectively. The diagnosis of neurologic WD was based on clinical,Kayser–Fleischer (KF) ring on slit lamp examination, low serum cerulo-plasmin (b20 mg/dl) and high urinary Cu (N40 μg/24 h) (Roberts et al.,2008). A detailed clinical evaluation including duration of neuropsychi-atric symptoms, age at onset, and history of hepatitis was noted. Pedi-gree chart was prepared for every index patient and the siblings werescreened by measuring serum ceruloplasmin, urinary and serum Cu,slit lamp examination for KF ring, liver function test and ultrasoundabdomen. The siblings of neurologic WD patients were considered tohaveWD based on low serum ceruloplasmin (b20 mg/dl), high urinaryCu (N40 μg/24 h) and additional findings such as KF ring and evidenceof liver dysfunction on biochemistry and/or ultrasound. DNA sequenc-ing study for the diagnosis of WD is not available locally.
MiniMental State Examination (MMSE) was used for the evaluationof cognitive functions (Crumet al., 1993). The severity of neurologicWDwas based on activities of daily living (ADL) and the sum score of fivesigns (dysarthria, tremor, ataxia, rigidity/bradykinesia and chorea/athetosis). Each neurologic sign was given a score of 0 to 3; zero beingnone and three being severe. The severity was categorized into thegrade-I (mild), grade-II (moderate, sum score of 2–7 and patient wasindependent for ADL) and grade-III (severe, the sum score of N7 anddependent for ADL) (Grimmet al., 1991; Kalita et al., 2010). The severityof dystonia was assessed using Burke–Fahn–Marsden (BFM) score(Krystkowiak et al., 2007). Liver dysfunction was considered if therewas raised liver enzyme (transaminases), coagulopathy (deranged in-ternational normalized ratio/prolong prothrombin time) or ultrasoundevidence of chronic liver disease (CLD).
2.1. Investigations
5-ml of venous blood was drawn from the antecubital vein in anethylene diamine tetra-acetic acid (EDTA) and plain vial. Plasma wasseparated from the EDTA vial and serum from the plain vial and storedat −80 °C until analyzed. GSH, MDA and TAC levels were analyzedmonthly whereas cytokine and glutamate levels were analyzed aboutone year later. Serum Cu and 24 hour urinary Cu levels were measuredby an atomic absorption spectrophotometer. Blood counts, hemo-globin, blood sugar, blood urea nitrogen, serum creatinine, protein, al-bumin, calcium, alkaline phosphatase, bilirubin and transaminases
Please cite this article as: Kalita, J., et al., A study of oxidative stress, cytokinNeuroimmunol. (2014), http://dx.doi.org/10.1016/j.jneuroim.2014.06.013
were measured. Coagulation profile was also evaluated. Ultrasoundabdomen was performed to evaluate evidence of CLD. Ultrasoundevidence of CLD included decrease in liver size, coarse echotextureand irregular margin with or without raised portal vein pressure(Rumack et al., January 5, 2011). Serum ceruloplasmin was assayed byits oxidase activity with o-dianisidine dihydrochloride following themethod of Schosinsky et al. (1974). The serum free Cu was calculatedby subtracting three times the serum ceruloplasmin level (mg/dl)from the total serum Cu level (mg/dl). Cranial MRI was done usinga 3 T MRI scanner and axial sections were obtained in T1, T2, andFLAIR sequences. The location of abnormal signal intensity and numberof MRI lesions were noted.
GSH, TAC and MDA levels were measured in 38 WD patients and64 healthy age (patients vs. controls — 16.9 + 5.9 vs. 17.4 ± 4.4 years;P = 0.78) and gender (M:F, 49:15; P = 0.63) matched controls by aspectrophotometer.
2.2. Glutathione (GSH) assay
Plasma GSH was measured by a spectrophotometer at 412 nmaccording to the method described by Tietze (1969). Plasma wasadded to 10% trichloroacetic acid (TCA) and allowed to stand at 4 °Cfor 2 h. This mixture was centrifuged at 2000 ×g for 15 min and the su-pernatantwas added to Tris–HCl buffer (0.4M, pH 8.9) containing EDTA(0.02 M). Finally 5,5-dithiobis {(2-nitrobenzoic acid) (DTNB) (0.01 M)}was added to the mixture which was reduced into the yellow product,5-thio-2-nitrobenzoic acid (TNB) that was measured by spectropho-tometer at 412 nm. A standard curve of reduced glutathione (GSH)was plotted to determine the amount of glutathione in the plasmasample.
2.3. Total antioxidant capacity (TAC) assay
Serum TAC was measured by the method described by Koracevicet al. (2001). In this method, the hydroxyl radical is produced by theFenton reaction, reacts with benzoate resulting in the release of TBARS(thiobarbituric acid reactive substances), which is bright yellowish-brown in color. Upon addition of a serum sample, the oxidative reac-tions are initiated by the hydroxyl radicals present in the reaction mix-ture, and are suppressed by the antioxidant components of the serum,whichprevents the color change and thereby provides an effectivemea-sure of the total antioxidant capacity of the serum. This was measuredby spectrophotometer at 532 nm and the inhibition of color develop-ment was defined as TAC.
2.4. Lipid peroxidation (LPO) assay
LPO was measured by assessing malonodialdehyde (MDA) level,which is the end product of LPO (Janero, 1990). Plasma was mixedwith EDTA, ascorbate (10 mM) and FeSO4 (16.7 mM) and incubated at37 °C for 60 min. The reaction was stopped by adding ice-cold 10%trichloroacetic acid (TCA). The mixture was centrifuged at 2000 ×gfor 10 min and supernatant was aspirated. The supernatant mixedwith equal volume of 0.67% thiobarbituric acid (TBA) and was kept ina boiling water bath for 15 to 20 min. MDA level was determined withthe absorption coefficient of MDA–TBA complex at 532 nm usingspectrophotometer.
2.5. Cytokine assay
Interleukin (IL-6, IL-8 and IL-10) and tumor necrosis factor-alpha(TNFα) were measured in serum using a flow cytometer with bead-based immunoassay (BD Biosciences, US). Cytokines were measuredin 29 WD patients and 44 healthy age (patients vs. controls — 16.9 +5.3 vs. 17.2 ± 4.4 years; P = 0.75) and gender (M:F, 22:33; P = 1.00)matched controls.
es and glutamate inWilson disease and their asymptomatic siblings, J.
3J. Kalita et al. / Journal of Neuroimmunology xxx (2014) xxx–xxx
2.6. Glutamate assay
Serum glutamate level was measured by a fluorescence microplatereader using excitation at 530 ± 12.5 nm and fluorescence detec-tion at 590 ± 17.5 nm (Invitrogen, U.S.). Glutamate was measured in35 WD patients and 45 healthy age (patients vs. controls — 16.9 ± 5.9vs. 17.2 ± 4.4 years; P = 0.78) and gender (M:F, 28:34; P = 0.79)matched controls. The control group did not have history of jaundice,patient of WD in their family and their serum ceruloplasmin levelswere normal.
At the time of blood collection, the control subjects were healthywithout any clinical evidence of systemic illness, infection, malignancyand autoimmune disease. None of the female control was pregnant.
2.7. Statistical analysis
The distribution of data was assessed by Shapiro–Wilk test. Normal-ly distributed data (GSH, LPO, glutamate and TAC) were presented asmean ± SEM and non-normally distributed data (IL6, IL8, IL10 andTNFα) as median (IQRs). Normally distributed data between patientsand controls were analyzed using independent t-test and non-normally distributed data were analyzed using Mann–Whitney U test.The relationship of glutathione, TAC, MDA, cytokine, glutamate, serumfree Cu, urinary Cu and ceruloplasmin were evaluated by Spearmancorrelation test. The evidence of CLD, severity of neurologicWD and ex-tent of MRI lesions were correlated with oxidative markers, glutamateand cytokine levels by Spearman or Karl–Pearson correlation test. Thevariable was considered significant if the two tailed P value was b0.05.All the statistical tests were done using SPSS-16 version or GraphPadprism-5 software.
3. Results
This study was based on 38 consecutive WD subjects; 29 neurologicWD patients and 9 asymptomatic WD siblings. Their age rangedbetween 4 and 31 (median 16) years, 10were females and 17were chil-dren (≤15 years). All the symptomatic patients had signs and symp-toms of neurological involvement, KF ring, low serum ceruloplasminand high 24-hour urinary excretion of Cu. All nine asymptomatic sib-lings had low serum ceruloplasmin and raised 24-hour urinary excre-tion of Cu. Eight of the asymptomatic WD patients also had KF ring,four had raised liver enzymes and six had CLD on ultrasound abdomen.
The median duration of neurological symptoms was 12 months(1 month to 12 years) and 12 had past history of jaundice. MMSEwas done in 22 patients and was abnormal in three. Dystonia waspresent in all the patients with neurologic WD. The severity of dystonia
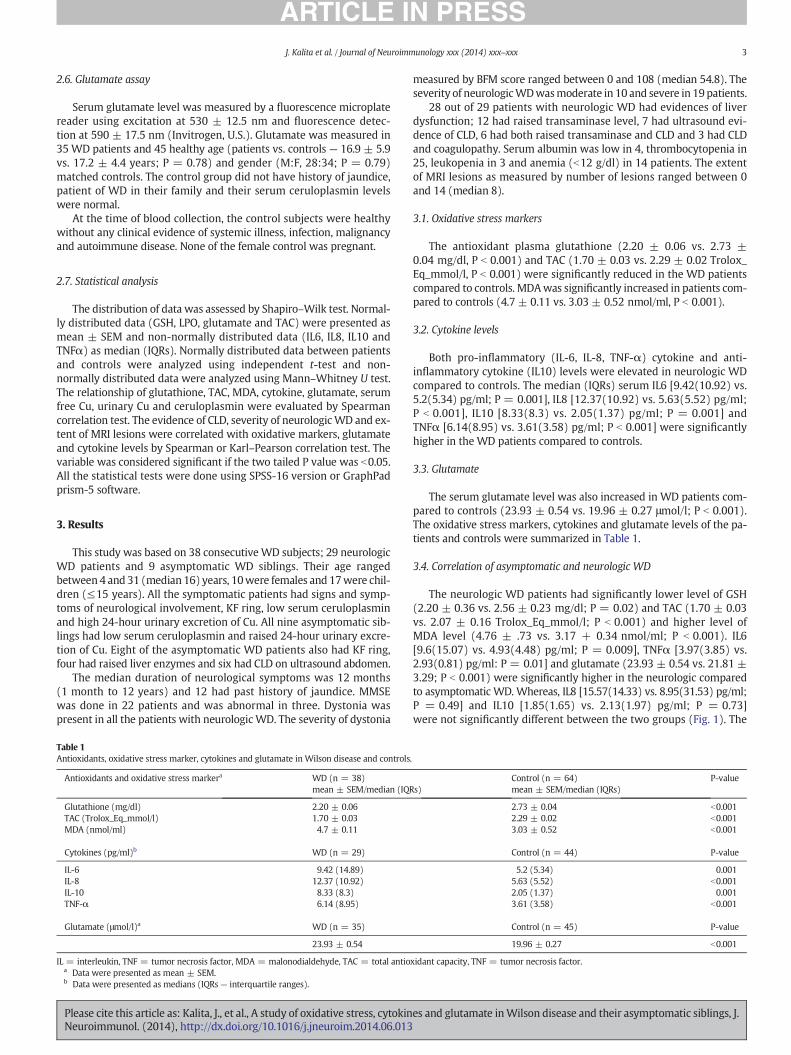
Table 1Antioxidants, oxidative stress marker, cytokines and glutamate in Wilson disease and controls
Antioxidants and oxidative stress markera WD (n = 38)mean ± SEM/median (IQR
Glutathione (mg/dl) 2.20 ± 0.06TAC (Trolox_Eq_mmol/l) 1.70 ± 0.03MDA (nmol/ml) 4.7 ± 0.11
Cytokines (pg/ml)b WD (n = 29)
IL-6 9.42 (14.89)IL-8 12.37 (10.92)IL-10 8.33 (8.3)TNF-α 6.14 (8.95)
Glutamate (μmol/l)a WD (n = 35)
23.93 ± 0.54
IL = interleukin, TNF = tumor necrosis factor, MDA = malonodialdehyde, TAC = total antioa Data were presented as mean ± SEM.b Data were presented as medians (IQRs — interquartile ranges).
Please cite this article as: Kalita, J., et al., A study of oxidative stress, cytokinNeuroimmunol. (2014), http://dx.doi.org/10.1016/j.jneuroim.2014.06.013
measured by BFM score ranged between 0 and 108 (median 54.8). Theseverity of neurologicWDwasmoderate in 10 and severe in 19patients.
28 out of 29 patients with neurologic WD had evidences of liverdysfunction; 12 had raised transaminase level, 7 had ultrasound evi-dence of CLD, 6 had both raised transaminase and CLD and 3 had CLDand coagulopathy. Serum albumin was low in 4, thrombocytopenia in25, leukopenia in 3 and anemia (b12 g/dl) in 14 patients. The extentof MRI lesions as measured by number of lesions ranged between 0and 14 (median 8).
3.1. Oxidative stress markers
The antioxidant plasma glutathione (2.20 ± 0.06 vs. 2.73 ±0.04 mg/dl, P b 0.001) and TAC (1.70 ± 0.03 vs. 2.29 ± 0.02 Trolox_Eq_mmol/l, P b 0.001) were significantly reduced in the WD patientscompared to controls. MDAwas significantly increased in patients com-pared to controls (4.7 ± 0.11 vs. 3.03 ± 0.52 nmol/ml, P b 0.001).
3.2. Cytokine levels
Both pro-inflammatory (IL-6, IL-8, TNF-α) cytokine and anti-inflammatory cytokine (IL10) levels were elevated in neurologic WDcompared to controls. The median (IQRs) serum IL6 [9.42(10.92) vs.5.2(5.34) pg/ml; P = 0.001], IL8 [12.37(10.92) vs. 5.63(5.52) pg/ml;P b 0.001], IL10 [8.33(8.3) vs. 2.05(1.37) pg/ml; P = 0.001] andTNFα [6.14(8.95) vs. 3.61(3.58) pg/ml; P b 0.001] were significantlyhigher in the WD patients compared to controls.
3.3. Glutamate
The serum glutamate level was also increased in WD patients com-pared to controls (23.93 ± 0.54 vs. 19.96 ± 0.27 μmol/l; P b 0.001).The oxidative stress markers, cytokines and glutamate levels of the pa-tients and controls were summarized in Table 1.
3.4. Correlation of asymptomatic and neurologic WD
The neurologic WD patients had significantly lower level of GSH(2.20 ± 0.36 vs. 2.56 ± 0.23 mg/dl; P = 0.02) and TAC (1.70 ± 0.03vs. 2.07 ± 0.16 Trolox_Eq_mmol/l; P b 0.001) and higher level ofMDA level (4.76 ± .73 vs. 3.17 + 0.34 nmol/ml; P b 0.001). IL6[9.6(15.07) vs. 4.93(4.48) pg/ml; P = 0.009], TNFα [3.97(3.85) vs.2.93(0.81) pg/ml: P = 0.01] and glutamate (23.93 ± 0.54 vs. 21.81 ±3.29; P b 0.001) were significantly higher in the neurologic comparedto asymptomatic WD. Whereas, IL8 [15.57(14.33) vs. 8.95(31.53) pg/ml;P = 0.49] and IL10 [1.85(1.65) vs. 2.13(1.97) pg/ml; P = 0.73]were not significantly different between the two groups (Fig. 1). The
.
s)Control (n = 64)mean ± SEM/median (IQRs)
P-value
2.73 ± 0.04 b0.0012.29 ± 0.02 b0.0013.03 ± 0.52 b0.001
Control (n = 44) P-value
5.2 (5.34) 0.0015.63 (5.52) b0.0012.05 (1.37) 0.0013.61 (3.58) b0.001
Control (n = 45) P-value
19.96 ± 0.27 b0.001
xidant capacity, TNF = tumor necrosis factor.
es and glutamate inWilson disease and their asymptomatic siblings, J.

4 J. Kalita et al. / Journal of Neuroimmunology xxx (2014) xxx–xxx
Please cite this article as: Kalita, J., et al., A study of oxidative stress, cytokines and glutamate inWilson disease and their asymptomatic siblings, J.Neuroimmunol. (2014), http://dx.doi.org/10.1016/j.jneuroim.2014.06.013

Fig. 2. Regression curve shows significant correlation of serum TAC with duration of illness, serum free Cu, and 24-hour urinary Cu and serum ceruloplasmin. TAC = total antioxidantcapacity.
5J. Kalita et al. / Journal of Neuroimmunology xxx (2014) xxx–xxx
asymptomatic WD patients were treatment naïve prior to the biochem-ical study. After thediagnosis ofWD in asymptomatic siblings, 6 receivedpenicillamine and zinc and 3 only zinc. In the neurologicWD, 22 patientswere prescribed penicillamine and zinc and 7 patients only zinc.
3.5. Clinical–biochemical correlation of oxidative stress markers, cytokinesand glutamate
TAC correlated with duration of illness (r = −0.44; P = 0.006),serum free Cu (r = −0.56; P b 0.001), urinary Cu (r = −0.52; P =0.001) and serum ceruloplasmin (r = 0.60; P = 0.001). IL6 correlatedwith total leucocyte count (r = −0.47; P = 0.013), and glutamatewith serum ceruloplasmin (r = −0.42; P = 0.025), TNFα (r = 0.395;P = 0.034) and 24 hour urinary Cu (r = 0.45; P = 0.005) (Figs. 2, 3).TAC is inversely correlatedwith age, duration of illness and hemoglobin.The remaining clinical (age, gender, severity of WD, MMSE score, BFMscore, hepatitis), laboratory (hemoglobin, platelet count, serum albu-min, serum bilirubin, serum transaminase, ultrasound evidence ofCLD) and the extent of MRI changes were not correlated with oxidativestress markers, cytokine and glutamate levels (Table 2).
Eighteen patients were treated (penicillamine and zinc in 11 andzinc 7) for a median duration of 51 (range, 6–144) months and 11were naïve to treatment prior to themeasurement of oxidativemarkers,cytokine and glutamate levels. The GSH and TAC were significantlyhigher and MDA, IL-6, IL-8 and glutamate were significantly lower inthe treated compared to treatment naïve patients. The details are sum-marized in Table 3.
4. Discussion
In the present study, antioxidants (GSH and TAC) were significantlydecreased and oxidative stressmarker (MDA), cytokines and glutamate
Fig. 1. Error bar diagram shows levels of antioxidant (GSH, TAC), oxidative stressmarker (LPO),siblings and controls. Values of GSH, TAC, LPO and glutamate expressed as mean ± SEM and vaWilson Disease, AWD = Asymptomatic Wilson Disease, IL = interleukin, TNFα = tissue necro
Please cite this article as: Kalita, J., et al., A study of oxidative stress, cytokinNeuroimmunol. (2014), http://dx.doi.org/10.1016/j.jneuroim.2014.06.013
levels were significantly increased in theWD patients compared to con-trols. These changesweremoremarked in neurologicWDpatients com-pared to their asymptomaticWD siblings and in the untreatedWD thanthe treated patients. TAC and GSH levels were inversely correlated withserum and urinary Cu and positively with serum ceruloplasmin levelwhereas reverse was true for MDA. Glutamate level positively correlat-ed with urinary Cu and negatively with ceruloplasmin. This study hadhighlighted the role of oxidative stress, cytokines and excitotoxicmarkers in neurologic WD and their correlation with clinical, biochem-ical and cranial MRI changes. Biochemical and ultrasound evidences ofliver dysfunction although were present in nearly all the symptomaticand majority of asymptomatic WD patients but history of jaundicewas present in only 41.4%. This is in concordance with the reportedfrequency of history of jaundice in 23% to 32% of patientswith neurolog-icWD (Walshe and Yealland, 1992; Kalita et al., 2013). There is only oneprior report correlating TAC with cytokine levels as well as with theclinical severity of WD. This study included 56 patients comprising of26 hepatic, 22 neurologic and 8 asymptomatic WD. WD patientshad significantly lower TAC and IL10 and higher IL 1β and IL6 levelscompared to controls. TNFα, hsCRP and IL2 were not different betweenWD patients and controls. The inflammatory markers were not relatedto disease severity, but TAC was related to the severity of neurologicsymptoms (Bruha et al., 2011). In our study however, cytokine levelswere elevated in patients but did not correlate with any clinical orMRI changes. TAC however correlated with duration of illness and IL6with leucocyte count. Oxidative stress markers and glutamate levelscorrelated with ceruloplasmin, serum free Cu and urinary Cu. Anotherstudy from India reported increase in both serum inflammatory andanti-inflammatory cytokines in WD patients compared to controls, butthese levels did not correlate with clinical parameters (Goyal et al.,2008). The lack of correlation of cytokine levels with clinical severityin our study may be due to the inclusion of only neurologic WD and
cytokine (IL6, IL8, IL10, TNFα) and glutamate in neurologicWDcompared to asymptomaticlue of cytokine expressed as medians (IQRs— interquartile ranges). NWD= Neurologicalsis factor, TAC = total antioxidant capacity.
es and glutamate inWilson disease and their asymptomatic siblings, J.

Fig. 3. Regression curve shows significant correlation of serum glutamatewith plasmaMDA, serum TNFα, 24-hour urinary Cu and serum ceruloplasmin in the patients withWD.MDA=malonodialdehyde, TNFα = tissue necrosis factor.
6 J. Kalita et al. / Journal of Neuroimmunology xxx (2014) xxx–xxx
their asymptomatic siblings. Whereas Bruha et al. included asymptom-atic, hepatic and neurologicWD patients (Bruha et al., 2011). Moreover,18 of our patients were already on treatment, which might have influ-enced the cytokine levels. Cytokines in the treated patients were sig-nificantly lower compared to treatment naïve patients. None of thereported studies however has measured glutamate in neurologic WD,which is a marker of excitotoxic injury.
In a normal individual, Cumetabolism is highly regulated. Unless Cuintakewas very low or high, the Cumediated immune status and oxida-tive stress function are not significantly affected. A higher dose of Cu for5 months however showed some changes in Cu status, and immunefunctions but its health implication is yet to be established (Turnlundet al., 2004). In a cell culture study, sub-lethal concentration of Cu
Table 2Correlation of clinical, biochemical and MRI findings of the Wilson disease patients with antiox
Variables GSH (r) TAC (r) MDA (r) IL6 (
Age −0.21 −0.40⁎ 0.17 −0.Gender −0.27 −0.23 0.03 0.Duration −0.25 −0.44⁎ 0.19 −0.MMSE −0.13 −0.42 0.56⁎ 0.Severity −0.21 −0.08 0.35 0.BFM −0.18 −0.07 0.28 −0.Hb −0.10 −0.39⁎ 0.14 −0.TLC 0.11 −0.16 0.01 −0.PLT 0.06 −0.06 −0.21 −0.Creatinine −0.26 −0.29 0.28 −0.SGOT 0.27 0.30 −0.35 −0.SGPT 0.16 0.16 −0.29 −0.Bilirubin 0.12 0.12 −0.07 0.Uric acid −0.52 −0.72⁎ 0.34 0.MRI −0.17 0.22 −0.32 −0.Serum Cu 0.53⁎⁎ −0.56⁎⁎ 0.48⁎⁎ 0.Ceruloplasmin 0.58⁎⁎ 0.60⁎⁎ −0.44⁎ 0.Urinary Cu 0.71⁎⁎ −0.52⁎⁎ 0.50⁎⁎ 0.
BFM = Burke–Fahn–Marsden, GSH = glutathione, IL = interleukin, MDA = malonodialdehtumor necrosis factor.⁎ P b 0.05 level.⁎⁎ P b 0.01.
Please cite this article as: Kalita, J., et al., A study of oxidative stress, cytokinNeuroimmunol. (2014), http://dx.doi.org/10.1016/j.jneuroim.2014.06.013
resulted in increased IL 1β, IL6 and TNFα. The increase in TNFα mRNAexpression howeverwas not associatedwith patient's serum TNFα sug-gesting that mRNA abundance does not always reflect the protein level(Teles et al., 2010). In our study, TNFα correlated with glutamate levelsuggesting the role of TNFα in the genesis of excitotoxic injury. Cyto-kines have been reported to predispose neurons to excitotoxic injury(Huang et al., 1999; Drachman et al., 2002). TNFα has shown to eitherdownregulate GLT1 or suppression of enzymes by which astrocytesclear the glutamate (Fine et al., 1996; Hara et al., 1997; Dringen et al.,2007). TNFα disrupts the expression and function of GLT1. In rat hippo-campal cell culture, TNFα resulted in increased expression of AMPA re-ceptors and overall synaptic strength, which in turn reduced clearanceof glutamate from the synaptic cleft. Increased expression of AMPA
idants, oxidative stress marker, cytokines and glutamate levels.
r) IL8 (r) IL10 (r) TNFα (r) Glutamate (r)
10 0.06 −0.06 0.02 0.1229 0.27 0.34 0.31 0.3210 −0.34 0.02 0.10 0.1010 −0.16 0.16 0.20 −0.0702 −0.01 −0.06 −0.07 0.1005 −0.07 −0.10 −0.09 0.0413 −0.01 −0.17 −0.24 0.0047⁎ −0.27 −0.36 −0.35 −0.1336 −0.30 −0.24 −0.37 −0.2627 −0.36 −0.18 −0.17 0.0912 −0.09 −0.12 −0.11 −0.2510 −0.11 −0.07 −0.11 −0.1301 0.22 0.01 0.17 0.0818 −0.16 0.04 −0.18 0.1302 0.19 −0.12 0.01 −0.2005 0.04 −0.05 0.07 0.1606 0.16 0.02 −0.24 −0.42⁎
02 0.11 −0.01 0.09 0.45⁎⁎
yde, MMSE = Mini-Mental State Examination, TAC = total antioxidant capacity, TNF =
es and glutamate inWilson disease and their asymptomatic siblings, J.

Table 3Comparison of antioxidants, oxidative stress marker, cytokines and glutamate levels in treated and treatment naïve patients with neurologic Wilson disease.
Variables Treated WD (n = 18)mean ± SEM/median (IQRs)
Untreated WD (n = 11)mean ± SEM/median (IQRs)
P value
Glutathione (mg/dl)a 2.17 ± 0.12 1.84 ± 0.06 0.01TAC (Trolox_Eq_mmol/l)a 1.76 ± 0.05 1.56 ± 0.03 0.001MDA (mmol/ml)a 4.45 ± 0.21 4.99 ± 0.08 0.03IL_6 (pg/ml)b 5.11 (5.62) 12.20 (16.49) 0.001IL_8 (pg/ml)b 7.82 (6.91) 15.65 (17.74) 0.04IL_10 (pg/ml)b 1.95 (1.68) 2.07 (2.26) 0.409TNFα (pg/ml)b 3.35 (2.61) 4.43 (4.06) 0.059Glutamate (μmol/l)a 22.78 ± 0.86 25.95 ± 0.80 0.02
GSH = glutathione, IL = interleukin, MDA = malonodialdehyde, TAC = total antioxidant capacity, TNF = tumor necrosis factor.a Data were presented as mean ± SEM.b Data were presented as medians (IQRs — interquartile ranges).
7J. Kalita et al. / Journal of Neuroimmunology xxx (2014) xxx–xxx
receptors results in increased sensitivity/hypersensitivity of neurons toglutamate (Zou and Crews, 2005). The effect of TNFα on GLT1 may be adynamic process; initially increased expression is protective whereaslonger duration of these changes may result in neuronal damage.
Normal brain astrocytes contain Cu, which are used in many bio-chemical reactions, and astrocyte has a capacity to deal with a largeamount of Cu. However, excess Cu is toxic as it can induce oxidativestress and cell damage (Kodama et al., 2010; Kaler, 2011; Scheiber andDringen, 2012).
The present study is based on small sample size becauseWD is a raredisease. Reduction in antioxidants and increase in oxidative stressmarkers, cytokines and glutamate even in asymptomatic siblingssuggest that these markers are closely related to Cu homeostasis inWD. The decreased levels of these markers in treated patients suggestthat these markers may be utilized to understand the mechanism ofCu induced injury inWDand have a potential tomonitor therapeutic re-sponse as well as may serve as a therapeutic target. Further studies areneeded in this direction.
Acknowledgment
Funding: This work was funded by an Intramural grant from theSanjay Gandhi Post Graduate Medical Sciences, Lucknow, India (PGI/137/39).
Ethics approval: The study was approved by the Institution EthicsCommittee, SGPGIMS, Lucknow (Ethic No. A-03:PGI/IMP/IEC/56/19.08.2011).
References
Attri, S., Sharma, N., Jahagirdar, S., Thapa, B.R., Prasad, R., 2006. Erythrocyte metabolismand antioxidant status of patients with Wilson disease with hemolytic anemia.Pediatr. Res. 59, 593–597.
Bruha, R., Vitek, L., Marecek, Z., Pospisilova, L., Nevsimalova, S., Martasek, P., Petrtyl, J.,Urbanek, P., Jiraskova, A., Malikova, I., Haluzik, M., Ferenci, P., 2011. Decreasedserum antioxidant capacity in patients with Wilson disease is associated with neuro-logical symptoms. J. Inherit. Metab. Dis. 35, 541–548.
Chen, D.B., Feng, L., Lin, X.P., Zhang, W., Li, F.R., Liang, X.L., Li, X.H., 2012. Penicillamine in-creases free copper and enhances oxidative stress in the brain of toxic milk mice.PLoS ONE 7, e37709.
Choi, B.S., Zheng, W., 2009. Copper transport to the brain by the blood–brain barrier andblood–CSF barrier. Brain Res. 1248, 14–21.
Crum, R.M., Anthony, J.C., Bassett, S.S., Folstein, M.F., 1993. Population-based norms forthe Mini-Mental State Examination by age and educational level. JAMA 269,2386–2391.
Dalgic, B., Sonmez, N., Biberoglu, G., Hasanoglu, A., Erbas, D., 2005. Evaluation of oxidantstress in Wilson's disease and non-Wilsonian chronic liver disease in childhood.Turk. J. Gastroenterol. 16, 7–11.
Drachman, D.B., Frank, K., Dykes-Hoberg, M., Teismann, P., Almer, G., Przedborski, S.,Rothstein, J.D., 2002. Cyclooxygenase 2 inhibition protects motor neurons and pro-longs survival in a transgenic mouse model of ALS. Ann. Neurol. 52, 771–778.
Dringen, R., Bishop, G.M., Koeppe, M., Dang, T.N., Robinson, S.R., 2007. The pivotal role ofastrocytes in the metabolism of iron in the brain. Neurochem. Res. 32, 1884–1890.
Fine, S.M., Angel, R.A., Perry, S.W., Epstein, L.G., Rothstein, J.D., Dewhurst, S., Gelbard, H.A.,1996. Tumor necrosis factor alpha inhibits glutamate uptake by primary human as-trocytes. Implications for pathogenesis of HIV-1 dementia. J. Biol. Chem. 271,15303–15306.
Please cite this article as: Kalita, J., et al., A study of oxidative stress, cytokinNeuroimmunol. (2014), http://dx.doi.org/10.1016/j.jneuroim.2014.06.013
Goyal, M.K., Sinha, S., Patil, S.A., Jayalekshmy, V., Taly, A.B., 2008. Do cytokines have anyrole in Wilson's disease? Clin. Exp. Immunol. 154, 74–79.
Grimm, G., Prayer, L., Oder, W., Ferenci, P., Madl, C., Knoflach, P., Schneider, B., Imhof, H.,Gangl, A., 1991. Comparison of functional and structural brain disturbances inWilson's disease. Neurology 41, 272–276.
Halliwell, B., 2001. Role of free radicals in the neurodegenerative diseases: therapeuticimplications for antioxidant treatment. Drugs Aging 18, 685–716.
Hara, H., Friedlander, R.M., Gagliardini, V., Ayata, C., Fink, K., Huang, Z., Shimizu-Sasamata,M., Yuan, J., Moskowitz, M.A., 1997. Inhibition of interleukin 1beta converting enzymefamily proteases reduces ischemic and excitotoxic neuronal damage. Proc. Natl. Acad.Sci. U. S. A. 94, 2007–2012.
Hensley, K., Robinson, K.A., Gabbita, S.P., Salsman, S., Floyd, R.A., 2000. Reactive oxygenspecies, cell signaling, and cell injury. Free Radic. Biol. Med. 28, 1456–1462.
Huang, P.P., Esquenazi, S., Le Roux, P.D., 1999. Cerebral cortical neuron apoptosis aftermild excitotoxic injury in vitro: different roles of mesencephalic and cortical astro-cytes. Neurosurgery 45, 1413–1422.
Janero, D.R., 1990.Malonodialdehyde and thiobarbituric acid-reactivity as diagnostic indicesof lipid peroxidation and peroxidative tissue injury. Free Radic. Biol. Med. 9, 515–540.
Kaler, S.G., 2011. ATP7A-related copper transport diseases-emerging concepts and futuretrends. Nat. Rev. Neurol. 7, 15–29.
Kalita, J., Somarajan, B.I., Misra, U.K., Mittal, B., 2010. R778L, H1069Q, and I1102Tmutationstudy in neurologic Wilson disease. Neurol. India 58, 627–630.
Kalita, J., Kumar, V., Chandra, S., Kumar, B., Misra, U.K., 2013.Worsening ofWilson diseasefollowing penicillamine therapy. Eur. Neurol. 71, 126–131.
Karin, M., Greten, F.R., 2005. NF-kappaB: linking inflammation and immunity to cancerdevelopment and progression. Nat. Rev. Immunol. 5, 749–759.
Kodama, H., Fujisawa, C., Bhadhprasit, W., 2010. Pathology, clinical features and treat-ments of congenital copper metabolic disorders—focus on neurologic aspects. BrainDev. 33, 243–251.
Koracevic, D., Koracevic, G., Djordjevic, V., Andrejevic, S., Cosic, V., 2001. Method for themeasurement of antioxidant activity in human fluids. J. Clin. Pathol. 54, 356–361.
Krystkowiak, P., DuMontcel, S.T., Vercueil, L., Houeto, J.L., Lagrange, C., Cornu, P., Blond, S.,Benabid, A.L., Pollak, P., Vidailhet, M., 2007. Reliability of the Burke–Fahn–Marsdenscale in a multicenter trial for dystonia. Mov. Disord. 22, 685–689.
Lovell, M.A., Ehmann, W.D., Butler, S.M., Markesbery, W.R., 1995. Elevated thiobarbituricacid-reactive substances and antioxidant enzyme activity in the brain in Alzheimer'sdisease. Neurology 45, 1594–1601.
Nagasaka, H., Inoue, I., Inui, A., Komatsu, H., Sogo, T., Murayama, K., Murakami, T., Yorifuji,T., Asayama, K., Katayama, S., Uemoto, S., Kobayashi, K., Takayanagi, M., Fujisawa, T.,Tsukahara, H., 2006. Relationship between oxidative stress and antioxidant systemsin the liver of patients with Wilson disease: hepatic manifestation in Wilson diseaseas a consequence of augmented oxidative stress. Pediatr. Res. 60, 472–477.
Ogihara, H., Ogihara, T., Miki, M., Yasuda, H., Mino, M., 1995. Plasma copper and antioxi-dant status in Wilson's disease. Pediatr. Res. 37, 219–226.
Roberts, E.A., Schilsky, M.L., American Association For Study Of Liver, D., 2008. Diagnosisand treatment of Wilson disease: an update. Hepatology 47, 2089–2111.
Rumack, C.M., Wilson, S.R., Charboneau, J.W., Levine, D., 2011. Diagnostic ultra-sound(January 5) Mosby — Year Book, 1.
Scheiber, I.F., Dringen, R., 2012. Astrocyte functions in the copper homeostasis of thebrain. Neurochem. Int. 62, 556–565.
Schlief, M.L., Gitlin, J.D., 2006. Copper homeostasis in the CNS: a novel link between theNMDA receptor and copper homeostasis in the hippocampus. Mol. Neurobiol. 33,81–90.
Schosinsky, K.H., Lehmann, H.P., Beeler, M.F., 1974. Measurement of ceruloplasmin fromits oxidase activity in serum by use of o-dianisidine dihydrochloride. Clin. Chem.20, 1556–1563.
Schulz, J.B., Lindenau, J., Seyfried, J., Dichgans, J., 2000. Glutathione, oxidative stress andneurodegeneration. Eur. J. Biochem. 267, 4904–4911.
Teles, M., Mackenzie, S., Boltana, S., Callol, A., Tort, L., 2010. Gene expression and TNF-alpha secretion profile in rainbow trout macrophages following exposures to copperand bacterial lipopolysaccharide. Fish Shellfish Immunol. 30, 340–346.
Thomas, G.R., Forbes, J.R., Roberts, E.A., Walshe, J.M., Cox, D.W., 1995. The Wilson diseasegene: spectrum of mutations and their consequences. Nat. Genet. 9, 210–217.
Tietze, F., 1969. Enzymic method for quantitative determination of nanogram amounts oftotal and oxidized glutathione: applications to mammalian blood and other tissues.Anal. Biochem. 27, 502–522.
es and glutamate inWilson disease and their asymptomatic siblings, J.

8 J. Kalita et al. / Journal of Neuroimmunology xxx (2014) xxx–xxx
Turnlund, J.R., Jacob, R.A., Keen, C.L., Strain, J.J., Kelley, D.S., Domek, J.M., Keyes, W.R.,Ensunsa, J.L., Lykkesfeldt, J., Coulter, J., 2004. Long-term high copper intake: effectson indexes of copper status, antioxidant status, and immune function in youngmen. Am. J. Clin. Nutr. 79, 1037–1044.
Vrabelova, S., Letocha, O., Borsky, M., Kozak, L., 2005. Mutation analysis of the ATP7B geneand genotype/phenotype correlation in 227 patients withWilson disease. Mol. Genet.Metab. 86, 277–285.
Please cite this article as: Kalita, J., et al., A study of oxidative stress, cytokinNeuroimmunol. (2014), http://dx.doi.org/10.1016/j.jneuroim.2014.06.013
Walshe, J.M., Yealland, M., 1992. Wilson's disease: the problem of delayed diagnosis. J.Neurol. Neurosurg. Psychiatry 55, 692–696.
Zou, J.Y., Crews, F.T., 2005. TNF alpha potentiates glutamate neurotoxicity by inhibitingglutamate uptake in organotypic brain slice cultures: neuroprotection by NF kappaB inhibition. Brain Res. 1034, 11–24.
es and glutamate inWilson disease and their asymptomatic siblings, J.
Copyright © 2022 FDOKUMEN