A study by the Centre for Economic Policy and Public Finance
197
-
Upload
khangminh22 -
Category
Documents
-
view
2 -
download
0
Transcript of A study by the Centre for Economic Policy and Public Finance

i

ii
A study by the Centre for Economic Policy and Public Finance (CEPPF), ADRI and International Studies Program, Andrew Young School of Policy Studies, Georgia State University, USA ____________________________________________________ ©Copyright Asian Development Research Institute (ADRI) Publisher Asian Development Research Institute (ADRI) BSIDC Colony, Off Boring-Patliputra Road Patna – 800 013 (BIHAR) Phone : 0612-2265649 Fax : 0612-2267102 E-mail : [email protected] Website : www.adriindia.org Printer The Offsetters (India) Private Limited Chhajjubagh, Patna-800001 Study Sponsored by World Bank Disclaimer This monograph may not reflect the views held by the Centre for Economic Policy and Public Finance (CEPPF), ADRI or the Andrew Young School of Policy Studies, Georgia State University. Usual disclaimers apply.

i
Contributors to this Report
Authors Prabhat P. Ghosh Shaibal Gupta Mark Rider Overall supervision of field work Sudip K. Pandey Field supervisors Shashi Ranjan Kumar
Bijendra Prasad Shivnath P. Yadav Data processing Rahbar Ali Pankaj Kumar
Bakshi Amit Kumar Sinha Data entry Vijay Kumar Bimal We would like to thank the Department of Panchayati Raj of the State of Bihar and the functionaries at the field level for their support and cooperation. We also would like to thank Dr. Yongmei Zhou and members of the World Bank staff in New Delhi for helpful comments on previous versions of this report. The usual disclaimers apply.

ii
TABLE OF CONTENTS
List of Abbreviations...................................................................................................vii
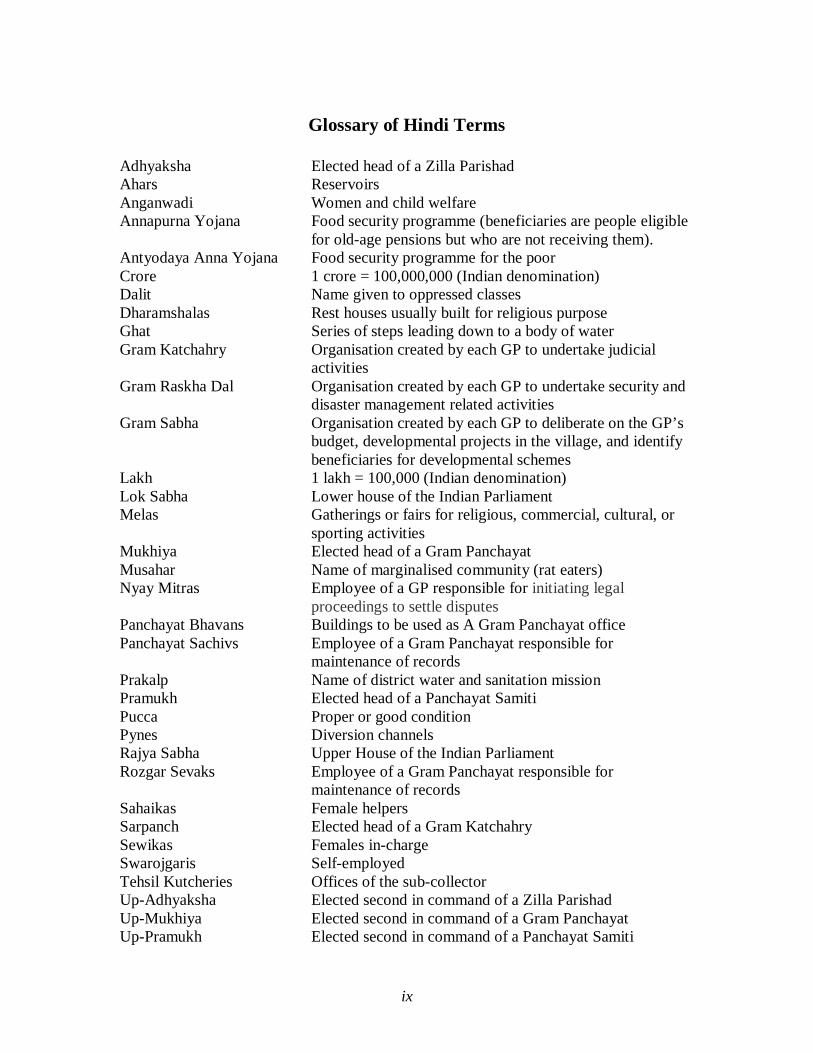
Glossary of Hindi Terms .............................................................................................. ix
Chapter I: Introduction ................................................................................................8 Purpose of the study ....................................................................................................8 Methodology ...............................................................................................................8 Sample design .............................................................................................................9 Overview of the survey instruments...........................................................................11 Topics and methodology............................................................................................12 Summary...................................................................................................................15
Chapter II: Background..............................................................................................17 Recent elections of Panchayati Raj Institutions ..........................................................17 Local government structure .......................................................................................19 Gram Panchayat ........................................................................................................20 Panchayat Samiti .......................................................................................................21 Zilla Parishad ............................................................................................................22 Demographic profile of elected officials ....................................................................23 Summary...................................................................................................................25
Chapter III: Analysis of Expenditure Assignments ...................................................27 The principles of expenditure assignments.................................................................27 Formal determination of expenditure priorities ..........................................................33 Clarity and appropriateness of assignments................................................................35
Assignment of production and commercial activities .............................................36 Assignment of financing arrangements ..................................................................36 Assignment of functionaries...................................................................................37 Assignment of responsibility without meaningful authority....................................38 Economies of scale ................................................................................................38 Spillover benefits and costs....................................................................................39 Concurrent assignments .........................................................................................39 Lack of clarity in assignments................................................................................39
Decision making arrangements ..................................................................................40 Activities of the GPs..................................................................................................42 Summary...................................................................................................................45
Chapter IV: Human and Physical Resources.............................................................47 Proximity of the GP headquarters to important centres ..............................................47 Availability, condition, and use of Panchayat Bhavan................................................48 Human resources .......................................................................................................49 Responsibilities of the Mukhiya and GP employees...................................................51 Training of elected officials and GP employees .........................................................53 Does the attributes of the Mukhiya influence the number of activities taken-up?........54 Capacity of the SFC, DoF, and PRI Department to collect and analyse PRI finance data..................................................................................................................................56

iii
Summary...................................................................................................................56 Chapter V: Analysis of Expenditures .........................................................................58
Gram Panchayat Expenditure Priorities......................................................................58 Summary...................................................................................................................61
Chapter VI: Analysis of Revenues ..............................................................................63 Devolution of funds to PRIs ......................................................................................63 Twelfth Finance Commission ....................................................................................63 National Rural Employment Guarantee Act ...............................................................64 Backward Regions Grant Fund ..................................................................................64 Amounts of GP revenues by source ...........................................................................65 Mukhiya’s evaluation of the adequacy of transfers and favourability of major tax heads..................................................................................................................................67 Panchayat Samiti finances .........................................................................................68 Zilla Parishad finances...............................................................................................69 Summary...................................................................................................................71
Chapter VII: Description and Performance of the Accountability System ..............72 A brief description of the accountability system.........................................................72 Performance of the accountability system..................................................................72 Adequacy of current system of accountability............................................................78 Summary...................................................................................................................79
Chapter VIII: Analysis of the Fiscal System and Recommendations........................81 Fiscal autonomy ........................................................................................................81 Vertical fiscal imbalances ..........................................................................................84 Horizontal fiscal imbalances......................................................................................85 Fiscal discipline.........................................................................................................85 Comparison with the State of West Bengal ................................................................86 Summary...................................................................................................................92 Recommendations to the Government of Bihar..........................................................94 Autonomy of GPs......................................................................................................94 Infrastructure.............................................................................................................94 Manpower .................................................................................................................95 Financial....................................................................................................................95 Other Suggestions......................................................................................................95 Summary...................................................................................................................99
References.................................................................................................................. 101
TABLES Table 1.01 Districts ranked according to the index of social capital ............................. 102 Table 1.02 Sample of Panchayati Raj Institutions, by tier of government..................... 103 Table 1.03 Number of villages and current population, in the sample of 50 Gram Panchayats .................................................................................................................. 104 Table 2.01 Distribution of Ward members and Mukhiyas, by reserved seat (per cent)..105

iv
Table 2.02 Distribution of Ward members (Mukhiyas), by caste and religion (per cent)....................................................................................................................................105 Table 2.03 Distribution of Ward members and Mukhiyas, by gender (per cent) ........... 106 Table 2.04 Average age of Ward members and Mukhiyas, by district (per cent) .......... 106 Table 2.05 Distribution of Ward members (Mukhiyas), by education (per cent)........... 107 Table 2.06 Distribution of Ward members (Mukhiyas), by occupation (per cent)......... 108 Table 2.07 Distribution of Ward members and Mukhiyas, by number of terms (per cent)....................................................................................................................................109 Table 3.01 Distribution of functions in federal countries, an international perspective .110 Table 3.02 Responsibilities of Panchayats ...................................................................111 Table 3.03 Frequency of meetings of Gram Sabha and Gram Panchayat ...................... 112 Table 3.04 Number of agenda items of Gram Panchayat meetings, reported by Mukhiyas (Panchayat Sachivs) in 2008-09................................................................................... 113 Table 3.05 Average number of projects per village type, by district ............................. 114 Table 3.06 Average expenditures per village type (Rs. 1,000’s) ...................................114 Table 3.07 Per cent of GPs performing various assigned production functions............. 115 Table 3.08 Per cent of GPs performing various assigned infrastructure functions......... 116 Table 3.09 Per cent of GPs performing various assigned development functions ......... 117 Table 3.10 Per cent of GPs performing assigned maintenance functions ...................... 118 Table 4.01 Average distance in kilometres of GP headquarters from important centres 119 Table 4.02 Per cent of GPs by distance of GP headquarters to block office and commercial bank ......................................................................................................... 119 Table 4.03 Per cent of GPs with a Panchayat Bhavan and its use .................................120 Table 4.04 Per cent of GPs with a Panchayat Bhavan and the source of construction funds....................................................................................................................................121 Table 4.05 Information on the conditions of Panchayat Bhavans functioning as an office....................................................................................................................................122 Table 4.06 Information on availability of furniture and fixtures in GP offices.............. 123 Table 4.07 Summary of employees, responsibilities, and terms of employment ........... 124 Table 4.08 Average number of Gram Panchayat employees and per cent female ......... 125 Table 4.09 Profile of Gram Panchayat employees........................................................ 126 Table 4.10 Distribution of Panchayat Sachivs and Rozgar Sevaks, by education (per cent)....................................................................................................................................127 Table 4.11 Distribution of non-NREGA project related responsibilities, by district...... 128 Table 4.12 Distribution of non-NREGA related responsibilities, by district ................. 129 Table 4.13 Distribution of NREGA-related responsibilities of GPs, by district (per cent)....................................................................................................................................130 Table 4.14 Distribution of NREGA-related responsibilities of GPs, by district (per cent)....................................................................................................................................131 Table 4.15 Distribution of administrative and quasi-judicial responsibilities, by district (per cent)..................................................................................................................... 132 Table 4.16 Mukhiya’s training..................................................................................... 133 Table 4.17 Training of Ward Members, Sarpanchs, and Panchs ...................................134 Table 4.18 Training of Panchayat Sachivs ...................................................................135 Table 4.19 Training of Rozgar Sevaks ......................................................................... 136 Table 4.20 Training of technical assistants...................................................................137

v
Table 4.21 Training of Nyay Mitras............................................................................. 138 Table 4.22 Average number of activities undertaken by GPs, by Mukhiya’s education.139 Table 4.23 Average number of activities undertaken by GPs, by Mukhiya’s number of terms ........................................................................................................................... 140 Table 4.24 Average number of activities undertaken by GPs, by distance to block office....................................................................................................................................141 Table 4.25 Average number of activities undertaken by GPs, by availability of Bhavan....................................................................................................................................142 Table 5.01 Average number of programmes and expenditures per GP and per capita...143 Table 5.02 Average and per capita outlays for 6 important schemes, by district ........... 144 Table 5.03 Average number of people recommended and benefitted per GP, by scheme....................................................................................................................................145 Table 5.04 Average number of people recommended and benefitted per GP, by scheme....................................................................................................................................146 Table 5.05 Average expenditure levels of GPs, by district ........................................... 147 Table 5.06 Average FC 12 programme expenditure per GP, by district (Rs. 1,000’s) ...148 Table 5.07 Average NREGA programme expenditure per GP, by district (Rs. 1,000’s)149 Table 5.08 Average BRGF programme expenditure under BRGF, by districts (Rs. 1,000’s) ....................................................................................................................... 150 Table 5.09 Difficulties faced in implementation of projects ......................................... 151 Table 5.10 Administrative expenditures, by ZPs (Rs. 1,000’s) ..................................... 152 Table 6.01 Total (per cent) allocation received by source, by Gram Panchayat ............ 153 Table 6.02 Twelfth Finance Commission funds received by GPs.................................154 Table 6.03 Allocation of Twelfth Finance Commission funds, by district .................... 155 Table 6.04 National Rural Employment Guarantee Act funds received by GPs, by district....................................................................................................................................156 Table 6.05 Allocations of the National Rural Employment Guarantee Act, by district..157 Table 6.06 Backward Region Grant Funds received by GPs ........................................ 158 Table 6.07 Allocations under Backward Region Grant Fund, by district ...................... 159 Table 6.08 Mukhiya’s opinion of the adequacy of transfers by source ......................... 160 Table 6.09 Favoured heads of taxation, number favouring (per cent favouring in parentheses) ................................................................................................................ 161 Table 6.10 Timeliness of the 12-FC distributions to GPs, by district and year .............. 162 Table 6.11 Timeliness of NREGA distributions to GPs, by district and year ................ 163 Table 6.12 Timeliness of BRGF distributions to GPs, by district and year ................... 164 Table 6.13 Number of and expenditures on development programmes, by Panchayat Samitis ........................................................................................................................ 165 Table 6.14 Timeliness of the 12-FC distributions to PSs, by district and year ............... 166 Table 6.15 Timeliness of the NREGA distributions to PSs, by quarter and year........... 167 Table 6.16 Timeliness of the BRGF distributions to PSs, by quarter and year .............. 168 Table 6.17 Number and expenditure on programmes by Zilla Parishad, district and year....................................................................................................................................169 Table 6.18 Timeliness of 12-FC distributions to ZPs, by quarter and year.................... 170 Table 6.19 Timeliness of NREGA distributions to ZPs, by quarter and year ................ 171 Table 6.20 Timeliness of BRGF disbursements to ZPs, by quarter and year................. 172 Table 6.21 Revenue Collection by ZPs ........................................................................ 173

vi
Table 7.01 Per cent of GPs preparing annual budgets and annual reports (per cent) .....174 Table 7.02 Per cent of GPs sending annual budgets and reports to concerned offices ...175 Table 7.03 GPs preparing annual accounts and audit reports (per cent) ........................ 176 Table 7.04 GPs sending annual accounts and audit reports to concerned offices (per cent)....................................................................................................................................177 Table 8.01 Total allocations to the PRIs, from FC-12 and BRGF and year................... 178
FIGURES
Figure 1.01 Maps of the State of Bihar and the 5 Sample Districts............................... 179 Figure 2.01 Local Government Structure in the State of Bihar ..................................... 182 Figure 2.02 Organisational structure of PRIs ............................................................... 183 Figure 6.01 Composition of total allocations received by Gram Panchayats 2006-07........................................................................................... 184 Figure 6.02 Composition of total allocations received by Gram Panchayats 2007-08.......................................................................................... 184 Figure 6.03 Composition of Total Allocation Received by Gram Panchayats 2008-09 185

vii
List of Abbreviations
AC Abstract Contingent ADRI Asia Development Research Institute AE Assistant Engineer AES Assured Employment Scheme ANM Auxiliary Nurse-cum-Midwife APHC Additional Primary Health Centre AWC Anganwadi Centre BDO Block Development Officer BMO Block Marketing Officer BPL Below Poverty Line BPRO Bihar Panchayati Raj Ordinance BREDA Bihar Renewable Energy Development Agency BRGF Backward Region Grant Fund BSEB Bihar State Electricity Board BWO Block Welfare Officer CAG Comptroller and Auditor General CDPO Child Development Project Officer CEO Chief Executive Officer CMO Chief Medical Officer CP Chair Person CRF Calamity Relief Fund CSS/CSP Centrally sponsored schemes/programmes CV Coefficient of variation DDC District Development Commissioner DDO District Disbursement Officer DIC District Industries Centre DM District magistrate DOPR Department of Panchayat Raj DRDA District Rural Development Authority DSE District Superintendent of Education ELA Examiner of Local Accounts EO Executive Officer FC12 Twelfth Finance Commission FY Fiscal Year GoB Government of Bihar GP Gram Panchayats IAY Indira Awas Yojana (Rural housing scheme) ICDP Integrated Child Development Project ICDS Integrated child development services JGSY Jawahar Gram Samridhi Yojana KVIC Khadi Village Industries Board KVY Kanya Vivah Yojana (Young women wedding (expenses) scheme) LBC Lower Backward Caste LPY Laxmibai Pension Yojana

viii
MLA Member of legislative assembly MSP Minimum support price MUS Muslim NGO Non-governmental organisaion NIC National Informatics Centre NREGA National Rural Employment Guarantee Act OAP Old Age Pension Scheme OBC Other Backward caste ORS Oral rehydration solution OTH Other PDS Public distribution system PHC Primary Health Center PHED Public Health Engineering Department PIRA Panchayati Raj Institutions Accounting Software PMRY Prime Minister Rojgar Yojana (Employment Scheme) POH Pension of Handicapped Scheme PRI Panchayati Raj Institutions PS Panchayat Samiti Rs. Rupees SC Scheduled caste SDEO Sub Divisional Educational Officer SDO Sub-divisional officer SFC State Finance Commission SGSY Swaranjayanti Gram Swarojgar Yojana SHG Self Help Group SSP Social Security Pension TA Technical assistant ToR Terms of reference TSC Total sanitation campaign UBC Upper Backward Caste UC Upper Caste VEC Village Education Committees VLW Village Level Worker WB World Bank ZP Zilla Parishad
ix
Glossary of Hindi Terms
Adhyaksha Elected head of a Zilla Parishad Ahars Reservoirs Anganwadi Women and child welfare Annapurna Yojana Food security programme (beneficiaries are people eligible
for old-age pensions but who are not receiving them). Antyodaya Anna Yojana Food security programme for the poor Crore 1 crore = 100,000,000 (Indian denomination) Dalit Name given to oppressed classes Dharamshalas Rest houses usually built for religious purpose Ghat Series of steps leading down to a body of water Gram Katchahry Organisation created by each GP to undertake judicial
activities Gram Raskha Dal Organisation created by each GP to undertake security and
disaster management related activities Gram Sabha Organisation created by each GP to deliberate on the GP’s
budget, developmental projects in the village, and identify beneficiaries for developmental schemes
Lakh 1 lakh = 100,000 (Indian denomination) Lok Sabha Lower house of the Indian Parliament Melas Gatherings or fairs for religious, commercial, cultural, or
sporting activities Mukhiya Elected head of a Gram Panchayat Musahar Name of marginalised community (rat eaters) Nyay Mitras Employee of a GP responsible for initiating legal
proceedings to settle disputes Panchayat Bhavans Buildings to be used as A Gram Panchayat office Panchayat Sachivs Employee of a Gram Panchayat responsible for
maintenance of records Prakalp Name of district water and sanitation mission Pramukh Elected head of a Panchayat Samiti Pucca Proper or good condition Pynes Diversion channels Rajya Sabha Upper House of the Indian Parliament Rozgar Sevaks Employee of a Gram Panchayat responsible for
maintenance of records Sahaikas Female helpers Sarpanch Elected head of a Gram Katchahry Sewikas Females in-charge Swarojgaris Self-employed Tehsil Kutcheries Offices of the sub-collector Up-Adhyaksha Elected second in command of a Zilla Parishad Up-Mukhiya Elected second in command of a Gram Panchayat Up-Pramukh Elected second in command of a Panchayat Samiti

x
Up-Sarpanch Elected second in command of a Gram Katchahry Zamindari System of land ownership (Zamindar is the term used for
land owners)

1
Executive Summary
The main objective of the Report on the Bihar Panchayati Raj Institution Finance Study is to
investigate the best ways to increase the autonomy, capacity, and accountability of local self
governments in the State of Bihar. This report is based on data collected from a set of 3 surveys
conducted on a sample of 5 Zilla Parishads, 10 Panchayat Samitis, and 50 Gram Panchayats,
during the period beginning on the 15th of March 2009 and ending on the 31st of July 2009. The 5
Zilla Parishads were purposely chosen, one each from five distinct socio-economic categories.
The five categories are based on values of a social capital index which is the simple arithmetic
sum of the values of the rural literacy rate, the gender disparity in literacy rate, the number of
self-help groups per 1 lakh of population, and the number of primary agricultural credit societies
and fisheries cooperative societies per 1 lakh of population. We also chose the sample of 5 Zilla
Parishads to obtain representation from different regions of the state. The chosen Zilla Parishads
are Begusarai, Bhojpur, Nalanda, Saharsa, and Sitamarhi, and two of the chosen districts –
Nalanda and Saharsa – are targeted for intervention by the WB. One relatively well off and one
less well off Panchayat Samiti were chosen from each Zilla Parishad, and five Gram Panchayats
were randomly chosen from each Panchayat Samiti. Each of the 3 questionnaires (one each for
the Zilla Parishads, Panchayat Samitis, and Gram Panchayats) consists of seven sections,
covering the demographic profiles of elected officials, physical infrastructure, human resources,
decision-making by Panchayats, flow of funds, implementation of projects, and suggestions for
improvement. Chapter 1 describes the sampling methodology, questionnaires, and the scope of
work for this study in greater detail.
Chapter 2 provides an overview of recent elections in the State of Bihar; explains the structure of
local governments; and describes the demographic profile of elected officials. Overall, the
implementation of the Mungeri Lall Commission Report brought significant changes in the
political and social discourse in the State of Bihar. For the first time, members of the lower
backward castes, which comprise approximately one-third of the total population, were brought
onto the centre stage of politics in Bihar. The subsequent elections of 1995 and 2000 further
strengthened the social justice mechanism, while the 2001 and 2006 PRI elections will go down

2
as turning points for the electoral empowerment of the lower backward castes. These elections
gave a much greater role to the marginalised sections of the population in local government.
Turning to the structure of local self government, it consists of three tiers in the State of Bihar,
namely Zilla Parishads, Panchayat Samitis, and Gram Panchayats. A Zilla Parishad is established
for each district of the state and Adhyaksha and Up-Adhyaksha are elected on the basis of caste
and gender. A Panchayat Samiti elects members from territorial constituencies, namely the Lok
Sabha and state legislative assemblies. Reserved seats on the basis of caste and gender exist
within this setup. The government permits the Panchayat Samitis to borrow from governments,
banks, and other financial institutions. Every Gram Panchayat has an elected leader - the
Mukhiya - and directly elected Ward members from the villages making up the Gram Panchayat.
Fifty percent of the Mukhiya seats are reserved for the marginalised sections of the society.
Though the aforementioned election processes increased political representation of the backward
castes, the reins of power generally remain with the upper castes.
Chapter 3 begins with an overview of the economic criteria commonly used to evaluate
expenditure assignments in a multi-tiered government system like that in the State of Bihar. On
the basis of these economic principles, the chapter then evaluates the clarity and appropriateness
of functional assignments to the Panchayats. Finally, this chapter describes the decision making
arrangements across different Gram Panchayats and various activities undertaken by the Gram
Panchayats, based on data collected from the surveys.
The fundamental economic principle that should guide the appropriate assignment of functional
responsibilities in a market economy is the concept of market failure. Those activities which the
market does well should be left to the private. However, those allocative functions which the
market should not be expected to perform well, due for example to public goods, externalities,
and natural monopoly, then these functions should be assigned to the lowest level of government
consistent with heterogeneous tastes, economies of scale in production, and spill-over benefits.
In addition, expenditure assignments should be exclusive, insofar as practical, to promote
accountability and in case of concurrent assignments among two or more tiers of government, it
is crucial to identify and assign sub-functions in a clear and exclusive manner. For example,
education consists of many sub-functions, including administration, financing, curriculum

3
development, and instruction. In principle, the different sub-functions making up education could
be assigned to different levels of government. However, they should be assigned in a clear and to
the extent possible exclusive manner in order to promote accountability.
In the State of Bihar, the assignment of responsibilities to the Panchayatas is directed by the 7th
and 11th Schedules of the Constitution. Some commercial activities, such as agriculture, land
improvement, and small scale industries, which would ordinarily be assigned to the private
sector in a market economy, are assigned by the Constitution to the Panchayats. The State of
Bihar obviously is oblidged to comply with such assignments. Though if it were not so
constrained, it would be preferable to leave these functions in whole or in substantial part to the
private sector. In the case of concurrent functions, such as the provision of primary education
and electricity to name just two, among the Union, the states, and the PRIs, clear assignment of
responsibilities among the five tiers of government (Union, State, Zilla Parishad, Panchayat
Samit, and Gram Panchayat) is lacking. To the extent that there are concurrent assignments
among these five tiers of government, coordinating mechanisms need to be established.
Furthermore, it is crucial to provide the Panchayats with adequate financing and human
resources to carry-out the functions assigned in the activity mapping. Local self governments
should also be given greater responsibility for recurrent expenditures, such as supplies and
personnel in the education and health sectors. If economies of scale and spillover benefits and
costs are considered, assignment of research and development to Zilla Parishads and the control
of epidemics and infectious diseases to Gram Parishads seem inappropriate.
Chapter 4 describes the availability to the Gram Panchayats of human and physical resources,
such as the number of employees, the extent of their training and education, and availability,
condition, and use of the Panchayat Bhavans, which is the administrative headquarters of the
Gram Panchayats. These data were collected through the survey of 50 Gram Panchayats. This
chapter also analyses the adequacy of these resources in performing the various responsibilities
entrusted to the Gram Panchayats. Physical features such as proximity of the Gram Panchayat to
the block headquarters and use of the Panchayat Bhavan as an office do not seem to affect the
number of activities undertaken. While most Gram Panchayats in our sample have inadequate
furniture for their Bhavans, Gram Panchayats in Begusarai who are generally satisfied with their

4
furniture, undertake more activities on an average than the Gram Panchayats in the other sample
districts. So improving the quantity and quality of furniture may facilitate GPs in taking-up more
activities. In contrast, the socio-demographic attributes of the Mukhiyas in our sample do appear
to have a modest effect on the number and type of activities undertaken by Gram Panchayats. In
addition, there is evidence that Mukhiyas are circumventing the democratic procedures for
collective grassroots decision-making and directing resources to disproportionally benefit their
own villages. This may suggest that accountability mechanisms may need to be strengthened
and/or enforced. On average 8 Gram Panchayats share the services of a single technical assistant.
Since the technical assistant is responsible for project planning, budgeting, and supervising
project work in the majority of Gram Panchayats, the fact that many Gram Panchayats rely on
the same person may adversely affect the quality of this important work. Gram Panchayats may
be better served if they have the resources to hire their own personnel. Finally, the State Finance
Commission, the Department of Finance, and the Department of Panchayati Raj lack the capacity
to conduct analysis of local government finances.
Chapter 5 discusses the expenditure priorities of the Gram Panchayats, using the survey data.
Gram Panchayat expenditures are generally financed through the following six Centrally
Sponsored Schemes: Indira Awas Yojana (IAY), Kanya Vivah Yojana (KVY), Total Sanitation
Campaign (TSC), Old-Age Pension Scheme (OAP), Laxmibai Pension Yojana (LPY), and
Pension of Handicapped Scheme (POH). All expenditures by Grma Panchayats are based on
allocations principally though not exclusively from these 6 schemes. Between fiscal years 2006-
07 and 2008-09, the average expenditure per Gram Panchayat increased by 12.7 per cent per
year. However, this increase was not uniform across the Gram Panchayats; some in fact
experienced much higher growth than others. Overall, these expenditures and schemes appear to
be responding to three priorities: roads, primary education, and drinking water. When
interviewed, the Mukhiyas stated that there was extra attention given to the most impoverished
communities but that implementing these projects was difficult in all areas due to an
unavailability of land or encroachment upon available land by the rural elite. Furthermore, the
programs of the Gram Panchayats struggled due to a lack of social cohesion and the need for
frequent payment of bribes.

5
Chapter 6 analyses the revenue sources of the Gram Panchayats, Panchayat Samitis, and Zilla
Parishads, based on data collected from the survery of Panchayats. Significantly, none of the
sampled Gram Panchayats or Panchayat Samitis raise own revenues; two out of the five Zilla
Parishads raise some own revenues from the rent of land and buildings. Otherwise, all of the
revenues of the Panchayats come from inter-governmental transfers.
This chapter also describes the sources and timeliness of these transfers as well as the barriers
that Mukhiyas claim prevent them from raising own revenues. The biggest obstacle to raising
own revenues, according to the Mukhiyas in our sample, is that the Government of Bihar has not
enacted the enabling legislation and regulations regarding permitted tax rates. In addition to the 6
schemes described above, the Gram Panchayats rely on transfers from the Twelfth Finance
Commission (FC-12), the National Rural Employment Guarantee Act (NREGA), and the
Backward Regions Grant Fund (BRGF) for revenue. This chapter and the associated tables
describe each of these three revenue sources in detail. Each is funded by the central government,
and there is some concern that NREGA and BRGF funds are subject to manipulation. When
surveyed about ways for Gram Panchayats to raise revenues, Mukhiyas favored a variety of taxes
on the most affluent members of their communities.
Chapter 7 provides a brief description of the accountability system, discusses its performance
and adequacy, and provides some recommendations for improvement it. Briefly, reports
generated by the Auditor General reveal a widespread breakdown of the de jure accountability
system. According to the Auditor General’s findings, Zilla Parishad, Panchayat Samitis, and
Gram Panchayats are unable to prepare accurate budgets, to adhere to agreed upon estimates, to
complete projects on time, and are unsuccessful at completing the audit forms required to correct
these issues. Cash books reveal unapproved advances and the general lack of the use of
prescribed budget controls. Other problems noted are incorrect information on employment
generated, misreporting by Zilla Parishads on completed work, doubtful muster rolls, excess
payments for labourers, wastage of expenditures due to abandonment of works, and non-
confirmation of wages-to-material ratios prescribed in the Swaranjayanti Gram Swarojgar
Yojana guidelines. The reports conclude that there is a clear possibility of misappropriation of
funds in some instances. The findings do vary in some ways across Gram Panchayats. To

6
summarise, 80 per cent of Gram Panchayats prepare budgets and reports, but reports are more
likely to be prepared than budgets. 90 per cent send their budgets and reports to the Block
Development Office but are less likely to send them to the Panchayat Samitis and Zilla
Parishads. These findings may suggest that simplified accounting systems and mandatory
training could help address these problems.
Chapter 8 concludes the report. It begins with an evaluation the fiscal system, using the
conventional economic criteria of fiscal autonomy, vertical imbalances, horizontal imbalances,
and fiscal discipline. Chapter 8 also provides a number of recommendations for improving the
system of local self government in the State of Bihar.
In contrast to local governments in the Republic of Tanzania and the State of West Bengal, local
self governments in the State of Bihar are completely dependent on inter-governmental transfers.
The federal architecture in the Constitution creates substantial vertical fiscal imbalances between
the states and the Union government. The transfer dependency of the states is therefore passed on
to Panchayati Raj Institutions in the State of Bihar. There also are clear horizontal fiscal
disparities among the Gram Panchayats in the State of Bihar, and rather than correcting these
imbalances, the transfer system appears to be exacerbate them. Regarding fiscal discipline, there
is no evidence that the Gram Panchayats are borrowing money. However, the Mukhiyas appear
to be by-passing the provisions for grassroots decision-making and directing resources to
disproportionately benefit their own villages. In the broader sense of fiscal discipline, this
behaviour by the Mukhiyas implies that there does not appear to be adequate fiscal discipline
which is confirmed comparing Bihar with West Bengal.
We recommend that the Government of Bihar adopt a gradualist approach to decentralisation
policy and develop a realistic multi-year blueprint for decentralization policy. Decentralisation
policy should establish priorities, such as education, health, drinking water, and economic
development. The Government of Bihar should give high priority to establishing a PRI fiscal
analysis unit to provide technical support to the State Finance Commission, Department of
Finance, and Department of Panchayat Raj. In addition, the accounting and reporting
requirements need to be streamlined and simplified. The government should make strategic use

7
of its decentralization policy to promote commercial activity in the rural areas of the state.
Finally, the Government of Bihar should undertake proper empirical evaluations of the
effectiveness of the education and health sectors.

8
Chapter I: Introduction
Purpose of the study
1.01 The GoB is committed to strengthening local self government. As part of this process, the
WB is preparing the Bihar Panchayat Strengthening Project. The development objectives of the
project are to increase the autonomy, capacity, and accountability of PRIs. Specifically, the
objectives encompass: 1) improving PRI governance capacity to implement government anti-
poverty schemes and undertake discretionary development initiatives that are responsive to
community needs in select districts and 2) improving the enabling environment, both policy and
administrative, for PRIs.
1.02 As part of project preparations, the WB commissioned this study of Bihar PRI finances.
Briefly, this study aims to understand how PRIs in the State of Bihar are currently financed and
staffed; whether there is sufficient human and fiscal resource capacity for PRIs to carry out their
legal responsibilities; whether there is sufficient autonomy in human and fiscal resource
management for PRIs to influence development outcomes in their localities; the expenditure
priorities of PRIs; the manner in which these priorities are determined de jure and de facto; and
the accountability framework for PRIs. This study also examines the current revenue
assignments to PRIs.
1.03 This study is intended to inform the GoB, the SFC, and the WB on the fiscal condition of
the PRIs. It is expected to stimulate dialogue among stakeholders on how to adjust the inter-
governmental fiscal framework to improve fiscal autonomy and development effectiveness of the
PRIs in Bihar.
Methodology
1.04 This report is based on data collected from primary and secondary field work in the State
of Bihar, during the period October 15, 2008 through July 31, 2009. The primary field work

9
involved collecting data from surveys of a sample of 5 ZPs, 10 PSs, and 50 GPs, for a total of 65
Panchayat units. A detailed description of the sample and the sampling methodology are
provided below.
Sample design
1.05 We would like the sample to reflect the distribution of the quality of governance among
the Panchayats of the State of Bihar. We know from previous research that literacy rates,
particularly female literacy, is highly correlated with the quality of governance, and the
formation of societies or the lack thereof also reflect the quality of local governance. ADRI has
conducted a few studies where districts were grouped into socio-economic categories with
respect to an indicator variable. In one such study, the 38 districts of the state were classified
using four indicator variables, namely a poverty index, a social vulnerability index, a livelihood
potential index, and a social capital index. With respect to each of these criteria, the districts can
be categorised into five groups: much below average, below average, average, above average,
and much above average. Any of these four indicators would be suitable for a study on PRI
finances. In our opinion, the social capital index is best suited to the objectives of this study. A
PRI unit’s level of social capital endowment is indicative of its ability to undertake collective
effort for development which is one of the major goals of the Panchayati Raj system.
1.06 The social capital index is constructed from the following 4 socio-economic indicators:
the rural literacy rate, the gender disparity in literacy rate, the number of self-help groups per 1
lakh of population, and the number of primary agricultural credit societies and fisheries
cooperative societies per 1 lakh of population. The social capital index is the simple arithmetic
sum of the values of these 4 indices. Thus by using the social capital index as the stratifying
variable, we hope to achieve a representative sample of Panchayats in terms of the quality of
governance. We also purposefully chose Panchayats to achieve geographical representation from
each of the 4 regions of Bihar (e.g., northeast, northwest, southeast, and southwest). The
grouping of the 38 districts in the State of Bihar according to these 5 categories of social capital
is provided in table 1.01.

10
1.07 For the choice of ZPs, we purposefully chose 5 districts, one each from 5 distinct socio-
economic categories (social capital well above average, above average, and so on), with an eye
to achieving geographic representation in the sample. The chosen districts are Begusarai,
Bhojpur, Nalanda, Saharsa, and Sitamarhi which appear in bold letters in table 1.01. Regarding
the geographical distribution of the districts, it should be noted that Bhojpur and Nalanda are
from the south-western part of the state which is the most prosperous region. Saharsa, on the
other hand, is from the north-eastern part, which is the most disadvantaged region of the state.
The remaining two districts – Begusarai and Sitamarhi – are from the south-eastern and north-
western parts of the state, respectively. The level of prosperity of the latter two regions is around
the average for the entire state. Figure 1.01 is a map of the State of Bihar showing the geographic
distribution of the sample districts. Finally, it should be noted that two of the chosen districts are
targeted for intervention by the WB, namely Nalanda and Saharsa.
1.08 The sample of PSs was purposefully chosen to provide a relatively low-income PS and a
relatively prosperous one from each ZP in the sample. The sample of 5 GPs from each of the 10
PSs in the sample is randomly chosen. Figure 1.01 also provides maps of each of the individual
sample districts. The district maps identify the location of the sample PSs and their proximity to
major roads. The district maps are intended to give the reader a sense of the representativeness of
the sample PSs.
1.09 The final sample for the study of 65 Panchayats is provided in table 1.02. Since the
sample GPs are randomly drawn from a high income PS and a low income one, our sample of 50
GPs may overstate the fiscal and human resource disparities among the GPs. According to the
State Finance Commission Report, 2004, there are 38 ZPs, 533 PSs, and 8,469 GPs in the State
of Bihar. In other words, we are sampling about 13.2 per cent, 1.9 per cent, and 0.6 per cent of
the total number of ZPs, PSs, and GPs, respectively, in the State of Bihar. The sample sizes for
the PSs and GPs are rather small for drawing valid inferences about the population
characteristics. However, this is the maximum number that could be surveyed with the budget
available for this study. Neverthess, it is important to keep these caveats in mind when
interpreting the findings of this report.

11
1.10 Although article 11 of the BPRO states that “... any local area comprising a village or a
group of continguous villages or part thereof to be a Gram Panchayat area with a population
within its territory as nearly as seven thousand”. Table 1.03 shows the number of villages and the
population of each of the 50 GPs in our sample, according to the 2001 census. The average
population of the GPs in our sample is approximately 12,000, which is substantially larger than
7,000.
Overview of the survey instruments
1.11 Briefly, the ZP, PS, and GP questionnaires follow a common format. Section I of each
questionnaire is a set of questions concerning the identity of the PRI unit. Section II is a set of
questions directed at ascertaining the demographic profile of the elected officials in each unit of
the sample. Section III is a set of questions concerning the physical infrastructure of the PRI
units in the sample. Section IV is a set of questions concerning the human resource capacity of
the Panchayats. Section V explores the functioning of the Panchayats, and section VI examines
the flow of funds to the Panchayats. Section VII consists of detailed questions regarding the
implementation of projects by the PRI units. Section VIII involves suggestions for
improvements, and section IX involves general remarks.
1.12 The primary interlocutor for each questionnaire is the highest elected official of each PRI
level (i.e., Mukhiya in the case of a GP and so on for the PSs and ZPs in the sample) or
whomever he (she) designates. In many cases, we attempted to corroborate the responses of the
interlocutors by examining the financial records of the Panchayat. Where appropriate, we also
sought out the opinions of others, such as Ward members and other residents of the Panchayat.
However, the primary data on which this report is based have not been audited. Therefore, we
cannot certify the reliability of these data.
1.13 The secondary field work involved the collection of information from the individual
departments of the GoB on the assignment of functions, assignment of taxes, and transfers by
these departments and registered societies in the case of centrally sponsored

12
schemes/programmes (CSS/CSP). We also examined the capacity of the DoF, DoPR, and SFC to
analyse PRI finances.
1.14 The study’s main deliverable is a report on the status and evolution of PRI finances for the
past three years in the State of Bihar and to provide suggestions for improving the inter-
governmental fiscal framework. The topics listed below are addressed in this report. These topics
are drawn from the ToR of the Report on the Bihar Panchayati Raj Institutions Finance Study.
We also briefly describe below the methodology that was used to address each of these topics.
Topics and methodology
1.15 This report provides an analysis of the functions assigned to the PRIs. Our analysis is
based on a careful review of the legal documents which set forth the functions assigned to the
ZPs, PSs, and GPs, including the Constitution of India, the BPRO, 2006, and subsequent
amendments to the same, and the activity mapping provided to us by the DoPR. We understand
that the Panchanyat Raj Institutions Act, 1993 and the BPRO, 2006 have been replaced by the
Panchanyat Raj Institutions Act, 2006. However, we were unable to obtain a copy of the
Panchayati Raj Institutions Act, 2006. Therefore, we relied upon the BPRO, 2006 in conducting
this analysis. As a result, there may be discrepancies between the current law as described in the
Panchanyat Raj Institutions Act, 2006, and the details provided in this report. Based on our
review of the BPRO, 2006 and other primary documents, we evaluated the clarity of functions
assigned to the PRIs by law and administrative rules in light of the normative theory of fiscal
decentralisation and international best practise.
1.16 Based on the primary field work described above, we construct to the greatest extent
possible a complete picture of the financial resources available to the GPs in our sample. We also
document the utilisation of funds by the GPs.1
1 Financial resources include the different revenue streams available to PRIs: Plan grants under the GoB and GoI Plan, discretionary grants, incentive grants, own tax and non-tax revenue, and shared revenue with GoB. The study also tracks the flow of funds from the GoB to the PRIs and examines the timeliness, completeness, and adequacy from the point of view of planning, budgeting, preparation and execution of annual plans.

13
1.17 Based on the primary field work, we examine the human resources available to the GPs.
According to the Report of the Examiner of Local Accounts (2008), the state functionaries
responsible for the functions devolved to the Panchayats have not been transferred to the ZPs and
PSs. As part of the primary field work, we examine whether elected officials feel that the state
functionaries report to them in their areas of competence, and whether these functionaries attend
the meetings of the Panchayats, as prescibed by the BPRO, 2006. Regarding the adequacy of
human resources available to the Panchayats, Section IV of the ZP, PS, and GP survey
instruments include a number of questions about the human resource capacity of the Panchayats
which allow us to address such issues in this report.
1.18 We analysed the Constitution of India and the BPRO, 2006 to evaluate the degree of
vertical imbalances in the de jure PRI system. In evaluating vertical imbalances, one would
ideally use estimates of the average per capita costs to achieve a minimum standard of service
delivery for each function assigned to the PRIs and compare these costs with the revenues
assigned to the PRIs. To the best of our knowledge, minimum standards of service delivery have
not been established by the State of Bihar or the GoI and thus cost estimates to achieve such
standards are not available. Consequently a quantitative estimate of the degree of vertical
imbalance in the State of Bihar is beyond the scope of this study.
1.19 As previously noted, we construct a more or less complete picture of the sources of funds
for each of the 50 GPs in our sample. Gauging the adequacy of finances for the various functions
is a difficult task as it requires estimating expenditure needs by function, and needs are obviously
a highly subjective concept. There are two approaches typically adopted in the literature on
estimating expenditure needs. One method is a bottom up approach in which detailed
information is used to estimate the unit cost of providing services. This approach is not feasible
given the resources and time available for this study. The second approach is to use established
expenditure norms, such as expenditures per client (or inhabitant) adjusted for different costs of
delivery. To benchmark these expenditure norms, one could use, for example, information on
average expenditures per client from other states of India. This methodology is not easily
implemented because data on Panchayat expenditures across India are not available. To address

14
this issue, we solicit the opinion of elected PRI officials regarding the adequacy of PRI finances
for the fulfilment of assigned functions.
1.20 We examine the expenditure priorities of the Panchayats. Section VII of the ZP, PS, and
GP survey instruments include a number of questions regarding the selection of schemes over the
previous 3 years that allow us to determine the spending priorities of the GPs. An analysis of the
responses to these questions allows us to address this issue.
1.21 To describe the formal decision-making processes of the GPs, we first describe the de
jure decision making process prescribed by the Bihar Panchayati Raj Ordinance, 2006.
Regarding informal decision-making processes, we analyse survey responses regarding the
regularity of GP meetings. The resources and time available for this study did not allow us to
delve deeper into this issue.
1.22 Regarding the accountability system, we describe the de jure accountability system
prescribed by the BPRO, 2006 and the Report of the Examiner of Local Accounts (2008).
Section VI of the ZP, PS, and GP survey instruments include a number of questions regarding
the audit status, financial reporting, and consolidation arrangements of the Panchayats. An
analysis of the responses to these questions allows us to evaluate the degree of compliance by
GPs in our sample with the de jure accountability system. In addition, we examine the Report of
the Examiner of Local Accounts for 2006 and 2007 to gain greater insight into the degree of
compliance by Panchayats with the de jure accountability system. Finally, a charted accountant
examined the compliance of the Panchayats with the financial reporting requirements of the
GoB. His findings are summarised in this report.
1.23 Based on an analysis of the data collected from the primary and secondary field work, we
conduct a comparison with the State of West Bengal, using the report on West Bengal’s PRI
finances prepared for the WB by Professors Roy Bahl and Sally Wallace.
1.24 We conduct an analysis of the equalising effect of the transfer system, using the
information obtained from the primary field work. Determining whether a transfer system is

15
equalising is an inherently difficult task. We examined the formulas used to make transfers to
establish whether the design of the transfer system contains explicit or implicit equalising
elements.
1.25 We evaluate the capacity of the DoF, DoPR, and the SFC to collect and analyse PRI
financial data and adjust the inter-governmental fiscal framework according to GoB objectives.
Based on discussions with the Permanent Secretary of the DoPR, Mr. Saaha, the SFC, DoF, and
the DoPR currently lack the capacity to collect and analyse data on PRI finances. Furthermore,
there is no consolidated reporting by the departments regarding transfers of money to the
Panchayats. This state of affairs has been confirmed by the Examiner of Local Accounts and a
member of the SFC. Therefore, there is not much to say other than to point out that the GoB’s
capacity to conduct and analyse PRI finances is woefully inadequate, and thus the GoB is unable
to make evidenced-based adjustments to the inter-governmental fiscal framework.
1.26 Finally, we provide recommendations to the GoB on potential reforms to improve the
inter-governmental fiscal framework with the objective of empowering local self government
and improving overall GoB development effectiveness. This includes suggestions for improving
the transfer system, PRI revenue authority, administration, and accountability system, based on
an analysis of the data collected from the primary and secondary field work described above and
in light of international best practises.
Summary
1.27 Chapter 1 explains the purpose of this study, describes the methodology, and provides an
overview of the survey instruments and the sample design. The study is based on primary and
secondary field work. The primary field work is based on data collected from surveys of a
sample of 5 ZPs, 10 PSs, and 50 GPs, during the period October 15, 2008 through July 31, 2009.
The 5 ZPs are purposely chosen, one each from five distinctive socio-economic categories with
respect to the social capital index. The social capital index is constructed as the simple arithmetic
sum of the values of the rural literacy rate, the gender disparity in literacy rate, the number of
self-help groups per 1 lakh of population, and the number of primary agricultural credit societies

16
and fisheries cooperative societies per 1 lakh of population. Two PSs from each ZP, and five GPs
from each PS are then randomly chosen. Each of the 3 questionnaires (ZP, PS, and GP) consists
of seven sections. The secondary field work involves interviews and data collection with
appropriate officials in the departments of the State of Bihar.
Briefly, the topics addressed in this report consist of the following:
1. An analysis of the functions assigned to the PRIs;
2. A description of the financial resources available to the GPs;
3. The human resources available to the GPs;
4. An evaluation of the degree of vertical imbalances in the de jure PRI system;
5. An examination of the expenditure priorities of the Panchayats;
6. A description of the formal and informal decision-making processes of the GPs;
7. A description of the de jure accountability system;
8. A comparison of PRI finances in the State of Bihar with that in the State of West Bengal;
9. An analysis of the equalising effect of the transfer system;
10. Recommendations to improve the inter-governmental fiscal framework;

17
Chapter II: Background
Recent elections of Panchayati Raj Institutions
2.01 In the PRI elections of 1978, there was a visible shift in the political centre of gravity.
Karpoori Thakur, the then Chief Minister, implemented the Mungeri Lall Commission Report,
which entailed reservation of jobs in the state government for both the lower backward castes
(Annexure I castes) and the upper backward castes (Annexure II castes) in Bihar. This measure
of Karpoori Thakur brought about a significant change in the political and social discourse in
Bihar. An extremely important consequence of this measure was that members of the lower
backward castes, distributed amongst 108 castes and 1/3rd of the total population, were brought
onto the centre stage of politics in Bihar for the first time.
2.02 In 1990, Laloo Prasad became the Chief Minister of the state. While the legislative
uncertainty of Karpoori Thakur hastened the process of decentralisation, Laloo Prasad could
afford to ignore it because of the relative social and political stability during his administration.
The subsequent assembly elections of 1995 and 2000, further strengthened the social justice
group, especially its upper segment. Thus, the political purpose of decentralisation was irrelevant
to the upper backward castes in Bihar. Additionally, it was feared that the backward caste
consolidation which was built so assiduously over the years would be fractured by PRI elections
at the grassroots level because of the lack of an organised and disciplined party structure at that
level. Further, with the meager resources at the command of the state government, it was
acknowledged that decentralisation would aggravate the financial crisis. Lastly, with the
possibility of increased transparency, decentralisation was not a palatable proposition for the
political managers and apex civil servants of the state. However, the intervention of the judiciary
rendered PRI elections unavoidable. The broad results of the election largely conform to the
above social and political trends in Bihar since the last PRI elections in 1978, which gradually
strengthened the hold of the upper backward castes on the political power structures of Bihar.

18
2.03 The PRI elections of 2001 were held in Bihar after a lapse of 23 years, despite the 73rd
Amendment of the Constitution in 1992 mandating that such elections be held. Apart from the
political implications of decentralisation, the devolution of resources to the rural areas was
expected to arrest the trend of a shrinking home market. With economic liberalisation and
opening of the home market, economic stagnation could be circumvented by a buoyant rural
market.
2.04 The 2001 PRI elections will go down in the history of Bihar as a turning point for the
electoral empowerment of the lower backward castes (listed in Annexure I). Until recently, they
were not taken into political or social cognisance, despite numbering more than 33 per cent of
the total population. While economic empowerment had touched a fraction of the upper
backward castes, large segments of the lower backward castes remained economically
disadvantaged and politically marginalised.
2.05 The PRI elections of 2006 also were a landmark in the history of Bihar. Unlike the PRI
elections of 2001, which were conducted after an intervention by the Patna High Court, the
elections of 2006 had the full support of the new state government. Not only was the state
government committed to strengthening the third tier of parliamentary institutions, the strategy
of inclusion of the marginalised also was institutionalised through provisions for positive
discrimination in this election. The 2006 elections reserved half the seats and even single posts
for women, with proportional reservation for scheduled castes and scheduled tribes and lower
backward castes. In Bihar, the electoral process resulted in substantial democratisation of the
higher centres of power, like the legislative assembly. The new reservations put in place prior to
the 2006 PRI elections attempted to mirror the democratisation of power with respect to the
lower tiers of government. The PRI elections of 2006, through the instrument of positive
discrimination, gave the marginalised section of the population a much larger role in local
government.
2.06 During the last two decades, reservation resulting from Mungeri Lall Commission Report
has ensured substantial presence of the lower backward castes in the state civil service, albeit at
the middle and lower levels. The PRI elections of 2001, however, decisively established their

19
political identity. Not only has one from their ranks emerged as a Chairman of a ZP, but a large
number of them were elected either as a Mukhiya (3.9 per cent) or as members of the ZP (3.5 per
cent). For the first time, they have tried to forge a pan-lower-backward alliance at different
levels. Their success in the Panchayat elections is certainly not spectacular, but their presence in
the power structure has at least become noticeable, and it promises a new factor in provincial
politics and social alliances.
2.07 Although there has been a change in the structure of power in the lower centres in favour
of upper and lower backward castes, the upper castes or the traditional elites still retain a
substantial part of the social and political power at the grassroots level. Admittedly, upper
backwards have extended their political support base in the Panchayat elections of Bihar —
chairmanships (43 per cent), membership in ZPs (42 per cent) and Mukhiyas (42 per cent), but
the upper castes still hold a substantial power base in rural Bihar. Their share in elected posts is
as follows: chairmanships (35 per cent), membership in ZPs (25 per cent), and Mukhiyas (34 per
cent).
Local government structure
2.08 Though the Constitution allowed the state governments to establish local governing
bodies, this was to be carried out by their own volition. This led to large inter-state disparities in
the presence of local governments. However, the 73rd and 74th amendments to the Constitution
render the establishment of rural (PRIs) and urban (municipalities) local governments mandatory
and provide a blue print for the same. The amendments include the 11th and 12th schedules of the
Constitution which lay out 29 items of expenditure devolution to PRIs and 18 items to the
municipalities. While these schedules allow state governments to devolve powers of taxation to
local bodies, it does not entrust this responsibility directly to the local governments.2
2.09 As figure 2.01 illustrates the PRI structure consists of 3 tiers of local self government:
ZPs, PSs, and GPs. Details regarding the structure of these tiers of local self government are
described below.
2 See H.L. Bhatia (2006). Public Finance, 26th edition. New Delhi: Vikas Publishing House Pvt., Ltd.

20
Gram Panchayat
2.10 A GP may be constituted from a single village or a group of contiguous villages so that
on average the GP has about 7,000 residents. However, as previously discussed, the average
population of a GP in our sample is approximately 12,000. A GP consists of an elected leader –
the ‘Mukhiya’ - and directly elected members – Ward members - from prescribed constituencies
which are established in a manner to ensure an average population of 500. An ‘Up-Mukhiya’
may be elected from amongst the directly elected Ward members.
2.11 In an attempt to encourage civic participation from marginalised sections of society,
almost 50 per cent of Ward member and Mukhiya seats are designated as ‘reserved’ for them.
While about 20 per cent of the seats are reserved for backward castes, the rest are divided among
scheduled castes and scheduled tribes in the same proportion as found in the local population.
While 50 per cent of these reserved seats are allocated to women, another 50 per cent of seats not
designated as reserved on the basis of caste also are reserved for women. These reserved seats
are then allocated to GPs within the district on the basis of rotation.
2.12 The term length for a GP is five years though it may be dissolved prior to the completion
of the full term. The GP is also required to conduct regular meetings and keep records of
resolutions, accounts, and prepare annual budgets. GPs are subject to audits by a prescribed
government authority. Well established regulations relating to the powers of the Mukhiya,
conduct of meetings, removal and resignation of members exist. Subsequent chapters of this
report provide details regarding the expenditure responsibilities and taxation powers of the PRIs.
2.13 The GP may also establish standing committees to oversee implementation of the GP’s
functional responsibilities. A Gram Raskha Dal also may be organised for security and disaster
management related activities.
2.14 The Gram Sabha is required to meet regularly and deliberate on the GP’s budgets,
developmental projects in the village, and identify beneficiaries for developmental schemes. The

21
Gram Sabha may also form a vigilance committee consisting of persons who are not members of
the GP to supervise governance related activities.
2.15 Judicial functions of the GP fall under the purview of the Gram Katchahry which consists
of a directly elected Sarpanch and Panches (members) from prescribed constituencies. A
reservation system as described above also exists for these officials.
Panchayat Samiti
2.16 A PS is established for every block and consists of elected members from territorial
constituencies, members of Lok Sabha (lower house of the Indian parliament) and state
legislative assembly whose constituencies lie wholly or in part within the PS’s jurisdiction;
members of Rajya Sabha (upper house of the Indian parliament) and state legislative council who
are registered as electors within the PS’s jurisdiction; and all Mukhiyas of the GPs falling within
the PS’s jurisdiction.
2.17 The members are elected from constituencies so formed as to ensure uniformity of
population served across jurisdictions. The members are required to elect a Pramukh and Up-
Pramukh from amongst them. Reservation of seats for directly elected members, Pramukh, and
Up-Pramukh on the basis of caste and gender exist and follow the same rationale as described
above with respect to the GP. The PS also is required to constitute standing committees to aid in
the discharge of its various functions.
2.18 The term length for a PS is five years though it may be dissolved prior to the completion
of the full term. The PS is also required to conduct regular meetings and keep records of
resolutions, accounts and prepare annual budgets. The PS enjoys permission to borrow from
governments, banks or other financial institutions provided such borrowing is sanctioned by the
government. PSs are subject to audits by a prescribed government authority. Well established
regulations relating to the powers of the Pramukh, conduct of meetings, removal and resignation
of members and constitution of standing committees exist. Subsequent chapters of this report
provide details regarding the expenditure responsibilities and taxation powers of PSs.

22
Zilla Parishad
2.19 A ZP is established for every district. Its members include elected members from
territorial constituencies where the constituencies house an average population of 50,000,
members of Lok Sabha and state legislative assembly whose constituencies lie wholly or in part
within the district; members of Rajya Sabha and state legislative council who are registered as
electors within the district and all Pramukhs of the PSs in the district.
2.20 The directly elected members of the ZP in turn elect an Adhyaksha and Up-Adhyaksha.
Reservation of seats for directly elected members, Adhyaksha, and Up-Adhyaksha on the basis
of caste and gender exist and follow the same rationale as described above with respect to the
GPs. The ZP is also required to constitute standing committees to aid in the discharge of its
various functions.
2.21 The term length for a ZP is five years though it may be dissolved prior to the completion
of the full term. The ZP is also required to conduct regular meetings and keep records of
resolutions, accounts, and prepare annual budgets. The ZPs are permitted to borrow from
governments, banks, and other financial institutions, provided such borrowing is sanctioned by
the government. ZPs are subject to audits by a prescribed government authority. There exist well
established regulations for relating to the powers of the Adhyaksha, conduct of meetings,
removal and resignation of members, and constituting standing committees. Subsequent sections
of this report provide details regarding the expenditure responsibilities and taxation powers of
ZPs.
2.22 The relationships among PRI officials are illustrated by the organisational chart provided
in figure 2.02. The responsibilities relating to implementation of policies, discharge of duties,
control of officers, disbursement of money, and possession of records and documents are
entrusted to the DDC cum CEO of the ZP. Similar responsibilities of the PSs are entrusted to the
BDO cum EO.

23
Demographic profile of elected officials
2.23 This section describes the demographic profile of elected officials in our sample of 50
GPs. The elected officials of a GP include the Mukhiya, the Up-Mukhiya, Sarpanch, Up-
Sarpanch, and Ward members. While the age, caste, gender, education, and occupational
composition of elected officials is analysed here, the Mukhiya’s profile is independently
reviewed. In addition to the above demographics, we also include tables on the number of terms
served and whether they were elected from a reserved seat.
2.24 Table 2.01 shows that approximately 59 per cent of Ward members in our sample were
elected from reserved seats; whereas, 56 per cent of Mukhiyas were elected from reserved seats.
While Nalanda on average elected almost 64 per cent of its members from reserved seats (the
largest per cent from reserved seats), it only elected 40 per cent of its Mukhiyas from reserved
seats. An explanation of the practise of reserved seats is provided in paragraph 2.11 above.
2.25 Table 2.02 provides the caste composition of Ward members and Mukhiyas by district for
our sample of 50 GPs. While there is a significant difference in the caste composition of
Mukhiyas; the composition of Ward members is more uniform across the 5 districts of our
sample. Upper caste Mukhiyas constitute about 32 per cent of all Mukhiyas in our sample;
whereas, Upper caste Ward members constitute only about 20.6 per cent of those in our sample.
Interestingly, the largest concentration of upper caste Mukhiyas (60 per cent) and Ward members
(32.5 per cent) in our sample are in Saharsa, a district in the most disadvantaged part of the state.
About 7 per cent of Ward members and 12 per cent of Mukhiyas are Muslims, with a significant
concentration in Sitamarhi, a district identified as ‘much below average’ in the social capital
ranking used to stratify our sample. Though the election of 2006 increased the political
representation of the backward castes; the reins of power largely remains with the upper castes.
For example, the proportion of upper backward caste Mukhiyas are significantly greater than that
of other castes.
2.26 Table 2.03 shows the distribution Ward members and Mukhiyas by gender and district.
The gender distribution of Ward members on an average is very balanced. This is likely due to
the result of reservation of seats for women. This pattern is more or less the same across all of

24
the districts. While a slightly larger per cent of Mukhiyas are male (54 per cent), the disparity is
very pronounced in Nalanda, reflecting perhaps the lower per cent of Mukhiyas elected from
reserved seats there.
2.27 Table 2.04 shows the distribution of PRI functionaries by age and district. Mukhiyas on
average are somewhat older than Ward members. This pattern is fairly stable across the 5
districts in our sample.
2.28 Table 2.05 shows that Mukhiyas are generally more literate than the Ward members in
our sample. Almost 60 per cent of the Mukhiyas in our sample achieve at least the educational
level of secondary schooling, while only about 30 per cent of Ward members accomplish this
level of education. Interestingly, no Mukhiya is identified as being illiterate. The response to this
question may be biased by the fact that the Mukhiyas are self reporting their level of literacy.
More than half of the Ward members in our sample are barely literate. Economic conditions
seem to play an important role in determining the per cent of elected officials that are literate.
For example, nearly 78 per cent of Ward members in the relatively poor district of Sitamarhi are
either illiterate or just literate; whereas, in the relatively well off district of Bhojpur 45 per cent
are either illiterate or just literate. The lack of highly literate Ward members probably reflects the
region’s educational opportunities. However, the electorate seems to value education, as
evidenced by their inclination to elect better educated Mukhiyas, assuming self reports of literacy
are accurate.
2.29 Table 2.06 shows that about one-third of Ward members and Mukhiya are not engaged in
any occupation. This may reflect the reservation of seats for women who may be less likely to be
engaged in employment outside the home. Cultivators, who generally earn higher incomes, form
34 per cent of Mukhiyas and about 25 per cent of Ward members, perhaps reflecting the
importance of economic affluence in these communities. This proposition is further strengthened
by the fact that 50 per cent of Mukhiyas in Bhojpur are cultivators. Surprisingly, while over 26
per cent of Ward members in our sample are rural labourers, this figure is just 4 per cent in the
case of Mukhiyas. None of the Mukhiyas are artisans or salary earners. A very small proportion
of Ward members are from this occupational category.

25
2.30 Table 2.07 provides information on the number of terms served by Ward members and
Mukhiyas. There is a strong evidence of an apparent ‘anti-incumbency’ phenomenon in the case
of both Mukhiyas and Ward members. However, Mukhiyas seem be less vulnerable to this
phenomenon than Ward members, with almost 97 per cent of Ward members and 82 per cent of
Mukhiyas serving only one term. This pattern is consistent across all 5 districts in our sample,
though 40 per cent of Begusarai’s Mukhiyas are serving a second term. Interestingly, a much
larger per cent of Muslim Ward members serve more than one term, while more than half of the
Mukhiyas who serve at least 2 terms belong to the upper and upper backward castes. A gender
disparity also exists, with almost 30 per cent of male Mukhiyas serving more than one term;
while in the case of female Mukhiyas it is only about 4 per cent. This apparent ‘anti-
incumbency’ phenomenon may be explained, at least in part, by the reservation of seats.
Summary
2.31 Chapter 2 provides an overview of recent elections of the PRIs in the State of Bihar,
explains the structure of local governments, and describes the demographic profile of elected
officials in the sample of 50 GPs. The implementation of the Mungeri Lall Commission Report
in the PRI elections held in 1978 brought significant changes in the political and social discourse
in Bihar. Members of the lower backward castes, comprising one-third of the total population,
were brought into the centre stage of politics in Bihar for the first time. The subsequent elections
of 1995 and 2000 further strengthened the social justice mechanism. These elections gave a
much greater role to the marginalized section of the population in local government.
2.32 The PRI structure of local self government consists of three tiers, namely Gram
Panchayat (GP), Panchayat Samiti (PS) and the Zilla Parishad (ZP). The GP consists of an
elected leader - the Mukhiya - and directly elected ward members. Fifty per cent of the Mukhiya
seats are reserved for marginalized sections of the society. The PS consists of elected members
from territorial constituencies, Lok Sabha, and state legislative assemblies. Reserved seats on the
basis of caste and gender exist for these elected officials, as well. The government permits PSs to
borrow from governments, banks, and other financial institutions. ZPs are established for every
district, and Adhyaksha and Up-Adhyaksha are elected on the basis of caste and gender.

26
2.33 Voters on average appear to elect older, male Mukhiyas that are a part of the upper
castes, better educated, and more affluent. While this pattern holds in the case of the caste
composition of Ward members, it is not so in case of other characteristics. Male Mukhiyas also
seem to enjoy greater success than Ward members in being elected to a second term. However,
this apparent ‘anti-incumbency’ phenomenon may reflect, at least in part, the need to recruit
political novices to satisfy the rules concerning the reservation of seats beginning with the 2006
elections. Though the reservation of seats has increased political representation of the backward
castes, the reins of power largely remain with the upper castes.

27
Chapter III: Analysis of Expenditure Assignments
3.01 The economic role of government, broadly speaking, is to enhance the performance of
the market economy. According to Richard A. Musgrave (1959) the economic role of
government can be divided into three fundamental functions: the stabilisation function, the
distribution function, and the allocation function. The stabilisation and distribution functions
should be assigned to the central government; therefore, we do not take up the assignment of
these two functions. That leaves the allocation function. In the vast majority of cases, the
allocation function should be assigned to the private sector. In some cases, markets may fail to
allocate good efficiently thus providing a role for government to correct such market failures.
Below we describe the economic principles that should guide the assignment of allocative
functions in a multi-tiered governmental system, such as that in the State of Bihar.
The principles of expenditure assignments
3.02 The State of Bihar is required by the 11th Schedule of the Constitution of India to assign
certain functions to the Panchayats, some of which would often be assigned to the private sector.
It may noneless be useful to discuss the appropriate assignment of allocative functions between
the private and public sectors according to economic principles, before taking up the appropriate
assignment of allocative functions in a multi-tiered system of government.
3.03 In the vast majority of cases, markets can be relied upon to efficiently allocate resources.
In such cases, the allocation function should be assigned to the private sector. In those cases
where the market cannot be relied upon to allocate goods and services efficiently, the
government should make adjustments to market allocations. We refer to such instances as market
failures. Generally speaking there are three types of market failures: public goods, externalities,
and natural monopoly. We discuss each of these in turn below.

28
3.04 Local public goods have two properties. One property of local public goods is that they
are non-rival in consumption over a limited geographic range, meaning that everyone within a
certain geographic area can share equally in the consumption of the good. The other property is
that public goods are non-exclusive, meaning that it is difficult or impossible to exclude others
from enjoying the good once it is produced. Examples of public goods include vaccination
programmes, police services, fire services, and education. When people make the decision to get
a vaccinated, they may not take into account the benefit of reducing the chance that they will
spread the disease to others. If we rely on private decision-making, too few people may get
vaccinated. This is an example of a market failure, and there is a role for government to design
policies to improve upon the private allocation. There are a number of ways that the government
could address this market failure. The government could provide vaccination services for free or
at a reduced cost, or the government could subsidise the price of vaccinations provided by the
private sector. The point being that a market failure does not necessarily compel the government
to take over the activity from the private sector. The public sector may still use the private sector
to allocate the good or service, but the government should provide some assistance or regulation
to improve upon the private allocation.
3.05 Externalities refer to cases where the consumption (production) of a good or service
affects others for better or worse. Examples of negative production externalities are industrial
pollution and solid waste management. Take the case of solid waste. It not only affects the
person who creates it but the person’s neighbours as well. However, the person may not take into
account the harm to others and therefore allow too much waste to accumulate. There is a role for
government to promote solid waste disposal. Again, the government may provide the service
itself or contract with the private sector to provide the service.
3.06 Finally, market failures arise from natural monopoly. In the case of electricity, water, and
mass transportation, there are large fixed costs. Because of these fixed costs, it is not cost
effective to have many firms providing this good in a given market. Due to the resulting lack of
competition, the firm will maximise profit by restricting output and increasing the price. As a
result, too little is produced. Therefore, there is a role for government to either regulate natural
monopolies or provide the good or service itself to correct this market failure.

29
3.07 Many of the functions assigned to the Panchayats by the 11th Schedule belong there
because of potential market failures. In the case of agriculture, for example, infectious disease
control should be assigned to the public sector. This is appropriate because infectious disease
control involves an externality. Not only is the farmer whose livestock are diseased benefitted by
infectious disease control but the farmer’s neighbours are benefitted as well. The farmer takes
into account the private benefit to himself of treating his livestock, but he may not take into
account the benefit to others from having his lieestock treated and preventing the further spread
of the disease. Therefore, he may not treat his livestock as aggressively or thoroughly as he
would if he internalised the full benefits to others of treating his livestock. Therefore, there is a
role for the public sector in infectious disease control. Having established that there is a role for
government in infectious disease control, the next issue is which level of government should be
assigned this function in a multi-tiered governmental system. We take up this issue below.
3.08 Now, we turn to the principles which should guide the decision of which level of
government should be assigned responsibility for a given function in a multi-tiered governmental
system, once it has been decided to assign the function to the public sector. According to the
subsidiarity principle, a function should be aassigned to the lowest level of government
consistent with heterogeneous tastes, economies of scale in the production, and spill-over
benefits. We proceed below by discussing the role of each of these characteristics of government
services in assigning functions in a multi-tiered system of government.
3.09 We begin by examining the role of economies of scale in the assignment of functions in a
multi-tiered system of government. Once the decision is made to assign a particular function to
the public sector, the presence or absence of economies of scale in the production of that
function may play an important role in deciding which level of government should be
responsible for it. If there are significant economies of scale in producing the good or service,
then that function should be assigned to the tier of government that exhausts the available scale
economies to minimise per unit costs of production. For example, government services, like
waste water treatment, often involve large fixed costs on facilities. Such goods and services can
be produced at lower costs per capita by spreading them over a large population and thus should

30
be assigned to the level of government that is sufficiently large to exploit these potential cost
savings. However, economies of scale are easily abused as a rationale for centralising
government functions. Often, creative solutions are available that permit decentralisation, even in
the case of functions with significant economies of scale. Again, take the case of waste water
treatment. Rather than assigning this function to a higher level of government to exploit available
economies of scale, several small jurisdictions could form a special district to provide waste
water treatment. Forming such special districts from a number of smaller jurisdictions would
allow them to realise the potential savings from spreading the costs of production over a larger
number of people and avoids centralisation of this function.
3.10 Turning now to the role of spill-over benefits in the assignment decision, the boundaries
of a jurisdiction should correspond as closely as possible to the benefit area of the expenditure
functions assigned to it. For example, the benefit area for sanitation services is clearly the local
community, but the benefit area for air traffic control is the entire national territory. Therefore,
the provision of sanitation services should be assigned to local governments, and air traffic
control to the central government. If the benefit area of a function is larger than the jurisdiction
to which it is assigned, the jurisdiction is unlikely to provide an efficient level of service due to
spill-over benefits accruing to neighbouring jurisdictions. Such an assignment is likely to result
in an inefficient under provision of the service because the jurisdiction is unlikely to take full
account of the benefits provided to non-residents in making its decision about how much of the
good or service to provide. For example, requiring a single municipality to finance a tertiary
hospital that provides services to residents of the entire region in which it is situated, including
nearby rural areas, is likely to result in a hospital with inadequate resources to handle the number
of patients seeking treatment and as a result the quality of care is likely to suffer. In summary, it
is important to take into account the benefit area of the government function when making
assignment decisions.
3.11 Finally, we turn to the role of heterogeneous tastes in making the assignment decision.
Heterogeneous tastes refers to the case where some people are willing to pay more for a high
level of the government service; others may only be willing to pay for a moderate level; and still
others may only want a minimal level of the service or none at all. If there is a substantial

31
variation in the demand for a government service among the population, it may be desirable to
have many jurisdictions that offer a variety of service levels. The application of this principle
assumes that there are not extensive economies of scale in the production of the public goods in
question, and assigning this function to a small jurisdiction will not result in significant spill-over
benefits to neighbouring jurisdictions. Assigning functions to the lowest level of government,
consistent with exploiting economies of scale and internalizing spill-over benefits, puts decision
making into the hands of officials that are closer to the people that are affected by their decisions.
This promotes accountability of officials to its residents. Furthermore, officials closer to the
people that they serve should know best the people’s preferences for government services.
3.12 The foregoing discussion provides useful guidance to the appropriate assignments of
functions in a multi-tiered governmental system. However, there is no single best distribution of
expenditure assignments. Table 3.01 shows the distribution of functions in 11 federal countries,
including India. While the expenditure assignments reported in this table broadly agree with the
foregoing principles, the most significant feature of this table is the variety of expenditure
assignments among federal countries. Based on such evidence, Jorge Martinez-Vazquez and
Andrey Timofeev (2007) conclude that an important consideration for efficient service delivery
is to have concrete, clear, and stable expenditure assignments. Insofar as practical, expenditure
assignments should be exclusive, as this will promote accountability of government officials to
its citizenry. If local residents do not know which level of government is responsible for
providing a given government function due to murky assignments, then they will not know
which level of government to hold accountable for poor service delivery. Murky assignments
may serve the interests of elected officials and civil servants would wish to escape accountability
for poor performance, but it does not serve the interests of stakeholders.
3.13 While exclusive expenditure assignments are desirable, it does not mean that there is no
role for concurrent assignments in a multi-tiered governmental system. In the case of concurrent
assignments, sub-functions that comprise a given function should be identified and clearly and
exclusively assigned to the appropriate tier of government, consistent with heterogeneous tastes,
economies of scale, and benefit spill-overs. More specifically, most functions of government,
such as agriculture, education, and healthcare to take just a few examples, are multidimensional

32
in nature. In other words, government functions often are the consequence of the performance of
many sub-functions.
3.14 Education, for example, is often divided into at least four levels: pre-school, primary,
secondary, and tertiary (university) education. In addition, there are vocational training
programmes, adult literacy programmes, public libraries, and so on. All of these distinct
activities fall under education. Each of these levels of education in turn consist of many sub-
functions, such as designing the curriculum; recruiting, training, monitoring, promoting, and
disciplining teachers; maintaining and cleaning school buildings; purchasing books and other
learning materials; providing food services; and financing education in addition to many other
administrative tasks associated with providing educational services. If education is a concurrent
assignment of two or more tiers of government, as in the State of Bihar, then the sub-functions of
education should be identified and clearly and exclusively assigned to the appropriate tier of
government. For example, curriculum design may involve substantial fixed costs. Cost savings
may be achieved by spreading these costs over a large population. Therefore, it may be more cost
effective to assign this sub-function to a higher level government, such as the state, and thereby
avoid the duplication of costs inherent in assigning this sub-function to a lower level
government. The cost savings from such an assignment may be worth the loss of local autonomy
in making curriculum decisions. In contrast, the quality of education may be enhanced by
assigning the sub-function of recruiting, promoting (dismissing) and disciplining teachers to the
local level of government. Local officials and even school officials themselves are in a much
better position to monitor the performance of teachers, than government officials at higher levels
of government. In short, exclusive assignments should not be interpreted to be an all or nothing
assignment of a function to a particular tier of government.
3.15 Insofar as practical, expenditure assignments should be clear and exclusive. However,
concurrent expenditure assignments may be necessary and appropriate in some cases, as in the
case of education and healthcare. In the case of concurrent assignments, the assignment of the
respective sub-functions that make up a given function of government should be assigned to the
appropriate tier government in a clear and exclusive fashion. Nevertheless, some overlapping of

33
responsibilities among the various tiers of government may be inevitable. In such cases,
mechanisms for coordination among the responsible tiers of government should be put in place.
Formal determination of expenditure priorities
3.16 The 73rd Amendment of the Constitution, and more specifically Schedule 11, compels the
the states to decentralise specific functions of government. Therefore, it is worth reviewing the
requirements of Schedule 11. Specifically, the 73rd Amendment provides a list of the powers,
authority, and responsibilities of Panchayats. For ease of reference, this list is provided in table
3.02. The responsibilities of the PRIs can be broadly classified as functions relating to agriculture
and allied activities (functions 1-7, and 12 in table 3.02), rural development (8, 9, and 22),
education (17-21), healthcare (23), infrastructure (13-15 and 29), and social welfare (10, 11, 16,
and 24-28).
3.17 The Constitution is silent on local government finances and the assignment of these
functions and their sub-functions to the three tiers of local government. According to sub-section
5, List II (State List), of the Seventh Schedule (article 246 of the Constitution), the states are
responsible for constituting and assigning the powers of local authorities for the purpose of local
self-government or village administration. In other words, each state is responsible for defining
the powers, authority, and responsibilities of the Panchayats. However, the assignment of
responsibilities to the Panchayats is constrainted by the 11th Schedule of the Constitution, and
financing of the Panchayats is constrained by the requirements of the 7th Schedule of the
Constitution. Before analysing the assignment of these functions by the State of Bihar, it may be
useful briefly to discuss the constraints facing the State of Bihar due to the Constitution,
regarding the assignment of functions to the PRIs.
3.18 Regarding the responsibilities listed in the 11th Schedule, there are a number of
production/commerical activities that would seem to be more appropriately assigned to the
private sector, such as agriculture (function 1 in the 11th Schedule and table 3.02), land
improvement (function 2), small scale industries (function 8), cottage industries (function 9), fuel
and fodder (funciton 12), rural electrification (fucntion 14), and markets (function 22). Granted,

34
there is a role for government in many of these areas. For example, there is a clear role for
government to intervene in private agriculture, whether for subsistence or commercial purposes,
to prevent the spread of diseases, to conduct research and development, and to disseminate
improved agricultural techniques. However, the Constitution simply assigns agriculture to the
Panchayats. The Constitution may be directing the states to allow local self governments to
regulate agriculture. However, regulation of agriculture is probably best done by state
government in the interests of creating a common market. Allowing local self governments to
regulate agriculture runs the risk that this authority will be abused to restrict trade in favour of
local production. Finally, perhaps subsistence and even some commercial activities in agriculture
are community-based undertakings, rather than private undertakings. If that is the case, it would
seem that the Union government could rely on local customs and practises to make such
decisions, rather than proscribing that they should be undertaken by local self governments. In
short, it is difficult to understand why the Constitution assigns certain production/commercial
activities to government, except perhaps as a vestige of the idea of ‘socialism’ that animated
many of the framers of the Constitution and the Congress Party.3 Of course, this points to the
need for flexibility in expenditure and revenue assignments and thus cautions against making
explicit assignments in the Constitution.
3.19 It is also interesting to note that some of the responsibilities listed in the 11th Schedule are
concurrent responsibilities of the Union government, the states, and the PRIs. As provided for in
List III, forests (function 6 in the 11th Schedule and in table 3.02), education (functions 17
through 20), fuel and fodder (function 12), and electricity (fucntions 14 and 15) are examples of
concurrent responsibilities of the Union, states, and PRIs. While making these responsibilities
the concurrent responsibility of the Union, state, and local self governments may or may not be
appropriate, at the very least the respective sub-functions constituting these responsibilities
should be clearly and exclusively assigned to an appropriate tier of government. As discussed
below, the GoB has chosen to make explicit assignments of certain sub-functions among the
Panchayats, but an explicit assignment of the respective responsibilities of the Union and state
governments appears to be missing. Furthermore, there needs to be coordinating mechanisms
3 See, for example, Granville Austin (1999) for a discussion of ‘social revolution’ and the First Amendment of the Constitution, specifically pages 69-98.

35
among the tiers of government in the case of overlapping responsibilities. Such coordinating
mechanisms appear to be missing, as well.
Clarity and appropriateness of assignments
3.20 One can identify the functions that have been ‘actually” transferred to the PRIs on the
basis of a number of GoB circulars. These circulars in Hindi are summarised in an activity
mapping which was translated into English as part of the study. However, these circulars may
not be very meaningful in some cases. If, for example the assignment of a function is not
accompanied by additional finances and human resources, then the PRI functionaries do not take
them seriously. The PRIs consider a function to be ‘actually’ devolved to them when they obtain
at least additional financial and human resources to carry out a given function. The devolution of
funds includes three major heads: FC12, BRFG and NREGA. However, it should be noted that
these allocations are not ‘sector’ specific and, even after being within the parameters of relevant
guidelines, the programmes can touch upon a number of sectors mentioned in the legal text. As
discussed in greater detail in subsequent chapters, the reason one can find several GPs reporting
activities under different heads— infrastructure, development, and maintenance functions (table
5.06 – 5.08). Some of the circulars, not accompanied by additional financial and human resource
support, bestow supervisory or recommending authority to the PRIs, e.g., ICDS, VEC, IAY, and
so on. After taking care of programmes under FC12, BRFG, and NREGA, the PRI functionaries
are left with very little time to attend to the recommending and supervisory functions.
3.21 There are several general issues with the current assignments of sub-functions to the 3
tiers of local self government as described the GoB’s activity mapping. First, in most cases the
activity mapping does not provide for financing of these activities. In addition, the activity
mapping does not provide for the assignment of the functionaries necessary to carry-out these
activities. In most cases, these functionaries remain employees of the state. The activity mapping
appears to address the contradiction of decentralising functions but maintaining control over the
relevant functionaries by providing the Panchayats with supervisory authority over the work of
and requests for leave by state functionaries. According to informal discussions with Panchayat
officials, they do not feel that they have real authority or autonomy in many areas assigned to

36
them in the activity mapping. Second, the activity mapping does not define the respective
responsibilities of the Union government and the State of Bihar for each of the 29 functions
where there are concurrent assignments among the five tiers of government: Union government,
GoB, and the PRIs. Third, it does not provide for coordinating mechanisms or authorities in the
case of overlapping responsibilities within or among functions. Finally, the GPs and PSs are
often assigned monitoring responsibilities, rather than authentic autonomy. In the cases in which
GPs and PSs are given responsibility for monitoring and reporting, there is no mechanism for the
GPs or PSs to appeal decisions taken by higher levels of government, suggesting that their
monitoring responsibility lacks any substantive meaning in actual practise.
Assignment of production and commercial activities
3.22 As previously noted, the activity mapping assigns responsibility for some commercial
activities to the Panchayats rather than the private sector. For example, ZPs are assigned
responsibility for production activities and acquiring materials and equipment, and the PSs are
assigned responsibility for establishing seed farms and nurseries. Other examples of assigning
seemingly private sector functions to Panchayats include animual husbandry, dairying, poulty,
fisheries, farm forestry, small scale industries, and fuel and fodder. Generally speaking, these
seem like production activities that should be left to the private sector. Perhaps, there is a reason
that the private sector is ineffective in performing these production activities. If that is the case, it
may be more effective to identify the obstacles that prevent the private sector from being
effective at performing these functions and trying to remedy these obstacles. It may be that the
private sector is simply being displaced by public sector activity in these areas. Alternatively,
subsistence farmers may lack the cash income to purchase the goods and services from the
market. If that is the case, it may be more effective for the government to provide farmers with
vouchers to purchase these services from the market rather than having Panchayats attempt to
produce these goods and services. Vouchers would have the added benefit of stimulating the
cash economy in rural areas of the state and thus promote commercial agriculture.
Assignment of financing arrangements
3.23 The GPs are responsible for the control, operation, and maintenance of minor irrigation
projects, tube-wells, and lift irrigation projects as well as the selection of the beneficiaries for

37
such projects. These assignments seem clear and appropriate. However, there is no provision for
the financing of these activities. It also would seem appropriate to give a larger role to the PSs
and GPs in the choice of projects undertaken by the minor irrigation department, including
providing PSs and GPs with conditional grants to finance minor irrigation projects within their
jurisdictions. After all the PSs and GPs are more likely to know best the minor irrigation projects
which have the highest rate of return, than officials in the irrigation department located in Patna.
3.24 In the case of healthcare, the current assignments leaves financing and budgeting for
personnel (salaries) and supplies in the hands of state officials. The share of the state budget in
India spent on wages and salaries in the health and education sectors often is in excess of 98 per
cent. These sectors simply are not effective without providing for supplies, particularly in the
case of the health sector. The assignment of sub-functions should be re-considered with this issue
in mind. Local self governments should be given greater responsibility for financing and
budgeting for supplies and personnel in the education and health sectors. Perhaps, the state
should create block grants for education and health to finance the hiring of personnel and
procurement of supplies by GPs. The state should monitor local self-governments to make sure
that the conditions of such block grant are met. Otherwise, the GPs should left to make hiring
and procurement decisions in these sectors.
Assignment of functionaries
3.25 Regarding water resources, the ZPs are assigned 4 sub-functions. These sub-functions
include providing engineering assistance to the PSs and GPs for irrigation projects. In addition,
the ZPs should control, monitor, and supervise projects being implemented by PSs and GPs. The
PSs are assigned 5 sub-functions. In addition to a number of supervisory tasks, the PSs are
responsible for control, operation, and maintenance of surface irrigation projects (e.g. dams,
weirs, medium irrigation projects, and so on) of the minor irrigation department. Finally, the GPs
are assigned 8 sub-functions. The GPs are largely responsible for the control, operation, and
maintenance of minor irrigation projects, tube-wells, and lift irrigation projects as well as the
selection of the beneficiaries for such projects. These assignments seem clear and appropriate.
However, there is no provision for the financing of these activities and the provisioning of
functionaries to carry-out these activities at PS and GP level seems inadequate.

38
Assignment of responsibility without meaningful authority
3.26 Local self-governments are given some authority to supervise and monitor the work of
gazetted and non-gazetted health officials. This authority is given meaning by requiring the
appropriate tiers of government to approve casual leave of gazetted and non-gazetted health
officers and to approve payment of their salaries based on absence reports. In the case of the
distribution of medical supplies, local self governments are given a largely supervisory role.
Schools and clinics are plagued by two problems: unexplained absences by teachers and the lack
of supplies. The assignment of the supervision of health and education personnel and the ability
to approve the payment of their salaries based on reports of absences may address the former
problem. In the case of disciplinary actions, the ZP (PS) can make recommendations, but the
activity mapping does not indicate to whom they should make these recommendations or provide
for an appeals process when a PS or ZP is dissatisfied with the action or lack of action taken by
the relevant authority.
3.27 Regarding PMRY, the ZPs and PSs are responsible for monitoring and inspecting
training and production centres for hand and power looms and silk. The GPs appear to be able to
recommend beneficiaries but not select beneficiaries. The real authority appears to be in the
hands of the DIC, and the assignment of the Panchayats does not appear to be substantive. Given
all the responsibilities of the Panchayats, one wonders if it is necessary or desirable to assign to
them sub-functions that do not appear to involve authentic responsibility or authority.
Economies of scale
3.28 Assigning research and development to the ZPs does not seem appropriate for two
reasons. Research and development involves considerable economies of scale and spillover
benefits. Research and development often requires laboratories, equipment, and highly trained
technicians. Cost savings can be achieved by spreading these costs over a large population. This
would argue for assigning research and development to the state if not the federal government.
3.29 Districts are responsible for formulation of, as opposed to simply implementing, national
and state education policy and schemes. This invites unnecessary duplication of effort in
formulating policies and may lead to wide discrepancies among the districts in the interpretation

39
of state and national policies. Due to economies of scale in the development of curricula, this
responsibility should be assigned to a higher level of government, unless there is a compelling
and countervailing benefit from the proposed assignment.
Spillover benefits and costs
3.30 Assigning the control of epidemics and infectious diseases to GPs is not appropriate due
to the significant spillover benefits (costs) from controlling (failing to control) such epidemics.
For example, GPs are likely to internalise the economic losses of slaughtering their livestock to
contain an epidemic but fail to internalise the benefit to neighbouring GPs from containing it.
This will tilt the decision of any given GP against containing an epidemic. Clearly, the control of
epidemics and infectious diseases should be assigned to a higher level of government that can
internalise these costs and benefits. Having said this, GPs should provide surveillance for
outbreaks of infectious diseases, but they should not be relied upon to control such outbreaks.
Concurrent assignments
3.31 Regarding social forestry and farm forestry, there appears to be considerable overlap in
the assignments among the ZPs, PSs, and GPs. According to the activity mapping, each tier is
responsible for “[n]ew functions related to social forestry and farm forestry, earlier performed by
the Forest Dept., shall be done by [ZP, PS, GP] now, with required assistance from rangers.”
Perhaps the meanings of social forestry and farm forestry are clear, but it would be worthwhile to
define the functions previously performed by the Forest Department that make up social and
farm forestry that are being re-assigned. Furthermore, the concurrent assignment of social and
farm forestry to all 3 tiers of local self government proposed is the type of arrangement that
should avoided. Murky assignments like these lead to a lack of accountability and poor service
delivery.
Lack of clarity in assignments
3.32 In several cases, there are concurrent assignments which should be avoided in favour of
exclusive assignments to promote accountability. More specifically, these cases include the
following: formulation and implementation of national and state education policy and schemes
(under the policy works and normal teaching activities sub-function); activities related to

40
enrolment, decrease in number of drop-outs, and supervision and evaluation of the 8th grade
general examinations; and evaluation and monitoring of mid-day meals and distribution of
allowances. There is lack of clarity regarding the respective roles of the VECs and GPs. Are the
VECs subordinate to the GPs, or do the VECs have independent authority? How should
disagreements be resolved? These issues need to be clarified. Also, making the districts
responsible for the formulation of, as opposed to simply implementing, national and state
education policies and schemes invites unnecessary duplication of effort in formulating policies
and may lead to wide discrepancies among the districts in the interpretation of state and national
policies. At the very least, there should be some way to centralise and share information about
the policies adopted by the districts and the manner in which these policies are formulated in
order to identify best practises.
Decision making arrangements
3.33 Consistent with the 11th Schedule of the Constitution of India, the BPRO, 2006 assigns
31 functions to the GPs. The GoB has provided greater specificity to these general assignments
in an activity mapping which is discussed above. The BPRO, 2006 also provides for the election
of a Mukhiya, Up-Mukhiya, and Ward members; the appointment of a number of committees;
and regular meetings of the Gram Sabha. Decisions on behalf of the GP should be collective
decisions either through a meeting of the Gram Sabha or by the people’s elected representatives.
While the BPRO, 2006 and the activity mapping give the Mukhiya considerable power and
responsibility, the Ward members have little formal authority. During informal discussions with
Ward members, we were told that Mukhiyas seldom consult them in taking decisions. Below, we
report evidence gathered with the PRI survey that support the anecdotal evidence gathered from
Ward members during informal interviews.
3.34 Table 3.03 shows that GPs on average held about 8 meetings over the past 3 years, with
an average attendance of about 7 members in FY 2009. However, only about 14 per cent of
villages have held at least one Gram Sabha meeting. The average number of meetings is also
stable across time and districts. The average number of meetings varies from one in Saharsa to
about 14 in Nalanda. A significantly larger number of villages in Bhojpur have convened at least

41
one meeting as compared to other districts. Distance from the GP to the block headquarters
affects the number of meetings only when GPs are between 9 to 12 miles of the block
headquarters. Apparently, Mukhiyas are not complying with the rules set forth in the BPRO
regarding the frequency of GP meetings.
3.35 Table 3.04 shows the topics that were part of the agenda of GP meetings in 2008-09. In
all, they report 259 topics which are grouped into seven major categories: (i) programme
planning, (ii) monitoring of various schemes, (iii) poverty alleviation programmes, (iv) education
issues, (v) health related issues, (vi) other development issues, and (vii) administrative issues.
3.36 Table 3.05 reports the distribution of the number of projects per village in the GP for our
sample of 50 GPs. The Mukhiya’s village on average benefits from 18.5 projects, while the
average number across all villages in all districts is about 10. This problem is especially acute in
the prosperous district of Bhojpur where the Mukhiya’s villages on average benefit from about 4
times the number of projects as all other villages in our sample. In contrast, the Mukhiyas in
Saharsa do not show such extreme favouritism to their own village. The distribution in Saharsa is
14 projects on average benefitting the Mukhiya’s village, and all other villages benefitting from
approximately 11 projects on average. Interestingly, all villages in our sample of 50 GPs benefit
from at least 1 project.
3.37 Table 3.06 provides information on average expenditures by GPs and village types for the
50 GPs in our sample. The average expenditure in the Mukhiya’s village is almost twice that
spent on all other villages combined. This problem is especially acute in the economically
developed district of Bhojpur where average expenditures on the Mukhiyas’s village are three
times that on all other villages combined. In the economically disadvantaged district of Saharsa,
the difference in average expenditure per village shows a slight preference for the Mukhiya’s
village, but the difference is negligible.
3.38 The GP survey also directed Mukhiyas to list the main reasons why the GPs did not
undertake assigned activities. Interestingly, the lack of an official directive from a state official is
cited as the foremost reason for the lack of activity. The legal provisions, they maintain, are not
sufficient to establish their standing for such activities. This was true even in the case of

42
activities such as ensuring enrolment and attendance in primary and middle schools and health
programmes which are activities that seemingly could be carried out without additional financing
or technical funtionaries.
3.39 In case of activities such as agriculture and poverty alleviation programmes which were
overseen by specialised government departments, the Mukhiyas feel that their involvement may
be seen as an infringement on the authority of others. The Mukhiyas noted that provision of
guidelines outlining their role would result in increased coordination and improved efficiency of
these developmental programmes.
3.40 Involvement in a few activities requires training of Ward members. When such training is
not conducted, they lack the required skills and knowledge to undertake activities and hence do
not get involved in these activities. GPs also appear to neglect time consuming promotional
activities, ironically due to the low level of awareness of the concerned developments in, for
example, the education or health sectors.
3.41 The problem of inadequate manpower is also an important reason for GPs avoiding or
limiting their activities in many fields. The Mukhiyas/Panchayat Sachivs feel that, with the
available manpower, they can only administer the existing programmes: FC12, NREGA, BRGF,
TFC, and a few others.
Activities of the GPs
3.42 For convenience, we have divided the GP’s 31 functional responsibilities listed in Article
22 of the BPRO, 2006 into 7 categories, specifically production related activities, infrastructure
related activities, development related activities, maintenance related activities, administrative
and quasi-judicial activities, and NREGA and non-NREGA related project activities. Below we
report the percentage of GPs in our sample taking up activities in these areas. We also use simple
cross-tabulations to see if distance of the GP from the block headquarters and the availability of a
Bhavan influence the take-up rate of activities by GPs.

43
3.43 Table 3.07 shows the percentage of GPs performing various assigned production
activities. More than half of the GPs in our sample undertake agriculture related activities while
less than one-fifth promotes Khadi and village industries. GPs that are within 0 to 4 kilometres of
the block office are significantly more likely to engage in productive activities than GPs that are
more remote. Perhaps, they are more likely to engage in productive activities because they are
closer to markets and thus have greater commercial opportunities from such investments than the
more remote GPs who may not find it profitable to transport goods to market because of their
remoteness. Interestingly, though perhaps not surprisingly, the most remote GPs (more than 12
kilometres from the block headquarters) are more likely to engage in agricultural and animal
husbandry related activities than those between 5 and 12 kilometres.
3.44 Table 3.08 shows that nearly all GPs in our sample undertake activities related to the
building of roads and promotion of non-conventional sources of energy. Interestingly, distance of
the GPs from the block headquarters appears to increase the probability that a GP will take-up
the building of roads and promotion of non-conventional sources of energy, perhaps reflecting
the lack of such amenities in more remote areas. Less than two-thirds of the GPs are involved in
rural sanitation. Though rural electrification may be an activity which would be very productive
for these GPs, only about 32 per cent undertake such activities, perhaps due to the scale of such
projects, the lack of financing, and the lack of technical expertise. Other infrastructure related
activities such as maintenance of dharamshalas, cattle sheds, ponds, slaughterhouses, parks, and
huts are generally not undertaken by GPs.
3.45 Table 3.09 shows the per cent of GPs in our sample engaged in activities related to
development functions. Over 55 per cent of all GPs are involved in some developmental activity,
with over 90 per cent undertaking activities to provide drinking water and promote education.
The 10 GPs in our sample in Nalanda seem most active, with at least 60 per cent of them
involved in a given development activity.
3.46 Table 3.10 shows the per cent of GPs in our sample engaged in maintenance related
activities. Over 70 per cent of GPs are involved in maintenance functions related to public roads,
drains, tanks, and wells, while maintenance of slaughter houses, garbage bins, huts, cattle sheds,

44
grazing lands, and dharamshalas are generally neglected. Proximity of the GP to the block
headquarters does not appear to have a clear influence on the probability that a GP will take-up
maintenance functions.

45
Summary
3.47 Chapter 3 provides a summary of the economic principles for making expenditure
assignments in a multi-tiered governmental system. On the basis of these principles, the chapter
evaluates the clarity and appropriateness of the expenditure assignments to the PRIs by the GoB.
Finally, this chapter provides statistics on the decision making arrangements and the various
activities undertaken by the GPs.
3.48 The fundamental economic principle which should guide the appropriate assignment of
functional responsibilities is the efficiency of markets and the private sector. In the case of
market failures due to public goods, externalities, and natural monopoly, these allocative
functions should be assigned to the lowest level of government consistent with heterogeneous
tastes, economies of scale, and spill-over benefits. Expenditure assignments should be clear and
insofar as possible exclusive to promote accountability. In the case of concurrent assignments
among two or more tiers of government, it is important to identify and assign sub-functions in a
clear and exclusive manner.
3.49 In making assignments to the PRIs, the State of Bihar is constrained by the 7th and 11th
Schedules of the Constitution. Some seemingly productive and commercial activities, such as
agriculture, land improvement, small scale industries, which are assigned to the PRIs by the 11th
Schedule would ordinarily be assigned to the private sector in a market economy. In the case of
overlapping functions among the Union, the states, and PRIs, clear assignments of responsibility
among these tiers are missing. It is crucial to provide adequate financial and human resources to
support the functions assigned to the PRIs in the activity mapping. Local self-governments also
should be given greater responsibility for hiring and procurement in the education and health
sectors. Taking due account of potential economies of scale and spillover benefits, the
assignment of research and development to ZPs and the control of epidemics and infectious
diseases to GPs seem inappropriate.

46

47
Chapter IV: Human and Physical Resources
4.01 This chapter describes the availability of human capital resources, such as the number of
employees, the extent of their training and education, and availability, condition, and use of
Panchayat Bhavans. This chapter also analyses whether such resources are adequate for
performing various responsibilities entrusted to the GPs. The evidence reported here is based on
responses to the GP survey.
Proximity of the GP headquarters to important centres
4.02 Proximity of a GP to the means of communication, transport, and commerce may
influence the ability of a GP to function effectively. Though we cannot assess the GPs use of
access to important centres, we assume that greater proximity improves the performance of the
GP, as it facilitates monitoring by the PS, and the Mukhiya and other GP functionaries do not
need to spend as much time travelling to the BDO; therefore, they may make more frequent trips
to visit the BDO and PS, which are generally housed in the same building.
4.03 Table 4.01 shows that GP headquarters within the 5 districts in our sample seem
reasonably well connected to important centres. On average GP headquarters are about 1-4 kms
from important centres, like pucca roads (average distance in our sample is 1 km), bus stops (2.6
kms), post offices (1 km), commercial banks (3.9 kms), high schools (3.2 kms), and public health
centres (1.9 kms). The distance from the GP headquarters to the block office is approximately 8
kms on average, with the range being 4.0 kms on average to 10.4 kms on average in Begusari
and Nalanda, respectively. In contrast, the GP headquarters are on average about 12.7 kms away
from a railway station and 13.1 kms from an urban centre. GP headquarters in Bhojpur and
Saharsa are more isolated than the GP headquarters in the other 3 districts in our sample.
Proximity of the GP headquarters to these centres is broadly similar across our sample of 50.
4.04 Table 4.02 shows that approximately 88 per cent of GP headquarters are within 8 kms of
a commercial bank. This is likely a testament to the policy of public sector banks pursuing
policies to improve rural services. While 60 per cent of GP headquarters are within 8 kms of

48
their block office, only 30 per cent of GP headquarters in the backward region of Saharsa lie
within that distance. This may adversely affect the monitoring efforts of PSs in more vulnerable
areas.
Availability, condition, and use of Panchayat Bhavan
4.05 Panchayat Bhavans are vital resources to GPs as they provide a designated space to hold
meetings, store documents, and plan and execute activities. Having a Panchayat Bhavan is likely
to create a sense of identity to GPs and lend an air of importance to their undertakings. Table
4.03 shows that a majority of the GPs in our sample have a Panchayat Bhavan, but 38 per cent do
not. While 80 per cent of the GPs in our sample of 10 in Begusarai have their own Bhavan, only
50 per cent of the GPs in our sample in Saharsa have one. It is interesting to note that the
percentage of GPs in our sample with Bhavans declines markedly when the distance to the block
headquarters exceeds 8 kms. More specifically, 36.4 per cent of the GPs in our sample that are
between 9 to 12 kms from the block headquarters have a Bhavan, and only a third of those more
than 12 kms have one. Finally, it is significant that 16 per cent of the GPs with a Bhavan report
that the Bhavan is not usable. This means that effectively, only 53 per cent of the GPs in our
have a usable Bhavan.
4.06 While it is important for a GP to have a Bhavan, the use to which it is put and its
condition are also important. There is wide variation in the use to which the Bhavan is put across
the 5 districts in our sample. Table 4.03 shows that all the Bhavans in Sitamarhi are used as a
Panchayat office, but only a third of the GPs in Bhojpur do so. The distance of the Bhavan from
the block headquarters appears to influence its use. More specifically, only 50 per cent of GPs
with a Bhavan use it as a Panchayat office when it is between 9 and 12 km from the block
headquarters; whereas 82 per cent of GPs within 0-4 kms of the block heardquarters with a
Bhavan use it as a Panchayat office.
4.07 Table 4.04 shows that the primary source of funds for Bhavan construction is the
government. More specifically, the government is the source of funds for the construction of the
Bhavan in slightly more than 90 per cent of the cases in our sample. The fact that nearly 50 per

49
cent of the GPs in our sample do not have a usable Bhavan may be attributable to the
government’s lack of funds. There does not appear to be any significant variation in the source of
construction funds according to the distance of the GP from the block headquarters.
4.08 Table 4.05 shows that the size of a GP office is rather small, having at most 2 rooms.
While 78 per cent of these offices have a roof in good condition; slightly less than half of them
possess a meeting hall or a toilet. These general conditions are consistent irrespective of the
proximity of the GP to the block headquarters.
4.09 Table 4.06 shows that GP offices on average have one table and almirah and about 9
chairs. There is not much variation in the furnishings of Bhavans among the districts or with
respect to proximity of the GP to the block headquarters. An overwhelming majority of the GPs
in our sample report that the furnishings of the Bhavan are inadequate. There is some variation
among the districts, with 50 per cent of GPs in Begusarai satisfied with their furniture while no
GP in Saharsa finds their furnishings adequate.
Human resources
4.10 Table 4.07 summarises the human resources of the PRIs, including their responsibilities
and terms of employment. GPs are assigned three functionaries, namely a Panchayt Sachiv, a
Panchayat Rozgar Sevak, and a Nyay Mitra. The Panchayat Sachiv is the Mukhiyas secretary or
assistant. The Rozgar Sevak officially works only on NREGA-related activities. The Nyay Mitra
attempts to settle legal disputes at the local level. There are no separate appointments for PSs; all
the work is done by the BDO. ZPs have their own human resources, with about 80-100
sanctioned posts, but there are many vacancies, ranging from 22 in Saharsa to 56 in Sitamarhi.
No level of PRI government has the autonomy to hire, promote, fire, or establish the rate of
remuneration of their staff. The rates of pay of PRI functionaries are low by any standard. Local
government autonomy may be enhanced if the PRIs were given greater human resource
management autonomy.

50
4.11 According to table 4.08, the functioning staffs for our sample of 50 GPs are rather small,
with an average of 4 employees. There is some variation across our sample of 5 districts, with
the sample of 10 GPs in Bhojpur employing on average about 3 people and the sample of GPs in
Sitamarhi employing more than 4.
4.12 Table 4.09 shows the average age, average length of service, and average number of GPs
served by GP employees in our sample of 50 GPs. The average age of the Panchayat Sachivs is
in the mid-40s, and the average number of GPs served by a Panchayat Sachive varies between
1.5 and 2.0. There is considerable variation in the average length of service. At the low end, the
average length of service is 3.8 years for our sample of 10 GPs in Begusarai, and at the high end,
the average length is 14.5 years in Bhojpur. The average age of the Rozgar Sevak and technical
assistants is quite a bit younger, with the average age being in the early 30s. They are quite new
to their jobs, with the average length of service being between 1 and 2 years. The Rozgar Sevaks
serve between 1 and 2 GPs on average. In contrast, the technical assistants serve, on average,
between 1.3 GPs in Nalanda and 11.9 GPs in Bhojpur. The average number of GPs served by the
technical assistants in our sample is 7.5 GPs. Turning to the Nyay Mitras, the average age is in
the mid-30s; the average length of service is between 1 and 2 years; and the average number of
GPs served is approximately 1 GP. It is reassuring that the Panchayat Sachivs are mature and
experienced, but they appear to be dividing their time between more than one GP which is not
ideal, given the importance of their role in the administration of GPs and as an assistant to the
Mukhiyas. It is also of considerable concern that the other GP employees have so little
experience. This may suggest a high rate of turnover in these positions. It is particularly
concerning that the technical assistants serve so many GPs.
4.13 Table 4.10 describes the education level of the GP employees. Nearly all of the Rozgar
Sevak, technical assistants, and Nyay Mitras are university graduates and above, which suggests
that they are well qualified for their jobs. More specifically, 84 per cent of the Rozgar Sevaks in
our sample are college graduates and above; 91.3 per cent of the technical assistants; and 93 per
cent of the Nyay Mitras. Ironically, the Panchayat Sachivs are not as well educated. In fact,
approximately one-third passed secondary school, one-third passed higher secondary school, and
one-third are graduates and above. There is some variation in the level of education of the

51
Panchayat Sachivs across the 5 districts in our sample. Nevertheless, these data suggest that the
Panchayat Sachivs are not as well educated as perhaps one would like them to be.
Responsibilities of the Mukhiya and GP employees
4.14 Having described the number and profile of GP employees, we turn now to a description
of their ‘actual’ responsibilities. In particular, we would like to know if there is a division of
labour between the Mukhiya and the GP employees. This will help us assess whether the
assignment of responsibilities between the Mukhiya and GP employees is appropriate, which is
the topic of this section. We begin by examining the distribution of responsibilities for activities
related to non-NREGA projects; then, we turn to a description of the distribution of
responsibilities for NREGA projects. We conclude this section with a description of the
assignment of administrative and quasi-judicial responsibilities.
4.15 Table 4.11 shows the distribution of responsibilities for activities related to non-NREGA
projects. There appears to be a clear division of labour. The Mukhiya and Rozgar Sevak working
as a team and the TA/AE assume responsibility for project planning and budgeting. In a few
cases, the Mukhiya or the Rozgar Sevak work independently on project planning and budgeting,
but this is rare. Programme Officers are not involved at all in this activity. In contrast, the
Programme Officer, which is a post created specifically for NREGA related activities, is engaged
in supervision of work as are the technical assistant and assistant engineer. In Nalanda, 50 per
cent of the Mukhiyas are engaged in supervising project work, but this does not occur in the
other districts in our sample. The Rozgar Sevak and Mukhiya working either as a team or
independently assume responsibility for maintaining records and accounts. The Programme
Officers, and only in a single instance a TA/AE is responsible for this activity.
4.16 Table 4.12 examines the effect of distance of the GP office from the block headquarters
on the division of labour on non-NREGA projects. According to the evidence in table 4.11,
distance from the block headquarters appears to have an important influence on whether the
TA/AEs are engaged in supervising non-NREGA projects. The per cent of TA/AEs engaged in
supervising non-NREGA projects declines from 53 per cent for GPs between 0 and 4 kms from

52
the block headquarters to 11 per cent for those more than 12 kms from the block headquarters. In
contrast, the engagement of Programme Officers supervising non-NREGA projects appears to
increase with distance. One would imagine that the quality and perhaps the timeliness of
completing projects benefit from supervision by TA/AE; therefore, the GoB may want to
consider ways to encourage TA/AEs to travel more frequently to more distant GPs to assist with
supervising their projects.
4.17 The NREGA guidelines provide information on the nature of the responsibilities
entrusted to the PRIs and their functionaries. GPs are responsible for project planning and
budgeting, and local vigilance committees are responsible for monitoring work. Programme
Officer is a post created specifically for NREGA. They work at the BDO office and are
responsible for NREGA-related programmes in all the GPs. The Programme Officer is entrusted
with responsibility for monitoring registration, job card issues, and other supervisory tasks.
Meanwhile, the Rozgar Sevak is required to maintain records regarding registration, job cards,
employment register, and so on. However, the guidelines are silent on which member of the GP
is required to undertake the responsibilities for project planning and budgeting and maintenance
of records and accounts.
4.18 Table 4.13 shows the distribution of responsibility for activities related to NREGA
projects. A significant proportion of GP employees seem to fulfil their assigned NREGA-related
responsibilities. While 64 per cent of TA/AE assumes responsibility for project planning and
budgeting; 90 per cent of Programme Officers supervise project work. The Rozgar Sevak
assumes primary responsibility for maintaining records and accounts. This division of labour is
broadly consistent with the NREGA guidelines, and the division of labour observed in the case
of non-NREGA projects.
4.19 Table 4.14 examines the effect of distance of the GP office from the block headquarters
on the division of labour reported above. Interestingly, this table shows that the likelihood of a
Programme Officer assuming responsibility for supervision of work increases with the distance
from the GP office to the block headquarters; whereas, the engagement of the TA/AEs in
supervision declines with distance. It is not clear whether Programme Officers are substituting

53
for the effort of TA/AEs in the case of more distant GPs. It is also not clear whether the expertise
of Programme Officers is an adequate substitute for TA/AEs. Given the importance of technical
supervision of projects by qualified experts, this pattern probably merits further investigation in
the case of both NREGA and non-NREGA projects.
4.20 Table 4.15 shows the distribution of administrative and quasi-judicial responsibilities.
Again, there is a clear division of labour between the Mukhiya, Panchayat Sachiv, and Sarpanch.
Regarding the responsibility for general administration, in 46 per cent of the GPs in our sample
the Mukhiya assumes primary responsibility for this activity and in 54 per cent of the GPs the
Mukhiya and Panchayat Sachiv collaborate or work jointly on this activity. The Panchayat
Sachiv has no independent role in general administration. In 78 per cent of the GPs in our
sample, the Panchayat Sachiv assumes independent responsibility for preparing the agenda and
minutes of GP meetings. There is 1 GP in which the Mukhiya assumes independent
responsibility for this activity and in 20 per cent of the cases the Mukhiya and Sachiv assume
joint responsibility for this activity. In the case of preparing the annual plan, the Mukhiya
assumes independent responsibility for this activity in 40 per cent of the GPs in the sample, and
in the remaining GPs, the Mukhiya and Sachiv assume joint responsibility for this activity.
Finally, the Sarpanch assumes independent responsibility for quasi-judicial functions in 20 per
cent of the GPs in our sample; the Mukhiya assumes independent responsibility in 4 per cent of
the GPs; and they collaborate in 76 per cent of the GPs. Interestingly, while the de jure quasi-
judicial responsibility rests with the Sarparchs, in practice the responsibility for quasi-judicial
functions is shared by the Sarpanchs and Mukhiyas in 76 per cent of the cases in our sample.
Training of elected officials and GP employees
4.21 Tables 4.16 and 4.17 show the extent and type of training received by elected GP
members, specifically Mukhiyas (table 4.16), Ward members (table 4.17), Sarpanchs (table
4.17), and Panchs (table 4.17). Elected Ward members spend significantly fewer days in training
than their employees. Among the elected officials, the Mukhiyas attend the largest number of
training programmes and more days in training. Almost all Mukhiyas attend a wide variety of
training programmes which is consistent with the broad range of duties that they are expected to

54
perform on behalf of a GP. While male and female Mukhiyas attend a similar number of training
programmes, male Mukhiyas spend 3 days more in training than females. Mukhiyas from more
backward castes appear to receive the least amount of training. However, distance from the GP
office to the block headquarters does not seem to affect the amount of training received by
elected officials. Approximately 9 Ward members attend at least one training programme per
year and about 8 members attend all available training programmes.
4.22 Tables 4.18 through 4.21 provide information on the extent of training received by GP
employees. Most of the employees have attended 1-3 training sessions on average, with technical
assistants attending the most. While Sachivs on average spend about 50 days in training, Nyay
Mitras spend less than 3. Begusarai and Nalanda’s Nyay Mitras have not attended any training
programmes. Interestingly, while the number of training programmes attended somewhat
diminishes with distance from block headquarters, this is counteracted by the fact that they spend
more days in training. Sachivs receive the most training, with over 90 per cent attending training
programmes on general administration, financial administration, and project implementation.
Given the very limited involvement of Sachivs in project administration reported above, one
wonders if such training for Sachivs is productive. Less than 25 per cent of Nyay Mitras attend
training programmes. Employees in the backward district of Sitamarhi seem to receive the least
amount of training. Since Nyay Mitras have quasi-judicial responsibilities, it may be desirable to
provide them with more training. This assumes of course that the relatively low level of training
among Nyay Mitras relative to other positions reflects a lack of opportunity for training rather
than a low take up rate, perhaps due their already high level of education or due to family
obligations. These data suggest that the GoB may want to devise schemes to encourage
backward caste officials and officials from more distant GPs to receive more training.
Does the attributes of the Mukhiya influence the number of activities taken-up?
4.23 We have described in some detail the demographic profile of the Mukhiyas in our
sample, including their gender, education, caste and religion, and number of terms served. In
addition, we have described the physical proximity of the GP headquarters to the block
headquarters as well as the availability of a Panchayat Bhavan. The question then arises whether

55
any of this matter in terms of an observable or measurable difference in the quality of
governance. Using simple cross tabulations, we examine the influence of these attributes on the
number of activities undertaken by a GP. This is admittedly a crude measure of the quality of
governance, but it seems like a good place to start. If there is further interest in this topic, then
more detailed and sophisticated statistical analysis could be undertaken. However, it is important
to keep in mind that the analysis is limited by the small size of our sample.
4.25 Table 4.22 shows the relationship between the education of the Mukhiya and the number
and type of activities taken-up by the 50 GPs in our sample. Mukhiyas that passed higher
secondary school or above take-up a larger number of production related, infrastructure related,
and development related activities. However, the difference is not particularly strong. The impact
of education is especially evident in the case of production related activities, where GPs led by
well educated Mukhiyas take-up 2.1 projects on average as opposed to a take-up rate of 1.2
projects in the case of less educated Mukhiyas. Having said this, we do not have information on
the timeliness or quality of these projects. Again, given the small size of our sample, these results
should be viewed with caution, particularly because the effect does not appear to be substantial.
4.26 Table 4.23 shows the relationship between the number and type of activities and the
number of terms served by the Mukhiya. While very few Mukhiyas in our sample have served
more than one term, longer serving Mukhiyas do not appear to take-up more activities. In fact, in
Begusarai, where 40 per cent of Mukhiyas have served more than one term, the longer serving
Mukhiyas take-up fewer production and infrastructure related activities than their first-term
counterparts.
4.27 Table 4.24 shows the relationship between the number and type of activities taken-up and
the distance of the GP headquarters from the block headquarters. Though GPs further away from
the block headquarters tend to undertake fewer production and development related activities,
this pattern is not consistent across the districts, though the differences are not large.
Interestingly, while 70 per cent of GPs in Saharsa are more than 8 kilometres away from the
block headquarters, they are marginally more likely to undertake a greater number of activities
than GPs closer to the block headquarters. Again, there simply does not appear to be compelling

56
evidence that distance of the GP from the block headquarters has an influence on the number or
type of activities taken-up by a GP.
4.28 Finally, table 4.25 shows the relationship between the availability of a Bhavan and the
number and type of activities taken-up by the GPs in our sample. Interestingly, the number and
type of activities taken-up by a GP do not appear to be influenced by the availability of a
Panchayat Bhavan, at least in our sample. In fact, GPs that do not have a Bhavan take-up slightly
more development related activities. These findings should be viewed with caution due to the
small size of our sample.
Capacity of the SFC, DoF, and PRI Department to collect and analyse PRI finance data
4.29 Based on interviews with a member of the SFC and the former director of the DoPR, the
GoB does not have any staff dedicated to studying PRI finances, and there is a lack of data on
PRI finances. In short, the SFC, DoF, and DoPR do not have the analytical capacity to examine
PRI finances. Either the DoF or the PRI Department should create a fiscal cell dedicated to
studying PRI finances. The GoB should strive to create the analytical capacity and data
infrastructure necessary to make informed policy decisions. This would lead to improved
decision-making and better economic and development policies.
Summary
4.30 Chapter 4 describes the physical and human capital resources of the GPs, and the lack of
capacity of the SFC, DoF, and PRI Department to conduct analysis of PRI finances. While
physical features such as proximity to block headquarters and use of Panchayat Bhavan as an
office do not seem to affect the number of activities undertaken by GPs, human resource
attributes such as the education of the Mukhiyas appear to have a positive effect on the take-up
of activities. While most GPs report inadequate furniture for their Bhavans, GPs in Begusarai
who are generally satisfied with their furniture, also undertake more activities on average than
the GPs in the other sample districts. So improving the quantity and quality of furniture may
facilitate GPs in taking-up more activities. About 8 GPs within a district share the services of a

57
technical assistant. Since we identify this employee as the one responsible for project planning,
budgeting, and supervising project work in a majority of GPs, the fact that several GPs may rely
on the same person to perform these activities may adversely affect the quality of this important
work. Regarding the PRIs’ human resource management autonomy, no tier of PRI government
has the autonomy to hire, promote, fire, or establish remuneration. PRIs may be more effective if
they have the autonomy and resources to hire, promote, fire, and establish remunation of their
personnel. Finally, there is evidence that Mukhiyas are circumventing the democratic procedures
for collective grassroots decision-making and directing scarce resources disproportionally to
benefit their own village. This suggests that social accountability mechanisms may need to be
strengthened or more closely adhered to by elected officials.

58
Chapter V: Analysis of Expenditures
5.01 This chapter reports evidence from the Bihar PRI survey on expenditures by the 50 GPs
in our sample. The reported expenditures are principally financed by five schemes: Indira Awas
Yojana (IAY), Kanya Vivah Yojana (KVY), Total Sanitation Campaign (TSC), Old-Age
Pension Scheme (OAP), Laxmibai Pension Yojana (LPY), and Pension of Handicapped Scheme
(POH). Generally speaking, these are income-support programmes administered by the PRIs. We
also describe the expenditure priorities financed by FC-12, NREGA, and BRGF which are ear-
marked for development projects. Finally, the GPs do not have any recurrent expenditure; their
expenditures are either transfer payments or capital expenditures. As we report in the next
chapter on revenues, none of the 50 GPs in the sample raise own revenues; therefore, they are
completely transfer dependent. Furthermore, GP ‘revenues’ are allocations. This practise
constrains the fiscal autonomy of the GPs.
Gram Panchayat Expenditure Priorities
5.02 Table 5.01 shows that the average number of programmes per GP and average
expenditure per programme increased from FY 2006-07 to FY 2008-09. More specifically, the
average number of programmes in FY 2006-07 was 11.2 per GP which increased to 16.6 per GP
in 2008-09. Similarly, the average expenditure per GP increased from Rs. 14,600 in FY 2006-07
to Rs. 22,300 in FY 2008-09. During the same period, the average expenditure by the GPs in our
sample increased from Rs. 67.3 per capita in FY 2006-07 to Rs. 96.4 per capita in FY 2008-09,
an increase of 12.7 per cent per annum during this 3 year period. However, these averages mask
considerable variation during this period across the 5 sample districts. Focusing on the rate of
annual increase in average expenditures per capita, it increased by 21.4 per cent per annum in
Bhojpur. In Nalanda, the annual rate actually decreased by 19 per cent per annum. The per
annum rates of growth for Begusarai, Saharsa, and Sitamarhi are 4.6 per cent, 56.6 per cent, and
-0.2 per cent, respectively. Ironically, the disparities in the annual growth rates reduced the
coefficient of variation of average per capita expenditures across the 5 districts from 63 in FY
2006-07 to 33 in FY 2008-09.

59
5.03 Table 5.02 shows average expenditures per GP and average expenditures per capita for 6
important schemes for the same period. The average expenditure per GP and average expenditure
per capita for 50 GPs and for all 6 schemes increased by approximately 152 per cent per annum
over this 3 year period. As a result, the share of these 6 schemes in total expenditures increased
from 30.2 per cent in FY 2006-07 to 73.7 per cent in FY 2008-09. Although the Laxmibai
Pension Yojana showed dramatic growth during this period, the initial base was small.
Therefore, the increase in importance of these 6 schemes is driven in our sample primarily by
growth in the Old-Age Pension Scheme (58.4 per cent per annum), followed closely by growth
in the Total Sanitation Scheme (52.7 per cent per annum) and growth in the Laxmibai Pension
Yojana (42.6 per cent per annum). Interestingly, the average total outlay for these 6 schemes
across the 5 districts in FY 2008-09 is broadly similar, between Rs. 8,75,000 and Rs. 8,96,000,
with the exception of Sitamarhi where the corresponding figure is less than half as much (Rs.
4,31,000). While the Indira Awas Yojana and Old-Age Pension Scheme are taken-up in every
district, the other programmes are not. In fact, the GPs in our sample in the backward district of
Sitamarhi do not take-up any of the other 4 schemes. It would be interesting to know the reasons
for this.
5.04 Table 5.03 and 5.04 show the average number of people recommended and benefitted by
GP for these 6 schemes, by district. As one would expect, the number of people recommended
for most schemes is greater than the number who benefit, but this pattern is reversed in case of
the IYA and OPA schemes. This is because the BDO is actually making the decision who shall
benefit from a scheme independently of the recommendations by the GPs. It is interesting to note
that although the sampled GPs in the district of Sitamarhi identify potential beneficiaries for
nearly every scheme, with the single exception of the TSC, there are no beneficiaries for the
Kanya Vivah Yojana, Laxmibai Pension Yojana, or the Pension for Handicapped Scheme.
5.05 Development expenditures, i.e. those financed by FC-12, NREGA, and BRGF funds
constitute the lion’s share of GP expenditures on projects as opposed to income support
programmes. The other large component, teacher salaries is merely routed through the GPs.
Table 5.05 shows that the average and per capita expenditures on main projects has almost

60
doubled between FY 2006-07 and FY 2008-09. However, this pattern is not consistent across all
5 sample districts. While these items have seen an almost fivefold increase in Saharsa, from Rs.
56,800 in FY 2006-07 to Rs. 2,56,300 in FY 2008-09, they have gradually declined in Nalanda,
from Rs. 1,30,000 to Rs. 99,000, respectively. It would be interesting to know the reason behind
these large disparities in expenditures per capita on main projects. The average and per capita
expenditures on other projects is rather small by comparison, pointing to the importance of
gaining a better understanding of what is going on with main projects. Interestingly, while all
districts experienced a decline in expenditures in FY 2009 relative to the previous year,
expenditures on other projects in Nalanda increased. It may be that the sampled GPs in Nalanda
are substituting one type of project for another. Salaries for teachers constitute a large share of
GP expenditures, though again these funds are merely routed through the GPs.
5.07 Tables 5.06 through 5.08 decompose FC-12, NREGA, and BRGF supported expenditures
into expenditures on particular activities, specifically expenditures on solar and vapour lights,
drinking water, road works, building works, irrigation works, and sanitation work. It should be
noted that there are slight discrepancies in the amounts received and utilised with these funds.
Generally, FC-12 funds are mostly used on solar and vapour lights and drinking water. Not
surprisingly given that NREGA funds must be used on labour intensive projects, these funds are
used primarily for road works (construction, and repair). BRGF funds are used mainly for the
construction and repair of buildings. There is variation among the districts in the manner in
which they utilise funds on different projects, reflecting perhaps the preferences of the Mukhiya
or the demands of the residents. For example, the sampled GPs in Bhojpur use a significant
proportion of their FC-12 funds for sanitation and road construction; almost half of their NREGA
funds are used for new irrigation projects and repairs; and it uses BRGF funds to finance solar
and vapour lights. Interestingly, the listed activities are all under taken throughout the three year
period of this study. This means that GPs are undertaking all decentralised activities, but they are
financing them from different sources of funds across the years.
5.08 Most of the Mukhiyas reported that the programmes are chosen to meet the needs of the
people; some GPs also elaborated on their answers. The GPs are seen to be particularly
responsive to three needs: roads, primary education, and drinking water. When deciding on

61
programmes, special consideration is reportedly given to the needs of the relatively more
backward villages and marginalised sections of society, such as the scheduled castes/tribes and
Muslims. Programmes that encourage environmental protection and uses of non-conventional
sources of energy are also popular. Though employment generation is an obvious consideration
for NREGA programmes, it is also an important concern for programmes funded by other
sources, too. Finally, certain programmes are reportedly chosen to utilise all the funds that were
allocated to GPs by the end of the fiscal year.
5.09 Table 5.09 summarises the difficulties reported by the Sachivs and Mukhiyas with
implementing projects. We have grouped these difficulties into five broad categories:
administrative reasons, economic reasons, social reasons, and corruption-related reasons. The
most frequently reported difficulty is the unavailability of land or its encroachment by the rural
elite. Unrealistically low prices in government manuals, a cumbersome system of bank
payments, and lack of social cohesion in the GP are also frequently reported difficulties. In
addition, demand by government officials for payment of bribes also is high on the list of
difficulties. However, official restrictions on the choice of programme expenditures is mentioned
only twice out of 78 responses as a difficulty. It, thus, appears that autonomy in the choice of
programmes is not perceived to be a major problem.
5.10 Finally, there are no separate administrative or recurring expenditures by GPs and PSs in
our sample. Recurrent expenditures by ZPs in our sample, except for Bhojpur, are summarised in
table 5.10.
Summary
5.11 Chapter 5 discusses the expenditure priorities of the 50 sampled GPs. GP expenditures
on income support are basically financed by the following six schemes: Indira Awas Yojana
(IAY), Kanya Vivah Yojana (KVY), Total Sanitation Campaign (TSC), Old-Age Pension
Scheme (OAP), Laxmibai Pension Yojana (LPY), and Pension of Handicapped Scheme (POH).
Between FY 2006-07 and 2008-09 the average expenditure per GP increased by 12.7 per cent per
annum. However, this increase was not uniform across the GPs in our sample; some GPs, in fact,

62
experienced much higher growth than others. The tables show that there is a significant
difference between the number recommended for benefits and the actual number benefitted.
Based on informal conversations with Mukhiyas, it is our understanding that BDO officials make
the decision regarding who will receive benefits under these 6 programmes. Capital expenditures
are primarily financed by 3 programmes: FC-123, NREGA, and BRGF. The priority
expenditures are roads, primary education, and drinking water. When interviewed, the Mukhiyas
stated that there was extra attention given to the most impoverished communities, but that
implementing these projects was difficult in all areas due to the unavailability of land or its
encroachment by the rural elite. Furthermore, the GPs faced difficulties in establishing priorities
due to a lack of social cohesion and the need for frequent payment of bribes.

63
Chapter VI: Analysis of Revenues
6.01 The PRIs do not receive any revenue; they only receive allocations. Table 6.01 shows
the total allocations received from FC-12, NREGA, and BRGF, by district and year. In addition,
figures 6.01 - 6.03 are pie-charts that show the composition of the total allocations, by year.
Devolution of funds to PRIs
6.02 As we show below, allocations from the Twelfth Finance Commission (FC-12), National
Rural Employment Guarantee Act (NREGA), and the Backward Regions Grant Fund (BRGF)
are the most important sources of GP revenues. We begin by explaining each of these
programmes. Then, we provide evidence on the amount of funds transferred to the GPs in our
sample by source of funds based on evidence for the PRI Survey data. We conclude with a
summary of the Mukhiya’s opinion of the adequacy of transfers and favoured major tax heads.
However, an important finding of this study is that no GP in our sample collects any revenue
from own revenues. The Mukhiyas explain that they are unable to levy own taxes, despite the
revenue assignments provided in the Bihar Panchayati Raj Ordinance, 2006 because the
Government of Bihar has not issued supporting regulations, on, for example, the permitted rates
of tax.
Twelfth Finance Commission
6.03 PRI funds, as recommended by the Twelfth Finance Commission (henceforth FC-12), is
transferred to the GoB by the central government. The state government distributes the sums to
the ZP, PS, and GP in the ratios 2:6:92, respectively. In other words, the overwhelming majority
of the FC-12 allocations go to the GPs, reflecting the Union’s policy of strengthening the tier of
local self government that is closest to the people. The allocated sums are sent directly to the
ZPs, PSs, and GPs, within 15 days of the sum being credited to the state's account. The
allocations among the ZPs, PSs, and GPs are made in proportion to their respective populations.

64
National Rural Employment Guarantee Act
6.04 The central government accounts for 90 per cent of the NREGA funds while the
remaining 10 per cent is provided by the state government. The state government divides the
total allocation under NREGA among the ZPs, PSs, and GPs in the ratios of 50:30:20,
respectively. Since NREGA is a rights-based programme, there is no pre-determined budget.
Initially, each unit is provided with a prescribed amount, and then reimbursed the remainder on
the basis of utilisation certificates submitted by the Panchayats. The Disbursement Officer
(DDO) for NREGA funds is the ZP’s District Engineer; the Programme Officer for the PS; and
the Mukhiya in case of the GPs. As discussed in greater detail below, the Mukhiyas report that
NREGA funds are not adequate. This is ironic because this is a demand-driven programme;
therefore, it is not clear why they report these funds as inadequate.
Backward Regions Grant Fund
6.05 The BRGF is entirely supported by the central government. In Bihar, all districts (37)
with the exception of Siwan are recipients of BRGF transfers. Each year, every district receives a
fixed minimum amount of Rs. 10 crore. Thereafter, 50 per cent of the remaining sum is allocated
among the districts on the basis of their share in total population (2001 census), and the
remaining 50 per cent of the sum is distributed on the basis of district’s land area.
6.06 The total funds are first transferred by the central government to the District Rural
Development Authority (DRDA). In turn, the District Development Commissioner (DDC), who
is the Chief Executive Officer (CEO) of the DRDA, then distributes the funds to the PSs and
GPs. The amount transferred to a Panchayat unit is determined by the proportion of their
population in the total population.

65
Amounts of GP revenues by source
6.07 The main sources of revenue for the PRIs include grants and transfers from the state and
central governments, including the State Finance Commission, Union Finance Commission, and
Centrally Sponsored Schemes (CSS). Importantly, no GP in our sample reported raising own
revenues. The reason given by Panchayat officials for not raising own revenues is the failure of
the state to issue the necessary implementing regulations, such as allowable rates of tax.
6.08 Table 6.02 shows that the average amount of revenue received by GPs from FC-12 has
declined modestly over the 3 year period from 2006-07 to 2008-09; consequently, the per capita
amounts have declined modestly, as well. Across districts however, we find that the 10 GPs in
Begusarai in our sample received a 13.1 per cent increase per annum in average FC-12 transfers
per GP during the 3 year period under study. In contrast, the sample average FC-12 transfers for
the 10 GPs in Bhojpur declined by 9.7 per cent per annum during the same period.
6.09 Interestingly, the difference between the minimum and maximum average amount
received by GPs for our sample of 5 districts is about Rs. 66,000 in FY 2006-07 and Rs. 108,000
in FY 2008-09. This suggests that there are growing disparities in the FC-12 transfers to the GPs
in our sample. Table 6.03 confirms this impression. The coefficient of variation of per capita
allocations among the 50 GPs in our sample has increased from 39.8 to 54.3 during the 3 year
study period.4 This overall trend across the 50 GPs in our sample masks considerable variation in
these trends among the GPs within the 5 districts in our sample. More specifically, The CV of
per capita allocations is decreasing throughout the period among the sample GPs in Bhojpur and
has an inverted U-shape in Sitamarhi. In short, not only are total FC-12 allocations per GP
declining during the study period, the disparities in transfers is increasing. If these revenue trends
continue, this may have implications over time for rural development in the State of Bihar.
4 The coefficient of variation (CV) is the conventional measure of fiscal disparities used in the empirical literature on fiscal decentralisation. The CV is given by the following formula: CV = (standard deviation ÷ average) × 100.

66
6.10 Turning to NREGA revenues, table 6.04 shows that the average and per capita NREGA
revenues dramatically increased during the 3 study period, from Rs. 29.3 per capita in FY 2006-
07 to Rs. 78.6 in FY 2008-09. This is an average growth rate of 38.9 per cent per annum.
However, this dramatic growth rate does not reflect a positive growth rate in per capita transfers
across the 5 sample districts. Sasharsa’s average growth rate of per capita revenues was 207 per
cent per annum; an average per annum growth rate among the smapled GPs in Bhojpur of 70.0
per cent per annum is by comparison rather more modest. The average annual growth rates for
Nalanda, Begusarai, and Sitamarhi are -3.9 per cent, 49.8 per cent, and 37.9 per cent,
respectively.
6.11 Table 6.05 shows the CV for NREGA revenues. The CV of per capita NREGA
allocations for the 50 GPs in our sample declined during the study period, from 126.6 in FY
2006-07 to a still substantial 77 in FY 2008-09. Again, this declining trend for the sample as a
whole masks the variety of trends among the 5 sample districts. For example, the CV of per
capita allocations is increasing among the 10 sample GPs in Sitamarhi, from 80.7 to 137.7. In
other words, not only are the GPs in the backward district of Sitamarhi subject to decreasing
average and per capita NREGA allocations but also to an increasing dispersion in per capita
allocations among the GPs. This may imply a highly unequal individual take-up rate among the
GPs in Sitamarhi which may reflect leadership issues in some GPs. This certainly bears further
investigation.
6.12 Now, we turn to an analysis of BRGF revenues received by the 50 GPs in our sample.
Average per capita allocations increased from Rs. 14.8 in FY 2007-08 to Rs. 36.2 in FY 2008-09
which reflects a growth rate of 144.6 per cent between FY 2007-08 and FY 2008-09. Again,
there is considerable variation in the growth rates in per capita transfer among GPs in the 5
sample districts. More specifically, the sample GPs in Nalanda experienced hardly any growth in
per capita allocation, with a growth rate of 0.7 per cent. In contrast, the growth rates for Bhojpur,
Begusarai, Saharsa, and Sitamarhi are 166.9 per cent, 980.0 per cent, 355.4 per cent, and 45.9 per
cent, respectively.

67
6.13 Table 6.07 shows that CV for per capita BRGF allocations among the 50 GPs in our
sample decreased substantially from 162.8 in FY 2006-07 to 76.0 in FY 2008-09. This pattern of
a declining CV is also reflected in the trend for Bhojpur, Begusarai, Saharsa, and Sitamarhi. In
contrast, the CV is increasing in Nalanda. Of course, we only have two years of data, so we
should not make too much of such trends.
6.14 Aggregate allocations for the 50 GPs in our sample have increased during the study
period, although there is considerable variation in the experiences among the 5 sample districts.
A potentially troubling aspect of these trends is the growing inequality in allocation in some
districts which may result in uneven development among the GPs in Bihar. NREGA and BRGF
funds seem more amenable to manipulation with these allocations varying according to the caste
and gender of the Mukhiya in our sample. Does the influence of the attributes of the Mukhiya
reflect discrimination by officials, superior advocacy by the Mukhiyas, or simple sampling error?
Such patterns deserve further investigation.
Mukhiya’s evaluation of the adequacy of transfers and favourability of major tax heads
6.15 Table 6.08 shows the Mukhiya’s opinion of the adequacy of transfers by source. While
Mukhiyas are almost unanimous in their opinion regarding the inadequacy of funds from the FC-
12, 16 and 6 per cent of them, respectively, rate NREGA and BRGF funds adequate.
Interestingly, 30 per cent of Mukhiyas in Begusarai opine that NREGA funds are adequate
though GPs there on an average received a little less than the average amount received by all
districts in all three years. In fact, 84 per cent of the Mukhiyas rate NREGA transfers as either
inadequate or very inadequate. As previously noted, this is particularly ironic because NREGA is
a demand driven programme.
6.16 Though the PRI Act provides for collection of own taxes by a GP, no GP in the sample
reports having done so. The main reason provided by the GPs for not levying own taxes is the
failure of the GoB to issue the necessary implementing regulations, such as the allowable rates of
tax. It is the opinion of the Mukhiyas that a provision is the law alone is not sufficient to levy
taxes; they require an official circular from the state government authorising them to do so. The

68
DoPR does not have any explanation for not having issued guidelines on collection of local
taxes. It appears that they are too busy with the allocation exercises under FC12 and BRGF;
NREGA allocations come from DRD. Regarding the DoPR’s future plans to issue the necessary
guidelines, they maintain that ‘they will come’, without specifying a time frame.
6.17 Table 6.09 shows the most favoured tax heads. In the opinion of the Mukhiyas in our
sample, a tax on fisheries is the most favoured tax head, which is preferred by 16 per cent. The
second and third most favoured heads are the taxes on Melas and land revenues. These choices
suggest that the Mukhiyas in our sample would prefer to levy taxes that are generally borne by
the more affluent or perhaps capable of being exported to non-residents.
6.18 As regards the predictability of distributions by FC-12, NREGA, and BRGF, this can be
evaluated by the timing of funds. Funds do not necessarily have to be transferred in amounts of
25 percent of the total by quarter. Nearly any timing of quarterly distributions can be
satisfactory, as long as it is predictable. Tables 6.10 - 6.12 show the timing of FC-12, NREGA,
and BRGF distributions, respectively, by year and district. The patterns, such as they are, appear
to be highly irregular by quarter, year, and district. The predictability of BRGF distributions
seems to be the most irregular of the three. This lack of predictability can create problems for the
planning and budgeting of GPs.
Panchayat Samiti finances
6.19 Table 6.13 shows the average number of development programmes, the total expenditure
on development programmes, and the average expenditure on development programmes,
undertaken by the 10 PSs in our sample by district and year. The average number of
development programmes undertaken by our sample of 10 PSs increases from 23.8 programmes
in 2006-07, to 39.7 programmes in 2007-08, and by 2008-09 reaches 59 programmes. This
pattern appears to reflect the substantial increase in development programmes undertaken by
Sitamarhi during this three year period. Total expenditures on development programmes
increased significantly from Rs. 1.8 million to Rs. 7.7 million between 2006-07 and 2007-08,
respectively. In particular, total expenditures in Sitamarhi increased throughout the three year

69
period. The pattern for average expenditures per development programme is rather complex, but
average expenditures per programme is generally increasing between 2006-07 and 2007-08 and
then decreases between 2007-08 and 2008-09.
6.20 Tables 6.14 through 6.16 show the timeliness of distributions to the PSs from FC-12,
NREGA, and BRGF, respectively. Generally speaking, the pattern of distributions appears to be
very irregular. This may create problems for planning and budgeting by PSs, unless they are told
well in advance by the Union government, BDO, and/or state government when they should
expect to receive distributions under these programmes and in what amounts.
Zilla Parishad finances
6.21 Table 6.17 shows the average number of development programmes, the total expenditure
on development programmes, and the average expenditure on development programmes,
undertaken by the 5 ZPs in our sample, by district and year. The average number of development
programmes increases from 45 programmes in 2006-07, to 89 programmes in 2007-08, and in
2008-09 reaches 150. However, this increase in the average number of programmes masks
considerable heterogeneity among the 5 districts in our sample. Forr example, the number of
programmes in Bhojpur increases sharply from 3 programmes in 2006-07 to 422 in 2008-09. In
contrast, the average number in Nalanda first decreases from 169 to 108 between 2006-07 and
2007-08 and then increases to 144 in 2008-09. In terms of average expenditure on all
development programmes, there is a substantial increase during this period, from Rs. 8.1 million
in 2006-07 to Rs. 172.3 million in 2008-09. A similar increasing trend in average expenditure per
programme is exhibited in our data during this period.
6.22 Tables 6.18 through 6.20 show the timeliness of distributions to the ZPs from FC-12,
NREGA, and BRGF, respectively. Generally speaking, the pattern of distributions appears to be
very irregular. This may create problems for planning and budgeting by ZPs, unless they are told
well in advance by the Union government, BDO, and/or state government when they should
expect to receive distributions under these programmes and in what amounts.

70
6.23 From our sample, we could not find any evidence of revenue effort by PSs. However,
ZPs do raise some own revenues, though not from taxes but rather from rent for shops on public
land, ferry arrangements, rent for land where fairs are held, and so on. Of the 5 ZPs, only two are
able to provide information on their own revenue collections. This information is summarised in
table 6.21.

71
Summary
6.24 Chapter 6 analyses the revenue sources of the GPs, based on information gathered
through the Bihar PRI survey. Perhaps most importantly, we find that none of the GPs raise own
revenue. Therefore, they are entirely dependent upon government transfers from three main
sources to finance development projects, namely FC-12 allocations, NREGA allocations, and
BRGF allocations. This chapter also describes the sources of these transfers in addition to
summarising the barriers that Mukhiyas claim prevent them from raising own revenue, namely
the falure to date of the GoB to issue enabling regulations regarding permitted tax rates. Finally,
this chapter describes each of the three revenue sources in detail. The three main sources of
allocations come from the Union government, and there is some concern that NREGA and
BRGF funds are vulnerable to manipulation. When asked about ways for GPs to raise own
revenues, the sampled Mukhiyas favoured a variety of taxes on the most affluent members of
their communities. It appears that the timing of distributions by FC-12, NREGA, and particularly
BRGF is highly irregular and unpredictable which can create problems for planning and
budgeting by GPs.

72
Chapter VII: Description and Performance of the Accountability System
7.01 This chapter reviews the de jure accountability system for PRI finances and the
compliance of the GPs with this system, based on evidence from the PRI Survey and audit
reports by the CAG.
A brief description of the accountability system
7.02 Articles 29, 57, and 84 of the BPRO, 2006 state that each GP, PS, and ZP are required to
prepare a budget of estimated receipts and disbursements for the following fiscal year. This
budget is then required to be approved by a majority of the GP members present at the meeting.
The quorum for the meeting should not be less than 50 per cent of total members. Articles 58 and
85 of the BPRO, 2006 require that each ZP and PS maintain accounts as prescribed. Article 30 of
the BPRO, 2006 mandates the maintenance of income and expenditure accounts by each GP.
7.03 Regular audits of the accounts of the GPs, PSs, and ZPs are to be undertaken by an
authority prescribed by the government and copies of the audit reports are to be sent to the
audited PRIs. The PRIs are then required to correct any defects or irregularities found in the
audit reports and provide clarifications regarding them to the authority carrying out the audit.
Apart from the usual audit mentioned previously, the PRIs may also be subject to concurrent or
special audit. It is important to point out that the DoF does not audit the PRIs.
Performance of the accountability system
7.04 The Reports of the Examiner of Local Accounts prepared for the Comptroller and Auditor
General of India provide information on the status of PRI accounting, audit arrangements, and
budget control systems. The report published in 2006 concludes that standard budget and
accounting formats prepared by CAG were generally not operationalised by the PRIs, and the
budgeting and financial accounting mechanism were deficient and deviated from the form
prescribed by the Bihar Panchayati Raj Act 1993 and Bihar Panchayat Samitis and Zilla

73
Parishads Budgets and Accounts Rules, 1964.5 The report concludes that PRIs in general do not
maintain annual accounts, receipts and payment accounts, and registers. So, it is difficult to
ascertain an overall picture of a PRI’s financial situation. The reports also uncovers the use of
many cash books, submission of incorrect utilisation certificates, and advances to executing
agents which were not covered by the rules. Budgetary controls are not exercised as the GPs and
PSs generally do not prepare budget documents while the same is also true in the case of two
ZPs. Similar findings with respect to usage of multiple cash books and lack of annual accounts
and budgets are noted in the 2007 report.6 The report also notes that at least 5 ZPs prepared
unrealistic budget estimates. The BPRO, 2006 mandates the creation of a Finance, Planning, and
Audit Committee by the PRIs, the 2007 report notes that only 40 of the 569 PRIs reviewed have
formed such a committee. This report also finds that devolved 10th and 11th Finance Commission
funds were left unutilised, and the failure by the GPs to prepare annual accounts made it difficult
to ascertain the quanta of expenditures on education, health, and other services.
7.05 The PSs and GPs also do not undertake the preparation of annual action plans as
mandated by the SGRY scheme. Assets and employment registers, completion certificates, and
work orders are not maintained, while muster rolls are certified by executing agents and not
elected PRI members. These lapses make it impossible to estimate employment generated by the
scheme and provide justifications for executed works. Other problems noted are incorrect
information on employment generated, misreporting by ZPs on works completed, doubtful
muster rolls, excess payments for labourers, wastage of expenditures due to abandonment of
works, and non-confirmation of wages-to-materials ratio prescribed in the SGRY guidelines. The
possibility of misappropriation of SGRY funds are noted in the 2007 report. Major lapses in
revenue management, irregularities in execution of works, excess payment, execution of the
same work by PSs and GPs, non-release of SGRY funds, and wasteful expenditures are items
highlighted in the 2007 report.
7.06 The completion rate of various schemes is about 56 per cent, across all PRIs. Lack of
effective supervision and control by the prescribed authorities (i.e., Mukhiya, DDC, CEO, BDO,
5 This report contains audits of 8 ZPs, 69 PSs and 510 GPs covering the period FY 2002to FY 2005. 6 Thie 2007 report is based on audits of 12 ZPs, 65 PSs and 513 GPs covering the period FY 2002 to FY 2006.

74
Pramukh, and Adhyakshya) is blamed for unsatisfactory completion rates. Lack of effective
monitoring and control by the DoPR and the DDC leads to shortfalls in the programme aimed at
construction of Panchayat Bhavans. Similar issues plague the programmes aimed at construction
of primary school buildings and provision of toilet and water facilities in primary and middle
schools. The 2007 report concludes that about 46 per cent, 41 per cent, and 19 per cent of works
undertaken during FY 2002-2006 by ZPs, PSs, and GPs, respectively were incomplete at the
time of the audit.
7.07 Other irregularities highlighted in the 2006 report include unauthorised diversion of road
cess funds, irregular revision of pay, outstanding advances, and misuse of provident fund
contributions.
7.08 While we outline the findings from the CAG reports above, we describe the current state
of affairs relating to accounts, budgets, and audit status using tabulations made from the PRI
Survey data. Though we did not conduct forensic audits of the 65 Panchayats in the survey
which would uncover evidence of any malfeasance or irregularities, the survey does enrich our
understanding of actual practises regarding maintenance and reporting of accounts, budgets, and
other documents. Here we present data exclusively for the GPs.
7.09 Table 7.01 shows that over 80 per cent of the GPs prepare annual budgets and reports, but
GPs seem to be more likely to prepare reports than budgets. There also is some evidence that
such activities have waned in FY 2009.
7.10 Table 7.02 shows that over 90 per cent of the GPs send their annual budgets and reports
to the BDO, but they are less likely to send these reports to the PS or ZP. Interestingly, this
seems to be driven by the actions of GPs in Bhojpur and Saharsa.
7.11 Table 7.03 shows that preparation of annual accounts was carried out by almost all GPs,
though GPs in Bhojpur and Saharsa were less likely to have done so than GPs elsewhere.
Interestingly, GPs that are more distant from the block headquarters prepare these documents.
Table 7.04 shows that significantly fewer GPs preparing the accounts send these to the PS or ZP,

75
the exception being the GPs in Begusarai where almost all GPs send their accounts to the
concerned offices.
7.12 Table 7.03 shows that although over 80 per cent of GPs prepared audit reports in FY
2007-08, this number dropped to 58 per cent in FY 2008-09.7 Table 7.04 shows that there is a
similar pattern regarding GPs sending these reports to the concerned offices. Contrary to what
we see in case of accounts, GPs farther away from the block headquarters are less likely to
prepare and send audit reports.
7.13 The importance of preparing annual budgets, reports, accounts, and audit reports cannot
be over emphasized. These documents provide details regarding the financial position of GPs,
progress of programmes undertaken, and an overview of upcoming initiatives. Given this, it is
disappointing that not all GPs prepare these documents. It is especially bewildering that although
they prepare these documents, many of them fail to send them to the concerned offices. This can
seriously hamper the ability of the higher tiers of local self government to supervise activities
undertaken by the GPs and may result in a lack of co-ordination among them.
7.14 We also include information from investigations carried out by an independent Chartered
Accountant to substantiate the information obtained from self reports by Mukhiyas, regarding
their compliance or non-compliance with the prescriptions of the PRI accountability system
described in the BPRO. The following paragraphs are based on his report.
7.15 While it is mandated that PRIs should maintain separate bank accounts for each different
source of revenue (funds from the central government, state government, central government
departments, and others), this was not always followed due to delays experienced in opening of
accounts or when there were one-time receipts. It was also noted that funds deposited were
withdrawn entirely within days. Inordinate delays in receipt of funds by the PRIs even though
they have been cleared by the DC and/or the DDC are present. Delays prior to collection of funds
by banks from the issuer also occur. Faster and seamless transfer facilities, in the form of
7 PRIs are required to respond to the findings of an audit with an “audit report” describing the measures taken by the PRI unit in response to any deficiencies identified by a CAG audit.

76
Electronic Fund Transfers, Core Banking Systems, etc. to transfer funds to the PRIs may aid in
reducing such delays.
7.16 In general, accounting processes and procedures and record keeping does not follow a
standard pattern throughout the state and are carried out differently at different PRIs. The PRI
would be well served if the GoB creates consistent and simplified accounting systems and
mandates its implementation.
7.17 There was no consistency regarding the heads under which expenditures were booked,
though large unadjusted advances to Ward members and employees were found in cash books,
detailed information on such advances for various schemes were meticulously maintained.
However, in the absence of proper adjustment of advances by debit to respective heads of
expenditure duly supported by cogent third-party evidences, the PRI as well as the persons to
whom the advances are made continue to be accountable for such amounts. As no utilisation
certificates are issued by PRIs, even ostensibly, they remain accountable.8 But even if utilisation
certificates are issued such certificates will continue to be un-verifiable by auditors in case they
are asked to certify end-use of funds.
7.18 The following ramifications of non-adjustment of advances were noted by a chartered
accountant who assisted with this study:
Large amounts of money appear to be recoverable from the incumbents to whom
advances were made.
A fair break-down of expenses actually incurred by the PRIs cannot be arrived at.
8 Utilisation certificates refer to an official document that certifies the use of funds by a government department or agency.

77
The entire amount advanced is presumed to have been spent. Amount refundable, if
any, being the unspent amount of an advance is neither ascertainable nor claimed from
the incumbent.
Adjustment of advances, whenever carried out, will have to be on the basis of
statement of expenses largely supported by third-party receipts, cash memos, credit
memos, etc. The absence of such third-party evidence renders the accounts non-
transparent.
End-use of funds cannot be verified to the satisfaction of the verifier.
Value of assets created, if any, out of PRI funds cannot be ascertained.
Periodic financial statements, even in the form of a Receipts and Payments Account
cannot be drawn up.
Actual and budgeted expenses cannot be compared.
PRIs are unable to issue utilisation certificates against the various funds received,
which in turn affects the authenticity of the utilisation certificate issued by the GoB.
Material for preparing a budget for the future periods is not available.
7.19 It was found that cash books were not balanced, even periodically, to reveal the balance
of cash on hand or at bank. As such, there is no system of preparing bank reconciliation
statements, and understandably so. Since reconciliation has to be struck between two balances,

78
one as per the bank records and the other as per PRI records; since the accounting system does
not include balancing of cash book, balance as per PRI books cannot be ascertained.
7.20 A sizable amount of funds received by the ZP comes in the form of loans from the GoB.
However, no separate account is maintained for such loans rendering it totally impossible to
reconcile the balance of loan against the balance as per government records.
7.21 Anomalies in the accounting system of the PRIs, including non-preparation of budgets
can be attributed to a lack of accounting knowledge and/or lack of training of the Gram Sevaks
who are charged with the responsibility of book keeping. Regular training on such matters would
immensely enrich the ability of the PRIs to maintain required documents.
Adequacy of current system of accountability
7.22 The GoB was to frame rules for accounting arrangements of PRIs under Section 121 of
the Bihar Panchayat Act 1993; however this has not been the case. These institutions therefore
follow the framework established by the PS and ZPs (Budget and Accounts) Rules 1964. The
presence of detailed accounting requirements in the BPRO, 2006 suggest that the PRIs are aware
of the regulations regarding budgets, accounts, plans, and other documents. However, there
seems to be a mismatch between the provisions of the BPRO, 2006 and the ability of the PRIs to
maintain such records. Audit reports by the CAG and the report by the independent chartered
accountant commissioned for this study highlight the lack of uniformity in maintenance of
accounts, improper use of funds, and unadjusted advances in cash books. Both reports argue that
such irregularities render it impossible to arrive at the overall financial position of the PRIs.
Other issues noted include misappropriation of funds and non-submission of utilisation
certificates. Evidence from the survey also indicates that records generally are not maintained as
prescribed, and even when maintained they are not sent to upper tiers of the PRI.
7.23 In an effort to standardise the accounting framework the Comptroller and Auditor
General of India (CAG) in 2002, formulated an accounting system for PRIs involving a 6-tier
coding system of account heads on the recommendation of the 11th Finance Commission. This

79
accounting system has since been replaced by a simplified accounting system in 2007, involving
a 3-tier coding system of account heads. The simplified accounting system, accepted and
approved in January 2009 by the Technical Committee on Budget and Accounting Standards for
PRIs, is intended to be used both for budgeting as well as for accounting throughout the country.
It is expected to promote uniformity on the one hand and better accountability on the other and
help enable the government to exercise better control over the PRIs. The simplified accounting
system also is intended to form the basis for development of the “PRIA Soft” (Panchayati Raj
Institutions Accounting Software) by the National Informatics Centre (NIC) in close consultation
with the CAG.
7.24 Guidelines for audit of PRI accounts have also been drawn up by the CAG. These audits
are to be carried out by the Examiner of Local Accounts (ELA) under the overall supervision of
the Principal Accountant General (Audit) of each state. In the case of the State of Bihar, the ELA
has already submitted a report covering the period ending 31st March 2007.
7.25 The need for training was highlighted by both respondents of the survey as well as the
independent chartered accountant commissioned for this report. There has been effort to
undertake such training activities. Training modules have been drawn up, the first set of trainees
are intended to be future training instructors. Whereas the first phase of training (to instructors) is
complete in 15 states, Bihar and Kerala are the only 2 states where the second phase of training
(by instructors) is also complete. However, it seems that the training was imparted to local
functionaries of CAG. Further supervision is required to prevent misappropriation and diversion
of funds by PRis.
Summary
7.26 Chapter 7 provides a brief description of the accountability system; discusses its
performance and adequacy; and provides some recommendations for its improvement. Reports
generated by the Auditor General of India reveal a widespread breakdown of the de jure
accountability system. GPs, PSs, and ZPs are unable to prepare accurate budgets, to adhere to the
agreed estimates, to complete the projects on time, and are unsuccessful at completing the

80
required audit forms, e.g., utilisation certificates. Cash books reveal unapproved advances and a
general lack of use of prescribed budget controls. Other problems are incorrect information on
employment generated, misreporting by ZPs of works completed, doubtful muster rolls, excess
payments for labourers, wastage of expenditures due to abandonment of works, and non-
confirmation of wages-to-materials ratio prescribed in the SGRY guidelines. The report
concludes that there is the clear possibility of misappropriation of funds in some instances. The
findings do vary in some ways across GPs. To summarize, 80 percent of GPs prepare budgets
and reports, but the reports are more likely to be prepared than the budgets. Ninety percent of
GPs send their budgets and reports to the BDO but are less likely to send them to the PSs or ZPs.
Finally, GPs that are more distant from the block headquarters are more likely to complete these
documents. These findings suggest that a simplified accounting system is needed and mandatory
training should be implemented across GPs.

81
Chapter VIII: Analysis of the Fiscal System and Recommendations
8.01 In this chapter we evaluate the fiscal system, using the conventional criteria of fiscal
autonomy, vertical imbalances, horizontal imbalances, and fiscal discipline. The revenue and
expenditure assignments have been discussed elsewhere in this report. We conclude with some
recommendations for the GoB.
Fiscal autonomy
8.02 There are 3 ways to evaluate the fiscal autonomy of sub-national governments, namely
tax autonomy, revenue autonomy, and expenditure autonomy. According to the tax autonomy
criterion, local governments should at a minimum have rate setting authority over at least one
tax. The rational for this principle is that local governments should finance expenditures at the
margin from own taxes in order to create a Wicksellian link between tax prices for local services
and the benefit of local services. In this way, policy-makers and the citizens of local
governments will internalise the true cost of providing local government services, and this should
promote fiscal discipline by and efficient allocation within the public sector.
8.03 The second criterion for fiscal autonomy is the share of sub-national revenues in total
government revenues. The greater this share, the greater the fiscal autonomy of sub-national
governments. The third criterion is the share of sub-national expenditures in total government
expenditures. Again, the greater this share, the greater is the fiscal autonomy of sub-national
governments.
8.04 Although we do not have the necessary data to calculate these expenditure and revenues
for local governments in the State of Bihar, some points of comparison may be helpful in putting
these measures into some kind of perspective. According to the Local Government Review 2007,
local governments in the United Republic of Tanzania are responsible for 21.4 per cent of total
government spending in fiscal year FY 2006-07. This is a substantial share of total government

82
spending, especially when taking into account that Tanzania is one of the poorest countries in the
world, and Tanzania just began its decentralisation policy reforms in 1999. Before 1999,
Tanzania was a highly centralised, socialist economy. However, local governments in Tanzania
do not have much discretion over even this spending because these expenditures are financed
exclusively with central government transfers, and the central government places restrictions on
these block grants. As a point of contrast, according to Ronald C. Fisher (2007), local
governments in the United States in FY 2003 were responsible for approximately 30 per cent of
total federal, state, and local government spending. By this measure, the United States is only
slightly more decentralised than Tanzania. However, approximately 60 per cent of local
government expenditures are self-financed by local governments, and consequently local
governments in the United States enjoy greater expenditure autonomy than their counterparts in
Tanzania.
8.05 In the case of local government autonomy in the State of Bihar, it is likely to be much
closer to the status of those in Tanzania, in terms of local government fiscal autonomy, than
those in the United States. Like local governments in Tanzania, PRIs in the State of Bihar are
almost completely transfer dependent, the excpetion being some minor own revenue generation
by ZPs, and there are restrictions on the use to which these funds can be put. Therefore, one must
conclude that PRIs in the State of Bihar do not have much genuine fiscal autonomy. However,
this should come as no surprise, given the different histories and stages of development of these
three countries. In fact, it may be completely appropriate to constrain the fiscal autonomy of
local government during the early stages of decentralisation and gradually increase it over time.
This is the gradualist approach to decentralisation that is being pursued in Tanzania and many
other countries, including China. The ‘big-bang’ approach to decentralisation that was adopted in
the Republic of Indonesia and the Federal Republic of Russia led to very difficult transitions and
the near total collapse of the public sector in the early stages of decentralisation. It also
unleashed separatist movements in several regions of these countries. In retrospect, many

83
observers believe that a gradualist approach to decentralisation in these two countries would
have been a more effective approach.9
9 See, for example, James Alm, Jorge Martinez-Vazquez, and Sri Mulyani Indrawati, eds. (2004) and Jorge Martinez-Vazquez, Mark Rider, and Sally Wallace (2008) for discussions of the Indonesian and Russian experiences with the ‘big-bang’ approach to fiscal decentralisation.

84
Vertical fiscal imbalances
8.06 Vertical fiscal imbalances refer to the tendency among federal countries for the revenue
raising powers of government to be concentrated in the hands of the central government, while
the functions of government, particularly the most expensive ones, to be assigned to sub-national
governments. Examples of the latter include expenditures on education and helath. This creates a
situation in which sub-national governments assume greater for expenditure functions but lack
the means to self-finance these responsibilities. The result is called a vertical fiscal imbalance.
Again, we are not in a position to quantify this imbalance for the PRIs in the State of Bihar.
However, it is well-known that India’s Constitution gives exclusive authority for the most
productive tax bases to the Union government, while the functions of government, particularly
health and education which are the most expensive functions of government, are concurrent with
the states and local governments. Consequently, the states of India are transfer-dependent and as
a consequence so are local governments. This also is the case in the State of Bihar: there is a
vertical imbalance between the expenditures functions assigned to PRIs and the revenues
available to them to carry-out these functions.
8.07 Although local governments have some revenue raising authority provided for in the
BPRO, 2006, they do not exercise this authority. The reason given for not raising own revenues
with the available tax handles is the failure of the GoB to issue enabling regulations, such as the
allowable rates of tax. Clearly, there is a vertical fiscal imbalance between local self
governments in the State of Bihar on the one hand and the State of Bihar and the Union
government on the other hand, even after taking into account transfers to local governments by
the state and Union governments. The Mukhiyas in our sample also report that they have
inadequate fiscal resources to carry-out their expenditure obligations. This is one of the
limitations of the activity mapping which is evaluated in some detail in chapter 3. Specifically,
the activity mapping does not provide for financing of PRI functions, except in a very limited
number of cases.

85
8.08 Regarding total PRI expenditures in the State of Bihar, we were not able to obtain total
figures for NREGA allocations. However, based on our sample of 65 PRIs, we estimate that
NREGA allocations account for more than 50 percent of total allocations to PRIs. Table 8.01
shows the total allocations to the PRIs in the State of Bihar from FC-12 and BRGF. Thus, we
estimate that total allocations to PRIs, after accounting for our estimate of NREGA allocations,
were approximately Rs. 1,400 crores in 2008-09. The total expenditure for GoB (revenue and
capital expenditures) in 2008-09 was Rs. 38,574 crore. In other words, allocations to the PRIs in
the State of Bihar account for about 3-4 percent of the total state expenditures in 2008-09.
Horizontal fiscal imbalances
8.09 We do not have the data to do a careful analysis of the potential horizontal fiscal
imbalances among local self governments in the State of Governments, particularly for GPs.
However, the PRI Survey data provides some evidence that there are large disparities among
GPs in per capita allocations driven by the erratic nature of the transfers by district and over
time. The trends described in chapter 5 in terms of the growth rates in allocations across districts
and the trends in the coefficient of variation of per capita allocations are difficult to explain,
especially in terms of an equalisation story. The FC-12 and BRGF transfer formulas are based
primarily on population; therefore, these formulas are not likely to be equalising. They do not
take into account disparities among the PRIs which may influence expenditure needs or costs of
delivering services, such as the per cent of the population in poverty. It is clear from the
available evidence and examination of the transfer formulas that there are horizontal fiscal
disparities among the GPs in the State of Bihar, and the transfer system rather than mitigating
them appears to be exacerbating them.
Fiscal discipline
8.10 There is no evidence that GPs are borrowing money. There is borrowing from the State of
Bihar by ZPs, but this borrowing is not documented. Therefore, it is impossible to evaluate
whether there is adequate fiscal discipline among ZPs. There is evidence that the Mukhiyas are
by-passing the provisions for grassroots decision-making and the social accountability

86
mechanisms and directing resources to benefit their own villages. Furthermore, the GPs do a
poor job of producing budgets and planning documents. In this broader sense of fiscal discipline,
it does not appear to be adequate.
Comparison with the State of West Bengal
8.11 The objective of this section is to review and compare the state of PRIs in the State of
Bihar with that in the State of West Bengal. The assessment matrix is organised according to the
following 5 aspects of fiscal decentralisation briefly described below.
8.11.01 Structure and scope of the government sector. How large is the role of the public sector
in the state economy, and to what extent is the government sector well-structured to make
effective policy decisions and to efficiently provide public services in a decentralized
framework? Among others this area includes issues such as the size of the public sector vis-à-vis
the private sector, the number of tiers of government in the system; the basic scope of each tier
(including district and sub-district government tiers, if relevant); and mechanisms for dialogue
and cooperation within each tier and between different tiers of government. This dimension also
considers whether the correct degree of political decentralization and local empowerment is in
place to institute effective local government.
8.11.02 Assignment of functional/expenditure responsibilities. To what extent is the assignment
of functional or expenditure responsibilities consistent with an efficient and effective approach to
decentralization and local governance? Is there a complete assignment of expenditure
responsibilities between the different levels of government, for all sectors (education, health
care, etc.) as well as clarity in the distribution of attributions in co-shared responsibilities
(delivery of services, capital development, staffing, regulation and setting of standards,
financing, etc.). How pervasive are state and national mandates? What functions or expenditure
responsibilities –if any- are “falling through the cracks”? To what extent are local governments
able to properly administer their assigned functions?
8.11.03 Revenue assignment and local tax administration. To what extent is the assignment of

87
revenue sources between different levels of government consistent with an efficient and effective
approach to decentralization and local governance? What is the degree of revenue sufficiency
and the extent of vertical and horizontal imbalances? Is there sufficient revenue autonomy at the
local level?
8.11.04 Intergovernmental fiscal transfers. To what extent is the design and implementation of
the system of intergovernmental fiscal transfers in each state consistent with an efficient and
effective approach to decentralization and local governance? Is there sufficient equalization to
address horizontal disparities? Is the system of transfers incentive compatible at the local level so
that local governments exercise their tax effort and strive for an efficient production of public
services? Are there adequate transfer instruments to pursue state and national government
objectives? To what extent are there central and state government mandates that are improperly
funded by system of local government finance?
8.11.05 Subnational borrowing and infrastructure development. Do local governments have
adequate access to funds for capital development through borrowing or other mechanisms? Is the
current regulatory and monitoring framework sufficient to avoid unsustainable practices of
capital infrastructure development?
Assessing the status of fiscal decentralisation reforms in two states
Aspect of fiscal
decentralisation State of Bihar State of West Bengal
(1) Structure of
public sector
Population: 83 million (2001)
16.6% SC/ST population
(2001)
90% rural population (2001)
The lowest state domestic
product per capita (only 34%
of the national average)
No PRI elections for 23 years
Population: 80 million (2001)
28.6 % SC/ST population
(2001)
72% rural population (2001)
15th place from the bottom
among 32 states and union
territories of India in terms of
state domestic product per

88
before 2001
Direct election of GP
Chairperson
2006 elections reserved half
the seats for women,
scheduled castes/tribes and
lower backward castes in
proportion to their share in
the population.
8463 Gram Panchayats
An average GP houses about
7,000 residents
Average GP constituency of
500 residents
capita(or just under the national
average)
Regular PRI elections since
1978 and direct GP elections
even before that
GP Chairperson is selected
among themselves by GP
councilors
The 1992 Amendment to the
state Act makes it mandatory to
provide for reservation of seats
at each level of the panchayat
for Scheduled Castes,
Scheduled Tribes, and women
in proportion to their share in
the population.
3,354 Gram Panchayats
an average GP houses about
17,000 residents
Average GP constituency of
1,500 residents
(2a) De jure
functional and
expenditure
assignments
In addition to agriculture
responsibilities common for
the two states, GPs monitor
attendance of agricultural
officers.
In addition to responsibilities
for water resources common
to the two states, GPs
monitor attendance of minor
In addition to agriculture
responsibilities common to the
two states, GPs collect soil for
sample surveys for the purpose
of financial assistance to
farmers and take an active role
in production of quality seeds
and their distribution.
In addition to land management

89
irrigation dept. workers.
In addition to the animal
resources responsibilities
common for the two states,
GPs monitor attendance of
state officials posted in the
area.
In addition to the forestry
responsibilities common for
the two states, GPs engage in
minor forest produce
In addition to the education
responsibilities common for
the two states, GPs identify
school sites, construct and
repair primary and middle
schools selected by the PS;
inspect and supervise
primary and middle schools
within the GP; determine
opening and closing hours of
schools being run for special
target groups; evaluate
dropout rates and develop
remedial actions; hire, fire,
supervise and pay para-
teachers.
In addition to the healthcare
responsibilities common for
the two states, GPs monitor
attendance of non-gazetted
responsibilities common for the
two states, GPs also identify
sharecropping tenants for legal
registration and display the
recorded tenancies
In addition to water resources
responsibilities common for the
two states, GPs build
percolation tanks, field
channels within the GP.
In addition to the animal
resources responsibilities
common for the two states, GPs
organize SHGs, distribute
improved poultry breeds, seeds
/ manure to farmers
In addition to the forestry
responsibilities common for the
two states, GPs organize SHGs.
In addition to the water supply
responsibilities common for the
two states, GPs construction
wells, tanks, and tube wells for
hand pump installations.
In addition to the healthcare
responsibilities common for the
two states, GPs are entrusted
with birth and death
registration; maintenance and
upgradation of health sub-
centers and ICDS (Anganwadi

90
officials posted in GP area.
In addition to the social
welfare responsibilities
common for the two states,
GPs are entrusted with
issuance of food ration cards;
distribution of scholarships
for SC/ST/OBC students of
grades 1-6, supervision over
residential schools for the
latter group.
or mother and child heath)
centers; local purchase of non-
medical items required by the
sub-centers; supplementary
nutrition for lactating mothers
and children under 6 years old.
(2b) De facto
functional and
expenditure
assignments
Average GP expenditure: Rs
. 133.2 per capita in 2007-08,
half of which is accounted
for by teacher salaries
Average 12FC expenditure
per GP was Rs.3.38 lakhs
(Rs. 30.5 per capita) in
2007/08.Generally, 12FC
funds are mostly used on
solar and vapour lights,
drinking water, and
sanitation.
Average NREGA
expenditure per GP was
Rs.4.11 lakhs (Rs. 37.4 per
capita) in 2007/08. NREGA
are used primarily for road
works (construction and
repair) and irrigation
infrastructure (new and
Average GP expenditure: Rs .
319 per capita in 2007-08, 7.5%
of which is accounted for by
salaries.
Average 12FC expenditure per
GP was Rs.4.43 lakhs (Rs. 23.3
per capita) in
2007/08.Generally, untied
funds (12FC, SFC) are mostly
used on roads and GP
buildings.
NREGA are used primarily for
road works (construction and
repair) and drinking water
installations. Average NREGS
expenditure per GP was Rs.
30.3 lakhs Rs. 159 per capita)
in 2007/08
BRGF funds are used mainly
for the construction of ICDS

91
repair)
BRGF funds are used mainly
for the construction and
repair of buildings. on solar
and vapour lights
(Anganwadi or mother and
child heath) centers and roads.
(3) Assignment
of revenue
sources
Intergovernmental revenue
accounted for 100% of GP
revenue
Intergovernmental revenue
accounted for 93.8% of GP
revenue in 2005-06
(4) Intergov.
fiscal transfers,
incl. the scope
of unfunded
mandate
92% the PRI allocation of the
12FC funds is allocated to
GPs in proportion to total
population (another 6% to
PS, 2% to ZP).
State share in the NREGA
funding to PRIs is 10%.
20% the PRI allocation of the
NREGS funds is allocated to
GPs (another 30% to PS,
50% to ZP).
All but one district are BRGF
recipients
Average BRGF allocation :
Rs. 75 per capita (2007/08)
70% of BRGF funds ( 92%
in 2007/08) are allocated to
20% of the 12FC funds is
distributed as Incentive Grants
on revenue mobilization of the
Panchayats. Remaining 80% is
distributed the same way as the
2nd State Finance Commission
grants (60% to GPs in
proportion to total population
and illiterate population;
another 20% to PS, 20% to ZP).
State share in the NREGA
funding to PRIs is 25%.
90% the PRI allocation of the
NREGS funds is allocated to
GPs (another 10% to PS).
11 of 18 districts are BRGF
recipients
Average BRGF allocation : Rs.
59 per capita (2007/08)
60% of BRGF funds are

92
GPs in equal shares (another
20% to PS, 10% to ZP)
allocated to GPs in proportion
to total population and illiterate
population (another 20% to PS,
20% to ZP)
(5) LG
borrowing and
infrastructure
development
No evidence that GPs are
borrowing money
Within the fiscal year, GPs can
and extensively do borrow
money from other (earmarked)
accounts under their control,
especially when they need to
meet statutory liabilities such as
wages or remittance of VAT to
be withheld from vendors.
Most of the new infrastructure
is built using NREGS funds and
untied funds such as State
Finance Commission, BRGF,
and incentive grants
Note: West Bengal districts receive less BRGF funds per capita due the fact that they have on average twice as much population as in Bihar combined with the fixed amount per district in the BRGF allocation from the Union, which accounted for Rs 2,500 crore out of total Rs. 4,400 crore BRGF allocation in FY 08/09.
Summary
8.12 The states of Bihar and West Bengal are similar in size. However, Bihar is more rural and
much poorer than West Bengal. PRI units are twice as big in population (and therefore fewer in
their number) in West Bengal than in Bihar. GP Chairperson is selected among themselves by
GP councilors in West Berngal while being directly elected in Bihar. West Bengal has a 30+ year
tradition of directly elected PRIs while Bihar did not hold PRI elections for 23 years until 2001.

93
8.13 In terms of de jure assignment, Bihar’s GPs are involved in supervising state department
employees (in particular their attendance) in many sectors that have less GP engagement in West
Bengal. Furthermore, Bihar’s GPs are delegated responsibility for construction of schools, and
hiring, firing, and remuneration of para-teachers. Also, unlike in West Bengal, Bihar’s GPs are
assigned responsibility for minor forest production and distribution of food ration cards and
scholarships for disadvantage students. On the other hand, West Bengal’s GPs are assigned a
number of significant responsibilities that are centralized in Bihar: building infrastructure for
hand-pump water sources and minor irrigation; construction and operation of health sub centers
and centers for maternal and child health. West Bengal’s GPs are also assigned responsibility for
the two major initiative of the 1970s Left Front government: facilitation of land tenancy
registration for sharecroppers and formation of self-help groups (SHGs).
8.14 In terms of actual expenditures, West Bengal’s GPs spend 150% more resources per
capita than their Bihar’s counterparts. The non-wage expenditures of GPs are four times higher
in West Bengal than in Bihar in per capita terms. The major differences appear to be in the
volume of labor intensive projects funded through the guaranteed employment schemes
(NREGA). While 90% of NREGA funds received from the Union government is allocated to GP
budgets in West Bengal, in Bihar the GP share is only 20%. In both states, NREGA funds are
used by GPs for road and water infrastructure.
8.15 While in West Bengal GPs are able to fund at least ten percent of their budgets from
locally raised revenues, in Bihar GPs are entirely transfer-dependent.
8.16 In terms of allocation of intergovernmental transfers among GPs, unlike per capita
allocation in Bihar, West Bengal addresses equity by giving 50 percent weight to illiteracy. At
the same time, West Bengal puts aside 20% of the Union Finance Commission funds as incentive
grants to rewards revenue mobilization by PRIs. While centralizing a larger part of NREGA’s
projects at the district level, Bihar channels a larger share of (semi-) discretionary resources (12-
FC and BRGF) to the the GPs. Bihar also receives more resources per capita from the Union
government, because it has smaller districts and the fact that more than half of the BRGF funds is
allocated by the Union in fixed amounts per district.

94
Recommendations to the Government of Bihar
8.17 The following suggestions for improving the functioning of GPs were collected from the
Mukhiyas, selected GP members, and Panchayat Sachivs of the 50 sampled GPs. These
suggestions are related to the autonomy of GPs, their infrastructural endowments, financial and
manpower base, and a few other issues.
Autonomy of GPs
(1) Each GP should have an administrative structure of its own and all paid employees of
the GPs should be answerable to the Mukhiya who should also have a role in their
appointment process.
(2) Mukhiyas should have the power to self-approve projects involving smaller amounts
(say, upto Rs. 5.00 lakh).
(3) GPs should have the liberty to prepare project budgets using current market prices of
different inputs, and not be bound by prices mentioned in government guidelines.
(4) Preparation of a credible list of BPL (Below Poverty Line) households is very crucial
for many poverty alleviation programmes. This task should be entrusted to the GP.
(5) Villagers often require residence, income and caste certificates for applying to various
offices (jobs, passport, poverty alleviation programmes, etc.). The power to issue these
certificates should be with the GP/Mukhiya. At present, these certificates are being
issued by the BDO.
Infrastructure
(1) All GPs should have their Panchayat Bhavan and there should also be residential
facilities, particularly for the Panchayat Sachiv.

95
Manpower
(1) Each GP should be provided with adequate manpower. At present, 4 paid employees
are available for each GP; but as many of these paid employees are required to serve
more than one GP, the actual availability of manpower is very limited.
(2) Many of the GP functionaries (elected or paid) are not trained. They should all be
trained and there should also be provisions for periodic training programmes.
Financial
(1) Allocations to GPs should be increased and such allocations should be made
proportional to the population of GPs.
(2) The proposed programmes and budgets should be approved within a specified time
period, and the funds should be released timely so that they can be executed properly.
(3) Allocation of funds in generally done for the GP as a whole. The distribution of funds
among the wards is determined quite often by the Mukhiya, leaving some wards under-
served or even un-served. It will be desirable that part of the total allocation is made
wardwise to avoid unequal distribution of project funds among the wards.
(4) The law provides for collection of taxes by the GPs. But, in the absence of a
departmental directive, no GP is collecting any taxes. The Department of PRI at the
state level should issue a proper directive so that GPs start collecting their own taxes.
Other Suggestions
(1) The legal provision of about 6 GP meeting in a year is often not followed. There should
be administrative directive to the GPs for following this provision. More frequent
meeting of the GPs will inprove its functioning.
(2) The GP functionaries should be provided with required security and the local Police
Station should be told to arrange for it.

96
(3) The elected functionaries should be paid regular allowances and for attending meetings
or making required visits to various offices.
(4) Many of the elected functionaries of GPs are not literate. Arrangements should be made
to make them literate, presumably though the Adult Literacy Programmes of the
government.
8.18 Below are some further recommendations that the GoB may wish to consider.
(1) The Government should develop a realistic multi-year blueprint for decentralisation
that is consistent with the government’s goals for strengthening local self government
and takes due account of the abilities of the state and local governments to implement,
recognising the fiscal and human resource capacities of the state and local governments.
(2) Continue to pursue a gradualist approach. However, local self governments may not all
move at the same speed. The Government of Bihar should attempt to accommodate the
different speeds with which local self governments are able and willing to pursue fiscal
decentralisation. Just as in Patna, there are different lanes for different modes of
transportation, like pedestrians, ox carts, pedal rickshaws, modern SUVs, and so on.
Similarly, the State of Bihar should create different lanes for Panchayats that are able
and willing to pursue decentralisation rapidly, and those that wish to go more slowly.
In many respects, this is what China has managed to do so successfully in many sectors.
(3) Rather than wholesale implementation of decentralisation policies everywhere and all
at once, consider using pilot studies to see what works and what does not. Again, pilot
studies have been used successfully by China and many African countries in pursuing
decentralisation policies, like Tanzania and Uganda to take two examples with which I
am familiar.
(4) Focus on a few priorities. For example, it would seem that the most important
government sectors are education, health, drinking water, and those related to
productive activities. Focus on making a few sectors successful. It is too easy to be

97
diverted by trying to make all 31 decentralised functions successful simultaneously and
everywhere. This is not practical and ultimately will not be successful.
(5) The government should give high priority to establishing a PRI fiscal analysis unit in
either the Department of Finance or the PRI Department. This unit should provide
technical support to the State Finance Commission. The Government of Bihar must
collect comprehensive and timely information on PRI finances. It also must recruit and
train the necessary staff and acquire the necessary hardware and software to analyse
these data. The Government of Bihar must have ways of indirectly monitoring the state
of local government finances and a fiscal analysis unit dedicated to analysing PRI
finances is a proven method of accomplishing this.
(6) The activity mapping is an excellent beginning, but it needs further work. The matrix
should account not only for the respective roles of 3 tiers of local government but
should also account for the roles of the Union and State governments. The matrix also
should include details about the responsibility for financing each function.
(7) The decentralisation strategy should include a strategy for increasing the fiscal
autonomy of local self governments, by enabling and perhaps incentivising them to
levy and collect own taxes. There will be a lot of political resistance to such an effort,
but the ultimate success of local self government ultimately depends on their ability and
willingness to self-finance local government services. Self-financing is the very essence
of fiscal autonomy and local self government. Without it, there is not real autonomy.
(8) The Government of Bihar should devise strategies to strengthen grassroots democracy,
particularly at the GP level of government. The Mukhiyas appear to be ruling by fiat,
directing resources to benefit themselves and their villages, and bypassing the
provisions of the Bihar Panchayati Raj Ordinance, 2006 for grassroots democracy.
Pilot programs to see what works and what does not work may be a place to start.
(9) The responsibilities of the Mukhiyas for carrying out activities and maintaining records
are too much for unpaid officials. Elected officials, including the Ward members,
should receive salaries commensurate with their official responsibilities. This should

98
increase the professionalism of elected officials, and the public may hold them more
accountable if the elected officials are receiving a salary for their service, particularly if
the Panchayats are required to self-finance all or part of the salaries of local officials.
As it is, elected officials are donating their time to the Panchayats, and therefore the
public may be more tolerant when elected local officials take certain liberties, such as
demanding bribes for jobs financed through NREGA or using their office to direct
benefits to themselves and their village.
(10) The accountability system described in the Bihar Panchayati Raj Ordinance, 2006 and
reviewed in chapter 7 of this report is not realistic given the general level of education
of the Mukhiyas and the human and physical resources available to them, at least as
reported by the 50 GPs sampled in the PRI Survey. The accounting and reporting
requirements need to be streamlined and simplified, so that it is reasonable to expect the
3 tiers of local self government to comply with these requirements and still promotes a
reasonable level of fiduciary accountability on behalf of the Panchayats by elected
officials.
(11) The government should make strategic use of its decentralisation policy to promote
commercial activity in rural areas of Bihar. At this stage of Bihar’s development,
increasing economic development in the rural areas is surely one of the most important
goals of decentralisation policy. As the rural areas develop, improvements in the other
sectors – health, education, and so on – will follow as a matter of course. Without
economic development, the progress that can be achieved in these sectors will be
severely constrained. There simply will not be the fiscal resources to improve service
delivery in the rural areas, without an increase in the level of commercial activities in
the rural parts of Bihar. For example, the state could supplement NREGA allocations
with additional funds for materials, equipment, and training. This would create synergy,
lead to higher quality investments, increase the skills of the labour force, and create
opportunities for further commercial activity in the rural areas.
(12) The Government of Bihar should conduct proper empirical evaluations of the
effectiveness of the education and health sectors. There are foundations, multilateral

99
donors, and bilateral donors that would help provide grant money for such evaluations,
and the State also has access to the outstanding capabilities of the ADRI to design and
implement such evaluations. Two examples come immediately to mind:
(13) It would be extremely useful for the Government to know if the resources spent on
education (e.g., pupil-teacher ratios, condition of school buildings, gender and
qualification of the teachers, and so on) influence the performance of students on the 8th
grade exam.
(14) A similar study should be conducted on the effectiveness of expenditures and
availability of health professionals and supplies on important health outcomes, such as
infant and maternal mortality.
Summary
8.17 Chapter 8 evaluates the fiscal system, using the conventional criteria of fiscal autonomy,
vertical imbalances, horizontal imbalances, and fiscal discipline. This chapter concludes with
some recommendations for the GoB. In a comparison with local governments in Tanzania and
the State of West Bengal, local self governments in the State of Bihar are completely dependent
on intergovernmental transfers. There are clear vertical fiscal imbalances between the PRIs and
the State of Bihar, and the Union government and the State of Bihar, even after taking into
account transfers to local governments by the Union government and the State of Bihar. This
conclusion is also confirmed by comparing the State of Bihar with the State of West Bengal. The
analysis of horizontal imbalances show clear horizontal fiscal disparities among the GPs, and the
transfer system rather than correcting them appears to be exacerbating them. Regarding fiscal
discipline, there is no evidence that GPs are borrowing money. However, the Mukhiyas are by-
passing the provisions for grassroots decision-making and directing resources to benefit their
own village.
8.18 Some modest recommendations for the GoB include the following. The GoB should
pursue a gradualist approach to decentralisation and should develop a realistic multi-year

100
blueprint to guide their reform efforts. The reforms should focus on important development
priorities, such as providing education, health, and clean drinking water. The GoB should give
high priority to establishing a PRI fiscal analysis unit in order to provide technical support to the
DoF, DoPR, and SFC and to support the development of a strategy to increase the fiscal
autonomy of local self governments in the State of Bihar. In addition, the accounting and
reporting requirements should be simplified and streamlined. The government should make
strategic use of its decentralization policy to promote commercial activity in rural areas of Bihar.
Finally, empirical evaluations of the effectiveness of the education and health sectors are
required.

101
References
Alm, James, Jorge Martinez-Vazquez, and Sri Mulyani Indrawati, eds. (2004). Reforming Intergovernmental Fiscal Relations and the Rebuilding of Indonesia: The ‘Big-Bang’ Program and Its Economic Consequences. Cheltenham, UK: Edward Elgar Publishers, Inc.
Bihar Panchayati Raj Ordinance, 2006. Patna, Bihar: Law Publishing House. Luce, Edward (2007). In Spite of the Gods: The Strange Rise of Modern India. New York:
Doubleday. Fisher, Ronald C. (2007). State and Local Public Finance, 3rd edition. Mason, OH: Thomson
Sout-Western. Local Government Fiscal Review 2007. “Measuring Progress on Decentralization by
Devolution.” Prime Minister’s Office – Regional Administration and Local Government, United Republic of Tanzania.
Martinez-Vazquez, Jorge, Mark Rider, and Sally Wallace (2008). Tax Reform in Russia.
Northhampton, MA: Edward Elgar Publishing Ltd. Martinez-Vazquez, Jorge and Andrey Timofeev (2007). “Reforming the assignment of functional
responsibilities: Principles and a practical guide”. unpublished manuscript, International Studies Program, Andrew Young School of Policy Studies, Georgia State University, Atlanta, GA.
Musgrave, Richard A. (1959). The Theory of Public Finance: A Study in Public Economy. New
York, NY: McGraw-Hill Publishers, Co. Oates, Wallace E. (1972). Fiscal Federalism. New York, NY: Harcourt Brace Jovanovich, Inc. Report of the Examiner of Local Accounts, Bihar (2006), Patna, Bihar: Government of Bihar,
Panchayati Raj Institutions. Report of the Examiner of Local Accounts, Bihar (2007), Patna, Bihar: Government of Bihar,
Panchayati Raj Institutions. Report on PRI Accounting (2009), Patna, Bihar: B. Gupta and Co. Stigler, George (1957). “Tenable range of functions of local government”, in Federal
Expenditure Policy for Economic Growth and Stability, Joint Economic Committee, Subcommittee on Fiscal Policy, Washington, D.C., Subcommittee on Fiscal Policy, Washington, D.C., pp. 2133-219.
Watts, Ronald L. (1999). Comparing Federal Systems, 2nd edition. Montreal, CA: McGill-
Queen’s University Press.

102
TABLES AND FIGURES Table 1.01 Districts ranked according to the index of social capital
Category
(according to the social capital index) Districts in Bihar
Aurangabad Munger W Champaran
Bhojpur Rohtas Much above average
(7 districts) Gaya Patna
Arwal Jehanabad Shekhpura
Bhagalpur Kaimur Siwan Above average
(8 districts) Buxar Nalanda
Begusarai Muzaffarpur Sheohar
Gopalganj Nawada Vaishali Average
(8 districts) Lakhisarai Saran
Banka Jamui Saharsa
Darbhanga Khagaria Samastipur Below average
(8 districts) E Champaran Madhubani
Araria Madhepura Supaul
Kishanganj Purnia Much below average
(7 districts) Katihar Sitamarhi
Source: Author’s own calculations.

103
Table 1.02 Sample of Panchayati Raj Institutions, by tier of government
Zilla Parishads Panchayat Samities
(number of GPs/population of PS)1 Gram Panchayats
Agiawan (15/1,22,093)
Agiawan, Badgaon, Dilian, Karwasin, and Nonwar
Bhojpur Udwantnagar (16/1,31,865)
Eraura, Choti Sasaram, Kusumha, Nawada Ben, and Udwantnagar
Bihar Sharif (20/3,94,435)
Muraura, Pachauri, Paroha, Sakraul, and Sigthu
Nalanda Silaw
(14/1,23,030) Barakar, Gorawan, Kariyanna, Nanand, and Pawadih
Naw Kothi (9/80,356)
Dafarpur, Hasanpur Bagar, Maheshwara, Naw Kothi, and Rajakpur Begusarai
Barauni (24/2,25,879)
Amarpur, Buthauli Mahna, Mallahipur North, and Pipra Dewas
Saharsa / Kahara (15/2,29,744)
Amarpur, Bangaun South, Chainpur, Diwari, and Padri
Saharsa Sonbarsha
(21/1,76,336) Khajuraha, Lagma, Raghunathpur, Shahpur, and Soha
Dumra (28/3,38,994)
Bhupobhairo, Bishanpur, Chakrajopatti, Khairwa , and Lagama Sitamarhi
Bokhara (11/1,03,778)
Banoul, Bhaur, Bokhara Chakauti, Dumari, and Maksudanpur
Note: 1The figures in brackets indicate the number of Gram Panchayats in the respective Panchayat Samiti and the population of the Panchayat Samiti, according to the 2001 census.

104
Table 1.03 Number of villages and current population, in the sample of 50 Gram Panchayats
District Panchayat Samiti
Gram Panchayat (number of villages/current population in 1,000’s)
Average population (1,000’s)
Agiwan Agiwan (6/12.8)
Dilian (8/22.0)
Narwar (4/10.1)
Badgaon (2/14.0)
Karwasin (4/10.6) 13.9
Bhojpur Udwantnagar Kusumba
(7/9.6) Udwantnagar
(1/11.0) Eroura
(9/14.3) Nawatoben
(5/9.4 ) Choti Sasaram
(5/10.8) 11.0
Bihar Sharif Paroha (4/7.1)
Sakraul (3/8.0)
Sinthu (3/12.0)
Muraura (8/12.1)
Pachauri (4/11.7) 10.2
Nalanda Silao Pawadih
(6/13.3) Gorawan (3/8.7)
Kariyana (1/7.2)
Barakar (8/21.8)
Nanand (1/9.7) 12.1
Naokothi Maheswara (2/13.0)
Dafarpur (6/20.0)
Rajakpur (2/10.0)
Hasanpur (3/11.5)
Naokothi (1/13.0) 13.5
Begusarai Barauni Pipra Devas
(2/19.0)
Mallahipur North
(1/17.0)
Amarpur (2/8.0)
Mahana (3/15.0)
Bathauli (6/13.6) 14.5
Kahara Bangaon South (1/12.6)
Dewari (4/11.2)
Amarpur(s) (3/9.0)
Chainpur (1/12.1)
Padri (1/6.2) 10.2
Saharsa Sonbarsa Sahpur
(4/9.4) Raghunathpur
(3/11.3) Lagama (4/8.7)
Khajuraha (3/15.3)
Soha (2/11.1 ) 11.2
Dumara Khairwa (3/10.7)
Bisanpur (3/7 .8)
Chakrajoputti (2/13.4)
Bhupbhairo (2/9.5)
Lagama (5/13.0) 10.9
Sitamarhi Bokhara
Maksudanpur Dumari (3/10.0)
Bhaur (3/11.8)
Banaul (1/14.9)
Bokhara (1/12.5)
Chakauli (2/10.8) 12.0
Note: 1The figures in brackets indicate the number of villages in and the population of the respective Gram Panchayat, according to the 2001 census.

105
Table 2.01 Distribution of Ward members and Mukhiyas, by reserved seat (per cent)
Sample districts PRI functionaries
Bhojpur Nalanda Begusarai Saharsa Sitamarhi All
Ward members 48.4 63.8 61.4 63.1 56.6 58.6 Mukhiyas 60.0 40.0 60.0 50.0 70.0 56.0
Source: Bihar PRI Survey data. Note: Sample size is 50 Mukhiyas and 757 ward members.
Table 2.02 Distribution of Ward members (Mukhiyas), by caste and religion (per cent)
Sample districts Caste
Bhojpur Nalanda Begusarai Saharsa Sitamarhi Average
23.6 13.5 23.3 32.5 9.8 20.6 Upper caste (40.0) (20.0) (30.0) (60.0) (10.0) (32.0) 31.2 24.8 17.6 21.3 28.3 24.5 Upper backward castes (20.0) (50.0) (40.0) (10.0) (10.0) (26.0) 16.6 23.4 37.5 25.0 25.4 25.9 Lower backward castes (10.0) (0.0) (10.0) (10.0) (30.0) (12.0) 24.2 36.2 17.0 16.9 17.3 21.8 Scheduled caste/tribes (30.0) (30.0) (10.0) (0.0) (20.0) (18.0) 4.5 2.1 4.5 4.4 19.1 7.2 Muslims (0.0) (0.0) (10.0) (20.0) (30.0) (12.0)
Source: Bihar PRI survey data. Notes: 1. The upper figure in each cell refers to the per cent of GP members, and the lower figure in parentheses refers to
the per cent of Mukhiyas. 2. Sample size is 50 Mukhiyas and 757 ward members.

106
Table 2.03 Distribution of Ward members and Mukhiyas, by gender (per cent)
Sample Districts PRI Functionaries Gender
Bhojpur Nalanda Begusarai Saharsa Sitamarhi Average
Male 45.2 51.1 54.0 48.8 50.3 49.9 Ward members Female 54.8 48.9 46.0 51.3 49.7 50.1 Male 60.0 70.0 40.0 40.0 60.0 54.0
Mukhiya Female 40.0 30.0 60.0 60.0 40.0 46.0
Source: Bihar PRI Survey data. Note: Sample size is 50 Mukhiyas and 757 ward members.
Table 2.04 Average age of Ward members and Mukhiyas, by district (per cent)
Sample Districts PRI Functionaries Bhojpur Nalanda Begusarai Saharsa Sitamarhi
All
Ward members 38.1 39.1 38.9 40.5 42.2 39.8 Mukhiya 44.4 47.7 42.9 50.6 44.5 46
Source: Bihar PRI Survey data. Note: Sample size is 50 Mukhiyas and 757 ward members.

107
Table 2.05 Distribution of Ward members (Mukhiyas), by education (per cent)
Sample districts Level of education
Bhojpur Nalanda Begusarai Saharsa Sitamarhi All
10.8 6.4 2.8 8.8 15.6 8.9 Illiterate (0.0) (0.0) (0.0) (0.0) (0.0) (0.0) 34.4 44.0 45.5 49.4 61.8 47.3 Just literate (30.0) (0.0) (100) (20.0) (30.0) (18.0) 6.4 2.8 1.1 1.3 0.0 2.2 Passed primary (0.0) (10.0) (0.0) (10.0) (0.0) (4.0) 14.0 13.5 14.2 10.6 7.5 11.9 Passed primary, but not
secondary (10.0) (10.0) (30.0) (20.0) (20.0) (18.0) 22.3 14.2 19.3 14.4 8.1 15.6 Passed secondary, but not
higher secondary (40.0) (40.0) (10.0) (40.0) (30.0) (32.0) 7.6 11.3 10.8 6.3 1.7 7.4 Passed higher secondary,
not graduate (20.0) (20.0) (20.0) (10.0) (0.0) (14.0) 4.5 7.8 6.3 9.4 5.2 6.6 Graduate and above (0.0) (20.0) (30.0) (0.0) (20.0) (14.0)
Source: Bihar PRI survey data. Notes: 1. The upper figure in each cell refers to the per cent of Ward members, and the lower figure in parentheses refers
to the per cent of Mukhiyas. 2. Sample size is 50 Mukhiyas and 757 ward members.

108
Table 2.06 Distribution of Ward members (Mukhiyas), by occupation (per cent)
Sample districts Occupation
Bhojpur Nalanda Begusarai Saharsa Sitamarhi All
33.8 20.6 17.0 35.0 20.2 25.2 Cultivator (50) (30) (30) (30) (30) (34) 24.8 26.2 25.0 24.4 31.8 26.5 Rural labour (10) (0.0) (0.0) (0.0) (10) (4) 0.0 0.0 2.8 0.0 0.0 0.6 Artisan (0.0) (0.0) (0.0) (0.0) (0.0) (0.0) 9.6 5.7 7.4 5.0 6.9 6.9 Trader (20) (20) (10) (30) (10) (18) 1.9 2.8 1.1 0.6 1.2 1.5 Salary earner (0.0) (0.0) (0.0) (0.0) (0.0) (0.0) 1.9 6.4 7.4 2.5 1.7 4.0 Other occupation (0.0) (30) (20) (0.0) (10) (12)
28.0 38.3 39.2 32.5 38.2 35.3 No occupation (20) (20) (40) (40) (40) (32) Source: Bihar PRI survey data. Notes: 1. The upper figure in each cell refers to the per cent of GP members, and the lower figure in parenthesesrefers to
the per cent of Mukhiyas. 2. Sample size is 50 Mukhiyas and 757 ward members.

109
Table 2.07 Distribution of Ward members and Mukhiyas, by number of terms (per cent)
Ward members Mukhiyas District One term Two terms One term Two terms
Bhojpur 97.5 2.5 100.0 0.0 Nalanda 97.2 2.8 70.0 30.0
Begusarai 97.2 2.8 60.0 40.0
Saharsa 96.9 3.1 100.0 0.0 Sitamarhi 94.8 5.2 80.0 20.0
Upper caste 97.0 3.0 93.8 6.3
Upper backward caste 96.0 4.0 53.8 46.2
Lower backward caste 98.6 1.4 100.0 0.0 Scheduled caste 97.2 2.8 100.0 0.0
Muslims 89.7 10.3 66.7 33.3
Male 93.8 6.2 70.4 29.6 Female 99.5 0.5 95.7 4.3
Source: Bihar PRI survey data. Note: Sample size is 50 Mukhiyas and 757 ward members.

110
Table 3.01 Distribution of functions in federal countries, an international perspective
Legend: F= federal power S = state (provincial/canton/Länd) C = concurrent (federal paramountcy)
Cs = concurrent (provincial paramountcy) c = community power r = regional power A = asymmetrical power † = federal legislation in this field administered by states. * = 6 of 17 sub-national orders of government has jurisdiction over education and health. ** = enumerated as a framework legislation whereby federal government may enact general principles only.
Source: Ronald L. Watts (1999, pages 128-9)
Function Canada (1867)
United States (1789)
Switzerland (1848/1999)
Australia (1901)
Germany (1949)
Austria (1929)
India (1950)
Malaysia (1963)
Belgium (1993)
Spain (1978)
Pakistan (1962)
Transportation and communication FC† FA Roads and bridges S FS FS FS C† FS FS FS Sr SF Railways FS FS F FS FC† F F FA F S S Air F F F FS F F F F Sr SF F Telecommunications FS FS F C F F F F F F F Postal services F F F C F F F F F F F Broadcasting F F F C SC† F F Sc F F
Agriculture and resources Agriculture C S F SC C† F† SC SCA S Fisheries FS S F FS C† FS FSA Sr S*F FS Mineral resources FS S S C† F FS FS Sr F Nuclear energy F FS F C C F F F F F
Social affairs Education and research FS* Primary and secondary education S S C†S S S FS CS FA Sc
Postsecondary education S FS FC†S FS C†** F FCS FA Sc F
Research and development FS F FS SC† FS FCS FA FSc FS
Health services Hospitals SF SF S FS C† C† S FA Sc FS* Public health and sanitation S S C† S C† FS S FC Sc S
Labour and social services FS C F Unemployment insurance F FS C† C C F S FA F F
Income security FS FC C C F CS FA F F Social services SF SF C† C C† S CS C Sc FS C Pensions Cs C C† C C†S F C FAS F FS

111
Table 3.02 Responsibilities of Panchayats
1. Agriculture, including agricultural extension 2. Land improvement, implementation of land reforms, land consolidation, and soil
conservation. 3. Minor irrigation, water management, and watershed development. 4. Animal husbandry, dairying and poultry. 5. Fisheries. 6. Social forestry and farm forestry. 7. Minor forest products. 8. Small scale industries, including food processing industries. 9. Khadi, village and cottage industries. 10. Rural housing. 11. Drinking water. 12. Fuel and fodder. 13. Roads, culverts, bridges, ferries, waterways and other means of communication. 14. Rural electrification, including distribution of electricity. 15. Non-conventional energy sources. 16. Poverty alleviation programme. 17. Education, including primary and secondary schools. 18. Technical training and vocational education. 19. Adult and non-formal education. 20. Libraries. 21. Cultural activities. 22. Markets and fairs. 23. Health and sanitation, including hospitals, primary health centres and dispensaries. 24. Family welfare. 25. Women and child development. 26. Social welfare, including welfare of the handicapped and mentally retarded. 27. Welfare of the weaker sections, and in particular, of the Scheduled Castes and the
Scheduled Tribes. 28. Public distribution system. 29. Maintenance of community assets.
Source: Eleventh Schedule (Article 243G of the Constitution). The amendments to India’s Constitution are available at http://india.gov.in/govt/constitutions_of_india_amendment.php.

112
Table 3.03 Frequency of meetings of Gram Sabha and Gram Panchayat
Gram Sabha meetings (Last 3 years)
Gram Panchayat meetings Average number
Characteristics Average number
Villages where at least one
meeting was held.
(percent)
2006-07 2007-08 2008-09
Average number of Ward members present
(2008-09)
District Bhojpur 6.6 58.2 3.0 2.6 3.0 6.3 Nalanda 14.1 4.5 3.5 4.0 3.6 8.9 Begusarai 7.3 2.8 3.0 3.9 3.0 7.2 Saharsa 1.0 3.5 2.3 2.6 1.6 4.8 Sitamarhi 9.7 2.3 3.4 2.8 2.4 6.7
Distance to block headquarters 0 – 4 kms 11.4 2.2 3.3 3.6 2.9 7.0 5 – 8 kms 10.0 4.5 2.8 3.1 3.6 7.8 9 – 12 kms 3.8 3.0 2.9 3.0 2.4 6.4 > 12 kms 11.3 5.0 3.6 2.3 1.4 3.9
Mukhiya’s religion and caste Upper caste 17.3 3.4 3.3 3.3 3.3 6.3 Upper backward caste 8.0 3.7 3.1 3.7 3.2 7.8 Lower backward caste 8.3 3.0 2.4 2.0 1.8 7.0 Scheduled caste 9.8 5.0 3.3 2.7 2.4 6.0 Muslim 7.4 2.3 3.3 3.0 1.8 5.6
Mukhiya’s gender Male 11.1 4.4 3.3 2.7 2.3 5.3 Female 8.4 2.4 3.0 3.6 3.2 8.0
All GPs 7.7 14.3 3.0 3.2 2.7 6.8 Source: Bihar PRI survey data.

113
Table 3.04 Number of agenda items of Gram Panchayat meetings, reported by Mukhiyas (Panchayat Sachivs) in 2008-09
Issues Bhojpur Nalanda Begusarai Saharsa Sitamarhi All 1. Programme planning 27 (50.9) 44 (68.8) 32 (56.1) 13 (46.3) 31 (54.4) 147 (56.8)
(a) FC12 funds 12 (22.6) 17 (26.6) 18 (31.6) 2 (7.1) 12 (21.1) 61 (23.6) (b) NREGA funds 12 (22.6) 26 (40.6) 6 (10.5) 5 (17.8) 11 (19.3) 60 (23.2) (c) BRGF funds 3 (5.7) 1 (1.6) 8 (14.0) 6 (21.4) 8 (14.0) 26 (10.0)
2. Monitoring of various schemes 16 (30.2) 1 (1.6) 1 (1.8) 5 (17.8) 3 (5.3) 27 (10.4) 3. Poverty alleviation programmes 4 (7.6) 4 (6.3) 12 (21.1) 6 (21.4) 13 (19.9) 39 (15.1)
(a) Indira Awas Yojana 3 (5.7) - 1 (1.8) 3 (10.7) 1 (1.8) 8 (3.1) (b) Old Age/Laxmibai Pension Yojana - 3 (4.7) 3 (5.3) 3 (10.7) 3 (5.3) 12 (4.6) (c) Kanya Vivah Yojana - - - - - - (d) Scholarship programme 1 (1.9) 1 (1.6) - - 1 (1.8) 3 (1.2) (e) Public distribution system - - 4 (7.0) - 4 (7.0) 8 (3.1) (f) Identification of BPL households - - 4 (7.0) - 4 (4.0) 8 (3.1)
4. Educational 2 (3.8) 3 (4.7) - - - 5 (2.0) (a) Functioning of schools 1 (1.9) - - - - 1 (0.4) (b) Enrolment/attendance - 1 (1.6) - - - 1 (0.4) (c) Mid-day meal scheme - 2 (3.1) - - - 2 (0.8) (d) Appointment of teachers 1 (1.9) - - - 1 (0.4)
5. Health related programmes - 3 (4.7) 1 (1.8) 1 (3.6) - 5 (2.0) (a) Organisation of health camp - - 1 (1.8) - - 1 (0.4) (b) Polio eradication programme - 1 (1.6) - - - 1 (0.4) (c) Functioning of ASHA - - - 1 (3.6) - 1 (0.4) (d) Functioning of ICDS - 2 (3.1) - - - 2 (0.8)
6. Others development issues 2 (3.8) 3 (4.8) 9 (15.9) 3 (10.8) 5 (8.8) 22 (8.5) (a) Social forestry - - 1 (1.8) - - 1 (0.4) (b) Diesel subsidy scheme - - - 1 (3.6) - 1 (0.4) (c) Promotion of women SHG 1 (1.9) 1 (1.6) - - - 2 (0.8) (d) Milk collection scheme - 1 (1.6) - - - 1 (0.4) (e) Flood felief - - 2 (3.5) 1 (3.6) 2 (3.5) 5 (1.9) (f) Birth-death registration 1 (1.9) - 5 (8.8) 1 (3.6) 1 (1.8) 8 (3.1) (g) Other development issues - 1 (1.6) 1 (1.8) - 2 (3.5) 4 (1.5)
7. Administrative issues 2 (3.8) 6 (9.4) 2 (3.5) - 5 (8.8) 15 (5.8) Total 53 (100.0) 64 (100.0) 57 (100.0) 28 (100.0) 57 (100.0) 259 (100.0)
Source: Bihar PRI survey data.

114
Table 3.05 Average number of projects per village type, by district
Sample districts Type of village
Bhojpur Nalanda Begusarai Saharsa Sitamarhi All
Mukhiya's village 18.5 19.6 12.4 13.8 28 18.5
Villages with > 2 projects 7 9.8 7.6 11.1 16.6 10
Villages with 1-2 projects 1.9 1.6 3.5 0 2.5 2.1
Villages with no projects 0 0 0 0 0 0
Total 4.9 9.2 8.7 12.2 19.4 10.4
Source: Bihar PRI survey data. Note: Sample size is 50 GPs. Table 3.06 Average expenditures per village type (Rs. 1,000’s)
Sample districts Type of village
Bhojpur Nalanda Begusarai Saharsa Sitamarhi All
Mukhiya's village 1,197.2 1,473.2 964.2 1,129.3 1,210.9 1,195.0
Villages with > 2 programmes 400.8 562.1 456.1 1,018.0 640.6 603.1
Villages with 1-2 programmes 131.5 188.0 429.9 0 2,072.6 322.1
Villages with no programmes 0 0 0 0 0 0
Total 438.5 626.0 633.8 1,060.8 957.7 685.2
Source: Bihar PRI Survey data. Note: Sample size is 50 GPs.

115
Table 3.07 Per cent of GPs performing various assigned production functions
Percentage of GPs performing functions related to
Characteristics Agriculture Animal
husbandry Fisheries Social and farm forestry
Khadi and village industries
District
Bhojpur 50.0 30.0 20.0 20.0 10.0 Nalanda 70.0 40.0 40.0 10.0 20.0 Begusarai 70.0 40.0 10.0 70.0 20.0 Saharsa 40.0 10.0 10.0 20.0 - Sitamarhi 50.0 20.0 20.0 10.0 20.0
Distance to block headquarters 0 – 4 kms 66.7 40.0 20.0 33.3 20.0 5 – 8 kms 53.3 13.3 13.3 26.7 13.3 9 – 12 kms 45.5 18.2 27.3 18.2 9.1 > 12 kms 55.6 44.4 22.2 22.2 11.1
Mukhiya’s religion and caste Upper caste 62.5 31.3 18.8 31.3 6.3 Upper backward caste 46.2 23.1 15.4 38.5 15.4 Lower backward caste (H+M) 66.7 33.3 33.3 33.3 16.7 Scheduled caste 55.6 33.3 22.2 11.1 22.2 Muslim 50.0 16.7 16.7 - 16.7
Mukhiya’s gender Male 55.6 29.6 18.5 22.2 11.1 Female 56.5 26.1 21.7 30.4 17.4
All GPs 56.0 28.0 20.0 26.0 17.5 Source: Bihar PRI survey data. Note: Sample size is 50 GPs.

116
Table 3.08 Per cent of GPs performing various assigned infrastructure functions
Per cent of GPs performing functions related to
Characteristics Roads/ buildings
Rural electrification
Non-conventional
energy
Rural sanitation
Dharamshala (rest house)
Cattle sheds, ponds,
etc.
Slaughter houses
Parks/ playgrounds
Huts/ sheds
District Bhojpur 100.0 10.0 80.0 60.0 20.0 - - 20.0 - Nalanda 90.0 80.0 100.0 80.0 - - - 40.0 10.0 Begusarai 100.0 30.0 90.0 70.0 10.0 - - - - Saharsa 90.0 30.0 90.0 50.0 - - - - - Sitamarhi 100.0 10.0 100.0 50.0 30.0 - 10.0 10.0 10.0
Distance to block headquarters 0 – 4 kms 100.0 26.7 100.0 66.7 13.3 - 6.7 6.7 6.7 5 – 8 kms 100.0 20.0 80.0 53.3 20.0 - - 13.3 6.7 9 – 12 kms 81.8 36.4 90.9 81.8 - - - - - > 12 kms 100.0 55.6 100.0 44.4 11.1 - - 44.4 -
Mukhiya’s religion and caste
Upper caste 93.8 37.5 75.0 62.5 12.5 - 0.0 6.3 6.3 Upper backward caste 92.3 38.5 100.0 53.8 - - 0.0 7.7 - Lower backward caste (H + M) 100.0 16.7 100.0 83.3 33.3 - 0.0 16.7 16.7 Scheduled caste 100.0 33.3 100.0 66.7 11.1 - 0.0 33.3 - Muslim 100.0 16.7 100.0 50.0 16.7 - 16.7 16.7 - Gender of Mukhiya
Male 96.3 48.1 92.6 59.3 11.1 - 3.7 22.2 7.4 Female 95.7 13.0 91.3 65.2 13.0 - - 4.3 -
All GPs 96.0 32.0 92.0 62.0 12.0 - 2.0 14.0 4.0 Source: Bihar PRI survey data. Note: Sample size is 50 GPs.

117
Table 3.09 Per cent of GPs performing various assigned development functions
Per cent of GPs performing functions related to
Characteristics of GP Rural housing Drinking
water Education Health and
family welfare
Woman and child development
Social welfare
Old-age and
widow pension
District Bhojpur 40.0 90.0 90.0 40.0 60.0 60.0 90.0 Nalanda 60.0 100.0 90.0 80.0 100.0 70.0 100.0 Begusarai 50.0 100.0 90.0 90.0 100.0 70.0 80.0 Saharsa 80.0 90.0 90.0 50.0 60.0 50.0 80.0 Sitamarhi 50.0 90.0 100.0 80.0 100.0 50.0 70.0
Distance to block headquarters 0 – 4 kms 46.7 86.7 100.0 93.3 86.7 53.3 80.0 5 – 8 kms 66.7 100.0 80.0 93.3 66.7 53.3 80.0 9 – 12 kms 63.6 100.0 81.8 90.9 63.6 81.8 90.9 > 12 kms 44.4 88.9 66.7 88.9 44.4 55.6 88.9
Mukhiya’s religion and caste Upper caste 75.0 93.8 87.5 75.0 81.3 56.3 81.3 Upper backward caste 61.5 100.0 92.3 69.2 84.6 76.9 92.3 Lower backward caste (H + M) 33.3 100.0 100.0 83.3 100.0 33.3 83.3 Scheduled caste 55.6 100.0 100.0 66.7 77.8 66.7 88.9 Muslim 16.7 66.7 83.3 33.3 83.3 50.0 66.7
Mukhiya’s gender Male 55.6 92.6 92.6 59.3 81.5 63.0 81.5 Female 56.5 95.7 91.3 78.3 87.0 56.5 87.0
All GPs 56.0 94.0 92.0 68.0 84.0 60.0 84.0 Source: Bihar PRI survey data. Note: Performance implies either time or money spent on activities.

118
Table 3.10 Per cent of GPs performing assigned maintenance functions
Per cent of GPs performing the following maintenance functions
Characteristics
Gra
zing
land
Adu
lt ed
ucat
ion
Gen
eral
sa
nita
tion
Publ
ic ro
ads
and
drai
ns
Tank
s an
d w
ells
Bur
ning
s an
d bu
rial
grou
nds
Dha
ram
shal
a (r
est h
ouse
)
Com
mun
ity
asse
ts
Cat
tle sh
eds
Slau
ghte
r-
hous
es
Park
s an
d pl
aygr
ound
s
Gar
bage
bin
s
Hut
s &
shed
s
District Bhojpur - 20.0 50.0 90.0 100.0 40.0 - 60.0 10.0 - 30.0 10.0 20.0 Nalanda 10.0 10.0 60.0 100.0 100.0 60.0 - 60.0 10.0 10.0 50.0 - - Begusarai - - 30.0 50.0 50.0 - 10.0 20.0 - - 20.0 - - Saharsa 10.0 10.0 30.0 30.0 60.0 - - 70.0 - - - - - Sitamarhi 10.0 - 50.0 80.0 60.0 30.0 10.0 40.0 10.0 - - - -
Distance to block office 0 – 4 kms 6.7 - 53.3 66.7 66.7 20.0 6.7 46.7 6.7 6.7 20.0 6.7 - 5 – 8 kms 6.7 6.7 46.7 73.3 80.0 26.7 6.7 66.7 13.3 - 20.0 - 6.7 9 – 12 kms - - 27.3 72.7 72.7 18.2 - 45.5 - - 9.1 - - > 12 kms 11.1 33.3 44.4 66.7 77.8 44.4 - 33.3 - - 33.3 - 11.1
Mukhiya’s religion and caste Upper caste 12.5 18.8 31.3 81.3 93.8 12.5 - 56.3 12.5 - 18.8 - 6.3 Upper backward caste - - 46.2 61.5 69.2 30.8 7.7 30.8 - - 23.1 - 7.7 Lower backward caste 16.7 - 33.3 50.0 66.7 33.3 16.7 50.0 16.7 - 16.7 - - Scheduled caste - 11.1 66.7 88.9 66.7 44.4 - 55.6 - 11.1 33.3 11.1 - Muslim - - 50 50.0 50.0 16.7 - 66.7 - - - - -
Mukhiya’s gender Male 7.4 11.1 44.4 81.5 81.5 33.3 3.7 55.6 7.4 3.7 18.5 - 7.4 Female 4.3 4.3 43.5 56.5 65.2 17.4 4.3 43.5 4.3 - 21.7 4.3 - All GPs 6.0 8.0 44.0 70.0 74.0 26.0 4.0 50.0 6.0 2.0 20.0 2.0 4.0
Source: Bihar PRI survey data. Note: Sample size is 50 GPs.

119
Table 4.01 Average distance in kilometres of GP headquarters from important centres
Centre Bhojpur Nalanda Begusarai Saharsa Sitamarhi All Districts Pucca road 0.6 1.7 0.2 1.8 0.6 1.0
Bus stop 2.1 4.3 1.4 3.3 1.8 2.6 Railway station 17.4 8.0 11.0 16.3 10.7 12.7 Block office 9.6 10.4 4.0 9.5 6.3 8.0 Urban centre 20.9 9.0 5.5 19.2 10.9 13.1 Post office 0.3 2.2 0.4 1.4 0.9 1.0 Commercial bank 3.6 6.5 2.0 3.3 3.9 3.9 High school 2.3 3.2 2.4 3.1 4.9 3.2 Public health centre 2.3 1.7 0.4 1.6 3.3 1.9 Source: Bihar PRI survey data. Note: Sample size is 50 GPs. Table 4.02 Per cent of GPs by distance of GP headquarters to block office and commercial bank
Distance to Bhojpur Nalanda Begusarai Saharsa Sitamarhi All
Block Office 0 – 4 kms 20.0 20.0 60.0 10.0 40.0 30.0 5 – 8 kms 40.0 20.0 30.0 20.0 40.0 30.0 9 – 12 kms 10.0 40.0 10.0 40.0 10.0 22.0 > 12 km s 30.0 20.0 - 30.0 10.0 18.0
Commercial Bank
0 – 4 kms 70.0 40.0 90.0 80.0 60.0 68.0 5 – 8 kms 20.0 20.0 10.0 20.0 30.0 20.0 9 – 12 kms 10.0 30.0 - - - 8.0 > 12 kms - 10.0 - - 10.0 4.0
Source: Bihar PRI survey data. Note: Sample size is 50 GPs.

120
Table 4.03 Per cent of GPs with a Panchayat Bhavan and its use
Use of Panchayat Bhavan Characteristics of GP
GPs with Panchayat
Bhavan Panchayat office
Storage space
Other purpose Unusable Total
District Bhojpur 60.0 33.3 - 33.3 33.3 100.0 Nalanda 60.0 66.7 - - 33.3 100.0 Begusarai 80.0 75.0 12.5 - 12.5 100.0 Saharsa 50.0 80.0 20.0 - - 100.0 Sitamarhi 60.0 100.0 - - - 100.0 Distance to block headquarters 0 – 4 kms 73.3 81.8 - - 18.2 100.0 5 – 8 kms 86.7 69.2 7.7 7.7 15.4 100.0 9 – 12 kms 36.4 50.0 25.0 - 25.0 100.0 > 12 kms 33.3 66.7 - 33.3 - 100.0 Mukhiya’s religion and caste Upper caste 62.5 60.0 10.0 10.0 20.0 100.0 Upper backward caste 76.9 70.0 - 10.0 20.0 100.0 Lower backward caste (H+M) 50.0 100.0 - - - 100.0 Scheduled caste 44.4 75.0 - - 25.0 100.0 Muslim 66.7 75.0 25.0 - - 100.0 Mukhiya’s gender Male 51.9 78.6 - 14.3 7.1 100.0 Female 73.9 64.7 11.8 0.0 23.5 100.0 All GPs 62.0 71.0 6.5 6.5 16.1 100.0 Source: Bihar PRI survey data. Note: Sample size is 50 GPs.

121
Table 4.04 Per cent of GPs with a Panchayat Bhavan and the source of construction funds
Source of construction funds
Characteristics
Per cent of GPs with Panchayat Bhavan.
Gov’t funds dedicated to Panchayat Bhavans.
Gov’t funds
from other schemes.
Unknown Total
District Bhojpur 60.0 66.7 - 33.3 100.0 Nalanda 60.0 71.4 14.3 14.3 100.0 Begusarai 80.0 100.0 - - 100.0 Saharsa 50.0 75.0 25.0 - 100.0 Sitamarhi 60.0 100.0 - - 100.0 Distance to block headquarters 0 – 4 kms 73.3 100.0 - - 100.0 5 – 8 kms 86.7 83.3 8.3 8.3 100.0 9 – 12 kms 36.4 75.0 25.0 - 100.0 > 12 kms 33.3 50.0 - 50.0 100.0
Mukhiya’s religion and caste
Upper caste 62.5 90.0 - 10.0 100.0 Upper backward caste 76.9 80.0 - 20.0 100.0 Lower backward caste (H+M) 50.0 100.0 - - 100.0 Scheduled caste 44.4 75.0 25.0 - 100.0 Muslim 66.7 75.0 25.0 - 100.0
Mukhiya’s gender Male 51.9 86.7 - 13.3 100.0 Female 73.9 81.3 12.5 6.3 100.0
All GPs 62.0 83.9 6.5 9.7 100.0 Source: Bihar PRI survey data. Note: Sample size is 50 GPs.

122
Table 4.05 Information on the conditions of Panchayat Bhavans functioning as an office
Per cent of GPs with functioning office having
Characteristics
Average number of
rooms Roof in good condition Toilet Meeting hall
District
Bhojpur 1.3 80.0 20.0 30.0 Nalanda 2.0 100.0 50.0 50.0 Begusarai 1.8 80.0 70.0 70.0 Saharsa 1.3 60.0 30.0 30.0 Sitamarhi 2.0 70.0 60.0 60.0
Distance of GP from block headquarters 0 – 4 kms 1.6 73.3 40.0 73.3 5 – 8 kms 1.7 80.0 53.3 40.0 9 – 12 kms 1.6 72.7 36.4 27.3 > 12 kms 1.8 88.9 55.6 44.4
Mukhiya’s religion and caste Upper caste 1.7 75.0 50.0 50.0 Upper backward caste 1.8 84.6 61.5 46.2 Lower backward caste (H+M) 2.0 100.0 66.7 66.7 Scheduled caste 1.6 77.8 11.1 44.4 Muslim 1.2 50.0 33.3 33.3
Mukhiya’s gender Male 1.8 81.5 55.6 44.4 Female 1.5 73.9 34.8 52.2
All GPs 1.7 78.0 46.0 48.0 Source: Bihar PRI survey data. Note: Sample size is 50 GPs.

123
Table 4.06 Information on availability of furniture and fixtures in GP offices
Average number per GP office
Per cent of GPs reporting current availability as adequate
regarding Characteristics
Tables Chairs Almirah Tables Chairs Almirah
District Bhojpur 0.8 8.2 1.2 - 10.0 0.0 Nalanda 1.2 11.1 0.7 10.0 30.0 10.0 Begusarai 1.1 9.3 1.0 50.0 50.0 50.0 Saharsa 0.9 6.3 0.6 - - - Sitamarhi 1.2 12.2 1.0 20.0 40.0 20.0
Distance from block headquarters 0 – 4 kms 1.1 10.9 0.9 33.3 40.0 33.3 5 – 8 kms 1.0 10.6 0.8 20.0 26.7 13.3 9 – 12 kms 1.2 6.8 1.0 - 9.1 0.0 > 12 kms 0.9 8.1 1.0 - 22.2 11.1
Mukhiya’s religion and caste Upper caste 0.7 9.1 0.9 6.3 18.8 12.5 Upper backward caste 1.2 11.1 1.0 30.8 53.8 30.8 Lower backward caste (H+M) 1.3 11.0 0.8 16.7 - - Scheduled caste 1.1 7.4 0.7 11.1 11.1 - Muslim 1.2 8.2 1.0 16.7 33.3 33.3 Mukhiya’s gender
Male 0.9 8.9 1.0 18.5 25.9 18.5 Female 1.2 10.0 0.8 13.0 26.1 13.0
All GPs 1.0 9.4 0.9 16.0 26.0 16.0 Source: Bihar PRI survey data. Note: Sample size is 50 GPs.

124
Table 4.07 Summary of employees, responsibilities, and terms of employment
Level of government Employee
Gram Panchayat
Panchayat Sachiv: 1. Appointed by GoB. 2. Enjoys a timescale of pay
Panchayat Rozgar Sevak:
1. Appointed by the Department of Rural Development.
2. Works only for NREGA. 3. Has a consolidated monthly pay of Rs.
3,000 which is low pay by any standard.
Nyay Mitra:
1. Appointed by GoB. 2. Attempts to settle legal disputes at the
local level. 3. Has a consolidated monthly pay of Rs.
2,000, which is low pay by any standard.
Panchayat Samiti
1. All the work is done by the BDO office. There are no separate appointments for PS work.
2. For NREGA related work, there are
three appointments, all working under the BDO and appointed by GoB. Programme officer: consolidated pay Rs. 20,000 per month. Accountant: consolidated pay Rs 8,000 per month. Panchayat technical assistant: consolidated pay Rs. 3,000 per month.
Zilla Parishad
1. They have their own human resources, with about 80-100 sanctioned posts.
2. Many posts are vacant, and the actual number of employees in our sample varies from 22 in Saharsa to 56 in Sitamarhi.

125
Table 4.08 Average number of Gram Panchayat employees and per cent female
Per cent female Characteristics Average number
of employees Panchayat Sachiv
Rozgar Sevak
Technical Assistants
Nyay Mitra
District Bhojpur 3.1 - - - - Nalanda 3.6 - 50.0 - 16.7 Begusarai 4.4 - - - 50.0 Saharsa 3.7 - - - 57.1 Sitamarhi 4.5 - - 20.0 - Distance from block headquarters
0 – 4 kms 4.1 - 13.3 0.0 12.5 5 – 8 kms 3.9 - 13.3 6.7 12.5 9 – 12 kms 3.9 - 9.1 0.0 28.6 > 12 kms 3.3 - 0.0 11.1 60.0
Mukhiya’s religion and caste Upper caste 3.9 - 12.5 6.3 45.5 Upper backward caste 3.8 - 7.7 0.0 25.0 Lower backward caste (H+M) 4.0 - 0.0 0.0 0.0 Scheduled caste 3.9 - 22.2 11.1 0.0 Muslim 3.8 - 0.0 0.0 33.3 Mukhiya’s gender
Male 3.9 - 14.8 3.7 20.0 Female 3.9 - 4.3 4.3 30.8
All GPs 3.9 - 10.0 4.0 24.8 Source: Bihar PRI survey data. Note: Sample size is 50 GPs.

126
Table 4.09 Profile of Gram Panchayat employees
Characteristics Average Age Average length of service Average number of GPs served
Panchayat Sachiv Bhojpur 49.8 14.5 1.9 Nalanda 45.8 7.0 1.6 Begusarai 44.9 3.8 1.9 Saharsa 45.8 12.5 1.6 Sitamarhi 44.7 12.0 1.2
Rozgar Sevak Bhojpur 30.1 2.0 1.3 Nalanda 28.4 1.5 1.2 Begusarai 29.9 1.5 1.9 Saharsa 29.0 2.0 1.2 Sitamarhi 27.0 1.9 1.5
Technical Assistants Bhojpur 32.0 2.0 11.9 Nalanda 42.1 1.0 1.3 Begusarai 33.2 1.4 7.8 Saharsa 32.0 2.0 7.4 Sitamarhi 32.0 1.6 9.1
Nyay Mitra Bhojpur 31.3 2.0 1.0 Nalanda 36.0 1.2 1.2 Begusarai 35.8 1.0 1.0 Saharsa 36.6 1.6 1.0 Sitamarhi 40.6 1.5 1.0
Source: Bihar PRI survey data Note: Sample size is 50 GPs.

127
Table 4.10 Distribution of Panchayat Sachivs and Rozgar Sevaks, by education (per cent)
Educational level Bhojpur Nalanda Begusarai Saharsa Sitamarhi All
Panchayat Sachivs Passed secondary 50.0 10.0 44.4 40.0 20.0 32.7 Passed higher secondary 30.0 60.0 33.3 20.0 30.0 34.7 Graduate and above 20.0 30.0 22.2 40.0 50.0 32.7
Rozgar Sevak Passed secondary - - - 10.0 10.0 4.0 Passed higher secondary 10.0 40.0 - - 10.0 12.0 Graduate and above 90.0 60.0 100.0 90.0 80.0 84.0
Technical Assistant Passed higher secondary - 16.7 0.0 10.0 20.0 8.7 Graduate and above 100.0 83.3 100.0 90.0 80.0 91.3
Nyay Mitra Passed higher secondary - - - 14.3 12.5 7.4 Graduate and above 100.0 100.0 100.0 85.7 87.5 92.6 Source: Bihar PRI survey data. Note: Sample size is 50 GPs.

128
Table 4.11 Distribution of non-NREGA project related responsibilities, by district
Responsible functionary Bhojpur Nalanda Begusarai Saharsa Sitamarhi All
Project planning and budgeting Mukhiya - 30.0 20.0 10.0 20.0 16.0 Rozgar Sevak - - 10.0 - 10.0 4.0 Mukhiya + Rozgar Sevak - 50.0 20.0 40.0 70.0 36.0 TA/AE1 100.0 20.0 50.0 50.0 - 44.0 Programme Officer - - - - - -
Supervision of work Mukhiya - 50.0 - - - 10.0 Rozgar Sevak - - - - - - Mukhiya + Rozgar Sevak - 20.0 - - 50.0 14.0 TA/AE1 10.0 30.0 90.0 - 50.0 36.0 Programme Officer 90.0 - 10.0 100.0 - 40.0
Maintenance of records and accounts Mukhiya - 20.0 10.0 - 10.0 8.0 Rozgar Sevak 60.0 20.0 50.0 100.0 60.0 58.0 Mukhiya + Rozgar Sevak 40.0 60.0 30.0 - 30.0 32.0 TA/AE1 - - 10.0 - - 2.0 Programme Officer - - - - - -
Total 100.0 100.0 100.0 100.0 100.0 100.0 Source: Bihar PRI survey data. Note: Sample size is 50 GPs. 1TA/AE = technical assistant/assistant engineer.

129
Table 4.12 Distribution of non-NREGA related responsibilities, by district
Distance to block office (kms) (all figures in per cent) Responsible functionary
0 – 4 5 – 8 9 – 12 > 12 All
Project planning and budgeting Mukhiya 20.0 20.0 0.0 22.2 16.0 Rozgar Sevak - 6.7 9.1 0.0 4.0 Mukhiya + Rozgar Sevak 46.7 26.7 45.5 22.2 36.0 TA/AE1 33.3 46.7 45.5 55.6 44.0 Programme Officer - - - - -
Supervision of work Mukhiya 6.7 6.7 18.2 11.1 10.0 Rozgar Sevak - - - - - Mukhiya + Rozgar Sevak 13.3 20.0 9.1 11.1 14.0 TA/AE1 53.3 33.3 36.4 11.1 36.0 Programme Officer 26.7 40.0 36.4 66.7 40.0
Maintenance of records and accounts Mukhiya 20.0 - 9.1 0.0 8.0 Rozgar Sevak 40.0 60.0 63.6 77.8 58.0 Mukhiya + Rozgar Sevak 33.3 40.0 27.3 22.2 32.0 TA/AE1 6.7 - - - 2.0 Programme Officer - - - - -
Total 100.0 100.0 100.0 100.0 100.0 Source: Bihar PRI survey data. Note: Sample size is 50 GPs. 1 TA/AE = technical assistant/assistant engineer.

130
Table 4.13 Distribution of NREGA-related responsibilities of GPs, by district (per cent)
Responsible functionary Bhojpur Nalanda Begusarai Saharsa Sitamarhi All
Project planning and budgeting Mukhiya 20.0 60.0 - 20.0 - 20.0 Rozgar Sevak - - 40.0 - 30.0 14.0 Mukhiya + Rozgar Sevak - - - - - - TA/AE1 80.0 30.0 60.0 80.0 70.0 64.0 Programme Officer - 10.0 - - - 2.0 Others - - - - - -
Supervision of work Mukhiya - - - - - - Rozgar Sevak - - 10.0 - - 2.0 Mukhiya + Rozgar Sevak - - - - - - TA/AE1 30.0 50.0 80.0 10.0 30.0 40.0 Programme Officer 50.0 50.0 10.0 70.0 70.0 50.0 Others 20.0 - - 20.0 - 8.0
Maintenance of records and accounts Mukhiya - 10.0 10.0 - - 4.0 Rozgar Sevak 100.0 90.0 60.0 80.0 50.0 76.0 Mukhiya + Rozgar Sevak - - 30.0 20.0 - 10.0 TA/AE - - - - 50.0 10.0 Programme Officer - - - - - - Others - - - - - -
Total 100.0 100.0 100.0 100.0 100.0 100.0 Source: Bihar PRI survey data. Note: Sample size is 50 GPs. 1TA/AE = technical assistant/assistant engineer.

131
Table 4.14 Distribution of NREGA-related responsibilities of GPs, by district (per cent)
Distance to block office (kms) Responsible functionary
0 – 4 5 – 8 9 – 12 > 12 All
Project planning and budgeting Mukhiya 13.3 13.3 36.4 22.2 20.0 Rozgar Sevak 26.7 6.7 9.1 11.1 14.0 Mukhiya + Rozgar Sevak - - - - - TA/AE1 60.0 80.0 45.5 66.7 64.0 Programme Officer - - 9.1 - 2.0 Others - - - - -
Supervision of work Mukhiya - - - - - Rozgar Sevak 6.7 - - - 2.0 Mukhiya + Rozgar Sevak - - - - - TA/AE1 53.3 40.0 36.4 22.2 40.0 Programme Officer 33.3 46.7 63.6 66.7 50.0 Others 6.7 13.3 - 11.1 8.0
Maintenance of records and accounts Mukhiya 6.7 - 9.1 - 4.0 Rozgar Sevak 66.7 66.7 90.9 88.9 76.0 Mukhiya + Rozgar Sevak 13.3 13.3 - 11.1 10.0 TA/AE1 13.3 20.0 - - 10.0 Programme Officer - - - - - Others - - - - -
Total 100.0 100.0 100.0 100.0 100.0 Source: Bihar PRI survey data. Note: Sample size is 50 GPs. 1TA/AE = technical assistant/assistant engineer.

132
Table 4.15 Distribution of administrative and quasi-judicial responsibilities, by district (per cent)
Responsible functionary Bhojpur Nalanda Begusarai Saharsa Sitamarhi All
Responsibility for general administration Mukhiya 60.0 80.0 - 30.0 60.0 46.0 Panchayat Sachiv - - - - - - Mukhiya + Panchayat Sachiv 40.0 20.0 100.0 70.0 40.0 54.0
Responsibility for agenda and minutes Mukhiya - 10.0 - - - 2.0 Panchayat Sachiv 100.0 50.0 50.0 100.0 90.0 78.0 Mukhiya + Panchayat Sachiv - 40.0 50.0 - 10.0 20.0
Responsibility for preparation of annual plan Mukhiya 100.0 50.0 20.0 20.0 10.0 40.0 Panchayat Sachiv - - - - 30.0 6.0 Mukhiya + Panchayat Sachiv - 50.0 80.0 80.0 60.0 54.0
Responsibility for quasi-judicial functions Mukhiya - - 10.0 10.0 - 4.0 Sarpanch - 50.0 10.0 20.0 20.0 20.0 Mukhiya + Sarpanch 100.0 50.0 80.0 70.0 80.0 76.0
Total 100.0 100.0 100.0 100.0 100.0 100.0 Source: Bihar PRI survey data. Note: Sample size is 50 GPs.

133
Table 4.16 Mukhiya’s training
Per cent of Mukhiyas trained in
Characteristics Average number of programmes
attended
Average number of
training days
General administration
Financial administration
Project implementation
District Bhojpur 2.3 4.3 80.0 80.0 80.0 Nalanda 4.0 7.1 90.0 90.0 100.0 Begusarai 2.8 3.7 100.0 100.0 100.0 Saharsa 3.2 6.8 100.0 100.0 90.0 Sitamarhi 3.5 5.0 100.0 100.0 100.0
Distance to block headquarters
0 – 4 kms 2.9 4.6 100.0 100.0 100.0 5 – 8 kms 2.8 3.8 86.7 86.7 93.3 9 – 12 kms 5.2 10.7 90.9 90.9 81.8 > 12 kms 2.0 3.2 100.0 100.0 100.0
Mukhiya’s religion and caste Upper caste 2.9 6.0 100.0 100.0 93.8 Upper backward caste 4.0 6.3 92.3 92.3 92.3 Lower backward caste (H+M) 1.5 2.2 100.0 100.0 100.0 Scheduled caste 3.3 4.6 77.8 77.8 88.9 Muslim 3.8 6.3 100.0 100.0 100.0
Mukhiya’s gender Male 3.2 6.8 96.3 96.3 96.3 Female 3.1 3.8 91.3 91.3 91.3
All GPs 3.2 5.4 94.0 94.0 94.0
Source: Bihar PRI survey data. Note: Sample size is 50 GPs.

134
Table 4.17 Training of Ward Members, Sarpanchs, and Panchs
Ward Members Sarpanchs Panchs
Characteristics Average number
of training programmes
arranged
Average number
of training
days
Average. number
attending at least 1 training
Average number
attending all
trainings
Average number of training
programmes attended
Average number
of training
days
Average number of
training programmes
attended
Average number
of training
days
District Bhojpur 1.5 2.2 8.3 8.3 1.3 3.2 1.0 1.0 Nalanda 2.1 3.0 6.8 5.9 2.8 4.5 1.7 4.3 Begusarai 1.9 2.8 8.7 7.9 1.0 1.0 1.0 2.0 Saharsa 1.7 1.7 6.1 6.1 1.0 1.0 1.0 1.0 Sitamarhi 3.1 4.6 12.4 11.0 1.0 3.0 1.0 3.0
Distance to block headquarters 0 – 4 kms 2.5 4.2 13.3 12.9 2.3 3.7 0.0 5.0 5 – 8 kms 1.4 1.7 7.5 6.9 1.3 3.0 1.2 2.6 9 – 12 kms 3.2 3.6 7.2 6.3 3.0 5.5 1.8 4.8 > 12 kms 1.5 2.3 4.9 4.5 1.4 2.2 1.0 2.0
Mukhiya’s religion and caste Upper caste 1.7 1.9 7.6 7.0 1.9 3.5 1.3 3.3 Upper backward caste 2.0 2.8 6.0 4.9 2.4 4.4 1.8 4.6 Lower backward caste (H+M) 1.5 2.5 11.5 12.0 1.0 2.0 1.0 3.0 Scheduled caste 2.8 3.2 8.8 7.7 1.0 2.0 1.0 1.0 Muslim 3.2 6.2 11.8 10.5 0.0 - - - Mukhiya’s gender
Male 2.5 3.7 7.9 6.7 2.2 3.5 1.4 3.6 Female 1.6 1.9 9.4 9.2 1.3 3.3 1.3 3.0
All GPs 2.1 2.8 8.5 7.8 1.4 2.5 1.1 2.3 Source: Bihar PRI survey data. Note: Sample size is 50 GPs.

135
Table 4.18 Training of Panchayat Sachivs
Per cent trained in
Characteristics Average number of programmes
attended
Average number of
training days
General administration
Financial administration
Project implementation
District Bhojpur 1.5 60.9 100.0 100.0 100.0 Nalanda 2.5 31.9 100.0 100.0 100.0 Begusarai 2.7 32.3 100.0 100.0 100.0 Saharsa 1.3 80.0 90.0 90.0 90.0 Sitamarhi 1.4 37.8 71.4 71.4 71.4
Distance to block headquarters 0 – 4 kms 2.0 45.4 100.0 100.0 100.0 5 – 8 kms 2.6 52.1 83.3 83.3 83.3 9 – 12 kms 1.1 57.3 100.0 100.0 100.0 > 12 kms 1.1 63.9 85.7 85.7 85.7
Mukhiya ‘s religion and caste Upper caste 1.5 63.0 100.0 100.0 100.0 Upper backward caste 1.3 45.5 100.0 100.0 100.0 Lower backward caste (H+M) 1.3 60.7 60.0 60.0 60.0 Scheduled caste 3.1 41.3 100.0 100.0 100.0 Muslim 1.4 59.2 80.0 80.0 80.0 Mukhiya‘s gender
Male 1.4 39.3 85.0 85.0 85.0 Female 2.1 69.0 100.0 100.0 100.0
All GPs 1.9 48.6 92.3 92.3 92.3 Source: Bihar PRI survey data. Note: Sample size is 50 GPs.

136
Table 4.19 Training of Rozgar Sevaks
Per cent trained in Characteristics
Average number of programmes
attended
Average number of
training days
General administration
Financial administration
Project implementation
District Bhojpur 1.9 34.7 40.0 100.0 100.0 Nalanda 2.1 32.4 70.0 70.0 90.0 Begusarai 2.3 32.8 90.0 100.0 100.0 Saharsa 1.1 30.8 70.0 80.0 70.0 Sitamarhi 2.4 32.9 80.0 100.0 100.0
Distance to block headquarters 0 – 4 kms 2.1 32.6 86.7 93.3 86.7 5 – 8 kms 1.9 31.9 60.0 86.7 100.0 9 – 12 kms 1.9 32.3 81.8 90.9 90.9 > 12 kms 1.9 34.9 44.4 88.9 88.9
Mukhiya‘s religion and caste
Upper caste 1.7 31.9 81.3 93.8 100.0 Upper backward caste 2.0 32.2 76.9 100.0 100.0 Lower backward caste (H+M) 2.2 32.3 66.7 100.0 83.3 Scheduled caste 2.4 35.8 44.4 77.8 88.9 Muslim 1.7 31.8 66.7 66.7 66.7 Mukhiya‘s gender
Male 2.1 33.2 66.7 88.9 92.6 Female 1.8 32.2 73.9 91.3 91.3
All GPs 2.0 32.7 70.0 90.0 92.0 Source: Bihar PRI survey data. Note: Sample size is 50 GPs.

137
Table 4.20 Training of technical assistants
Per cent trained in Characteristics
Average number of programmes
attended
Average number of
training days
General administration
Financial administration
Project implementation
District Bhojpur 2.6 34.4 40.0 50.0 40.0 Nalanda 2.8 74.3 30.0 30.0 30.0 Begusarai 4.1 35.9 80.0 80.0 80.0 Saharsa 1.0 30.0 50.0 60.0 60.0 Sitamarhi 2.7 23.3 20.0 30.0 30.0
Distance to block headquarters 0 – 4 kms 3.1 32.0 60.0 66.7 66.7 5 – 8 kms 3.0 34.4 40.0 46.7 40.0 9 – 12 kms 1.8 52.0 36.4 36.4 36.4 > 12 kms 1.8 42.6 33.3 44.4 44.4
Mukhiya’s religion and caste Upper caste 2.3 32.7 62.5 68.8 68.8 Upper backward caste 3.5 54.4 53.8 61.5 53.8 Lower backward caste (H+M) 1.0 30.0 16.7 16.7 16.7 Scheduled caste 2.5 34.8 33.3 33.3 33.3 Muslim 2.3 23.3 16.7 33.3 33.3 Mukhiya’s gender
Male 2.7 42.1 40.7 40.7 40.7 Female 2.5 34.6 47.8 60.9 56.5
All GPs 2.6 39.6 44.0 50.0 48.0 Source: Bihar PRI survey data. Note: Sample size is 50 GPs.

138
Table 4.21 Training of Nyay Mitras
Percentage of Nyay Mitras trained in Characteristics of GP
Average number of programmes
attended
Average number of training days General.
Administration Financial.
administration Project
Implementation
District Bhojpur 1.0 3.0 12.5 12.5 12.5 Nalanda 3.0 8.0 100.0 66.7 66.7 Begusarai - 0.0 - - - Saharsa 1.0 1.0 12.5 12.5 12.5 Sitamarhi - - - - -
Distance to block headquarters 0 – 4 kms - - - - - 5 – 8 kms 1.0 3.0 25.0 25.0 25.0 9 – 12 kms 3.0 3.0 33.3 33.3 33.3 > 12 kms 1.0 11.0 16.7 12.5 12.5
Mukhiya’s religion and caste
Upper caste 1.0 2.0 20.0 18.2 18.2 Upper backward caste 5.0 5.0 50.0 33.3 33.3 Lower backward caste (H+M) - - 25.0 25.0 25.0 Scheduled caste 1.0 11.0 - - - Muslim - - - - -
Mukhiya’s gender Male 2.3 5.7 30.0 25.0 25.0 Female 1.0 3.0 12.5 12.5 12.5
All GPs 1.0 2.4 25.0 18.3 18.3 Source: Bihar PRI survey data. Note: Sample size is 50 GPs.

139
Table 4.22 Average number of activities undertaken by GPs, by Mukhiya’s education
Average number of activities undertaken District Education of Mukhiya Number of
GPs Production related
Infrastructure related
Development related
Passed primary or below 4 1.3 2.8 4.5 Passed secondary 4 1.5 3.3 4.8 Passed higher secondary or above 2 1.0 2.5 5.0
Bhojpur
Total 10 1.3 2.9 4.7 Passed primary or below 2 1.5 3.5 5.5 Passed secondary 4 2.0 4.0 5.8 Passed higher secondary or above 4 1.8 4.3 6.5 Nalanda
Total 10 1.8 4.0 6.0 Passed primary or below 4 1.5 3.0 6.0 Passed secondary 1 1.0 2.0 6.0 Passed higher secondary or above 5 2.8 3.2 5.6 Begusarai
Total 10 2.1 3.0 5.8 Passed primary or below 5 0.6 2.4 5.6 Passed secondary 4 0.3 2.5 3.8 Passed higher secondary or above 1 4.0 4.0 7.0 Saharsa
Total 10 0.8 2.6 5.0 Passed primary or below 5 1.4 2.6 5.6 Passed secondary 3 1.0 3.7 6.0 Passed higher secondary or above 2 1.0 4.0 4.0 Sitamarhi
Total 10 1.2 3.2 5.4 Passed primary or below 20 1.2 2.8 5.5 Passed secondary 16 1.2 3.3 5.1 Passed higher secondary or above 14 2.1 3.6 5.6 All
Total 50 1.4 3.1 5.4 Source: Bihar PRI survey data. Note: Sample size is 50 GPs.

140
Table 4.23 Average number of activities undertaken by GPs, by Mukhiya’s number of terms
Average number of activities undertaken
District Mukhiya’s number of terms
Number of GPs Production
related Infrastructure
related Development
related
One term 10 1.3 2.9 4.7 More than 1 term - - - - Bhojpur Total 10 1.3 2.9 4.7 One term 7 1.9 4.0 6.1 More than 1 term 3 1.7 4.0 5.7 Nalanda Total 10 1.8 4.0 6.0 One term 6 2.5 3.2 5.8 More than 1 term 4 1.5 2.8 5.8 Begusarai Total 10 2.1 3.0 5.8 One term 10 0.8 2.7 4.8 More than 1 term - - - - Saharsa Total 10 0.8 2.7 4.8 One term 8 1.3 3.0 5.8 More than 1 term 2 1.0 4.0 4.0 Sitamarhi Total 10 1.2 3.2 5.4 One term 41 1.5 3.1 5.4 More than 1 term 9 1.4 3.3 5.5 All Total 50 1.4 3.1 5.4
Source: Bihar PRI survey data. Note: Sample size is 50 GPs.

141
Table 4.24 Average number of activities undertaken by GPs, by distance to block office
Average number of activities undertaken
District Distance to the block office
Number of GPs Productivity
related Infrastructure
related Development
related
0 – 8 kms 6 1.50 2.33 5.33 More than 8 kms 4 1.00 3.75 3.75 Bhojpur Total 10 1.30 2.90 4.70 0 – 8 kms 4 1.50 4.00 5.75 More than 8 kms 6 2.00 3.83 6.17 Nalanda Total 10 1.80 3.90 6.00 0 – 8 kms 9 1.78 3.00 5.78 More than 8 kms 1 5.00 3.00 6.00 Begusarai Total 10 2.10 3.00 5.80 0 – 8 kms 3 0.67 2.33 4.67 More than 8 kms 7 0.86 2.71 5.14 Saharsa Total 10 0.80 2.60 5.00 0 – 8 kms 8 1.50 3.38 5.25 More than 8 kms 2 0.00 2.00 6.00 Sitamarhi Total 10 1.20 3.10 5.40 0 – 8 kms 30 1.50 3.03 5.43 More than 8 kms 20 1.35 3.20 5.30 All Districts Total 50 1.44 3.10 5.38
Source: Bihar PRI survey data. Note: Sample size is 50 GPs.

142
Table 4.25 Average number of activities undertaken by GPs, by availability of Bhavan
Average number of activities undertaken
District
Is Panchayat Bhavan used as Panchayat
Office?
Number of GPs Production
related Infrastructure
related Development
related
Yes 2 3.0 1.5 5.0 No 8 0.9 3.3 4.6 Bhojpur Total 10 1.3 2.9 4.7 Yes 4 1.3 4.0 5.3 No 6 2.2 4.0 6.5 Nalanda Total 10 1.8 4.0 6.0 Yes 6 2.0 2.8 6.2 No 4 2.3 3.3 5.3 Begusarai Total 10 2.1 3.0 5.8 Yes 4 0.3 2.3 3.5 No 6 1.2 2.8 6.0 Saharsa Total 10 0.8 2.6 5.0 Yes 6 1.5 3.8 5.0 No 4 0.8 2.3 6.0 Sitamarhi Total 10 1.2 3.2 5.4 Yes 22 1.5 3.1 5.1 No 28 1.4 3.2 5.6 All Districts Total 50 1.4 3.1 5.4
Source: Bihar PRI survey data. Note: Sample size is 50 GPs.

143
Table 5.01 Average number of programmes and expenditures per GP and per capita
Item Bhojpur Nalanda Begusarai Saharsa Sitamarhi All
2006-07
Average number of programmes per GP 12.6 19.7 5.3 7.6 10.7 11.2
Average expenditure per GP (Rs. 000) 693.1 1274.3 348.2 366.1 975.4 731.4
Average expenditure per programme (Rs. 000) 51.0 69.8 103.8 72.6 66.7 72.6
Average expenditure per capita (Rs) 59.6 134.3 26.8 38.4 77.2 67.3
2007-08
Average number of programmes per GP 7.9 11.0 6.6 10.9 9.2 9.1
Average expenditure per GP (Rs. 000) 407.1 843.4 502.1 857.6 801.1 682.3
Average expenditure per programme (Rs. 000) 48.7 92.7 74.1 82.6 102.1 80.4
Average expenditure per capita (Rs) 33.3 87.0 44.7 81.1 72.6 63.7
2008-09
Average number of programmes per GP 16.8 9.9 13.7 14.1 28.4 16.6
Average expenditure per GP (Rs. 000) 1379.2 676.2 1071.4 1580.5 868.2 1115.1
Average expenditure per programme (Rs. 000) 82.7 89.9 109.2 137.4 38.7 91.6
Average expenditure per capita (Rs) 106.7 71.4 79.4 147.6 76.7 96.4 Source: Bihar PRI survey data. Note: Sample size is 50 GPs.

144
Table 5.02 Average and per capita outlays for 6 important schemes, by district
Average outlay per GP (Rs. 000)
Average outlay per capita (Rs.) District
2006-07 2007-08 2008-09 2006-07 2007-08 2008-09 Bhojpur
Indira Awas Yojana 28.2 76.2 71.6 2.2 6.2 5.4 Kanya Vivah Yojana 0.0 0.0 9.0 0.0 0.0 0.8 Total sanitation campaign 0.0 18.7 11.4 0.0 1.6 0.9 Old-age pension scheme 100.9 102.8 801.3 10.0 10.1 71.3 Laxmibai Pension Yojana 0.0 0.0 0.0 0.0 0.0 0.0 Pension of handicapped scheme 0.3 0.3 2.6 0.0 0.0 0.2
Total 129.4 198.0 895.9 12.2 17.9 78.6 Nalanda
Indira Awas Yojana 20.5 133.3 93.3 2.3 15.0 9.7 Kanya Vivah Yojana 0.0 0.0 18.0 0.0 0.0 1.5 Total sanitation campaign 0.0 143.4 48.0 0.0 11.5 4.0 Old-age pension scheme 203.2 303.2 704.0 20.1 24.7 69.0 Laxmibai Pension Yojana 0.0 0.0 6.0 0.0 0.0 0.8 Pension of handicapped scheme 0.0 26.4 6.9 0.0 3.3 0.6
Total 223.7 606.3 876.2 22.5 54.5 85.6 Begusarai
Indira Awas Yojana 69.0 95.9 59.4 5.2 6.9 4.5 Kanya Vivah Yojana 0.0 0.0 5.0 0.0 0.0 0.4 Total sanitation campaign 51.8 17.9 124.0 2.8 1.0 7.6 Old-age pension scheme 201.5 400.2 701.1 22.6 34.9 53.8 Laxmibai Pension Yojana 0.0 0.0 0.0 0.0 0.0 0.0 Pension of handicapped scheme 0.2 0.0 2.0 0.0 0.0 0.2
Total 322.5 514.0 891.5 30.6 42.8 66.5 Saharsa
Indira Awas Yojana 77.0 165.1 184.3 7.8 16.3 19.0 Kanya Vivah Yojana 0.0 1.5 19.0 0.0 0.1 2.2 Total sanitation campaign 0.0 0.0 1.6 0.0 0.0 0.1 Old-age pension scheme 2.7 26.7 217.1 0.3 2.3 23.7 Laxmibai Pension Yojana 4.8 2.6 8.6 0.4 0.2 0.8 Pension of handicapped scheme 0.1 0.1 0.4 0.0 0.0 0.0
Total 84.6 196.0 431.0 8.5 19.0 46.0 Sitamarhi
Indira Awas Yojana 41.9 112.3 88.2 4.1 9.8 6.7 Kanya Vivah Yojana 0.0 0.0 0.0 0.0 0.0 0.0 Total sanitation campaign 0.0 0.0 0.0 0.0 0.0 0.0 Old-age pension scheme 302.8 399.8 799.2 23.5 36.0 71.7 Laxmibai Pension Yojana 0.0 0.0 0.0 0.0 0.0 0.0 Pension of handicapped scheme 0.0 0.0 0.0 0.0 0.0 0.0
Total 344.7 512.1 887.4 27.6 45.7 78.4 Total
Indira Awas Yojana 47.3 116.6 99.4 4.3 10.8 9.1 Kanya Vivah Yojana 0.0 0.3 10.2 0.0 0.0 1.0 Total sanitation campaign 10.4 36.0 37.0 0.6 2.8 2.5 Old-age pension scheme 162.2 246.5 644.5 15.3 21.6 57.9 Laxmibai Pension Yojana 1.0 0.5 2.9 0.1 0.0 0.3 Pension of handicapped scheme 0.1 5.4 2.4 0.0 0.7 0.2
Total 221.0 405.3 796.4 20.3 36.0 71.0
Source: Bihar PRI survey data. Note: Sample size is 50 GPs.

145
Table 5.03 Average number of people recommended and benefitted per GP, by scheme
District Scheme/Year Bhojpur Nalanda Begusarai Saharsa Sitamarhi
All
Indira Awas Yojana R 9.4 37.1 34.1 50.7 50.4 36.3 2006-07 B 13.0 14.7 32.4 46.9 22.8 26.0 R 22.0 50.9 104.3 75.4 83.3 67.2 2007-08 B 27.9 15.3 51.9 72.1 38.2 41.1 R 20.0 73.2 48.1 110.0 104.8 71.2 2008-09 B 20.4 26.9 34.4 92.8 118.9 58.7
Kanya Vivah Yojana R 0.0 0.0 0.0 0.0 0.0 0.0 2006-07 B 0.0 0.0 0.0 0.0 0.0 0.0 R 1.1 2.5 0.0 1.3 1.2 1.2 2007-08 B 0.0 1.4 0.0 0.3 0.0 0.3 R 12.8 6.8 16.6 23.2 1.0 12.1 2008-09 B 2.1 0.0 1.2 5.4 0.0 1.7
Total Sanitation Campaign R 0.0 0.0 35.0 0.0 0.0 7.0 2006-07 B 0.0 0.0 35.0 0.0 0.0 7.0 R 7.5 3.8 21.5 0.0 0.0 6.6 2007-08 B 10.0 7.7 90.8 0.0 0.0 21.7 R 0.0 27.2 207.8 0.0 0.0 47.0 2008-09 B 22.5 0.5 119.8 0.1 0.0 28.6
Source: Bihar PRI survey data. Note: R = Recommended/B = Benefitted Note: Sample size is 50 GPs.

146
Table 5.04 Average number of people recommended and benefitted per GP, by scheme
District Scheme/Year
Bhojpur Nalanda Begusarai Saharsa Sitamarhi All
Old-Age Pension Scheme R 18.2 158.0 46.4 37.6 93.6 70.8 2006-07 B 109.7 232.4 215.8 25.9 331.7 183.1 R 67.1 167.0 51.6 107.8 82.8 95.3 2007-08 B 128.9 334.3 405.8 85.0 423.6 275.5 R 182.4 247.2 54.8 163.7 149.6 159.5 2008-09 B 809.7 722.8 513.2 290.3 799.2 627.0
Laxmibai Pension Yojana R 2.4 0.0 0.0 2.4 1.1 1.2 2006-07 B 0.0 0.0 0.0 2.4 0.0 0.5 R 2.4 2.2 1.5 4.6 1.4 2.4 2007-08 B 0.0 0.0 0.0 2.6 0.0 0.5 R 15.2 68.7 25.7 50.6 78.9 47.8 2008-09 B 0.0 7.0 3.0 6.8 0.0 3.4
Pension for Handicapped Scheme R 1.8 8.6 7.0 4.2 2.3 4.8 2006-07 B 1.6 0.3 0.8 0.8 0.0 0.7 R 3.0 19.0 3.5 6.8 3.4 7.1 2007-08 B 0.7 1.1 0.0 0.8 0.0 0.5 R 15.2 33.1 23.3 15.4 12.5 19.9 2008-09 B 3.1 2.9 11.5 2.3 0.0 4.0
Source: Bihar PRI survey data. Notes: 1. Sample size is 50 GPs.
2. R = Recommended/B = Benefitted. 3. GPs do not have any allocation for administrative purpose. 4. All salary payments are made by the BDO's office. 5. Main projects include: FC12, BRGF, and NREGA. 6. Teachers' salary for primary school are routed through the GPs.

147
Table 5.05 Average expenditure levels of GPs, by district
Average expenditure per GP (Rs. 000)
Average expenditure per capita (Rs.) District Expenditure head
2006-07 2007-08 2008-09 2006-07 2007-08 2008-09
Main projects 578.9 337.1 1295.7 48.7 27.7 100.7 Other projects 27.4 46.7 15.8 2.3 3.7 1.4 Teacher salary 316.4 643.2 470.5 23.7 51.7 37.1 Bhojpur
Total 922.7 1027.1 1782.0 74.8 83.1 139.2 Main projects 1126.7 844.3 655.8 120.6 86.1 68.7 Other projects 68.6 120.1 177.9 6.0 12.2 21.8 Teacher salary 104.4 207.4 156.7 10.2 19.7 15.0 Nalanda
Total 1299.8 1171.7 990.4 136.8 118.0 105.5 Main projects 417.8 288.3 1021.8 30.5 20.6 76.1 Other projects 42.2 136.6 52.6 2.3 11.1 4.1 Teacher salary 274.3 557.0 356.0 23.8 38.1 29.2 Begusarai
Total 734.3 981.9 1430.4 56.6 69.8 109.4 Main projects 359.6 838.5 1531.9 37.7 79.7 142.9 Other projects 79.9 95.4 82.5 7.3 9.0 7.6 Teacher salary 128.6 1190.1 949.1 12.5 107.8 90.6 Saharsa
Total 568.0 2124.1 2563.5 57.5 196.4 241.1 Main projects 422.4 798.1 908.4 38.3 74.0 78.9 Other projects 11.6 129.5 38.2 1.1 10.3 3.5 Teacher salary 238.7 1407.0 597.5 21.0 114.9 46.2 Sitamarhi
Total 672.7 2334.6 1544.1 60.4 199.2 128.6 Main projects 581.1 621.3 1082.7 55.2 57.6 93.4 Other projects 46.0 105.7 73.4 3.8 9.3 7.7 Teacher salary 212.5 800.9 505.9 18.3 66.4 43.6 Total
Total 839.5 1527.9 1662.1 77.2 133.2 144.8 Source: Bihar PRI survey data. Note: Sample size is 50 GPs.

148
Table 5.06 Average FC 12 programme expenditure per GP, by district (Rs. 1,000’s)
District Programme 2006-07 2007-08 2008-09 Solar/vapour lights (new/repair) 0.0/(0.0) 33.4/(10.1) 158.9/(47.9) Drinking water (new/repair) 124.0/(33.6) 77.7/(23.5) 39.8/(12.0) Road (construction/repair) 39.1/(10.6) 46.0/(13.9) 27.9/(8.4) Building (construction/repair) 88.6/(24.0) 2.3/(0.7) 4.6/(1.4) Irrigation (new/repair) 19.2/(5.2) 30.4/(9.2) 20.6/(6.2) Sanitation work (new/repair) 98.2/(26.6) 140.8/(42.6) 79.9/(24.1) Others (new/repair) 0.0/(0.0) 0.0/(0.0) 0.0/(0.0)
Bhojpur
Total 369.0/(100.0) 330.6/(100.0) 331.7/(100.0) Solar/vapour lights 172.9/(55.4) 164.8/(50.1) 65.8/(26.4) Drinking water (new/repair) 25.0/(8.0) 32.9/(10.0) 34.9/(14.0) Road (construction/repair) 29.0/(9.3) 0.0/(0.0) 66.8/(26.8) Building (construction/repair) 38.4/(12.3) 12.8/(3.9) 37.4/(15.0) Irrigation (new/repair) 0.0/(0.0) 0.0/(0.0) 0.0/(0.0) Sanitation work 46.8/(15.0) 96.4/(29.3) 44.4/(17.8) Others 0.0/(0.0) 20.4/(6.2) 0.0/(0.0)
Nalanda
Total 312.1/(100.0) 329.0/(100.0) 249.3/(100.0) Solar/vapour lights 143.9/(50.1) 244.0/(90.7) 320.2/(83.7) Drinking water (new/repair) 0.0/(0.0) 21.8/(8.1) 27.5/(7.2) Road (construction/repair) 70.1/(24.4) 3.2/(1.1) 20.3/(5.3) Building (construction/repair) 9.8/(3.4) 0.0/(0.0) 14.5/(3.8) Irrigation (new/repair) 0.0/(0.0) 0.0/(0.0) 0.0/(0.0) Sanitation work 7.8/(2.7) 0.0/(0.0) 0.0/(0.0) Others 55.7/(19.4) 0.0/(0.0) 0.0/(0.0)
Begusarai
Total 287.3/(100.0) 269.0/(100.0) 382.5/(100.0) Solar/vapour lights 317.7/(88.0) 378.0/(100.0) 349.8/(98.3) Drinking water (new/repair) 14.1/(3.9) 0.0/(0.0) 0.0/(0.0) Road (construction/repair) 4.7/(1.3) 0.0/(0.0) 6.0/(1.7) Building (construction/repair) 24.5/(6.8) 0.0/(0.0) 0.0/(0.0) Irrigation (new/repair) 0.0/(0.0) 0.0/(0.0) 0.0/(0.0) Sanitation work 0.0/(0.0) 0.0/(0.0) 0.0/(0.0) Others 0.0/(0.0) 0.0/(0.0) 0.0/(0.0)
Saharsa
Total 361.0/(100.0) 378.0/(100.0) 355.8/(100.0) Solar/vapour lights 164.7/(47.2) 176.0/(50.9) 179.5/(59.5) Drinking water (new/repair) 105.4/(30.2) 92.7/(26.8) 69.4/(23.1) Road (construction/repair) 44.6/(12.8) 77.1/(22.3) 30.8/(10.2) Building (construction/repair) 9.4/(2.7) 0.0/(0.0) 0.0/(0.0) Irrigation (new/repair) 11.2/(3.2) 0.0/(0.0) 0.0/(0.0) Sanitation work 13.61/(3.9) 0.0/(0.0) 22.0/(7.3) Others 0.0/(0.0) 0.0/(0.0) 0.0/(0.0)
Sitamarhi
Total 348.9/(100.0) 345.8/(100.0) 301.7/(100.0) Solar/vapour lights 166.3/(48.5) 212.6/(64.3) 220.8/(68.1) Drinking water (new/repair) 56.2/(16.4) 38.4/(11.6) 32.4/(10.0) Road (construction/repair) 40.5/(11.8) 19.2/(5.8) 28.8/(8.9) Building (construction/repair) 30.9/(9.0) 3.0/(0.9) 10.7/(3.3) Irrigation (new/repair) 6.2/(1.8) 10.2/(3.1) 3.9/(1.2) Sanitation work 29.8/(8.7) 47.3/(14.3) 27.6/(8.5) Others 13.0/(3.8) 0.0/(0.0) 0.0/(0.0)
Total
Total 342.9/(100.0) 330.7/(100.0) 324.2/(100.0) Source: Bihar PRI survey data. Note: Sample size is 50 GPs.

149
Table 5.07 Average NREGA programme expenditure per GP, by district (Rs. 1,000’s)
District Programmes 2006-07 2007-08 2008-09 Solar/vapour lights 0.0/(0.0) 0.0/(0.0) 0.0/(0.0) Drinking water (new/repair) 0.0/(0.0) 0.0/(0.0) 0.0/(0.0) Road (construction/repair) 98.7/(28.2) 35.5/(32.6) 281.1/(28.0) Building (construction/repair) 4.6/(1.3) 0.0/(0.0) 0.0/(0.0) Irrigation (new/repair) 148.8/(42.5) 52.1/(47.8) 452.8/(45.1) Sanitation work 98.0/(28.0) 21.3/(19.6) 269.1/(26.8) Others 0.0/(0.0) 0.0/(0.0) 0.0/(0.0)
Bhojpur
Total 350.0/(100.0) 108.3/(100.0) 1004.0/(100.0) Solar/vapour lights 0.0/(0.0) 0.0/(0.0) 0.0/(0.0) Drinking water (new/repair) 0.0/(0.0) 0.0/(0.0) 0.0/(0.0) Road (construction/repair) 137.3/(21.2) 140.0/(19.4) 85.7/(14.9) Building (construction/repair) 0.0/(0.0) 0.0/(0.0) 0.0/(0.0) Irrigation (new/repair) 496.7/(76.7) 581.4/(80.6) 489.6/(85.1) Sanitation work 6.5/(1.0) 0.0/(0.0) 0.0/(0.0) Others 6.5/(1.0) 0.0/(0.0) 0.0/(0.0)
Nalanda
Total 647.6/(100.0) 721.4/(100.0) 575.3/(100.0) Solar/vapour lights 0.0/(0.0) 0.0/(0.0) 0.0/(0.0) Drinking water (new/repair) 0.0/(0.0) 0.0/(0.0) 0.0/(0.0) Road (construction/repair) 131.6/(58.0) 285.4/(90.9) 354.9/(50.2) Building (construction/repair) 0.0/(0.0) 0.3/(0.1) 0.0/(0.0) Irrigation (new/repair) 95.3/(42.0) 28.6/(9.1) 123.7/(17.5) Sanitation work 0.0/(0.0) 0.0/(0.0) 223.4/(31.6) Others 0.0/(0.0) 0.0/(0.0) 4.9/(0.7)
Begusarai
Total 226.9/(100.0) 314.0/(100.0) 707.0/(100.0) Solar/vapour lights 0.0/(0.0) 0.0/(0.0) 0.0/(0.0) Drinking water (new/repair) 6.6/(13.2) 0.0/(0.0) 0.0/(0.0) Road (construction/repair) 22.3/(44.7) 314.3/(67.9) 773.4/(53.8) Building (construction/repair) 18.1/(36.3) 0.0/(0.0) 30.2/(2.1) Irrigation (new/repair) 0.0/(0.0) 75.9/(16.4) 628.2/(43.7) Sanitation work 2.9/(5.8) 61.6/(13.3) 0.0/(0.0) Others 0.0/(0.0) 11.1/(2.4) 5.8/(0.4)
Saharsa
Total 49.8/(100.0) 462.9/(100.0) 1437.5/(100.0) Solar/vapour lights 0.0/(0.0) 0.0/(0.0) 0.0/(0.0) Drinking water (new/repair) 0.0/(0.0) 0.0/(0.0) 0.0/(0.0) Road (construction/repair) 216.8/(100.0) 261.6/(49.2) 325.1/(84.3) Building (construction/repair) 0.0/(0.0) 0.0/(0.0) 0.0/(0.0) Irrigation (new/repair) 0.0/(0.0) 159.0/(29.9) 18.9/(4.9) Sanitation work 0.0/(0.0) 111.1/(20.9) 41.6/(10.8) Others 0.0/(0.0) 0.0/(0.0) 0.0/(0.0)
Sitamarhi
Total 216.8/(100.0) 531.7/(100.0) 385.6/(100.0) Solar/vapour lights 0.0/(0.0) 0.0/(0.0) 0.0/(0.0) Drinking water (new/repair) 2.3/(0.8) 0.0/(0.0) 0.0/(0.0) Road (construction/repair) 81.0/(28.1) 185.9/(45.6) 373.1/(45.4) Building (construction/repair) 7.2/(2.5) 0.0/(0.0) 5.7/(0.7) Irrigation (new/repair) 177.0/(61.4) 169.6/(41.6) 323.8/(39.4) Sanitation work 18.7/(6.5) 49.7/(12.2) 117.5/(14.3) Others 2.0/(0.7) 2.4/(0.6) 1.6/(0.2)
All Districts
Total 288.3/(100.0) 407.7/(100.0) 821.9/(100.0) Source: Bihar PRI survey data. Note: Sample size is 50 GPs.

150
Table 5.08 Average BRGF programme expenditure under BRGF, by districts (Rs. 1,000’s)
District Programmes 2006-07 2007-08 2008-09 Solar/vapour lights — 57.9/(44.3) 177.0/(36.7) Drinking water (new/repair) — 0.0/(0.0) 0.0/(0.0) Road (construction/repair) — 72.7/(55.7) 305.4/(63.3) Building (construction/repair) — 0.0/(0.0) 0.0/(0.0) Irrigation (new/repair) — 0.0/(0.0) 0.0/(0.0) Sanitation work — 0.0/(0.0) 0.0/(0.0) Others — 0.0/(0.0) 0.0/(0.0)
Bhojpur
Total — 130.6/(100.0) 482.4/(100.0) Solar/vapour lights — 0.0/(0.0) 0.0/(0.0) Drinking water (new/repair) — 0.0/(0.0) 0.0/(0.0) Road (construction/repair) — 0.0/(0.0) 0.0/(0.0) Building (construction/repair) — 175.6/(70.0) 189.0/(85.0) Irrigation (new/repair) — 0.0/(0.0) 0.0/(0.0) Sanitation work — 75.2/(30.0) 33.3.0/(15.0) Others — 0.0/(0.0) 0.0/(0.0)
Nalanda
Total — 250.8/(100.0) 222.3(100.0) Solar/vapour lights — 13.8/(39.3) 186.6/(46.0) Drinking water (new/repair) — 0.0/(0.0) 0.0/(0.0) Road (construction/repair) — 0.9/(2.5) 0.0/(0.0) Building (construction/repair) — 20.4/(58.2) 219.0/(54.0) Irrigation (new/repair) — 0.0/(0.0) 0.0/(0.0) Sanitation work — 0.0/(0.0) 0.0/(0.0) Others — 0.0/(0.0) 0.0/(0.0)
Begusarai
Total — 35.0/(100.0) 405.6/(100.0) Solar/vapour lights — 44.8/(41.5) 34.7/5.6) Drinking water (new/repair) — 0.0/(0.0) 0.0/(0.0) Road (construction/repair) — 11.1/(10.3) 0.0/(0.0) Building (construction/repair) — 52.1/(48.2) 585.2/(94.4) Irrigation (new/repair) — 0.0/(0.0) 0.0/(0.0) Sanitation work — 0.0/(0.0) 0.0/(0.0) Others — 0.0/(0.0) 0.0/(0.0)
Saharsa
Total — 108.0/(100.0) 619.9/(100.0) Solar/vapour lights — 63.1/(42.8) 169.8/(50.5) Drinking water (new/repair) — 14.9/(10.1) 66.3/(19.7) Road (construction/repair) — 13.1/(8.9) 55.5/(16.5) Building (construction/repair) — 0.0/(0.0) 0.0/(0.0) Irrigation (new/repair) — 47.2/(32.0) 39.8/(11.8) Sanitation work — 9.1/(6.2) 5.0/(1.5) Others — 0.0/(0.0) 0.0/(0.0)
Sitamarhi
Total — 147.5/(100.0) 336.3/(100.0) Solar/vapour lights — 35.9/(26.7) 113.5/(27.0) Drinking water (new/repair) — 3.0/(2.2) 13.3/(3.2) Road (construction/repair) — 19.6/(14.6) 72.2/(17.5) Building (construction/repair) — 49.6/(36.9) 198.6/(48.6) Irrigation (new/repair) — 9.4/(7.0) 8.0/(1.9) Sanitation work — 16.9/(12.6) 7.32/(1.8) Others — 0.0/(0.0) 0.0/(0.0)
All Districts
Total — 134.4/(100.0) 413.3/(100) Source: Bihar PRI survey data. Note: Sample size is 50 GPs.

151
Table 5.09 Difficulties faced in implementation of projects
Reason volunteered by Panchayat Sachiv/(Mukhiya) Number of Panchayat Sachivs/(Mukhiyas) giving this reason.1
Administrative reasons
(i.) Official restrictions on the choice of programmes. 2/(2.6) (ii.) Delay in sanctioning programmes. 1/(1.3) (iii.) Delayed release of programme funds. 6/(7.7) (iv.) System of payments through bank accounts for NREGA is
cumbersome. 12/(15.4)
(v.) Lack of cooperation by government functionaries of the related departments.
6/(7.7)
Economic reasons
(vi.) Current prices of goods required for programme implementation is higher than mentioned in government manuals.
12/(15.4)
(vii.) Land related problem, either non-availability or available land being under encroachment by some members of the rural elite.
13/(16.7)
(viii.) Poor roads in rural areas hampering mobility of Panchayat officials. 1/(1.3) Social reasons
(ix.) Pressure by the members of the rural elite while making choice of programme or during implementation.
7/(9.0)
(x.) Lack of social cohesion in the rural community. 10/(12.8) Corruption-related reasons
(xi.) Demand by the government officials for payment of bribes. 8/(10.3) Total 78/(100.0)
Source: Bihar PRI survey data. Notes: Sample size is 78 Mukhiyas and Panchayat Sachivs from the 50 sampled GPs.
1Number of Mukhiyas giving this reason is in parentheses.

152
Table 5.10 Administrative expenditures, by ZPs (Rs. 1,000’s)
Expenditures District 2006-07 2007-08 2008-09
Number of employees
Bhojpur - - - 29 Nalanda 420 480 502 47 Begusarai 66 78 91 30 Saharsa 193 181 94 22 Sitamarhi 142 93 312 56 Average per district 160 208 250 33
Source: Bihar PRI survey data. Note: Sample size is 5 ZPs.

153
Table 6.01 Total (per cent) allocation received by source, by Gram Panchayat
Allocations received (Rs. 1,000’s) District
FC12 NREGA BRGF Total 2006-07
Bhojpur 375.0 (51.2)
358.0 (48.8) - 733.0
(100.0)
Nalanda 323.0 (34.7)
607.0 (65.3) - 930.0
(100.0)
Begusarai 309.0 (52.8)
276.0 (47.2) - 585.0
(100.0)
Saharsa 361.0 (87.4)
52.0 (12.6) - 413.0
(100.0)
Sitamarhi 341.0 (60.6)
222.0 (39.4) - 563.0
(100.0)
All Districts 341.8 (54.9)
303.0 (48.7) - 622.8
(100.0) 2007-08
Bhojpur 342.0 (57.4)
112.0 (18.8)
142.0 (23.8)
596.0 (100.0)
Nalanda 341.0 (25.5)
712.0 (53.3)
282.0 (21.1)
1335.0 (100.0)
Begusarai 269.0 (41.1)
334.0 (51.1)
51.0 (7.8)
654.0 (100.0)
Saharsa 378.0 (40.8)
420.0 (45.4)
128.0 (13.8)
926.0 (100.0)
Sitamarhi 360.0 (36.0)
479.0 (47.9)
160.0 (16.0)
999.0 (100.0)
All Districts 338.0 (37.5)
411.4 (45.6)
152.6 (16.9)
902.0 (100.0)
2008-09
Bhojpur 306.0 (16.8)
1,073.0 (59.0)
440.0 (24.2)
1,819.0 (100.0)
Nalanda 288.0 (26.2)
570.0 (51.9)
240.0 (21.9)
1,098.0 (100.0)
Begusarai 395.0 (26.1)
710.0 (46.9)
408.0 (27.0)
1,513.0 (100.0)
Saharsa 377.0 (14.9)
1,554.0 (61.3)
603.0 (23.8)
2,534.0 (100.0)
Sitamarhi 287.0 (29.3)
392.0 (40.0)
300.0 (30.6)
979.0 (100.0)
All Districts 330.6 (20.8)
859.8 (54.1)
398.2 (25.1)
1,588.6 (100.0)

154
Source: Bihar PRI survey data. Table 6.02 Twelfth Finance Commission funds received by GPs
Average amount received per GP (Rs. 000)
Average amount per capita received (Rs.) Characteristics
2006-07 2007-08 2008-09 2006-07 2007-08 2008-09 District
Bhojpur 375.0 342.0 306.0 32.2 29.0 25.6 Nalanda 323.0 341.0 288.0 32.1 33.1 28.4 Begusarai 309.0 269.0 395.0 24.3 21.2 31.7 Saharsa 361.0 378.0 377.0 35.7 36.4 37.8 Sitamarhi 341.0 360.0 287.0 30.6 32.9 26.0
Distance to block headquarters
0 – 4 kms 317.3 298.7 322.7 35.4 24.0 25.5 5 – 8 kms 342.7 336.0 324.0 29.0 27.2 27.1 9 – 12 kms 376.4 343.6 375.5 37.1 33.6 38.7 > 12 kms 338.9 400.0 300.0 36.2 43.1 31.3
Mukhiya’s religion and caste Upper caste 325.6 326.3 336.9 31.5 31.0 32.9 Upper backward caste 376.2 345.4 359.2 34.1 32.3 31.5 Lower backward caste 300.0 330.0 300.0 27.7 30.9 30.2 Scheduled caste 336.7 318.9 300.0 29.1 26.1 24.8 Muslims 360.0 390.0 328.3 28.8 31.4 26.1
Mukhiya’s gender Male 335.2 353.0 325.9 33.1 34.3 31.8 Female 349.6 320.4 336.1 28.5 26.0 27.7
All GPs 341.8 338.0 330.6 31.0 30.5 29.9 Source: Bihar PRI survey data. Note: Sample size is 50 GPs.

155
Table 6.03 Allocation of Twelfth Finance Commission funds, by district
FC-12 allocations Information 2006-07 2007-08 2008-09
Bhojpur Average allocation per GP (Rs. 000) 375.0 342.0 306.0 Average allocation per Capita (Rs.) 32.2 29.0 25.6 Standard deviation of per capita allocations 15.2 8.0 8.4 Coefficient of variation of per capita allocations 47.2 27.6 32.7 Nalanda Average allocation per GP (Rs. 000) 323.0 341.0 288.0 Average allocation per Capita (Rs.) 32.1 33.1 28.4 Standard deviation of per capita allocations 13.8 16.0 16.8 Coefficient of variation of per capita allocations 43.0 48.2 59.1 Begusarai Average allocation per GP (Rs. 000) 309.0 269.0 395.0 Average allocation per Capita (Rs.) 24.3 21.2 31.7 Standard deviation of per capita allocations 13.4 14.0 23.1 Coefficient of variation of per capita allocations 55.2 66.0 72.7 Saharsa Average allocation per GP (Rs. 000) 361.0 378.0 377.0 Average allocation per Capita (Rs.) 35.7 36.4 37.8 Standard deviation of per capita allocations 9.6 11.4 18.7 Coefficient of variation of per capita allocations 26.8 31.3 49.4 Sitamarhi Average allocation per GP (Rs. 000) 341.0 360.0 287.0 Average allocation per Capita (Rs.) 30.6 32.9 26.0 Standard deviation of per capita allocations 7.7 15.4 9.6 Coefficient of variation of per capita allocations 25.2 47.0 36.8 Total Average allocation per GP (Rs. 000) 341.8 338.0 330.6 Average allocation per Capita (Rs.) 31.0 30.5 29.9 Standard deviation of per capita allocations 12.3 13.8 16.3 Coefficient of variation of per capita allocations 39.8 45.2 54.3 Source: Bihar PRI survey data. Note: Sample size is 50 GPs.

156
Table 6.04 National Rural Employment Guarantee Act funds received by GPs, by district
Average amount received per GP (Rs. 1000’s)
Average amount received per capita (Rs.) Characteristics
2006-07 2007-08 2008-09 2006-07 2007-08 2008-09 District
Bhojpur 358 112 1,073 30.5 10.5 88.1 Nalanda 607 712 570 66.6 70.5 61.5 Begusarai 276 334 710 23.7 22.3 53.2 Saharsa 52 420 1,554 5.2 39.5 151.0 Sitamarhi 222 479 392 20.5 44.2 39.0
Distance to block headquarters 0 – 4 kms 244.0 424.0 639.3 19.0 34.3 50.3 5 – 8 kms 310.7 342.7 995.3 28.1 30.2 82.8 9 – 12 kms 359.1 572.7 743.6 38.0 54.3 73.1 > 12 kms 320.0 307.8 1,143.3 37.8 34.0 125.3
Mukhiya’s religion and caste Upper caste 257.5 264.4 1,141.3 24.3 28.9 108.2 Upper backward caste 413.8 571.5 880.0 42.8 52.0 83.7 Lower backward caste 241.7 353.3 545.0 25.8 31.6 50.8 Scheduled caste 356.7 450.0 664.4 31.7 36.6 53.8 Muslims 165.0 456.7 673.3 13.4 35.6 53.4
Mukhiya’s gender Male 348.5 455.6 861.9 35.6 44.4 87.3 Female 249.6 359.6 857.4 21.8 29.3 68.3
All GPs 303.0 411.4 859.8 29.3 37.4 78.6 Source: Bihar PRI survey data. Note: Sample size is 50 GPs.

157
Table 6.05 Allocations of the National Rural Employment Guarantee Act, by district
NREGA allocations Information 2006-07 2007-08 2008-09
Bhojpur Average allocation per GP (Rs. 000) 358.0 112.0 1073.0 Average allocation per capita (Rs.) 30.5 10.5 88.1 Standard deviation of per capita allocation 20.5 29.6 34.0 Coefficient of variation of per capita allocations 67.4 281.2 38.6 Nalanda Average allocation per GP (Rs. 000) 607.0 712.0 570.0 Average allocation per capita (Rs.) 66.6 70.5 61.5 Standard deviation of per capita allocation 57.4 31.9 51.7 Coefficient of variation of per capita allocations 86.3 45.3 84.1 Begusarai Average allocation per GP (Rs. 000) 276.0 334.0 710.0 Average allocation per capita (Rs.) 23.7 22.3 53.2 Standard deviation of per capita allocation 32.1 21.4 29.4 Coefficient of variation of per capita allocations 135.5 95.8 55.3 Saharsa Average allocation per GP (Rs. 000) 52.0 420.0 1554.0 Average allocation per capita (Rs.) 5.2 39.5 151.0 Standard deviation of per capita allocation 11.9 15.1 60.4 Coefficient of variation of per capita allocations 229.3 38.2 40.0 Sitamarhi Average allocation per GP (Rs. 000) 222.0 479.0 392.0 Average allocation per capita (Rs.) 20.5 44.2 39.0 Standard deviation of per capita allocation 16.6 26.0 53.7 Coefficient of variation of per capita allocations 80.7 58.8 137.7 Total Average allocation per GP (Rs. 000) 303.0 411.4 859.8 Average allocation per capita (Rs.) 29.3 37.4 78.6 Standard deviation of per capita allocation 37.1 32.0 60.5 Coefficient of variation of per capita allocations 126.6 85.6 77.0 Source: Bihar PRI survey data. Note: Sample size is 50 GPs.

158
Table 6.06 Backward Region Grant Funds received by GPs
Average amount received per GP (Rs. 000)
Average amount received per capita (Rs.) Characteristics
2006-07 2007-08 2008-09 2006-07 2007-08 2008-09
District Bhojpur - 142.0 440.0 - 13.9 37.1 Nalanda - 282.0 240.0 - 26.8 27.0 Begusarai - 51.0 408.0 - 3.0 32.4 Saharsa - 128.0 603.0 - 13.0 59.2 Sitamarhi - 160.0 300.0 - 17.2 25.1
Distance to block headquarters 0 – 4 kms - 60.0 377.3 - 5.9 29.5 5 – 8 kms - 168.7 350.7 - 13.8 29.6 9 – 12 kms - 87.3 520.9 - 8.2 52.7 > 12 kms - 360.0 362.2 - 39.4 37.8
Mukhiya’s religion and caste Upper caste - 168.1 428.8 - 17.0 41.0 Upper backward caste - 183.1 356.9 - 19.7 31.8 Lower backward caste - 0.0 530.0 - 0.0 49.7 Scheduled caste - 222.2 304.4 - 17.9 27.2 Muslims - 93.3 415.0 - 8.3 32.8
Mukhiya’s gender Male - 180.4 407.0 - 18.2 40.5 Female - 120.0 387.8 - 10.8 31.0
All GPs - 152.6 398.2 - 14.8 36.2 Source: Bihar PRI survey data. Note: Sample size is 50 GPs.

159
Table 6.07 Allocations under Backward Region Grant Fund, by district
BRGF allocations Information 2006-07 2007-08 2008-09
Bhojpur Average allocation per GP (Rs. "000) - 142.0 440.0 Average allocations per capita (Rs.) - 13.9 37.1 Standard deviation of per capita allocations - 22.5 21.1 Coefficient of Variation of per capita allocations - 161.4 57.0 Nalanda
Average allocation per GP (Rs. "000) - 282.0 240.0 Average allocations per capita (Rs.) - 26.8 27.0 Standard deviation of per capita allocations - 25.6 30.2 Coefficient of variation of per capita allocations - 95.5 111.7
Begusarai Average allocation per GP (Rs. "000) - 51.0 408.0 Average allocations per capita (Rs.) - 3.0 32.4 Standard deviation of per capita allocations - 9.5 20.4 Coefficient of variation of per capita allocations - 316.2 63.0
Saharsa Average allocation per GP (Rs. "000) - 128.0 603.0 Average allocations per capita (Rs.) - 13.0 59.2 Standard deviation of per capita allocations - 28.2 31.9 Coefficient of variation of per capita allocations - 218.0 53.8
Sitamarhi
Average allocation per GP (Rs. "000) - 160.0 300.0 Average allocations per capita (Rs.) - 17.3 25.1 Standard deviation of per capita allocations - 28.0 22.0 Coefficient of variation of per capita allocations - 161.8 87.8
Total Average allocation per GP (Rs. "000) - 152.6 398.2 Average allocations per capita (Rs.) - 14.8 36.2 Standard deviation of per capita allocations - 24.1 27.5 Coefficient of variation of per capita allocations - 162.8 76.0
Source: Bihar PRI survey data. Note: Sample size is 50 GPs.

160
Table 6.08 Mukhiya’s opinion of the adequacy of transfers by source Fund Opinion Bhojpur Nalanda Begusarai Saharsa Sitamarhi All
Adequate 0 0 0 0 10 2 Inadequate 70 90 70 80 60 74 FC-12 Very inadequate 30 10 30 20 30 24 Adequate 10 10 30 20 10 16 Inadequate 90 80 60 70 80 76 NREGA Very inadequate 0 10 10 10 10 8 Adequate 10 0 0 10 10 6 Inadequate 80 70 100 70 70 78 BRGF Very inadequate 10 30 0 20 20 16
Total 100 100 100 100 100 100 Source: Bihar PRI survey data. Note: Sample size is 50 GPs.

161
Table 6.09 Favoured heads of taxation, number favouring (per cent favouring in parentheses)
Tax heads Bhojpur Nalanda Begusarai Saharsa Sitamarhi All
Land revenue/additional 1/(5.0) 2/(10.0) 3/(15.0) 2/(10.0) 2/(10.0) 10/(10.0)
Agriculture/horticulture 4/(20.0) 3/(15.0) 1/(5.0) 0/(0.0) 0/(0.0) 10/(10.0)
Fishery 1/(5.0) 3/(15.0) 5/(25.0) 4/(20.0) 3/(15.0) 16/(16.0)
Poultry 0/(0.0) 1/(5.0) 1/(5.0) 0/(0.0) 0/(0.0) 2/(2.0)
Small/cottage Industries 1/(5.0) 0/(0.0) 0/(0.0) 0/(0.0) 0/(0.0) 1/(1.0)
Bricks kiln 3/(15.0) 0/(0.0) 2/(10.0) 0/(0.0) 3/(15.0) 8/(8.0)
Sand picking 0/(0.0) 2/(10.0) 0/(0.0) 0/(0.0) 0/(0.0) 2/(2.0
Brewery/toddy tapping 2 /(10.0) 1/(5.0) 0/(0.0) 1/(5.0) 1/(5.0) 5/(5.0)
Trade (general) 0/(0.0) 0/(0.0) 0/0.0) 5/(25.0) 0/(0.0) 5/(5.0)
Trade (food grains) 2/(10.) 1/(0.0) 0/(0.0) 0/(0.0) 0/(0.0) 3/(3.0)
Huts/mela 1/(5.0) 4/(20.0) 3/(15.0) 3/(15.0) 3/(15.0) 14/(14.0)
River Ghat 0/(0.0) 0/(0.0) 0/(0.0) 0/(0.0) 5/(25.0) 5/(5.0)
Vehicles 0/(0.0) 0/(0.0) 3/(15.0) 0/(0.0) 1/(5.0) 4/(4.0)
Money lending 1/(5.0) 0/(0.0) 0/(0.0) 0/(0.0) 0/(0.0) 1/(1.0)
Caste-based services 0/(0.0) 1/(5.0) 0/(0.0) 0/(0.0) 0/(0.0) 1/(1.0)
Income tax 0/(0.0) 0/(0.0) 0/(0.0) 1/(5.0) 0/(0.0) 1/(1.0)
Others 4/(20.0) 2/(10.0) 2/(10.0) 2/(10.0) 2/(10.0) 12/(12.0)
Total 20/(100.0) 20/(100.0) 20/(100.0) 20/(100.0) 20/(100.0) 100/(100.0) Source: Bihar PRI survey data. Note: Sample size is 50 GPs.

162
Table 6.10 Timeliness of the 12-FC distributions to GPs, by district and year
Per cent of funds received by quarter District/ year
Average amount received
(Rs. 1,000’s) Q-I Q-II Q-III Q-IV Total
Bhojpur 2006-07 375 28.5 24.0 19.2 28.3 100 2007-08 342 42.1 5.3 5.3 47.4 100 2008-09 306 47.1 5.9 17.6 29.4 100
Nalanda 2006-07 323 49.8 11.1 27.9 11.1 100 2007-08 341 47.5 10.6 0.0 41.9 100 2008-09 288 37.5 25.0 25.0 12.5 100
Begusarai 2006-07 309 14.9 23.3 40.5 21.4 100 2007-08 269 26.8 26.8 20.1 26.4 100 2008-09 395 27.3 18.0 31.9 22.8 100
Saharsa 2006-07 361 50.1 - 39.9 10.0 100 2007-08 378 33.3 9.5 23.8 33.3 100 2008-09 377 42.7 9.5 9.5 38.2 100
Sitamarhi 2006-07 341 47.2 47.5 5.3 - 100 2007-08 360 40.0 5.0 20.0 35.0 100 2008-09 287 50.2 5.9 12.5 31.4 100
All districts 2006-07 1,709 38.4 21.1 26.3 14.3 100 2007-08 1,690 38.3 10.7 13.8 37.2 100 2008-09 1,653 40.2 12.9 19.6 27.2 100
Source: PRI survey data. Note: The sample size is 50 GPs.

163
Table 6.11 Timeliness of NREGA distributions to GPs, by district and year
Per cent of funds received by quarter District/
year
Average amount received
(Rs. 1,000’s) Q-I Q-II Q-III Q-IV Total
Bhojpur 2006-07 358.0 26.3 66.8 2.5 4.5 100.0 2007-08 112.0 - 55.4 - 44.6 100.0 2008-09 1073.0 28.1 - 16.3 55.6 100.0
Nalanda 2006-07 607.0 32.1 21.7 12.0 34.1 100.0 2007-08 712.0 22.2 19.1 4.2 54.5 100.0 2008-09 570.0 21.1 14.4 - 64.6 100.0
Begusarai 2006-07 276.0 - 14.9 18.8 66.3 100.0 2007-08 334.0 13.2 27.2 1.8 57.8 100.0 2008-09 710.0 38.0 4.2 31.7 26.1 100.0
Saharsa 2006-07 52.0 28.8 - 7.7 63.5 100.0 2007-08 420.0 14.5 0.5 23.3 61.7 100.0 2008-09 1554.0 27.9 16.6 16.4 39.1 100.0
Sitamarhi 2006-07 222.0 10.4 21.2 22.5 45.9 100.0 2007-08 479.0 3.1 1.7 14.6 80.6 100.0 2008-09 392.0 60.7 1.0 - 38.3 100.0
All Districts 2006-07 1515.0 21.6 30.3 12.4 35.7 100.0 2007-08 2057.0 13.5 14.5 9.9 62.0 100.0 2008-09 4299.0 31.7 8.7 15.2 44.4 100.0
Source: PRI survey data. Note: The sample size is 50 GPs.

164
Table 6.12 Timeliness of BRGF distributions to GPs, by district and year
Per cent of funds received by quarter District/
year
Average amount received
(Rs. 1,000’s) Q-I Q-II Q-III Q-IV Total
Bhojpur 2006-07 - - - - - - 2007-08 142 38.0 - - 62.0 100 2008-09 440 - - 50.0 50.0 100
Nalanda 2006-07 - - - - - - 2007-08 282 34.0 34.0 - 31.9 100 2008-09 240 80.0 - 20.0 - 100
Begusarai 2006-07 - - - - - - 2007-08 51 - 100.0 - - 100 2008-09 408 25.0 62.5 12.5 - 100
Saharsa 2006-07 - - - - - - 2007-08 128 - - - 100.0 100 2008-09 603 52.1 35.8 - 12.1 100
Sitamarhi 2006-07 - - - - - - 2007-08 160 31.3 68.8 - - 100 2008-09 300 100.0 - - - 100
All Districts 2006-07 - - - - - - 2007-08 763 26.2 33.7 - 40.1 100 2008-09 1,991 45.6 23.7 16.0 14.7 100
Source: PRI survey data. Note: The sample size is 50 GPs.

165
Table 6.13 Number of and expenditures on development programmes, by Panchayat Samitis
District 2006-07 2007-08 2008-09 Average number of development programmes
Bhojpur 46.5 30.0 81.5 Nalanda 17.5 39.5 38.5 Begusarai 2.0 24.5 23.5 Saharsa - 69.0 61.0 Sitamarhi 13.0 35.5 90.5 All Districts 23.8 39.7 59.0 Average expenditure on all development programmes (Rs. 1,000’s) Bhojpur 4,000 13,900 11,100 Nalanda 650 5,500 1,550 Begusarai 500 1,200 1,850 Saharsa - 11,050 10,700 Sitamarhi 1,000 10,450 13,450 All Districts 1,800 8,420 7,730 Average expenditure per development programmes (Rs. 1,000’s) Bhojpur 86.0 463.3 136.2 Nalanda 37.1 139.2 40.3 Begusarai 250.0 49.0 78.7 Saharsa - 160.1 175.4 Sitamarhi 76.9 294.4 148.6 All Districts 75.5 212.1 131.0
Source: Bihar PRI survey data. Note: Sample size is 10 PSs.

166
Table 6.14 Timeliness of the 12-FC distributions to PSs, by district and year
Per cent of funds received by quarter District/
year
Average amount received
(Rs. 1,000’s) Q-I Q-II Q-III Q-IV Total
Bhojpur 2006-07 415 20.5 59.0 - 20.5 100 2007-08 245 67.3 - - 32.7 100 2008-09 330 50.0 - 24.2 25.8 100
Nalanda 2006-07 350 51.4 30.0 18.6 - 100 2007-08 275 38.2 23.6 - 38.2 100 2008-09 340 50.0 - 50.0 - 100
Begusarai 2006-07 415 50.6 - 49.4 - 100 2007-08 410 50.0 - - 50 100 2008-09 410 - 50 - 50 100
Saharsa 2006-07 370 18.9 31.1 50.0 - 100 2007-08 370 18.9 31.1 50.0 - 100 2008-09 555 33.3 - - 66.7 100
Sitamarhi 2006-07 470 50.0 50.0 - - 100 2007-08 330 50.0 - 50.0 - 100 2008-09 400 58.8 - 41.3 - 100
All Districts 2006-07 404 38.6 34.7 22.5 4.2 100 2007-08 326 43.6 11.0 21.5 23.9 100 2008-09 407 37.1 10.1 20.4 32.4 100
Source: Bihar PRI survey data. Note: Sample size is 10 PSs.

167
Table 6.15 Timeliness of the NREGA distributions to PSs, by quarter and year
Per cent of funds received by quarter District/
year
Average amount received
(Rs. 1,000’s) Q-I Q-II Q-III Q-IV Total
Bhojpur 2006-07 1,900 89.5 10.5 - - 100 2007-08 3,250 63.1 - 3.1 33.8 100 2008-09 25,450 55.2 0.2 17.7 26.9 100
Nalanda 2006-07 16,300 52.5 - - 47.5 100 2007-08 7,650 90.8 - - 9.2 100 2008-09 3,600 0.0 - - 100.0 100
Begusarai 2006-07 - - - - - - 2007-08 12,400 0.8 - 10.1 89.1 100 2008-09 6,200 100.0 - - - 100
Saharsa 2006-07 - - - - - - 2007-08 11,700 0.0 9.8 3.8 86.3 100 2008-09 9,950 1.0 25.6 - 73.4 100
Sitamarhi 2006-07 2,400 6.3 93.8 - - 100 2007-08 5,750 4.3 - 6.1 89.6 100 2008-09 10,050 57.2 32.8 - 10.0 100
All Districts 2006-07 4,120 50.5 11.9 - 37.6 100 2007-08 8,150 22.9 2.8 5.3 69.0 100 2008-09 11,050 47.2 10.7 8.1 33.9 100
Source: Bihar PRI survey data. Note: Sample size is 10 PSs.

168
Table 6.16 Timeliness of the BRGF distributions to PSs, by quarter and year
Per cent of funds received by quarter
District/ year
Average amount received
(Rs. 1,000’s) Q-I Q-II Q-III Q-IV Total
Bhojpur 2006-07 - - - - - - 2007-08 430 - - 100 - 100 2008-09 - - - - - -
Nalanda 2006-07 - - - - - - 2007-08 315 100 - - - 100 2008-09 515 100 - - - 100
Begusarai 2006-07 - - - - - - 2007-08 - - - - - - 2008-09 600 100 - - - 100
Saharsa 2006-07 - - - - - - 2007-08 - - - - - - 2008-09 575 100 - - - 100
Sitamarhi 2006-07 - - - - - - 2007-08 - - - - - - 2008-09 660 100 - - - 100
All Districts 2006-07 - - - - - - 2007-08 149 42.3 - 57.7 - 100 2008-09 470 100 - - - 100
Source: Bihar PRI survey data. Note: Sample size is 10 PSs.

169
Table 6.17 Number and expenditure on programmes by Zilla Parishad, district and year
District 2006-07 2007-08 2008-09 Average number of development programmes Bhojpur 3 5.0 422 Nalanda 169 108 144 Begusarai 10 42 74 Saharsa 1.0 47 38 Sitamarhi 42 244 72 All Districts 45 89.2 150 Average expenditure for all development programmes (Rs. 1,000’s) Bhojpur 1,100 1,100 146,700 Nalanda 35,600 46,500 47,300 Begusarai 1,100 197,500 436,300 Saharsa 300 28,600 32,200 Sitamarhi 2,200 31,300 198,900 All Districts 8,060 61,000 172,280 Average expenditure per development programmes (Rs. 1,000’s) Bhojpur 366.7 220.0 347.6 Nalanda 210.7 430.6 328.5 Begusarai 110.0 4,702.4 5,895.9 Saharsa 300.0 608.5 847.4 Sitamarhi 52.4 128.3 2,762.5 All Districts 179.1 683.9 1,148.5
Source: Bihar PRI survey data. Note: Sample size is 5 ZPs.

170
Table 6.18 Timeliness of 12-FC distributions to ZPs, by quarter and year
Per cent of funds received by quarter District/
year
Average amount received
(Rs. 1,000’s) Q-I Q-II Q-III Q-IV Total
Bhojpur 2006-07 1,687 50 - - 50 100 2007-08 1,687 - 100 - - 100 2008-09 1,687 50 - - 50 100
Nalanda 2006-07 1,763 50 - - 50 100 2007-08 1,763 - - 100 - 100 2008-09 1,763 - 50 - 50 100
Begusarai 2006-07 546 - 100 - - 100 2007-08 4,391 - - - 100 100 2008-09 1,742 - 100 - - 100
Saharsa 2006-07 1,209 100 - - - 100 2007-08 1,209 100 - - - 100 2008-09 1,209 100 - - - 100
Sitamarhi 2006-07 2,211 50 - - 50 100 2007-08 2,211 - - 100 - 100 2008-09 1,105 - 100 - - 100
All Districts 2006-07 7,416 54.5 7.4 - 38.2 100 2007-08 11,261 10.7 15.0 35.3 39.0 100 2008-09 7,506 27.3 49.7 - 23.0 100
Source: Bihar PRI survey data. Note: Sample size is 5 ZPs.

171
Table 6.19 Timeliness of NREGA distributions to ZPs, by quarter and year
Per cent of funds received by quarter District/
year
Average amount received
(Rs. 1,000’s) Q-I Q-II Q-III Q-IV Total
Bhojpur 2006-07 40,793 89 11.0 - - 100 2007-08 2,300 100 - - - 100 2008-09 - - - - - -
Nalanda 2006-07 54,444 18.4 81.6 - - 100 2007-08 44,388 27.3 - - 72.7 100 2008-09 36,421 17.6 - - 82.4 100
Begusarai 2006-07 - - - - - - 2007-08 548,181 31.0 - 69.0 - 100 2008-09 82,328 43.2 23.5 33.3 - 100
Saharsa 2006-07 - - - - - - 2007-08 294,000 100 - - - 100 2008-09 30,700 29.3 - 70.7 - 100
Sitamarhi 2006-07 - - - - - - 2007-08 46,224 19.3 - 80.7 - 100 2008-09 53,87 - 100 - - 100
All Districts 2006-07 95,237 53.7 46.3 - - 100 2007-08 93,5093 54.0 - 28.9 17.1 100 2008-09 154,836 22.5 30.9 26.0 20.6 100
Source: Bihar PRI survey data. Note: Sample size is 5 ZPs.

172
Table 6.20 Timeliness of BRGF disbursements to ZPs, by quarter and year
Per cent of funds received by quarter District/
year
Average amount received
(Rs. 1,000’s) Q-I Q-II Q-III Q-IV Total
Bhojpur 2006-07 - - - - - - 2007-08 1,000 - - - 100 100 2008-09 127,500 100 - - - 100
Nalanda 2006-07 - - - - - - 2007-08 2,595 - - - 100 100 2008-09 9,353 - - - 100 100
Begusarai 2006-07 - - - - - - 2007-08 - - - - - - 2008-09 3,267 - - - 100 100
Saharsa 2006-07 - - - - - - 2007-08 131,700 - - - 100 100 2008-09 34,257 - - - 100 100
Sitamarhi 2006-07 - - - - - - 2007-08 159,700 - - - 100 100 2008-09 - - - - - -
All Districts 2006-07 - - - - - - 2007-08 294,995 - - - 100 100 2008-09 174,377 25 - - 75 100
Source: Bihar PRI survey data. Note: Sample size is 5 ZPs.

173
Table 6.21 Revenue Collection by ZPs
Revenue collected (Rs. 1,000’s) District 2006-07 2007-08 2008-09 Bhojpur 1,146 1,000 1,000 Nalanda - - - Begusarai - - - Saharsa - - - Sitamarhi 320 95 705
Source: Bihar PRI survey data. Note: Sample size is 5 ZPs.

174
Table 7.01 Per cent of GPs preparing annual budgets and annual reports (per cent)
GPs preparing annual budgets GPs preparing annual reports Characteristics
2006-07 2007-08 2008-09 2006-07 2007-08 2008-09
District Bhojpur 50.0 50.0 40.0 80.0 80.0 60.0 Nalanda 90.0 90.0 90.0 100.0 100.0 100.0 Begusarai 100.0 100.0 100.0 100.0 100.0 100.0 Saharsa 70.0 70.0 70.0 70.0 70.0 70.0 Sitamarhi 100.0 100.0 100.0 100.0 100.0 100.0
Distance to block headquarters 0 – 4 kms 80.0 80.0 80.0 93.3 93.3 93.3 5 – 8 kms 73.3 73.3 73.3 80.0 80.0 73.3 9 – 12 kms 90.9 90.9 90.9 100.0 100.0 90.9 > 12 kms 88.9 88.9 77.8 88.9 88.9 88.9
Mukhiya’s religion and caste Upper caste 81.3 81.3 81.3 93.8 93.8 93.8 Upper backward case 76.9 76.9 76.9 84.6 84.6 76.9 Lower backward caste 66.7 66.7 66.7 66.7 66.7 66.7 Scheduled caste 88.9 88.9 77.8 100.0 100.0 88.9 Muslim 100.0 100.0 100.0 100.0 100.0 100.0
Mukhiya’s gender Male 88.9 88.9 85.2 96.3 96.3 88.9 Female 73.9 73.9 73.9 82.6 82.6 82.6
All GPs 82.0 82.0 80.0 90.0 90.0 86.0 Source: Bihar PRI Survey data. Note: Sample size is 50 GPs.

175
Table 7.02 Per cent of GPs sending annual budgets and reports to concerned offices
GPs sending annual budget GPs sending annual reports Characteristics
BDO PS ZP BDO PS ZP
District Bhojpur 70 60 60 70 20 10 Nalanda 100 100 100 100 100 100 Begusarai 100 100 100 100 100 100 Saharsa 80 50 50 90 20 20 Sitamarhi 100 100 100 100 100 90
Distance to block headquarters 0 – 4 kms 86.7 86.7 86.7 93.3 80.0 80.0 5 – 8 kms 80.0 73.3 73.3 80.0 60.0 60.0 9 – 12 kms 100.0 72.7 72.7 100.0 63.6 54.5 > 12 kms 100.0 100.0 100.0 100.0 66.7 55.6
Mukhiya’s religion and caste Upper caste 93.8 81.3 81.3 93.8 50.0 50.0 Upper backward caste 84.6 76.9 76.9 84.6 76.9 76.9 Lower backward caste 83.3 83.3 83.3 100.0 83.3 83.3 Scheduled caste 88.9 88.9 88.9 88.9 77.8 55.6 Muslims 100.0 83.3 83.3 100.0 66.7 66.7
Mukhiya’s gender Male 100.0 88.9 88.9 100.0 70.4 63.0 Female 78.3 73.9 73.9 82.6 65.2 65.2
All GPs 90.0 82.0 82.0 92.0 68.0 64.0 Source: Bihar PRI Survey data. Note: Sample size is 50 GPs.

176
Table 7.03 GPs preparing annual accounts and audit reports (per cent)
GPs preparing annual accounts GPs preparing audit reports Characteristics
2006-07 2007-08 2008-09 2006-07 2007-08 2008-09 District
Bhojpur 90.0 90.0 90.0 70.0 80.0 10.0 Nalanda 100.0 100.0 100.0 90.0 80.0 70.0 Begusarai 100.0 100.0 100.0 100.0 100.0 100.0 Saharsa 70.0 70.0 70.0 60.0 90.0 10.0 Sitamarhi 100.0 100.0 100.0 100.0 100.0 100.0
Distance to block headquarters 0 – 4 kms 86.7 86.7 86.7 93.3 93.3 80.0 5 – 8 kms 86.7 86.7 86.7 86.7 93.3 66.7 9 – 12 kms 100.0 100.0 100.0 81.8 90.9 45.5 > 12 kms 100.0 100.0 100.0 66.7 77.8 22.2
Mukhiya’s religion and caste Upper caste 87.5 87.5 87.5 87.5 100.0 43.8 Upper backward caste 92.3 92.3 92.3 84.6 84.6 69.2 Lower backward caste 83.3 83.3 83.3 66.7 66.7 66.7 Scheduled caste 100.0 100.0 100.0 88.9 88.9 55.6 Muslims 100.0 100.0 100.0 83.3 100.0 66.7
Mukhiya’s gender Male 100.0 100.0 100.0 92.6 92.6 55.6 Female 82.6 82.6 82.6 73.9 87.0 60.9
All GPs 92.0 92.0 92.0 84.0 90.0 58.0 Source: Bihar PRI Survey data. Note: Sample size is 50 GPs.

177
Table 7.04 GPs sending annual accounts and audit reports to concerned offices (per cent)
GPs sending annual accounts GPs sending audit reports Characteristics
BDO PS ZP BDO PS ZP
District Bhojpur 70.0 10.0 10.0 60.0 0.0 0.0 Nalanda 90.0 50.0 70.0 70.0 50.0 50.0 Begusarai 100.0 90.0 90.0 100.0 90.0 90.0 Saharsa 90.0 20.0 20.0 90.0 30.0 30.0 Sitamarhi 80.0 70.0 70.0 80.0 70.0 80.0
Distance to block headquarters 0 – 4 kms 93.3 73.3 73.3 93.3 73.3 73.3 5 – 8 kms 73.3 40.0 40.0 80.0 46.7 46.7 9 – 12 kms 90.9 36.4 45.5 72.7 36.4 45.5 > 12 kms 88.9 33.3 44.4 66.7 22.2 22.2
Mukhiya’s religion and caste Upper caste 87.5 37.5 37.5 87.5 43.8 43.8 Upper backward caste 76.9 46.2 53.8 69.2 46.2 46.2 Lower backward caste 100.0 83.3 83.3 83.3 66.7 66.7 Scheduled caste 77.8 33.3 44.4 66.7 33.3 44.4 Muslims 100.0 66.7 66.7 100.0 66.7 66.7
Mukhiya’s gender Male 92.6 44.4 48.1 85.2 40.7 44.4 Female 78.3 52.2 56.5 73.9 56.5 56.5
All GPs 86.0 48.0 52.0 80.0 48.0 50.0 Source: Bihar PRI Survey data. Note: Sample size is 50 GPs.

178
Table 8.01 Total allocations to the PRIs, from FC-12 and BRGF and year
Allocations (Rs. crore) Year Zilla Parishad Panchayat Samiti Gram Panchayat Total FC-12
2006-07 6.50 19.49 298.82 324.80 2007-08 6.50 19.49 298.82 324.80 2008-09 6.50 19.49 298.82 324.80
BRGF 2006-07 — — — — 2007-08 10.94 32.82 503.24 547.00 2008-09 32.44 64.89 227.10 324.43
FC-12 + BRGF 2006-07 6.50 19.49 298.82 324.80 2007-08 17.44 52.31 802.06 871.80 2008-09 38.94 84.38 525.92 649.23

179
Figure 1.01 Maps of the State of Bihar and the 5 Sample Districts (The 5 sample districts are highlighted in blue in the map of Bihar)

180

181

182
Figure 2.01 Local Government Structure in the State of Bihar

183
Figure 2.02 Organisational structure of PRIs
Source: Report of The Examiner of Local Accounts, Bihar, (2006), Panchayati Raj Institutions, GoB, Patna.

184
Figure 6.01 Composition of total allocations received by Gram Panchayats
2006-07
Figure 6.02 Composition of total allocations received by Gram Panchayats
2007-08

185
Figure 6.03 Composition of Total Allocation Received by Gram Panchayats 2008-09
_________