annual economic report 2016 - Ministry of Finance
180
ANNUAL ECONOMIC REPORT 2016 Ministry of Finance, Economic Planning and Development Department of Economic Planning and Development P.O. Box 30136, Lilongwe 3. Telephone: (265) 1 788 888 Fax: (265) 1 788 247 E-mail: [email protected]
-
Upload
khangminh22 -
Category
Documents
-
view
1 -
download
0
Transcript of annual economic report 2016 - Ministry of Finance

ANNUAL ECONOMICREPORT 2016
Ministry of Finance, Economic Planning and Development Department of Economic Planning and DevelopmentP.O. Box 30136, Lilongwe 3.Telephone: (265) 1 788 888Fax: (265) 1 788 247E-mail: [email protected]
CHAPTER
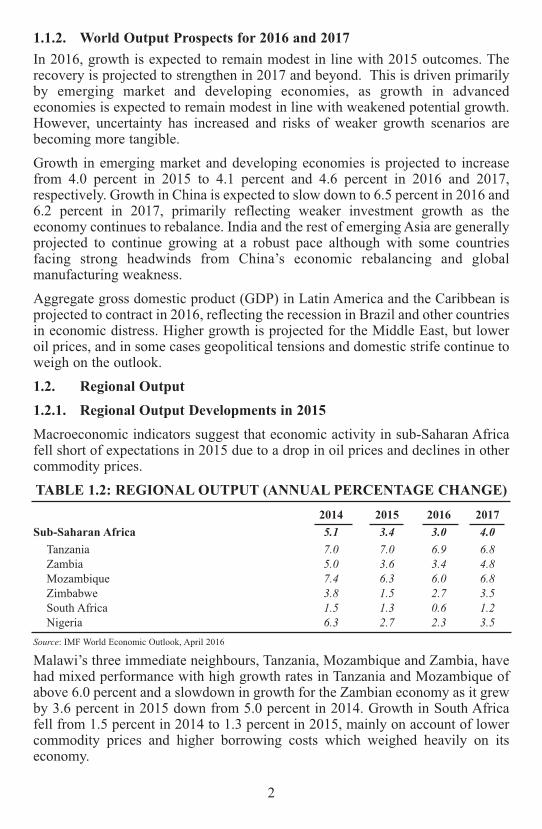
Chapter 1: The World Economic Outlook ......................................................... 1Chapter 2: Macroeconomic Performance In 2015 And Prospects For
2016 And 2017 ................................................................................ 7Chapter 3: Agriculture And Natural Resources ............................................... 21Chapter 4: Irrigation And Water Development ................................................ 39Chapter 5: Transport And Public Infrastructure .............................................. 46Chapter 6: Mining Sector ................................................................................ 51Chapter 7: Energy............................................................................................. 59Chapter 8: Trade And Private Sector Development.......................................... 69Chapter 9: Education ....................................................................................... 81Chapter 10: Tourism .......................................................................................... 89Chapter 11: Intergated Rural Development ....................................................... 94Chapter 12: Public Health, Nutrition, HIV And AIDS
Management ................................................................................ 101Chapter 13: Youth Development, Sports and Culture ..................................... 113Chapter 14: Climate Change And The Environment ....................................... 122Chapter 15: Employment, Gender, Children and Social Welfare .................... 131Chapter 16: Social Support And Poverty Reduction Programmes ................... 146Chapter 17: Public Enterprises ........................................................................ 149Chapter 18: Banking And Finance ................................................................... 163Chapter 19: Public Finance .............................................................................. 166

CHAPTER 1THE WORLD ECONOMIC OUTLOOK
1.1. World Output 1.1.1. World Output Developments in 2015 Global growth at 3.1 percent in 2015 was weaker than originally expected. Theunexpected weakness in late 2015 reflected mainly softer activity in advancedeconomies - especially in the United States, but also in Japan and other advancedAsian economies. Growth in advanced economies was estimated at 1.9 percent in2015. Unfavourable demographic trends, low productivity growth, and legaciesfrom the global financial crisis continue to hamper a more robust pickup ineconomic activity. Overall activity in the United States was weaker than expectedespecially in exports and domestic demand.TABLE 1.1: WORLD OUTPUT (ANNUAL PERCENTAGE CHANGE)
2014 2015 2016 2017Global Growth 3.4 3.1 3.1 3.5Sub-Saharan Africa 5.1 3.4 3.0 4.0Advanced Economies 1.8 1.9 1.9 2.0
United States of America 2.4 2.4 2.4 2.5Euro Area 0.9 1.6 1.5 1.6
Germany 1.6 1.5 1.5 1.6France 0.2 1.1 1.1 1.3
United Kingdom 2.9 2.2 1.9 2.2Japan 0.0 0.5 0.5 -0.1Canada 2.5 1.2 1.5 1.9
Emerging Market and Developing Economies 4.6 4.0 4.1 4.6Developing Asia 6.8 6.6 6.4 6.3
China 7.3 6.9 6.5 6.2India 7.2 7.3 7.5 7.5
Commonwealth and Independence States 1.1 -2.8 -1.1 1.3Emerging and Developing Europe 2.8 3.5 3.5 3.3Latin America and the Caribbean 1.3 -0.1 -0.5 1.5Middle East and North Africa 2.8 2.5 3.1 3.5Source: IMF World Economic Outlook, April 2016
Despite signs of weakening growth, labour market indicators continue toimprove. Growth in Japan was also weak in 2015, reflecting a particularly sharpdrop in private consumption. In the euro area, weaker exports were offset bystronger private consumption supported by lower oil prices and easy financialconditions. The picture for emerging markets is quite diverse, with high growthrates in China and most of emerging Asian markets and severe macroeconomicconditions in Brazil, Russia, and a number of other commodity exporters. Growthin China was slightly stronger than previously forecasted, reflecting resilientdomestic demand especially consumption.
1
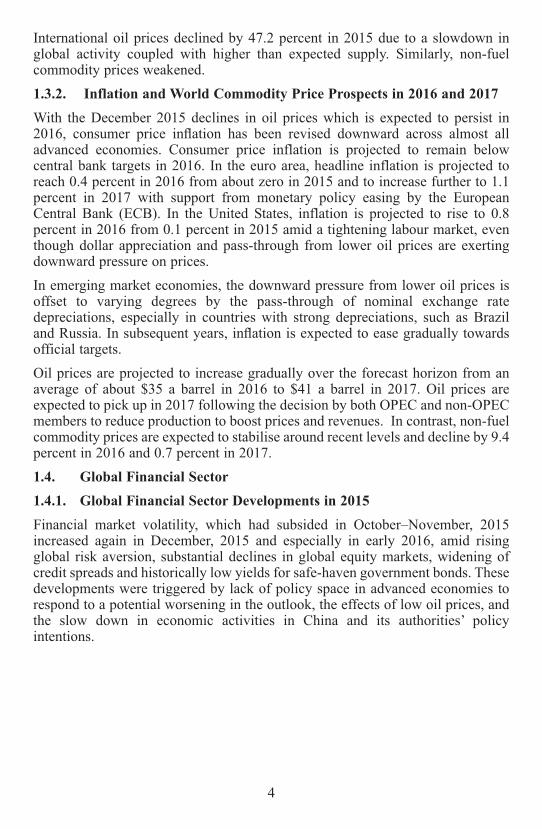
1.1.2. World Output Prospects for 2016 and 2017In 2016, growth is expected to remain modest in line with 2015 outcomes. Therecovery is projected to strengthen in 2017 and beyond. This is driven primarilyby emerging market and developing economies, as growth in advancedeconomies is expected to remain modest in line with weakened potential growth.However, uncertainty has increased and risks of weaker growth scenarios arebecoming more tangible.Growth in emerging market and developing economies is projected to increasefrom 4.0 percent in 2015 to 4.1 percent and 4.6 percent in 2016 and 2017,respectively. Growth in China is expected to slow down to 6.5 percent in 2016 and6.2 percent in 2017, primarily reflecting weaker investment growth as theeconomy continues to rebalance. India and the rest of emerging Asia are generallyprojected to continue growing at a robust pace although with some countriesfacing strong headwinds from China’s economic rebalancing and globalmanufacturing weakness.Aggregate gross domestic product (GDP) in Latin America and the Caribbean isprojected to contract in 2016, reflecting the recession in Brazil and other countriesin economic distress. Higher growth is projected for the Middle East, but loweroil prices, and in some cases geopolitical tensions and domestic strife continue toweigh on the outlook.1.2. Regional Output1.2.1. Regional Output Developments in 2015Macroeconomic indicators suggest that economic activity in sub-Saharan Africafell short of expectations in 2015 due to a drop in oil prices and declines in othercommodity prices. TABLE 1.2: REGIONAL OUTPUT (ANNUAL PERCENTAGE CHANGE)
2014 2015 2016 2017Sub-Saharan Africa 5.1 3.4 3.0 4.0
Tanzania 7.0 7.0 6.9 6.8Zambia 5.0 3.6 3.4 4.8Mozambique 7.4 6.3 6.0 6.8Zimbabwe 3.8 1.5 2.7 3.5South Africa 1.5 1.3 0.6 1.2Nigeria 6.3 2.7 2.3 3.5
Source: IMF World Economic Outlook, April 2016
Malawi’s three immediate neighbours, Tanzania, Mozambique and Zambia, havehad mixed performance with high growth rates in Tanzania and Mozambique ofabove 6.0 percent and a slowdown in growth for the Zambian economy as it grewby 3.6 percent in 2015 down from 5.0 percent in 2014. Growth in South Africafell from 1.5 percent in 2014 to 1.3 percent in 2015, mainly on account of lowercommodity prices and higher borrowing costs which weighed heavily on itseconomy.
2

1.2.2. Regional Output Prospects for 2016 and 2017Growth in sub-Saharan Africa is expected to remain weak in 2016 at 3.0 percent,lower than 3.4 percent in 2015. The ongoing slowdown is primarily driven byunfavourable external conditions. The resource-intensive countries have suffereda decline in commodity prices, while the region’s frontier markets are adverselyaffected by tighter global financing conditions. Growth is projected to pick up to4.0 percent in 2017 due to a small expected rebound in commodity prices andtimely policy implementation. Sub-Saharan Africa’s oil-exporting countries areprojected to grow by 2.0 percent in 2016 and 3.4 percent in 2017. The effect ofthe decline in oil prices on the region’s oil-importing countries has been smallerthan expected because many of these economies export other non-renewableresources whose prices have also dropped. In South Africa, growth is expected tobe halved to 0.6 percent in 2016 owing to lower export prices, elevated policyuncertainty, and tighter monetary and fiscal policies. In Zambia, the impact of thedrought on electricity production and low copper prices are adding to downwardpressure on growth. Therefore, growth will remain subdued at 3.4 percent. Inmany other oil importers, inflationary pressures stemming from the pass-throughof a strong U.S. dollar (which notably limited the decline of fuel prices indomestic-currency terms) and high food prices (due to the drought in eastern andsouthern Africa) have also eroded the benefits of lower oil prices. Nonetheless,ongoing investment in infrastructure and strong consumption in countries such asKenya, Rwanda and Tanzania are expected to drive growth rates of 6–7 percentor more in 2016 and 2017. 1.3. Inflation and World Commodity Prices1.3.1. Inflation and World Commodity Prices in 2015Headline inflation in advanced economies in 2015, at 0.3 percent on average, wasthe lowest since the global financial crisis, and this mostly reflects the sharpdecrease in commodity prices with a pickup in late 2015. In many emergingmarkets, lower prices of oil and other commodities have tended to reduceinflation. However, in a number of countries such as Brazil and Russia, sizablecurrency depreciations have exerted inflationary pressures.TABLE 1.3: CONSUMER PRICES AND WORLD COMMODITY
PRICES (ANNUAL PERCENTAGE CHANGE)2014 2015 2016 2017
Consumer Prices GrowthAdvanced Economies 1.4 0.3 0.7 1.5Emerging Markets and Developing Economies 4.7 4.7 4.5 4.2Sub-Saharan Africa 6.4 7.0 9.0 8.3
Commodity Prices GrowthOil -7.5 -47.2 -31.6 17.9Non-fuel -4.0 -17.5 -9.4 -0.7
Source: IMF World Economic Outlook, April 2016
3
International oil prices declined by 47.2 percent in 2015 due to a slowdown inglobal activity coupled with higher than expected supply. Similarly, non-fuelcommodity prices weakened. 1.3.2. Inflation and World Commodity Price Prospects in 2016 and 2017With the December 2015 declines in oil prices which is expected to persist in2016, consumer price inflation has been revised downward across almost alladvanced economies. Consumer price inflation is projected to remain belowcentral bank targets in 2016. In the euro area, headline inflation is projected toreach 0.4 percent in 2016 from about zero in 2015 and to increase further to 1.1percent in 2017 with support from monetary policy easing by the EuropeanCentral Bank (ECB). In the United States, inflation is projected to rise to 0.8percent in 2016 from 0.1 percent in 2015 amid a tightening labour market, eventhough dollar appreciation and pass-through from lower oil prices are exertingdownward pressure on prices.In emerging market economies, the downward pressure from lower oil prices isoffset to varying degrees by the pass-through of nominal exchange ratedepreciations, especially in countries with strong depreciations, such as Braziland Russia. In subsequent years, inflation is expected to ease gradually towardsofficial targets.Oil prices are projected to increase gradually over the forecast horizon from anaverage of about $35 a barrel in 2016 to $41 a barrel in 2017. Oil prices areexpected to pick up in 2017 following the decision by both OPEC and non-OPECmembers to reduce production to boost prices and revenues. In contrast, non-fuelcommodity prices are expected to stabilise around recent levels and decline by 9.4percent in 2016 and 0.7 percent in 2017. 1.4. Global Financial Sector1.4.1. Global Financial Sector Developments in 2015Financial market volatility, which had subsided in October–November, 2015increased again in December, 2015 and especially in early 2016, amid risingglobal risk aversion, substantial declines in global equity markets, widening ofcredit spreads and historically low yields for safe-haven government bonds. Thesedevelopments were triggered by lack of policy space in advanced economies torespond to a potential worsening in the outlook, the effects of low oil prices, andthe slow down in economic activities in China and its authorities’ policyintentions.
4

TABLE 1.5: LONDON INTERBANK OFFER RATES(PERCENTAGE)
2014 2015 2016 2017London Interbank Offered Rate (LIBOR) (Percent)On U.S. Dollar Deposits (six months) 0.3 0.5 0.9 1.5On Euro Deposits (three months) 0.2 0.0 -0.3 -0.4On Japanese Yen Deposits (Six Months) 0.2 0.1 -0.1 -0.3Source: IMF World Economic Outlook, April 2016
Monetary policy in advanced economies remains very accommodative withasymmetric shifts in the policy stance. In December the U.S. Federal Reserveraised policy rates above the zero lower bound for the first time since 2009, andit has communicated that any future policy actions will remain data dependent.On the other hand, the ECB announced a package of further easing measures inMarch, 2015 comprising an expansion of its asset purchase programme, includingpurchases of corporate bonds, new longer-term refinancing operations and afurther reduction in all policy rates. The monetary policy stance has also movedin different directions across emerging markets. A number of commodityexporters have raised policy rates in response to currency depreciation andassociated changes in inflation and inflation expectations, notably in Mexico andSouth Africa. In contrast, policy rates have been eased in India and China reducedthe reserve requirements.1.4.2. Global Financial Sector Prospects in 2016 and 2017Global financial conditions are assumed to remain broadly accommodative, butwith some segments—notably commodities and related industries and oil-exporting countries—facing tighter financing conditions. The process ofmonetary policy normalisation in the United States is assumed to proceedsmoothly without sharp movements in long-term interest rates. The tightening offinancial conditions for some emerging market economies over the past fewmonths, with rising interest rate spreads and declining equity prices, is expectedto persist.1.5. International Trade1.5.1. International Trade Developments in 2015After bouncing back from the global financial crisis, global trade and investmenthave slowed notably, both in absolute terms and in relation to world GDP growth.This slowdown has been more pronounced in emerging market and developingeconomies. The slowdown and rebalancing in China play an important role inexplaining these trends, but also the declining in investment and imports in somecommodity exporters especially facing macroeconomic difficulties. For theremainder of emerging market and developing economies, the decline in trade andinvestment growth is more muted. The main factor influencing the evolution ofglobal current account balances in 2015 has been the decline in oil prices. As a
5

result of this decline, the aggregate current account balance of oil-exportingemerging market and developing economies has turned into a deficit for the firsttime since 1998.
TABLE 1.6: WORLD IMPORTS AND EXPORTS (ANNUAL PERCENTAGE CHANGE)
2014 2015 2016 2017World Trade Volume (Goods and Services) 3.5 2.8 3.1 3.8Imports (Percentage Change)Advanced Economies 3.5 4.3 3.4 4.1Emerging Market and Developing Economies 3.7 0.5 3.0 3.7Exports (Percentage Change)Advanced Economies 3.5 3.4 2.5 3.5Emerging Market and Developing Economies 3.1 1.7 3.8 3.9Source: IMF World Economic Outlook, April 2016
Capital flows to emerging market and developing economies reached their lowestlevel since the global financial crisis in the second half of 2015. With capitaloutflows declining less than inflows, and with relatively little change in theaggregate current account balance, the change in reserves turned negative forthese economies as a group in the last two quarters of 2015. 1.5.2. International Trade Prospects for 2016 and 2017Growth in global trade is projected to remain moderate and pick up graduallyfrom 2016 onward, primarily due to stronger growth in domestic demand inemerging market and developing economies. Similar factors are expected to be atplay in 2016 compared to 2015 on account of further decline in average oil pricesrelative to their 2015 levels, albeit on a more modest scale. In subsequent years,imbalances are forecast to narrow as China rebalances and the surpluses ofadvanced European economies gradually decline as a share of world GDP morethan offsetting the return to surplus of oil-exporting countries given the forecastof higher oil prices.
6

Chapter 2
MACROECONOMIC PERFOMANCE IN 2015 AND PROSPECTSFOR 2016 AND 2017
2.1 Overall Economic Performance and ForecastIn 2015, Malawi attained GDP growth of 3.1 percent. Unfavourable weatherconditions which affected production in Agriculture and unstable macroeconomicconditions, particularly during the second half of the year, contributed to thesubdued economic performance. This is notable from the negative growthexperienced by the agricultural sector and decline in the growth rates ofmanufacturing, the wholesale and retail trade, which constitute the three largestsectors of the economy. Initial estimates for GDP growth in 2016 indicate that the economy will expandby 5.1 percent, an increase from the 3.1 percent growth rate registered in 2015.The increase in growth is mainly driven by modest growth in the agriculturalsector especially commercial agriculture and a notable expansion in the servicessectors, in particular, wholesale and retail trade, information and communicationand financial services. Macroeconomic instability and infrastructural bottlenecks,including frequent power outages carried over from 2015 are hindering growthprospects for other sectors, particularly mining and manufacturing which are bothexperiencing a decrease in their respective performances. Going forward, the economy is espected to continue growing owing to theimprovement in the macroeconomic fundamentals. In particular, the economywill benefit from lower fuel prices following a significant decrease in global oilprices carried over from 2015, stable exchange rate and greater availability of fueland foreign exchange. On the other hand, some challenges such as high interestrates and the high cost of utilities affecting the businesses in 2015 are expected tocontinue in 2016. In 2017, the economy is projected to improve compared to 2016 and it isestimated to grow by 7.0 percent. The increase in growth is attributed to continuedfavourable macroeconomic fundamentals, particularly the expected decreasingrate of inflation and an expected stable exchange rate, among others. In addition,the strong real GDP growth for the year will be driven by the increase inagricultural output on the assumption that weather condition normalises.
7

TABLE 2.1: GDP BY ACTIVITY AT CONSTANT PRICES,(IN MK’ MILLION)
Constant 2010 prices (in K’million)Sector 2013 2014 2015 2016* 2017*
Agriculture, forestry and fishing 347 179 368 910 362 869 374 509 400 195Mining and quarrying 12 021 11 467 11 597 11 647 11 837Manufacturing 110 096 117 008 121 452 125 585 132 365Electricity, gas and water supply 15 118 15 576 15 930 16 353 17 010Construction 32 980 34 563 35 722 36 474 37 767Wholesale and retail trade 182 885 194 361 203 547 214 865 231 760Transportation and storage 31 168 32 671 34 168 36 435 38 097Accommodation and food services 22 065 23 372 24 689 26 217 27 923Information and communication 45 292 50 811 55 118 58 104 61 850Financial and insurance services 58 171 61 348 65 569 68 621 73 262Real estate activities 92 962 96 428 97 997 100 997 103 964Professional and support services 3 422 3,675 3 843 4 138 4 261Public administration and defense 22 854 24 017 25 530 27 084 28 751Education 29 651 30 823 32 641 35 048 37 394Health and social work activities 30 911 32 209 33 342 35 874 38 279Other Services 56 225 59 282 62 769 66 210 69 037GDP at constant market prices 1 091 543 1 232 001 1 269 966 1 334 879 1 428 298GDP at current prices 1 425 230 2 534 656 3 207 378 3 895 748 4 816 798Source: National Statistical Office (NSO) and Department of Economic Planning and Development (DEPD)
*Projections
TABLE 2.2: SECTORAL CONTRIBUTION TO GDP (IN PERCENTAGES)
Constant 2010 prices (in K’million)Sector 2013 2014 2015 2016* 2017*Agriculture, forestry and fishing 29.9 29.9 28.6 28.1 28.0Mining and quarrying 1.0 0.9 0.9 0.9 0.8Manufacturing 9.5 9.5 9.6 9.4 9.3Electricity, gas and water supply 1.3 1.3 1.3 1.2 1.2Construction 2.8 2.8 2.8 2.7 2.6Wholesale and retail trade 15.8 15.8 16.0 16.1 16.2Transportation and storage 2.7 2.7 2.7 2.7 2.7Accommodation and food services 1.9 1.9 1.9 2.0 2.0Information and communication 3.9 4.1 4.3 4.4 4.3Financial and insurance services 5.0 5.0 5.2 5.1 5.1Real estate activities 8.0 7.8 7.7 7.6 7.3Professional and support services 0.3 0.3 0.3 0.3 0.3Public administration and defense 2.0 1.9 2.0 2.0 2.0Education 2.6 2.5 2.6 2.6 2.6Health and social work activities 2.7 2.6 2.6 2.7 2.7Other Services 4.8 4.8 4.9 5.0 4.8Source: National Statistical Office (NSO) and Department of Economic Planning and Development (DEPD)
*Projections
8

TABLE 2.3: ANNUAL PERCENTAGE GROWTH RATES(IN PERCENTAGES)
Constant 2010 prices (in K’million)Sector 2013 2014 2015 2016* 2017*Agriculture, forestry and fishing 6.2 6.3 -1.6 3.2 6.9Mining and quarrying 6.9 -4.6 1.1 0.4 1.6Manufacturing 5.6 6.3 3.8 3.4 5.4Electricity, gas and water supply 5.5 3.0 2.3 2.7 4.0Construction 2.0 4.8 3.4 2.1 3.5Wholesale and retail trade 7.9 6.3 4.7 5.6 7.9Transportation and storage 5.3 4.8 4.6 6.6 4.6Accommodation and food services 5.1 5.9 5.6 6.2 6.5Information and communication 7.5 12.2 8.5 5.4 6.4Financial and insurance services 3.8 5.5 6.9 4.7 6.8Real estate activities 2.5 3.7 1.6 3.1 2.9Professional and support services 5.5 7.4 4.6 7.7 3.0Public administration and defense 2.7 5.1 6.3 6.1 6.2Education 5.4 4.0 5.9 7.4 6.7Health and social work activities 5.1 4.2 3.5 7.6 6.7Other Services 5.5 5.4 5.9 5.5 4.3GDP at constant market prices 6.3 6.2 3.1 5.1 7.0GDP at current prices 23.8 31.5 26.5 21.5 23.6Source: National Statistical Office and Department of Economic Planning and Development (DEPD)
*Projections
2.2 Real Sector Performance in 2015 and Prospects for 2016 and Beyond2.2.1 AgricultureIn 2015, the agricultural sector contracted by 1.6 percent. The reduction is onaccount of the adverse weather conditions such as the late onset of rains, theJanuary 2015 floods, the uneven distribution of rainfall and dry spells whichnegatively affected the sector. Crop production declined by the following; maizeproduction decreased by 30 percent, rice by 18 percent and cassava by 2 percent.The decline was not as pronounced as originally estimated due to increase intobacco production. Tobacco production increased from 192 million kilograms in2014 to 193 million kilograms in 2015. In 2016 the sector is projected to grow by 3.2 percent despite the adverse effectsof El Nino weather conditions which resulted in erratic rainfall patterns and dryspells across the country. According to first round crop estimates, the moderategrowth in the sector is being driven by commercial farming. In particular, tobaccoproduction increased by 10 percent and sugarcane production grew by 2.8percent.
9

In 2017, the sector is projected to rebound with growth of 6.9 percent on theassumption that the weather condition will normalise. 2.2.2 Mining and QuarryingIn 2015, the Mining and Quarrying sector is expected to grow quite modestly by1.1 percent, compared to a negative growth of 4.6 percent registered in 2014.Growth in the sector is driven by the production of minerals such as coal.However, growth was lower than expected in 2015 due to delays in thecommencement of production of Kanyika Niobium Mine by Globe Metals andMining in Mzimba. Modest growth will continue in 2016 and the sector is expected to grow by 0.4percent and 1.6 percent in 2017 respectively. The country has mineral potential asdemonstrated by the airborne geophysical survey carried out in 2015 and there hasbeen talk of oil exploration in Lake Malawi. However, it will take some time forpotential exploration to take place and bear fruit. In addition, resumption inproduction of uranium at the Kayelekera Uranium Mine is not expected to takeplace in the course of 2016 and 2017 as international uranium prices remain low. 2.2.3 ManufacturingGrowth in the manufacturing sector was estimated at 3.8 percent in 2015 downfrom 6.3 percent in 2014. While the manufacturing sector enjoyed a relativelystable macroeconomic environment during the first half of the year, developmentsfrom July onwards including the rapid depreciation of the kwacha and highinflation rates negatively affected growth in this sector. In addition, agro-processing was negatively impacted by the decrease in agricultural cropproduction. In 2016, the growth rate is expected to be at 3.4 percent. Increased competitionfrom smuggled products, increasing production costs due to inflation and thedepreciation of the local currency and erratic electricity supply are constraininggrowth in this sector. Nevertheless, the sector is expected to expand, albeitmodestly, in 2016 largely due to growth in agro-processing which constitutesaround 50 percent of value added in the manufacturing sector. In addition,macroeconomic instability is expected to subside due to increased foodavailability and tobacco selling. In 2017, the sector is expected to grow by 5.4 percent assuming a favourableharvest and stable macroeconomic conditions.
2.2.4 Electricity, Gas and WaterThe utilities sector is estimated to have grown by 2.3 percent in 2015 and 2.7percent in 2016. The modest growth rates can be explained by challenges inhydropower production due to low water levels of the Shire River and lack ofimplementation of critical projects due to funding gaps. In addition, water boardsare expecting modest increases in production.
10

In 2017, the sector is expected to grow by 4.0 percent based on informationprovided by the Electricity Supply Corporation of Malawi (ESCOM) that it isexpected to increase production. In addition, the unbundling of ESCOM isexpected to address the inefficiencies in the power market. 2.2.5 ConstructionThe Construction sector grew by 3.4 percent in 2015 and it is expected to growby 2.1 percent in 2016. Construction is primarily dependent on government ordonor-funded projects, which are observed to be declining. In addition, the sectorremains constrained by a significant built-up of non-payments by the Governmentand high interest rates. Some companies opted for the zero-coupon promissorynotes that were offered by the Government in order to repay some of its debt.While this eased some of the cash flow constraints, they also incurred losses byaccepting this form of payment. In 2017, the sector is projected to grow by 3.5 percent on the basis that theGovernment will increase investing in physical infrastructure. Donor-fundedprojects such as the construction of secondary schools, teacher training colleges,community technical colleges and libraries in education sector will alsocontribute to improved performance in the sector.2.2.6 Wholesale and RetailThe wholesale and retail trade sector is estimated to grow by 4.7 percent in 2015compared to 6.3 percent in 2014. The decline in the growth rates in 2014 and 2015can partly be explained by the decline in the growth rate of the agricultural sectoras the performance of these two sectors is linked. In addition, the depreciation ofthe exchange rate increased costs. On the other hand, the sector benefitted fromthe stabilisation of the exchange rate and the reduction in fuel prices during thefirst half of the year. In 2016, the sector is expected to grow by 5.6 percent. Retailers are enjoying highprofits in this sector. In addition, the decrease in the fuel prices has reduceddistribution costs. Despite this development, some companies are moving out ofmanufacturing into wholesale and retail trade.In 2017, the sector is expected to grow by 7.9 percent, assuming that stablemacroeconomic conditions and high growth in agriculture will spur growth in thissector.2.2.7 Transportation and Storage ServicesThe sector is estimated to grow by 4.6 percent in 2015 compared to 4.8 percentregistered in 2014. While fuel prices generally reduced, damage to road and railinfrastructure sustained during the floods presented a challenge to the sector. Onthe other hand, the importation of maize from Zambia has benefitted the sector. In 2016 the sector is projected to grow by 6.6 percent largely due to growth in thewholesale and retail trade sector and the modern depots that are to be built inMzuzu and Lilongwe. In addition, it is expected that performance will improve inrail transport following the completion of the Moatize-Nacala Corridor Project.
11

In 2017 the sector is projected to slow down to 4.6 percent. This is mainlyattributable to the anticipated increase in international fuel prices in the year. 2.2.8 Accommodation and Food ServicesThe sector grew by 5.6 percent in 2015, mainly due to growth in the conferenceand corporate segments. Some hotels, for example, Annie’s Lodge, Sun and Sand,and Ilala Crest Lodge are expanding their facilities. In addition, a new five starhotel recently opened in Lilongwe has also contributed positively. In 2015, theGovernment supported the marketing of the tourist sector through a number ofactivities, including designating September 2015 as Malawi Tourism Month.Despite these positive developments, the introduction of a tourist visa fee inOctober 2015 is expected to somewhat negatively affect international arrivals inthe country. Growth is expected to remain strong in 2016 and 2017 at 6.2 and 6.5 percent,respectively, for similar reasons as cited for 2015. In addition, food services areexpanding primarily due to a new KFC restaurant opened in Lilongwe.
2.2.9 Information and CommunicationIn 2015, the information and communication sector grew by 8.5 percent. Thesector is registering high sales mainly due to the expansion of the communicationnetwork by mobile phone companies. In addition, the migration to digitalterrestrial television broadcasting has benefitted the sector. In 2016, the sector isestimated to grow by 5.4 percent as it is expected to benefit from increased salesof units, high internet subscriptions and consolidation of new services such asmobile banking. In 2017, the sector is projected to rebound to 6.4 percent. Growth potential for thissector remains strong as internet service providers seek to further increase theircustomer base and mobile phone operators have also high potential to increasesales of units and internet subscriptions. Therefore, mobile phone companiescontinue to undertake major investments in infrastructure to support theseservices.
2.2.10 Financial and Insurance ServicesThe sector is estimated to grow by 6.9 percent in 2015. The sector is benefittingfrom high interest rates, bank charges and increased foreign exchangetransactions that led to registering high profits. Growth is estimated at 4.7 percent in 2016. In addition to continued growth in thebanking sector, the insurance sector is also growing as gross written premiums areestimated to grow by 13.4 percent in real terms. In 2017, the sector is projected to grow by 6.8 percent, citing the same reasons.Growth is also expected to be boosted by an expanding customer base, as theintroduction of new technologies such as mobile banking will allow traditionalfinancial service providers to reach into new markets.
12

2.2.11 Real EstateThe real estate sector is estimated to grow by 3.1 in 2016 compared to 1.6 percentregistered in 2015. Growth remains modest as companies are experiencing lowactivity in this sector. Nevertheless, there is a rebound in 2016 as the MalawiHousing Corporation expects to increase its activities. The Corporation isexpected to have access to affordable finance through the Malawi InvestmentTrade Centre. In 2017, the sector is projected to grow by 2.9 percent, citing thesame reasons. 2.2.12 Professional and Support ServicesThe sector is expected to grow by 7.7 percent in 2016, up from 4.6 in 2015. Thereis high demand for legal services and audits following the need to prosecute thoseinvolved in the public finance mismanagement that was discovered in 2013 andthe need to have in place more checks and balances of both the public and privatesectors. In 2017 the sector is expected to continue growing at the rate of 3.0 percent andthe lower growth is based on assumption that many legal cases will be concludedin 2016. 2.2.13 Public Administration and DefenceThe sector grew by 6.3 percent in 2015, and it is projected to continue growing in2016 at the rate of 6.1 percent. The increase in growth can be explained by PublicService reforms introduced in February 2015 as these are expected to improveproductivity in public administration. The sector is anticipated to continue growing in 2017 and it is expected to growby 6.2 percent, citing the same reasons.2.2.14 EducationThe sector registered the growth of 5.9 percent in 2015, and it is estimated to growby 7.4 percent in 2016. This is attributable to the construction of new secondaryschools, libraries and the development of community technical colleges across thecountry. Furthermore, gross enrolment rates continue to increase owing to both populationgrowth and a focus to achieve the educational goals of the MillenniumDevelopment Goals and now the Sustainable Development Goals. With regardsto private schools, though gross enrolment rates vary across institutions, revenuesare expected to increase as the Malawian economy improves. Hence, the sector isexpected to continue growing, and it is projected to grow by 6.7 percent in 2017. 2.2.15 Human Health and Social Work ActivitiesThe sector is estimated to grow by 7.6 percent in 2016, an increase from 3.5percent registered in 2015. The number of in-patients in public and privatehospitals continues to rise owing to population growth particularly in urban areas.In addition, most private hospitals have increased fees and the number of people
13

seeking health services in private hospitals has also increased. The sector isprojected to grow by 6.7 percent in 2017 due to similar reasons. 2.3 Actual and Projected Inflation Rates for the Period from 2015 to 20172.3.1 Inflation Rates in 2015The annual average inflation rate for 2015 was at 21.8 percent down from 23.8percent in 2014. The end period inflation was at 24.9 percent, up from 24.2percent in December 2014. The annual average inflation rate for food was at 23.9percent while non-food items was at 20.0 percent. Looking beyond 2015, averageinflation rates for 2016 and 2017 are estimated at 19.8 percent and 14.9 percent,respectively. Single digit inflation is projected to be achieved in 2018.
TABLE 2.4: INFLATION RATES, 2013 __ 2017YEAR 2013 2014 2015 2016* 2017*Inflation rate (end of period), percent 23.5 24.2 24.9 17.5 12.8Inflation rate (annual average), percent 27.3 23.8 21.8 19.8 14.9Source: National Statistical Office and Department of Economic Planning and Development (DEPD)*Projections
In particular, inflation was on a downward trajectory for the first three months of2015. The decline in fuel prices and the exchange rate appreciation at thebeginning of the year supported the decrease in non-food inflation. Food pricesalso decreased as compared to the corresponding period in the previous year.However, since April 2015 the inflation rate crept up, mainly driven by foodinflation due to the shortage in food supply as a result of adverse weatherconditions. In addition, the exchange rate began to depreciate earlier thanexpected during the tobacco selling season in July, 2015 mainly due to speculativebehaviour by banks and the strengthening of the US dollar. This fuelled anincrease in non-food inflation.
2.3.2 Inflation Projections for 2016In 2016, the inflation rate is expected to decrease to an average of 19.8 percentand an end-period rate of 17.5 percent. Food inflation is projected at an averageof 23.8 percent and non-food inflation at 16.0 percent. Hence, inflation in 2016 isexpected to be driven by food inflation due to low food supply in the countrycaused by low rainfall. Food inflation reached its peak in February, 2016 and thereafter continued on amoderately downward trajectory as food supply increases following theharvesting period from March onwards. However, food inflation is not expectedto decrease significantly due to a decrease in production as estimated by the cropestimates. As such the end period food inflation rate is projected at 20.0. Non-food inflation is expected to decrease throughout the period and morepronouncedly from April 2016 onwards given the onset of the tobacco sellingseason and the expected stabilisation of the exchange rate. In addition, the
14

continued decrease in international oil prices will result either in lower fuel pricesor in the stabilisation of fuel prices. As was the case in 2015, this will also lead tolower non-food inflation which is forecast to reach an end-period rate at 14.9percent.
2.3.3 Inflation Projections for 2017Inflation rate is expected to decrease to an average of 14.9 percent in 2017 and anend-period rate is projected to be at 12.8 percent, with average food inflation at14.7 percent and non-food inflation at 15.1 percent. Food inflation is forecastedto subside and reach an end-period of 11.8 percent, assuming resumption inagricultural production. Non-food inflation is expected to remain at similar levelsas registered in 2016, as structural imbalances will lead to further depreciation ofthe exchange rate and utility prices will continue to increase. In addition, worldoil prices are forecast to start increasing in 2017 as per the IMF commodityestimates. The overall inflation rate is expected to fall to single digits from 2018onwards.
2.4 Balance of Payments2.4.1 Current Account Balance 2015 and 2016Malawi posted a current account deficit of US$936.7 million in 2015 which isprojected to decrease by 2.2 percent to US$916.3 million in 2016. The currentaccount deficit is being driven by continuous deficits on the net exports of goodsand services. As a percentage of GDP, between 2014 and 2015 the current account deficitdecreased from 23.3 percent of GDP to 19.2 percent of GDP. This is mainly onaccount of improvements in the trade balance. Net exports of goods are set todecrease by 16.0 percent from a deficit of US$1,232.9 million in 2014 toUS$1,036.1 million in 2015. This is mainly due to a significant decrease inimports between 2014 and 2015. The same trend is observed in the currentaccount balance for 2016 which also decreases, driven by a decrease in importsover and above a moderate decrease in exports. In the medium term, Government is putting in place economic reforms, includingthe launching of the National Export Strategy, which aims at reducing the currentaccount deficit. This will be achieved by improvements in the exports sectorcoupled with a decrease in import dependency. 2.4.1.1 Goods Balance in 2015 and 2016In 2015, exports are estimated to have decreased by 2.8 percent and reached avalue of US$1,371.9 million. This can be explained by the general decline inproduction of agricultural commodities due to adverse weather conditionsexperienced during the harvesting season. In addition, many commoditiesexperienced a decrease in their international prices. In 2016, exports are estimatedto further decrease by negative 0.26 percent. Despite continued adverse weatherconditions and low export prices affecting most commodity exports, tobacco is
15

expected to experience an increase in volumes to be exported, thus explaining analmost stagnation in export values between 2015 and 2016.Imports are expected to decrease significantly over the period in question by 20.5percent from $2,507.2 million in 2014 to $1,994.1 million in 2016. This hasmainly been driven by a decrease in the value of imports of petroleum productsby 56.5 percent due to the drop in international oil prices.
TABLE 2.5: EXPORT VALUES OF TRADITIONAL COMMODITIES(US$ MILLION)
2014 2015 2016Tobacco 600.8 649.7 703.4Tea 76.6 66.5 62.5Sugar 125.3 125.7 112.2Cotton 22.9 9.4 4.4Coffee 4.4 4.3 3.2Pulses 52.0 74.4 74.4Edible Nuts 70.3 107.1 95.0Uranium 41.0 - -Source: National Statistical Office and Department of Economic Planning and Development
2.4.1.1.1 Emergence of Edible Nuts as Key ExportsEdible nuts consist of groundnuts, cashew nuts and macadamia nuts. A significantincrease is noted in the value of edible nuts between 2014 and 2015 by 52.3percent. This makes it the third largest export of Malawi, following tobacco andsugar. Even though the production of groundnuts and cashews decreased in 2015due to unfavourable weather conditions, it appears that production of macadamianuts increased significantly, particularly in the Northern region . Macadamia nutsare high-value nuts in international markets and can fetch up to $12 dollars perkilogram.
2.4.2 Capital and Financial Account Balance 2015 and 2016Malawi is mainly financing its imports through foreign capital grants, foreignloans to General Government and Monetary Authorities, as well as foreign directinvestment. Positive inflows allowed Malawi to run a Capital Account surplus ofUS$457.4 million in 2015 and it is forecast to increase by 16.6 percent toUS$533.1 million in 2016. In 2015, the net inflow of funds into the FinancialAccount was US$590.7 million, which is set to decrease in 2016 to US$493.1million. This decrease can mainly be explained by the decrease in “OtherInvestment Liabilities”, which is mainly driven by a decrease in foreign loanstaken by General Government and banks.
16

TABLE 2.6: BALANCE OF PAYMENTS (US$ MILLION)2013 2014 2015 2016
Current Account Balance (Net) (1 216.5) (1 148.6) (936.7) (916.3)Goods (Net) (1 406.1) (1 232.9) (1 036.1) (946.4)
Exports of Goods, fob 1 260.5 1 512.4 1 469.3 1 465.6 Imports of Goods, fob (2 675.0) (2 753.0) (2 511.5) (2 416.4)Services (Net) (132.3) (159.6) (175.3) (156.3)
Exports of Services 109.6 109.5 116.2 93.8Imports of Services (241.9) (269.1) (291.6) (250.1)Income (Net) (262.8) (299.8) (219.6) (206.9)
Income Receipts 2.2 3.4 3.4 3.1Income Payments (265.0) (303.2) (223.1) (210.0)Current Transfers (Net) 584.7 543.6 494.3 393.2
Current Transfers Receipts 597.7 558.4 507.7 403.2Current Transfers Payments (13.0) (14.8) (13.4) (9.9)Capital Account (Net) 603.1 457.4 533.1 423.2
Current Account Receipts 603.3 457.5 533.3 423.4Current Account Payments (0.1) (0.2) (0.2) (0.1)Financial Account (Net) 739.7 740.2 590.7 493.1Foreign Direct Investment (Net) 449.7 603.5 292.8 323.2Foreign Direct Investment Abroad 4.1 4.7 5.1 4.1Foreign Direct Investment in Malawi 445.5 598.8 287.7 319.1
Portfolio Investment (Net) 7.6 8.7 9.3 7.5Portfolio Investment Assets 0.1 0.1 0.1 0.1Portfolio Investment Liabilities 7.5 8.6 9.2 7.4
Other Investments (Net) 468.3 307.8 378.4 261.7 Other Investment Assets (30.1) (100.0) (64.2) (68.7)Other Investment Liabilities 498.4 407.8 442.6 330.4
Reserve Assets (185.8) (179.8) (89.9) (99.3)Net Errors and Omissions (126.3) (48.9) (187.1) 0.0Source: National Statistical Office
2.5 Fiscal PerformanceIn the course of the 2015/16 fiscal year, Government continued to pursue fiscalpolicies and reforms aimed at restoring macroeconomic stability throughadherence to fiscal discipline. These policies were aimed at complementing otherpolicies aimed at achieving the same objective such as; tightening of monetarypolicy, maintenance of flexible exchange rate and enhancing automatic pricingmechanisms. Specifically, in the context of the Extended Credit Facility (ECF)programme with the International Monetary Fund (IMF), these policies were
17

together aimed at achievement of low inflation and interest rates, restoration ofinternal and external balance and stable exchange rates. However, theimplementation of the 2015/16 FY faced a number of challenges which includedsharp exchange rate depreciation during the first half which led to increased costsof imports for essential budgetary goods such as fertilizer and drugs. Furthermore,the continued freeze on budgetary support continued to put pressure on the narrowdomestic resource envelope thereby limiting government’s ability to financecritical service delivery and capital projects. The prolonged dry spell that affectedthe country during the period also created more fiscal pressure due to the resultantincreased need for humanitarian response. Despite the numerous challenges faced by government, fiscal policy remainedprudent and the Government objective of restoring macroeconomic stabilityremained on track. This was evidenced by the February, 2016 IMF mission toMalawi which concluded that Government made substantial progress to bring theECF programme back on track. The government met three out of the four ECFquantitative targets, including Central Government Net Domestic Borrowing. Bymid year the Net Domestic Borrowing was at K3.4 billion against the target ofK58 billion. The government was, therefore, within the target by K54.6 billion.Fiscal prudence has resulted in the reduction in debt stock due to higherrepayments than disbursements. Despite the increasing debt figures over theyears, external debt remains sustainable over the medium to long term as thepresent value ratios of key sustainability indicators are within the thresholdsapplicable to Malawi. For instance in 2016, the present value of debt/GDP ratio is26 per cent against a threshold of 30 per cent. As such, the borrowing plan hasbeen framed to ensure that the public debt levels continue to be sustainable in thenext five years.Furthermore, with Government’s record success in achieving most of thestructural benchmarks in the ECF programme, it is expected that more donorsupport will resume in the 2016/17 fiscal year.In the 2015/16 fiscal year total revenues and grants increased compared with2014/15 fiscal year. As percentage of GDP, total revenues and grants reached 22.1percent in 2015/16 compared with 21.8 percent in 2014/15 FY. The increase wason account of continued improvements in tax administration and new budgetsupport grants from African Development Bank following successfullimplementation of a number of public finance management measures . Withregard to domestic revenue collection, major improvements were reported undertaxes on income and profits which increased from 8.5 percent of GDP in 2014/15FY to 8.6 percent of GDP in 2015/16 FY. The improved performance in domesticrevenue continued to be buoyed by numerous reforms being implemented atMRA .However, due to a slow down in the economy experienced during theperiod under review taxes on goods and services marginally slackened from 6.7percent of GDP in 2014/15 FY to 6.5 percent of GDP in 2015/16 FY. Coupledwith a slow down in non-tax revenue collections during the year, in total domesticrevenue as percentage of GDP reduced from 19.3 percent in 2014/15 FY to 18.8
18

percent in 2015/16 FY. Despite suspension of budgetary support by the CABS,the country received budget support of about K17.9 billion from the AfricanDevelopment Bank and there was an increase in program grants and dedicatedgrants from 2.8 percent of GDP in 2014/15 to 3.6 percent of GDP in 2015/16.However, a substantial amount of this donor support is being channelled directlyto the implementing partners leaving little or no room for Government discretionto increase spending in other sectors where financing is much needed. As a signal of government’s commitment to restoration of macroeconomicstability through fiscal consolidation, overall fiscal deficit improved from 5.8percent in 2014/15 fiscal year to 3.8 percent during the 2015/16 fiscal year.Similary, net domestic borrowing improved during the year as it declined from3.38 percent of GDP in 2013/14 Fiscal year to 0.7 percent of GDP.Going forward into 2016/17 fiscal year, total revenues and grants as percentage ofGDP are expected to reach 22.2 percent which is a marginal increase from 21.0percent in 2015/16 fiscal year. Domestic revenues are expected to slow down to17.8 percent in 2016/17 FY from 18.4 percent in 2015/16 FY while grants as apercentage of GDP are expected to increase from 3.6 percent to 4.4 percent. Theincrease in grants is expected to arise from direct project support and ring fencedsector dedicated grants.The downward drop in domestic revenues as a percentageof GDP is an indication that our tax base is less responsive to the growth inincome hence government’s effort in broadening the tax base including taxing ofthe informal sector. In the 2015/16 fiscal year, total expenditures as percentage of GDP reduced from29.6 percent in 2014/15 fiscal year to 25.9 percent. Recurrent expenditure alsodeclined from 22.2 percent of GDP to 19.5 percent of GDP while developmentexpenditure increased from 5.4 percent in 2014/15 fiscal year to 6.3 percent in2015/16 fiscal year on account of increased foreign financed capital expenditure.In 2016/17 fiscal year, total expenditures as percentage of GDP is expected tomarginally increase from 25.8 percent to 26.1 percent mainly on account ofgovernment’s commitment to increasing capital expenditure from 6.3 percent in2015/16 FY to 7.3 percent in a quest to increase the economy’s productivecapacity. Conversely, recurrent expenditure as percentage of GDP is estimated tomarginally decline from 19.5 percent in 2015/16 FY to 18.8 percent signalling aslight departure from a consumption-led budget to a pro-growth budget.Government will continue to ensure pursuit of the macroeconomic stability goalwith the objectives of reducing inflation, lowering interest rates and stabilisingthe exchange rate at the core of its economic management agenda. Tightening ofthe fiscal policy while ensuring that growth sectors of the economy are wellsupported will remain at the core of Government’s priorities. Monetary policyshall continue to focus on dealing with the inflation problem and exchange ratevolatility. In 2016/17 Government will strive to finance all recurrent expenditureswith domestic resources while redirecting foreign resources to capitalexpenditures.
19

Over and above the economic objectives the 2016/17 FY budget is set as a vehiclefor addressing the current food crisis by financing maize purchases on thedomestic market and through imports, countering the effects of climate change,and enhancing rural incomes to enable people to purchase food.2.6 Monetary Policy DevelopmentsMonetary policy during the 2015/16 fiscal year focused on achieving twoobjectives, namely containing inflationary pressures, with the aim of bringingdown headline inflation, and achieving import cover of more than three months.To meet these objectives, the Reserve Bank of Malawi (RBM) pursued a tightmonetary policy stance in the first half of the 2015/16 financial year. In the firstquarter of the fiscal year, RBM maintained the policy rate at 25.0 percent.However, the liquidity reserve requirement ratio (LRR) was adjusted downwardsto 7.5 percent in August 2015 from the preceding level of 15.0 percent in order toenable commercial banks lower the spread between the prime lending rate and thepolicy rate. This resulted in a 4.78 percentage points decline in the base lendingrate by the end of August 2015. However, to deal with the high inflationexpectations and the sharp depreciation of the domestic currency, RBM raised thepolicy rate by 2.0 percentage points to 27.0 percent in November 2015. Contraryto this development, the annual growth rate of private sector credit rosesubstantially to 29.9 percent in December, 2015 from 13.6 percent recorded at theend of the 2014/15 fiscal year.
20

Chapter 3AGRICULTURE AND NATURAL RESOURCES
3.1 OverviewThis chapter reviews the performance of the Agriculture and Natural Resourcessector for the 2015/16 fiscal year. The chapter is divided into three sectionsnamely agriculture sector, fisheries sector and forestry sector.
3.2 Agriculture SectorThis section reviews weather forecast, crop and livestock production, nationalfood security, Farm Input Subsidy programme (FISP), and Agriculture SectorWide Approach (ASWAp).
3.2.1 2015/16 WeatherAccording to the Department of Climate Change and Meteorological Servicesactual cumulative rainfall performance from October 2015 to March 2016 wasbelow average in some parts of the Central and Southern regions. On the otherhand, average to above average rainfall amounts was received in the northern partof the country. Improvements in rainfall performance was observed in March2016. The combined effects of dry spells and flooding experienced in some partsof the country during the 2015/16 growing season significantly affecteddevelopment and maturity of most crops. Hence, the country recorded decreasedproduction in many agriculture commodities.
3.2.2 Crop ProductionThe second round of the Agriculture Production Estimates Survey (APES)projects a decrease in production for all major crops except some tubers such assweet potatoes and potatoes. National maize production is expected to go downfrom 2,776,277 metric tonnes in the 2014/15 growing season to 2,431,313 metrictonnes in the 2015/16 growing season, representing a 12.4 percent decrease. Thedecline is attributed to the late onset of planting rains and intermittent rainfallpatterns coupled with hot weather and prolonged dry spells especially in theSouthern Region and part of the Central Region. Tobacco production for 2016was estimated at 199,899 metric tonnes, an increase of 3.6 percent from 192,967metric tonnes in 2015. The increase is generally attributed to expansion ofhectarage in isolated tobacco growing areas adjacent to markets in which lastseason’s prices were relatively fair. Groundnuts production is estimated at272,077 metric tonnes which is a decrease by 8.2 percent from 296,497 metrictonnes produced in 2015. The table below gives a summary of production inmetric tonnes of major crops.
21
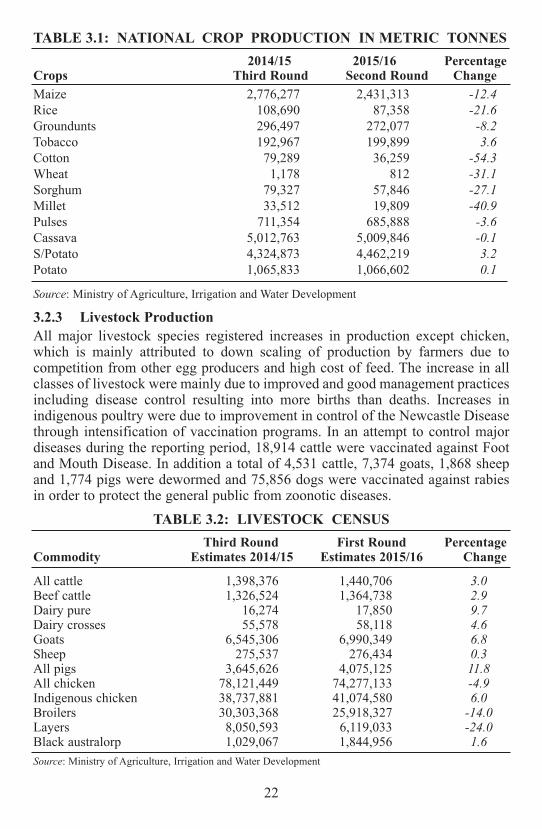
TABLE 3.1: NATIONAL CROP PRODUCTION IN METRIC TONNES2014/15 2015/16 Percentage
Crops Third Round Second Round ChangeMaize 2,776,277 2,431,313 -12.4Rice 108,690 87,358 -21.6Groundunts 296,497 272,077 -8.2Tobacco 192,967 199,899 3.6Cotton 79,289 36,259 -54.3Wheat 1,178 812 -31.1Sorghum 79,327 57,846 -27.1Millet 33,512 19,809 -40.9Pulses 711,354 685,888 -3.6Cassava 5,012,763 5,009,846 -0.1S/Potato 4,324,873 4,462,219 3.2Potato 1,065,833 1,066,602 0.1
Source: Ministry of Agriculture, Irrigation and Water Development
3.2.3 Livestock ProductionAll major livestock species registered increases in production except chicken,which is mainly attributed to down scaling of production by farmers due tocompetition from other egg producers and high cost of feed. The increase in allclasses of livestock were mainly due to improved and good management practicesincluding disease control resulting into more births than deaths. Increases inindigenous poultry were due to improvement in control of the Newcastle Diseasethrough intensification of vaccination programs. In an attempt to control majordiseases during the reporting period, 18,914 cattle were vaccinated against Footand Mouth Disease. In addition a total of 4,531 cattle, 7,374 goats, 1,868 sheepand 1,774 pigs were dewormed and 75,856 dogs were vaccinated against rabiesin order to protect the general public from zoonotic diseases.
TABLE 3.2: LIVESTOCK CENSUSThird Round First Round Percentage
Commodity Estimates 2014/15 Estimates 2015/16 Change
All cattle 1,398,376 1,440,706 3.0Beef cattle 1,326,524 1,364,738 2.9Dairy pure 16,274 17,850 9.7Dairy crosses 55,578 58,118 4.6Goats 6,545,306 6,990,349 6.8Sheep 275,537 276,434 0.3All pigs 3,645,626 4,075,125 11.8All chicken 78,121,449 74,277,133 -4.9Indigenous chicken 38,737,881 41,074,580 6.0Broilers 30,303,368 25,918,327 -14.0Layers 8,050,593 6,119,033 -24.0Black australorp 1,029,067 1,844,956 1.6Source: Ministry of Agriculture, Irrigation and Water Development
22

3.2.4 National Food SecurityDuring the reporting period, all eight Agriculture Development Divisions (ADDs)reported a poor food situation during the period between January and March 2016compared to same period last season. This is mainly attributed to flooding andprolonged dry spells in some parts of the country. The situation in Shire ValleyADD where 36 percent of the farm families have no food, is worse off this seasonthan last growing season when 10 percent of farming families had no food. Theprevailing price range for maize is also higher this season, ranging from K160 perkg to K265 per kg than last season’s price range of K70 per kg to K130 per kg. Ina bid to cope with the situation, families without food are purchasing maize fromvendors in markets where it is readily available. They are also engaging in variousincome generating activities including selling of fruits, firewood, charcoal andcasual labour.TABLE 3.3: NATIONAL FOOD SITUATION AS AT 30 MARCH 2016
2015/2016 SEASON 2014/2015 SEASON% Farm % Farm
Total farm Farm families families Total farm Families familiesADD families without food without food families without food without food
Karonga 146,137 19,790 13.5 136,536 1,491 1.1Mzuzu 387,414 65,860 17.0 381,413 9,135 2.0Kasungu 743,478 107,493 14.0 639,897 12,158 1.9Lilongwe 848,603 254,988 30.0 848,603 29,285 2.2Salima 221,296 54,292 25.0 200,749 2,959 1.0Machinga 779, 467 170,687 22.0 835,583 86,982 4.0Blantyre 816,914 252,008 31.0 894,636 31,335 4.0Shire Valley 216,215 77,855 36.0 185,609 18,501 10.0Total 3,380,057 1,002,973 30.0 4,123,026 191,846 5.0Source: Ministry of Agriculture, Irrigation and Water Development
3.2.5 Agriculture Sector Wide Apporach (ASWAp)The implementation period for the ASWAp came to an end in 2015. Currently, theMinistry of Agriculture, Irrigation and Water Development is conducting a reviewof the ASWAp to inform the development of the next medium term investmentstrategy for the agriculture sector. Meanwhile, whilst awaiting finalisation of thisprocess, the Ministry continued to implement its programmes in line with theASWAp in pursuit of delivering its targets in the Malawi Growth andDevelopment Strategy (MGDS) II. Within the ASWAp, the Ministry continued to implement a number of projectsincluding the Agriculture Sector Wide Support Project (ASWAp-SP), which isfunded by the Multi Donor Trust Fund (MDTF), that is, receiving contributionsfrom the European Union, Flanders International Cooperation Agency, UnitedStates Agency for International Development, Royal Norwegian Ministry ofForeign Affairs and Irish Aid. The MDTF was expected to close in December2016; but the Ministry is in discussion with World Bank, as MDTF administrator,on the possibility of extension.
23
Besides, the Ministry also continued to implement other projects including theAgriculture Infrastructure Support Project (AISP) and the Smallholder Irrigationand Value Addition Project (SIVAP) funded by the African Development Bank(AfDB); the Agriculture Productivity Programme for Southern Africa (APPSA)funded by the World Bank; the Farm Input Diversification Programme II (FIDPII)funded by the European Union; and the Sustainable Agriculture ProductionProgramme (SAPP) funded by the International Fund for AgricultureDevelopment (IFAD).3.2.6 Farm Input Subsidy Programme (FISP)A total of 1.5 million beneficiaries were targeted in all 28 districts across thecountry in the 2015/16 Farm Input Subsidy Programme. Each target beneficiarywas issued with a total of four coupons: two fertilizer coupons to purchase one 50kg of NPK and one 50 kg bag of Urea and two seed coupons to purchase a 5 kgof hybrid or 8 kg of OPV maize seed and certified legume (3 kg soya or 2 kg ofbeans/groundnuts/pigeon peas/cowpeas seed). The Programme supplied a total of150,000 metric tonnes of fertilizer (75,000 metric tonnes of NPK and 75,000metric tonnes of Urea), a minimum of 7,500 metric tonnes of maize seed andminimum of 3,000 metric tonnes of certified legume seed.In a bid to improve efficiency and accountability, the programme took thefollowing measures:
1. Piloted retailing of fertilisers by the private sector in the followingdistricts: Chikwawa, Mwanza, Chiradzulu, Balaka, Dedza, Mchinji,Salima, Mwanza and Nkhotakota;
2. Increased contribution to the programme by each farmer from MK500 toMK9,000;
3. Implemented central selection of beneficiaries to reduce bias inbeneficiary selection;
4. Continued with escorts to retail markets by the Malawi Police Service;and
5. Continued tracking of vehicles delivering fertilizer to retail markets usingESOKO system.
3.3 The Fisheries Sector3.3.1 The Socio-economic Role of the Fisheries Sector3.3.1.1 EmploymentThe Fisheries sub-sector which is composed of capture fisheries, aquaculture andaquarium trade sub-sectors has continued to be one of the major source ofemployment. During the financial year 2015/16, it has directly employed nearly60,746 fishers, an increase from 56,070 fishers who were employed in the2014/15 financial year.It is still on record that the sector continues to indirectly employ over half amillion people who are engaged in other ancillary activities such as fish
24

processing, fish marketing, boat building and engine repairs. It is also on recordthat the fish industry supports over 1.6 million people in lakeshore areas andmakes substantial contributions to their livelihoods. Thus, approximately 9percent, 18 percent, 15 percent, 9 percent and 30 percent of the total populationin Karonga, Nkhata Bay, Nkhotakota, Salima and Mangochi, respectively, aresupported by the fish industry. In addition, 13 percent of the people in Zomba,Machinga and Phalombe districts, as well as 6 percent of the people in the LowerShire Valley derive their livelihood from fishing.3.3.1.2 Food and Nutrition SecurityThe Fisheries Sector contribution to food and nutrition security has continued tobe paramount. With the production of 144,258 tonnes, fish has continued to be themain source of animal protein in the country with the contribution of over 70percent of the dietary animal protein intake of Malawians and 40 percent of thetotal protein supply. Much of the fish is consumed in rural areas therebycontributing significantly to daily nutritional requirements to some of thevulnerable groups such as HIV and AIDS victims, orphans and the poor.3.3.1.3 Source of incomeFish landings of 144,258 tonnes in 2015 had a beach or landed value ofMK108.66 billion (approx US$162.26 million) when compared with fish landingsof 117,098 tonnes in 2014 which had a beach or landed value of MK74.95 billion(approx US$166.56 million). The national average beach price was at MK753.24 per kilogram in 2015.Chambo, Mpasa, Mphende, Mcheni, Kampango, and Sanjika fetched the highestaverage beach prices of MK1,708/kg, MK1,315/kg, MK1,235/kg, MK1,073/kg,MK963/kg and MK904/kg, respectively, whilst Kasawala and Usipa recorded thelowest average beach prices of MK361/kg and MK384/kg, respectively, as shownin Figure 3.1 below. The low prices of these fish species allow the poorhouseholds to afford them and therefore has a positive impact on their diets.
FIGURE 3.1: AVERAGE BEACH PRICES FOR ALL FISH SPECIESFOR 2015 AND 2014
Source: Department of Fisheries
25
n Average Beach Prices (mk/kg) for all sh species 2015 n Average Beach Prices (mk/kg for all sh species 2014
Aver
age
beac
h P
rice
(Mk/
kg)
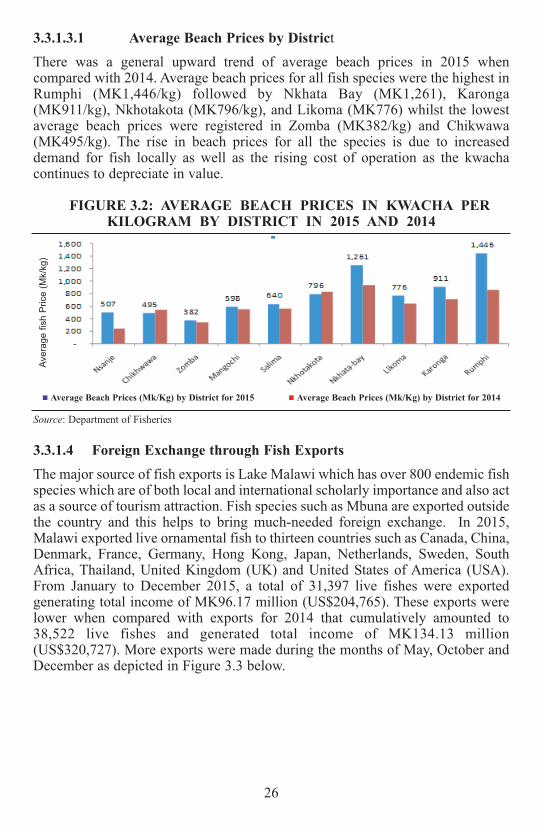
3.3.1.3.1 Average Beach Prices by DistrictThere was a general upward trend of average beach prices in 2015 whencompared with 2014. Average beach prices for all fish species were the highest inRumphi (MK1,446/kg) followed by Nkhata Bay (MK1,261), Karonga(MK911/kg), Nkhotakota (MK796/kg), and Likoma (MK776) whilst the lowestaverage beach prices were registered in Zomba (MK382/kg) and Chikwawa(MK495/kg). The rise in beach prices for all the species is due to increaseddemand for fish locally as well as the rising cost of operation as the kwachacontinues to depreciate in value.
FIGURE 3.2: AVERAGE BEACH PRICES IN KWACHA PERKILOGRAM BY DISTRICT IN 2015 AND 2014
Source: Department of Fisheries
3.3.1.4 Foreign Exchange through Fish ExportsThe major source of fish exports is Lake Malawi which has over 800 endemic fishspecies which are of both local and international scholarly importance and also actas a source of tourism attraction. Fish species such as Mbuna are exported outsidethe country and this helps to bring much-needed foreign exchange. In 2015,Malawi exported live ornamental fish to thirteen countries such as Canada, China,Denmark, France, Germany, Hong Kong, Japan, Netherlands, Sweden, SouthAfrica, Thailand, United Kingdom (UK) and United States of America (USA).From January to December 2015, a total of 31,397 live fishes were exportedgenerating total income of MK96.17 million (US$204,765). These exports werelower when compared with exports for 2014 that cumulatively amounted to38,522 live fishes and generated total income of MK134.13 million(US$320,727). More exports were made during the months of May, October andDecember as depicted in Figure 3.3 below.
26
n Average Beach Prices (Mk/Kg) by District for 2015 n Average Beach Prices (Mk/Kg) by District for 2014
Aver
age
fish
Pric
e (M
k/kg
)

FIGURE 3.3: EXPORT OF LIVE ORNAMENTAL (AQUARIUM)FISH IN 2015
Source: Department of Fisheries
The largest market for the aquarium trade in the period was Germany, Hong Kongand Thailand that imported fish worth MK35.3 million, MK19.2 million andMK10.4 million, respectively. Thus comparing with other markets, Germanyimported 36.7 percent of fish from Malawi followed by Hong Kong (19.9percent), and Thailand (10.7 percent) as shown in Figure 3.4 below.FIGURE 3.4: MAJOR MARKETS FOR AQUARIUM FISH IN 2015
Source: Department of Fisheries
3.3.2 Status of the Fisheries Sector3.3.2.1 Total Annual Fish Production by Water BodyNational catch statistics from all water bodies for Malawi show that total fishproduction had registered an increase from 116,128 tonnes in 2014 to 144,315tonnes in 2015. Lake Malawi alone had a total landing of 130,111 tonnes whenartisanal (127,438 tonnes) and commercial production (2,614 tonnes) figures areadded and this is followed by Lake Malombe at 5,904 tonnes (table 3.4). Thuswhen considered in terms of contribution by water body, about 90.16 percent ofthe catch originated from Lake Malawi, followed by 4.09 percent from Lake
27
Malombe whilst Lake Chilwa and Shire River contributed 3.92 percent and 1.03percent, respectively.
TABLE 3.4: FISH CATCH CONTRIBUTION BY WATER BODYFOR 2005 __ 2015
Source: Department of Fisheries
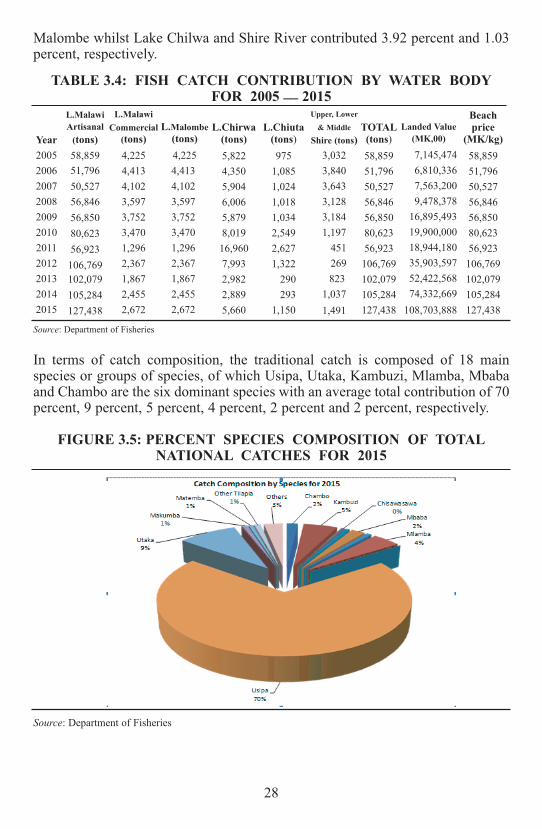
In terms of catch composition, the traditional catch is composed of 18 mainspecies or groups of species, of which Usipa, Utaka, Kambuzi, Mlamba, Mbabaand Chambo are the six dominant species with an average total contribution of 70percent, 9 percent, 5 percent, 4 percent, 2 percent and 2 percent, respectively.
FIGURE 3.5: PERCENT SPECIES COMPOSITION OF TOTALNATIONAL CATCHES FOR 2015
Source: Department of Fisheries
28
Year20052006200720082009201020112012201320142015
L.MalawiArtisanal(tons)58,85951,79650,52756,84656,85080,62356,923106,769102,079105,284127,438
L.Malombe(tons)4,2254,4134,1023,5973,7523,4701,2962,3671,8672,4552,672
L.MalawiCommercial(tons)4,2254,4134,1023,5973,7523,4701,2962,3671,8672,4552,672
L.Chirwa(tons)5,8224,3505,9046,0065,8798,01916,9607,9932,9822,8895,660
L.Chiuta(tons)975
1,0851,0241,0181,0342,5492,6271,322
290293
1,150
Upper, Lower
& Middle
Shire (tons)3,0323,8403,6433,1283,1841,197
451269823
1,0371,491
TOTAL(tons)58,85951,79650,52756,84656,85080,62356,923106,769102,079105,284127,438
Landed Value(MK,00)
7,145,4746,810,3367,563,2009,478,378
16,895,49319,900,00018,944,18035,903,59752,422,56874,332,669
108,703,888
Beachprice
(MK/kg)58,85951,79650,52756,84656,85080,62356,923106,769102,079105,284127,438

3.3.2.2 Annual Fish Production and Landed ValueThe 2015 catch trends together with 2016 and 2017 projections in fish productionper fish species and the estimated revenue gained by the small scale fishers isshown in Table 3.5 below. In terms of fish sales, whatever was produced by thesector was wholesomely translated into monetary value. A total of MK108.66billion (approx US$162.26 million) was cumulatively realised. However, thecatch contributions for 2016 are expected to slightly drop to around 131,451tonnes from 144,315 tonnes in 2015 due to an anticipated drop and projecteddecrease in abundance of some fish species such as Usipa (Engraulicyprissardella). The 2015 landing is largely composed of Usipa which contributes about70 percent to the total catch as shown in Figure 3.5. It is anticipated that in 2017the figures will stabilize with an increase in catches to 138,623 tonnes. This wouldtranslate to increased projected accrued monetary value of MK115.126 billion.
TABLE 3.5: FISH CATCH AND VALUE FOR 2015 AND ESTIMATESFOR 2016 AND 2017 FOR MAJOR SPECIESFish Species 2015 2016 2017
Local Name Sceintific Name Quantity Value Quantity Value Quantity Value
Chambo Oreochromis 2540.83 1,913,854.79 2,792 2,208,278,585 3,532 2,933,326,00Kambuzi Lethrinops spp. & Allied genera 7376.75 5,556,463,170 7,220 5,710,035,516 7,581 6,296,020,500Kasawala Juvenile Oreochromis spp. 135.07 101,740,127 248 196,153,482 260 215,930,00Chisawasawa Lethrinops spp. & Allied genera 901.7 679,196,508 714 564,614,176 750 622,875,000Kampango Bagrus meridionalis 962.43 724,940,773 1,579 1,248,686,523 1,658 1,376,969,000Mbaba Buccochromis spp. & Allied genera 3073.19 2,314,849,636 5,914 4,677,713,987 6,210 5,157,405,000Mcheni Rhamphochromis spp. 1338.57 1,008,264,467 1,431 1,131,680,145 1,502 1,247,411,000Mlamba Bathyclarias & Clarias spp. 6172.63 4,649,471,821 5,420 4,286,761,029 5,691 4,726,375,500Mpasa Opsaridium microlepis 2.51 1,890,632 73 57,809,412 77 63,948,500Nchila Labeo mesops 0 - 3 2,412,087 3 2,558,187Sanjika Labeo cylindricus 12.56 9,460,694 44 34,745,344 46 38,203,000Usipa Engraulicypris sardella 99369.65 74,849,195,166 85,408 67,549,187,200 89,678 74,477,579,000Utaka Copadichromis virginalis & relatives 13337.89 10,046,632,264 11,969 9,466,045,146 12,567 10,436,893,500Ndunduma Diplotaxodon spp 1458.71 1,098,758,720 1,469 1,162,069,212 1,543 1,281,461,500Nkholokolo Synodontis nyassae 0 - 161 127,663,124 169 140,354,500Makumba Oreochromis shiranus & relatives. 1165.92 878,217,581 1,225 968,543,045 1,286 1,068,023,000
Matemba Barbus paludinosus & relatives 839.31 632,201,864 643 508,237,012 675 560,587,500Other Tilapia Tilapia rendalli & others 1501.67 1,131,117,911 1,158 915,934,710 1,216 1,009,888,000Others Various spp 4125.22 3,107,280,713 3,980 3,147,698,734 4,179 3,470,659,500TOTAL 144,315 108,703,536,836 131,451 103,964,268,467 138,623 115,126,468,187
Source: Department of Fisheries
3.3.3 Fish Market Prices for Various Fish ProductsThe retail outlet market and beach prices have continued to show an increasingtrend during the year 2015. Thus in terms of fish products, Chambo, Kampangoand Mlamba products had the highest market prices (Figure 3.6). In all cases, theinformation generated has demonstrated that fish in the country is sold in variousforms depending on species, that is: sun dried, which is most common for fishspecies like Usipa, Utaka, Kambuzi and Matemba; smoked which is used onChambo, Kampango and Mlamba; para-boiled for Usipa; pan roasting for Utakaand Kambuzi; and fresh (frozen or iced) to enable fish traders to transport the fishto distant rural and urban markets.
29

FIGURE 3.6: FISH MARKET PRICES (MK/KG) FOR VARIOUSFISH PRODUCTS IN 2015
Source: Department of Fisheries
The 2015 prices show that along the value chain fish prices keep escalating as thefish and fisheries products are transported from the lake (beach) to the uplandsupermarkets. The prices vary depending on form of the product, that is, fresh,frozen, smoked and filleted. As value addition is taking place, the price of fishgoes up to recover the added costs of processing as shown in Figure 3.6 above andTable 3.6 below. Another factor for the general upward trend in fish prices is dueto the depreciation of Malawi currency which resulted in increased landing andtransportation costs, supply and demand fluctuations and seasonality.
TABLE 3.6: FISH MARKET AVERAGE PRICES FOR VARIOUS FISH PRODUCTS IN 2015
Avg price forvarious fishproducts perkg for 2015 Chambo Chisawasawa Kampango Mbaba Mcheni Mlamba Usipa Utaka NdundumaFresh fishBeach 1,708 513 963 556 1,073 732 384 574 645Fresh fishMALDECO 2,210 900 1,910 1,420 1,360 1,290 1,400 880 1,000 Fresh fish atSupermarkets 2,420 990 2,070 1,570 1,500 1,420 1,500 990 1,100Frozen fishSupermarket 2,600 1,060 2,070 1,570 1,600 1,000 1,500 1,090 1,260Smoked fishSupermarkets 3,960 5,180 3,300 _ 5,000 5,280 3,190 5,180 5,180Fillets 7,560 _ 5,800 _ _ 5,280 _ _ _
Source: Department of Fisheries
30

3.3.3.4 Fish Supply per CapitaIn terms of per capita fish consumption, the sector continues to registerfluctuating trends due to varying fish production levels. There was anotherincrease from 8.19kg/person/yr in 2014 to 10.09kg/person/yr in 2015 as shown inTable 3.7 below.
TABLE 3.7: PER CAPITA FISH SUPPLY FROM 2005 TO 2015WITH ESTIMATED POPULATION GROWTH
Source: Department of Fisheries
The current average per capita consumption of 10.09 kilogram per person per yearis still less than the recommended 13-15 kg per person per year by the WorldHealth Organisation (WHO). However, the current Fisheries and AquaculturePolicy focuses on fish quality and value addition as a means of promotingadoption of best practices that will enhance quality, hygiene and sanitation andvalue addition for fish and fish products so that the annual catch that is lostthrough post harvest spoilage and insect infestation is reduced. This will ensurecontinued availability of fish in required amounts that will avert the per capitaconsumption deficit. The aquaculture efforts that are being pioneered by thesector will enhance production of the major cultured species such as Chambo.
3.3.3.5 Status Of Fishing Fleet (Craft) and FishersDuring the year 2015, a census of all fishing effort indicators was done with theaim of determining the spatial and temporal composition, magnitude anddistribution of fishing effort from which targeted and relevant managementinterventions are derived. The 2015 survey managed to record fishing gears, craftsand fishers in all landing sites and the results are summarised in Table 3.8 below,which shows that:__
1. There is a steady increase in the number of crew members since 1998while gear owners have rather remained stable. Since 2011, the number ofgear owners is declining with a recent slight increase (6.07 percent)observed between 2014 and 2015;
31
Year Population Total catch (kg) Fish supply/kg/person/yr2005 11,300,000 72,913,000 6.452006 11,500,000 65,484,000 5.692007 11,700,000 65,200,000 5.572008 13,100,000 71,266,000 5.442009 13,300,000 71,289,000 5.362010 13,500,000 95,724,000 7.092011 13,700,000 81,070,000 5.922012 13,900,000 120,328,000 8.662013 14,100,000 109,889,000 7.792014 14,300,000 117,094,878 8.192015 14,300,000 144,315,275 10.09

2. Only boats with engines and planked canoes have maintained a steadyincreasing trend while boats without outboard engine are declining withdugout canoes remaining rather stable at least for the past six years;
3. There has been an increase in the numbers of Chilimira nets by 17.93percent over the results of the 2014 survey. Although this is the case,generally the overall trend of Chilimira has been stable over the years.Unlike Chilimira nets, there has been a decrease in the number of Nkachanets by 13.83 percent. The overall trend of the Matemba seine nets overthe years has been stable. Although this is the case, one would see thatthere is a decrease by 64.32 percent between 2014 and 2015 records. Thischange can be attributed to the slow recovery of the Matemba fishery inLake Chilwa and Lake Chiuta which has forced most of the fishers to useother gears such as gillnets;
4. Temporal trends in the number of gillnets show that while the largermeshed gillnets have declined since 2009, the number of under-meshedgillnets, Ngongongo, have continued to rise since 2011; and
5. Comparing the last two years (2014 and 2015), there is an increase in thenumbers of Kandwindwi. This is anticipated because this gear is currentlybeing used as an improved beach seine thereby allowing it to be recastseveral times in one day and hence increasing the probability of catchingmore fish. On the other hand, Kambuzi seines have decreased by 2percent. This could be due to the tendency of the fishers opting for smallmeshed gears due to the dwindling of catches of the relatively bigger fishlike Utaka. This has therefore prompted fishers to prefer using smallmeshed gears such as Nkacha nets other than the Kambuzi seine. On theother hand, there is an increase in Chambo seine nets by 55.56 percentbetween the 2014 and 2015.
32

TABLE 3.8: FRAME SURVEY COUNTS OF FISHING CRAFT, GEAROWNERS, CREWMEMBERS AND FISHING GEARS 1998 __ 2015
% increaseIndicator 1998 1999 2003 2007 2008 2009 2010 2011 2012 2013 2014 2015 /decreaseBoats with engine 578 534 493 586 814 872 960 1,003 1,211 1,280 1,352 1526 12.87Boats without engine 3,240 3,088 2,999 3,502 3,360 2,942 2,613 2,570 2,582 2,396 2,989 2254 -24.59Dug-out canoes 14,306 11,457 11,824 11,215 11,540 11,289 10,785 10,663 11,089 10,918 10,935 11635 6.40Planked canoes 764 1,227 1,098 833 996 1,382 1674 21.13Gear owners 14,471 13,503 15,542 13,305 14,065 13,403 14,538 14,146 12,761 12,383 11,546 12247 6.07Crew members 37,488 35,347 42,312 41,993 41,841 46,123 45,335 47,003 45,764 43,312 44,524 48499 8.93Gillnets (normal) 32,941 43,430 77,668 67,552 70,606 75,291 63,225 52,560 60,716 43,560 26,398 26925 2.00Ngongongo 13,704 14,979 19,303 10,351 24,311 23,031 28,376 39706 39.93Chikwekwesa 337 59 90 257 7,674 246 157 368 134.39Longlines 2,753 3,954 2,884 3,902 5,726 5,740 5,791 5,182 150,397 6,321 5,723 9808 71.38Kambuzi seines 546 345 385 438 484 399 408 261 200 174 145 141 -2.76Chilimira nets 2,584 2,568 3,079 2,588 3,491 3,394 3,349 3,053 2,931 3,059 3,129 3690 17.93Fish traps 8,255 40,078 27,071 20,460 15,814 25,362 34,644 24,832 16,690 21,941 44,585 32673 -26.72Handlines 4,400 3,084 1,383 2,414 1,563 1,589 660 748 870 584 2,687 3638 35.39Kandwindwi 98 98 106 117 79 79 113 160 41 59Scoop nets 21 79 83 14 36 56 29 59 54 47 44 39 -11.36Cast nets 37 47 766 535 717 701 705 824 782 694 439 356 -18.91Chambo seines 106 62 71 70 212 89 85 177 129 110 117 182 55.56Nkacha nets 204 258 309 279 238 315 241 289 524 274 311 268 -13.83Matemba seine 498 422 276 853 406 542 690 855 587 662 1,194 426 -64.32Chomanga 35,579 23,298 24,350 13,371 5,814 038,506 44,847 45,862 67,354 51,102 56,609 68624 21.22
Source: Department of Fisheries
3.3.4 Performance of Aquaculture SectorUsing the developed aquaculture data collection methodology and tools, theaquaculture sub-sector contributed about 4,984.45 tonnes of fish harvested fromall production systems which ranged from cage culture to pond culture.
TABLE 3.9: ESTIMATED PRODUCTION LEVELS (TONNES) AND VALUE (US$) OF THE MAJOR CULTURED FISH SPECIES (2000 – 2015)
EstimatedSpecies Units Years
– – 2000 2001 2002 2003 2010 2011 2012 2013 2014 2015Production
Oreochromis (t) 500 600 670 680 850 1420 2186 2,578 3,299.84 3,422.03shiranus/mossa Valuembicus (US$) 550,000 575,000 649,600 696,000 869,550 1,219,780 1,877,774 2,704,783 3,462,122.87 3,849,012.05
Production(t) - 12 70 85 630 862 633 641 820.48 850.86
ValueTilapia rendalli (US$) - 13,800 11,200 42,000 113,647 740,458 543,747 813,460 1,041,229.13 957,027.43
Production(t) 15 18 10 17 42 175 262 333 426.24 5 08.47
Clarias Valuegariepinus (US$) 18,000 18,000 11,200 17,000 42,000 150,325 225,058 339,786 434,925.58 571,914.86
Production(t) 10 10 8 4 30 76 67 7 1 90.88 94.25
ValueCyprinus carpio (US$) 10,000 10,000 8,960 5,600 42,000 65,284 57,553 88,884 113,771.92 106,004.60
Production(t) 5 8 4 15 48 98 84 82 104.96 1 08.85
Oncorhynchus Valuemykiss (US$) 17,500 57,200 24,800 96,000 307,200 56,078 72,156 103,511 132,493.89 122,427.85Total majorspecies (t) 530 648 752 801 1600 2631 3232 3,705 4,742.40 4,984.45Total value
(US$) 595,500 674,000 705,760 856,600 1,374,397 2,260,029 2,776,288 4,050,425 5,184,543.40 5,606,386.79
Source: Department of Fisheries
33
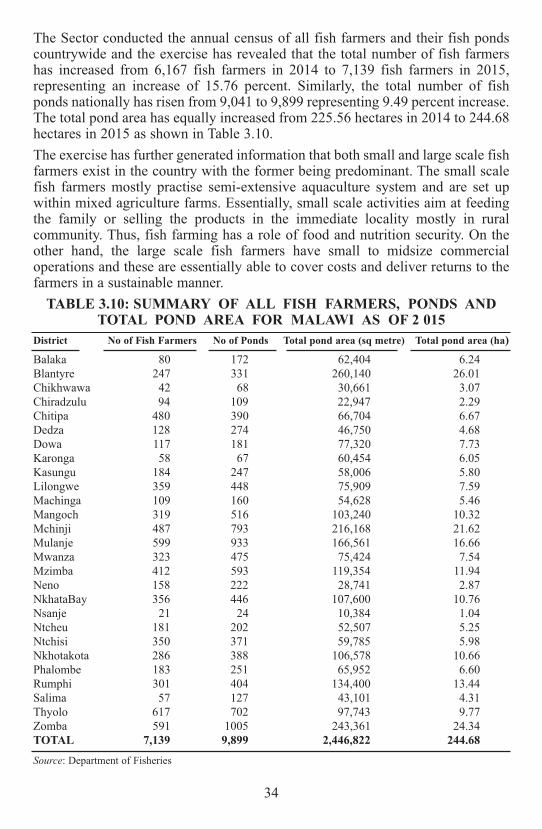
The Sector conducted the annual census of all fish farmers and their fish pondscountrywide and the exercise has revealed that the total number of fish farmershas increased from 6,167 fish farmers in 2014 to 7,139 fish farmers in 2015,representing an increase of 15.76 percent. Similarly, the total number of fishponds nationally has risen from 9,041 to 9,899 representing 9.49 percent increase.The total pond area has equally increased from 225.56 hectares in 2014 to 244.68hectares in 2015 as shown in Table 3.10.The exercise has further generated information that both small and large scale fishfarmers exist in the country with the former being predominant. The small scalefish farmers mostly practise semi-extensive aquaculture system and are set upwithin mixed agriculture farms. Essentially, small scale activities aim at feedingthe family or selling the products in the immediate locality mostly in ruralcommunity. Thus, fish farming has a role of food and nutrition security. On theother hand, the large scale fish farmers have small to midsize commercialoperations and these are essentially able to cover costs and deliver returns to thefarmers in a sustainable manner.TABLE 3.10: SUMMARY OF ALL FISH FARMERS, PONDS AND
TOTAL POND AREA FOR MALAWI AS OF 2 015District No of Fish Farmers No of Ponds Total pond area (sq metre) Total pond area (ha)Balaka 80 172 62,404 6.24Blantyre 247 331 260,140 26.01Chikhwawa 42 68 30,661 3.07Chiradzulu 94 109 22,947 2.29Chitipa 480 390 66,704 6.67Dedza 128 274 46,750 4.68Dowa 117 181 77,320 7.73Karonga 58 67 60,454 6.05Kasungu 184 247 58,006 5.80Lilongwe 359 448 75,909 7.59Machinga 109 160 54,628 5.46Mangoch 319 516 103,240 10.32Mchinji 487 793 216,168 21.62Mulanje 599 933 166,561 16.66Mwanza 323 475 75,424 7.54Mzimba 412 593 119,354 11.94Neno 158 222 28,741 2.87NkhataBay 356 446 107,600 10.76Nsanje 21 24 10,384 1.04Ntcheu 181 202 52,507 5.25Ntchisi 350 371 59,785 5.98Nkhotakota 286 388 106,578 10.66Phalombe 183 251 65,952 6.60Rumphi 301 404 134,400 13.44Salima 57 127 43,101 4.31Thyolo 617 702 97,743 9.77Zomba 591 1005 243,361 24.34TOTAL 7,139 9,899 2,446,822 244.68
Source: Department of Fisheries
34
3.3.5 ChallengesThere are a number of challenges faced by the sector, some of which are asfollows:__
1. Inadequate financing of fisheries programmes and activities leading tounderachievement of the set targets;
2. Poor distribution and amount of rainfall leading to reduced wateravailability in fish and fields leading to reduced production from fishfarming;
3. Continued depreciation of the Kwacha thereby increasing the requiredstart-up capital for any fish farming or fishing enterprise; and
4. Poor availability of spare parts for engines and increased operation costsdue to rise in prices were additional challenges.
3.4 The Forestry SectorThis section reviews the forestry sector’s performance and contribution to theeconomy in the financial year 2015/2016 in accordance with forest policy andpublic expenditure regulation. The section focuses on forest utilisation andmarketing, budget allocation and revenue collection, tree planting and plantationrehabilitation, and various programmes being implemented in the sector.
3.4.1 Forest Utilisation and MarketingThere were 38 timber export licences and 1,000 export permits issued to RAIPLYMalawi, Vizara Timber plantation and various individuals for exporting forestproducts to various countries. For imports, 8 licenses and 547 permits forimportation of various forestry products were issued to Illovo Sugar Company,ESCOM, Simbanet, Nyala Company, and Lizulu Timbers. By 4th April 2016,issuances of export licenses and permits generated revenue amounting toMK6,976,000 down from K8,505,000 in 2015. Receipts from import licenses andpermits amounted to MK2,825,000. The exported products went to markets inRepublic of South Africa, Mozambique, Kenya, Tanzania, Botswana, Zimbabwe,China, Zambia, Germany and France, among other countries. The total exportvalues were MK3.3 billion as shown in Table 3.11. This is similar to earningsrecorded in 2015.
35

TABLE 3.11: EXPORT VALUE FOR FOREST PRODUCTS FOR2015/16 FINANCIAL YEAR (AS AT 5 APRIL 2016)
Forest product Quantity Export value in Malawi KwachaMDF Block boards (sheets) 131,050 1,356,249,568Shutter ply boards (sheets) 106,140 917,795,357Kiln dried timber (m3) 1,926 142,491,560Laminated shelvings 201,104 sheets
475 m3 238,155,642Plywood 4776 sheets
714 m3 136,629,924Timber (pine and rubber – m3) 15,020 479,779,874Curios (pieces) 558 3,499,541Colombo roots(kg) 28,000 39,780,000Total 3,314,381,467Source: Department of Forestry
3.4.2 Budget Allocation, Expenditure and Revenue CollectionIn the 2015/2016 financial year, the Department of Forestry was allocatedK219,054,996 as compared to K136,898,753 in 2014/15 Financial year on OtherRecurrent Transactions (ORT). There was a 60 percent increase in nominal valuein the budget allocation compared to 4 percent increase in the previous financialyear. The Department has seven Cost Centres. Table 3.12 below shows theallocations and expenditures per Cost Centre.
TABLE 3.12: COST CENTRE BUDGETARY ALLOCATIONS A NDEXPENDITURES FOR 2015/16 FY AS OF 5 APRIL 2016
Approved Budget Actual Funding FundingCost Centre (MK) (MK) (percent)
Department of ForestryHeadquarters 42,000,000 19,343,625 46.02Forestry Research Instituteof Malawi 15,733,450 8,693,164 55.25Regional Forestry Office South 28,456,260 15,478,289 54.39Regional Forestry Office Centre 32,031,650 17,779,243 55.51Regional Forestry Office North 27,300,301 14,904,934 54.60Malawi College of Forestry andWildlife 40,533,335 22,668,712 55.93Viphya Plantations 33,000,000 18,203,253 55.16Total 219,054,995.87 98,867,967 54Source: Department of Forestry
36

With three months to go before the end of the financial year, only 54 percent ofthe approved budget has been funded so far. The funding levels are lower thanplanned and the cost centres are facing financial difficulties in fulfilling theirplanned tasks. For example, management of Viphya Plantations requires hugecapital investment in terms of vehicles, tractors, fire fighting equipment andmaintenance of infrastructure such as plantation roads, houses andcommunication equipment, among others. The three division forestry offices have24 plantations with a total of 37,304 hectares and 83 forest reserves. Due to lowfunding levels, these establishments are under threats from encroachment becauseof lack of adequate patrolling and law enforcement. Forestry Research Institute ofMalawi (FRIM) which is mandated to carry out stakeholder-oriented research onthe sustainable management, utilisation and conservation of trees and forests inMalawi is unable to collect and process tree seeds and as such the quality of treesplanted is of inferior quality. Malawi College of Forestry and Wildlife is alsounable to train more technical staff in time resulting in decline of forestry servicesin the country.With regards to revenue collection, the major sources of revenue for theDepartment of Forestry in the year under review were sales of logs, concessions,firewood and licenses. Most revenue was collected from Viphya Plantations.Table 3.13 below shows revenue collected by the Department by 28 February,2016. Prospects for next financial year are not promising as the forest resources aredwindling. Viphya plantation which is main source of revenue is facing a lot ofchallenges such as theft of trees for timber.TABLE 3.13: REVENUE COLLECTED BY THE DEPARTMENT OFFORESTRY AS OF 28TH FEBRUARY 2016 IN THE 2015/16 FINANCIAL YEARSource of revenue Amount Collected (MK)
Sale of farm produce 385,560Sale of firewood 51,719,075Forest seed sales 1,439,571Phytosanitary Certificates 1,638,350Log sales 18,230,947Licence Fees 50,314,139 Miscellaneous Fees 10,075,589Concessions 195,431,079Rent Malawi Government houses 4,191,840Rest House Fees 74,000Royalties on Forestry Produce 1,997,340Accommodation and Hall hire 472,550Tuition Fees 33,500Course Fees 255,000Receipts on certificates 2,233,550Total Revenue 648,492,090Source: Department of Forestry
37

3.4.3 Tree Planting and Plantation Rehabilitation3.4.3.1 2015/16 Forestry SeasonThe target for tree planting in 2015/16 season was 59,950,000 seedlings. The treeswere expected to be planted by different stakeholders such as smallholderfarmers, communities, private sector, Village Natural Resources ManagementCommittees, Non Governmental Organisations, schools and governmentplantations. The production was 45,259,672 seedlings and the actual seedlingsplanted in three regions during the National Forest Season are 34,958,686. At thesame time last year, 47,163,367 seedlings had been planted and 63,196,840seedlings were planted during the 2013/14 forestry season. The decreasingnumbers of trees planted are due to a number of factors such as erratic rainfall anddwindling seedling production levels. Table 3.14 shows the details.
TABLE 3.14: TREE PLANTING IN THE 2015/16 NATIONALFOREST SEASON
Seedlings Planted asRegion Target Production 2016 of MarchNorth 7,950,000 6,854,314 4,031,342Centre 30,000,000 22,628,438 14,494,010South 22,000,000 15,776,920 16,433,334Total 59,950,000 45,259,672 34,958,686Source: Department of Forestry
3.4.3 Forest Development and Management FundThe Forestry Development and Management Fund (FDMF) became operationalin the 2011/12 financial year. The aim of the fund is to support and increase theconservation and management of forest resources and forest land in Malawi. Inthe year under review, the Department of Forestry was allocated MK789,314,440.The major expenditures for the FDMF in the year under review were:__
1. Tree Planting and Management;2. Contract work in government plantations for various silvicultural
operations;3. Law enforcement; and4. Training of Forestry Assistants at Malawi College of Forestry and
Wildlife.
38

Chapter 4IRRIGATION AND WATER DEVELOPMENT
4.1 OverviewThis chapter provides a brief of the major achievements for Irrigation and WaterDevelopment during the 2015/2016 financial year as well as a summary of theprospects for the 2016/2017 financial year. The Irrigation and Water Developmentsector is guided by the following policy objectives: To achieve sustainable andintegrated water resources management systems; increase availability andaccessibility of water and sanitation services for socio-economic growth anddevelopment; develop the institutional capacity of the water and sanitation sector;increase agricultural production; and enhance food security through irrigationdevelopment.
4.2 IrrigationMalawi has been experiencing erratic rainfall patterns coupled with dry spells andthis has negatively affected rain-fed agriculture. It has been reported that rain-fedagriculture production decreased in 2014/15 season. For example, maizeproduction declined by about 30 percent in the 2014/15 season and it is expectedto decrease by 2 percent in the 2015/16 season. In addition, food demand has beenincreasing steadily due to absolute increase in population.Therefore, in order to ensure that household and national food security isachieved, a total of 3,028 hectares of land has been developed for irrigationfarming and 1,797 hectares of irrigable land has been rehabilitated for thesmallholder farmers. This brings the total developed land to 104,643 hectares,representing 25.6 percent of a potential land for irrigation of 408 862 hectares.Out of the total developed land, 52,144 hectares of land is under smallholderfarmers, benefiting 424,808 people and 52,499 hectares is under the estates.Major crops grown by the smallholder farmers included cereals (maize and rice)and horticultural crops for both food security and income purposes.The newly developed schemes under the aforementioned programmes/projectscomprise all the technologies currently being promoted, that is, gravity fed,motorised and treadle pump based irrigation schemes. During the reportingperiod, 96.7 percent of the developed 52,144 hectares were utilised undersmallholder irrigation, of which 28,249 hectares (56 percent) was under gravity,4,036 hectares (8 percent) was under motorised pumps, 14,629 hectares (29percent) was under treadle pumps and 3,531 (7 percent) hectares was underwatering can-based irrigation.
4.3 Water Resources Management and DevelopmentThe Sector continued to achieve the objectives of ensuring that people in Malawihave access to potable water, improved sanitation services, and increased foodsecurity and national incomes through implementation of a number ofprogrammes/projects.
39

The sector has also commenced the upgrading of Kamuzu Barrage at Liwondewith funding from the World Bank under Shire River Basin ManagementProgramme. The upgraded Barrage will be a state-of-the-art facility which willimprove regulation of the Lake Malawi-Shire River System and weedmanagement. The Shire River Basin Management Programme also seeks to lay afoundation for more integrated planning and modernised system operations forthe Shire River Basin. Through the same programme, the rehabilitation andmanagement of sub-catchments in Ntcheu, Neno, Zomba and Blantyre, andprotected areas of Lengwe and Liwonde National Parks and Forest Reserves inNeno and Mangochi has commenced in order to reduce soil erosion and improvepeople’s livelihoods. Further, the Programme is supporting community-levelflood risk management investments in Chikwawa and Nsanje districts.During the reporting period, the sector also continued with the implementation ofthe Songwe River Basin Development Programme which is a joint programmebetween the Government of the Republic of Malawi and the Government of theUnited Republic of Tanzania whose ultimate goal is to contribute to improvedliving conditions of the basin population and the socio-economic development inthe two countries. Amongst several benefits, the two countries will have improvedhydropower, irrigation and trade once the project is finished and operational. Thesector has finalised the development of the detailed designs for variousinvestments such as multipurpose dam, hydropower plant, irrigation schemes androad infrastructure.With support from the Global Environmental Fund (GEF) through UNDP, thesector embarked on the improvement of hydro-meteorological monitoringstations to support early flood warning systems across the country. The projectwill also help strengthen climate information and early warning systems inMalawi for climate resilient development and adaptation to climate change.In addition to the above milestones, through the International DevelopmentAssociation (IDA) Crisis Response Window (CRW), the sector commenced theimplementation of various key interventions under the Malawi Flood EmergencyRecovery Project. The project primarily focuses on the sustainable restoration ofagricultural livelihoods, enhanced food security, resilient reconstruction of criticalpublic infrastructure, restoration of services, and investments in longer-term riskreduction. Specifically, construction of dykes commenced in Chikwawa, Zombaand Phalombe districts. The project also assisted in the provision of potable waterto the 2015 flood affected communities in the Lower Shire through drilling ofboreholes.
4.4 Water SupplyIn order to ensure that access to safe water supply is achieved, three rural pipedwater supply systems were constructed and five rural water supply systems wererehabilitated in the period under review. This achievement brings the percentageof people with access to safe water supply to about 84 percent in the country.During the same reporting period, the sector rehabilitated piped water supply
40

41
systems under the National Water Development Programme (NWDP) in the areasof Mchinji, Champhira in Mzimba, Usisya-Usingini in Nkhata Bay and Misukuin Chitipa. To ensure sustainability, the project established and trained WaterUsers‘ Associations and recruited local utility operators to carry out operationsand maintenance of the systems. In addition, the piped water supply systems haveWater Point Committees responsible for managing the daily affairs of communaltaps.The performance of the five water boards of Lilongwe, Blantyre, SouthernRegion, Central Region and Northern Region that supply water services to theurban and town centres for 2014 and 2015 is outlined in Table 4.1 below. Thefigures in the table depict that there was a significant increase in the populationserved with water, averaging at 12 percent. The water boards increased waterproduction in the year under review, and there was also a rise in the number ofnew customers.
TABLE 4.1: URBAN WATER SUPPLY COVERAGEIncrease in Coverage
Population Served population Increase inWater Board 2014 2015 served Percentages
Lilongwe (LWB) 570,858 720,725 149,867 26.3Blantyre (BWB) 1,064,860 1,118,633 53,773 5Central Region (CRWB) 201,745 226,560 24,815 12.3Northern Region (NRWB) 253,201 280,014 26,813 10.6Southern Region (SRWB) 289,799 323,799 33,820 11.7
TOTAL 2,380,463 2,669,731 289,088 12
Source: Water Boards Reports, 2015
Similarly, the percentage of people able to access water within a 30 minute radiussteadily increased as shown in table 4.2 below. This is attributed to the completionof projects such as: Extension of Zomba Water Supply; Extension of MangochiWater Supply; the establishment of a new Neno water supply system, amongothers.
TABLE 4.2: PERCENTAGE OF PEOPLE WHO ARE LESS THAN 30MINUTES AWAY FROM WATER SOURCES
Water Board 2013 2014 2015Lilongwe 68 69 72Blantyre 100 100 100Central Region 98 98 98Northern Region 100 100 100Southern Region 77.0 79 81Average 88.6 89.2 90.2Source: Water Boards Reports, 2015
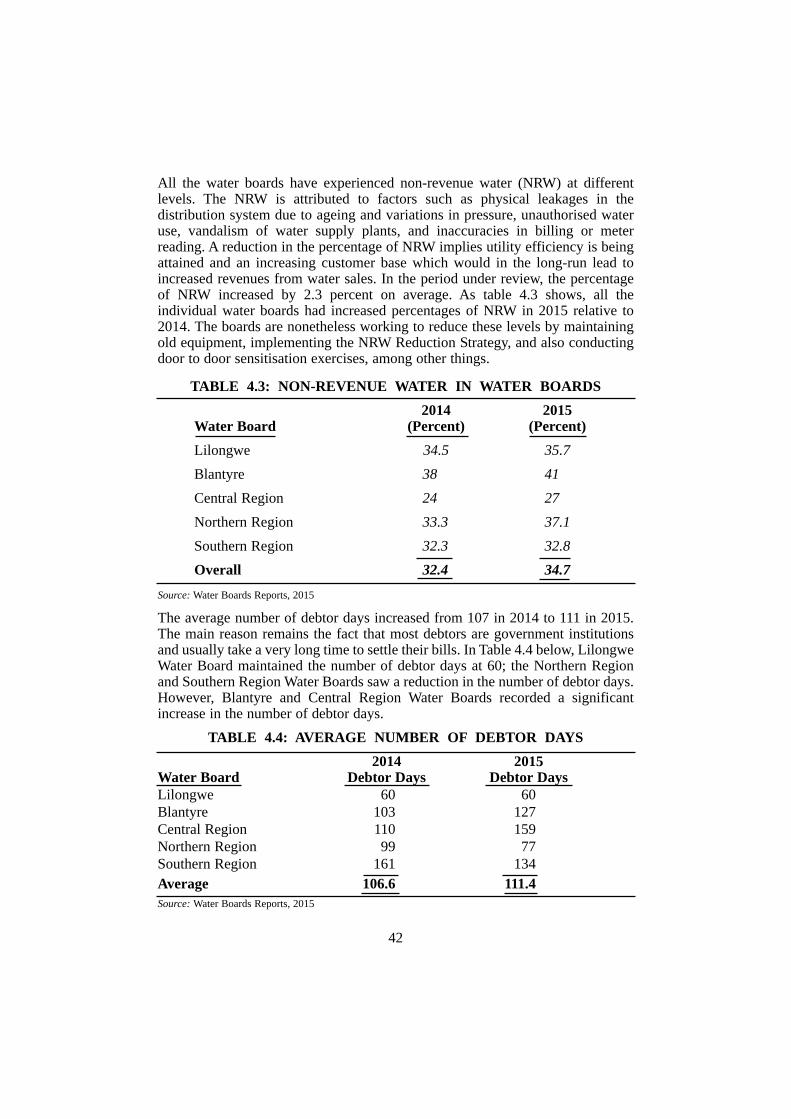
All the water boards have experienced non-revenue water (NRW) at differentlevels. The NRW is attributed to factors such as physical leakages in thedistribution system due to ageing and variations in pressure, unauthorised wateruse, vandalism of water supply plants, and inaccuracies in billing or meterreading. A reduction in the percentage of NRW implies utility efficiency is beingattained and an increasing customer base which would in the long-run lead toincreased revenues from water sales. In the period under review, the percentageof NRW increased by 2.3 percent on average. As table 4.3 shows, all theindividual water boards had increased percentages of NRW in 2015 relative to2014. The boards are nonetheless working to reduce these levels by maintainingold equipment, implementing the NRW Reduction Strategy, and also conductingdoor to door sensitisation exercises, among other things.
TABLE 4.3: NON-REVENUE WATER IN WATER BOARDS2014 2015
Water Board (Percent) (Percent)Lilongwe 34.5 35.7Blantyre 38 41Central Region 24 27Northern Region 33.3 37.1Southern Region 32.3 32.8Overall 32.4 34.7
Source: Water Boards Reports, 2015
The average number of debtor days increased from 107 in 2014 to 111 in 2015.The main reason remains the fact that most debtors are government institutionsand usually take a very long time to settle their bills. In Table 4.4 below, LilongweWater Board maintained the number of debtor days at 60; the Northern Regionand Southern Region Water Boards saw a reduction in the number of debtor days.However, Blantyre and Central Region Water Boards recorded a significantincrease in the number of debtor days.
TABLE 4.4: AVERAGE NUMBER OF DEBTOR DAYS2014 2015
Water Board Debtor Days Debtor DaysLilongwe 60 60Blantyre 103 127Central Region 110 159Northern Region 99 77Southern Region 161 134Average 106.6 111.4Source: Water Boards Reports, 2015
42

4.5 Sanitation and HygieneThe sector is implementing a project under the Global Sanitation Funding (GSF)of the United Nations (UN) Water Supply and Sanitation Collaboration Council(WSSCC) called Accelerated Sanitation and Hygiene Practices in Malawi whoseobjective is to create and maintain an improved public health environment byeliminating open defecation and promoting accelerated access to improvedsanitation and adoption and use of hygiene practices. In doing so, the projectcontributes to Government efforts of attaining improved health and socio-economic development. The project is being implemented in six districts ofRumphi, Nkhotakota, Ntchisi, Balaka, Phalombe and Chikwawa. During theperiod under review, the project has assisted five traditional authorities inPhalombe, Rumphi, Balaka, Nkhotakota and Chikwawa to attain the opendefecation free status, representing a 25 percent achievement of the project target.The sector has also commenced the implementation of the Sustainable RuralWater and Sanitation Infrastructure for Improved Health and Livelihoods Project.The objective of the project is to spur socio-economic growth in Malawi byimproving health and livelihoods of the rural population through provision ofsustainable water supply and improved sanitation. The project conductedtrainings on community-led total sanitation (a tool for sanitation promotion) toPrimary School Education Administrators and extension workers in the five targetdistricts of Rumphi, Nkhotakota, Ntcheu, Mangochi and Phalombe. In addition,the project has also commenced the construction of sanitation facilities in targetedschools, health centres and market centres in these districts.Furthermore, with support from World Bank and through Blantyre and LilongweWater Boards the sector carried out sanitation and hygiene promotion campaignin the peri-urban areas of the two cities.
4.6 Planned Programmes for the 2016/17 Financial YearIn 2016/17 financial year, the sector will continue to work towards the attainmentof goal of water and sanitation for all. Under Irrigation, Green Belt Irrigation(GBI) has been identified as one of Government’s priorities to ensure thathousehold and national food security is achieved. With regard to this realisation,the sector plans to develop close to 6,300 hectares of land for irrigation farmingwhich is expected to benefit over 10,000 farmers in the 2016/17 financial year.This will be achieved through the implementation of the Support to ASWAp-GBIComponent 2 covering 989 hectares and construction of Bwanje Dam, SmallFarms Irrigation Project covering 800 hectares, Capacity Enhancement for theDevelopment of Medium Scale Irrigation Schemes covering 200 hectares andProgramme for the Rural Irrigation Development covering 5,133 hectares.Solar-powered irrigation farming will be promoted through the AgricultureInfrastructure Support Programme (AISP) and the Support to ASWAp-GBIComponent 2, in Nsanje, Chikwawa, Neno and Balaka districts targeting 827hectares. The Smallholder Irrigation and Value Addition Project will finalisedevelopment of 400 hectares for new irrigation schemes and rehabilitation of five
43

existing schemes covering 1,170 hectares in Wovwe, Hara, Bua, Zumulu A andManthimba. Under the Malawi Flood Recovery Programme, the sector willrehabilitate the schemes that were affected by floods covering 2,056 hectaresacross the country. Plans are also in place to distribute 4,510 treadle pumps tosmallholder farmers in areas which were affected by floods.Under the Shire Valley Irrigation Project, the sector shall ensure that all the sevenpreparatory studies are completed and adequate financing is sourced as it has thepotential of turning the Lower Shire into a food basket as well as opening upvarious accompanying economic opportunities. Under the Shire River BasinDevelopment Project Phase I, the Irrigation and Water sector will develop newschemes covering about 1,000 hectares. The sector shall also spearheadimplementation of the newly-developed Irrigation Master Plan and InvestmentFramework and also establishing Irrigation Fund. In addition, in order to improvecapacity in the implementation of irrigation development programmes, a capacitybuilding programme with support from the Government of Japan will be launchedtargeting 35 irrigation engineers registered as professional irrigation Engineerswith the Malawi Board of Engineers in a phased approach.Under Water Resources Management and Development, the sector plans tocommence the construction of Diamphwe Multipurpose Dam which will supplywater to meet demand in Lilongwe City and surrounding areas. Above this, thesector intends to construct a total of three small multipurpose dams across thecountry to make water resources readily available for multiple uses such asdomestic, irrigation, fish farming, livestock production, recharging groundwaterresources as well as sustaining the ecosystem. Furthermore, there will becontinued implementation of the ongoing projects such as the Shire River BasinManagement Programme and Songwe River Basin Development Programmewhere issues of water development and management are highly featuring. Thesector also plans to enhance groundwater recharge through the implementation ofGroundwater Development and Management Program whereby water fromprecipitation will deliberately be encouraged to infiltrate into the ground toimprove the quantity and quality of groundwater resources and availability ofsurface water resources in the dry season and dry areas for various uses.It is expected that the sector will rehabilitate twelve piped water supply systemswith a total of 2,925 taps and construct 450 boreholes which are expected tobenefit over 515,850. This will be done through the implementation of theSustainable Rural Water and Sanitation Infrastructure for Improved Health andLivelihoods Project. In addition, in conjunction with United Nations InternationalChildren’s Emergency Fund (UNICEF) and through the Water Sanitation andHygiene (WASH) Project, the sector will complete the construction of a numberof boreholes to benefit over 42,000 people. It is anticipated that this activity willbe concluded during the first quarter of 2016/17FY.
44

4.7 Challenges Facing the SectorAlthough the sector has recorded the achievements highlighted above, it has alsofaced a number of challenges ranging from vandalism of irrigation infrastructure,ageing infrastructure, dwindling sources of water, inadequate production capacityof water due to increased water demand and lack of access to land for commercialfarming. The sector has also been hit hard by exorbitant electricity tariffs forirrigation schemes using ESCOM power to pump water for irrigation purposes asthey are charged at industrial rates and maximum voltage use. Furthermore, lowfunding levels to district offices is affecting operations, maintenance andsustainability of water supply and sanitation systems. Lastly, non-adherence toprojected cash flows by Treasury affects implementation of work plans. This isfurther aggravated by delays in processing of payments by the Department ofAccountant General.
45

Chapter 5TRANSPORT AND PUBLIC INFRASTRUCTURE
5.1 OverviewThis chapter reviews the performance of the transport sector for the financial year2015/16 focusing on road, rail, marine and air transport, including plant, vehiclehire and engieering services.
5.2 Road Transport and Safety5.2.1 Roads Sub-SectorIn general, the roads sub-sector did not perform well during the year under review.Most projects have faced constrained financial resources which in turn affectstheir timely implementation. Besides, the financial challenges from previousyears have resulted into huge liabilities accumulated due to delayed payments,interest charges and price escalations. Due to these financial problems, mostprojects that were scheduled for commencement in the 2015/16 financial yearhave not taken place. Furthermore, heavy rains during the 2014/15 and 2015/16years caused a lot of damage to the roads that were constructed in the past, mostof which are due for periodic maintenance and rehabilitation. To address this, theRoads Authority is already attending to some of the roads by carrying outpatching and resealing works including rehabilitation to ensure that the roadsprovide the travelling public with better service.During the period under review, a number of projects that had stalled over theyears commenced, namely the Zomba – Jali – Kamwendo – Phalombe –Chitakale road and the Thyolo – Thekerani – Muona – Bangula Road (S151). Thefunding was provided from Kuwait Fund, Arab Bank for Economic Developmentin Africa (BADEA), OPEC International Fund, and the Government of Malawi.Implementation of other projects in the road sub-sector is expected to commencein 2016/2017 financial year. These are as follows:1. Mzuzu – Nkhata Bay Road rehabilitation with funding from the African
Development Bank;2. Liwonde – Mangochi Road rehabilitation project with funding from the
African Development Bank;3. Karonga – Songwe Road rehabilitation project with funding from the World
Bank;4. Area 18 roundabout – New Parliament Building – Kamuzu Central Hospital
roundabout to Paul Kagame on Amina roundabout expansion and dualisationof the road with funding from Government of Malawi and AfricanDevelopment Bank; and
5. Illovo roundabout – Midima Road expansion and dualisation with fundingfrom the Government of Malawi.
46

There are also plans to commence feasibility and design studies of other roadsincluding:1. Economic feasibility and preliminary engineering design of the Rumphi –
Nyika – Chitipa Road Project with funding from the Arab Bank for EconomicDevelopment in Africa (BADEA) and the Government of Malawi; and
2. Feasibility and engineering designs for the Chiweta – Kacheche Road and theKacheche – Mzuzu – Mzimba road projects with funding from the WorldBank.
In July 2015, there was a change in the fuel levy structure from an absolute figureto a percentage of the pump price. The rationale for pegging the fuel levy as apercentage was to ensure that more resources are collected for road maintenanceand that the value of the fuel levy is not eroded by inflation, given that thecontracts for road maintenance are subject to revisions on account of inflation andexchange rate fluctuations. This change led to the increase in the amount as wellas the value of the fuel levy in US$ per litre. In particular, when the change waseffected in July 2015, the fuel levy for petrol and diesel changed from K37(US$0.08) to K60.3 (US$0.10) and from K32 (US$0.07) to K74.8 (US$0.13),respectively. The subsequent revision occured in November 2015, however, therewas a decrease in the rate of the fuel levy expressed in US$ per litre due to thedepreciation of the kwacha as the fuel prices have been stable.
5.2.2 Road Traffic and SafetyThere are several efforts being undertaken in order to improve service delivery aswell as efficiency. In this regard, a number of reforms are being implemented inthe Directorate of Road Traffic and Safety Services.
5.2.2.1 Malawi Traffic Information System (MALTIS)The MALTIS has been operational since May 2015. Its implementation aims atimproving road safety through the automation of manual transactions andimprovement in safety procedures. The implementation of MALTIS has alsoresulted in increased revenue to the Government due to sealing of loopholes andenhanced road safety by eliminating the production of fake documents bymiddlemen.
5.2.2.2 Outsourcing of Vehicle Inspection ServicesThe decision to outsource vehicle inspection for Certification of Fitness (CoF) toprivate service providers was reached to bring efficiency in the delivery of thisservice to the public. Government Centres at the Road Traffic and Safety Servicesregional offices, apart from servicing particular categories, will only play the roleof quality control especially in Lilongwe and Blantyre. About 16 companiesexpressed interest to provide Vehicle Inspection Services (VIS) and their premiseswere inspected in order to assess their capacity to undertake the project. Theprivate sector is expected to start providing VIS before June 2016.
47

The outsourcing of Vehicle Inspection Services is expected to de-congest theexisting Road Traffic Vehicle Inspection Stations and ensure private sectorparticipation in road safety management.
5.3 Rail Sub-sectorDuring the period under review, there were efforts to improve rail infrastructurein order to improve efficiency in rail operations. In this regard, the Ministry hasbeen rehabilitating rail infrastructure with the aim of curtailing furtherdeterioration of the railway network. The situation deteriorated with the floodsthat occurred in January 2015, resulting in over 70 percent of the networkrequiring major rehabilitation and reconstruction. This has heavily affectedmovement of goods and people especially in the areas where they mainly rely onrail network to transport goods. Meanwhile, it is expected that the feasibility anddesign studies for the Sena railway rehabilitation will be completed by June 2016.Similarly, the feasibility study for the Nkaya-Salima-Lilongwe-Mchinji rail line isexpected to be finalised by June 2016. Once these studies have been finalised, itwill be easier for the Government to mobilise resources for rehabilitation of therailway lines.The completion of the 138 km rail line from Kachaso in Chikwawa to NkayaJunction in Balaka will provide a cheaper transport alternative to the businesscommunity. During the year under review, VALE started operating trains on therail line.In 2016/17, the Government will continue with efforts to conduct spot emergencyrepairs especially in areas that were affected significantly by the floods.
5.4 Marine Sub-SectorThe Government realises the importance of water transport. In this regard, theMarine Department commenced a number of activities undertaken to enhancemarine safety. This includes the review of laws and regulations governing the sub-sector. During the year under review, the Marine Sub-sector was affectedparticularly in port operations. The Nkhata Bay Jetty was damaged by heavywinds thereby affecting the safety of passengers. In this regard, the private sectoroperator of the port is in the process of reconstructing the jetty. This eventtogether with the loss of the Gantry Crane at Chilumba port in 2013 continues tonegatively affect the general condition of port equipment.In the 2016/17 financial year, there are plans to procure and install navigation aidson Lake Malawi in order to enhance safety in the operations of vessels.
5.5 Air Transport Sub-SectorIn view of Malawi’s geographical position, air transport continues to play astrategic and significant role in the development of our economy. Air transport isperhaps one of the important contributors to the development of the tourism sectorin the country which the Government is trying to promote because of its vastpotential in generating foreign exchange. There is a growing interest from
48

operators to offer air services to Malawi and the Government is working oncreating an enabling environment to facilitate their operations. During the periodunder review, Government has replaced communication and air traffic controlequipment at Chileka International Airport. The installation of this equipment hasensured that the airport uses up-to-date technology which has enhanced efficiencyand safety with regards to operations.The Government realises the need for efficiency and effectiveness in the airtransport sector and to that effect a number of reforms have been planned in thesub-sector. One such reform is the establishment of an autonomous Civil AviationAuthority (CAA) in order to separate delivery of services and the regulatoryfunctions in the aviation sector. Malawi is currently not able to meet statutoryobligations of providing effective safety oversight in the aviation industry whichhas led to the country being listed as a Significant Safety Concern (SSC) state.This is attributed to the present institutional framework whereby the Departmentof Civil Aviation as an authority in the aviation sector plays both the role ofregulation and service provision. The creation of an autonomous Civil AviationAuthority (CAA) would ensure the proper separation of functions and allow theimplementation of all the critical elements of an effective safety oversight system.It is planned that the Civil Aviation Authority will be established by December2016.In the year 2016/17, Government will continue towards completing the project ofChileka International Airport by rehabilitating the Terminal Buildings. Theproject will enhance the processing of departing and arriving passengers andincrease room for duty free shopping and other services at the airport. In addition,the Government will embark on a project to replace some of the equipment atKamuzu and Chileka International Airports. Some of the equipment to bereplaced includes the instrument landing system at Chileka International Airportand the navigation and fire-fighting equipment for both Chileka and KamuzuInternational Airports.
5.6 Plant, Vehicle Hire and Engineering Services (PVHES)Plant, Vehicle Hire and Engineering Services (PVHES) is a Treasury Fund mainlyinvolved in the hiring out of plant and equipment. PVHES is undergoing reformto improve and sustain its operations. The institution has been struggling due toobsolete equipment and emergence of stiff competition in the market. Foreffective reform, there would be need to identify required capital investment,undertake upgrading of facilities and identify a strategic partner. During the yearunder review, PVHES has commenced the rebranding and automation withsupport from E-Government; conducted organisational restructuring through aFunctional Review Study with support from the Department of Human ResourceManagement and Development (DHRMD) and commenced the process toidentify a strategic partner.
49

5.7 Challenges for the Transport SectorDuring the year under review, several challenges were encountered, including thelack of adequate funding particularly on government-funded projects for bothroads and civil aviation. The depreciation of the kwacha also affected theimplementation of projects as costs increased. In addition, heavy rains and floodsalso affected transport infrastructure as a number of roads, bridges and railinfrastructure were damaged.
50

Chapter 6
MINING SECTOR
6.1 Overview
The Mining sector remains the potential for economic diversification and one of
the few areas that can contribute to sustainable growth. Malawi has many
potential mineral resources such as Uranium, heavy mineral sands, strontianite,
rare earth minerals, phosphate, bauxite, gypsum, vermiculite, precious and semi-
precious stones, limestone, dimension stone, silica sand, sulphides and coal.
The mining industry in Malawi is, however, new and needs more than updated
policies and legislative framework in terms of support for the country to have the
expected benefits from mining activities.
The Government also recognizes the role that Artisanal and Small-Scale Mining
(ASM) plays in economic growth and poverty reduction in Malawi. Currently,
ASM focuses on industrial minerals, gemstones and rock aggregate. In 2015/16
financial year, the Government continued implementing programmes to support
Small-Scale Mineral Production which aims at developing capacity of staff and
ASM in lime, graphite, chalk and salt production with an aim of promoting value
addition in artisanal and small-scale mining and increasing their access to soft
loans.
The mining sector in the country continues to experience reduced investment andproduction as a result of the slump in global mineral prices. The coal and cementsub_sectors suffered a lot of competition from cheap imports from theneighbouring countries. As a result, some of the coal mines shut down or scaleddown production. On the other hand production in the cement sub_sectorincreased despite the competition. This report, therefore, reviews theperformance of Malawi’s mining sector in terms of mineral production, domesticand export sales and employment opportunities.The report also provides asynopsis of new mineral exploration and assessment of existing explorationprojects which are underway, mineral licenses and mining investmentopportunities currently available in the country.
A Review of the Mines and Minerals Act, 1981 was done and the draft Mines andMinerals Bill is being vetted by the Ministry of Justice before it can be tabledbefore Parliament. Similarly, the Mining Fiscal Regime was reviewed and it isexpected to be tabled in Parliament simultaneously with the Mines and MineralsBill.
In 2015, the data from the countrywide airborne geophysical survey waslaunched. The survey has generated invaluable data that will provide baseline datato potential investors and other interested parties. Clients are now accessing thedata for their own use in mineral exploration, infrastructure development andgeneral research.
51
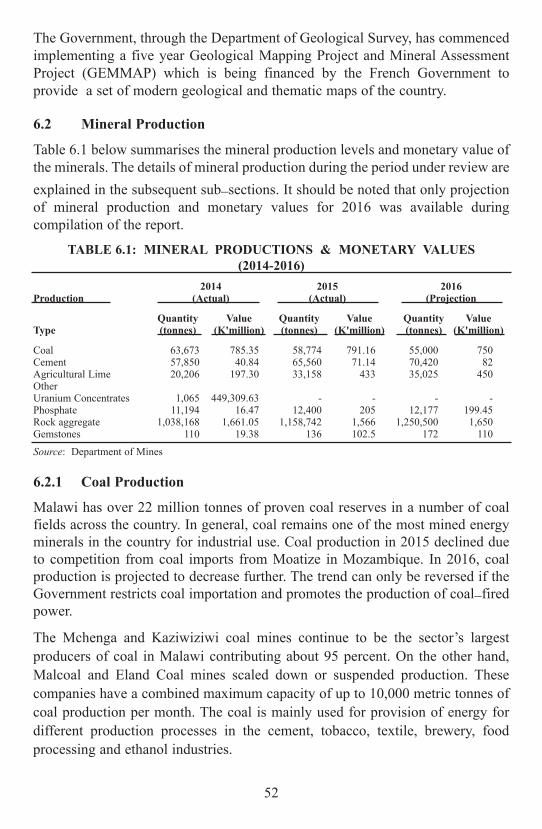
The Government, through the Department of Geological Survey, has commenced
implementing a five year Geological Mapping Project and Mineral Assessment
Project (GEMMAP) which is being financed by the French Government to
provide a set of modern geological and thematic maps of the country.
6.2 Mineral Production
Table 6.1 below summarises the mineral production levels and monetary value of
the minerals. The details of mineral production during the period under review are
explained in the subsequent sub_sections. It should be noted that only projection
of mineral production and monetary values for 2016 was available during
compilation of the report.
TABLE 6.1: MINERAL PRODUCTIONS & MONETARY VALUES
(2014-2016)
2014 2015 2016Production (Actual) (Actual) (Projection
Quantity Value Quantity Value Quantity ValueType (tonnes) (K'million) (tonnes) (K'million) (tonnes) (K'million)
Coal 63,673 785.35 58,774 791.16 55,000 750Cement 57,850 40.84 65,560 71.14 70,420 82Agricultural Lime 20,206 197.30 33,158 433 35,025 450Other Uranium Concentrates 1,065 449,309.63 - - - -Phosphate 11,194 16.47 12,400 205 12,177 199.45Rock aggregate 1,038,168 1,661.05 1,158,742 1,566 1,250,500 1,650Gemstones 110 19.38 136 102.5 172 110
Source: Department of Mines
6.2.1 Coal Production
Malawi has over 22 million tonnes of proven coal reserves in a number of coalfields across the country. In general, coal remains one of the most mined energyminerals in the country for industrial use. Coal production in 2015 declined dueto competition from coal imports from Moatize in Mozambique. In 2016, coalproduction is projected to decrease further. The trend can only be reversed if theGovernment restricts coal importation and promotes the production of coal_firedpower.
The Mchenga and Kaziwiziwi coal mines continue to be the sector’s largest
producers of coal in Malawi contributing about 95 percent. On the other hand,
Malcoal and Eland Coal mines scaled down or suspended production. These
companies have a combined maximum capacity of up to 10,000 metric tonnes of
coal production per month. The coal is mainly used for provision of energy for
different production processes in the cement, tobacco, textile, brewery, food
processing and ethanol industries.
52

6.2.2 Uranium Concentrates Production
The continued decline in the price of uranium, following the accident at
Fukushima nuclear plant, forced the company to suspend mining and processing
operations until the prices improve. For the past two years, the price of uranium
has been below US$40 per pound. The Kayerekera Uranium Mine which was
commissioned in 2009 thus still remains on care and maintenance.
6.2.3 Agricultural, Calcitic and Hydrated Lime Production
Zalco, Lime-Co and Flouride companies are the largest producers of agriculture,
hydrated and calcitic lime in the country with a combined production capacity of
up to 3,500 metric tonnes of lime products per month. All the three companies
increased their respective production capacity in 2015 as compared to their
production in the previous year. Demand for agriculture lime from the tobacco
estates, poultry and paint industries remained robust from within the country.
Production of hydrated lime was mostly dominated by medium to small scale
operators like the Lirangwe Lime Makers Association, and Balaka Lime Makers
Association, among others. Most of these operators have increased their
production capacity owing to overwhelming support received from OVOP in
terms of monetary and equipment assistance.
6.2.4 Rock Aggregate Production
The production of rock aggregates rose slightly in 2015 due to the improvement
in economic activities in the country which included construction and
rehabilitation of roads and a number of infrastructures. In 2016, there are
prospects that the production will increase as the economy is stabilizing. There
are 19 operating quarries for production of rock aggregate both at commercial and
project level. Out of these, only 10 are commercial quarries and the rest are
project quarries.
6.2.5 Phosphate Production
Apatite deposits suitable for the manufacturing of compound phosphate fertilizers
are found at Tundulu in Phalombe District. The phosphates are contained in a
carbonatite complex and occur as apatite sovite and apatite carbonatite.
Drilling indicated reserves amounting to 2 million tonnes and averaging 17
percent P205 have been outlined to a depth of 100 metres. There is potential for
increasing the ore reserves by investigating the adjacent areas capped by
agglomerates. Part of the Tundulu area is being developed by Optichem for
Phosphate mining to be used in the production of fertilizer.
53
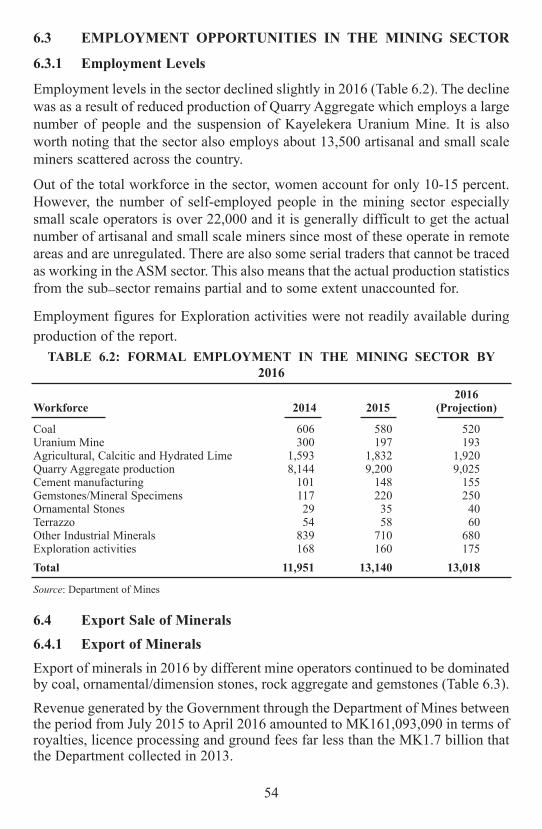
6.3 EMPLOYMENT OPPORTUNITIES IN THE MINING SECTOR
6.3.1 Employment Levels
Employment levels in the sector declined slightly in 2016 (Table 6.2). The decline
was as a result of reduced production of Quarry Aggregate which employs a large
number of people and the suspension of Kayelekera Uranium Mine. It is also
worth noting that the sector also employs about 13,500 artisanal and small scale
miners scattered across the country.
Out of the total workforce in the sector, women account for only 10-15 percent.However, the number of self-employed people in the mining sector especiallysmall scale operators is over 22,000 and it is generally difficult to get the actualnumber of artisanal and small scale miners since most of these operate in remoteareas and are unregulated. There are also some serial traders that cannot be tracedas working in the ASM sector. This also means that the actual production statisticsfrom the sub_sector remains partial and to some extent unaccounted for.
Employment figures for Exploration activities were not readily available during
production of the report.
TABLE 6.2: FORMAL EMPLOYMENT IN THE MINING SECTOR BY
2016
2016Workforce 2014 2015 (Projection)
Coal 606 580 520Uranium Mine 300 197 193Agricultural, Calcitic and Hydrated Lime 1,593 1,832 1,920Quarry Aggregate production 8,144 9,200 9,025Cement manufacturing 101 148 155Gemstones/Mineral Specimens 117 220 250Ornamental Stones 29 35 40Terrazzo 54 58 60Other Industrial Minerals 839 710 680Exploration activities 168 160 175
Total 11,951 13,140 13,018
Source: Department of Mines
6.4 Export Sale of Minerals
6.4.1 Export of Minerals
Export of minerals in 2016 by different mine operators continued to be dominatedby coal, ornamental/dimension stones, rock aggregate and gemstones (Table 6.3).
Revenue generated by the Government through the Department of Mines betweenthe period from July 2015 to April 2016 amounted to MK161,093,090 in terms ofroyalties, licence processing and ground fees far less than the MK1.7 billion thatthe Department collected in 2013.
54

The average price of the minerals vary per individual operator/producerdepending on quality or grade of mineral and their respective production costssince the country does not have fixed prices for particular minerals.
TABLE 6.3: MINERAL EXPORTS
2014 2015 2016Exports (Actual) (Actual) (Projection)
Value Value ValueQuantity (K’ Quantity (K’ Quantity (K’
Type (tonnes) million) (tonnes) million) (tonnes) million)
Coal 8,845 97.994 7,520 85.005.2 7,200 75.5Uranium cake 500 13.80 - - - -Other(1)Dimension stones 36,795 10,638.2 40,500 13.250 42,560 15.2(2)Rock aggregate 23 154.55 35 1,750.0 50 1,855.21(3)Gemstones 104 14.64 150 185.62 210 205.22(4)Rock/Soil samples 95.0 4.673 86 4.520 82 4.21
Source: Department of Mines
Coal was exported by Eland Coal Mines to Mbeya Cement Company andGypsum Company in Tanzania. Gemstones continue to be exported to variousparts of the world like India, Indonesia, Malaysia, South Africa, China, U.S.A,Italy, UK etc.
6.5 New Mining Operations and Licences
In the 2015/16 financial year, the Government granted various licenses toprospecting mining companies and individuals as presented in Table 6.4.
TABLE 6.4: NEW MINING AND PROSPECTING LICENCESISSUED IN 2015/16
Type of Licence Number issued Mineral (s)
Small Scale Operators
Non-Exclusive Prospecting Licence 71 Gemstones, Ornamental stonesMining Claim Licence 29 Gemstone, Ornamental stonesReserved Minerals Licence 84 Gemstones, Ornamental stones
Large-Medium Scale Operators
Exclusive Prospecting Licence 12 Uranium, Heavy mineral sands, Basemetals and Platinum Group Metals,Limestone, Gypsum, Iron ore, Glasssands
Mining Licence 2 Quarry aggregate and ClayReconnaissance Licence 4 Base metals, Potassium, Coal,
Limestone, Platinum GroupElements and rare earth metals
Source: Department of Mines
55

6.6 Mining Investment Opportunities
6.6.1 Mineral Potential of the Country
Malawi produces cement, coal, crushed stone for aggregates, dolomite, limestone,and some artisanal salt for domestic consumption. Apart from industrial mineralproduction which services local demand and the Kayerekera Uranium Mine,Malawi’s mineral sector is still in its infancy stage. However, there is potential forheavy mineral sands, bauxite, phosphate, uranium and rare earth elementdeposits. Artisanal and small scale mining activities have grown considerably andare source of livelihood for many families in rural areas.
A regional geochemical drainage reconnaissance survey prior to 1973 showedseveral anomalies considered to be worthy following up. Local and internationalcompanies are both actively engaged in the exploration for various minerals overMalawi. Potential exploration targets include gold, uranium, platinum group ofminerals (PGMs), base metals nickel and copper, dimension stone, phosphates,heavy mineral sands, graphite, and coal.
6.6.2 Pipeline Projects
During the year under review very few companies, both local and foreign, wereengaged in exploration activities for different minerals in various parts of thecountry. Generally, the year 2016 experienced a decrease in exploration activitiescompared to 2015. If commodity prices will pick up and the recent dynamism ininfrastructures development is confirmed, a few mining projects will becomeviable.
The major projects in the pipeline include the Kanyika Multi-commodity Projectby Globe Metals and Mining in Mzimba District and the Songwe Rare EarthProject by Mkango Resources in Phalombe District.
The Kanyika Niobium Mine project, with an estimated deposit of around 50million tonnes of the multi-commodity minerals comprising niobium, tantalum,zircon and uranium could earn Malawi in excess of US$100 million in foreigncurrency per annum.
On Geological Survey side, a number of projects are in pipeline. Field surveyswere conducted in Chitipa and Karonga districts. The work involved geologicalmapping, geochemical survey and ground geophysical survey especiallymagnetics. A total of 151 samples have been collected and are being analysed atGSD laboratory in Zomba. Ground geophysical survey was conducted in Mchinjidistrict. The work involved a magnetic survey aimed at delineating the Mchinjidyke. Four drill holes have been located.
The Government will launch the Geological Mapping and Mineral AssessmentProject in June 2016. The components of the project include (a) Geologicalmapping of the whole country at various scales; (b) mineral resources potentialmapping; (c) natural risk (Geohazard) mapping aimed at generating data that willassist government to implement and manage the prevention policies of the
56

country’s structural development plans; (d) technical support to Small scalemining; (e) improvement of Geological Survey laboratory capacity; and (f)training of staff. The project is funded through a grant from the FrenchGovernment amounting to 10,812,758.71 Euros. The contract has been awardedto a consortium of the Geological Survey of France (BRGM), Geological Surveyof Finland (GTK) and Council for Geosciences (CGS) who will work with GSD.
The Geological Survey Department conducted a geochemical survey in selectedareas in seven districts. 710 stream sediment samples were collected and havebeen analyzed. The Final report for the geochemical survey has been compiled.The project was conducted with financial and technical support from the JapanInternational Cooperation Agency (JICA).
6.7 Geodata Management Centre
The Government realizes the importance of easy access to geo-scientific data. Inthis regard, the MNREM is in the process of establishing a web based Geo-scientific Data Management Information System (GDMIS) at the GeologicalSurvey Department. The system will improve the management, access, archiving,updating and dissemination of data related to the geology and mineral resourcesof Malawi. GAFFAG a consulting firm from Germany has been awarded acontract to design and install the system.
6.8 Monitoring of Geohazards
In the year under review, a total of 265 earthquake events with magnitudesbetween 0.1 and 5.0 have been analyzed. The epicentres for most of the events fallwithin the Thunduwike, Vwaza area (Rumphi District) and Karonga basin innorthern Malawi. Significant earthquake events occurred in Central Malawi andthese include the 3.7 magnitude earthquake that was recorded on 14th August,2015 at 07:33:28 GMT and the 4.7 magnitude earthquake that was recorded on15th August, 2015. These earthquakes had their epicentres located inMozambique, east of Nkhotakota district. On 25th August 2015, southern Malawiexperienced an earthquake of magnitude 5.0 and was felt by almost all districts inthe Southern Region of Malawi. The earthquake had its epicentre in Mozambique,about 75 km south-east of Mulanje District. A 4.8 magnitude earthquake was alsorecorded on 8th September, 2015 at 19.58 GMT, the epicentre located in Tanzanianorth east of Karonga district. In all these earthquake events there have been noreports of damage to property, injury or death.
The focal depths for most of the earthquakes in the country range from 0-15Kmwithin the Malawi Rift Valley. However, isolated events have also been recordedwith depths of more than 15 km in some parts of the country. Generally, theoccurrence and distribution pattern of earthquakes in the Malawi Rift shows thatplate motion is still active along the East African Rift zone.
57

6.9 Capacity Building
The Mining sector is geared to provide high quality services to its clients. Toachieve this, the Geological Survey Department is building capacity in bothhuman and infrastructure. Currently, 8 officers are pursuing further studies atvarious universities outside the country. Furthermore, the Ministry has procuredassorted geological mapping and mineral exploration equipment. Upgrading ofthe laboratories is also in progress to ensure that most analyses of geologicalsamples are done within the country. The upgrading of the laboratories is beingfinanced under MGGSP and GEMMAP.
The MNREM is also working with the University of Malawi to review thecurriculum and introduce mining related courses. This will ensure that the countryhas enough locally trained professional to work in the sector.
58

Chapter 7
ENERGY
7.1 Overview
This chapter reviews the performance of the Energy Sector in the 2015/16 fiscalyear in terms of developments in the electricity, petroleum, coal and biomasssubs-sectors and various renewable energy programmes.
7.2 Electricity
In the period under review, ESCOM sold 1,491.18 GWh of electricity comparedto 1,460.35 GWh in the same period in the previous year. This marginal increaseof 2.11 percent in units sold is a result of a 13.81 percent increase in domesticconsumption which was somewhat offset by a 3.01 percent decline in industrialsector consumption (Power Demand) and an 18 percent decrease in generaldemand (consumption by small-to-medium scale businesses). The number ofregistered customers in the period under review increased by 16.10 percent from269,469 in 2014 to 312,857 in 2015. The installed generation capacity remainedat 351MW.
TABLE 7.1: ELECTRICITY GENERATION AND CONSUMPTION(2007-2015)
YEAR 2007 2008 2009 2010 2011 2012 2013 2014 2015
Installed Hydro Capacity (MW) 265.85 285.85 285.85 285.85 285.85 285.85 285.85 351 351Maximum (Peak) Demand (MW) 251.03 241.88 259.67 273.01 277.75 277.88 279.73 323.91 335.26Energy generation (GWh) 1,453.06 1,543.00 1,642.02 1,809.17 1,871.88 1,911.51 1,828.2 1,906.51 1,975.02Number of Consumers 164,795 75,157 189,166 194,459 205,045 218,164 238,211 269,469 312,857Consumption Domestic(GWh) 434.63 461.56 502.08 571.56 593.85 596.10 577.65 614.20 699.03
General (GWh) 197.55 213.73 226.16 253.70 250.43 244.47 214.96 183.26 150.30Power Demand (GWh) 512.17 527.08 577.84 580.76 612.23 604.88 613.82 639.27 620Export (GWh) 11.85 17.17 15.94 20.66 19.08 21.1 23.82 23.62 21.85Total Consumption GWh) 1156.2 1219.54 1322.02 1426.68 1475.59 1,466.52 1,429.68 1460.35 1491.18
Source: ESCOM Ltd
7.2.1 Demand Analysis and Planned Projects
The Government of Malawi targets to increase access to electricity by a rangebetween 30 percent and 50 percent by 2030. To achieve these aspirations, theMinistry of Energy and Natural Resources in collaboration with ESCOM Ltdhave developed a Mini-Integrated Resource Plan (IRP) for electricity as astrategic blueprint for Malawi’s electricity sector requirements between 2015 and2020. The Mini IRP essentially sets out a road map for optimal expansion anddevelopment of the electricity sector in Malawi.
59

The Mini-IRP demand forecast has three growth path scenarios for access toelectricity: 1) A Low Scenario that follows the past trend in access to electricity,2) A Base Scenario representing an optimal path that assumes the target of 30percent in 2030 (the lower end of the Government aspirations), and 3) a HighScenario that assumes the target of 50 percent in 2030 (the higher end of theGovernment aspirations). Table 7.2 shows projected peak loads for all the threescenarios. The total system peak load is projected to increase from 462.32 MW in2015 to 749.74 MW by 2020, which is the most probabilistic scenario and thisrepresents an overall growth of 62.2 percent.
TABLE 7.2: TOTAL PEAK LOAD, MEGA WATTS
Year Low Scenario Base Scenario High Scenario
2015 462.32 462.32 462.322016 501.35 519.92 538.022017 537.42 572.51 627.212018 577.64 640.32 690.242019 617.12 692.63 771.502020 658.97 749.74 855.41
Source: Ministry of Energy and Natural Resource and ESCOM Ltd
In terms of sectoral consumption in 2015, household sector accounts for highestelectricity consumption and this was followed by agriculture, services, andmanufacturing, among other sector as given in Figure 7.1.
FIGURE 7.1: SECTORAL ELECTRICITY USE IN 2015
Source: ESCOM Ltd
Over the 5 year period (2016-2020), major step loads are expected in the miningsector followed by agriculture, manufacturing, services and construction in thatorder. Table 7.3 shows the total electricity use for households and the aggregateof the five sectors for all the three scenarios.
Total electricity use is expected to increase from 2105.9 GWh in 2015 to 2978.97GWh in 2020 for the Low Scenario and to 3383.33 GWh and 3755.36 GWh forthe Base and High Scenarios, respectively. These represent respective increases of
60

41.46 percent, 60.66 percent and 78.33 percent for the Low, Base and HighScenarios, respectively, over the period 2015 – 2020.
TABLE 7.3: TOTAL ELECTRICITY USE FOR ALL SECTORS, 2015 – 2020, GWh
Low Scenario Base Scenario High Scenario
Household Other All Household Other All Household Other AllYear Sector Sectors Sectors Sector Sectors Sectors Sector Sectors Sectors
2015 865.75 1240.19 2105.9 865.75 1240.19 2105.9 865.75 1240.19 2105.9
2016 957.66 1303.32 2260.98 1006.87 1315.93 2322.8 1053.91 1328.57 2382.48
2017 1055.46 1369.82 2425.28 1161.23 1396.55 2557.78 1260.41 1423.56 2683.97
2018 1159.49 1439.89 2599.38 1329.67 1482.36 2812.03 1486.4 1525.68 3012.08
2019 1270.05 1513.72 2783.77 1513.08 1573.68 3086.76 1733.08 1635.49 3368.57
2020 1387.47 1591.5 2978.97 1712.43 1670.9 3383.33 2001.77 1753.59 3755.36
Source: Ministry of Energy and Natural Resource and ESCOM Ltd
According to the Mini-IRP, optimal expansion of the generation capacity entailsundertaking the following generation investments: Kamwamba Coal Power Plantphases 1 and 2 (270MW) by 2020; Lower Fufu Hydropower Plant (208 MW) by2024; Songwe Hydropower Plant (90MW) by 2022; Illovo Cogeneration –Bagasse Phase I (11MW) by 2017; Tedzani IV Hydropower Plant (21MW) by2020; Diesel peaking plants (16MW) by 2017 and various non-dispatchableenergy supplies (Solar PV). Other plausible power generation projects identifiedin the Mini-IRP include Kholombidzo Hydropower Plant (144.4MW) by 2021;Mpatamanga Hydropower Plant (300MW) by 2021; Mbongozi Hydropower Plant(41MW) by 2020 and Illovo Cogeneration – Bagasse Phase II (40MW) by 2020.On the transmission front, the Mini-IRP recommends the following projects:constructing a (400kV) Mozambique – Malawi interconnector to enable bothexports and imports of power, and a new double circuit 132kV overhead line fromNkhoma substation in Lilongwe via substations in Salima, Nkhotakota andDwangwa to Chintheche substation in Nkhata Bay. Other projects include energyefficiency projects, which are initiatives aimed at managing demand and reducinglosses on the system. These efforts are also planned to be undertaken during thefive year horizon of the Mini-IRP. It is envisaged that Demand-Side Management(DSM) and loss reduction initiatives will save about 40MW.
7.2.2 Electricity Tariff Developments
In September 2013, ESCOM applied for a 58 percent base tariff increase for afour year period from 2014 to 2018. This application was made because theprevious base tariff period that commenced in 2009 was coming to an end inDecember 2013. The Malawi Energy and Regulatory Authority (MERA)observed that the implementation of the 2009 base tariff had resulted insignificant improvements in the financial position of ESCOM reflected by theimproved return on capital employed and shareholder’s fund. ESCOM’s workingcapital improved from negative to positive as the liquidity position also improved.
61

The Authority, therefore, observed that the tariff increase requested by ESCOM isaimed at building on its improved financial position to enhance its capacity andcapability for better service delivery for its existing customers and increasingaccess to electricity services to a larger section of the Year Low Scenario BaseScenario High Scenario population as the demand for electricity servicescontinues to grow at an average of 12 percent per annum. Following a detailedreview and analysis of the ESCOM application and stakeholder inputs in thereview process, MERA approved an average tariff increase of 37.28 percent forESCOM to be implemented in a phased manner over a four year period startingfrom 4 April 2014. The implementation of the approved tariff was subject toESCOM demonstrated achievements in meeting the set performance targets.
The first increase of 13.5 percent was effected on 4th April 2014, 18.18 percentwas supposed to be implemented on 1 July 2015, 8.9 percent will apply in 2017and 1.9 percent will be implemented in 2018, the last year of implementation ofthe second base tariff. Overall, the 37.28 percentage base tariff approved byMERA moved the average tariff from K31.54 per kWh to K43.24 per kWh.However, the first tranche of the base tariff moved the average tariffs fromK31.54 per kWh to K35.69 per kWh. At the end of implementing the first trancheof the base tariff in June 2015, ESCOM was supposed to be granted the secondtranche of 18.18 percent tariff based on the four-year phasing. ESCOM submittedits performance report for the first year up to June 2015 based on the agreed keyperformance indicators (KPIs). Based on the actual performance achievementsagainst the KPIs set targets, MERA granted 13.73 percent instead of the planned18.18 percent. MERA arrived at the 13.73 percent using a specially formulatedperformance assessment and rating framework. This adjustment moved theaverage tariff from K35.69 per kWh to K40.59 per kWh.
The energy laws and regulations provide for the automatic tariff adjustmentformula (ATAF) whose objective is to cushion ESCOM’s approved revenuerequirements for the base tariff period against variations in macroeconomicfundamentals of exchange rate and inflation. During the period under review,MERA granted a 30.67 percent and 7.5 percent tariff increase on 1st January 2016and 6th February 2016, respectively, based on ATAF. These tariff adjustments sawthe average tariff moving up to K57.72 per kWh.
7.2.3 Malawi Rural Electrification Programme
The Government of Malawi started implementing the Malawi RuralElectrification Programme (MAREP) in 1980. The aim is to increase access toelectricity for people living in peri-urban and rural areas as part of theGovernment‘s effort to reduce poverty, transform rural economies, improveproductivity and improve the quality of social services. The Ministry of NaturalResources, Energy and Mining under the Department of Energy Affairscompleted implementation of MAREP Phase 7 Project in 2014/15 financial year.The project was implemented by engaging private local contractors forconstruction works in order to build their capacity and meet Government’s
62

objective of liberalising the energy sector. The project was implementedsuccessfully and a total of 81 targeted trading centres were electrified includingover 40 beneficiaries.
The Ministry is planning to implement MAREP Phase 8 and a comprehensive oftargeted benefiting trading centres is given in Table 7.4 below. The constructionworks are expected to commence in the forthcoming 2016/2017 financial year.Apart from implementation of MAREP 8, the Ministry has identified over 100centres that require a dropdown transformer for electrification in order to increaseaccess to electricity. This project shall run concurrently with MAREP 8. It isanticipated that the total cost for material purchases and construction works willbe around MK16 billion.
TABLE 7.4: MAREP PHASE EIGHT TRADING CENTERS (TCs)
No. DISTRICT TARGET TC Benefiting TC No. DISTRICT TARGET TC Benefitting TC
63
NOTHERN REGION
1 Chitipa Nkhanga Mwamkumbwa IIMbilima/IlombaNavitengoUdondaIpenzaTiti
Mubanga MahoweMahowe H/CMubanga CDSS
Namatubi
2. Karonga KawaleNgana NgisiMwangulukulu
3 Rumphi Luviri BembeNkhozo
PhokaBowe Chanyoli
Betere
4. Mzimba Bulala MatalaManyeteKaundiEndindeni
Emfeni MafundeyaKavinkhama
Khosolo MakhuwiraChizani
5. Nkhata Bay Chituka KabeskaNthungwaChisu
CENTRAL REGION
1. Kasungu Mthabuwa SopaniNkomadziKapopoNgwata
Chambwe ChitenjeKadifula
Ndonda VilembaKapeluraKatozi
CENTRAL REGION
2. Nkhotakota Mpondagaga
Katimbira ChipandoChalunda Malowa
3. Ntchisi Mawiri MpaloMalambo NkanireBumphula Chingámba
4. Dowa MkukulaChankhunguKachigamba
5. Salima Chikombe Chikombe IIChinguluwe ChikumbaMichulu Nakudze
6. Lilongwe Thumbwi MngwagwaMtemangómbeMilindi
Malembo KapingaNyandeLisoko
Chadza
7. Mchinji Kazyozyo ChawalaKaigwazanga
Kabunthu MkonkhaMsampha
Kalulu Kalulu II
8. Dedza MphunziKamenyaMphathi Maonde
9. Ntcheu Kandeu MphepozinayiMtumba
Gowa Mission ChikapaMasamba
Salima T.-off

TABLE 7.4: MAREP PHASE EIGHT TRADING CENTERS (TCs) (continued)
No. DISTRICT TARGET TC Benefiting TC No. DISTRICT TARGET TC Benefitting TC
SOUTHERN REGION
Source: ESCOM Ltd
7.2.4 Kholombidzo Hydropower Feasibility Study
The Kholombidzo Falls are located in the middle of Shire River, upstream ofNkula Falls and the first falls downstream of Liwonde Barrage. The site offers anadvantage of a potential electricity generation capacity ranging from 60 MWduring dry season to 220 MW during rainy season. A dam located justdownstream of the Matope bridge would provide the needed storage under a headof 50–65 m for the expected range of generation. In the period under review, theconsultant completed pre-feasibility studies and the geotechnical investigationscommenced. Environmental and Social Impact studies are in progress.
7.3 Energy Management
7.3.1 Sustainable Energy Management with Support from United NationsDevelopment Programme
With support from the United Nations Development Programme (UNDP), theGovernment is implementing the Sustainable Energy Management Project withthe aim of taking energy issues to the district councils so that they should be
64
1. Blantyre Mitsidi
MtenjeDomwe Namwanje
Mkwate
2. Chiradzulu Chikwakwata MaletaNalandaNamalambaChimpesa
Chiperere MatiyaChikaonda Chigoti
NyalugweMasukuHanayi
3. Thyolo Chipho Ganeti PrimarySchool
Sandama KambaMphuka Didi primary
SchoolsMphukaprimarySchools
4. Mulanje NakambaMilondeNogwe
5. Phalombe DzenjeMpataNamba Mankhanamba
NamacheteMsemaMambala
6. Chikwawa Changoima ChikweuGaga
DoloThendo BorderPost
7. Nsanje N’gabuChibuliKanyimbi
8. Mangochi Kwisimba IbrahimBinali TsanyaMvumba Chamtulo
9. Balaka Shire NorthKuntiyani MwayeSawali Chimatiro
10. Machinga Msosa Lirangwe T-offDalabaniGawanani
NayuchiMangamba Chigamba
11. Zomba Ulumba LambuliraMakinaNachuma Chisuzi
12. Mwanza NjolomolaSanjika MichiruNthache
13. Neno Chilimbondo Chilimbondo IIKasambaKundembo

appearing in the District Development Plans (DDP). The project is targeting 14districts namely Dowa, Ntchisi, Mchinji, Mzimba, Nkhata Bay, Chitipa, Zomba,Machinga, Balaka, Mangochi, Phalombe, Nsanje, Neno and Salima. During2015/16 fiscal year the project has achieved the following:
n Review of National Energy Policy which is in draft form is ready forcomments by the national stakeholders;
n Training of Extension Workers in three districts namely Mchinji, Mangochiand Nkhatabay on renewable energy and energy efficiency technologies;
n Installing of pilot renewable projects in the three districts of Mchinji,Mangochi and Nkhatabay for the communities to appreciate; and
n Establishment of a website of renewable energy projects.
7.3.2 Increasing Access to Clean and Affordable Decentralised EnergyServices in Selected Vulnerable Areas in Malawi
The Government is implementing this project with funding from the GlobalEnvironmental Facility (GEF) with the project aim of up-scaling the existingMin-grid Model, piloting new Min-grid Models and capacity building. In theperiod under review, the project has given an advance to Mulanje EnergyGeneration Agency (MEGA) - the old system is now operational and people arepaying for electricity after getting licenses from MERA. MEGA is also in theprocess of recruiting an environmental impact assessment expert to analyse newsites for up-scaling.
7.3.3 National Clean Cook Stove Project
The National Cook Stoves Presidential Initiative was launched in January 2013and is funded from Energising Development (ENDEV), Irish Aid and the UK‘sDepartment of International Development (DFID). Since the launch, the projecthas disseminated 382,100 portable cook stoves. In addition, the National CookStoves Roadmap was launched on 18 March 2016 and the objective of theroadmap is to catalyse sustained uptake of clean and efficient cook stoves inMalawi in order to save energy and reduce smoke emissions as well as improvethe cooking environment in Malawian households. Specifically, the expectedoutputs of the programme include: a) National Cook Stoves Taskforcestrengthened and functional; b) cook stove standards and testing mechanism putin place; c) relevant policy and regulatory frameworks revised and harmonised intandem with the current alternative energy situation; d) cook stove technologiespromoted on basis of evidence from consistent testing results; e) national capacityof cook stoves players strengthened; and f) delivery models and financialmechanisms for catalysing mass uptake of cook stoves in place. In addition, theNational Cook Stoves Taskforce chaired by the Department of Energy Affairsplans to:
65

n Facilitate the uptake of two million cook stoves by 2020; and
n Continue pushing for a VAT waiver on cook stoves to ensure theiraffordability by local Malawians.
7.3.4 Energy Sector Support Project
In an effort to increase the reliability and quality of electricity supply in the majorload centres in Malawi, the Government started implementing the Energy SectorSupport Project with support from the World Bank. The project intends to achievethis objective by strengthening the existing electricity network, performinggeneration and transmission feasibility studies for hydro power improvements,improving demand side management and energy efficiency measures andbuilding capacity of the energy subsector through among others technicalassistance. In the period under review, pre-feasibility studies for backbonetransmission line, Fufu Hydropower Plant, Mpatamanga Hydropower Plant andBagasse Cogeneration Plant were completed. Furthermore, the IndependentPower Producer (IPP) consultant presented an Inception Report and a contractwas signed with a consultant to develop an Integrated Resource Plan (IRP) andfinally the Wind Measuring Equipment was fabricated.
7.4 Petroleum
7.4.1 Fuel Importation
Overall, imports of petroleum products during the year under review slightlyincreased by 11.08 percent compared to last year. The importation of petrolincreased by 22 percent and diesel increased by 4 percent as compared to last yearwhile paraffin decreased by 67 percent below that of last year (Table 7.5). Thedecline in paraffin importation demonstrates the noted observation that paraffinhas been substituted by other forms of energy for lighting e.g. rechargeable lampsthat have proliferated in the local market. It may also be noted that Jet A-1importation edged up by 13 percent attributed to a surge in demand due tointernational meetings and forums that the country hosted. Among the reasonsattributed to the increased demand for the imported fuel is the relatively low fuelprices that prevailed in the period under review. As it has been always the case,Malawi capitalised on the Beira, Nacala, Dar-es-Salaam and Mbeya routes forprocurement of fuel in 2015. Based on the figures provided in Table 7.6, about 76percent of fuel imports were procured through Beira, 22 percent through Dar-es-Salaam and 2 percent through Nacala.
66

TABLE 7.5: FUEL IMPORTS (LITRES) 1999 – 2015
Year Petrol Diesel Jet a-1 Paraffin Avgas Total
1999 91,797,272 130,545,103 1,639,326 46,413,088 - 270,394,789
2000 84,896,135 124,905,868 7,238,749 31,397,224 107,269 248,545,245
2001 81,039387 125,106,968 8,800,186 18,921,235 356,926 234,224,702
2002 88,329,685 127,157,516 6,417,316 20,955,949 201,917 243,062,383
2003 92,976,658 136,408,597 11,911,286 23,652,991 213,898 253,038.246
2004 94,186,321 147,922,241 10,862,036 24,762,093 284,286 266,870,655
2005 84,023,978 152,664,646 9,267,805 21,838,787 235,537 258,527,411
2006 88,330,024 153,235,938 11,764,101 20,310,207 224,682 259,158,172
2007 91,289,689 167,120,445 13,001,437 18,232,957 259,393 289,903,921
2008 103,003,788 199,251,252 13,261,288 17,957,471 268,978 333,742,777
2009 112,236,705 203,302,459 9,758,855 13,916,949 254,470 339,469,438
2010 101,173,574 186,539,556 11,710,626 10,639,538 318,087.5 310,381,382
2011 104,825,891 189,983,124 12,838,968 10,254,955 126,422 318,029,360
2012 99,593,583 205,213,866 7,525,000 6,565,312 261,700 319,159,461
2013 108,885,428 212,460,625 9,896,951 1,749,159 223,686 333,215,849
2014 108,885,190 159,798,758 7,785,520 1,533,155 133,067 278,135,6902015 133,103,655 166,402,223 8,766,307 506,304 176,058 308,954,547
Source: Malawi Energy Regulatory Authority (MERA)
TABLE 7.6: MALAWI FUEL IMPORTS PER ROUTE 2000 – 2015
ROUTES
Year Beira Nacala Dar-es-Salaam Mbeya Gweru Total
2000 126,761,107 42,149,779 51,806,647 20,481,694 - 41,199,2272001 130,585,831 16,134,199 66,135,812 21,368,860 - 234,224,7022002 130,763,489 10,140,307 77,013,269 28,879,927 - 246,796,9922003 158,652,734 35,988,318 39,857,111 31,998,208 1,065,575 267,561,9462004 160,122,393 37,361,892 37,361,892 32,024,478 - 266,870,6552005 182,861,911 6,862,335 43,545,416 25,257,749 - 258,527,4112006 88,508,579 2,717,997 53,336,864 14,594,732 - 59,158,1722007 197,009,678 1,164,019 60,113,735 18,355,659 - 276,643,0912008 214,596,975 20,687,513 56,618,685 28,309,338 320,212,5112009 198,528,097 43,640,049 86,011,524 1,276,443 - 329,456,1132010 211,143,990 21,708,391 42,803,344 22,296,943 - 298,352,6682011 167,765,872 17,240,701 50,845,869 13,343,270 0 249,195,7122012 258,442,871 7,552,721 35,918,180 - 9,458,989 311,372,7612013 268,560,053 10,715,210 43,819,950 - - 323,095,2122014 225,767,402 11,367,566 41,000,722 278,135,6902015 233,479,738 6,250,367 69,224,442 308,954,547
Source: Malawi Energy Regulatory Authority (MERA)
7.4.2 Petroleum Pricing
Since the establishment of the Malawi Energy Regulatory Authority (MERA) inDecember 2007, all energy pricing activities are handled by the Energy PricingCommittee of MERA as per the requirement in the Energy Laws. For PetroleumPricing, the Automatic Pricing Mechanism introduced in 2000 continues to be themain principle behind fuel pricing. This system links pump prices to procurement
67

costs and exchange rate movements with a 5 percent trigger band. The formula ismanaged under a multi-sector Energy Pricing Committee (EPC), which meetsonce every month to assess changes in the agreed parameters that constitute theIn-Bond Landed Cost (IBLC) and the value of the Malawi Kwacha against the USDollar.
In the period under review price adjustments were effected on all petroleumproducts. For instance, one litre of petrol rose by 45.7 percent while diesel by 46.1percent (Table 7.7).
TABLE 7.7: PUMP PRICE REVISIONS FROM 2008-2015 (MK/LITRE)
Jan June Feb Feb Nov May May Apr Dec Product 2008 2008 2009 2010 2011 2012 2013 2014 2015
Petrol 200.90 251.20 213.50 256.20 380.00 490.00 714.09 839.00 711.90
Diesel 187.60 234.50 199.30 231.20 360.00 475.00 693.90 853.40 732.70
Paraffin 132.20 165.30 132.20 199.00 171.00 171.00 171.00 719.30 573.10
Source: Malawi Energy Regulatory Authority (MERA)
68

Chapter 8
TRADE AND PRIVATE SECTOR DEVELOPMENT
8.1. Overview
This chapter reviews the external trade performance and highlights majorachievements of the trade and private sector development sector during the2015/16 fiscal year. The report, therefore, focuses on core areas of creating aconducive and regulatory environment, formulating and implementing policies ontrade for industry development and competitiveness. It also focuses on progresson ensuring the expansion of products and services from Malawi on domestic andinternational markets.
8.2. Overall Trade Performance Between 2013 and 2015
The overall external trade performance indicates traditionally a rapid growth ofimports as compared to exports. During the period under review, totalmerchandize exports were recorded at MK659,739 million as compared toMK601,869 million in 2014 translating into a growth of 9.61 percent. Totalmerchandise imports declined to MK1,092,933 million in 2015 fromMK1,198,103 million in 2014 thus registering a decrease of 8.78 percent. As hasbeen the case, the increase in exports could not keep pace with imports. Theimports are mostly dominated by traditional products such as fertilizer andpetroleum and other fuels. The trade deficit decreased in 2015 from the previousyear. According to trade data from the National Statistical Office (NSO), thecountry registered a trade deficit of MK433,193 million while that of the previousyear was MK596,234 million.
TABLE 8.1: VALUE OF EXPORTS AND IMPORTS, 2013- 2015 IN
MILLIONS OF KWACHA
2013 2014 2015*
Total Exports 431,517 601,869 659,739
Total Imports 1,015,364 1,198,103 1,092,933
Trade Balance (583,847) (596,234) (433,193)
Source: National Statistical Office and Ministry of Industry and Trade * Provisional figures
8.2.1 Malawi’s Major Trading Partners
The Southern Africa Development Community (SADC), Common Market forEastern and Southern Africa (COMESA) and the European Union (EU) continueto be the major trading partners for Malawi1. In 2015, Malawi registered tradedeficit with SADC and COMESA but registered a trade surplus as traditionallyexpected with the EU (see Table 8.2).
During the year under review, exports to SADC decreased from MK171 billion in2014 to MK169.33 billion. Imports also decreased from MK471.12 billion in2014 to MK360.63 billion. This resulted into a trade deficit of MK191.29 billion
69
1 Note that SADC and COMESA are not mutually exclusive and that trade with dual member countries such as
Zambia and Zimbabwe is recorded both under SADC and COMESA.
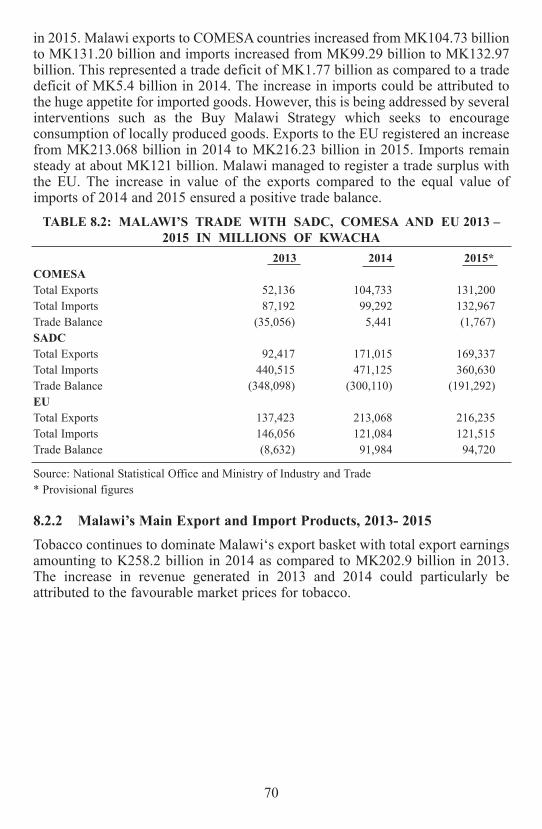
in 2015. Malawi exports to COMESA countries increased from MK104.73 billionto MK131.20 billion and imports increased from MK99.29 billion to MK132.97billion. This represented a trade deficit of MK1.77 billion as compared to a tradedeficit of MK5.4 billion in 2014. The increase in imports could be attributed tothe huge appetite for imported goods. However, this is being addressed by severalinterventions such as the Buy Malawi Strategy which seeks to encourageconsumption of locally produced goods. Exports to the EU registered an increasefrom MK213.068 billion in 2014 to MK216.23 billion in 2015. Imports remainsteady at about MK121 billion. Malawi managed to register a trade surplus withthe EU. The increase in value of the exports compared to the equal value ofimports of 2014 and 2015 ensured a positive trade balance.
TABLE 8.2: MALAWI’S TRADE WITH SADC, COMESA AND EU 2013 –
2015 IN MILLIONS OF KWACHA
2013 2014 2015*
COMESA
Total Exports 52,136 104,733 131,200
Total Imports 87,192 99,292 132,967
Trade Balance (35,056) 5,441 (1,767)
SADC
Total Exports 92,417 171,015 169,337
Total Imports 440,515 471,125 360,630
Trade Balance (348,098) (300,110) (191,292)
EU
Total Exports 137,423 213,068 216,235
Total Imports 146,056 121,084 121,515
Trade Balance (8,632) 91,984 94,720
Source: National Statistical Office and Ministry of Industry and Trade
* Provisional figures
8.2.2 Malawi’s Main Export and Import Products, 2013- 2015
Tobacco continues to dominate Malawi‘s export basket with total export earningsamounting to K258.2 billion in 2014 as compared to MK202.9 billion in 2013.The increase in revenue generated in 2013 and 2014 could particularly beattributed to the favourable market prices for tobacco.
70

TABLE 8.3: MALAWI’S MAIN EXPORT COMMODITIES,
2013 - 2015 IN KWACHA
2013 2014 2015*
Tobacco 202,882,441,836 258,447,259,671 67,306,259,132
Tea 31,013,223,072 32,026,928,996 9,000,886,532
Sugar 41,175,910,211 53,200,849,305 6,427,307,184
Pulses 10,124,792,073 21,628,720,957 3,047,308,187
Apparel and Clothing (Knitted or Crocheted) 559,711,600 13,492,754 31,587,412
Apparel and Clothing(Not Knitted or Crocheted) 3,586,462,302 2,562,061,762 689,276,551
Natural Rubber 2,936,186,965 1,703,011,297 1,957,514,654
Nuts (Groundnuts, Cashew nuts, Macadamia) 26,751,011,063 26,751,011,063 61,288,817,090
Coffee 1,445,188,329 1,950,626,647 743,980,706
Cotton 8,541,020,868 9,201,677,170 516,302,917
Spices (HS 904) 1,110,844,262 780,598,539 602,256,528
Skin and Hides (HS 410) 663,100,317 841,338,436 585,519,754
Wood (Sawn and Plied) 5,280,194,950 6,915,073,225 3,516,087,233
Wood Furniture (4420) 450,447,748 416,059,934 516,942,204
Source: National Statistical Office and Ministry of Industry and Trade
* Provisional figures
On the imports side, fertiliser remains the dominant import for Malawi followingthe nature of our economy which is predominantly agricultural. Other noticeableimports are petroleum products (Table 8.4).
Table 8.4: VALUE OF SELECTED IMPORTS, 2013-2015 IN KWACHA
2013 2014 2015*
Fertilizer 125,446,575,136 90,622,037,731 110,891,701,821
Diesel and other fuels 87,406,412,649 90,315,313,442 57,776,304,620
Petroleum 44,026,927,928 52,308,434,374 45,016,948,680
Paraffin 692,165,405 771,628,156 45,016,948,680
Coal 1,073,128,583 1,187,052,064 1,903,632,592
Source: National Statistical Office and Ministry of Industry and Trade
* Provisional figures
8.2.3 Trade Agreements
Malawi has concluded bilateral, regional and multilateral trade agreements withthe view to provide wide and unlimited market access opportunities for the privatesector. These are summarized in the following sections below.
8.2.3.1 Bilateral Agreements
In 2015, the Ministry reviewed the Joint Trade, Investment and TechnicalCooperation Agreement with the Peoples Republic of China. In addition, thepreferential market accesss arrangement for Least Developed Countries (LDCs)
71

offered by China was also reviewed increasing the market access opportunities forMalawian products from 95 percent to 97 percent, meaning that only 3 percent ofMalawian exports to China are subjected to high import duties.
Within this framework, Malawi secured notable national development projectssuch as the Kam’mwamba Coal Fired Power Plant Project, E-governmentNational Identity Project, rehabilitation of the Chileka International Airport,various roads and buildings in Lilongwe and a number of grants, among others.In terms of promoting value addition, China agreed to bring in investors tosupport value addition in a number of products particularly those featured in theNational Export Strategy (NES) such as oil seed products, sugarcane products,cotton, textile, apparel and hides and skins, among others, to take advantage ofMalawi‘s available markets in the region and beyond.
Malawi also participated in The Johannesburg Summit held from 4th to 5thDecember 2015 and the 6th Ministerial Conference of the Forum on China-AfricaCooperation (FOCAC) held on 3rd December 2015. The two sides reviewed thedevelopment relations between China and Africa and the positive contributionsFOCAC has made over the past 15 years since its inception.
Furthermore, the Ministry reviewed the bilateral trade agreement withMozambique. The major emphasis of the bilateral Trade Agreement was onresolving challenges emanating from non-tariff barriers.
8.2.3.2 Regional Trade Agreements
The SADC-EAC-COMESA Tripartite Free Trade Area (TFTA) was launched in2015. Malawi is one of the 24 Member/Partner States that have signed the TFTAAgreement. The launch of the Tripartite Free Trade Area follows what memberstates of COMESA, the EAC and SADC agreed in October 2008.
The Ministry is committed to easing trade across borders. To realize thisobjective, the Ministry has embarked on the development and operationalisationof a One Stop Border Post (OSBP) Project with the support of the AfricanDevelopment Bank and the World Bank. OSBP is one important component offacilitating trade in line with the World Trade Organisation (WTO) Agreement onTrade Facilitation and it aims at upgrading and modernising border post facilitiesthat will transform into One Stop Border Posts at Songwe on the Tanzania Border,Mchinji on Zambia Border, and Dedza, Mwanza, and Muloza on the Borders withMozambique. A bilateral agreement on the establishment of an OSBP atSongwe/Kasumulu has already been signed between the Governments of Malawiand Tanzania. Malawi is yet to sign the arrangement with Mozambique.
8.2.3.3 Multilateral Trade Agreements
Malawi, as a member of the WTO, participated in the 10th WTO MinisterialConference. The major outcomes of the Conference included:
1. Participation in the Enhanced Integrated Framework (EIF) Donor pledgingconference where donors pledged US$320 million to support Least
72

Developed Countries (LDCs) such as Malawi with trade-related capacitybuilding;
2. Ministerial decision on preferential Rules of Origin aimed at streamliningand simplifying rules of origin in order to make them developmentfriendly and help LDCs fully utilise the provided market accessopportunities;
3. Ministerial decision on Cotton which stresses the importance of cotton toa number of LDCs economies and as such grants duty free and quota freemarket access to developed countries effective 1st January 2016;
4. Ministerial decision on elimination of export subsidies by Developed andDeveloping Countries which implies that exports from LDCs stand achance to be more competitive in developed/developing country markets;and
5. Ministerial decision on services waiver for LDCs aimed at assistingimplementation of preferential treatment in favour of services and servicessuppliers of LDCs and increasing LDCs participation in trade in serviceswhereby non-LDC members will grant LDCs‘ services and servicessuppliers preferential access to their markets.
The Ministry also participated in a number of meetings with bilateral andmultilateral donor agencies such as UNCTAD, International Trade Centre (ITC),Trade Advocacy Fund (TAF) and others.
8.3 Industrial Performance
During the period under review, a number of industrial development activitieswere carried out with the objective of improving business environment for themanufacturing sector, increasing contribution of manufacturing value addition toGDP and increasing value added exports.
8.3.1 Export Performance for National Export Strategy ManufacturingSub-Clusters
The National Export Strategy (NES) identified four manufacturing sub-clusters inorder to diversify the export base and reduce the country’s trade deficit. Exportperformance of a recent study report by the Ministry shows that agro-processingand packaging sectors are the only sub-clusters heavily exploiting the exportmarket while Assembly and Beverage participation in the export market is ratherminimal as shown in Figure 8.1 below.
73
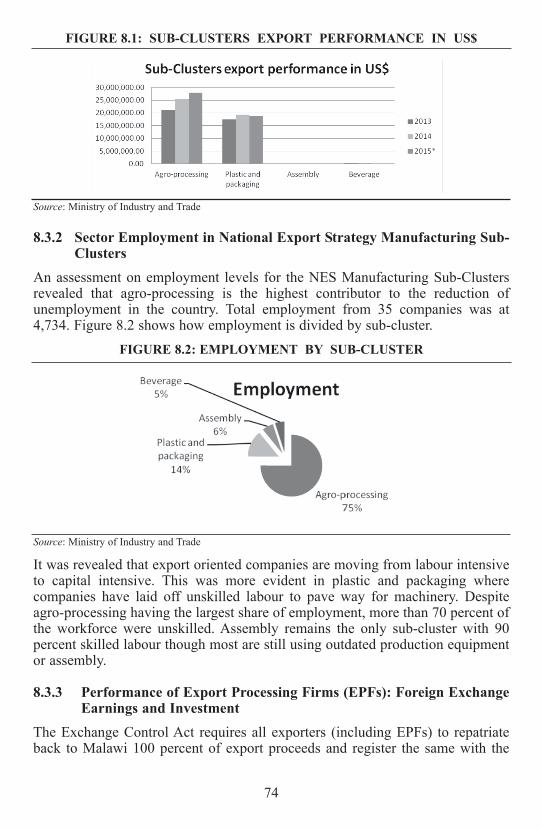
FIGURE 8.1: SUB-CLUSTERS EXPORT PERFORMANCE IN US$
Source: Ministry of Industry and Trade
8.3.2 Sector Employment in National Export Strategy Manufacturing Sub-Clusters
An assessment on employment levels for the NES Manufacturing Sub-Clustersrevealed that agro-processing is the highest contributor to the reduction ofunemployment in the country. Total employment from 35 companies was at4,734. Figure 8.2 shows how employment is divided by sub-cluster.
FIGURE 8.2: EMPLOYMENT BY SUB-CLUSTER
Source: Ministry of Industry and Trade
It was revealed that export oriented companies are moving from labour intensiveto capital intensive. This was more evident in plastic and packaging wherecompanies have laid off unskilled labour to pave way for machinery. Despiteagro-processing having the largest share of employment, more than 70 percent ofthe workforce were unskilled. Assembly remains the only sub-cluster with 90percent skilled labour though most are still using outdated production equipmentor assembly.
8.3.3 Performance of Export Processing Firms (EPFs): Foreign ExchangeEarnings and Investment
The Exchange Control Act requires all exporters (including EPFs) to repatriateback to Malawi 100 percent of export proceeds and register the same with the
74
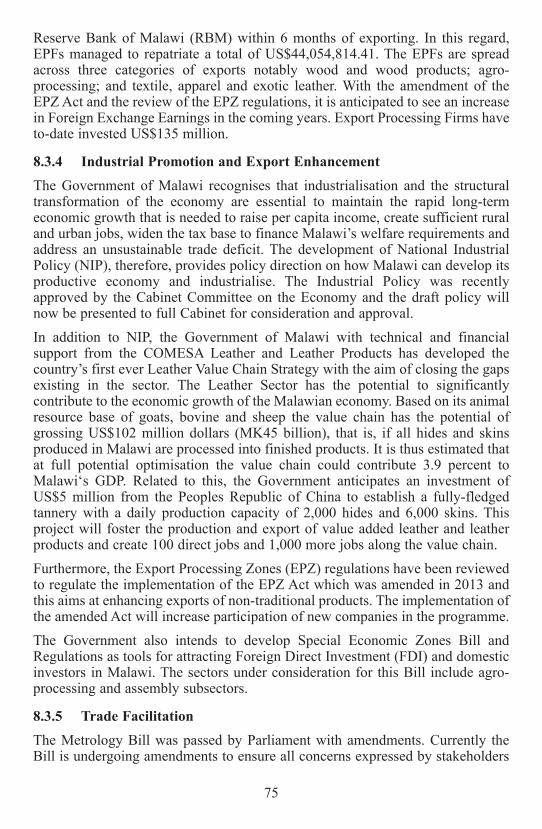
Reserve Bank of Malawi (RBM) within 6 months of exporting. In this regard,EPFs managed to repatriate a total of US$44,054,814.41. The EPFs are spreadacross three categories of exports notably wood and wood products; agro-processing; and textile, apparel and exotic leather. With the amendment of theEPZ Act and the review of the EPZ regulations, it is anticipated to see an increasein Foreign Exchange Earnings in the coming years. Export Processing Firms haveto-date invested US$135 million.
8.3.4 Industrial Promotion and Export Enhancement
The Government of Malawi recognises that industrialisation and the structuraltransformation of the economy are essential to maintain the rapid long-termeconomic growth that is needed to raise per capita income, create sufficient ruraland urban jobs, widen the tax base to finance Malawi’s welfare requirements andaddress an unsustainable trade deficit. The development of National IndustrialPolicy (NIP), therefore, provides policy direction on how Malawi can develop itsproductive economy and industrialise. The Industrial Policy was recentlyapproved by the Cabinet Committee on the Economy and the draft policy willnow be presented to full Cabinet for consideration and approval.
In addition to NIP, the Government of Malawi with technical and financialsupport from the COMESA Leather and Leather Products has developed thecountry’s first ever Leather Value Chain Strategy with the aim of closing the gapsexisting in the sector. The Leather Sector has the potential to significantlycontribute to the economic growth of the Malawian economy. Based on its animalresource base of goats, bovine and sheep the value chain has the potential ofgrossing US$102 million dollars (MK45 billion), that is, if all hides and skinsproduced in Malawi are processed into finished products. It is thus estimated thatat full potential optimisation the value chain could contribute 3.9 percent toMalawi‘s GDP. Related to this, the Government anticipates an investment ofUS$5 million from the Peoples Republic of China to establish a fully-fledgedtannery with a daily production capacity of 2,000 hides and 6,000 skins. Thisproject will foster the production and export of value added leather and leatherproducts and create 100 direct jobs and 1,000 more jobs along the value chain.
Furthermore, the Export Processing Zones (EPZ) regulations have been reviewedto regulate the implementation of the EPZ Act which was amended in 2013 andthis aims at enhancing exports of non-traditional products. The implementation ofthe amended Act will increase participation of new companies in the programme.
The Government also intends to develop Special Economic Zones Bill andRegulations as tools for attracting Foreign Direct Investment (FDI) and domesticinvestors in Malawi. The sectors under consideration for this Bill include agro-processing and assembly subsectors.
8.3.5 Trade Facilitation
The Metrology Bill was passed by Parliament with amendments. Currently theBill is undergoing amendments to ensure all concerns expressed by stakeholders
75

are taken into account. Thereafter, the Bill will be sent to the State President toaccent it into an Act. It is anticipated that the Act will empower the MalawiBureau of Standards to enforce regulations which governs weights andmeasurements. This will have positive impact on consumer protection and fairtrade. Currently, most of the unscrupulous businessmen are defrauding localpeople through illegal scales and other measuring instruments. This will also havea positive effect on the environment as well as health sectors just to mention afew.
8.4 Private Sector Development
The results of the 2015 Doing Business Survey reveal that Malawi has madestarting a business easier by streamlining company name search and registrationand eliminating the requirement for inspection of company premises before issueof business license. On access to energy in particular electricity, Malawi hasreduced time required to get electricity by engaging subcontractors to carry outexternal connection works. The Ministry still organises Public Private DialogueForums which provide an opportunity for key stakeholders from the Governmentand private sectors to discuss and formulate agreed plans to overcome theconstraints facing the private sector. The Ministry is also actively sensitisingpublic and private sector stakeholders with new developments made to addressthe ease of doing business in the country. These developments include thePersonal Property Registry System and the Online Business Registration Systemwhich are now operational; the Insolvency Act and the New Company’s Act.
8.5 Investment Developments and Promotion
8.5.1 Global Investment Trends in 2014/15 and Policies
According to United Nations Conference on Trade and Development (UNCTAD)Report, global FDI inflows declined by 16 per cent to US$1.23 trillion in 2014,mostly because of the fragility of the global economy, policy uncertainty forinvestors and elevated geopolitical risks. New investments were also offset bysome large disinvestments. However, recovery was expected in 2015 and beyond.
FDI inflows today account for more than 40 percent of external developmentfinance to developing and transition economies. Inward FDI flows to developingeconomies reached their highest level at US$681 billion with a 2 percent rise.Developing economies thus extended their lead in global inflows. China becamethe world’s largest recipient of FDI. Among the top ten FDI recipients in theworld, five are developing economies. Global FDI inflows were projected to growby 11 percent to $1.4 trillion in 2015. Expectations are for further rises to US$1.5trillion in 2016 and US$1.7 trillion in 2017. Both UNCTAD’s FDI forecast modeland its business survey of large Multinationals (MNEs) signal a rise of FDI flowsin the coming years. The share of MNEs intending to increase FDI expendituresover the next three years (2015–2017) rose from 24 percent to 32 percent. Trendsin cross-border Mergers and Acquisitions (M&As) also point to a return to growthin 2015. However, a number of economic and political risks, including ongoing
76

uncertainties in the eurozone, potential spillovers from geopolitical tensions andpersistent vulnerabilities in emerging economies may disrupt the projectedrecovery. In 2014, FDI inflows to Africa remained flat at US$54 billion. Despitethe services share in Africa, FDI is still lower than the global and the developing-country averages. In 2012, services accounted for 48 per cent of the total FDIstock in the region, more than twice the share of manufacturing which was at 21per cent. FDI stock in the primary sector was 31 per cent of the total. Services FDIis concentrated in a few countries, including South Africa, Nigeria and Morocco.
Countries’ investment policy measures continue to be geared predominantlytowards investment liberalisation, promotion and facilitation. In 2014, more than80 per cent of investment policy measures aimed at improving entry conditionsand reducing restrictions. A focus was on investment facilitation and sector-specific liberalisation, for example, in infrastructure and services. Newinvestment restrictions related mostly to national security concerns and strategicindustries such as transport, energy and defence.
8.5.2 FDI Pledges into Malawi
Generally, in terms of value, investors showed a lot of interest in 2014 when theypledged to invest a total of US$1,747,716,360, compared with justUS$734,007,452 and US$572,659,583 pledged in 2013 and 2015, respectively.The Energy sector was the FDI recipient, attracting over US$250 million in 2013,US$1.4 billion in 2014 and US$100 million in 2015, which attracted more FDIthan any other sector for all years. Following this sector were the Manufacturingand Mining sectors which attracted over US$100 million worth of investmentseach in 2013 and 2015. The countries that are proving to be significant sources ofFDI in Malawi are India, China, South Korea, the United Kingdom, United ArabEmirates, Australia and South Africa, each of which pledged to invest more thanUS$10 million in at least one of the three years under consideration.
FIGURE 8.3: INVESTMENT PLEDGES BY YEAR AND BY SECTOR
Source: Malawi Investment and Trade Centre (MITC) database
77

The main challenges that companies are facing in Malawi and potentialconstraints to FDI inflows are:
1. Unpredictable factor and product prices due to exchange rate fluctuations.This makes business planning difficult;
2. High costs of and limited access to raw materials;
3. High factor and product transportation costs;
4. High import duties;
5. High rates of corruption;
6. Insufficient and unreliable supply of electricity; and
7. Difficulties in acquiring land for investment. In Malawi most of the land iscustomary land such that it is legally owned by the chiefs. This makes itdifficult for investors to purchase land for investment since they have tonegotiate with chiefs and the issue of compensation cost for land which isoccupied by villagers. There is need for the Ministry of Lands, Housing andUrban Development to speed up facilitation of allocation of land forinvestment projects.
8.5.3 Prospects for FDI from 2016/17 to the Medium Term
FDI inflows in Malawi are expected to take an upward trend due to theopportunities in different sectors of the economy such as energy, agriculture, andservices. Investment promotion efforts of the Malawi Investment and TradeCentre (MITC) will be greatly enhanced with the review of the legislativeframework for Investment and Trade Promotion and Facilitation including theOne Stop Service Centre (OSSC) for MITC. In 2015 Malawi held the first everMalawi Investment Forum which attracted a lot of interest from potentialinvestors, some of which made pledges.
8.6 Small and Medium Enterprises (SMEs) Promotion
8.6.1 SME Development
The Government continues to support the development of the SME sector. In thisregard, promotion of small scale enterprises at local level has been one of the keyinterventions aimed at enhancing the capacity and capability of SMEs inproduction, packaging, costing, and marketing. Ensuring businesses have accessto business support services remains a top priority of the Government. TheGovernment, through the Ministry, conducted mapping of institutions thatprovide support to Micro Small and Medium Enterprises (MSMEs). This led todevelopment of a database and directory of MSME support providers. Thiscreates a single reference document that helps create awareness about whereMSMEs can seek support on business development.
78

The Ministry is also implementing a United States African DevelopmentFoundation (USADF) which is a strategic partnership between USADF and theGovernment of Malawi to promote economic development in Malawi. The goalof USADF’s programme in Malawi is to advance broad-scale, sustainableeconomic growth and help diversify Malawi‘s economic base. The programmepromotes the development, competitiveness and profitability of small scaleagricultural producer groups, cooperatives and associations, and small scale agri-businesses especially those that improve incomes and living standards of the poorand the marginalised, and participation of small scale agricultural groups andSMEs in export trade and investment relationships. The programme has supportedover 46 businesses with grants.
8.6.2 SME Promotion
The Government realises the need to create sustainable business linkages betweenlarge enterprises and MSMEs. The Ministry is implementing a Business LinkageMatching Grant and Financial Innovation Facility schemes under theCompetitiveness and Job Creation Support Project (CJCSP). The BusinessLinkages Matching Fund (BLMF), a component of the Competitiveness and JobCreation Support Project provides matching grants to businesses to enable themto upscale their production levels and thereby improve their supplier capabilities.The scheme is a comprehensive enterprise support intervention in order tofacilitate linkages and create effective ways of upgrading MSMEs, facilitatetransfer of technology, knowledge and skills, improve business and managementpractices and access to markets. It contributes to creating strong and sustainablelinkages that have the potential to promote production efficiency, productivitygrowth, technological and managerial capabilities, employment creation,increased turnover and market diversification for SMEs. The project started in2014 and has supported around 100 MSMEs with matching grants for equipment,machinery and infrastructure, that is, with ‘hardware grants’ and grants for theacquisition of skills necessary to run their businesses with ‘software grants’. Theaverage size of the hardware grants was US$8,300 (MWK 5,000,000). TheFinancial Innovation Facility is working with commercial banks to developinnovative lending practices that will lead to more MSMEs accessing innovativefinancial products. It ultimately aims at employment creation and value addition.
Supporting SMEs to have access to both local and international markets is anotherimportant area. Over the past year, the Ministry supported 60 SMEs to participatein both International and Agriculture fairs. The entrepreneurs were able togenerate orders and business deals worth over MK20 million in 2015. In addition,the Ministry has supported 60 small scale entrepreneurs to participate in theTanzania-Malawi Joint SME Exhibition held both in Lilongwe and Dar es Salaamin Tanzania. The SMEs have established business links with buyers in the UnitedStates, Europe and Tanzania to supply products such as groundnuts, honey, textileproducts and handicrafts.
79

8.7 Cooperative Development
In order to empower Malawians and to stimulate the growth of the Cooperativessector, Malawi Government continued to provide education to cooperativemembers and registered various new cooperative enterprises. Value additionmachinery was installed in various cooperative groups across the country.
8.8 Competition and Fair Trading Commission (CFTC)
Competition and fair trading are among the key enablers of private sectordevelopment and these create pathways for achieving inclusive economicdevelopment. Therefore, the Government remains committed to maintaining apro-competitive and fair trading business environment. In the year under review,the main focus was to promote a competition and fair trading culture among thebusiness community and sensitise the general public about their rights asconsumers. In this regard, business persons in major trading centres in all districtsof the country (except Neno and Likoma) were reached with messages onCompetition and Fair Trading Act. Over 35 percent of the Malawi populationwere reached with messages on Competition and Fair Trading Act throughelectronic and print media and business clinics (direct engagement withconsumers). These activities have resulted in an increase in the number ofconsumer rights violation complaints received by the CFTC. This signifiesincreased awareness about consumer rights and about available redressmechanisms. The CFTC has also recorded a decrease in incidences of blatantviolations of the CFTA such as display of disclaimers like goods once purchasedare not returnable and display of misleading information.
The CFTC also promoted competition and fair trading through enforcementactivities and market surveillance. With regard to consumer protection, the CFTCinvestigated 68 complaints on consumer rights violations of which 37 wereresolved. The CFTC also investigated 47 cases on restrictive business practices ofwhich 24 were resolved. With regard to merger control, the CFTC reviewed andauthorised 13 merger authorisation applications. Four merger applications wereapproved with conditions aimed at addressing competition and/or public interestconcerns which were identified. The CFTC also conducted market monitoringthrough market inquiries and market studies. One market study was conductedand five market inquiries whose results have contributed to advocacy for policyreforms were also carried out. These activities have contributed to improving thebusiness environment in Malawi.
80

Chapter 9
EDUCATION
9.1 Overview
The Ministry of Education Science and Technology (MoEST) is the policy bearerin the provision of education in the country and provides education incollaboration with faith-based organisations and the private sector. Otherministries including those responsible for Youth, Gender and Labour complementMoEST in the provision of both formal and non-formal education. For instance,the Ministry of Gender, Children, Disability and Social Welfare leads in theprovision of Early Childhood Development (ECD), the Ministry of Sports andCulture leads in the provision of sports and other services targeting out-of-schoolyouth while the Ministry of Labour, Youth and Manpower Development takes thelead in the provision of technical education and vocational training.
The Education Sector’s planning is guided by the National Education Sector Plan(NESP) for the period 2008-2017. Meanwhile, the implementation of the NESPis guided by the second Education Sector Implementation Plan (ESIP II) for theperiod 2013-2017. The plan is in line with the National Development agenda asoutlined in the Malawi Growth and Development Strategy.
This report outlines some of the achievements made by the education sector in the2015/16 fiscal year based on the work plans drawn from the ESIP II.
9.2 Key Sector Achievements
9.2.1 Primary Education Sub-sector
The NESP identifies equitable access to education as one of the areas to beaddressed in the country. Access to education continues to increase - in the year2015/16 an enrolment of 4.8 million was registered, compared to 4.6 millionregistered in 2014/15, representing a 2.9 percent increase. Enrolment in ruralareas continues to be higher than in urban areas with 4,182,121 learnersrepresenting 87 percent compared to 622,075 learners in urban areas. Enrolmentby gender shows that there were more girls enrolled than boys at 2,405,388 and2,398,808, respectively, representing a Gender Parity Index of 1.002.
The Net Enrolment Ratio (NER) is a good measure of access. The NER measuresthe proportion of learners of primary school going age (6-13) to the totalpopulation of school going age. According to the 2014 Welfare Monitoring surveythe NER for Malawi stood at 87 percent up from 86 percent registered in 2011.Disaggregated by gender, the indicator shows that the NER for female learnerswas at 88 percent in 2014 up from 86 percent in 2011, while that of male learnerswas at 86 percent from 87 percent in 2011.
Net Intake Rate (NIR) which is the percentage of six year olds in society enteringthe education system at standard one has increased from 78 percent in 2011 to95.5 percent in 20151.
81
1 Education Management Information System (EMIS) data, 2015

Disaggregated by gender, the NIR for girls stood at 100 percent while for boys thefigure was at 91 percent. This means that there is a higher access to education bygirls of official school-going age compared to boys.
About 2.4 percent (115,284) of total primary enrolment are children with specialneeds. About 42.6 percent of these students have learning difficulties (22.3percent boys and 20.3 percent girls) followed by low vision which is at 22 percent(11.2 percent boys and 10.8 percent girls). The system also registered 8.8 percent(421,319) of the total enrolment as orphans.
The Gender Parity Index (GPI) is the ratio of female to male Gross EnrolmentRate (GER). In a situation of equality between boys and girls enrolment rates GPIis 1, while 0 indicates the highest disparity. The 2015 results indicate the genderparity is at 1 showing there is equality between boys and girls enrolment. Despitethis being the case, other measures such as survival rates and promotion rates mayprovide a clearer picture as to how boys and girls are faring in the system.
TABLE 9.1: PERFORMANCE INDICATORS FOR ACCESS TO PRIMARY
EDUCATION
2015 Level of Performance
Indicator 2015 Value Target/Projection (Actual/Target)*100 (%)
Primary Girls to Boys Ratio (GPI) 1 1.02 98Special education needs (SEN) as percent of total enrolment 2.4 2.2 109Net Intake Rate (NIR) (%) 95.5 95 100.5Primary Classroom Ratio (PCR) 109 98 90Primary Enrolment 4,795,196 4,482,798 107
Source: MoEST
In its quest to reduce congestion in classrooms and improve sanitation in primaryschools, the Ministry, through its budgeted resources, constructed 48 classroomblocks, 146 latrines and 20 urinals across the country. With financial assistancefrom DfID, 212 classrooms are currently being constructed which will reduceopen-air classes. The Ministry is also constructing classrooms and ancillarybuildings for 115 Primary Schools through the Local Development Fund (LDF)and conventional mode through the Education Infrastructure Management Unit(EIMU) in city councils. Despite investments in the primary education sub-sector,results show a minimal decline in the pupil-classroom ratio from 111 in 2014 to109 in 2015. The Pupil Classroom Ratio is still higher than the ratio of 105:1 thatwas achieved in 2011 and it is also higher than the projected ESIP II target of 98.There are, however, a number of projects being taken to build more classroomblocks to ensure that classroom congestion is reduced. The Pupil PermanentClassroom Ratio (PpCR) measures the number of pupils per permanent structureunlike the PCR which gives the number of pupils per classroom regardless of thestate of the structure.
82

FIGURE 9.1: TRENDS IN PUPIL PERMANENT CLASSROOM RATIO
(PpCR) AND PUPIL CLASSROOM RATIO (PCR)
Source: MoEST
Internal efficiency in education helps to understand how the education systemutilises the limited resources and time. This is measured mainly through threeindicators, that is, completion, repetition and dropout rates. The completion rate2
was at 51 percent in 2015 down from 52 percent in 2014. Disaggregated bygender, boys are still recording a higher completion rates than girls at 56 percentand 47 percent, respectively. Repeating a class means a pupil is using more publicresources than allocated. According to the EMIS (2015) data the repetition rate3
was at 21.9 percent (22.4 percent for boys and 21.3 percent girls) up from 19.7percent recorded in 2014, implying that the Government continues to wasteresources on repeaters. The results indicate that the target of reducing therepetition rate to 5 percent by 2017 as outlined in the ESIP II is off-track.
In a bid to reduce inefficiencies that come with central procurement of Teachingand Learning Materials (TLMs) and hence address problems of inadequate supplyof textbooks and other TLMs to schools, the Ministry is liberalising theprocurement of primary school textbooks. Guidelines on the liberalisation ofprocurement have been developed. The decentralised procurement is expected togive schools the liberty to procure TLMs from local publishers based on theschool’s needs. The Ministry also distributed standard one and two textbooks toalmost 4,000 primary schools and is expected to cover all schools by the end ofthe 2015/16 financial year. The reforms being carried out in procurement of TLMsare expected to significantly reduce the Pupil Textbook Ratio which was at 2:1 in2015.
In 2015, out of a total 249,031 candidates who took the 2015 Primary SchoolLeaving Certificate of Education (PSLCE) Examination, 168,221 candidatespassed and qualified for the award of the certificate, representing a 67.6 percent
83
2 Primary completion rate is defined as the ratio of the total number of learners successfully completingstandard 8 to the total number of children of the official primary school graduation age (age 13) in thepopulation.
3 The repetition rate measures the proportion of students who have remained in the same grade for two or moreconsecutive years by retaking the grade by either leaving the class prematurely or returning for a second orthird time.

pass rate. The figure is slightly lower than that of 2014 where 259,251 candidateswrote the examination and 160,966 passed, representing a 68.98 percent pass rate.
9.2.2 Secondary Education Sub-sector
The Secondary Education Sub-sector continues to grow with the number ofsecondary schools at 1,454 in 2015 compared to 1,313 in 2014. 1,195 schools or82 percent of secondary schools were located in rural areas while 18 percent, or259 schools, were located in urban areas. Most of the schools in the rural areasare Community Day Secondary Schools (CDSSs). The 2015 EMIS reportindicates that CDSSs make up most of the public secondary schools followed bydistrict day secondary schools and district boarding schools at 689,67 and 60,respectively. Private secondary schools were at 360, representing 25 percent of allsecondary schools in the country.
The total number of learners enrolled in secondary schools increased from346,604 in 2014 to 358,033 learners (190,623 boys and 167,410 girls) in 2015representing a 3.3 percent growth. Out of the total enrolment, 286,154 learnerswere from public schools while 71,879 were from private schools. Public schoolenrolment, therefore, accounted for approximately 80 percent of the totalsecondary school enrolment in 2015. Figure 9.2 below gives the trend inenrolment of learners in secondary schools.
FIGURE 9.2: TREND IN SECONDARY ENROLMENT BY GENDER
Source: MoEST
The pupil classroom ratio for secondary schools has been increasing from 51.4 in2011 to 61.2 in 2015. Across proprietorship, public secondary schools have ahigher student permanent classroom ratio than private secondary schools.
The Government is constructing laboratories and libraries in thirty-three (33)CDSSs so as to give students a better chance to compete with their counterpartslearning in conventional secondary schools. 21 of these will be constructed withfinancial assistance from the European Union (EU) and sites have already beenidentified. 12 CDSSs are being constructed under Phase III Japanese InternationalCooperation Agency (JICA) support. The Government is also constructing theThumbwe and Machinga secondary schools. These schools will help in expandingaccess to secondary education. In addition, the Government is constructing girls’
84

hostels to ensure more girls are enrolled and retained in secondary schools. So far13 hostels have been completed and only five hostels are remaining.
In order to ensure a safe and secure learning environment, the Ministryrehabilitated four national secondary schools: Mzuzu Government, LilongweGirls, Dedza and Blantyre secondary schools. These have been handed over toGovernment. The Ministry also distributed 414 solar panels to CDSSs and 8 solarpanels to Teacher Development Centers (TDCs). It is also rehabilitating districtsecondary schools including Lunzu, Phalombe, Balaka, Chilumba, and Majuni.Lunzu is at 87 percent completion with hostels, classroom blocks, administrationblock, kitchen and dining hall completed. Balaka secondary school is at 70percent completion, Phalombe is at 60 percent and Chilumba is at 85 percentcompletion rate.
As part of the ongoing Public Service Reforms, Malawi Government will, from2016/17 academic year, phase out the Junior Certificate of Education (JCE)examination. The last JCE examination to be administered will, therefore, be in2016 for the current Form 2 students. Examinations will be administered at theend of the four years and successful candidates shall be awarded the MalawiSchool Certificate of Education (MSCE) as is the case now, while unsuccessfulcandidates shall be awarded a Certificate of Completion which will recognise thefact that the owner of the certificate went through and completed secondaryeducation.
9.2.3 Teacher Education
9.2.3.1 Primary School Teacher Situation
The MoEST continues to train more teachers in the country. In order to expandteacher education, the Ministry opened the Chiradzulu Teacher Training College(TTC) which has a capacity of about 560 teachers. The Government will alsoconstruct three TTCs in Rumphi, Chikwawa and Mchinji. Preparations for theprojects are at an advanced stage and works are expected to start in the 2016/17financial year.
The number of teachers registered in 2015 was 61,363 (29,943 women and 41,420men). The pupil qualified teacher ratio (PQTR) was at 75 in 2015 compared to 78recorded in the preceding year. The MoEST has also employed an additional10,500 teachers which are expected to further improve the PQTR which istargeted to be at 1:60 by 2017.
9.2.3.2 Secondary School Teacher Situation
In 2015, the secondary school sub-sector had 14,497 teachers, of which 11,288were male and 3,209 were female meaning that around 78 percent of the teachersare male and only 22 percent are female. Higher rates of female teachers may leadto increases in female student enrolment as they act as role models. About 52percent (7,508) of the teachers are professionally trained while 48.2 percent(6,989) are not trained as secondary school teachers. Out of the qualified ones, 74percent (5,048) are male and 26 percent are female (1,757).
85

The pupil qualified teacher ratios (PqTR) have been fluctuating between 49.1 in2011 and 63.5 in 2015. The 2015 EMIS data shows that the situation hasworsened in private schools compared to public ones since the PqTR in the formerhas increased from 45 in 2011 to 77 in 2015 while in the latter it has slightlydecreased from 53.1 in 2011 to 50 in 2015. The construction of the NalikuleCollege of Education in Lilongwe is at an advanced stage and it is expected to beopened in September 2016. The college will assist in reducing the pupil teacherratio (PTR).
9.2.4 Higher Education
The Higher Education Sub-sector in Malawi comprises only four publicuniversities, namely: the University of Malawi, Mzuzu University, LilongweUniversity of Agriculture and Natural Resources (LUANAR) and the MalawiUniversity of Science and Technology (MUST). In addition, there are sixteenrelatively smaller private universities that have been accredited by the NationalCouncil for Higher Education (NCHE), making a total of 20 universities.
During the year under review, the Government established the Higher EducationStudents Loans and Grants Board and its Secretariat to ensure that there is anefficient system of disbursing and recovering of student loans. The establishmentof this Board will ensure that only students in need who apply for loans benefitfrom the loans scheme. So far, 4,474 students benefited from the scheme andmoney amounting to almost MK1.3 billion was dispersed in the 2015/16academic year. This is expected to improve equitable access to higher educationas the targeted students (those with low socio-economic status) will be able toenrol in their respective universities. The legal framework and filling of theposition of Loan Recovery Manager in the Secretariat are expected to improvefacilitation of loan recovery and this is expected to become effective. The LoanFund will act as a revolving fund and students will now be obliged to pay backtheir loans, thereby benefitting other students in need in the future.
The Government under the Support to Higher Education Science and TechnologyProject (HEST) will continue with the expansion of infrastructure in variouspublic universities (Mzuzu University, The Polytechnic and Chancellor Collegeunder the University of Malawi) and Four Technical Colleges namely Lilongwe,Salima, Soche and Nasawa where works are underway. The project is funded byAfrican Development Bank, Nigerian Trust Fund and Malawi Government. Thiswill ensure that there is increased enrolment and an improved learningenvironment in the targeted education institutions.
9.3 Education Budget Achievements 2015/16
9.3.1 2015/16 Education Budget
Since the withdrawal of development partners from the Sector Wide Approach(SWAp) process which had the Joint Financing Agreement (JFA), theGovernment has been funding all of the Ministry’s operations and most of itsdevelopment budget. The overall approved budget for the Ministry of Education,
86

Science and Technology for 2015/16 was MK172.6 billion and this was revisedto MK164 billion, of which MK90.2 billion was for personal emoluments (PE),MK24.4 billion for Other Recurring Transactions (ORT) and the rest comprisedsubventions and the development budget. MK104.3 billion of the total revisedbudget was funded, and MK103.4 billion has been utilised, representing anabsorptive rate of 99.1 percent.
Total budget for the Education Sector comprises MK90.2 billion for PE; MK24.2billion for ORT supporting the Ministry Headquarters, Divisions, TeacherTraining Colleges (TTCs), and districts; MK48.1 billion for educationsubventions; and MK10.2 billion for development composed of MK3.6 billionPart 2, which was revised downwards and MK6.6 billion Part 1. In terms offunding and absorption of the funds, MK68.7 billion has been funded for PE;ORT got a funding amounting to MK15.8 billion, of which MK15.5 billion hasbeen utilised; and MK17.9 billion has been utilised for subventions.
9.3.2 Financial Performance for the Quarters and Year-to-Date
The table below is a summary of the funding and expenditure in the three quartersof 2015/16.
TABLE 9.2: FUNDING AND EXPENDITURE FOR THE THREEQUARTERS IN 2015/16
Education Sector Budget Analysis as of 31 March 2016- 2015/16 FY (in MK '000,000)
Approved Revised Funding Expenditure % Budget % Funding %BudgetK Millions K Millions K Millions K Millions Funded Spent Spent
PE
MoEST: HQ & Depts. 891.1 891.1 832.8 832.8 93 100.0 93.5
Divs 16,581.0 16,581.0 9,855.7 9,855.7 59 100.0 59.4
TTCs 803.4 803.4 652.0 652.0 81 100.0 81.2
DEMs 71,905.3 71,905.3 57,370.2 57,370.2 80 100.0 79.8
Total PE 90,180.8 90,180.8 68,710.7 68,710.7 76 100.0 76.2
ORT
MoEST:HQ & Depts. 6,751.4 5,795.4 2,817.3 2,767.3 49 98.2 47.7
Divs 4,005.5 4,005.5 2,573.6 2,348.5 64 91.3 58.6
TTC 3,790.0 3,220.0 1,837.1 1,780.2 57 96.9 55.3
DEMs ORT 9,598.5 9,598.5 8,584.9 8,584.9 89 100.0 89.4
Total ORT 14,546.9 13,020.9 7,228.1 6,895.9 56 95.4 53.0
Total ORT (MoEST Vote 250 plus DEMs) 24,145.4 22,619.4 15,813.1 15,480.8 70 97.9 68.4
Total Recurrent for Education Sector 114,326.2 112,800.2 84,523.8 84,191.6 75 99.6 74.6
Subventions 48,095.0 48,095.0 17,855.6 17,855.6 37 100.0 37.1
Dev. Part 1 MoEST 6,560.9 - - 0 0.0 0.0
Dev. Part 2 MoEST 3,600.0 3,065.0 1,895.4 1,315.2 62 69.4 42.9
Total for EducationSector 172,582.1 163,960.2 104,274.7 103,362.3 64 99.1 63.0
Source: MoEST
Note: DEM-District Education Manager; TTC-Teacher Training College; Divs-Divisions.
87

9.3.3 Funding by Treasury
Funding to the MoEST is provided by Treasury to Cost Centres (CCs) each monthbased on the monthly cash forecast requirements indicated to Treasury before theyear starts, adjusted by any later forecasts. During the three quarters, Treasuryfunded a total of MK104.3 billion to CCs, representing 63 percent of the 2015/16revised budget. As shown in the summary table, PE and ORT (HQ, Divisions,Secondary Schools and TTCs) are performing well with budget utilisation rates of76.2 percent and 68.4 percent, respectively. However, budget utilization ascompared to the funded amount, is lower than expected for Development Part 1and 2 as projects have only utilised 42.9 percent of the budget by the end of thethird quarter.
9.3.4 Discrete Development Projects
Funding from Discrete Partners (DPs) towards development projects is notincluded in the budget. Such DPs include AfDB, USAID, JICA and UNICEF.Financial resources from these partners are spent through their own bank accountswhich are managed by their own project management units. The resources are,therefore, not accounted for within the government systems.
With funding from the Japanese Government, the Ministry is constructingNalikule College of Education in Lilongwe. The College, when operational, isexpected to reduce the problem of supply of secondary school teachers in thecountry. The college is set to open in September 2016. The Government isexpected to contribute towards the construction of the sports facility whoseresources will be included in the 2016/17 budget.
9.4 Key Implementation Challenges
The key challenges that the Ministry faced during the year under review are asfollows:
1. Delays in funding: The Ministry faced inconsistencies in funding as datesfor monthly funding kept on changing every time. This delayed fundingnegatively affected implementation of planned activities; and
2. Inadequate funding: Inadequate funds, for example, for the construction oflaboratories and libraries in CDSSs, have led to downscaling of the numberof CDSSs from the planned 100 to 33 CDSSs. The problem has beenexacerbated by the withdrawal of support from development partners‘ tothe Sector Wide Approach (SWAp) which has reduced the implementationof some programmes and projects.
88

Chapter 10
TOURISM
10.1 World Tourism Outlook in 2015 and Prospects of 2016
The direct contribution of the Tourism Sector to world GDP in 2015 was 3.0percent and is forecast to rise by 3.3 percent in 2016, (World Travel and TourismCouncil - WTTC, 2016). This primarily reflects the economic activity generatedby industries such as hotels, travel agents, airlines and other passengertransportation services, excluding commuter services. The main reasons for theweaker Travel and Tourism performance in 2015 include the increase in terrorattacks and political instability in countries like Ukraine, Syria and Libya. Asforecast by the WTTC, the direct contribution of Travel and Tourism to GDP isexpected to grow by 4.2 percent per annum to 3.4 percent of GDP by 2026.
The total contribution of the Tourism Sector to GDP was US$7,170.3 billion in2015 which is 9.8 percent of world GDP. This is expected to grow by 3.5 percentto US$7,420.5 billion, representing 9.8 percent of GDP in 2016. It is forecast thatthe total contribution of the sector to GDP will grow by 4.0 percent per annum toUS$10,986.5 billion by 2026, representing 10.8 percent of GDP. Travel andTourism also contributed significantly to global employment in the year, directlysupporting 107,833,000 jobs which is 3.6 percent of total employment. Thisincludes employment by hotels, travel agents, airlines and other passengertransportation services (excluding commuter services), restaurant and leisureindustries directly supported by tourists. Travel and Tourism will directly accountfor 135,884,000 jobs by 2026, an increase of 2.1 percent per annum over the nextten years. It is forecast that the contribution will grow by 1.9 percent in 2016 to109,864,000, representing 3.6 percent of total employment. Including jobsindirectly supported by the industry, the sector was responsible for 9.5 percent oftotal employment which translates to about 283,578,000 jobs. This is expected torise by 2.2 percent in 2016 to 289,756,000 jobs which is 9.6 percent of totalemployment. By 2026, the sector is forecast to support 370,204,000 jobs whichwill be 11.0 percent of total employment, translating into an increase of 2.5percent per annum over the period.
For the Africa region, the direct contribution of Travel and Tourism to GDP in2015 was US$74.3 billion, about 3.3 percent of total GDP in 2014, and it isforecast to rise by 2.5 percent to US$76.2 billion in 2016. The total contributionof Travel and Tourism to GDP was US$180.0 billion in 2015, representing 8.1percent of GDP and is expected to grow by 2.6 percent to US$184.7 billion, 8.0percent of GDP in 2016. It is forecast to rise by 4.8 percent per annum toUS$295.7 billion by 2026, which is 7.9 percent of GDP. In 2015, Travel andTourism directly supported 9,083,000 jobs, representing 3 percent of totalemployment. It is forecast to grow by 0.3 percent to 9,113,500, which is 2.9percent of total employment in 2016. Its total contribution to employment,including jobs indirectly supported by the industry, was 7.2 percent which
89

translates to about 21,956,500 jobs. Visitor exports generated US$46.7 billion in2015. Travel and Tourism investment in Africa was US$29.6 billion in 2015.
In the SADC region, Travel and Tourism directly generated US$19.0 billion, thatis, 3.1 percent of total GDP in 2015. The total contribution of Travel and Tourismto GDP was US$54.2 billion in 2015, representing about 8.7 percent of GDP andis expected to grow by 3.0 percent to US$55.8 billion, which is 8.6 percent ofGDP in 2016. In terms of employment, the sector directly supported 2.7 percentof total employment and this translates to about 2,383,000 jobs.
Spending by international tourists within the region for both business and leisuretrips reached US$18.1 billion. This amount included spending on transport; butexcluded international spending on education. Investment in the sector amountedto US$8.9 billion.
10.2 Tourism in Malawi
Tourism in Malawi directly contributed MK105.029 billion, which is 3.4 percentof GDP in 2015 and is forecast to rise by 2.9 percent to MK108.067 billion in2016. The sector’s total contribution to GDP was MK221.096 billion in 2015,which was 7.2 percent of GDP and is expected to grow by 4.2 percent toMK230.284 billion, 7.0 percent of GDP in 2016. In 2015, Travel and Tourismdirectly supported 205,000 jobs, representing 2.8 percent of total employment.The total contribution included 446,500 jobs indirectly supported by the industry,that is, 6.2 percent of total employment and this is forecast to grow by 0.9 percentto 207,000 jobs in 2016, which is 2.8 percent of total employment. By 2026,Travel and Tourism is forecast to support 634,000 jobs and this will be 6.0 percentof total employment, an increase of 3.4 percent per annum over the period.
Visitor exports, through about 850, 000 tourist arrivals, generated MK17.172.4billion, in 2015. However, this is expected to fall by 2.5 percent in 2016, and thecountry is expected to attract 888,000 international tourist arrivals. By 2026,international tourist arrivals are forecast to total 1,327,000 generating expenditureof MK25.920 billion, an increase of 4.5 percent per annum. Investment in thesector amounted to about MK15.943 billion and this is expected to rise by 8.8percent in 2016 and by 6.9 percent per annum over the next ten years toMK33.667 billion in 2026. Travel and Tourism’s share of total nationalinvestment will rise from 3.1 percent in 2016 to 3.2 percent in 2026.
10.2.1 Major Achievements in the 2015/16 Financial Year
The Government of Malawi recognises tourism as an emerging sector withtremendous potential to contribute towards the country’s socio-economicdevelopment. The Malawi Growth and Development Strategy (MGDS II)identifies tourism as one of key priority economic sectors in acceleratingsustainable economic growth and infrastructure development. The mandate of theDepartment of Tourism is to optimise contribution of the tourism sector tonational income, employment and foreign exchange earnings. Thus, theDepartment would ensure that tourism is developed and promoted in the manner
90

that brings meaningful economic benefits to the areas visited, contributeseffectively towards poverty reduction, and is sustainable and enjoyable to bothpresent and future hosts and visitors. In pursuit of this mandate, the Departmentof Tourism achieved the following:
10.2.1.1 Policy Development and Planning
The Department commenced the implementation of The Malawi Tourism 2020Strategy. The Plan focuses on three main areas:__
1. Improving the enabling environment by reducing barriers for new andoperating businesses, addressing infrastructure challenges, strengtheningpublic-private sector dialogue, and incentivising investment;
2. Strengthening Malawi‘s tourism offer by building a network of regionaltourism committees to address gaps in tourism products and services; and
3. Growing international tourism demand for Malawi through theestablishment of a public-private partnership destination marketingorganisation that engages in best practices to inspire visitation by high-value travellers.
Secondly, efforts were also made to revise the Tourism Policy which is outdated.The draft tourism policy document has been developed to guide the growth of thesector. The policy calls for mainstreaming of tourism issues at all planning stagesfor an integrated growth of the sector and socio-economy of the country at large.
10.2.1.2 Marketing Initiatives
In order to attract foreign tourists, the Department undertook increased marketingcampaigns in major source and regional markets including development of anupgraded and interactive website and hosting of international travel trade with anaim of increasing awareness of the destination and its various touristic attractions.On the domestic scene, special events and programmes under the theme“Tiziyamba Ndife A Malawi!” were undertaken to stimulate the spirit of travelamongst Malawians and as result more Malawians are patronising such events,and travelling during holiday breaks.
10.2.1.3 Quality Assurance
To improve the standard and quality of services in the tourism industry, theGovernment carried out inspection of 1,036 tourism enterprises During thisexercise, 850 enterprises, representing 82 percent of the total, were licensed.
10.2.2 Challenges and Constraints to Development and Promotion ofTourism
The Tourism Sector in Malawi has great potential for growth. However, the sectorcontinues to face a number of challenges that are frustrating its efforts to becomeone of the leading tourism and investment destinations in the region and the worldat large. Some of the major challenges are:__
91
1. Inadequate resources to undertake meaningful tourism activities, forinstance, marketing campaigns both locally and internationally, qualityassurance activities, research and statistics and investment promotions;
2. Inadequate skilled manpower in the industry;
3. Limiting institutional set-up in which the Government acts as a policymaker, implementer and regulator;
4. Increased perceived health risks related to Malaria and Bilharziaincidences on water bodies which attracted negative international mediapublicity;
5. Lack of competitive and specific tourism investment incentives;
6. Unavailability of land for investment; and
7. Perceived high cost of travel into and out of the destination.
10.2.3 Plans for the Next Financial Year
In the 2016/17 financial year, the overall objective of the Tourism Sector shall beto increase awareness of Malawi both locally and internationally as a destinationfor leisure travel and tourism investment. The campaign aims at increasingvisitors currently at 850,000 to 1,000,000 subsequently increasing visitorexpenditure to over MK20 billion.
The Tourism Sector currently faces lack of data collection capacity. In order toincrease data gathering and analytical capacity to support Tourism and Travelsector decision making, the Department of Tourism will continue with plans todevelop a framework for the implementation of the Tourism Satellite Accounting(TSA) system which is a method of measuring the direct economic contributionof tourism consumption to a national economy and a standard framework fororganising tourism statistics endorsed by the United Nations StatisticalCommission and United Nations World Tourism Organization (UNWTO).
Furthermore, the Department plans to implement the following activities in the2016/17 financial year:__
1. Adoption of National Tourism Policy and mainstreaming of tourism inall sectors because of its multiplier effects;
2. Intensification of marketing efforts to promote the country as a tourismand investment destination so as to compete effectively with countries inthe region. As a matter of strategy, Malawi would like to make itselfmore visible in South African, the United Kingdom, the United States,Nordic and German markets;
3. On the domestic scene, awareness campaigns have been planned to instilthe spirit of travel, eating out amongst Malawians and take pride in thenatural assets that Malawi is endowed with so that Malawians becomebetter ambassadors under the theme “Tiziyamba ndife a Malawi”. This
92

programme shall complement the ‘Buy Malawi’ campaign thatencourages promotion of Malawian products and services;
4. The Government will upgrade to bitumen standards the 4.8 km accessroad at Senga Bay in Salima district to ensure that there is seamless roadnetwork to all areas with touristic value;
5. To address the shortage of skilled personnel in the tourism andhospitality sector, the Government will commence the construction ofthe ultra-modern Malawi Institute of Tourism Lilongwe Campus atLingadzi Inn to churn out enough skilled manpower to meet the ever-growing labour demand of the sector. In addition, short-term up-skillingtraining programmes have been planned targeting those already workingand employed in the travel and tourism sector to improve servicedelivery and instil customer confidence in Malawi’s tourism product;
6. The sector will continue the implementation of the star grading system toall gradable hotels and lodges to be in line with international standards;
7. The sector will also continue to inspect tourism units for compliance tominimum standards;
8. Visitor surveys and tourism research will be undertaken to producetourism statistical reports that drive policy and decision making at alllevels; and
9. In order to improve the public and private sectors dialogue, the TourismIndaba will be organised where various stakeholders shall be broughttogether to drive the tourism agenda forward.
93

Chapter 11
INTERGATED RURAL DEVELOPMENT
11.1 Overview
The Malawi Growth and Development Strategy II recognizes that broad basedeconomic growth can only be attained if the rural poor, who are the majority, fullyparticipate in the political, social and economic activities. The MGDS II has,therefore, identified Integrated Rural Development (IRD) as one of the nine keypriority areas that can transform rural areas into politically, socially andeconomically viable enclaves that can contribute positively to the reduction ofpoverty and overall sustainable development in Malawi.
Recently, there has been a consensus among stakeholders about the importance ofdecentralization in facilitating the implementation of Integrated RuralDevelopment initiatives on a sustainable basis. In this regard, a functioningdecentralized system of local governance is considered as a critical prerequisitefor potential success of the Integrated Rural Development. Several reasons wereadvanced by stakeholders that justified a functional decentralized localgovernance system as critical for IRD success. Most stakeholders argued thatdecentralization provides an institutionalized and predictable framework fororganizing, coordinating, implementing, monitoring and evaluating grass-rootdevelopment efforts as well as bringing the government machinery closer to thepeople. In addition, decentralization empowers the people and, therefore, it is acatalyst for sustainable development.
In view of this, the Government of Malawi has adopted the implementation ofRural Growth Centres (RGCs) Development Programme and the construction ofmarket centres both in the rural and semi-urban centres as critical developmentcomponents within the realm of IRD. In order to achieve this important objective,the Ministry continued implementing various activities during the 2015/16 fiscalyear and plans to undertake several activities in the 2016/17 fiscal year.
This report highlights the activities that have been implemented during the2015/16 fiscal year in tandem with the strategic focus areas of the Ministry.
11.2 Major Achievements during the 2015/16 Financial Year
The following are some of the highlights with regards to major achievements andplans for the Integrated Rural Development sector:
11.2.1 Rural Growth Centres (RGCs) Development Programme
Rural Development is at the centre of poverty reduction in rural areas. The RuralGrowth Centres (RCGs) have proven to have potential to generate economicgains which can lead to improvements in rural livelihoods in both medium andlong term. In the 2015/16 fiscal year, the Government completed the constructionof basic social infrastructure in two of the RGCs at Neno and Nthalire in ChitipaDistrict and the facilities are currently in use. Although the development of theseRGCs has potential to generate economic gains, access to these centres has
94

remained a challenge due to poor road networks. Lack of such requisiteinfrastructure has the potential to discourage investors and traders, hence turningthe RGC infrastructures into white elephants.
TABLE 11.1: ACHIEVEMENTS AND CURRENT STATUS OF RURAL GROWTH
CENTERS IN MALAWI
Name of the
RGC Completed Structures Outstanding works Remarks
1. Nthalire
2. Nambuma
3. Chitekesa
4.Chapananga
5. Mkanda
6. Neno
Source: Ministry of Local Government and Rural Development Reports
As reported in the previous reporting period, Phase I of construction worksreached 92 percent completion rate at Mkanda and Chapananga RGCs in Mchinjiand Chikhwawa districts, respectively. However, progress has stalled ascontractors’ accounts were frozen due to ongoing investigations on cashgate. As
95
The structures are operational butfinal payment has not been made tothe contractor because the contractordisputed the final account.
1. Ready for use although power isnot connected. However, theservice provider has already beenpaid.
2. Police Unit is now in use 3. Contractor is asking for the
revision of the contract to completethe VIP stand and the fixing ofshelves.
Construction works stalled due tocontractor asking for revision of rates.
The construction works stalled due tofreezing of accounts of contractorsand currently the Ministry is waitingfor direction on legal issues on thesame from Ministry of Justice andConstitutional Affairs.
The construction works stalled due tofreezing of accounts of contractorsand currently the. Ministry is awaitingfor direction on legal issues on thesame.
Ministry to revive the deferredofficial opening.
No outstanding works
1. Power connection 2. Final painting and
flooring of the HealthCentre is stilloutstanding because ofthe implication of thecontractor in the cashgate scandal.
3. VIP stand for thestadium
4. Fixing shelves for thelibrary
1. Community Hall andlibrary at roofing stage
2. Community ground3. Perimeter fence
1. Community Hall2. Community ground3. Library
1. Community Hall 2. Community ground3. Library
Minor defects that need attention.
1. Community hall 2. Bus depot 3. Library 4. Police unit and staff
houses 5. Community Ground
1. Community hall 2. Bus depot 3. Library 4. Community ground5. Police Unit 6. Health Centre
1. Market kiosks 2. Market sheds 3. Bus depot
1. Market kiosks 2. Market sheds 3. Bus depot
1. Market kiosks 2. Market sheds 3. Bus depo
1. Community Hall 2. Community Stadium3. Library 4. Bus depot 5. Guardian Shelter 6. Kitchen and Toilets
such, the Ministry is still waiting for strategic direction and guidance on the wayforward from Ministry of Justice and Constitutional Affairs.
For some projects such as Chitekesa RGC, Phase I has been completed and PhaseII of the implementation process has commenced. However, construction worksstalled when the site was used as a shelter camp by flood victims. Following therelocation of flood victims, the contractor refused to commence constructionworks demanding the revision of the contracts to accommodate inflation anddepreciation of the local currency which has rendered building materialsexpensive. The proposed revised rates have since been submitted to the Directorof Buildings who has in turn advised the contractor to resubmit the request aftercertain amendments were effected.
Despite these challenges, the Government is committed to achieving thesuccessful completion of these projects because of their potential in curbing rural-urban migration. It is envisaged that the investments made in RGC willcreate a conducive environment for the rural populace to accept these areas as abetter place to live in rather than migrating to urban areas for greener pastures.The Ministry, therefore, expects these challenges to be resolved swiftly so thatconstruction works can recommence in all sites that stalled and be completed inthe 2016/17 fiscal year.
Table 11.1 depicts progress achieved during the implementation of the RGCs inthe year under review (2015/16). Despite significant progress that has beenregistered in some project sites, it can be noted that the effects of the cashgatescandal and its requisite legal battles still continue to haunt progress ofimplementation in some sites.
11.2.2 Markets Development Programme (Urban and Rural Markets)
During the 2015/16 fiscal year, the Government finalised the construction ofNkhamenya market in Kasungu District and commenced the processes of havingthe infrastructures installed with electricity at Ekwendeni and Enukweni marketsin Mzimba District, Limbuli and Matawale markets in Mulanje District andZomba City Councils, respectively. Apart from Nsanje Market whoseconstruction works is about to commence, construction of infrastructure in mostproject sites is almost complete save for the installation of electricity.
Table 11.2 summarises the progress achieved so far in the implementation of theUrban and Rural Markets. The analysis in Table 11.2 reveals that althoughconstruction of most of the markets is complete, traders continue to shun thefacilities due to outstanding basic amenities such as connection to electricity,water and access roads. This revelation demonstrates the importance ofintegrating some of the key stakeholders such as Ministry of Transport andInfrastructure Development and utility providers such as ESCOM and WaterBoards during the planning stages of such huge investments in order to curb suchchallenges. In this regard, the notion of IRD can generate quick wins ifcompletion of such projects would be fully fledged without outstanding issues.
96

TABLE 11.2: PROCESSES UNDER MARKET CONSTRUCTION
Name of Market Completed Structures Outstanding works Remarks
1. Matawale
2. Ekwendeni
3. Enukweni
4. Dwangwa
5. Nkhamenya
6. Limbuli
7. Nsanje
Source: Ministry of Local Government and Rural Development Reports
97
Ready for use though power is not connected.
Ready for use but power is not yetconnected but the service providerhas been paid.
Council is working on the vandalised structures.
1. The market was competed andformally opened by the Presidentof the Republic of Malawi.
2. The two additional structures arebeing constructed with fundingfrom the Development Fund forLocal Authorities (DFLA).
1. Quotation was submitted to theMinistry but awaiting forpayments
2. The council is working on watersupply
Ready for use but power is not yet
connected although the service
provider has been paid. ESCOM
promised to provide transformers by
January 2016 and the Council is
currently procuring the works of a
solar powered borehole to
supplement the low pressure of
Southern Region Water Board.
The project has stalled due to cuts in
budget allocations and the contractor
then asked for a revision of the rates
due to time that elapsed since August
2013 when the contract was signed.
Consent was given to the
contractor’s request and the
contractor has now embarked on the
re-mobilisation process.
Power Connection by ESCOM
Power Connection by ESCOM
None but structures werevandalised due to nonoccupancy
1. Connection to electricityto bus depot which iswaiting re-routing ofESCOM facilities.
2. Two more additionalstructures which werenot from initial design(Restaurant andButchery).
1. Power Connection byESCOM who promisedto supply thetransformed by January2016.
2. Water connection.
Power Connection by
ESCOM
1. Market
2. Bus depot
3. Markets sheds
4. Butchery
1. Market Kiosks 2. Market sheds 3. Ablution block 4. Butchery 5. Fence 6. Market Pavements
1. Market Kiosks 2. Market sheds 3. Ablution block 4. Butchery 5. Bus depot
1. Market Kiosks 2. Market sheds 3. Bus depot 4. Slaughter house 5. Water pump 6. Butchery
1. Market Kiosks 2. Market sheds 3. Ablution block 4. Bus depot 5. Fence
1. Market sheds 2. Slaughter house 3. Market kiosks 4. Butchery
1. Market sheds
2. Slaughter house
3. Market kiosks
4. Bus terminal
No completed structure
11.3 National Decentralization Programme II (NDPII)
The Government is committed to decentralising functions to local authorities as ameans of promoting local governance and accelerating participatory democracy.Under this programme, almost 17 sectors, including Agriculture, Health,Education, Environment, Forestry, Fisheries, Housing, Water, Lands, Transportand Infrastructure Development, Gender and Community Services, NationalRegistration Bureau, Labour, Trade, Youth and Sports, Irrigation andImmigration, have devolved to local councils. Funds for these devolved sectorsare disbursed directly to local councils.
In conformity with the Public Service Reforms Programme, the Ministry alsoregistered significant progress in the devolution of the development budget andthe devolution of human resources to the local authorities.
TABLE 11.3: ACHIEVEMENT AND CURRENT STATUS ON COMPLETE
DEVOLUTION OF FUNCTIONS TO COUNCILS
Output Currents Status Remarks
Sectors devolved
EnhancedParticipation andownership of LocalLevel DevelopmentProgrammes
Integrated FinancialManagementInformation Systems(IFMIS) rolled out.
Source: Ministry of Local Government and Rural Development Reports
11.4 Major Plans for the 2016/17 Fiscal Year
During the 2016/17 fiscal year, the Ministry under the Rural Growth CentreDevelopment Programme will continue construction works at Chitekesa, Mkandaand Chapananga in Phalombe, Mchinji and Chikwawa districts, respectively,while under construction of rural and urban markets, the Ministry will embark onthe construction of Nsanje market. Furthermore, the Ministry will continue tofacilitate devolution of functions to local councils. The Ministry of LocalGovernment and Rural Development intends to update and align the SocialEconomic Profiles (SEPs) and the District Development Plans (DDPs) to the
98
17 Sectors have devolved theirfunctions to Local Authorities.
Three Socio-Economic Profiles (SEPs)and District Development Plans(DDPs) have been updated and alignedto MGDS II. These include Dowa,Likoma and Chiradzulu districtcouncils’ SEP’s and DDP’s.Cumulatively, this developmenttranslates into 24 local councils havingupdated Local Development Plans.
28 Councils have operational IFMIS.
The Ministry has planned tocontinue supporting thedevolution process of theremaining sectors during the2016/17 fiscal year.
Only 4 out of 28 district councilshave not updated theirSEPs/DDPs but the Ministry hasplanned to backstop this processduring the 2016/17 fiscal year.
Frequent monitoring visits areundertaken to assess theperformance of IFMIS in localcouncils.

successor National Development Strategy and the Sustainable DevelopmentGoals (SDGs).
11.5 Opportunities and Challenges
11.5.1 Opportunities
The fact that Integrated Rural Development is one of the nine key priorities in theMGDS II offers major opportunities to resuscitate rural economies and transformthem into potential engines of economic growth. This will contribute tosustainable growth and result in re-distribution of wealth to all citizens while alsomitigating the negative consequences of rural-urban migration.
Another opportunity noted is the collaboration with the Department of Buildingsin the Ministry of Lands, Housing and Urban Development. This has ensuredavailability of technical expertise in the councils.
Finally, the impeding factors toward the implementation of these projects arebeing discussed and tackled, for instance, legal direction on the freezing ofaccounts of the contractors and also steady funding despite budget cuts onresource allocation towards these projects.
11.5.2 Challenges
The construction of Rural Growth Centres and Markets in the year under reviewexperienced the following challenges and risks:__
1. The main challenge has been inadequate budgetary allocation and lowfunding. The typical Rural Growth Centre and market are supposed tohave a network of access roads to various social infrastructuresconstructed at a centre. These access roads are not provided for in thebudget for construction. This has been evidenced at Ekwendeni andEnukweni where vendors are refusing to occupy the markets due to a poorroad network;
2. Delays on giving legal direction on the way forward on the freezing ofaccounts of contractors due to cashgate has derailed the constructionworks at Chapanaga and Mkanda Rural Growth Centres;
3. Use of local contractors is yet another challenge since most of the localcontractors have inadequate capacity to deliver projects outputs as per thecontract agreement. This scenario leads to an increase in overhead costsfor the projects like Nthalire and Nambuma RGCs;
4. The change in design of infrastructure to include the needs for additionalfacilities is not easy to accommodate. This is a problem when it comes toconstruction of additional infrastructures at a particular centre and tendsto delay execution of works by the contractors;
99

5. There have been cost escalations for project construction materials whichexert pressure on the budget. This directly delays project implementationand leads to long duration of project execution;
6. Delays in compensation in most sites have affected the progress, hencedelayed execution of works by the contractor; and
7. There is slow pace of decentralization due to inadequate skills andunpredictable and erratic provision of resources.
100

Chapter 12
PUBLIC HEALTH, NUTRITION, HIV AND AIDS MANAGEMENT
12.1 Overview
This chapter reviews the performance and highlights some of the majordevelopments regarding public health, nutrition and HIV and AIDS management.It comes in the final year (2011-2016) of implementing the Health SectorStrategic Plan (HSSP).
12.2 Public Health
According to the World Health Organization (WHO), health is a state of completephysical, mental and social well-being and not merely the absence of disease andinfirmity.
12.2.1 Major Developments on Health Indicators
For the first three quarters of the 2015/16 fiscal year, the Out-patient Department(ODP) Utilisation Rate was at 940 visits per 1,000 people in the population. Intotal, there were 12,294,838 OPD attendances, 940,546 hospital admissions and574,497 in-patient deaths. Maternal, neo-natal and child health, which are key inmanaging population growth, remain a priority for the Ministry.
In 2013/14 fiscal year, the MDG Endline Survey (MES) showed that the MaternalMortality Ratio (MMR) declined from 675 deaths per 100,000 live births in 2010to 574 deaths per 100,000 live births in 2013/14 (NSO, 2011). However, theWHO estimates an MMR of 634 deaths per 100,000 live births in 2015. The MESreported a Full Immunisation Coverage of 71.5 percent in 2014)NSO, 2015). Bythe end of the third quarter of this fiscal year around 60 percent of children below12 months were fully immunised.
The Government is progressively winning the fight against Malaria with areduction in prevalence from 484 in 2011 to 319 in 2015. The rate is even lowerfor the first 9 months of the 2015/16 fiscal year and this was 284 cases per 1,000people. Despite this progress in combating Malaria, some challenges still exist.Admittedly, the progress is slow with some districts still recording high incidencerates. To make considerable gains, a focused approach may be necessary toaddress the high incidence rates of Malaria in the top ten districts includingMwanza, Nkhotakota, Nkhata Bay, Salima, Likoma, Neno, Ntchisi, Karonga,Rumphi and Nsanje.
12.2.2 Improving Access and Coverage of Services
The Government approved a budget of MK6.5 billion for health infrastructuredevelopment in the 2015/16 financial year to facilitate the implementation of on-going infrastructure projects under the Ministry of Health (MoH). The majorfocus areas include construction of staff houses in rural health facilities,
101

rehabilitation of central and district hospitals as well as construction of new healthfacilities. As of the mid-year budget review in January 2016, the Ministry ofHealth was funded a total of MK1.77 billion, representing a 27 percentdisbursement rate. This low funding rate did not meet the cash flow requirementsfor the Ministry to efficiently and adequately implement various projectsactivities. Consequently, progress in most infrastructure projects has beennegatively affected.
12.2.2.1 Progress in Main Construction Works
The health infrastructure projects currently being implemented by the Ministry ofHealth under the Government-funded Public Sector Investment Programme(PSIP) are categorised as follows:__
1. Under the Umoyo Housing Project Phase 2, the Ministry of Health isconstructing 140 staff houses in various sites countrywide and doctors’flats in four central hospitals. In general, progress in these projects hasstagnated at an average of 60 percent, largely due to low and inadequatefunding to settle both current and accumulated outstanding payments tocontractors. However, there is an opportunity to finalise the remainingproject works with the coming in of the Health Sector Joint Fund, whichhas put considerable attention to health infrastructure development;
2. Finalisation of construction works for the new Nkhata Bay DistrictHospital and commencement of construction works for the new PhalombeDistrict Hospital were prioritised. The Nkhata Bay District Hospital haspartially started operating while finalisation of other few remaining worksis in progress. On the other hand, construction of the Phalombe DistrictHospital has not yet commenced because the contractor has not yet beenprocured;
3. The on-going construction of 15 health centres has been affected by lowfunding leading to inability to settle both current and accumulatedoutstanding payments to contractors. Very little progress has beenregistered in the current financial year in this regard; and
4. Rehabilitation works were planned for all the four central hospitals, thatis, Queen Elizabeth Central Hospital (QECH), Zomba Central Hospital(ZCH), Kamuzu Central Hospital (KCH), and Mzuzu Central Hospital(MCH) as well as Zomba Mental Hospital. Very little progress has alsobeen achieved under these in the current financial year. Notably ZombaCentral Hospital has managed to re-assess and cost the new scope ofworks for its rehabilitation needs. Under district hospital rehabilitations,Nsanje, Balaka, Kasungu and Chitipa district hospitals were targeted withnew scope of rehabilitation works prioritised but to date no rehabilitationworks have commenced.
102
12.2.3 Medicines and Medical Supplies
Despite early improvements in supplies, there are apparent setbacks includinginadequate storage facilities, drug pilferage and general financing gaps foressential medicines and supplies. For example, the overall funding gap formedicines (resources allocated minus costs) was estimated at 64,533,811,950 oran 84.15 percent shortfall in 2015/16 financial year. This is an underestimation ofthe true resource gap mainly due to difficulties in quantifying actual clinical needas opposed to what services were accessed. The existing barriers to service use,especially limitations in human resources and inadequate infrastructure, implythat what is observed as utilisation is an underestimation of the true need.Furthermore, resources required especially in service streams like mental healthand family planning are not adequately captured in the HSSP. Similarly, theresources database was not finalised and it is suspected that resources availablewere underestimated and costs were overestimated.
12.2.4 Human Resources for Health (HRH)
Malawi remains one of the World Health Organisation’s priority countries whichfails to meet the minimum threshold of 23 doctors, nurses, and midwives per10,000 population necessary to deliver essential maternal and child healthservices. The total health workforce will remain unknown until anothercomprehensive human resources census is conducted. The last HRH census wasconducted in 2008 with funding from the Global Fund. Table 12.1 below showsthe Ministry of Health staff establishment and summary of vacancy rates for someselected health cadres as of 2012.
TABLE 12.1: SUMMARY OF ESTABLISHED VERSUS FILLED POSTS SERVICE
Established VacancyDescription Posts Filled Rate (%)
Planning & policy development 626 76 88
Preventive health services 7 553 5 136 32
Nursing 13 669 3 545 74
Pharmacy 545 161 70
Allied health technical services 1 143 381 67
Allied health services – clinical officers 4 491 1 643 63
Medical specialists 228 32 86
Medical officers 344 168 51
Internal audit services 16 7 56
Accounting services 421 315 25
Administration services 6 732 4 261 37
Total for all service areas 42 309 20 365 52
Source: Ministry of Health, 2012
This human resources shortage is partly exacerbated by the failure to trainadequate numbers of health workers and inability to retain those who are alreadyin the system. Non-technical support personnel, including Health SurveillanceAssistants (HSAs), account for over 60 percent of the Ministry’s StaffEstablishment. According to the HSSP, Malawi is confronted with a heavy burden
103

of diseases, evidenced by high levels of child and adult mortality rates and a highprevalence of tuberculosis (TB), Malaria, HIV and AIDS, and other tropicaldiseases. The escalating double burden of disease has worsened. This is evidencedby reported new cases of HIV and TB and increasing rates of HIV and TB co-infection.
12.2.5 Place and Assistance During Delivery
As of September 2015, 124,983 women were admitted for delivery to maternityand 7,272 were referred to another facility before delivery, resulting in 132,255total admissions to maternity during this period. Out of all admissions, 124,100(96 percent) delivered at health facilities, while 4,867 (4 percent) had alreadydelivered before reaching a facility. The 124,100 facility deliveries represent 75percent of the estimated 166,000 quarterly deliveries in the population in 2015.This is less than the 83 percent reported in the Integrated Household SurveyReport of 2010-2011.
A total of 121,450 (96 percent) deliveries were conducted by skilled birthattendants, 604 (less than one percent) by paramedical staff and 4,605 (4 percent)were not attended by any of the above. 16,310 (12 percent) of women developedobstetric complications. The most common complications wereobstructed/prolonged labour (5,637 cases) and post-partum haemorrhage (1,811cases). A total of 128,967 babies were born, 124,549 (97 percent) were singletonsand 4,418 (3 percent) were twins/multiples. There were 126,776 (98 percent) livebirths and 2,191 (2 percent) stillbirths. 125,653 (99 percent) of babies born alivewere discharged alive and 1,123 (1 percent) died before discharge. 126,556 (morethan 99 percent) of women were discharged alive and 103 (less than one percent)women died before discharge, which is equivalent to a maternal mortality ratio of81 per 100,000 live births among women attending maternity.
12.2.6 Health Sector Strategic Plan (HSSP) Financing
Table 12.2 below relates HSSP (2011-2016) financing requirements to what wasavailable from the Government and what was available in the health sector as awhole. HSSP (2011-2016) financial requirements were at least 1.4 times higherthan total available resources in the health sector and at least 3 times higher thanthe Government health budget for all the Fiscal Years. The government healthbudget increased nominally over the HSSP (2011-2016) period while thepercentage of the national budget allocated to health hovered around an averageof 10 percent as shown in the Table. There were, therefore, insufficient resourcesin the Malawi health sector to meet HSSP targets. Progress towards HSSP targetscould also have been moderated by the high likelihood that a significantproportion of health sector resources did not implement HSSP priorities. Due tothe large number of implementers of development partner funds and lack ofaccountability for result mechanisms for the implementers, it is also likely thatthere was poor coordination and duplication, leading to further diminishing theeffectiveness of healthcare resources.
104

TABLE 12.2: HSSP RESOURCE REQUIREMENTS AND RESOURCE
MAPPING ESTIMATES
2011/12 2012/13 2013/14 2014/15 2015/16HSSP FinancialProjections (US$)* 787,000,000 845,000,000 926,000,000 1,007,000,000 1,042,000,000Resource Mapping Estimates (US$) 545,243,840 558,079,959 599,707,398 641,638,706 635,822,045MoH Total Budget (US$) 213,467,927 185,624,824 153,391,077 192,292,270 159,960,743Govt. Exp. on Health as % of National Budget 11% 12% 9% 11% 12%
Source: Resource mapping rounds 1 to 4, MoH Budget files, Ministry of Finance budget statements
*HSSP Financial Projections based on mid-term re-costing of the HSSP
12.3 Nutrition, HIV and AIDS
The Government recognises that a healthy population is necessary for sustainableeconomic growth and development. Improving nutrition of a country’s populationhas significant economic and social benefits as it reduces morbidity and mortality,improves the learning capacity of school children and increases productivity ofthe general population. To ensure an adequate nutrition and HIV-free population,the Government, through the Department of Nutrition, HIV and AIDS, has beenimplementing programmes, projects and strategies that fall under priority areafive of the MGDS II, that is, Public Health, Sanitation, Malaria and HIV andAIDS Management and Theme two of Social Development particularly Sub-theme six of Nutrition.
12.3.1 Nutrition
High levels of malnutrition in the country are believed to be one of the underlyingcauses of under-development and increased cycles of poverty. A recent study in2012 on the cost of hunger revealed that Malawi loses 10.3 percent of its GDPevery year due to under-nutrition. However, efforts are in place to curb thesituation and some progress has been made on nutrition status in Malawi. TheGovernment supports the scaling up nutrition (SUN) movement in a bid to endstunting in a child’s first 1,000 days of life. Despite such efforts, micronutrientdeficiencies and stunting are still persistent in the country. The MalawiMillennium Development Goals (MDG) Endline Survey of 2014 ratesmalnutrition very high in Malawi with stunting, wasting and underweight beingamong the highest in the world.
TABLE 12.3: TRENDS IN SITUATION OF NUTRITION INDICATORS IN PERCENTAGE, 1992 TO 2014
Year 1992 2000 2004 2010 2014*
Stunting 48.7 49.0 48.0 47.1 42.4
Underweight 27.2 25.0 22.0 12.8 16.7
Wasting 5.4 5.5 5.0 4.0 3.8
Source: DHS (1992, 2000, 2004, 2010) and *MDG Endline Survey, 2014
105

According to the 2010 Demographic and Health Survey (DHS) Report, stuntingis increasing in some districts despite being on a general decline in the country.These include Blantyre, Lilongwe, Salima and Nkhotakota districts. Rural-urbanmigration and the concentration of nutrition programmes in rural areas couldexplain such findings, as recent studies indicate high prevalence of stunting inurban and semi-urban areas. It should, however, be stressed that such findingsneed to be studied further.
12.3.1.2 Nutrition Sub-Sector Achievements
In a bid to make an impact on the nutrition status of the country, the nutrition sub-sector implements its programmes according to four thematic areas: i) Creation ofan Enabling Environment; ii) Prevention of Nutrition Disorders; iii) Treatment ofNutrition Disorders; and iv) Community Nutrition. In the period under review theNutrition sub-sector attained the following achievements:
12.3.1.2.1 Creation of an Enabling Environment
1. Translated a community training manual for frontline workers andcommunity volunteers;
2. Reviewed Guidelines for Community Management of Acute Malnutrition(CMAM);
3. Developed a Nutrition Resource Tracking System;
4. Developed and rolled out the two plans for Micronutrient Powder andEmergency;
5. Developed a Micronutrient Strategy;
6. Conducted high level advocacy meetings with national assembly (193parliamentarians) and over 100 stakeholders on the cost of under-nutrition;
7. Conducted a micronutrient survey;
8. Conducted a national research dissemination conference;
9. Conducted bi-annual national SUN learning fora for experience sharing;
10. The review of the National Nutrition Policy and Strategic Plan is currentlyin progress and at an advanced stage;
11. Organised a national nutrition committee meeting where sector prioritieswere set and were aligned to the results framework;
12. Over 9,800 community workers were trained in nutrition programmes;and
13. Revamped the District Nutrition Coordination Committee (DNCC) in allthe 28 districts.
106

12.3.1.2.2 Prevention of Nutrition Disorders
1. 75,000 nutrition promotion materials were produced and disseminated.This represents 100 percent achievement on the planned target for theyear and a 477 percent increase from last year’s 13,000;
2. 1,524,600 pupils from various primary schools across the countrybenefited from the school meals programme, a decline from 1,620,216who benefited from the programme in the previous year;
3. 2,908,069 under-five children and lactating mothers were reached withVitamin A supplementation, a decline from 3,500,000 in the previousyear;
4. Trained 26 National Nutrition Officers, taken from line ministries, in codemonitoring of breast milk substitutes;
5. Printed and distributed 21,000 community counselling cards on maternalhealth and nutrition, sanitation and hygiene to reach approximately2,100,000 care givers;
6. All 28 districts in the country rolled out Scaling Up Nutrition (SUN)interventions as planned; and
7. Various nutrition messages on stunting, anaemia, malaria and familyplanning were developed and aired on seven national and communityradios.
12.3.1.2.3 Treatment of Nutrition Disorders
1. 35,443 Severe Acute Malnutrition cases were admitted in CMAMfacilities, an increase from last year’s 35,000;
2. 61,129 cases of Moderate Acute Malnutrition were treated under theSupplementary Feeding Programme; and
3. 31,454 PLHIV, TB patients and other chronically ill patients wereprovided with nutrition supplements, representing a 150 percent increasefrom 12,580 cases in the preceding year.
12.3.1.2.4 Community Nutrition
1. Rolled out community-based nutrition to 13 districts;
2. 319,978 children were reached with key high impact nutritioninterventions in 13 districts; and
3. 2,254 community care groups were established in the 13 districts forimplementation of household and community nutrition interventions.
107

12.3.2 HIV and AIDS
Malawi has in the recent past witnessed significant progress in the delivery ofHIV prevention, care, treatment and programme strengthening interventionswhich have led to the decline in new HIV infections. According to UNAIDS HIVEstimates, Malawi has seen a tremendous reduction in the HIV prevalence from16 percent in the late 1990s to 12 percent in 2004, 10.6 percent in 2010 andcurrently it is estimated at 10.3 percent in 2014. SPECTRUM modelling alsoestimates that 26,000 to 34,000 new infections occurred in 2015 as indicated inTable 12.4 below.
TABLE 12.4: MODELLED ESTIMATES OF NEW HIV INFECTIONS PER YEAR
AND NUMBER OF PLHIV (ALL AGES)
Description 2010 2011 2012 2013 2014 2015 2016
No. of PLHIV 65,001 58,918 50,611 45,600 41,814 37,558 34,232New infection 1,049,024 1,054,615 1,056,400 1,060,072 1,063,914 1,064,848 1,065,491
Source: National Aids Commission (NAC) SPECTRUM Estimates, 2016
12.3.2.1 HIV Testing and Counselling
625,803 people were tested and counselled for HIV between July and September2015. Testing outputs increased by 27 percent from the last quarter of the 2014/15fiscal year. This was most likely due to the deployment of new dedicated staff(HIV Diagnostic Assistants - HDAs) to about 200 facilities. HDAs are currentlyhired by PEPFAR implementing partner organisations and seconded to publicsector facilities, primarily to boost routine provider-initiated HIV testing forpatients. 586,926 (94 percent) of all tests were performed at health facilities,14,563 (2 percent) were done in stand-alone HIV Testing and Counselling (HTC)sites and 24,314 (4 percent) were done outside facilities/in the community. Out of34,966 people newly-diagnosed with HIV this quarter, 93 percent were tested athealth facilities, 3 percent at standalone HTC sites and 4 percent in a community-based testing.
12.3.2.2 Anti-retroviral Therapy (ART)
43,217 (22 percent) of all patients ever registered were retained in pre-ARTfollow-up by the end of September 2015; 102,297 (53 percent) had started ART;46,939 (24 percent) had been lost after follow-up; and 1,917 (1 percent) wereknown to have died. The proportion of patients starting ART is expected toincrease. A total of 1,593 persons received Post Exposure Prophylaxis (takinganti-retroviral medications, ARVs) as soon as possible after exposure to HIV sothat the exposure will not result in HIV infection during the third quarter of 2015.This is a 13 percent increase from the previous quarter (1,408).
12.3.2.3 Prevention of Mother to Child Transmission (PMTCT) of HIV
The implementation of PMTCT Option B+5 has effectively integrated PMTCTand ART services. The program aims to initiate lifelong ART for all HIV infected
108

women as early as possible in pregnancy. ART may be started and continued atantenatal clinic (ANC), labour and delivery and at ART clinics. All infants bornto HIV-infected women are supposed to start daily Nevirapine (NVP) prophylaxisfor the first 6 weeks of life. Nevirapine syrup is given to women at ANC at theearliest opportunity to take home with instructions on how to give it to the new-born. As of September, 2015, 79 percent of the estimated 14,926 HIV infectedpregnant women in Malawi were on ART. This is based on 7,031 women atmaternity who were already on ART when getting pregnant and 4,792 womenwho newly initiated ART in pregnancy. This is a slight increase in ART coveragefrom 70 percent in the last quarter of 2014/15 fiscal year.
12.3.2.4 Tuberculosis (TB) and HIV Interventions
TB is one of the most important HIV-related diseases in Malawi and aconsiderable proportion of deaths on ART are attributed to undiagnosed TB.577,441 (98 percent) of all patients retained on ART were screened for TB at theirlast visit before end of September 2015. As of that visit, 3,270 (1 percent) patientswere new TB suspects and had presumably been referred for examination by aclinician and for TB investigations. 802 (less than one percent) patients wereconfirmed TB (clinical or lab based) cases. Out of these, 729 (91 percent) wereconfirmed to be on TB treatment and 73 (9 percent) had not yet started or hadinterrupted TB treatment.
12.3.2.5 Exposed Children Follow-up
11,357 HIV-exposed children were newly enrolled into follow-up as of September2015. 7,558 (67 percent) of these were under the age of 2 months. This representstimely enrolment for 84 percent of the 9,019 known HIV-exposed childrendischarged from maternity.
12.3.2.6 HIV and AIDS Sub-Sector Achiements
It is expected that the Government of Malawi will intensify its fight against thepandemic in order to meet the UNAIDS 90-90-90 treatment targets. In order tomeet such targets, the HIV and AIDS sub-sector has the following priority areas;i) Prevention; ii) Treatment, Care and Support; iii) Impact Mitigation; iv)Protection, Participation, Empowerment of PLHIV and Other VulnerablePopulations; v) Mainstreaming and Linkages; vi) Sustaining National HIV andAIDS Research Agenda; vii) Monitoring and Evaluation, viii) ComprehensiveMulti-sectoral and Multi-disciplinary Response to HIV and AIDS; and CapacityDevelopment. During the period under review, the HIV and AIDS sub-sector incollaboration with various stakeholders registered the following milestones:
12.3.2.6.1 Prevention
1. 58 weekly radio programmes carrying HIV and AIDS prevention messageswere aired on community and national radios;
109

2. 277 radio slots addressing key drivers of the epidemic were produced bydifferent implementing partners;
3. 1,852 youth friendly health service providers were trained on youth uptakeof HIV and AIDS and other health services;
4. Condom use in the country continues to show an upward trend yearly.54,631,223 free condoms were procured and distributed to end users and16,377,603 socially-marketed condoms were distributed, of which 67,248were female condoms.
5. 68,059 Voluntary Male Medical Circumcision procedures were conducted.This shows a significant drop from 83,847 who underwent the procedure in2013/14 fiscal year; and
6. 85 percent of infected pregnant women were initiated on ART to reduce therisk of vertical transmission of HIV. This also represents a drop from 93percent who were initiated on anti-retroviral therapy (ART) during thesame period in 2013/14.
12.3.2.6.2 Treatment, Care and Support
1. 552,805 patients were on ART, representing 55 percent of the estimatedPLHIV in the country. The number of PLHIV on ART has been increasingfor the previous ten years as depicted in the Figure 12.1 below;
FIGURE 12.1: PATIENTS ALIVE AND ON ART, 2004-2014
Source: Department of Nutrition, HIV and AIDS
2. 76 percent of adults and 77 percent of children on ART were retained aliveand were on ART after a 12 month period. This represents a significant risefrom 70 percent in 2013/14 fiscal year. In addition, AIDS-related deathshas declined from over 30,000 in 2015 to 29,363 over the period underreview as indicated in Table 12.5 below; and
3. 518 Community Home Based Care service providers were trained inpalliative care and psychosocial support.
110
TABLE 12.5: NUMBER OF HIV-RELATED DEATHS (ALL AGES)
2010 2011 2012 2013 2014 2015 2016
51,027 46,482 41,978 36,198 32,603 30,765 29,363
Source: National Aids Commission (NAC) SPECTRUM Estimates, 2016
12.3.2.6.3 Impact Mitigation
1. 3,762 Orphans and Vulnerable Children (OVC) affected by HIV and AIDSwere provided with education bursaries, an improvement from 1,206 in the2013/14 financial year; and
2. 29,302 households with OVC received psychosocial material and medicalsupport to care for the OVC, surpassing the annual target of 20,000households.
12.3.2.6.4 Empowerment of People Living with HIV
1. 1,035 empowerment advocacy sessions for PLHIV were conducted atdistrict level;
2. 106 social mobilisation campaigns aiming at protecting AIDS-relatedrights and elimination of HIV-related stigma were conducted; and
3. 306 frontline workers were sensitised on gender and gender based violencerights and responsibilities of PLHIV.
12.3.2.6.5 Mainstreaming and Linkages
1. 85 people in major social sector organisations were oriented on HIV andAIDS mainstreaming;
2. 85 large public and private organisations have HIV and AIDS workplacepolicies and programmes; and
3. 50 new workplace peer educators were trained to increase awareness ofHIV and AIDS issues among staff members.
12.3.2.6.6 Sustaining HIV and AIDS Research Agenda
In the period under review, resource constraints affected research studies.However, some partners had some studies still in the pipeline and these includethe Dream Programme, the UNC Project, the Karonga Prevention Study and theDignitas International programme.
12.3.2.6.7 Monitoring and Evaluation
1. 32 Prevention of Mother to Child Transmission (PMTCT) mentorshipreview meetings in high prevalence districts were conducted;
111

2. 141,910 voluntary male medical circumcision (VMMC) standardised datacollection and reporting tools were printed in order to strengthen the datacollection and reporting system for the VMMC programme;
3. 118 data handling officers from all the five health zones were briefed on therevised VMMC data collecting tools as part of implementation of VMMCin 20 districts across the country; and
4. The National Monitoring and Evaluation Plan for the HIV sector wasdeveloped and finalised during the reporting period.
12.3.2.6.8 Comprehensive Multi-sectoral Response and CapacityDevelopment
1. One manager and six supervisors were recruited to manage HIVpharmaceuticals and medicals supplies in Central Medicals Stores;
2. 100 Central Medical Staff and health workers were trained in HIVpharmaceuticals and medical supplies and commodity logisticsmanagement;
3. All HIV and AIDS organisations were mapped in all the 34 local authoritiesacross the country; and
4. 1,278 members of Community-Based Organisations and Faith-BasedOrganisations were trained to plan, manage and monitor HIV and AIDSinterventions.
112
Chapter 13
YOUTH DEVELOPMENT, SPORTS AND CULTURE
13.1 Youth Development and Empowerment
The Youth Development and Empowerment Sector contribute to nationaldevelopment through the promotion of youth empowerment programmes. Thesector empowers the youth to play an assertive and constructive role in theirpersonal development and regeneration of their communities through setting ofstandards, guidelines and direction for youth development in Malawi. The sectorfocuses on ensuring that Malawi’s youth, who represent significantly over 70percent of the country’s population, are educated, healthy, well-trained, vibrantand productive. Specifically, Youth Development and Empowerment is among thepillars that the Government is implementing through the second Malawi Growthand Development Strategy (MGDS II) in order to empower the youth socially,economically and politically. In order to fulfil its mandate, the YouthDevelopment and Empowerment Sector focused on five strategic programmeareas during the 2015/16 financial year and these are:
1. Improvement of youth athletes’ livelihoods;
2. Improvement in literacy and numeracy levels among the youth;
3. Increasing youth participation in development initiatives;
4. Improvement in youth and athletes’ health and productivity; and
5. Improvement in coordination and effective delivery of youth developmentand empowerment programmes.
13.1.1 Major Achievements in the 2015/2016 Fiscal Year – YouthDevelopment and Empowerment
13.1.1.1 Youth Economic Empowerment Programme
The sector is implementing the Youth Economic Empowerment Programmewhich seeks to enhance capacity of the Youth of Malawi to be job creators in orderto uplift their income-earning capacity. The overall objective of the programme isto reduce the high unemployment rate amongst young people in the country.Major components of the programme include Youth Enterprise DevelopmentFund (YEDF), Neno Integrated Youth Development Centre, and the NationalYouth Service. Major achievements of the programme are presented in the sub-sections below.
13.1.1.1.1 Construction of National Youth Development Centre
The sector finished the construction of the National Youth Development Centre atNeno under the Integrated Youth Development Project with support from theGovernment and United Nations Development Programme (UNDP). The Centre
113

core focus is to impart practical agricultural skills on the youth who would like totake up farming as a business and self-employment. At present, the Centre has twohostels, a cafeteria, two dwelling houses and several production units. Theseproduction units include 23 acres for maize production, poultry production withcapacity of 1500 broilers and egg layers giving 30 crates of eggs per day, piggerywith capacity of 75, five bee apiaries and three fish ponds. In order to expand theoperations of the Centre, the sector plans to increase the production units and thedwelling houses so as to offer skills training opportunities for 300 youths perintake.
13.1.1.1.2 Multipurpose Youth Centre
Youth Multipurpose Learning Centers (YMLCs) present one of the strategies forguaranteeing youth development and empowerment. The multipurpose youthcentres are, therefore, key delivery structures for reaching out to adolescents andyouth with a variety of education, participation and skills building programeswhile at the same time according the young people with opportunity for leisure,recreation and creation of healthy relationships. With support from UNICEF, theGovernment completed construction and officially opened Thyolo Multi-purposeYouth Centre on 31st March 2016.
13.1.1.1.3 Functional Literacy Programme
Youth policy has a specific objective and policy statements in as far as promotingeducation among young people is concerned. The policy seeks to improve bothformal and non-formal education and training for young people in the country.
One of the strategies to achieve this is the introduction of literacy and numeracyprogramme for out of school youth to meet literacy and numeracy needs of theyouth that have never been to or dropped out of school and cannot return to theformal education system. The nine month teaching curriculum apart fromnumeracy and literacy also covers hygiene and nutrition. In the last ten months theprogramme has graduated more than 3000 adolescent girls. After graduation theadolescent girls are supposed to be supported and benefit from livelihood andagribusiness programmes being implemented in their respective districts.
13.1.1.1.4 Training of Youth in Technical Vocational and Enterprise Skills
The sector has also been building the capacity of the youth so as to enable theyouth to acquire skills that will enhance their ability to generate income andemployability. The appropriate skills as well as technical knowledge make theyouth exercise a profession, art and/or activity, independently in theircommunities. During the period under review about 7,000 youths were trained invocational and entrepreneurial skills through different youth programmes.
114

13.1.1.1.5 Youth Health
Health and well-being are a function of, and a means to, overall socio-economicdevelopment. Where young people are concerned, the enjoyment of a healthstatus that enables them to lead an economically and socially productive life isvery important. During the period under review, 124,643 youths were reachedwith sexual reproductive information, HIV and AIDS, family planning messagesand life skills through help lines, community concerts, condomize campaigns andvarious social media platforms.
13.1.1.2 Youth Participation and Leadership Programme
The Youth Participation and Leadership Programme aims at enhancing theopportunity of youths to participate in key decision making processes and ensurethat they are given leadership roles. This is based on the realisation that the battleto lift the plight of Malawian Youth can only be won if the youth themselvesactively participate and where possible assume leadership roles. The majorachievements under this programme include the following:
13.1.1.2.1 Leadership and Participation
Youth marginalization and discrimination is one of the issues affecting the youth.Traditionally, youths have been passive recipients of services from adults andinstitutions. As a result, they have not been actively and meaningfully involved indecision making and interventions about issues which affect them as a targetgroup and the nation as whole. To promote youth participation, about 20,000youth were trained in leadership skills through structures like youth clubs, youthnetworks and youth development centres during the period under review.
13.1.1.2.2 Launching of the Youth Status Report
Furthermore, the President, His Excellence Professor Peter Mutharika launchedthe first Youth Status Report at Bingu International Conference Centre (BICC) on12th February 2016. The report captures indicators that can be used to assess thestatus of young people in Malawi, and this analysis presents available data fordifferent specific indicators that should be considered when developing policiesand programmes for young people. The indicators include population, education,employment, sexual and reproductive health, HIV and AIDS, gender equality andsocial protection.
13.1.1.2.3 Organization of Youth Conference
The Government also organized a high level youth conference at BICC where theyouth were provided with a forum for sharing their issues, developmentinitiatives/business opportunities and their aspirations.
115

13.2 Sports and Culture
The Ministry of Sports and Culture contributes to national development, identityand unity through the promotion and management of sporting and culturalprojects and programmes. The Ministry provides overall leadership and oversightthrough coordination, planning, implementation, monitoring and evaluation ofprogrammes in order to have healthy and productive citizens and promote theMalawian cultural identity and unity in diversity.
In order to fulfil its mandate, the Ministry of Sports and Culture focuses on thesix strategic objectives namely:__
1. To promote mass participation in sports at all levels;
2. To coordinate the provision and development of sports and culture andrecreation facilities;
3. To promote and develop school sports and physical education;
4. To improve coordination and effective delivery of sports and cultureprogrammes;
5. To uncover the nation’s roots through cultural and natural heritageresearch;
6. To safeguard the nation’s cultural and natural heritage for posterity andsustainable socio-economic development; and
7. To enhance Malawi’s national identity by raising greater awareness andappreciation of Malawi’s cultural and natural heritage.
13.2.1 Major Achievements in the 2015/16 Fiscal Year – SportsDevelopment
The following are some of the achievements registered under the sportsdevelopment programme during the 2015/16 financial year:__
13.2.1.1 Construction and Rehabilitation of Sports Facilities
1. Supervision of construction works for Bingu National Stadium. All worksunder the loan agreement with the People’s Republic of China werecompleted on 30 November 2015. The Department of Buildings issued aCertificate of Practical Completion on 21 December 2015. The Ministryhas now engaged two landscape contractors to plant grass and shrubsaround the Stadium;
2. Painting, fixing of electrical circuits and repair of 16 toilet cisterns atKamuzu Institute for Sports;
3. Produced Bills of Quantities (BOQs) for all the prioritised works formaintenance and rehabilitation at Kamuzu Stadium. About 40 flash mastercistern toilets out of 80 toilets have been fixed and 20 manholes have beenfixed and connected to sewer pipes;
116

4. Completed production of tender documents for Mzuzu Youth Centre andadvertised in the Nation Newspaper of 30 November 2015, invitingconstruction companies to bid for the Centre’s construction. Following this,the Ministry conducted opening of bid documents for the construction ofMzuzu Youth Centre on 18 January 2016. Surface clearing and soil testingof soil samples was also done; and
5. Under the mass participation, recreation and physical fitness programme,the Ministry distributed ‘Sport in a box’ to all district councils through theDistrict Sports Offices and Sport Facilities. The Sport in the box wasdonated to the Ministry by UNICEF. Each a box contains a selection ofsports equipment including footballs, volleyballs, and volleyball nets.
13.2.1.2 Elite Sport Development and International Cooperation throughSport
Under Elite Sport Development and International Cooperation through Sport, theMinistry held the following sponsored sport competition finals:
1. GOTv Netball Championship on 22 November 2015 at Don BoscoTechnical College in Lilongwe. The competition was sponsored byMultichoice Malawi;
2. Standard Bank Football Association (FA) Cup on 31 October 2015 at CIVOstadium in Lilongwe. The competition helped to promote football talent.However, Standard Bank announced that it would no longer continuesponsoring the FA Cup;
3. 2015 Presidential Initiative on Sports Netball Finals at Blantyre YouthCentre on 23 January 2016;
4. TNM Super League prize presentation ceremony at COMESA Hall inBlantyre on 15 January 2016; and
5. Chipiku Central Region Football Association prize presentation ceremonyat the Police Officer‘s Mess in Area 30, Lilongwe.
Under the same programme, the Ministry launched the following sportcompetitions:__
1. 5-Aside (Five Star) Football in Malawi on 30 October 2015 at SilverStadium. The programme will roll out to all the three regions of thecountry;
2. 2016 Copa Coca Cola Schools Football competition in conjunction withMinistry of Education and MASSA at Ekwendeni CCAP SchoolCommunity Centre ground on 29 January 2016. The school soccercompetition is sponsored by Carlsberg Malawi Limited; and
3. Airtel Money Netball Competition at Salima Community Centre ground on15 January 2016.
117

13.2.1.3 Sports Development Events and Meetings
The Ministry undertook the following:__
1. The Ministry in conjunction with Ministry of Education, Science andTechnology organised UNDOKAI Sports Event at Bowa Primary Schoolon 4 February 2016. UNDOKAI sporting event was conducted under thetheme “Sports for Tomorrow” which is an initiative of the Government ofJapan to encourage people in sport participation and sensitise countries on2020 Tokyo Olympic Games;
2. Hosted African Union Sports Council Region 5 Disability sportsconference from 9 to 10 October 2015 at Bingu International ConferenceCentre in Lilongwe. All the ten SADC member countries were represented.The meeting was aimed at developing work plans for disability sports inthe Region 5 as one way of promoting sports for people with disability. Thehosting of the meeting demonstrated Malawi Government’s commitmenttowards the promotion of sports for people with disability;
3. Hosted a World Cup qualifying game between Malawi and TanzaniaNational Football teams on 11 October 2015 at Kamuzu stadium inBlantyre. Unfortunately, Malawi failed to qualify for the second round andis out of the 2018 World Cup competition; and
4. Hosted a seminar for FIFA Technical Directors of East and Central Africafrom 25 to 29 January 2016 at Chiwembe Technical Centre in Limbe. Thisis the first time that Malawi hosted such seminar.
13.2.1.4 Coordination and Management of Sports Programmes
In order to improve the coordination and management of sport programmes, theMinistry held a meeting with the Malawi National Council of Sports on 8 January2016 at Umodzi Park Hotel. In addition, the Ministry held an Induction Coursefor Youth and Sports Officers at the Staff Development Institute at Mpemba.UNICEF provided the financial support.
13.2.1.5 Other Notable Achievements
1. Establishment of Malawi Anti-Doping Organisation (MADO) Office inMalawi. MADO is an independent sports organisation that will run andmanage all sport programmes that deal with drug and substance abuse insport. The Ministry facilitated a meeting of the Malawi Ant-DopingOrganization (MADO) Board on 16 October 2015 in Blantyre which wasorganised to plan activities to fight doping in Malawi Sports; and
2. The Ministry led the Sports sector in gathering support for the generalpublic to vote for Mwawi Kumwenda, Malawi National Team Netballplayer, for the 2016 Athlete of the Year Award. Mwawi Kumwendasubsequently won the International World Game Association 2016 Athleteof the Year Award.
118

13.2.2 Major Achievements in the 2015/16 Fiscal Year – CulturalDevelopment
The following are some of the achievements registered under the culturaldevelopment programme during the 2015/2016 financial year:
1. Facilitated and participated in cultural events like the Kulamba Ceremonyin Zambia, Mulhako wa Alhomwe, Umthetho festival, Blantyre ArtsFestival and Umhlanganowa Maseko festival;
2. Held two consultative meetings with various stakeholders regarding whatshould be included in the National Heritage Council (NaHeC) Bill in theNorthern and Southern Regions;
3. Organised a stakeholders’ meeting at which a Technical Working Group ofthe Tourism, Wildlife and Culture Sector Working Group was created;
4. Conducted two training sessions on events promotion for artists;
5. Successfully established one Arts SACCO office which will provide creditfacilities for artists to enable them to develop creative industries;
6. The National Dance Troupe showcased Malawi’s culture throughperformances at 30 functions;
7. Trained 50 registry personnel in various institutions on recordsmanagement;
8. Conducted 20 records management surveys at University of MalawiOffices, Mzuzu High Court and various other government and privateinstitutions. Based on the surveys, proper advice was given to theseinstitutions on how to manage their records;
9. Processed and classified records from the Ministry of Health, MalawiRevenue Authority, District Council’s office in Karonga and EducationDivisions in the Northern Region. The records will be used by academics,researchers, policy makers and the general public;
10. Continued rehabilitating the Blantyre Cultural Centre, maintainedmonuments of the Late Rev. John Chilembwe at PIM in ChiradzuluDistrict and Martyrs’ Memorials in Nkhata Bay;
11. Participated in the rehabilitation of the Lilongwe Old District Council’sOffice;
12. Mobilised 40 communities in cultural heritage preservation;
13. Licensed about 213 libraries, film theatres and shops, making them fit forpublic usage;
14. Classified about 5,398 films and publications;
15. The Natural History Section of the Ministry conducted 10 field surveyswhere some animal specimens were collected including one crocodilespecimen, two hyena specimens, one python specimen and several small
119

mammal and bird specimens. These have been earmarked for exhibition atChichiri Museum. Furthermore, the section carried out two researchprogrammes in Lengwe and Nyika National parks. The Nyika researchfocused on population distribution of Blue Swallows on the Nyika Plateauwhile that of Lengwe looked at vulture counts to ascertain speciesabundance in Lengwe;
16. The Education Section has been implementing outreach programmes thatlink culture with topical issues such as climate change, HIV and AIDS,youth empowerment, and malaria prevention; and
17. Produced 350 copies of a Malawian cultural and artistic events calendar.
13.2.3 Challenges Faced by the Sector
1. Inadequate resources to implement sports and cultural programmes in thecountry. The scope of some of the planned activities had to be curtailed inorder to operate within the confines of available resources. This meant thatplanned targets which would have made significant difference could not bemet; and
2. The Department of Culture has its divisions located in various places whichmakes coordination a challenge. The operation costs in terms of holdingmanagement and other departmental meetings are high.
13.2.4 Planned Activities for Sport and Culture in 2016/17
In the 2016/17 financial year, the Ministry plans to undertake the following,among others:
13.2.4.1 Sports Development
1. Introduce the e-ticketing system in the main stadiums of the country tofacilitate revenue collection during events;
2. Under mass participation in sport, the Ministry plans to introduce aNational Fitness programme to increase participation in sport by allcitizens;
3. The Ministry plans to establish a Department of Marketing at the MalawiNational Council of Sport. The Department will handle all sport marketingissues and improve sponsorship management and revenue generation insports. The Department will also provide an opportunity for the privatesector to use the power of sport for marketing of their brands;
4. The Ministry plans to review the management structure of sports in Malawito improve the way sport programmes are managed and coordinated in thecountry;
5. The Ministry will revive the National Sports Development fund in order toincrease investment in sports and provide an opportunity for the privatesector to use sport for marketing of their brands; and
120

6. The Ministry will develop standard guidelines and designs for sportfacilities.
13.2.4.2 Cultural Development
1. Devolve some functions of the department to local councils and split theDepartment into three departments in conformity with the public reformsprogramme;
2. Strengthen capacities of relevant stakeholders through provision oftraining;
3. Collect, preserve and widely disseminate information on culture throughradio and television productions;
4. Facilitate the mainstreaming of culture in key policy documents like themedium-term development strategy and sectoral plans; and
5. Review and develop the national legal framework on culture.
121
Chapter 14CLIMATE CHANGE AND THE ENVIRONMENT
14.1 Climate Change and Meteorological Services14.1.1 OverviewIn Malawi there has been an increase in the country’s population and an extensionof human settlements and life-supporting activities into areas vulnerable to theimpacts of weather and climate-related disasters, as well as over-dependence onrain-fed agriculture production which is highly vulnerable to the impact ofclimate variability and climate change. The increase in the frequency andintensity of natural hazards such as floods, drought, prolonged dry spells andheavy rains due to climate variability and change poses critical challenges for ourcountry. In this respect, the Department of Climate Change and MeteorologicalServices is a fundamental part of national infrastructure and plays an importantrole in supporting vital functions of the Government. Inadequate infrastructureand limited human resources, however, are among the factors that limit theDepartment’s capacity to take advantage of developments in science andtechnology and improve its services.The observations and data on weather and climate gathered by the Departmentform the foundation of monitoring and predicting weather and climate patternsand produce climate change projections that are used in issuing early warningsand alerts on extreme weather and climate events such as heavy rainfall, strongwinds, floods and drought. These observations are collected from 21 mainmeteorological stations, 53 automatic weather stations and over 200 rain-gaugestations run by volunteer institutions and individuals. However, these weather andclimate observation station networks are sparsely distributed and, therefore, donot adequately represent the weather and climate conditions affecting the country.Telecommunication networks are also used for the exchange of data. However,these are inadequate and some are obsolete and out of date, and this hampers theefficient flow of observations and products, including multi-hazard earlywarnings.The Department sends its daily weather information to radios and once a week tonewspapers. In addition, it has its own television weather studio where weatherinformation for television is developed on a daily basis. On its website, it uploadsdaily weather information, ten-rainfall and agro-meteorological bulletins, amongmany other weather and climate information products for various users todownload and apply them in their daily operations and planning of events,programmes and projects.During the 2015/16 fiscal year, the Department planned to continue with theinitiatives to improve the monitoring, analysis and prediction of weather, climateand climate change in Malawi and kept up with trends in the world meteorologicalcommunity in order to contribute to the socio-economic development of Malawi.In this regard, the Department envisaged improving its human and institutional
122
capacity through training and infrastructural development and implementation ofthe Quality Management System (QMS) for aviation weather services. TheDepartment also planned to continue with service provision to stakeholders insupport of crop weather insurance in Malawi both at micro and macro levels. Inaddition, it continued with its role in the United Nations Framework Conventionon Climate Change (UNFCCC) negotiations. In order to improve the accuracy ofweather forecasts as well as the monitoring of extreme weather events and theissuing of early warnings and alerts, the Department procured state of artequipment for monitoring, modelling and prediction of weather and climateservices.Malawi, as member of the World Meteorological Organisation, is recognisedinternationally due its success stories related to the improvement in the deliveryof weather and climate services. As a consequence, it was chosen as one of thetwo African countries to pilot the Global Framework for Climate ServicesAdaptation Programme. Through this programme the Department has been ableto enhance and improve its relationship with the users of weather, climate dataand information for their various activities.
14.1.2 Services ProvidedThe Department provides the following services to the general public andspecialised users:1. Aviation weather services at Kamuzu and Chileka International Airports, and
Mzuzu and Karonga aerodromes;2. Up-to-date weather information, forecasts and warnings of severe weather
such as heavy rains, tropical cyclones and Mwera warnings through the printand electronic media;
3. Climate change projections, information and advisories;4. Climatological data, information and advisories for planning and operations
in agriculture, forestry, health, water resources, construction, commerce,environment, insurance, tourism and other social andeconomic sectors;
5. Seasonal rainfall forecasts and regular rainfall advisories on the onset,progress and cessation of the season;
6. Crop yielding forecasts using crop weather models;7. Daily rainfall data for the crop weather insurance programme;8. Ten-day rainfall and agro-meteorological bulletins; and9. Meteorological engineering services such as station equipment installation
and calibration of meteorological equipment, among others.
123

14.1.3 Achievements14.1.3.1 Weather and Climate Monitoring and ForecastsThe Department continued to monitor daily weather observations from its 21meteorological conventional stations, 53 automatic weather stations and over 200volunteer weather stations and transmit the observations to the nationalmeteorological centre for analysis and production of forecasts. In addition, itcarried out quality control of collected climate data and stored it safely in theCLIMSOFT Database Management System for future use by various users forvarious socio-economic activities. Using the collected ten-day climate data, theDepartment produced a ten-day rainfall and agro-meteorological bulletin everyten days and distributed them to various users for use for social economicactivities in the country. Furthermore, the Department continued contributing tothe regional and global initiatives of data exchange on a daily basis to enhanceregional and global climate models and forecast products. In addition, theDepartment produced and issued daily and five-day weather forecasts, advisoriesand severe weather warnings for tropical cyclones and Mwera warnings fromobserved weather information. These were used in various economic activities inagriculture, fishing, tourism, transport and insurance activities such as cropweather insurance in all 28 districts in the country through the print and electronicmedia. The seasonal rainfall forecast was produced and issued for the 2015/16rainfall season as well as regular rainfall advisories and updates on the onset,progress and cessation of the season for planning purposes in various sectors ofsocio-economic activity in the country. For the first time, the Departmentdownscaled and disseminated seasonal rainfall forecasts in all districts. Thedissemination involved engagement with chiefs and all key stakeholders atdistrict level.
14.1.3.2 Aviation Weather ServicesMalawi is a signatory of several international conventions including that ofInternational Civil Aviation Organisation (ICAO) and the World MeteorologicalOrganisation (WMO). ICAO in collaboration with WMO recommends andregulates standards and best practices of safe air navigation to ensure efficiencyand regularity of air travel. The Department is a key implementing entity of ICAOconvention and assists the Government to live up to its international commitment. The Department has continuously been collecting and providing weatherinformation at Kamuzu and Chileka International Airports and Mzuzu andKaronga aerodromes for safe and smooth non-interrupted operations of aircrafts.In addition, the Department provided weather information to support safe andsmooth operations of aircraft during Very Very Important Persons (VVIP) events.In order to ensuring that quality meteorological information is timely sharedinternationally, ICAO and WMO recommend that Quality Management Systems(QMS) should be practiced in all National Meteorological Services (NMSs),which are expected to pursue ISO 9001:2008 certification of their AviationWeather Services. Member countries have to show proof that the implementation
124

process for the qualification requirement is underway. The Department is in theprocess of implementing the QMS for aviation weather services to meet a certainpredefined international standard (ISO 9000). Training is currently beingconducted on the same and so far all-weather observers and forecasters have beentrained on QMS as well as internal auditors. Currently, manuals and standardoperational procedures have been prepared and are yet to be printed in readinessfor the full implementation of QMS. What is now remaining for Malawi to be ISOcertified for aviation meteorological services is the engagement of services of anexternal auditor to verify that all systems are in place and functional.
14.1.3.3 Climate and Climate Change ServicesClimate change is the sub-programme that is among the priorities of the secondMalawi Growth and Development Strategy (MGDS II). The Department,therefore, continued to carry out various functions in areas such as climate datamanagement, climatic data collection, improvement and maintenance of a reliablenetwork of stations, climate change projections, scientific research on climatetrends as well as climate change evidence and indicators and public awarenessactivities on understanding of climate change information. This has resulted in anincrease of uptake, use and application of climate data and information by varioussocio-economic sectors in the country to support development activities inagriculture, forestry, health, water resources, construction, commerce,environment, insurance, tourism and other socio-economic sectors. TheDepartment, therefore, retrieved the stored and quality controlled climate datafrom its archives, analysed it to usable formats and disseminated it to users forplanning of various socio-economic activities in agriculture, road construction,tourism, dam construction and insurance including crop weather insurance.The Department has continued rendering its services in support of the cropweather insurance initiative at both micro and macro levels. It has improved itscommunication mechanism to and from stations as well as externalcommunication to ensure smooth flow of data and information on a daily basis.The programme is aimed at contributing to the adaptation strategy of small andmedium scale farmers to the adverse effects of climate change.The 2015/16 rainfall season has been affected by one of the strongest El Niños inhistory. In this regard, the Department in its 2015/16 rainfall seasonal outlookstatement for Malawi issued in September 2015, indicated that the rainfall patternover the country during 2015/16 was to be affected by the strong El Niño presentin the tropical Pacific Ocean and had linkage with the occurrence of some majorunusual weather conditions in different parts of the world including Malawi,giving rise to floods due to unusually wet weather conditions in some areas andprolonged droughts due to drier than normal conditions in others. Historically, El Niño events reach maximum strength between October in the year of onset andJanuary of the following year, and often persist through much of the first quarterof that year before returning to neutral conditions. The current El Niño has beenfollowing a similar timeline. All of the atmospheric variables including lower andupper level wind anomalies and rainfall pattern in the country have reflected the
125

presence of El Niño although it is not the only factor that drives global climatepatterns. Impacts of both the El Niño state and other locally relevant climatedrivers for example, the state of the Indian Ocean, or the tropical Atlantic seasurface temperature have been affecting rainfall behaviour in the country. Assuch, the Department carried out awareness campaigns to various communities tosensitise the population on the impacts of El Niño on Malawi weather.On climate change initiatives, the Department continued to provide technicalsupport to the development of the National Adaptation Plan process, nationalcommunications and mitigation actions and played a key role in representingMalawi and providing technical advice at the ongoing United Nations FrameworkConvention on Climate Change (UNFCCC) negotiations including participationat UNFCCC conference of parties in Paris in December 2015. The Departmentalso contributed to the work of the Intergovernmental Panel on Climate Change(IPCC) on reviewing and disseminating its fifth assessment report. TheDepartment is also implementing activities under the multi-sectoral ClimateChange Programme, where different initiatives are being implemented to assistMalawi’s adaptation to climate change. Currently, the Department is runningseven district climate information centres in Nsanje, Chikwawa, Mulanje, Zomba,Salima, Kasungu and Karonga. These are serving as Climate Change InformationCentres for communities at district level which are also conduits for early warningmessages in addition to Climate Change Adaptation Learning Centres.Communication with stakeholders for the provision of customer-specific weatherand climate services was initiated in accordance with the WMO’s ClimateServices Delivery strategy. The Common Alert Protocol (CAP), the WorldMeteorological Organisation’s initiative for information dissemination usinginternet was operationalised. The Department continued to participate at theAfrica Risk Capacity programme of the African Union that aims to provideAfrican governments with immediate resources in the case of a natural disaster asan adaptation mechanism to climate change. Under the Global Framework forClimate Services Adaptation Programme in Africa, the Department has providedtraining to the members of the Network of Climate Journalists to improve theirunderstanding and reporting of weather and climate issues. The Department alsocollaborated with other institutions to train agricultural extension workers andMalawi Red Cross volunteers on how to share with farmers the scientific weatherinformation in a simplified manner so that farmers can make their own informeddecisions regarding agriculture management.
14.1.3.4 Public Weather ServicesThe Department embarked on a public awareness campaigns on weather, climateand climate change in some districts by using electronic media. It also celebratedthe World Meteorological Day on 23 March 2016 under the theme. “Hotter, Drier,Wetter, Face the future.” In addition, the Department commemorated the 66th
anniversary of WMO during which it observed an awareness week from 16 to 23March 2016. During the event, local communities were sensitised on the
126

operations of the Department as well as on climate change issues. In addition,activities focused on sensitising the general public on how to access weather andclimate services and products.
14.1.3.5 Infrastructural DevelopmentThe Department continued to procure, install and/or upgrade meteorologicalequipment in all stations across the country. This is funded by the LeastDeveloped Countries Fund (LDCF) under the ‘Strengthening ClimateInformation and Early Warning Systems in Malawi for Climate ResilienceDevelopment and Adaptation to Climate Change’ Project of GlobalEnvironmental Facility (GEF) with technical assistance from United NationsDevelopment Programme (UNDP). The project has also supported theDepartment to procure computers for all stations to improve the DatabaseManagement System (DBMS) and update safe keeping of climate data for use byvarious users in the country. The Department also serviced and maintained its 43Automatic Weather Stations and 21 main stations, planted a number of volunteerstation rain gauges and the global telecommunication system. State of artequipment for monitoring, modelling and prediction of weather and climateservices with high spatial resolution has been procured. The Department is in theprocess of procuring a lightning detection system for enhancing the issuance ofaccurate lightning warnings.
14.1.3.6 Human Resource DevelopmentThe Department, which always requires very rare skilled personnel to produceand deliver its services, is training five officers in Bachelor of Science inMeteorology in China and Russia with the assistance of WMO. The Departmentalso trained four officers in Advanced Diploma in Weather Forecasting with theassistance UNDP under ‘Strengthening Climate Information and Early WarningSystems in Malawi for Climate Resilience Development and Adaptation toClimate Change’ Project of Global Environmental Facility (GEF). Thorough theproject three meteorological engineers have attended two factory training coursesto enhance their understanding of automatic weather stations. The Department hasalso trained one meteorological engineer in electrical engineering to boost the in-house engineering team.
14.1.3.7 International Relations and CooperationThe Department is affiliated to a number of international organisations such asWorld Meteorological Organization (WMO) which is funding Global Frameworkfor Climate Services Adaptation Program in Malawi. The Department Chairedand participated at the Meteorological Association of Southern Africa (MASA)2015 Annual General Meeting. The Department is also affiliated to African Centrefor Meteorological Applications for Development (ACMAD) where the Directorof the Department is a Member of Board of Directors and participated at its 2015Board meeting. The Department also participated at the 3rd African MinisterialConference on Meteorology in Cape Verde in February 2015.
127
14.1.4 ChallengesSome activities failed to be implemented due to inadequate and delayed funding.Lack of equipment, adequate human resource and instruments also hinderedsmooth operations and execution of some activities.
14.2 Environment and Natural Resources Management14.2.1 OverviewThe Environment Affairs Department is mandated to provide cross-sectoralcoordination in Environment and Natural Resources Management throughmonitoring, overseeing compliance, and provision of technical and informationservices. This sub-chapter provides the performance of environment programs inthe 2015/16 financial year.14.2.2 Planning and CoordinationThe Department coordinated environmental management programmes andactivities under the United Nations Conventions on Climate Change, BiologicalDiversity, and the Vienna Convention. In the fiscal year, the Department hasdeveloped a project proposal on enhancing the resilience of agro-ecologicalsystems. The project was approved by GEF 6 and it aims to foster sustainabilityand resilience for food security by maintaining significant biodiversity andecosystem of goods and services.The country has developed the Intended National Determined Contributions(INDCs) in the priority sectors of agriculture, land use and planning, energy,water, forestry and waste management. It also developed policy briefs for theNational Climate Change Response Framework and it revised NAPA andNAMAs. The policy briefs will sensitise stakeholders on effectiveimplementation of these instruments.The Government has trained 50 refrigeration technicians on good refrigerationpractices that minimise emissions of Ozone Depleting Substances (ODS) into theatmosphere. The training strengthened the capacity of refrigeration technicians onimproved operations, service and maintenance of refrigeration facilities as acrucial element in the phase-out of ODS in the country. In addition, theGovernment has trained 30 customs officers at the Northern and Southern regionborder posts in the control of illegal trade of ODS in the country.14.2.3 Environmental Impact Assessment (EIA) and Pollution ControlThe Government continued to facilitate integration of environmentalconsiderations into development planning and implementation through theEnvironmental Impact Assessment (EIA) process. In the reporting period, theGovernment reviewed 13 EIA reports, of which 8 were approved. It also reviewsand approved five Environmental Management Plans (EMPs) and three Auditreports. Furthermore, the Government conducted five environmental complianceinspections to industries and potentially polluted sites to ensure environmentalsustainability.
128

129
In order to ensure good waste management in the country, the Governmentcontinued to implement the Integrated Waste Management Project to reducepollution and related problems in the cities of Malawi. In the reporting period, theTrunk Sewer Line along Mudi River in Blantyre from Daily Board to ClockTower has been rehabilitated. In addition, enforcement of Ban on Thin Plasticshas been undertaken whereby 15 companies have been inspected. Out of the 15companies inspected, 8 were compliant. All non-compliant companies wereissued with warning letters and fines.
14.2.4 Biodiversity ConservationMalawi is participating in a medium-sized SADC project on mainstreamingbiodiversity in development policy and planning initiatives. The project aims tofacilitate the integration of biodiversity and bio-safety into other sectoral andcross-sectoral policies, plans and programmes. The project has identified keyentry points for biodiversity mainstreaming into existing national policies,strategies and activities across various ministries. The entry points identified sofar includes the revised Environmental Management (EM) Bill, Land Policy,National Adaptation Plan (NAP) process, revised EIA regulations and thesuccessor of MGDS II.The Government has developed Guidelines for Confined Field Trials (CFT),Multi-locational Field Trials (MLT) and General Release (GR) of GeneticallyModified Organisms in Malawi. The document provides guidance on howlicensed institutions can conduct CFTs, MLTs and GR in a manner that iscompliant with the provisions of Biosafety legislation. In addition, theGovernment has approved an application by Lilongwe University of Agricultureand Natural Resources to a conduct confined field trial of cowpea plantsgenetically modified for resistance against Maruca vitrata, a serious insect pest ofcowpeas in Africa. The trial will be conducted over a period of three years andwill be concluded in 2018.The Government approved and issued two emission licenses for Illovo SugarCompany and Alliance One Tobacco Processors. It also issued licenses fortransportation of waste, storage of waste, operation of a waste managementfacility and waste disposal sites for Engen Limited, Malawi Mangoes Ltd., IllovoSugar Company and Alliance One Tobacco Processors.
14.2.4 Policy Guidance and Legal Enforcement for the Protection of theEnvironment
The Government prepared an Enforcement Manual for Environment and NaturalResources (ENRM) laws in Malawi. The manual is intended to be used byregulatory authorities as a tool for enforcing compliance with ENRM legislation.It will also be used as a guidance document that provides direction on appropriateaction to be taken in cases of non-compliance.

In addition, the Government prepared the Guidelines for safe and securetransportation of radioactive materials in Malawi. The document providesguidance on implementing, maintaining and enhancing security in order to protectradioactive material against theft, unauthorised access, illegal transfer, sabotageand other malicious acts that could result in unsafe radiation exposure.
14.2.5 Environmental Information, Education and Public AwarenessDuring the year, the Government of Malawi supported three districts of Blantyre,Mangochi and Mchinji in the production and printing of District State ofEnvironment and Outlook Reports. This is a planning and implementation toolthat helps in decision making for environment and natural resources managementat the district level.The Government has also been implementing various initiatives to raiseawareness such as: production and dissemination of waste management messagesthrough various avenues including airing of jingles on good waste managementpractices; road shows; targeted sensitisation meetings; and dissemination ofInformation, Education and Communication (IEC) materials. Further, theGovernment has erected billboards carrying waste management messages,produced and aired documentaries on MBC regarding plastics waste and heldopen sensitisation meetings in several districts on plastics.The Government has developed tools for proper management of the environmentand natural resources such as a handbook on Sustainable Land Management(SLM) Best Practices in Malawi. The handbook documents knowledge andlessons learnt on what works better in environment and natural resourcesmanagement.The Government has technically and financially supported communities along theShire River to sustainably manage the catchment of the river. Through this, thefollowing have been achieved:1. Communities have engaged in SLM initiatives such as harvesting bee honey,
diversifying food crops and fish farming, producing groundnuts flour,processing crisps from Irish potatoes for sale as part of Sustainable LandManagement activities to take pressure off the dependence on naturalresources;
2. Communities in perennial flood prone areas in Balaka have this year beenspared from floods due to various conservation initiatives; and
3. Most gullies are now reclaimed, most bare hills have been revegetated andmost river banks are conserved.
130

Chapter 15EMPLOYMENT, GENDER, CHILDREN AND SOCIAL WELFARE
15.1 Labour15.1.1 OverviewThis chapter reviews developments initiatives at the Ministry of Labour, Youthand Manpower Development for the period from July 2015 to June 2016 andprojections for 2017.15.1.2 Skills DevelopmentThe Government recognises high levels of youth unemployment in the country. Inthis regard, the Government has prioritised manpower development to curb thisproblem through the establishment of community technical colleges. A total of 28colleges will be established throughout the country, at least one in each district.So far, eleven community technical colleges have been established and are up andrunning, though they vary in terms of quality. About 1,000 students (700 men and300 women) are in these colleges acquiring various skills ranging frombricklaying, motor vehicle mechanics, carpentry, among others, and the firstcohort will graduate in December 2016. The remaining seventeen colleges arescheduled to be completed in 2016.The Government engaged the People’s Republic of China to support theconstruction of ten Community Technical Colleges and a Technical TeacherTraining College. In addition, through a loan and grant from the European Union,the Ministry will rehabilitate ten Community Technical Colleges, ten Rural SkillsDevelpment Centres, three Trade Testing Centres and four national technicalcolleges.In order to address the mistmatch between demand and supply of skills, theGovernment, with support from the International Labour Organisation (ILO), isdeveloping a National Skills Strategy for the country. The strategy will enable theTechnical, Enterpreneurial, Vocational Education and Training (TEVET) sector toprovide training that is demanded by the industry.15.1.3 Trade Testing ServicesThe Ministry of Labour, Youth and Manpower Development, among others, isresponsible for conducting skills testing and certification and so far 9,018candidates in different prescribed trades were tested, representing a 96 percentachievement rate on projected candidature. The assessment was conducted in 46Technical Training Institutions across the country. A 56 percent national pass ratehas been registered in the 2015/16 fiscal year which is 15 percent more than theprevious year’s achievement (41 percent) and 8 percent of this was women.During the same period, the Ministry issued 2202 Trade Test Certificates tosuccessful candidates thereby increasing their chances of securing formalemployment. Of these, 1,328 were Grade 3 certificates, 597 were Grade 2certificates and 277 were Grade 1 certificates. Six percent of the certificates werefor female candidates.
131

In addition, community technical colleges have started bearing some fruits. Forinstance, a total of 123 candidates from Community Technical Colleges sat for theTrade Testing Examinations and 85 of these candidates passed, representing a 69percent pass rate from Community Technical Colleges, surpassing the nationalpass rate by 13 percent.In an effort to achieve equitable access to Technical, Entrepreneurial andVocational Education and Training (TEVET), the Ministry of Labour, Youth andManpower Development further embarked on rehabilitating, re-equipping andmodernising the existing seven national technical colleges in order to provideskills in modern technology which will be in line with the private sectorexpectations. A loan was secured from African Development Bank (AfDB) forconstructing workshop, ICT and Business centres, classrooms and e-libraries andprocuring ICT equipment and library books at Lilongwe, Nasawa, Salima andSoche Technical Colleges. Through the same loan, the Government providedmerit-based scholarships to 485 students who could not afford to access trainingof which 51 percent of the beneficiaries were women. Furthermore, some teachersalso benefited from the scholarships.In order to improve the quality of technical skills, the Government is modernisingtrade testing equipment in all trade testing centres throughout the country. Thiswill enable graduates to acquire modern skills as required by the industry.Furthermore, in an effort to improve skills quality assurance, the Governmentintends to finalise the establishment of an independent Assessment andCertification Body for the TEVET Sector by December 2016.
15.1.4 Labour Services15.1.4.1 Occupational Safety and HealthThe Ministry endeavours to improve working conditions by improving the safety,health and welfare of workers and reduce work-related accidents and diseases byintensifying occupational safety and health inspections. There are about 1,200registered workplaces required to be inspected twice per annum. Out of about2,400 workplace inspections required to be undertaken, about 1,000 workplaceinspections were undertaken in the year under review. The Government iscurrently considering availing adequate resources available so that all workplacesin the country are rendered safe and without risks to health of all workers as wellas the general public and the environment. All workplaces that do not abide by theset occupational safety and health standards will be reprimanded accordingly aswas the case in Blantyre where four companies that did not comply were finedMK200,000 each.
15.1.4.2 National Employment and Labour PolicyExperience has shown that economic growth may not necessarily translate into anincrease in the number of jobs being created. In this regard, the Ministry has putin place an enabling policy environment to address employment creation. TheGovernment has finalised the development of the National Employment and
132
Labour Policy which seeks to place employment at the centre of nationaldevelopment by vigorously pursuing employment creation in all sectors of theeconomy. The policy offers an opportunity for the Government to take a moreholistic and focused approach in addressing the challenge of unemployment andunderemployment. The Ministry will continue sensitising all sectors aboutcreation of descent and productive employment within the framework of theDescent Work Country Programme.15.1.4.3 Workers CompensationIn order to speed up workers compensation payments and guarantee availabilityof funds, the Ministry is in the process of developing a Workers CompensationFund (WCF) to avail funds for compensation payments. This will reduce thefinancial burden to the Government as well as private sector and clear the backlogcases as quickly as possible. During the period under review, the Governmentfacilitated payment of MK248,906,570 as compensation for 462 cases out of1,618 registered cases and received MK8,666,513 as pension paid out fromZimbabwe.
15.1.4.4 Minimum WageThe Ministry is determined to improve the welfare of the workers in this country.Having realised that the minimum wage is not enough to draw people out ofpoverty, negotiations are underway towards fixing the minimum wage by sectorso that the remuneration of employees is in line with the performance of theirrespective sectors. Having one minimum wage across the board tends to suppresswages in other sectors that make huge returns. This will bring fairness in theremuneration of workers as is the case in other countries.
15.1.4.5 Tripartite Labour Advisory CouncilIn recognition of the complexity and critical nature of labour as a factor ofproduction, the Government in consultation with social partners reconstituted theTripartite Labour Advisory Council (TRAC) in September 2015 in accordancewith the Labour Relations Act. The Tripartite Labour Advisory Council aims atpromoting dialogue around labour and employment issues and provides soundadvice to the Government in this important field.
15.1.4.6 Tenancy LabourThe Government with the assistance of ILO commissioned a study looking at boththe legal and economic aspects of tenancy labour. The study revealed, amongstothers, that most tenants are largely exploited in Malawi. The Government willsoon abandon the tenancy system and introduce social security measures totenants affected by the abolition of tenancy labour. The Employment Act willaccordingly be amended to adequately regulate employment in tobacco estatesand other agricultural undertakings to sufficiently recognise and provideprotection to tenants as employees deserving decent working conditions.
133

15.1.4.7 Labour Market Information SystemIn order to bridge the information gap between employers and the labour force,the Government is in the process of developing a labour market informationsystem which will increase access to and availability of labour marketinformation in the country. Currently, a consultant to develop the system has beenrecruited. With the system in place, the Government will modernise publicemployment services.15.1.4.8 Temporary Employment PermitThe Temporary Employment Permit (TEP) procedures will be reviewed in orderto tighten the issuing of TEPs. This is to ensure that only skills which are notavailable in the country are considered and thus favour job opportunities forMalawians and the youth in particular.15.1.5 Child LabourChild labour remains a challenge to economic growth and development inMalawi. According to the 2002 Child Labour Survey, the prevalence rate was at37 percent of the population while the Malawi Indicator Cluster Surveyconducted in 2006 revealed a prevalence rate of 29 percent. Currently, anothersurvey is underway and, due to various interventions, it is hoped that the resultswill register a decline. The Government with the support fom cooperatingpartners such as ILO, Eliminating Child Labour in Tobacco Growing (ECLT) andJapanese Tobacco International (JTI) will continue to vigorously fight childlabour until it is completely eliminated.In an effort to tackle child labour in a more systematic, focused and coordinatedmanner for effective action, the Ministry has developed a Child Labour Policy forCabinet’s consideration and approval. Furthermore, the Government has enactedthe List of Hazardous Work which is a domain for eliminating the worst forms ofchild labour in response to the ILO Convention 182. In collaboration withdevelopment partners, the Ministry organised the National Child LabourConference which was attended by representatives from the Government andCivil Society Organisations at both local and international levels. The Conferencegenerated actions to be implemented by different key players in the elimination ofchild labour.15.1.6 Youth DevelopmentMalawi is a youthful nation since more than 60 percent of the country’spopulation being young people below the age of 30. Therefore, the youthrepresent a vast human resource potential, which could contribute positively tonational development if nurtured well. Some of the problems which the youthface include high youth unemployment and under-employment, limited access totechnical and vocational training and limited scientific and technologicalknowledge. With support from United Nations Development Programme(UNDP), the Government has finished construction works at Neno YouthDevelopment Centre under the Integrated Youth Development Project. The
134

Centre’s core focus is to impart practical agricultural skills to the youth whowould like to take up farming as a business and a form of self employment. TheMinistry will, therefore, continue implementing youth empowerment anddevelopment programmes across the country in order to reap demographicdividend. The Government will continue organising high level youth conferenceswhere the youth will be provided with a forum for sharing their challenges andtheir aspirations.15.1.7 ChallengesAchievement of labour and employment sector aspirations in Malawi has beenconstrained by a number of factors such as inadequate labour inspectors; lack ofoperational resources such as finances and equipment; skilled labour shortages;inadequate number of professional technical staff; and ineffective monitoring andevaluation system.15.2 Gender, Children, Disability and Social Welfare15.2.1 OverviewThe Ministry of Gender, Children, Disability and Social Welfare is mandated topromote gender equality and protect the welfare of Malawian women, men, girlsand boys with special focus on persons with disabilities and the elderly for themto become self-reliant and active participants and beneficiaries of the nationalsocio-economic development agenda.15.2.2 Gender Equality and Women EmpowermentThe Government is committed to promoting gender mainstreaming in the nationaldevelopment process to enhance participation of men, women, boys and girls forsustainable and equitable development for poverty eradication. The Governmentbelieves in gender equality by promoting the rights of women and girls asdemonstrated by the enactment of the following laws: Marriage, Divorce andFamily Relations Act; Trafficking in Persons Act; Disability Act; Gender EqualityAct and Child Care, Protection and Justice Act, among others. In 2015/16 fiscalyear, the Ministry has achieved the following:15.2.2.1 Gender Mainstreaming and Policy GuidanceUnder this a number of activities have been executed, some of which are asfollows:1. The Ministry launched the second edition of the National Gender Policy
which will guide gender mainstreaming and women empowerment initiativesin order to attain gender equity and equality in Malawi;
2. Held the National Gender Conference where achievements in gendermainstreaming were presented;
3. Finalised the Technical Review of the Prevention of Domestic Violence Act(PDVA) with a press briefing. The review report has been submitted to theMinistry of Justice for the finalisation of the draft Bill;
135
4. Developed the National Plan of Action for Women Economic Empowermentand Plan of Action Against Gender Based Violence;
5. Strengthened the capacity in gender responsive budgeting by training 20public officers responsible for planning and budgeting and collected genderdisaggregated data for the transport sector;
6. Institutionalised gender mainstreaming in academic institutions by facilitatingdevelopment of gender policies in public universities namely MzuzuUniversity, Malawi University of Science and Technology, LilongweUniversity of Agriculture and Natural Resource (LUANAR) and theUniversity of Malawi;
7. Facilitated the development of curricula for courses in gender anddevelopment at University of Malawi and LUANAR and also gender modulesfor training institutions in the transport sector. Currently, ten students (6women and 4 men) are pursuing a two-year Master’s Degree Programme inGender and Development at LUANAR. A total of 75 students (44 women and31 men) are pursuing a four-year Bachelor’s Degree Programme in GenderStudies at both universities. At diploma level, there are 46 students atLUANAR who are also studying Gender and Development. This will providea pool of gender experts in Malawi; and
8. The Government through the implementation of newly enacted laws hasnullified child marriages involving almost 600,000 boys and girls who havesince gone back to schools.
15.2.2.2 Promoting Women Social and Economic EmpowermentIn an attempt to increase women participation in socio-economic endeavours, theMinistry:1. Popularised women’s and girls’ rights through commemorations of
International Women’s Day, 16 Days of Activism Against Gender BasedViolence and International Rural Women’s Day;
2. Facilitated interface meetings with 80 (65 men and 15 women) TraditionalAuthorities on the Marriage, Divorce and Family Relations Act with regardsto early and child marriages. This has enhanced the campaign on ending earlymarriages;
3. Supported 157 girls mobilised by mother groups in Salima, Mchinji, Dowa,Dedza and Nsanje districts with learning materials such as school bags,exercise books, pens, pencils, and school uniforms as an incentive to keepthem in school. To date, mother groups in the target districts have so farmobilised 2,465 girls to return to school;
4. Trained 204 Community Development Assistants in the revised Umodzi ndiPhindu Manual for Community Economic Empowerment. The trainedCommunity Development Assistants have been capacitated to provide gendersensitive economic empowerment initiatives to community business groups;
136

5. Printed 5,000 copies of Gender Related Laws which were distributed toCourts, Police, Traditional Authorities, Religious and Opinion Leaders anddisseminated in 22 district councils; 150 police units; 110 courts and in totalapproximately 220,000 people were reached with the gender related laws andmessages on violence against women;
6. Trained 246 (97 women and 149 men) Magistrates, Police Prosecutors, SocialWelfare Officers and Civil Society Organisations (CSOs) on Gender RelatedLaws;
7. Facilitated reporting of 237 Gender Based Violence (GBV) cases to thedistrict One Stop Centres in Chitipa, Karonga, Nkhata Bay, Mzimba, Salima,Mchinji, Dowa, Dedza Machinga, Chiradzulu, Mangochi, Chikwawa andNsanje; and
8. Undertook 15 mobile court sessions where a total of 49 cases were handled inChitipa, Karonga, Nkhata Bay, Mzimba, Salima, Mchinji, Dowa, DedzaMachinga, Chiradzulu, Mangochi, Chikwawa and Nsanje. Out of the totalcases handled, 29 cases representing 59 percent were defilement and rapecases and these were successfully concluded with some of the accused beinggiven custodial sentences of up to 20 years.
15.2.2.3 Promoting Participation of Women in Politics and Decision-Making
Malawi has potential to increase the number of women in polictics and decisionmaking processes. To achieve this, the Ministry:1. Initiated processes of engendering the electoral law process, political party
manifestos, constitutions and regulations;2. Produced the 2014 Gender Profile and Women Status in the Public Service in
collaboration with the Department of Human Resource Management andDevelopment. The Report emphasised on scaling up gender mainstreaming atall levels in the Public Service; and
3. Conducted Professional Women Network Meetings in Mzuzu and Blantyrewith participation of approximately 6,000 participants. The women areexpected to form networks to acquire business loans.
In the upcoming 2016/17 financial year, the Government intends to achieve thefollowing:1. Capacity development of the Parliamentary Committees to advance gender
equality and support women’s empowerment;2. Capacity building for Village Savings and Loans and Business groups and
train these groups in various business skills in order to enhance women'scapacity to engage in entrepreneurship;
3. Institutionalisation of chief’s gender equality related by-laws into local districtcouncil operations;
137
4. Support of the enforcement and implementation of the gender equality relatedlaws;
5. Promotion of gender responsive budgeting, planning and monitoring in keysectors and District Councils;
6. Conducting Ending Violence Against Women and Girls campaigns;7. Finalising the review of the Citizens Act; and8. Commemorating International Days such as International Women’s Day; 16
Days of Activism against GBV; Human Rights Day and UNiTE Campaigns,ending child marriages, among others.
15.2.2.4 Legal UnitThe Ministry registers not less than 50 cases every week on domestic violence,sexual offences against young girls, deceased estates misappropriation againstwomen and children, lack of provision for child care and protection, amongothers. The Ministry through support from development partners established alegal unit in 2015 to clear outstanding Gender and Child cases. During the yearunder review, the unit managed to handle and conclude 83 cases out of the 435outstanding cases. The Ministry also provided legal support/advice to police onmany other criminal offences against women and children such as gender-basedcriminal offences, sexual violence offences, and property grabbing offences. In2016/17 financial year, the Ministry will:1. Lobby other development partners to support the recruitment of additional
lawyers;2. Intensify efforts to conclude all the outstanding cases; and3. Continue to provide legal advice to the Police and those undergoing various
abuses.15.2.3 Child Protection and Development15.2.3.1 Early Childhood Development (ECD)The Ministry has established 11,105 centres run by 32,361 caregivers and this hasincreased access to ECD from 1 percent in 1994 to 40 percent in 2015. In the2015/16 budget, under ECD the following has been achieved:1. Completed the construction of eight ECD centres and MK117 Million has
been disbursed for the construction of 39 additional ECD centres. It is worthnoting that other centres have been constructed in collaboration withdevelopment partners through off-budget support;
2. Trained 1,000 caregivers;3. Printed and distributed 5,000 copies of ECD instructional materials;4. Raised awareness of ECD programmes amongst the public through the launch
of the ECD Week of Action attended by over 6,000 people;
138

5. Conducted orientation meetings for 56 Ward Councillors; held advocacymeetings with selected Parliamentary Committees and trained 20 mediapersonnel on the need to continue investing on the ECD programme inMalawi;
6. Provided over 124,000 vita-meal packets to 973 Community Based ChildcareCentres (CBCCs), benefiting 65,678 children in the Southern region. TheNorthern and Central regions benefitted directly from the Feeding Programmewhich covered 1,451 CBCCs benefiting 185,003 children; and
7. Reached 7,179 households benefitting 13,689 parents and 20 parentingeducators across the country with parenting education and support.
In the upcoming financial year, the Government shall continue to increase accessto Early Childhood Development Services through constructing of more ECDcentres; and train more ECD caregivers.15.2.3.2 Child ProtectionThe Government has achieved the following under child protection for the periodunder review:1. Re-unified 72 (60 men and 12 women) street children with parents or
guardians;2. Promoted mainstreaming of child protection in the education system through
the introduction of the Child Friendly Schools Initiative in all the sixeducational divisions. In addition, the Government developed a manual on thesame covering 240 participants which included 34 District EducationManagers, 34 Coordinating Primary Education Advisors, 6 EducationDivision Managers and Head Teachers;
3. Strengthened the child protection system by training 80 Trainers ofFacilitators of Children’s Corners as one way of encouraging participation ofchildren on issues affecting their lives and established Quality Improvement(QI) Teams in six teams in Mangochi and four teams in Balaka. The aim ofthe Quality Improvement Teams is to facilitate provision of quality services tovulnerable children at community level. Currently, the QI Teams are workingin service areas of Education, Household Economic Strengthening and ChildProtection; and
4. In collaboration with development partners, oriented 26 District ChildProtection Committees reaching 780 members on the new National Plan ofAction for Vulnerable Children. The oriented officers are championingimplementation of the National Plan of Action at District and Communitylevels.
In 2016/17 fiscal year, the Government shall roll out Child Protection InformationManagement System (CPIMS) at district level; continue removing street kids andbeggars from the streets; finalise the Early Childhood Development Policy; andmonitor the utilisation of branded child protection services and improvementplan.
139

15.2.4 Social WelfareThe Government of Malawi is committed to protecting the rights and welfare ofvulnerable individuals, families and communities. The Ministry aims atcontributing to the promotion of access to social justice and improved socialwellbeing of the vulnerable and disadvantaged groups of people through anintegrated, well-coordinated and regulated social welfare services deliverysystem. During the year under review, the National Social Welfare Policy hasbeen approved for implementation by all stakeholders.
15.2.4.1 Protecting the Vulnerable through Social Cash TransfersThe Ministry is protecting the vulnerable and ultra poor and labour constrainedhouseholds through implementation of the Social Cash Transfer Programmewhich was launched in 2006 as a pilot in Mchinji district. To date, the programmeis operational in 18 districts namely Chitipa, Likoma, Machinga, Mangochi,Mchinji, Phalombe, Salima, Balaka, Thyolo, Mulanje, Zomba, Mwanza, Neno,Nsanje, Chikwawa, Mzimba, Dedza and Nkhata Bay. Work in the remaining tendistricts will commence once funding negotiations have been completed. Theprogramme is making significant impact in the communities. To date the numberof beneficiary households is 172,000 reaching over 800,685 individuals.In the upcoming financial year, the Government shall continue to provide cashtransfers; and strengthen linkages between the Social Cash Transfers Programmeand other resilience building initiatives underway.
15.2.4.2 Protecting the Vulnerable in Emergency and Disaster RecoveryThe Government of Malawi on 13 January 2015 declared a state of emergencyfollowing the devastating floods that occurred in 15 districts. The Ministrychaired the Protection Cluster whose objectives were two-fold: to coordinateprotection activities of vulnerable and marginalised groups of people affected bythe emergency in the country; and to ensure that human rights and gendersensitive approaches are mainstreamed in each sector when planning for responseand transitioning out of the humanitarian emergency.During the year under review, the Ministry focused on the disaster recoveryactivities, which included:1. The Ministry oriented district facilitators in Crisis Psychosocial Support. A
total of 18 Facilitators were trained in Nsanje District; and2. Identified and traced 73 (38 women and 35 men) separated children and
reunited them with their families.In the upcoming financial year, the Government shall enhance the capacity ofstakeholders to ensure the national emergency preparedness measures are genderand protection responsive.
140

15.2.4.3 Rehabilitation of Juvenile Offenders and Family WelfareIn the year under review, the following was achieved:1. Reforming and rehabilitation of juvenile offenders with the objective of
ensuring that they become productive citizens. A total of 149 children inconflict with the law have been rehabilitated;
2. Social Welfare Policy was approved by Cabinet;3. Construction of girl‘s hostels at Chilwa and Mpemba Reformatory Centres
which shall increase the number of girls juvenile offenders being reformed;and
4. Provision of matrimonial counselling to 101 families and legal assistance to25 families.
In the upcoming financial year, the Government shall continue to reform juvenileoffenders and complete the construction of a hostel at Mpemba ReformatoryCentre.15.2.4.4 Case Management and Journey of LifeDuring the year under review, the Government has achieved the followingtowards ensuring that children (and families) with complex needs are assessedand a multi-sectoral package of care and protection is arranged, coordinated,monitored and evaluated in partnership with the child and/or the family:1. The Ministry trained 422 Case Managers (District Officers, Child Care
Institution Officers and Extension Workers) who are championing casemanagement in all the districts;
2. Conducted Case Conferences in Dedza, Mangochi and Blantyre. Theconferences provided a platform for knowledge sharing in case management;and
3. Conducted a joint orientation of 28 District Social Welfare Officers (DSWOs)and 20 Prison Officers. The orientation focused on ensuring the possibility ofextending probation services to adult offenders.
Plans for 2016/17 financial year include:1. Building capacity of case managers for assessment, case conferencing,
referral and follow up;2. Building capacity of supervisors and community facilitators in Journey of
Life; and3. Evaluating the impact of the Journey of Life Initiative.
141

15.2.5 Disability and Elderly AffairsDuring the 2015/16 financial year, the following have been achieved:1. The Ministry provided vocational skills and rehabilitation training to 116
persons with disabilities including those with visual impairment (53 womenand 63 men);
2. Trained about 100 persons with disabilities in vocational skills through theMalawi Council for the Handicapped (MACOHA) Community-BasedRehabilitation (CBR) Programme in the districts of Machinga, Phalombe,Lilongwe, Mzimba, Blantyre and Salima, among others;
3. Provided 453 persons with disabilities with assistive devices such aswheelchairs, clutches, walkers and others as well as physio or occupationaltherapy throughout the country to improve their mobility and promote theirindependence;
4. Constructed a modern kitchen and commenced construction of a male hostelat Mulanje Vocational Training Centre for the Blind. Completion of the malehostel will see an increase in the enrolment of trainees at the institution from50 to over 80;
5. Popularised the importance of protecting People with Albinism and Personswith Disabilities through the commemoration of International AlbinismAwareness Day (IAAD) and International Day of Persons with Disabilitieswhich were patronised by over 3,000 people including 100 persons withalbinism. The Days were observed under the theme: “UnderstandingAlbinism: Protect and Respect Rights of Persons with Albinism” and“Inclusion Matters: Access and Empowerment of People of all Abilities”.This increased community awareness on issues of albinism and disability;
6. Launched the National Disability Mainstreaming Strategy, Work Plan forChildren with Disabilities and the Disability Communication Strategy. Thestrategy will guide and operationalise implementation of children withdisability issues in Malawi;
7. Implemented an all-inclusive response plan to address the increased cases ofattacks on persons with albinism in Malawi;
8. Undertook an investigative study to establish the root cause of attacks andkilling of persons with albinism and exhumation of bodies in the country. Thestudy was conducted in the five districts of Machinga, Mulanje and Zombain the South; Dedza in the Centre and Chitipa in the North. The findings ofthe study will help in conducting effective albinism interventions;
9. Provided support to 40 elderly victims of violence and abuse;10. Provided specialised geriatric medical and rehabilitative services to over 50
older persons with various ailments;11. Supported over 500 needy older persons with food and non-food items in
collaboration with stakeholders;
142

12. Reviewed and resubmitted the Elderly Policy for Cabinet approval;13. Implemented a comprehensive public awareness campaign on the promotion
and protection of human rights of older persons and on the fight againstwitchcraft related violence including commemorations of the InternationalDay for Older Persons under the theme “Sustainability and AgeInclusiveness in the Urban Environment”; and
14. Undertook orientation of 20 media personnel on ageing in Malawi and therole of the media in responding to the challenges of older persons. Followingthe orientation, the coverage of stories concerning the plight of the elderlyhas increased in the local print and electronic media.
Plans for 2016/17 under Disability and Elderly include:1. Undertaking measures to protect and promote the rights of persons with
albinism in Malawi in collaboration with the stakeholders like the Police, theMalawi Human Rights Commission, Association of Persons with Albinism inMalawi, the Federation of Disability Organisations in Malawi (FEDOMA)and the UN Family, among others;
2. Continuing capacity building of ministries, departments and agencies(MDAs), district and city councils, and other NGOs in disabilitymainstreaming. Over 30 MDAs and councils will be targeted in the financialyear;
3. Conducting public and targeted awareness campaigns to sensitise the generalpublic on disability and elderly issues as well as promoting the rights ofpersons with disabilities and the elderly. Targeted training for the media,clergy, judiciary and the legislature on disability issues will be conducted;
4. Finalising the review of the Disability Policy;5. Continuing vocational skills training of persons with disabilities in the three
centres located in Lilongwe, Chiradzulu and Mulanje;6. Commemorating and observing UN International Days for Older Persons,
Disability and Albinism on 1st October, 3rd December and 13th June,respectively;
7. Facilitating the review of the 1911 Witchcraft Act;8. Developing the National Plan of Action on Violence Against Older Persons;
and9. Developing the National Elderly Bill to strengthen the promotion and
protection of older persons’ rights.
143

15.2.6 Adult LiteracyCurrently there are 7,200 Chichewa/vernacular and 1,633 English literacy centresoperating across the country by Government with enrolment of approximately220,825 learners. It is worth acknowledging that other NGOs are alsoimplementing adult literacy classes through off-budget support. In the year underreview, the following achievements were registered:1. Commemoration of 2015 International Literacy Day which was attended by
over 2,000 people. This was part of creating awareness on the efforts on adultliteracy;
2. Orienting adult literacy instructors and management committees: 15participants attended the orientation workshop which built the capacity ofinstructors to effectively implement an adult literacy programme;
3. Distributing teaching and learning materials to all adult literacy centres acrossthe country; and
4. Production of new sets of assessment tools for the Chichewa syllabus for thenext five years and one set of English tools for one year.
In the upcoming financial year, the Government shall:1. Develop a policy on adult literacy to effectively guide adult literacy activities
in Malawi; and2. Link the informal adult literacy system to the formal education system so that
graduates of adult literacy can continue their education using the formaleducation system through the adult education approach.
15.2.7 Community DevelopmentThe Ministry promotes community participation in development initiativesthrough community capacity building, home management and nutrition. In2015/16 financial year, the Ministry has achieved the following;1. In collaboration with its partners, the Ministry facilitated nutrition, health and
sanitation initiatives for 30 cooperatives from 12 districts (Chitipa, Mzimba,Rumphi, Nkhatabay, Karonga, Kasungu, Lilongwe, Nkhotakota, Dedza,Blantyre, Thyolo and Zomba). In line with this, the 30 cooperatives havedeveloped micro-enterprise projects to mitigate nutrition, health andsanitation problems identified within their communities with a combinedcapital investment of MK2,726,700 being managed in a revolving fund grantsarrangement;
2. 315 cooperatives countrywide were also mobilised under the value chainsproject to participate in savings and credit clubs across the country. Thesehave accumulated a total savings of about MK645 million; and
3. Conducted a basic community development training course at MagomeroCollege, out of which 61 students graduated with a basic certificate inCommunity Development.
144

In the upcoming financial year the Government shall:1. Mobilise communities into groups for Village Savings and Loans and
motivate the communities to participate in community-based projects; and2. Review guidelines for leadership, home management and nutrition.15.2.8 NGO CoordinationThe Malawi Government recognises that a significant amount of development aidis being channelled through NGOs in Malawi. Therefore, it has strengthened thefunctions of NGO coordination in order to ensure that donor aid effectivelycontributes to development results. The Government has achieved a nuber ofthings. Hence, the Ministry:1. Facilitated registration of 24 NGOs;2. Conducted a mapping exercise of NGOs in all the 33 district councils and a
total of 247 NGO were mapped. A directory of the NGOs mapped has beenpublished. The Directory features NGOs per council, annual funding, sourceof funding, and area of focus. The mapping exercise has revealed that overK40 billion in Malawi goes to NGOs which are complementing governmentefforts in the Health and Education sectors;
3. Developed a draft NGO Policy that is expected to clearly provide guidance onissues of NGO registration, regulation and coordination in Malawi; and
4. Launched an online portal for NGO Registration via www.ngoboard.mw/registration which has simplified NGO registration in Malawi.
In the upcoming financial year, the Ministry will:1. Launch and operationalise the NGO policy;2. Establish a web-based NGO management information system; and3. Scale up the mapping of NGOs to Area Development Committee (T/A) level.
This shall provide evidence for the developmental impact of NGOs.
15.2.9 ChallengesDespite the success stories registered in the year 2015/16 financial year, thefollowing challenges were faced:1. Inadequate financial resources to enable the Ministry to recruit staff; service
the Ministry’s old fleet of motor vehicles; procure fuel, airtime andconsumable goods; provide care and support to the Ministry’s institutionssuch as the Social Rehabilitation Centres and to cater for the basic needs ofthe children, among others;
2. Delayed disbursement and processing of funds for activities;3. Limited human resource base at all levels which led to poor coordination and
implementation of the Ministry’s programmes; and4. Inadequate teaching and learning materials for ECD and Adult Literacy.
145

Chapter 16SOCIAL SUPPORT AND POVERTY REDUCTION PROGRAMMES
16.1 Social Cash Transfer Programme (SCTP)The programme will continue to target 10 percent of the population who are ultra-poor and labour-constrained households. Providing recipients with regularand predictable transfers of cash gives them the flexibility to plan theirexpenditure to meet immediate basic consumption needs as well as providing theopportunity for investment in productive activities.The programme has experienced impressive growth in the last 12 months. ByMarch 2016, the SCTP had reached over 170,122 beneficiary households and hadgone to full scale in 15 out of 18 districts where it is implemented. TheGovernment expects to enroll over 319,000 households by the end of June 2016.The programme is being implemented with funding from the European Union;German Government; World Bank; Irish Aid and Malawi Government. Onaverage, each participating household receives MK4,000 per month. However,participating households with children of school-going age receive a cash bonusto cover school expenses aimed at increasing school enrolment and attendance.Plans are underway to adjust the monthly transfer upwards to MK6,700 permonth.16.2 Village Savings and Loans (VSL) ProgrammeThe Department of Economic Planning and Development engaged a consultant todevelop best practice guidelines for Village Savings and Loans (VSL) andCommunity Savings and Investment Promotion (COMSIP). This guide borrowsbest practices from implementing organisations as well as from the globallyaccepted Savings and Loans Associations. It is a gold standard guide that acts asa basis for ensuring VSL programme quality and holding service providersaccountable in case of deviations. It provides guidance on graduation mechanismsto ensure long term sustainability. 35 percent of implementing institutions hadlinked beneficiaries to mobile money, banks and also agro–dealers. The linkagesare important in that they complement VSL activities and add more value to thelives of the VSL group members. Once linked to banks, the members are able toaccess bank services while mobile money allows them to use their mobile phonesas cash vaults. Currently, there are over 700,000 beneficiaries of various VSL andCOMSIP programmes where 79 percent of them are women.16.3 MicrofinanceMicrofinance is an important sub-sector of the financial sector. It plays asignificant part in supporting access to finance and financial inclusion of the poor.The goal is to have a viable and sustainable private microfinance market with theGovernment providing a supportive, enabling, and appropriate policyenvironment and institutional framework. The Ministry of Finance, EconomicPlanning Development is developing a new microfinance policy whose objectiveis to reduce poverty through economic empowerment by providing access to
146
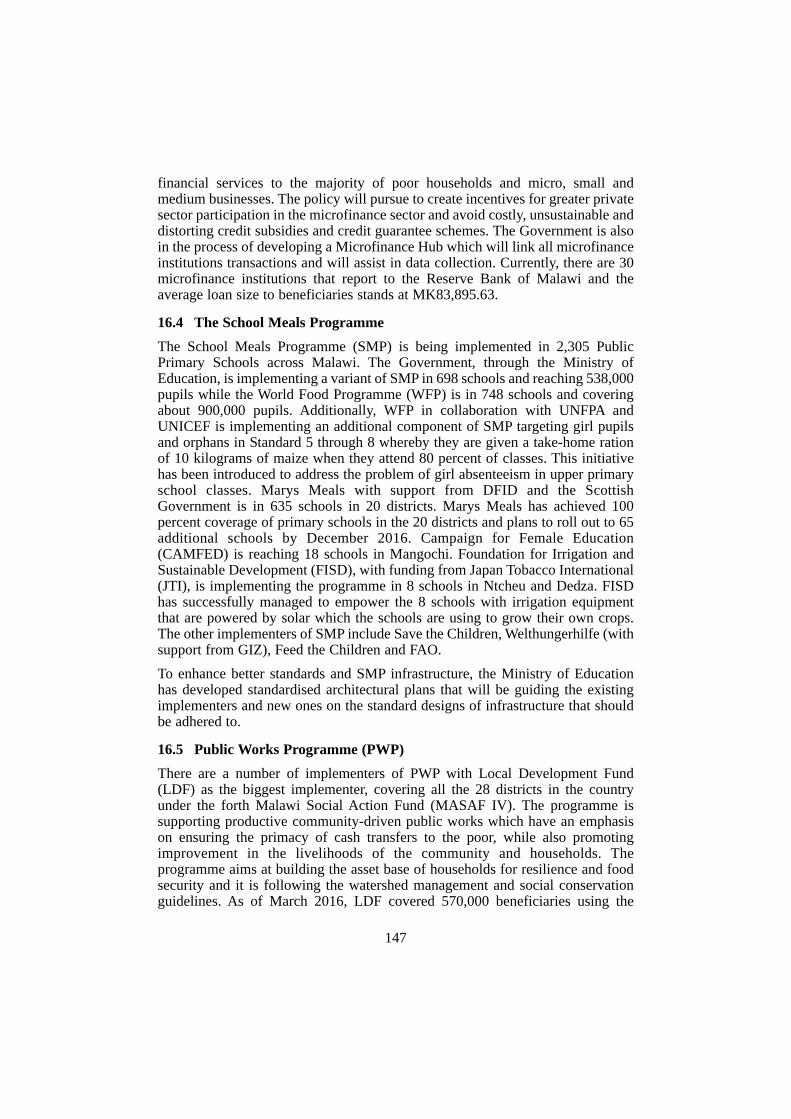
financial services to the majority of poor households and micro, small andmedium businesses. The policy will pursue to create incentives for greater privatesector participation in the microfinance sector and avoid costly, unsustainable anddistorting credit subsidies and credit guarantee schemes. The Government is alsoin the process of developing a Microfinance Hub which will link all microfinanceinstitutions transactions and will assist in data collection. Currently, there are 30microfinance institutions that report to the Reserve Bank of Malawi and theaverage loan size to beneficiaries stands at MK83,895.63.
16.4 The School Meals ProgrammeThe School Meals Programme (SMP) is being implemented in 2,305 PublicPrimary Schools across Malawi. The Government, through the Ministry ofEducation, is implementing a variant of SMP in 698 schools and reaching 538,000pupils while the World Food Programme (WFP) is in 748 schools and coveringabout 900,000 pupils. Additionally, WFP in collaboration with UNFPA andUNICEF is implementing an additional component of SMP targeting girl pupilsand orphans in Standard 5 through 8 whereby they are given a take-home rationof 10 kilograms of maize when they attend 80 percent of classes. This initiativehas been introduced to address the problem of girl absenteeism in upper primaryschool classes. Marys Meals with support from DFID and the ScottishGovernment is in 635 schools in 20 districts. Marys Meals has achieved 100percent coverage of primary schools in the 20 districts and plans to roll out to 65additional schools by December 2016. Campaign for Female Education(CAMFED) is reaching 18 schools in Mangochi. Foundation for Irrigation andSustainable Development (FISD), with funding from Japan Tobacco International(JTI), is implementing the programme in 8 schools in Ntcheu and Dedza. FISDhas successfully managed to empower the 8 schools with irrigation equipmentthat are powered by solar which the schools are using to grow their own crops.The other implementers of SMP include Save the Children, Welthungerhilfe (withsupport from GIZ), Feed the Children and FAO.To enhance better standards and SMP infrastructure, the Ministry of Educationhas developed standardised architectural plans that will be guiding the existingimplementers and new ones on the standard designs of infrastructure that shouldbe adhered to.
16.5 Public Works Programme (PWP)There are a number of implementers of PWP with Local Development Fund(LDF) as the biggest implementer, covering all the 28 districts in the countryunder the forth Malawi Social Action Fund (MASAF IV). The programme issupporting productive community-driven public works which have an emphasison ensuring the primacy of cash transfers to the poor, while also promotingimprovement in the livelihoods of the community and households. Theprogramme aims at building the asset base of households for resilience and foodsecurity and it is following the watershed management and social conservationguidelines. As of March 2016, LDF covered 570,000 beneficiaries using the
147

MASAF III approach and the number got reduced to 340,000 households usingthe MASAF IV implementation guidelines. Other important implementers are theWorld Food Programme with 44,908 beneficiaries in Balaka, Zomba, Phalombeand Karonga districts. CARE Malawi through the UBALE Project is reaching outto 28,000 beneficiaries in Blantyre Rural, Chikwawa and Nsanje districts. Currently, the PWP wage rate stands at MK600.00 per day per participant anddiscussions will be initiated soon to adjust it upwards.
148

Chapter 17
PUBLIC ENTERPRISES
17.1 Overview
This chapter highlights the financial performance of selected statutory bodiesduring the 2014/15 financial year and it also provides a brief overview of the mid-year unaudited results up to December 2015 and prospects to June 2016. Ingeneral, the performance of the public corporations has been mixed. This wasworsened by the unstable macro-economic environment which characterised mostpart of the year 2015. As a result, the performance of most corporations wasnegatively affected.
In a bid to improve performance of statutory bodies, the Government undertookseveral reforms within the public enterprise sector, which were aimed at providinga conducive environment for their operations. One of the reform areas was thedevelopment of the Dividend and Surplus Policy. This Policy aims at providing aframework for determination and remittance of dividends and surpluses to theGovernment. Implementation of the policy will start in the 2016/17 financial yearand it is envisaged that remittance of parastatal dividends will significantlyimprove.
Another significant event that the Government implemented in 2015/16 was thedisposal of the majority of its shareholding in Malawi Savings Bank andIndebank. With the launch of Basel II, the Reserve Bank of Malawi prescribednew capital adequacy requirements. This implied that the Government of Malawineeded to inject additional capital to the two banks. However, due to financialconstraints, the Government could not recapitalise the banks. As a result, theGovernment sold majority of the shares it had in the Malawi Savings Bank andIndebank to FDH Bank and National Bank of Malawi, respectively.
17.2 Water Utility Portfolio
17.2.1 Blantyre Water Board (BWB)
Blantyre Water Board continued to report losses in 2015. The 2014/15 auditedaccounts recorded a loss of MK352.7 million, a slight improvement fromMK424.614 million loss in 2013/14. As at 31 December 2015, the Board hadmade a loss of MK128.0 million. The continued poor performance was mainlydue to poor sales volumes arising from the delayed completion of the Walker’sFerry Project which resulted in lower water production than budgeted. Inaddition, the Board continued to experience high levels in non-revenue wateraveraging 46 percent in December 2015. This was due to postponement of pipereplacement leading to increased occurrence of pipe bursts which led to increasedwater pressure after the completion of the Walker’s Ferry Project. This also hadnegative effect on the profitability of the Board.
The liquidity position of BWB continued to be weak and below desirable levelsof more than 2:1. With a current ratio of 1.28:1 as at 31 December 2015, the Board
149

is barely able to cover its current liabilities. To improve this position, the Board isfocusing on reducing its non-revenue water in order to improve sales. In terms ofits financial leverage, the BWB is still vulnerable to any downturns as revealed byits ever increasing high debt-to-equity ratio of over 100 percent. This indicatesthat most of the Board’s activities are to a higher degree financed by creditorfunds as compared to owner’s equity. This is an indication of a weak financialleverage position.
Another blow to the Board during the period under review was the increase in itsdebtors as indicated by trade receivable days standing at 216 days in December2015. This arose from the inconsistency in the billing cycles as well as due to non-payment of outstanding bills by both the Government institutions and privatedebtors. The Board has intensified its debt collection using various strategies toreduce the level of debtors.
Table 17.1 shows the financial performance of the Board as at 31 December 2015.
TABLE 17.1: SELECTED PERFORMANCE STATISTICS FOR BWB
2015/16 2014/15 2013/14 2012/13 2011/12 2010/11
(half year) (Audited) (Audited) (Audited) (Audited) (Audited)
Performance targets K’000 K’000 K’000 K’000 K’000 K’000
Total revenue 4,523,400 8,303,705 7,593,984 5,118,192 3,257,995 2,654,934Change in revenue (0.46) 0.09 0.48 0.57 0.23 0.11Total expenditure 4,278,200 4,278,200 7,036,178 6,306,157 4,879,912 2,869,338Change in expenditures (0.39) 0.12 0.29 0.70 0.17 0.13Profit after Tax (128,000) (352,700) (424,614) 59,795 207,863 58,941Change in surplus/loss (0.64) (0.17) 8.10 0.71 (2.53) 0.23Net Current Assets 749,082 1,231,052 745,272 546,392 392,807 13,752Current liabilities 2,633,438 1,926,505 1,349,888 1,664,877 976,563 799,053Current ratio 1.28 1.64 1.55 1.33 1.40 1.02Debt/Equity, % 143 140 76 60 32 9
Trade receivable days 216 100 80 128 103 102
Source: Blantyre Water Board (BWB)
17.2.2 Southern Region Water Board (SRWB)
Southern Region Water Board registered a profit after tax of MK136.9 million in2015, a significant decline compared to a profit after tax of MK220.7 millionrealised in 2013/14. Nevertheless, the position had significantly improved as at 31December 2015, with a profit after tax of MK264.3 million already realised.However, this profit is largely attributed to under expenditures in operatingexpenses on account of cash flow challenges which led to deferring someactivities. Notwithstanding, the Board produced water volumes below the targetmostly due to reduction in available water resources as a result of delayed raincoupled with power outages. On the other hand, the Zomba zone experiencedincreased water consumption after a customer meter verification exercise therebyoffsetting the reduced water sales in other zones. Although still high, the meterverification exercise had a positive impact on reducing non-revenue water whichstood at 32.8 percent at the end of 2014/15 financial year and at 30.9 percent as
150

at 31 December 2015. The Board is putting in place various measures to ensurethat the target of reducing non-revenue water to 28 percent by close of 2015/16financial year is met.
Generally, SRWB has a good liquidity position at the current ratio of 2.96:1 whichindicates the Board’s financial strength and ability to meet its current liabilities asit has a good proportion of asset value relative to the value of its current liabilities.This is also an improvement from the previous financial year’s position of 2.1:1.To further strengthen this position, the Board is focusing on reducing its non-revenue water in order to improve sales. Similarly, the Board has a good financialleverage with a debt-to-equity ratio of 33 percent showing that its activities are toa higher degree financed by owner’s equity as compared to creditor funds. TheBoard has put in place revenue collection strategies to reduce the overall debtposition.
Table 17.2 shows the financial performance of the Board as at 31 December 2015.
TABLE 17.2: SELECTED PERFORMANCE STATISTICS FOR SRWB
2015/16 2014/15 2013/14 2012/13 2011/12 2010/11(half year) (Audited) (Audited) (Audited) (Audited) (Audited)
Performance targets K’000 K’000 K’000 K’000 K’000 K’000
Total revenue 2,105,772 3,067,671 2,169,434 1,818,478 1,259,471 1,068,266
Change in revenue (0.31) 0.41 0.19 0.44 0.18 0.13
Total expenditure 1,575,037 2,538,053 1,963,419 1,508,420 1,158,499 1,032,426
Change in expenditures (0.38) 0.29 0.30 0.30 0.12 0.13
Profit after Tax 264,295 136,918 220,770 358,632 100,483 35,566
Change in surplus/loss 0.93 (0.38) 0.38 (2.57) (1.83) (0.19)
Net Current Assets 1,500,804 1,011,889 994,078 1,051,677 607,389 675,425
Current liabilities 765,332 925,426 672,297 403,966 239,105 126,627
Current ratio 2.96 2.09 2.48 3.60 3.54 6.33
Debt/Equity, % 33 32 47 16 0 0
Trade receivable days 325 167 207 159 175 186
Source: Southern Region Water Board (SRWB)
17.2.3 Central Region Water Board (CRWB)
Central Region Water Board registered a loss of MK166.2 million in 2014/15, ascompared to a net profit of MK202.4 million realised in 2013/14. However, theBoard registered a significant improvement as at 31 December 2015, with a profitafter tax of MK76.1 million. Nevertheless, this profit does not reflect an increasein the sales volumes and it is largely attributed to savings on operating expensesas a result of cash flow challenges and delayed implementation of some activities.There was a 7 percent reduction in growth of water sales volume over the last yearwhich was mainly due to dwindling of raw water sources and ESCOM poweroutages. Despite the Board having enough capacity to produce more, the waterdemand in CRWB continues to grow slowly due to the existence of alternativewater sources in the supply area. To improve the situation, the Board isundertaking promotion campaigns to encourage more customers to get connected.
151
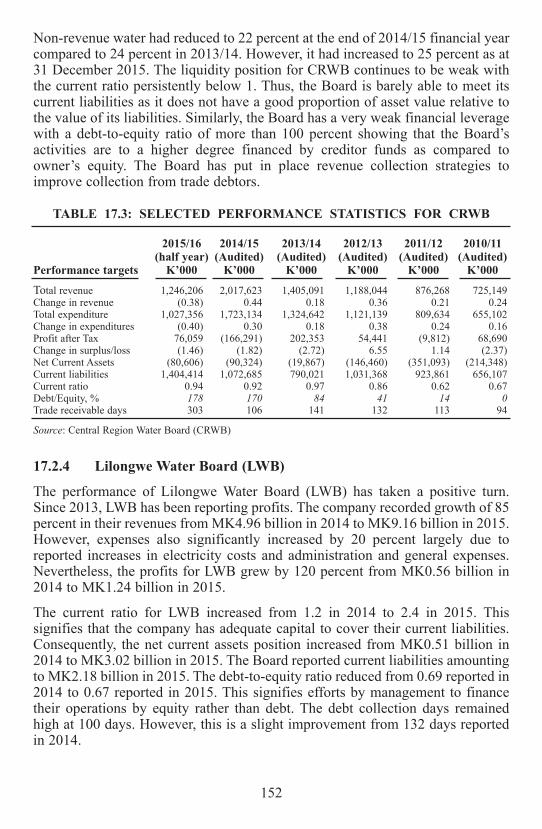
Non-revenue water had reduced to 22 percent at the end of 2014/15 financial yearcompared to 24 percent in 2013/14. However, it had increased to 25 percent as at31 December 2015. The liquidity position for CRWB continues to be weak withthe current ratio persistently below 1. Thus, the Board is barely able to meet itscurrent liabilities as it does not have a good proportion of asset value relative tothe value of its liabilities. Similarly, the Board has a very weak financial leveragewith a debt-to-equity ratio of more than 100 percent showing that the Board’sactivities are to a higher degree financed by creditor funds as compared toowner’s equity. The Board has put in place revenue collection strategies toimprove collection from trade debtors.
TABLE 17.3: SELECTED PERFORMANCE STATISTICS FOR CRWB
2015/16 2014/15 2013/14 2012/13 2011/12 2010/11(half year) (Audited) (Audited) (Audited) (Audited) (Audited)
Performance targets K’000 K’000 K’000 K’000 K’000 K’000
Total revenue 1,246,206 2,017,623 1,405,091 1,188,044 876,268 725,149Change in revenue (0.38) 0.44 0.18 0.36 0.21 0.24Total expenditure 1,027,356 1,723,134 1,324,642 1,121,139 809,634 655,102Change in expenditures (0.40) 0.30 0.18 0.38 0.24 0.16Profit after Tax 76,059 (166,291) 202,353 54,441 (9,812) 68,690Change in surplus/loss (1.46) (1.82) (2.72) 6.55 1.14 (2.37)Net Current Assets (80,606) (90,324) (19,867) (146,460) (351,093) (214,348)Current liabilities 1,404,414 1,072,685 790,021 1,031,368 923,861 656,107Current ratio 0.94 0.92 0.97 0.86 0.62 0.67Debt/Equity, % 178 170 84 41 14 0
Trade receivable days 303 106 141 132 113 94
Source: Central Region Water Board (CRWB)
17.2.4 Lilongwe Water Board (LWB)
The performance of Lilongwe Water Board (LWB) has taken a positive turn.Since 2013, LWB has been reporting profits. The company recorded growth of 85percent in their revenues from MK4.96 billion in 2014 to MK9.16 billion in 2015.However, expenses also significantly increased by 20 percent largely due toreported increases in electricity costs and administration and general expenses.Nevertheless, the profits for LWB grew by 120 percent from MK0.56 billion in2014 to MK1.24 billion in 2015.
The current ratio for LWB increased from 1.2 in 2014 to 2.4 in 2015. Thissignifies that the company has adequate capital to cover their current liabilities.Consequently, the net current assets position increased from MK0.51 billion in2014 to MK3.02 billion in 2015. The Board reported current liabilities amountingto MK2.18 billion in 2015. The debt-to-equity ratio reduced from 0.69 reported in2014 to 0.67 reported in 2015. This signifies efforts by management to financetheir operations by equity rather than debt. The debt collection days remainedhigh at 100 days. However, this is a slight improvement from 132 days reportedin 2014.
152
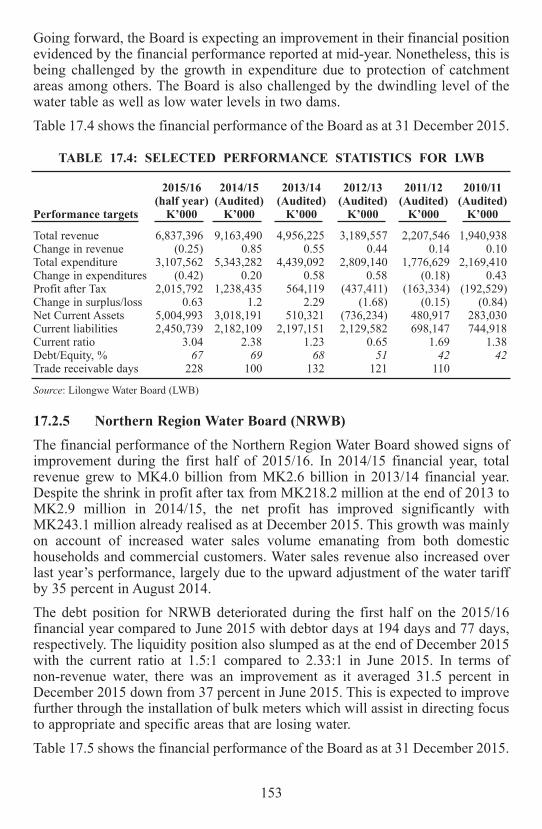
Going forward, the Board is expecting an improvement in their financial positionevidenced by the financial performance reported at mid-year. Nonetheless, this isbeing challenged by the growth in expenditure due to protection of catchmentareas among others. The Board is also challenged by the dwindling level of thewater table as well as low water levels in two dams.
Table 17.4 shows the financial performance of the Board as at 31 December 2015.
TABLE 17.4: SELECTED PERFORMANCE STATISTICS FOR LWB
2015/16 2014/15 2013/14 2012/13 2011/12 2010/11(half year) (Audited) (Audited) (Audited) (Audited) (Audited)
Performance targets K’000 K’000 K’000 K’000 K’000 K’000
Total revenue 6,837,396 9,163,490 4,956,225 3,189,557 2,207,546 1,940,938 Change in revenue (0.25) 0.85 0.55 0.44 0.14 0.10 Total expenditure 3,107,562 5,343,282 4,439,092 2,809,140 1,776,629 2,169,410 Change in expenditures (0.42) 0.20 0.58 0.58 (0.18) 0.43 Profit after Tax 2,015,792 1,238,435 564,119 (437,411) (163,334) (192,529)Change in surplus/loss 0.63 1.2 2.29 (1.68) (0.15) (0.84)Net Current Assets 5,004,993 3,018,191 510,321 (736,234) 480,917 283,030 Current liabilities 2,450,739 2,182,109 2,197,151 2,129,582 698,147 744,918 Current ratio 3.04 2.38 1.23 0.65 1.69 1.38 Debt/Equity, % 67 69 68 51 42 42
Trade receivable days 228 100 132 121 110
Source: Lilongwe Water Board (LWB)
17.2.5 Northern Region Water Board (NRWB)
The financial performance of the Northern Region Water Board showed signs ofimprovement during the first half of 2015/16. In 2014/15 financial year, totalrevenue grew to MK4.0 billion from MK2.6 billion in 2013/14 financial year.Despite the shrink in profit after tax from MK218.2 million at the end of 2013 toMK2.9 million in 2014/15, the net profit has improved significantly withMK243.1 million already realised as at December 2015. This growth was mainlyon account of increased water sales volume emanating from both domestichouseholds and commercial customers. Water sales revenue also increased overlast year’s performance, largely due to the upward adjustment of the water tariffby 35 percent in August 2014.
The debt position for NRWB deteriorated during the first half on the 2015/16financial year compared to June 2015 with debtor days at 194 days and 77 days,respectively. The liquidity position also slumped as at the end of December 2015with the current ratio at 1.5:1 compared to 2.33:1 in June 2015. In terms of non-revenue water, there was an improvement as it averaged 31.5 percent inDecember 2015 down from 37 percent in June 2015. This is expected to improvefurther through the installation of bulk meters which will assist in directing focusto appropriate and specific areas that are losing water.
Table 17.5 shows the financial performance of the Board as at 31 December 2015.
153

TABLE 17.5: SELECTED PERFORMANCE STATISTICS FOR NRWB
2015/16 2014/15 2013/14 2012/13 2011/12 2010/11(half year) (Audited) (Audited) (Audited) (Audited) (Audited)
Performance targets K’000 K’000 K’000 K’000 K’000 K’000
Total revenue 2,473,539 4,001,471 2,649,967 1,906,155 1,444,987 1,059,836Change in revenue (0.38) 0.51 0.39 0.32 0.36 0.24Total expenditure 1,985,479 3,529,468 2,147,221 1,663,355 1,157,557 939,606Change in expenditures (0.44) 0.64 0.29 0.44 0.23 0.21Profit after Tax 243,122 2,922 218,163 84,030 205,524 50,763Change in surplus/loss 82.20 (0.99) (1.60) 0.59 (3.05) 1.56Net Current Assets 408,525 588,952 184,642 (78,195) 112,232 123,452Current liabilities 816,330 442,585 1,198,851 749,056 308,039 332,122Current ratio 1.50 2.33 1.15 0.90 1.36 1.37Debt/Equity, % 51 54 32 26 42 45
Trade receivable days 194 77 108 100 102 102
Source: Northern Region Water Board (NRWB)
17.3 Property Development and Management
17.3.1 Malawi Housing Corporation (MHC)
Malawi Housing Corporation has continued to perform poorly for the last fiveyears. Although the institution’s revenue had been increasing in the first threeyears of the period under review, it has been making losses in the last two years.Profit increased by 6 percent from 2011 to 2012 but in 2013 profits fell by 29percent as a result of a MK38.4 million loss. The poor performance is largely duenon-payment of rentals by the Government which has 85 percent of theinstitution’s houses. Currently, the Government owes the institution MK47.9million.
The current ratio, which measures the institutions ability to meet its short-termobligations, has persistently been below desirable levels as it stood at 0.88:1 at 31December 2015. This is also exacerbated by the reduction in net current assets toMK147.3 million in 2014/15 from MK963.7 million at the end of 2013/14.Furthermore, current liabilities have persistently been higher than current assets.However, the institution’s debts are not more than its equity as indicated by adebt-to-equity ratio at only 6 percent for the last two years.
One major challenge for the institution remains the high cost of project finance inMalawi. In this respect, MHC is in the process of applying for loans with the BizPlanners and Advisors Pte Limited, Industrial and Commercial Bank of China andKuwait Fund. The institution continues to experience an increase in debtcollection days which in turn restricts cash flow as it impacts negatively onrevenue.
Table 17.6 shows the financial performance of the Corporation as at 31 December2015.
154
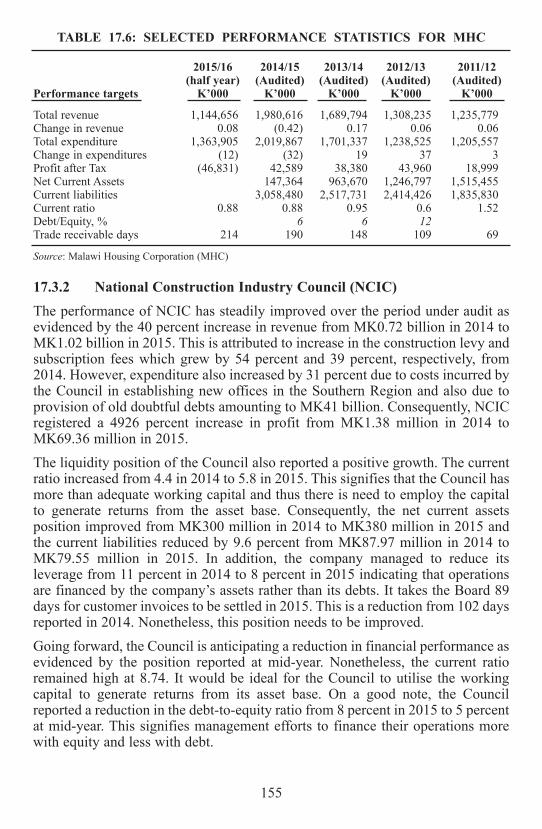
TABLE 17.6: SELECTED PERFORMANCE STATISTICS FOR MHC
2015/16 2014/15 2013/14 2012/13 2011/12(half year) (Audited) (Audited) (Audited) (Audited)
Performance targets K’000 K’000 K’000 K’000 K’000
Total revenue 1,144,656 1,980,616 1,689,794 1,308,235 1,235,779Change in revenue 0.08 (0.42) 0.17 0.06 0.06Total expenditure 1,363,905 2,019,867 1,701,337 1,238,525 1,205,557Change in expenditures (12) (32) 19 37 3Profit after Tax (46,831) 42,589 38,380 43,960 18,999Net Current Assets 147,364 963,670 1,246,797 1,515,455Current liabilities 3,058,480 2,517,731 2,414,426 1,835,830Current ratio 0.88 0.88 0.95 0.6 1.52Debt/Equity, % 6 6 12
Trade receivable days 214 190 148 109 69
Source: Malawi Housing Corporation (MHC)
17.3.2 National Construction Industry Council (NCIC)
The performance of NCIC has steadily improved over the period under audit asevidenced by the 40 percent increase in revenue from MK0.72 billion in 2014 toMK1.02 billion in 2015. This is attributed to increase in the construction levy andsubscription fees which grew by 54 percent and 39 percent, respectively, from2014. However, expenditure also increased by 31 percent due to costs incurred bythe Council in establishing new offices in the Southern Region and also due toprovision of old doubtful debts amounting to MK41 billion. Consequently, NCICregistered a 4926 percent increase in profit from MK1.38 million in 2014 toMK69.36 million in 2015.
The liquidity position of the Council also reported a positive growth. The currentratio increased from 4.4 in 2014 to 5.8 in 2015. This signifies that the Council hasmore than adequate working capital and thus there is need to employ the capitalto generate returns from the asset base. Consequently, the net current assetsposition improved from MK300 million in 2014 to MK380 million in 2015 andthe current liabilities reduced by 9.6 percent from MK87.97 million in 2014 toMK79.55 million in 2015. In addition, the company managed to reduce itsleverage from 11 percent in 2014 to 8 percent in 2015 indicating that operationsare financed by the company’s assets rather than its debts. It takes the Board 89days for customer invoices to be settled in 2015. This is a reduction from 102 daysreported in 2014. Nonetheless, this position needs to be improved.
Going forward, the Council is anticipating a reduction in financial performance asevidenced by the position reported at mid-year. Nonetheless, the current ratioremained high at 8.74. It would be ideal for the Council to utilise the workingcapital to generate returns from its asset base. On a good note, the Councilreported a reduction in the debt-to-equity ratio from 8 percent in 2015 to 5 percentat mid-year. This signifies management efforts to finance their operations morewith equity and less with debt.
155

Table 17.7 shows the financial performance of the Council as at 31 December2015.
TABLE 17.7: SELECTED PERFORMANCE STATISTICS FOR NCIC
2015/16 2014/15 2013/14 2012/13 2011/12 2010/11(half year) (Audited) (Audited) (Audited) (Audited) (Audited)
Performance targets K’000 K’000 K’000 K’000 K’000 K’000
Total revenue 553,265 1,017,118 724,708 677,347 456,242 414,712Change in revenue (0.46) 0.40 0.07 0.48 0.10 0.47Total expenditure 529,759 947,754 723,028 514,475 411,707 316,265Change in expenditures (0.44) 0.31 0.41 0.25 0.30 0.83Profit after Tax 23,506.00 69364 1379 162872 44535 102240Change in surplus/loss (0.66) 49.30 0.99 (2.66) 0.56 0.07Net Current Assets 399,749 380,107 300,914 368,134 205,742 169,688Current liabilities 51,631 79,547 87,969 56,513 57,955 47,700Current ratio 8.74 5.78 4.42 7.51 4.55 4.56Debt/Equity, % 5 8 11 0.07 11 32
Trade receivable days 184 89 102 139 181 121
Source: National Construction Industry Council (NCIC)
17.4 Power Portfolio
17.4.1 Electricity Supply Corporation of Malawi Limited (ESCOM)
Electricity Supply Corporation of Malawi (ESCOM) continued to perform well in2014/15 when compared to 2013/14. ESCOM’s revenue had grown fromMK49.25 billion in 2013/14 to MK55.01 billion in 2014/15, thus reporting a 12percent growth. However, expenses grew by 24 percent to MK43.03 billionduring the same period. Maintenance costs largely contributed to the growth inexpenses. Thus, the profit after tax fell by 67 percent from MK26.82 billion in2014 to MK8.73 billion in 2015.
The current ratio for ESCOM increased from 1:5.46 reported in 2014 to 1:5.9 in2015. This implies that ESCOM has a lot of liquidity floating around.Consequently, the net current assets position grew from MK26.0 billion in 2014to MK36.7 billion in 2015. Regardless, ESCOM recorded an increase in the tradereceivable days from 64 days in 2014 to 92 days in 2015. This implies thatESCOM should continue to improve its efficiency in collecting outstandinginvoices from customers. One of the strategies in place is intensifying theinstallation of pre-paid meters to reduce the amount of money that is tied up byits debtors. The debt-to-equity position of 79 percent implies that the enterprise isemploying debt to finance its operations other than equity. This is not sustainableand dangerous as the equity base can easily be consumed by debt.
Going forward, it is anticipated that the performance of ESCOM will improve asevidenced by the growth in profits after tax reported at mid-year and the reductionin the debt-to-equity ratio. ESCOM needs to intensify its efforts to recover debtfrom its creditors as the trade receivable days increased to 186 days at mid-yearfrom 92 days reported at the end of the 2015 financial year.
156

Table 17.8 shows the financial performance of the Commission as at 31December 2015.
TABLE 17.8: SELECTED PERFORMANCE STATISTICS FOR ESCOM
2015/16 2014/15 2013/14 2012/13 2011/12 2010/11(half year) (Audited) (Audited) (Audited) (Audited) (Audited)
Performance targets K’000 K’000 K’000 K’000 K’000 K’000
Total revenue 30,117,054 55,098,247 49,246,288 34,403,257 22,564,426 13,828,962Change in revenue (0.45) 0.12 0.43 0.52 0.63 0.32Total expenditure 24,436,040 43,025,990 34,571,300 21,510,150 12,897,269 10,416,037Change in expenditures (0.43) 0.24 0.61 0.67 0.24 0.15Profit after Tax 8,981,550 8,730,030 26,818,774 17,959,525 5,969,691 5,806,797Change in surplus/loss 0.03 (0.67) (0.49) (2.01) (0.03) 66.16Net Current Assets 43,657,156 36,652,655 26,014,068 16,234,456 (753,827) (5,874,304)Current liabilities 8,137,539 7,487,155 5,835,770 3,531,385 10,228,671 12,197,288Current ratio 6.36 5.90 5.46 5.60 0.93 0.52Debt/Equity, % 74 79 74 106 99 202
Trade receivable days 186.95 92.17 63.95 66.79 89.60 79.92
Source: Electricity Supply Commission of Malawi (ESCOM)
17.4.2 National Oil Company of Malawi (NOCMA)
NOCMA’s performance over the five year period has been somewhat mixed.There was a significant increase in revenue from 2012 to 2013 (13,180 percent)but the company realised a 71 percent drop in revenue in the preceding year.However, there is a 228 percent projected increase in income in 2015/16.Expenses also followed a similar trend, although they have been projected to godown in the 2015/16 financial year.
NOCMA has maintained a 1:1 current ratio indicating that it cannot cover itscurrent liabilities with its current assets. This may affect its repayments of anyfinancial obligations that it may have. The debt-to-equity position has beensignificantly high at an average of 3,749 percent. This is unsustainable because itsignals that it is over-leveraged.
Table 17.9 shows the financial performance of the Company as at 31 December2015.
TABLE 17.9: SELECTED PERFORMANCE STATISTICS FOR NOCMA
2015/16 2014/15 2013/14 2012/13(half year) (Audited) (Audited) (Audited)
Performance targets K’000 K’000 K’000 K’000
Total revenue 32,109,908 9,802,752 33,947,924 255,641Total expenditure 94,099 9,780,745 33,848,604 9,780,745Profit after Tax 32,204,007 22,007 99,320 414,951Net Current Assets 927,175 680,986 1,000,000 545,776Current liabilities 14,225,105 32,766,592 34,478,490 39,805,784Current ratio 1.0 1.0 1.0 1.0Debt/Equity, % 1,098 6,411 4,225 3,424
Trade receivable days 154 25 19
Source: National Oil Company of Malawi (NOCMA)
157

17.4.3 Malawi Energy Regulatory Authority (MERA)
The performance of Malawi Energy Regulatory Authority (MERA) improved in2015. The revenue for the Authority grew by 52 percent from MK1.82 billion in2014 to MK2.78 billion in 2015. Expenses also reported a positive growth of 30percent from MK1.08 billion in 2014 to MK1.40 billion in 2015. Thus, profit aftertax for the Authority increased by 85 percent from MK0.74 billion in 2014 toMK1.37 billion in 2015.
The current ratio for MERA increased from 1.24 reported in 2014 to 3.24 in 2015.The reduction in current liabilities by 68 percent from MK21.66 billion in 2014to MK6.92 billion in 2015 might have contributed to the growth. Consequently,the net current assets position increased from MK5.12 billion in 2014 to MK15.49billion in 2015. The debt-to-equity ratio for the Authority significantly reduced to53 percent in 2014/15. This signifies efforts by management to finance theoperations by equity and less by debt. MERA is anticipating a furtherimprovement in its performance in 2016 despite reporting a loss at mid-year. Thecurrent ratio slightly decreased from the position reported in 2014. Nonetheless,a current ratio of 1:3.01 at mid-year implies that MERA has adequate workingcapital to be employed in its operations.
Table 17.10 shows the financial performance of the Authority as at 31 December2015.
TABLE 17.10: SELECTED PERFORMANCE STATISTICS FOR MERA
2015/16 2014/15 2013/14 2012/13 2011/12 2010/11(half year) (Audited) (Audited) (Audited) (Audited) (Audited)
Performance targets K’000 K’000 K’000 K’000 K’000 K’000
Total revenue 1,987,331 2,776,576 1,822,962 1,111,255 663,718 528,618Change in revenue (0.28) 0.52 0.64 0.67 0.26 0.32Total expenditure 887,659 1,403,228 1,079,817 704,594 650,812 500,096Change in expenditures (0.37) 0.30 0.53 0.08 0.30 0.53Profit after Tax 1,032,283 1,373,348 743,145 406,661 12,906 28,522Change in surplus/loss (0.25) 0.85 (0.83) (30.51) 0.55 0.47Net Current Assets 25,150,088 15,493,925 5,167,442 2,094,525 675,211 364,914Current liabilities 12,505,285 6,917,123 21,655,747 23,202,288 9,768,840 5,702,596Current ratio 3.01 3.24 1.24 1.09 1.07 1.06Debt/Equity ratio 0.49 0.53 13.13 5.76 13.23 12.39Trade receivable days 45 45 45
Source: Malawi Energy Regulatory Authority (MERA)
17.5 Telecommunication Portfolio
17.5.1 Malawi Posts Corporation Limited (MPC)
The performance of Malawi Posts Corporation (MPC) slightly improved from theposition reported in 2014/15. In 2014/15, revenues grew by 3 percent fromMK3.24 billion to MK3.35 billion. Expenses grew by 15 percent from MK3.27billion to MK3.76 billion during the same period. Thus, the financial position of
158

the Corporation worsened with a loss increasing from MK171 million reported in2014 to MK463 million recorded in 2015.
With a current ratio of 0.71, MPC had inadequate working capital to finance itsday-to-day operations in 2015. The current liabilities for the Corporationincreased from MK2.48 billion as reported in 2014 to MK2.86 billion in 2015.Consequently, the net current assets position worsened from a liability of MK748million in 2014 to a liability of MK834 million in 2015. Thus, the Corporationwould not have been able to meet their obligations in 2015 due to more currentliabilities than current assets. The Corporation reported a trade receivable daysposition of 49 days implying that management is employing efforts to collectresources from their creditors. The debt-to-equity position, however, remainedhigh at 108 percent in 2015.
Going forward, MPC anticipates an improvement in their financial position. TheCorporation reported a profit of MK127 million at mid-year of 2015/16 financialyear. The net current assets position has slightly improved. However, theCorporation still reported negative working capital of MK231 million at mid-year.Notably, the current ratio improved from 1:0.71 at the end of 2014/15 financialyear to 1:0.89 at mid-year of 2015/16.
Table 17.11 shows the financial performance of the Corporation as at 31December 2015.
TABLE 17.11: SELECTED PERFORMANCE STATISTICS FOR MPC
2015/16 2014/15 2013/14 2012/13 2011/12 2010/11(half year) (Audited) (Audited) (Audited) (Audited) (Audited)
Performance targets K’000 K’000 K’000 K’000 K’000 K’000
Total revenue 1,940,777 3,345,514 3,239,818 2,613,213 1,510,322 1,206,453nge in revenue (0.42) 0.03 0.24 0.73 0.25 0.25Total expenditure 1,851,334 3,761,488 3,273,184 2,106,007 1,565,142 1,195,515Change in expenditures (0.51) 0.15 0.55 0.35 0.31 0.53Profit after Tax 127,426 (463,271) (171,101) 44,142 (87,579) 59,887Change in surplus/loss (1.28) 1.71 4.88 1.50 2.46 0.85Net Current Assets (231,791) (834,472) (748,133) (249,955) (576,987) (174,506)Current liabilities 2,043,371 2,865,572 2,479,689 1,594,633 1,421,587 826,756Current ratio 0.89 0.71 0.70 0.84 0.59 0.79Debt/Equity, % 108 109 (15.92) (15.74) 60.39Trade receivable days 23 49
Source: Malawi Posts Corporation (MPC)
17.5.2 Malawi Communications and Regulatory Authority (MACRA)
Malawi Communications Regulatory Authority (MACRA) has consecutivelyreported surpluses over the years. Income for MACRA increased by 103 percentfrom MK6.64 billion reported in 2014 to MK13.50 billion in 2015. Expenses, onthe other hand, increased by 62 percent from MK3.44 billion in 2014 to MK5.59billion in 2015. Consequently, surpluses grew by 107 percent from MK3.20billion in 2014 to MK8.61 billion in 2015.
159

Table 17.12 shows the financial performance of the Authority as at 31 December2015.
TABLE 17.12: SELECTED PERFORMANCE STATISTICS FOR MACRA
2015/16 2014/15 2013/14 2012/13 2011/12(half year) (Audited) (Audited) (Audited) (Audited)
Performance targets K’000 K’000 K’000 K’000 K’000
Total revenue 6,435,378 13,503,831 6,641,779 3,377,847 2,286,898Change in revenue (0.52) 1.03 0.97 0.48 0.14Total expenditure 2,964,553 5,594,074 3,445,989 2,706,382 1,624,130Change in expenditures (0.47) 0.62 0.27 0.67 0.24Profit after Tax 3,262,970 8,614,669 3,195,790 671,465 662,768Change in surplus/loss (0.62) 1.70 (3.76) (0.01) 0.06Net Current Assets 4,641,265 4,336,386Current liabilities 4,140,119 5,911,197Current ratio 2.12 1.73Debt/Equity ratio 0.83 1.08Trade receivable days 416 165
Source: Malawi Communications and Regulatory Authority (MACRA)
17.6 Agriculture Portfolio
17.6.1 Agriculture Development and Marketing Corporation Limited(ADMARC)
The performance of the Agriculture Development and Marketing Corporation(ADMARC) remained poor in the period under review. In 2015, total revenuesshrunk to MK9.5 billion from MK11.2 billion in 2014. Thus, the financialposition of the Corporation worsened by 307 percent from a loss of MK169.4million reported in 2014 to a loss of MK914.3 million in 2015.
With a current ratio of 0.5, ADMARC had inadequate working capital to financeits day-to-day operations in 2015. The current liabilities for the Corporationincreased from MK8.7 billion reported in 2014 to MK10.2 billion in 2015.Consequently, the net current assets position worsened from a liability of MK3.3billion in 2014 to a liability of MK5.4 billion in 2015. Thus, the Corporationwould not have been able to meet its obligations in 2015 as they reported morecurrent liabilities than current assets. The Corporation reported a trade receivabledays position of 51 days implying that management is employing efforts to collectresources from their creditors. The debt-to-equity position, however, remainedhigh at 86 in December 2015, meaning that a large proportion of the Corporationis consumed in debt. Furthermore, the current ratio remained at undesirable levelsaveraging 1:0.5, implying that the corporation’s ability to meet its short termobligations was still very weak.
Table 17.13 shows the financial performance of the Corporation as at 31December 2015.
160

TABLE 17.13: SELECTED PERFORMANCE STATISTICS FOR ADMARC
2015/16 2014/15 2013/14 2012/13 2011/12
(half year) (Audited) (Audited) (Audited) (Audited)
Performance targets K’000 K’000 K’000 K’000 K’000
Total revenue 9,555,009 11,168,955 10,986,251 9,127,835 2,035,857
Change in revenue (0.14) 0.02 0.20 3.48 2.61
Total expenditure 10,469,309 11,045,893 10,758,542 4,025,025 2,951,605
Change in expenditures (0.05) 0.03 1.67 0.36 6.63
Profit after Tax (914,300) (169,417) 227,709 5,102,810 (915,748)
Change in surplus/loss (3.07) (0.46) (0.96) 6.57 0
Net Current Assets (5,413,315) (3,312,703) (2,588,708) (8,742,050) (7,227,501)
Current liabilities 10,243,281 8,720,483 3,475,589 3,959,723
Current ratio 0.5 0.6 0.4 0.2 0.2
Debt/Equity, % 86 77 36 118
Trade receivable days 51 23 33 162
Source: Agriculture Development and Marketing Corporation (ADMARC)
17.7 Pharmacy, Medicines and Poisons Board (PMPB)
Pharmacy, Medicines and Poisons Board’s (PMPB) performance was generallygood during the audit period. Revenue grew by 46 percent in 2015 and this wasmainly attributed to a 131 percent increase in registration fees and a 78 percentincrease in grant income particularly from National Aids Commission (NAC).This exceptional increase in income combines with a mere 20 percent growth inexpenditure leading to an increase in profits by 181 percent.
However, PMPB’s current ratio is at 1:4.8 due to the existence of too much cashand cash equivalents mainly in the Board’s foreign currency denominated accountamounting to MK318 million. The Board has maintained a low debt-to-equityposition over the years and it further lowered it to 17 percent in 2015. Theinstitution took an average of 56 days to collect outstanding customer invoices in2015.
At mid-year of 2015/16 financial year, PMPB reported a surplus of MK84million. Thus, going forward, the institution anticipates continued positiveperformance. However, the assessment of mid-year performance reveals that thefinancial performance for 2015/16 might slightly decline from the positionreported in 2014/15.
Table 17.14 shows the financial performance of the Board as at 31st December2015.
161
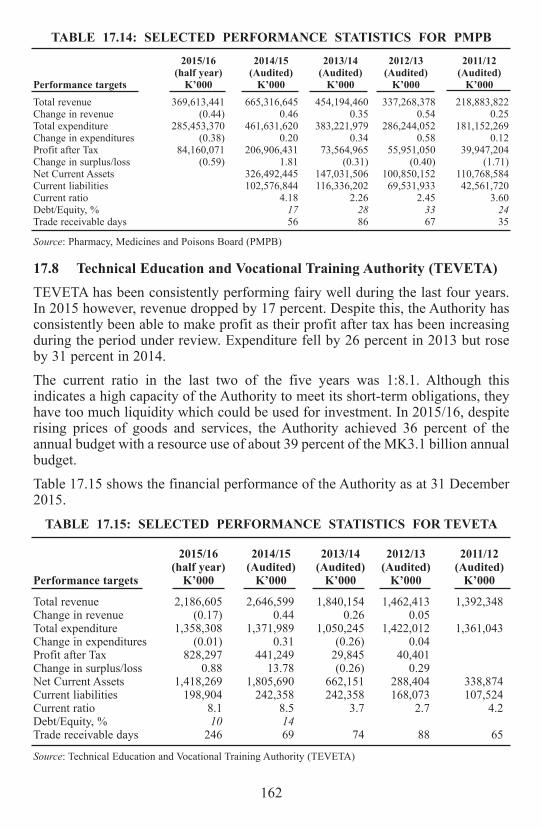
TABLE 17.14: SELECTED PERFORMANCE STATISTICS FOR PMPB
2015/16 2014/15 2013/14 2012/13 2011/12(half year) (Audited) (Audited) (Audited) (Audited)
Performance targets K’000 K’000 K’000 K’000 K’000
Total revenue 369,613,441 665,316,645 454,194,460 337,268,378 218,883,822Change in revenue (0.44) 0.46 0.35 0.54 0.25Total expenditure 285,453,370 461,631,620 383,221,979 286,244,052 181,152,269Change in expenditures (0.38) 0.20 0.34 0.58 0.12Profit after Tax 84,160,071 206,906,431 73,564,965 55,951,050 39,947,204Change in surplus/loss (0.59) 1.81 (0.31) (0.40) (1.71)Net Current Assets 326,492,445 147,031,506 100,850,152 110,768,584Current liabilities 102,576,844 116,336,202 69,531,933 42,561,720Current ratio 4.18 2.26 2.45 3.60Debt/Equity, % 17 28 33 24
Trade receivable days 56 86 67 35
Source: Pharmacy, Medicines and Poisons Board (PMPB)
17.8 Technical Education and Vocational Training Authority (TEVETA)
TEVETA has been consistently performing fairy well during the last four years.In 2015 however, revenue dropped by 17 percent. Despite this, the Authority hasconsistently been able to make profit as their profit after tax has been increasingduring the period under review. Expenditure fell by 26 percent in 2013 but roseby 31 percent in 2014.
The current ratio in the last two of the five years was 1:8.1. Although thisindicates a high capacity of the Authority to meet its short-term obligations, theyhave too much liquidity which could be used for investment. In 2015/16, despiterising prices of goods and services, the Authority achieved 36 percent of theannual budget with a resource use of about 39 percent of the MK3.1 billion annualbudget.
Table 17.15 shows the financial performance of the Authority as at 31 December2015.
TABLE 17.15: SELECTED PERFORMANCE STATISTICS FOR TEVETA
2015/16 2014/15 2013/14 2012/13 2011/12(half year) (Audited) (Audited) (Audited) (Audited)
Performance targets K’000 K’000 K’000 K’000 K’000
Total revenue 2,186,605 2,646,599 1,840,154 1,462,413 1,392,348Change in revenue (0.17) 0.44 0.26 0.05Total expenditure 1,358,308 1,371,989 1,050,245 1,422,012 1,361,043Change in expenditures (0.01) 0.31 (0.26) 0.04Profit after Tax 828,297 441,249 29,845 40,401Change in surplus/loss 0.88 13.78 (0.26) 0.29Net Current Assets 1,418,269 1,805,690 662,151 288,404 338,874Current liabilities 198,904 242,358 242,358 168,073 107,524Current ratio 8.1 8.5 3.7 2.7 4.2Debt/Equity, % 10 14
Trade receivable days 246 69 74 88 65
Source: Technical Education and Vocational Training Authority (TEVETA)
162

Chapter 18
BANKING AND FINANCE
18.1 Overview
The objectives of monetary policy in the 2015/16 fiscal year was to achieve andmaintain stability in the general price level in the economy and to build foreignexchange reserves to a minimum of 3 months import cover. To meet theseobjectives, the bank used a variety of instruments that included the policy rate, theLiquidity Reserve Ratio (LRR), open market operations (OMO) andcommunication.
Despite the tight monetary policy stance during the first half of the 2015/16 fiscalyear, growth in broad money supply, M2, accelerated to 23.7 percent in December2015 from 13.8 percent recorded at the end of 2014/15 fiscal year. In line with thisdevelopment, headline inflation picked up to 24.9 percent in December 2015 from21.3 percent in June 2015. Two other factors were also behind this development.Firstly, following the floods and sporadic drought conditions experienced in2014/15 agricultural season and the resulting low supply of food, food prices roseremarkably. Secondly, the kwacha depreciated significantly in the first half of2015/16 fiscal year.
18.2 The Banking System
Broad money supply (M2) picked up strongly and recorded MK778.8 billion asat end-December 2015 from MK642.0 billion at the end of 2014/15 fiscal year.This mainly reflected a MK77.4 billion accumulation of foreign currencydenominated deposits. Net maturity of securities led to a growth of savingsdeposits during the first half of the 2014/15 fiscal year as reflected by a MK30.8billion accumulation of term (time and savings) deposits. Demand deposits alsoincreased by MK29.6 billion between June 2015 and December 2015.Meanwhile, currency in circulation declined by MK1.0 billion due to a slowdownin economic activity after the tobacco marketing season. On a year-on-year basis,the annual growth rate of broad money supply (M2) stood at 23.7 percent inDecember 2015 compared 13.8 percent in June 2015.
On the counterparts, the growth in M2 resulted from increases in both Net ForeignAssets (NFA) and Net Domestic Assets (NDA) of the banking system. In the firsthalf of the 2015/16 fiscal year, NFA and NDA grew by MK83.5 billion andMK53.2 billion to MK339.5 billion and MK439.3 billion, respectively, as at end-December 2015. However, in dollar terms, NFA shrunk in the first half of 2015/16fiscal year and stood at US$511.0 million from US$580.3 million. Therefore, thegrowth in NFA during the first half of the 2015/16 fiscal year was largely due torevaluation gains following the continued depreciation of the kwacha against thedollar. The kwacha traded at MK664.3650 in December 2015 compared toMK437.2315 in June 2015. NDA of the banking system increased by MK53.2billion between June and December 2015 and stood at MK439.3 billion at end-
163
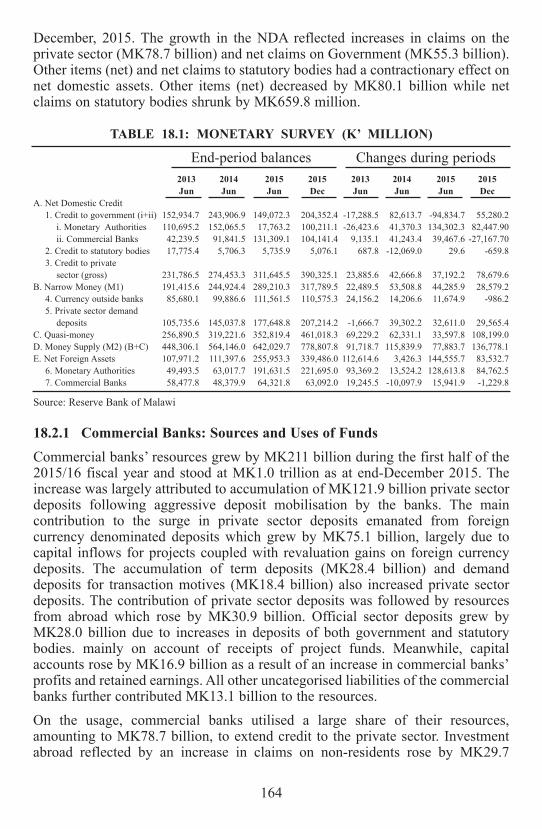
December, 2015. The growth in the NDA reflected increases in claims on theprivate sector (MK78.7 billion) and net claims on Government (MK55.3 billion).Other items (net) and net claims to statutory bodies had a contractionary effect onnet domestic assets. Other items (net) decreased by MK80.1 billion while netclaims on statutory bodies shrunk by MK659.8 million.
TABLE 18.1: MONETARY SURVEY (K’ MILLION)
End-period balances Changes during periods
2013 2014 2015 2015 2013 2014 2015 2015
Jun Jun Jun Dec Jun Jun Jun Dec
A. Net Domestic Credit
1. Credit to government (i+ii) 152,934.7 243,906.9 149,072.3 204,352.4 -17,288.5 82,613.7 -94,834.7 55,280.2
i. Monetary Authorities 110,695.2 152,065.5 17,763.2 100,211.1 -26,423.6 41,370.3 134,302.3 82,447.90
ii. Commercial Banks 42,239.5 91,841.5 131,309.1 104,141.4 9,135.1 41,243.4 39,467.6 -27,167.70
2. Credit to statutory bodies 17,775.4 5,706.3 5,735.9 5,076.1 687.8 -12,069.0 29.6 -659.8
3. Credit to private
sector (gross) 231,786.5 274,453.3 311,645.5 390,325.1 23,885.6 42,666.8 37,192.2 78,679.6
B. Narrow Money (M1) 191,415.6 244,924.4 289,210.3 317,789.5 22,489.5 53,508.8 44,285.9 28,579.2
4. Currency outside banks 85,680.1 99,886.6 111,561.5 110,575.3 24,156.2 14,206.6 11,674.9 -986.2
5. Private sector demand
deposits 105,735.6 145,037.8 177,648.8 207,214.2 -1,666.7 39,302.2 32,611.0 29,565.4
C. Quasi-money 256,890.5 319,221.6 352,819.4 461,018.3 69,229.2 62,331.1 33,597.8 108,199.0
D. Money Supply (M2) (B+C) 448,306.1 564,146.0 642,029.7 778,807.8 91,718.7 115,839.9 77,883.7 136,778.1
E. Net Foreign Assets 107,971.2 111,397.6 255,953.3 339,486.0 112,614.6 3,426.3 144,555.7 83,532.7
6. Monetary Authorities 49,493.5 63,017.7 191,631.5 221,695.0 93,369.2 13,524.2 128,613.8 84,762.5
7. Commercial Banks 58,477.8 48,379.9 64,321.8 63,092.0 19,245.5 -10,097.9 15,941.9 -1,229.8
Source: Reserve Bank of Malawi
18.2.1 Commercial Banks: Sources and Uses of Funds
Commercial banks’ resources grew by MK211 billion during the first half of the2015/16 fiscal year and stood at MK1.0 trillion as at end-December 2015. Theincrease was largely attributed to accumulation of MK121.9 billion private sectordeposits following aggressive deposit mobilisation by the banks. The maincontribution to the surge in private sector deposits emanated from foreigncurrency denominated deposits which grew by MK75.1 billion, largely due tocapital inflows for projects coupled with revaluation gains on foreign currencydeposits. The accumulation of term deposits (MK28.4 billion) and demanddeposits for transaction motives (MK18.4 billion) also increased private sectordeposits. The contribution of private sector deposits was followed by resourcesfrom abroad which rose by MK30.9 billion. Official sector deposits grew byMK28.0 billion due to increases in deposits of both government and statutorybodies. mainly on account of receipts of project funds. Meanwhile, capitalaccounts rose by MK16.9 billion as a result of an increase in commercial banks’profits and retained earnings. All other uncategorised liabilities of the commercialbanks further contributed MK13.1 billion to the resources.
On the usage, commercial banks utilised a large share of their resources,amounting to MK78.7 billion, to extend credit to the private sector. Investmentabroad reflected by an increase in claims on non-residents rose by MK29.7
164
billion. Meanwhile, commercial banks reduced their net claims on centralgovernment and statutory bodies by MK14.9 billion and MK659.8 million,respectively. These developments mainly reflected redemption of Treasury billsand repayment of loans by the statutory bodies. Deposits at the Reserve Bank plustill money declined by MK2.3 billion largely due to a downward adjustment ofthe LRR in August 2015.
18.2.2 Reserve Bank: Sources and Uses of Funds
During the first half of 2015/16 fiscal year, the resources for RBM increased byMK292.4 billion to MK796.3 billion as at end-December 2015 from MK503.9billion at the end of 2014/15 fiscal year. The major source of funds for the centralbank during the period was unsectored liabilities which increased by MK194.3billion to MK185.7 billion as at end-December 2015, on account of open marketoperations. This was complemented by official sector deposits which grew byMK55.4 billion due to receipts of project funds and on account of revaluationgains following depreciation of the local unit. These developments were,however, partly offset by the declines in commercial banks deposits plus tillmoney and currency in circulation.
The Reserve Bank of Malawi used a bulk of the resources in extending Ways andMeans advances to Central Government and investing abroad. During the period,a total of MK137.8 billion was extended to Government to support its fiscaloperations and to redeem maturing securities. Investments abroad increased byMK134.3 billion mainly due to purchases from the market, receipt of projectfunds and on account of revaluation gains. Unsectored assets of the RBM alsoincreased by MK26.1 billion between July 2015 and December 2015. Thesedevelopments were partly counteracted by a MK5.9 billion reduction in netclaims on the commercial banks following maturity of Reverse RepurchaseAgreements (REPOs).
165

Chapter 19
PUBLIC FINANCE
19.1 Introduction
This chapter presents the performance of central government budgetary
operations during the 2015/16 fiscal year compared with the 2014/15 fiscal year.
Furthermore the section presents the medium term framework for the next two
fiscal years thus 2016/17 to 2017/18 fiscal years. The structure of the chapter is
as follows: section two provides the summary of central government budgetary
operations followed by discussion on performance of total revenues and grants in
section 3. The fourth and fifth sections present the performance of central
government recurrent expenditures and development expenditures respectively.
Finally the chapter ends with highlights of the 2016/17 budget in section six and
major implementation challenges of the 2016/17 budget in section seven.
19.2 Summary of Central Government Budgetary Operations
The 2015/16 budget was formulated against the theme of rebuilding fiscal
discipline as a foundation for restoration of macroeconomic stability for poverty
reduction. The aim was to ensure lower inflation, lower interest rates, stable
exchange rate and inducing inclusive growth. The 2015/16 budget considered
priorities in the Malawi Growth and Development Strategy II, revenue policy
reforms and policy interventions which government implemented to address the
social and macroeconomic imbalances that were prevailing in the country. With
regard to the macroeconomic outlook, the budget considered prospects in the
global, regional and domestic economy. At the global level, real output growth
was projected at 3.5 percent and 3.8 percent in 2015 and 2016 respectively.
Stagnation and prolonged deflation which ultimately result in persistent weak
global trade growth were still major concerns in advanced economies such as
Japan and the Euro area, hence the slowdown in the expected growth forecast.
The 2015/16 FY also considered development in the sub-Saharan region where
growth was projected to remain robust at 4.5 percent and 5.1 percent in 2015 and
2016 respectively due to continued investment in infrastructure and increase in
agricultural production. The Malawi economy on the other hand was projected to
decline to 3.1 percent in 2015 due to the setbacks such as recent floods and dry
spells that exterted pressure on growth prospects.
However, just like the 2014/15 FY budget the 2015/16 FY framework was
designed in such a way that all recurrent expenditures are financed by domestic
resources amidst uncertainty of budgetary support by development partners. The
macroeconomic assumption upon which the budget was formulated included an
annual average inflation of 16.4 percent and real GDP growth rate of 5.4 percent
166
coupled with a nominal GDP growth of 22.8 percent. These assumptions were key
to a stable macroeconomy and consequently growth of the economy. The nominal
anchors of the 2015/16 FY budget remained a reduction of accumulation of
arrears and reduction of net domestic borrowing to 0.7 percent of GDP.
The 2015/16 budget operated under the assumption of zero budgetary support
from development partners. Government’s focus was therefore on raising
sufficient domestic revenues to finance the budget. Furthermore austerity
measures were implemented extensively to ensure that expenditures are within
the budget framework. The Malawi Revenue Authority stepped up its efforts to
strengthen revenue collections and this included enforcement of compliance rules
and of use of electronic fiscal devices. In addition Government financially
supported revenue collecting departments such as Department of Immigration,
Malawi Police and Road Traffic Directorate to carry out their functions
effectively.
Despite diminishing domestic resources during the 2015/16 fiscal year,
Government continued its commitment in increasing spending to social sectors as
Health, Education, Agriculture and Social Protection Programmes. For instance
allocations to the Farm Input Subsidy Programme (FISP), Cement and Iron sheets
subsidy and social cash transfers to the vulnerable were implemented as budgeted.
The implementation of the 2015/16 FY budget faced a number of challenges. The
sharp depreciation of the exchange rate towards the end of the first half increased
the cost of the FISP contracts as well as importation of essential commodities
such as drugs and fuel. The dry spell and drought experienced during the year
resulted in heightened fiscal pressures due to the increased need for humanitarian
food response. This was aggravated by the aftermath of the food shortage from
the 2014/15 FY due to the floods and drought experienced during the fiscal year.
Nevertheless amid the challenges, Government received drought support from the
European Union, World Bank and other cooperating partners.
During 2015/16 FY total expenditures and net lending marginally declined to
25.8 percent of GDP from 27.7 percent of GDP in 2014/15 FY. This expenditure
outturn was against a resource envelope (including grants) of 22.1 percent of
GDP. The decline in total expenditure and net lending was mainly on account of
recurrent expenditure which declined as a result of a reduced domestic resource
envelope. Domestic revenues reduced from 19.0 percent of GDP to 18.4 percent
of GDP as a result of poor performance in revenue collecting departments and a
slowdown in taxes on goods and services due to the slowdown in the economy
during the year. This was worsened by lack of adequate budgetary support during
the year. On the contrary total grants increased from 2.8 percent of GDP in
2014/15 FY to 3.6 percent of in 2015/16 FY. However, over 70 percent of these
grants were direct project grants and sector specific dedicated grants thereby
167

leaving little room for government discretion to allocate resources to other critical
sectors. Overall, fiscal deficit in 2015/16 significantly declined to 3.8 percent of
GDP from 5.8 percent in 2014/15 FY and was largely financed by domestic
borrowing amounting to 0.7 percent of GDP. The reduced fiscal deficit was a
result of the expenditure control measures implemented by Government during
the Year.
Going forward into 2016/17 fiscal year, total expenditure and net lending is
estimated at 26.7 percent of GDP which is a marginal increase from the 25.8
percent of GDP in 2015/16. The increase in total expenditure is expected in order
to address the current food crisis by financing maize purchases on the domestic
market and through imports, countering the effects of climate change, and
enhancing rural incomes to enable people to purchase food. In addition, in
2016/17 FY government is committed to increasing capital expenditure to
enhance the productive capacity of the economy. This includes allocating more
resources towards the transformation of the Greenbelt Initiative into a full
Authority to manage the country’s large-scale irrigation projects. It is on account
of these initiatives that the fiscal deficit is projected to marginally increase to 3.9
percent of GDP from 3.8 percent in 2015/16 FY. Government will continue to
implement expenditure control measures and revenue enhancing measures to
ensure that the budget is implemented within the estimated resource envelope.
Furthermore, in its pursuit of the macroeconomic stability objective Government
will ensure that domestic borrowing does not exceed the acceptable norm of 1.5
percent of GDP. Table 19.1 gives a summary of Central Government budgetary
operations.
19.3 Total Revenues and Grants
Table 19.1 below shows that as a share of GDP, total revenues and grantsincreased from 21.8 percent in 2014/15 FY to 22.1 percent in 2015/16 FY and thiswas mainly on account of grants which slightly improved from 2.8 percent ofGDP to 3.7 percent of GDP. The outturn on grants was on account of direct projectsupport and sector dedicated grants. Nevertheless, many development partnersdid not commit any budget support grants except African Development Bankwhich disbursed K17.9 billion following progress by government in PublicFinance Management reforms. Nevertheless, with the recent extension of the IMFECF supported programme Government expects more budget support in 2016/17FY. However, the 2016/17 FY budget has been designed on the assumption of nobudget support. On the other hand, domestic revenues slightly declined from 19.0 percent of GDP in 2014/15 FY to 18.4 percent of GDP in 2015/16 FY despiteremarkable performance on taxes in income and profits. The dismal performancewas on account of low collections in taxes on goods and services due to the slowdown in the economy during the year. Low collections from revenue collectinggovernment departments also contributed to the low outturn of domesticrevenues.
168

TABLE 19.1: CENTRAL GOVERNMENT BUDGETARY OPERATIONS2014/15-2017/18
2014/15 2015/16 2015/16 2016/17 2017/18Outturn Approved Revised Estimate Projection
Total Revenue and Grants 609,580.4 763,480.0 784,839.5 965,226.6 998,353.5
Domestic Revenue 530,188.8 666,348.0 653,948.8 774,790.4 907,889.1
Grants 79,391.6 97,132.0 130,890.6 190,436.2 90,464.4
Total Expenditure and Net
Lending including MAREP 771,856.8 931,274.0 924,540.0 1,139,920.9 1,126,680.6
Total Expenditure and Net
Lending 771,856.8 925,490.0 918,730.0 1,139,920.9 1,126,680.6
Total Expenditure 771,856.8 923,990.0 917,230.0 1,136,420.9 1,123,680.6
Recurrent Expenditure 620,237.9 699,852.6 693,048.8 819,040.7 837,537.0
Development Expenditure 151,619.0 224,137.4 224,181.2 317,380.2 286,143.6
MAREP 5,784.1 5,810.0
Net Lending 1,500.0 1,500.0 3,500.0 3,000.0
Deficit
Excluding Grants 1a (242,435) (264,926.0) (264,781.2) (365,130.5 (218,791.6)
Including Grants 1b (163,043.0) (166,294.0) (138,200.5) (171,194.3) (128,327.1)
Financing 163,043.0 166,294.0 138,200.5 171,194.3 128,327.1
Foreign Borrowing (Net) 69,995.6 113,113.0 102,198.9 111,194.3 94,004.7
Borrowing 81,532.6 130,810.0 124,303.9 136,715.3 120,000.0
Repayment 2a (11,537.4) (17,697.0) (22,105.0) (25,521.0) (25,995.3)
Domestic Borrowing (Net) 2b 94,297.3 53,181.0 25,001.6 60,000.0 34,322.4
Privatisation proceeds 11,000.0
(Percentage of GDP)
Revenue (Including Grants) 21.9 21.5 22.1 22.2 20.7
Revenue (Excluding Grant) 19.0 18.8 18.4 17.8 18.8
Grants 2.8 2.7 3.7 4.4 1.9
Total Expenditure and Net Lending 27.7 26.1 25.9 26.2 23.4
Recurrent Expenditure 22.3 19.7 19.5 18.8 17.4
Development Expenditure 5.4 6.3 6.3 7.3 5.9
Deficit (Excluding Grants) (8.7) (7.5) (7.5) (8.4) (4.5)
Deficit (Including Grants) (5.8) (4.7) (3.9) (3.9) (2.7)
Domestic Borrowing (Net) 3.4 1.5 0.7 1.4 0.7
GDP at Current Prices (FY) 2,786,115.8 3,551,562.9 3,551,562.9 4,356,272.9 4,816,797.7
19.3.1 Domestic Revenues
Table 19.2 indicates that the performance of domestic revenues particularly taxeson goods and services mirrored the overall slowdown of the economy during theyear. Overall taxes on goods and services marginally reduced from 6.8 percent in2014/15 FY to 6.7 percent in 2015/16 FY. A marginal performance in taxes ongoods and services particulary Value added Taxes (VAT) was on account of non-compliance of some operators of Electronic Fiscal Devices that wereimplemented by the Malawi Revenue Authority (MRA) during the year.
Similary, Taxes on international trade declined from 1.6 percent of GDP in2014/15 FY to 1.5 percent of GDP in 2015/16 FY and this was on account of adecline in volumes of taxable imports.
169
Nevertheless, taxes on income and profits continued to register an increase in
2015/16 FY from the previous year with an increase from 8.5 percent of GDP to
8.7 percent of GDP. This mirrored better performance in other economic activities
following the continued availability of foreign exchange and fuel as well as salary
increments in both the public sector and private sector.
On the other hand, non-tax revenues marginally declined to 2.02 percent of GDP
in 2015/16 FY from 2.4 percent of GDP in 2014/15 FY. The dismal perfomance
in non-tax revenues was on account of low collections under departmental
receipts and parastatal dividends.
Going forward, economic growth is expected to rebound to 5.1 percent in 2016/17
FY from 3.1 percent in 2015/16 FY as macroeconomic fundamentals become
relatively stable. Consequently, domestic revenue collections are expected to
remain relatively stable over the period due to the rebound in economic activities
such as agriculture, manufacturing, electricity gas and water supply, information
and communications. Total tax revenues are expected to stabilise at 16.3 percent
of GDP in 2016/17 FY and this is on account of increases in taxes on income and
profits which are estimated to increase from 8.6 percent in 2015/16 FY to 9.1
percent in 2016/17 FY. In addition, with regards to taxes on goods and services it
is envisaged that going forward the loss incurred during the 2016/17 FY due to
non-compliance will be offset by an expected rise of the VAT which will be
enhanced by penalties charged on non-compliant operators.
170

TABLE 19.2: CENTRAL GOVERNMENT REVENUE 2014/15-2017/18 FY
2014/15 2015/16 2015/16 2016/17 2017/18Outturn Approved Revised Estimate Projection
A. GROSS TAX REVENUE 472,525.6 604,287.0 595,501.8 719,471.5 851,194.61. TAXES ON INCOME & PROFITS 236,906.9 312,413.5 307,474.9 397,509.5 460,064.3
Companies 57,909.3 76,640.0 76,640.0 99,713.4 115,468.1Individuals 136,301.9 176,907.1 176,907.1 226,424.6 62,199.7
Non Resident Tax 4,585.0 6,971.5 6,971.5 8,529.4 9,877.0P.A.Y.E 126,367.1 163,294.5 163,294.5 209,770.8 242,914.6Fringe Benefit Tax 5,349.8 6,641.1 6,641.1 8,124.4 9,408.1
Withholding Tax 39,143.0 49,958.6 49,958.6 66,550.5 77,065.5Other* 3,552.7 8,907.8 3,969.1 4,821.0 5,331.0
2. TAXES ON GOODS & SERVICES 188,943.4 236,796.3 232,870.7 263,746.6 318,349.4VAT 147,156.7 181,620.5 181,620.5 206,360.1 248,817.5Excise Duties 41,786.7 55,175.8 51,250.2 57,386.4 69,531.9
3. INTERNATIONAL TRADE TAXES 46,675.4 55,077.2 55,156.2 58,215.5 72,781.0Customs Duties 46,121.3 54,519.2 55,156.2 58,215.5 72,781.0
Import Duties 46,121.3 54,519.2 54,519.2 57,543.2 71,940.4Miscellaneous Duties 554.1 558.0 637.0 672.3 840.5
4. Less: TOTAL TAX REFUNDS 9,618.0 11,873.0 13,424.8 10,635.0 12,767.95. NET TAX REVENUE 462,907.6 592,414.0 582,077.0 708,836.5 838,426.7
B. NON TAX REVENUE 67,281.2 73,934.0 71,871.8 65,953.9 69,462.4Departmental Receipts 11,396.6 15,174.5 15,174.5 18,053.5 20,906.0Other Revenue (dividends etc) 32,815.2 20,623.6 18,561.5 23,240.3 20,000.0Receipts from PIL 13,148.3 22,973.8 22,973.8 23,285.1 26,964.2Rural electrification levy 8,680.9 13,459.2 13,459.2 - -Storage levy 1,240.2 1,702.8 1,702.8 1,375.0 1,592.3GROSS DOMESTIC REVENUE 539,806.8 678,221.0 667,373.6 785,425.4 920,657.0NET DOMESTIC REVENUE 530,188.8 666,348.0 653,948.8 774,790.4 907,889.1
Percentage of GDP
GROSS TAX REVENUE 17.0 17.0 16.8 16.5 17.7Taxes on Income and Profit 8.5 8.8 8.7 9.1 9.6Taxes on Goods and Services 6.8 6.7 6.6 6.1 6.6International Trade Taxes 1.7 1.6 1.6 1.3 1.5NET TAX REVENUE 16.6 16.7 16.4 16.3 17.4NON-TAX REVENUE 2.4 2.1 2.0 1.5 1.4GRAND TOTAL 19.4 19.1 18.8 18.0 19.1
GDP at Current Market Prices (FY) 2,786,115.8 3,551,562.9 3,551,562.9 4,356,272.9 4,816,797.7
Source: Ministry of Finance
19.4 Central Government Recurrent Expenditures
Total recurrent expenditure as at end 2015/16 FY closed at K693.0 billion despite
a projected total recurrent expenditure of K699.8 billion implying that the
government was within the budget by K6.8 billion. The decline in recurrent
expenditure implied that as a percent of GDP, total recurrent expenditure closed
at 19.5 percent down from 22.2 percent in 2014/15 FY. The decline was on
account of public finance management reforms that government implemented
during the year. These included ensuring that MDAs are funded only when they
submit comprehensive monthly expenditure returns and bank reconciliations. In
addition, government implemented full operationalisation of the monthly cash
171

management function, which ensured that monthly funding is done based on
available resources. These measures were complemented by a number of
expenditure control measures such as reduction of government fully funded travel
and reduction of “ghost workers” through a recently concluded payroll headcount
audit that government implemented during the course of the year.
Going forward, total recurrent expenditure for 2016/17 FY is estimated at K819.0
billion representing 18 percent of GDP and is projected at K837.5 billion in
2017/18 representing 17.4 percent of GDP. Government’s policy stance in
2016/17 FY is that a large proportion of recurrent expenditure will be financed by
domestic resources hence most of the foreign resources will be directed to capital
expenditure.
Tables 19.3 and 19.4 present Functional and Economic classification of the
recurrent budget respectively.
TABLE 19.3: FUNCTIONAL CLASSIFICATION OF CENTRAL
GOVERNMENT RECURRENT EXPENDITURE
2014/15 2015/16 2015/16 2016/17 2017/18Outturn Approved Revised Estimate Projector
General Public Services 151,753.3 170,206.5 158,427.8 214,143.9 218,180.2General Administration 92,906.5 109,927.1 97,961.8 146,316.0 159,431.9Defence Affairs 19,170.7 18,798.7 20,133.1 21,556.0 21,051.4Public Order and Safety Affairs 39,676.1 41,480.7 40,333.0 46,271.9 37,696.9
Social and Community Services 230,769.5 288,513.9 292,530.2 335,049.6 336,781.2Education Affairs and Services 119,462.1 154,392.5 152,085.3 169,361.4 175,396.6Health Affairs and Services 44,259.8 73,043.2 78,456.0 90,999.8 84,231.6Social Security and Welfare Affairs Services(social protection) 53,168.1 46,871.8 46,030.6 53,816.7 56,451.5
Housing and Community Amenity Services 12,200.0 11,573.8 14,108.4 18,315.4 18,100.6
Recreational,Tourism, Cultural & Other Social Services 1,679.5 2,632.5 1,849.8 2,556.4 2,601.0
Economic Services 237,715.1 241,132.2 242,090.8 269,847.0 282,575.5Mining and Manufacturing and
environmental protection 5,867.9 5,850.3 6,304.3 7,086.1 7,240.0Agriculture and Natural Resources 72,191.9 73,689.2 90,370.8 82,633.7 82,511.6Transport and communication Services 29,037.8 30,656.2 30,961.6 28,721.7 36,262.0General Economic, Commercial
and Labor Affairs 4,220.5 5,089.5 4,797.9 7,616.4 7,777.1R & D Economic Affairs
and public debt 126,397.0 125,847.0 109,656.2 143,789.0 148,785.5Total Recurrent Expenditure 620,237.9 699,852.6 693,048.8 819,040.5 837,536.8
Percentage of GDP
GENERAL PUBLIC SERVICES 5.4 4.8 4.5 4.9 5.0SOCIAL AND COMMUNITY SERVICES 8.3 8.1 8.2 7.7 7.7ECONOMIC SERVICES 8.5 6.8 6.8 6.2 6.5TOTAL RECURRENT EXPENDITURE 22.3 19.7 19.5 18.8 19.2GDP at Current Market Prices (FY) 2,786,115.8 3,551,562.9 3,551,562.9 4,356,272.9 4,816,797.7
Source: Ministry of Finance
172

Table 19.3 above shows the different allocations of total recurrent expenditure
using functional classification. Social and community services continued to
benefit significantly as a large share of total recurrent expenditure followed by
economic services. Despite drawing down more resources from the total recurrent
expenditure social community services stagnated at 8.2 percent in 2015/16 FY
from the same level in 2014/15 FY and is expected to decline further to 7.6
percent of GDP in 2016/17 FY and 2017/18 FY. Despite the decline from 8.5
percent of GDP in 2014/15 FY to 6.8 percent of GDP in 2015/16 FY economic
services also continued to benefit from a fair share of the recurrent expenditure
compared to General Public services which only recorded 4.5 percent of GDP in
2015/16 FY a decline from 5.4 percent of GDP in 2014/15 FY. Recurrent
Expenditure towards general public services is expected to improve to 4.9 percent
of GDP in 2016/17 FY and 5.0 percent of GDP in 2017/18 FY.
These allocations are consistent with Government’s commitment in supporting
social and community services and economic services since they are priority areas
in the MGDS II. In the medium term, Government will continue to put much
focus on these services particularly Agriculture and Irrigation, Education, health,
transport and communication in order to achieve the country’s development
objectives and goals.
TABLE 19.4: ECONOMIC CLASSIFICATION OF CENTRALGOVERNMENT RECURRENT EXPENDITURE
2014/15 2015/16 2015/16 2016/17 2017/18Outurn Approved Revised Estimate Projection
Gross Consumption 354,772.0 415,679.0 405,802.5 503,014.0 547,101.6Compensation of Employees 196,930.1 228,690.0 222,275.3 264,652.0 285,309.3Use of Goods and Services 157,841.9 186,989.0 183,527.1 238,362.0 261,792.3Less: Fees, Sales and Recoveries 1.0 - -
Net Consumption 354,771.0 415,679.0 405,802.5 503,014.0 547,101.6Interest on Debt 114,947.5 125,497.0 118,074.4 147,018.3 108,974.3Pensions and Gratuities 30,980.7 43,148.0 42,145.0 50,155.0 52,663.2Grants, Subventions and Transfers 119,537.6 115,528.6 127,027.0 118,853.2 170,289.6
Local Authorities 25,704.0 16,535.6 9,003.0 29,613.2 61,764.9Public Bodies 36,292.3 50,493.0 47,095.0 47,340.0 49,123.7Private 57,541.3 48,500.0 70,929.0 41,900.0 59,401.0Abroad - -
Gross Fixed Capital Formation 620,236.8 699,852.6 693,048.8 819,040.5 879,028.7Loans and Capital Transfers - - -Total Recurrent Expenditures 620,236.8 699,852.6 693,048.8 819,040.5 879,028.7
As a Percentage of GDPGross Consumption 12.7 11.7 11.4 11.5 11.4Interest on Debt 4.1 3.5 3.3 3.4 2.3Pensions and Gratuities 1.1 1.2 1.2 1.2 1.1Grants, Subventions and Transfers 4.3 3.3 3.6 2.7 3.5Gross Fixed Capital Formation 22.3 19.7 19.5 18.8 18.2Total Recurrent Expenditures 22.3 19.7 19.5 18.8 18.2GDP at Current Market Prices (FY) 2,786,115.8 3,551,562.9 3,551,562.9 4,356,272.9 4,816,797.7
Source: Ministry of Finance
173

With regards to economic classification as shown in table 19.4 above, gross fixed
capital formation maintained the largest proportion of recurrent expenditures
despite a marginal decline from 22.3 as percentage of GDP in 2014/15 FY to 19.5
percent in 2015/16 FY and is expected to decline further to 18.8 percent of GDP
in 2016/17 FY and 18.2 percent of GDP in 2017/18 FY. Nevertheless, expenditure
towards gross consumption relatively declined from 12.7 percent of GDP in
2014/15 FY to 11.4 percent of GDP in 2015/16 FY and is expected to be
maintained at the same levels in 2016/17 FY and 2017/18 FY. This is in line with
government policy stance of supporting economic services which are among the
priority areas of MGDS II. The decline in gross consumption reflects government
commitments to boost growth through investment rather than consumption.
19.5 Development Expenditure
The functional and economic classification of development expenditures are
presented in Tables 19.5 and 19.6 respectively.
TABLE 19.5: FUNCTIONAL CLASSIFICATION OF CENTRAL
GOVERNMENT DEVELOPMENT EXPENDITURE 2014/15-2017/18 FY
2014/15 2015/16 2016/17 2016/17 2017/18Outturn Approved Revised Estimate Projection
General Public Services 33,800.8 50,452.8 66,691.0 63,133.2 31,407.9General Administration 30,015.8 46,805.8 63,044.0 60,483.8 24,841.8Defence Affairs 535.0 535.0 535.0 449.4 364.4Public Order and Safety Affairs 3,250.0 3,112.0 3,112.0 2,200.0 6,201.7
Social and Community Services 29,745.3 37,845.3 38,799.1 40,444.3 92,182.1Education Affairs and Services 11,120.3 10,120.3 10,732.2 22,295.0 57,187.1Health Affairs and Services 10,692.8 14,992.8 14,555.2 12,773.2 20,690.4Social Security and Welfare Affairs
Services (social protection) 1,244.6 1,144.6 1,144.6 260.0 75.0Housing and Community Amenity Services 1,145.0 6,145.0 5,815.0 4,225.0 13,753.7
Recreational, Cultural & Other Social Services 5,542.6 5,442.6 6,552.1 891.0 476.0
Economic Services 88,072.9 135,839.3 118,691.1 213,802.7 162,553.6Mining and Manufacturing and
enviromental protection - 26,428.3 26,428.3 12,843.6 11,630.7Agriculture and Natural Resources 51,621.5 65,042.6 50,436.8 117,827.9 54,975.2Tourism Affairs and Services - - - - -Transport and communication
Services 30,937.3 39,154.3 36,759.3 70,381.5 79,714.6General Economic, Commercial
and Labor Affairs 5,514.1 5,214.1 5,066.7 12,749.8 16,233.0R & D Economic Affairs and
public debt - - - - -Total Development Expenditure 151,619.0 224,137.4 224,181.2 317,380.2 286,143.6
Percentage of GDPGENERAL PUBLIC SERVICES 1.2 1.4 1.9 1.4 0.7SOCIAL AND COMMUNITY SERVICES 1.1 1.1 1.1 0.9 1.9ECONOMIC SERVICES 3.2 3.8 3.3 4.9 3.4TOTAL DEVELOPMENT EXPENDITURE 5.4 6.3 6.3 7.3 5.9GDP at Current Market Prices (FY) 2786115.8 3551562.9 3551562.9 4356272.9 4816797.7
Source: Ministry of Finance
174

Table 19.5 above of functional classification of development expenditures
suggests that with an increase from 3.1 percent of GDP in 2014/15 FY to 3.3
percent of GDP in 2015/16FY in expenditure under economic services the
2015/16 FY development budget continued to reflect a pro-growth fiscal policy
stance to ensure that government spurs economic growth through economically
productive sectors such as infrastructure development. The outturn reflected
Government’s commitment of resources towards economically productive sectors
as opposed to non-productive sectors. The productive sectors during the fiscal
year included Mining, Agriculture, Transport and communication in line with the
MGDS II prioritisation. Going forward, the resources towards economic services
are expected to increase further to 4.9 percent in 2016/17 FY against the same
fiscal policy stance. In particular, part of the resources will be channelled towards
the Greenbelt Initiative which will be transformed into a fully-fledged Authority
to manage the country’s large-scale irrigation projects for increased agricultural
productivity and sustainable economic growth. In addition, the Ministry of
Agriculture, Irrigation and Water Development will be funded adequately for
increased investments in improving the effectiveness and performance of small
holder irrigation projects. Furthermore, the increase is partly on account of funds
allocated for infrastructure projects on roads and Public Universities, schools and
colleges, namely University of Malawi, Malawi University of Science and
Technology, Lilongwe University of Agriculture and Natural Resources and
Mzuzu University as well as Construction of Technical colleges and Secondary
schools across the country.
However, the sustained lower levels of resources towards general public services
at less than 2 percent of GDP signalled government’s effort to implement fiscal
discipline to remain at sustainable levels of domestic borrowing consistent with
the ECF targets while at the same time responding to the diminishing external
resources from development partners. Going forward into 2016/17 FY the trend
is expected to be sustained as development expenditure on general public services
is estimated at 1.4 percent of GDP in 2015/16 FY and 0.6 percent of GDP in
2017/18 FY.
175
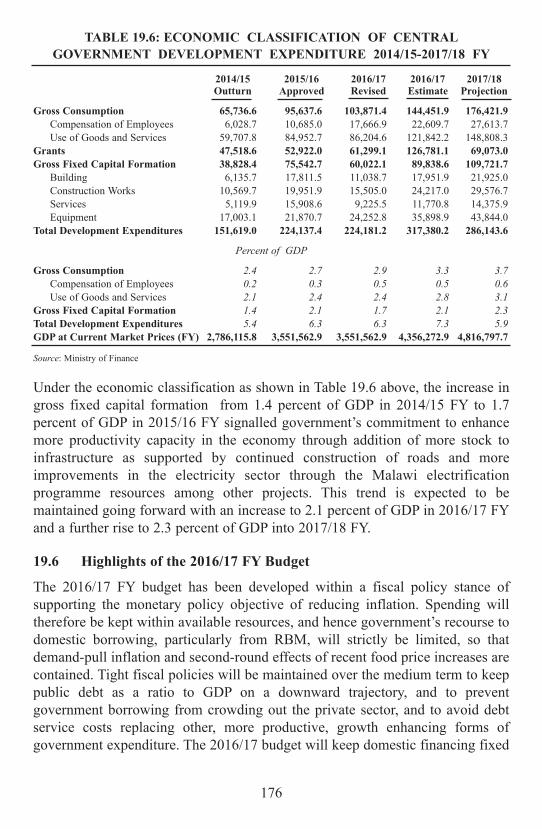
TABLE 19.6: ECONOMIC CLASSIFICATION OF CENTRAL
GOVERNMENT DEVELOPMENT EXPENDITURE 2014/15-2017/18 FY
2014/15 2015/16 2016/17 2016/17 2017/18Outturn Approved Revised Estimate Projection
Gross Consumption 65,736.6 95,637.6 103,871.4 144,451.9 176,421.9
Compensation of Employees 6,028.7 10,685.0 17,666.9 22,609.7 27,613.7
Use of Goods and Services 59,707.8 84,952.7 86,204.6 121,842.2 148,808.3
Grants 47,518.6 52,922.0 61,299.1 126,781.1 69,073.0
Gross Fixed Capital Formation 38,828.4 75,542.7 60,022.1 89,838.6 109,721.7
Building 6,135.7 17,811.5 11,038.7 17,951.9 21,925.0
Construction Works 10,569.7 19,951.9 15,505.0 24,217.0 29,576.7
Services 5,119.9 15,908.6 9,225.5 11,770.8 14,375.9
Equipment 17,003.1 21,870.7 24,252.8 35,898.9 43,844.0
Total Development Expenditures 151,619.0 224,137.4 224,181.2 317,380.2 286,143.6
Percent of GDP
Gross Consumption 2.4 2.7 2.9 3.3 3.7
Compensation of Employees 0.2 0.3 0.5 0.5 0.6
Use of Goods and Services 2.1 2.4 2.4 2.8 3.1
Gross Fixed Capital Formation 1.4 2.1 1.7 2.1 2.3
Total Development Expenditures 5.4 6.3 6.3 7.3 5.9
GDP at Current Market Prices (FY) 2,786,115.8 3,551,562.9 3,551,562.9 4,356,272.9 4,816,797.7
Source: Ministry of Finance
Under the economic classification as shown in Table 19.6 above, the increase in
gross fixed capital formation from 1.4 percent of GDP in 2014/15 FY to 1.7
percent of GDP in 2015/16 FY signalled government’s commitment to enhance
more productivity capacity in the economy through addition of more stock to
infrastructure as supported by continued construction of roads and more
improvements in the electricity sector through the Malawi electrification
programme resources among other projects. This trend is expected to be
maintained going forward with an increase to 2.1 percent of GDP in 2016/17 FY
and a further rise to 2.3 percent of GDP into 2017/18 FY.
19.6 Highlights of the 2016/17 FY Budget
The 2016/17 FY budget has been developed within a fiscal policy stance of
supporting the monetary policy objective of reducing inflation. Spending will
therefore be kept within available resources, and hence government’s recourse to
domestic borrowing, particularly from RBM, will strictly be limited, so that
demand-pull inflation and second-round effects of recent food price increases are
contained. Tight fiscal policies will be maintained over the medium term to keep
public debt as a ratio to GDP on a downward trajectory, and to prevent
government borrowing from crowding out the private sector, and to avoid debt
service costs replacing other, more productive, growth enhancing forms of
government expenditure. The 2016/17 budget will keep domestic financing fixed
176
in nominal terms at MKW 60 billion or 1.5 percent of GDP which is the same
share of GDP as in 2015/16 FY.
Over and above the economic objectives the 2016/17 FY budget is also set to
address the current food crisis by financing maize purchases on the domestic
market and through imports, countering the effects of climate change, and
enhancing rural incomes to enable people to purchase food.
On the resource side, Government will continue to prioritise revenue mobilization
in the wake of increased uncertainty regarding budget support as donors are
increasingly gravitating towards other forms of assistance. Government will
therefore develop more reliable forms of resource mobilisation, specifically by
improving the efficiency of tax administration and through tax policy changes
aimed at generating additional revenue. In particular, Government has developed
a Dividend and Surplus Policy to enhance financial management in statutory
bodies and facilitate remittances.
In addition, Government is committed to implement broad based tax reforms
starting from the 2016/17 Fiscal Year with the aim of creating a simple, efficient,
transparent and fair tax system. To this effect, Government will streamline tax
incentives, eliminating unproductive tax measures and concentrating all revenue
provisions in tax legislation. The tax policy initiatives will be guided by a shift in
reliance on revenue from taxation of labour and investment (factors of
production) to consumption. That is, shifting the relative burden from income
taxes to consumption taxes, primarily the value added tax (VAT), to spur
economic development.
The 2016/17 budget will continue the process of fiscal and debt consolidation.
With regard to wage policy the budget will provide for annual wage creep as well
as recruitment of frontline staff mainly in the Ministries of Education, Health and
Natural Resources among others. A general increase of the wage bill at a rate
lower than inflation will be implemented. The wage bill will be restricted to
7 percent of GDP. In terms of FISP, the reforms implemented in the 2015/16
growing season are currently under review in light of the lessons learnt during the
pilot phase. It is expected that findings from the pilot phase will inform program
implementation in the 2016/17 financial year. Furthermore, the Government will
continue with austerity measures on the expenditure side and the aforementioned
domestic revenue enhancing measures to ensure that the end of the 2016/17 FY
domestic borrowing target of 1.5 percent of GDP is met while complementing the
monetary policy objective of price stability.
177

19.7 Major Implementation Challenges of the 2016/17 FY Budget
Short-term risks are expected as the looming food crisis approaches—aggravated
by the El Niño weather phenomenon—and this is expected to weigh on the
2016/17 FY budget. The current estimation of the food gap suggests a substantial
financing requirement which the 2016/17 FY domestic resource envelope alone
cannot contain. In the event of the expected severe deterioration in the
humanitarian outlook due to the external weather conditions, there will therefore
be a need for additional financing from cooperating partners to create more fiscal
space for channelling domestic resources to productive sectors of the economy.
The 2016/17 FY budget also continues to face the challenge of uncertainty
surrounding full resumption of budget support from the country’s development
partners. In this regard, the 2016/17 budget will rely more on domestically
generated revenues as was largely the case with the 2015/16 FY budget with more
risk of high domestic financing if some development partners will not disburse as
pledged. This may result in high domestic debt service costs which may
potentially pose a risk to the successful implementation of the fiscal programme
and also crowd out private sector development as interest rates continue to rise.
Lastly, if tobacco prices on the auction floors will continue to be low this may
pose challenges with possible negative effects on incomes which may result in
reduced tax revenue collections.
178