Testability Transformation - Program Transformation to Improve Testability
Upload
khangminh22Category
view
3download
0
i
A Structured Approach to Transformation Modelling of Natural Hazards
by
Wayne Hart: BE (Hons), MBA
Thesis submitted to the
University of Canberra
Australian Capital Territory
Australia
In fulfilment of the requirements for the degree of
Doctor of Philosophy in Applied Economics
9 May 2019

ii
ANZSRC Field of Research (FOR) Code
The Australian and New Zealand Standard Research Classification (ANZSRC) is jointly
produced by the Australian Bureau of Statistics and Statistics New Zealand.
The Fields of Research (FOR) code for this project is:
Division 14 Economics
Group 1402 Applied Economics
Field 140205 Environment and Resource Economics
Reference for this work
Hart, W. (2019) A structured approach to transformation modelling of natural hazards,
Doctoral Thesis, University of Canberra Library, University of Canberra, Australia, 9 May
2019, pp 1-339

iii
Statement of Originality
Except where clearly acknowledged in footnotes, quotations and the bibliography, I certify
that I am the sole author of this thesis. I further certify that to the best of my knowledge the
thesis contains no material previously published or written by another person, nor has been
the basis of an award of any other degree or diploma except where due reference is made in
the text of the thesis. The thesis complies with University requirements for a thesis as set out
in the Examination of Higher Degree by Research Theses Policy.
Signature of Candidate
Signature of Chair of Supervisory Panel
Date 20/8/2018
Statement of Copyright in Relation to this Thesis
Under Section 35 of the Copyright Act of 1968, the author of this thesis is the owner of any
copyright subsisting in the work, even though it is unpublished.
Under section 31(I)(a)(i), copyright includes the exclusive right to 'reproduce the work in a
material form'. This copyright is infringed by a person who, not being the owner of the
copyright, reproduces or authorises the reproduction of the work, or of more than a
reasonable part of the work, in a material form, unless the reproduction is a 'fair dealing with
the work 'for the purpose of research or study' as further defined in S.40 and S.41 of the Act.
This thesis must therefore be copied or used only under the normal conditions of scholarly
fair dealing for the purposes of research, criticism or review, as outlined in the provisions of
the Copyright Act 1968. In particular, no results or conclusions should be extracted from it,
nor should it be copied or closely paraphrased in whole or in part without the written consent
of the author. Proper written acknowledgement should be made for any assistance obtained
from this thesis.
Copies of the thesis may be made by a library on behalf of another person provided the
officer in charge of the library is satisfied that the copy is being made for the purposes of
research or study.

iv

v
Acknowledgements
I am pleased to acknowledge the support of many people who have made the completion of
this work possible. It is useful to note that this project began with a very broad concept and a
long period of exploration of the effectiveness of quantitative risk analysis systems in the
natural environment, what weaknesses there were, what solutions might be possible, and how
the solutions might be further improved. This involved countless conversations with people,
groups and communities too numerous to individually acknowledge. Nevertheless, I thank
them all.
Primarily I would like to acknowledge the knowledge and guidance of my University of
Canberra supervisory team led by Professor Rob Tanton and supported by Professor Ken
McQueen, and the Institute for Governance and Policy Analysis. Our journey in guiding an
innovative, multi-disciplinary thesis through a labyrinth of mixed research and disciplinary
approaches was challenging, but with perseverance and Rob’s continuing support, I am well
pleased with the result.
I am also indebted to Professor Jason Ingham and Mr Kevin Walsh from the University of
Auckland for providing guidance on spatial interpretation of the Canterbury Earthquake
Sequence built environment data.
I very much valued my discussions with Professor Steven Cox of the Australian National
University, Mr Kevin McCue of Canberra, and Mr Ken Sharp of Cooma on Snowy
Mountains’ and Newcastle seismicity.
Many thanks are due to Geoscience Australia and the Institute of Geological and Nuclear
Sciences Ltd (GNS Science) in New Zealand for their exceptional support of seismic studies
generally and most especially though their extensive and highly accessible online databases
of seismic event data that so strongly encourages and supports seismic research.
I would also like to thank the many support and academic staff throughout the University of
Canberra who understand the needs and challenges of the Higher Degree by Research (HDR)
journey and consistently go out of their way to assist the many individual PhD candidates
along the way.
Finally, I acknowledge the long-standing support of my wife Glynis for everything else.

vi
Prologue: Three new Axioms of Real Things and Models
This thesis is about real things (e.g.: natural hazards and disasters), and how they are often
initially modelled only with representation models of the collected data (e.g.: with images,
data, graphs and narratives). The thesis shows how, when the original model is transformed
into new forms (e.g. formulas, dimensionless ratios, and metaphors), new understandings are
revealed about its behaviour (e.g. reservoir induced seismicity, seismic energy attenuation,
and montane people behaviours).
This thesis will present new approaches to real things, models, representation and
transformation, beginning with three new axioms describing models.
1: Axiom of Real Things
All real things are unique
Comment: real things are unique manifestations of matter, energy and information. They
may include, for example: people, mountains, electrical systems, books, discoveries,
earthquakes, symphonies, planets and stars, measurements, fires, floods and footballs.
2: Axiom of Representation Models
Models represent real things
Comment 1: models represent the appearance, behaviour, or properties of real things
Comment 2: we represent real things with models of what is seen and measured e.g. a
picture or sculpture, a table of numbers and words, a narrative of words, a chemical or
mathematical formula, a data stream, or a flow chart.
3: Axiom of Transformation Models
Models may be transformed into other models
Comment 1: Transformation means changing the form of a representation model to enhance
the understanding of the unique real thing or the model of the real thing.
Comment 2: Initial models of real things are typically built from raw collected data that only
give a partial understanding of the thing.
Comment 3: Most models, when transformed into another model form give an enhanced
view of the real thing or the model that improves its usefulness for storing information about
the real thing, or forecasting its future behaviours.

vii
A Structured Approach to Transformation Modelling of Natural Hazards
Abstract
This thesis will inform effective decision making in a natural disaster environment by
combining positivist research data fully describing past disaster events, constructed into
models that may assist in forecasting outcomes of future disaster events.
Transformation Modelling
Typically, a vast amount of situational data from a particular natural disaster is collected and
stored during the time band of the event. It is collected by participants such as emergency
responders, government agencies and researchers.
The consequences of most natural disasters are the outputs arising from multiple inputs to a
natural and anthropological system that are related through complex relationships. In this
study these inputs, outputs and relationships are used to create transformation models. This
study provides an original approach to physical data and information management, building
initial representation models, and creating transformation models to assist decision making,
The thesis introduces a new dimensionless parameter that models relative human behaviour
during pre-event and event time bands when potentially; behavioural responses are shown to
affect the forecast outcomes based on measured situational data.
The internationally standardised tool for managing a risk or hazard is a two dimensional
matrix of historical event likelihood, and the magnitude of consequences. Extending the
traditional two-dimensional matrix to a three-dimensional matrix that includes a participant
behavioural parameter is shown to inform more informative forecasting of disaster outcomes.
The Study
The study involves a research programme of one foundation study and three situational
studies in montane environments that introduce new model approaches to risk management.
The essential element of building this model is the use of a well posed, problem building
principles to enable the creation of a structurally robust and solvable mathematical model.
The foundation study researches the historical development of data modelling and finds a
structured set of seven archetypal forms of models from a catalogue of 2968 general models.
These archetypal forms of models are applied to three different situational studies.

viii
The first situational study investigates the Gutenberg-Richter Equation as a reliable model
for forecasting the likelihood of long-range seismic trends in the Snowy Mountain Region
and the overlayed effects of Reservoir Induced Seismicity (RIS) amongst the 52 water dams
in the greater Snowy Mountains Region. The study uses transformation models, to show how
traditional investigations have over-reported the frequency and magnitude of RIS in this
region. This new modelling approach provides a much improved RIS evaluation criteria, as
well a surprising finding that reservoirs significantly reduce the risk of serious damage and
harm from seismic events when they do, occasionally, occur.
The second situational study looks at the second major earthquake in the Canterbury, New
Zealand sequence of 2010-11. This second of four strong and major earthquakes caused
massive damage, 185 fatalities, and 2,000 moderate to serious injuries, mostly in the city of
Christchurch. This study takes a new approach to the transformation modelling of damage
using the attenuation of seismic energy to develop a new quantitative model called here the
Specific Surface Energy (SSE). This new mathematical model now provides a quantitative
definition based on measured seismic data for the historic Modified Mercalli Intensity (MMI)
scale of seismic intensity. The study identifies several new seismic intensity anomalies that
show significant geological features beyond the well-known Bexley liquefaction anomaly
may lead to very different risks of damage and consequences. These outcomes may have
significant consequences implications for the next major event on the NZ Alpine Fault.
The third situational study develops a new approach to studying and forecasting human
behaviour in montane natural hazard situations by investigating recreational visitor and
resident, understanding and responses to montane risks in the Snowy Mountains in NSW.
The study shows, as might be expected, that visitors and residents will likely behave
measurably different when confronted with montane natural hazard risks. The study models a
new method of measuring differences in visitor and resident risk awareness that transforms
into different measures of behaviour for application to natural hazard risk assessment models.
In the conclusion, the studies are synthesised into a mathematically robust, three domain
matrix model where: natural hazard risk = likelihood * consequences * behaviour.

ix
TABLE OF CONTENTS
Page
Statement of Originality and Statement of Copyright iii
Acknowledgements v
Prologue vi
Abstract vii
Table of Contents ix
List of Figures xvii
List of Tables xxi
PART I: INTRODUCTION AND OVERVIEW 1
CHAPTER 1: INTRODUCTION, RESEARCH QUESTION & METHOD 1
1.1 An Introduction to Communities and Natural Hazards 1
Some Historic Major Disasters: Five Vignettes 2
(a) Victoria’s (AUS) 21 major bushfires 4
(b) Australian Snowy Mountains (NSW) Seismicity 7
(c) Kelso (Otago, NZ) Flooding 8
(d) Newcastle (NSW) Earthquake (1989) 10
(e) Christchurch Earthquake Sequence (NZ) (2010-11) 12
1.2 A Theoretical Framework - Natural Hazard and Disaster Risk 13
Hazard Risk Measurement and Management Framework – ISO 31000 15
The Study Objective and Supporting Framework Constraints 20
Geographical Framework: montane, lowland, and coastal places 21
Economics Framework: applied environmental and resource economics 22
1.3 A Proposal for Transformation Modelling 23
1.4 The Research Question Set – Primary and Secondary Questions 23
1.5 Research Project - Overall Study Method 25
(a) A Method for Geohazard Risk Modelling 25
(b) Research Process and Method 28
1.6 Thesis Plan 30

x
CHAPTER 2: LITERATURE REVIEW 35
2.1 Natural Hazards, Disasters and Affected Communities 35
Geological Hazards (earthquakes, tsunami, volcanoes, and landslides) 38
Meteorological Hazards (storms, floods, cyclones, blizzards and bushfires) 38
Review of Occasional Government Responses 39
The 2011 Queensland Floods and Insurance 42
Government Response Plans 45
The 2009 Victorian Bushfires Royal Commission 49
Private Sector Emergency Response Agencies 51
2.2 Review of Recent Research Approaches 54
Natural Hazards and the Bushfire CRC 54
The Cities and NERAG Projects 55
United Nations Office for Disaster Risk Reduction 56
Fundamental Behaviours Research 57
2.3 Systems Modelling and Applied Mathematics 58
Well posed Problems 59
Natural Hazards – An Energy Intensity Transformation Model 60
Applied Newtonian Physics 61
Energy as a Measure of Damage Potential 63
New Dimensionless Measurement Approach to Natural Systems 65
Information Risk (Security and Quality) 66
Qualitative Reasoning 67
A Modern Role for Logarithms 69
Gradable (Numerically Scalable) Adjectives and MMI 72
Psychometric Measurement Methods 73
Converging to a System Equation 78
2.4 Conclusions 78
2.5 A Vignette: NZ Modified Mercalli Intensity Scale – Gradable Adjectives 80

xi
PART II: RESEARCH PROGRAM 83
CHAPTER 3: DATA TO INFORMATION TRANSFORMATION – SEVEN
ARCHETYPAL MODEL FORMS 83
3.1 Introduction 84
3.2 Evolution of Modelling 85
3.3 Empirical and Formal Models 86
3.4 Creating a System Model 87
3.5 Empirical Survey of Models by Observation and Correlation 88
No Exceptions Statement 91
Composite Models 91
3.6 Seven Archetypal Model Examples 91
3.7 Dimensional Analysis 96
3.8 The Computer Model 97
3.9 Project Modelling 98
3.10 Modelling Practice – Model Form Selection 99
3.11 Modelling Practice – Professional Preferences and Bias 101
3.12 Conclusions 103
3.13 A Vignette: The Blind Men and the Elephant, A Hindoo Fable, 1872 104
CHAPTER 4: THE LIKELIHOOD OF NATURAL HAZARD EVENTS 105
4.1 Introduction 106
Australia is Different 106
Montane Region Hazard Risks 108
4.2 PART 1: Gutenberg-Richter (G-L) Law in Australia and the SMR 112
Australian Earthquake Data 113
Snowy Mountains Region (SMR) Trends 115

xii
4.3 PART 2: Reservoir Induced Seismicity (RIS) 116
Reservoir Induced Seismicity in Australia 116
Occurrence theory for Seismicity 117
4.4 Four Suspected Reservoir Induced Seismicity Events 118
The (1958) Eucumbene Dam and Reservoir 122
The (1970) Talbingo Dam and Reservoir 123
The (1960) Warragamba Dam and Lake Burragorang Reservoir 126
The (1983) Thomson Dam and Reservoir 127
4.5 SMR Results and Analysis 129
SMR and Reservoir Induced Seismicity 131
4.6 The Non-RIS Dams in the combined SMR study areas 134
Other Dams and Reservoirs in the extended Study Area 135
4.7 Synthesis of Results for a ISO 31000 model 137
4.8 Generalised Criteria for RIS 138
4.9 Application of G-L Law Model to Seismic Hazard forecasting 139
4.10 Conclusions 140
CHAPTER 5: CONSEQUENCES OF NATURAL HAZARD EVENTS 143
5.1 Introduction 144
Newtonian Physics at Work – A Refresher 145
Force and Energy from Acceleration and Duration 146
Wave Behaviour of Seismic Systems 147
5.2 Why Peak Ground Acceleration (PGA)? 149
PGA Measurement as a Measure of Seismic Impact 150
The four commonly used PGA parameters 150
Maximum of Individual Orthogonal PGAs 151
Geometric Mean Orthogonal 2D Horizontal PGA 152
Vector Sum Orthogonal 2D Horizontal PGA 153
xiii
Vector Sum Orthogonal 3D Cumulative PGA/Displacement Product 153
Which PGA is Best? 154
Seismic Intensity –Intensity (MMI) and Energy (SSE) Scales 156
5.3 Seismic Events in Christchurch, New Zealand 158
Christchurch 2011 Study Approach and Method 161
Graphical Method Repeatability 163
Three-way AVD Seismograms 164
Observational Comparisons of Four Different PGA methods 166
Comparison of 3DVector Sum PGA with Specific Surface Energy 170
5.4 Trend Outliers – Specific Surface Energy and Seismic Anomalies 171
5.5 The Lyttelton Hanging Wall Anomaly - Spatial Attenuation 173
5.6 The Marlborough Transition Zone Anomaly – A Large Area Energy Sink 179
5.7 The Timaru Anomaly 180
The Timaru Downs Dolerite Shield 183
5.8 A Proposed Correlation between MMI and SSE 184
5.9 Seismic Shaking – Temporal Attenuation 185
5.10 Transformation Modelling 187
5.11 Data Acknowledgements 189
5.12 Conclusions 189
5.13 A Vignette: A Seismic Rock Fall Study 190
Chapter Appendix: Sample AVD seismograms from Event II Anomaly locations 194
CHAPTER 6: NATURAL HAZARD RISK BEHAVIOURS 197
6.1 Natural Hazard Systems and People Responses 198
6.2 Behavioural Influences 203
Montane Risk Awareness 203
6.3 Measuring Risk Awareness Behaviours 204

xiv
The Survey Method and Design 204
A Montane Natural Hazard Psychometric Survey 205
6.4 Development of a Transformation Model for Risky System Behaviours 209
Rational Behaviours 209
Qualitative Reasoning Applied 210
Reciprocity of Behaviour 210
Arithmetic and Logarithmic Domains 210
Respondent Sectors 211
Behaviour Ratio Trends 212
6.5 The Survey and Questionnaire Design 212
The Survey Testing and Distribution 214
The Survey – Results 217
Attitude and Demographic Responses 217
Geological Natural Hazard Perceptions 219
Meteorological Natural Hazard Perceptions 221
Montane Driving Hazard Risk Perceptions 223
6.6 The Survey – Analysis, Summary and Conclusions 225
Tests for Significance of Differences 228
6.7 Conclusions 230
Acknowledgments 232
PART III: MODEL SYNTHESIS FROM NEW KNOWLEDGE 233
CHAPTER 7: TRANSFORMATION MODEL OF NATURAL HAZARDS 233
7.1 Principles of Modelling Systems 234
Development of a Structured Natural Hazard Systems Model 235
7.2 Determination of Model Approaches 236
Actuarial vs Aggregated Risk Assessment 236
7.3 General Behavioural Risk Awareness 238

xv
7.4 General Hazard Frequency - Magnitude Relationships 238
7.5 General Energy Intensity - Attenuation and Damage Model 239
The Risk Equations 239
The Behaviour Inclusive Model 240
Qualitative Reasoning and Related Analysis 241
7.6 A General Natural Hazard Model 241
Geophysical Risk Analysis 242
A New Geophysical Behaviour – Specific Surface Energy (SSE) 243
7.7 People and Built Environment Behaviours 243
7.8 Conclusions 245
7.9 A Vignette: An Historical Earthquake Remodelled 246
CHAPTER 8: CONCLUSIONS 249
8.1 The Research Question Set 249
The Primary Research Question 249
The Five Secondary Questions 249
8.2 New Knowledge Discovered in this Project 252
Prologue: Three new Axioms about Real Things and Models 252
Discovery of the Seven Archetypal Models 252
Snowy Mountains Seismicity and RIS 253
Modelling Remote Seismic Damage through Surface Energy Intensity 254
Behaviour Modelling in Natural Hazards 256
8.3 Past Knowledge Inconsistencies and Uncertainties Refined 256
Seven Archetypal Models 256
Snowy Mountains Seismicity and RIS 257
Modelling Remote Seismic Damage through Surface Energy Intensity 258
Behaviour Modelling in Natural Hazards 259

xvi
8.4 Limitations of this Study 259
Single Disaster Event Data 259
Significance Testing of Power Law Data 260
Forecasting from Gutenberg-Richter Law 260
Psychometric Measurement of Group Behaviours 260
ISO 31000 Model Structures 261
Well Posed Problems 261
8.5 Questions for Future Research 261
Three new Axioms about Real Things and Models 261
Seven Archetypal Models 262
Snowy Mountains Seismicity and RIS 262
Modelling Remote Seismic Damage through Surface Energy Intensity 263
Behaviour Modellings in Natural Hazards 264
BIBLIOGRAPHY 265
References and Bibliography 265
APPENDICES: 291
Appendix 1: The Quantitative Montane Risks Survey Package (Refer Chapter 6). 291
Appendix 2: Hart, W., Environmental flow management in a complex, complementary-
competitive river system. 297
Appendix 3: Hart, W., Renewable energy flux thresholds for development decisions 307

xvii
LIST OF FIGURES
Figure 1.1: Kelso (West Otago, NZ) 1875 Town Plan 9
Figure 1.2: Isoseismal map for the Newcastle earthquake of 28 Dec 1989 (local) 11
Figure 1.3: 1997 Liquefaction Risk Map for Christchurch 13
Figure 1.4: A composite, qualitative – quantitative matrix model for risk assessment 17
Figure 1.5: The Risk Triangle 18
Figure 1.6: Flow Chart Model of this Research Project 30
Figure 3.1: Behavioural relationships between the empirical and theoretical worlds 86
Figure 3.2: Brisbane floods inspire Indigenous painting: The Water Dragon 91
Figure 3.3: Scale model of the Maeslantkering storm surge barrier 92
Figure 3.4: A table of five most intense Atlantic Hurricanes. 92
Figure 3.5: The Gilgamesh (The Great Flood) Tablet 93
Figure 3.6: Earthquake Energy Release - Gutenberg 93
Figure 3.7: Music stream for “The Tempest at Sea” (Symphony 39) by Joseph Hadyn 94
Figure 3.8: A 0.75 second, raw data stream segment for earthquake ground acceleration 95
Figure 3.9: A simple (US EPA) National Response System Flowchart 95
Figure 4.1: Map of 2011 Magnitude 5+ Australian Plate Earthquakes 107
Figure 4.2: Map of all recorded Australian Earthquakes to 2011 108
Figure 4.3: The compression pattern of the Australian Plate 109
Figure 4.4: Locations of the four large Australian dams and reservoirs variously associated
with Reservoir Induced Seismicity (RIS) 111
Figure 4.5: Bayrak (2002) G-R plot for San Andreas Fault in California USA 113
Figure 4.6: The all-Australian data for Gutenberg-Richter Law 114
Figure 4.7: The modern all-Australian data for Gutenberg-Richter Law 115
Figure 4.8: The Snowy Mountains Gutenberg-Richter Relationship 116
Figure 4.9: Venn Map: Lake Eucumbene - Berridale Wrench Fault 119

xviii
Figure 4.10: Venn Map: Lake Talbingo - Gilmore Fault 119
Figure 4.11: Venn Map: Lake Burragorang - Macquarie Fault 120
Figure 4.12: Venn Map: Lake Thomson - Yallourn Fault 120
Figure 4.13: Temporal Event Graph seismic swarm pattern, Eucumbene Dam after 1958 123
Figure 4.14: Temporal Event Graph seismic swarm pattern, Talbingo Dam after 1971 125
Figure 4.15: Temporal Event Graph seismic swarm pattern, Warragamba Dam after 1960 127
Figure 4.16: Temporal Event Graph seismic swarm pattern, Thomson Dam after 1983 129
Figure 4.17: The all-data SMR Gutenberg-Richter Equation 130
Figure 4.18: The SMR Gutenberg-Richter Equation: excluding Talbingo Data 133
Figure 5.1: Depictions of Love and Rayleigh seismic waves 147
Figure 5.2: Graphic of multiple pathways for seismic body waves through the earth 148
Figure 5.3: Transform of 2D circular motion to biaxial sinusoidal functions 149
Figure 5.4: MMI plot for Canterbury Event II on 22 Feb 2011 157
Figure 5.5: Location of Events I to IV on the Canterbury Plains and Banks Peninsula 159
Figure 5.6: A typical Snowy Mountains rock outcrop at Porcupine Rocks 160
Figure 5.7: A typical Christchurch Port Hills rock outcrop at Rapaki 160
Figure 5.8: Orthogonal vector traces from Event II for Heathcote Valley School 165
Figure 5.9: Plot of four most common PGA measures in the 80 Event II seismographs 167
Figure 5.10: Preferred PGA and Surface Energy in the 80 Event II seismographs 169
Figure 5.11: The Christchurch Event II landslide & rock fall map 174
Figure 5.12: Hanging Wall Stations Seismic Response with epicentral distance 177
Figure 5.13: Timaru Downs (Mt Horrible Lava Shield) section showing Loess over Dolerite
over Canterbury Gravels 183
Figure 5.14: Seismogram locations and shaking duration vs epicentral distance with the
Timaru outlier (anomaly) 186
Figure 5.15: 2011 Christchurch Event II: The 500m path of a 2-3m ellipsoid boulder
originating from an outcrop (tor) on Rapaki 191

xix
Figure 5.16: 2011 Christchurch Event II: The approximate 20m airborne trajectory of a 2-3m
ellipsoid boulder 191
Figure 5.17: 2011 Christchurch Event II: House damage and debris blowout 191
Appendix 5 (1) Lyttelton Port Oil Wharf (LPOC) Seismogram 194
Appendix 5 (2) Timaru Roncalli College (TRCS) Seismogram 195
Appendix 5 (3) Molesworth Station (MOLS) Seismogram 196
Figure 6.1: The Bushwalking Australia L-C risk assessment matrix 199
Figure 6.2: Location of the Primary Study Region in SE Australia 203
Figure 7.1: Isoseismal map of the 1988 Te Anau earthquake. 248

xx

xxi
LIST OF TABLES
Table 1.1: The population change across urban and rural Victoria, Australia 6
Table 1.2: Most significant locations for the 10 major geohazards 22
Table 2.1: Analysis of the 67/127 recommendations and categories from the Royal
Commission into 2009 Victorian Bushfires 50
Table 2.2: Example of scales that link gradable adjectives to natural system probability
frequency and to logarithmic transformations 71
Table 3.1: Properties and examples of the seven archetypal model forms 90
Table 3.2: Occurrence of categories of system model structures 97
Table 3.3: Some professional preferences of the seven archetypal model forms 102
Table 4.1: USGS Richter and Magnitude Severity Descriptor Scales 107
Table 4.2: Geoscience Australia (GA) seismic event database 1900-2013 for M > 2 114
Table 4.3: Lake Eucumbene – Berridale Wrench Fault: the occurrence and magnitudes record
of historic earthquakes 122
Table 4.4: Talbingo occurrence and magnitude record of historic earthquakes 124
Table 4.5: Schedule of the sixteen large dams in the Snowy Mountains Scheme and four
water supply dams in the SMR 132
Table 4.6: The Snowy Mountains G-R Law Equations 1955-2013 134
Table 4.7: The 32 notable large dams within 300km of the SMR study area boundary 136
Table 4.8: Table Transformation Model for 1955-2013 events based on the alternative
Gutenberg-Richter formula models with and without RIS 138
Table 4.9: Forecast probability of future earthquake events in the Snowy Region 139
Table 5.1: Typical geotechnical properties of granite and basalt 161
Table 5.2: Specific Surface Energy Method Repeatability Test Results 164
Table 5.3: Peak motion values for 3 orthogonal planes at Heathcote Valley 166
Table 5.4: Attenuation Relations for PGA & Specific Surface Energy (SSE): Event II 171
Table 5.5: Lyttelton Hanging Wall Block seismograph locations for Event II 175

xxii
Table 5.6: PGA and Specific Surface Energy Attenuation relationships 178
Table 5.7: Variance from Trend for Specific Surface Energy Anomalies 179
Table 5.8: Attenuation Relations and Extent of the Timaru Anomaly 182
Table 5.9: Limits of new energy intensive damage types in ChCh Event II- 22 Feb 2011 184
Table 5.10 Preliminary comparison of a relationship between MMI and SSE 185
Table 6.1: The L-C scales for citation seriousness in a coal mines safety survey 202
Table 6.2: Transform of cumulative event likelihood to a logarithmic rating 207
Table 6.3: Transform of property and human value impacts to a logarithmic rating 208
Table 6.4: First Transform Table for Risk into the Logarithmic Domain 213
Table 6.5: Second Transform Table for Sector Relative (Logarithmic) Risk 214
Table 6.6: General Attitudes to Risk amongst Montane Respondent Groups/Mix 218
Table 6.7: Summary of Survey Ratings for Geological Natural Hazards 220
Table 6.8: Summary of Survey Ratings for Meteorological Natural Hazards 222
Table 6.9: Summary of Survey Ratings for Motor Vehicle Accidents 224
Table 6.10 Behavioural Ratio for geo-hazards and population sectors in SMR 225
Table 6.11 Histogram of raw survey data values for Landslide Hazards in SMR 229

1
CHAPTER 1: INTRODUCTION - THE RESEARCH QUESTION AND METHOD
1.1 An Introduction to Communities and Natural Hazards
Decision making by communities in preparation for, during, and after natural disasters uses
knowledge that is generally gained from past events and models that forecast the future. The
objective of this thesis is closing the gaps in knowledge that are found when models don’t
adequately describe past events, ignore long term historical trends, have inconsistent
parameters and terminology, and don’t consider the interactions between people, their
communities and the environment around them. This study addresses these matters in
questions relating to natural disasters using evidence based research that leads to an
integrated model with strong mathematical integrity. The study begins by combining
positivist (evidence based) and constructivist (scientific model based) approaches to such
studies that are grounded in the natural and cultural history of the communities they relate to.
Community and Cultural Priorities
The desire to live a secure life has occupied the minds of communities and their leaders for
millennia and for much of that time augurs, astrologers, and soothsayers have advised leaders
and their communities on settlement decisions based mostly on the mystery of metaphysical
signs and traditions. Lin and Chen (2010) discuss how the process and consequence of place-
making, naming and language is at the core of human geography and even so in modern
times for indigenous peoples in the mountainous Hualien County in Taiwan. This local
approach to place can be extrapolated to general populations to propose that the main
elements that define a person’s identity in modern society are threefold: (i) their name
(because this signals an individual personality and a personal heritage through parentage), (ii)
their language (because this defines their belonging to a common community), and (iii) their
place (because this defines their belonging to a geographical location). Even in the modern
world where young people in particular, travel to find adventure, wealth and fame, their
name, their mother tongue (and accent) and the place of their birth will travel with them.
Some societies explicitly embed this in their culture as seen the New Zealand Maori concept
of Turangawaewae – a place to stand – to describe their home marae (tribal meeting place).
Professor Timoti Karetu of the small locality of Matawaia (NZ) says (Karetu, 1990, p 112):
Life takes me all over the place, but in Matawaia I know who I am. It is the place
from which my canoe was launched on life's rocky road; it is the stump to which I

2
will tie that canoe at journey's end. In life it is the ground on which I stand; in
death it becomes te ukaipo, the breast that nurtures me at night.
Jackie Huggins (1994, p 3-4) shows how for Rita Huggins of the Mak Mak people whose
homelands are southwest of Darwin in the Northern Territory of Australia:
Identity and country is inextricably linked to the heart of country: the people, the
animals, the plants, the ancestors, the seasons – and the intimate relationships
that tie them together.
There is possibly no greater decision for a new community than where it will settle, a
decision that once made, endures beyond disasters – man made or natural. In historical
communities, and indigenous peoples, most members will likely only have memories of this
decision encapsulated in their stories and mythology, but in “second world” nations of
colonisation especially in the 18th
and 19th
centuries, leaders (actually or metaphorically
speaking) planted a stick in the ground and said “this is where we will be”.
Many of the factors that influenced these decisions have been well described in Central Place
Theory (Christaller 1933) and were generally based on the potential for trade and transport
(such as rivers or natural harbours); the potential for agriculture (such as fertile lowlands and
a ready supply of water); and the potential for defence (depending on perceived threats).
Rarely did a community make the location decision while including a structured analysis of
potential natural hazards (geohazards) and the risk of disasters such as floods, earthquakes,
wildfires, cyclones, and eruptions. Disaster events happen only rarely and new colonists often
have no local history or indeed personal knowledge framework upon which to give this risk,
substantial consideration for a new settlement.
Some Historical Natural Disasters: Five Vignettes
It is helpful to consider some actual examples of how communities made their settlement
decisions, and how they considered issues and the strategic decisions of the community.
All communities will have a degree of resilience arising from their connection to the place.
The meaning of this will depend on the community, nearby geographical features, hazards
and risks (geohazards), and the metrics employed to evaluate them. Cutter et. al. (2008)
describes resilience as the ability of a community to respond and recover from natural hazard
based disasters including its inherent ability to absorb impacts and cope with an event. Post-

3
event recovery processes also enable communities to learn and adapt their response to future
threats. These views are also seen in Rodin & Garris (2012) and Urban Land Institute (2013).
Most communities have a “recover and rebuild” philosophy unless they are impacted by a
natural disaster, so vast and catastrophic that there is nothing or nobody left to rebuild.
Communities worldwide have endured the impacts of geohazards ever since humankind
began the transition from hunter-gatherer to farmer-trader in the Neolithic and started to
acquire and build fixed property assets. These property assets became the major measures of
wealth through being the enabler of protection for a person, family and community,
mechanisms for continuity of food supply, and centres for markets and trade. Once
established, the collective wealth of the community involved enabled settlements to be
sustained. This meant that the original process for selecting a location and growing a
settlement over time became more important than was realised at the decision time with
unsatisfactory places failing to prosper and preferred places providing greater growth.
Models for the spatial location, structure size and hierarchy of function for settlements were
developed in Central Place Theory by Christaller (1933) and further developed by Berry
(1958), Hohenberg (2003), Kim & Margo (2003) and O’Sullivan (2005). The primary drivers
for these models are weighted towards economics and trade and give less weighting to the
original imperatives of protection that evolved in the original settlements period of the
Neolithic. Perhaps this reflects the evolutionary European origins of this economic theory and
of the colonial settlement period. The combination of the industrial revolution, colonial
expansion and population growth saw the creation of many new settlements and communities
in the new world of the 18th
and 19th
centuries with central business districts and population
density being concentrated around trade hubs such as ocean and river ports. Such locations
usually provided other nearby advantages such as alluvial flat land (fine and soft sediments)
which provided ease of roads and building foundation construction (excavation and piles),
and ease of communication. Technology and innovation in foundation development such as
screw or helical piles in the 1840-1860 period provided opportunities for larger building
developments on soft sedimentary soils in an essentially hand tool economy. These locations
were also exposed to severe damage from occasional (a long recurrence interval) major
geohazards such as storm floods (river floods or tidal surges) and earthquake liquefaction.
Settlers brought with them the economic and social thinking of agriculture and trade from the
old world. With little knowledge of the climate and geography of the new world, they were
faced with complex decisions on where to locate new settlements, and tended to create urban

4
settlements based on desirable attributes of the European settlements they left behind. Five
such settlements or areas are: Rural Victoria (Australia) which is much like pastoral England;
Kelso (New Zealand) more like arable Scotland and England, The Snowy Mountains (NSW,
Australia) like the Scottish Highlands, Newcastle (NSW, Australia) like industrial Tyneside,
and Christchurch (New Zealand) like coastal Norfolk. Each of these settlements was located
in generally favourable locations from the perspective of Central Place Theory, providing
appropriate access for strong economic performance in agriculture and trade. These example
places however, suffered terrible impacts from geohazard disasters not found in their British
geographical similes, and were repeatedly confronted with the challenge of rebuilding
following such disasters.
The question that is rarely asked, but underlies each of these settlements, is should they, from
a security perspective, have been built there at all, and once severely damaged, is rebuilding
and restoration the best decision and course of action. More recently the question of industry,
urbanization and disaster risks and the impact on the traditional factors of economics,
geography, planning, ecology, and security in industrial location theory is being examined
(Mayo, 2011).
This introduction briefly examines five settlement vignettes, the drivers for their location and
growth, the prime geohazard threat, and a brief history of their disaster impacts. The first two
are regional geohazards while the other three are specific towns and cities. These vignettes
help set the scene for the three situational studies presented later in this thesis
(a) Victoria’s 21 major bushfires – multiple complex responses (1851-2009)
(b) Snowy Mountains seismicity – landslip evidence unrecognised (1950-74)
(c) Kelso (NZ) – flood evidence ignored for 100 years (1875-1980)
(d) Newcastle Earthquake – a tragic (but somewhat fortunate) surprise (1989)
(e) Christchurch Earthquake Sequence – old lessons to be re-learned (2010-11)
The vignettes briefly describe the key social, geographical and geophysical factors in the
disaster events, identifying social factors that describe the direct or default decisions of
community leaders, and a need to bring these complex factors together in decision making.
Vignette (a) Rural Victoria (Australia)
Rural Victoria offered colonial settlers in the 1800s vast plains for grazing and arable
farming and large deposits of alluvial gold. By 1851, the settler population of Victoria was

5
approximately 350,000 of which 70% lived in rural areas. The land and climate that kept the
graziers and farmers in the region, has for millions of years sustained an ecology of
grasslands and forests in which bushfires were part of the natural cycle of regeneration for
eucalypt bushland (VBRC 2010). These same bushfires had a catastrophic impact on the
rural and mining settler communities with significant areas of the 23 million hectares (MHa)
that make up the State of Victoria, burned by bushfires since settlement in the early 1800s.
During this time the six bushfires with the greatest impact on people and property have been:
1851 (12 fatalities / 5.0 MHa - million hectares burned),
1926 (60 fatalities / 0.5 MHa),
1939 (71 fatalities / 2.0 MHa),
1944 (52 fatalities / 1.0 MHa),
1983 (47 fatalities / 0.5 MHa), and most recently,
2009 (173 fatalities / 0.5 MHa).
The 2009 Victorian bushfire cycle represented approximately 400 individual bushfires with
14 major fires (both grassland and forest) spanning a wide swathe of Central Victoria,
destroying 2,000 homes, displacing 7,500 people, and severely damaging 78 townships.
These bushfires ran for approximately five weeks, sustained by a long period of hot windy
weather conditions favourable for such bushfires, with a climax during a devastating
windstorm and firestorm known as Black Saturday, on 7 February 2009 and then subsiding
before extinguishing when cooler damp weather arrived in early March. The descriptive
narrative, including print and broadcast news media (McGourty 2009), for this event focuses
on temperatures, wind speed and fuels. Recent research has shown (Dowdy et. al. 2009, Gill
1998) the repetitive nature in the transcontinental weather pattern that preceded almost all
historic major fire events in Victoria was widely known, but not used in strategic responses.
The statistics in the Victorian Bushfire Royal Commission (VBRC 2010) show a progressive
decline in major bushfire event frequency and areas (in terms of millions of hectares burned)
over the past 160 years. During this period, there have been significant improvements in
bushfire education, communication systems, transport, warnings and response activities.
There has also been increasing populations in many at-risk rural and remote locations, so
event behaviours by management systems and new less experienced settler residents mean
that people and property damage in an event can still be very high.

6
The population of Victoria has seen consistent growth over its migration history. The decline
in gold mining after the gold rush of the 1850s and 1860s and the declining labour content in
agriculture production due to increasing mechanisation had seen the rural populations decline
in the early to mid-1900s. During this time, urban populations especially in the large city of
Melbourne have grown rapidly. In recent times rural and remote populations have partially
stabilised and recovered due to lifestyle (retirees and rural-residential) living replacing
economic (e.g. farming) rural living.
Table 1.1: The population change across urban and rural Victoria, Australia
Victoria, Australia 1855 2012
Melbourne Metropolitan 100,000 (29%) 4.3 million (73.5%)
Regional cities & large towns 247,000 (71%)
1.3 million (22.2%)
Rural (settlements <200) 250,000 (4.3%)
Total Population 347,000 5.85 Million
Rural residential residents generally place a high value on scenic locations and natural
environments and as a result have frequently built homes and expanded settlements in
remote, hilly and well-forested areas. Unfortunately these areas have limited access (and
escape) roads, higher rainfall, and a high density of bushfire fuel load, creating a very high
exposure to bushfire risk.
A number of these bushfire events like many other major natural disasters have been
followed by government inquiries or Royal Commissions’ of Inquiry and as a consequence
have each resulted in an exceptionally valuable database of information representing the state
of knowledge at that time, together with many recommendations and research which have
advanced knowledge further e.g. VBRC (2010). Unfortunately, this growth in knowledge has
not mitigated the recurrence or severity of major events. New knowledge has the potential to
mitigate the damage and consequences of future events with an increased awareness that
climate change may increase the frequency and intensity of the weather conditions that
exacerbate major bushfires.
The multiple bushfire disasters in these areas has put significant pressure on government
agencies, firstly to respond and aid recovery from major events, but more significantly to play
a larger role in prevention and planning. Bushfire research programs are now a major part of

7
government intervention that has seen major improvements in bushfire operations, as well as
in modelling bushfire risk assessment. There have been in Australia, and other international
regions prone to bushfires (also called wildfires) such as Europe, Canada, United States, a
wide range of risk and event modelling programs such as Dowdy / CSIRO (2009), Gill
CSIRO (1998), USFS / Byram (1959), USDoAg / Keetch (1968), Ontario MNR (2010),
Sweden MHI / Gardelin (2010) to assist operational managers. Nevertheless, in spite of an
increasing understanding of the risks, rural residents continue to live and develop residential
estates in the highly flammable eucalypt and conifer forest zones, and then rebuild destroyed
homes in the same high risk locations with few lessons learned.
Vignette (b) The Australian Snowy Mountains (NSW, Australia)
The Australian Snowy Mountains like all mountain features in a new colonial landscape
have inspired exploration, adventure and settlement. Nevertheless, this is a different type of
settlement, one of major infrastructure assets and recreational visitors, of vast low density
grazing properties, and few permanent residents. Like most mountain ranges, the Snowy
Mountains have a higher level of seismicity than the surrounding lowlands but unusually
these ranges are not near a tectonic plate boundary. They have been the centre of two major
forms of human intervention and development – dams and reservoirs for electricity and
irrigation, and tourism with montane sports.
The permanent population of the NSW Snowy Mountains region is just 35,000 people across
10 townships (ABS 2012b), but it is home to the Snowy Mountains Scheme, a system of 20
dams and 16 power stations. It is also home to five sport and recreation resorts bringing a
total of 1.3 million visitors each year (DNSW 2013a, 2013b) for typical mountain pursuits
such as snow-sports, fishing, hiking, and mountain biking. This study is fortunate in that the
region has built a strong record of the regional seismicity since 1950, arising from the Snowy
Mountains Scheme project investigations. The region has been home to a number of
devastating geohazards: a 1997 landslide (Macdougall et. al. 2002) with 18 fatalities, multiple
bushfires - some with a few fatalities but devastating environmental damage, and others
including the Victoria bushfires discussed in (a) above.
The Thredbo landslide of 1997, where a massive slip caused by uphill drainage failures in the
resort village led to the collapse of two ski lodges, caught everybody by surprise. The
eyewitness accounts in Macdougall (2002, page 9 and 10), note the strange creaking noises
the previous day and the progressive leaning downhill of snow gum trees over previous
8
months and years, but there was no one to tell who had the ability to respond to these
observations. Much has been learned from past geohazard events, notably bushfire and
landslides, such that national park and resort staff now respond better to new event reports,
after recognising incipient disaster conditions. The region is getting better prepared for the
range of likely geohazards, such as bushfires, landslides, blizzards, wind and rainstorms.
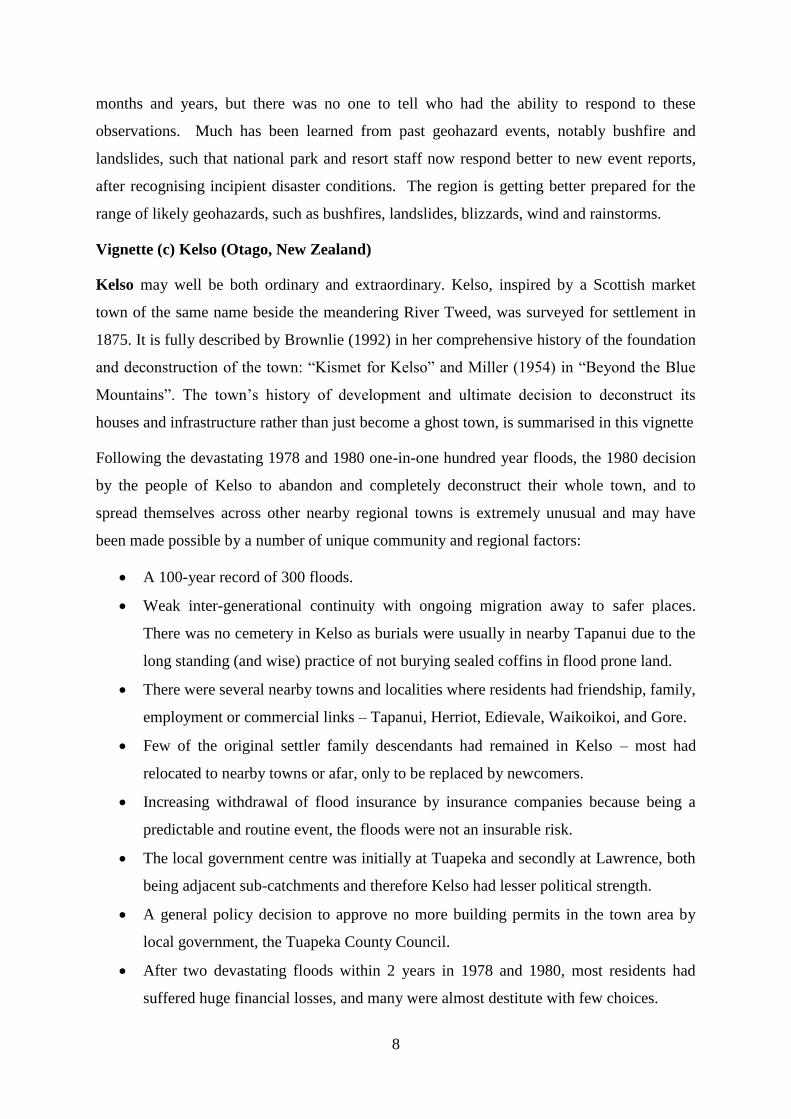
Vignette (c) Kelso (Otago, New Zealand)
Kelso may well be both ordinary and extraordinary. Kelso, inspired by a Scottish market
town of the same name beside the meandering River Tweed, was surveyed for settlement in
1875. It is fully described by Brownlie (1992) in her comprehensive history of the foundation
and deconstruction of the town: “Kismet for Kelso” and Miller (1954) in “Beyond the Blue
Mountains”. The town’s history of development and ultimate decision to deconstruct its
houses and infrastructure rather than just become a ghost town, is summarised in this vignette
Following the devastating 1978 and 1980 one-in-one hundred year floods, the 1980 decision
by the people of Kelso to abandon and completely deconstruct their whole town, and to
spread themselves across other nearby regional towns is extremely unusual and may have
been made possible by a number of unique community and regional factors:
A 100-year record of 300 floods.
Weak inter-generational continuity with ongoing migration away to safer places.
There was no cemetery in Kelso as burials were usually in nearby Tapanui due to the
long standing (and wise) practice of not burying sealed coffins in flood prone land.
There were several nearby towns and localities where residents had friendship, family,
employment or commercial links – Tapanui, Herriot, Edievale, Waikoikoi, and Gore.
Few of the original settler family descendants had remained in Kelso – most had
relocated to nearby towns or afar, only to be replaced by newcomers.
Increasing withdrawal of flood insurance by insurance companies because being a
predictable and routine event, the floods were not an insurable risk.
The local government centre was initially at Tuapeka and secondly at Lawrence, both
being adjacent sub-catchments and therefore Kelso had lesser political strength.
A general policy decision to approve no more building permits in the town area by
local government, the Tuapeka County Council.
After two devastating floods within 2 years in 1978 and 1980, most residents had
suffered huge financial losses, and many were almost destitute with few choices.

9
Some financial assistance being an excess from prior publically subscribed emergency
funds, was made available, but only to assist with relocation, but not rebuilding.
Changing rural demographics – technology and agricultural modernisation had seen
generalised rural depopulation across the nation or concentration to larger towns from
where farm workers would drive to work, sometimes working across multiple farms.
A neutral change facilitator – the Anglican Vicar from nearby Tapanui, Rev. Phillip
Charles who chaired cornerstone community meetings for change.
Strong local political leadership – the then Minister for Regional Development, the
Hon. Warren Cooper was a well-regarded local Member of Parliament.
Figure 1.1:
Kelso 1875 Town Plan
Plan shows the importance of
the river and water access to
the settlement placement and
design but also shows the
flood risk inherent with the
several low-lying oxbow lake
depressions. (Source: May
Brownlie 1992, National
Library NZ)
The long-term flooding pattern with a dynamic river course was evidenced before settlement
by the lush natural vegetation, the broad flat valley, and the slow meandering Pomahaka

10
River together with the historical oxbow lake depressions that can be seen in the October
1875 town survey map in Figure 1.1. These features may have attracted British settlers with
a vision of a quiet British style agricultural village. It is clear however, the surveyors did not
understand the of ability of the surrounding Black Umbrella Mountains to the north west, and
the Blue Mountains to the east, to trap moisture laden southerly weather systems and cause
massive inflows into the Pomahaka River. The signs were all there to be seen. The 100-year
evidence of flood dynamics, oxbow depressions, and the dynamic course of the main riverbed
is still clearly seen in modern Google Earth satellite photographs and maps of where the town
once was. For example, the north-south running street (Denholm St) on the west side of town
and river and many of its surveyed town lots are now completely submerged by the
expanding riverbed. Kelso is a clear example of obvious disaster risk factors being
overlooked in the original settlement decisions.
The interesting observation that arises is that while many individuals and families made the
decision to relocate, some quite early in the history of Kelso, the empty houses they left were
quickly re-occupied by newcomers several times over. The current townspeople that
remained by 1980 were initially even more determined to resist demolition and resettlement
in the face of diminishing support from government and compelling evidence on the future
geohazard risk. Governments appear seldom willing to address such vehement public
debates with logical and scientifically based policy-making, without leadership from strong
local leaders. Evidence and leadership ultimately prevailed at Kelso.
Vignette (d) Newcastle (NSW, Australia)
Newcastle like its English eponymous ancestor began as a centre of the coal industry in New
South Wales to service rapidly growing Sydney (Campbell et. al. 2009) with the opening of a
colliery and rail line at the “Yard Seam” in December 1831. Its growth as a regional, steel
producing and coal export centre saw a prosperous business district emerge with a 1991
population of 262,000 (Bray, 1998).
On 28 December 1989 at 10.29 am local time (Geoscience Australia 2004) a shallow
moderate magnitude (ML) 5.6 earthquake occurred, leading to 13 fatalities and 160 injuries.
There were 50,000 damaged buildings and a gross damage cost of approximately AU$4
Billion. Being a daytime event in the middle of the Christmas – New Year holidays, the city
centre office buildings, and in particular schools that suffered heavy damage were largely
empty. Estimates of potential human cost were in the region of 200-300 fatalities had the

11
event occurred a week or two earlier or later (Carr et. al. 1992, Stuart 1990, 1992). Of note is
that the Central Business District (CBD) shaking continued for the relatively short time of six
seconds which is much less than might be expected for a city built on alluvial river flats
where liquefaction can be expected to extend shaking and subsequent damage.
Figure 1.2 Isoseismal map for the Newcastle earthquake of 28 Dec 1989 (GA, local time)
In the city centre, the seismic felt intensity has been mapped as MMI level VI on the
Modified Mercalli Intensity scale by Drummond (2016) as shown in Figure 1.2. This event
stands as a strong warning that Australia with a large stock of un-reinforced masonry (URM)
buildings nationwide remains highly vulnerable to serious seismic events. This occurs

12
because of human factors such as low risk awareness, and a high community value placed on
heritage buildings and townscapes in earthquake prone areas (Chapter 4, Figure 2 – Glanville
2012) for even moderate magnitude (M < 6.0) earthquakes. The high heritage values found
in communities are modern symptoms of place theory, as discussed earlier in this chapter and
still dominate building modernisation decisions.
Vignette (e) Christchurch (Canterbury, New Zealand)
Christchurch was badly damaged by a strong (magnitude 6.3 earthquake) on Tuesday 22
February 2011 at 12.51 p.m. The earthquake killed 185 people and injured several thousand,
with 177 being killed by falling masonry and collapsing office blocks in the built
environment, mostly in the CBD (Moore 2011). The damage was highly exacerbated by
liquefaction of the underlying alluvial flats that dominate the central and eastern landscape.
Just eight people were killed by the direct shaking effects of the earthquake: three being
knocked over and five by rock falls in the natural environment of the nearby Lyttelton
volcanic cone. The earthquake epicentre was near Heathcote Valley, just 7 kilometres
southeast of Christchurch’s CBD, a centre with a very high number of URM buildings of
high heritage value to the city. The earthquake occurred more than five months after a major
earthquake (4 Sept 2010: magnitude 7.1) 40 km west of the city at Darfield and was followed
by two more similar earthquakes (13 June 2011: M6.4, and 23 Dec 2011: M6.2 with
epicentres a few kilometres to the east of this event.
Christchurch leaders and planners have known almost since settlement in 1848 and the 1888
and 1901 earthquakes, it is a high liquefaction risk area, with the Centre for Advanced
Engineering (CAE) and Canterbury Regional Council (CRC) publishing (CAE 1997, Figure
1.3) its comprehensive forecast of (and since proven accurate in 2010-11) liquefaction risk
map in 1997. Whilst civic leaders, town planning and development specialists became aware
of this risk, general community awareness and acceptance had been limited and especially
resistant to suggestions of major development restrictions within the suburban areas. The
destruction of 10,000 homes and some 2,000 commercial and industrial buildings following
the Canterbury Earthquake sequence suggests a NZ$20 billion write-off in built environment
assets, even though the rebuild cost is estimated to be some NZ$40 billion.
The impacts have gone well past the direct event consequences with a huge loss of
community continuity as residents with moderate ties to the city location have relocated and
been replaced by a high number of mobile, rebuild construction workers.

13
Figure 1.3: 1997 Liquefaction Risk Map for Christchurch (CAE 1997, p 304)
It is clear that information on the risk and the probable consequences of seismic events have
been in front of the City, its leaders, its heritage building sector, and its population for many
decades (Centre for Advance Engineering, CAE 1997), but little was done by successive
cycles of leaders to prepare for the inevitable disaster. The options available following the
1997 report included fully using this information to strengthen or rebuild the risk prone
heritage areas ahead of a catastrophic event such as the 2010-11 Canterbury seismic
sequence. These options will be explored further in Chapter 7.
1.2 A Theoretical Framework - Natural Hazard and Disaster Risk
Defining the theoretical framework for this project is complex, mostly because it is a
multidisciplinary project and normal epistemological definitions do not easily fit the study.
Therefore in this description, the theoretical framework will touch several areas.
Academic research into community and individual risk has been conducted across many
sectors for many decades. These sectors are not limited to Natural Hazard and Disaster risk,
but cover all aspects of risk in society including industrial disasters such as: the 1986
Chernobyl nuclear power station meltdown (Abbott et. al. 2006); the 2008 Global Financial

14
Crisis (Ashby, 2010); environmental disasters such as the 2010 BP offshore oil spill in the
Gulf of Mexico (Curlee & Gordon, 2011); and the 2015 European migration crisis (Berry,
2015). The mainstream literature on risk especially as observed in Renn’s (1992) framework,
all has a consistent focus on risk reduction, where it seems there is a consensus that risk is
undesirable. Some risks such as insurance actuarial risk, finance market variability risk, and
engineering design risk are seen as critical to ensuring products are properly priced or
resources are used efficiently and therefore seeks to optimize rather than minimize risk.
Renn’s (1992) framework which is inclusive of these dilemmas follows an extensive
literature review which identified seven approaches to classifying risk perspectives:
(i) the actuarial approach (using statistical predictions);
(ii) the toxicological and epidemiological approach (including ecotoxicology);
(iii) the engineering approach (including probabilistic risk assessment);
(iv) the economic approach (including risk-benefit comparisons);
(v) the psychological approach (including psychometric analysis);
(vi) social theories of risk; and
(vii) cultural theory of risk (group analysis).
While each of these seven approaches has relatively close linkages to a particular world
sector or type of potential disaster, natural disasters are different to general disasters in that
natural disasters in almost every case will traverse several of the approaches, and on
occasions all seven. This natural hazard research project will show that the actuarial,
engineering, economic, psychological, social and cultural approaches all combine to enable a
transformation model of natural hazard risk.
The original outline of Renn (1992) has continued to map social theories being described
more extensively in his revision: Social Amplification of Risk (Renn 2008a, 2008b). The
concept of social amplification of risk is based on the thesis that the social and economic
impacts of an adverse event are determined by a combination of direct physical consequences
interacting with psychological, social, institutional, and cultural processes.
The epistemology and ontology for this project will focus on constructivist approaches in
showing that new knowledge will be derived in structural models of the natural world. These
models take many forms. The project will show that the use of positivist approaches to
research and data accumulation leads to consistent quantitative structures. This will advance
the general modelling approaches of observed data and information to go beyond

15
representational models of past and present realities (ontologies) to forecast probable future
realities in the risk and consequences of natural hazards through transformation modelling.
Positivist and interpretivist methods are two basic approaches to research described by Stahl
(2007) who also points out that strictly following either or indeed any other ontological
approach will likely lead to inconsistencies. Positivists prefer scientific, quantitative methods
that give clear definitive outcomes. Interpretivists prefer humanistic, qualitative methods that
can be transformed to give conceptual outcomes and vice versa. This study will also
investigate qualitative processes around risk concepts with social surveys and seek to evolve
quantitative interpretations that are compatible with quantitative measures of risk
probabilities and economic consequences.
The positivist methodology to be applied in this project is based around the ISO 31000:2009
hazard risk measurement and management standard in a natural hazard paradigm. Natural
hazards generally encompass a wide collection of risk factors which may occur together to
create a disaster event. These factors are generally capable of measurement and subsequent
management to reduce the impacts and costs of disaster events.
Hazard Risk Measurement and Management Framework – ISO 31000
A number of risk modelling frameworks were investigated for this study. These framework
approaches were applied to risk situations across the seven risk approaches (i – vii) listed in
the section above. The main frameworks selected for detailed evaluation include the ISO
31000 expectation equation, risk and intensity mapping; complex systems modelling;
Boolean decision systems; dynamic differential equation and economic systems.
Evaluation factors included historical applications, hazard sector familiarity and acceptance,
flexibility across different natural hazards, flexibility for extension into community
behaviours, ability to achieve mathematical integrity, and to solve specific model studies.
A detailed report on this analysis is beyond this thesis, nevertheless the ISO 31000 model
framework was selected for the reasons above, and the matters identified in the structured
risk assessment and management methodology based around the historical risk expectation
equation that follows.
This equation has a long well proven history, being developed 350 years ago, with its
creation being the result of a request from a gambler on how to split the residual “pot” in an

16
uncompleted game of dice. The solution is found in the original Pascal-Fermat letters of
1654, (Devlin 2010) where for uncertain situations or events we find equation 1.1:
long term expected outcome = ∑(probability * value) (1.1)
The expectation equation is the foundation of the general risk assessment standard, ISO
31000 and is found to be ideal for modelling the component domains of hazards and events.
Hazards that can lead to disaster events come from a very wide set, and include a wide range
of anthropological and natural events. For example, anthropological hazards and disaster
events such as disease epidemics (e.g. the post-WWI influenza epidemic – Macdougall,
2002), geopolitical events (e.g. wars), and major industrial events (e.g. Chernobyl) show
many of the natural disaster features, but are excluded from this study due to their geo-
political origins. Instead, this study has a preferred focus on naturally occurring geo-hazards,
as this enables the use of the natural expectation parameters of likelihood and consequences.
The counterpoint to anthropological hazards is natural hazards that generally can be
categorised in two broad categories, being geological and meteorological hazards. Such
definitions are not always clear-cut and some hazards and disaster events bridge the
definitions. For example a landslide on a mountain that has been unsafely modified by road
engineering works (as in the Thredbo landslide of 1997), and that occurs following stormy
weather might be called geological, anthropological or meteorological. Since landslides have
occurred since the beginning of earth time and occur primarily in the geological domain they
will be classified here as geological hazards. Severe natural bushfires generally occur owing
to a concurrence of certain meteorological conditions, a sympathetic forest landscape, and
commonly some form of human activity. Recent research (AIC 2008a, 2008b) has shown that
85% of bushfires in modern times are triggered by malicious or accidental anthropological
ignition, being approximately 50% deliberate or suspicious and 35% accidental showing the
importance of including community behaviours in the risk evaluation. The research has
shown that the precursor conditions for serious bushfires are meteorological, and therefore
they will be classified as meteorological hazards and disasters.
Generic risk management research and management method development has led to the
creation of the two-dimensional or matrix, risk expectation model an excellent working
example of which is shown in Figure 1.4 and Equation 1.2:
Risk = Likelihood * Consequences (1.2)

17
In the ISO 31000 system and this thesis, the common vocabulary uses (i) the term likelihood,
(also termed in other situations as probability or occurrence) with dimensions or units of
events per unit time, and (ii) the term of consequences (also termed costs or impacts) with
dimensions or units of value or cost per event. The model therefore gives an expected risk
output of value (or cost) per unit time. This simple mathematical method and its parameters
are dimensionally and conceptually consistent and robust, although as follows can be argued
as incomplete. The example model in Figure 1.4 is one of the more complete and consistent
examples of the two-domain ISO model in published literature. It includes simultaneously,
both qualitative and quantitative measures in its matrix axes, using both logarithmic and
perception scales, enabling a user to assess the best criteria for their risky situation.
Figure 1.4: A composite, qualitative – quantitative matrix model for risk assessment:
source Risk Management Group Ltd, Training Flyer 2015
The expected risk outcome (the multiplication product) may be typically described on
qualitative or quantitative scales (Stevens, 1946) with the two key parameters being either an
ordinal scale (such as: low, moderate, high, severe, critical, and catastrophic) or a ratio scale
(such as ranging from say $1,000 to $1 billion). Other scales may be selected as appropriate
to the system size. In an individual’s wealth scale, the expected risk outcome range of low to

18
catastrophic may be $100 to $1 million, while for a substantial community the same ordinal
scale may give a ratio scale of $100,000 to $1 billion being 1000 times greater. This thesis
explores this question and human understanding of scale for likelihood and consequences by
a survey of individuals and communities in the montane Snowy Mountains region. The event
likelihood and the consequences in the matrix in Figure 1.4 are not inanimate, static
parameters that on their own lead to a deterministic level of risk, but they are also strongly
behavioural (anthropologically) and dynamic (temporally) influenced. This leads to
recognition that risk outcomes over time are strongly influenced by the behaviours of the
animated environment in which the risky hazards exist or natural disasters occur.
Expansion of ISO 31000 into a three domain model
In contrast to the two-parameter matrix, Geoscience Australia (GA) and many other
approaches have incorporated a qualitative three-domain approach as described in the Cities
Project (Middelmann & Granger, 2000, Middelmann, 2007, Crichton, 1999), to develop
improved urban risk management structures.
GA has based its approach on an understanding that total risk is the outcome of the
interaction between a hazard, the elements at risk, and the vulnerability of those elements, as
can be shown by the expression shown in the Equation 1.3:
Total Risk = Hazard * Elements at Risk * Vulnerability (1.3)
This equation is used by Crichton (1999), Middelmann (2007) and Geoscience Australia in
Figure 1.5 where Elements at Risk aligns with Exposure. This image representation has
modelling difficulties since any well posed quantitative model needs each parameter to be
dimensionless, or in the same dimensions, or in complementary dimensions and scale:
Figure 1.5: The Risk Triangle (after
Crichton 1999)

19
Convertito (2004) used a similar approach in describing the Italian risk domain (Italian Civil
Protection Department, ICPD) for seismicity with risk, R being defined in Equation 1.4 as:
Risk (R) = Hazard (H) * Vulnerability (V) * Exposure (E) (1.4)
In the Convertito / Italian seismicity approach, H is the probability that a given level of a
selected strong ground motion parameter being exceeded in a given time period and V is the
probability that a given level of damage is reached as a consequence of the seismic event.
Thirdly, E represents the estimation of the expected number of human losses or the monetary
estimation of the element exposed to the risk for which the analysis is carried out. This leads
to the observation that seismic risk is a stochastic expression of the product of the seismic
hazard and its consequences. Convertito further discusses the two approaches to hazard risk
assessment at any particular location being the stochastic and deterministic approaches.
The deterministic approach can be considered more useful in the analysis of a well-defined or
properly posed scenario with measurable inputs and strongly quantitative outputs, whereas in
the stochastic approach, the statistical outcomes of multiple events or hazards are collectively
considered. Both deterministic and stochastic methods, as well as the GA and ICPD
descriptions, use a formula model as in Equations 1.3 and 1.4 to display and analyse data.
There is a use for both approaches (McGuire, 2001) either individually or collectively, but
often the choice is by convenience rather than optimised information outputs matched to the
modelling purpose. Of more concern is that the quasi-quantitative formula or expression as
used to link the three domains in the GA and ICPD methods has dimensional inconsistencies
unlike the simple yet mathematically robust ISO method. All publications sighted from these
organisations appear to use the three domains as qualitative descriptors or mathematical
metaphors for hazard risk mapping rather than as robust quantitative model inputs.
There is no specific objection to the use of qualitative, image based models (as discussed in
the following Chapter 2), but when using deterministic formula models there is a reasonable
expectation that mathematical rules of parameters and operators will be applied in a well
posed manner to produce robust quantitative outputs. This is extremely important to actuarial
applications, such as the insurance industry (refer to Equation 7.1 p 236 later). The absence of
robust statements of dimension and domain limits in Equations 1.3 and 1.4 means that based
on the information given in the statement descriptions of these authors and organisations, the
equations might have been written (as attempted by some projects) in the form of:
R = H + E + V; or R = H * V / E (1.5)

20
The Study Objective and Supporting Framework Constraints
The main object of the study and thesis is to create a well posed mathematically robust and
flexible model. It is intended to achieve a model in the form of Equation 1.6:
Risk($/year) = Likelihood(events/year) * Consequences($/event) * Behaviour(do) (1.6)
This innovative development of dimensionless (do) elements in a complex dimensioned
model, if successful, presents a new opportunity to evaluate quantitatively the role of
communities in the risk outcomes of natural hazards and disasters. A few words of caution
are needed around being particularly careful of the quantitative consistency, relative scales,
the domain linearity (cf logarithmic / power law data), as well as the relevance of the
dimensionless domain inputs.
The use of scaled dimensionless elements does enable the transformation of raw data into
coherent information that produces useful approaches for priority setting. An example of this
approach is reported in Hart (2013b), for a wide range of natural and renewable energy
options. These are normally non-comparable, but can be normalised in a dimensionless
domain for prioritising investment in the natural and renewable energy sector.
Maintaining quantitative consistency within a framework is inherent in most mathematical
systems. It is the standard view across the physical sciences (Brown 2013a, Himmelblau &
Riggs 2012, OpenStax 2012, PSSC, 1960, Sonin, 2001, Hart 2013b) that well posed
quantitative models including equations and formulae are entirely dependent on dimensional
and unit consistency across the system being considered. Readers of this thesis who may have
not had this background are directed to a useful online refresher on this topic by Sonin (2001)
and distributed as a free PDF by The Massachusetts Institute of Technology (MIT). The
development and solution of well posed models is an essential aspect of this study.
It is therefore proposed that the three-domain approach is sound and more useful than the
two-domain ISO approach. In Chapter 6, this study will show the role that anthropological or
human behaviours play in emerging, accelerating or diminishing risky event outcomes, in
addition to the two inanimate domains of risk likelihood and risk consequence.
The addition of a third domain of risk (being human behaviours) to a model that is already
dimensionally consistent creates a problem – what will be the nature of the new domain? The
options are to modify the dimensions of the two original domains to accommodate the new
domain or to make the new domain dimensionless (signified by do). This study aims to

21
explore and develop a third dimensionless (as described in section 2.3, p65 later) domain that
reflects the influence of human behaviour on risky event likelihood and consequences.
Geographical Framework: montane, lowland, and coastal places
Geography as a discipline is described in two main branches: physical geography that looks
at the natural processes of the Earth, such as climate, oceans and geology, and human
geography that looks at the impact, interactions, and behaviour of people and communities in
the physical environment. The earlier vignette examples of settlement decisions of 18th
and
19th
century colonists show some of the interactions of communities and geohazards, and the
economic impacts of disasters they suffered. This thesis shows how both branches of the
geographical framework are important to the modelling of natural hazards. Further the
addition of a third domain to the traditional risk equation, introduces a new and innovative
way of capturing these effects in a quantitative and robust manner.
Mostly, communities adapted to the risks with: (i) hazard barriers, for example, river bank
levees; (ii) regulatory barriers, for example, prohibition of development on hazardous land;
(iii) response agencies, for example, fire brigades to extinguish geohazard as well as human
fires; and (iv) advanced management skills protection of the infrastructure investment.
This study generalises the three main topographical land-based environments for settlement
places as montane, lowland, or coastal. It considers how they are different and why it is
useful for in-depth and field research to recognise these differences when researching human
responses to natural hazard risks. In particular, montane environments present the most
challenging of the three environments. Montane environments could be defined simply as
mountainous regions. In this study montane will extend beyond strict mountainous features
to include the adjacent lowland or coastal areas that are strongly influenced by the mountains
among them as seen in the Kelso flooding vignette earlier. Therefore, the montane
environment is most likely to bring together the widest range of major geohazard risks, as can
be seen in Table 1.2.
Importantly, because of their natural scenery and year round recreational opportunities,
montane environments are generally significant tourism destinations. Conversely, lowland
and coastal environments tend towards localised geohazards that are specific to each location,
as in Table 1.2, but these geohazards have greater consequences because of extensive built
environments and permanent populations in these places.

22
Table 1.2: Most significant locations for the 10 major geohazards
Coastal Locations Lowland Locations Montane Locations
Cyclone (aka Hurricane) Rain/Hail Storm Earthquake
Tsunami Blizzard Landslide
Tornado Volcano
Bushfire Bushfire
Windstorm
Blizzard
Economics Framework: Applied Environmental and Resource Economics
Tourism and infrastructure in the same space and place involve large assemblies of people
and capital, and across short and long timeframes. The risk shared with these matters
typically falls within the field of economics and risk (Renn 1992, 2008a, and 2008b) but the
range of scope and timeframe involved means that the risk does not easily fit within one field
of economic research. Consequently, this study recognises montane natural hazards have a
strong influence on the micro- and macro-economic outcomes including risks to the
population, the region, and the national economy.
As the financial investment in the montane built environment grows in the montane regions,
the private and public economic impacts from risky hazards and events becomes more
important to economic planning and policy of local, state and federal government. There is
increasingly a stronger desire to understand geohazards through the gathering of disaster
event data, and to use that data to design better preparatory, response and recovery strategies.
The Snowy Mountains Region, like the montane regions of most developed countries clearly
shows the importance of understanding risky effects on the environment as well as the
implicit natural resources, and how those effects will impact efficient economic development
in this important south-eastern Australian region.
The thesis will demonstrate the complexity and importance of improving modelling systems
and in particular transformation modelling to inform better policy responses to the
preparation, response and recovery from natural disasters. Although this study will not focus
directly on strict economic parameters, it will do so indirectly by developing models that will
enable better forecasting of economic effects.
Therefore within the ANZSRC Field of Research (FOR) system, the FOR code of 140205
applies, being the field of Applied Environmental and Resource Economics.

23
1.3 A Proposal for Transformation Modelling
Typically, a vast amount of situational data from a particular natural disaster is collected and
stored during the time band of the event. The data is collected by participants such as
emergency responders, government agencies, and researchers. A major intention of the data
gathering is to enable pending or future events to be compared closely to a documented,
comparable, historical event and to enable better forecasting of the impacts of a future event.
The impacts of most natural disasters are the outputs arising from multiple inputs to systems
or situations that are related through complex relationships between model domains. In this
study, these relationships are as important as the elements and attributes of transformation
models. This study develops, in later chapters, an original approach to physical data and
information management, relationship definition, and then transformation models enabling a
new approach for data-to-information transformations and subsequent decision making.
Even more complex than physical parameters, is the effect of human behaviour during event
time bands. The widely varying possible behavioural responses can hugely alter the logically
forecast outcomes that are based only on measured situational and physical data.
The internationally standardised tool for managing situational risk or hazard is the two-
domain matrix of historical event frequency and the magnitude of consequences discussed
earlier. An objective of this study is to extend the traditional two-domain matrix to a three-
domain matrix that includes a participant behavioural ratio and informs more reliable
forecasting of outcomes from natural disasters.
1.4 The Research Question Set – Primary and Five Secondary Questions
This study considers the scientifically described behaviours of geohazard components in
selected environments subjected to geohazard events as well as the impacts of resulting
disasters. It is considered that in the five brief vignettes above, the consequences of
reasonable geohazard risk in the form of disaster event outcomes has been materially
worsened as a consequence of sub-optimal settlement place decision making. While in many
cases the communities have been able to recover and rebuild, demonstrating their resilience,
rarely is the question asked, what might we have done with the recovery and rebuilding funds
had the event not occurred, or been less severe, or been avoided. The question is sometimes
asked when there is a sense that community intervention may have reduced the costs such as
in bushfires, or flood protection works. Most often the question becomes: how could better

24
decision making on community development planning mitigate the damage outcomes and
reduce the funds diverted from other essential community activities into the recovery and
rebuild, or what is the avoidable opportunity cost.
It is considered that (i) the modelling of assets, energy and behaviour information for (ii) the
built and human domains that (iii) incorporates the risk of occurrence, the impacts, and the
behaviours of participants, can lead to better community decision making. This is expected to
help policy and operational managers in the risk assessment, event response, and recovery
from major geohazard events. Further it will strengthen the evidence for regulatory geohazard
barriers and conditions imposed on private or public developers who are tempted to seek the
lowest short-term cost, rather than the lowest risk-cost profile for their development.
From these elements the Research Question Set becomes:
The Primary Research Question:
How should a structured system of natural hazard risk models be developed to enable the
quantified forecasting of natural disaster risk outcomes?
The Five Secondary Questions:
1. Is the ISO 31000 an effective framework for the structured system?
2. How might traditional representational models of historic events be transformed into
forecasting models for future events?
3. Is the Gutenberg-Richter seismic likelihood / magnitude model of a region with strong
historic anthropological influences, able to be transformed for future natural hazard
event forecasting purposes?
4. Is the qualitative Modified Mercalli Intensity scale of seismic event consequences able
to be transformed into a quantitative model that enables forecasting of damage across a
region with significant seismic and geological anomalies?
5. Is the human awareness of natural hazard risks able be modelled to enable forecasting
of human involvement influences on future disaster event outcomes?

25
1.5 Research – Overall Project Method
An initial background literature review and research into natural hazards and disaster has
found that the subject is multidisciplinary with a wide range of researchers in social and
scientific disciplines working in the field(s). Natural disaster events occur at widely different
locations, and in unpredictable timeframes, meaning that research is inevitably reactive and
often situation specific. It appears logical that in trying to understand these events that a
combination of methods and models is required to identify true boundaries and behaviours of
natural hazard events and their impacts on people and communities.
For example, as will be seen further on, the Eucumbene and Warragamba dams and water
reservoirs were most likely wrongly identified as being the cause of Reservoir Induced
Seismicity because of single method modelling. It was found that the seismicity at these
locations was probably natural and coincidental, not reservoir induced.
Further, the study finds that human behaviour influences natural disaster outcomes beyond
the geophysical probability and impacts, but there is no mathematically sound modelling
method for measuring human behaviour and using that model to forecast future outcomes.
These and multiple other deficiencies in natural hazard and disaster, definition, measurement,
modelling and forecasting have informed the structure and methods for this research project
in the specific situational studies in the respective chapters.
(a) Research Question: A Method for Geohazard Risk Modelling
Noted above is that more recently peoples of the world have tended to look to their leadership
for guidance and survival of geohazards and disasters. This is largely evidenced by the almost
mandatory television news pictures of political leaders touring a disaster zone and meeting
with survivors, and the very high level of media criticism should they not do it “properly”
(Roberts, 2017). In many natural disasters, the delivery of leadership completely or partially
fails at least some community expectations of prevention, minimisation, and recovery. To
give leaders better management tools, the international general risk management standard
ISO 31000:2009 was developed, and became widely adopted for disaster management.
Whilst the risk standard itself can be considered to be without material fault, its application
has been much less so. For example, Environmental Impact Statements in all Australian
states for major developments, such as new mining operations or power stations, are required

26
to include a risk assessment showing how risks will be identified and managed (COAG
2012). The process for evaluation of the EIS risk assessment is one of submissions and public
hearings of objections against the proposals. There is an easily demonstrated opportunity for
proposal risk assessments and public submissions to simply not identify, nor properly
quantify inconvenient risks, owing to poorly informed public objectors. Then the likely
outcomes (managed and unmanaged) are not properly identified and management plans are
not adequately prioritised, resulting in a shortfall in the delivery of public expectations.
This situational risk is equally as serious in geohazard and disaster environments as it is in
major commercial developments. This can lead to a number of serious failures in inherently
risky situations such as new developments as well as established locations, which may
include:
Not identifying significant system risks
Not providing an adequate description of identified risks
Not providing an adequate description of risk consequences
Not providing sound treatments for identified risks
Not providing for the emergent behaviours for some risks
Not ensuring the risk treatment does not itself introduce new risks and consequences
Not integrating the assessment activity with other management processes
The common theme in these failures is that while they identify a process of physical failure, it
is a failure in the expected behaviours of the risk assessment process participants that is at the
root of the failure itself. It comes as no surprise that in this standardised approach to
managing failure and risk, it is the participant and population behaviours, where most of the
risk lies and needs to be considered in any analysis.
Therefore, as well as the intention to understand and model the physical characteristics and
natural behaviours of natural systems (for example event probability and event consequences)
an equally important element of this study is modelling the behaviour of the participants in
risky events. An analysis of individual causes of death shows that just 8 of the 185 deaths in
the Christchurch earthquake (Press 2011), and a similar ratio of one in 13 deaths in the 1989
Newcastle NSW earthquake (McCue 2014), were caused by the direct action of the
earthquake itself on a person (hit by rock fall, being knocked over etc.). The others were
generally caused by the indirect actions of human participants whether they were building
designers and builders, transport operators, or participants in the community risk
management and recovery processes.

27
Measuring the human cost of bushfires is more problematic. It is generally accepted that
bushfires are a geohazard, arising from intense hot, dry, windy weather that creates the
conditions for an unmanageable grassland or bushfire. The tipping point from hazard to
event is however quite a low natural probability for any particular location and time. Whilst
the weather conditions that will almost certainly lead to a bushfire are well known, the areas
impacted by a bushfire are typically less than 5% of the area exposed to the risk, and in these
cases some 85% of the bushfires are started either deliberately or accidentally by a human
activity (AIC 2008a, 2008b, VBRC 2010). The other 15% of bushfires are assumed to have
other causes such as a windblown falling tree, lightning or other natural causes.
This study will consider earthquakes as case studies of different geohazards because they
represent the range of differences (in spatial, temporal and management capacity terms) and
will test our ability to create comprehensive models, for example as the chosen case studies
illustrate the differences being:
Events from the two main geohazard domains: meteorology and geology
Events unfolding via two different temporal domains: progressive and instantaneous
The forecasting or event planning timeframe is different from days ahead to immediate
The impact damage causes are different: from mostly natural to mostly anthropogenic
Each of these case studies however, displays common characteristics that are found in almost
all geohazard events such as:
The release of both initial event energy and the triggered release of stored energy
The stored energy (e.g. chemical and mechanical) greatly exceeds initial event energy
The main damage to people and property assets arises from stored energy release
Participants may show irrational behavioural responses based on perceptions not fact
These issues will be explored in the analysis of data relating to the hazards and events, and
the subsequent development of the models. They may then be used for forecasting risks, and
planning response and recovery programs by all participants in events. The participants in
the events will generally include:
The people who were involved in the community settlement, it’s siting and planning
The people who live (including recreation) and work in the community
The people who provide support and management services to the community
The people who provide response and recovery services after a geohazard event.

28
All these people will make decisions based on the accumulated information and knowledge
of geohazards and subsequent events, which can materially affect the outcomes of a disaster
event to be more or less severe. The project seeks to provide more structured approaches to
information management, based on sound scientific models of forecastable behaviours that
can materially improve hazard event outcomes.
(b) Research Project – Research Process and Method
The method for the research project will be as follows:
a) A literature survey that considers: types of geohazards, current methods for analysing and
assessing hazard and event risks and outcomes, the potential mathematical tools for
modelling hazards and events, systems and modelling theory, and past published research.
This will be related to geo-hazard behaviours in the NSW Snowy Mountains Region and the
NZ South Island and their montane regions, and human behaviours in the risk domain for
these regions.
b) A survey and analysis of a large number of general models that transform data into
information as they evolved for human use over the many millennia of human thinking
development. A large group of models will be examined for the commonality of attributes
application and discipline to enable a structured approach to generic model selection and
application in the process of transforming data into usable information.
The generic models so developed will be applied to three situational studies to enable a
structured approach to the transformation of raw data into useful information, for application
in natural disaster decision making.
c) The first situational study considers a temporal and spatial investigation of the nature of
seismic events in the Snowy Mountains Region. It considers the influence of the construction
of the Snowy Mountains Scheme for hydroelectricity and irrigation between 1949 and 1974
on the seismic event profile of the region. The study will consider the forecast likelihood of
events using the benchmark model of Gutenberg and Richter that was developed in the
1940’s. The resulting frequency-magnitude models for forecasting earthquake probability
will be tested against measured experience. It will consider suspected occurrences for
reservoir induced seismicity (RIS), for example the Thomson Dam in the Victorian Alps, and
consider the risk for RIS in the 16 storage dams in the Snowy Mountains Scheme, as well the
three major water storage reservoirs found within the study area: Corin, Bendora, and Cotter.

29
This analysis of natural and anthropological seismicity enables a forecast model for future
seismicity and impact risks to human and property assets in the region.
d) A temporal and spatial study of geohazards in montane influenced regions forms the
second situational study. This case study considers the impact and influence of the 2010-11
Christchurch sequence of earthquakes at distances remote from the Christchurch urban area
that has been the focus of many recent research studies. The Banks Peninsula basalt shield of
extinct volcanoes caused the fault development and accumulation of alluvial sediments
between it and the South Island mainland. This became the centre of the massive damage by
liquefaction and rock falls from the volcanic mountains, resulting in 185 fatalities.
e) The third situational study includes a survey of stakeholders (being residents, workers and
recreational visitors) in the Snowy Mountains Region to determine how stakeholders in a
risky environment consider risk probability and consequences. This survey was conducted
within the formal human ethics requirements of the University of Canberra. It has several
stages and provides linkages between the likelihood and consequences studies outlined in
Chapters 4 and 5, showing the impact of the human domain on the two major inanimate
domains of risk management.
This situational study will involve a paper based confidential survey, personally handed to
residential, employed, and recreational stakeholders, to be completed at their convenience
and posted to the researcher in a self-addressed envelope. The survey mechanism was chosen
after a study into survey methods and the effects of methods, and surveyor age and gender on
survey responses, and a test study into styles of questions including measurement scales. The
survey will investigate how members of the public as well as infrastructure managers might
be at risk of compartmentalising risk management around inanimate measures, rather than
integrating the human attitude and activity trends into the risk profile, and consequently the
assessment, response and recovery decision processes. Such a result and the stark realisation
of the consequences of natural disasters generally, and in montane regions specifically, can
inform whether emergency response systems for the protection of people and property need
different strategies for montane regions than for lowland and coastal regions.
f) The final part of the project method will be the development of a decision making model
that will enable stakeholders in different geographic communities to use important
information, integrate behavioural information with geophysical laws on disaster occurrence

30
and consequences. This will enable them to make informed decisions about geohazard risks
and their decisions on preparation, response, and recovery to geohazard events.
1.6 Thesis Plan
This thesis is structured in three parts. Firstly, the development of the project concepts and
methods, secondly the four research chapters, and thirdly the synthesis of the research
outcomes and the new knowledge created. The study is international in scope and approach,
drawing research outcomes from natural hazard studies in both Australia and New Zealand,
two close but very different geophysical places in size, climate, geology, and exposure to
natural hazards. Therefore, developing a model that covers studies in both countries also
begins the process of developing a new general global approach to natural hazard models and
the decisions of communities exposed to these hazards.
Importantly, the study has been through an iterative process, resulting from increasing unease
at a number of multidisciplinary approaches reviewed, but also at a number of single aspect
studies. The form of this study, evolved as the research progressed. For that reason the
modelling approach that evolved from the analysis and synthesis of the data, began in a
foundation study that examines the creation of information from the beginning of human
thought. The foundation study is introduced relatively early in the thesis so that the reader can
see the way in which the three situational research studies converge on a new modelling
approach for natural hazards and community risk as shown in Figure 1.6.
Figure 1.6: Flow Chart Model of this Research Project
This approach of introducing the synthesis model early and raising it again a number of times
is intended to give assistance to the reader’s development of their understanding of the

31
research question. This iterative approach contrasts with the usual scientific method
approach, being a statement of an original hypothesis, but it does reflect a journey of
scientific exploration and the unexpected discoveries along the way.
To supplement the thesis a number of subsidiary research tools have been applied. When the
author found a paucity of tools to conduct the research, two subsidiary studies were
conducted showing how complex systems may be modelled and how quantitative tools may
be applied to such systems. The results of these studies are the Appendix to this thesis.
Part One: The Introduction and Literature
Chapter 1 begins by identifying the 10 most significant and relevant geohazards, across the
two main categories of geological and meteorological hazards as shown in Table 1.2. The 10
major geohazards are a mix of geological and meteorological geohazards and of particular
note is the propensity of natural hazards to occur in montane regions.
Chapter 2 follows with a literature review developing a contextual environment for this
study. It considers the literature on geohazards that impact on communities, how
communities and their populations manage their knowledge of geohazard risks and
subsequent disasters, especially in montane environments. This introduction notes that
geohazards fall into two major categories, geological and meteorological, and compares how
they differ and are alike and their respective risk assessment and management approaches.
The literature review then considers how a methodology using based on multidisciplinary
tools, leads to improved risk management. Chapter 2 will bring together three major domains
in preparing for natural disasters: (i) forecasting the likelihood of these events, (ii) forecasting
the consequences of these events especially on communities, and (iii) the behaviours of
communities and people in assessing the risk of future events. The literature review shows
the research, analysis and synthesis methods used in this project.
Part Two: The Four Research Studies
Part Two of the thesis is comprised of four chapters outlining each of the four research
studies, the research outcomes, and including methods used for treating model anomalies.

32
Chapter 3 provides a new approach to data and information modelling, based on an
extensive observational survey of systems modelling, that takes into account human thinking,
learning and decision processes followed by a pattern correlation approach. This chapter
describes a research study undertaken as part of this wider project to consider 2,968 data and
information models, and finds by correlation that all types of models in use can be grouped
into at least one of seven archetypal model forms.
Chapter 4 investigates the likelihood of occurrence of a natural disaster with a case study of
reservoir induced seismicity in the Australian Snowy Mountains. It considers traditional
methods and models for forecasting seismic occurrence, and the impact of anthropogenic
influences on the traditional models. The Snowy Mountains region is one of the most capital
asset intensive areas of rural and remote Australia, and so the twin impacts of natural
seismicity on large reservoir dams and reservoir-induced seismicity are of concern. This
study incorporates data from the Geoscience Australia online seismic database and is one of
the few opportunities in Australia to examine the seismicity of a significantly modified, large
natural system over a long period.
Chapter 5 considers that while the behaviours and likelihood of occurrence bring together
two factors that separately cause little impact, the combination of these factors, being the
growth or attenuation of energy from a natural disaster is very important. In this chapter, the
2010-11 Christchurch (NZ) earthquake sequence will be used to consider how real event
geophysical data can be modelled to simulate system behaviours and outcomes. Then, when
the data is transformed into a different model form, it reveals an important new underlying
behaviour in the intensity of the system. This situational study shows that distributed impact
damages previously reported in a damage intensity scale (Modified Mercalli Intensity or
MMI) is strongly influenced by a new quantified measure, “specific surface energy” or SSE
at distant locations. The SSE attenuation varies greatly, often less, but sometimes more,
damaging than the initiating energy for the event.
This concept of natural energy intensity is also developed in the refereed conference paper in
Appendix 2.3 (Hart 2013b). Upon reflection this specific surface energy basis seems
intuitively obvious when compared to the current quantitative method being force or impact
based directly, using data that is directly generated by sensing instruments. Calculating the

33
proposed specific surface energy (SSE) method for model building can be complex and
tedious, especially since the transformation is graphically based, but this first attempt as such
a method will potentially lead to improvements by perhaps a numerical method.
Chapter 6 will show the influence of human behaviours on most geohazard risk management
systems are implied in the physical parameters of likelihood of occurrence and consequences.
A field study records and compares the geohazard risk understanding of visitors, workers and
residents in montane areas. The most significant contribution of this part of the study to new
knowledge in this field lies in the development of a structured approach to a survey of
attitudes and knowledge towards human and property risk impacts that can be transformed
into a quantitative physical measure of forecast behaviours. The new approach is achieved
by integrating the traditional risk assessment methods of the two domains of likelihood of
occurrence and consequences with a third domain – the application of knowledge. As the
case study vignettes show, the informed application, or not, of extant knowledge can have a
major impact on disaster outcomes for communities regardless of physical likelihood of
occurrence and the impacts.
Part Three: Synthesis of Findings
Chapter 7 begins Part Three of the thesis where it is seen that most often, community
decision systems are based on the event origin circumstances, rather than the impact location
circumstances. It is the intensity of energy in the localised natural and built environment that
triggers a rapid escalation of stored energy, causing the chaotic system behaviours. These
behaviours present to decision makers, information that cannot be easily predicted, but can
form part of a reliable forecast and event management system. A new risk model will
demonstrate that this damage energy is typically many times greater than the initial hazard or
disaster natural energy release. In most natural disasters, the original event acts as a trigger to
release both natural and anthropological stored system energy that has accumulated over time
and emerges only once triggered by a natural event. Chapter 7 then shows how risk is
heavily influenced by the application of system knowledge and participant behaviours to
forecast outcomes during and after natural disasters. The corollary of this approach is that
knowledge is available that could significantly reduce the human impact on disaster

34
outcomes, but that decision-making processes which are heavily focussed on prima facie
responses, are not able to use new information in a properly weighted manner.
Chapter 8, the Conclusion, summarises several new knowledge outcomes arising from the
research questions for this project. The chapter also identifies potential ongoing research
work that is needed to take these concepts further, to enable and ensure a well-informed
community where individuals, managers and the community are able to achieve appropriate
risk outcomes for geohazard risk and events.
The Bibliography of references used directly in this study is but part of the background
material and research publications available in Natural Hazard and Disaster research. In
many cases, past and recent research is consolidated in government policy and research
reports that have been used in this thesis, and in these cases, much of the underlying research
for those reports is not directly referenced in this thesis.

35
CHAPTER 2: LITERATURE REVIEW
This chapter provides a research background to the subject of this thesis. The chapter adds
to the descriptions of in Chapter 1 and the natural hazards and disasters, and the communities
they affect. It presents the background knowledge, research and government interventions
that have helped communities, researchers and their leaders to understand, respond to, and
recover from natural disasters. Finally, it describes the knowledge and tools that will be
applied in this thesis to develop models that those communities, researches and their leaders
can use to make better risk assessments and preparations for future natural disasters.
2.1 Natural Hazards, Disasters and Affected Communities
In recent centuries, an improving understanding of the behaviours of natural systems and
empirical study of the physical sciences through observation, explanation, and modelling has
enabled more transparent and reliable forecasts of the future outcomes of leadership
decisions. In areas such as astronomy, seasonal calendars, and life cycles, the regularity of
event reoccurrence has given both confidence in the capability to use the physical sciences to
forecast certain future outcomes, and indeed an expectation that this capability can be
extended to the forecasting of all natural phenomena.
The desire to describe all systems through mathematics and the physical sciences reached a
crescendo in the early 20th
century, but was confronted by the incomplete works of the
unified field theory of Einstein (1925), and Alfred North Whitehead and Bertrand Russell’s
Principia Mathematica (1910). The failures to complete these works were followed by
Gödel’s (1931) incompleteness theorems. Gödel’s theory on undecidable propositions
showed “in certain formal systems it is not possible to simultaneously achieve consistency
and completeness”.
Einstein (1921, p15) had recognised this challenge earlier, when addressing the Prussian
Academy of Sciences in Berlin he said, “As far as the laws of mathematics refer to reality,
they are not certain, and as far as they are certain, they do not refer to reality.”
This did not cause mathematicians to give up but instead to recognise certain limitations to
their work most notably the influence of variability and uncertainty in empirical systems and
therefore to find new modelling techniques to bring these together.
The successes of systems modelling in military applications saw the rapid growth in the
science of operations research in the 1940s (Gass, 2005). This science blended deterministic
(formula driven) and stochastic (uncertain data driven) modelling to overcome the anomalies

36
and inconsistencies in natural and engineered system models. The distinguishing feature of
operations research lies in the application of science and mathematics to resolve problems in
which the human domain is an active contributor. Operations research might also be
described as the science of decision-making based on knowledge of behaviours of defined
systems. Attempts to more broadly understand and describe natural systems especially in the
biological sciences led to the definitions and study of systems commencing with the works of
Bertalanffy (1969) and leading the applications of systems theory as described in the
supplementary papers to this thesis (Hart 2013a and 2013b).
Over time, computerised methods capable of processing large amounts of observed and
calculated data, blended with Geographical Information Systems (GIS) to produce
multilayered maps have seen a reduced influence of the deterministic part of this blend in
favour of stochastic approaches (Fatichi 2009, Barbosa 2011). The application of
sophisticated statistical analysis techniques to derive deterministic models has been seen in
earthquake modelling with the work of Gutenberg and Richter (1949) with the examination
of approximately 3,600 worldwide earthquakes that occurred between 1904 and 1946. They
were able to develop a number of formula relationships that modelled the frequency,
magnitude and energy of earthquakes that still today have the capability to provide
reasonably reliable forecasts of the probability and impacts of future seismic events. Other
examples of logarithmic frequency–magnitude relationships include landslides in British
Columbia by Guthrie (2004), for Central USA rainstorms by Faiers et. al. (1997), for South-
western Pacific Ocean cyclones as reported by Stephens (2014), for North Atlantic
Hurricanes reported by Doheny and Dillow (2002), Tornadoes by Pateman & Vankat (2002),
Australian Bushfires by Easthaugh & Vacik (2012) and meteors by Watson (1939).
Natural hazard management of the full spectrum of events such as earthquakes, landslides,
storms, blizzards, floods, and bushfires, and in particular natural hazard risk management,
have entered the modelling arena in more recent times and generally reflects the recent
modelling trends towards large scale, data based, Geographic Information System (GIS)
assessment processes. This in part has occurred because the deterministic approaches whilst
providing high quality mathematical models were adversely impacted by the variability of
natural systems. The highly variable nature of the earth’s surface, the surface topography,
and the atmospheric and oceanic systems that surround it, cause much variability and many
anomalies in natural systems. This is indicative of a metaphorical comparison with Gödel’s
analysis of the difficulties of trying to achieve simultaneous completeness and consistency in
defined systems. But setting aside this goal simply because it is difficult is not an acceptable

37
option when there remains a viable opportunity for significantly improved protection of
human life and property assets by new and hopefully improved modelling approaches.
The exaggerated topographical variability in the earth’s surface as found in montane regions
provides multiple opportunities for anomalies to be found in deterministic relations for
natural phenomena. Montane refers to mountainous regions and includes high altitude or
marginal regions where the geological and meteorological behaviours are influenced by the
mountains themselves. This means that montane areas will include high plateaus, and the
nearby foothills of mountain ranges, and cannot be defined in terms of altitude alone: perhaps
the best definition is that montane regions are dominated by the mountains in their midst.
The nature of planet earth is that 70% of the surface is covered by oceans and further, 27% of
the land surface can be described as montane (Korner, 2005), leaving 22% as lowlands and
coastal lands. Whilst most of the world’s population live in lowland and coastal areas,
approximately 11% or more than 720 million people live in mountainous areas (Huddleston
FAO, 2003). These people are more likely to be indigenous peoples and understand the
natural hazards that surround them implicitly; however, the beauty and recreational
opportunities of montane regions bring large numbers of lowland visitors and tourists to these
regions. These visitors bring an estimated 15-20% share of the global tourism market,
generating between 100 and 140 billion US$ per year (Kruk 2010) and therefore providing a
significant contribution to the montane economies. This economic activity comes with risks
as the unfamiliarity of visitors to montane environments can also leverage the natural hazard
risks to much higher levels. Whilst most lowland and coastal resident populations will be the
dominant human influences in their own systems, in montane regions we need to consider the
influence of visitors and tourists as a significant part of the montane systems.
The nature of montane regions can create a more demanding physical environment for all
activities since with greater surface profile anomalies (such as mountain barriers, landslide
risks, rapidly changing weather, fast moving rivers and winds etc. , there is a need for a more
complex approach to natural hazard modelling of the anomalies as well as any open spaces.
This thesis will consider these modelling issues but will provide a new approach by
considering anomalies as a normal part of a diverse landscape rather than exceptions. The
thesis will use generalized Newtonian physics based models in matter and energy physics to
describe the elements of natural hazards and their impact on communities. The method
adopted for this study will examine in detail case studies in seismicity, resident and visitor

38
behaviours and their effects in related lowland and montane environments by considering
seismicity and tourism in the Australian Snowy Mountains, and the recent Canterbury
earthquake sequence in New Zealand. The impact of natural events is examined with an
anomaly inclusive modelling approach that will examine how to model community impacts
coherently and distinctly through the international ISO 31000 approach to risk likelihood and
consequences.
In developing the systems approach, the author found that much of the methodology
demanded the use of a range of trans-disciplinary tools some of which are not often used
contemporaneously. In some cases, the rules and definitions of these tools have not been
developed robustly, and in others they had not been applied in a consistent manner across the
various academic disciplines or research environments that use them. The author therefore
found it necessary to develop a number of new fundamental modelling tools from first
principles and apply these tools to this research.
Geological Hazards (earthquakes, tsunami, volcanoes and landslides)
The main five geological hazards are earthquake, tsunami, landslide, eruption and meteor
impact. These are generally regarded as distinctly different types of events even though in
certain circumstances they may occur contemporaneously. Generally, however they are
independent or if events occur contemporaneously such as an earthquake and a tsunami there
is typically significant spatial separation between their most serious impacts. For example in
the magnitude 9 Tohoku earthquake that led to the Eastern Japan Tsunami in 2011, many of
the 18,000 deaths and much of the US$ 150 billion cost of the damage including the
Fukushima Nuclear Plant meltdown were due to the tsunami rather than the originating
earthquake (Nakayachi & Nagaya 2016). Similar compound events show likewise that it is
more appropriate to consider a single rating for geological events. A good description of
these major five geological hazards and events is found in most physical geography texts
(Abbott 2008) and will not be developed further here.
Meteorological Hazards (storms, floods, cyclones, blizzards and bushfires)
The five main meteorological event types are storm, bushfire, cyclone, flood, and blizzard.
These are also each regarded as distinctly different types of events even though in certain
circumstances they may occur contemporaneously. Generally however they are independent

39
or if events occur contemporaneously such as a cyclone and a windstorm there may be a
significant spatial separation between their most serious impacts. At times there may also be
contemporaneous hazard from the geological and meteorological domains such as a storm
also creating a landslide. Similar compound events show likewise that it is more appropriate
to consider a single rating for meteorological events as the difference between a windstorm
and a blizzard may be only temporal. As for geological hazards, good description of these
five major meteorological hazards and events is also found in most physical geography texts
(Abbott 2008) and will not be discussed further here. The ratings are also generally self-
evident and at this stage are presented here as indicative ratings for communities and
countries with a reasonably strong, well aware, and self-sufficient natural disaster response
organisation such as: Australia, New Zealand, Japan, Italy, Spain, Portugal, and the United
States.
Review of Occasional Government Responses
As discussed earlier in the vignettes, the direct geohazard effects of a natural disaster may be
enhanced or diminished by the proximity or otherwise of communities. This also affects the
event consequences, expectations and role of government, which may increase according to
greater community impacts. The role of government in modern liberal or laissez faire
economies has undertaken a major shift during the 20th
Century away from the classical
liberal philosophy views of the 18th
Century. Much of this change was led by the United
States in part because it was one of the world’s largest economies, but also in part because the
United States represents a new process in creation of a new superpower (von Mises 1940,
Horwitz 1987). All superpowers the world has known have a long tradition of cultural and
political development sometimes traversing 3,000 years and so change was hesitant and crisis
driven. Most superpowers share the same long-range economic ideas and global trends (Paul,
1980) typically through invasions and trade. The United States is the first colonial creation of
a new superpower.
The laissez faire economic and legal principles embodied in the American Constitution
(ratified in 1788) evolved from the liberal philosophy of John Locke (1690, §3) who
proposed:
“Political power, then, I take to be a right of making laws, with penalties of death,
and consequently all less penalties for the regulating and preserving of property, and

40
of employing the force of the community in the execution of such laws, and in the
defence of the commonwealth from foreign injury, and all this only for the public
good”.
Locke further commented (Locke, 1690, §13):
“I easily grant that civil government is the proper remedy for the inconveniences of
the state of Nature”.
Moreover (Locke 1690, §63, emphasis added):
“The freedom then of man, and liberty of acting according to his own will, is
grounded on his having reason, which is able to instruct him in that law he is to
govern himself by, and make him know how far he is left to the freedom of his own
will.”
Core to this philosophy of economic and political freedom are the words “grounded on his
having reason” which implies having the knowledge to make reasoned decisions. As the
world order became more sophisticated the limited role of laissez faire government came
under pressure when citizen groups demanded greater intervention in economic and civil
affairs. This pressure pushed the role of government well beyond its traditional 18th
and 19th
Century roles of property and criminal law administration, and the undertaking of wars
described by Locke.
The great economic depression of 1933 was the first major intervention (von Mises 1940,
Evans 2009) of governments into a national response to a non-military disaster affecting a
country, and became a model that was followed to a greater or lesser extent by governments
around the world. This response set the tone for both (i) a requirement for a capability of a
national government to intervene in the “inconveniences of nature”, and (ii) the expectation
of the population for greater intervention by government in the response to matters beyond
their control and reason. These community expectations have clearly influenced the setting of
the terms of reference and the recommendations of the 2009 Victorian Bushfires Royal
Commission (VBRC 2010) through a strong theme of reviewing the “whole of event” role of
government and government agencies.
Reflecting on this event Evans (2009, Introduction) begins “As I write, smoke from the worst
bushfires in Australia’s history hangs over my city.” Evans considers how disasters divide
and traumatise society, and how the determination of communities to respond and recover is
manifested. Evans brings together a diverse range of perceived and real disasters that have
both defined the shape of Australia and the nature of response by successive Australian

41
governments in both anthropological and natural aspects, to make his point. Evans discussed
10 significant, widespread events, temporally and spatially varied, that changed Australia, but
not all of which would meet modern consensus definitions of disasters. The 10 disasters he
writes about are as follows:
The (Australian) Resource Crash of 40,000 BCE
The Tasmanian Genocide: 1804-1938
Feral Nation – Rabbits: 1859 onwards
The Slaughter: Flanders 1917
The Great Depression: 1930-1939
Black Friday Bushfires 1939
The Snowy Mountains Scheme:1949-1974
Cyclone Tracy: 1974
Fool’s Gold: the Montreal Olympics 1976
The Great Drought: 2002 onwards
Evans validates his selection of disasters using one of the Greek time concepts; kairos as a
point in ordinary time (chronos) when there is a major rupture in the continuity of the
everyday, whether it is a major failure, or a success, in the response of a people to a tragedy.
This discontinuity concept is important to the concepts of emergent properties in systems
analysis, since this unplanned emergence creates community concern and anxiety.
Macdougall et.al. (2002) in “Thredbo, A Tragedy Waiting to Happen and other Australian
Disasters” writes also about the national impact of some 28 disaster events being: 14 natural
events and 14 built environment events. This volume records that in many cases critical items
of information or knowledge that could have prevented the respective events or significantly
reduced their impacts were overlooked. The development of Australia, its community and
government, and the responses to disasters has been shaped by these events and many others
like them. Australians have realised in both mind and substance that many people working
together can bring about a much stronger recovery from a disaster and an improved
preparedness for the next event. The role of government has not just been in the physical
recovery, but also in the building of a knowledge resource that enables the reasoned
responses described by Locke (1690). The debate and development of the role of
government in natural hazard management and disaster response has been led by

42
governments at local, state (and territory) and Commonwealth level. There appears to be
however, surprisingly little scholarly debate on these issues and the rightful roles of
government in Australia, compared to USA and other countries.
Australia is by all international standards a “top 10” wealthy country (OECD, 2014), a
country that has always provided, and more so in recent times, the resources expected by
communities to minimise adverse situation impacts and aid in the recovery. There has
generally been a strong consensus around the diversion of government’s financial resources
to aid victims of disasters as evidenced by examination of government’s role by commissions
and enquiries (VBRC 2010). The question in the liberal framework remains unanswered;
does such comprehensive intervention and support to disaster victims remove the reasoned
decisions individuals and communities should make to reduce the risk and impacts of quite
regular natural hazard events, especially meteorological events such as bushfires, floods and
cyclones?
The 2011 Queensland Floods and Insurance
The economic effect of catastrophic events and losses on community economies has often
been hidden by central government and international insurance intervention. For example a
“one-off” direct central government tax as a fund raising levy to rebuild Queensland’s
infrastructure after widespread storms in 2010-11 was introduced. The Australian
Commonwealth (PM 2011) committed to raising $5.6 billion for storm reconstruction in
2010-11. This was funded by approximately $2.8 billion in cuts to carbon reduction and
environmental projects, $1 billion by delaying other major infrastructure projects and $1.8
billion by funds received through the one-year flood recovery levy. The levy was 0.5 per cent
on all Australian personal incomes above $50,000 and a further 0.5 per cent on income above
$100,000 in the 2011-12 year.
This tax mechanism has subsequently created greater interstate disaster recovery expectations
for future, but as communities and cities grow the value of their built environment and the
continuing growth of urban and lowland populations as a percentage of country, such
interventions may not be possible or acceptable.
Following the Queensland floods, the Commonwealth Government established the National
Disaster Insurance Review, being an inquiry into flood insurance in particular, and included
in its brief (NDIR 2011, page i):

43
The Australian Government seeks to ensure that:
a. Individuals and communities affected by the floods and other natural disasters are
able to recover and rebuild as quickly as possible.
b. People are able to choose where they live in an informed way.
c. Individuals and communities at risk of future flooding or other extreme weather
events are aware of the risks but are able to obtain suitable protection against those
risks, both in terms of having access to insurance and benefiting from appropriate
mitigation strategies.
and in its objectives: the Review should be guided by the following principles:
a. Government intervention in private insurance markets is justifiable only where, and
to the extent that there is a clear failure by those private markets to offer
appropriate cover at affordable premiums.
b. The appropriate mitigation of risk by individuals and governments at all levels is a
key objective.
c. Individuals and businesses should be encouraged to insure themselves where
practicable.
These terms of reference contain a curious inconsistency. They begin with the presumption
of a failure of private markets and define the failure as being unaffordable premiums for
property flood insurance. The terms of reference do not allow the inquiry to establish whether
there is such a market failure, or whether any market failure is in a related area, for example
flood risk information.
Following the very serious floods in 1974, the Brisbane City Council, having many riverside
and floodplain properties subjected to repetitive floods identified a need by householders
(current and prospective) to access a free flood risk information service to overcome the
market failure in access to publically available, but previously inaccessible information. This
service enabled any person (in the early days) to telephone for instant free advice as to
whether any property was impacted by a previous major flood. It has since become a free
online GIS based service offering for any property, an instant three page report of past flood
histories, the flood risk and a flood cycle analysis. This free online 24 hour service enables
any prospective property buyer or tenant, to establish the flood risk by free and ready access
to information and best practice risk analysis. The anecdotal saying in Queensland often used
by the real estate industry practitioners and clients (Pers. Comm. (Centenary Real Estate,
Brisbane) 2000) was “if you can get flood insurance cover in Brisbane – you don’t need it”.

44
This reflected the view that riverside and flood plain areas that were flood prone were well
known, and easy to discover, and therefore an uninsurable flood risk.
The NDIR inquiry on the other hand proposed a scheme that obligated insurance companies
to provide flood insurance to all insured properties and a scheme of arrangement where
government would subsidise the gap between actuarial based prices for insured flood risk and
perceived “affordable pricing”. The Australian Actuaries Institute supported the concept with
the media comment (Actuaries 2012):
“The Institute recommends the creation of a national pool of funds to subsidise the
high insurance premiums of people living in disaster-prone areas,” said Institute
CEO Melinda Howes. “However, any assistance provided shouldn’t encourage risk-
taking behaviour such as building in flood-prone areas.”
Insurance is an important economic tool in efficient risk management by sending economic
messages to market participants, including residential house owners, through pricing
mechanisms (refer Equation 7.1 Chapter 7). Such a scheme would immediately add
significant regulated value to any property considered a high flood risk, especially highly
desirable riverside properties, and would indemnify any owner or tenant from losses arising
from a decision to build or live there. More importantly, it would create an effective transfer
of wealth from the Government to individuals arising from them making high-risk property
investment decisions. Further, any change in the pricing of the subsidy by a future
government would affect the property value and a reduction in subsidy could expose the
government to contractual compensation issues or the government could withdraw its
financial support and make the subsidy transfer-funded amongst the insured. This then
becomes a government legislated compulsory transfer of wealth between property owners
and a wealth transfer from general suburb properties to highly desirable yet risky riverside
properties.
The insurance industry in a liberal economy is potentially one of the most demand-supply
efficient sectors of the economy. Property insurance is internationally borderless with active
global re-insurance markets (Karl & McCullough, 2012). By being a second tier (i.e.
discretionary) financial product with strong price sensitivity, giving the opportunity for
potential customers to self-insure creates a strong push as well as opportunity to maximise
market efficiency in product pricing. In the highly regulated sectors of the Australian
insurance sector such as third party motor vehicle insurance and health insurance, risk is
generally equally distributed, pricing is generally oligopolistic and may be price efficient, but

45
this is difficult to evaluate because of the regulated product boundaries. On the other hand,
the deregulated property-liability insurance market has generally been economically efficient
for some time. Cummins (1993) has shown that internationally large insurers operate in a
narrow band around an average efficiency level of about 90 percent relative to their cost
frontier whereas efficiency levels for medium and small insurers are between about 80 and 88
percent respectively. Berry-Stölzlea (2011) reports that a single European market, even with
significant recent consolidation shows the validity of the efficient structure hypothesis in
property insurance with little or no evidence of price inefficiencies as proposed in the
alternative structure-conduct performance (SCP) or the relative market power hypotheses. In
other words two decades of research has shown that the property insurance market is
relatively efficient in sending market signals to consumers on the consequences of risky place
decisions with regard to their property ownership and that government intervention in product
offering or pricing will place that market efficiency at risk.
The 2013 change of government meant it was extremely unlikely that the NDIR proposal
would proceed, but the report and proposal were an example of how, well meaning, but ill
considered, government intervention can create, rather than overcome, natural hazard market
distortions and failures.
Government Response Plans
A more critical analysis of the role of government has occurred in the United States. The
United States news media presented most Hurricane Katrina (New Orleans, La, 2005) stories
as matters of government response and less about households and communities preparedness
or responsibility for recovery (Barnes 2008). The newspapers studied by Barnes focused
more on government response (or lack of it) than on key public health and community well-
being responsibilities in disaster management.
Governments (municipal, state, and federal level agencies) routinely make disaster plans. But
during Hurricane Sandy (New York and New Jersey, 2012), plans that took several years and
millions of dollars to prepare were ignored almost immediately (Liboiron, 2013). This study
concluded that discarding disaster plans is entirely normal, and may even be beneficial. After
interviews with officials in municipal and state governments as well as first response teams,
Liboiron concluded that New York City’s Mayor, Michael Bloomberg marginalized the city’s
Office of Emergency Management (OEM) upon the storm’s arrival, and relocated city

46
emergency management functions to his office. The story of why the OEM was sidelined is
complex, with institutional, political and personality clashes all playing a role, but other
levels of disaster planning have shown the same characteristics. New York City is a part of
several regional collaborative efforts, including the Regional Catastrophic Planning Team
(RCPT) that brings together emergency managers from New York, New Jersey, Connecticut
and Pennsylvania. The disaster planning done by the RCPT is also reported by Liboiron to
have remained on the shelf during Hurricane Sandy.
Sociologist Lee Clarke has argued that disaster plans should be understood primarily as
“fantasy documents” that function as rhetoric and tools designed to convince audiences that
they ought to have confidence in the subject organisation (Clarke, 1999). These fantasy
documents are designed to provide public trust in technocratic administration and
governance, and to subdue public anxiety by appearing to have the capacity to control the
uncontrollable, predict the unpredictable, and turn uncertainty into manageable risk.
Organisations can be powerful opinion influencers, whatever their motives, but they can also
be overconfident (Guillen, 2001). Even those that deal with potentially hazardous activities
such as nuclear power, oil transportation, toxic waste, as well as natural disaster relief engage
in unrealistic planning to reassure their constituencies that they can deal with emergencies.
Clarke considers that such plans are important in government perceptions but less so in
government process.
The notion of consensus and dis-sensus in times of crisis has been applied in research efforts
(Quarantelli, 1977). Dis-sensus types of crises are conflict oriented situations where there are
sharply contrasting views of the nature of the situation, what brought it about, and what
should be done to resolve it (Drabek 2007). The campus civil rights riots of the late 1960s in
the United States and western Europe gives examples of this type of crisis which is often a
political opinion crisis with clearly identifiable political targets and personalities.
Consensus-type crises are those where there is agreement on the meaning of the situation, the
norms and values that are appropriate, and the priorities that should be followed (Quarantelli,
1970). Natural disasters, as well as those disasters occasioned by (non-political) technological
agents, are major examples of this type of crisis (Quarantelli, 1977). Lakoff (2010, p1)
quotes John Gutfreund, former CEO of Salomon Brothers, who said "its laissez-faire until
you get in deep sh**." In October 2007, extensive wildfires covered parts of Southern
California, around Los Angeles and San Diego. The fires were blamed on the mixture of

47
strong winds, hot weather, and dry fuel, but as is often the case, the magnitude of the disaster
could not be attributed solely to nature. The firestorm also highlighted San Diego region’s
weak regulations and limited public resources for mitigating the wildfire risk to the built
environment. The region appeared unwilling to contradict demand and implement zoning
regulations to stem rapid housing development into the city backcountry where fire risk was
especially high. San Diego had declined to fund improvements in the city’s underfunded fire
department, even after catastrophic wildfires swept through San Diego County in 2003.
As local public firefighters awaited assistance from other regions, the "Wildfire Protection
Unit" of American International Group Inc. (AIG) attended specific properties in the northern
suburbs of San Diego being those houses belonging to members of AIG’s Private Client
Group, for which membership cost an average of $19,000 per year (Lakoff, 2010). Whether
the flames would destroy the homes of area residents thus depended on private insurance
rather than mis-funded public resources.
In contrast to the fragmented United States approaches, emergency management policy and
leadership in Australia is led by the Commonwealth Attorney General’s Department (AGD
2011) who under the Disaster Resilient Australia banner have produced booklets such as the
National Strategy for Disaster Resilience: Companion Booklet (AGD 2012, p9). The
strategy’s communication plan is built on simple, action oriented and relevant messages:
disasters will happen – natural disasters are inevitable, unpredictable and
significantly impact communities and the economy,
disaster resilience is your business – governments, businesses, not-for-profit,
organisations, communities and individuals all have a role to play and to be
prepared,
connected communities are resilient communities – connected communities are ready
to look after each other in times of crisis when immediate assistance may not be
available,
know your risk – every Australian should know how to prepare for any natural
disaster,
get ready, then act – reduce the effects of future disasters by knowing what to do, and
learn from experience – we reduce the effects of future disasters by learning from
experience.

48
From this strategy, Australian, State, Territory, and Local Governments have built common
regional strategies for risk assessment, event response planning, and recovery, mirroring the
international governmental approaches (NZ Civil Defence (CDEM) 2010, US-FEMA 2010,
UKCO 2010, and United Nations 2005 – as referenced in ADG 2011).
The biggest challenge facing this system for emergency management is found in the last
action message above: to learn from experience and enable reasoned decisions. The growth in
knowledge (Hart, 2013a) in any field or discipline such as natural hazards and disasters has
been and continues to be exponential, such that completely managing this growth will always
be a distant future objective. Managing information and knowledge includes accumulating
historical knowledge, building lessons, developing new knowledge, making it understandable
and accessible to risk assessment, planning and response agencies (Hart, 2013b), and
ensuring the relevant and appropriate knowledge is used. Likewise the irrelevant and
inappropriate knowledge is set aside as in The Brisbane City Council “Floodwise” reports. A
number of tools such as the ISO risk assessment standard (ISO 31000) have been established
to assist in this process in natural hazard and disaster management but such tools, which seek
to condense and oversimplify accumulated knowledge, create the very real risk of important
and useful knowledge being summarised into irrelevance.
Past approaches have been very practitioner oriented, driven by the immediate needs of those
involved and affected by a disaster, and the intent and capability of the responders to act
immediately to alleviate the level of distress as best they can. Response organisations such as
fire service, coastguard, police, and army reservists, have generally been a first response only,
withdrawing as soon as conditions have stabilised to the extent that normal civil and
commercial services can resume their role. In the very largest disasters, such as where a
region has had the fabric of their community destroyed (e.g. Victorian Bushfires (1851-
2009), Kelso 1980, Newcastle 1989, Thredbo 1997, and Christchurch 2011), communities
have required an intensive and ongoing government involvement to assist in the rebuild and
recovery. This application of continuing public funding to the disaster recovery has seen
demands for accountability in the original risky decisions of victims, from those less, or not
affected. This accountability includes ensuring that the response is appropriate, not
excessive, and is based on proper use of available information.
The AGD 2012 booklet’s second message means a responsibility of individuals to be
prepared; so when governments say “that is enough from us, over to you?” As governments
review disaster responses against: event knowledge, fiscal constraints, and consolidated

49
community expectations, clearer policies and strategies are emerging. The 2014 Government
Inquiry, in part, considered these issues reporting on the consequences of developments in the
Australian financial system since the 1997 Financial System Inquiry and the global financial
crisis. The Inquiry was intended to refresh the philosophy, principles and objectives
underpinning the development of a well-functioning financial system, including:
balancing competition, innovation, efficiency, stability and consumer protection;
how financial risk is allocated and systemic risk is managed;
assessing the effectiveness and need for financial regulation,;
the role of Government; and
the role, objectives, funding and performance of financial regulators.
The Inquiry Report (Murray (as Chair) 2014) had as a major concern, reducing risk
responsibility for a disaster from the government through more robust structures for market
participants such as banks, companies and customers. This goal reflects a political position of
a liberal government and is perhaps inconsistent with typical worldwide trends in the role of
governments in natural hazard disasters as outlined above.
Most major disasters now have an “end of event” phase in the form of a government inquiry
into aspects that gains a political profile, whether it is perceived planning, response, or
recovery failures. These inquiries also have the opportunity of bringing closure to the
government’s involvement and leadership of the event as well enabling event victims to have
a chance for personal closure. Generally, such inquiries make a number of structural
recommendations for changes to emergency services, community education, and government
policies and for future research to improve overall community resilience.
The next section describes one such enquiry that has possibly produced an unprecedented
database of all aspects of a major natural disaster event.
The 2009 Victorian Bushfires Royal Commission
The “Black Saturday” bushfires in Victoria in 2009, in which 173 people died, were reviewed
by a Royal Commission with a terms of reference (VBRC 2010 Volume 3, Appendix A, p 1),
being to inquire and report on:
The causes and circumstances of the bushfires which burned in various parts of
Victoria in late January and in February 2009 (“2009 Bushfires”).

50
The preparation and planning by governments, emergency services, other entities, the
community and households for bushfires in Victoria, including current laws, policies,
practices, resources and strategies for the prevention, identification, management,
and communication of bushfire threats and risks.
All aspects of the response to the 2009 Bushfires, particularly measures taken to
control the spread of the fires, and measures taken to protect life and public property,
including but not limited to:
o immediate management response and recovery,
o resourcing, overall coordination and deployment; and
o equipment and communication systems.
The measure taken to prevent or minimise disruption to the supply of essential
services such as power and water during the 2009 bushfires.
Any other matters that (are) deemed appropriate in relation to the 2009 Bushfires.
The Commission made 67 formal recommendations, and (including sub-recommendations)
gave 127 distinct recommendations for various government organisations and other entities to
undertake. These recommendations have been categorised by this author in Table 2.1,
according to whether the recommendations are planning, response or recovery, and whether
they cover operational, financial, social or policy objectives.
The scope and balance of the recommendations are heavily weighted towards Public Policy.
This in effect means much more rigorous government administration of bushfire management
and leadership, furthers the belief that improved administration and policy can make a
substantial contribution to mitigation of natural hazard and disaster impacts, and certainly an
expectation it is the expected role of government to do so.
Table 2.1: Analysis of the 67/127 Recommendations and Categories from the
Royal Commission into 2009 Victorian Bushfires
Objectives / Phase Planning Response Recovery Total
Number %
Social, Education 15 2 - 17 13%
Operational 12 17 - 29 23%
Financial 3 - 1 4 3%
Policy 58 9 10 77 61%
Total 88 28 11 127 100%

51
This contradicts recent USA experience and practice (Liboiron, 2013), being that event
leadership and emergency management people networks are more effective than documented
plans. On the other hand, the political intervention in Cyclone Sandy indicates there are
positive political outcomes to be gained for strong and successful state and local government
intervention, and so in line with comments above, the shift from individuals towards greater
government responsibility continues.
It leaves two key questions that arise from reading the Black Saturday witness statements:
Could government policy and administration change have materially reduced the
bushfire occurrence, magnitude and spread, and
Could government policy have materially changed the timing of the decisions made
by individuals to leave, rather than stay and defend to the extent that materially fewer
people would have made their decisions much earlier and saved many lives?
A reading of the more than 100 witness statements to the Royal Commission indicates
broadcast information that would have resulted in an earlier decision to “leave” was missing.
VBRC - Private Sector Emergency Response Agencies
The VBRC (VBRC 2010: Volume 1, Chap. 2) reports that landholders’ responsibilities for
fire on their own land have always been a part of Victoria’s bushfire management
infrastructure, including the very obvious forest industry brigades and private farm based
units. Commercial forest plantations are legally required to maintain local forest industry
brigades. In Victoria (2009), there are 24 forest industry brigades, staffed by 717 employees.
The industry brigades also have a community coordination role in bushfire suppression, in
which case they come under the operational control of the Country Fire Authority (CFA).
For example, Hancock Victorian Plantations (HVP), (Sewell 2009, and 2010) has seven
forest industry brigades registered with the CFA. On Black Saturday, 7 February 2009, HVP
had fire tower observers in position, a first-attack helicopter on standby at Latrobe Valley
Airport, 12 firefighters patrolling for arson activity, and a surveillance plane flying a circuit
around the Latrobe Valley (VBRC 2010: Volume1 Chap. 2). They had back up personnel and
equipment at a number of HVP depots together with operational coordinators on duty, and
throughout the day, a HVP liaison officer was located at the Traralgon Incident Control
Centre.

52
Private (usually farm based) units are usually not formally organised but operate in support of
the local CFA. They often arrive at fires before the CFA because they are responding from
nearby farms. They are an integral element of the fire first response, particularly in western
and central Victoria.
Professor ‘t Hart as an expert witness to the Royal Commission reminded the Commissioners
(VBRC 2010, EXP.3031.001.0002) that an emergency is a perceived threat to the core values
or life-sustaining functions of a social system, which requires urgent remedial action, under
conditions of deep uncertainty. Crises typically defy conventional administrative or policy
responses because they differ in scale, scope or complexity from the standard contingencies
that have occurred in the past and for which preparations may have already been made.
Professor ‘t Hart reports (page 2):
“that a full scale emergency presents policymakers with dilemmas that have impossible-
choice dimensions: everybody looks at them to “do something”, but it is far from clear
what that “something” is or whether it is even possible without causing additional harm.”
Although disaster emergencies have always been part of everyday reality, it appears their
character is changing with crises of the near future likely to be increasingly frequent and
generate higher impacts. Professor ‘t Hart discusses the ways modernization has seen social
systems become more vulnerable to disturbances with three especially relevant trends:
Growing complexity and tighter coupling of social, communication and government
systems. Unforeseen events are more obvious and publicised sooner, requiring
decisions to address the publicity rather than the emergency at hand.
The societal climate in which political leaders and organisation must operate today
has made it harder to deal with emergencies especially with regard to reduced
community tolerance of imperfections and disturbances.
Public organizations tend to prepare for known and expected contingencies, but the
administrative toolbox for routine disturbances has only limited use in the face of a
major previously undefined emergency.
Further Professor ‘t Hart notes that it is not at all easy to achieve complete collaboration in
emergency management. Wise & McGuire (2009) report that studies of emergency
management networks show key people give a low priority to complete collaboration, that
tribal identities are strong, particularly among the uniformed services, and that the divide
between full-time and volunteer emergency management workers can be persistent.

53
Wise & McGuire also note that in western United States multi-organisational networks have
become the primary vehicle through which disaster policy is designed and administered. The
formation and execution of natural hazards and disaster response policy requires the
performance of fundamental tasks that cannot be carried out by single government
organisations alone. This arises because each event has such a diversity of new parameters
that single purpose organisations cannot exhibit the diversity of thought required.
The VBRC, following the evidence of sector requests for a major change towards an
integrated single fully responsible fire organisation covering the metropolitan, country,
environmental and private fire services, then received the evidence of Ms Penny Armytage,
the Secretary of the Department of Justice (VBRC 2010 Vol2 Chap10; Armytage, 2010). Ms
Armytage said that the State (of Victoria) is implacably opposed to any significant
organisational change or amalgamation. She argued that no change was necessary and,
indeed, change could threaten operational capability with a particular emphasis on cultural
differences within different response services that, while having the same objectives, had
evolved situation and sector specific strategies and strengths.
Ms Armytage also highlighted the ‘industrial fallout’ that would likely accompany any
attempted restructuring move because of the different and competitive positions adopted by
the United Firefighters Union, the Australian Workers Union, and Community and Public
Sector Union who each represented different stakeholders in country, metropolitan,
environment and volunteer areas of fire response services. The Victoria government proposed
strengthening the existing system, with a focus on improvement and increased inter-agency
cooperation in information management while enabling a broad growth in capability.
The VBRC made 127 recommendations to the Victorian State Government with the
implication that there was much that was done badly, which if done differently would have
materially changed the outcomes. It was clear that the 2009 bushfires occurred in a time of
the most extreme weather conditions of wind temperature and preceding drought either ever
experienced, or at least ever recorded in Victoria.
The information and knowledge to fight or at least contain and limit the bushfires was well
known and well disseminated to firefighters in a situation where fire outbreak occurrence was
spread over a wide area and notably, about 95% of Victoria’s grasslands and forestlands did
not catch fire, while over 80% of the fires had anthropological causes. Their response whilst
subject to improvements and lessons learned would have not made as much a material

54
difference to the fires progress and eventual extinguishing, as did the change in weather to
cooler damp conditions.
The information to leave at risk areas was not as well disseminated in time and space, was not
well understood by the at risk sectors of the public, and resulted in many more deaths than
were inevitable in such a severe fire situation.
If there were systemic failures in the 2009 Victorian Bushfires it was in the expectations
around information management and an expectation that government had all the information
resources available in order to convey in an accurate and timely manner (for some people -
just before the last minute) the information on when it was time to leave. The expectation
that government knows best is deeply flawed in complex emergencies.
2.2 Review of Recent Research Approaches
Natural hazard research in Australia is carried out by private companies, emergency agencies,
research institutions and universities, however most government funding is channelled
through, or in association with, relevant cooperative research centres (CRCs).
The Natural Hazards and Bushfire CRC
The recently established Bushfire and Natural Hazards Cooperative Research Centre
(BNHCRC) arose from the Bushfire CRC before it. It has a strong research alignment (Bruce
2014) with emergency agencies and their work to manage the impact of broader natural
hazards on Australian communities. This includes research on the needs of emergency
services, land managers, all levels of government and the private sector. This CRC seeks to
conduct multi-institution and inter-disciplinary research across the three main themes of (i)
Economics, policy and decision-making, (ii) Resilient people, infrastructure and institutions,
and (iii) Bushfire and Natural Hazard Risks.
The research priorities focus on working with communities, to improve disaster resilience
and reduce the human, social, economic and environmental costs from bushfires and other
natural hazards. BNHCRC state their strategic direction for research that supports the
development of cohesive, evidence-based policies, strategies, programs and tools to build a
more disaster resilient Australia. The funding enables the BNHCRC to provide a long-term
research base that directly supports our emergency services and other government and non-

55
government agencies as they work to minimise, prepare for, respond to and recover from
natural disasters. This research also includes community and individual behavioural and
psychological responses to natural hazard threats and consequences.
It is understood (not referenced) that consideration is being given to adapting the
consequences parameter to include behavioural responses however this risks compromising
the geophysical nature of this parameter. This study prefers to recognise the advantages of a
three domain risk model. The CRC states their strategy is largely end-user driven. This
means the various emergency service agencies, departments and non-government
organisations around the country that become partners have a significant say in the
development of the research program. This may also mean that research is closely aligned to
government strategies that are then influenced by funding processes. Elements of these
strategies are discussed in part in the general government directions earlier in this chapter.
The consequence of the BNHCRC position between Government, its policies and budgetary
constraints and the wider research community is seen in research being focused more towards
populated (i.e. voter) centres rather than other societal stakeholders including ecological or
natural resource intensive regions such as montane, or oceanic regions. This is a socio-
economic reality but risks a less balanced view of natural hazards and disaster events.
The CITIES and NERAG Projects
Geoscience Australia in 1996 established The AGSO Cities Project (Middelmann & Granger,
2000, and Middelmann, 2007) to undertake research, directed towards the mitigation of the
wider spectrum of natural hazard risks faced by Australian urban communities. Reports have
been produced for a number of moderate to high risk cities such as Mackay Qld, Cairns Qld,
Perth WA, and Gladstone Qld. Although this is in the style of a multi-consultancy project, it
was built around a strong scientific method approach and included much research into new
understandings of natural hazard preparation, response and recovery especially, in larger
coastal communities. The Cities Project considered that natural hazard risk is an outcome of
the interaction between a hazard phenomenon and the elements at risk within the community
(the people, buildings and infrastructure) that are vulnerable to such an impact using the
generalised GA risk relationship in Equation 1.3 earlier being:
Risk = Hazard x Elements at Risk x Vulnerability. (1.3)

56
These projects, being a series of studies on moderate to high risk Australian coastal cities
considered that the vast majority of information, relationships and processes involved in
understanding risk are spatial in nature. The project, therefore, made extensive use of
geographic information systems (GIS) for analysis and risk assessment. The main tools
developed were based around Risk-GIS, as a fusion of the decision support capabilities of
GIS and the philosophy of risk management expressed in the ISO 31000 standard. A similar
project for other cities has been completed by engineering consultancy firms under the
framework of National Emergency Risk Assessment Guidelines (NERAG 2010). The study
and report for Rockhampton Qld, (Aurecon, 2012) was prepared under the auspices of the
Rockhampton Regional Council and the Queensland Government.
United Nations Office for Disaster Risk Reduction
The research work in Australia is mirrored globally such as the research, work, guides and
report produced by UNISDR, The United Nations Office for Disaster Risk Reduction. The
2012 Report (Blackburn and Johnson, 2012) is a generic natural hazard research report on
operational processes for city administrators to improve resilience and natural disaster
outcomes. As noted in the Report Introduction (page 8) this report recognises that almost
90% of the world’s population lives in coastal and/or lowland places opening with the
following comments:
Today, more than half the global population resides in urban areas. By 2025, roughly two-
thirds of the world’s inhabitants and the vast majority of wealth will be concentrated in
urban centres. Many of the world’s mega-cities, characterized as those with populations
exceeding 10 million, are already situated in locations already prone to major
earthquakes and severe droughts, and along flood-prone coastlines, where the impacts of
more extreme climatic events and sea level rise pose a greater risk to disasters.
The UNISDR report provides a trans-national introduction to urban disaster resilience, based
on case studies and best practice principles. The report appears to be targeted at policy
makers and is heavily focussed on generic discussion. This type of report appears to be one of
the most common forms of natural hazard research program, being research based, translated
into case studies and real world examples as an introduction for new projects and
stakeholders. The project includes 1276 cities worldwide that are contributing or following
the applied research in natural hazard resilience concluding with a generic urban resilience
checklist as follows:

57
The Ten Essentials for Making Cities Resilient – (Blackburn & Johnson, 2012, p113)
1. Put in place organisation and coordination to understand and reduce disaster risk, based
on participation of citizen groups and civil society. Build local alliances. Ensure that all
departments understand their role in disaster risk reduction and preparedness.
2. Assign a budget for disaster risk reduction and provide incentives for homeowners, low
income families, communities, businesses and the public sector to invest in reducing the risks
they face.
3. Maintain up to date data on hazards and vulnerabilities. Prepare risk assessments and use
these as the basis for urban development plans and decisions, ensure that this information
and the plans for your city’s resilience are readily available to the public and fully discussed
with them.
4. Invest in and maintain critical infrastructure that reduces risk, such as flood drainage,
adjusted where needed to cope with climate change.
5. Assess the safety of all schools and health facilities and upgrade these as necessary.
6. Apply and enforce realistic, risk compliant building regulations and land use planning
principles. Identify safe land for low income citizens and upgrade informal settlements,
wherever feasible.
7. Ensure that education programmes and training on disaster risk reduction are in place in
schools and local communities.
8. Protect ecosystems and natural buffers to mitigate floods, storm surges and other hazards
to which your city may be vulnerable. Adapt to climate change by building on good risk
reduction practices.
9. Install early warning systems and emergency management capacities in your city and
hold regular public preparedness drills.
10. After any disaster, ensure that the needs of the affected population are placed at the
centre of reconstruction, with support for them and their community organisations to design
and help implement responses, including rebuilding homes and livelihoods.
Fundamental Behaviours Research
The “Ten Essentials” checklist above, in point 1, discusses a need “to understand and reduce
disaster risk” and in point 3 “data on hazards and vulnerabilities”. The Cities Project and
subsequent NERAG Guidelines use a strong reliance on spatial tools and studies and it may
be said this approach reflects the useful role of maps (as image models – Hart 2013a). It is a
proposition of this study that fundamental research establishing deterministic formulae

58
derived from graphical image models, provides essential inputs into GIS or map based image
models. As noted above, map and image models are very powerful communication tools for
presenting model outputs, and knowledge inputs especially to non-technical audiences.
This study in recognising there is a continuity of knowledge and information flows from the
geophysical domains to the policy and decision making domains, seeks to understand the
fundamental properties of geophysical systems that can build strong models, identify and
manage anomalies, all leading to improved decision making by use of these tools.
2.3 Systems Modelling and Applied Mathematics
The term “system” is used widely in many different model situations. For this study,
distinctions arising from the Bertalanffy (1969) research include properties as follows, to give
to clear distinctions between general and complex systems, and between open and closed
systems. These are well described in Buckley (1967), Klir (1991), Miller (1995), Skyttner
(1996), Alexander (2000), Kadane & Kazar, (2001), Ahmed (2005), and Pidwirny (2006)
A summary of the 10 general properties of systems follows, and the conference papers added
as appendices to this thesis (Hart 2013a, 2013b) provide examples of the application of this
approach using the references above:
A system has a definable boundary separating the system resources and components
from its environment.
A system boundary may be only open or closed.
Resources (from the mass, energy or information domains) in an open system only,
may cross the boundary in either direction.
Resources from any of the three domains crossing an open system boundary will be
inputs or outputs to the system.
There will be no resources (from the mass, energy or information domains) within a
system boundary, for a null system.
System components may be themselves systems or subsystems.
There are relationships between these subsystems including the null relationship,
overlap, and nesting.
There may be relationships between the system, subsystems, resources, or
components inside the boundary, and those outside.

59
The relationships between resources, subsystems and components may be described
quantitatively.
The system components and the relationships between them may exhibit temporal
variations or properties including new emergent properties.
The resources in a system may be modelled as described in the prologue and this is most
efficiently done using one of the seven archetypal models developed in Chapter 3. The use of
these models requires the application of the following applied mathematics and physical
science approaches to building the models:
Well Posed Problems
Natural Hazards – specific surface energy risk model
Applied Newtonian Physics – for natural hazard systems
Key issue: energy (rather than force) as a measure of damage potential
Dimensionless Measurement – a new approach for natural systems
Key Issue – consistent dimensionless variables
Information Risk – information security and quality
Qualitative Reasoning – linking quantitative concepts
A Modern Role for Logarithms – The neglected transformation
Mathematical Strength: gradable adjectives
Cognitive (Behavioural) Physics – a new approach for psychometric models
Each will now be described in general terms to illustrate their potential role in the project.
Well -posed Problems
The successful use of standard mathematical techniques in quantitative modelling depends on
the concept of well posed problems, and is described by Balint & Balint (2014) for a sound
energy attenuation problem as being somewhat similar to seismic energy attenuation. This
concept was developed by Jacques Hadamard in 1902 and describes a well posed problem as
one where a mathematical model of physical phenomena should have three properties:
1. A solution exists,
2. The solution is unique,
3. The solution's behaviour changes continuously with the initial conditions.
The challenge of this project lies not in the choice of mathematical techniques but in the
possibility that a well posed problem describing natural hazard risk in three domains exists,

60
that it can be solved with a unique solution for each location, and that the solutions for each
location will vary with changes in initial conditions. In this scenario, the model will properly
make use of the applied mathematics and physical science approaches above, and in
particular will focus on developing anomaly free conditions, the law of energy conservation
in attenuation systems, dimensionally consistent risk parameters, reversible power laws and
logarithmic relationships.
Natural Hazards – An Energy Intensity Transformation Model
In contrast to the probability expectation models (basic ISO 31000:2009, Stirling 2012) and
Geoscience Australia impact force models (Middelmann & Granger, 2000, and Middelmann,
2007) this study develops a model of risk based on specific surface energy (SSE) to reflect
transfer of energy from a source to an impact target that may receive significant damage.
The likelihood domain represents how a frequency model adds to the stakeholder outputs,
and a response to temporal effects, together with the effect of anomalies in the system model.
The consequences domain represents how potential impacts affect the expected outcomes,
and considers the specific surface energy in the event, including attenuation and anomalies.
The psychological domain represents the role of human stakeholders, their ability to assess
risk in advance, behave instinctively to reduce risk and respond to events as they occur.
This brings together the energy effects from the event itself. In most cases the event energy
must rise above a threshold to enable the triggered release of stored physio-chemical, or
potential energy. This potential energy may be many times greater than the localised specific
surface energy from the original natural hazard event and includes, for example, the energy
release associated with a collapsing building. In the second (Event II) Canterbury earthquake,
over 95% of fatalities were caused by such collapses with only 5% of fatalities caused by the
primary event energy (Press 2011). Almost all object phenomena whether they are in the
human, natural or built environments have a natural impact threshold below which no
damage will occur. So a small earthquake will shake but not cause any damage and a low
heat may warm an item up but not lead to combustion. This trigger threshold is generally
measured and recorded as a force measure representing the penetration of a real or
metaphorical “protective shell”.
At the threshold of damage, increases in energy will cause exponentially increasing damage
until runaway catastrophic damage occurs from emergent positive feedback processes. This

61
represents a significantly different approach to damage and injury risk (Powell & Reinhold
2007, Schmidt et.al. 1998, Lutze 2001) compared to traditional approaches which are
generally based on force for both the initiation of damage and the assessment of the extent of
subsequent damage.
For example the traditional use of impact force related measures include:
Earthquake force – Magnitude and Peak Ground Acceleration (PGA)
Bushfire force – McArthur Forest Fire Danger Index (FFDI): Wind and Temperature
Cyclone or Hurricane force – Beaufort Scale or wind speed
Few natural hazard measures take account of duration and as developed later in Chapter 5, a
new method based on applied Newtonian Physics being the product of a force measure and
the duration gives a more mathematically robust measure of specific surface energy’s in a
natural disaster and therefore risk of damage from the natural hazard as also shown in the
Modified Mercalli Intensity (MMI) model. This approach can also identify anomalies in
standard behaviours and present new evidence of higher or lower risk to natural hazards in
unexpected locations than is identified with trends and traditional methods.
The study model will accumulate the measured behaviours of the 3 part sub-systems and will
use a number of mathematical tools as described above to resolve the model. The main tools
used in this analysis together with the background that leads to their useful adaptation to the
natural hazard situations are covered in the following sections.
Applied Newtonian Physics - for Natural Hazard Systems
It is challenging for most people in everyday society to translate the knowledge from a
traditional physics education into the real world. It is equally challenging for most people to
follow and understand, and therefore have confidence in, advice from expert scientists on the
quantified risks arising from natural hazards. This leads to two major adverse outcomes as
was presented in the evidence to the Royal Commissions for 2009 Victorian Bushfires
(VBRC 2009), and the 2010-11 Canterbury Earthquake Sequence. In the bushfire scenario,
the ability of a cool south-westerly wind change to initially accelerate a northwest strong
wind bushfire for a few hours, before subduing the fire was known (Engel et.al. 2013). In the
latter case, the Canterbury Earthquake Royal Commission noted that the Canterbury Regional
Council’s specific (ECan 2004) warnings on vulnerability to earthquake initiated soil
liquefaction in the Christchurch Region were validated in the 2010-11 earthquake sequence

62
(CERC 2012). These warnings had been accurately mapped and forecast by the Christchurch
Lifelines Project (CAE 1997). Communities, organisations and individuals, often only react
to the threat when it is well established, often underestimate the magnitude of the threat, and
consequently make response decisions that are inadequate.
This study will introduce a new application of Newtonian physics modelling approaches and
mixed mathematical methods, to assist in quantifying the trends, impacts and anomalous
behaviours of seismic energy in the near location of the epicentre, and at distant locations. It
is recognised that this approach may cause difficulties for readers with unpleasant memories
of high school mathematics and physics. However, overlaying the modelling with well posed
problem criteria will result in transparent outcomes where the concepts maybe complex but
the actual mathematics used in this project will not go beyond senior high school levels.
Physics is widely and variously described in dictionaries and textbooks as the interactions of
energy, matter, space, and time, and the fundamental mechanisms that underpin physical
phenomena (OpenStax, 2012). Physics can describe the link between mathematics theory
and the physical realm where as Robert Brown (2013a, p33) points out: “mathematics is the
natural language and logical language of physics, not for any particularly deep reason but
because it works”. Physicist Eugene Wigner (1960, p2) observed, “The first point is that the
enormous usefulness of mathematics in the natural sciences is something bordering on the
mysterious and that there is no rational explanation for it. Second, it is just this uncanny
usefulness of mathematical concepts that raises the question of the uniqueness of our physical
theories”. More recently Sarukkai (2005, p415) observes, “One of the elements contributing
to the mystery of mathematics lies in the physicist stumbling upon a mathematical concept
that best describes a phenomenon”. Sarukkai’s comment has a validity that has been the
subject of specific endeavours in this study where this chapter sets out a structured approach
to considering the phenomena and creating a structured approach to selecting from a vast
library of mathematical tools those that assist in the study objectives.
The physics realm of course includes both the micro-realm of atoms, molecules and cells, and
the macro-realm of planets, stars, and the cosmos. This thesis considers the everyday world
of people and the natural-economic environment, in which they live, and perhaps sometimes
they influence, but which certainly influences them. Therefore, the descriptions relate to
neither quantum physics nor the theoretical physics of cosmology but start with applied
studies in the four traditional concepts of energy, matter, space, and time as is typically
accepted in general physics (PSSC 1960, OpenStax 2012, Brown 2013a; 2013b).

63
The study of physics in the everyday world now extends into the world of information and
cognitive physics, sometimes called psychophysics and sometimes psychometrics as
introduced earlier on page 59 and will be covered later from page 73 of this chapter. The role
of information as a fifth concept includes physics and indeed its accumulated data,
information and knowledge, much of which is derived by observation and measurement. This
fifth concept of information also appears to behave according to the laws of physics both in
its creation, conservation and the manner in which people interact with their natural economic
environment (Landauer 1961, Preskill 1992, Hawking 2005, Hart 2013a and 2013b).
The traditional physics processes of measurement now use the SI (Système Internationale) set
of units which is based on the three fundamental mechanical units (there are four more other
SI fundamental units for temperature, electric current, luminosity, and atomic number) being:
Length (metre) being one ten millionth of the distance between north pole and equator,
Mass (kilogram) being one thousandth (a litre) of a cubic metre of water, and
Time (second) is approximately one heart beat and the second division by 60 of an hour.
The recognition and scientific description of fundamental information was a human discovery
just as was the recognition of matter, and energy before. The application of the mathematics
of physics to the mathematics of human behaviour where the same methods, models and
structures used to describe natural phenomena such as earthquakes, cyclones, or bushfires can
usefully describe cognitive processes of analysis and decision making associated with natural
hazards and risk. An examination of various modelling options sees the logarithmic
transforms and associated operators such as calculus, vector, and matrix mathematics provide
previously unfound mathematical congruence across all elements of the risk assessment and
decision information process.
This thesis reports in Chapter 4 on field studies that examine and demonstrate how a physical
sciences approach and a structured mathematical analysis of natural hazard effects when they
manifest as an event or a disaster can describe and model the phenomena. It will further
examine how such phenomena can be transformed into useful knowledge to be applied in
natural hazard and disaster risk assessment, decision making, and policy development.
Energy as a Measure of Damage Potential
The damage process occurs when concentrated energy impacts on an asset (human, natural or
built environment) at a level above a threshold and penetrates its protective shell. Once

64
penetrated the accumulated damage is a measure of the cumulative impact energy which will
typically be the product of force (or acceleration) and distance (or duration).
The Hurricane Katrina disaster led to a discussion on tropical cyclone intensity as a measure
of destructive potential (Powell & Reinhold, 2007, p514). The key observation was that
Hurricane Katrina, being significantly weaker than Hurricane Camille at landfall, led to so
much more destruction. Hurricane intensity provides a measure to compare the maximum
sustained surface winds (VMS) of different storms, but it does not account for storm size.
Powell & Reinhold commented:
“It serves a useful purpose for communicating risk to individuals and communities, but
is a poor measure of the destructive potential of a hurricane because it depends only on
intensity”
and
“The highest one minute average wind, VMS, (at an elevation of 10 m with an
unobstructed exposure) associated with that weather system at a particular point in
time, and a 1–5 damage potential rating is assigned by the Saffir–Simpson scale”
Powell & Reinhold (207, p524) propose a new term call Integrated Kinetic Energy (IKE)
being the kinetic energy across the whole storm size (a spatial integration) and show how it is
more relevant to damage potential concluding though:
“The IKE-based WDP and SDP calculations are more complex than the current SS, and
there may be some resistance to any new metric if there were any chance it might
confuse the public.”
Studies in ship collision damage (Lutzen Denmark 2001, Chen 2000) also point to the
importance of energy dissipated in the collision rather than a simple measure of speed as a
measure of damage suffered by the ships. The studies also show the ship geometry at impact
as a significant factor since ships present typically very different profiles to a collision.
Motor vehicle collisions on the other hand can produce more standardised vehicle approach
direction and sizes at impact enabling isolation of key impact factors. Society of Automotive
Engineers (SAE) studies (Schmidt et.al. 1998) found that collision (approach and separation)
energy differences were valid measures of damage and injury in collision impacts rather than
speed alone except in barrier impact where typically the barrier does not move and the
vehicle comes to rest at the point of impact. Schmidt et.al. (1998, p5) concluded:

65
“The impact speed or absolute speed is not a good measure of the impact severity
except in special cases like barrier impacts”
These analyses support re-consideration of peak measures of natural disasters such as
earthquake magnitude or PGA, wind speed or qualitative cyclone intensity as measures of
damage and risk potential. Instead, the key force based measure might be replaced with a new
surface energy based measure (Specific Surface Energy, SSE), that for example correlates
with seismic intensity (Modified Mercalli Intensity, MMI) as proposed in this study.
A New Dimensionless Measurement Approach to Natural Systems
Most physical systems are made up of components that have physical dimensions but a
dimensionless quantity may still have a physical dimension or property. Whilst many forms
of dimensional measurement have evolved over time, and the SI (Système Internationale)
development of the 1890’s period enabled international comparisons, there are still many
local and historical dimension systems that inhibit consistent and effective modelling
usefulness. For example the risk formula: Risk = H * V * E described earlier in Chapter 1,
does not work as a mathematical formula model because of inconsistent units. One approach
is to show a dimensionless quantity being measured and give the quantity a meaningful value.
This is done by use of the same unit system in both the numerator and denominator, as is
found in chemical concentrations, for example % (percent or g/100g) or ppm (parts per
million or mg/kg). The quantity may also be given as a ratio of two different units that have
the same dimensional character albeit vastly different scale (for instance in scaling
cosmological distances, being 10 trillion (1012
) kilometers per light year). This may also be
the case when calculating slopes in graphs, or when making unit conversions.
Thus there are essentially four main types of dimensionless variables.
Dimensionless Variables
Dimensionless variables enable scientific and everyday concepts to be described
mathematically; from numbers, through complex terms and ratios, to conversion factors and
other measures used in everyday society.
These four main types of dimensionless variables, with examples, are:

66
Quantitative values: real numbers, complex numbers, descriptive numbers (dozen,
gross etc.), angles (degrees, radians etc.), economic values (dollars etc.),
Dimensionless Numbers (e.g. in fluid mechanics: Reynolds, Prandtl, Stokes Numbers),
Ratios (e.g.: concentrations (ppm), efficiency (%), slopes (x in y), probability (%), and
Conversion factors (e.g.: 4.546 litres / gallon, 1760 yards / mile, 2.2046 pounds / kg).
These types of dimensionless variables provide tools to transform the three different domains
of the comprehensive risk system function into a consistent model, using comparable
dimensionless variables in the numerator, with time in the denominator as seen later.
In the three individual domain functions, the individual variable dimensions as seen in field
measurements are essentially incompatible in measure and scale and therefore unsuitable in
their raw form for use with any mathematical operator. An example of incompatibility is if
say government tax revenue is compared between tax revenue ($) per person and tax revenue
($) per family without any regard to the size of the families being in the survey population. It
is possible and practical to overcome this obstacle by the transformation of the raw variable
to a consistently dimensioned variable. This is commonly done in other society measures
such as in economic modelling for value by a consistent pricing denominator such as for
petrol as dollars ($) per litre, or it is done using a consistent time unit as a common
denominator, for example $ per year or alternatively $ per hour.
Information Risk (Security and Quality)
It is a natural consequence of the recognition of the value of information that it becomes a
resource in need of risk management itself. Written knowledge from historical sources has
been often destroyed (both accidentally and deliberately) but remarkably a large amount has
survives and more is re-discovered regularly. The very mechanism that now enables the
measurement of information quantitatively is in itself very volatile and at risk. Governments
and organisations have addressed the effects of information volatility with structured archive
systems for both hard and electronic formats. Ross (2010) discusses how the information
systems can include as constituent components a range of diverse computing platforms from
high-end supercomputers to personal digital assistants and cellular telephones. This project
uses historical seismic data alongside modern data in Chapter 4. The data was tested for
integrity and was found useful and comparable to modern data for modelling the magnitude /
probability relationship of seismic events. Since the historical data was measured manually,

67
the non-collection of data below human sensitivity compared to modern sensitive automatic
instruments is noted, but the mid-range and high range data appears to have complete
integrity. The simplicity of information transmission and duplication against the high level of
volatility and uncertain physical life of electronic media does mean that archiving appropriate
levels of electronic information in a secure low-risk environment is a serious new risk
management problem for archivists. The ability to include these information uncertainties in
a system equation dominated by intangibles implies a high level of integrity risk.
Qualitative Reasoning (QR)
Many mathematicians (DeCoste 1991, Eisenack 2007, Tusscher & Panfilov 2011, Chang et.
al. 2011) have generally found that solving equations for natural systems is either
extraordinarily complex or the necessary simplifications and approximations compromise the
integrity of the solution. This can be true for the natural systems application of the otherwise
traditional useful scientific and engineering method of differential equations. This introduces
the argument for qualitative approaches to well posed complex physical problems. As an
example, Bredeweg et. al. (2009) describes the means to express conceptual knowledge such
as the physical system structure, causality, start and end of processes, assumptions and
conditions under which facts are qualitatively true and distinct. Kuipers (2001) describes the
problem as the prediction of a set of possible behaviours consistent within a qualitative
equation model of the system and expressing natural types of incomplete knowledge of the
system. It is difficult to find a provably complete set of behaviours in the incompleteness of
any model. This introduces the qualitative element into the solution process and so, as well as
a quantitative, numerical, graphical and analytical reasoning; the use of qualitative reasoning
is employed. There is no better example of this than the development of probability theory in
the 1654 Pascal-Fermat letters (Devlin 2010) as discussed earlier in this thesis.
The practical approach to resolving complex natural systems using qualitative reasoning to
resolve complex and incomplete quantitative models has been successfully developed
through a wide range of systems studies including: Bredeweg et. al. (2008), Zitek et. al.
(2009), Bredeweg et. al. (2009), and Bouwer et. al. (2010).
Kuiper’s reported rationale for the use of qualitative reasoning to resolve complex natural
hazard systems and overcome the inadequacies of quantitative, numerical, graphical and
analytical reasoning was tested successfully in this thesis. While the opportunity for

68
qualitative reasoning to overcome modelling inadequacies exists, it is proposed that
qualitative reasoning provides an otherwise unrecognised opportunity to integrate qualitative
variable parameters such as behaviours and information with otherwise physically descriptive
models such as formulae. This thesis advances the complete or partial quantification of these
qualitative parameters in the case of cognitive physics or psychophysics and information, and
therefore provides opportunities for a more comprehensive approach to modelling the total
system that surrounds natural hazards and disasters.
It is proposed that qualitative representation requires at least four core attributes being:
Structure – being the components, attributes, and relationships of the system.
Behaviour – temporal and spatial changes within the system.
Aggregation – alignment transformations by meaningful models.
Simulation – input reasoning to output conclusions with defined boundary conditions.
Ballarini et. al. (2009) describe qualitative reasoning as an approach to analysing dynamic
systems with a flexible approach to precise quantitative parameters that derives information
about the behaviours which might be exhibited by the system. This has been termed a soft
proof where a formal proof is in part supported by logical or qualitative reasoning. It is
commonly included in artificial intelligence studies as a form of representing knowledge. It is
sometimes likened to common-sense logic, enabling the prediction of the behaviours of
physical systems, without having to create and analyse the partial differential equation that
more precisely governs that behaviour. Motivations for applying QR include uncertainty or
mathematical inconsistency in:
parameter values for system models,
the model’s structures including the existence of partial knowledge,
formula dimensions between qualitative and quantitative measures, and
repetition of the process or experiment, to achieve robust empirical results.
A number of different styles of qualitative modelling are found in literature but generally all
including deterministic, representations of system dynamics, as a set of ordinary differential
equations (ODEs) or partial differential equations (PDEs). Reasoning is applied to the system
so that rather than look at a robust continuum of possible values for variables within the
equations, a discrete set of intervals (in time or space) representing various scenarios is
identified. The interval boundaries are important to the scenario for the specific variables.

69
This leads to qualitative approaches to resolving the models differential equations (Liu 2003).
Eisenack (2007) introduces model unit frameworks as a common framework for
understanding qualitative differential equations (QDEs) in a robust mathematical sense. It
provides basic insights into the behaviours of models under uncertainty. Qualitative reasoning
is at risk of being considered a substitute for weak models but should be instead considered as
the inclusion of intuitive or qualitative knowledge with structured quantitative knowledge.
Perhaps the best way to envisage this is empirically based soft tissue existing within a hard
bone structural skeleton for the problem definition. This also is seen in the 10 complex
system properties listed earlier in this chapter.
A Modern Role for Logarithms – The Neglected Transformation
The publication of John Napier's Mirifici Logarithmorum Canonis Descriptio in 1614
“embodies one of the very greatest scientific discoveries that the world has seen” (Hobson
1914, p1). Napier’s logarithms arrived after 24 years of work (Levine, 2011; Lexa, 2011) to
help his work as an enthusiastic astronomer and in particular the “multiplications, divisions,
square and cubical extractions of great numbers” (Villarreal-Calderon, 2008). It was some
years until 1730, when Leonhard Euler recognised that logarithms were the inverse of
exponential laws (cited in Eves 1992).
Early interest in logarithms centred on calculating Napier’s “great numbers”. In more recent
times, with computers having taken over the role of calculating with large numbers, the
usefulness of logarithms in the analysis of numbers of “great difference” has been of reduced
interest (Levine 2011), while the underlying scale of measures using logarithms continue.
This is especially the case in the mathematical description of natural phenomena such as
sound (the decibel), earthquakes (Richter magnitude), acidity (pH scale), sensory stimuli (e.g.
pain, taste, smell, sound, light) in psychology and psychophysics (the Weber–Fechner law),
music (tone intervals), and fractal dimensions (e.g. snowflakes).
Physics and psychology studies generally show just how often logarithms can be used to
model, describe and predict the behaviour of worldwide phenomena, for example College
Physics (OpenStax, 2012) describes projectile (or sporting object) trajectories, temperatures
in nature, system entropy, sound levels, capacitor voltage decay, carbon dating isotope decay.
These each show that transforming vast linear or measured data from a linear form into a
logarithmic (or inverse exponential) form (using a logarithmic transform function) transforms

70
the information into a form that is more readily modelled. This means its behaviour can be
better understood and used than by other data transformations. The questions of scale design
have a long history of development (Stevens 1946, Rasch 1961, and Hart 2013b).
An inherent ability to use logarithmic scales to understand wide range quantities is shown in
psychological studies of young children and isolated indigenous peoples (Pica et.al. 2004,
Booth & Siegler 2006, Dehaene et.al., 2008) have found that individuals with little formal
mathematics education tend to naturally estimate quantities on a logarithmic scale, that is,
they position numbers from a wide set on an unmarked line according to their logarithms.
For example, 100 may be equi-positioned between 10 and 1000. Increasing education in
cardinal numbers shifts this perception usually to a linear layout. The testing of the use of
logarithms in psychophysics demonstrates that many human cognitive processes are more
naturally aligned to logarithmic scales rather than conditioned linear scales seen in formally
educated adults, and therefore when modelling risky behaviours and natural phenomena,
logarithmic modelling is likely to be more appropriate and useful in everyday use.
The logarithm is fundamental to the approach taken to risk assessment in this thesis. The
recognition by Euler in 1730, as described above, that power laws are simply the inverse of
Napier’s Logarithms of 1614 is repeated here for emphasis, and will in this thesis, be used
interchangeably for the relationships of elements in systems described. There are strong
reasons (discussed below) to prefer the logarithm, as a transform for power laws, over other
mathematical transformations that compress data, such as the root or reciprocal.
An exercise was undertaken here to review typical usage and summarise when and when not
to use logarithmic transformations, with the observations taken from general practice in
mathematics and some other ad hoc observations. This list is illustrative rather than
exhaustive, but Napier’s observations on great numbers and differences remain important.
A logarithmic transformation is specifically useful when:
The transformation of the dependent variable (residual) is approximately linear,
when the data or underlying theory relationship is (close to) exponential,
the transformation residuals have a strong positively skewed distribution,
when the standard deviation of the residuals is directly proportional to the fitted values
and not to a power of the fitted values,
when the data covers multiple orders of magnitude (great numbers), and
when comparing data from different orders of magnitude (great differences).

71
Typical reasons for not using a logarithmic transformation include:
trying to make data outliers not look like outliers, or make bad data look better,
the software package automatically does it without any criteria,
when there is no underlying reason for power law system behaviour
when other data compression transformations (e.g. root or reciprocal) are better, and
it makes a more attractive or dramatic graph or plot without an underlying cause.
This chapter introduces and develops the application of various approaches to investigating
the natural hazard risks in the Geoscience Australia (GA) Cities project and the GA risk
models. The dimensional inconsistency in the GA Risk Model (Risk = H*V*E) arising from
this formula are addressed by modelling using the ISO 31000 approach. The NERAG
standard (NERAG 2010) provides an opportunity to address these inconsistencies with a
significantly stronger quantitative approach. The NERAG approach was used for the new
generation approach that replaces the Cities projects conducted by Aurecon (2012) for the
Capricornia city of Rockhampton (Queensland). In particular, the likelihood and
consequence parameters are strongly based on the application of gradable adjectives, and the
logarithmic transformation. This seen in Table A5 in report (Aurecon 2012) which is
reproduced here (Table 2.2) and discussed in detail in the study of seismic intensity.
Table 2.2 Example of scales that link gradable adjectives to natural system probability
frequency and to logarithmic transformations (source Aurecon 2012)

72
Hypothesis Testing - a Logarithmic Transformation Weakness
New knowledge development using data for evidence requires hypothesis testing for
significance. Significance testing usually assumes normal or near normal data distributions
and relationships in the arithmetic or linear domain. Bio-medical and psychological research
has also found that human system behaviours, like physical geographical systems, often
follow power laws that are best analysed in the logarithmic domain. Specific studies such as
Feng (2014) and books such as Armitage (2002) demonstrate this means limited suitability
for biomedical (for example scales of felt pain) and psychological research (for example
responses to noise) hypothesis testing. Hart (2001) has on the other hand described the
applicability of the Mann-Whitney U Test, a test for highly skewed or variable shape, but the
small range of integer values in the proposed questionnaire structure, may limit its usefulness.
Gradable (Numerically Scalable) Adjectives and MMI
The trend towards GIS based stochastic modelling described earlier has appeared to diminish
the perceived value of deterministic trend equations in natural phenomena. This introduction
illustrates and the thesis demonstrates that logarithms linked to gradable adjectives can add
significant strength to risk management decision making, with an even more powerful
opportunity that lies in the ability to merge models of otherwise incompatible phenomena.
This demonstrates capacity for common analysis across otherwise great differences in both
magnitude and in behaviours, and how to be integrated into effective system models as
shown in the next section on the Mercalli seismic intensity scale.
Mercalli Intensity - an applied Gradable Adjective Scale
The Mercalli Scale for earthquake intensity has its origins in 1884 and has undergone
multiple revisions to become the Modified Mercalli scale that is now used internationally. It
is essentially a descriptive scale focused on the event impacts on people and the built
environment. In 1996 a New Zealand version of the scale was released (Dowrick 1996,
2008) to include impacts on the natural environment so that the intensity could be measured
in remote areas with little or no built environment upon which to gauge the impacts. There
have been subsequent minor adjustments to give the fully developed scale which is
reproduced as a reader resource in the vignette at the end of this chapter.

73
This 1996 modified scale is also more relevant to Australia and any region with significant
remote areas since here the MM Intensity is measured only by impacts in the natural rather
than human environment. Rock fall and landslide risks are of particular importance in
montane environments especially those with significant infrastructure or recreation facilities.
It is reasonable to interpret the MMI scale this way noting, for example, that rock fall from
montane outcrops will be the first significant sign followed by landslides each of increasing
severity over the MMI scale three unit range of:
MM VIII: isolated rock fall, superficial land cracks
MM IX: steep slope rock falls, minor landslides
MM X: widespread rock falls, and landslides, forming landslide dams
Of course rock fall and landslide hazards are not the consequence of earthquakes alone. The
other main geohazards leading to these environmental impacts are rainfall or snow storms
and heavy rainfall that is preceded by wildfire deforestation (Cannon 2005) or other
deforestation causes such as logging.
Any of these precursor events may have the effect of reducing the observed environmental
impact MMI levels by up to two MM intensity units. Water saturated hillsides may likely
become unstable at lower MM shaking intensities than those indicated in the NZ MM scales,
for example at MM VI being approximately equivalent to a local magnitude M 2.8 - 3.4.
In spite of these limitations, the MM seismic intensity is finding increased usage in NZ for
recognising damage at locations distant from the epicentre by the easy access to online
reporting of “Felt Reports” accessed through the GeoNet internet home page
(https://www.geonet.org.nz). The use of gradable adjectives helps considerably in a
community interpretation programme but lacks scientific precision unless backed up by
substantial statistical data such as the GeoNet Felt Reports.
In Chapter 5, a new study in the attenuation of specific surface energy based on
measurements from seismograph networks provides a successful first attempt at linking the
MMI scale and its gradable adjectives to a robust geophysics seismic measurement technique.
Psychometric Measurement Methods
The design of an effective population survey needs to consider the manner in which the
subjects will respond to the questions and the manner in which the questions are presented.

74
The essential elements in this approach are psychometrics and psychophysics being
collectively the structured measurement of behavioural responses to psychological stimuli.
This approach is often the most appropriate and useful in psychometric analysis of response
to severity, a key element of psychophysics. These approaches seek to measure and represent
the natural tendency for people to perceive issues across a range of magnitudes on a quasi-
logarithmic scale rather than a linear scale (Pica et.al. 2004, Booth & Siegler, 2006, Dehaene
et.al. 2008).
Booth & Siegler (2006) report that the natural thinking approach of pre-school children starts
out as a logarithmic approach, but evolves into a more linear approach as their education
develops, for example the use of a ruler, reading the time, and performing arithmetic
functions are all linear. The studies by Pica et. al. and Dehaene et. al. on indigenous
Amazonian peoples who had not been exposed to western education found that words for
quantitative estimation generally followed a quasi-logarithmic relationship. An unresolved
question to be considered in this study is whether the logarithmic approach to cognitive
decision making has been displaced by education-based knowledge, or is merely latent in the
respondents in this survey, and whether the respondents can draw on this cognitive process in
responding to the questions.
Psychophysical approaches to questionnaires are most useful when they link the behavioural
responses to measurable physical phenomena, but the approach still needs to be relevant to
the outcome being sought. There are a number of such mixed qualitative-quantitative
approaches in common use with the main three described here (Likert, Ipsative, and Weber-
Fechner) in order to then identify the most appropriate for use in this project. It is important
to remember that the timescales of forecasting and actual hazard events cover potentially 100
years or more, and mean it is not possible to validate the actual knowledge and behaviour
linkage forecasts. Instead the intention is to see if using methods validated in past or parallel
research, a robust and relevant quantitative behavioural parameter can be developed.
(i) The Likert Scale
The typically bipolar Likert scale frequently applied to surveys including risk surveys
(Dickson 2009) anticipates that behaviours are influenced by the level of agreement or
disagreement by treating the variable as an ordinal scale of measurement.

75
The format of a typical five-level Likert survey scale is recording the reaction to a statement
about a particular activity, for example, the format of a sample question in a set of montane
recreation questions or a stakeholder survey might be to select the preferred answer to the
statement as follows:
“Snow skiing is highly risky”
Answer by clicking on the relevant button (or ticking the relevant box):
1. I strongly disagree (with the statement) ◘,
2. I disagree ◘,
3. I neither agree nor disagree ◘,
4. I agree ◘, or
5. I strongly agree ◘.
A Likert scale based survey has a number of identified weaknesses that may produce
unreliable results including responses being: (i) influenced by the mood(s) of the respondent,
(ii) acquiescence responses where respondents subconsciously wish to appear agreeable
(Kamoen et.al. 2011), and (iii) social desirability responses where responses are aimed at
making the respondent appear more competent in the subject matter (Baron, 1996). An
advantage of the Likert Scale is that it is a common method for survey collection, and
therefore more easily used by most respondents who may be familiar with it. The Likert
based surveys are also versatile and inexpensive and are useful over a range of media such as
online, interview or paper based surveys.
Population attitudes on a topic exist on a multi-dimensional continuum; however, the Likert
Scale is one-dimensional and typically gives five choices or qualitative options, and where
the space between each choice is unlikely to be equal or comparable. There is a risk that due
to the influence of mood, previous answers may influence subsequent answers, or may bias to
one side (agree or disagree). Baron (1996) observes the respondents may typically avoid the
“extreme” scale options resulting in biasing responses towards the center. Baron reports these
biases and weaknesses may move the mean result by as much as one half to one full standard
deviation. This leads to the conclusion that this is an inappropriate basis for this project.

76
(ii) The Ipsative Scale
An example of an alternative approach is the Ipsative scale (Baron 1996) which requires
respondents to choose a preference between options, and is therefore considered particularly
effective in identifying inconsistent responses. This forced choice approach is designed to
reduce Likert style biases. They cannot agree with all items presented and have to choose
between two seemingly similar items.
For example, the format of a question in a set of montane recreation questions or a
stakeholder survey might be to:
Select the preferred statement of the two options and click on the button (or tick the
preferred box):
I mostly enjoy doing sports with individual risk and achievement ◘ , or
I mostly enjoy doing sports with team risk and achievement ◘
The set of preferences across many questions is unique to the individual respondent and is
considered a useful measure of the choices they will make in reality from which, in this
example, an individual’s personal risk profile can be determined. This individuality means
that it is more difficult to develop a set of results across a population, as the responses are to
some extent dependent on the full set of questions and the mood of the respondent. These
results are less objective in setting the risk profile of a location or environment.
(iii) The Weber-Fechner Scale
The Weber-Fechner psychometric approach to generating quantified responses to various
stimuli has evolved from understanding the effects of physical stimuli such as pain and sound
on individual people. The Weber-Fechner scale applies a controlled logarithmic scale to
measure a response that has been derived from a survey population, perhaps with an
underlying objective physical parameter such as force or value. While the Weber-Fechner
origins lie in physiological stimuli such as pain and sound, it has been applied to cognitive
stimuli in the case of economic risk and insurance (Sinn, 2003, and Weber, 2004). It is
therefore reasonable that it provides useful psychometric measures of risk perception.

77
Supporting this conjecture are the historical cognitive parameters of time (second, minute,
hour, day, week, month, year) (Bruss, 2010) and of course metric distance (µm, mm, metre,
kilometre), which each follow the structure of a Weber-Fechner scale.
These interesting historical considerations demonstrate that in applying a cognitive approach
to measures of time and distance, it is still appropriate and natural for survey respondents to
think subconsciously in power law terms. This observation leads to a view that using an ISO
31000 structure with logarithmic / power law scales to conduct and present a quantitative
survey of population risk perceptions in the Snowy Mountains Region, will fit naturally with
established human thought processes as seen in figure 1.4 earlier. The time and stimuli scales
representing the likelihood and consequences domains of the risk matrix are to be surveyed
and presented in logarithmic (inverse power law) format. The validity of this decision will be
tested during the survey, since the consequences of natural hazard risk to human and property
assets will be measured in a single scale. The risk in this approach is that while time and
distance follow power law scales, answering questions in a survey in this format may be
unusual for many respondents and this may result in errors or completely inconsistent results.
A Montane Application of the Weber–Fechner Scale
In a survey of montane recreation risk, or a montane stakeholder survey, the respondent
might be asked to select the preferred answer to the question of the form:
“How often does the average snow skier break a leg while skiing?”
Answer by clicking on the relevant button (or ticking the relevant box):
1. Once per year ◘,
2. Once per 3 years ◘,
3. Once per 10 years ◘,
4. Once per 30 years ◘, or
5. Very rarely ◘
The traditional image of a montane recreation accident is a skier with a broken leg.
Improvements in skiing equipment design have actually seen lower leg fractures decline by
more than 80% since the 1970’s to approximately 0.3 fractures per 1000 skier days (Bürkner

78
& Simmen, 2008). This means that choice 5 is the factually correct answer for a typical
recreational skier, in spite of a common public (non-skier) perception being much more
frequent. Nevertheless, risky event behaviour is typically in response to perceived risk, so
questions of this nature are highly relevant to determining perceived risk and consequential
behaviours.
Converging to a System Equation
The underlying challenge of bringing three distinct domains together in a viable well posed
comprehensive system model with multiple variables is to achieve dimensional consistency.
Such problems have been met in fluid mechanics, the venue for the most common
applications of the Buckingham π Theorem (White 2009), as well as the sound energy
attenuation problem earlier (Balint & Balint 2014).
In the case of the comprehensive risk system equation in three domains where the non-
temporal components of the domain dimensions are matter, energy and dimensionless
information, a mechanism is required to reduce these to the same consistent basis. Therefore,
the mechanism is also essentially dimensionless, except in time. It soon becomes evident that
the comprehensive system equation is a temporal equation either explicitly or implicitly. By
implication, it is intended that any quantity of resource has been assembled over a substantial
period. For example an absolute mass of matter exists only in relationship to the environment
that is immediately external to the system and would have been created or assembled, or
consumed in a particular period of time so that the matter domain function will implicitly be
the quantity of matter per unit time. The system equation’s net dimension then becomes “per
unit time (t-1
).
2.4 Conclusions
The approach researched in this literature and knowledge review enables the attributes of a
system and its describing model to be created as follows:
A Systems approach encompasses components, attributes and relationships in
economic, physical and community systems.
Steady state behaviours are described by standard systems whereas complex systems
models assist with emerging and unpredictable systems.

79
Natural hazard emergent behaviours and relationships beyond steady state changes are
described by complex systems that can be reduced to well posed problems.
Energy based models describe damage to human, natural and built environment better
than force based models.
Research trends in seismic intensity such as the Modified Mercalli Intensity (MMI) are
essentially energy measures using a qualitative scale of gradable adjectives
Applied physics provides a fundamental framework for model structure and modelling.
Measurement scales and gradable adjectives provide transformations between
quantitative, semi-quantitative/qualitative, and qualitative attributes and properties for
modelling complex and emergent properties.
Many complex systems struggle to achieve dimensional consistency and therefore
quantitative or qualitative validity, but dimensionless variable based design and
structure can overcome these problems with well posed problems.
Logarithmic transformations describe the majority of natural phenomena and especially
rapidly emergent phenomena associated with natural hazards and disasters.
Cognitive and behavioural physics follow logarithmic laws and can be incorporated
with dimensional consistency into modelling behavioural responses.
Qualitative Equations enable temporal and spatial analysis of complex deterministic
relationships and can be modelled with qualitative gradable attributes and behaviours.
Matrix Model structures provide structures for multiple dimensional models in risk,
hazards and resource modelling.
Qualitative reasoning benefits from quantitative tools by helping to establish scales and
priorities amongst options and choices.
Other useful risk modelling tools could include differential equations, complex systems
analysis, and the Boolean transformation as these are each very useful tools when
faced with breaking down complex problems to solvable decisions. Such
transformations are used widely in automated decision systems, however their
successful use depends on properly posed problem methods.

80
2.5 A Vignette: New Zealand Modified Mercalli Intensity Scale – Gradable Adjectives
Felt earthquake reports are quantified using the New Zealand Modified Mercalli Intensity
(MMI) scale (Dowrick 1996, 2008). The NZ scale enhances the international MMI to include
environmental impacts and responses (as in italics below). The MMI also considers the
standard of building construction, but is useful in remote (no buildings) locations. Also listed
is a generalised GNS “Graded Adjective” scale for Intensity. The Mw magnitude is an
estimated guide for an equivalent local epicentre nearby to the MMI observer.
MMI Four Element Impact Description:
(People, Fittings, Structures, Environment)
Intensity
(GNS)
Mw
(local)
I People: Not felt except by a very few people under exceptional
circumstances.
unnoticed < 1.5
II People: Felt by persons at rest, on upper floors or favourably placed. unnoticed 1.7 - 2.2
III
People: Felt indoors; hanging objects may swing, vibration similar to
passing of light trucks, duration may be estimated, may not be
recognised as an earthquake.
weak 2.2 - 2.8
IV People: Generally noticed indoors but not outside. Light sleepers may
be awakened. Vibration may be likened to the passing of heavy traffic,
or to the jolt of a heavy object falling or striking the building.
Fittings: Doors and windows rattle. Glassware and crockery rattle.
Liquids in open vessels may be slightly disturbed. Standing motorcars
may rock.
Structures: Walls and frames of buildings, and partitions and
suspended ceilings in commercial buildings, may be heard to creak.
light 2.8 - 3.4
V People: Generally felt outside, and by almost everyone indoors. Most
sleepers awakened. A few people alarmed.
Fittings: Small unstable objects are displaced or upset. Some glassware
and crockery may be broken. Hanging pictures knock against the wall.
Open doors may swing. Cupboard doors secured by magnetic catches
may open. Pendulum clocks stop, start, or change rate.
Structures: Some windows Type I cracked. A few earthenware
bathroom fixtures cracked.
moderate 3.4 - 4.0
VI People: Felt by all. People and animals alarmed. Many run outside.
Difficulty experienced in walking steadily.
Fittings: Objects fall from shelves. Pictures fall from walls. Some
furniture moved on smooth floors, some unsecured free-standing
fireplaces moved. Glassware and crockery broken. Very unstable
furniture overturned. Small church and school bells ring. Appliances
move on bench or table tops. Filing cabinets or "easy glide" drawers
may open (or shut).
Structures: Slight damage to Buildings Type I. Some stucco or cement
plaster falls. Windows Type I broken. Damage to a weak domestic
chimneys, some may fall.
Environment: Trees and bushes shake, or are heard to rustle. Loose
material may be dislodged from sloping ground, e.g. existing slides,
talus slopes, shingle slides.
strong 4.0 - 4.6

81
VII People: General alarm. Difficulty experienced in standing. Noticed by
motorcar drivers who may stop.
Fittings: Large bells ring. Furniture moves on smooth floors, may move
on carpeted floors. Substantial damage to fragile contents of buildings.
Structures: Unreinforced stone and brick walls cracked. Buildings
Type I cracked with some minor masonry falls. A few instances of
damage to Buildings Type II. Unbraced parapets, unbraced brick gables,
and architectural ornaments fall. Roofing tiles, especially ridge tiles may
be dislodged. Many unreinforced domestic chimneys damaged, often
falling from roof-line. Water tanks Type I burst. A few instances of
damage to brick veneers and plaster or cement-based linings.
Unrestrained water cylinders (water tanks Type II) may move and leak.
Some windows Type II cracked. Suspended ceilings damaged.
Environment: Water made turbid by stirred up mud. Small slides such
as falls of sand and gravel banks, and small rock-falls from steep
slopes and cuttings. Instances of settlement of unconsolidated or wet,
or weak soils. Some fine cracks appear in sloping ground. Instances of
liquefaction (i.e. small water and sand ejections).
severe 4.6 - 5.2
VIII People: Alarm may approach panic. Steering of motorcars greatly
affected.
Structures: Buildings Type I heavily damaged, some collapse.
Buildings Type II damaged some with partial collapse. Buildings Type
III damaged in some cases. A few instances of damage to Structures
Type IV. Monuments and pre-1976 elevated tanks and factory stacks
twisted or brought down. Some pre-1965 infill masonry panels
damaged. A few post-1980 brick veneers damaged. Decayed timber
piles of houses damaged. Houses not secured to foundations may move.
Most unreinforced domestic chimneys damaged, some below roof-line,
many fall.
Environment: Cracks appear on steep slopes and in wet ground. Small
to moderate slides in roadside cuttings and unsupported excavations.
Small water and sand ejections and localised lateral spreading
adjacent to streams, canals, lakes, etc.
extreme 5.2 - 5.9
IX Structures: Many Buildings, Type I destroyed. Buildings Type II
heavily damaged, some collapse. Buildings Type III damaged some with
partial collapse. Structures Type IV damaged in some cases, some with
flexible frames seriously damaged. Damage or permanent distortion to
some Structures Type V. Houses not secured to foundations shifted off.
Brick veneers fall and expose frames.
Environment: Cracking of ground conspicuous. Land-sliding general
on steep slopes. Liquefaction effects intensified and more widespread,
with large lateral spreading and flow sliding adjacent to streams,
canals, lakes, etc.
extreme 5.9 - 6.5
X Structures: Most buildings Type I destroyed. Many buildings Type II
destroyed. Buildings Type III heavily damaged, some collapse.
Structures Type IV damaged, some with partial collapse. Structures
Type V moderately damaged, but few partial collapses. A few instances
of damage to Structures Type VI. Some well-built timber buildings
moderately damaged (excluding damage from falling chimneys).
Environment: Land-sliding very widespread in susceptible terrain,
with very large rock masses displaced on steep slopes. Landslide dams
may be formed. Liquefaction effects widespread and severe.
extreme 6.5 - 7.0

82
XI Structures: Most buildings Type II destroyed. Many buildings Type III
destroyed. Structures Type IV heavily damaged, some
collapse. Structures Type V damaged, some with partial collapse.
Structures Type VI suffer minor damage, a few moderately damaged.
extreme 7.0 - 7.7
XII Structures: Most buildings Type III destroyed. Structures Type IV
heavily damaged, some collapse. Structures Type V damaged some with
partial collapse. Structures Type VI suffer minor damage, a few
moderately damaged.
extreme > 7.7
Supplement: New Zealand Version MMI Scale Building Construction Types
Buildings Type I
Buildings with low standard of workmanship, poor mortar, or constructed of weak materials like mud
brick or rammed earth. Soft storey structures (e.g. shops) made of masonry, weak reinforced concrete
or composite materials (e.g. some walls timber, some brick) not well tied together. Masonry buildings
otherwise conforming to buildings Types I to III, but also having heavy unreinforced masonry towers.
(Buildings constructed entirely of timber must be of extremely low quality to be Type I.)
Buildings Type II
Buildings of ordinary workmanship, with mortar of average quality. No extreme weakness, such as
inadequate bonding of the corners, but neither designed nor reinforced to resist lateral forces. Such
buildings not having heavy unreinforced masonry towers.
Buildings Type III
Reinforced masonry or concrete buildings of good workmanship and with sound mortar, but not
formally designed to resist earthquake forces.
Structures Type IV
Buildings and bridges designed and built to resist earthquakes to normal use standards, i.e. no special
collapse or damage limiting measures taken (mid-1930s to c. 1970 for concrete and to c. 1980 for
other materials).
Structures Type V
Buildings and bridges, designed and built to normal use standards, i.e. no special damage limiting
measures taken, other than code requirements, dating from since c. 1970 for concrete and c. 1980 for
other materials.
Structures Type VI
Structures, dating from c. 1980, with well-defined foundation behaviour, which have been specially
designed for minimal damage, e.g. seismically isolated emergency facilities, some structures with
dangerous or high contents, or new generation low damage structures.

83
CHAPTER 3: TRANSFORMATION MODELS -
SEVEN ARCHETYPAL MODEL FORMS
This chapter investigates and reports a statistical observation survey and study into general
representation and transformation modelling undertaken at the beginning of this research
project beginning with a reminder of Figure 1.6.
An extensive literature search for guidance on structured representation and transformation
modelling of large-scale natural phenomena was unsuccessful. Small-scale phenomena are
commonly modelled using differential equations, but an examination of this technique found
it unsuitable for this project due to the scale and complexity of variables in natural systems.
Solving the complex problem elements jointly can be confused. Instead, the ISO 31000
approach enables solving the complex model elements progressively in three distinct steps.
This study was undertaken in part from first principles and largely from examination of
multiple applications of modelling in research, education, business, engineering and practice.
This chapter describes the research undertaken and the findings that provide for a new
structured approach to modelling empirical data. The research flow diagram (itself using an
archetypal model form) in Figure 1.6 illustrates how the findings of this chapter assist
transformation model application in the three situational studies that follow.
A particularly unique feature of this research project into natural systems is that natural
hazard parameters impact on individuals at a very small scale and local manner, and
simultaneously affect large communities that are both close by and distant. This dramatic
variability in scale challenges the usefulness of most modelling and mathematical methods.
As will be seen later, the author found the use of logarithms very helpful in this study.
Logarithms are a mathematical technique common to upper high school mathematics through

84
to physical science research but rarely used directly in modern business. It is a tool that was
once core to understanding the now rarely used slide rule that has been since replaced by
digital computing devices.
3.1 Introduction
Understanding natural hazard risk and disaster situations can enable more effective decisions
between options on how to prepare for, respond to, and recover from emergency situations
and events. This understanding can be deduced empirically to be a space-time process of
analysing available information. Unfortunately, in natural hazards and disaster situations,
information flows are immense and intense, in part because of the large scale of most events,
and in part because of the complexity of the human and geophysical interactions. These
limitations in information management can threaten the quality of required decisions.
Humans make extensive use of information-based decisions both as individuals and
communities and use that trait to identify opportunities for learning and improvement. It
appears only humans have an advanced ability to accumulate, store and distribute
information, and its derivative knowledge, in its own right, in all aspects of their life and
community. Further humans, routinely generate and accumulate information and knowledge
without any specific plan for its future use. This academic process of curating information
for storage is commonly attributed to ancient Alexandria but began much earlier, around
3000 BCE in the city of Uruk in Mesopotamia (in modern day Iraq) (Potts 2000).
The primary mechanism used uniquely by modern humans to accumulate, store and use
information is described here as modelling, compared to the oral and behavioural knowledge
traditions of prehistoric societies. This chapter develops a new understanding of general
systems modelling and demonstrates its specific validity to natural hazards and disasters.
Generally, a model builds on recorded and measured information. Through empirical
relationships to the potential outputs, the model accumulates empirical knowledge to assist in
future decision making. When a decision is required in natural hazard and disaster situations,
the potential hazard and disaster outcomes related to a particular decision can be calculated.
The outcomes are commonly determined using the traditional (pre-ISO31000) expectation
equation, itself a model that multiplies the spatial (impact) and time (frequency) parameters
to create a gross measure of expected risk to a community or system. In recent years
community needs for preparations, response and recovery to hazards and disasters by

85
community leaders such as government have increased, and the expectation model has
become central to government policy, investment and operations. This chapter demonstrates
that the simple expectation formula approach has significant weaknesses that can be
overcome by more sophisticated approaches to modelling.
The expectation approach weaknesses that are investigated and considered are:
Human behaviour as well as event frequency and impact are all important and should
be modelled in the same continuum.
Inferior outcomes for decision processes arise from simple input data models, whereas
mathematical transformations of inputs give consistent scales for impacts, frequency
and behaviour outputs and hence deliver better informed decisions.
Longitudinal measures of event progress with risky events can produce more valuable
information on risk than consolidated summaries of input data.
Modelling of specific surface energy in risky events can produce more valuable
information on system damage than direct measures of impact stimuli such as force.
Individuals and communities often make decisions with simplistic binary (Y/N) or
Boolean processes, in spite of access to very intense densities of support information.
3.2 Evolution of modelling
Systems’ modelling as an information transformation process did not result from a single
discovery. Despain (2010) showed that a fundamental capability of a human is to absorb
information, process and retain it in a structured form, for future use.
Despain (2010) describes the consensus of researchers for whom it is the very decision
complexity across, and the relationships between, multiple criteria rather than the simplicity
of a single trait that defines human thinking. This complexity appears to be linked to the long
period of childhood and nurturing, and shows extended education processes as unique to
humans. We can regard education as a process of learning how to understand and live with
the intrinsic and extrinsic world around us. Maheshwari (2011) reminds us that education is
more than mere schooling. Etymologically, education is derived from the Latin "e-ducere"
which means ‘to lead out’ or ‘to draw out’, a process of using intellectual structures to draw
meaning from natural real world phenomena.

86
3.3 Empirical and Formal Models
The real world is an empirical world - from the Latin “empiricus” meaning to practice or
experience. In empirical science research outcomes are based on experiment or observation.
In this empirical research environment, observed outcomes are modelled into empirically
based theory describing the behaviours of phenomena that later provide for prediction of
behaviours when subject to alternative stimuli. This is illustrated in Figure 3.1.
The alternative to the empirical research environment occurs when a conceptual model and
outcomes are derived by logic and deduction from first principles without practical
experimentation or observation inputs. When the deduced formal behaviours equate to the
empirical observations, the theoretical model of the real system is considered validated.
Figure 3.1 shows the behavioural cycle of observation and prediction that is central to the
growth in human knowledge.
Figure 3.1: Behavioural relationships between the empirical and theoretical worlds
This type of learning and knowledge model is described in multiple contexts by Routio
(2007). Of general observation is that the literature on approaches to modelling is largely
developed by constructivist deduction processes rather than experimental positivist processes.
Ekeberg (1991), Kadane & Kazar (2001), Peschard (2011), Knuuttila & Boon, (2011), Frigg
& Nguyen (2017) Brady (2018) all show how models may evolve to meet the need of the
user within the disciplinary study area they are describing. Some studies on general and
complex systems use examples of model types, but comprehensive investigations into the
range of uses of models in constructivist epistemology do not appear to exist.
This study has taken a different approach following exposure to the work of authors such as
Saxe (1872) and Ekeberg (1991), where each author used multiple models to describe several
different elements of the subject and hence give a more comprehensive representation and
understanding of the real system. This led to the questions: what types of models are there,
real world, and
empirical phenomena
virtual world
and theoretical
phenomena
behavioural observation
behavioural prediction

87
what are their properties and strengths, and how can their use be optimised in research and
knowledge representation?
3.4 Creating a System Model
The challenge of creating a system model by description of measured features are
demonstrated in John Saxe’s allegorical poem (1872), The Blind Men and the Elephant (refer
Chapter Appendix), where each description is only what is within each observers’ adjacent
space. The six blind men of Indostan (India) each feel the elephant to have a different shape
and surface. Each description is of one observer only so a composite of six observers is
required to build the comprehensive system model. We see that six individual descriptions
are inadequate because they only cover the adjacent space and time properties of the six blind
men. None of the observers describes other aspects of an elephant such as feed and waste
processes, respiration and sound making, procreation and nurturing, herd and community
behaviours or other traits of elephants that make them unique in the animal kingdom.
To understand modelling, it is useful to start with Oxford Dictionaries Online (2013) which
provides eleven distinct meanings for the word – model. These dictionary meanings will all
fit within the set of archetypal model forms described in the findings later in this chapter:
a three-dimensional representation of a person or thing or of a proposed structure,
typically on a smaller scale than the original,
(in sculpture) a figure or object made in clay or wax, to be reproduced in another more
durable material,
a thing used as an example to follow or imitate,
a person or thing regarded as an excellent example of a specified quality,
an actual person or place on which a specified fictional character or location is based,
the plan for the reorganization of the Parliamentary army, passed by the House of
Commons in 1644 - 1645,
a simplified description, especially a mathematical one, of a system or process, to
assist calculations and predictions,
a person employed to display clothes by wearing them,
a person employed to pose for an artist, photographer, or sculptor,
a particular design or version of a product, and
a garment or a copy of a garment by a well-known designer.

88
These definitions enable us to recognise that modelling is primarily the action of representing
world phenomena, often described as a system, in an alternative or reduced form. Even the
‘person employed to pose’ fits this description since the artist, photographer, or sculptor will
have an artistic message they are trying to develop and communicate and the model is a
generic representation of that message to assist them in their artistic creation. This enables
world phenomena to be partially or completely represented from another perspective either to
describe its past, or its future. It then means that the modeller or model creator has the
opportunity to focus on a subset of the system’s universal properties, to convey a certain
emphasis to the target audience.
A key element of modelling is that there is no obligation to model the entire set of a system’s
behaviours or properties. It is an important freedom to select a subset for a modelling focus
and therefore learning or research activities. It is however best practice for the model creator
to define explicitly the properties being excluded from the model, so an audience knows the
limitations of the model. This approach leads to development of a new definition for a model
as noted in this author’s prologue and in this chapter being:
A Comprehensive Definition of a Model
A model is a transformation of a phenomenon that enables its properties to be described in
a new manner to assist evaluation of its past behaviours, a description of its current
status, or the prediction of future behaviours, and the communication of all three.
The (Oxford Dictionaries Online) eleven meanings of model illustrate the pre-eminent role of
modelling in the development of human knowledge. Further that the eleven definitions fall
within the comprehensive definition gives a basis for classifying the types of model.
3.5 Empirical Survey of Models by Observation and Properties Correlation
In order to bring structure to the selection of suitable models for a particular question and
avoid the risk of omission, an observational survey of various model type using keywords
(Frigg & Nguyen, 2017, Kadane & Kazar, 2001) was conducted. This observational research
approach (Given 2008, p 573-577) is typically applied to psychological research on human
subjects, however in this case the benefit of qualitative observation, its flexible and emergent
research structure, and effectiveness for exploring topics about which little is known closely
matches needs of this survey. The survey used online search engines, hard copy media such
as textbooks, published research papers, and educational materials as model example sources.

89
The seven model forms were not hypothesised in advance, but evolved by examination for
common properties as each model example was found and studied, resulting in the list of
seven distinct forms and their properties as seen in Table 3.1.
The nine keywords used in the searches were: (i) system(s), (ii) model(s), (iii) diagram(s),
(iv) data, (v) theory(s), (vi) representation, (vii) finance, (viii) science, and (ix) literature.
Survey Sorting and Analysis Method
The “field” research in this part of the study was undertaken during 2013 as follows:
1. The search and survey identified in two stages, a total of 2,968 different general
models including models specific to risk, natural hazards and disasters.
2. Stage one was a scanning search across multiple books and other publications, online
search engines, galleries, museums, of approximately 1,000 examples of models
3. Stage two followed by second sample search to give the final total of 2,968 unique
model examples. The search ended when there was a high level of result repetition.
4. These were then catalogued and correlated into those with common characteristics as
finally summarised in table 3.1, resulting in seven distinct categories.
5. The occurrence survey excluded dictionaries and unpublished raw data as these were
models (sorted lists) in their own right rather than applications of models.
6. Composite models (as noted below) that combined more than one model type (5% of
the survey) were counted once, by the dominant form.
7. The model types with a basic set of key properties and examples of each of the seven
archetypal models evolved as new model types with unique properties appeared.
8. Each model example, was also considered for features that made it different and
therefore potentially a new or previously unrecognised form.
9. The distinct forms of models found, their properties listed and then tabulated.
An example of step 6 is a computer spreadsheet, where cells may be populated by words,
numbers, data or formulae and the file may have graphs as images. An example of step 8
includes describing a data (stream) as not being a single row table, or a flow chart as not
being an image, hence these two forms appeared later in the survey process.

90
Table 3.1: Properties and examples of the seven archetypal model forms
Model Properties Examples
1: Image Free form layout of elements
Composition mimics real or conceptual
phenomena such as design, manufacture
and assembly
Elements are colours, lines, shapes, and
dots or pixels
Enables free form creativity
2D (CAD) drawings and plans
Maps
Graphs
Printed fabrics
Photographs
Image artworks
2: Scale Three dimensional model
Typically XYZ ratio scale
May replicate some functions
May be linear (scale) model,
Scale alone enables perception and
setting functionality
3D (CAD) drawings and plans
Architectural development
Sculptural artworks
Fishing lures (of wild fish food)
Scale model boat, car, or doll
Wind tunnel shape testing
3: Table Rows and columns
A list is single column table
Populated by words & numbers
Qualitative & quantitative applications
Includes mathematical matrices
Financial tables and ledgers
Periodic table of elements
Experimental output records
Telephone book
Mass and energy balances
4: Narrative Sentences and paragraphs
Populated with words
Qualitative model applications
Subjective and objective modelling
options
Dictionary or encyclopaedia
Religious texts
Novels or other fiction
Biography
Poetry and drama scripts
5: Formula Formulae and equalities
Uses symbols and numbers
May contain statistical elements
Governed by strict rule conventions
Trigonometry, algebra etc.
Solar system dynamics
Chemical reactions
Spread sheets
6: Data
(Stream) Continuous stream of values
Populated by symbols / numbers
Alternative format and systems
Includes, decimal, binary, etc.
Musical score
Digital music recording
Data logger output or record
Digital information stream
7: Flow
(Chart) Shapes and lines typically in two
dimensional format
Structured shapes represent resources
and functions
Structured lines represent relationships
and flows
Mass and energy balances
IT system developments
Project management
Experimental design
Business system diagrams
HR records systems

91
No Exceptions Statement:
The survey found that from the 2,968 model samples examined, there were no examples of a
model that were not one of the seven archetypal forms listed and described in Table 3.1.
Composite Models:
Each example of a model found was counted only once. There were 150 examples of models
in the survey that had composite forms, comprising 5% of the total sample. In the case of
composite models, the dominant type in the example was counted once in the survey. The
relatively low occurrence of this combination does not materially affect the general analysis.
3.6 Seven Archetypal Model Examples
The observational survey to find the archetypal model types is illustrated with some
examples. These models are drawn from modern and historic, natural hazard and disaster
situations showing models of events, data and systems.
i. Images:
Australian indigenous peoples have for some 30,000 years created images by painting on
rocks and bark as both a cultural symbol connecting their past and present, the supernatural
and reality and a model of their environment. In Figure 3.2, this example of modern
Aboriginal art is both representative (physical features) and transformational (with meanings)
elements including historical and future meanings, and cultural rights. Other images such as
graphs and engineering plans include spatial and
temporal images in more modern situations.
Figure 3.2: Brisbane floods inspired this Indigenous
painting: The Water Dragon. The 2011 Brisbane floods and
the area's Indigenous history have been incorporated into
this image that celebrates contemporary indigenous
storytelling. Water Dragon was painted by Brisbane
Indigenous artist Judy Watson.
Photo by ABC and Judy Watson

92
ii. Scale Models:
The historical transition from simple images to scale models enabled original users to carry
around a model that had physical substance and therefore might carry the powers embodied
in the original. This includes items such as scale models of ancient gods, or modern religious
symbols, again showing both representational and transformational elements. Scale models
also have important roles in research, media and education for example, demonstrating the
operation and limitations of flood disaster control projects such as in South Holland.
Figure 3.3: Scale model of the
Maeslantkering barrier for storm
surge control in the Maas River
system in South Holland, The
Netherlands.
Photo: Quisnix
iii. Table Models:
The development of simple symbols to represent and record a quantum of goods or services
enabled basic barter trade to grow into trade between ancient communities and organisations
and ultimately lead to the Balance Sheets and Profit / Loss Statements of modern commerce.
Likewise tables being more commonly used as representational models have become one of
the most effective representations of events, systems and data. Tables (often as computer
spreadsheets) can be used directly for transformations where columns or rows of data are
transformed into other forms of data for modelling purposes, for example for intensity or
psychometric modelling as later in this thesis.
Figure 3.4: A table of the five most intense Atlantic
Hurricanes. This table lists the most intense Atlantic
hurricanes (also called tropical cyclones) in terms of
their lowest barometric pressure (hectopascals) where
normal atmospheric pressure is 1013 hPa.
Source: HURDAT Database
5 Most intense Atlantic hurricanes
# Hurricane Year hPa
1 Wilma 2005 882
2 Gilbert 1988 888
3 "Labor Day" 1935 892
4 Rita 2005 895
5 Allen 1980 899

93
iv. Narrative Models:
These first appear as an extension of the trading records by becoming descriptions of events,
customs and relationships. They were typically written on papyrus scrolls or carved into
wood, stone or clay tablets and onto building walls taking the simple representations of
events into transformation narratives of historical stories.
Figure 3.5: The Gilgamesh (The Great Flood) Tablet
(Library of Ashurbanipal: Neo-Assyrian). This object is the
single most famous cuneiform text because of its similarity to
the Noahs Flood story. It is the 11th Tablet of the Epic of
Gilgamesh and tells how the gods determined to send a great
flood to destroy the earth, but one of them, Ea, revealed the
plan to Utu-napishtim whom he instructed to make a boat in
which to save himself and his family.
Photo: British Museum; ID K.3375
v. Formula Models:
The development of the formula concept, whether in mathematics or chemistry, being
essentially a balanced description or equation of a physical phenomenon, enabled large and
complex systems to be described in concise forms, including dimensional transformations.
Famous transformation formulae include Pythagoras’ ancient triangle equation (a2 + b
2 = c
2)
and Einstein’s energy mass equivalence formula E = mC2 (Einstein, 1905). These formulae
not only record physical data, but enable prediction of future combinations and outcomes.
Figure 3.6: Earthquake Energy Release - Gutenberg
In the Gutenberg-Richter formulation, known energy is
released. For surface-wave magnitude, Ms, the
Gutenberg-Richter energy release formula takes the
form:
E = energy release (Joules)
M = surface-wave magnitude (Ms)
log10E = 4.4 + M*1.5 (USGS Choy, 2012)

94
vi. Data (Stream):
This a commonly used, but generally not well understood, as an alternative form of modelling
because of some similarities to narrative writing. The earliest examples were written music
scores originating from Mesopotamia, which enabled a code of musical notes to be written in
a time stream. The data model stands separate from narrative information and table lists
because it exists in only the single dimension of time. The data stream records a temporal
stream of data, which may be measurements from a scientific experiment (a representational
model), as well as a musical score (a future or transformation model).
A Music Data Stream
Figure 3.7: Music stream for The Tempest at Sea (Symphony 39) by Joseph Hadyn in 1765. This
emotional symphony was came from the early “storm and stress” period of romantic and dramatic
works in literature and music, and later inspired works by Bach and Mozart. This opening segment
emphasizes the single temporal dimension of music scores as a modelling device for music.
Composer: Franz Joseph Hadyn, 1732 - 1809
A Scientific Data Stream
The simple representation and data stream model in Figure 3.8 is from a modern instrument
for sensing earthquakes. This is a segment of the Heathcote Valley Primary School (HVSC)
raw data seismic record from the 16-bit accelerogram that started recording at 20110221-
235142 GMT during the Christchurch February 2011 earthquake. Graphical traces of this
record (notably the top left trace) are seen in Figure 5.7, later in this thesis.
This extract is of the SW horizontal ground acceleration data stream being:
Across one of the three spatial orthogonal dimensions,
Is recorded every 5 milliseconds, and
Shows the data record for a total 0.75 seconds, being 150 data items.
Shows data in the south-westerly direction of the horizontal plane.
The ground acceleration at two kilometres from the epicentre was momentarily an
extremely high 16,468 mm/s2 (Fig 3.8, bold / box) or 1.6 times greater than gravity.
This was exceptionally high horizontal acceleration and shaking that led to the extraordinary
damage and injury levels from what was an only moderately sized earthquake.

95
The segment in mm/sec at Heathcote Valley Primary School starts at 20110221-235142 GMT:
…….. 391.5 870.6 759.5 457.5 223.9 -22.1 -509.4 -1272.4 -1751.4 -2219.8
-2757.1 -1952.8 -305.2 768.5 1305.8 1659.2 2026.7 2546.3 4231.6 6294.3
7184.6 7804.0 8165.9 7685.6 6375.3 4828.3 4050.5 4024.4 4482.9 4729.3 4664.3
4757.6 4293.0 3140.4 1706.0 49.8 -1317.2 -2214.2 -2710.3 -2742.0 -2783.5
-2930.9 -2916.1 -2759.2 -2265.4 -1859.8 -1686.8 -1522.3 -2181.0 -3575.8 -5027.9
-6237.1 -6717.6 -6663.5 -6426.3 -5174.8 -2050.7 1255.4 3659.9 6067.7 7534.0
7936.7 8050.2 8639.8 9857.5 10032.4 10450.2 10228.3 7802.2 6408.5 6178.2
5990.2 5739.6 5281.4 5197.1 5244.4 5534.8 5789.7 5662.6 5494.1 5187.6 4807.9
4607.2 4533.6 4554.6 4635.0 5552.4 6068.7 2770.8 -196.0 264.3 -363.0 -1729.8
-5539.4 -10845.2 -12008.1 -14592.0 -16467.7 -12444.2 -11029.8 -12828.3 -13569.9
-12683.0 -10417.5 -10431.1 -10723.7 -9161.4 -9100.1 -8664.0 -6794.4 -6352.3
-6494.4 -6596.9 -7078.2 -7001.1 -6419.3 -5754.8 -5273.1 -5235.1 -5339.4
-5285.9 -5428.4 -5714.0 -5511.9 -4857.4 -3909.8 -3121.3 -2402.1 -1697.9
-1372.2 -630.4 348.4 1022.1 1397.1 1914.5 2567.0 3207.0 4359.2 4137.9
3182.9 3161.2 2904.5 4043.1 5654.0 3176.7 ……………
Figure 3.8: A 0.75 second, raw data stream segment for earthquake ground acceleration
vi. Flow (Chart):
Flow models such as organisational structure, Gantt and flow charts can represent a model of
an organisation, project stages, or disaster event procedures as well as the flow of
responsibility or work (a transformation) from management to workers and staff in two
spatial dimensions or one each of space and time.as in Figure 3.9. Figure 1.6 earlier shows a
flow model to describe the flow of data and transforms used in this thesis. It is this attribute
of flow from a beginning to an end
that distinguishes them from simple
image models.
Figure 3.9: A simple (US EPA)
National Response System Flowchart
guides the first few operational stages
in response to a major incident report
whether caused by a natural hazard
trigger or anthropological activity

96
3.7 Dimensional Analysis
An essential aspect of modelling is ensuring consistent dimensional perspectives of the
model. This consistency will lead to model integrity and the potential for extrapolation to
situations beyond the empirical data set – for example future forecasts. This study has
recognised mass, space and time as the key dimensions, with the three orthogonal dimensions
for defining space and one time dimension of back and forth. The archetypal forms may
exchange either of the dimensions (for example a second or third dimension being either a
space or a time dimension) so long as internal model consistency is conserved.
Within the space and time dimensions fundamental properties of matter and systems such as
length, mass, temperature, as well as time can be then defined and modelled so that for
example while Figure 3.8 shows a seismic data set in the time dimension, each data entry has
the dimensions of distance and time squared. This property becomes important when
deciding which model format will give the best data transformation. In deciding, for example,
how to describe a seismic event whether the original Richter magnitude, a more recent
magnitude measure, the moment magnitude scale (Mw) and the intensity scale (Modified
Mercalli Intensity), the peak ground acceleration, or the calculated specific surface energy
(SSE), gives the best measure of strength and prediction potential for community damage.
It is important to recognise that the word dimension has two complementary meanings, one
being spatial and the other being mathematical. Spatial dimensions are essentially the three
orthogonal dimensions for defining space and one time dimension of back and forth.
Mathematical dimensions are essentially units of measure: length, mass, temperature and
time etc. There are no clear alternative words and the appropriate meaning of each word is
contextual on its application. Consistency is an essential element of the use of this word and
the activity of dimensional analysis is aimed at maintaining that consistency.
Consequently, a list of descriptions for each of the seven forms may be defined as follows.
1. A schematic or representational image in two dimensions of space, such as a two
dimensional artwork.
2. A scale model in three dimensions of space, such as a dimensionally scaled item or
replica, or a sculptured statue.
3. A table of properties being in one dimension of space and another dimension of space
or time, for example a set of research or financial tables, or a list.

97
4. A narrative description, such as a written definition, or published work being
generally in two dimensions of space – across and down (in English).
5. A formula equation or set of inequalities including science equations being in one or
two dimensions of space and another possible dimension of space or time.
6. A data stream records in one dimension in time, such as music (in say digital / binary
or paper media) or a scientific measurement record.
7. A flow model being in one dimension of space and another dimension of space or
time, as typically used in business systems when as a flow chart.
The analysis of the 2,968 model samples is shown in Table 3.2, which records a name for
each class, its frequency of use and a historical perspective of its introduction to usage by
peoples. The frequency of use is largely indicative and partly related to the design of the
survey; however, it is believed that a comparable size of the survey sample would give
comparable results. This conclusion is reached from the initial survey of approximately
1,000 models, which generated a similar frequency distribution.
Table 3.2: Occurrence of categories of system model structures
Archetypal
Model Forms
Occurrence
(s = 2,968)
Example of an
Early Use
Era of
Introduction
Age in Years
(ref. Common Era)
1. Image 42.0% Sulawesi cave art
(35,000 BCE) Middle Paleolithic 70,000 - 30,000 BCE
2. Scale 5.8% Carved figurines
(30,000 BCE) Upper Paleolithic 30,000 – 1,000 BCE
3. Table 11.1% Sumerian cuneiform
ledger (8,000 BCE) Neolithic 8,000 – 4,000 BCE
4. Narrative 4.0% Egypt hieroglyphs
(3,400 BCE) Neolithic 4,000 – 2,000 BCE
5. Formula 14.4% Babylonian algebra
(1,800 BCE) Ancient 2,000 - 0 BCE
6. Data 4.2% Hurrian music
notation (1000 BCE) Ancient 1000 BCE – 1000 CE
7. Flow 18.5% Organisation and
Gantt chart (1910) Modern 1900 CE to now
3.8 The Computer Model:
As noted in the foregoing, the “computer model” is generally not a specific individual form
of model, but rather a structural mechanism for building various model forms comprising
high volumes of data, typically using proprietary computer software. It is more accurately
described as computerised modelling. Computerised modelling enables a model creator to
store and rapidly manipulate via different scenarios the model properties. This enables the

98
presentation of past, current or future behaviours of the system in a digital form in a process
most commonly described as simulation.
A parallel form of computer modelling is Computer Aided Design (CAD), which creates an
image model of say a building that can be rotated, rearranged in part or full all within seconds
and in the process manipulating huge amounts of basic data to present a simple outcome of
different options or scenarios.
3.9 Project Modelling
It is common that some or most of the seven modelling forms may be used in a single project,
for example an engineering project may use images of engineering drawings (manual or
CAD), a scale model for project promotion or planning, table schedules of materials,
narrative specifications and standards, design formulae, quality testing data streams, and
management flow charts. It is seen that Ekeberg (1991) is an excellent example of the
application of these modelling structures to a complex life science research study. Although
now somewhat older, this paper on the central nervous system (CNS) responses of in vitro
lamprey (eel) utilises all seven forms of modelling as follows:
1. Images in the form of graphs of responses to ionic conductance of key solutes,
2. The underlying bench top experimental equipment set up (a functional scale model)
where stimuli were applied and responses measured.
3. Narrative descriptions of neural networks and stimuli responses,
4. Tables of neuron parameters and properties data (and of course the reference list),
5. Mathematical equations of the electrochemistry and the ionic conductance channels,
6. Data streams of neuron responses to ionic solute concentration,
7. Flow diagrams based around a single cell model of the system,
Ekeberg describes the research process of evolving from a biological model to a quantitative
conceptual model. Once appropriate quantitative data were gained, the resulting model
complex was computerised for predictive purposes through the use of multiple simulations.
The model was developed for small cellular networks on an Apple Macintosh II and for
larger complex networks on a UNIX based multiuser system. Perhaps, because this was an
early modelling and simulation project the authors devised and explained their program

99
methodology clearly from first principles and avoided the risks of short cuts and assumptions
in terminology.
At this point, some observational comments are required. The Ekeberg project culminates in
a suite of models and a computerised model. Whilst the suite of models includes “every
mechanism”, the paper does not record how those that are not included were decided, for
example ionic solutes other than potassium, sodium, and calcium. This means that the
parameters deliberately excluded from the study, may put unstated constraints on the
applicability of the research that can only be deduced by a reader. The systems approach in
Table 3.1 requires that defined relationships across the system boundary are required for a
complete system definition.
It can be concluded from this discussion of the Ekeberg project that this older study is a
superior example of best practice in natural system modelling. Time has helped to define
systems theory and modelling theory from its early scientific days, described by Bertalanffy
(1969) and successive theorists, and enable a more structured approach to systems modelling.
This process of defining general and complex systems, of describing open and closed systems
is a more structured approach. The table of generalised properties is an outcome of a
widespread literature study as reported earlier which found that many descriptions of systems
in the literature were themselves poorly defined, it would appear because the researcher or
author had not clearly worked through the boundaries of their work.
Table 3.1 is a composite of a wide range of readings on systems of many types. The
underlying concern is not the absolute definitions of the systems in other published works but
that those systems were not adequately defined and therefore through unclear boundaries,
elements, attributes, and relationships, the validity of conclusions may be compromised.
This thesis and its underlying research have attempted a systematic positivist approach to
modelling, to develop more robust conclusions from the analysis of field data.
3.10 Modelling practice - model form selection:
In some situations, the model form selection is best pre-determined from established practice,
for example, corporate financial reports will use legislatively prescribed forms of tables, and
bait models (lures) in recreational fishing will follow decades of dedication, commitment,
trial and error, and hard lessons. For others, especially those with limited precedent, the best

100
option is not as clear. The modeller or researcher may need to evaluate several potential
forms before settling on the form that meets the modelling objectives and indeed the need for
several model forms to describe the system behaviours in a single project.
In standardised financial reports under the International Financial Reporting Standards
(IFRS) adopted in part or completely by most countries, the main business system is
represented in a standard four model set of tables for annual reporting. The primary purpose
of these reports to give investors a model of the business in a regulated and standard form
(recognising the international nature of investment markets) to decide whether the
corporation is meeting its investment objectives and whether the investment should continue:
Statement of Financial Position, previously known as the balance sheet
Statement of Comprehensive Income, previously the profit and loss account
Statement of Changes in Equity, and
Statement of Cash Flows
The complete business model often represented in the annual report for example the BHP
Billiton Annual Report (2012), is a large collection of alternative model forms. These
alternative forms include narrative descriptions, maps, graphs, data tables, mathematical
tools, along with prior year comparisons to demonstrate recent temporal properties of the
company. The two companies BHP and Billiton, which combined to form this entity, have
histories commencing in 1885 and 1860 respectively and financial records going back to
these times. This heritage has created a wide range of precedents and structures that have
evolved into this latest published business model.
Kadane and Kazar (2001) observe that much of modern scientific enterprise is concerned
with the question of model choice. A researcher collects data, and wants to study how it
affects some outcome of interest. Kandane and Kazar conclude that typically choice of a
model, as a component in a unifying conceptual framework, is a workable attempt to bring
order to this decision.
The process of model selection and development therefore follows these eight key steps:
1. Identify the system, its boundaries, its components, resources, sub-systems and the
relationships between them,
2. Identify the system observer, typically the stakeholders outside the system and their
objectives, while typically defining the relationships within the system,
3. Identify the purposes of the model,

101
4. Identify the inputs to the model, typically concepts, data, structures and relationships,
5. Identify the outputs to the system model or its composite sub-system models,
6. Identify the component exclusions to the system model commencing with those
components that are next to included components or those having relationships with
included components.
7. Identify the modelling structure or structures to be used for the specific parts of the
model.
8. Identify the model structure transitions over the temporal frame of the system, for
example: original data, evolving into tables, graphs, flow charts, mathematical
relationships, computer based scenario simulations, simulation outputs, and narrative
reports and descriptions.
This approach requires the researcher or model creator to define the system inputs and
outputs, the boundaries around the system, what elements are relevant and not, and the
relationships between them, all at an early stage, leading to a more robust study. Of course,
the principles herein permit iterative improvements as the project progresses, all leading to
the key research question a researcher or model creator will ask in selecting a model choice
under this scenario. The key question becomes - will this model reduce the complexity of the
real world system, and yet include all material and relevant parameters in a way that
generates a useful predictive description or outcomes?
3.11 Modelling practice – professional preferences and bias
This chapter began with a discussion on human uniqueness, however such is the scope of
human knowledge that early in the life of a person, biases in thinking form, leading to biases
in the education and professional direction a person’s life will follow. This leads inevitably
to biases or preferences in modelling approaches with most persons feeling more comfortable
or at ease with different approaches.
In the course of the data gathering for the 2,968 occurrences of model forms illustrated in
Table 3.1, clear professional biases emerged. For most professions it was noticed that there
was a clear primary preference, and for many, one or more secondary preferences. Some
professions such as engineers and researchers (social and scientific) are likely to be
comfortable with several preferences but interestingly many professions have one or more
model forms that are almost exclusively avoided. This creates risks for those professions, in

102
that the discovery or communication of information with clients, readers, and users may be
incomplete. Table 3.3 presents an anecdotal view of many common professions observed in
the initial part of this study.
Table 3.3: Some professional preferences of the seven archetypal model forms
Model Form Primarily Preferred Secondary preferences
1: Image Artist (image or surface)
Presenter / marketer / sales
Mapmaker / geographer
Professional engineer
Chemist, scientist
Author / storyteller
2: Scale Architect
Toy maker
Sculptor
Film maker
Chemist (molecules)
Marketer / sales
3: Table Accountant
Statistician
Database manager
Researcher
Marketer / Sales
Policy maker (government)
4: Narrative Author / Journalist
Policy maker
Teacher
Researcher
Business analyst
Geographer
5: Formula Professional engineer
Chemist / physicist
Mathematician
Accountant (spreadsheets)
Hydrologist
Geophysicist / meteorologist
6: Data Computer engineer (binary)
Musician / composer
Geneticist (DNA models)
Financial analyst (markets)
Geologist (seismic data)
Database manager
7: Flow Project manager
Plumber / Electrician
Business analyst
Professional engineer
Policy maker
Geneticist (DNA models)
In table 3.3 the model forms 1, 3, 4, 5, 6, and 7, mostly cover the professions and disciplines
engaged in natural disaster planning, response and recovery, in other words almost all forms.
It is this aspect when applied to the situational studies reveals properties of hazards and
events not otherwise well defined. The converse of these observations also applies where,
when presented with information modelled into a format not typically used by the
professional audience, that the discomfort with the presentation may see the conclusions
rejected. An example of this is seen in natural hazard and disaster models where the
dominant professionals are geographers and earth science professionals who are typically
more at home with maps than tabulated data and mathematical formulae. Yet some elements
of damage and risk, forecasting and attenuation, are more fully described by mathematical
relationships. The information that arises from these relationships is at risk of non-discovery

103
from key decision makers unless the model creators recognise the limitations of their
audience.
3.12 Conclusion:
Effective research modelling must be based on (i) a comprehensive understanding of the
underlying real world system; (ii) explicit decisions on what to include and exclude in the
model; (iii) a clear understanding of the model’s audience; and (iv) a structured analysis of
the modelling options. This chapter has described how research into a large number of system
models has identified seven archetypal model structures each with common properties and at
least one mutually exclusive property between model types.
Further, the chapter has illustrated the differences and similarities in representational and
transformational models in how they record and present data and information.
Computerised models are not a unique archetypal form, but instead a versatile and widely
used methodology or tool for building and analysing a model in a multi-scenario simulation
environment. It is generally most valuable in obtaining detailed behavioural and temporal
understanding of the subject system from a large amount of data such as is generated in a
typically short period of a disaster event.

104
3.13 A Vignette: The Blind Men and the Elephant, A Hindoo Fable, J G Saxe (1872)
I It was six men of Indostan, to learning much inclined,
Who went to see the Elephant, (though all of them were blind),
That each by observation, might satisfy his mind.
II. The First approached the Elephant, and happening to fall
Against his broad and sturdy side, at once began to bawl:
"God bless me! - but the Elephant, is very like a wall!"
III. The Second, feeling of the tusk, cried: "Ho! - what have we here
So very round and smooth and sharp? To me 'tis mighty clear
This wonder of an Elephant, is very like a spear!"
IV. The Third approached the animal, and happening to take
The squirming trunk within his hands, thus boldly up and spake:
"I see," quoth he, "the Elephant, is very like a snake!"
V. The Fourth reached out his eager hand, and felt about the knee.
"What most this wondrous beast is like, is mighty plain," quoth he;
"'Tis clear enough the Elephant, is very like a tree!"
VI. The Fifth who chanced to touch the ear, said: "E'en the blindest man
Can tell what this resembles most; deny the fact who can,
This marvel of an Elephant, is very like a fan!"
VII. The Sixth no sooner had begun, about the beast to grope,
Then, seizing on the swinging tail, that fell within his scope,
"I see," quoth he, "the Elephant, is very like a rope!"
VIII. And so these men of Indostan, disputed loud and long,
Each in his own opinion, exceeding stiff and strong,
Though each was partly in the right, and all were in the wrong!
MORAL. So, oft in theologic wars, the disputants, I ween,
Rail on in utter ignorance, of what each other mean,
And prate about an Elephant, not one of them has seen!

105
CHAPTER 4: THE LIKELIHOOD OF NATURAL HAZARD EVENTS
This chapter examines the likelihood (called probability or occurrence elsewhere) parameter
in the proposed three part risk assessment model beginning with a reminder of Figure 1.6.
The background to this chapter is found in the continuing validity of the Gutenberg and
Richter, frequency–probability model of (1949) across multiple international studies and its
applicability to the research study area of the Snowy Mountains Region (SMR). The review
shows Australia is a single continent, a single tectonic plate, with no plate boundaries within
it is under global levels of compression and is different to almost everywhere else on earth.
The literature then shows how the SMR, a relatively consistent part of Australia, with a high
level of economic and infrastructure development is an excellent dataset for examining one of
the world’s great development conundrums – reservoir induced seismicity. This discussion
will be limited to seismicity literature, and the record of magnitude and intensity in the SMR.
The underlying natural seismicity of the SMR, an intraplate region is not well known in terms
of the Gutenberg-Richter law. The conference presentation by Hart (2014) gave rise to a
vigorous debate of the role of Reservoir Induced Seismicity (RIS) in the Geoscience
Australia (GA) dataset. The debate considered whether the dataset had been adversely
affected by the Snowy Mountains Scheme, and in particular by the potential effects of RIS on
the many large dams and reservoirs in the region. This study will examine the limited
published examination for this, notably (Gibson & Sandiford 2013, McCue 2011, Gupta &
Rastogi 1976, Denham 1974, Cleary 1962) and the records of seismic activity in the region to
assess the impact of RIS on underlying natural seismic risk in the Snowy Mountains Region
(SMR). This study excludes suspected RIS in underground oil and gas reservoirs including
coal seam gas, which has been the priority for RIS research in recent years (O’Neill & Danis,
2013, Drummond, 2016)

106
4.1 Introduction
The standardised approach to risk management (ISO 31000) represents event risk assessment
and management with the two event parameters: the likelihood of occurrence, and the event
consequences in both qualitative and quantitative works (Stevens, 1946). To help quantify
SMR seismic history and risk, a study on the Gutenberg-Richter equation was carried out.
The author was personally advised by an experienced Snowy Mountains geologist (pers.
comm. K. R. Sharp 2013) that the 1959 Berridale event (McCue 2011) was not considered by
most geologists to be caused by the Eucumbene Dam but was instead a normal event on the
Berridale Wrench Fault. Many local residents informally expressed an opposing view that the
Eucumbene Dam caused the Berridale sequence in the 1959-1963 period (Bowland 2011).
The reported occurrences of Reservoir Induced Seismicity (RIS) in the primary study area
were initially investigated because of the concentration of 20 large dams. In addition a
further 32 moderate to large dams and water reservoirs in the extended montane region from
Victoria to the NSW Blue Mountains were studied bringing the total to 52 large dams, almost
all of which were built since 1950. This period corresponds to the establishment of a
substantial seismic monitoring program by the Snowy Mountains Scheme (Moye, 1956).
Australia is Different
The frequency and magnitude of significant intra-plate earthquakes across the world are
significantly less than the inter-plate regions along the tectonic plate boundaries. Figure 4.1
(Glanville 2012) shows the low occurrence of earthquakes greater than M5 for a typical year
(2011) on the Australian continent. Nevertheless, real risks do exist and Geoscience Australia
(GA) has published a comprehensive seismic risk map for Australia in Burbidge (2012).
The dominance of the earthquake frequency and magnitude along the Australian plate
boundaries overwhelms the awareness of damaging earthquake risk in continental Australia.
The GA seismic event database has 74 manually estimated and recorded earthquakes greater
than magnitude 2.0 between the years 1900 and 1955. The largest of these was a magnitude
7.3 in 1941 at Meeberrie, W.A. The seismic instrumentation equipment and network
improvements since this time have resulted in 14,472 earthquakes being recorded between
1955 and 2013 with three strong quakes at the highest magnitude of 6.7. The highest casualty
(injuries and fatalities) event in Australia was the 1989 Newcastle earthquake, described as a
moderate magnitude 5.6 earthquake using the USGS gradable adjective scale in Table 4.1,

107
Figure 4.1: Map of 2011
Magnitude 5+ Australian
Plate Earthquakes (Fig 27,
Glanville, 2012)
The epicentre of this event, as described in the Chapter 1 introductory vignettes, was 15 km
from an historic city centre with few buildings built to modern engineering standards, there
were 13 fatality and 160 injury casualties.
Table 4.1: USGS Richter and
Magnitude Severity Descriptor
Scales (NSF 2014)
Sixty years of detailed earthquake event recording by Geoscience Australia has provided
Australia with a comprehensive modern earthquake magnitude record. This record includes a
manual database of significant pre-1955 events, and records from the post-1955 period based
on greatly improved instrumented monitoring networks. These records are used in magnitude,
probabilistic and intensity studies to identify seismic risk zones as seen in Figure 4.2 and in
Burbidge (2012). Recently the MMI map data as in Drummond (2016 in Figure 1.2, Chapter
1) and McCue (2011) have been incorporated into the 2018 Geoscience Australia National
Seismic Hazard Assessment model - the NSHA18 – which is found at www.ga.gov.au.
Earthquake
Magnitude
USGS Quake
Severity Scale
< 2.0 Micro
2.0 – 3.9 Minor
4.0 – 4.9 Light
5.0 – 5.9 Moderate
6.0 – 6.9 Strong
7.0 – 7.9 Major
> 8.0 Great

108
Figure 4.2: Map of all recorded Australian Earthquakes to 2011 (Wakelin-King 2011, p65)
The official record also includes major older events; however, it has a limited record of small
events compared to countries with greater seismicity in populated areas and greater seismic
awareness. This leaves the Australian public and policy makers potentially unaware of, and
unprepared for, major events with a longer recurrence interval. The online GA record is a
readily searchable database that easily enables detailed study of seismic trends. A review of
the record to 2011 (Wakelin-King & White 2011, p65) gives a picture of the seismic hotspots
in Australia in the Figure 4.2 map of all Australian earthquakes to 2011 with concentrations
in eastern NSW, the Victorian ranges, the Spencer Gulf and the West Australia Wheat belt.
Geoscience Australia describes the Australian continental structure in Blewett (2012). It is a
landform of continental passive margin, with an absence of major tectonic plate subduction
zones, displaying a vast relatively flat area of continental crust. Australia does not display
active margin plate boundary uplift, giving the relatively low Snowy Mountain and Victorian
Alpine ranges. These ranges result from accumulated mid-oceanic expansion in the Pacific
and Antarctic (see also Fig 4.3) Oceans over the past 100 million years.
Montane Region Hazard Risks
The Snowy Mountain Region environment like most alpine environments brings in the
commonly expected natural hazards of floods, storms, bushfires, and earthquakes.
Earthquakes in montane regions commonly initiate a series of secondary hazard events that

109
may be best illustrated by a set of scenarios in the three quite different environments as
discussed earlier in the Geographical framework section in Chapter 1:
Scenario 1 – Urban (lowland and coastal): a major urban earthquake will commonly
cause building and infrastructure damage, leading to casualties and massive economic
disruption. Secondary impacts include fires caused by fuel and electricity.
Scenario 2 – Remote Montane: a remote montane or alpine earthquake may generate rock
falls, landslides and avalanches. The low level of built environment in this scenario is likely
to see limited damage to property assets and only individual or small group casualties.
Scenario 3 – Developed Montane. A developed montane environment may be equally
remote as scenario 2 but show similar compound events as scenario 1. The mountainous
nature will likely lead to alpine power stations (hydroelectric and wind turbine), townships
and tourist resort facilities. In addition to the compound events in Scenario 2 there is a high
risk of rock falls and landslides impacting villages, power stations, dams and storage lakes.
The event impacts will include damage to road and communications infrastructure.
It is widely agreed that there is reasonably consistent compression stress across the entire
Australian plate (Hillis & Reynolds 2000, Reynolds et.al. 2002). This reflects the relative (to
the Pacific and Antarctic Plates) a MOR driven, northward push of the Australian Plate
towards the Indonesian (Sumatra and Java) and Pacific (Solomon, New Hebrides, Tongan,
Kermadec, and Southern NZ) subduction zones (sz) and the New Guinea and New Zealand
collision boundaries (cb) as shown in Figure 4.3 (after Reynolds et.al. 2002).
Figure 4.3: The compression
pattern of the Australian Plate
due to the Antarctic MOR and
surrounding plate boundaries
(Reynolds 2002)
S = Sumatra; J = Java; NG = New
Guinea; SM = Solomon Islands; NH =
New Hebrides; LHR = Lord Howe Rise;
TK = Kermadec Trench; SNZ =
Southern NZ; MOR = Mid Oceanic
Ridge; (sz) = subduction zone; (cb) =
collision boundary

110
For the purpose of this study, the SMR is the rectangular zone (130km x 230km) bounded by
(and excluding) Canberra and the Victorian state border and is shown approximately in
Figure 4.4. This region, although a mix of metamorphic / granitic, and volcanic / basaltic,
and sedimentary regions, appears more homogenous than the wider all-Australia tectonic
plate as it is found entirely within the Lachlan Orogen structures. The whole of continental
Australia is considered a much more varied geological structure with many different
components and several widely separated seismically active zones as seen in Figure 4.2.
The Australian Snowy Mountains Region (SMR) primary study area as shown in Figure 4.4
includes the towns of Tumut, Tumbarumba, Cooma, Bombala, Jindabyne, and Thredbo, but
excludes urban Canberra. These towns together with rural farms and villages have a
combined permanent population of just 35,000 residents. The adjacent urban centres of
Canberra, Albury, and Wagga Wagga have a population exceeding 600,000. The SMR also
includes several montane National Parks including the Kosciuszko, Namadgi, Brindabella
and Burrowa-Pine Mountain National Parks that bring a strong visitor economy to the region.
The commencement of the Snowy Mountains Hydro-electric Scheme (SMS) in 1949 also saw
the commencement of an intensive program of geological studies. The studies resulting from
a research contract between the SMS and Australian National University in Canberra
included a seismic monitoring programme that began in 1952 (Moye 1956, Cleary et. al.
1962, 1977). These studies generated the necessary geological and geotechnical information
in advance of the construction of the widespread complex of 16 major dams and 225 km of
tunnels - as listed in Table 4.5. This intense geological study of this region leads to the
reasonableness of the assumption that the seismic records for this region are materially
complete. Further the quality of the data record from soon after 1955 is likely to be as good
as anywhere else in Australia for the modern (post-1980) period, and comparable to the
longer history of reliable data from active plate boundary zones elsewhere.
The SMR towns provide the core workforce and population servicing the electricity, farming,
forestry and visitor economy sectors. The permanent residents include many professionals
who generally have a very high awareness of the regional infrastructure, communications and
road networks, in part because the tourism off-season is a period of intense maintenance and
development activity throughout the national parks and resorts. Alongside the 1.3 million
visitors to the region in a typical year (DNSW 2013a, 2013b) this puts the knowledge of
immediate response to a surprise natural hazard event in the hands of very few, just one local
person in thirty-five of the annual visitor numbers.

111
Of particular note in hazard risk assessment and response planning programs, is that seismic
events unlike meteorological events, come without warning, reaching an immediate peak,
with no or little opportunity to plan responses. Compared to storms and floods where
typically 48-hour forecasts will give a reasonable warning of heightened risk, or bushfires
where often an approaching event may even have a week’s warning, the earthquake brings a
range of very serious dynamic matters to disaster management services.
This study sought to confirm or otherwise the various assessments of RIS likelihood and to a
lesser extent, consequences, in the extended SMR and its reported four occurrences. The
assessment method requires collection of SMR seismic event records from the online GA
database and then used transformation modelling to model the temporal and spatial data in a
form that highlights RIS events. The study also sought to identify criteria for determining the
likelihood and consequences associated with possible future events.
Figure 4.4: Locations of
the four large Australian
water dams and
reservoirs variously
associated with Reservoir
Induced Seismicity
(RIS): the 1958
Eucumbene, 1970
Talbingo, 1959
Warragamba, and 1983
Thomson dams
The study results were reported in a conference paper (Hart 2014) which forms much of this
chapter. This work and the paper were completed early in the research programme and
therefore some further analysis was required to integrate the results within the full research
program of transformation modelling of natural hazards.
The transformation models applied in this chapter are: (i) table models to form the global
standard ISO 31000 likelihood vs consequences matrix, and tabulated temporal / magnitude

112
frequency summaries of seismic events; (ii) narrative descriptions of risk criteria, (iii)
formula models to model the frequency magnitude Gutenberg-Richter relationships; and (iv)
image models which use Venn Maps and Temporal Event Graphs to model the spatial and
temporal behaviour of seismic swarms in the vicinity of large dams and reservoirs.
For completeness the Venn Maps for all four suspected RIS dams and reservoirs in the
extended study area (Gibson 2008, 2013) being Eucumbene (NSW), Talbingo (NSW),
Warragamba (NSW) and Thomson (VIC) dams are included in the thesis. These Venn Maps
show that there is a concentration of earthquakes near these lakes and reservoirs, leading to a
detailed study of the swarms and other related seismic events.
PART 1: Gutenberg-Richter Law application to the SMR
4.2 Gutenberg-Richter Law Trends in Australia and the SMR
The long records of the earthquake activity in active tectonic boundaries, for example
California, enabled an analysis of an extremely large database of collected earthquake data
much earlier than in Australia. This Californian database was first used in 1935 when Richter
(1935) published his detailed analysis of some 4,000 Southern California earthquakes. In this,
and in subsequent work, Gutenberg and Richter (1949) developed a model for the frequency
of earthquake magnitude based events within certain ranges according to the Gutenberg-
Richter Law (Equation 4.1):
log N = a - b * M (4.1)
In this model, N and M are the cumulative number and magnitude of earthquake events while
‘a’ is a strongly regional parameter commonly between 2 and 6, and ‘b’ is also a situational
parameter broadly around a value of 1.
The global validity of this equation has been reinforced since its establishment with many
subsequent studies populated with more modern data, including complete data of low
magnitude events. It is this strong relationship that enables extrapolation and forecasting of
recurrence intervals for rare and yet larger earthquakes on the basis of a robust data set of
medium level earthquakes. When compared to more recent analyses such as by Bayrak
(2002) in California, end of trend-line inconsistencies (< M3 and, > M8) still appear as seen
in Figure 4.5, being at low and high magnitude values.

113
Figure 4.5: Bayrak (2002) G-R plot for San
Andreas Fault in California USA. (surface
wave magnitude scale, Ms)
Bayrak also presents data from 27 global earthquake zones sourced from multiple sources to
give a total database of 201,000 earthquakes in the hundred years between 1900 and 2000.
Just seven of these seismic events in the Bayrak study arose from the Australian intra-plate
region.
The various regional graphs in Australia show trends that are similar to the data and the
Gutenberg-Richter plot for the San Andreas Fault as shown in Figure 4.5. All plots show the
same “fall off” behaviour for Minor and Micro events less than magnitude M4.0 or M2.0
which is suspected to be caused by under-reporting of small events.
Australian Earthquake Data
The relatively rare major quakes in Australia, but high frequency of minor quakes still
enables the Geoscience Australia (GA) earthquake data base (www.ga.gov.au/earthquakes) to
be tested against this law. The GA database of quakes greater than magnitude 2 as collected
over the past 100 years is summarised in Table 4.2, but the improved collection of micro and
minor quake data from 1980 is also deducible.
The general improvement in seismic data quality and quantity was recognised at a global
level by Gutenberg and Richter. The Australian data also shows non-linearity for earthquake
data of magnitude less than M2.0 with strong linearity beyond magnitude, M3.0.

114
Period / Era Earthquakes M > 2
Table 4.2:
Geoscience Australia (GA)
seismic event database
1900-2013 for M > 2
1900 - 1954 74
1955 - 1969 1,255
1970 - 1979 2,648
1980 - 1989 3,751
1990 – 1999 3,095
2000 - 2013 3,649
Total Events 14,472
The data from all Australian 14,398 recorded earthquakes since 1955 is presented on a
Gutenberg-Richter plot for the Australian continent and shown in Figure 4.6. The plots are
consistent with similar plots elsewhere the curve moves left of the straight line relationship
for M < 2.0 probably reflecting a weaker data set for small events. However, the all-
Australia plot also shows considerable non-linearity across the whole range of recorded
quakes. When compared to plots (Bayrak 2002) for other regions of the world it appears that
the all-Australian data since 1955 does not have a consistent fit with the general G-R model.
Figure 4.6: The all-Australian data for Gutenberg-
Richter Law: log (N) = 6.6 - 0.91*M (generated by
Author)
The apparent continuous concave curve leads to an implication that the logarithmic
relationship is not a straight line over the magnitude range and area of interest.
This non-linearity raises a question that is beyond the scope of this study: is this a function of
the all-Australian data set or the general nature of intra-plate earthquake trends?

115
When the all-Australian data from a more modern data set is plotted, being the 3649 events
for M>2 in the period 2000 to mid-2013, is plotted, a slightly better fit with the G-R Law is
found as in Figure 4.7. This data set is considered of sufficient size to be a representative
regional subset of global data that should follow the G-R Law. The curve has a mixed
concave-convex shape that is not understood and maybe a part of the question raised above.
Figure 4.7: The modern all-Australian data for
Gutenberg-Richter Law: log (N) = 6.0 – 1.01*M
(generated by author of this thesis)
Snowy Mountains Region Trends
Of relevance to this study is whether the all-Australian event non-linearity applies to a
smaller regional sub-set such as the Snowy Mountains Region (SMR). It appears likely that
the Australia wide geological and tectonic variation is the likely explanation for the poor fit
with the G-R Law, compared to most studies at active margins but what about the fit across
relatively consistent seismic zones.
Between 1955 and mid-2013, there have been 316 earthquake events in the SMR greater than
magnitude 2.0 with one at M5.3 being the largest. This presents a relatively small sample
size compared to all of Australia, and other time periods. A Gutenberg-Richter plot of these
quakes is shown in Figure 4.8. The most remarkable feature of this plot is the very high level
of fit with the G-R Law.
Notably, this good-fit data set also includes the lesser quality 1955-2000 period not included
in the all-Australia data above. Cutting the data set with different date limits and in different
regions does not change the observations in Figure 4.8.

116
Figure 4.8: The Snowy Mountains Gutenberg-
Richter Relationship: log(N) = 4.2 - 0.84*M
(generated by author)
As noted earlier, the commencement of the Snowy Mountains Scheme in 1949 saw the
commencement of an intensive program of geological and seismic studies from 1952 (Moye
1956, Cleary 1962) and generated important geological and geotechnical information in
advance of the construction of the widespread complex of dams and tunnels. It is assumed
has been noted by these authors that the project funded records for this region are reasonably
complete, even though subject to the vagaries of older instrumentation. The quality of the
SMR data record from 1955 is therefore considered to be as good as elsewhere in Australia
for the modern (post-1980) period and comparable to the long history of reliable data from
the active plate boundary zones in California. This smaller data set of just 316 earthquake
records for the SMR gives an excellent fit with the G-R Law, giving a high level of
confidence that the G-R Law may be of significant benefit as an earthquake occurrence
forecasting tool for this montane region of Australia.
PART 2: Reservoir Induced Seismicity (RIS)
4.3 Reservoir Induced Seismicity in Australia
By conducting a study into the frequency and magnitude of earthquakes in the Snowy
Mountains Region based on raw Geoscience Australia data from the period 1955-2013, a
specific determination of the G-R Law of seismic frequency – magnitude behaviours is found
for comparison with suspected RIS affected data. Some SMR community groups have raised
informally with the author, that the natural seismicity of this region has been worsened by the

117
heavily engineered Snowy Mountains Scheme and the effects of Reservoir Induced
Seismicity (RIS), causing significant increase in the underlying natural seismic behaviours.
This part of the study will seek to understand the basis for these views and establish whether
Reservoirs lead to a change in natural hazard risk from RIS, and whether any change can be
quantified.
A literature study finds that of 52 major dams in the wider Snowy Mountains Region (being
essentially the wider region including the Victorian Alps and the Blue Mountains shown in
Figure 4.4), four have had previously reported significant RIS event sequences. Not all
researchers have supported this view with Muirhead in Denham (1976 p83) stating there was
only one clear case. This new study investigates whether:
All four of those events are evidenced genuine RIS events,
Whether a revised approach to seismic data modelling might give a clearer basis for
evaluating RIS suspicions, and
Is it practical to transform the data and representation models to a form that separates the
natural and RIS activity – if any?
The Gutenberg-Richter Law (G-R Law) data for SMR has been fine-tuned to address
multiple second tier effects. The various published improvements and developments
(Johnston 1990, Hunter & Mann 1992, Palacios, et.al. 2006) to the G-R Law to address the
multiple secondary influences on the underlying relationship are not material for most
studies. They suggest the G-R Law is effective in its simple form for hazard forecasting in the
presence of anthropological anomalies, such as underground mining, oil and gas operations,
or reservoir induced seismicity with a strong, but do not give complete certainty.
Occurrence Theory for Seismicity
The frequency and magnitude profile of intra-plate earthquakes in Australia is clearly
significantly less than the inter-plate earthquakes that occur along major tectonic plate edges.
Earthquake magnitude measurement methods and records have evolved over recent decades
to include a number of different scales (Kanamori 1983, McCalpin 2009, and Choy &
Boatright 2012) each based on different measurement principles and providing a slightly
different meaning and results. Generally, however the scales are generally comparable in the

118
M3.0 to M7.0 range and so while acknowledging the scale differences, the reported
magnitudes are used generically in this analysis, as they are in many other studies.
The SMR seismic data may have been distorted by one of the major anthropological
anomalies in seismic modelling – that of reservoir induced seismicity (RIS). The local region
has been subject to the construction of some 20 large reservoirs of the Snowy Mountain
Region with a number of certain, and suspect, events to evaluate.
We recall the Australian tectonic plate as a whole does not demonstrate consistent G-R Law
behaviour but some segments of the all-Australian database as smaller geologically distinct,
regional sub-sets do. The Snowy Mountains Region (SMR) appears to meet the criteria for
consistent G-R Law behaviour, enabling a strong transformation model for natural hazard
likelihood or occurrence under an ISO 31000 model to be determined.
4.4 Four Suspect RIS Events
The four suspected locations for RIS in the extended Snowy Mountains area are shown in the
following Venn Maps produced by the GA online search tool in Figures 4.9 – 4.12 (overlaid
with GA mapped faults), and include a record of M > 2.0 seismic events in the 1955-2013
timeline. It is clearly seen that there appears to be a concentration of seismic events in the
vicinity of the four dams and reservoirs that leads to suspected RIS.
In addition to the multiple of small events there was a significant M5.7 event at the junction
of the Jindabyne and Berridale Faults shown in figure 4.9. These maps show spatial layout of
seismic swarms with the larger (cf. light and moderate) seismic events being red ringed dots.
The four large dams out of a total of 52 large and moderate dams in the extended study area,
(the Eucumbene, Talbingo, Thomson and Warragamba Dams) that have been reported as
causing RIS, all have comprehensive seismic records. They are studied in terms of their
seismic record (location and magnitude) and temporal activity. The significance of this study
lies in the development of water storage in Australia and the wider public concern for the
impact of such large geo-structures on public safety (Gibson and Sandiford, 2013). These
concerns extend to large scale tailings dams which can be many times larger than water
reservoirs and contain mining waste that is very vulnerable to liquefaction especially with
upstream dam types (Martin & McRoberts, 1999). This risk is evident at the Cadia-
Ridgeway mine near the Orange seismically active area, just north of the SMR in NSW.

119
Figure 4.9: Venn Map: Lake Eucumbene – Berridale Wrench Fault - 113 earthquakes
(M > 2.0) 1955-2013; Dam is 5km north of the junction of two main faults.
Figure 4.10: Venn Map: Lake Talbingo – Gilmore Fault - 36 earthquakes (M > 2.0): 1955-
2013; the dam is at the northern end of Lake Talbingo and discharges into Blowering Lake

120
Figure 4.11: Venn Map:
Lake Burragorang –
Macquarie Fault - 235
earthquakes (M > 2.0):
1955-2013; the
Warragamba Dam is at
the north-eastern end of
the lake (near Silverdale)
Figure 4.12: Venn Map:
Lake Thomson –
Yallourn Fault – 53
earthquakes (M > 2.0):
1955-2013; the dam is at
the southern end of Lake
Thomson

121
In the primary study area, notable swarms of earthquakes occurred around the Eucumbene-
Berridale area and around the Talbingo area in the years immediately after the completion
and filling of the Eucumbene and Talbingo reservoirs (Muirhead et.al. 1973, Gupta &
Rastogi, 1976, and Muirhead, 1981). The swarms however only occur for these two
reservoirs out of the more than 20 major reservoirs in the primary study area that were
constructed in the study period between 1955 and 2013. This leads to a consideration of
whether these two dams in the reservoir construction program over a 60 year period
(including the new downstream Cotter Dam (II) in 2014) were the primary cause of suspected
reservoir induced seismicity (RIS) and why other dams did not show the same behaviours.
In the wider study area, a similar pattern to the Talbingo seismicity has been previously and
separately identified at the Thomson Dam (Allen et.al. 2000), a large urban supply reservoir
near Melbourne, Victoria. The issue of RIS at Warragamba has been raised by Fell et.al.
(2005), and Gibson & Sandiford, (2013). Amongst these publications both the terms swarm
and event are used in descriptions of RIS, but the analysis appears to lack consistent study
parameters across the four situations. Swarms consist of multiple localised earthquakes and
have been often attributed to RIS, with strong supporting evidence as in the Thomson and
Talbingo Dams. Likewise moderate, strong or major single events near dams and not
necessarily in a similar time frame as the dam construction and first filling as for Eucumbene
and other global projects have been also attributed to RIS (Talwani 1997).
The three generally reported (Gupta & Rastogi, 1976, Talwani 1997) causes for RIS are:
The local tectonic setting where a tension (normal or slip-strike faults) environment
may cause vulnerability,
Mechanical stress on a potential slip zone caused by the mass of the dam and
impounded water, and
A continuous “column” of water leading to a continuous increase in deep pore
pressure at a potential slip zone.
The first cause may contrast with the general compression environment of the Australian
continent (refer to Figure 4.3 earlier) and so may warrant detailed tectonic studies. The
“column” of water refers to interstitial gaps in bedrock that permits slow water flow with
minimal pressure loss. The latter two (of the three) causes have a strong temporal and spatial
aspects and so these aspects must be considered in analysing a potential RIS event.

122
The (1958) Eucumbene Dam and Reservoir
Personal communication with a number of local residents suggests that Eucumbene Dam (a
hydroelectric storage reservoir) caused the Berridale earthquakes in the 1959-1963 period.
Does the evidence support this local view? Table 4.3 lists the longer term occurrence of
seismic events within 20 kilometers of Lake Eucumbene, the largest lake in the Snowy
Mountains Scheme. This lake was formed by the construction of a 116 m high dam in the
southwestern corner of the new 4,800 GL lake. It was completed in 1958 and took some 2
years to reach approximately 80% full, being its subsequent typical maximum operating
range.
Table 4.3: Lake Eucumbene – Berridale Wrench Fault: the occurrence and
magnitudes record of historic earthquakes
The southern side of Lake Eucumbene is near the junction of the North-South (N-S)
Jindabyne Thrust Fault with the main NW-SE Berridale Wrench Fault as shown in Figure
4.9, and is some 5 km south of the Eucumbene Dam itself (McCue 2011 figure 5). Table 4.3
shows the seismic record of all seismic events and those greater than magnitude 2.0 within 20
km of Lake Eucumbene although most are within 15-20 km and well to the south. The all-
magnitude record shows 226 events in the same area and pattern but the M<2.0 records are
excluded from Figure 4.9 for consistency.
A search of the Geoscience Australia online seismic database for Eucumbene related
seismicity has produced the Venn Map, and Temporal Event Graph in Figures 4.9 and 4.13
and the tabulated data in Table 4.3.
Decade All Events >M2 Events Magnitude All Events
1951-60 8 3 M<1.0 3
1961-70 25 7 M1.0-1.9 109
1971-80 43 30 M2.0-2.9 101
1981-90 49 27 M3.0-3.9 11
1991-00 18 15 M4.0-4.9 1
2001-10 52 21 M5.0-5.9 1
2011-13 31 10 M>6.0 0
Total 226 113 Total 226

123
Further, the pre-1958 record of events is very thin and the <M1.0 record almost non-existent,
with just 3 events, indicating weak measurement and recording data in this then remote and
sparsely populated montane region. Breaking up the M>2.0 record into decade temporal
blocks, and allowing for improved modern recording trends, shows the same spatial pattern
of events. The M>2.0 gives a mean 2.5 events per year in each decade and a standard error of
1.0 events with no trend in frequency other than an increased clusters in seismic activity in
the 1974-78 years.
Figure 4.13: Temporal Event Graph seismic swarm pattern, Eucumbene
Dam after 1958 (Year of dam completion) (generated by Author)
The (1970) Talbingo Dam and Reservoir
The Talbingo Dam is a hydroelectric storage reservoir with a height of 162 m was completed
in 1970 and at 921 GL storage is the third largest in the Snowy Mountain Scheme. The lake
fills a long, narrow and deep gorge on the Tumut River, created between the adjacent
Gilmore Fault complex and the Tumut Block (Figure 4.10). The lake was essentially full by
mid-1971 just 4 months after commencement of filling (Gupta & Rastogi, 1976).
A search of the Geoscience Australia online seismic database for Talbingo related seismicity
has produced the tabulated data in Table 4.4, and the Venn Map and Temporal Event Graph
in Figures 4.10 and 4.14.
During the period of filling some 36 events were recorded within 10-15 km of the dam and
lake with 10 events up to M3.5 between 1971 and 1980. The GA database records no events

124
prior to 1971, just 5 small events in 1981-90, and no further events until the M2.3 event in
2008. There were 53 events M<2.0 in the same area with again no events recorded prior to
1971, 38 events M<2.0 between 1971 and 1980 and 10 events between 1981 and 1990.
There were no M<2.0 events in 1991-2000, and 5 small events between 2008 and 2013.
Table 4.4: Talbingo occurrence and magnitude record of historic earthquakes
The spatial pattern of the M<2.0 events was almost identical to the M>2.0 events. Repeating
the seismic record analysis as for that performed for the Lake Eucumbene – Berridale area
and being mindful of the findings of the Thomson Reservoir produces an entirely different
outcome to that for Lake Eucumbene. The analysis presents the following potential findings:
The Talbingo lake area is generally an area of low natural seismicity.
The construction of the Talbingo Dam and filling of the lake generated a significant
increase in localised, low magnitude seismicity for a period of approximately 3 years.
The absence of any pre-1971 events being recorded is likely attributable to inadequate
seismic sensing resources, as is also shown in the 1971-2013 record that shows just 3 of
the 89 events are below M1.0. It is likely that events M<1.0, are at a very low
probability of being detected by seismographs used in this region during this period.
The increase in seismicity in the 1971-80 decade corresponds to the seismic activity
surge at Eucumbene in the same period. It is possible this surge is due to a general
increase in SMR seismicity, but large area seismology and forecasting relies heavily on
long term historical data as a predictor so conclusion exceptions are best drawn from
trend anomalies.
Decade All Events >M2 Events Magnitude All Events
1951-60 0 0 M<1.0 3
1961-70 0 0 M1.0-1.9 50
1971-80 69 29 M2.0-2.9 29
1981-90 15 5 M3.0-3.9 7
1991-00 0 0 M> 4.0 0
2001-10 3 1
2011-13 2 0
Total 89 35 Total 89

125
The almost complete absence of regional seismicity from 1987-2007 suggests that RIS
brought forward natural seismic energy releases that might have otherwise occurred in
this period or even later in the absence of a dam and reservoir project.
The 2000-13 record of 5 minor quakes suggests a background average of 5 events per
decade and indicates a potential for natural frequency of 15 events over the 36 years
from 1971 to 2008 compared to the 89 events recorded.
Figure 4.14: Temporal Event Graph seismic swarm pattern, Talbingo
Dam after 1971 (Year of dam completion) (generated by Author)
These observations initially indicate that the background seismicity has in total generated or
bought forward a short term increase to a seismic swarm of events some 10 times greater
natural background seismic occurrence and some 10 -100 times lower in magnitude as a
result of RIS, and that beyond 30 years the natural background seismicity has resumed. The
timelines for this indication are quite short and this indication cannot be stated conclusively,
but nevertheless the suggestion is made on the basis that long term recording and analysis
might address this inferred hypothesis.
By measuring all significant events and determining whether the total energy release of the
dam construction and filling period and decades immediately beyond correlates with long
term energy release determined by back extrapolation of future steady state records.

126
For the purposes of this analysis for establishing a natural underlying frequency – magnitude
model for the SMR it is appropriate to remove the Talbingo area seismic record from the
SMR database used in this project and test its effect by recalculating the G-R Law equation
given in Figure 4.6. Such a data cleansing and recalculation gives an alternative equation as
shown in Figure 4.16.
There appears to be a clear association between the Talbingo seismic swarms and the three
generally accepted contributing causes. There is strong evidence of RIS that began shortly
after dam completion and the commencement of the first fill. The form of the RIS seismicity
was a large number of small (M<2.0) tremors in a focal (hypocentre) pattern that was directly
under the reservoir footprint and progressively became deeper over a few years.
The (1960) Warragamba Dam and Lake Burragorang Reservoir
The Warragamba Dam is primarily an urban water supply reservoir and outside of the
primary study area but within the extended Snowy Mountains Region. The Warragamba
Venn Map (Figure 4.11) shows a completely different spatial pattern of seismic events arising
from the 1973 Picton, NSW earthquake, compared to other suspected RIS sites. Almost all of
the 235 earthquakes occurred near or beyond the south-eastern river entry to the lake, some
40 km from the dam. Further as shown below, the main swarm occurred within a very short
time span, but some 13 years after completion of the dam. This strongly implies that the
entire seismic pattern is directly associated with the underlying Lapstone Complex and
Macquarie Fault and appears unrelated to the dam and its reservoir, Lake Burragorang
(Denham 1976, O’Neil 2011).
The 1959 Warragamba Dam was named by some researchers as a cause of RIS in the large
swarm of events in 1973 (Fell et. al., 2005, and Gibson & Sandiford, 2013). The
Warragamba Dam, a large water supply reservoir south west of Sydney, NSW is in the
middle of a moderately active seismic belt along the NSW continental escarpment that has
seen approximately 25 earthquakes greater than M4.0 since 1955, but again the temporal and
spatial differences between the dam completion, the reservoir filling and the reported seismic
swarm put doubt on the RIS conclusion.
There was only minor activity following dam completion in 1960, consistent with the
regional seismicity. The seismic swarm some 13 years after completion of the dam was
concentrated past the shallow end of the long narrow southern arm of the lake. This swarm

127
followed a M5.0 event (and are considered mostly aftershocks) appears more consistent with
events that occur periodically along the 1200 km NSW escarpment belt.
Figure 4.15: Temporal Event Graph seismic swarm pattern, Warragamba
Dam after 1960 (Year of dam completion) (generated by Author)
The (1983) Thomson Dam and Reservoir
The Thomson Dam is primarily an urban water supply reservoir and a large rock and earth fill
embankment dam built as an urban supply reservoir approximately 130 km from Melbourne,
Victoria. The dam is outside of the primary study area but within the extended Snowy
Mountains Region. It is helpful to consider the approach taken in the comprehensive study of
the Thomson Water Supply Dam and Reservoir (Allen et.al. 2000, p1). This study examined
the patterns of RIS around the Thomson Reservoir (approximately 250 km southwest of the
SMR) following its completion in 1983 with Allen reporting as follows:
About three years following the commencement of filling in 1983, shallow earthquakes
began occurring immediately under the reservoir, with magnitudes up to ML 3.0, at rates
of up to five events per week. These events were almost certainly reservoir-induced and
coincided with steadily increasing water levels.
The reservoir reached, and was consistently near capacity during the period from 1990
to 1996. During this time, the majority of seismic activity near the Thomson Reservoir

128
had migrated to greater depths and away from the reservoir, with decreasing activity
levels.
On the 25th September 1996, a magnitude ML 5.0 earthquake occurred at a depth of 12
km adjacent to the reservoir. This was followed by a period of intense seismicity with
approximately 200 aftershocks recorded over more than a year.
Recent records indicate that the area seems to be approaching the end of the period
when triggered earthquakes are likely with activity levels now similar to those existing
prior to commencement of filling.
This part of the study leads to the following commentary for the Thomson Dam:
The construction period of the Thomson Dam itself did not appear to trigger or induce
any recorded seismic events,
Events were recorded only when filling had reached a significant level. The “V” shape of
valley dams such as the Thomson Dam means that for a steady fill rate, the depth (and
water pressure) increases are initially rapid, but as the reservoir fills and creates a larger
lake surface area, the rate of depth and water pressure increase slows.
Is the progression of events to greater depth in a RIS process part of a progressive stress
release process or a water pressure (interstitial) penetration process, or both?
Can the 1996 M5.0 event and its approximately 200 aftershocks be attributed mostly to
RIS or were they part of the general background seismicity in the wider region?
The 1996 events were close to the dam but so were a number of other events more
directly associated with the Yallourn Fault, 20km to the south-east of the dam. Meaning
the Thomson Dam may not have caused any major seismic events at this later time 10
years after dam completion but instead largely caused a large swarm of quite minor
events upon dam completion and the extended period of filling.
These Thomson Dam factors were considered fully in the Allen study and will not be
analysed further, but they lead to some useful questions being as follows:
If dam building and reservoir filling creates (RIS), is this RIS additional to the
underlying total seismic energy behaviour of the region?
Alternatively, is RIS primarily a temporal and / or magnitude shift in the underlying
seismicity to a swarm of smaller progressive events?

129
Or thirdly is the RIS a mix of these seismic factors?
How long do records need to be modelled both before and after the suspected RIS events
to answer these questions?
What is the region of influence of RIS from the dam or reservoir boundary (for example:
1, 5, or 10 km)? This study has used 10 km.
If one or other of these effects apply what is the magnitude of the temporal (for example:
1, 5, 10 years forward) or magnitude (increase/decrease of M+0.5 or say M+2.0) shift?
Figure 4.16: Temporal Event Graph seismic swarm pattern, Thomson Dam
after 1983 (Year of completion) (generated by Author)
4.5 SMR Results and Analysis
Between 1955 and mid-2013, there have been 316 earthquake events in the SMR study area
greater than M2.0 with the Eucumbene-Berridale event at M5.3 the largest. This is a
relatively small sample size compared to all of Australia, and other periods. A Gutenberg-
Richter plot of these quakes is shown in Figure 4.17. The most remarkable feature of this
plot is the very high level of fit with the G-R Law for events in the study area.
The smaller data set of just 316 (1955-2013) earthquake records for this region is plotted
according to the Gutenberg-Richter parameters as seen in Figure 4.17.

130
Figure 4.17: The all-data SMR
Gutenberg-Richter Equation:
log (N) = 4.2 – 0.84*M.
(generated by Author from
SMR seismic data)
The almost perfect consistency of this data across the sample magnitude range from M2.0 to
M6.0 supports the assumption above that the SMR database post-1955 is indeed consistent
and complete. This gives a high level of confidence that the G-R Law may be of significant
benefit as an earthquake probability forecasting tool (not an earthquake prediction tool) for
this montane region of Australia. Figure 4.17 suggests this approach is able to accurately
forecast the mid-term (50 years) probability of future SMR seismic events above defined
magnitudes, within the region and a locational emphasis on recurrence intervals.
The strong fit of regional data to the model needs to also consider the effect of potential
known anomaly effects, such as tunnel and underground mine blasting and reservoir
construction. There is little evidenced impact of tunneling effects on seismicity records,
probably due to the widespread use of micro-delay blasting techniques. The SMS
construction used micro-delay blasting which only causes local vibration over a few seconds
rather than single blast seismic like waves (Kenneth Sharp, pers. comm. 2013). Therefore
there is no noticeable effect on the general purpose seismometers. Micro-delay blasting is
designed to minimize the total wave amplitudes (p954 Carvalho, 2007) and generally means
underground development and any associated micro-seismic events will not lead to mass rock
failure (Hudyma, 2008).
The case for reservoir induced seismicity is much stronger. The data suggests swarms of
earthquakes around the Berridale and Talbingo areas generally corresponding to the dates for
the completion and filling of the Eucumbene and Talbingo reservoirs. This introduces the

131
question as to whether the Berridale and Talbingo swarms have materially biased the
aggregate SMR data and whether in the absence of this attributed data there would remain a
good fit with the G-R Law. Whilst technical reports to the NSW Government (Gibson &
Sandiford 2013) have raised the possibility of hazards resulting from RIS, it could also be
postulated that there are incidental beneficial effects. It appears from the transformation
model figures (combination of tables, Venn maps and temporal graphs), that RIS brings
forward in a time-shift, potentially larger (G-R Law consistent) events into a swarm of
smaller events that have a much reduced impact on human and property assets than the
alternative large events. This is an assumption in the absence of long term pre-dam and post-
dam monitoring, however if one recalls that the general seismicity is the periodic release of
progressively accumulated tectonic energy, rather than new RIS stress, then the assumption is
likely valid. More importantly the events mostly occur in a time frame when a high level of
hazard awareness and safe responses can be communicated to local populations, along with
short term event mitigation steps to be taken by regional natural hazard response managers.
Following is an examination of the highly developed montane environment found in the
Snowy Mountains, the area generally considered to be a wilderness area, but is given due
consideration of known anthropological risk factors together with a study of some notable
seismic events, and related aftershock activity.
SMR and Reservoir Induced Seismicity
There are 16 dams in the Snowy Mountains Scheme and three large water reservoirs
servicing the ACT region with one expanded to give 20 dams built as shown in Table 4.5.
There are a further 32 large dams and reservoirs within 300km of the study area boundary but
still within the Victorian and NSW montane belt from Melbourne, Victoria to Sydney, NSW
as shown in Table 4.7.
A temporal and spatial search of the online GA seismic database for all of the 20 dams in the
SMR study area has shown localised seismicity swarms near the two dams (Eucumbene and
Talbingo) mentioned above. Swarms also occurred at two of the 32 large dams in the wider
region to give 4 out of 52 large dams with possible evidence of RIS swarms. The two wider
region dams considered in more depth are the Warragamba Dam, which is some 300km to the
north east, and the Thomson Dam, which is some 250 km to the south-west.

132
Table 4.5: Schedule of the sixteen large dams in the Snowy Mountains Scheme and four
water supply dams in the SMR study area (Note: size dimensions vary slightly with source)
The dams and reservoirs not exhibiting indications of seismic anomalies have also been
searched over a 20km range from the lake for the 15 years post-construction for any evidence
of temporally and spatially consistent post-construction or filling swarms of seismic events.
A total of 48 of the dams, including 18 in the main study area show no seismicity links with
long term trends. Those trends occasionally showed some periods of accelerated activity and
periods of relatively quiet activity but were not temporally related to any dam construction.
It strongly appears the Talbingo and Thomson Dams are demonstrated as strongly associated
with RIS while the Warragamba Dam and the Eucumbene Dam are most probably not. The
lead Eucumbene M5.3 event and its extended period of just a few immediate aftershocks is
considered a coincidence of the colocation of the dam with the nearby fault junctions
associated with the Berridale Wrench Fault. The cluster location is too distant from the dam
No. Dam Year Storage Height
Snowy Mountains Scheme
1 Guthega 1955 1.6 GL 34 m
2 Eucumbene 1958 4,798 GL 116 m
3 Tumut Pond 1959 53 GL 86 m
4 Happy Jacks 1959 271 ML 29 m
5 Tantangara 1960 254 GL 45 m
6 Tooma 1961 28 GL 67 m
7 Deep Creek 1961 11 ML 21 m
8 Tumut 2 1961 2.7 GL 46 m
9 Island Bend 1965 3.1 GL 49 m
10 Khancoban 1966 27 GL 18 m
11 Geehi 1966 21 GL 91 m
12 Jindabyne 1967 688 GL 72 m
13 Jounama 1968 44 GL 44 m
14 Blowering 1968 1,628 GL 112 m
15 Murray 2 1968 2.3 GL 43 m
16 Talbingo 1970 921 GL 162 m
ACT Water Supply Reservoirs
17 Bendora 1961 12 GL 47 m
18 Corin 1968 76 GL 74 m
19
20
Cotter I (orig. & raised)
Cotter II (submerged #19)
1912, 1951
2013
4 GL
78 GL
31 m
87 m

133
and the spread out nature of the seismicity over some 50 km range and 20 years supports this
view. The observed Berridale-Eucumbene activity was typical of a low level of aftershocks
following a significant event.
It also contrasts with the Talbingo analysis that follows, which itself is more closely aligned
to the event profile of the Thomson Reservoir RIS record. Specifically the location and depth
of the hypocenters of the earthquake events progressed downwards and reduced as time
progressed. The natural seismicity in the primary study area as shown in Figure 4.18 includes
the Eucumbene event data and excludes the Talbingo data.
Therefore to achieve a reliable database of natural seismicity for applying to the G-R Law, it
is intended to leave the Lake Eucumbene – Berridale seismic record in the SMR database.
The two G-R Law equations for the study area including and excluding the Talbingo
suspected RIS data are shown in Table 4.6. Within the normal variability of G-R Law and the
relatively small data set it is unclear whether these differences are material, especially when
compared to the All-Australia data and equations shown in Table 4.6 below.
Figure 4.18: The SMR
Gutenberg-Richter Equation:
log (N) = 4.1 – 0.82*M
(generated by Author
excluding Talbingo Data)
Examining the two equations shows the expected effect of removing the low magnitude data
by reducing the slope and vertical intersect but even so, the two equations are remarkably
close and within the normal uncertainty of a G-R Law relation. In other words omitting the
Talbingo data has at most, only made a slight difference to the G-R equation parameters.
More importantly, the long term difference to forecasting earthquakes in a reservoir intensive
area appears to replace a single moderate event with a swarm of small events.

134
The interim conclusion is that in spite of the strong evidence attributing the swarm of seismic
events within 10km of Talbingo Dam and over the years 1972-1992 being the 20 years
following the dams construction to RIS, removal of these 32 seismic events being about 10%
of the full dataset from the SMR G-R Law dataset with M>2.0 only slightly changes the G-R
Law parameters or analysis for the SMR.
Table 4.6: The Snowy Mountains G-R Law Equations 1955-2013
Equation 2:
All (primary)
SMR Data:
316 seismic events, ≥ M 2.0
log (N) = 4.2 – 0.84*M (4.2)
Variance R2 > 0.9997
Equation 3:
SMR excluding
Talbingo Data
284 seismic events, ≥ M2.0
log (N) = 4.1 – 0.82*M (4.3)
Variance R2 > 0.9997
This suggests that the RIS attributed to the Talbingo dam construction and filling is generally
a minor effect on the long term seismicity of the region, and in particular that associated with
the complex Gilmore Fault Zone that defines the western side of the Tumut River Valley.
Finally, the variance data for this analysis shows R2 > 0.9997 for each SMR dataset (with and
without Talbingo data) and their G-R Law equations, means an almost perfect fit supporting
the conclusion of the relevance of the G-R Law to these regional data subsets.
4.6 The Non-RIS Dams in the combined SMR study areas
Primary SMR Study Area:
The examination of the 316 seismic events with M>2.0 in the defined SMR has shown only
one dam in the primary SMR and one in the extended study area have indicated increased
local seismic activity that is likely temporally and spatially related to a dam construction and
reservoir fill cycle. These two dams are only a small fraction (4%) of the total of 52 dams in
the extended study region
This analysis confirmed the validity of selecting the Eucumbene and Talbingo reservoirs for
detailed examination as above. The result of this analysis supports removing the Talbingo

135
data, and leaving in the Eucumbene-Berridale data, in the study area dataset for a natural
seismicity G-R Law analysis, to provide a reliable and consistent data set for the study area.
A temporal and spatial study of seismicity using the GA online database for the SMR study
region was also conducted and no other “hot spots” of concentrated seismicity were found
within a 10km (or so) radius from any dam. There are approximately 32 large dams outside
of the SMR study area, but within the regional 200-300km envelope in the south-eastern
Australian ranges as listed in Table 4.7 and these are discussed further below.
RIS has been reported as linked to two of the twenty large dams in the NSW SMR as
indicated in Table 4.5. Both of these two dams, Eucumbene and Talbingo have been
identified (Bock 1983, Gibson and Sandiford 2013) as being associated with reservoir
induced seismicity however the case for Eucumbene has been contradicted by Cleary &
Moye (1962) and McCue (2011). This transformation model review of the earthquake data
has been able to examine a larger set of post-dam seismic trends and form a more evidence-
based view of the question, of whether the post-dam seismicity is reservoir induced or
whether it is part of the long range underlying seismic trends. The review strongly supports
the contrary views of McCue (2011), Cleary (1962) and Denham (1977) expressed above,
namely that there is no evidence of reservoir induced seismicity either in its own right or as
an exacerbation of natural activity attributable to the construction of the Eucumbene Dam.
The evidence strongly supports the suggestion that in the SMR, only the Talbingo Dam and
reservoir induced a RIS seismic swarm.
Other Dams and Reservoirs in the extended SMR study area:
To ensure that the selection of SMR study area largely based on the SMR has not accidentally
biased the study and excluded nearby RIS occurrences, a literature search was conducted to
identify other potential RIS swarms up to within a 300km range of the study area boundary
(Gupta & Rastogi 1976, Bock 1983, Gibson 2008, McCue 2011, Allen et.al. 2000, and
Gibson & Sandiford 2013).
The key issues in this matter are essentially: (i) what are the key causes of reservoir induced
seismicity – increased mechanical load or increased fluid flow and pore pressure to
earthquake focal points – or a mixture of both? (ii) If there is a strong causal link between
reservoirs and induced seismicity, why do so few dams in a relatively homogenous geological

136
zone exhibit symptoms of RIS – indeed are dams and their lakes a minor factor? (iii) Do
dams modify underlying natural seismic behaviours in some other manner?
The Geoscience Australia (GA) online Australian earthquake data set and its seismicity
search facility assists a layered temporal and spatial analysis that addresses these questions.
By a process of taking probable events out of the data set and recalculating the G-R
relationship for the SMR we find that the Snowy’s Scheme and its high density of dams and
tunnels has not contributed significantly to the localised or general seismicity in the region.
Table 4.7: The 32 notable large dams within 300km of the SMR study area boundary. (The
dams marked * have been previous linked to RIS)
South & West of SMR H (m) GL North & East of SMR H (m) GL
Lake Chifley 38 31 Lake Oberon 34 45
Carcoar Lake 52 36 Burragorang (Warragamba)* 142 2,030
Lake Rowlands 20 4.5 Lake Woronora 66 72
Lake Wyangala 85 1,220 Lake Cataract 56 94
Lake Hume 51 3,040 Lake Cordeaux 21 1.2
Lake Buffalo 34 24 Lake Avon 74 214
Lake William Hovell 35 14 Lake Nepean 82 70
Lake Dartmouth 180 3,850 Wingecarribee Res 19 26
Rocky Valley Res 32 28 Fitzroy Res 14 24
Yarrawonga W. 22 118 Pejar Dam 26 9
Lake Glenmaggie 37 190 Lake Sooley 15 4.6
Lake Nillahcootie 34 40 Lake Burrinjuck 91 1,026
Lake Eildon 83 3,390 Lake Burley Griffin 33 28
Upper Yarra Res 89 205 Lake Googong 67 123
Lake Thomson* 166 1,123 Lake Yarrunga (Tallowa) 43 86
Blue Rock Lake 72 208 Danjera Dam 30 7.8
The evidence considered in this study confirms the Allen (2000) study of the Thomson Dam
and supports the Allen comments that the major Thomson Dam event (M5.0 in 1996) and the
swarm of aftershocks some 13 years after the Dam construction may be more directly

137
attributable to the Yallourn Fault and less than or not at all attributable to Thomson RIS. The
Warragamba Dam seismic swarm occurred upstream of the extreme southern arm of Lake
Burragorang where there would be neither load stress from the dam and reservoir nor any
significantly increased geological pore pressure. Further the intense seismic swarm of nearly
200 events M>2.0 occurred within a week after from a M5.5 event on 9 March 1973 some 14
years after dam construction in 1959 with none of the progressive (stress release or raised
water pore pressure) events of Thomson and Talbingo Dams occurring under the lake. It is
concluded that the Warragamba Dam and its reservoir did not lead to RIS in the nearby area
and the reported swarm is a natural moderately-large event with a swarm of aftershocks.
4.7 Synthesis of Results for an ISO 31000 model.
The study shows that primary SMR study area has 20 dams and reservoirs with one clear case
of RIS, and the extended SMR study area has a further 32 dams and reservoirs with one clear
case of RIS. This small sample set suggests that RIS is relatively rare being on average, one
in 25 or 4% dams, for intraplate seismic zones.
The study finds two very similar equations for the primary study area (being with and without
the Talbingo RIS data) of the form:
log N = a - b * M (4.1)
where, N is the cumulative number of events and M, the magnitude of earthquake events.
In the primary SMR research area, the 1955 – 2013 Gutenberg-Richter Relationship of 316
seismic events ≥ M2.0 with R2 > 0.9997 is shown to be:
log (N) = 4.2 - 0.84*M (4.2)
After extraction of the Talbingo swarm RIS data the 1955 – 2013 Gutenberg-Richter
Relationship now being 284 seismic events ≥ M2.0 with R2 > 0.9997, is now shown to be:
log (N) = 4.1 – 0.82*M (4.3)
Therefore, over 63 years of the database – the recurrence intervals are mathematically shown
to be as in Table 4.8, although with such a small database the equations may not be as
accurate as for a larger database of events – however the trend is clearly significant.

138
Table 4.8: Table Transformation Model for 1955-2013 events based on the alternative
Gutenberg-Richter formula models with and without RIS
Over 63 years All SMR (primary) N = All SMR less Talbingo Swarm N =
M ≥ 2.0 330 290
M ≥ 3.0 48 44
M ≥ 4.0 7.0 6.6
M ≥ 5.0 1.0 1.0
M ≥ 6.0 0.14 = 1 per 435 years 0.15 = 1 per 415 years
M ≥ 7.0 1 per 3000 years 1 per 2750 years
This table shows that for this data set it may possible to quantify the implication that RIS, if it
occurs, replaces large events with multiple small seismic events and in principle leads a
reduction in seismic hazard risk of damage in active seismic zones.
For the primary SMR, RIS exchanges a slight reduction in the probability of large events is
quantified at about a 10% increase in recurrence interval and shows a slight, but significant
corresponding increase in small events, again about 10%. The data for the extended SMR
shows twice as many dams and reservoirs and two examples of RIS suggest a similar effect.
4.8 Generalised Criteria for RIS
The transformation modelling of the four suspected RIS events in the extended Snowy
Mountains Region has identified the probability that:
1. The Gutenberg–Richter equation for the region was favourably influenced from a
damage risk by RIS with a reduced probability of large magnitude damaging quakes.
2. RIS events are not single large magnitude events.
3. RIS events typically are in the form of a swarm of minor and micro-severity quakes.
4. It appears the progressive tectonic energy accumulation is released from RIS triggers
with a swarm of 50–200 micro and minor events rather than a single larger event.
5. The energy substitution concept, if valid, means that reservoirs substitute large events
with multiple small events, and consequentially reduce seismic damage risk.
6. RIS swarms occur within 1-3 years of dam completion and reservoir filling (reservoir
filling may take 1–5 years for very large reservoirs).

139
7. RIS swarms may last for 1-5 years before a return to background seismicity levels.
8. RIS swarms are found to occur mostly within a range of 10 km of the lake footprint.
9. The occurrence of RIS being just two event swarms from a population of 52 large dams
in SMR suggests RIS is an uncommon event, and probably not predicable by location.
10. Future dam projects could enable answers for unanswered questions by close monitoring
of pre-build and post-build monitoring of large dams.
4.9 Application of Gutenberg-Richter Law Model to Seismic Hazard Forecasting
The examination of the Snowy Mountains earthquake history since 1955 and the application
of both the G-R Law with an examination of RIS together with removal of event records that
may have contributed to an accelerated or overstated risk presents a model for seismic risk
for the SMR as being:
log (N) = 4.1 – 0.82*M (4.3)
This enables a table of recurrence intervals as presented in Table 4.9, with numbers rounded
to reflect the uncertainties. While there is no hard rule, in general it is reasonable to
extrapolate to one or two orders of magnitude above the highest recorded event (M5.3, 1959
at Berridale) indicating that the recurrence interval of once per 60 years for 5.0 < M < 5.9 is
appropriate and that for 6.0 < M < 6.9 a recurrence interval of 400 years is reasonable. For
7.0 < M < 7.9 a recurrence interval of 2,500 years is only indicative (Bayrak 2002).
Table 4.9: Forecast probability of future earthquake events in the Snowy Region
Magnitude (Mw) f(x) (per year) Recurrence interval (years)
2 - 2.9 5 -
3 - 3.9 1 1
4 - 4.9 0.1 10
5 - 5.9 0.05 60
6 - 6.9 0.0025 400
7 - 7.9 (0.0004) (2500)
The table shows that a forecast probability of a M5 event within the region of some 35,000
sq. km is approximately 1.5% in any one year or a recurrence interval of about 60 years. If

140
these extrapolated figures were validated by more extensive longer term data or compared
with other like events such as Banks Peninsula in the Canterbury sequence of 2010-11, then
forecasts can be made. The presence of seven towns and villages (Thredbo, Perisher,
Guthega, Charlotte Pass, Cooma, Talbingo and Jindabyne) covering a combined area that is
exposed to rock falls of about 100 sq. km out of the total area. On an averaged spatial basis
this dilutes the probability of a rock fall event by another 350 times to 0.004% in any one
year and extends the recurrence interval to approximately 20,000 years for townships at risk
in the SMR.
4.10 Conclusion:
This study and its analysis shows that the occurrence of seismic events in the Snowy
Mountains Region can be transformation modelled on a conditional basis using the
Gutenberg-Richter Law supported by spatial and temporal graphs. The conditions of the
modelling include an awareness and potential identification of anthropological events such as
tunnelling micro-seismicity and reservoir induced seismicity. This gives the opportunity to
segregate the suspected RIS data from events caused by these anomalies. In general, modern
tunnelling is conducted using large scale drilling methods, but historical industrial scale
tunnelling was with micro-delay explosive blasting that limited consequential micro-
seismicity to vibration scale behaviours. There was essentially no impact of this activity on
seismic records. RIS event seismicity has a high public profile often connected with large
dams and reservoirs and in particular significant events with magnitudes M>5.0. This has
been of significant worldwide concern to environment and public risks.
The detailed study of RIS associated with the SMR study area and nearby montane areas
between Melbourne Victoria and Sydney NSW, has considered some 52 large hydroelectric
and water supply reservoirs. Only two dams (Talbingo and Thomson) display a measurable
RIS anomaly to the underlying natural records. Two other dams (Eucumbene and
Warragamba) have been attributed as causing RIS, however a temporal and spatial study
indicates that the localised seismicity was not caused by RIS and that the temporal and spatial
parameters are coincidental or more closely linked to major fault activity in the locality.
Therefore of the 52 large regional dams and reservoirs in the extended region, only two (4%)
are clearly linked to RIS.

141
An analysis of the observed RIS further indicates that the RIS swarm events may have been
more numerous but much lower magnitude than the likely long term background seismicity.
Further, some major events previously associated with the dams may well have been
coincidental and more likely connected with major, active nearby faults. There are evidenced
indications that RIS reduces the seismic damage or consequences risk by replacing significant
single events with a swarm of smaller events, potentially representing the same overall
energy release as the natural long term background seismic energy release.
The trend of the analysis and criteria for modelling RIS does enable a first estimate of the
effect of RIS on an intra-plate seismic zone, and the potential to claim that RIS reduces the
likelihood of underlying large seismic events in an active intraplate zone. Whilst the
reduction may be modest, this conclusion contradicts “conventional” public commentary and
hearsay, based often on spatial and temporal coincidences, that repeatedly implies that the
impact of RIS in seismic zones increases earthquake natural disaster hazard risk.
Therefore anthropological anomalies in seismic profiles may be removed from the G-R Law
dataset to produce a strong model to enable forecasting of future natural seismic event
occurrence and magnitude. It is further concluded that an all-Australia intra-plate dataset
does not produce a strong compliance with the G-R Law. Nevertheless, when a dataset from a
geologically consistent area such as the SMR, forming as it does a significant section of the
Lachlan Orogen, then a very strong level of G-R Law compliance is found, increasing the
certainty of the forecast seismic occurrence behaviours.

142

143
CHAPTER 5: CONSEQUENCES OF NATURAL HAZARDS
This chapter considers the second domain in the ISO 31000 composite model, being the
consequences or impacts of the occurrences, beginning with a reminder of Figure 1.6. It
considers the geophysical phenomena associated with earthquakes as natural hazards not just
at the epicentre, but at nearby and distant locations to the epicentre,
The chapter begins by investigating the difference between seismic magnitude and intensity.
Magnitude is a quantitative measure of the size of the earthquake at its source. It is
commonly reported on the Richter Magnitude Scale or one of its modern derivatives and
measures the amount of seismic energy released by an earthquake at its source. The Intensity
is a term to describe the qualitative local effects of an earthquake across its affected area,
with higher values near the epicentre and diminishing values further away. The intensity is
most commonly described by observers in terms of the Modified Mercalli Intensity Scale.
Chapter 4 considered the first of two traditional domains of informed risk assessment being
event likelihood. This chapter reports on a situational study of attenuation of seismic specific
surface energy (SSE) following the second major event in the 2010-11 Christchurch NZ
earthquake sequence at 12.51 pm 22 February 2011 (local time). This event is chosen for
study, in part, because the region is surrounded by montane regions including the volcanic
Banks Peninsula and the NZ Southern Alps (incorporating the Alpine Fault). Also considered
is that the NZ Government research institute, GNS Science, had recently upgraded its
national seismic monitoring network following the Mw 7.1 event at Greendale, Canterbury on
4 September 2010. This upgrade enabled a major step forward in wide area seismic data,
using as raw data, seismograms from 80 strong motion record stations within a 250 km radius
of the epicentre. This step forward in field data accumulation is comparable to the
development of the Snowy Mountains Scheme seismic monitoring program in the 1950s
(Moye 1955, 1956) and used as a background to the situational study in Chapter 4.

144
The data analysis compares traditional parameters with a new parameter to measure and
model the risk of damage to human and property assets. This new method considers various
modelling approaches to typical geophysical behaviour patterns and how occasionally
information that sits well outside the expected behaviour envelope (a “black swan” event)
may be a rare warning of an unexpected extreme risk, not a mere data outlier. This chapter
will specifically model the temporal and spatial attenuation of specific surface energy away
from the epicentre of a major event (as a measure of intensity), and how in a black swan
event the specific surface energy concentrates to generate an unexpectedly higher than a
normal set of consequences, or alternatively dissipates energy in a less harmful manner.
This chapter creates a model of the spatial attenuation of seismic intensity based on actual
surface measurements of seismic intensity related data, rather than geological parameters
such as the seismic quality factor Q, or hydrocarbon reservoir exploration, or by simulation of
theoretical models (Zhang & Stewart, 2010, Nazarchuk et.al, 2017, Soleimani et. al. 2018).
5.1 Introduction
Natural hazard modelling as a precursor to event response and management has largely
developed within the specific knowledge base of each type of natural hazard or disaster
event, being either a geological or a meteorological knowledge set and the forces that are
generated with the respective systems. It has been generally considered that the forces
generated by natural hazards lead to damage of human and built environments, forces such as
wind and floodwater forces, earthquake and landslide impact forces, and in the extreme -
forces from meteor impacts. Most category systems for natural hazards are based on a
measure of force in some form such as earthquake Richter magnitudes, the Beaufort wind
scale and the Saffir-Simpson cyclone or hurricane scale.
The traditional approaches to hazard and damage risk media statements, using a measure of
force, are commonly used because they can be directly and reliably measured with a direct
instrumentation and they can be readily visualised by affected peoples. However these
measures are based on measuring a peak value and do not consider the duration of the
specific surface energy that surround most disaster events and the continuing damage that
arises from long duration events rather than the initial impact.
This chapter considers a new general approach to defining natural disaster effects for
meteorological events (hurricanes, blizzards, floods, and bushfires) and geological events

145
(earthquakes, landslides, rock falls and sinkholes) by considering the specific surface energy
associated with an event rather than the initial or peak forces. The chapter proposes that the
impact of specific surface energy, when delivered above a threshold force level defines the
amount of damage that occurs at that location.
Newtonian Physics at Work – a Refresher
In Newtonian mechanics or physics, it is readily recalled that the acceleration of a mass is a
measure of the applied force since force = mass x acceleration. The energy of a mass is a
measure of work done on that mass by that force, so that: work done = energy expended =
force x displacement. Since velocity = displacement / duration, then displacement =
velocity x duration. By substitution, energy expended = force x velocity x duration.
However, force, like acceleration, is a vector quantity and is therefore subject to rules of
vector mathematics. Therefore, the seismic acceleration of a structure during a major
earthquake is a net result and measure of the imposed vector forces in all directions. In a two
or three dimensional oscillating or cyclical force environment, a continuous cyclical force on
a mass will lead to a reciprocating displacement, where the displacement in each cycle can be
summed to give a total displacement under a continuous (constant or variable) force. In
considering the specific surface energy and the Newtonian definitions in an earthquake event
land surface, there is not a discrete mass to which energy can be ascribed. For seismic
comparison purposes, it does not matter whether a tonne of land surface is defined, or a
square metre surface by one metre deep, or a square kilometre, so long as it is consistent.
This consistency can be achieved in SI units as the specific surface energy (e.g. joules per
kilogram) of the patch of land that is being considered. This can be the interface between a
patch of land and, say, a building on which it rests. A small fraction (say <<1%) of the
incoming seismic energy (Batzle et. al. 2007, Kanamori & Brodsky 2004, Fulton & Rathbun
2011, Aubry 2018) is transferred to any change in the lithosphere, buildings or trees; with the
non-absorbed residual energy flowing onward from the epicentre.
This is the case for both Peak Ground Acceleration (PGA) and specific surface energy, so
energy transfers between the land surface and the built environment are potentially as
important as each other in assessing the seismic impacts. Bisztricsany (1958 in Wahlstrom,
1979) recognised the importance of the energy and duration of surface waves in the
earthquake duration magnitude (also known as CODA). This again, like the work of

146
Gutenberg & Richter (1945) is a measure of energy release from the fault plane, and so it
does not contribute to the theory of damage impacts except in the frequency analysis of
seismic waves. Since this part of the current study is focussed on specific surface energy at
distant locations from the natural disaster event, as a measure of damage risk or assessment,
the earthquake duration measure does not assist here.
In the following studies, the specific surface energy for the duration of the seismic oscillation
will be considered and the acceleration units used will be mm/sec2 and the calculated SSE
will be MJ/t of surface material in order to keep the range of results comparable and readable.
The method for measuring the specific surface energy is not yet easily measured by a direct
and reliable instrument. It currently requires an intense manual graphical calculation or a
digital integration. As this is a method development project, the manual method will suffice
and will include an analysis of result accuracy, but with the recognition that a direct digital
integration method will make the results of this approach more accessible for future work.
Force and Energy from Acceleration and Duration
In summary of the basic physics above, therefore, acceleration is a measure of the magnitude
of the impact force and once a threshold force has been achieved or exceeded at the target
mass, impact damage occurs. The total amount of damage that occurs is denoted by the
transferred energy intensity above the evolving threshold force. As the initial threshold force
and the built environment suffer deterioration, the ongoing threshold for further damage
impacts typically decreases hence the importance of shaking duration. This is especially the
case for unreinforced masonry being impacted by seismic energy, where for example: once
the brick – mortar bond has started to crack or break continued shaking will rapidly propagate
the cracking and damage, with rapidly increasing collapse of the brick walls or structures.
Alternatively, in the natural environment, for example, once a threshold forces for a rock fall
or landslide to initiate are reached, the rock fall and landslide may continue until the
damaging forces and energy flows are exhausted.
A further analysis of the geophysical PGA behaviours of seismic events considers which of
the several PGA analytical methods provides the best analysis of damage potential or whether
an intensity measure such as specific surface energy is better. PGA has provided a strong
basis for correlation with out-of-plane damage (OOP) in the Canterbury earthquakes and with
post-quake field simulation tests in Wellington and Auckland (Ingham (2011) Walsh et.al.

147
(2017). PGA, however, does not provide the same correlation confidence for the built
environment in the wider earthquake affected zones. This is seen especially in Timaru some
150 km to the south west of the epicentre near Christchurch. Timaru is the second largest city
in the Canterbury region, and only suffered moderate direct damage in the Canterbury
Sequence with no serious casualties, but a significant number of URM buildings required
major repair or demolition. This study will therefore extend the geophysical analysis of the
seismic events for a better explanation, primarily by investigating specific surface energy. In
addition, to be considered is why the seismic shaking in Christchurch city on 22 February
2011 generally lasted for about 20 seconds and in South Canterbury generally lasted for some
90 seconds, whereas at Timaru itself the shaking lasted for 150 seconds potentially giving
much greater opportunity for damage propagation once an initial threshold force has been
breached.
It has been shown that across other damage research disciplines, such as in vehicle accidents
and general building damage that energy can provide a direct measure of cumulative damage,
while PGA is a measure of force, generally used to indicate the threshold force beyond which
the built environment is no longer resilient and material damage occurs. This study considers
and compares the effects of the PGA and energy attenuation models in a real seismic event.
Wave Behaviour of Seismic Systems
In an idealised seismic environment where seismic energy is being transported along a
surface such as the surface of the earth, two types of surface wave motion are described: the
Love wave and the Rayleigh wave with both illustrated in Figure 5.1. The Love wave moves
only in the horizontal plane with the wave direction being a sideways oscillatory movement
with no vertical movement, whereas the Rayleigh wave will show a rippling effect like the
surface of water as a typical seismic wave passes through.
Figure 5.1: Depictions of Love and
Rayleigh seismic waves (graphic
courtesy of Exploratorium, San
Francisco)

148
A graphic of typical global seismic wave paths as seen in Figure 5.2, shows the pathway of
seismic energy is not limited to surface waves. Firstly the seismic event will have typically
commenced several kilometres, or more, underground with a displacement in the fault plane
at the hypocentre or focus and will radiate outwards partly via the surface, by direct
transmission, by reflection and by refraction through the many rock and sedimentary
materials that make up the earth’s structure. Secondly, this combination of energy
transmission behaviours will be experienced by an observer at any one location, as is
illustrated in Figure 5.2 (courtesy of US Geological Survey).
Seismic energy generally materialises at the earth’s surface in a series of oscillatory motions
that will be typically highly varied in magnitude and frequency as well as vector
displacement. Figure 5.7 shows part of a typical three way orthogonal seismogram from the
2010-2011 Canterbury Earthquake sequence of earthquakes and in particular illustrates the
highly variable nature of the surface energy effects. This seismogram gives a complete
orthogonal set of the acceleration, velocity and displacement vectors including the peak value
vectors at Heathcote Valley, the closest seismograph to the epicentre some 2.4 km nearby.
Figure 5.2: Graphic of multiple pathways for
seismic body waves through the earth (P
(compression), S (shear), and K (core) waves)
before they materialise at the surface as Love
or Rayleigh waves (graphic courtesy USGS)
In the measurement of seismic and other forms of vibration (e.g. rotating equipment and
motor vehicle travel), a commonly used parameter is peak acceleration in the cyclic vibration
spectrum (not forward motion spectrum). Acceleration however, like velocity and distance,
is a vector quantity meaning that both its scalar value and its direction are of equal
importance in any analysis. In tabulated means and averages like most situations, the dataset
will typically comprise entirely scalar values meaning only the magnitude of the value is
required for the analysis and determining the resulting mean value. This includes for example
averaging the ages or weights of participants in a sample. When a situation such as that

149
shown in Figure 5.3 occurs where a mass rotates around a circular path, with a constant speed
(a scalar quantity) it has different characteristics as a vector quantity being a rapidly
oscillating acceleration and velocity as the mass makes a complete revolution around its
track. The motion can be described sinusoidal in the two orthogonal planes for both velocity
(and acceleration) and each of these is a vector where magnitude and direction are important.
Figure 5.3: Transform of 2D circular motion
to biaxial sinusoidal functions (by Author)
The separation into distinct parameters in the seismogram does not diminish the underlying
description of behaviour; which when the data is reassembled, will show an irregular circular
continuum of motion, being at a constant speed. In other words, the acceleration and velocity
in each plane are not independent data points in the cyclical data set – they are connected and
related. This basic and idealised model helps to frame the thinking for seismic analysis.
5.2 Why Peak Ground Acceleration (PGA)?
The sense of motion experienced by people and property assets in all circumstances is a
generally a measure of acceleration – i.e. felt acceleration. When the value for the felt
acceleration exceeds certain thresholds, injury or damage occurs by either a person falling or
a building suffering shaking damage. The seismic acceleration imposed on a structure during
a major earthquake is a direct measure of these imposed forces. This seismic factor has long
been incorporated in international building standards for example ASCE 7-10 – The
American Society of Civil Engineers, 2010 edition of Standard on “Minimum Design Loads
for Buildings and Other Structures”. Seismic engineering needs special rules to account for
the peak acceleration and thereby the maximum forces on the building structure at different
points. The peak acceleration experienced at ground level being the foundation for the built
environment that can be transformed into design criteria for the fabric of the building itself.

150
PGA Measurement as a Measure of Seismic Impact
Early earthquake seismographs used the pen trace of an inertial weight to measure the
frequency and displacement as various seismic waves travelled through the seismograph
location and from that derived such parameters as magnitude and the peak acceleration.
However, each seismograph generally only measured frequency and displacement along one
axis. Modern strong motion seismometer devices based on electronic strain cells are
essentially three-dimensional sealed devices that can give simultaneous force-acceleration
records of the seismic motion in any direction. The cells typically use the three orthogonal
axes of two horizontal axes (at right angles) and the vertical axis. This suite of simultaneous
data provides a valuable Newtonian property – being the vector values as well as the scalar
magnitudes. A vector approach leads to considering different and more informative options
for presenting Peak Ground Acceleration (PGA). The approach is based on different
combinations of the three orthogonal (two horizontal and the vertical) records: H1, H2, and
V. The three PGA vector options effectively act as representing the location and shape of the
effective PGA acting on a person or place, and therefore the force vector becomes a direct
measure for the potential damage or impact.
There are four commonly used combinations of the PGA vectors as discussed by Nelson and
Murray (1978), Herak et.al. (2001), Zonno & Montaldo (2002), Mogi & Kawakami (2004),
Yamada et.al. (2010), Takewaki (2011), Stewart (2011), Kaiser et.al. (2011), Irsyam et.al.
(2013), and Berryman (2012), as options for the most significant force vector, being the:
(i) Maximum of Individual Orthogonal PGAs
(ii) Geometric Mean Orthogonal 2D Horizontal PGAs
(iii) Vector Sum Orthogonal 2D Horizontal PGAs, and
(iv) Vector Sum Orthogonal 3D Cumulative PGA/Displacement Product.
Following is a comparative analysis of the four parameters.
The four commonly used PGA parameters
It is appropriate to consider the origin of each of the four most commonly used PGA
calculations, and their properties, in determining which option will provide the most
informative and robust parameter or indicator for the force vector.

151
(i) Maximum of Individual Orthogonal PGAs
The maximum PGA in a seismogram is determined in Equation 5.1, and when used assumes
the three orthogonal PGA peaks, occur at random times, each completely independent.
PGA3DMAX = the greater of (PGAH1, PGAH2, or PGAV) (5.1)
With three orthogonal (H1, H2, and V) axes the maximum individual PGA is considered by
Berryman (2012), Herak et.al. (2001) and Zonno & Montaldo (2002) to represent the
maximum force in any one of the three orthogonal directions that the built environment is
exposed to. This method will variously select the peak acceleration in either of the horizontal
plane or the vertical plane at different locations to represent the greatest force imposed on a
person or building. Of the 68 Strong Motion Recorder (SMR) sites within approximately 200
km of the epicentre of the Christchurch earthquake on 22 February 2011, 12 sites recorded
the highest PGA in the vertical plane, 32 sites in the horizontal plane radially aligned with the
epicentre, and 24 sites aligned at right angles to the epicentre radial plane. The 12 vertical
plane sites were mostly closest to the epicentre and beyond that, there was a mix of
orthogonal horizontal PGAs. This suggests in the application of building design standards,
that if a single maximum peak ground acceleration value is chosen as a measure of damage
risk, then it should be applied to the property asset design in each orthogonal direction.
The February 22 event produced unusually high PGAs, (especially in the vertical plane) and
in many locations greater than the acceleration due to gravity. In the locations where PGAV >
1.0; people were apparently lifted of their feet as well as being likely knocked over upon
landing. When PGAH was beyond a local situation threshold, a person may have been
knocked over, or was at a risk of death or severe injury because of impact injuries. New
Zealand Police casualty lists (Press 2011) indicate four people died as a result of these mixed
PGA mechanisms in the 22 February event.
The use of this parameter implies consideration that the highest PGA in any direction, not just
the orthogonal planes where acceleration is measured, represents the probability of the
highest force impact on people or buildings. Of course, it may be that the highest is not in
one of the measured planes and this may understate the maximum. It does not consider the
effects when synchronised cyclic seismic waves in different directions combine PGA vectors
to act simultaneously and create a larger vector sum in a combined vector direction rather
than just the orthogonal axis directions.

152
(ii) Geometric Mean Orthogonal 2D Horizontal PGA
The geometric mean as defined in Equation 5.2, when applied to a seismic event has the
characteristics as follows. The geometric mean will lie between the two vector values and is
weighted towards the smaller value, effectively assuming a measured result in one direction
is in reality distributed and dispersed across other directions.
PGAGM = 2√ (PGAH1 * PGAH2) (5.2)
The geometric mean mathematical concept is applied in many different engineering and
business applications where the values are multiplied together across sequential time periods
to model a cumulative effect, for example in financial investment the geometric mean return
is the rate over several years. Applications in seismic engineering are well established and
described by Stewart (2011), and Irsyam et.al. (2013).
The Christchurch Earthquake PGA is described by Bradley (2012). The building design
standard ASCE-7 (2010, p60) uses “the maximum credible earthquake geometric mean
(MCEG) PGA since the most severe earthquake effects considered by this standard
determined for geometric mean peak ground acceleration. The MCEG peak ground
acceleration adjusted for site effects (PGAM) is used in this standard for evaluation of
liquefaction, lateral spreading, seismic settlements, and other soil related cumulative issues”.
It appears that the geometric mean has a strong historical basis for application having been
included in ASCE standards for many decades, noting that it is focussed mostly on damage
caused by horizontal shaking behaviour. Recent editions of the ASCE-7 have started to
consider the limitations of this format as reported by leading engineers in Los Angeles
(LATBSDC 2014, p 11) who have reported:
“ASCE 7-10 has changed the ground motion intensity by modifying the definition of
horizontal ground motion from the geometric mean of spectral accelerations for two
components to the maximum response of a single lumped mass oscillator regardless of
direction.”
moreover:
Hence, disagreement with the new definition of ground motions contained in ASCE 7-10, is
widely held among respected academicians and design professionals. ASCE 7-10 does not
specify how seed time histories are to be scaled for three-dimensional analyses except that
each pair of selected and scaled ground motions shall be scaled such that in the period

153
range of 0.2T to 1.5T, the average of the square root of the sum of the squares (SRSS)
spectra from all horizontal component pairs does not fall below a target spectrum (130% of
the prescriptive approach.”
A discussion of the basis for standards is beyond the scope of this work, but a move from
geometric mean to a vector sum approach is under active debate in the highly earthquake
prone areas of the USA, and notably California as noted in LATBSDC (2014, p 11).
(iii) Vector Sum Orthogonal 2D Horizontal PGA
The two dimensional horizontal vector sum arises when it is assumed that the two horizontal
PGAs are cyclically synchronised through an approximately circular horizontal motion.
Resolving this PGA recognises the vector addition properties of PGA is achieved by simple
Pythagorean trigonometry, since H1 andH2 have orthogonal axes, as shown in Equation 5.3.
PGAVS2D = 2√ (PGAH1
2 + PGAH2
2) (5.3)
The vector sum will always exceed the larger value and be less than the sum of the two
values. This method mathematically provides a measure of the resultant vector of any two
forces acting on the point under consideration with a focus on horizontal forces. This method
generally follows the assumption of the geometric mean that horizontal shaking forces
(arising from say Love Seismic Waves) are dominant in a seismic event and most relevant to
damage risk assessment for human and built environment assets. This approach is discussed
by Nelson & Murray (1978), Mogi & Kawakami (2004), and Kaiser et.al. (2011).
(iv) Vector Sum Orthogonal 3D Cumulative PGA/Displacement Product
This approach is based on Equation 5.4. It varies from those above options in that it
dimensionally represents the highest peak or total force that may be exhibited in a three
dimensional wave system where the peak acceleration in each direction may be experienced
simultaneously. It assumes the worst case and can be found by modern electronic strain cells
due to their high frequency resolution.
PGAVS3D = 2√ (PGAH1
2 + PGAH2
2 + PGAV
2) (5.4)

154
Such a system is difficult to visualise but if the circular motion paradigm in Figure 5.3 is
extended to an irregular stellated polygon model, the peak is continuously recorded. This
could be visualised as a simultaneous combination of the Love and Rayleigh Seismic Waves.
The normal process of separating the motion into individual one-dimensional plots dilutes the
concept of this approach; however, the GNS Science three-dimensional orthogonal
seismograms indicate that the PGA repeatedly occurred simultaneously in the damaging
Christchurch earthquake on 22 February 2011. When one of the orthogonal peaks was
asynchronous, typically a close slightly lower alternative value synchronised with the other
peaks, giving still valid use of the three-dimensional vector sum with a very small error. This
contradicts the historical assumption of an alternate PGA as used in building standards and
reflects the benefit of the modern strong motion seismographs and recorders now in use.
Such an approach has been commonly used in seismic research in Japan, for example
Takewaki (2011), and Yamada et.al. (2010) discuss the record levels of 3-dimensional PGA
(H1, H2 and V) in various major seismic events, noting that the seismograms confirm actual
synchronisation of the three orthogonal PGA values. Japan has a long record of liquefaction
arising from strong vertical accelerations and has possibly recognised the importance of a
three dimensional measure to the analysis of this phenomenon.
Which PGA is Best?
The four main forms of describing the peak ground acceleration (PGA) are each an important
alternative input into seismic design for buildings representing the magnitude of impact
forces on the built environment. The access to modern seismic instrumentation provides a
large dataset to confirm that there is a relatively predictable relationship between the four
methods of calculating PGA and more importantly a relatively predictable difference between
the rates of PGA attenuation with distance from the epicentre of a seismic event. As with all
natural hazards where forecasting a future event depends strongly on knowledge of the past,
the history of PGA measurement and usage weighs heavily on a reluctance to change data
collection methods and lose historical data continuity, however against that is a continuing
need to improve forecast capability and relevance. When the four forms of PGA are
compared for robustness and relevance as above, the difference between the four forms is a
logarithmic relationship that displays as in Equation (5.5):
log (PGAVS3D) > log (PGAVS2D) > log (PGA3DMAX) > log (PGAGM) (5.5)

155
Following in this chapter an empirical comparison using the Christchurch Event II data (in
Figure 5.8 and Table 5.4) also suggests that the PGAVS3D produces the most robust model.
Whilst the design standards used in seismic design are in fact based on the lowest PGA in this
sequence and the lowest impact energy, in reality the design method contains higher design
margin factors that provide for a safe margin beyond the measured PGA. If the technically
correct and accurately measurable three-dimensional “vector sum” was used, then more
accurate designs based more strongly on measured forces would be achievable. This same
test is applied to the selection and application of the appropriate mean when using datasets
from empirical situations in natural systems.
The conclusion from this desktop analysis of options is that the 3D vector sum PGA provides
the most appropriate measure of PGA in the full spectrum of situations.
The reasons supporting this recommendation can be therefore summarised as:
Three dimensional vector sum (VS3D) has a long history in event measurement in high
intensity, liquefaction prone Japanese environments,
The VS3D gives balanced weighting to the highest PGA of the three orthogonal axes if
and when one or more of the axes is materially different to the others,
Modern strong motion recorder seismograph instrumentation is in widespread use and
well established in a wide range of locations to give full acceleration / velocity /
displacement data in digital form,
Digital data and seismograms can be readily downloaded, processed mathematically,
and graphically presented in online databases together with key data,
The data set shows that for a wide range of seismic readings over a wide area spanning
500km, and across different geomorphological settings, the VS3D give the strongest
Coefficient of Determination (CoD) R2 measure as shown in Table 5.4 below, and
When the geomorphological sectors are processed individually, the Coefficient of
Determination (CoD) R2 measure improves even more noticeably.
Following the comparison of the four forms of PGA, an evaluation of the VS3D PGA against
specific surface energy from a major seismic event has been carried out for interpretation of
geomorphology characteristics and anomalies in the seismic records of the Canterbury
earthquake sequence. This evaluation shows the relationship between the two parameters and
considers which is the best determinant and predictor of earthquake damage. Is it (i) peak
force (measured by peak acceleration) or (ii) total energy (the product of acceleration,

156
cumulative displacement, and shaking duration), or (iii) alternatively both used to forecast the
damage from a combination of force and energy impacts at the place under consideration.
This seismic event approach will take a case study approach and will consider different PGA
measurement models based on the 2010-11 Christchurch New Zealand seismic sequence and
in particular, the 22 February 2011 event that caused considerable harm and damage in
Christchurch, New Zealand. This earthquake had a devastating impact on the Christchurch
CBD and widespread severe impacts on the surrounding urban areas. It has been noticed by
this author that a number of townships and small cities such as Amberley, Rangiora, Oxford,
Ashburton, Geraldine, and Timaru in the wider regional areas also suffered considerable
impacts from the event sequence. They were little reported outside of their local area because
of the relatively small scale of the consequences compared to the larger city of Christchurch.
An analysis of the seismic parameters in these areas however provides very useful
information on the attenuation of forces (as represented by PGA) or specific surface energy
(as calculated in this paper) that can be used in forecasting the effects of likely future events.
Seismic Intensity – Intensity (MMI) and Energy (SSE) Scales
This study proposes a comparison of MMI with an intensity based specific surface energy
(SSE) method for seismic intensity attenuation as an alternative to the PGA based method.
Modified Mercalli Intensity (MMI): The MMI seismic intensity isoseismal map for the
1989 Newcastle earthquake is shown in Chapter 1. The definitions for the NZ modified MMI
scale are shown in Chapter 2 (s2.5). Goded et.al. (2012) presented the results of the GeoNet /
GNS Science MMI “felt report” map for Christchurch Event II in Figure 5.4.
The GNS Science report location plotting approach does not lead to the clean concentric
isoseismal boundary mapping seen in the GA Newcastle map in Figure 1.2, but it does
suggest some report inconsistencies to the south-west, far north and south-east of the Port
Hills epicentre that correspond to anomalies identified in this chapter. The use of gradable
adjectives in scales such as MMI leads to differences in interpretation between observers and
relies on averaging many felt reports. SSE is a new approach to find a consistent quantitative
scale with clear definitions that map to the MMI scale and validate observer reports.
The Specific Surface Energy (SSE) therefore requires an interim definition as follows:
A measure of energy, primarily kinetic energy rather than thermal or sound energy

157
SSE passes through a specific mass of ground matter at the observer location
The SSE is attenuated by dynamic resistance where it is converted typically to thermal
energy. One laboratory study suggest temperatures of up to two degrees Celsius may
be possible with very cohesive (energy absorbing) surface. (Aubry 2018)
SSE attenuation may also occur through energy absorption by the “surface-attached”
features at the location, for example trees and buildings.
The long distance transmission (>>250 km) of seismic energy suggests localised energy
attenuation is a very small fraction of the energy input to a location (perhaps <<1%).
Figure 5.4: MMI plot for Canterbury Event II on 22 Feb 2011 event: (Goded 2012)

158
5.3 Seismic Events in Christchurch, New Zealand
There were four major events (greater than M6) in the Canterbury Sequence among an
exceptionally large number of more than 12,500 events all being formally defined as
aftershocks to Event I. The four major events were:
I. 04:35, 4 Sept. 2010 (NZ Time): M7.1 at Darfield
II. 12:51, 22 Feb. 2011 (NZ Time): M6.3 near Lyttelton
III. 14:21, 13 Jun 2011 (NZ Time): M6.4 at Sumner, and
IV. 15:18, 23 Dec. 2011 (NZ Time): M6.0 at New Brighton
These events produced devastating regolith liquefaction to the northern, eastern and southern
sectors of Christchurch city, being built largely on young clays, silts, and sandy sediments.
These sediments link the sediment and gravel based Canterbury Plains in the west of
Christchurch to the basaltic shield twin volcanic group of Banks Peninsula in the south east
as shown in Figure 5.5. The major extinct intra-plate volcanoes at Akaroa and Lyttelton
commenced activity approximately 10My ago in the Miocene. The craters have subsequently
become submerged and eroded by the post-glacial rise in sea levels leading up to 15,000
years ago.
Figure 5.5 shows the south-easterly crater-harbours of Lyttelton and Akaroa, and the
epicentres of the four major events in the Christchurch sequence. Events II and III had their
hypocentres directly under the northern rim of the Lyttelton volcanic crater-harbour at a
depth of 5-7 km. The Christchurch CBD is 7 km to the northwest of the event II epicentre.
Weathering of the whole volcanic group of Banks Peninsula and the northern edge of
Lyttelton in particular has left many jointed rocky outcrops along the residual crater ridge,
and on the faces of weathered and jointed lava flows. In the otherwise flat topography of the
Christchurch urban area, residential development along the lower slopes has been highly
desirable and extensive, leading to occasional but generally accepted risks of rock fall to
those in residential areas. This risk materialised at much higher levels in multiple locations
during the larger earthquake events in the Christchurch sequence, creating very serious urban
environment disruption, harm and damage.
There are some significant similarities and some differences in the surface geology of the
Snowy Mountains Region (SMR) compared to Banks Peninsula. The topography of the
weathered volcanic basalt ridges and tors is comparable to weathered granite ridges and tors

159
with both showing deep jointing and the separation of large boulders as seen in the SMR rock
outcrops in Figures 5.6 and 5.7.
Figure 5.5: Location of Events I to IV on the Canterbury Plains and Banks Peninsula.
* Event II caused the greatest urban harm and damage.
** Events II & III were under the north of the Lyttelton Harbour volcanic rim (Port Hills).
Both montane environments also show steep slope angles between 30° and 45° that enable
high speed downhill boulder roll. Therefore the physical configuration of many weathered
rocky outcrops on the Port Hills ridges and similarly steep SMR hillsides, the range of sizes
of jointed and eroded large boulders, and the population concentrations at the slope roll-outs
encourages close comparisons between these similar montane systems, as seen visually in
Figures 5.6 and 5.7. The boulder and slope similarities mean that once dislodged, the
boulders are at a high risk of falling, rolling, tumbling, and sliding movements at high speeds
(typically 100 km/hr) down hillsides as described in Highland (2004).

160
Figure 5.6 (left): A typical Snowy
Mountains rock outcrop at Porcupine Rocks
(photo: wildwalks.com)
Figure 5.7 (right): A typical Christchurch
Port Hills rock outcrop at Rapaki (photo:
climbnz)
In general the SMR is approximately 50% granite and 25% basalt with the volcanic basalts
being more biased towards the easterly tableland zones and the plutonic granites dominating
the higher western zones. The balance of 25% is mostly uplifted marine and sedimentary
formations. Banks Peninsula displays a more rugged appearance of peaks and ridges largely
due to intensive weathering of the more erosion vulnerable interwoven tephratic lava and ash
formations. Nevertheless, the topographical similarities in the rocky outcrops and steep
hillsides in both cases present similar rock fall risk and downhill movement behaviours. The
main basis for comparability lies in the underlying geology. Both the SMR and Banks
Peninsula ridge and peak formations have considerable igneous origins, being mostly granite
or basalt. The relevant mechanical properties of these two rock types are seen in Table 5.1
and although the geochemical (respectively acidic and basic) differences are significant, the
mechanical properties that relate to behaviours in a seismic event are relatively close.
Table 5.1 shows the closeness of properties of Granite and Basalt with differences being
relatively minor. Of particular note is that granite as an intrusive rock formed in plutons with
very slow cooling, enabling large grain crystals to form. Basalt as extrusive lava either air or
undersea cooled, results in a finer grain structure than Granite. Both rock types present

161
granular crystalline microstructures that are vulnerable to differential weathering and jointing
into large boulders, creating ideal candidates for seismic rock fall and boulder roll. The
properties representing seismic energy transmission and stress behaviours under fault
conditions also illustrate significant similarity in the rock types and strong grounds for
assuming comparable seismic behaviours.
Table 5.1: Typical
geotechnical properties of
granite and basalt
(consolidated from data in
Zhao 2010)
The most significant difference in seismic risk between montane elements of the two
locations is found where the lower mountainsides and valleys in the SMR are typically
heavily forested, except in the higher recreation zones such as those of the ski resorts at
Thredbo, Perisher, Mount Selwyn and Charlottes Pass. These forested areas will provide
significant rock fall barriers (Stokes 2006) a fact long recognised in Banks Peninsula where
residents on the lower slopes often planted groves of trees uphill of their homes to arrest
tumbling boulders, occasionally loosened by rain and wind storm events. Whist the weight
and inertia of these boulders (each typically between one and 50 tonnes) limits their
unstressed movement, a severe weather storm or an earthquake, creates the potential for
behaviour that mirrors the following description of the Rapaki boulder fall and the many
other like rock falls in Christchurch Event II.
Christchurch 2011 Study Approach and Method:
Seismic data for this event was collected by GNS Science from the GeoNet seismograph
network across New Zealand. This study considers 80 GNS Science online seismographs up
Property Granite Basalt
Rock type Igneous Igneous
Rock class Intrusive Extrusive
Grain size (mm) 1.0 - 10 0.05 – 0.25
Density (gm/cm3) 2.5 – 2.6 2.2 – 2.8
Schmidt Hardness 54 - 69 + 61
P wave velocity (m/s) 4500 - 6500 5000 - 7000
S wave velocity (m/s) 3500 - 3800 3660 - 3700
Compressive strength (MPa) 100 - 300 100 – 350
Tensile strength (MPa) 7 - 25 10 - 30
Elastic modulus (GPa) 30 - 70 40 - 80
Strain at failure 0.25% 0.35%
Specific heat (J/kg0C) 790 840

162
to a 250 km range of Christchurch Event II at 12.57pm local time on 22 February 2011. The
primary zone of interest was sites within 150 km of the epicentre near Heathcote Valley,
which included much of the seismically active Hope Fault to the north and the northern end
of the Alpine Fault. The study was extended to an approximate 250 km radius to ensure
there were no boundary anomalies in the primary zone.
This event occurred on the hidden Port Hills Fault, which is a short, 10km long, reverse thrust
fault with slip strike, sitting just under the northern rim of the Lyttelton volcanic cone and in-
line with the Greendale Fault that was the epicentre of Event I, some six months before. This
fault has no surface features possibly because it sits below deep alluvium and was therefore
previously unrecognised. A number of peculiarities were noticed in the data so sites within a
fringe zone of 50-100 kilometres outside of the primary zone were also processed as a matter
of data integrity practice in order to discount boundary effects from the primary zone, and
potentially other anomalies in the data.
The PGA values were calculated directly from reported data, and the specific surface energy
values were determined by a manual graphical method, from the AVD (from the GNS
Science GeoNet web site) seismograms as follows:
a. The primary study zone was up to 150 km from the epicentre (61 seismograph sites),
b. The fringe zone was the next 50-100 km from the primary zone (19 seismograph sites),
c. The three dimensional orthogonal seismogram for each location was scaled on-screen,
d. The seismogram time scale was divided into at least 10 periods on the active traces,
e. For each seismogram and period, the average acceleration and average displacement
values are graphically measured with an Omnigrid Metric R1515a square transparent
ruler (Prym GmbH, Zweifaller Strasse 130, 52224 Stolberg, Germany),
f. The average acceleration and displacement values are multiplied for each time period,
and each orthogonal axis, and then summed to obtain a specific surface energy value,
g. The three orthogonal PGA values were recorded for calculation of the four PGA forms,
h. The epicentral distance to the seismograph location was re-measured, since distances
were recorded on the GNS Science seismograms only to the nearest kilometre.
i. Distances up to 50 km were re-measured to one more significant figure (being the
nearest 100m).
j. All four data items, the seismogram, site elevation and the location were recorded,
k. The seismograph sites were grouped with common geomorphic structures and
anomalies from the trend-lines, the seven geomorphic groups being as follows:

163
l. Repeatability tests were conducted on the data as noted in Table 5.2 below.
Whilst a data based digital method is likely to produce more repeatable results, the faster
manual method using AVD graphs was conducted first to experiment with methods and data
to see if meaningful results might arise. The direct data is available from GeoNet for a digital
analysis if that is considered useful at a future time.
The primary study zone groups – greater Canterbury (61 seismograph sites):
South-east side of the Port Hills Fault – hanging wall block (5 sites)
Christchurch city and plains – gravel and loess silt lithology (34 sites)
Bexley liquefaction area – very high PGA values and liquefaction (3 sites)
Alpine Foothills – that bound the Canterbury Plains to the west (10 sites)
Alpine Fault Zone – sites within 5km of the Hope and Alpine Faults (9 sites)
The fringe tectonic zones (19 seismograph sites):
Waitaki River Valley Zone – southern fringe sites on the Pacific Plate (7 sites)
Nelson-Marlborough Zone – Australian Plate and Marlborough transition faults (12)
The data was entered into a MS Excel spreadsheet that enabled a log-log plot of any
parameter against epicentral distance and inclusion or exclusion of any geological or
lithospheric zone for the data set for each plot. The data from the five hanging wall block
sites on Banks Peninsula for the three dimensional vector sum PGA and the specific surface
energy are separately presented in Figures 5.9 and 5.10, and Table 5.4 below, and are
included in the all sites figures below.
Graphical Method Repeatability
As part of the method proving process for determining the specific surface energy, a
repeatability test (ASTM 2009) was also carried out on the specific surface energy
determination at three GNS Science seismograph sites using one set of horizontal data. The
repeatability is a measure of the same operator (data processor) using the same method on the
same input data over close times (1 – 2 days apart). A method reproducibility (ASTM 2009)
which involves a different operators using the same method on the same data at different

164
times was not conducted due to the personal nature of this PhD project, so the results may
contain a systematic bias associated with the graphical analysis operator (thesis author).
A survey of a range of test and analytical methods (Mandel 1972, Horwitz 1977, Bovera
2003, Horie 2008, and Pandiripalli 2010) find that the reproducibility range is typically
projected at 1.5 times the repeatability range for complex analytical methods with a high
level of operator skill. The repeatability results are presented in Table 5.2, which finds that
the method has a standard error of ±13.3% repeatability and therefore by projection ±20%
reproducibility about the graphically determined mean value.
These confidence levels are typically representative of manually intensive analytical or test
methods. Since the original measured data source from a vibration device is digitally
collected before graphical presentation in a seismogram, a digital method can be derived to
determine the specific surface energy, and would likely have a repeatability of less than 2%
being the typical accuracy of digital strain sensors. The derivation of a digital integration
method for the specific surface energy is beyond the scope of this project.
Table 5.2: Specific Surface Energy Method Repeatability Test Results
GNS Science
Seismograph
Data
Set
# of
Tests
Repeatability
Average
Repeatability
Std Dev
Std Dev as
% Ave’ge
Reproducibility
1.5*SD/Ave
PPRC Pages Rd H1 10 ±2.63 MJ/t ±0.26 ±9.7% ±14.6%
DO6C Opus Blg H1 10 ±1.24 MJ/t ±0.23 ±18.5% ±27.8%
OXZ Oxford H1 10 ±0.0159 MJ/t ±0.0019 ±11.7% ±17.6%
Average ±13.3% ±20.0%
Three-way AVD Seismograms
The approach under consideration also recognises that the primary hazard or event energy
above a threshold release triggers various forms of latent energy (e.g. potential and
physiochemical energy) to accumulate with the total energy release in an event and ultimately
creates a more intense impact on the people and property assets in the impact zone. The
earthquake impact zone instrumental measures are in this analysis acceleration, velocity, and
displacement determined by electronic strain sensors, but after signal processing all
producing an AVD seismogram, which is published online by GNS Science as shown by
example in Figure 5.8. These seismograms together with their attached temporal and spatial
data have been used as the primary data sources for this part of the project.

165
The development of seismic attenuation models based on the AVD seismogram presents an
opportunity for forecasting probable earthquake impacts and consequences at locations
radially distant from the epicentre. The attenuation models will be used to determine ground
acceleration and matching cyclical displacement across the duration of shaking at a range of
locations. This will enable determination of a cumulative force-displacement measure of
work done on a particular ground location and therefore a measure of specific surface energy
towards the location, and the people and property assets there. This approach seeks to
investigate that the application of energy attenuation models can provide an alternative risk
assessment process by providing a stronger estimate of consequence in the ISO 31000 model.
From each location seismogram, (as shown in Figure 5.8 being typical of the 80 seismograms
in the study area arising from Event II) are the three independent orthogonal seismograms
that show a number of common characteristics. These are; the orthogonal peak acceleration
and velocity vectors appear to be closely synchronised, are a mixture of positive and negative
values, but have comparable scalar magnitudes.
Figure 5.8: Orthogonal vector traces from Event II for Heathcote Valley School (traces in
the SW, NW horizontal and vertical planes, & 2.4km from epicentre (source: GNS Science)
The peak motions for the three orthogonal directions are shown in Table 5.3. This implies
that the simplified two-dimensional model in Figure 5.3 may be extrapolated into
simultaneous, very dynamic three-dimensional patterns of continuous motion(s). In

166
consideration of the complexity of input energy waveforms, however, it is most unlikely that
the net locus waveform will be a simple spheroid or rounded polyhedron. The locus might
instead be visualised as a complex solid shape such as an irregular (i.e. uneven) stellated
polyhedron with multiple peaks and valleys.
Notably the 61 SMRs from around the greater Canterbury zone generally show a similar
synchronicity of peaks (maxima) to those seen in the Heathcote Valley seismograms. Where
they do not match with this observation, there is a comparable magnitude peak within the
same time point, which might be only slightly, less than the recorded maximum peak. If this
is the general case, then it is reasonable to consider a seismogram as a three-dimensional set
of oscillatory peaks that maximise within a three dimensional envelope. This implies that the
three seismograms represent a situation under continuous random three-dimensional forces.
For the Heathcote Valley School, the AVD peaks for Figure 5.8 are in Table 5.3.
Table 5.3: Peak motion values for 3 orthogonal planes at Heathcote Valley, 22 Feb. 2011
= Peak in Figure 5.8 S26W Plane S64E Plane Vertical Plane
Acceleration: mm/s2 -14,267 -11,637 14,381
Velocity: mm/s -973 623 -392
Displacement: mm 149 69 119
Earthquake reporting and discussion in the public arena uses both magnitude or intensity to
describe the size of an earthquake. There are three common measures, the Richter Scale (ML)
the more recent Moment Magnitude Scale (MW), and the Modified Mercalli Intensity Scale
(MMI). The first two determine the magnitude only at the epicentre calculated by back
calculation, and the latter is a qualitative scale of felt impacts at the observer’s location. In
the public media domain, the Richter and MMI scales are commonly confused.
Observational Comparison of Four Different PGA Methods
All of the 80 seismograms from the greater Canterbury region and the fringe tectonic regions
were examined for Canterbury Sequence Event II. The four tested PGAs discussed above are
plotted in Figure 5.9 to establish their robustness and relevance to investigations in this event.
This full sized comparison graph is filled with a high volume of data however strong
relationships are evident creating potentially useful transformation models of PGA.

167
Fig
ure
5.9
: P
lot
of
the
fou
r m
ost
com
mon
PG
A m
easu
res
in t
he
80 E
ven
t II
sei
smogra
ph
s (b
y A
uth
or)

168
These plots bring together the attenuation parameters as seen in Table 5.4, again emphasising
the common spatial attenuation factors and progressively decreasing epicentral PGA and
energy, and the significant anomalies from the trend lines.
The trend lines and the resulting Coefficient of Determination (CoD) is also summarised
again in Table 5.4. All four lines show remarkable similarity in the attenuation factor with
the extent of the similarity only being exceeded by the observation that the two three
dimensional attenuation factors (3D vector sum and maximum) are identical at 1.33 and the
two horizontal attenuation factors (2D vector sum and geometric mean) are identical at 1.25.
The general observations from the trend lines and data fit in Figure 5.9 and Table 5.4 are:
It was found that the attenuation factor was largely unaffected by the particular PGA
parameter though the intercept being related to parameter values somewhat more so.
These graphical trend lines have a very similar gradient and spread and are in sequence
indicating that the spatial attenuation of each parameter is similar.
The order of the trend lines follows the differences in Equation 5.5 but of a lesser extent
than expected.
The trend lines indicate that a 3 dimensional (vertical inclusive) PGA will across the
whole data set provide the closest to ideal measure of seismic forces.
The spread of data points generally follows each PGA form in a very similar manner
with some outliers across the range of data, but few strong regional or other trends of
variation from each trend line.
There were greater variances from the trend line at locations most distant (up to 300km)
from the epicentre and in many of these cases; the manual calculation was more
difficult because of small amplitude data.
The conclusion from these plots is that apart from local anomalies, the attenuation model in
any of its variances is a useful predictor of PGA remote from the epicentre which if
correlated with damage or design criteria gives a useful transformation of raw data into
seismic event outcomes
Next, the data analysis considers the preferred PGA and Specific Surface Energy (SSE)
comparison and is shown in the full sized graph in Figure 5.10, where we introduce
amplitude and duration of shaking into the specific surface energy (SSE) parameter.

169
Fig
ure
5.1
0:
PG
A a
nd S
pec
ific
Su
rface
En
ergy
Tre
nds
in t
he
80 E
ven
t II
sei
smogra
ms
(gen
erate
d b
y A
uth
or)

170
Comparison of 3D Vector Sum PGA with Specific Surface Energy
The attenuation of PGA (3DVsum), and Specific Surface Energy (SSE) or event intensity, is
formally represented in Figure 5.10 and is also a graphical representation with a high volume
of data. The trend lines are represented by the formulae in Equations 5.6 and 5.7:
log (PGA (3DVsum) ) = -1.3282*log(DIST) + 5.0444 (mm/sec2) (5.6)
log (SSE) = -2.3136*log(DIST) + 5.5682 (MJ/t) (5.7)
Of particular note is the significantly higher gradient in the SSE trend line indicating the
energy level attenuates more quickly than the force base PGA trend line. This enables a
greater degree of discrimination between epicentral distances and that may be of assistance in
correlating the SSE model and the MMI scale.
The general observations from the trend lines and data fit in Figure 5.10 and Table 5.4 are:
The spread of SSE data points generally shows consistency but with several strong
spatial variation anomalies that appear to be significantly different to the trend line.
It was again found that the attenuation factor was consistent with a better fit to the
transformation equation model. The R2 for PGA is 0.91, for SSE (all data) is 0.92 but
when the eight anomalies are excised, the (SSE) R2 becomes a very strong 0.98.
The SSE trend lines indicate that SSE provides a consistent seismic intensity measure.
The eight SSE anomaly location effects correspond closely to apparent MMI anomaly
locations in Figure 5.4 (Goded et. al., 2012) giving confidence in the relationship.
The spatial attenuation anomalies are very obvious in several locations.
The SSE in hanging wall zone (Banks Peninsula) is an average of 79% below trend
The SSE on the Timaru Dolerite Shield was 830% above trend
The SSE in the Marlborough transition zone was an average of 88% below trend
The conclusion from these observations is that the Specific Surface Energy shows similar
difference trends to PGA but the SSE spatial attenuation is much greater than the general
PGA trend in the previous section. Of most concern is that the Timaru Dolerite zone appears
to have the specific surface energy almost an order of magnitude greater implying a risk of
greater damage compared to other like epicentral distances.

171
These Specific Surface Energy anomalies and differences in Figure 5.10 were investigated
further. Of particular note was the impact of the shorter and longer shaking times at certain
locations that experience unusual patterns of damage, and in the Marlborough (plus some
Nelson locations) anomaly the more rapid diminution of shaking. These appear to be
important situational anomalies. To attempt an explanation an examination of
geomorphological differences in the locations was undertaken. It must be noted that a
detailed and robust geological examination of the anomalies is beyond the scope of this study
but there are some suspect causes that immediately come to notice for these trend outliers.
Table 5.4: Attenuation Relations for PGA & Specific Surface Energy (SSE): Event II
Y
log(Y) = a*log(de)+b
a
Attenuation
Factor
b
Intersect
log(y) @ de=1km
R2
CoD to trend line
PGA: Vsum(PGA3D) -1.3282 5.0444 0.9096
PGA: Max(PGA3D) -1.3314 4.9067 0.8978
PGA: Vsum(PGA2H) -1.2528 4.8562 0.8915
PGA: Geomean(PGA2H) -1.2515 4.6958 0.8935
SSE (all Event II data) -2.3136 5.5682 0.9188
SSE (less 8 anomalies Table 5.7) -2.5249 6.0135 0.9665
5.4 Trend Outliers – Specific Surface Energy and Seismic Anomalies
The eight data points in Figure 5.10 Specific Surface Energy plot that show significant
deviations from the trend line are identified as significant anomalies with a montane
significance. There is also a group of data outliers originating from the near-estuarine zone of
Bexley that suffered the most serious liquefaction in the Canterbury region. The zone is
generally between the entry of the Heathcote and Avon Rivers into the Estuary shown in
Figure 1.3. This area is called the Bexley Anomaly in this study and is essentially in the
centre of the liquefaction zone shown in the Figure 1.3 map. It will not be studied further here
as it does not represent a montane or montane influenced zone. This area has been subject to
a large number of alluvial liquefaction specific, research studies by other research
institutions. The Bexley area was originally very close to high tide level but then dropped a
further 0.5 metre in altitude due to combined liquefaction and footwall zone effects for events
II, III, and IV in the earthquake sequence. This area is just 2-4 km from the epicentre of
Event II and a similar distance from the epicentres of Events III and IV as shown in Figure
5.4 above.

172
The three major anomalies covered by the eight outlier data points being considered here are
the Hanging Wall, Timaru and Marlborough Anomalies. These data points are shown with a
black circle around the brown markers in Figure 5.10, with the most significant of these being
Port Lyttelton (2 sites), Cashmere (2 sites), plus one site each for McQueen’s Valley, Timaru,
Wairau Valley and Molesworth for which the AVD seismograph plots are found in the
Appendix to this Chapter. These are the eight anomalies noted above which also show
significant geological features that appear to explain their anomaly.
McQueen’s Valley and to a lesser extent Port Lyttelton are the midst of Banks
Peninsular and its extinct volcanoes that erupted over the past six to 12 million years.
They are therefore to the south and east of the new Port Hills Fault that was
recognised in this event. It is described as being a data point in the hanging wall zone
of the event fault. The other 4 data points in this zone (although much closer to the
epicentre) showed the same behaviour of PGA and Specific Surface Energy. Hanging
Wall sites had significant damage the evidence suggests it was less than the damage at
equidistant on the footwall side of the fault.
Timaru sits atop a dolerite shield that erupted from the now extinct Mt Horrible volcano
some 2.5 million years ago (Gair 1959, 1961). The shield lies above the alluvial
gravels of the Canterbury plains.
Wairau Valley and Molesworth sit amidst the massive parallel fault system of the
Marlborough transition zone between the Pacific oceanic subduction trench and the
Alpine Fault. These sites are on the northern side of the multiple faults that ruptured
along a 200km section Pacific-Australian plate boundaries during the Kaikoura
earthquake sequence that began on 14 November 2016 with a M7.8 event near
Culverden in North Canterbury.
The specific surface energy (SSE) has units of a specific energy reported in MJ/t of surface
was calculated for all seven geomorphic zones and the results shown in Figure 5.10. This
plot showed a number of useful differences and anomalies being:
The SSE CoD (R2) was further (above) than for PGA even with the anomalies included
The hanging wall zone SSE values were much further (below) the trend line than for
PGA as shown by the five circled points in Figure 5.10 (same 5 points as Figure 5.12)

173
The Timaru (TRCS) data point circled (2.17, 1.52) has anomalously high specific
surface energy for its epicentral distance being a full order of magnitude above the
trend line. This is confirmed on the seismogram (see Chapter Appendix –
seismogram (2) on page 195) with an exceptionally extended duration of shaking and
is apparent in seismograms of other events. The specific surface energy at Timaru 147
km from the epicentre is similar to Rakaia just 56 km from the epicentre and four
times greater than nearby Peel Forest.
Although the Timaru district event damage is relatively low compared to Christchurch
there was widespread minor damage to URM structures such as house foundations
and walls, as well as serious damage to larger URM walls in structures such as
churches and industrial buildings, which suffered, significant out of plane (OOP)
damage. This cumulative minor damage exceeded that of surrounding areas.
The two lowest specific surface energy points (circled) correspond to Molesworth
Station (MOLS) and Wairau Valley Farm (WVFS). This is peculiar because these
two seismograph locations are the only two locations in the middle of the
Marlborough fault transition zone where four major faults (the Wairau, Awatere,
Clarence, and Hope faults) breakaway from the northern end of the Alpine Fault strike
slip zone and transition to the south western Pacific subduction zone.
5.5 The Lyttelton Hanging Wall Anomaly – Spatial Attenuation
The second important factor after the topographical similarities in montane seismic rock fall
situations is the usefulness of measuring attenuation of the forces and energy that accompany
seismic events. Attenuation will be both temporal and spatial meaning, the intensity may
reduce with time, and also with distance and direction from the epicentre. It is noted that the
epicentres for Events II and III were under the north-western edge of an extended area (Banks
Peninsula) of about 1150 square km of terrain that is topographically a montane environment.
This area is characterised by high ridges and steep slopes as shown in Vignette (end of this
chapter) Figures 5.15 – 17, and the map in Figure 5.11.
The map in Figure 5.11, courtesy of GNS Science (Hancox 2011), shows that the boundaries
of the rock fall and landslide zone were quite compact, with almost all rock falls occurring
within 5 km of the epicentre. In the Christchurch sequence liquefaction and significant
shaking damage affected towns and buildings up to 150 km away, for example in towns such

174
as Temuka and Timaru. This gives an indication that while the localised ground acceleration
behaviour as a measure of impact force was a major parameter in the causes of the rock falls,
the shaking attenuated to below rock fall initiation thresholds in quite short distances.
Figure 5.11: Christchurch Event II land & rock fall map (GNS Science: Hancox 2011)
Figures 5.8 and 5.9, to be explored in detail later, compare the attenuation of PGA and
Specific Surface Energy across the seismogram database and specifically that these
parameters for the five seismograph locations sit well below the general data population lines
for attenuation of PGA and specific surface energy. Figure 5.11 presents a plot of these five
points representing the five seismograph stations on the hanging wall side of the reverse
thrust rupture in Event II as in Table 5.5. All other GNS Science seismograph locations were
on the footwall side of this fault.
The rapid attenuation zone of the risk of rock fall shown in Figure 5.11 is an indicator that the
peak ground acceleration (PGA) also attenuates quite rapidly from the epicenter and that it
rapidly fell below the threshold force able to dislodge large boulders within a 5 km radius of
the epicentre of Event II.

175
Table 5.5: Lyttelton Hanging Wall Block seismograph locations for Event II
In its fundamental form, the attenuation relation for seismic strong motion parameters such as
PGA for a particular event can be described quite comprehensively by the standard energy
attenuation expression for energy in an absorptive media such as sound in air or water as
expressed in Equation 5.8:
log Y = − a log De + b (5.8)
where: Y is the main motion parameter (PGA), De is a measure of source-to-location
distance, and a, b the event parameters being the attenuation factor and the theoretical PGA at
the source. This model is a very basic model and based on normal attenuation physics.
Studies of shaking attenuation have been conducted over the active magnitude range under
consideration in a number of other locations say typically M2 to M8. Since the 1970s, peak
ground motion attenuation equations have attempted to be complete and have been
represented by generalised logarithmic equations e.g. Campbell 2003 (cited in Graizer 2007):
lnY = c1 + c2M – c3 lnDe- c4r + c5F + c6S + ε (5.9)
and:
ln(Y) = ln[A(M,F)]–0.5ln[(1-R/Ro)2 +4Do
2R/Ro–
0.5ln[(1-√(R/R1)2+4D1
2-√(R/R1)]+blnVS30/VA+ σ (5.10)
These relations bring together a wide range of event and situational parameters that have been
evaluated by Graizer (2007) demonstrating a modest level of fit between the relation and the
measured data. On the other hand, real locational situations also display complex
topographical and event criteria that is difficult to model with certainty.
GNS Science
Site Code Seismograph Location
Epicentral
Distance
HVSC Heathcote Valley Primary School 2.4
LPOC Lyttelton Port Oil Wharf 4.2
CMHS Christchurch Cashmere High School 4.7
LPCC Lyttelton Port Company 4.8
MQZ McQueen's Valley 14.3

176
The Graizer parameters in Equations 5.9 and 5.10 above incorporate magnitude, PGA
direction (vertical or horizontal), fault characteristics (slip, depth etc.) and local geology and
geography (plate type, topography etc.) that can be represented by the event constants a and
b. Generally however the PGA has been the horizontal PGA which as introduced above is but
one of four measures in common use and as shown is probably not the best measure of a three
dimensional phenomena. This type of fundamental relation follows the same general
principles as other logarithmic patterns of energy attenuation in an absorbent media such as
with sound in air or liquids. They are normally reported with the coefficient, a, being a
variable function, perhaps due to the non-homogeneity of the absorbent media. The
homogeneity factors include such phenomena of reflection from surface boundaries,
reflection and refraction from other faults, and other variable absorption behaviours found
across media changes. Incidentally, for different seismograms the horizontal PGA values may
not be on true compass axes, however being horizontally at right angles is the only criteria for
orthogonal analyses that are used together in a three dimensional vector sum.
The study will now determine the appropriate attenuation relation from which the strong
motion parameter at the rock-fall zone in Figure 5.11 graphs with some degree of accuracy to
enable reasonable prediction of rock fall risk based on magnitude, epicentral distance and
geomorphological topography of the region.
The analysis will continue to examine the strong motion parameters associated with Event II
in the Christchurch sequence. The reasons for choosing this event are several including:
Event I was some distance away at Darfield (Greendale Fault) (approximately 30km)
from the Port Hills and caused only minor levels of rock fall,
Many new seismographs were installed after Event I to capture aftershock activity and
therefore Event II is an extremely well documented event,
Event II along the Port Hills Fault was a reverse or thrust (with slip strike) event with
only five seismographs on the hanging wall (Banks Peninsula) block of the fault,
The epicentre for Event III is close to that for Event II and of the same magnitude
therefore many of the incipient rock fall boulders may have already fallen.
This analysis provides field measures of rock fall risk that is extinguished in an average 6 km
from the epicentre. A plot of the measured PGA and the calculated specific surface energy for

177
the hanging wall zone side of the Port Hills fault is plotted in Figure 5.12. The McQueen’s
Valley seismograph is at the lower edge of the GNS Science map in Figure 5.11.
All other hanging wall seismograph locations are inside the rock fall hazard zone of Figure
5.12 giving a PGA and surface energy thresholds and the corresponding attenuation
relationships that are shown in Table 5.5, with two (HVSC, CMHS) being on the northern
side of Banks Peninsula and three (LPOC, LPCC, MQZ) being amid the Lyttelton Cone.
Figure 5.12 Hanging Wall Stations Seismic Response with epicentral distance (by Author)
Importantly the log-log attenuation factor for the 3D vector sum is -1.33 being almost
identical to the generalised attenuation factor for the whole record for Event II as is seen
earlier. From these models with a rock fall threshold distance of less than 6 km, it is seen that
this corresponds to an approximate 3DVsum PGA of 0.07g or in light of the limited data
available is typically between 0.05g and 0.10g. In the empirical model shown in Figure 5.11
and Table 5.7, the main Rapaki boulder at 2.5 km from the epicentre was exposed to a
calculated shaking level with a PGA of 5,000 mm/sec2 or approximately 0.5g.
As seen in Figure 5.7 there are many similar large rocks and boulders that could be shaken
free from the Rapaki Tor and indeed many were. Therefore, depending on the accumulated

178
weathering, the boulder connection to the rock wall, the level of support from surrounding
boulders, and the direction of shaking, many large boulders may break free during an event.
Table 5.6: PGA and Specific Surface Energy Attenuation relationships
Y
log(Y) = a*log(de)+b
a
Attenuation
Factor
b
Intersect log(y) @
de=1km
R2
CoD to trend-line
Vsum(PGA3D) -1.331 4.8825 0.8696
Surface Energy
(SSE) -2.3091 4.765 0.7887
This measure is clearly a lower limit measure of when the most vulnerable large boulders
become dangerous. In summary it has been suggested that (Massey 2012a):
The threshold PGA for a large boulder to break free form a ridge top rock-wall or tor is
approximately 0.05 to 0.10g or 50-100mm/sec2.
A large event will release many boulders and cliff face collapses. Uncompleted
collapses may be a result of weakened ground structure to be initiated by a smaller
aftershock and it may be some time before weathering processes brings new boulders
into the rock fall vulnerability range.
The similar topography between the Port Hills and the Snowy Mountain region ridges
suggests the rock-fall thresholds will be similar.
The specific surface energy toward rock walls intuitively has limited effect on damage since
the shaking release of a boulder is likely to be more rolling force related of a single peak
force causing a fracture of a brittle connection between the boulder and its parent rock. The
surface energy approach is more likely to be of interest in the built environment where
damage is probably more related to energy input over a number of shaking cycles.
The analysis will next examine this aspect in more detail by looking at the wider attenuation
from the epicentre cross the Canterbury region since significant built environment damage
was reported in towns and centres as far away as Timaru 147 km from the epicentre. The five
seismograph stations on Banks Peninsula being in the Lyttelton Hanging Wall zone of the
subterranean fault show an average 81% lower specific surface energy than nearby stations
on the northern side of the fault such as in the Bexley zone.

179
Table 5.7: Variance from Trend for Specific Surface Energy Anomalies
Seismogram ID Epi-central
Distance km
Actual SSE
MJ/t
Trend SSE
MJ/t
% Actual /
Trend
LPOC (1) 4.2 1,500 13,620 11.0%
LPCC (1) 4.8 3,520 9,890 35.6%
HVSC (1) 2.4 3,160 48,900 6.5%
CMHS (1) 4.7 2,720 10,430 26.0%
MQZ (1) 14.3 120 770 15.8%
Average Hanging Wall
Zone (1) 6.0 2,200 16,720 19.0%
TRCS (2) (Timaru) 147 33 3.5 930%
MOLS (3) 172 0.2 2.44 8.2%
WVFS (3) 225 0.2 1.36 14.7%
Average Marlborough
Transition Zone (3) 198 0.20 1.90 11.5%
No obvious geological explanation is available for this reasonably consistent anomaly from
the trend line other than all five points fall within the specific montane zone description.
These points are the five black ringed brown points on Figure 5.10 below the trend close to
the epicentre. Three points are amongst Banks Peninsula at Lyttelton and McQueen’s Valley
and the other two points are directly above this hidden fault and essentially on the hanging
wall side but share some alluvial geomorphology with the rest of Christchurch.
5.6 The Marlborough Transition Zone Anomaly
The two Marlborough transition zone points are approximately 90% below the trend, but are
some 200 km from the epicentre. This zone is not studied in depth because of the complexity
of the Marlborough transition from the eastern subduction zone running from Tonga to
Kaikoura and the western subduction zone south of New Zealand (Puysegur Trench) and the
lack of built environment in this zone that could suffer material consequences. This zone is a
complex section of the Australian and Pacific tectonic boundary. The Marlborough Anomaly
identified in this study by model outliers shows much lower specific surface energy than in
the Pacific Plate seismograph locations, and lower than locations west of the transition zone.

180
The Specific Surface Energy at the Marlborough Anomaly locations is approximately one
tenth of locations a similar distance from the epicentre in the West Coast and Alpine Fault
Zone and also in the Waitaki Valley to the south of Timaru, indicating significant seismic
energy absorption through this zone.
It is hypothesised that the specific surface energy to these points, which lie amongst the large
parallel Waimea, Wairau, Awatere, Clarence, and Hope / Kerekengu, complex fault zones,
suggests that significant energy is absorbed and/or reflected away by these faults. It is also
clear however that the Alpine Fault itself does not show the same energy absorbing or
attenuation effects as the Marlborough Faults. No further study on this anomaly will be
undertaken here due the apparent complexity of the causes, however the anomaly detected
might benefit from further research and be better understood in a wider application of the
Specific Surface Energy method of attenuation measurement.
5.7 The Timaru Anomaly
Of special note and interest to this study is the Timaru anomaly which although only one
seismic station appears to be a reliable point securely atop a dolerite ridge in the centre of the
Mt Horrible lava shield. This point shown in Figure 5.10 as the only significant ringed data
point above the trend line shows an specific surface energy that is 9.3 times (almost a full
order of magnitude) above the South Island trend line.
The Timaru anomaly is a remarkable seismic response anomaly that appears to enable
continuous seismic shaking in Timaru at moderate amplitudes for much greater duration
following an earthquake than would be expected based on the temporal and spatial
attenuation relationships derived in this project. Some locations exhibit a form of extended
shaking but this is often discontinuous and related to the reflection of a strong seismic wave
or an extended pathway by which a body wave is diffracted through the variable earth mantle
as noted in Figure 5.2. The consequence of this anomaly appears to have been a greater level
of built environment damage from the Christchurch sequence than would have been normally
expected at this epicentral distance.
Only one note of caution arises because there was only one GNS Science seismograph
installed in Timaru, primarily because Timaru being a small city has historically been
considered not to be a significant zone of seismic interest. The city (in the 1880s) once
attracted an international focus on its unusual geological features when the basaltic lava flows

181
from the last in the series of intra-plate volcanoes along the east coast of the South Island, Mt
Horrible erupted during the early Pleistocene and is possibly the youngest volcano in the
South Island. This was followed by loess deposition from the quaternary glaciation on and in
(e.g. filling the lava tubes) the dolerite formations. The study of these loess formations by
von Haast (1879) and Hardcastle (1889, 1890), saw the first international recognition of the
effect of climate change on glacial loess formations.
Notwithstanding that the more comprehensive strong motion parameter developed in this
work, the three dimensional vector sum, gives a consistently higher reading than the
traditional geometric mean, the resulting motion parameters as measured at the Timaru
Roncalli College seismograph site gave significantly much higher values than the remote
attenuation relation for Timaru at 147 km from the Event II epicentre. The log-log motion
parameter / epicentral distance plots presented a strong correlation but with blocks or
readings in swarms either just above or just below the trend lines. This applied for both the
PGA and surface energy motion parameters and in general the Coefficient of Determination
(CoD) or (R2) for each of the trend lines was between 0.88 and 0.92 as seen in Table 5.4.
Notably the specific surface energy trend line, a new measure of specific surface energy from
the epicentre that enables a strong model for the attenuation of energy from the epicentre was
found to have a stronger CoD across the whole data set.
One GNS Science seismogram location in Timaru being at Roncalli College (GNS Science:
TRCS) near the centre of Timaru and amongst the Timaru Downs dolerite shield stands out
as exceptional with all motion parameters significantly above the trend line. The new surface
energy motion parameter is nearly one full order of magnitude (9.3 times greater) at Timaru
than the attenuation equation would forecast above as is seen in Table 5.7. This is the only
significant matter on the plots showing such a significant deviation and is worthy of further
investigation. The PGA and amplitude plots are above the trend line to an extent similar to
other variations that might be explained by localised geological formations.
An examination of the full seismogram (Chapter Appendix (2)) for Event II shows generally
that the shaking duration expanded with epicentral distance but it shows that quite
remarkably the shaking at TRCS continued for 150 seconds being nearly a full minute longer
than the shaking at other regional locations a like distance from the Christchurch epicentre.
It is important to note that while there was only one seismograph in Timaru, the seismograms
for Event I on 4 September 2010 (shaking duration 150+ seconds), Event III (not recorded)

182
and Event IV on 23 December 2011 (shaking duration >>70+ seconds) show this was a
shared observation across two other events for which TRCS seismograms exist.
Whilst the ground acceleration attenuated with the extended time of shaking, the shaking
amplitude in all three orthogonal directions remained at quite a high level for the extended
duration of 150 seconds giving the outlier value for the seismic specific surface energy.
An examination of the Timaru geological records finds that the Timaru Downs is a series of
basaltic rolling ridges rising to 300m and flowing from the ancient volcano of Mt Horrible
some 15km inland from the present coastline. It was the subject of intense geological scrutiny
for over 125 years because of its many peculiar characteristics (Goodall 1886, Hardcastle
1889, 1890, Forbes 1890, Raeside 1964, Gair 1959, 1961, Smalley & Fagg 2014).
Generally, the Canterbury Plains on the east coast of the South Island are formed from glacial
gravels eroded from the mountains of the NZ Alpine Fault starting during the Pliocene and
then mixed and interlaced with significant amounts of sub-aerial loess throughout the
quaternary periods of extensive glaciation in the westerly mountain zones.
Table 5.8: Attenuation Relations and Extent of the Timaru Anomaly
Motion Parameter a b de log(Y) YTL Y@TRCS TRCS/YTL
Vsum(PGA3D) -1.35 5.08 147 2.15 143 363 2.55
Max(PGA3D) -1.36 4.94 147 1.99 98 278 2.83
Vsum(PGA2H) -1.28 4.89 147 2.12 131 347 2.66
Geomean(PGA2H) -1.28 4.73 147 1.96 90 240 2.66
Specific Surface
Energy (MJ/t) -2.34 5.6 147 0.53 3.4 33 9.77
Symbols & Key: Vsum = vector sum, Geomean = geometric mean, PGA = peak ground
acceleration, 3D = 3 orthogonal axes, 2H = 2 horizontal orthogonal axes, de = epicentral
distance, Y = motion parameter, TL = MS Excel trend-line, TRCS = Timaru Roncalli College
Seismograph site, Canterbury average gravitational acceleration, g = 9,807 mm/sec2,
As shown in Figure 5.13, an 1886 railway cutting uncovered that the Mt Horrible basaltic
lava flows identified as dolerite overlaid these gravels progressively building up the Timaru
Downs while the continuing distribution of eroded gravels from the major glacial rivers
Waitaki, Rangitata, Rakaia, and Waimakariri continued to push the plains eastward.

183
The top soils of the plains and the difficult fragipans of loess continued to be deposited from
the sub-aerial loess (Von Haast, 1879, Hardcastle 1890). It appears that with Timaru, being
the only locality with a lava shield “over” gravel in the region, gives the weak horizontal
shear strength of the non-cohesive pebble and sand gravels. This enables Timaru on its thin
dolerite shield to rock back and forth for a greater duration with limited dampening and is so
able to cumulatively transfer greater specific surface energy to the built environment than
other nearby locations with more cohesive (and energy absorbing) clay and loess soils.
Figure 5.13: Timaru Downs (Mt Horrible Lava Shield) section showing Loess over
Dolerite over Canterbury Gravels (Goodall 1886)
The Timaru Downs Lava (Dolerite) Shield
It is further conjectured that the relatively low initial PGA values did not cause high impact
forces on the built environment as seen in locations with high PGA values. The USGS
hazard maps noting the relatively low PGA suggest Timaru is a low hazard area. The
extended duration of high amplitude low frequency shaking, risks causing higher levels of
damage to URM buildings, especially those with weak mortar or with corroded brick ties as
is commonly found in the many heritage buildings in this coastal region. The level of
damage to Timaru buildings, particularly the more vulnerable open structures was relatively
high, as was the damage to a number of URM buildings such as warehouses and churches.
This damage was consistent with long period low frequency shaking where weak inter-
masonry joints (brick or cut stone) abraded to the point where the structure relied primarily
on gravitational weight forces, rather than cohesion of the mortar, and eventually fractured.
Examples are: (i) building corners (e.g. St Pauls Church), (ii) OOP walls (brick original bus
depot), or (iii) unreinforced features such as gable end stonework and towers (St Mary’s
Church). It is recognised that this explanation contains a degree of qualitative reasoning but
the explanation for this seismic response anomaly is consistent with geotechnical principles
applied to an unusual geological structure in an active seismic zone.

184
The corollary of this observation is that the level of shaking and damage causing the specific
surface energy experienced by Timaru is equivalent to a town just 56km (such as Rakaia)
from the epicentre rather than the actual 147km. Timaru is also located 150 km from a long
section of the Alpine Fault to the north-west, but while the PGA forces may be manageable,
the total energy caused by the long duration of seismic shaking could be comparable to that
expected from the greater amplitude but shorter duration. This describes the risks to the
Aoraki Mt Cook village, which is widely considered to be in a high-risk area, being just 40
km from the Alpine Fault.
For now, it can be concluded that:
The Timaru GNS Science seismograph (GNS Science: TRCS) has raised the
suggestion of a serious adverse anomaly in built environment foundation material,
The anomalous behaviours potentially arise from the relatively recent (early
Pleistocene – ±2 Mya) lava-shield over non-cohesive gravel structures,
The surface energy approach (seismic intensity) to seismic event impacts on distant
built environments gives new information on the combined event effects of PGA and
shaking duration,
If the anomaly is persistent, Timaru is much more exposed to serious shaking
damage from an Alpine Fault event than previously thought.
5.8 A Proposed Correlation between MMI and SSE
The damage, distance and intensity relationship for Event II is shown in Table 5.9 where
MMI represents the Modified Mercalli Intensity of damage descriptions, and the calculated
(trend line) specific surface energy (SSE) value is shown for correlation purposes.
This shows the distance effects for damage of various categories in the 22 February
Christchurch event. In the light of these specific comparisons around trends and anomalies,
the comparison of MMI reports from Goded et. al., (2012) in Figure 5.4 and the SSE
attenuation trends in Figure 5.10 indicates we can map the MMI scale to the specific surface
energy (SSE) scale. This means that the qualitative scale of gradable adjectives in MMI is
also a measure of damage energy intensity at a particular location remote from the epicentre.

185
Table 5.9: Limits of new energy intensive damage types in ChCh Event II- 22 Feb 2011
Type of damage recorded / observed Epicentral
distance MMI
SSE
(Act)
+ / -
Trend
SSE
(Trend)
Port Hills (hanging wall) LPCC 4 km IX 3500 - 9800
Bexley Step-cracking in walls, HPSC 7 km VIII 2984 + 750
General liquefaction sediments, KPOC 22km VII 770 + 280
URM civic buildings damaged, ADCS 83 km V 32 + 13
URM wall OOP damage, TRCS 150 km VI 33 + 3.5
Buildings shake MOLS, WVFS 200 km IV 0.2 - 1.9
Of particular note is that in the Figure 5.4 MMI plot, there were higher than equidistant MMI
reports in Timaru and lower than equidistant MMI reports in Central Marlborough and on
Banks Peninsula. This corresponds to the SSE anomalies identified in this study and form
supporting evidence that SSE and MMI provides comparable measures of energy intensity.
There is not sufficient quality data available to provide a robust mapping and transformation
model, but a preliminary comparison of qualitative intensity (MMI) value and quantitative
surface energy (SSE) is shown in Table 5.10 below and this maps to Equation 5.11.
Table 5.10: Preliminary comparison of a relationship between MMI and SSE
Abbreviated MMI Description MMI SSE (MJ/t)
General failure of buildings X 10,000
High damage rates to buildings IX 5,000
High anxiety in population VIII 2,000
Difficult to stand, people alarmed VII 750
Falling and light structural damage VI 200
Shaking and falling damage V 50
Light shaking and vibration IV 1 - 10
The table data columns therefore map to a draft intensity-energy formula transformation:
MMI = 2 log (SSE) + 1.6 (with R2 = 0.98) Eq. 5.11
5.9 Seismic Shaking - Temporal Attenuation
The phenomenon of temporal attenuation is essentially one of the rate of energy absorption.
Seismic energy is generally transmitted long distances by body wave systems as shown in

186
Figure 5.2 above and with surface waves giving a complex mixture of diffracted, reflected
and absorbed waves. Ultimately, almost all wave energy will be attenuated by friction forces
in the transmission media and absorbed as heat.
Temporal attenuation appears not to have been well studied, but the 80 seismograms in this
study give an indication of the nature of this process. The duration of primary shaking as
determined from the pattern of relatively constant amplitude shaking for each of the 80 GNS
Science seismic stations in the study was recorded. It is plotted against the epicentral distance
in Figure 5.14. The only notable feature is the extreme outlier point for the Timaru
seismograph station where unusually high shaking for a long duration occurred.
The XLS trend line for this dataset has an almost horizontal slope (0.075), indicating apart
from the first 5km the shaking duration with epicentral distance showed no discernible trend.
The CoD (R2) for the trend line is 0.067 indicating no trend consistency for the dataset.
Further, the 80 seismograms showed quite varied amplitudes for each site and it was only the
combined parameter of specific surface energy that showed any form of epicentral
dependency, that being a very strong relationship. This indicates that the specific surface
energy has a strong epicentral distance relationship that presents itself as a mix of
acceleration, amplitude and duration that is also related to the local geomorphic formation.
Figure 5.14: A plot of seismogram locations and shaking duration vs epicentral distance
with the Timaru outlier (circled) – (generated by Author).

187
5.10 Transformation Modelling
This part of the study has examined a vast amount of data from Event II, 80 seismograms,
each generating a three orthogonal dimensional set of 16,400 displacement, velocity and
acceleration measurements, a total of some 4,000,000 data points generated in a 90 second
timeframe. A typical data record is shown in Figure 3.8 of Chapter 3 and is shown
graphically in Figure 5.8 (HVSC), and the appendix to this chapter. This event was one of
11,200 earthquakes (including aftershocks) that form the first two years of the Christchurch
sequence. Aftershocks (large and small) have continued, totalling approximately 20,375 in
the eight years from the Event I (4 September 2010) to the date of this thesis, with each shock
generating vast amounts of data.
This illustrates the basic premise of this thesis being that raw data must be consolidated and
transformed into useful information that highlights specific issues to assist decision makers in
the preparation, response and recovery of future seismic events. This covers matters such as
economically efficient insurance, building standards, population education, emergency
response preparations, alternative services and infrastructure re-establishment, reinstatement,
and learning lessons from the event. This chapter has used all of the seven archetypal
modelling approaches developed in Chapter Three, these being: (i) images (e.g.: graphs,
photos, and maps); (ii) scale models (computerised three dimensional LIDAR or radar
mapping of rock falls and cliff collapses); (iii) tables (raw and summarised data); (iv)
narrative (explanations); (v) formulae (to model likelihood and consequence frequency and
attenuation); (vi) data (raw seismograph outputs); and (vii) flow (image sequencing).
The energy intensity modelling has determined the attenuation of PGA and specific surface
energy (SSE) in Equations 5.6 and 5.7 relative to the distance from the epicentre. It shows
that the variability in the duration of shaking that does not form part of the PGA attenuation
model brings to attention the impact of extended shaking on the total energy transfer at the
destination. For the extended shaking environment of Timaru, and the reduced specific
surface energy destinations of Marlborough transition zone, and the hanging wall, Banks
Peninsula zone, significant differences were observed by the author.
This study has not correlated the actual damage with differences in damage between locations
since the built environment damage in Timaru is held in commercially confidential records of
insurance companies, however a number of large URM buildings such as churches and
historic warehouses suffered significant out of plane (OOP) damage and were subsequently

188
demolished. A much larger number of typical brick dwellings (built in the 1950s and 1960s)
with URM concrete circumferential foundation walls suffered extensive cracking, that did not
lead to collapse or demolition and some owners were given compensatory insurance payouts.
Many homeowners with light to moderate cracking chose not to make insurance claims since
disclosure requirements meant that having a registered earthquake claim could impact
adversely on property values. Most of these buildings were not repaired, and the largely
vertical cracking has enabled the foundation walls to carry vertical loads in normal daily use.
Some of this cracking was extended by the major 14 November 2016 Kaikoura Coast
earthquake sequence (a 200 km long sequence of events up to M7.8). The epicentre of the
Kaikoura sequence was some 275 km from Timaru and so the shaking amplitude was less
than the Christchurch sequence some 150 km from Timaru. The Kaikoura event is not a
subject of this study but illustrates the potential impact of the next Alpine Fault event.
The Alpine Fault is 150km from Timaru and generally produces great magnitude events
being sometimes greater than M8. A number of recent ground drill core studies along the
Alpine Fault found 27 major and great seismic events over the past 8000 year period
(Berryman et.al. 2012, Cochrane et.al. 2017). This has revealed a regular pattern of major and
great seismic events with a mean recurrence interval of 291 years and a standard deviation of
23 years. The last great event was in 1717, being 301 years prior to the date of this thesis. A
near-future major event is considered inevitable. One concern is the ability of the older
circumferential URM foundation walls to carry the specific surface energy from this much
larger and potentially closer event.
Application to ISO 31000:2009 model
The ISO 31000 model captures likelihood and consequence parameters for a particular
location or region. The transformation modelling approach developed in this study enables a
region wide review of seismic data gathered over a 500 km region to be tested for anomalies
that may highlight just a few locations with typically unusual geology that will lead to lower
or higher than trend specific surface energy transfers. The differences from trend may be as
much as an order of magnitude implying a material difference in impacts in the built
environment from major or great earthquakes, epicentred some 200 km from Timaru. This
difference is of sufficient magnitude to be reflected in consequence assessments using the
ISO 31000 risk assessment model.

189
5.11 Data Acknowledgements
The author gratefully acknowledges the GeoNet database and its sponsors the New Zealand
Earthquake Commission, GNS Science, and Land Information NZ for making Strong Motion
Recorder data from many sites around the Canterbury region available for use in this study.
Acknowledgement is also due to Geoscience Australia for its user-friendly searchable
earthquake event website that enables parametric studies of historical seismic events in
Australia.
5.12 Conclusions
This analysis strongly suggests that there is a calculable damage risk from earthquakes and
subsequent earthquake effect damage in montane regions such as New Zealand and the
Snowy Mountains region based on established models for (i) earthquake frequency –
magnitude relationships, (ii) seismic intensity distance profiles and (iii) earthquake shaking
attenuation relationships. These models validate the interpolation of rocky hillside behaviours
in the four major 2010-2011 earthquakes near Christchurch, New Zealand, but also provide a
potential qualitative / quantitative transformation relationship.
The earthquake sequence, with all main events being greater than magnitude 6, produced
different but comparable levels of rock fall hazard. This enables forecasting of hazard and
damage risks in the Snowy Mountains Region. This also takes account of the distinct
townships and their particular topographic situations. The correlation between MMI and
attenuated energy (SSE) in this study is specific to Event II and so clearly, a generalised
correlation will need to take account of any initial event magnitude and the surface
attenuation behaviour of the regional lithosphere.
The forecast likelihood of a magnitude 5 event within the Snowy Mountains region of some
35,000 sq. km is approximately 1.5% or a recurrence interval period of about 60 years. The
presence of seven towns and villages (Thredbo, Perisher, Guthega, Charlotte Pass, Cooma,
Talbingo and Jindabyne) covering a combined area that is exposed to rock falls of about 100
sq. km extends the likelihood by another 350 times to a recurrence interval of approximately
20,000 years. Nevertheless, the rock outcrops above the resorts and townships pose a surface
risk not only from earthquakes but also to other geohazard events that lead to rock falls such
as storms, all of which have a much greater frequency and shorter recurrence interval.

190
5.13 A Vignette
A Seismic Rock Fall Study - (a Potential Energy Release Study)
Event II (22 February 2011) at a relatively shallow focus of 5 km produced the most
casualties and damage of the Christchurch sequence mostly due to liquefaction initiated
building collapses on the sedimentary areas to the north and west of Banks Peninsula. There
was significant damage and four deaths arising from multiple of serious rock falls of the
nature shown in the photographs in this vignette illustrated in Figures 5.15, 5.16, and 5.17
(Hancox, 2011). The estimated total of falling large rocks (boulder rolls) is 4502 from Event
II (Massey et.al. 2012a).
This specific incident fortunately did not cause any casualties due to a resident leaving the
house out of curiosity for the seismic event exterior noise and vibrations, just seconds before
the boulder impact. This photograph series shows the typical rock fall behaviors on an un-
forested slope with a direct rock impact on a house on the lower slopes of Rapaki, a
prominent tor, just 2.5 kilometers from the epicenter of Event II.
This section will consider the impacts of energy events that occurred during this event. The
total energy release from the slip-strike displacement on the newly identified Port Hills fault
can be calculated from the Gutenberg-Richter energy release formula in its updated USGS
form for estimating the energy release E, in joules being:
log10E = 4.4 + M*1.5 (USGS Choy, 2012). 5.12
For the 22 February 2011 Event II with a magnitude of M6.3, there was an estimated energy
release of 70,000 GJ. This energy radiated from the earthquake focus (5 km deep) a direct
distance of 6 km before it reached the Rapaki Tor, and created a number of localised small
rock falls including the large boulder.
The photo-story shows how Event II dislodged a large oval boulder from an outcrop (Figure
5.15, point 1) that bounced violently approximately 600m down a 30° slope (point 2), was
airborne as it passed through a house (point 3) – yet below roof level (Figure 5.16), and then
rolled to rest on a road 60m downhill (Figure 5.17, point 4) of the house. The weathering and
jointing history of the boulder had left it with an ellipsoid shape, measured at 1.8 to 3.5
meters in its short and long diameters, and has been calculated in this study to have a mass of
approximately 18 tonnes, enabling it to roll and bounce freely as it gained speed down a steep
treeless slope.

191
Figure 5.15: 2011 Christchurch
Event II: The 500m path of a 2-
3m ellipsoid boulder originating
from an outcrop (tor) on Rapaki
(1), down a clear 30 degree slope
(2), air-borne through a house (3),
and coming to rest on a road (4).
Photo: Hancox, 2011
Figure 5.16: 2011 Christchurch
Event II: The approximate 20m
airborne trajectory of a 2-3m
ellipsoid boulder is evident from
the lawn gouge and then no
further ground contact until
other side of the house (3).
Photo: Hancox, 2011
Figure 5.17: 2011 Christchurch
Event II: House damage and
debris blowout (3) and boulder
resting beside the road (4).
Photo: Hancox, 2011

192
The photographic record, site measurements, and calculations below indicates that the rock
was airborne at an estimated speed of at least 85 km/hr, for approximately 20 meters, as it
entered the house through the up-hill wall. This is one of many examples where residences
were heavily impacted by large single rolling boulders of comparable size or larger (up to 50
tonnes) in this earthquake event with a number of boulders remaining within the body of the
building they impacted because of difficulty of removal.
Consistent with a theme of this study that energy release is the main quantifying variable for
impact damage an estimate of impact energy transfer from the boulder will be made here.
From the photographic evidence and measurements taken, it is possible to estimate the
boulder’s kinetic energy immediately prior to and after impact. The downhill speed has been
calculated from projectile mathematics, and probable maximum bouncing elevation on a 30
degree slope.
If we measure or estimate:
Last bounce distance (before house) = 20 metres (measured ± 10%)
Ellipsoid minor and major diameters = 1.8 and 3.5 (measured ±5%)
Mass of basalt boulder = 18 tonne (calculated ±10%)
Downhill speed = 85 km/hr = 25 m/sec (calculated ± 10%)
Rotation (50% slip/bounce) = 3 rev/sec (estimated ± 30%)
Then by calculation:
Linear kinetic energy = 6 MJ
Rotational kinetic energy = 3 MJ
Total kinetic energy = 9 MJ (estimated ± 20%)
Total boulder kinetic energy = 9 MJ / 18 tonne = 0.5 MJ/t
It appears that almost all of this kinetic energy (which is equivalent to the explosive energy of
2 kilograms of TNT) was dissipated in a highly impulsive (t < 1 second) house impact, with
the boulder then based on a photographed trail of grass damage exiting the house in a slow
roll towards its final resting place on the street below at point 4 in Figure 5.15.
The Rapaki Boulder has been subsequently set into the side of the streetscape where it landed
(point 4) and a memorial garden planted around it. This initial boulder roll event and

193
subsequent high energy impact was caused by a magnitude (Mw) 6.3 earthquake, which is
approximately equates to MMIX on the Modified Mercalli Scale at this location.
The manifestation of new localised energy illustrates the long distance transmission of energy
starts with a large energy event (70,000 GJ in this case at the focus) and generates localised
releases of potential energy, (9 MJ in this case) so that for 4500 similar rolling boulder totals
some 40 GJ of potential energy is released by the trigger event. A parallel study of rock face
collapse (Massey 2012b) estimates a total landslide volume of 95,000 m3 which equates to
210,000 tonnes. If it is assumed that the debris energy averages 0.5 MJ per tonne as before,
then a rock face energy release of 105 GJ can be estimated. This gives a total 145 GJ of rock
fall potential energy triggered and into this house by the earthquake event compared to a total
initial epicentral event energy release of 70,000 GJ being 0.2% of the total.
Rock falls are often directly associated with landslides in earthquake scale descriptions. In
montane environments where outcrops of weathered (and typically rounded) boulders are
vulnerable to moderate earthquakes atop a steep slope, the risks to people and property assets
from boulder roll quickly become very significant. The lessons from this rock fall and cliff
face collapse analysis are that the primary seismic event can trigger a significant release of
potential energy from both the built and natural environment that can lead to significant event
consequences.

194
Chapter Appendix: Seismograms from three anomaly stations in Event II - source GNS
(1) Lyttelton Hanging Wall Anomaly: Acceleration and displacement dissipate quickly

195
(2) Timaru Anomaly: Acceleration slowly dissipates while displacement is extended

196
(3) Marlborough Transition Zone Anomaly: Extended low acceleration and displacement

197
CHAPTER 6: NATURAL HAZARD BEHAVIOURS RESPONSE IN A MONTANE
ENVIRONMENT
This chapter is the third of the situational studies that contributes to building a new three
domain model for risk and hazard assessment beginning with a reminder of Figure 1.6. This
chapter is deliberately constrained by the theoretical framework discussions in Chapter 1, as
it is the intention to develop a robust dimensionless mathematical parameter that can be
applied as an extension to the current two domain expectation equation. It does not seek to
find a the best quantified behavioural techniques for natural hazard modelling as this has been
widely attempted unsuccessfully elsewhere, simply because the method can only be tested
over the long term life cycle of a hazard, disaster, and recovery which is well beyond the
scope of this project. Instead, we seek to find a robust mathematical method that will work
here. It is further constrained by the Chapter 2 literature background in quantitative
psychology and in particular the subject of psychometrics which over many years have
shown it is possible to forecast the likely behaviours of people from a defined demographic
by an examination of their knowledge and background attitudes.
The earlier two studies consider the traditional risk elements of likelihood and consequences
of a hazardous event occurrence in a physical environment. This chapter considers the role of
cognitive processes of stakeholders in a populated environment and how the cognitive
outcomes may affect behaviours and ultimately risk outcomes. It therefore does not examine
the wider behaviours of people and their communities in natural hazard and disaster events.
Research on risk perception began in the 1940s, when studies on human adjustments to
floods in the United States found that people’s past experience with floods directly influenced
their behavior when they were under threat from a possible flood. Kellens et.al. (2013)
provides an extensive literature review of this field especially for research on the human

198
dimension of risk mostly in well populated multi-hazard environments. This study seeks to
model how people might respond to remote montane risks they have not experienced but may
be aware of. The model will use an analysis of survey method options (as outlined in Chapter
2, p73-77) that can transform the qualitative continuum of psychological approaches to risk to
a semi-quantitative measure of risk that is typical of those used in ISO 31000 approaches.
The chapter reports on the development of a qualitative research method. The method must
be able to transform its results to a natural hazard research program that can produce
quantitative inputs for a deterministic, three domain risk assessment model.
6.1 Natural Hazard Systems and People Responses
The standard ISO 31000 approach to risk management represents event risk assessment and
management with the two key parameters: the likelihood of occurrence and the event
consequences, as discussed in Chapter 1. The expected risky outcome (the multiplication
product) of these two key parameters has been well described on qualitative or quantitative
scales (Stevens, 1946, Kellens et.al. 2013, Aven 2014 and 2016). The scales may be either an
ordinal scale such as: low, moderate, high, severe, critical, and catastrophic, or quantitative
scales ranging from say $1,000 for a small event to $1 billion for major disasters. Other
measurement scales may be selected as being more appropriate to the circumstances. In an
individual person’s wealth scale, the expected risky outcome range of low to catastrophic
may be $100 to $1 million, while for a substantial community the same ordinal scale may
give a ratio scale of $10,000 to $100 million. This chapter will also explore quantitative
scales for likelihood and consequences using a survey of individuals and communities.
The likelihood and the consequences are not fixed physical parameters that on their own lead
to a fixed risk. They are also behavioural (anthropologically influenced) and dynamic
(temporally influenced). This leads to recognition that risk outcomes over time are strongly
influenced by the behaviours of the human environment in which the risky hazards occur.
In this study, a new three-domain model of likelihood, consequences, and behaviour will be
developed recognising that likelihood and consequences alone will not adequately define the
risk assessment outcome in a developed environment. This inadequacy arises because both
the physical likelihood and consequences can be significantly influenced by behaviours of
individuals and communities, and in the reciprocal, those behaviours are influenced by both
likelihood and consequences. This complexity can be seen in major earthquakes where a low

199
likelihood of occurrence can mean there is either an event pending or a low natural temporal
and spatial risk. The build-up of earthquake potential with limited community awareness and
precautions will eventually result in much greater impacts and consequences. This dynamism
and feedback creates a significant challenge when modelling natural hazard system risk.
Natural hazard risks and events evoke a wide range of human responses from those affected
at both an individual person and a community level (Lara et.al. 2010, Kellens et.al. 2013). In
this context a community might be:
a place that is a residential community where people live nearby,
a workplace where people work together for a common purpose,
a community of interest where people join together for a common recreational
purpose such as sport or outdoor adventure, or
a professional community where like qualified professionals such as the insurance
sector, work to a common set of standards across a wide range of places.
Therefore, the physical principles of likelihood and consequences need to be generalised
across the many community forms and their member behaviours so that they can be readily
applied to the various risk management sectors. These sectors include insurance and financial
risk, workplace health and safety, environmental risk, recreational risk management, and
natural hazard event response by agencies and asset owners.
The individual and community responses to natural hazard events are in large part affected by
the magnitude of an event and in part by the capability to respond. This response paradigm
leads to an ongoing potential for behavioural influence on the event and especially on the
consequences. With these concepts in mind, this investigation seeks to develop a method for
understanding how individuals and communities assess and would likely respond to the risk
of occurrence and the risky consequences. The ISO 31000 international standard and its
supporting guidelines present a standard methodology for evaluating likelihood and
consequences of defined risky systems to derive models and standardised approaches on how
a person or a community should best respond to an identified system and the risk.
An example of recreational montane risk management is found in Bushwalking Victoria
(2001), the peak body for some 70 outdoor recreation clubs in Victoria who has published
expedition risk assessment guidelines using the ISO 31000 approach. This guide uses a
likelihood - consequence (L-C) risk assessment matrix as shown in Figure 6.1 below, being
similar to risk matrices used by many other communities and organisations.

200
Figure 6.1: The Bushwalking Australia (2011, p4) L-C risk assessment matrix
In Figure 6.1, the format and evaluation criteria are based on an entirely qualitative approach
to assessing the risk likelihood and risk consequences. In the absence of rigorous guidelines
and definition of terms, this qualitative approach introduces a new risk being that users of the
approach make decisions heavily influenced by their personal perceptions and experiences.
Within a sports community with common practices and language, qualitative standards might
produce risk assessment outcomes that meet that community’s needs. In a generalised system
however, such a situation leads to decisions on how to plan for an identified risk becoming
notably inconsistent. A serious unintended outcome from the use of qualitative analysis
occurs when this type of matrix is used in environmental impact reports to comply with
development regulations. There is a high chance that the likelihood and consequences of
adverse events will be inconsistent and at worst, deliberately misrepresented. A review by the
author of 12 mining applications submitted to the NSW Department of Planning according to
the environmental assessment process required under the NSW Environmental Planning and
Assessment Act 1979 shows inconsistent use of risk assessment processes in submissions and
at worst, avoidance of proper risk management responsibilities. This review showed the
following repeated examples of inconsistency in the assessments:
Defining the system (development) boundary to be too small, such as the worker
environment only, or the systems boundary of the active operations, or the physical
boundary fence of the organisation, rather than the wider area of influence or effects,
Identifying a wide range of hazards, but for some individual classes of hazards only
using a particular event that might happen rarely or with limited impact rather that a
balanced spectrum of event frequency and magnitudes,

201
Using deliberately soft language to describe a serious risk so as to potentially
minimise objector or media attention,
Not defining the time scale for the likelihood parameters so it is not clear if the event
frequency is once per month, per year, or per decade, and
At the other end of the scale is preparing a comprehensive assessment of every risk,
its likelihood and consequences together with risk responses that might affect the
location and wider region including transport routes for raw materials and products.
The latter example in this list includes “textbook” examples for every risk practitioner to act
and model on, but this then may be too overwhelming for a smaller development or for a
potential objector to understand. The review found inconsistencies are widely evident in
NSW development proposals. This gap has the potential to understate risk likelihoods and
consequences, leaving developers and their communities ill-prepared for a disaster event.
To overcome these inconsistencies some organisations now using the L-C matrix have moved
to apply quantitative criteria to the likelihood and consequence questions using a matrix of a
similar format but with quantitative measures. Figure 1.4 in the introduction presents such an
example of a composite qualitative and quantitative L-C matrix. This matrix also introduces
another important concept in behavioural studies that will be explored further here – the
concept of logarithmic perception. This concept is very important to quantitative risk
management but is applied inconsistently, as will be discussed below.
In the case of the (USA) Mine Health and Safety Administration (Grayson 2009), who
monitor mine safety through a citation (offence notice) and penalty system, the risk of an
adverse event is assessed in terms of likelihood and severity of citations for safety
misdemeanours. Such a system is essentially a “near miss” system on the basis that a citation
is generally for a safety misdemeanour that did not result in a significant safety event.
For an underground coal mining situation, Grayson considered how often a citation (offence)
notice to a particular financial value is likely to happen as is shown in Table 6.1 and shown
on a logarithmic scale. The citation and the penalty become proxies for safety with a high
frequency of minor citations or a lesser frequency being a proxy for the systemic safety
practices at a particular location. The Grayson survey of 31 out of 488 active underground
coal mines of varying sizes found that the mines that incurred the largest penalties also
incurred them most often and vice versa for smallest /lowest frequency mines. It is not clear

202
if this survey implies an enforcement bias towards the more serious offenders or larger mines
but it indicates that a (quasi) log-log analysis enables a quantitative risk analysis.
A conclusion (in Grayson 2009) from this risk management example in a very competitive
coal supply market, is that, minor safety breaches were considered common events, citations
were unavoidable and, whilst undesirable, were to be expected, and therefore monitoring
them merely gives a measure of compliance. When plotted in the L-C matrix, the outcome
ranges from low to high risk (of a citation and the value of penalties) and it becomes a proxy
measure for mine safety practices according to the mine’s compliance with safety regulations.
The analysis could imply that citations and penalties are an everyday operating expense to be
minimised against appropriate preventative measures, when convenient.
Table 6.1: The L-C scales for citation seriousness in the coal mines safety survey.
The likelihood of a safety compliance
citation (offence notice) being issued:
The consequence of safety compliance
failures (citation penalties) may be:
>1 per week (certain to occur in any week), <$250 (a very low cost),
<1 per week (likely to occur), <$2,500 (a low cost),
<0.5 per week (somewhat likely), <$25,000 (a moderate cost),
<0.1 per week (unlikely to occur), or <$62,500 (significant cost),or
<0.04 per week (very unlikely to occur) >$62,500 (a high cost of penalties)
It does not indicate that the citation – penalty system has changed long term behaviours to a
safer mining environment. Each risk assessment system uses its own situational language but
the similarities and principles between them are clear. Whilst the quantitative measures will
often be situation specific, they enable users to apply common values to concepts such as
likelihood, consequence, high risk and low risk.
The needs of both systems (bushwalking and coal mines) while extreme in their environment
(recreational vs hazardous industry; and ordinal vs ratio scales) are also clear, including:
(i) the need for specific and accurate language in the assessments, backed up by
quantitative analysis,
(ii) the need for a common set of risk assessment and response objectives between
the data input (policing) agency and the actioning agency (site operator), and
(iii) a mechanism for behavioural review of the risk elements and reporting.

203
6.2 Behavioural Influences
Montane Risk Awareness
The Australian Snowy Mountains Region (SMR) used in this study, covers an area of 37,500
square kilometres is shown in Figure 6.2 and includes the rural towns of Cooma, Jindabyne,
Thredbo, Tumut, and Tumbarumba, but excludes the cities of Canberra, Wagga Wagga, and
Albury. These rural towns, together with rural farms and villages, have a combined
permanent population of some 35,000 residents of whom about 50% are in active
employment (ABS 2012a) mostly in government or private infrastructure organisations. The
SMR also encompasses four alpine national parks being the Kosciuszko, Namadgi,
Brindabella and Burrowa - Pine Mountain National Parks. The region is bounded in the
north-east by Canberra and the south-west by the Victoria state border as in Figure 6.2.
Figure 6.2:
Location of the
Primary Study
Region in SE
Australia
The SMR towns provide the core workforce and population servicing the electricity, farming,
forestry, government, and visitor economy sectors. The two major towns of Cooma and
Tumut and smaller towns such as Adelong and Tumbarumba have a strong heritage built

204
environment reflecting their 1800’s mining and forestry origins. The towns have many
unreinforced masonry (URM) buildings, built in alluvial valleys that are vulnerable to
significant flash floods and moderate earthquake events. The newer towns of Jindabyne
(1960s) and Thredbo (1980s) have generally modern buildings on a granite group foundation.
Nevertheless, each town is still exposed to serious natural hazards, such as the 1997 Thredbo
landslide, which killed 18 people.
The residential population of the region generally has a very high awareness of the
infrastructure, communications and road networks, in part because the summer season is a
period of intense maintenance and development activity throughout the national parks and
resorts and in part, because the workforce is mostly local residents. Further local residents
and their families are also likely to participate in year round montane recreation. Alongside
the 35,000 residents are the 1.3 million visitors (DNSW 2013) to the region in a typical year
that puts the knowledge of response to a major natural hazard event in the hands of a small
percentage of the potentially affected people, just one local person per forty visitors in any
one year.
Of particular note in geohazard risk assessment and response planning programs is that
geological events such as earthquakes and landslides, unlike general meteorological events,
tend to occur without warning, reach a peak magnitude very quickly, with no inherent process
for prioritising responses during the event. Montane environments also tend to experience
much more volatile weather than general lowland or coastal environments with a higher risk
of unpredictable and rapid deterioration in conditions, resulting in a higher level of weather
related casualties. Compared to lowland storms and bushfires where typically 5-10 day
weather forecasts will give a reasonable warning of heightened risk, the montane events bring
a range of very serious immediate concerns to disaster management services.
6.3 Measuring Risk Awareness Behaviours
The Survey Method and Design
As introduced in Chapter 2 and above, the elements of risk are capable of numerical
assignment arising from detailed statistical analysis, but the stakeholder perceptions of risk
directly influence response decisions in risky environments. The numerical assignment can be
any of the four scales of measurement (nominal, ordinal, interval, or ratio) being core
concepts introduced by Prof. Stanley Stevens (1946) and still in active use. The use of the

205
ratio scale introduces powerful opportunities for mathematical analysis and modelling. Risk
perception is essentially a psychological criterion and with the ability to assign a number in a
greater than / less than scale, clearly an ordinal scale of measurement is achievable. To
develop a scale where the intervals are mathematically definable and where there might be an
absolute zero is challenging. Such a goal can be achieved by a dimensional analysis of the
variables under consideration. Although the principles of dimensional analysis have arisen in
the field of physics and other applied mathematics fields, the principles can be applied
equally to psychometrics (and psychophysics).
It has been demonstrated that stakeholders in natural hazard outcomes (MacDougall et.al.
2002) may undertake risky activities or ignore warnings, unaware of the actual likelihood or
consequences. Starr (1969) reported that people are willing to accept or take voluntary risks
(being those that are self-generated) some 1000 times greater than involuntary risks (those
created by others). For example, the actual relative accident risk of self-drive transport is
typically 1000 times greater than public transport such as air travel, yet stakeholder’s risk
acceptance in terms of willing participation in the two situations is similar (Steg 2003).
The USA Bureau of Transportation Statistics 2018 report (USBTS 2018) that based on
distance travelled, car occupants have a 1 in 654 chance of dying while travelling and aircraft
occupants have 1 in 9821 chance of dying. That means people apply much higher standards
of managed safety to public transport than to private transport at a similar ratio to the
voluntary / involuntary risk ratio. When personal recreation is involved (e.g. car rallying or
cycling, or snow sports) the personal risk acceptance increases further, as is explored in this
survey of risk perceptions of montane stakeholders in the Snowy Mountains Region.
This survey project is sympathetic to the ISO 31000 approach. This has led to the shape of
the survey and the individual questions to be those typically found in a formal group risk
assessment conversation. This leads the survey outcomes to being directly useful in
understanding how different groups relate to perceived risk and how a study can be
successfully designed and conducted to measure mixed risks (people and property risks).
A Montane Natural Hazard Psychometric Survey
In this natural hazard assessment survey, as well as the questions asked, the various factors
surrounding the survey structure will be evaluated. This part of the study also included
research into an effective method design as well as into the results themselves, especially

206
around a respondent’s abilities to assess likelihood and mixed consequences on logarithmic
scales. The timescale for events used in the survey is shown in Table 6.2 along with the
transform relationship between the event likelihood and the survey rating. The factors to be
tested in the context of other identified survey weaknesses include:
Can the Weber-Fechner power law model effective cognitive stimulus such as risk
rather than a physical stimulus such as pain and noise for respondent replies?
Can a single survey combine mixed parameters such as property damage and human
harm in a single consequence scale?
Can respondents without any formal training in risk management, other than a brief
written introduction in the survey, complete the survey form consistently?
Is the survey language appropriate to the nature of the respondents?
Is a self-assessment of risk awareness and response behaviour valid?
Are the self-determined survey categories for respondents by resident, employment or
visitor status appropriate?
The categories anticipate that employees of infrastructure organisations such as Local
Government, National Parks and Wildlife Service, Snow-sport resorts, Snowy Hydro or
similar large enterprises will are well trained in workplace health and safety (WHS) and will
be inclined to make more realistic risk assessments than visitors. It is unclear whether non-
employed residents will more closely align with employees or visitors, except where they are
long term residents (> 5 years) it is surmised as likely they will be familiar with montane
hazards and their responses will bias towards locally employed respondents.
Natural events, their progressive scale and responses are often described qualitatively by a
wide range of gradable adjectives in surveys (Kamoen, 2011), the media and various other
situations such as injury compensation reports (Actons, 2014). For this study a set of five has
been used (ref. Table 6.2), in part drawn from injury compensation usage (Actons, 2014), in
part from infrastructure safety policy (BITRE – Risbey 2009), and in part drawn from
common usage (Abbott, 2008).
This scale of gradable adjectives has been considered for their meaning in an Australian
context (Evans, 2009 and Macdougall et.al. 2002). The quantitative scales in this survey of
montane natural hazards are logarithmic (power) scales for both the event probability

207
(likelihood) and impact (consequences). These scales will be linearised by logarithmic
transforms as shown in Tables 6.2 and 6.3, and mathematical functions (Eq. 6.4, and Eq. 6.5).
Table 6.2: Transform of cumulative event likelihood to a logarithmic rating
Event Likelihood in Survey L(event per year) Survey (L) Rating
Almost never / Rarely <0.0001 1
Once or more per 1000 years 0.001 2
Once or more per 100 years 0.01 3
Once or more per 10 years 0.1 4
Once or more often per year 1 5
Note: this is the increasing rating order as used in the analysis
Natural hazard impacts may be both financial damage and / or a human impact. In developed
societies, human impacts are valued very highly and such valuations are normally
incorporated in infrastructure investment decisions through a structured valuation
methodology.
These decisions reflect community expectations for prioritising decisions for public
investment in infrastructure such as, where roadway improvements are based on an
investment, achieving a reduction in event consequences for users. Since this methodology
represents priorities for public spending, it becomes a useful and appropriate measure for the
value of human impacts from natural hazard events when designing disaster response
strategies. The valuation of levels of event damage to property and human assets has been
calculated for the Australian socio-economic environment by the Australian Bureau of
Infrastructure, Transport and Regional Economics (BITRE) in Risbey (2010).
These values have been inflation (CPI) adjusted to 2013 (last available report), and rounded
to provide the values used in this survey by the criteria as shown in Table 6.3. This
Australian public policy based approach considers valuations for injury, permanent
disabilities, and fatalities that can be used alongside calculated property damage of the same
valuation in a single survey.
In the questionnaire, the survey rating was transformed into an A to E scale to minimise
confusion between responses to the likelihood and consequences questions.

208
Table 6.3: Transform of property and human value impacts to a logarithmic rating
Event Consequences in Survey BITRE ≡ $ Survey (C) Rating
Minor damage or person injury < $5,000 1
Serious damage or person injury < $50,000 2
Major damage or person disability < $0.5 million 3
Extensive damage or one/two fatalities < $5.0 million 4
Catastrophic damage or multiple fatalities < $50 million 5
A further option is the choice of decimal (base 10) or Napierian logs (base e = 2.718) for the
actual scale. While most respondents will be able to estimate along a logarithmic scale it was
considered that the decimal steps might be too large. The survey results show that 5 of the 61
survey respondents manually inserted their own number (each for only one of the 32 answers)
meaning a confused assessment rate of 5 manual answers to 1952 questions or 0.2%.
The Napierian logarithm scale overcomes this risk by having smaller steps being about
halfway between the Decimal logarithms but then creates a larger and more complex scale for
respondents. The low failure (to choose) rate in the responses validates the survey structure
choice of decimal logarithms as a reasonable compromise between simplicity, and definition
in the answers.
The two decimal (base 10) logarithmic transform tables (6.2 and 6.3) are drawn from a ratio
scale that can be usefully presented as the Transformation Equations (6.1) and (6.2) for these
two parameters of likelihood (L) and Consequences (C) as:
(L) Rating = log (Likelihood) + log (100,000) (6.1)
and; (C) Rating = log (Consequences) – log (500) (6.2)
These logarithmic transform functions, just like the three above examples follow the simple
format; y = a.x + b and so are consistent with the Weber-Fechner power law and more
traditional measures such as time and distance that cover a wide range of values. This
enables the survey to test whether a cognitive response to an imagined future event such as
natural hazards can be measured using a power law as a valid psychometric measure.
Consequently, total risk is the expectation product of likelihood and event consequences
being where:
Risk = L(event) * C(consequences) (6.3)

209
and, log(Risk) = log (Likelihood) + log(Consequences) (6.4)
and, by substituting with Equations 6.1 and 6.2:
and: ∑ Rating = log (Likelihood) + log(Consequences) + 5.0 – 2.7 (6.5)
and: log (Risk) = ∑ Rating + 2.30 (6.6)
The logarithmic transform functions enable differences in responses between demographic
groups to be measured and then calculated by subtraction difference. The result is then
transformed back in to the arithmetic domain for evaluation.
6.4 Development of a Transformation Model for Risky System Behaviours
To develop useful outcomes from the survey analysis that is applicable to an ISO 31000
modelling situation requires that the survey data is transformed into a parameter that is
mathematically robust. The transform model assumes mathematical rules apply including
rational behaviour, reciprocity and qualitative reasoning. This requires the application of a
number of mathematical and semi-mathematical techniques.
Rational Behaviours
The concept of rational behaviours is essential to drawing a transformation modelling linkage
between cognitive processes of knowledge, and actions such as responding to stimuli. This
rational human behaviour occurs where “human decision agents are (i) expected to act
‘normatively’ and make rational decisions, and (ii) evaluate and assess according to
normative criteria and utilitarian expectations (Kusev 2017).
In this study, this means that if a sector of the population assesses the risky outcome as lower
than the population then they will take fewer steps to avoid it and a more hazardous situation
than Normal eventuates. Therefore, if the risk (L+C) for population sub-sector Si is less than
the population Po ((L+C)Si < (L+C)Po) then the Behaviour Ratio is greater than 1.0 (B(e) >
1.0). When applied as a third domain in the risk assessment equation, B(e) causes the
assessed risk to increase beyond the normal values for situation or for the general population.

210
Qualitative Reasoning Applied - Why B(e) for the Normal Population, P, is equal to 1.0
In this transformation model, and for normal circumstances, B(e) for P is 1.0. This is
reasoned as an originating value because the base line event likelihood and event
consequences as drawn from the community at large already assume a normal environment
behaviour for the population and physical environment.
Normal in this study is a position where the likelihood of an event that is unaffected by
anthropological behaviours such as an earthquake or large scale weather patterns in non-
human physical environments. It means in human environments, the behaviours of the wider
population behaving in a rational informed manner. Normal typically includes the built
environment being constructed in line with prevailing building standards of the time, or
informed evacuation, but excludes panic. Likewise, Normal in Chapter 4 means the
seismicity in the SMR, excluding identified anthropogenic RIS.
Reciprocity of Behaviour
As noted above, rational risk response behaviour is considered in this study to occur if an
individual or group perceives a risk to be greater than the normal population, and then they
take greater personal risk-averse measures in response, to reduce their risk. This study also
assumes that risky or risk averse decisions cause a person’s knowledge to the likelihood and
consequences of risk and natural hazards to match the decisions they may have made
subconsciously. There is no strong prior evidence for this in a montane situation however the
concept is consistent with flood risk behaviours discussed by Kellens et. al. (2013) above.
The survey has essentially measured a respondent’s knowledge to natural hazard risk and this
is assumed to parallel or model that person’s action when confronted with a risk and vice
versa. This is termed “reciprocity of behaviour”.
Arithmetic and Logarithmic Domains
This analysis uses both the logarithmic and arithmetic domains by using the advantages
observed earlier in this thesis for other parts of the study. This preamble to the survey results
assumes a mathematical literacy in these operators, and seeks to show which parts of the
analysis are completed in each of the logarithmic and arithmetic domains. In essence the data

211
gathering and results presentation are in the arithmetic domains while the data mixing and
consolidation is use the logarithmic domains.
Of absolute importance to the study is an assumption that the magnitude and time ranges for
natural hazard events are perceived by the human mind to best fit power law / logarithmic
thinking as in tables 6.1, 6.2 and 6.3 and the demonstration of the applicability of the Weber-
Fechner scales to this study environment.
It was recognised however, that explicit power law / logarithmic operators and scales may
introduce concerns for non-mathematical survey respondents. It was therefore decided to
disguise the underlying power law basis by transforming the question answer choices to a
simple scales of 1 to 5, and A to E, so that the real numbers are less visible and intimidating
to the non-numerically inclined respondent. The processing of the data then reversed this
transformation and mathematical consistency
Respondent Sectors
In the respondent population of 61 survey respondents, four sectors (with the number of
respondents) were initially identified: being the corporate (27), small business (6), individual
residents (4) and visitors (24). These numbers are smaller than ideal and so conclusions are
subsequently qualified, however this is a new method and approach and the numbers were
found to be adequate to test the methodology. The corporate includes large companies (such
as Snowy Hydro Ltd and snow sport resorts), Local Government Authorities (LGAs), and
State Government Agencies (e.g. police, parks, health, and schools), and small business are
mostly local trades, retail and hospitality businesses.
The small business and individual respondent numbers (i.e. non-employed residents) were
quite small and so by reasoning they were merged with corporate and visitors respectively to
be the business and individuals groups. The basis being that employed corporate and small
business respondents spent a significant part of each day considering the service, safety and
emergency needs of the region and their clients. In contrast the residents and visitors are
primarily accountable only for their own individual and family safety. Therefore in summary:
Bu, represents the employed corporate and small business respondents,
In, represents individuals being mostly visitors plus non-employed residents, and
Po, represents the total population of respondents,

212
Behaviour Ratio Trends
Further for the new behaviour ratio B(e) the trends are as logically or qualitatively
determined as follows:
B(e) trends greater than 1.0 for participants who are less averse to normal risk outcomes than
the full population of participants. These participants may disregard personal safety measures
that reduce the likelihood of an event, and reduce the consequences as measured by the costs
of event damage. At the extreme, a participant may even act in a criminally malicious manner
to exacerbate outcomes such as in times of high bushfire risk, arson increases.
B(e) is less than 1.0 when it is considered that risk or disaster event outcomes are higher than
normal, and so the participants behaviour is more risk averse than the normal population. In
this case participants may tend to take further risk precautions than average. These
inequalities are described in Table 6.5 below.
6.5 The Survey and Questionnaire Design
The approaches discussed above enable the questionnaire based survey with quantitative
measures that feed into an L-C matrix to be undertaken, and then to be interpreted using the
inverse transform. From this approach, the montane risk study outcomes will determine and
demonstrate whether or not there are systematic differences in the risk likelihood and
consequence perceptions between the two main demographic groups in the SMR population
(Po), being business (Bu), and individuals (In).
The design principles for the survey and the specific parameters for the transformations from
cognitive thinking processes to a Behaviour Ratio by a mathematically robust transformation
method were defined first. The transformation validity was not proven at this stage as it
required completing the survey and populating the method stages with survey data to achieve
confidence in the conceptual model. This process is shown stepwise in Table 6.4 and follows
showing the transformation of likelihood and consequences scales into structured
questionnaire responses that will enable a quantifiable behavioural ratio scale to be evolved.
This scale will be at mathematically consistent with the development of a three domain or
dimensional risk model.

213
Table 6.4: First Transform Table for Risk into Logarithmic Domain
1 2 3 4 5 6 7 8 9
Risk HO HO HO HS HS HS HS L + C
Low RI Yr/event Low $/event Low Low Low
Rarely <0.0001 1 Minor $5,000 A 1 2
1000 yr 0.001 2 Serious $50,000 B 2 4
100 yr 0.001 3 Major $0.5 M C 3 6
10 yr 0.1 4 Fatal (1-3) $5 M D 4 8
1 yr 1 5 Catastrophic $50 M+ E 5 10
High High High High High
Table Key:
Column 1: Direction of increasing risk used in this table
Column 2: Recurrence Interval expected years between events
Column 3: Inverse of Recurrence Interval (events per year)
Column 4: Answer scale used in survey for How Often (HO) (logarithmic)
Column 5: Graded adjective scale for event seriousness (HS)
Column 6: Equivalent $ value scale for event seriousness ex BITRE (HS)
Column 7: Answer scale used in survey for How Serious (HS) (logarithmic)
Column 8: Transform Scale for assessing risk seriousness (logarithmic)
Column 9: Maximum Risk Product - Equation 6.3 and 6.4 (logarithmic)
Where:
Risk, R = (HO = How Often) Likelihood x (HS = How Serious) Consequences = L + C,
and: L = log (Likelihood), C = log (Consequences);
HO = Recurrence Interval [=] years / event; and HS [=] $ / event
This is now able to transform the knowledge of a sub-unit of the population (to be called a
population sector) into a parameter which forecasts the expected behaviours of that sector
when exposed to a serious natural hazard.
The next step is to ensure that when it becomes the third domain of the risky product formula
it acts in a mathematically consistent and robust means to provide a better assessment. This
is found in Table 6.5, leading to the value of the Behaviour Ratio (being (L+C)Po / (L+C)Si )
for a Sector, i, relative to the total population.

214
Table 6.5: Second Transform Table for Sector Relative (Logarithmic) Risk
Assumptions
Population, Po has n Sectors, Si ; where ∑Si = Po (for i = 1 to n)
Event Risk Behaviour Ratio, B(e)Si = (L+C)Po / (L+C)Si
To find B(e)Si in the arithmetic domain: subtract (L+C)Po - (L+C)Si
in logarithmic domain, then find inverse logarithm of the difference.
If for sector, Si B(e)Si = 1.0, then Si risk appetite = Po appetite
Behaviour
Ratio Values
B(e) > 1.0 Will be less risk averse, people act more risky
B(e) = 1.0 Will be normally risk averse or risky
B(e) < 1.0 Will be more risk averse, people act less risky
The Survey Testing and Distribution
The questionnaire approach to the survey with supporting explanatory documents was chosen
over an interview to avoid risks of bias reaction to the interviewer(s) demographic as has
been reported by other studies (Freeman, 1976, and Hague, 2006). These studies show that
face to face interviews can be severely affected by the interviewer’s demographic status. For
example a survey interviewer who is a mature male is more likely to bias the respondent’s
mood to be acquiescent and competency oriented whereas interviewers with an obvious
disability are more likely to generate genuine sympathetic responses.
The paper questionnaire method was chosen over an online survey (such as Survey Monkey)
to assist managing the survey toward an evenly balanced (approximately 50/50%) mix
between employee and resident compared to visitor respondents. University of Canberra
Human Research Ethics Committee approval for the survey was granted, as was gaining the
permission of the proprietors of each public location to set up an information desk for the
distribution of questionnaires. This included setting up an information desk in the Jindabyne
town centre on a day when the ski fields were closed due to blizzard conditions. This
approach assisted with the coverage and response of recreational winter visitors by giving
them an activity for their down time on a day when montane safety was an issue.
The questionnaires were also handed out on an evening in the dining room of a major
recreational club to reach a wider range of visitors and locals. Other distribution locations for
the survey included Cooma, Tumbarumba and Tumut to ensure a wider coverage of the
region’s community and business stakeholders as well some summer recreation users. As part

215
of the distribution process, managers of all four Local Government Authorities, and the four
major ski resorts were asked to hand questionnaires to a mix of operational staff, but again
completion was, as for others, anonymous and voluntary. Since the survey was anonymous,
the response rates for the specific business organisations and locations were indeterminate,
however the timing of distribution generally matched the recorded postal receipt of responses
over the survey timeframe. This indicated that the response rates were reasonably consistent
across the region and respondent sectors to which surveys were distributed. A total of 144
questionnaires were distributed and 61 completed and returned which although small enabled
the method to be tested and preliminary trends to inform the model development.
The survey questions although qualitative and using everyday language, use highly structured
underlying meanings that simulate standard ISO 31000 risk assessment processes. Noting the
expectation that all questions would be answered, and the questions were of a consistent
nature, the Raosoft online sample size calculator (www.raosoft.com/samplesize.html) was
applied. This estimated an ideal sample size (68 respondents) to give less than 10% error in
the responses at 90% confidence limits.
A copy of the questionnaire package is included in the Appendix 1 to this Thesis. The event
frequency questions were asked in a recurrence interval format for ease of understanding, but
transformed to a likelihood basis for risk results analysis using the transform in Table 6.4.
The main survey is bounded by introductory and concluding questions. A few introductory
questions start the respondent thinking about safety in the montane environment from the
perspective of their type and length of involvement, and their personal attitude to risk, all
from a neutral perspective. The end of the survey includes demographic questions being age
bracket, career and education profile. The demographic questions are at the end of the survey
so as not to imply to respondents before they complete the survey, that they are important
pre-conditions for the answers.
The body of the survey considers the montane natural hazard risks that may be encountered at
any time in the Snowy Mountains according to the two main categories of geological risks
and meteorological risks. Geological risks includes earthquakes, and landslides (and rock
falls), while meteorological risks include storms (and floods), blizzards, and bushfires in each
category of remote areas, townships, or on roads.
A preliminary test study using four respondents personally known to the author was
conducted to reduce the risk of unusable responses. The four test study respondents were all

216
familiar with the winter sports in the SMR and included one professional, one trades
manager, and two fellow PhD students. Their comments were reviewed and only very minor
alterations to the introductory and concluding questions were required. This enabled the test
survey responses to be included with the main body of responses.
For each of the locations (remote areas, townships, and roads), respondents are firstly asked
to consider the likelihood of significant events occurring on a likelihood basis. Secondly,
respondents are asked to choose the most likely, from an escalating set (gradable adjectives)
of consequences involving human and/or property harm. They were structured to present
simple and clear choices to the respondent, and yet reduce the likelihood of careless answer
repetition by three underlying mechanisms, being:
The hazards were arranged to reduce respondent tendency towards pattern answers
in the various categories of natural hazard and to encourage discrete thinking for
each question and answer.
The likelihood question ratings were asked in reverse scale order (increased rating
= increased recurrence interval = decreased likelihood), whereas the consequence
question ratings were in increasing scale order (increased rating = increased
consequences).
The likelihood rating is answered on a numeric scale of 1 – 5 and the consequence
rating is answered on an alphabetic scale of A – E to minimise confusion.
As noted earlier, survey analysis was then carried out in natural order by reversing the
numerical scale responses so that a higher rating means both a greater perceived likelihood
and greater perceived impacts as described in Tables 6.2 and 6.3. The hazards were
considered in type categories of geological and meteorological hazards plus a third montane
hazard of motor vehicle driving. The potential negative consequence of structuring the
questionnaire in this form was that some potential respondents would still find the structure
and style of the questionnaire somewhat daunting and decide not to complete it, thus reducing
the response rate. Avoiding repetitive response patterns (Hague 2006) in a survey with a
common question style was considered important to ensure the validity of the outcomes, and
a reduced response rate risk was effectively a filter on the quality of respondent responses.
Nevertheless, the survey simulates some conditions in typical L-C matrix risk assessment
discussion and is partly a respondent self-selection process. It is considered that potential
respondents who have weak awareness or interest of risk and safety issues are considered less

217
likely to be decision makers in a business, community, or family group situation, and
therefore may be less likely to complete the survey.
A number of steps were used to encourage participation including a gift wrapped tea bag with
a gift note to take some time out, relax and complete the questionnaire. Personally handing
out all questionnaires reminded respondents there was a real person conducting the research,
rather than it being a remote impersonal or commercial study.
The Survey – Results
There were a total of 61 respondents from 144 questionnaires distributed and returned
between August 2013 and January 2014. All of these returned questionnaires were properly
completed or with just a few minor errors from which the respondent’s intentions could be
easily seen or confidently deduced. Therefore all returned questionnaires were used in the
statistical analysis.
The 42% return rate is considered reasonable in light of the relatively daunting nature of the
questions and structure in the survey, and that most of the recipients of the survey were either
on holiday and relaxing, or held busy jobs. The 54% of respondents from a business
(government, large business or SME) environment means that the distribution method has
achieved a reasonable sector balance between business managers and employees and
individual visitors and local residents to which surveys were distributed.
Apart from the raw results showing the means and standard errors three sets of comparative
results are listed in the result Tables 6.6, 6.8, and 6.9. The first of these is the Population /
Business Ratio which shows the difference in the mean scores of the structured organisation
and all respondents. This is produced so as to enquire whether there is a systematic
difference between these two groups of respondents which could be attributed to their
background awareness in montane safety and risk.
Attitude and Demographic Responses
Across the survey, many respondents reported a long term association with the region with
57.6% of the business group and 78.6% of the visitor-community group reporting a greater
than five year association with the region. Some people may have other career and travel
montane associations, and risk awareness from elsewhere in the world, but almost all

218
respondents were introduced to the survey by the author, and were estimated to be primarily
Australian residents. This unknown effect is not expected to change responses markedly.
The general attitude to safety produced the results shown in Table 6.6. This question was
expected to generate a bias towards acquiescent responses in light of a high level of general
media focus on home, road and personal safety contributing to Australia being a safety-aware
country. Whether people react to hazards with the strong safety conscious attitude they think
they have was not determined. The results showed quite clearly that respondents who work or
live in the region by a 2/3rd
to 1/3rd
majority consider safety to be important in everything
they do whereas about 2/3rd
of visitors took a reasonable amount of care but accepted that
things go wrong anyway. In other words, visitors were twice as likely to have a greater self-
declared risk appetite associated with being in a montane environment.
With 66.7% of the business group being in the 41-60 age bracket and 50.0% of the visitor-
community group being over 60 there is a pattern of a younger shorter term persons in the
business group, but a significant older group of visitors who are long-term repeat visitors to
the region.
The relatively low number of 41-60 year old visitor responses does not correspond with the
researcher’s assessment of surveys handed out and suggests that this age group was less
likely to complete the survey. There is no obvious explanation for this observation.
Table 6.6: General Attitudes to Risk amongst Montane Respondent Groups/Mix
Question Corporate SME Visitor Non-Work Res All
a (very careful) 16 = 59% 4 = 67% 9 = 38% 4 = 100% 33 = 54%
b (things happen) 7 = 26% 2 = 33% 12 = 50% 0 21 = 34%
c (not worried) 4 = 15% 0 2 = 8% 0 6 = 10%
d (whatever) 0 0 1 = 4% 0 1 = 2%
Total in sub-group 27 6 24 4 61
Respondent Mix Business = 33 persons Individuals = 28 persons Total = 61
The employment responses indicated 64% of the business group are in professional roles and
31% are in administration roles. 36% of the visitor-community group reported they are not
working, and this may include full time tertiary students, while 32% are in professional roles.
Three of the four non-working residents identified as students.

219
Both groups reported 93% holding tertiary (university or vocational) qualifications spread
evenly across commerce, science and technology and community service sectors which is
significantly higher than the broader Australian levels of 63% with tertiary qualifications.
This reflects the target audience for montane recreation and montane employees are generally
hold specific skills. It supports the expectation that respondents would be relatively
competent in completing this type of survey although it is not clear whether montane
residential and visitor groups are more likely to have tertiary education or those without these
qualifications chose not to complete the survey. Understanding these aspects of the
demographic mix in montane environments was not a major feature of the survey, so the
extent of potential demographic questions was deliberately compromised so as to focus
respondents on the body of questions associated with perceptions of natural hazard risk.
Geological Natural Hazard Perceptions
The geological natural hazard perceptions of both business and individual respondents are
shown in Table 6.7. These results show a consistent pattern of differences between the two
main respondent groups in the survey population generally, especially when the total risk
perception is considered. The pattern shows that the risky Behaviour Ratio for the Business
Sector is 22% less for earthquakes and 34% less for landslides and rock falls compared to the
overall population. Comparably the risky Behaviour Ratio for the Individuals Sector is 30%
greater for earthquakes and 70% greater for landslides and rock falls. These differences are
not surprising and reflect the continuing awareness of the devastating landslide at Thredbo in
1997 (Macdougall et.al., 2002) in which 18 people died and reconstruction of the highway
above the landslide cost $24 million. The differences for landslides on roads and access
probably also reflects strong awareness of the many recent road closures due to many large
roadside landslips in the unusually heavy 2012 spring rains.
It is significant that the differences in the Behaviour Ratio have indicated that the method has
strongly revealed a means of measuring behaviour in a material manner. It is important to
note that the demographic difference between the sub-groups is consistent with logical
expectations; and the Weber-Fechner scale showed moderate differences between the two
sub-groups suggesting that all stakeholders in montane work and recreation have at least
reasonable montane risk awareness.

220
The region’s earthquake history provides a useful context for the seismic risk. The past 60
years has seen the occurrence of several significant Snowy Mountains Region earthquakes in
remote areas. These include a magnitude 5.3 (1959) and a 4.0 (1971) both centred near
Berridale; a magnitude 4.2 (1998) near the Goobarragandra Wilderness Area (east of Tumut),
and three magnitude 4.0 events (1958, 1976, and 1980) near Cooma.
Table 6.7 a & b: Summary of Survey Ratings for Geological Natural Hazards
Respondents Business Bu (N = 33)
Individuals In (N = 28)
Population Po (N = 61)
Po-Bu
Po-In
a) Geological Hazards Mean Mean Mean Diff Diff
Earthquake Likelihood (L) - Refer Table 6.4 - Column 4
Remote Areas 2.88 2.29 2.61 -0.27 0.32
Townships 2.36 1.93 2.16 -0.20 0.23
Roads & Access 2.39 2.14 2.28 -0.11 0.14
Earthquake Seriousness (C) - Refer Table 6.4 - Column 8
Remote Areas 1.36 1.68 1.51 0.15 -0.17
Townships 1.85 2.07 1.95 0.10 -0.12
Roads & Access 1.79 1.86 1.82 0.03 -0.04
Total Risk (L + C) - Refer Table 6.4 - Column 9
Remote Areas 4.24 3.96 4.11 -0.12 0.15
Townships 4.21 4.00 4.11 -0.10 0.11
Roads & Access 4.18 4.00 4.10 -0.08 0.10
Average 4.21 3.99 4.11 -0.10 0.12
Inv. log B(e) 0.79 1.32
Respondents Business Bu (N = 33)
Individuals In (N = 28)
Population Po (N = 61)
Po-Bu
Po-In
b) Landslide Likelihood (L) - Refer Table 6.4 - Column 4
Remote Areas 3.97 3.46 3.74 -0.23 0.27
Townships 2.97 3.00 2.98 0.01 -0.02
Roads & Access 4.27 3.57 3.95 -0.32 0.38
Landslide Seriousness (C ) - Refer Table 6.4 - Column 8
Remote Areas 1.67 2.04 1.84 0.17 -0.20
Townships 3.48 3.04 3.28 -0.21 0.24
Roads & Access 1.97 2.00 1.98 0.01 -0.02
Total Risk (L + C) - Refer Table 6.4 - Column 9
Remote Areas 5.64 5.50 5.57 -0.06 0.07
Townships 6.45 6.04 6.26 -0.19 0.23
Roads & Access 6.24 5.57 5.93 -0.31 0.36
Average 6.11 5.70 5.86 -0.19 0.22
B(e) (= Inv. log) 0.67 1.73
A Gutenberg-Richter power law survey was conducted (Chapter 4) over 316 Snowy
Mountains seismic events greater than magnitude 2.0 since 1955. This survey shows the

221
recurrence interval for a potentially damaging earthquake in the region greater than
magnitude 5.0 is 60-100 years.
Cooma and Tumut being townships with many heritage buildings of unreinforced masonry
(URM) construction means they are very vulnerable to collapse leading to serious injury or
death from an earthquake in this magnitude range, as is evidenced by the 1989 Newcastle
(magnitude 5.6) and February 2011 Christchurch (magnitude 6.3) earthquakes.
This survey would indicate that business respondents are only slightly more aware of seismic
risk likelihood. They are still likely to understate the potential damage consequences by an
order of magnitude, depending on how close the epicentre is to a township when compared to
the visitor-residents group of individuals. The individuals are somewhat more realistic on
earthquake consequences but still likely to understate damage effects. The direct damage
effects in more modern built environments such as Thredbo and Jindabyne are likely to be
very low unless an earthquake subsequently triggers a landslide or rock fall as was discussed
in Chapter 5. Overall it appears that the general population of persons normally present in the
SMR as defined in this survey under-estimates the seismic and landslide risk in built
environments and modified remote environments such as rock or boulder laden hillsides
cleared for ski runs.
The geological risk of landslide and rock fall remains significant due to two factors: the
Snowy Mountains Region is comprised of rounded mountains with steep hillsides especially
with the lower slopes being often greater than 30 degrees (which is comparable to the Rapaki
vignette in Chapter 5). Being a montane environment the region is very prone to localised
thunderstorms and flash floods. These are particularly likely in remote and highway areas
such as in the Tumut and Tumbarumba floods in 2012 and respondents having an impact
rating greater 4.0.
Meteorological Natural Hazard Perceptions
Meteorological conditions differ from geological conditions in the awareness of all
demographic groups with generally greater ratings for frequency and seriousness. The 2,200
metre high topography of the SMR penetrates well into the one kilometre high atmospheric
boundary layer, resulting in major distortions and concentrations in meteorological flows and
events. The survey response to meteorological hazards is shown in Table 6.8 and includes
common montane storm events and consequential events such as bush fires.

222
Table 6.8 a, b & c: Summary of Survey Ratings for Meteorological Natural Hazards
Respondents Business Bu (N = 33)
Individuals In (N = 28)
Population Po (N = 61)
Po-Bu Po-In
Meteorological Hazard Mean Mean Mean Diff Diff
a) Storm Likelihood (L)
Remote Areas 4.36 4.00 4.20 -0.16 0.20
Townships 4.06 3.50 3.80 -0.26 0.30
Roads & Access 4.24 3.93 4.10 -0.14 0.17
Storm Seriousness (C )
Remote Areas 1.88 1.71 1.80 -0.08 0.09
Townships 1.94 1.86 1.90 -0.04 0.04
Roads & Access 2.00 1.86 1.93 -0.07 0.07
Total Risk (L +C) - Refer Table 6.4 - Column 9
Remote Areas 6.24 5.71 6.00 -0.24 0.29
Townships 6.00 5.36 5.70 -0.30 0.35
Roads & Access 6.24 5.79 6.03 -0.21 0.25
Average 6.16 5.62 5.91 -0.25 0.29
Inv. log B(e) 0.57 1.97
b) Blizzard Likelihood (L)
Remote Areas 4.61 4.46 4.54 -0.07 0.08
Townships 4.33 4.04 4.20 -0.14 0.16
Roads & Access 4.52 4.54 4.52 0.01 -0.01
Blizzard Seriousness (C)
Remote Areas 1.61 1.96 1.77 0.16 -0.19
Townships 1.52 1.75 1.62 0.10 -0.13
Roads & Access 1.61 1.54 1.57 -0.04 0.03
Total Risk (L + C) - Refer Table 6.4 - Column 9
Remote Areas 6.21 6.43 6.31 0.10 -0.12
Townships 5.85 5.79 5.82 -0.03 0.03
Roads & Access 6.12 6.07 6.10 -0.02 0.03
Average 6.06 6.10 6.08 0.02 -0.02
Inv. log B(e) 1.05 0.97
c) Bushfire Likelihood (L)
Remote Areas 4.27 4.18 4.23 -0.04 0.05
Townships 3.55 3.11 3.34 -0.20 0.24
Roads & Access 4.21 3.93 4.08 -0.13 0.15
Bushfire Seriousness (C)
Remote Areas 2.30 2.00 2.16 -0.14 0.16
Townships 2.73 2.39 2.57 -0.15 0.18
Roads & Access 1.91 1.68 1.80 -0.11 0.12
Total Risk (L + C) - Refer Table 6.4 - Column 9
Remote Areas 6.57 6.18 6.39 -0.18 0.21
Townships 6.27 5.50 5.92 -0.35 0.42
Roads & Access 6.12 5.61 5.89 -0.24 0.28
Average 6.32 5.76 6.07 -0.25 0.31
B(e) (= Inv. log) 0.56 2.05

223
Bushfires are part of the meteorological hazard set since the bushfire risk escalates
dramatically in hot windy conditions and most bushfire events in Australia occur when
compatible meteorological conditions in a hot, dry windy weather system occur. The effects
are due to the drying out of plant based fuel and also to the increased volatility of flammable
eucalyptus oil from living and fallen vegetation at higher temperatures. The access for
emergency service response vehicles is also much worse in montane areas.
The survey results show that both Business and Individual respondent groups have a similar
understanding of blizzard risk in the SMR with the differences well inside the rating accuracy
and therefore are considered as not significant. The Behaviour Ratio at 1.05 for the business
sector and 0.96 for the individual sector might suggest that Individuals are slightly more
cautious than employed persons but the difference is not significant for a firm conclusion.
For general storms and bushfires the differences are much more pronounced with the
business sector showing a Behaviour Ratio of 0.56 and individuals showing a ratio of around
2.0 for these risks. This may also reflect a high level of involvement by employed staff in
storm recovery and bushfire response. Most employed persons would be involved in an
event response for several days or even weeks on a regular basis due the known severity of
these events. In comparison, individuals would experience these events from afar. Especially
since most of the floods and all of the bushfires happen during the warmer seasons when the
visitor economy is at a lower level than the peak winter season. With the growth in new
summer montane sports such as mountain biking, this awareness difference might reduce in
future years.
This approach to surveying montane stakeholders on meteorological hazards has produced
reasonably consistent results in spite of the relatively small respondent sample of 61
respondents, and known recent major flood and bushfire events that could over-weight
respondent opinions in favour of a higher likelihood.
Montane Driving Hazard Risk Perceptions
This survey section, although not a natural hazard, is most certainly a montane hazard and so
was included as a benchmark across all respondents to assess montane risk awareness. All
respondents are likely to have comparable experiences and it was expected that both groups
would have similar perceptions. The vast majority of visitors arrive in the region by private
motor vehicle, as do most business employees going about their work. Unlike urban and

224
coastal areas, or in much more internationally prominent montane resorts, only in a few cases
do SMR workers or visitors use either public transport or special employer provided vehicles
such as the ski-tube rail link to Perisher, the over snow track transporter to Charlotte Pass, or
helicopters. Driving hazards including a high risk of wildlife collisions at certain times of the
day (with Kangaroos, wombats and birds etc.) are therefore experienced similarly by all
demographic groups.
The survey results shown in Table 6.9 for the questions on the frequency and seriousness
indicate that both major demographic groups have similar responses. Essentially the
consensus of residents and visitors to the Snowy Mountains is that a major accident is
expected to happen about once per year and with one or two fatalities or serious disabling
injuries being likely.
Table 6.9: Summary of Survey Ratings for Motor Vehicle Accidents
Respondents Business Bu (N = 33)
Individuals In (N = 28)
Population Po (N = 61)
Po-Bu Po-In
Vehicle Hazards Mean Mean Mean Diff Diff
MV Accident Likelihood (L)
Roads & Access 4.73 4.89 4.80 -0.08 -0.09
MV Accident Seriousness (C)
Roads & Access 3.61 3.14 3.39 -0.21 0.25
Total Risk (L + C) - Refer Table 6.4 - Column 9
Roads & Access 8.33 8.04 8.20 -0.14 0.16
B(e) (= Inv. log) 0.87 1.20
There is however a smaller measurable difference in the behaviour ratio that mirrors the
differences in geological and meteorological montane hazards although not quite as
pronounced. The behaviour ratio for Business respondents shows a value of 0.87, and for
Individuals a value of 1.20, showing a smaller difference in risk awareness between the two
groups than other montane hazards.
In spite of this moderate difference in driving risk awareness, recent motor vehicle accident
statistics in the Snowy Mountains region are unfortunately much worse than the expectations
of both groups. In recent years there have been two to three serious accidents per year (both
car and motorcycle) resulting in fatalities, caused variously by heavy storms, ice and wildlife
on roads, and unfamiliarity with the winding nature of montane roads. Minor accidents
(especially non-injury accidents) are not known to this project as generally they are usually
reported directly to insurance companies; perhaps a stakeholder in future studies.

225
6.5 The Survey – Analysis, Summary and Conclusions
In addition to the results presented in the foregoing, a summary of the differences in
likelihood and consequence perceptions between business and individual sectors and the
calculation of a Behavioural Ratio for the Business and Individual sectors is in Table 6.10.
This table shows that for a natural hazard risk assessment strategy there will be different
levels of risk outcome depending on whether the hazard and event is dominated or under the
control by either of the two sectors or the population as a whole. A Corporate controlled
hazard could, for example include a risk assessment or response for a major dam controlled
by Snowy Hydro, or a bushfire under control by the Rural Fire Service or a flood controlled
by a LGA, or a blizzard controlled by a snow resort. An Individual controlled hazard would
initially include a major earthquake or landslip in a township before rescue and response
services were mobilised and a population controlled hazard would include a Blizzard over a
wider area where there were elements of corporate rescue services control and significant
groups of unassisted visitors. In an ISO 31000 overall risk assessment, the likelihood and
consequence perceptions are mapped in a matrix diagram.
Table 6.10 Behavioural Ratio for geo-hazards and population sectors in SMR:
Major Hazard
Event
B(e) Business
Controlled
B(e) Visitor
Controlled
B(e) General
Population
Seismic 0.79 1.32 1.0
Landslide 0.67 1.73 1.0
Storm Wind / Rain 0.57 1.97 1.0
Blizzard 1.05 0.97 1.0
Bushfire 0.56 2.05 1.0
Vehicle Accident 0.74 1.45 1.0
Average (Rounded) 0.87 1.20 1.0
The relatively consistent pattern of Behavioural Ratios in this table enables, for practical
purposes when planning for response and recovery strategies, the average behavioural ratios
indicated in Table 6.10 to be applied in assessing people impacts on physical risks. In
essence this table means that in a significant event the risk assessment outcomes halve when
a business manager takes control of a geohazard event situation compared to a person in the
visitor or resident population.
Notably it is considered by all stakeholders that across the spectrum of montane hazards,
motor vehicle use is considered a much greater risk than all natural hazards; that bushfires

226
and blizzards are considered second equal; storms and landslides are considered fourth equal;
and that seismic hazards are considered a distant sixth.
This means that based on the scales developed for this case study that the overall risk
assessment for earthquakes is:
Once per ten years with no damage, and
Once per hundred years with minor damage, and
Or once per thousand years with serious damage
These results are consistent with the calculated Richter-Gutenberg Law analysis that is
reported in Chapter 4 of this thesis, and with the narrative description of recent events above.
The common group of natural hazards give the following level of risk as:
Once per year with minor damage, and
Once per ten years with serious damage, and
Once per hundred years with major damage.
Detailed actual event data for this period is not available to this project. Recent events and
incidents of deaths and damage are well published in the local news media (one by blizzard,
two to three fatal motor vehicle accidents, a major regional flood every 10 years, one
landslide disaster) would suggest that the real level of risk is higher and closer to:
Once per year with major damage, and
Once per ten years extensive damage, and
Once per hundred years with catastrophic damage
Finally, road vehicle accidents in the snowy mountains region see a small number of fatalities
(two to three) every year which suggests a higher actual risk rating according to the criteria in
Tables 6.2 and 6.3. Therefore it would appear that based on a review of known actual
disaster events and their consequences, that all stakeholders in the SMR have: (i) a
reasonably accurate assessment of seismic risk, (ii) an optimistic assessment (by one rating
unit) of motor vehicle risk and (iii) a very optimistic view (by two rating units) of the
common natural hazards of landslides, storms, blizzards and bushfires. Although business
employees generally have more conservative views than individuals they are still relatively
optimistic about natural hazard risk compared to reality.

227
In summary, the results in the foregoing analysis are consistent with the observations in the
introductory chapter. The application of central place theory saw many persons who made
decisions about the siting of new towns (that subsequently grew into cities) making decisions
that did not take account of the natural hazard environment of the place or location because
they lacked the knowledge or were generally more optimistic. Further, having made the
place decision and settled there it is exceptionally rare for the residents collectively to
abandon their settlement location entirely due to natural hazard risk (a rare exception being
Kelso, NZ in Chapter 1). This is illustrated by a examples of places that are exposed to high
levels of regular natural disasters due to poor quality settlement decisions and subsequently
do not prosper but continue to exist. Such examples are Galveston on (McComb 1986), Bixel
& Turner 2000) a very low coastal lowland (being essentially a 25 mile long sand island)
subject to frequent hurricanes and inundation, and; Kelso in a deep (albeit low altitude)
montane valley between the Black Umbrella Range and Blue Mountains in Otago, NZ
(Brownlie 1992) that is subject to regular devastating floods. Instead these places typically
continue to operate at a very modest level, having to divert large amounts of the places’
economic wealth into protection, impact, response, and recovery activities. This results in an
overall lower level of wealth and economic growth for the community as is especially
noticeable in the Galveston (1900 and 2015 population 40,000 and 50,000 respectively)
analysis compared to its nearby sister city of Houston (1900 and 2015 population of 40,000
and 2.5 million respectively).
This survey indicates that the stakeholders in SMR montane environment generally hold a
view that the four common natural hazards will have an impact of one to two logarithmic
rating units less than reality. This means on a numerical scale that the actual cost of
protection, impact, recovery and response is approximately 10 to 100 times greater than the
expectation of these stakeholders. Although the SMR villages were largely settled in the 19th
century to support , grazing and natural forestry, they grew and prospered due to increased
plantation forestry, hydroelectric infrastructure, and tourism in the 20th
century and continue
to show growth as montane recreation continues to grow. This multiple economic sector
balance shows a strong sense of place with many families being multigenerational residents
over the past 175 years. Many local families are actively engaged in community services such
as volunteer fire protection and ambulance services.
For higher risk locations, it is helpful that these factors are determined, since a failure to
identify the risks will see a place underprepared for the events that may occur, or individual

228
persons and families then make location decisions that are significantly more risky than is
intended. A fully informed risk profile for individuals or a family helps build place loyalty
and resilience. That is not to say that some individuals or families will not deliberately make
risky decisions. As shown earlier in Starr (1969) most individuals will make risk decisions
with approximately 1000 times (3 logarithmic (base 10) rating units) greater risk when they
feel they are in personal control of the risk compared to when they are not in control of the
risk. It may be considered that communities may take a similar approach but most
importantly it is accurate information of the risk likelihood and consequences within an
appropriate risk assessment framework that is required to make the most appropriate decision
for that individual, family, or community.
Tests for Significance of Differences
Generally, statistical significance testing such as the “t” test, require the data to not be
skewed, (Feng 2014) to approximately resemble a normal distribution, and the spread /
dispersion of data about a measure of central tendency to be similar for the test sample under
comparison (Armitage 2002). In general, data condensing transforms such as logarithm
transforms and averaging, whether by means, medians or modes, condense the dispersion and
spread, and make significance testing methods largely invalid.
Tests specifically for skewed data such as quartile range testing or Wilcoxon’s rank sum test
(Armitage, 2002) and the Mann-Whitney U Test (Hart 2001 and Armitage 2002) also have a
range of specific requirements including:
Two random, independent samples:
Comparable spread or dispersion profiles between samples
Continuous data – to the nth decimal place:
Scale of measurement should be ordinal, interval or ratio
A null hypothesis asserts that the medians of the two samples are identical.
This survey does adequately comply with these conditions either. In these tests, it is only
possible to consider the significance between sections of the raw data. Therefore, a direct
examination of the raw data in histogram format as well as medians, modes and means was
undertaken using the raw survey data before transformation.

229
Different members of a community will respond to a disaster based on their knowledge and
attitudes with behaviours ranging from measured calm to unbridled panic. This is implied in
Table 6.11 where expectations of likelihood and consequences are widely spread within the
subsectors of individuals / visitors, and those who are employed in business or infrastructure
organisations. Gaining a measure of central tendency in such data is difficult and beyond
most methods which rely heavily on limited skewness, much larger samples, and relatively
symmetrical spread or dispersion. To illustrate, a section of response data for landslide
events is shown along with the raw sample data median, mode and means, along with an
excel standard deviation calculation is shown in table 6.11. From this table when comparing
the vertical columns (for example Bu-L1 with In-L1), it can be seen that the dispersion for
each respective column is broadly comparable, but it is also seen why median and mode
measures of central tendency are unhelpful, being primarily that the discrete integer values in
the raw data give uneven trends.
With this knowledge, a more effective questionnaire and research design might now be
conducted however; the design used here does have benefits in the model writing process.
Table 6.11 Histogram of raw survey data values for Landslide Hazards in SMR.
Where:
R&A means road and access environments
L and C are the respondent’s estimated values of Likelihood and Consequences (1 - 5)
L1, L2 and L3 represent the three location scenarios of Remote, Townships, and Roads
N is the number of respondents in each sub-sector i.e. 33 (Business) and 28 (Individuals)
Business Sub-sector Individuals Sub-sector
Location Remote Remote Town Town R&A R&A Remote Remote Town Town R&A R&A
Value L1 C1 L2 C2 L3 C3 L1 C1 L2 C2 L3 C3
1 1 19 4 3
15 3 14 4 5 4 10
2 2 7 1 2
9 7 5 10
3 6 6 20 12 4 6 9 2 16 8 4 7
4 11 1 8 8 16 1 13 2 8 4 16
5 13
8 13 2 3 3 6 4 1
N(total) 33 33 33 33 33 33 28 28 28 28 28 28
Median 4 1 3 3 4 2 4 2 3 3 4 2
Mode 5 1 3 3 4 1 4 1 3 3 4 1
Mean 4.0 1.7 3.0 3.5 4.3 2.0 3.5 2.0 3.0 3.0 3.6 2.0
std dev 1.0 0.9 0.9 1.2 0.7 1.1 1.1 1.3 0.9 1.4 1.2 1.0

230
Therefore noting it is contrary to the above discussion, the best measures for illustrative
purposes of central tendency and data contraction and the spread or dispersion comparison is
the Excel spreadsheet generated mean and standard deviation, along with their weaknesses.
This is a previously noted limitation of the study, so there remains further opportunity to
further improve this method of measuring knowledge and attitudes of business employees
and visitors to montane risk places to achieve a more robust statistical significance.
6.7 Conclusions
Montane regions typically concentrate and release energy flows from the environment into
natural hazards in a much more aggressive manner than coastal or lowland regions. For most
people, montane environments are places of natural beauty, sport, and recreation, all values
that tend to understate the underlying risk from natural hazards.
The Australian Snowy Mountains are sparsely populated with just 50% of the 35,000
permanent residents being employed, but the region attracts 1.3 million visitors each year
who are less familiar with the region and it’s more aggressive hazards than are residents.
These visitors may be more at risk from major natural hazard events than urban populations,
because they underestimate their effects and do not make informed or rational risk avoidance
decisions. With a ratio of visitor persons and local resident and business persons of 40 to
one, and with visitors having an average stay in the region of just 4 days it is not possible to
fully inform every visitor in safe responses to an emergency and still leave time for them to
enjoy their visit. This places a high burden on businesses, organisations and their employees
to lead event responses should a serious natural hazard event occur.
This study shows that in all major types of natural hazard events ranging from earthquakes,
landslides, storms, blizzards and bushfires, employees of local infrastructure organisations
and business have a more conservative view of the likelihood and consequences of natural
hazard events than do visitors and non-employed residents of the region. This business group
generally expects events to happen twice as often and to have two times more serious
consequences than visitors and non-working individual locals.
A significant exception to this trend is motor vehicle accidents when all stakeholders, being
employees and visitors alike, have similar expectations, although generally they all expect
fewer and less serious accidents than is the reality.

231
Montane natural hazard risks are perceived to be worse than coastal and lowland risks
because of topographical physics, population dynamics, infrastructure and awareness and
need for special leadership during adverse events. Geological hazard events are typically
poorly understood whereas weather conditions form part of our daily information stream and
form an active part of our daily decision making process on recreation and sport. This
exacerbates risky event outcomes as business managers and employees generally expect
montane natural hazard events to happen more often and the consequences to be much less
than community-visitor groups. In general, people making use of mountain recreation
opportunities indicate that both business and individual groups see meteorological and
geological hazards in the same light.
The Weber-Fechner power law was found to be a suitable survey tool for developing
quantified cognitive attitudes including perceptions of risk likelihood and consequence. The
ISO 31000 risk assessment process although widely used, is relatively daunting for many
members of the community, and can typically understate the overall risk assessment unless it
is formulated using strong underlying theoretical relationships and is transformed into
everyday language. Although it is a suitable design survey tool, it appears that the selected
region and participants do not show large differences in risk awareness as might be expected
in a lowland urban area.
In general, the montane residents and the montane visitors have a common respect for
montane risk and while there are differences, those differences are not as great as might be
found in the Australian population at large. The method developed in this study might be
also be very useful in a lowland urban environment by demonstrating the differences in
behavioural responses to risk in the wider Australian population.
The key assumption in this study is that in matters related to serious risk, the respondents
participated as rational beings: being that when exposed to a serious risk or a perceived risk,
respondents would act in a rational manner to reduce risk or harm from a natural hazard or
disaster event. This assumption is consistent with literature reviewed but was not addressed
nor proven in this study
A possible weakness in this survey is the exploratory nature of the survey design and
execution. In the absence of structured research of this nature and absence of any prior
attempts to quantitatively blend traditional ISO 31000 methodology with survey based

232
behavioural data means, the development of a dimensionless behavioural ratio that produces
results that can be appropriately weighted for the three domains is a very new approach.
As a first step, this approach has demonstrated that such a methodology is possible and
practical but has not gone far enough to link activities to behaviours on a quantitative scale
that matches the likelihood and consequence data. This becomes a next step to be resolved in
the development of more useful risk assessment models.
Further, the transform modelling approach used in the study does not enable normal methods
of statistical significance testing and this is reported as an area of ongoing study in skewed
data surveys.
Acknowledgements
The author sincerely thanks the management of the Snowy Mountains Local Government
Authorities (LGAs); NSW state government agencies including Destination NSW, National
Parks and the State Emergency Services; the SMR ski resorts (Thredbo, Perisher Blue,
Charlotte Pass, and Selwyn); and his colleagues on the Board of Tourism Snowy Mountains
Inc., for encouraging their busy staff to participate in the survey, and as well, the many
private respondents to the questionnaire for their time.

233
CHAPTER 7: TRANSFORMATION MODEL OF NATURAL HAZARDS
This Chapter brings together the new expansion of the international standard ISO 31000 two-
domain model based on likelihood and consequences for determining natural hazard risk
outcomes, and the new behavioural ratio domain into a three domain model beginning with a
reminder of Figure 1.6
This expansion is outlined in Chapter 1 - the introduction together with a new, more
structured approach to transforming vast amounts of data into useful information that can be
used to populate the new model form. Chapter 1 introduces the standard two-domain matrix
risk model with the attributes that make it relevant and the proposal that in the majority of
natural hazard based disasters, it is the human environment and the behaviours of its
participants that causes the majority of disaster consequences.
The underlying knowledge base and outcomes from prior research and various mathematical
and modelling approaches to these issues are outlined in Chapter 2 - the literature review.
These approaches include an expanded application of resource economic concepts, applied
Newtonian physics, logarithmic transformations, dimensionless analysis and qualitative
reasoning to bring a mixture of mathematical tools together in a new and unique manner.
Chapter 3 recognises that this complex systems research project needed a mixed-model
approach that is a foundation study for the three situational studies. This study of 2968
models finds from historical and first principles that all systems modelling is carried out by
one or more of a total seven archetypal model techniques. By transforming raw data into
useful information through modelling, the properties (components, attributes and
relationships) and beneficial applications of these seven archetypal model techniques are
developed to assist in the selection and application of the most effective models in the three
studies.

234
It is found in Chapter 4 that the failure to use a structured transformational modelling
approach has resulted in overstated conclusions about the frequency and nature of reservoir
induced seismicity (RIS) in the greater Snowy Mountains Region. Chapter 4 applies a new
approach using a mixed-modelling method to evaluate the likelihood of damage to a montane
industrial environment caused by RIS and natural seismicity. This evaluation shows that RIS
concerns appear to have been misdiagnosed, and overstated in the past. By using a mixed-
model approach of table and image models (both spatial and temporal) in a formula
(Gutenberg-Richter) model environment a new “picture” of RIS is developed that more
accurately diagnoses the likelihood RIS, as well as forecasting its very much reduced
consequences that previously thought, by using spatial and temporal mapping of new dams
and reservoirs. This becomes the likelihood domain in the new risk model.
Chapter 5 introduces a new approach using specific surface energy (SSE) instead of Peak
Ground Acceleration (PGA) to measure damage potential of seismic event energy at locations
distant from the event epicentre. This new technique maps closely with the qualitative MMI
scale and may be more useful for modelling the attenuation of wide area damage
consequences from a major earthquake. The approach uses a diverse mixed-model approach
of image, data stream, table, formula and flow chart models.
Chapter 6 recognises the new third domain of the influence of human behaviour on the risk
matrix model on the natural disaster system. It demonstrates a measurable and measured
difference in risk awareness and by qualitative reasoning finds measurable differences in
rational participant behaviours. This means that informed participants in the natural hazard
system will likely take responses and decisions that lead to an improvement in risk outcomes.
Chapters 4, 5, and 6 have each considered the three major domains of risk management
being, event likelihood, event consequences and human behaviour. Each chapter has
considered how these three system behaviours may be modelled using robust methods,
including qualitative reasoning to build a three-domain model. This chapter brings together
the findings from the foregoing chapters to assist in future risk assessment in forecasting
models and assist in planning and preparation for the consequences of future natural disasters.
7.1 Principles of Modelling Systems
It is noted that system modellers tend to follow structures in the form of like model types in
the same knowledge domain. There is rarely, any explicit analytical approach for examining

235
the modelling options according to their merits and arriving at an optimised mixed-model
structure that synthesises a study in the most efficient and structured manner.
Development of a Structured Natural Hazard Systems Model
A structured approach for developing a well posed natural hazard model system becomes:
i. Determine the system structure: components, attributes, and relationships
ii. Determination of general system type: standard, complex or special type
iii. Determine system boundaries relative to components and subsystems
iv. Determine steady state and emergent elements amongst (i) and (ii) above
v. Determine model forms from the seven options (image, scale, narrative, tables,
formula, data, flowchart) by:
a. Consideration of data & components (e.g. data, table, image / graph)
b. Consideration of relationships (e.g. scale, matrix (table), flow (chart)),
c. Consideration of externalities (system external influencers)
d. Consideration of temporal or spatial stages in model (pre-event, post-
event, epicentre, remote effects, stakeholder impacts, matter, energy,
information flows) to generate governing system equations
e. Consideration of stakeholders (input, participants, outcome etc.)
f. Consideration of expected outputs (formula, tables, images, narrative etc.)
vi. Design model subsystems (or fragments) with fully attributed components
vii. Decide mathematical methods to build and resolve (e.g. logarithms, Boolean
algebra, differential equations, qualitative reasoning, general and cognitive sciences,
extremes and averages, and complex systems analysis)
viii. Build systems and subsystems structures, and populate with data, components,
attributes, and relationships
ix. Resolve system governing and resource model and equation outputs through
methods in (vii) above
x. Test model validity with historical data for inputs and outputs
xi. Feedback model outputs to system and model inputs and review validity of all
modelling assumptions, logic, and decisions for accuracy and robustness
xii. Record model environment, inputs, assumptions, outcomes, and omissions.
xiii. Commission model for simulations of future scenarios and behaviours

236
To summarise, a mathematical description of natural and social systems generally includes
relevant coverage of type, components, magnitude, spatial and temporal characteristics all
combined and presented as a model or group of models. The primary purpose of any model is
to create an idealised description that mimics the behavioural inputs and outputs of the key
parameters, identifies but excludes anomalies and includes genuine outliers, can be used to
explain current behaviours and to forecast future steady state and emergent behaviours with
greater quantitative certainty.
7.2 Determination of Model Approaches
Almost all systems can be represented by more than one type of model and often the use of
different model types applied contemporaneously to a particular system will see a better
understanding of the scenario and its different behaviours emerge. For example, statistical
data collected in a table model may be co-presented as a graph (being an image model) and
upon demonstrating a clear data fit to a trend line, may lead to the derivation of a reliable
deterministic formula model that forecasts an expected output from the specific inputs and
initial boundary conditions.
Actuarial versus Aggregated Risk Assessment
It is accepted that the main focus of this study has been the determination of forecast riskiness
based on the modelling of geophysical, built, and human environment behaviours, as a means
to understand current and future risk. This is in stark contrast to the largest global risk
management sector; the insurance industry, which operates on three fundamental precepts:
risk management by transfer of financial value, limits on maximum insurance available, and
extrapolation of past risk transfer trends provides the best model of future risk.
The actuarial approach is codified in the Statement of Principles Regarding Property and
Casualty Insurance Ratemaking adopted by the Board of Casualty Actuarial Society since
1988 (Byron et.al. 2014, Werner & Modlin 2010). Annual reviews ensure there is an orderly
global financial market in re-insurance through consistent standards. This leads to the
fundamental insurance equation for rates, adjusted insured losses and underwriting (UW)
factors, being:
Premium Rates = Insured Losses + Loss Expenses + UW Expenses + UW Profit (7.1)

237
The goal of actuarial ratemaking is to assure that the fundamental insurance equation or
formula is always appropriately balanced with the profit representing long term and short
term risk balanced returns. The underlying assumption to these precepts is that the claims
history provides an all-encompassing aggregated trend of all significant risk components in
the risk equation, and that there is no significant emerging component or attribute that takes
an otherwise standard system into complex system mode.
The comparative three precepts for this study involve an observed significant self-insurance,
especially by governments of: (i) infrastructure assets, (ii) significant non-insurable, non-
financial (i.e. human needs) casualty risk, and (iii) there are catastrophic or rapidly emergent
risk attributes that cannot be extrapolated from recent trend behaviours. The actuarial sector
of the insurance industry has introduced catastrophe modelling to try to address the very rapid
increase in the frequency and magnitude of catastrophe claims. This is not so much driven by
increased frequency and magnitude of events but more so the rapidly expanding size of the
built environment and the increasing use of risky land and locations to accommodate that
growth. The actuarial sector (Lythe 2008, Buldeyrev 2010) is addressing the question by
building catastrophe models and aggregating the expertise and experience from several
disciplines such as: meteorology, oceanography structural engineering, seismologists,
economics and statistical modelling (simulation techniques).
The continuation of expertise and modelling built around standard systems appears to expose
the weaknesses of rapidly emerging attributes of natural hazard systems and models, for
example, the risks of climate change. This leads to a strong probability that the actuarial
approach of risk assessment and risk transfer may not meet the needs of the city and
community stakeholders due to price rises and emerging complexity of disaster impacts.
Similar un-modelled emergent attributes have been seen in the insurance of asbestos
liabilities for long term latent claims (Parameswaran 2004) and the uncertainty of
catastrophic pandemics (Stitt 2006) against unprecedented human longevity in modern
societies (Rafe & Howes 2012). These emergent behaviours in the insurance sector lend
weight towards the benefit of a structured complex systems approach where risk components
are modelled separately, and then aggregated in a qualitative reasoning approach.
It is clear that whatever likelihood-consequence relationships evolve from these systems,
human behaviour will adapt risk outcomes to mitigate adverse outcomes to an acceptable
personal economic level.

238
The forgoing three chapters (4, 5, and 6) have, through a series of empirical field studies,
generated temporal, spatial and behavioural data that has been modelled in logarithmic and
various other domains to generate a series of deterministic formulae. Some of these formulae
have been determined “originally” from first principles and others have been “localised” by
applying location specific parameters to generalised principles developed elsewhere. Each of
the three chapters addresses the three major domains that provide a structured approach to
risk assessment, preparation, response and recovery for a natural disaster event, namely: (i)
forecasting the likelihood of occurrence of these events, (ii) forecasting the consequences of
these events and (iii) forecasting the behaviours of communities in natural hazard events.
7.3 General Behavioural Risk Awareness
Chapter 6 shows the results of a quantitative / qualitative study intended to show differences
between business persons (in corporate and SME situations) and individuals (visitors and
residents) on the assumption that business persons will in an Australian work environment be
exposed to a rigorous workplace health and safety training and practice environment.
The exceptions were for blizzards and road safety where both groups recognised the risks at
almost identical levels indicating as winter sports stakeholders, a concern for winter montane
hazards and an almost equal awareness of road safety hazards. Such a survey could be
repeated in an urban environment since both demographic groups are common across
Australian population.
7.4 General Hazard Frequency–Magnitude Relationships
It is the intention of this study to develop a generalised method initially based on documented
seismic hazards and events with specific studies in the Snowy Mountains and the South
Island of New Zealand for case study data. It is important to make checks from time to time
that the method indeed has wider applicability. For example, consistent with the extreme
value distribution principles, the logarithmic frequency-magnitude relationship appears to be
applicable for all or at least most serious natural hazard phenomena for which data has been
analysed, having become well established for describing earthquakes through the Gutenberg-
Richter relationship. Other examples of well-correlated logarithmic frequency–magnitude
relationships include landslides in British Columbia, Central USA rainstorms, South-western

239
Pacific Ocean cyclones, North Atlantic hurricanes and Tornadoes, Australian bushfires, and
meteors.
7. 5 General Energy Intensity: Attenuation and Damage Models
The Damage Process occurs when concentrated energy impacts on an asset (human, natural
or built environment) at a level of concentration above a threshold that penetrates its
protective “shell or layer”. Once this shell is penetrated, the accumulated damage is a
measure of the cumulative impact energy, which will typically be the product of force (or
acceleration), and distance (or duration). The energy transfer process has been demonstrated
in hurricanes, and ship and vehicle collisions as a stronger measure of damage and injury
risk. Clearly the energy transfer to damage processes applies solely to the inelastic
component of the impact energy since the elastic component is manifested as the departure
energy of the collision bodies. The inelastic energy transfer is manifested as damage, noise
and heat generation although the last two elements are relatively small.
A clear example of energy transfer is the Rapaki Boulder where the energy processes follow
the Chapter 5 Vignette model and the potential energy of the boulder is converted to downhill
kinetic energy (less friction losses with each sliding bounce) but at the impact with the house
the boulder has significant kinetic energy. The impact energy of 9 MJ being equivalent to two
kg of TNT, is mostly dissipated in the explosive impact. Therefore the total damage = total
energy transfer less friction, heat, and noise energy.
The Risk Equations
The risk equation exists in various forms. The standard likelihood – consequence model
from ISO 31000 has been adopted internationally in industry and commerce but as discussed
and demonstrated earlier in this thesis, the application has often been inconsistent and flawed.
Risk sector professionals have recognised the roles of environmental conditions on the risk
assessment process and have often sought extensions of the two-domain model with
parameters that fall into the general behavioural category with phrases such as vulnerability;
however it has been demonstrated that these extensions have been weakened by logic
inconsistencies. Risk sector professionals typically jump over these inconsistences by going
to big data analysis – effectively saying rather than trying to forecast future risk, the risk
sector (e.g. insurance companies) will use historical records as a forecast of the future. In
summary, the three most useful risk equation types are currently:

240
ISO 31000 Risk = Likelihood * Consequences (7.2)
Qualitative Risk = Hazard * Exposure * Vulnerability (7.3)
This Study Risk = Likelihood * Consequences* Behaviour (7.4)
= log (L) + log (C) + log (B) (7.5)
Where likelihood is in events/time, consequences are in $ (value)/event, and behaviour is a
dimensionless ratio variable. The system is considered to be in steady state, which generally
means it, is stable, even if somewhat variable, with variability between components attributes
and relationships not expanding or diminishing to deterministic chaos.
The Behaviour Inclusive Model:
Using the ratio principles of a parameter where the sub-group is a fraction of the population,
a new Equation 7.6 is established:
Event Behaviour = cognitive (population attributes / sub-group attributes) (7.6)
Meanwhile, Gutenberg-Richter equation forms the likelihood equation in Equation 7.7:
Seismic Likelihood (Frequency – Magnitude) model:
log ∑(N) = 4.1 – 0.8M (7.7)
The consequences model is generalised in Equations 7.8, 7.9, and 7.10:
Consequence (Spatial Energy) model = k*E (SSE [=] MJ/t)
log10EM = 4.4 + 1.5*M: where EM =Total event energy release, (Joules) (7.8)
log(Vsum(PGA3D)) = 4.83 – 1.33*log(de) (7.9)
log(SSE: MJ/t) = 7.77 – 2.31*log(de) (7.10)
where: Vsum(PGA3D) = three dimensional vectors sum peak ground acceleration, and
de = epicentral distance (kilometres).

241
Qualitative Reasoning and Related Analysis
The analysis of the study has developed essential components of a deterministic model of the
natural hazard complex system, however in some aspects; the model consists of fragments in
terms of the qualitative reasoning approach. Resolving the model requires a practical
approach to qualitative reasoning to resolve complex and incomplete system equations as
discussed in Chapter 3 by Bredeweg et al (2008), Zitek et.al. (2009), Bredeweg et.al. (2009),
and Bouwer et.al. (2010). Recall the key elements of this approach are: (1) Structure, (2)
Behaviour, (3) Aggregate, and (4) Simulation. An image model of the reasoning process by
Bredeweg shows three main steps:
1. The model starts by determining and aggregating the scenarios and model fragments,
leading to comparison of the state dynamics.
2. Find the model transitions (or emergent conditions and properties) being (i) the
ingredients or model properties including structural (entities, and agents), behavioural
(values, and inequalities) and causal (influences) and (ii) the known, unknown, and
invalid behavioural conditions.
3. Conduct inequality reasoning which is triggered any time we add a new inequality
relation, or new correspondence.
Inequality reasoning infers new relations that must not be, circular logic, derived, self-
evident, or invalidated by boundary conditions. If it passes all the tests, it is added to the set
of known and valid relationships. Care has been taken in this study to avoid these tests with
external referenced inputs and evidence, which has been tested beyond the boundaries of the
research zones to test and ensure continuity of trends.
7.6 A General Natural Hazard Model
Natural hazard modelling as a precursor to event response and management has largely
developed within the knowledge base of each type of natural hazard or disaster event
This chapter considers the common attributes of natural hazards and disaster events such as
meteorological events (hurricanes, blizzards, floods, and bushfires) and geological events
(earthquakes, landslides, rock falls and sinkholes). The thesis evaluates the energy intensity
that surround disaster events with a particular focus on how the consequences (historically
recorded on the MMI scale) are affected by the total energy balance surrounding the event. It

242
considers how the primary hazard or event energy release triggers forms of latent energy (e.g.
potential and physiochemical energy) to magnify the total energy release and ultimately
magnify the impacts on the people and property assets in the impact zone. The basic concept
is now (including where behaviour is a modelled property, transformed from measured risk
awareness):
Risk = Likelihood * Consequences* Behaviour (7.11)
The ISO 31000 risk assessment model uses the two-domain matrix image in Figures 1.4 and
6.1, which is represented by the general expectation formula in Equation 7.12:
Event risk ($/time) = likelihood (events/time) x consequences ($/event) (7.12)
This formula includes both of the traditional domains and their dimensions, however the
introduction of the third domain (being the behavioural ratio) in this study can usefully
expand the traditional two-domain equation for a specific location as a defined location zone
into a three-domain equation. This means the addition of a new dimensionless behavioural
ratio term to Equation 7.11 to give Equation 7.15.
Location riskiness = Location (likelihood x consequences x behaviour) (7.15)
Geophysical Risk Analysis
The geophysical risk relates primarily to those physical domains of the geophysical
environment whether they are geological or meteorological. This study generally has
focussed on geological elements and noting a due regard to meteorological elements, and that
approach will continue. To focus on the event likelihood, the seismicity study in the Snowy
Mountains Region (SMR) provides a formula model for occurrence with the Gutenberg-
Richter (frequency magnitude) Law for the region (corrected for anthropological anomalies
such as RIS) log(N) = 4.1 – 0.82*M, being Equation 4.10. Recall that M represents seismic
magnitude and N the cumulative frequency of seismic events greater than M, and the
equation shows that the seismicity decreases logarithmically with increasing magnitude.
Recall also, that due to radial expansion and absorptive dissipation, the impact force and
impact energy (Y - the strong motion parameters) of a seismic event at a distant location with
an epi-central distance, de, are described as behaving according to the classical energy

243
intensity attenuation law, I = b - a*log de. In a seismic event, the energy intensity is a
logarithmic function of a strong motion parameter such as peak ground acceleration (PGA)
such that, I = log(Y) and Yd = PGAd. Therefore, for a general seismic event of magnitude M,
the attenuation law as described in Papoulia (1990) in Equation 7.16.
Is = b + c*M – a*log de, (7.16)
where a, b, and c, are situational or event coefficients and “a” is the attenuation coefficient
that forms the two equations in Table 4.6. This study has been based on data from a strong
M6.3 seismic event, albeit one that caused devastating damage and harm.
A New Geophysical Behaviour – Specific Surface Energy (SSE)
The description of natural hazard events generally includes type (or category), spatial
(location), temporal (when) and magnitude (size) characteristics.
The descriptions of event observers (and researchers) include both the magnitude of the event
and the magnitude of the impacts. Generally, these correlate if there is a clear understanding
of the attenuation or growth of the event or profile from the place of origin to the place or
time of impact. Nevertheless, in the typical presence of a large dataset, substantial data
processing techniques must be applied to consolidate and synthesise the data into useful
forms.
This includes means and averages which can take many forms including forms, which are
specifically applicable to different types of models and datasets.
7.7 People and Built Environment Behaviours
The Snowy Mountain environment, like most alpine environments, includes the commonly
expected natural hazards of floods, storms, bushfires, landslides and earthquakes. This
environment can be a more complex emergency situation than that for a general urban
(lowland or costal) environment. It has the same hazards in part because of the highly
variable topography, in part because the sparse road system limits access to event locations,
and in part, because the many remote areas of the region are not well known to stakeholders.
Earthquakes in montane regions bring a special set of attributes to the emergency situation.
Storms, blizzards, bushfires and commonly landslides are progressive events with a

244
significant warning time, varying from minutes to hours to days. Earthquakes are a special
case. The impact at full force occurs in a matter of seconds, and commonly triggers a series
of additional compound events giving little time to react and minimise impacts or maximise
response effectiveness.
Notably very few, if any, people become direct casualties of the earthquake energy release
itself, as it is essentially a shaking event only. Direct casualties suggest those who are
knocked over by the violent shaking and are severely injured or killed by their fall. It is the
series of subsequent or indirect impacts especially in moderate or large earthquakes that
cause damage and injury to people and property assets. Examples of the subsequent or
indirect impacts may include tsunamis, landslides and rock falls, urban fires, liquefaction and
building, or infrastructure collapses. These will occur typically in one of three scenarios:
Scenario 1 – Urban (lowland and coastal): a major urban earthquake will commonly cause
extensive building and infrastructure damage. This leads to casualties in the building
collapses or from falling debris in the seconds after the commencement of the event. The
secondary effect may be fires caused by fuel leakage or electricity short-circuits leading to
further casualties and extensive property and environmental damage.
Scenario 2 – Remote Montane: a remote montane or alpine earthquake may generate rock
falls, landslides avalanches and potentially water reservoir failures. The low level of built
environment in this scenario is likely to see limited damage to property assets and individual
or small group casualties. The landslide risk of valley fill embankments is significant where
such elements create the risk of downstream peak flood events.
Scenario 3 – Developed Montane. A developed montane environment may be equally
remote as scenario 2 and show similar compound events. The mountainous nature of the
region will likely lead to the development of alpine power stations (hydroelectric and wind
turbine), townships and tourist resort facilities. In addition to the compound events in
Scenario 2, there is a high risk of rock falls and landslides impacting villages, power stations,
dams and storage lakes leading to much larger dam breaches, and flooding. The event
impacts will be compounded by damage to road and communications infrastructure causing
major rescue and recovery impediments.
The Snowy Mountains Region includes some 20 dams and lakes of large and moderate sizes,
and there are also another 32 reservoirs in the wider SMR. Of particular note is the risk of
the quite different events of landslides and rock falls. These are subject to both rainfall as

245
well as seismic causes. A landslide will normally constitute a major shift in a large volume of
mountain-side towards the valley floor, along a slip plane parallel to the hillside and often
along much of the hillside height. A rock fall will normally be the falling or collapse of large
amount of steep cliff face or outcrop rocks that are released by horizontal forces.
A rock fall occurs when a large individual rock or a number of large rocks or boulders are
dislodged from an exposed rocky outcrop and, fall, tumble, or slide down the hillside. These
rocks, have been weathered significantly and are often spherical or ellipsoid in shape. More
significant is that rock falls, like landslides can occur during heavy rainfall as well as
earthquakes but rock falls are very likely to occur during smaller events due to their outcrop
exposure, size and shape as was evidenced in the 2010 / 2011 Canterbury (NZ) Earthquake
sequence.
7.8 Conclusions
This analysis strongly suggests that there is a calculable risk from earthquakes and
subsequent earthquake effect damage in the Snowy Mountains region based on established
models for (i) earthquake frequency – magnitude relationships and (ii) earthquake shaking
attenuation relationships. These models validate the interpolation of rocky hillside behaviours
in the four major 2010-2011 earthquakes near Christchurch, New Zealand.
The earthquake sequence, and all events being greater than magnitude 6, produced different
but comparable levels of rock fall hazard. This enables forecasting of hazard and damage
risks in the Snowy Mountains region. This also takes account of the distinct townships and
their particular topographic situations.
The forecast probability of a magnitude 5 event within the region of some 35,000 sq. km is
approximately 1.5% in any one year or a return period of about 60 years. The presence of
seven towns and villages (Thredbo, Perisher, Guthega, Charlotte Pass, Cooma, Talbingo and
Jindabyne) covering a combined area that is exposed to rock falls of about 100 sq. km
extends the probability by another 350 times to 0.004% in any one year and a return cycle of
approximately 20,000 years. Nevertheless, the rock outcrops above the resorts and townships
pose a specific risk not only from earthquakes, but to other geohazard events that lead to
landslides such as storms, and engineering failures, all of which have a much greater
frequency and return period.

246
7.9 A Vignette - An Historical Earthquake Remodelled
Event 16899: M6.7 at Te Anau, Fiordland NZ at 11.28am (local) Saturday, June 4 1988
Observations
The author while waiting in his car for the end of Saturday morning music classes at George
Street Normal School in Dunedin experienced this earthquake. The event caused significant
rocking of the car and strong shaking of street-side power poles and overhead power lines.
The shaking pattern suggested a combination of both Love and Raleigh surface waves as in
Chapter 5 (Figure 5.1) earlier. The local media reported the event but only referred to the
numerous landslips in Fiordland areas surrounding the epicentre and short local power cuts.
The author estimates a felt intensity in Dunedin at MM5.
GeoNet Official Record (Event ID 16899) shows:
Event Magnitudes: ML 6.1, MW 6.7, MS 6.5
The earthquake that shook the South Island of New Zealand on 3 June 1988 (UTC) was felt
most strongly in the Milford Sound - Te Anau - Manapouri area, and caused numerous minor
landslides and rock falls in the ranges of Fiordland. It was felt across an area that extended
from the southern shore of the South Island to Westport, and there was also a report of it
being felt as far away as Wellington. Although damaging intensities were only experienced in
sparsely populated areas, the earthquake disrupted the electricity supplies to Christchurch and
Invercargill when a switch at Manapouri Power Station was tripped.
Event Comparison Analysis
The Isoseismal Map (Figure 7.1) shows four felt reports in Dunedin: one MM4, two MM5
and one MM6. The comparison of the authors observations with the NZ MMI scale in
Chapter 2 (s2.5 above - Vignette: New Zealand Modified Mercalli Intensity Scale) would
strongly suggest a mid-range MM5 level for Dunedin.
The epicentre near Te Anau for the magnitude Mw 6.7 (73km deep) quake would suggest a
felt intensity of MM8 at the epicentre. This makes deeper Te Anau quake directly

247
comparable with the Christchurch Event II (Felt Intensity Plot, Figure 5.4) with a magnitude
M 6.3 and Intensity MM8. It suggests the attenuation equations derived in Chapter 5, which
are specific to an event the size and geology of Christchurch Event II, can be initially applied
to the Te Anau event with recognition for potential attenuation differences.
Event Attenuation Model Analysis
Key Parameters:
Distance from Te Anau to Dunedin = 250 km (note: log 250 = 2.4)
Epicentre: Magnitude Mw 6.7; Intensity MM8; Depth 73 km; and Specific Surface Energy =
30,000 (est) MJ/tonne (based on trend line Fig 5.11, and Table 5.7)
Model Equation 5.7 for the Canterbury Plains
log (SSE) = 5.6 - 2.3*log(DIST)
The attenuation factor 2.3 for the deep alluvium / colluvium based plains surrounding
Christchurch suggests a higher spatial attenuation rate than for the continuous granite / schist
ranges of Otago. It is suggested the 2.3 attenuation factor at 33% lower would then be 1.55.
Model Equation 5.7a for the Otago Ranges
log (SSE) at Dunedin = 5.6 – 1.55 * log(DIST) = 1.9
This gives a SSE of approximately 80 MJ / kg, which can be calculated in the model to give
the MM Intensity from the:
MMI / SSE conversion Equation 5.11
MMI (Dunedin) = 2 * log (SSE) + 1.6 = 2 * 1.9 + 1.6 = 5.4
This gives a calculated intensity, when rounded, of mid-range MM5 as observed above.
Summary:
The SSE / MMI conversion model development is not yet complete as it includes the
attenuation parameter specific to the central South Island. The Otago Granite Schist belt
attenuation factor is a preliminary estimate. Further development is required in other regions
to determine the attenuation factors in different lithosphere environments.

248
Figure 7.1 Isoseismal map of the Te Anau earthquake. Courtesy Downes, (1995) Atlas of
isoseismal maps of New Zealand earthquakes,

249
CHAPTER 8: CONCLUSION AND FUTURE RESEARCH
This concluding chapter sets out in four parts (i) a re-statement and summary review of the
research question findings, (ii) a summary of new knowledge discovered in the research
programme, (iii) a summary of past knowledge is refined including corrections to historic
misunderstandings and research findings, and, (iv) posing questions for future research.
8.1 The Research Question Set:
The Primary Research Question for this study is:
How should a structured system of natural hazard risk models be developed to enable the
quantified forecasting of natural disaster risk outcomes?
Response: To achieve the outcome outlined in the question, a great deal of ground work was
needed at the commencement of the study, to consider the nature of data generated in the
timeframe of a natural hazard leading to a disaster and how it might be applied to other
events. This work showed that most often, there is a weakly structured approach to collecting
raw data and building event models as event responder’s first priority is preservation of life
and property. Therefore developing a new approach to building models (for event decisions
or forecasting) was required. This new approach is termed transformation modelling where
selection is from a portfolio of representational model options, being the seven archetypal
models. It is then possible to transform raw and modelled data (data stream, data tables and
graphs etc.) into more useful model forms (formulae and transformation tables etc.) that
directly reveal generalised properties and relationships of the hazard / disaster system.
The Five Secondary Questions for this study are:
1. Is the ISO 31000 an effective framework for the structured system?
Response: The Thesis background research showed that although the ISO standard provides
for a quantitative model, in many actual cases, the populating of a model prescribed by the
standard results in a qualitative or semi-quantitative model with inconsistent application of

250
the basic rules of mathematics. This thesis shows that a well-structured framework can help
lead to a mathematically consistent model as was applied in the three situational studies. The
framework revealed that, as well as modelling data in subject studies for RIS and seismic
energy intensity and attenuation, transforming this data and developing new methods for
behavioural studies can provide an integrated quantitative model across the three domains.
These three domains were identified as those most important to natural hazards and disasters
being the two already used by ISO 31000 (likelihood and consequences) and a new domain
of human behaviour. The ISO 31000 matrix generally does not consider anthropological
influences for natural hazards such as climate change and other macro-global trends such as
population growth. This omission from the ISO 31000 system requires that anthropological
behaviours need to be amalgamated in the matrix model. The new domain approaches have
wide implications for achieving a better understanding of seismic and other natural events in
montane regions.
2. How might traditional representational models of historic events be transformed into
forecasting models for future events?
Response: Geohazard risks in exclusively natural environments are able to be modelled
comprehensively using the ISO 31000 likelihood – consequences matrix if good historic data
and mathematically consistent models are available.
This study shows that geohazard risks and events can be modelled simply in representation
models (e.g. tables and graphs) however to be fully useful the data needs to be modelled in
transformation models (e.g. equations and intensity maps) that are mathematically consistent,
based on sound geophysical principles, with anthropological influences removed. The
models so produced can forecast the probable likelihood and consequences of natural
disasters and enable planners and decision makers preparing for disaster response and
recovery to be better prepared for the location, scale and magnitude of future events.
3. Is the Gutenberg-Richter seismic likelihood / magnitude model of a region with strong
historic anthropological influences, able to be transformed for future natural hazard
event forecasting purposes?
Response: This thesis has shown that historic models for seismic probability (Gutenberg-
Richter Model ca. 1949), and intensity (MMI ca. 1902) can be modelled against modern data

251
to remove anthropogenic distortions, and correlated with mathematically robust
transformation energy models (SSE). If the mathematically consistent method developed in
his thesis for forecasting human behaviours in a natural hazard environment based on risk
awareness is applied to more situations to improve and prove its robustness, then a new
method for forecasting consequences and preparations based on long-term averages is
achieved. The method uses a consistent combination of qualitative and quantitative
measuring methods such as behavioural psychology, logarithmic data transformations and
dimensionless ratio models applied to an additional third domain to the two dimensional ISO
31000 matrix model. The formal ISO 31000 general risk assessment model is therefore
expanded into the three domains of likelihood, consequences and behaviour.
4. Is the qualitative Modified Mercalli Intensity scale of seismic event consequences able
to be transformed into a quantitative model that enables forecasting of damage across
a region with significant seismic and geological anomalies?
Response: Social science research and the effect of natural hazards and disasters on
communities as discussed in the opening introduction and literature review of this thesis have
brought a much greater focus by social and psychological sciences in risk and disaster
management. This has brought with it a strong focus on qualitative methods. In this study,
the historic usefulness of quantitative methods in geophysics, Newtonian physics, and a wide
range of more than twenty mathematical tools and techniques were all investigated for their
ability to undertake useful transformation modelling of seismic events. A foundation
modelling research study resulted in the newly defined seven archetypal modelling methods,
the demonstrated usefulness of graphical, logarithmic and qualitative transformations, and
most importantly structured economic systems modelling.
This leads to more reliable quantitative models that could be usefully applied to insurance
strategies, government funding and resourcing, and the building of safe communities.
5. Is the human awareness of natural hazard risks able be modelled to enable
forecasting of human involvement influences on future disaster event outcomes?
Response: The third (human behaviour) domain in the new ISO 31000 matrix model is based
on an assumption founded in research over several decades, that risk response behaviour is
generally aligned with knowledge or awareness of risk. This assumption enables an attitude

252
and knowledge survey to be uses as a proxy basis for quantifying future behaviours in a
natural hazard situation with psychometric methods and generating a behaviour ratio that will
provide the third domain as illustrated in Figure 1.6.
8.2 New Knowledge Discovered in this Project
Prologue: Three new Axioms about Real Things and Models
The prologue to this thesis is an “original formulation” of the interrelationships between
matter, energy, and information and therefore the role of these three fundamental, real things
in modelling. A significant amount of original research was conducted on this concept but
was not included in this thesis. The research touched Albert Einstein’s 1905 proof of the
equivalence of matter and energy (E=mc2) and that energy is real, not just disturbances in
the “ether” (Einstein 1905). It considered that Stephen Hawking’s’ discovery near black holes
and information at the event horizon (the conservation of quantum information, Hawking
2005), and Landauer’s Principle (Landauer 1961) on the physical energy required for the
creation, manipulation, and destruction of binary bits of information (>0.0172eV /bit), and
thereby to conclude that information is in itself, real. This thesis has opened this door to a
structured research programme in this area using the principles developed here.
Importantly, representational modelling is not enough. Extending the models into
transformational modes is required to make models useful tools for forecasting outcomes.
Discovery of the Seven Archetypal Models
To help bring further structure to the general research discipline of data and system
modelling, a search found 2,968 distinct examples of system models. These models were
examined for a range of attributes so that modelling approaches could be categorised, and
thence, a structured process for designing approaches for information transformations.
a. Modelling is a uniquely human capability, developed since pre-ancient times enabling
data creation and collection, management by processing into knowledge, and then
storing the processed knowledge for later recovery and use in future decision making.
b. It was found that there are seven archetypal model forms for modelling real
phenomena to explain past or existing situations, and for use in forecasting future
situations being: image, scale, table, narrative, formula, data (stream) and flow (chart).

253
c. Models and systems usage comes in many forms, often only differentiated by the
users’ intent rather than robust definitions. Standard system models have 10 basic
components, attributes and relationships. These can be escalated to a complex system
model definition with a further 10 complex components, attributes and relationships
that model and explain the rapidly emergent properties that inhabit the model.
d. A comprehensive definition of a model has been devised, being: a model is a
transformation of a phenomenon that enables its properties to be described in a new
manner to assist evaluation of its past behaviours, a description of its current status, or
the prediction of future behaviours, and the communication of all three.
e. A three-domain model of likelihood, consequences, and participant behaviours is
required to define in full an anthropologically influenced risky system.
f. A dimensionless behaviour parameter for anthropological variables meets the
scientific dimensions of frequency and magnitude in a spatial and temporal system
such as a natural hazard or disaster. This parameter is a ratio of attributes of the
situation demographic to the population demographic, since the non-anthropological
likelihood and consequence data is based on the geophysical system attributes.
Snowy Mountains Seismicity and RIS
The concept of transformation modelling of the likelihood domain in an IS0 31000 matrix
model was developed for and tested in examining the phenomena of reservoir induced
seismicity (RIS). Large dam and reservoirs have long been held responsible for increased
seismic activity. The greater Snowy Mountains Region (SMR) with 52 large dams and
reservoirs, the Geoscience Australia searchable online database of 14,472 earthquakes (M >
2.0) in the region since 1955, provides a well-defined system to test the validity of historic
claims, and to derive a robust transformation methodology for RIS evaluation.
a. The Gutenberg-Richter formula developed on inter-plate tectonic boundaries very
closely models the frequency-magnitude seismic relationship in the intra-plate SMR.
This means that unlike the wider Australian continental environment, the SMR
seismic data can be safely modelled using established models.
b. Reservoir Induced Seismicity (RIS) magnitude-frequency patterns appear not to
adversely affect the close fit of the Gutenberg-Richter model to a region’s seismic

254
history. This is demonstrated by both the raw seismic data, and the RIS excluded data
providing an almost perfect fit (with R2 = 0.9997) to the established Gutenberg-
Richter equation format being equation 4.3.
log (N) = 4.1 – 0.82*M (Eq. 4.3)
c. RIS is a relatively rare event occurring in just two of the 52 large dams and reservoirs
in the greater SMR. RIS results in a swarm of small or low magnitude seismic events
corresponding to dam completion and the first fill, and potentially giving an early
progressive release of otherwise stored seismic energy. This substitution of a few
large magnitude future events with a RIS swarm of small low energy events means
that RIS can cause the release of stored seismic potential energy in a steady low-
magnitude manner with a much lower risk of damage consequences.
Modelling Remote Seismic Damage through Surface Energy Intensity
For obvious economic and community reasons, research tends to be centred on places of
community importance such as towns and infrastructure that are most affected in a natural
disaster. There is much more to be learned about the nature of natural hazards and the
promulgation of damage causing energy by a study of the intervening spaces and developing
a regional approach to understanding how natural hazard energy is attenuated from the centre
of impact. The Canterbury earthquake sequence was a first major city impact of such
magnitude in New Zealand and so the economic and community cost was high. This study
seeks to understand the promulgation and attenuation of damage causing energy at distances
from the epicentre and to understand especially the anomalies in the models.
a. It was found the vector sum of the orthogonal (i.e. three dimensional) peak ground
acceleration (PGA) factors gives the most accurate measure of maximum dynamic
forces on the built environment of the four commonly used PGA methods.
b. The variability of duration of shaking for locations that suffered the same PGA means
that a time – acceleration measure, being the total specific surface energy, gives a
more reliable measure of likely total damage for local built environments during
Event II on 22 February 2011 of the Christchurch Earthquake Sequence and by
transformation modelling will do so for other seismic events.

255
c. The Specific Surface Energy (SSE) attenuates in the Canterbury region according to a
logarithmic transformation of distance (in kilometres) from the epicentre to give the
SSE in MJ/t according to Equation 5.7, with a very good fit (R2 = 0.92) for all field
data and an almost perfect fit (R2 = 0.97) when anomalous data is excised.
log (SSE) = -2.31*log(DIST) + 5.57 (Eq. 5.7)
d. The specific surface energy (SSE), a new measure of kinetic energy, maps closely to
the historic Modified Mercalli Intensity (MMI) giving a new quantitative method for
deriving the locational value to be used for event consequences forecasting, By
interpolation of the MMI plot (Figure 5.4) and the SSE attenuation equation (Figure
5.10 and Equation 5.7) a first estimate (with R2 = 0.98) of the relationship between
MMI and SSE specifically for Christchurch Event II is found in Equation 5.11 to be:
MMI = 2 log (SSE) + 1.6 (Eq. 5.11)
e. The Timaru Anomaly of significantly extended shaking during Canterbury Sequence
Event II, showed that Timaru is more exposed to the damaging specific surface
energy, almost a full order of magnitude (93%) greater than other locations of a
comparable distance from the epicentre of a major seismic event.
f. The Lyttelton Hanging Wall anomaly during Event II of below trend surface energy
flow showed that locations close to epicentre but on the hanging wall of this reverse
thrust fault have 80% lower energy intensity and appear to suffer less damage.
g. The Marlborough anomaly of a below trend specific surface energy during Event II
showed that in the Marlborough transition zone, representing a multi-fault complex
tectonic boundary system, seismic specific surface energy levels were greatly reduced
compared to other equidistant locations around and beyond the Alpine Fault. This
suggests that almost 90% of energy is absorbed in this transition zone.
h. Montane seismic events produce more damage from the release of potential energy
from buildings, cliff faces and exposed rock outcrops than the seismic shaking itself.
Behaviour Modelling in Natural Hazards
This study shows that generic likelihood and consequences data do not enable risk models to
be properly developed for human intensive or human influenced situations.

256
A modifying dimensionless parameter that creates a three domain model for risk is needed:
Risk = Likelihood * Consequences * Behaviour
a. Cognitive psychometric responses to mathematically incompatible parameters can be
blended by logarithmic transformations into like scales for risk assessment surveys.
b. Behavioural measurement can be successfully designed into the structure of the
method of a qualitative survey including scales such as the Likert, Ipsative, and
Weber-Fechner scales. In risk assessment surveys the Weber-Fechner scale lends
itself most readily to measurement of logarithmic human perceptions and behaviours.
c. The development of a three-domain risk assessment model of likelihood,
consequences and behaviour is assisted greatly by the use of logarithmic scales.
d. Logarithmic scales also permit parameter inversion and the use of qualitative
reasoning to ensure model consistency and integrity.
8.3 Past Knowledge, Inconsistencies and Uncertainties Refined
Seven Archetypal Models
Further to the new knowledge gained in this study there are a number of past modelling
approaches and issues that have been refined to make future modelling more effective.
These include:
a. Computerised modelling is a tool that enables the transformation of vast amounts of
data to be carried out efficiently. Computer models are not a separate type of model as
sometimes mis-named, as the computer’s role is typically to assist in processing large
amounts of data, within one of the seven archetypal model forms.
b. Effective systems modelling using one of the seven archetypal forms, requires careful
definition of the system under consideration, including whether it is an open or closed
system, and whether it is a standard or complex system.
c. Best practice models must be mathematically robust and must define: whether the
system(s) are open or closed, standard or complex; the need for clear boundaries,
domains, attributes, and relationships, to be dimensionally consistent, and to clearly
describe externalities, temporal and spatial characteristics, and assumptions.

257
Snowy Mountains Seismicity and RIS
RIS in the SMR has been a concern in a number of recent dam and reservoir projects with a
number of dams being quoted as examples. The lack of a clear method of identification has
overstated the risk numerically as well as assessment of risk from individual occurrences.
The study has successfully addressed a number of these problems such as:
a. Of the 50 large dams in the greater snowy mountains region, only two (Talbingo,
Thomson) exhibited clear evidence of RIS, and two previously identified RIS dams
(Eucumbene and Warragamba) did not exhibit evidence of RIS.
b. The M5.3 Berridale earthquake was not, as had been previously suspected by
Sandiford and Gibson, caused by reservoir induced seismicity,. This event and most
of the aftershocks including the three subsequent M4.0 earthquakes in the Cooma area
are almost certainly normal seismic activity associated with the Berridale Wrench
fault. It cannot be ruled out that a few of the shallow less than M2.0 earthquakes in
the region especially those around the periphery of the lake may be related to RIS.
c. The swarm of 253 earthquakes in the region of the headwaters of the Warragamba
Dam and its Lake Burragorang in 1973, some 13 years after dam completion are
almost certainly not the result of RIS. The swarm appears to be primarily related to
the nearby Macquarie fault and probably also the deeper profile of the nearby
Lapstone Nepean fault system. This conclusion is reached because the swarm is some
50km south of the dam where RIS swarms normally occur and the swarm occurred so
long after the completion of the dam. RIS swarms normally correspond to dam
completion and first fill being within 1-3 years of dam completion and occur under
the dam footprint or the deeper parts of the reservoir or lake.
d. The Thomson Reservoir in the southern Snowy Mountains region clearly
demonstrates an idealised example of RIS in the 53 earthquake swam. There have
been other earthquakes nearby probably caused by the Yallourn Fault rather than RIS.
This RIS is described in publications by Sandiford and Gibson with a sound analysis
of probable RIS mechanisms.
e. The Talbingo Dam in the SMR exhibits a clear example of RIS with it’s swarm of 53
(M>2.0) earthquakes close to the dam and under the lake, immediately following dam
completion and first fill in 1971.

258
Modelling Remote Seismic Damage through Surface Energy Intensity
The use of localised PGA as an immediate measure of damage risk from seismic events is
helpful because PGA dimensionally acts as a proxy for impact forces. In most cases the
extent of damage is also affected by the total energy absorbed and this is a combined measure
of PGA, plus the amplitude and duration of shaking. The past knowledge is a strong
foundation for this extension of analysis with conclusions as follows:
a. The overwhelming common practice of reporting the mean PGA as the horizontal
geometric mean in reports and research following the Canterbury (NZ) earthquake
sequence is most likely to be flawed, and under-reports the PGA of this extraordinary
sequence of earthquakes and associated risks, reducing the value of the lessons. The
origins of this mean appear to lie in the mechanical seismographs and simplistic 3D
orthogonal design practices that were already in service when the most advanced
building standard of its time ASCE-7 brought new seismic considerations into
mainstream building design.
b. Japanese practices and evidence from the three dimensional GEONET seismograms
demonstrate the peak PGA in all directions show simultaneous peaks and show little
evidence of independent oscillatory motions. The modern usage of electronic three
dimensional strain recorders together with the simultaneous 3D peaks supports a
move to 3D Vector Sum analysis of PGA.
c. It appears that building design standards that have embedded greater design safety
factors compensate for the consistent difference between geometric mean and vector
sum PGAs. However, the use of geometric mean for analysis of other seismic
behaviours in the human and built environment possibly introduces forecasting risk.
d. The combined roles of SSE attenuation, fault matrices, lithospheric structure
(including soil cohesivity) and the role of logarithmic transformations, enable possible
explanation of the Timaru (basalt shield), Marlborough (intra-zone), Banks Peninsula
(hanging wall), and Bexley (liquefaction) anomalies.
e. Many geophysical models fail to account for group behaviours, caused through a lack
of mathematical and dimensional consistency, and less than structured methods or
clarity in modelling and simulation in psychometric models.

259
Behaviour Modelling in Natural Hazards
It has been indicated that anthropological factors influence risk assessment outcomes but a
dimensionally consistent approach has not been developed previously. This study provides a
basis for analysing the appropriateness of current and past methods, including:
a. The use of a logarithmic transformation for psychological responses to natural hazards
is appropriate and reflects a human tendency to consider and prioritise awareness of
consequences and losses on logarithmic scale (either base 10 or Napierian).
b. An important assumption in behavioural modelling is that participants will behave
rationally according to their knowledge and objectives. Irrational behaviour appears to
occur but mostly that is a misunderstanding of the participant’s cognitive priorities.
8.4 Limitations of the Study
This integrated research project approach to an ISO 31000 risk model structure has
encountered a number of limitations which are described and discussed here.
a. Single Disaster Event Data. The most significant limitation of this study is the non-
availability of adequate data to undertake an integrated risk study of a single major
montane natural hazard event, where the relationships between likelihood,
consequences and behaviours can be seen in a single event model.
Instead, the study undertakes three situational studies of distinct, but related and
comparable situations in montane seismicity to build a research data based (positivist)
model and demonstrate how the three domains of likelihood (Montane Seismic
forecasts including Reservoir Induced Seismicity), consequences (Montane Seismic
Intensity Attenuation) and behaviours (Snowy Mountains Region residents and
visitors) can be transformation modelled.
The models, as shown in Figure 1.6, can be integrated for a future natural hazard
event to create a comprehensive risk model in three domains.
b. Significance Testing of Power Law Data. A further limitation arises from the
widespread applicability of power law and logarithmic transformation models in
natural and psychometric systems, and the limited applicability of linear hypothesis

260
testing methods for significance in these areas. In general hypothesis significance
testing requires two independent sample sets, parameters with continuous values, and
both samples normally distributed. These criteria are often not available in natural
systems such as medical (psychological and pharmaceutical) research as well as
natural hazard data systems.
A positivist approach in this mathematical environment creates a number of statistical
method challenges. Instead the three situational studies use semi-manual and visual
comparison methods for comparison, contrast and fit. These include trend line
variance testing of fit to formula models (R squared - MS Excel). Visual tests include
measures of central tendency such as comparisons of median, mode, and mean, plus
data dispersion to compare samples from the same population for material differences
in values and dispersion.
c. Forecasting from Gutenberg-Richter Law. By its very nature forecasting involves
extrapolation beyond known data. Table 4.9 forecasts the possible probability of
future earthquake events in the Snowy Region and gives indicative recurrence
intervals, with numbers rounded to reflect the uncertainties. While there is no hard
rule, in general it is reasonable to extrapolate to one or two orders of magnitude above
the highest recorded event (M5.3 1959 at Berridale).
This indicates that the recurrence interval of once per 60 years for event 5.0 < M < 5.9
is appropriate and the interval for 6.0 < M < 6.9 a recurrence interval of 400 years is
reasonable. For 7.0 < M < 7.9 a recurrence interval of 2,500 years is somewhat
speculative and therefore a limitation of this risk assessment approach to forecasting
very large seismic events in this area.
d. Psychometric Measurement of Group Behaviours. Psychometric measures are
used widely in human resource management to assess likely job candidate behaviours.
They often go beyond the limits of this approach for forecasting future behaviours.
In this study psychometric measurement is intended to forecast (not predict time and
place etc.) likely future behaviour trends of demographic groups of people (not
individuals) in the Snowy Mountains Region based on their role, risk awareness, and
knowledge. As described in the text of Chapter 6 this is a reasonable approach, but as

261
clearly stated, this approach cannot reliably predict (in time and place) the behaviours
of groups or individuals in the described situations.
e. ISO 31000 Structures. The ISO 31000.2009 Risk Management Standard is
primarily an international management tool for the management of risk and safety in
many spheres of human endeavour. It is a two-domain model based on the historic
Fermat-Pascal expectation model of 1654, and has been proven to be a very useful
tool in bringing multi-disciplinary knowledge from multiple time periods and multiple
locations into a single model to assess risk levels and changes or trends in risk levels.
It does not make events more or less risky by itself, but merely enables the integration
of vast amounts of information and the assessment of risk across multiple domains.
f. Well Posed Problems: The application of everyday mathematical techniques to
everyday situations is always problematic. The challenges of boundary conditions,
data anomalies, and data measurement make achieving meaningful outcomes difficult
– but this is not a good enough reason to not do it. Within the limitations mentioned in
this study has shown that the proper application of well posed problem methods can
result in meaningful quantitative models of multi-disciplinary problems such as
forecasting risk within major natural disasters. The introduction vignettes illustrate
common issues to overcome in some different disaster types (storms, floods,
landslides and wildfires) that indicate this approach is may be successful here also.
8.5 Questions for Future Research
Prologue: Three new Axioms about Real Things and Models
The prologue to this thesis is an “original realisation” of the interrelationship concept
between matter, energy, and information and therefore the role of these three fundamental
real things in modelling.. As noted in s8.2 above, this thesis has opened this door to a more
structured research programme in this area using the principles developed herein.

262
Specifically the thesis develops two new concepts for models, being whether models are
representational or transformational. The properties, features and limitations of representation
or transformation models across the seven new archetypal model types need detailed
investigation and definition, and whether these two concepts have unique properties, or have
gaps or overlaps. This two concept distinction may likely have significant positive impacts
on research project design and interpretation enabling more structured design and more
reliable conclusions.
Seven Archetypal Models
Having developed an integrated and mathematically robust method for risk assessment that
includes a number of systems modelling definitions and structures, there is an opportunity for
further research that strengthens these definitions:
a. Does the “seven archetypal forms model” analysis provide a wider explanation of
how people observe, learn and store information for archiving or recall and use when
required? In other words is modelling more than a data transformation process, so
when carried out in a structured manner, goes to the heart of knowledge management?
b. How can the much confused current use of standard and complex models, their
elements, attributes, and relationships, be developed into a more systematic academic
discipline that uses sound mathematical and statistical methods, as well as academic
tools of human logic and behaviours to simulate real work and research matters more
usefully. Is this a new direction for mathematics as an academic discipline or a
building on existing methods?
Snowy Mountains Seismicity and RIS
This project has challenged a number of traditional RIS theories and provided a new structure
based on adjacent seismic behaviour for 52 SMR dams.
Are these conclusions globally valid, or in other words:
a. Does the Gutenberg- Richter formula model apply to a defined set of seismic events
in specific RIS swarms, recognising the data set is often quite small?

263
b. Are there clear instances of Reservoir Induced Seismicity (RIS) in the global seismic
domain that are not defined by the formula, spatial, and temporal modelling method
developed in this study?
Modelling Remote Seismic Damage (MMI) through Surface Energy Intensity (SSE)
The specific surface energy method developed and tested in this study for Event II needs
further study to find its applicability over a wider range of tectonic and seismic settings.
a. This study tested intra-plate settings, some 200 km from plate boundaries, however
will it be as useful for tectonic plate boundary settings
b. Its potential usefulness will depend entirely on a data to specific surface energy value
algorithm that is able to process digitally generated data streams of acceleration and
oscillation displacement to obtain a specific surface energy (work done) measure from
modern seismograph electronic devices in real time.
c. The Timaru, Banks Peninsula Hanging Wall and Marlborough transition zone
anomalies of the 2011 Christchurch earthquake (Event II) need to be tested in other
seismic events to confirm their general applicability and to ascertain the validity of
the explanations hypothesised in this thesis.
d. The Bexley Anomaly having been identified as a risk area in the 1997 CAE report
suggests that specific surface energy analysis may give an improved method for
consequences forecasting in liquefaction prone seismic zones.
e. The attenuation factor in the SSE attenuation plot and the equation is representative of
gravel-sand-loess alluvium / colluvium of the Canterbury Plains surrounded by the
mixed volcanic, sedimentary loess valleys, mixed sedimentary uplands and heavily
eroded montane environments. Testing the attenuation factor in other geological
environments such as a contiguous granitic and schist montane plateau is needed to
generalise the model equations found.
Behaviour Modelling in Natural Hazards
The introduction of structured behaviour modelling based on knowledge and attitudes
towards montane safety has been developed here using a relatively simple survey method.
To fully validate the methods as robust, further research is needed, specifically:
a. Rules for well posed problems in psychometric surveys and research

264
b. Research data that is transformed by quantifiable scales and relationships, into
measurable risk related behaviours needs to be better understood. Can the
development of structured measurement tools such as scaling bring a more robust
quantitative approach to qualitative disaster behaviour psychology?
c. This study modelled cognitive processes in at-risk situations and assumes (based on
research evidence) that behavioural responses are indicated by cognitive responses to
posed questions. Is there is a need to better understand the modern emotional
responses to the role of risk and place in human settlement, as described in Central
Place Theory?
d. Why do regulatory organisations continue to permit risky settlement and
developments after considering the known economic and human risks from natural
hazards in those places?
e. Why is the dysfunctional behavioural relationship between knowledge and emotion
often seen in risky places and settlements (with natural hazard risk) not clearly
understood, and would it benefit from further research?
f. The limitations of normal significance testing for logarithmic transformations is
widely recognised, but there could be a more structured approach to visual testing
developed, or an alternative non-parametric statistical method might be adapted to
give wide application in biomedical and psychological research.
g. Can better communication of risk assessments, alongside the further development of
the behavioural ratio in a three-domain risk assessment model lead to better settlement
decisions? Some Local Government Areas (LGAs) undertake outstanding efforts to
communicate natural hazard risk, for example the FloodWise Property Reports
website in Brisbane, Queensland, while others see it as an investment deterrent, such
as with climate change risk and estimates of ocean level rise.

265
REFERENCES AND BIBLIOGRAPHY
Abbott, P., Wallace, C., Beck, M. (2006) Chernobyl: Living with risk and uncertainty,
Health, Risk & Society, June 2006; 8(2), pp 105-121.
Abbott, P. L. (2008) Natural Disasters (6th
Ed). McGraw Hill, New York, ISBN 978-0-07-
305034-8, pp 1-510.
ABS (2012a) Household Income and Income Distribution Report, Australian Bureau
Statistics, Canberra, 2011-12, Report Cat No. 6523.0, ISSN 1448-5648, pp 1-108.
ABS (2012b) Regional Population Growth, Australia (Estimated Resident Population, Local
Government Areas, NSW) Australian Bureau of Statistics, Canberra, Cat: 3218.0.
Actons (2014) Injury Values, Poster, Actons Injury Solicitors, Retrieved from
http://www.actons-solicitors.co.uk/injury-values, 7 October 2014.
Actuaries (2012) National pool to subsidise high insurance premiums the best solution, says
Actuaries Institute, Australian Institute of Actuaries, 50 Carrington Street, Sydney NSW,
Media Release, 18 January 2012.
AGD (2011) National Strategy for Disaster Resilience, Attorney-General’s Department,
Barton, ACT, February 2011, ISBN: 978-1-921725-42-5, pp1-14.
AGD (2012) National Strategy for Disaster Resilience: Companion Booklet, Attorney-
General’s Department, Barton, ACT, 2012, ISBN: 978-1-922032-27-0, pp 1-44.
Ahmed, E., Elgazzar, A. S., & Hegazi, A. S. (2005) An Overview of Complex Adaptive
Systems, Retrieved from http://arxiv.org/abs/nlin/0506059, 28 June 2005, pp 1-26.
AIC (2008a) Proportion of deliberate bushfires in Australia, Poster, Bushfire Arson Bulletin
no. 51, March 2008, Australian Institute of Criminology, Canberra, ISSN 1832-2743.
AIC (2008b) Weekly Patterns in Bushfire Ignitions, Poster, Bushfire Arson Bulletin no. 55,
October 2008 Australian Institute of Criminology, Canberra, ISSN 1832-2743.
Alexander, B., (2000) The definition of system, Kybernetes, Vol. 29, Issue: 4, pp 444 – 451.
Allen, T., Gibson, G., & Hill, C. (2000) The Thomson Reservoir Triggered Earthquakes,
Australian Earthquake Engineering Soc. 2000 Conf., November 18-20, Paper No. 8, pp 1-8.
Armitage, P., Berry, G., Matthews J.N.S., (2002) Statistical Methods in Medical Research,
Blackwell Science, Massachusetts, USA, ISBN 0-632-05257-0, pp 1-826.

266
Armytage, P. (2010) Witness Statement to the 2009 Victorian Bushfires Royal Commission,
28 April 2010, Secretary for Department of Justice, State of Victoria, Document Number
WIT.3003.002.0001, pp 1-46.
Ashby, S. (2010) The 2007-09 Financial Crisis: Learning the Risk Management Lessons,
Financial Services Research Forum Report, University of Nottingham, UK, pp 1-50.
ASCE 7-10 (2010) Minimum Design Loads for Buildings and Other Structures, American
Society of Civil Engineers, Standard ASCE/SEI 7-10, pp 1-658.
Aubry, J., Passelègue, F. X., Deldicque. D., Girault, F., Marty, S., Lahfid, A., Bhat, H. S.,
Escartin, J., Schubnel, A. (2018) Frictional Heating Processes and Energy Budget During
Laboratory Earthquakes, Geophysical Research Letters, Vol 45, Issue 22, 28 Nov 2018, 8 pp
Aurecon (2012) Rockhampton Regional Council Natural Hazards Risk Assessment: Final
Report, Prepared for: Rockhampton Regional Council Project #210202, Aurecon Australia
Pty Ltd, Brisbane, Australia, pp 1-225.
Aven, T., (2014) Implications of black swans to the foundations and practice of risk
assessment and management, Reliability Engineering & System Safety, Volume 134, 2015,
https://dx.doi.org/10.1016/j.ress.2014.10.004, pp. 83-91,
Aven, T., (2016) Risk assessment and risk management: Review of recent advances on their
foundation, European Journal of Operational Research, Volume 253, Issue 1, 16 August
2016, https://doi.org/10.1016/j.ejor.2015.12.023, pp 1-13,
Ballarini, P., Guerrieroy, M. L., & Hillstonz, J. (2009) Qualitative Reasoning of Stochastic
Models and the Role of Flux, Proceedings 23rd
Annual Workshop on Qualitative Reasoning
22 - 24 June 2009, Ljubljana, Slovenia, pp 1-10
Balint, A. M., Balint, S. (2011) Well posed problem in sense of Hadamard, for a source
produced acoustic perturbation propagation in a lined duct, carrying a gas flow, Carpathian J.
Math. 30 (2014), No. 3, pp 267 - 274
Barbosa, S.M., 2011: Testing for Deterministic Trends in Global Sea Surface Temperature. J.
Climate, 24, https://doi.org/10.1175/2010JCLI3877.1, pp 2516–2522,
Barnes, M. D., Hanson, C. L., Novilla, L., Meacham, A. T., McIntyre, E., & Erickson, B. C.
(2008) Analysis of Media Agenda Setting During and After Hurricane Katrina: Implications
for Emergency Preparedness, Disaster Response, and Disaster Policy, American Journal of
Public Health, Vol. 98, No. 4, pp 604-610.

267
Baron, H. (1996) Strengths and limitations of ipsative measurement, Journal of Occupational
and Organizational Psychology, 69, pp 49-56.
Batzle, M., Duranti, L., Rector, J., Pride, S., (2007). Measurement and Interpretation of
Seismic Attenuation for Hydrocarbon Exploration, Colorado School of Mines for Department
of Energy Grant Agreement: DE-FC26-04NT15505. DOI:10.2172/927592. Pp 1-34.
Bayrak, Y., Yilmazturk, A., Ozturk, S. (2002) Lateral variations of the modal a/b values for
the different regions of the world, Journal of Geodynamics 34, pp 653-666.
Berry, B. J. L., & Garrison, W. L. (1958) The functional bases of the central place hierarchy,
an empirical analysis of central place theory, Economic Geography 34, pp 145-54.
Berry, M., Garcia-Blanco, I., Moore, K (2015) Press Coverage of the Refugee and Migrant
Crisis in the EU: A Content Analysis of Five European Countries, Report prepared for the
United Nations High Commission for Refugees (December 2015) , pp 1-277.
Berry-Stölzlea, T. R., Weissb, M. A., & Wendec, S. (2011) Market structure, efficiency, and
performance in the European property-liability insurance industry, American Risk &
Insurance Association (ARIA), Annual Meeting July 2011, San Diego, CA, pp 1-28
Berryman, K. (2012) Geoscience as a component of response and recovery from the
Canterbury earthquake sequence of 2010–2011, New Zealand Journal of Geology and
Geophysics, 55:3, pp 313-319.
Berryman, K. R., Cochran, U. A., Clark, K. J., Biasi, G. P., Langridge, R. M., & Villamor, P.
(2012) Major earthquakes occur regularly on an isolated plate boundary fault, Science 336,
DOI: 10.1126/science.1218959, pp 1690-1693
Bertalanffy, L. von, (1969) General System Theory; Foundations, Development Applications,
revised edition (1976), George Braziller, New York, ISBN 978-0-8076-0453-3, pp 1-295.
Bisztricsany, E. A., (1958) A new method for the determination of the magnitude of
earthquakes. Geofizikai. Kozlemenyek., VII, pp 69-76.
Bixel, P. B., & Turner, E. H. (2000) Galveston and the 1900 Storm: Catastrophe and
Catalyst, University of Texas Press, Austin, ISBN 0-292-70884-X, pp 1-174.
Blackburn, S., & Johnson, C. (2012) Making Cities Resilient Report 2012. My city is getting
ready! A global snapshot of how local governments reduce disaster risk, (2nd
Ed.) UNISDR,
ISBN: 978-92-1-132036-7, pp 1-116.

268
Blewett, R.S. (ed.), (2012) Shaping a Nation: A Geology of Australia, Geoscience Australia
and ANU Press, Canberra, pp 1-571.
Bock, G., & Denham, D. (1983) Recent earthquake activity in the Snowy Mountains region
and its relationship to major faults, Journal Geological Society Australia, 30, pp 423-429.
Booth, J.L., & Siegler, R.S. (2006) Developmental and individual differences in pure
numerical estimation, Developmental Psychology 42(1), pp 189-201.
Bouwer, A., & Bredeweg, B. (2010). Graphical means for inspecting qualitative models of
system behaviour, Instructional Science, 38(2), pp 173-208.
Bovera, F., Spanghero, M. Galassi, G., Francesco, M. F., & Buccioni, A. (2003)
Repeatability and reproducibility of the Cornell Net Carbohydrate and Protein System
analytical determinations, Ital. J. Animal Sci. Vol. 2, pp 41-50.
Bowland, G., (2011) Impacts of remote low level seismic events on the Monaro region NSW,
Australian Earthquake Engineering Society Conference, 18-20 November 2011, Novotel
Barossa Valley, South Australia, pp1-6.
Bradley B. A. (2012) Ground motions observed in the Darfield and Christchurch
earthquakes and the importance of local site response effects, New Zealand Journal of
Geology and Geophysics, 55:3, pp 279-286.
Brady, C. (2018) Modelling and the representational imagination, ZDM Mathematics
Education 50: 45. https://doi.org/10.1007/s11858-018-0926-4, pp 45-59.
Bray, G. (1998) 1996 Census of Population and Housing, Selected Characteristics for Urban
Centre and Localities: NSW and ACT. Australian Bureau of Statistics, Canberra, 29 Jan 1998.
ABS Catalogue No. 2016.1, ISBN 0642-23221-0, pp 1-90.
Bredeweg, B., Linnebank, F., Bouwer, A., & Liem, J. (2009) Garp3 - Workbench for
qualitative modelling and simulation, Ecological informatics, 4(5), pp 263-281.
Bredeweg, B., & Salles, P. (2009) Mediating conceptual knowledge using qualitative
reasoning, in: Jorgensen, S.V., Chon, T-S., Recknagel, F.A. (eds.), Handbook of Ecological
Modelling and Informatics, Wit Press, Southampton, UK, pp 351-398.
Bredeweg, B., Salles, P., Bouwer, A., Liem, J., Nuttle, T., Cioaca, E., Nakova, E., Noble, R.,
Caldas, A. L. R., Uzunov, Y., Varadinova, & E., Zitek, A. (2008) Towards a structured

269
approach to building qualitative reasoning models and simulations, Ecological Informatics,
Vol. 3, Issue 1, pp 1–12.
Brown, R. G. (2013a) Introductory Physics I, Elementary Mechanics, Duke University
Physics Department, Durham, NC, © Robert G. Brown, 1993, 2007, 2013 pp 1-536.
Brown, R. G. (2013b) Introductory Physics II, Electricity, Magnetism and Optics, Duke
University Physics Department, Durham, NC, 3 September 2013, © Robert G. Brown 1993,
2007, 2013 [online and print], pp 1-451.
Brownlie, M., (1992) Kismet for Kelso, published by May Brownlie, Gore Publishing Co.,
Gore, NZ, pp 1-432.
Bruss, F. T., & Ruschendorf, L. (2010) On the perception of time, Gerontology Vol. 56 No.4,
pp 361-370.
Buckley, W. F. (1967) Sociology and modern systems theory, p39, Prentice-Hall Sociology
Series, Prentice-Hall, University of Michigan, pp 1-227.
Buldeyrev, S.V., Parshani, R., Paul, G., Stanley, H. E., & Havlin, S., (2010) Catastrophic
cascade of failures in interdependent networks, Nature, Vol 464, 15 April 2010,
doi:10.1038/nature08932, pp 1025-1028
Burbidge, D.R. (ed.), 2012. The 2012 Australian Earthquake Hazard Map. Record 2012/71.
Geoscience Australia: Canberra. ISBN 978-1-922201-04-1 (PDF), pp 1-116
Bürkner, A., & Simmen H. P. (2008) Fractures of the lower extremity in skiing - the
influence of ski boots and injury pattern, Sportverletz Sportschaden, 22(4), pp 207-212.
Bushwalking Victoria (2011) Risk Management Guidelines for Bushwalking Victoria
Member Clubs, Version 3.0, pp 1-18.
Byram G., M. (1959) Forest fire behaviour. In: Forest Fire Control and Use, Chapters 3 and
4, (ed. K.P. Davis). McGraw-Hill, New York, pp 1-584.
CAE (1997), Risks and Realities, A Multi-disciplinary Approach to the Vulnerability of
Lifelines to Natural Hazards, Centre for Advanced Engineering, University of Canterbury,
NZ, , ISBN 0-908993-12-9, pp 1-312.
Campbell, D., Brougham, J., & Caldwell, R. (2009) Uncovering and understanding
Australia’s first railway, Institution of Engineers Australia, 2009 Australian Journal of Multi-
disciplinary Engineering, Vol. 7, No. 2, pp 147-156.

270
Cannon, S. H., & Highland L. (2005) Southern California - Wildfires and Debris Flows, U.S.
Geological Survey, Fact Sheet 2005–3106
Carr, V. J., Lewin T.J., Carter, G.L., & Webster, R.A. (1992) Patterns of service utilisation
following the 1989 Newcastle earthquake: findings from Phase 1 of the Quake Impact Study.
Australian J Public Health. 1992. Vol. 16 No. 4, pp 360-369
Carvalho J.M., Cavalheiro, A.T., & Teixeira, P. (2007) Tunnelling in an urban critical area –
A case study, Underground Space – the 4th Dimension of Metropolises, Barták, Hrdina,
Romancov & Zlámal (eds), Taylor & Francis, London, ISBN 978-0-415-40807-3, pp953-959
CDEM (2010) Community Engagement in the CDEM context—Best Practice Guide, Version
1.0, Ministry of Civil Defence & Emergency Management, New Zealand, pp 1-36.
CERC (2012) Canterbury Earthquakes Royal Commission Reports, Volumes 1-3 © New
Zealand Department of Internal Affairs, Wellington, NZ.
Chang, M. D., Wetzel, J., & Forbus, K. D. (2011) Qualitative and quantitative reasoning
over physics textbook diagrams, Proceedings of the 25th International Workshop on
Qualitative Reasoning, Barcelona, Spain, pp 16-18,
Chen, D. (2000) Simplified Ship Collision Model, Virginia Polytechnic Institute and State
University, Blacksburg Virginia, pp 1-104.
Choy, G. L., & Boatwright, J. L. (2012) Radiated seismic energy and energy magnitude, U S
Geological Survey, Denver, CO, DOI: 10.2312/GFZ.NMSOP-2 IS 3.6, pp 1-9.
Clarke, L. (1999) Mission improbable: using fantasy documents to tame disaster, University
of Chicago Press, Chicago, IL, ISBN: 978-0-2261094-2-8, pp 1-225.
Cleary, J.R. Doyle, H.A. & Moye, D.G. (1962) Seismic Activity in the Snowy Mountains
region and its relationship to geological structures, Australian Journal of Earth Sciences,
Volume 11, Issue 1, pp 89-106.
Cleary J.R., (1977) Australian seismicity studies: a historical survey, Earthquake Information
Bulletin, No.9, pp 4-8.
COAG (2012) Business Advisory Forum - Major Project Approvals Reforms, Prepared by the
States and Territories for the COAG Business Advisory Forum, December 2012, ©
Australian Department for Prime Minister and Cabinet, 6 December 2012, pp 1-23.

271
Cochran, U. A., Clark, K. J., Howarth, J. D., Biasi, G. P. Langridge, R. M. Villamor, P.,
Berryman, P. K. R., & Vandergoes, M.J. (2017) A plate boundary earthquake record from a
wetland adjacent to the Alpine fault in New Zealand refines hazard estimates, Earth and
Planetary Science Letters 464 (2017), pp 175–188.
Convertito V. (2004) Extension of classical attenuation laws: Effects and Implications on the
Probabilistic Seismic Hazard Analysis, Università degli Studi di Napoli “Federico II”.
Crichton, D. (1999) ‘The risk triangle’ in J. Ingleton (editor) Natural Disaster Management.
Tudor Rose, London, pp. 102–103.
Christaller, W. (1933) Central Places in Southern Germany, translated by C.W. Baskin,
Englewood, NJ: Prentice Hall, 1966, pp 1-230.
Cummins, J. D., & Weiss, M. A., (1993) Measuring cost efficiency in the property-liability
insurance industry, Journal of Banking and Finance 17, pp 463-481.
Curlee, W. & Gordon, R. (2011). Risk management through the lens of complexity— the BP
oil crisis. Paper presented at PMI Global Congress 2011—EMEA, Dublin, Ireland. Newtown
Square, PA: Project Management Institute.
Cutter, S.L., Barnes, L., Berry, M., Burton, C., Evans, E., Tate, E., & Webb, J. (2008) A
place-based model for understanding community resilience to natural disasters, Global
Environmental Change 18, pp 598–606.
DeCoste, D. (1991) Towards a Qualitative Theory of Safety Control, When and How to Panic
Intelligently, Qualitative Reasoning Group, Institute for the Learning Sciences, Northwestern
University, Evanston Il, Technical Report # 14 May, 1991, pp1-27
Dehaene, S., Izard, V., Spelke, E., & Pica, P., (2008) Log or Linear? Distinct Intuitions of the
Number Scale in Western and Amazonian Indigene Cultures, Science, Vol. 320, Issue 5880,
pp 1217-1219.
Denham, E. (Ed) (1976) Seismicity and Earthquake Risk in Eastern Australia, A Symposium
held in Canberra on 5 December 1973, Bureau of Mineral Resources, Geology and
Geophysics, Bulletin No. 164, ISBN 0 642 02011 6, pp 1-83.
Despain, D. (2010) Early Humans Used Brain Power, Innovation and Teamwork to
Dominate the Planet, Scientific American, February 27, 2010, permanent address:
http://www.scientificamerican.com/article.cfm?id=humans-brain-power-origins.

272
Devlin K., (2010) the Pascal-Fermat Fermat Correspondence, How Mathematics Is Really
Done, Vol. 103, No. 8, April 2010, Mathematics Teacher, pp 578-582.
Dickson T.J. (2009). An exploration of risk management strategies in regional tourism
businesses: the case of the Eurobodalla region, published in: Crisis Management in the
Tourism Industry, Ashgate (Surrey), UK, Chapter 12, ISBN 9780754673804, pp 187-205.
DNSW (2013a), Travel to Snowy Mountains: Year to March 2013, Destination NSW,
Sydney, NSW, pp 1-2.
DNSW (2013b), Travel to Snowy Mountains: Year to September 2013 Destination NSW,
Sydney, NSW pp 1-2.
Doheny, E.J., Dillow J. J. A., (2002) Adjustments to USGS Peak-Flow Magnitude-Frequency
Relations in Delaware and Maryland Following Hurricane Floyd, September 1999, USGS
Fact Sheet FS-152-02, 2002, pp 1-8.
Dowdy, A.J., Mills, A. Finkele, K., & de Groot, W. (2009) Australian fire weather as
represented by the McArthur Forest Fire Danger Index and the Canadian Forest Fire
Weather Index, CSIRO, BOM, CAWCR Technical Report No. 10, ISBN: 978-1-92160518-5,
pp 1-90.
Downes, G.L. (1995) Atlas of isoseismal maps of New Zealand earthquakes, Monograph 11,
Institute of Geological & Nuclear Sciences, ISBN 0-478-09502-3, pp 1-304
Dowrick, D.J. (1996) The Modified Mercalli scale – revisions arising from recent studies of
New Zealand earthquakes, Bulletin of the NZ National Society for Earthquake Engineering,
Vol. 29(2), pp 92-106.
Dowrick, D.J., Hancox, G. T., Perrin, N. D., & Dellow, G. D., (2008) The Modified Mercalli
Intensity Scale – Revisions Arising from New Zealand Experience, Bulletin of the NZ
National Society for Earthquake Engineering Vol. 41(3), pp 193-205.
Drabek T. E. (2007) Social Problems Perspectives, Disaster Research and Emergency
Management: Intellectual Contexts, Theoretical Extensions, and Policy Implications,
American Sociological Association, New York, Annual Meeting, August 2007, pp 1-114
Drummond, B. (2016). Review of Hydrofracturing and Induced Seismicity. Record 2016/02.
Geoscience Australia, Canberra. http://dx.doi.org/10.11636/Record.2016.002, pp 1-109.

273
Easthaugh, C. S., & Vacik, H. (2012) Fire size - frequency modelling as a means of assessing
wildfire database reliability, Austrian Journal of Forest Science, Vol. 129 (3-4), pp 228-247.
Einstein, A., (1905) Does the Inertia of a Body Depend upon its Energy Content, based on the
English translation of the original 1905 German paper (published as “Ist die Trägheit eines
Körpers von seinem Energiegehalt abhängig?”, in Annalen der Physik. 18:639, 1905, pp1-3.
Einstein, A. (1921) Sidelights on Relativity, Two addresses: 1: (Ether and Relativity) to the
University of Leyden (1920), and 2: (Geometry and Experience) to the Prussian Academy of
Sciences in Berlin in 1921, Translated into English by G. B. Jeffery, and W. Perrett,
Methuen, London, 1922, pp 1-28.
Einstein, A. (1925) Einheitliche Feldtheorie von Gravitation und Elektrizit at Preussische
Akademie der Wissenschaften, Phys.-math, Klasse, Sitzungsberichte, pp 414–419.
(Translation: Unified Field Theory of Gravitation and Electricity).
Eisenack K. (2007) A common framework for qualitative and quantitative modelling,
Proceedings of the 21st Qualitative Reasoning Workshop, June 27-29 2007, Aberystwyth
UK, pp 1-8.
Ekeberg, O., Wallen, P., Lansner, A., Traven, H., Brodin, L., & Grillner, S. (1991). A
computer based model for realistic simulations of neural networks, Biological Cybernetics,
65, pp 81-90.
Engel, C. B., Lane, T. P., Reeder, M. J., & Rezny, M. (2013) The Meteorology of Black
Saturday, Q. J. R. Meteorol. Soc. 139, April 2013, DOI:10.1002/qj.1986, pp 585–599.
Environment Canterbury (ECan 2004), The Solid Facts on Christchurch Liquefaction, Poster
© Canterbury Regional Council, Christchurch.
Evans, R. (2009) Disasters That Changed Australia, Victory Books, Melbourne University
Publishing, Carlton, ISBN 978-0-522856-649-1, pp 1-198.
Eves, H. W., (1992) An introduction to the history of mathematics, The Saunders series (6th
ed.), Section 9-3, Saunders, Philadelphia, ISBN 978-0-03-029558-4, pp 1-775
Faiers, G. E., Keim, B. D., & Muller R. A. (1997) Rainfall frequency/magnitude atlas for the
south central United States, SRCC Technical Report 971, Southern Regional Climate Centre,
University of Louisiana, LA, ISBN 0-938909-67-3, pp 1-41.

274
Fatichi, S., Barbosa S. M., Caporali E., & Silva M. E. (2009) Deterministic versus stochastic
trends: Detection and challenges, J. Geophys. Res., vol 114, D18121,
doi:10.1029/2009JD011960, pp 1-11
Federal Emergency Management Agency (FEMA) (2010) National Disaster Recovery
Framework: Federal Register, Vol. 75, No. 27, Department of Homeland Security, USA.
Fell, R., MacGregor, P., Stapledon, D., & Bell G. (2005) Geotechnical Engineering of Dams
(Warragamba Dam p488), CRC Press, , ISBN 978-0-4153-6440-9, pp 1-912.
Feng, C., Wang, H., Lu, N., Chen, T., He, H., Lu, Y., & Tu, XM., (2014) Log-
transformations and its implications for Data Analysis, Shanghai Archives of Psychiatry,
2014, Vol. 26, No. 2, pp 105-109.
Fitzpatrick R. (2008) Euclid’s Elements of Geometry Books I – XIII, The Greek text of J.L.
Heiberg (1883–1885) from Euclidis Elementa, with parallel modern English translation, by
Richard Fitzpatrick, revised edition 2008, ISBN 978-0-6151-7984-1, pp 1-545.
Forbes, H.O. (1890) On avian remains found under a lava-flow near Timaru, in Canterbury,
Transactions and Proceedings of the New Zealand Institute - Geology 23, 366-372.
Freeman, J., & Edgar, W. B. (1976) Some sources of interviewer variance in surveys, Public
Opinion Quarterly, 40 (Spring 1976), pp 79-91.
Frigg, R., & Nguyen, J. (2017). Models and representation, In Lorenzo Magnani & Tommaso
Bertolotti (eds.), Springer Handbook of Model-Based Science. pp. 49-102.
Fulton, P. M., Rathbun, A. P., (2011) Experimental constraints on energy partitioning during
stick–slip and stable sliding within analog fault gouge, Earth and Planetary Science Letters
308 (2011), pp185–192.
Gair, H. S. (1959) The tertiary geology of the Pareora District, South Canterbury, New
Zealand Journal of Geology and Geophysics, 2:2, pp 265-296.
Gair, H. S. (1961) Drillhole evidence of the Pliocene-Pleistocene boundary at Timaru, South
Canterbury, New Zealand Journal of Geology and Geophysics, 4:1, pp 89-97.
Gardelin, M. (2010) Prediction of wildland fire danger in Sweden, Forest Fire Model and
Grassland Fire Model Poster, © Swedish Meteorological and Hydrological Institute.

275
Gass, S. I., & Assad, A. A., (2005) An Annotated Timeline of Operations Research: An
Informal History. Chap 3, Birth of operations research from 1936 to 1946, Kluwer Academic
Publishers, Boston, ISBN: 1-4020-8112-X, pp 45-60.
Geoscience Australia (2004) Newcastle Earthquake: 28 December 1989, GA Report,
Canberra, pp 1-3.
Gibson, G. (2008) Earthquakes and Dams in Australia, Seismology Research Centre, RMIT,
Bundoora, Victoria. pp 1-6
Gibson, G., & Sandiford, M. (2013) Seismicity & induced earthquakes, Submission to Office
of the NSW Chief Scientist and Engineer (OCSE) 15 August 2013, Melbourne Energy
Institute University of Melbourne, pp 1-33.
Gill, M. (1998) A Richter Type Scale for Fires? Research Letter #2, Division of Plant
Industry, CSIRO, from www.firebreak.com.au/reslet2 12 Mar 1998, downloaded 6 Apr 2014.
Given, L. M, (Ed) (2008) The Sage Encyclopaedia of Qualitative Research Methods,
SAGE Publications, Inc., California 91320, ISBN 978-1-4129-4163-1, vol 1&2, pp1-1014
Glanville, D. H. (Ed.) (2012) Australian Seismological Report 2011, Record # 2012/46,
Geoscience Australia, Canberra, pp 1-119.
GNS Science (2012) 8000-year quake record improves understanding of Alpine Fault,
Institute of Geological and Nuclear Sciences, Wellington, New Zealand, Media release
28/06/2012.
Goded, T., Fenaughty, K. J., Michell, R. (2012) Lessons from the Canterbury events:
preliminary improvements to the online felt reports. 2012 NZSEE Annual Technical
Conference, at University of Canterbury, Christchurch, New Zealand, pp 1-8
Gödel, K. (1931), Über formal unentscheidbare Sätze der Principia Mathematica und
verwandter Systeme, I. Monatshefte für Mathematik und Physik 38: (Trans: On formally
undecidable propositions of Principia Mathematica and related systems I), pp 173-198.
Goodall, J. (1886) On the formation of Timaru Downs, Transactions and Proceedings of the
New Zealand Institute 19, pp 455-458.
Graizer, V., & Kalkan, E. (2007) Ground Motion Attenuation Model for Peak Horizontal
Acceleration from Shallow Crustal Earthquakes, Earthquake Spectra, Vol. 23, No. 3, August
2007, pp 585–613.

276
Grayson, R. L., Kinilakodi, H., & Kecojevic, V. (2009) Pilot sample risk analysis for
underground coal mine fires and explosions using MSHA citation data, Safety Science 47
(2009), pp. 1371–1378.
Guillén, M. F. (2001) Mission Improbable: Using Fantasy Documents to Tame Disaster, by
Lee Clarke – Review. Reproduced from Administrative Science Quarterly, March 2001 46:1,
pp 151-153.
Gupta, H. K., & Rastogi, B. K. (1976) Dams and Earthquakes, Elsevier Scientific Publishing
Co., ISBN 978-0-4444-1330-7, pp 1-229.
Gutenberg, B., & Richter, C. F. (1949) Seismicity of the Earth and Associated Phenomena,
Chapter 5, Frequency and Energy of Earthquakes, Princeton University Press, pp 1-273.
Guthrie, R. H., & Evans, S. G. (2004) Magnitude and frequency of landslides triggered by a
storm event, Loughborough Inlet, British Columbia. Natural Hazards and Earth System
Science, 2004, 4(3), pp 475-483.
von Haast, J., (1879) Geology of the provinces of Canterbury and Westland, New Zealand, a
report comprising the results of official explorations, Press Office, Christchurch. pp 1-474.
Hague, P., (2006) A Practical Guide to Market Research, Grosvenor House Publishing High
St, Guildford, Surrey, GU1 3HY, ISBN 1-905529-30-9, pp 1-198.
Hancox, G., & Perrin, N., (2011) Report on Land-slide Reconnaissance Flight on 24 Feb
2011 following the Mw 6.3 Christchurch Earthquake of 22 Feb 2011, GNS Science, Lower
Hutt, NZ, LD8, 2 March 2011, pp 1-44.
Hardcastle, J. (1889) The origin of the loess deposits on the Timaru plateau, Transactions and
Proceedings of the New Zealand Institute Vol. 22, (online Royal Society of New Zealand
http://rsnz.natlib.govt.nz – repr. in Loess Letter Supplement Vol. 23, Nov. 1990) pp 406-414.
Hardcastle, J. (1890) On the Timaru loess as a climate register, Transactions and Proceedings
of the New Zealand Institute 23, (online Royal Society of New Zealand).
http://rsnz.natlib.govt.nz – repr. in Loess Letter Supplement 23, Nov. 1990) pp 324-332
Hart, A. (2001) Mann-Whitney test is not just a test of medians: differences in spread can be
important. BMJ : British Medical Journal, 323(7309), pp 391–393.
Hart, W. (2013a) Environmental flow management in a complex, complementary-competitive
river system [online], in: Sustainable Engineering Society Conference (2013: Canberra,

277
A.C.T). Sustainable Engineering Society (SENG) 2013 conference: Looking back-looking
forward. Barton, ACT: Engineers Australia, 2013: pp 138-147.
Hart, W. (2013b) Renewable energy flux thresholds for development decisions: Using
fundamental engineering knowledge to plan a better future [online], in: Sustainable
Engineering Society Conference (2013: Canberra, A.C.T). Sustainable Engineering Society
(SENG) 2013 conference: Looking back-looking forward. Barton, ACT: Engineers Australia,
2013: pp 82-91.
Hart W. (2014) Gutenberg-Richter Law and earthquake hazard forecasting in an active
intra-plate region: The Australian Snowy Mountains, presented to “Tectonics in the
Snowies”, Special Group for Tectonics and Structural Geology, Biennial Conference,
Thredbo, NSW, 3 - 7 Feb. 2014,
‘t Hart P. (2010) Organizing for effective emergency management. Expert Witness
Submission to the Royal Commission on the Victorian Bushfires: VBRC Document number
EXP.3031.001.0001, School of Politics and International Relations, Australian National
University, pp 1-17.
Hawking, S.W. (2005) Information Loss in Black Holes, DAMTP, Center for Mathematical
Sciences, University of Cambridge, Wilberforce Road, Cambridge, UK.
Phys.Rev.D72:084013, 2005, DOI: 10.1103/PhysRevD.72.084013, pp 1-5.
Herak, M., Markuzic, S., & Ivancic, I. (2001) Attenuation of Peak Horizontal and Vertical
Acceleration in the Dinarides Area, Studia geophysica et geodaetica 45, pp 383-394.
Highland L. (2004) Landslide types and processes U.S. Geological Survey, Poster, Fact Sheet
No. 2004 – 3072.
Hillis, R.R. & Reynolds, S. D., (2000) The Australian Stress Map, Journal of the Geological
Society, London, No.157, pp 915-921.
Himmelblau, D.M., Riggs, J.B. (2012), Basic Principles and Calculations in Chemical
Engineering, 8th Edition, University of Texas, Austin, Texas, ISBN 13: 978-0132346603,
pp 1-954.
Hobson, E.W. (1914) John Napier and the Invention of Logarithms, 1614, A lecture by E. W.
Hobson. Reprint, Cambridge University Press, 1914, pp 1-48.

278
Hohenberg, P.M. (2003) The historical geography of European cities: an interpretive essay,
Handbook of Regional and Urban Economics: Cities and Geography, Chapter 67, Edited by,
Henderson V. & Thisse, J. F. Elsevier, North Holland, ISBN 978-0-444-50967-3, pp 1-1082.
Horie, K., Tsutsumi, Y., Takao, Y., & Suzuki, T. (2008) Calculation of Repeatability and
Reproducibility for Qualitative Data, Department of Industrial Administration, Tokyo
University of Science, Chiba, , Japan, pp 1-12.
Horwitz, M. J. (1987) Republicanism and Liberalism in American Constitutional Thought,
William & Mary Law Review, Volume 29, Issue 1, Article 8.
Horwitz, W. (1977) The Variability of AOAC Methods of Analysis as Used in Analytical
Pharmaceutical Chemistry, Journal of the AOAC, Vol 60, No,6 1977, pp 1335-1363.
Huddleston, B., Ataman, E., de Salvo, P., Zanetti, M., Bloise, M., Bel, J., Franceschini, G., &
d’Ostiani, L. Fé. (2003) Towards a GIS Based Analysis of Mountain Environments and
Populations, Environment and Natural Resources Working Paper No. 10, Food and
Agriculture Organisation of the United Nations (FAO), Rome, Pp 1-34.
Huggins, R., & Huggins, J. (1994) Auntie Rita, Aboriginal Studies Press, Canberra, 1994,
Reprinted in 2011, ‘Teachers’ Notes: Aboriginal Identity (Legends, Country of the Heart,
Auntie Rita)’, Aboriginal Studies Press, AIATSIS, pp 1-13.
Hunter, R. L., & Mann, C. J. (Eds) (1992) Techniques for Determining Probabilities of
Geologic Events and Processes, Studies in Mathematical Geology No.4, Oxford University
Press, New York, , ISBN 0-19-507498-X, pp 1-384.
Ingham J. (2011) Unreinforced Masonry (URM) Buildings and Earthquake-Prone Policies
hearing transcript: 2011-11-07, Royal Commission of Inquiry into Building Failure caused
by Canterbury Earthquakes 2011-12, Transcripts Day 06, Department of Internal Affairs,
Wellington, pp 1-95.
IPCC (2012) Managing the risks of extreme events and disasters to advance climate change
adaptation, A Special Report of Working Groups I and II of the Intergovernmental Panel on
Climate Change [Field, C. B., Barros, V., Stocker, T. F., Qin, D., Dokken, D. J., Ebi, K. L.,
Mastrandrea, M. D., Mach, K.J., Plattner, G. K., Allen, S. K., Tignor, M., & Midgley P. M.
(eds.)]. Cambridge University Press, Cambridge, UK, pp 1-582.
ISO 31000 (2009) Risk Management - Principles and Guidelines Geneva, International
Standards Organisation.

279
ISO Guide 73 (2009), Risk Management – Vocabulary, Geneva, International Standards
Organisation.
Johnston, A. C. (1990) An earthquake strength scale for the media and the public,
Earthquakes & Volcanoes, Vol. 22 Issue 5, ISSN: 0894-7163, pp 1-214.
Kaiser, A. E., Benites, R. A., Chung, A. I., Haines, A. J., Cochran, E., & Fry, W. (2011)
Estimating Seismic Site Response in Christchurch City from Dense Low-Cost Aftershock
Arrays, 4th IASPEI / IAEE International Symposium: Effects of Surface Geology on Seismic
Motion, August 23–26, 2011, University of California, Santa Barbara.
Kamoen, N., Holleman, B., Nouwen, R., Sanders, E., & van den Bergh, H. (2011) Absolutely
relative or relatively absolute? The linguistic behaviour of gradable adjectives and degree
modifiers, Journal of Pragmatics 43, pp 3139–3151.
Kanamori, H. (1983) Magnitude scale and quantification of earthquakes, in S.J. Duda & K.
Aki (eds) Quantification of Earthquakes, Tectononphysics 93, Elsevier, Amsterdam, pp 185-
199.
Kanamori, H., Brodsky, E. E., (2004) The physics of earthquakes, Rep. Prog. Phys. 67 (2004)
PII: S0034-4885(04)25227-7, pp 1429–1496
Karetu, T. (1990) The Clue to Identity, New Zealand Geographic, Issue No.5, pp 112-117.
Karl, J. B., & McCullough K. (2012) Risk Shifting In Reinsurance Markets, American Risk &
Insurance Association (ARIA) Annual Meeting August 5-8, 2012, Minneapolis, Minnesota.
Kadane, J. B. & Kazar, N. A. (2001) Methods and Criteria for Model Selection, Carnegie
Mellon University, Statistics Technical Reports, Pittsburg December 2001, pp 1-24.
Keetch J. J. & Byram G. M. (1968) A drought index for forest fire control. US Department of
Agriculture Forest Service, South-eastern Forest Experimental Station, Research paper SE-
38, Asheville, North Carolina, pp 1-33.
Kellens, W., Terpstra, T., Schelfaut, K., De Maeyer, P., 2013. Perception and communication
of flood risks: A literature review. Risk Analysis. 33 (1), pp 24-49.
Kim, S., & Margo, R. A. (2003) Historical Perspectives on U.S. Economic Geography,
NBER Working Paper No. 9594, Handbook of Regional and Urban Economics: Cities and
Geography, Chapter 66, Edited by, Henderson V. & Thisse, J.F. Elsevier B. V., ISBN: 978-0-
444-50967-3, pp 1-1082.

280
Klir, G. J. (1991), Facets of Systems Science, Plenum Press, New York, NY.
Knuuttila, T., & Boon, M. (2011), How do models give us knowledge? The case of Carnot’s
ideal heat engine, Euro J. Phil Science (2011) 1, pp 309-334.
Korner, C., & Ohsawa, M. (2005) Ecosystems and Human Well-being: Current State and
Trends, Volume 1, Part III: Chapter 24. Mountain Systems, Millennium Ecosystem
Assessment Secretariat, UNEP, Island Press, ISBN 1-55963-227-5, 901 pp.
Kruk, E. (2010) Two Decades of Mountain Tourism, in ICIMOD 1989-201, International
Centre for Integrated Mountain Development, Kathmandu, Nepal, pp1-4.
Kuipers, B. (2001) Qualitative Simulation, In Encyclopedia of Physical Science and
Technology, Third Edition, R. A. Meyers, (Ed), Academic Press, 2001, pp 287–300.
Kusev. P., Purser, H., Heilman, R., Cooke, A. J., Van Schaik P., Baranova V., Martin, R., &
Ayton, P. (2017) Understanding Risky Behavior: The Influence of Cognitive, Emotional and
Hormonal Factors on Decision-Making under Risk. Front. Psychol. 8:102. doi:
10.3389/fpsyg.2017.00102, pp 1-10.
LATBSDC (2014) An Alternative Procedure for Seismic Analysis and Design of Tall
Buildings Located in the Los Angeles Region – A Consensus Document, 2014 edn., Los
Angeles Tall Buildings Structural Design Council, Los Angeles, CA.
Lakoff A. (ed) (2010) Disaster and the Politics of Intervention, Columbia University Press,
New York, ISBN: 978-0-231-14697-5, 160 pp.
Landauer, R., (1961), "Irreversibility and heat generation in the computing process”, IBM
Journal of Research and Development, 5 (3), doi:10.1147/rd.53.0183, pp 183–191.
Lara A, Sauri D, Ribas A, Pavon D. (2010) Social perceptions of floods and flood
management in a Mediterranean area (Costa Brava, Spain). Natural Hazards and Earth
System Sciences, 2010; 10 (10), pp 2081-2091.
Levine, D. L., (2011) Why logs: a history of logs? retrieved from [online]
http://davidlouislevine.com/math_history.../History%20of%20Logs.ppt .
Lexa, M. A., (2011) Remembering John Napier and His Logarithms, Department of
Electrical & Computer Engineering, Rice University, Houston, pp 1-13.
Liboiron, M., & Wachsmuth, D. (2013) The fantasy of disaster response: governance and
social action during Hurricane Sandy, Social Text Periscope, October 29th, 2013.

281
Lin, M. S., & Chen Y. (2010) Language, place and identity: the politics of place and
language in the formation of indigenous identity in Hualein, Taiwan, Dialectologia 4, 28
March 2008, pp 67-81.
Locke, J, (1690) Two Treatises of Civil Government: Book 2, True Original, Extent, and End
of Civil Government, J. M. Dent & Sons, London, Everymans Edition 1924, pp 1-268.
Lutzen, M. (2001) Ship Collision Damages, Technical University of Denmark, Lyngby,
Denmark. ISBN 87-89502-60-4.
Lythe, R., (Ed) (2008) A Guide to Catastrophe Modelling 2008-09, The Review – Worldwide
Reinsurance, Informa UK Ltd, Sheepen Place, Colchester, UK. pp 1-23.
McCalpin, J. P., (2009) Appendix 1: Earthquake Magnitude Scales, in McCalpin J. P. (ed.),
Volume 95: Paleoseismology, 2nd
ed., Academic Press, 629 pp
McCue, K. (2011) The 1959 Berridale NSW Earthquake Revisited. Australian Earthquake
Engineering Society 2011 Conference, Nov 18-20, Barossa Valley, South Australia, pp 1-10.
McCue, K. (2014) The 1989 Newcastle earthquake – an unlearned lesson for Australia. The
Australian Geologist / TAG December 2014, Geological Society of Australia, Hornsby, NSW
2077, pp 22-24.
McComb, D. G. (1986) Galveston, a History, University of Texas Press, Austin, Texas, USA,
pp 1-267.
Macdougall, A. K. Ryzman, L. & Zwar, D. (2002) Thredbo a Tragedy Waiting to Happen –
and Other Australian Disasters, Five Mile Press, Victoria, ISBN 1 86503 796 6, p 1-18.
McGourty, J. (ed) (2009) Black Saturday, Stories of love Loss and courage from the
Victorian Bushfires, Harper Collins, Sydney, ISBN 978 0 7322 9010, pp 1-288
McGuire R. K. (2001) Deterministic vs. probabilistic earthquake hazard and risks. Soil
Dynamics and Earthquake Engineering 21, pp 377-385.
Maheshwari, V.K., Sing, P., & Bansal, S., (2011) Philosophical Basis of Education. Study
Mode.com. Retrieved 04, 2011, from http://www.studymode.com/essays/Philosophical-
Basis-Of-Education-663828.html.
Mandel, J. (1972) Repeatability and Reproducibility Journal of Quality Technology. Vol. 4,
No.2, April 1972, p 74-85.

282
Martin, T. E., McRoberts, E. C. (1999) Some considerations in the stability analysis of
upstream tailings dams, 6th
International Conference, Tailings and mine waste; 1999; Fort
Collins; CO, in Tailings and mine waste; 287-302
Massey, C.I., McSaveney, M.J., Heron, D., & Lukovic, B. (2012a) Canterbury Earthquakes
2010/11 Port Hills Slope Stability: Pilot study for assessing life-safety risk from rock falls
(boulder rolls), GNS Science, Lower Hutt, NZ. Consultancy Report 2011/311.
Massey, C.I., McSaveney, M.J., Yetton, M.D., Heron, D., Lukovic, B & Bruce, Z.R.V.
(2012b). Canterbury Earthquakes 2010/11 Port Hills Slope Stability: Pilot study for
assessing life-safety risk from cliff collapse, GNS Science Consultancy Report 2012/57.
Mayo, S.M., & Aziz, A. (2011) An Overview of industry, urbanization and disaster risks
nexus in Punjab, Pakistan Journal of Science, Vol. 63 No. 1.
Middelmann M., & Granger K. (eds) (2000) Community Risk in Mackay, A multi-hazard risk
assessment, Australian Geological Survey, Canberra, ACT, , ISBN: 0-642-398623, pp 1-16
Middelmann, M.H. (ed) (2007) Natural Hazards in Australia: Identifying Risk Analysis
Requirements. Geoscience Australia, Canberra, ISBN 0-978-1-921236-61-7, pp1-177
Miller, F. W. G. (1954) Beyond the Blue Mountains: A History of the West Otago District,
Otago Centennial Historical Publications, Dunedin, NZ, pp 1-186
Miller, J. G. (1995), Living Systems, University Press of Colorado, Niwot, CO, ISBN 978-0-
87081363-4, pp 1-1157.
von Mises, L. (1940) Interventionism: an economic analysis, 1st ed., Greaves B. B. (ed), The
Foundation for Economic Education, Inc., Hudson, NY, ISBN: 1-57246-071-7, pp 1-106.
Mogi, H., & Kawakami, H. (2004) Probability Distribution of Peak Ground Acceleration
Ratios, 13th Conf. on Earthquake Engineering, Vancouver, B.C., Aug. 1-6, 2004, No. 1345
Moore, C. (2011) Earthquake Christchurch New Zealand 22 February 2011, Random House,
Auckland, NZ, ISBN 978 1 86979 699 0, pp 1-192
Moye, D. G., (1955) Engineering Geology for the Snowy Mountains Scheme, J. Institution of
Engineers Australia, 27, pp. 287-298.
Moye, D.G. (1956) Investigation of the occurrence of earthquakes in the Snowy Mountains
and proposals for the establishment of seismographs. Internal Report, Snowy Mountains
Hydro-electric Authority, Cooma, available NatLib Aust., Item19303457.

283
Muirhead, K. J., Cleary, J. R., & Simpson, D. W. (1973) Seismic activity associated with the
filling of Talbingo Reservoir, Int. Colloq. On Seismic Effects of Reservoir Impounding,
March 1973, Royal Society, London, p 17.
Muirhead, K. J. (1981) Seismicity induced by the filling of the Talbingo Reservoir, Journal of
the Geological Society of Australia, Vol. 28, pp 291–298.
Musson, R., Grünthal, G., Stucchi, M. (2010): The comparison of macroseismic intensity
scales, Journal of Seismology, 14, 2, pp. 413-428.
Nakayachi, K., & Nagaya, K. (2016). The Effects of the Passage of Time from the 2011
Tohoku Earthquake on the Public's Anxiety about a Variety of Hazards. International journal
of environmental research and public health, 13(9), 866. doi:10.3390/ijerph13090866.
Nazarchuk, Z., Skalskyi, V., Serhiyenko, O., (2017) Acoustic Emission, Foundations of
Engineering Mechanics, Springer International Publishing AG. 283P. DOI 10.1007/978-3-
319-49350-3.
Nelson, T. A. & Murray, R. C. (1978) Elastic-Plastic Analyses for Seismic Reserve Capacity
in Power Plant Braced Frames, Lawrence Livermore Laboratory, Report UCRL-52614,
October 4, 1978.
NDIR (2011) Natural Disaster Insurance Review, Inquiry into flood insurance and related
matters, The Treasury, Parkes, ACT 2600, Commonwealth of Australia, ISBN 978-0-642-
74739-6, September 2011.
NERAG (2010) National Risk Assessment Guidelines, Emergency Tasmanian State
Emergency Service, Hobart. National Emergency Management Committee (2010) ISBN 978-
0-9805965-1-9 (PDF), pp 1-58
NSF (2014) Earth Science of the Western US, National Science Foundation, Paleontological
Research Institution, Ithaca, NY, [online guide] downloaded from:
http://geology.teacherfriendlyguide.org/index.php/hazards-w/hazards-earthquakes-w,
OpenStax (2012) College Physics. OpenStax College, Rice University, Houston Texas. 21
June 2012. [online] http://cnx.org/content/col11406/latest/ pp 1-1263.
Ontario MNR (Ministry of Natural Resources) (2010) Weather Damaged Fuels Hazard
Rating System. Advisory Brochure.

284
O’Neill, C., Danis, C. (2013) The Geology of NSW. The geological characteristics and
history of NSW with a focus on coal seam gas (CSG) resources,
Department of Earth and Planetary Science, Macquarie University, Sydney, NSW, A report
commissioned for the NSW Chief Scientist’s Office, pp 1-114.
O’Sullivan, A. (2005) Market Areas and Central Place Theory, drawn from Chapter 5,
Urban Economics 5th
Ed., (McGraw-Hill/Irwin, 2003) ISBN 9780071086684.
Palacios, P. Molina, I. Segovia, M. (2006) The Gutenberg-Richter law: Assumptions,
limitations and pp 1-1263 interpretations. Chapter 10, Statistics in Volcanology, Geological
Society of London, 2006. ISBN 978-186239-208-3, pp 1-285.
Pateman, M. & Vankat, D. (2002), The Effect of Climate Change on Tornado Frequency and
Magnitude. Miami University, Oxford, Ohio, USA.
Paul, E. F. (1980) Laissez Faire in Nineteenth-Century Britain: Fact or Myth? Literature of
Liberty, Vol. III, no. 4, pp. 5-38, Arlington, VA: Institute for Humane Studies.
Peschard, I., (2011) Making Sense of Modelling: Beyond Representation, SPSP 2009: Society
for Philosophy of Science in Practice, Minnesota, June 18-20, 2009.
Pica, P. Lemer, C. Izard, V. & Dehaene, S. (2004) Exact and approximate arithmetic in an
Amazonian indigene group. Science, 15 Oct 2004; 306 (5695): pp 499-503.
Pidwirny, M. (2006). "Definitions of Systems and Models". Fundamentals of Physical
Geography, 2nd Edition. http://www.physicalgeography.net/fundamentals/4b.html.
PM (2011) Rebuilding after the floods, Prime Minister - Gillard, Julia, Australian Prime
Ministerial Transcripts, Department of the Prime Minister and Cabinet, Canberra, Media
release - 27 January 2011.
Potts, D. T., (2000) Before Alexandria: Libraries in the Ancient Near East, Chapter 1 in
MacLeod, R., (2000) The Library of Alexandria: Centre of Learning in the Ancient World,
New York City, New York and London, England: Tauris Publishers, pp. 1–196, ISBN 978-1-
85043-594-5 (reprinted 2010).
Powell, M. D. & Reinhold, T. A (2007) Tropical Cyclone Destructive Potential By Integrated
Kinetic Energy, American Meteorological Society, April 2007, pp 513-526.
Preskill J. (1992) Do Black Holes Destroy Information? International Symposium on Black
Holes, Membranes, Wormholes, and Superstrings, Texas, January, 1992, pp 1-18

285
Press (2011) Our People the Victims article downloaded 8 April 2014 from The Press
newspaper website at: http://www.stuff.co.nz/the-press/news/christchurch-earthquake-
2011/12-51/our-people/the-victims.
PSSC (1960) (Haber-Schaim, U. Dodge, J. H. Gardner, R. Shore, E. A. Walter, F.) Physics.
Physical Science Study Committee, Massachusetts Institute of Technology, 1st Edition 1960.
D.C. Heath & Co., pp 1- 585.
Quarantelli, E. L. (1970) In Human Nature and Collective Behavior, ed. T. Shibutani,
Englewood Cliffs, NJ: Prentice-Hall, pp 1-232.
Quarantelli, E. L., & Dynes R. R. (1977) Response to Social Crisis and Disaster, Ann. Rev.
Sociol. 1977. 3. pp 23-49.
Raeside, J.D. (1964) Loess Deposits of the South Island, New Zealand, and Soils Formed on
them, New Zealand Journal of Geology and Geophysics, 7:4, pp 811-838.
Rasch, G. (1961) On General Laws and the Meaning of Measurement in Psychology.
Proceedings of the Fourth Berkeley Symposium on Mathematical Statistics and Probability,
Volume 4: Contributions to Biology and Problems of Medicine, pp 321--333, University of
California Press, Berkeley, Calif., 1961. http://projecteuclid.org/euclid.bsmsp/1200512895.
Renn, O. (1992) Concepts of risk: a classification, Chapter 3 in Krimsky, S. & Golding, D
(eds.), Social Theories of Risk, Praeger. pp 53-79
Renn, O. (2008a) Concepts of Risk: An Interdisciplinary Review, Part 1: Disciplinary Risk
Concepts, GAIA 17/1 (2008): pp 50–66
Renn, O. (2008b) Concepts of Risk: An Interdisciplinary Review, Part 2: Integrative
Approaches, GAIA 17/2 (2008): pp 196-204
Richter C.F. (1935) An Instrumental Earthquake magnitude Scale Bulletin of the
Seismological Society of America, Vol. 25, January 1935, No. 1, pp 1-34.
Risbey, T. Cregan, M. & De Silva, H. (2010) Social Cost of Road Crashes Bureau of
Infrastructure, Transport and Regional Economics (BITRE) presented to Australasian
Transport Research Forum. 29 Sept. – 1 Oct. 2010, Canberra, Australia, pp 1-16.
Roberts, P., S. (2017) Why presidents should stop showing up at disaster sites, Washington
Post, Washington DC, 13 September 2017,

286
Rodin, J. & Garris, R. (2012) “Reconsidering Resilience for the 21st Century.” pp 110−111
in USAID Frontiers in Development, edited by Rajiv Shah and Steven Radelet (Washington,
DC: U.S. Agency for International Development, 2012), 264pp , ISBN: 978-1492848639.
Ross, R. (2010) Guide for Applying the Risk Management Framework to Federal Information
Systems A Security Life Cycle Approach, Joint Task Force Transformation Initiative
Interagency Working Group National Institute of Standards and Technology, US Department
of Commerce, Special Publication 800-37, Rev. 1, pp 1-93
Routio, P. (2007) The Use of Models, Arteology, the science of products and professions,
University of Arts & Design, Helsinki, Finland, [online] http://www2.uiah.fi/projects/metodi.
Sarukkai, S. (2005) Revisiting the ‘unreasonable effectiveness’ of mathematics, National
Institute of Advanced Studies, Indian Institute of Science Campus, Bangalore, India. Current
Science, Vol. 88, No. 3, 10 February 2005, pp 415-423.
Saxe, J. G. (1872) The Blind Men and the Elephant, A Hindoo Fable, from Best Remembered
Poems, Dover Publications Inc, Mineola NY, 1992, pp 150-151.
Sewell, L. (2009) Submission by Linda Sewell to the 2009 Victorian Bushfires Royal
Commission by HVP Plantations: Published in VBRC (2010) document number
SUBM.002.029.0137_R.
Sewell, L. (2010) Witness Statement of Linda Sewell CEO of HVP Plantations, HVP
Plantations, 2010: Published in VBRC (2010) document number WIT.7519.001.0001.
Schmidt, B. F. Haight, W. R. Szabo T. J. & Welcher J. B. (1998) System-Based Energy and
Momentum Analysis of Collisions, Copyright © 1998 Society of Automotive Engineers, Inc.
Report No. 980026, 13 pp.
Sharp, K. R. (2013) Personal conversation at Cooma, NSW in October 2103.
Skyttner, L. (1996), General Systems Theory. An Introduction, Macmillan, London.
Sonin, A., A. (2001) The Physical Basis of Dimensional Analysis, 2nd Edition, Department of
Mechanical Engineering, MIT, Cambridge, MA 02139, pp1-57, downloaded on 14 January
2019 from http://web.mit.edu/2.25/www/pdf/DA_unified.pdf, 50pp
Smalley, I., & Fagg, R. (2014) John Hardcastle looks at the Timaru loess: Quaternary
International (2014), http://dx.doi.org/10.1016/j.quaint.2014.06.042.

287
Starr, C. (1969), Social Benefits versus Technological Risks, Science Vol. 165, No. 3899.
(Sept. 19, 1969), pp 1232–1238.
Steg, L., (2003) Can Public Transport compete with the private car IATSS Research,
Volume 27, Issue 2, 2003, https://doi.org/10.1016/S0386-1112(14)60141-2, pp 27-35
Sinn, H-W, (2003) Weber’s Law and the Biological Evolution of Risk Preferences: The
Selective Dominance of the Logarithmic Utility Function, 2002 Geneva Risk Lecture, The
Geneva Papers on Risk and Insurance Theory, 28: 2003, pp 87–100.
Soleimani, B., Kazem R., Larki, E., Shirali, K., Soleimani, M. (2018) Gaseous Reservoir
Horizons Determination via Vp/Vs and Q-Factor Data, Kangan-Dalan Formations, in one of
SW Iranian Hydrocarbon Fields, Geopersia 8 (1), 2018, pp 61-76.
Stahl B.C. (2007) Positivism or Non-Positivism — Tertium Non Datur. In: Sharman R.,
Kishore R., Ramesh R. (eds) Ontologies. Integrated Series in Information Systems, vol 14.
Springer, Boston, MA. 28 pp
Stevens, S.S. (1946), On the Theory of Scales of Measurement. Science, New Series, Vol.
103, No. 2684 (June 7, 1946), pp 677-680.
Stephens, S., A., Ramsay, D., L. (2014) Extreme cyclone wave climate in the Southwest
Pacific Ocean: Influence of the El Niño Southern Oscillation and projected climate change,
Global and Planetary Change 123 (2014) pp 13–26
Stirling, M., McVerry, G., Gerstenberger, M., Litchfield, N., Van Dissen, R., Berryman, K.,
Barnes, P., Wallace. L., Villamor. P., Langridge, R., Lamarche, G., Nodder, S., Reyners, M.,
Bradley, B., Rhoades, D., Smith, W., Nicol, A., Pettinga, J., Clark, K., Jacobs, K., (2012)
National Seismic Hazard Model for New Zealand: 2010 Update, Bulletin of the
Seismological Society of America, Vol. 102, No. 4, August 2012, doi: 10.1785/0120110170,
pp. 1514–1542.
Stokes, A. (2006) Selecting tree species for use in rockfall-protection forests; Forest Snow
and Landscape Research 80, 1, pp 77–86.
Stuart. H. J. (1992), The Newcastle Earthquake: Local Government Response, The Macedon
Digest, Vol. 7, No. 4, pp 17-21.
Stuart, H. J. (1990) Newcastle Earthquake 28th December 1989: A perspective of council's
role in disaster management. Newcastle, NSW, Newcastle City Council,

288
Takewaki, I, (2011) Preliminary report of the 2011 Tohoku Earthquake off the Pacific Coast,
Zhejiang Univ-Sci A (Appl Phys & Eng), 12(5), pp 327-334.
Talwani, P. (1997) On the Nature of Reservoir-induced Seismicity, Pure Appl. Geophys., 150
(1997), 0033–4553/97/040473–20, pp 473–492.
Timm, C. Hoernle, K. Van Den Bogaard, P. Bindeman, I. & Weaver, S. (2009) Geochemical
Evolution of Intraplate Volcanism at Banks Peninsula, New Zealand, Journal of Petrology
Vol. 50, No. 6, pp 989-1023.
ten Tusscher, K., & Panfilov, A. (2011) Mathematics for Biologists, Utrecht Univ., pp 1-130
United Kingdom Cabinet Office (UKCO) (2010), Draft Strategic National Framework on
Community Resilience, Cabinet Office, London, pp 1-28.
Urban Land Institute (2013). After Sandy: Advancing Strategies for Long-Term Resilience
and Adaptability. Washington, DC Urban Land Institute, ISBN 978-0-87420-292-2, pp 1-64.
U.S. Department of Transportation, Bureau of Transportation Statistics (2018) available by
PDF from: www.dot.gov.bts/files/publications/national-transportation-statistics/index
VBRC (2010) The Final Report of the 2009 Victorian Bushfires Royal Commission, The
State of Victoria, PP No. 332, Session 2006–10, Parliament of Victoria Summary: ISBN 978-
0-9807408-1-3, Volume I: 978-0-9807408-2-0, Volume II: 978-0-9807408-3-7, Volume III:
978-0-9807408-4-4, Volume IV: 978-0-9807408-5-1.
Villarreal-Calderon, R. (2008) Chopping Logs: A Look at the History and Uses of
Logarithms, Montana Maths Enthusiast, Vol. 5, Nos 2 & 3, ISSN 1551-3440, pp 337-344.
Wahlström, R. (1979) Duration Magnitudes for Swedish Earthquakes, Deutsches
GeoForschungs, Zentrum Helmholtz-Zentrum Potsdam, (Report 5/79).
Wakelin-King, G.A. and White, S.Q., (2011) Potential geoheritage values of Australian
desert landscapes, Report to the Commonwealth Department of Sustainability, Environment,
Water, Population and Communities, Canberra, pp 1-127.
Walsh, K., Dizhur, D., Giongo, I., Derakhshan, H., & Ingham, J. (2017). Comparison
between Predicted URM wall out-of-plane strength based capacity, and in situ proof test
results, 13th Canadian Masonry Symposium, Halifax, Canada, 05 - 07 Jun 2017. Proceedings
of the Thirteenth Canadian Masonry Symposium. Canada Masonry Design Centre, pp 1-12.

289
Watson, F.G. 1939. A study of telescopic meteors. Proc., American Philosophical Society,
vol. 81, no. 4, pp 493-504.
Weber, E.U., (2004) Perception Matters: Psychophysics for Economists, Chapter 9 in J.
Carrillo and I. Brocas (Eds.), Psychology and Economics, Vol 2, OUP, Oxford, UK, 231pp.
White, F. M. (2009) Fluid Mechanics 7th
ed. Chapter 5 (McGraw-Hill Series in mechanical
engineering). ISBN 978–0–07–352934, pp 1-885.
Whitehead, A. N., Russell, B. (1910 etc.) Principia Mathematica, 3 volumes, Cambridge
University Press, 1910, 1912, and 1913, Abridged as Principia Mathematica to *56,
Cambridge University Press, 1962.
Wigner, E. P. (1960) The Unreasonable Effectiveness of Mathematics in the Natural
Sciences, Richard Courant Lecture in Mathematical Sciences, John Wiley & Sons, Inc., New
York, Communications in Pure and Applied Mathematics, Vol. XIII, pp 1-14.
Willis M. (2004), Bushfire Arson: a Review of the Literature, Australian Institute of
Criminology, Canberra, Public Policy Series, No 61, ISBN 0-642-53851-4, pp 1-170.
Wise, C. R., & McGuire, M. (2009) Wild-land fire mitigation networks in the western United
States, Disasters, Vol. 33, No. 4, pp 721-746.
Zhang, Z., Stewart, R. R., (2010) Seismic attenuation and rock property analysis in a heavy
oilfield: Ross Lake, Saskatchewan, CREWES Research Report - Volume 19 (2007) 1
Zhao, J., Labiouse, V., Dudt, J-P., & Mathier J-F. (Eds.) (2010) Rock Mechanics in Civil and
Environmental Engineering, CRC Press, Chapter 2.1 Rock testing and material properties;
pp 57–138.
Zonno, G., & Montaldo, V. (2002) Analysis of strong ground motions to evaluate regional
attenuation relationships, Annals of Geophysics, Vol. 45, No. 3/4, June/August 2002.
Zitek, A., Schmutz, S., Preis, S., Salles, P., Bredeweg, B., & Muhar, S. (2009) Evaluating the
potential of qualitative reasoning models to contribute to sustainable catchment
management, Ecological Informatics, 4(5), pp 381-395.

290

291
APPENDIX 1: The Quantitative Montane Risks Survey Package
6 August 2013
Mr Wayne Hart
University of Canberra
Canberra ACT 2601
APPROVED - Project number 13-128
Dear Wayne,
The Human Research Ethics Committee has considered your application to conduct research with human
subjects for the project Risk assessment methodologies used by stakeholders for geohazards montane
environments – field survey.
Approval is granted until 28 February 2014.
The following general conditions apply to your approval. These requirements are determined by University policy and the National Statement on Ethical Conduct in
Human Research (National Health and Medical Research Council, 2007).
Monitoring:
You, in conjunction with your supervisor, must assist the Committee to monitor the conduct of approved research by completing and promptly returning project review forms, which will be sent to you at the end of your project and, in the case of extended research, at least annually during the approval period.
Discontinuation of research:
You, in conjunction with your supervisor, must inform the Committee, giving reasons, if the research is not conducted or is discontinued before the expected date of completion.
Extension of approval:
If your project will not be complete by the expiry date stated above, you must apply in writing for extension of approval. Application should be made before current approval expires; should specify a new completion date; should include reasons for your request.
Retention and storage of data:
University policy states that all research data must be stored securely, on University premises, for a minimum of five years. You must ensure that all records are transferred to the University when the project is complete.
Contact details and notification of changes:
All email contact should use the UC email address. You should advise the Committee of any change of address during or soon after the approval period including, if appropriate, email address(es).
Please add the Contact Complaints form (attached) for distribution with your project.
Yours sincerely
Human Research Ethics Committee
Hendryk Flaegel
Ethics & Compliance Officer
Research Services Office
T (02) 6201 5220 F (02) 6201 5466

292
Geohazard Risk and Safety in the
Snowy Mountains, a Survey Hello, I would like to invite you to participate in our research project, which is aimed at
ensuring your safety and enjoyment in the Snowy Mountains Region by providing advice to
organisations and businesses in the region about your safety and risk.
My name is Wayne Hart, and I am from the University of Canberra. This brief survey is
completely confidential and should take you about 10 - 15 minutes to complete. I have
included a free tea bag so you can make a cup of tea and relax while you fill in the survey.
Please note that you must be over 18 years of age, to complete the survey.
Survey Instructions:
Please find somewhere comfortable where you will not be disturbed.
Answer questions 1 to 3 by ticking the best fit box for the question.
Answer questions 4 to 19 by using the boxes at the top of page 2 and writing your
opinion for the two elements of each question in the respective box as in the
(extreme) example question on the unlikely event of meteor impacts.
Answer questions 20-25 as indicated by each question
Put the completed questionnaire in the supplied self-addressed envelope and put
into a postal box,
If you would like a copy of the survey report please put your first name and email
address on the bottom of this page, fold it separately and put it in the envelope.
I will send you a copy of the survey report, probably about the middle of 2014.
Assurances
The information from this survey will be presented only in a consolidated form and it
will not be possible to identify any individual respondent from the results.
This research is independent of any organisation or business operating in the Snowy
Mountains Region although they will be provided with the report on request.
The responses will be kept in a secure place for 5 years to comply with University of
Canberra research policies and will be destroyed after that time.
If you give below your email address for a copy of the report, your email address will
be separated from your responses when it is received, not be passed to any other
person or organisation, nor used for any purpose unrelated to this research project
Wayne Hart: email [email protected] ; mobile: 0418 815 136
To receive a copy of the survey report, please complete this box, fold this page separately
and put it into the self-addressed envelope along with your questionnaire response.
Name: Email Address:

293
The Questionnaire: Safety and Risk in the Snowy Mountains Region
1. Would you consider your connection to the Snowy Mountains as mainly: (tick one box only)
a. A worker or employee with an infrastructure or major facility organisation, such as a shire council, tourist resort, state government; or
b. A worker with a small or medium business or service provider; or
c. a visitor to the region; or
d. a non- working, local resident (for example you may be retired)?
Comments (optional):
2. How long or often have you been involved in this capacity? (tick one box only)
a. Less than one year, or
b. One to five years, or
c. More than 5 years?
Comments (optional):
Mountain environments offer beauty, excitement, sports, relaxation, and also some degree of risk. I would like to explore this aspect with you.
3. How important to you is safety and risk in the Snowy Mountains region? (tick one box only)
a. It is important in everything I do – I don’t want to have an accident
b. I am careful most of the time – but sometimes thing go wrong
c. I am not worried, there are services to help if something goes wrong
d. I am just here to have fun and I don’t expect to have an accident
Comments (optional):

294
Risky events are usually defined in two ways: How Often, and How Serious.
Please think about these possible risk events in the Snowy Mountains. I would like you to assess these events on the (1-5) and (A-E) scales for the closest answer to your opinion:
Consider these possible Geohazard events
How Often (1 to 5)
How Serious (A to E)
(An example question and responses)
Major asteroid or meteorite impact in the Snowy’s 5 C
4. Major bushfires in remote areas of the Snowy’s
5. Major bushfires in Snowy townships and resorts?
6. Major bushfires affecting roads and access?
7. Major landslides in remote areas or valleys?
8. Major landslides in Snowy townships and resorts?
9. Major landslides affecting roads and access?
10. Earthquakes in remote areas?
11. Earthquakes in Snowy townships and resorts?
12. Earthquakes affecting roads and access?
13. Blizzards or very serious snowstorms?
14. Blizzards in Snowy townships and resorts?
15. Blizzards affecting roads and access?
16. Very serious vehicle accidents involving visitors?
17. Major floods or rainstorms in remote areas?
18. Major floods or rainstorms in Snowy townships / resorts?
19. Major floods or rainstorms storms affecting roads / access?
How Often?
1. About once a year or more often
2. About once every ten years
3. About once every hundred years
4. About once every thousand years
5. Almost never
How Serious?
A. Minor damage or person injury
B. Serious damage or person injury
C. Major damage
D. One or two human fatalities
E. Multiple fatalities

295
And finally I would like to learn a little about your background (in confidence) to help us analyse the answers you have given.
Respondent Questions
Write a, b, c, or d
20. What age range are you in?
a. 18 – 40 years
b. 41 – 60 years
c. Over 60 years
21. What is your gender?
a. Male
b. Female
22. What type of job or career do you hold at present?
a. Not working
b. Administration / services
c. Trades
d. Professional / business / manager
23. What is the main type of your educational background?
a. High School only
b. Tertiary (University or TAFE), commerce / business
c. Tertiary (University or TAFE), science / technical
d. Tertiary (University or TAFE), arts / community services
24. Would you like a copy of the report on the survey results sent to you?
If yes, please write your Email address on the separate front page:
Many thanks for participating in our survey. Your answers will assist the development of risk assessment, resource planning, and emergency response in the Snowy Mountains region to make it a safer and more enjoyable destination for everyone.
Finally, feel free to make any comments on this survey or related issues of risk and safety in the Snowy Mountains Region by completing this box.
25. Other Comments:
Wayne Hart | ph: (02) 6201 5902 | email: [email protected]
Institute for Governance & Policy Analysis | University of Canberra | ACT 2601

296

297
APPENDIX 2: Sustainable Engineering Society (SENG) 2013
Conference: Looking back...looking forward
Environmental flow management in a complex, complementary-competitive river system
Hart, Wayne1
Abstract: The exploitation of a river system occurs because of the multitude of benefits that accessible water brings to urban and rural communities. The Opuha and Opihi Rivers (NZ) system is a case study of a strongly regulated system that is progressively but unevenly restoring balanced community and ecological benefits to a river system that had become severely degraded by excessive extraction of water for irrigation, to the detriment of urban water flows, recreation, river based ecological systems, and indigenous fishing rights under traditional food source obligations. The multiple behaviours of the system show a mixture of deterministic, stochastic and emergent characteristics that define it as a complex river system, with a wide range of users where some uses are competitive and some are complementary. System management by regulation, through an adversarial decision process, will typically lead to a management and water allocation regime for a system as a whole that is dominated by deterministic rules. These rules will benefit the stronger stakeholders, so that less influential stakeholders have generally substandard outcomes. A systems approach to allocation can be used simulate the normal stochastic behaviours through strategies that maintain the vitality and diversity of all affected communities with a stake in the river system. The Opuha - Opihi river system, following the construction of a 70 GL storage dam and a 7.5 MW electricity generator in the head waters, is a system that demands a multi-disciplinary analysis of the system behaviours ranging from complex systems theory, economics, community sociology, statistics and risk management, meteorology and ecology through to hydrology to achieve more balanced outcomes for all stakeholders. There is a recognition that the current economically based user regimes should respond more to natural stochastic cycles to achieve optimum multi-user outcomes, and such regimes will ensure that natural cycle based allocations, rather than deterministic allocations, are more robust, better managers of risk (and diversity) and ultimately more sustainable.
To cite this article: Hart, Wayne. Environmental flow management in a complex, complementary-competitive river system [online]. In: Sustainable Engineering Society Conference (2013: Canberra, ACT). Sustainable Engineering Society (SENG) 2013 conference: Looking back looking forward. Barton, ACT: Engineers Australia, 2013: 138-147.
Availability: http://search.informit.com.au/documentSummary;dn=795537263418063;res=IELENG
Personal Author: Hart, Wayne;
Source: In: Sustainable Engineering Society Conference (2013: Canberra, ACT). Sustainable Engineering Society (SENG) 2013 conference: Looking back looking forward. Barton, ACT: Engineers Australia, 2013: 138-147.
Document Type: Conference Paper
ISBN: 9781922107107
Subject: Water-supply--Management; Stochastic processes; Irrigation projects--;
Peer Reviewed: Yes
Affiliation: (1) Institute for Applied Ecology, University of Canberra, ACT 2601, email: [email protected]
Database: ENGINEERING COLLECTION

298
Environmental flow management in a complex, complementary-competitive river system
Wayne Hart:
Institute for Applied Ecology, University of Canberra, ACT 2601
Correspondence: email: [email protected]
ABSTRACT: The exploitation of a river system occurs because of the multitude of benefits that
accessible water brings to urban and rural communities. The Opuha and Opihi Rivers (NZ) system is
a case study of a strongly regulated system that is progressively but unevenly restoring balanced
community and ecological benefits to a river system that had become severely degraded by
excessive extraction of water for irrigation, to the detriment of urban water flows, recreation, river
based ecological systems, and indigenous fishing rights under traditional food source obligations. The
multiple behaviours of the system show a mixture of deterministic, stochastic and emergent
characteristics that define it as a complex river system, with a wide range of users where some uses
are competitive and some are complementary.
System management by regulation, through an adversarial decision process, will typically lead to a
management and water allocation regime for a system as a whole that is dominated by deterministic
rules. These rules will benefit the stronger stakeholders, so that less influential stakeholders have
generally substandard outcomes. A systems approach to allocation can be used simulate the normal
stochastic behaviours through strategies that maintain the vitality and diversity of all affected
communities with a stake in the river system.
The Opuha - Opihi river system, following the construction of a 70 GL storage dam and a 7.5 MW
electricity generator in the head waters, is a system that demands a multi-disciplinary analysis of the
system behaviours ranging from complex systems theory, economics, community sociology, statistics
and risk management, meteorology and ecology through to hydrology to achieve more balanced
outcomes for all stakeholders. This paper demonstrates the benefit of applying a stochastic nonlinear
dynamical systems analysis to develop a multi-domain system function that recognises the unique
structures of this system, and enables an optimisation process for improved user regimes.
There is a recognition that the current economically based user regimes should respond more to
natural stochastic cycles to achieve optimum multi-user outcomes, and such regimes will ensure that
natural cycle based allocations, rather than deterministic allocations, are more robust, better
managers of risk (and diversity) and ultimately more sustainable.
Keywords: diversity, environmental, river, flows, Opuha, resource, stochastic, complex, system.
Introduction
Natural water is a contestable community resource whereby parties who have an economic, recreational or values based need for the resource will compete for access to and allocation of the resource.
It is commonly found that the demands exceeds the supply, especially in arid or agricultural regions and so there is increasingly a contest based on political power
criteria often resulting in misallocations to the various contested water use applications.
Sometimes the allocation criteria are complementary either in timing or volume, but more often they are competitive and mutually exclusive. For this reason it is often assumed that complementary allocations are not part of the allocation process and opportunities for broader benefits to the wider stakeholder community are lost in the competitive processes because the complexities of the

299
opportunities fall outside the contestable process mechanisms.
An example of such a complex complementary-competitive system is the Opuha - Opihi River system (figure 1) in central east coast of South Island New Zealand. The Opihi River is a 75 km long, predominantly rainfall fed river rising in the foothills of the Southern Alps that is joined midway along its length by a major tributary, the 35 km long Opuha River rising in the Two Thumb Range and predominantly fed by snow melt and storm events.
Figure 1: The Opuha - Opihi River System
The short run of this braided river with the highly seasonal, short peak flow events does not correspond well to the peak demands for summer irrigation in the coastal plains between Kakahu and Temuka. Historically the agricultural communities along the river used the porous gravel based plains as a highly mobile aquifer that was heavily drawn down and then recharged during storm events.
The result of this imbalance was for many years, a severely degraded surface river system whereby limited irrigation in the coastal plains drawn primarily from the aquifer beside the rivers, frequently drew the water table down to significant subsurface levels and dried up the river leaving the aquatic habitat almost non-existent except for larger pools such as
might be found in hard rock cuttings at river bends.
Clearly this management regime has had severe impacts on both environmental and recreational uses of the river system.
The Opuha Dam Project
From 1995-1998 a community based project was undertaken by the user groups listed in figure 2, to dam the Opuha River tributary to the system at the entrance to the Opuha Gorge creating a 70 Gigalitre storage lake that would primarily retain the snow melt as well as large rainfall events for later release to recognised water users.
This river system is described using systems theory (Randall, 2011) terminology as a “complex complementary - competitive” system because it is:
Complex: a bounded open river system with multiple uses, users, operating inputs and outputs, together with strong stochastic, non-linear, and emergent behaviours.
Complementary: some uses are complementary in either a spatial or temporal respect
Competitive: some uses are competitive and mutually exclusive in both a quantitative, qualitative and temporal respect.
The primary users of the water system are listed in figure 2, (Johnson, 2000) and it is important to note that traditional (Maori) fishing was an unfulfilled legal obligation under the Treaty of Waitangi (1842) between NZ Maori Tribes and the NZ Government which in this region are primarily the Ngai Tahu peoples centred around the Arowhenua Marae on the banks of the Opihi River at Temuka.
The elements of this descriptive term “complex complementary - competitive” may need some further explanation; in particular the term complementary system. Complementary uses are well illustrated with irrigation and electricity generation. Competitive uses typically include consumption uses such as irrigation.

300
River System User Groups
Purpose of Allocated Resource
Timaru & Mackenzie District Councils
Urban water supply security flow
Farm cooperatives and individuals
Cropping and dairy farm irrigation
Environmental users:
River health
Ngai Tahu Maori – Mahika kai
Fishing licensees
Recreational users
Diversity of aquatic life and river bank ecology
Eel and estuary (mullet, flounder, etc) fishing
Trout and salmon fishing
Minor water sports, 4WD driving, BMX,
Alpine Energy Ltd Electricity generation
Figure 2: Primary Users and Stakeholders of the Opuha - Opihi River System
Being a short run braided river system, natural water transport in the Opuha - Opihi River system is measured in hours rather than the days or weeks in the larger and longer systems in Australia. This timeframe causes temporal inconsistencies between irrigation water timing (cooler part of day) and electricity generation timing for optimum pricing.
The electricity generation occurs at the toe of the main dam but the construction of a “day pond” and delayed irrigation release immediately downstream of the main dam enables some peak hour / best price electricity generation, and, optimum time of day availability of water for irrigation extraction. These water uses with a little bit of engineering, and a little bit of innovation, and a little bit of compromise are complementary and non-competitive.
The underlying environmental standard imposed over the corporate and agricultural users was that at all times a minimum environmental flow of 2.5 cumecs (2.5 KL/sec) would be maintained at the State Highway No.1 bridge (refer figure 1) in the lower reaches of the river. This initially produced a strong river recovery but significantly reduced the normal (and often beneficial) flood, freshet and drought seasonal stresses on the river, vital for the natural annual life cycles of a short run braided river.
In and around the community debates for the allocation of water to the maximum contestable potential uses, the discussion and
debate processes followed the typical pattern expected of contestable allocations. Planning and regulatory process under the New Zealand Resource Management Act (1991) provided the framework for these discussions and debates and further the allocation and permitting of user entitlements.
However many commentators and stakeholders have expressed concerns with this Act, for example “the resource management process was criticised by developers as time-consuming and expensive, and by environmentalists as giving too much encouragement to developers" (Pawson 2010). This Act is frequently considered a very cumbersome legislative instrument that has on many, if not most, situations left all stakeholders feeling disadvantaged and dissatisfied rather than as proposed here using innovation to deliver a satisfactory outcome.
The economic value of irrigation has seen stakeholders in this sector accumulate membership in the political decision bodies (Sowden, 2010), causing serious stress on conflict of interest protections.
Within this social-political environment, external events have impacted on the river development with two well publicised events: firstly the partial collapse of the dam during a major cyclonic storm when it was under construction (about 20% complete) on 6 February 1997 (Lees and Thomson, 2003) and secondly the collapse of the elected Council for the Canterbury Regional Council, now known as ECan the regulating authority for this river system (Sowden, 2010).
The balance of this paper will consider strategic thinking processes and inputs to the consideration of allocation of resources in a complex complementary system rather than focus on the specific process and outcomes of the Opuha - Opihi River resource allocation history, drawing on the experiences as indicators of other potential outcomes.
Water Allocation Thought Processes
Of particular note is the discussion around determining criteria for environmental flows in a managed river. Such debate involves a number of pressures including:
Stakeholders seek to maximise their desired outcomes

301
Quantitative tolerances for compromise (can outcomes have volume flexibility)
Temporal tolerances for compromise (can outcomes have temporal flexibility)
Matching and simulating natural cycles (short and long term)
Optimising complementary economic outcomes
Predicting unintended outcomes
Review processes to further optimise criteria and realign targets
The natural result of these pressures and the legislative environment is that the compromise is decided or negotiated in a common environment such as an environment court or a political institution and the science behind the thinking and discussion becomes severely simplified and compromised.
In December 2009 (Sowden, 2010) the New Zealand Auditor General - found that four ECan Councillors had broken the law by debating and voting on proposed water charges where they had conflicts of interests as water consent holders or partners of water consent holders.
The report of the joint investigation identified major failings in the way that the ECan managed water in Canterbury together with long running institutional problems.
That irrigation in Canterbury represents 7% of GDP represents the pressures to follow economic criteria rather than comprehensive science based analyses involving all sciences from economics, through community sociology, statistics and risk management, meteorology, ecology and hydrology, and instead present balanced outcomes. It is nevertheless a reality that most English Common Law based societies have evolved civil decision making processes based on an adversarial rather than an inquisitorial approach.
The inquisitorial approach arises when a “court” is actively involved in investigating the case, whereas in an adversarial system the court is a primarily a referee between the protagonists. The consequence of the adversarial approach is that the adjudicator of the “court” is primarily qualified in law or politics (ie is elected) and generally seeks an outcome that is least likely to suffer a successful appeal.
The tendency to seek an outcome of least resistance that is subject to an adversarial appeal process, leads to a conservative approach to system management. The regulatory or licencing output becomes the cumulative result of these various pressures and societal approaches. The licensing outcome is then a simple regulatory regime that is easily quantified by evidence oriented measurement and is therefore subject to easily proven enforcement regimes rather than a System Manager who is charged with meeting balanced objectives. Yet this is at odds with typical agricultural practices where farmers demonstrate long term land care strategies in the management of their own farms and local catchments, often forming local knowledge sharing cooperatives to enhance those care strategies.
Typically though the resulting river management regime is a minimum flow measured by a standard device at one or several points along the river path that may or may not have seasonal variations. This often results in the river system becoming “a long moving pond” without the vitality and diversity that characterises most natural river systems.
Vitality and Diversity of River Systems
A preferred alternative approach as justified below is to create an environmental flow regime that replicates the diversity of natural behaviours of the river system and therefore enables the ecology of the managed river to, as closely as practicable, match the natural pre-management scenarios.
This approach means identifying the outcomes of the various features of the vitality and diversity of a river system. To illustrate this approach, here follows a description and discussion based on the features of the Opuha - Opihi River system, as an example of a complex complementary-competitive river system facing multiple use pressures.
The description developed by the author summarises in figure 3 the set of behaviours this river system will from time to time display, the causes, and the benefits or outcomes the river system will deliver, in its different phases.
Creating a discussion and negotiation environment for such a regime with an objective to replicate some or most of the natural river system behaviours with such a

302
diverse range of stakeholders is extraordinarily challenging. In a community and regulatory environment where stakeholders have become culturally attuned to adversarial negotiations and power (economic and / or political) based decision processes, to apply best practice principles of science and community outcomes requires a new recognition that a win-win outcome is possible.
Flow Strategy and Allocation Development
The options in environmental flow strategy development are the result of setting priorities on users and uses of the river. It is a normal reality that the traditional adversarial approach described above will see the more dominant users gaining priority. The concept of discretionary additional water arises so that at times, water is made available for time
managed freshet or flood events to enable the positive benefits these events bring to the vitality and diversity of the ecology of the river.
Typically instead, an environmental negotiation and allocation strategy that recognises the river system behaviours alongside an understanding that all natural systems contain variability and risk is recommended. This would for example see the economic allocation of water resource (for example to irrigation) based on a core flow at say 90% certain levels (but still subject to rationing in exceptionally dry periods) plus discretionary additional water as available.
In parallel, the same strategy is applied to environmental allocation of water resource, where minimum flows are based on a core flow regime at say 90% certain (but still subject to rationing in exceptionally dry periods) plus discretionary additional water as available.
River Behaviour Cause(s): (f(x) = frequency) Benefits and Outcomes
1. Loss of stream continuity – river retreats to pools and “holes”
Summer drought
Excessive irrigation extraction
Regular - f(x) > 2-5 years
Reduction in algae and pests
Reduction in non-mobile ecology
Survival of stronger / native species
Exotic species more vulnerable
Loss or recreational usage
2. Low stable flow for extended periods
Build of upstream dam
Over managed system
Maximised usage
Regular - f(x) = annual
Continuous growth in ecology
fills large pools or “holes” on bends
Water temperatures average high
Growth in pests – e.g. algae
Growth in accumulated waste
3. Major winter or summer Flood
Very large rainfall events
Likely rare - f(x) > 10 years
Washout of some species to sea
Cleans large pools or “holes” on bends
Washout of most waste and pests
Tumbling of riverbed stones – cleans
Faster growth ecology dominates early recovery of river health
4. Spring flood / freshet
Snow melt and/or rain event
Common - f(x) ≈ annually
May vary from year to year
Cools down river systems
Cleans large pools or “holes” on bends
Washout of some waste and pests
Tumbling of riverbed stones – cleans
Develops an annual cycle
Favours certain ecology species
5. Summer or winter freshet
Average or minor rainfall events
Common - f(x) ≈ quarterly
Washout of some waste and pests
Cleans large pools or “holes” on bends
Tumbling of riverbed – minor cleans
Develops regular cycles and variety
Favours certain ecology species
Figure 3: Five-way Classification of River System Behaviours

It is recognised that agriculture usually cannot take advantage of short run excesses simply because of the seasonal, planting, growth and harvest cycles, however in recognition that the river system has had, say, a couple of additional (managed) flood and freshet events in recent years, it could be agreed that the next year there will be an additional allocation of irrigation water, even if it subsequently places the river system under the equivalent of drought stress when anticipated extra rainfall is limited.
As noted above, periodic drought stress is an important natural temporal phenomenon that brings longer term benefits to a river system, even though it is likely to go against the natural sympathies of the wider community to care for the environment that appears not able to care for itself.
It is argued that a more natural, robust, sustainable river system and its associated ecology will evolve, including a sense of advantage to native species that have evolved in such an environment, if it is subject to the natural variability and stresses of the natural environment rather than being mollycoddled with ill-informed pressures. This means that to see fish occasionally die because of river stress is an acceptable (albeit occasional) natural behaviour.
Opuha Precipitation Pattern
The rainfall data in the Opuha River catchment has been collected by local station holders and is potentially inconsistent, but nevertheless is shown in the rainfall frequency chart for the 19 year period, 1976 – 1994 (figure 4).
Figure 4: 19 year (1976 – 1994) rainfall distribution in the Opuha River Catchment
The rainfall records have been correlated with official river flow records (figure 5) for the Opuha River and show a similar trimodal pattern of precipitation being very dry, average, or very wet years rather than the normal (bell curve) probability distribution. It is the unique nature of a short run braided river that precipitation events show distinct river flow peaks because of the rapid catchment drainage time after such an event.
This trimodal weather pattern distribution shows that the annual weather patterns of very dry, average, and very wet; each occur with approximately equal probability.
The weather patterns for this period and region show that precipitation is strongly affected by the SW-NE orientation of the Southern Alps which places the region in a rain shadow from the dominant westerly weather patterns of most of New Zealand. The majority of “average” precipitation, whether from rain or snow, is of a southerly origin and of a relatively steady nature.
Up to an average of three times per year the catchment is impacted by strong, very moist, cyclonic storms from the north-east and east as can be determined from Opuha river hydrographs (Dark et al, 2008). The number and frequency of these major events defines a dry, average, or wet year in terms of total precipitation. In support of this pattern of cyclonic storms, it can be observed in figure 5 and most notably, as might be expected in very wet years, there is an increasing probability of major and extreme events. There were only two extreme events in the period of this analysis.
Flow in Opuha River Dry
Years Average
Years Wet
Years
No. of minor events (20-100 cumecs)
2.5 3.2 4.0
No. of major events (100-200 cumecs)
0.2 0.4 0.5
No. of extreme events (>200 cumecs)
0 0 0.3
Total No. significant events per year
2.7 3.6 4.8
Total Years in each category
11 11 8
Figure 5: 30 year (1972 – 2001) Opuha River peak flow events
The Opuha - Opihi River system ecology has clearly evolved as a consequence of this highly specific weather pattern with regards to

304
precipitation and its subsequent effects on the hydrology. Being composed of typical short run braided rivers, the importance of floods and freshets to “clean” this system by regenerating holes and tumbling the gravels to remove pests and algae is very evident.
This analysis clearly demonstrates the stochastic behaviours of the weather and subsequent hydrology of the Opuha – Opihi system creates a special set of nonlinear dynamical conditions that affects the local catchment. Further this catchment is isolated from other systems and regions by the Two Thumb Range to the west and the Mount Peel – Four Peaks Range to the east. The climatic impact on this complex system generates a need for specific solutions in managing a strongly regulated and engineered system.
Whilst removal of large amounts of water for organisational and agricultural use is important to the economic and social health of the region, replicating the annual river cycles with appropriate flood events is equally important to the ecological health of the river system
More recent studies by NIWA (Arscott et al 2007) have reported that the stable flow regime created by the regulated stable river flows were partly responsible for increased periphyton algae mat coverage of up to 55% of the river bed and that flush flows up to 20 cumecs were only effective in the upper reaches as the effectiveness rapidly declined downstream. A regime of additional actions such as longer sustained flushing events, topping up natural events will lead to disruption of the now tightly packed river bed by a natural phenomenon.
Whilst the extensive ecosystem damage from thick and persistent algae mats is most concerning, it has inspired a need for urgent and high quality research. Early Opuha – Opihi project stakeholders with river experience in other areas such as Nelson - Waimea as more recently reported by Hay and Young (2005) had forecast such issues however with significantly different climatic and demographic backgrounds predictive evidence was less clear. Actual practice has since proven the validity of the opportunity to take the Opuha – Opihi experience into other river systems many of which are choking from excessive algae invasions.
Modelling Natural Cycles – Illustrated
From the current knowledge of the mass set function and its stoichiometric parameters an alternative model to the constant environmental flows is postulated based on a total annual allocation regime.
Shown in figure 6, is the normal regulated fixed environmental flow and equi-comparable but variable environmental flow option, each based on the same total annual flow to irrigation users but simply reallocated during the season, with two flood events replicating either the pre-project spring thaw in the Two Thumb Range or a north-east cyclonic storm.
Model Notes:
1. Autumn & Spring Flush = 4.54 GL over two days (@ 35 KL/sec)
2. Summer - Autumn net re-allocation from river to Irrigators = 13.91 GL
3. Winter - Spring net re-allocation back to River = 13.91 GL
Figure 6: Potential model for fixed or variable e-flows in a river system
This model seasonally reschedules the river system to experience a seasonal flow regime that more closely simulates natural behaviours and attracts the natural benefits of such a regime, and does not produce net reduction in flows to economic users such as irrigators.
It is also important to note that while the model shows the average flow in a flood week is 10 cumecs (10 KL/sec), this could be actually be achieved typically by a two day event of say 25 cumecs, and a five day event of say four cumecs, replicating that the effects and benefits of most storm or freshet events in this river system that occur by events of a short duration. Nevertheless this remains a compromise with the Opuha River alone producing two very large events during the 30 year period, one at 240 cumecs and another producing 375 cumecs each for a day or so.

305
Such extreme events produce a massive renewal event for the river and needs to be recognised as a potentially beneficial event.
To further leverage the natural benefits the introduction of a single stakeholder’s System Manager rather than a System Regulator is perhaps the preferred option over a flawed political process seriously impacted by conflicts of interest. The System Manager could have the mandate at short notice to synchronise such a flushing peak with heavy rain events and create a cumulative impact, something that is not permitted by current licensing.
This modelling done on the Opuha - Opihi River system in the 1995 - 2000 period showed that such a strategy makes a greater amount of water available for allocation to economic uses provided that agricultural users develop irrigation management systems that have an element of stochastic uncertainty and access to short term (annually) planned crops to make use of additional allocation.
This illustrative example of such modelling in figure 7 shifts some 14 GL of summer environmental flow to irrigators and the same water is returned to river in traditional wet season flows with a couple of 35 cumec flood events some 14 times greater than the standard environmental flow.
Such a management regime would contribute strongly to the health of the river in line with the behaviours shown in figure 3. There is however a probability that generating adequate peak flow to cause genuine flushing may also well lead to redirection of braids (an entirely natural phenomenon) and impacts to irrigation water off-take devices and weirs.
Conclusions
It is recognised that the usual decision processes, the constraints of an adversarial approach, and the community emotional responses to a river in (perhaps avoidable) drought stress in a society with considerable access to multiple media outlets, make a strategy based on recognition and management towards natural variability difficult and may inevitably result an allocation response that becomes very conservative.
A new systems approach to the study and management of any complex complementary-
competitive river system is the most important parameter to be considered by all stakeholders as demonstrated by the regular algae plagues recorded in the local media.
The Opuha - Opihi system has naturally exhibited a wide range of complex, stochastic nonlinear behaviours and any management regime that seeks to maintain a vital and diverse river ecosystem for all stakeholders should seek to replicate these behaviours throughout the multi-year cycles with a stochastic pattern that replicates the unique trimodal weather patterns of the system.
It is strongly argued by the author that environmental flows based on steady, strong flows that do not exhibit the natural variability of excess and stress, will inevitably result in weaker less robust river ecosystems as well as suboptimal economic outcomes.
It is equally strongly argued that with education and experience wider stakeholder acceptance of the need and benefits of variable environmental flows will evolve in all parts of the community from economic, infrastructure, recreational and ecological advocates.
Over the 14 year’s operating experience since commissioning the Opuha Dam and regulatory management system, the river system initially responded positively to the project, but also in line with predictions responded with a need for more sophisticated management regimes. The progress of the problems has enabled high quality research and consequently evidence based policy to evolve for the benefit or this and other like complex river systems.
References
Johnson, R B. 2000 Opihi River Regional Plan Canterbury Regional Council Report R00/16, ISBN 1-86937-392-8, 28 September 2000
Arscott, D.B. Kelly, D.J. Tuck, E. (2007) Flushing Flows for the Control of Nuisance Periphyton Growth in the Opuha-Opihi River System (2004-2006), National Institute of Water & Atmospheric Research Ltd, Christchurch Report CHC 2008-034, August 2007 pp. 1-45
Hay, J. Young, R. (2005) Review of biological data relating to the Waimea River Catchment, Waimea Water Augmentation Committee, Cawthron Inst. Report No. 996, June 2005

306
Pawson, E. 2010 Economy and the Environment - Regulating Economy and Environment Part 4, Te Ara - the Encyclopedia of New Zealand, 26 November 2010
Randall, A. (2011). Risk and Precaution, Cambridge University Press, Cambridge and New York, page 65 ISBN 978-0521766159
Sowden, M. (2010) Regulatory Impact Statement – Response to the review of Environment Canterbury, Natural and Built Systems, NZ Ministry for the Environment, Wellington, 22 March 2010
Lees, P. Thomson, D. (2003) Emergency management, Opuha Dam collapse, Waitangi Day 1997, 2003 Symposium "Dams – Consents and Current Practice”, IPENZ Proceedings of Technical Groups 30/2 (LD) pp.84-89
Dark, A. Bright, J. Sigle, S. (2008), Canterbury Strategic Water Study (Stage 2), Aqualinc Research Ltd, Canterbury Mayoral Forum, December 2008, Report No. L05086/1.
Hajek, B. (2011) An Exploration of Random Processes for Engineers. IFP Group, University of Illinois at Urbana-Champaign December 2011 pp.1-413
Rowley, J. (2007) The wisdom hierarchy: representations of the DIKW hierarchy. Journal of Information Science 2007 33: 163

307
APPENDIX 3: Sustainable Engineering Society (SENG)
2013 conference: Looking back...looking forward
Renewable energy flux thresholds for development decisions: Using fundamental engineering knowledge to plan a better future
Hart, Wayne1
Abstract: A key global strategy for reducing the risks of extreme events arising from climate change is the expansion of renewable energy availability to energy networks. This expansion is the subject of many international research and development programs incentivised by extensive government funding programs many for proof of concept projects. Allocating funding to genuine, viable technologies is a cause of much angst among government agencies that can be improved by greater use of traditional engineering knowledge and analysis. The many definitions for renewable energy that are based around simplistic source descriptions lead policy makers and potential investors to risk misjudging priorities for policy and investment development. Simplistic descriptions, often driven by lay, public relations program descriptions such as, bioenergy, geothermal, hydroelectricity, oceanic, solar, and wind create a warm emotional response but can mislead decision makers to suboptimal choices. This paper presents a new concept for defining renewable energies that leads stakeholders to form a more realistic assessment of the policy and investment potential and the risks of the many renewable energy options. The simple application of renewable energy flux, flux intersection and flux capture efficiency concepts combine to give a rigorous methodology for the realistic assessment of renewable energy options. This paper demonstrates the strength of these concepts within the current debate on renewable energy and its sources.
To cite this article: Hart, Wayne. Renewable energy flux thresholds for development decisions: Using fundamental engineering knowledge to plan a better future [online]. In: Sustainable Engineering Society Conference (2013: Canberra, ACT). Sustainable Engineering Society (SENG) 2013 conference: Looking back looking forward. Barton, ACT: Engineers Australia, 2013: 82-91.
Availability: http://search.informit.com.au/documentSummary;dn=795108705079125;res=IELENG
Personal Author: Hart, Wayne;
Source: In: Sustainable Engineering Society Conference (2013: Canberra, ACT). Sustainable Engineering Society (SENG) 2013 conference: Looking back looking forward. Barton, ACT: Engineers Australia, 2013: 82-91.
Document Type: Conference Paper
ISBN: 9781922107107
Subject: Climatic changes--Environmental aspects; Renewable energy sources--Technological innovations; Renewable energy sources--Government policy; Technology assessment; Renewable energy sources--Economic aspects; Sustainable engineering;
Peer Reviewed: Yes
Affiliation: (1) Institute for Applied Ecology, University of Canberra, ACT 2601, email: [email protected]
Database: ENGINEERING COLLECTION

308
Renewable energy flux thresholds for development decisions:
Using fundamental engineering knowledge to plan a better future.
Wayne Hart,
Institute for Applied Ecology, University of Canberra, ACT 2601
Correspondence: email: [email protected]
ABSTRACT: A key global strategy for reducing the risks of extreme events arising from climate change is the expansion of renewable energy availability to energy networks. This expansion is the subject of many international research and development programs incentivised by extensive government funding programs many for proof of concept projects. Allocating funding to genuine, viable technologies is a cause of much angst among government agencies that can be improved by greater use of traditional engineering knowledge and analysis.
The many definitions for renewable energy that are based around simplistic source descriptions lead policy makers and potential investors to risk misjudging priorities for policy and investment development. Simplistic descriptions, often driven by lay, public relations program descriptions such as, bioenergy, geothermal, hydroelectricity, oceanic, solar, and wind create a warm emotional response but can mislead decision makers to suboptimal choices.
This paper presents a new concept for defining renewable energies that leads stakeholders to form a more realistic assessment of the policy and investment potential and the risks of the many renewable energy options. The simple application of renewable energy flux, flux intersection and flux capture efficiency concepts combine to give a rigorous methodology for the realistic assessment of renewable energy options. This paper demonstrates the strength of these concepts within the current debate on renewable energy and its sources.
KEYWORDS: renewable, energy flux, bioenergy, geothermal, hydropower, tidal, solar, wind.
1. Introduction
Renewable energy means many things to different people. It is a concept of important political, scientific and community interest; however it is also a source of much difference of opinion. Throughout the world, scientific and government agencies approach the concept in ways that reflect their particular objectives and Australia is a clear example of that. We see across three Australian agencies an approach that focuses on two primary aspects, being in essence (i) natural energy resources that (ii) can be replenished.
Renewable energy in the Australian context is defined by the Australian Bureau of Statistics, an agency of the Treasury of the Australian Government, as energy sources, such as solar, hydropower, biomass and wind power, that are naturally replenished and produce relatively few greenhouse gases. (ABS 2008)
ABARES, the Australian Bureau of Agricultural and Resource Economics and Sciences is an
economics research organisation within the Australian Department of Agriculture, Fisheries and Forestry. ABARES (2010) records that Australia has a rich diversity of renewable energy resources (wind, solar, geothermal, hydro, wave, tidal, bioenergy).
The Australian government agency directly responsible for renewable energy development; the Australian Renewable Energy Agency (ARENA 2013) falls within the jurisdiction of the Department of Resources, Energy and Tourism, and defines renewable energy as energy which can be obtained from natural resources that can be constantly replenished. ARENA considers that renewable energy technologies include technologies that use, or enable the use of, one or more renewable energy sources including: bioenergy, geothermal energy, hydropower, ocean energy, solar energy, and wind energy. ARENA further defines renewable energy technologies as those technologies that are related to renewable

309
energy, for example technologies that (i) store energy generated using renewable energy, (ii) predict renewable energy supply, and (iii) assist in the delivery of renewable energy to energy consumers.
2. Renewable Energy Concepts
The traditional approach to describing renewable energy is well described in the ARENA website which for convenience has the key elements described in alphabetical order below. Not included herein as a distinct renewable energy form is what ARENA describes as hybrid technologies as these are essentially one of these core sources blended with other energy generation vehicles to extend energy efficiency and outputs:
a. Bioenergy is a form of renewable energy derived from biomass to generate electricity and heat or to produce liquid fuels for transport. Biomass is any organic matter of recently living plant or animal origin. It is available in many forms such as agricultural products, forestry products, and municipal waste.
Traditionally mainly woody biomass has been used for bioenergy with wood or wood waste used a primary fuel in both domestic and industrial settings, however more recent technologies based on a better understanding of hydrolysis and fermentation processes have expanded the potential resources to those such as agricultural residues, oilseeds and algae. These advanced bioenergy technologies are mostly in the production of biodiesel from plant lipids and bioethanol from starch or sugar crops which allow for the sustainable development of a more diversified bioenergy industry, reducing competition with traditional agricultural land and resources.
b. Geothermal energy is the energy released as heat from below the surface of the earth. There is a steady continuous flow of heat from the centre of the Earth (where temperatures are above 5000°C) through the surface of the Earth (15°C) into space (-273°C). The heat is generated by the natural decay of radiogenic elements over millions of years, including uranium, thorium and potassium, but generally that energy moves in a slow steady process and is rarely in a useable form. Occasionally the geothermal energy (Turcotte 2002, Finger 2010)) has an
enhanced flux towards the earth’s surface where it becomes exploitable.
Ancient uses of geothermal energy include a stone pool on China’s Lisan Mountain built in the Qin dynasty in the 3rd century BCE and later the hot baths of the ancient Roman Empire in Bath, England dating from the first century CE.
In the modern context energy is brought to the surface through deep drilled bores extracting hot water that is circulating amongst the sub-surface rocks, or by pumping cold water into the hot rocks and returning the heated water to the surface, to drive steam turbines to produce electricity. Widely faulted bed rock structures and subterranean water are pivotal to this process of enhanced energy flux.
c. Hydropower is a renewable source of energy which uses the force or energy of moving water to generate power.
In the modern context this power, or ‘hydroelectricity’, is generated when falling water is channeled through water turbines. The high pressure and volume of the flowing water impacting on turbine blades rotates a shaft and drives an electrical generator, converting the motion into electrical energy.
Hydropower is an advanced and mature renewable energy technology, and provides some level of electricity generation in more than 160 countries worldwide since its advent some 130 years ago. Hydropower plants range from very small to very large individual plants and vast schemes involving multiple large hydropower plants.
d. Ocean energy is a term used to describe all forms of renewable energy derived from the seas that cover some 71% of the Earth’s surface and therefore dominate the natural energy dynamics of our world. There are two main types of ocean energy: mechanical energy from the tides and waves, and thermal energy from the sun.
wave energy—generated by converting the energy of ocean waves (oscillating swells) into other forms of energy (currently only electricity). There are many different technologies that are being developed and trialed to convert the energy in waves into electricity.
tidal energy—generated from tidal movements typically in and out of

310
estuaries has been a feature since the Rance Power Station (Hammons 1997) in Northern France was built in 1966. Tides contain both potential energy, related to the vertical fluctuations in sea level, and kinetic energy, related to the horizontal motion of the water.
ocean thermal energy—a newer technology generated by converting the temperature difference between surface water and water at depth into useful energy. Ocean thermal energy conversion (OTEC) plants may have a range of applications for Australia, including electricity generation. They may be land-based, floating or grazing.
e. Solar energy is energy which is created directly from sunlight or heat from the sun. Solar power is captured when energy from the sun is converted into electricity or used to heat air, water, or other fluids. It is also a mature, even ancient form of energy having been used for community and food preservation purposes for example recorded mention of dried fruits can be found in Mesopotamian tablets dating back four millennia (Trager 1995)., and evaporated sea salt is mentioned in the Vinaya Pitaka, a Buddhist scripture compiled in the mid-5th century BCE (Prakash 2005).
There are currently two main types of solar energy technologies:
solar thermal—these systems convert sunlight into thermal energy (heat). Most solar thermal systems use solar energy for space heating or to heat water (such as in a solar hot water system). This heat energy can also be used to drive a refrigeration cycle to provide for solar based cooling, or to make steam, which can then be used to generate electricity using steam turbines.
solar photovoltaic (PV)—the direct conversion of sunlight directly into electricity using photovoltaic cells is a modern technology. PV systems can be installed on rooftops, integrated into building designs and vehicles, or scaled up to megawatt range power plants.
f. Wind energy is generated by converting wind currents into other forms of energy using wind turbines. Historically this has included sailing ships as well as wind mills for grinding grains or pumping water, again
usages that have a recorded history of several millennia.
Winds are created by composite mechanisms involving the rotation of the Earth, the heating effects of the Sun, the cooling effect of the oceans and polar ice caps, temperature gradients between land and sea, and the physical effects of mountains and other obstacles.
Modern wind turbines convert the force of the wind into a torque (rotational force), which is then used to rotate an electric generator to create electricity.
Wind energy power stations (wind farms) commonly aggregate the output of multiple wind turbines through a central connection point to the electricity grid and these occur in both on-shore (on land) and off-shore (out to sea) wind energy projects.
For the purposes of this paper renewable energy will refer to that energy from a practically inexhaustible source where the capture and use of that energy for humankind’s purposes does not materially alter the energy balance of the environment that existed before its capture. At the extremes of physics one might argue that the Sun has a finite life which at current estimates is expected to expire in about five billion years and that earth may become uninhabitable in about one billion years. This paper will disregard those scenarios and consider solar renewable energy within the current framework of the Solar System.
Further we should consider that renewable energy is that energy which is potentially available for capture and reuse for the direct benefit of humankind. It does not include for example biological luminosity as might be found in glow-worm caves as a prey attractant for moth larvae or deep sea fish luminosity. Whilst within the definitions of pure physics these are renewable energy forms, they are not renewable energy forms that are available for capture and reuse by human kind.
3. Environmental Considerations
The enthusiasm in renewable energy has been severely mitigated by increasing awareness of the environmental side effects of renewable energy facilities. Often these are an adverse impact but sometimes there are significant community benefits particularly in community education, tourism and recreational options as seen in Table1.

311
Table 1: The main environmental impacts of typical renewable energy facilities
Renewable Energy Environmental Impacts (High, Medium or Low)
Bioenergy - ethanol Moderately high levels of waste and by-products
Moderately high risk of biological odours
High feedstock growing, energy and transport inputs
Low net energy yields
High
Geothermal Accelerated release of hazardous heavy metals
Adverse impacts on regional water tables
Low (hot rock) to higher (aquifer) net energy flux
Medium
Hydropower Large scale physical disruption to montane features
Disruption to riverine ecology, increases in algae
Flood mitigation but reduced ecological diversity
Enhanced recreational uses of water sports and fishing
High net energy yields
High
Oceanic energy - tidal Significant changes to estuarine ecology and species
Silting risks in estuaries – can be managed
Enhanced tourism and educational opportunities
High net energy yields
Medium
Oceanic energy - wave High maintenance
Operations impact local sea-life
Low to medium net energy yields
Low
Solar power - PV Complex manufacturing facilities required
Static systems – low operating costs
High net energy yields
Low
Wind power - HAWT Noise and visual impacts in rural situations
Minor loss of birdlife by blade impacts
High net energy yields
Low
4. Common principles of renewable energy
Planet Earth is possibly the most dynamic energy planet in the Solar System comprising not only the widespread geophysical processes of solar radiation, wind, dust storms, and volcanic processes but because the planet surface is dominated by water systems, Earth has a very wide range of large scale energy and dynamic processes.
It is not simply the presence of various forms of energy that creates the opportunity for Earth inhabitants (human and animal to survive but that these energy forms exist in dynamic processes that enable the flow of energy to be interfaced, and a part of the energy to be captured and used for a different process or cause. It is this concept of energy flow intersection, capture, and diversion that establishes the concept of renewable energy.
Thus for an energy form to be renewable there must exist:
a. An energy flow. The mere existence of a static reservoir of energy as for example in a coal field or an oil field does not create
the opportunity for renewable energy. The use of a reservoir of energy without replenishment does not provide for renewability, whereas a flow of energy form from its source to destination enables the intersection and capture of some of that energy flow.
b. An intersection with the energy flow, by a system or device that responds to the inwards flow of energy and releases outwards the uncaptured energy.
c. A partial capture of the energy flow. As is may be derived by use of the second law of thermodynamics almost never can any form of energy be diverted for use at 100% efficiency. The capture efficiency may vary from 20% or less for solar or biomass energy to 80% or more as for hydropower.
d. A delivery mechanism to enable the captured energy to be delivered with minimum losses (typically 5-10% of the bulk flow) to a user or for an application.
An understanding of the renewable energy process such as this draws the analysis away from lay and emotional terminology into a more technical and commercial analysis which

312
enables more rational decisions on investment and policy to be made.
Many, if not most, governments of developed countries have as a consequence of their dependence on fossil fuels (coal, oil, and gas) increased their policy awareness of renewable energy and have sought to encourage the research, development, and exploitation of renewable energies, some forms such as geothermal, hydropower and wind power have matured sufficiently to be widely exploited as commercial levels, whilst others are still in the research, or small scale niche development phase.
As is commonly seen in situations where there is direct intervention in markets by governments to achieve a long term strategy beyond the time horizons of bona fide commercial and investment participants, fringe participants seek to slip inside the edge of the program definition to capture “a slice of the action”, such participation being commonly named “rent-seeking” Tullock (1998). This is when lobbying by an entity seeks to gain an economic benefit from society or government without reciprocating any benefits back to society through wealth creation”. Examples of rent-seeking are when a company lobbies the government for loan subsidies, grants or tariff protection. These activities don't create any benefit for society; they just redistribute resources from the taxpayers to the rent seeking, special- interest group.
On the other side of this debate, governments are trying to be as open minded as possible to new innovative forms for renewable energy and renewable energy technologies to expand their future options.
This paper provides a methodology that will provide an investment or policy threshold and reduce the risk of excluding a potentially viable renewable energy technology but reduce the risk of wasted public research and development funds, by providing a sound scientific and commercial policy criteria that highlights the probability of success of an investment in renewable energy.
This criteria is based around the concept of energy flux which is a measure of the rate of transfer of energy through a defined system surface. The quantity is may be defined in slightly different ways, depending on the context, with the two most common being:
Rate of energy transfer per unit area is measured in watts per square metre (SI units = Joule per second per square metre).
This vector quantity has its flow component measured perpendicular to the energy capture system surface area, and may be called the specific energy flux or energy flux density, to recognise the specific area in the definition.
Total rate of energy transfer measured in watts. (SI units = Joule per second - watts). This scalar quantity is the flow through a defined system boundary and is sometimes informally called the energy output or the energy current.
The capture system surface area is somewhat problematic to define consistently across such diverse technologies. For the purpose of this paper it is used as the area at the point at which the capture process is managed, meaning that for hydropower it is the cross sectional area of the dam, whereas for solar power it is the surface area of the ground covered by the capture device. For geothermal it is even more problematic as the exploitable flux occurs over a field of an area defined by geo-resistivity boundaries, however the energy is extracted by drilling into the field and intersecting geological faults to provide a flow pathway for geothermal heat transfer and so in this case is considered the area of the active field (Lee and Bacon 2000).
These principles around energy flux and capture efficiency lead us to Proposition One:
Prop 1: That only renewable energies that are present above a threshold energy flux and have a capture efficiency above a threshold capture rate will become viable renewable energies.
Because the technologies for each type of renewable energy vary so greatly from intense, highly regulated, advanced capital equipment options such as hydropower to passive distributable solar power installations, the threshold energy flux and the threshold capture rate will vary between renewable technologies leading us to Proposition Two:
Prop 2: That each form of renewable energy will have a unique threshold energy flux and a threshold capture rate that may be used to priortise the likelihood of success of that form of renewable energy development.
Finally because the world has standardised electricity distribution systems and standardised use devices (appliances) almost all renewable energy systems with electricity as an output will suffer conversion and distribution (Newell 2007) losses. A great deal

313
of work is put into reducing these losses by geographical siting of facilities that leads us to Proposition Three:
Prop 3: That viable renewable energy systems will have standard energy form outputs located as close as possible to consumer demand networks so that energy flux threshold criteria are not compromised by high distribution losses.
It is proposed that these three propositions provide a comprehensive and rigorous methodology for priortising renewable energy and technology developments.
An example of a potential renewable energy source that has been often demonstrated with initially exciting interest but which repeatedly struggles to gain commercial traction is biomass gasification. This technology (Anderson, 1977) gained widespread acceptance in World War Two when strict controls on civilian use of petroleum products meant that private vehicles otherwise sat idle through the absence of fuel. Modern units still continue to be used but only where remoteness precludes alternatives.
The further complication of high moisture contents in biomass severely reduced efficiency. In such situations the energy flux is very low and the energy capture rate is also very low. Demonstration units frequently trigger interest by producing a gas that burns with a hot flame but at essentially non-economic flux outputs compared to the direct combustion of the dry biomass. Hence the use of propositions one to three when comparing direct combustion with biomass gasification frequently negates gasification as a viable renewable energy, even though the common use of the term renewables applies and draws sympathetic interest to technology promoters seeking R& D financial support.
5. Energy flux thresholds for specific renewables
Most renewable energy forms have heritage applications that involve direct application where the renewable energy flow is intersected and captured for direct use as is seen in wood fire heating in homes, geothermal hot baths, water mills for grinding grain, surfing on waves, sun dried fruit, and wind powered sailing craft. In the modern context, energy processing operations sees a new dimension after the intersection and capture of renewable energy being the subsequent delivery of the energy to the user.
The most common form of delivery is now via electricity networks and to a lesser extent hot water district heating schemes.
Following is how these principles exist in a modern context. Material to this discussion is recognition that there exist many new experimental technologies that do not operate at scales that generate renewable energy at “commercial” levels. The following analysis provides benchmark thresholds that these energy forms may need to aspire to in order to move out of the experimental research regime into the commercially viable regime.
a. Bioenergy - Bioethanol
Few of the many bioenergy options have achieved long term competitive (with fossil fuels) status in their own right compared to those that are essentially waste disposal options (Anderson 1977) with an energy by-product, other than the production of, biodiesel and bioethanol. There are large scale industries in the USA (corn), Brazil (cane sugar) and to a lesser extent in Australia, Indonesia and Malaysia (biodiesel from palm oil). Generally such examples compete to some extent with agricultural production for human or animal food or forest reserve areas.
In the USA a typical corn based bioethanol plant (Hauser 2007) will produce 190 million litres pa of ethanol with an energy output of 21 MJ / litre (being 4 billion MJ pa or 127 MJ/sec) from 22 million bushels of corn at 130 bushels per acre being produced therefore from 170,000 acres (700 million sqm) to give and energy output of 0.2 watts / sqm.
b. Geothermal Energy
The geothermal gradient is the rate of increasing temperature with respect to increasing depth in the Earth's interior. Away from tectonic plate boundaries, it is about 25°C per km of depth however this temperature profile does not directly represent the heat flux.
The Earth's internal heat comes from a combination of residual heat from planetary accretion (about 20%) and heat produced through radioactive decay (80%). The major heat-producing isotopes (Sanders 2003) in the earth are Potassium-40, Uranium-238, Uranium-235, and Thorium-232.
Mean heat flow is 65 milliwatts per sqm over continental crust and 101 milliwatt per sqm over oceanic crust (Pollack 1993), and a typical 100 milliwatt per sqm in hot rock anomalies. If the hot rock anomaly is treated as a low grade reservoir a 2 MW(th) heat flux

314
from a typical hot rock circulating bore pair cell of 200,000 sqm, to give a thermal heat flux of 10 watts per sqm with 25% thermal / electrical capture from a generator.
Geothermal from the more traditional aquifer based systems rely on higher energy fluxes created not by conduction through rocks but by natural groundwater flows from a nearby natural water reservoir such as a lake or large river through heavily faulted volcanic regional rocks.
At the, typical, Ohaaki field in New Zealand (Lee and Bacon 2000) this relatively low grade power station has a maximum net capacity is about 66 MW(e), from a field that is approximately 2 sq km, to give an electrical energy flux of 33 watts per sqm after a 25% thermal / electrical capture by the generators.
c. Hydropower
The Snowy Mountains hydro-irrigation scheme consists of many dams, tunnels and power stations (Snowy Hydro 2003) in a complex web of water diversions. Measuring the energy flux is quite complex due to the definition of the flux area, as for example Tumut 1 and Tumut 2 project (Diesendorf 1961), a linked pair of deep underground (average depth 300 metres underground) power stations (610 MW and typically 1,600GWHr /year) fed from an alpine dam 220 m wide and 85 m high (9,460 sqm) through a total of 7.2 kilometers of 6.4 metre diameter pressure tunnels. This highly engineered funneling of energy creates an average annual energy flux of (1,600 GWHr /8760 hours across 9,460 sqm dam area) 20,000 watts / sqm.
A more useful flux threshold measure is the Blowering Power Station, an impounded body of water contained by a wide base, valley dam that is 800 m wide at the top, 400m wide at the base and 90 metres high, therefore with an approximate cross sectional area of 54,000 sqm. This 80 MW power station annually generates 260 GWHr and therefore produces a modest energy flux of 550 watts per sqm. This dam also perform major storage and flood mitigation services for the downstream Murrumbidgee Irrigation Area (MIA) with peak electricity generation capability and so has a relatively low capacity factor of 37%.
These two extreme examples demonstrate both the scale and flexibility of hydropower with extremely high energy fluxes available in alpine generating stations and suggest a value for the lower threshold for viability for more common valley dam hydropower.
d. Oceanic - Tidal
The Rance Tidal Power Station (de Laleu 2009, Hammons 1997) has a peak rating of 240 Megawatts, generated by its twenty four 10MW bulb turbines. With a capacity factor of approximately 26%, it supplies an average output of 62 Megawatts before distribution losses, giving an annual output of approximately 540 GWh. The barrage dam is 750 m long and the power station dam is 333 m long, enclosing a 22 sq km tidal basin.
The Rance estuary has an average low to high tide range of eight metres and a maximum perigean spring tide range of 13.5 metres following the predictable lunar cycles.
The twenty four, 10MW, 5.4m diameter bulb turbines, are connected to the 225kV French Transmission network. The bulb turbines were developed by Electricite de France for this unique application. These axial flow turbines are well suited for low vertical head stations such as tidal (and also riverine) hydropower allowing generation on both ebbs of the tide.
The tidal flow for flux consideration is for a 750 metre wide and 13.5 metre tide range dam and the annual average energy flow is 62 million watts giving an average energy flux through the barrage dam of 6,000 watts / sqm after capture losses. Few tidal stations have been built, often because of the high environmental impacts. This facility had a 20 year payback period although it produces electricity at a competitive marginal cost, it has high operating and maintenance costs, which set the margin for renewable tidal power.
e. Solar Energy – Thermal and PV
The initial solar flux normal to the earth projection plane is an average 1360 watts per square metre; however the average surface flux at a particular location is reduced by cloud, oscillating diurnal atmospheric absorption to give a typical impact average of 25% (Prowse 2011) of this initial solar flux, say 340 watts per square metre, a figure that can be enhanced by angling the receptor panel to an average angle of incidence typically 30 degrees from the horizontal facing true north.
Capture losses (Zeman 2006) for photovoltaic devices include reflected energy, non-effective areas, and parasitic losses as well as thermodynamic losses to give a typical conversion rate of between 20 and 25% of incident solar energy. Table 2 shows the comparable energy flux values for solar PV and thermal energy. Photovoltaic delivery losses which include conversion to 240 volts and AC transmission are typically 10-15%.

315
Table 2: Solar thermal and PV energy and their power flux balance
Parameter Thermal Solar Water Flux Electrical PV Flux
Incident solar flux 340 watts per sqm 340 watts per sqm
Capture efficiency 80% as absorbed heat 25%
Delivery efficiency 95% (as hot water) 85% (as 240 VAC)
Net Flux 250 watts per sqm 75 watts per sqm
The capture rate for thermal devices such as solar hot water heaters can be as high as 80% and since these are usually close coupled domestic devices, delivery losses are low.
f. Wind Energy – Horizontal Axis (HAWT)
Wind energy is the kinetic energy of air in motion. In general, for a wind farm site to be viable in a variable wind-time speed profile, an average wind speed of 6 m/s is required
Grogg (2005) shows that for horizontal axis wind turbines (HAWT) the theoretical energy flux (E) per unit area (A) and time (t), being the wind power incident on A (e.g. equal to the rotor area of a wind turbine), where ρ is the density of air (typically 1.2 kg per cubic metre); and v is the wind speed is:
P = E / (A* t) = 0.5 * ρ * v
3 (1)
Modern wind turbines range from about 40 to 80m in height, 50 to 85m in rotor span (5000 sqm sweep area), and 850 kW to 4.5MW with off-shore turbines enabling the larger machines due to cleaner airflow at lower altitudes. This shows that wind power in an open air stream is proportional to the third power of the wind speed; an eightfold increase in wing power when the wind speed doubles.
Determining the rate of energy capture is an optimisation (Talini 2011) that considers:
the statistical wind profile of a site being the time weighted average speeds
the swept rotor area of the turbine blades
the blade profile and strength design
the compromise (cost vs efficiency) number of blades, typically three
This simplified approach gives the range for energy flux for the swept area of a HAWT as shown in Table 3. The third power law sees an arithmetic average 6 m/s wind speed produce a geometric average 250 watt per sqm.
Table 3: Wind speed, energy and power flux
Wind Speed Metre/sec
Energy Flux Watts/sqm
Power Flux (80 m span)
4 m/s 38 0.20 MW
6 m/s 130 0.65 MW
10 m/s 600 3.0 MW
Grogg reports that the optimisation process of flux and energy capture places a maximum limit (known at Betz’s Limit) that no HAWT can extract more than 59% of the raw kinetic power in the wind and so this becomes the typical design energy capture limit through the design of blade pitch and profile configuration.
Table 4: Summary of flux thresholds based on marginal examples chosen
Energy Form Energy Input (watts / sqm)
Capture Flux Efficiency (%)
Distribution Losses (%)
Output Flux (watts / sqm)
Bioenergy (Solar-EtOH) 340 0.07% 15% 0.2
Geothermal (Hot Rocks) 10 25% 20% 2
Geothermal (Aquifer) 130 25% 10% 30
Hydropower (Valley Dam) 600 90% 5% 510
Hydropower (Alpine) 25,000 90% 10% 20,000
Oceanic – Tidal Estuary) 7,500 80% 10% 5,400
Solar – Thermal 340 80% 5% 250
Solar – PV 340 25% 15% 75
Wind - HAWT 250 50% 20% 100

316
6. Renewable Flux Summary
The renewable energy fluxes for the six forms of renewable energy taken from marginal generation facilities are therefore as shown in Table 4. This uses a mixture of input data based on first principles and applied examples based on what are understood to be marginally successful applications, therefore meeting the definition of threshold flux levels above.
7. Conclusion
The energy flux estimates from the common forms of renewable energy as calculated using established engineering knowledge, and provides an astonishingly wide range of values. Further the huge range of this data demonstrates that the continuing tendency of lobbyists and political idealists to equate the standard six forms of renewable energy in the same context is as flawed as it is misinformed.
When the economic parameters of capital and operating costs - which range from extremely
high capital costs of hydropower to the low operating costs of Solar PV power - are included in the analysis the data becomes real to the research policy and decision maker.
Nevertheless this analysis demonstrates that there already exists enough knowledge and engineering skill for initial analyses and decisions on the viability of various renewable energy forms, without resorting to expensive concept projects that have not produced an encouraging viability statement.
The already weak indications of very low energy flux rates of bioenergy and hot rock geothermal flows indicate that these are almost certainly poor prospects for mass substitution of fossil fuels. Further these renewable energy forms are known to also have very high specific (per GWHr) capital and operating costs with very poor energy production and capture efficiencies.
This analysis strongly suggests that in a tight global economic environment, the funding and research investments may be best directed after quality engineering analysis using known methodologies and this new analysis tool.
8. References Anderson, L. Tillman, D. (Editors) (1977) Fuels from Waste, Energy, Science and Engineering Series Academic Press New York ISBN 0-12-056450-5
Diesendorf, W. (1961) The Snowy Mountains Scheme: Phase 1 – the Upper Tumut Projects, Horowitz Publications, Sydney, pp1-162
Finger, J. Blankenship, D (2010) Handbook of Best Practices for Geothermal Drilling, Sandia National Laboratories Albuquerque, New Mexico, December 2010 Ref: SAND2010-6048 pp1-84
Ergon Energy (2006) Birdsville Organic Rankine Cycle Geothermal Power Station Brochure
Flynn, G (2004) Wind Farm Siting Issues in Australia, Sustainable Energy Australia, 2004
Geoscience Australia and ABARES (2010) Australian Energy Resource Assessment, Canberra, Australia. ISBN 978-1-921672-59-0
Grogg, K. (2005) Harvesting the Wind: The Physics of Wind Turbines, Carleton College Physics and Astronomy Papers. Retrieved June 2013
Hammons, T. J. (1997) Tidal Power, Proceedings of the IEEE. Vol X . No 7. March 1997
Hauser, R.J. (2007) Corn-Based Ethanol in Illinois and the U.S. A Report from the Department of Agricultural and Consumer Economics, University of Illinois, Urbana-Champaign November 2007, pp1-177
Tullock, G. (1998) The Fundamentals of Rent-Seeking, The Locke Luminary Vol. I, No. 2 (Winter 1998) Part 2 editors Owens, A.J, Rowley, C.K.
Laleu, V. de (2009) La Rance Tidal Power Plant, 40-year operation feedback – lessons learnt, BHA Annual Conference, Liverpool, October 2009
Lee, S. Bacon L (2000), Operational History of the Ohaaki geothermal field New Zealand, Proceedings World Geothermal Congress 2000, Kyushu - Tohoku, Japan,
Newell, B., D. M. Marsh, D. Sharma. (2011) Enhancing the resilience of the Australian National Electricity Market: taking a systems approach in Policy Development. Ecology and Society 16(2): 15. [online] URL: http://www.ecologyandsociety.org/vol16/iss2/art15/

317
Pollack, H.N. Hurter S. J. Johnson J. R . (1993) Heat flow from the Earth's interior: Analysis of the global data set, Reviews of Geophysics, 31, 3 / August 1993, p. 273 doi:10.1029/93RG01249
Prakash, Om (2005). Cultural History of India. New Age International (P) Ltd, Daryaganj, New Delhi. p. 479. ISBN 978-8-122415-87-2
Prowse, R. (2011) How much energy do you get from a roof top solar system? SEE-Change Newsletter, Canberra, May/June 2011
Snowy Hydro (2003), Engineering Features of the Snowy Mountains Scheme, Snowy Hydro Ltd, Cooma, 4
th Edition 2003 pp1-160, ISBN
0-642-99767-5
Sanders, R. (2003). Radioactive potassium may be major heat source in Earth's core. UC Berkeley News 10 October 2003).
Talinli, I. Topuz, E. Aydin, E, Kabakc, S.B. (2011). A Holistic Approach for Wind Farm Site Selection by Using FAHP, Chapter 10, Wind Farm - Technical Regulations, Potential Estimation and Siting Assessment, Dr. Gastón Orlando Suvire (Ed.), InTech Europe, Rijeka, Croatia ISBN: 978-953-307-483-2
Trager J. (1995) The Food Chronology: a food lover's compendium of events and anecdotes, from prehistory to the present. Henry Holt and Company Inc, New York, NY 1995
Turcotte, DL; Schubert, G (2002). "4". Geodynamics (2 ed.). Cambridge, England, UK: Cambridge University Press. pp. 136–7. ISBN 978-0-521-66624-4.
Zeman, M. (2010) Solar Cell Conversion Efficiency Limits, Solar Cells, Delft University of Technology, Chapter 5 pp 5.1-5.12

318
Copyright © 2022 FDOKUMEN