A Specific Pharmacophore Model of Aurora B Kinase Inhibitors and Virtual Screening Studies Based on...
12
A Specific Pharmacophore Model of Aurora B Kinase Inhibitors and Virtual Screening Studies Based on it Hui-Yuan Wang 1,2 , Lin-Li Li 2 , Zhi-Xing Cao 1 , Shi-Dong Luo 1 , Yu-Quan Wei 1 and Sheng-Yong Yang 1, * 1 State Key Laboratory of Biotherapy and Cancer Center, West China Hospital, West China Medical School, Sichuan University, Sichuan 610041, China 2 West China School of pharmacy, Sichuan University, Sichuan 610041, China *Corresponding author: Sheng-Yong Yang, [email protected] In this study, 3D-pharmacophore models of Aurora B kinase inhibitors have been developed by using HipHop and HypoGen modules in Catalyst soft- ware package. The best pharmacophore model, Hypo1, which has the highest correlation coeffi- cient (0.9911), consists of one hydrogen-bond acceptor, one hydrogen-bond donor, one hydrophobic aliphatic moiety and one ring aromatic feature. Hypo1 was validated by test set and cross-validation methods. And the specificity of Hypo1 to Aurora B inhibitors was examined with the use of selective inhibitors against Aurora B and its paralogue Aurora A. The results clearly indicate that Hypo1 can differentiate selective inhibitors of Aurora B from those of Aurora A, and the ring aromatic feature likely plays some impor- tant roles for the specificity of Hypo1. Then Hypo1 was used as a 3D query to screen several data- bases including Specs, NCI, Maybridge and Chi- nese Nature Product Database (CNPD) for identifying new inhibitors of Aurora B. The hit compounds were subsequently subjected to filter- ing by Lipinski’s rule of five and docking studies to refine the retrieved hits, and some compounds selected from the top ranked hits have been suggested for further experimental assay studies. Key words: Aurora B, drug design, kinase inhibitor, pharmacophore modeling, virtual screening Received 22 July 2008, revised and accepted for publication 13 Novem- ber 2008 In the past decade, the Aurora family of serine ⁄ threonine kinases has attracted intense attention because of its critical roles played in the regulation of cell mitosis (1–5). Humans express three Aurora kinases, namely, Aurora A, B, and C (6). At least two of them (Aur- ora A and B) have been found to be frequently over-expressed in human tumors, including breast, lung, colon, ovarian, prostate, col- orectal, and pancreatic cancers (the function of Aurora C is not yet clear) (6–15). Many in vitro and in vivo experimental data show the association existing between Aurora A ⁄ B over-expression and can- cer, thus Aurora A and B have been thought to be attractive drug targets for cancer therapy (16–20). For a long time, much more attention has been paid to the discovery of Aurora A inhibitors due to, for examples, the gene amplification of Aurora A and the obser- vation that it can transform cells when over-expressed. Until recently, several studies have shown that inhibition of Aurora B might be more advantageous in terms of providing therapeutic ben- efit in oncology (16,17,19,21–27). Typically, for example, inhibitors that target both Aurora A and B induce a failure in cell division and endoreduplication rather than a G2-M arrest, which are typical phenotypes of the ablation of Aurora B function (21). As a result, the research interest in recent years has been shifted to the discov- ery of Aurora B kinase inhibitors. Currently, at least 10 pharmaceutical companies have been involved in the development of Aurora B inhibitors. Although, up to now, the inhibitors targeting Aurora B are not as many as those targeting Aurora A, still there have been considerable amount of compounds reported to be inhibitors of Aurora B. And at least one compound (AZD1152) (28), which selectively targets against Aurora B, has entered clinical trials. On the other hand, a pre-survey to the chemi- cal structure and bioactivity of these complexes shows that the lim- ited number of inhibitors of Aurora B still bear sufficient diversity of chemical structure and bioactivity. These provide a good basis to elucidate the structure–activity relationship of these diverse com- pounds and further benefit to identify novel Aurora B inhibitors. In terms of the residue sequence and 3D-structure of catalytic domain, Aurora B is too similar to its paralogue Aurora A (17,29); this increases the difficulty to find a selective Aurora B inhibitors. Taking full advantage of the information of known Aurora B inhibi- tors, particularly the selective Aurora B inhibitors, may benefit the discovery of selective Aurora B inhibitors. Thus, in this study, we shall develop specific pharmacophore models of Aurora B inhibitors based on common chemical features of Aurora B inhibitors reported so far by using the HipHop (30) and HypoGen (31) algorithms imple- mented in Catalyst software (Accelrys, San Diego, CA, USA). Then the best model will be used as a 3D search query for several che- mical databases, including Specs, NCI, Maybridge, and Chinese 115 Chem Biol Drug Des 2009; 73: 115–126 Research Article ª 2009 The Authors Journal compilation ª 2009 Blackwell Munksgaard doi: 10.1111/j.1747-0285.2008.00751.x
Transcript of A Specific Pharmacophore Model of Aurora B Kinase Inhibitors and Virtual Screening Studies Based on...

A Specific Pharmacophore Model of Aurora BKinase Inhibitors and Virtual Screening StudiesBased on it
Hui-Yuan Wang1,2, Lin-Li Li2, Zhi-XingCao1, Shi-Dong Luo1, Yu-Quan Wei1 andSheng-Yong Yang1,*
1State Key Laboratory of Biotherapy and Cancer Center, West ChinaHospital, West China Medical School, Sichuan University, Sichuan610041, China2West China School of pharmacy, Sichuan University, Sichuan610041, China*Corresponding author: Sheng-Yong Yang, [email protected]
In this study, 3D-pharmacophore models of AuroraB kinase inhibitors have been developed by usingHipHop and HypoGen modules in Catalyst soft-ware package. The best pharmacophore model,Hypo1, which has the highest correlation coeffi-cient (0.9911), consists of one hydrogen-bondacceptor, one hydrogen-bond donor, onehydrophobic aliphatic moiety and one ringaromatic feature. Hypo1 was validated by test setand cross-validation methods. And the specificityof Hypo1 to Aurora B inhibitors was examinedwith the use of selective inhibitors against AuroraB and its paralogue Aurora A. The results clearlyindicate that Hypo1 can differentiate selectiveinhibitors of Aurora B from those of Aurora A, andthe ring aromatic feature likely plays some impor-tant roles for the specificity of Hypo1. Then Hypo1was used as a 3D query to screen several data-bases including Specs, NCI, Maybridge and Chi-nese Nature Product Database (CNPD) foridentifying new inhibitors of Aurora B. The hitcompounds were subsequently subjected to filter-ing by Lipinski’s rule of five and docking studiesto refine the retrieved hits, and some compoundsselected from the top ranked hits have beensuggested for further experimental assay studies.
Key words: Aurora B, drug design, kinase inhibitor, pharmacophoremodeling, virtual screening
Received 22 July 2008, revised and accepted for publication 13 Novem-ber 2008
In the past decade, the Aurora family of serine ⁄ threonine kinaseshas attracted intense attention because of its critical roles playedin the regulation of cell mitosis (1–5). Humans express three Aurora
kinases, namely, Aurora A, B, and C (6). At least two of them (Aur-ora A and B) have been found to be frequently over-expressed inhuman tumors, including breast, lung, colon, ovarian, prostate, col-orectal, and pancreatic cancers (the function of Aurora C is not yetclear) (6–15). Many in vitro and in vivo experimental data show theassociation existing between Aurora A ⁄ B over-expression and can-cer, thus Aurora A and B have been thought to be attractive drugtargets for cancer therapy (16–20). For a long time, much moreattention has been paid to the discovery of Aurora A inhibitors dueto, for examples, the gene amplification of Aurora A and the obser-vation that it can transform cells when over-expressed. Untilrecently, several studies have shown that inhibition of Aurora Bmight be more advantageous in terms of providing therapeutic ben-efit in oncology (16,17,19,21–27). Typically, for example, inhibitorsthat target both Aurora A and B induce a failure in cell divisionand endoreduplication rather than a G2-M arrest, which are typicalphenotypes of the ablation of Aurora B function (21). As a result,the research interest in recent years has been shifted to the discov-ery of Aurora B kinase inhibitors.
Currently, at least 10 pharmaceutical companies have been involvedin the development of Aurora B inhibitors. Although, up to now, theinhibitors targeting Aurora B are not as many as those targetingAurora A, still there have been considerable amount of compoundsreported to be inhibitors of Aurora B. And at least one compound(AZD1152) (28), which selectively targets against Aurora B, hasentered clinical trials. On the other hand, a pre-survey to the chemi-cal structure and bioactivity of these complexes shows that the lim-ited number of inhibitors of Aurora B still bear sufficient diversityof chemical structure and bioactivity. These provide a good basis toelucidate the structure–activity relationship of these diverse com-pounds and further benefit to identify novel Aurora B inhibitors.
In terms of the residue sequence and 3D-structure of catalyticdomain, Aurora B is too similar to its paralogue Aurora A (17,29);this increases the difficulty to find a selective Aurora B inhibitors.Taking full advantage of the information of known Aurora B inhibi-tors, particularly the selective Aurora B inhibitors, may benefit thediscovery of selective Aurora B inhibitors. Thus, in this study, weshall develop specific pharmacophore models of Aurora B inhibitorsbased on common chemical features of Aurora B inhibitors reportedso far by using the HipHop (30) and HypoGen (31) algorithms imple-mented in Catalyst software (Accelrys, San Diego, CA, USA). Thenthe best model will be used as a 3D search query for several che-mical databases, including Specs, NCI, Maybridge, and Chinese
115
Chem Biol Drug Des 2009; 73: 115–126
Research Article
ª 2009 The AuthorsJournal compilation ª 2009 Blackwell Munksgaard
doi: 10.1111/j.1747-0285.2008.00751.x
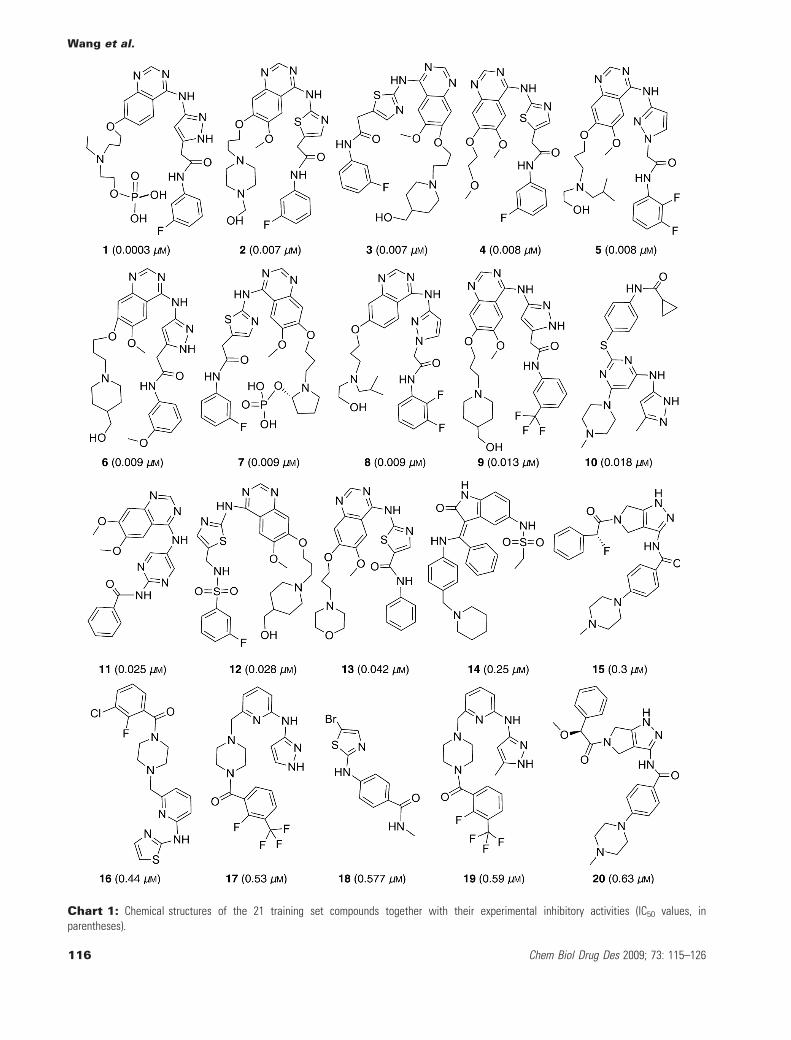
Chart 1: Chemical structures of the 21 training set compounds together with their experimental inhibitory activities (IC50 values, inparentheses).
Wang et al.
116 Chem Biol Drug Des 2009; 73: 115–126

Chart 2: Chemical structures of the 21 test set molecules together with their experimental inhibitory activities (IC50 values, in parentheses).
A Specific Pharmacophore Model of Aurora B Kinase Inhibitors
Chem Biol Drug Des 2009; 73: 115–126 117

Nature Product Database (CNPD). The hit compounds will be subse-quently subjected to filtering by Lipinski's rule of five (32) and dock-ing study to refine the retrieved hits and as a result to reduce therate of false positive. Finally potential lead compounds will beshifted to in vitro and in vivo, as well as structural modification stu-dies. As far as we know, this is the first report on the specific 3Dpharmacophore modeling of Aurora B kinase inhibitors for rationaldrug design.
Materials and Methods
Pharmacophore modelingAll the parmacophore modeling calculations were carried out byusing CATALYST 4.11 software package (Accelrys). The commonpharmacophore features necessary for potent Aurora B inhibitorswere identified by HipHop program and quantitative pharmaco-phore models were created by HypoGen module within CATA-LYST.
As far as we can collect, there are about 88 human Aurora Bkinase inhibitors which quantitative bioactivity data are publiclyavailable (17–19,29,33–38). After ignoring the inhibitors with verysimilar structure and similar activity, 42 inhibitors were chosen forthe pharmacophore modeling. For the specific quantitative pharma-cophore models by HypoGen, 20 inhibitors who have relativelyhigher inhibitory potency to Aurora B kinase (IC50 < 1 lM) wereselected to form the training set; these compounds have satisfac-tory diversity in both structural features and activity ranges. Thebiological activity values of the selected 20 inhibitors span a rangeof four orders of magnitude (IC50 values ranging from 0.0003 to0.63 lM). Chemical structures as well as experimental IC50 valuesof training set molecules are given in Chart 1-1–20. The remaining22 compounds form the test set, which are shown in Chart 2-21–
42. The eight most active compounds (compounds 1–8) in trainingset were selected for the identification of common chemical fea-tures by HipHop.
All molecules were built in Catalyst 2D ⁄ 3D visualizer in Catalystsoftware package and all of the structures were minimized usingthe Charmm-like force field implemented in the program (39). A ser-ies of energetically reasonable conformational models which repre-sent the flexibility of each compound were generated within theCatalyst catConf module using the Poling Algorithm (39–42). Wechoose a maximum number of 250 conformers, the 'best conforma-tional analysis' method (40–42), and an energy threshold of15 kcal ⁄ mol above the global energy minimum for conformationsearching.
In the HipHop run, compound 1 was considered as 'reference com-pound' specifying a 'principal' value of 2 and a 'MaxOmitFeat' valueof 0, meaning their structures and conformations would have thestrongest influence in the model building phase. The 'principal' and'MaxOmitFeat' values were set to 1 for the remaining compoundsof the training set. The initial features, which were specified basedon an overview of all the training set molecules, include hydrogen-bond acceptor (A), hydrogen-bond donor (D), hydrophobic aliphaticmoiety (L), and ring aromatic feature (R).
In the HypoGen run, the initial pharmacophore features were speci-fied based on the common pharmocophore features identified inthe HipHop run. The quality of the HypoGen models were evaluatedaccording to Debnath (43) in terms of cost functions and other sta-tistical parameters which were calculated by HypoGen module dur-ing hypothesis generation. A good pharmacophore model shouldhave a high correlation coefficient, lowest total cost and RMSDvalues, and the total cost should be close to the fixed cost andaway from the null cost. The best pharmacophore hypothesis wasfurther validated by test set method and Fischer's randomizationtest (44).
Virtual screeningThe best HypoGen pharmacophore hypothesis was used as a 3Dstructural query for retrieving potent molecules from chemical data-bases including Specs, NCI, MayBridge and CNPD. For each mole-cule in the databases, 100 conformers were generated with thefast conformer generation method, allowing a maximum energy of15 kcal ⁄ mol above that of the most stable conformation. All querieswere performed using the Fast Flexible Search Databases ⁄ Spread-sheets method within the Catalyst DBServer module. Only thosecompounds that fit all the features of the pharmocophore model inthe Catalyst queries were retrieved as a hit.
Docking studiesTo reduce the rate of false-positive, structure-based docking studieswere carried out by using LigandFit within Cerius2 program package(Accelrys). The receptor structure was taken from the crystal structureof Aurora B combined with compound 14 (PDB entry: 2bfy) (45,46).Solvent molecules in the crystal structure were removed. Hydrogenatoms were added in a normal scheme by Cerius2. The binding siteof the bound ligand was identified as the active site. The site defini-tion as well as the used docking parameters was firstly validatedthrough docking the bound ligand back into the protein. The bestdocked pose should differ only minimally from the position of the
Figure 1: The best HipHop pharmacophore model mapping withthe most active compound 1. The features are color coded withgreen, hydrogen-bond acceptor; magenta, hydrogen-bond donor;light blue, hydrophobic aliphatic moiety; orange, ring aromaticfeature.
Wang et al.
118 Chem Biol Drug Des 2009; 73: 115–126

ligand in the crystal structure (for example, root mean square devia-tion is <0.5 �). Partial charges of all chemical compounds were auto-matically assigned by the Gasteiger scheme implemented in Cerius2program. All molecules were flexibly docked employing the CFF forcefield (which is an all hydrogen force field) for energy minimization.Conformations of each compound were created with Monte Carlosimulation (5000 trials). The grid resolution was set to 0.5 �. Otherparameters were kept at their default values.
Results and Discussion
Pharmacophore modelBefore performing the quantitative pharmacophore modeling, thequalitative HipHop model was generated based on the eight mostactive compounds in the training set (1–8). Figure 1 presents themapping of the best HipHop pharmacophore model onto the mostactive compound 1 in the training set. The best hypothesis containssix features: three hydrogen-bond acceptors (A), one hydrogen-bonddonor (D), one hydrophobic aliphatic moiety (L), and one ring aro-matic feature (R).
The HipHop pharmacophore model is a qualitative model which isnot suitable for virtual screening purpose. But it provides important
Table 1: Statistical parameters of the top 10 pharmacophoremodels generated by the HypoGen
Hypo no. Total costa Cost diffb RMSD Correlation (r) Featuresc
1 73.5097 131.5123 0.5199 0.9911 ADLR2 77.4001 127.6219 0.8113 0.9782 ADLR3 78.2158 126.8062 0.8403 0.9766 ADLR4 81.8615 123.1605 0.9531 0.9702 ADR5 82.3621 122.6599 0.9676 0.9693 ADR6 82.4296 122.5924 1.0784 0.9611 ADLR7 83.6884 121.3336 1.0548 0.9632 ADR8 83.7755 121.2465 1.1385 0.9565 ADLR9 84.8748 120.1472 1.1832 0.9529 ADLR
10 84.9034 120.1186 1.1803 0.9532 ADLR
aThe total cost value of a hypothesis is calculated by summing three costfactors, a weight cost (data not shown), an error cost (data not shown), anda configuration cost (a constant among all the hypotheses).bThe difference between the total cost of a hypothesis and that of the nullhypothesis, roughly correlates with significance. The larger the difference,the greater the significance of the hypothesis. A true correlation in the datawill very likely be estimated by models that exhibit a cost difference (Nullcost)Total cost). (Fixed cost = 70.80, configuration cost = 16.96, nullcost = 205.022). All cost values are in bits.cA = hydrogen-bond acceptor, D = hydrogen-bond donor, L = hydrophobicaliphatic moiety, R = ring aromatic feature.
Figure 2: The best HypoGen pharmacophore model for Aurora B inhibitors. (A) The best pharmacophore model Hypo1. (B) 3D spatial rela-tionship and the distance constraints of the Hypo1. (C) Hypo1 mapping with the most active compound 1. (D) Hypo1 mapping with the leastactive compound 20. The features are color coded with green, hydrogen-bond acceptor; magenta, hydrogen-bond donor; light blue, hydropho-bic aliphatic moiety; orange, ring aromatic feature.
A Specific Pharmacophore Model of Aurora B Kinase Inhibitors
Chem Biol Drug Des 2009; 73: 115–126 119

information which is helpful for the HypoGen run. The HipHop phar-macophore model clearly indicates that the chemical featuresincluding hydrogen-bond acceptor, hydrogen-bond donor, hydrophobicfeature, and ring aromatic feature are necessary for potent AuroraB inhibitors. According to this information, the four types of chemi-cal features were specified as the initial pharmacophore features inthe HypoGen run. The quantitative models were generated with the20 compounds in the training set (compounds 1–20, Chart 1). Thetop 10 hypotheses generated by HypoGen together with the resultsof statistical analysis are presented in Table 1. The top rankedpharmacophore model (Hypo1, Figure 2A), which was characterizedby the lowest total cost value (73.5097), the highest cost difference(131.5123), the lowest RMSD (0.5199), and the best correlationcoefficient (0.9911), was chosen for further analysis. The fixed costand null cost are 70.80 and 205.022 bits, respectively. The Hypo1who has the best predictive power and statistical significance con-tains four features, including one hydrogen-bond acceptor, onehydrogen-bond donor, one hydrophobic aliphatic moiety, and onering aromatic feature. The 3D space and distance constraints ofthese pharmacophore features are shown in Figure 2B. Figure 2C, Dpresent the Hypo1 aligned with the most active compound 1 (IC50:0.0003 lM) and the least active compound 20 (IC50: 0.63 lM) inthe training set. Clearly, all hypothesis features are mapped verywell with the corresponding chemical functional groups on com-pound 1, while two hypothesis features, i.e., hydrogen-bond donorand ring aromatic feature, are not mapped very well or completely
Table 3: Experimental and predicted IC50 values of the test setcompounds
MoleculeExptlIC50 (lM)
EstimatedIC50 (lM) Errora
Exptlscaleb
Estimatedscale
21 0.005 0.016 3.2 +++ ++22 0.0075 0.02 2.7 +++ ++23 0.008 0.0036 )2.2 +++ +++24 0.012 0.019 1.6 ++ ++25 0.014 0.017 1.2 ++ ++26 0.015 0.014 )1.1 ++ ++27 0.018 0.013 )1.4 ++ ++28 0.03 0.013 )2.3 ++ ++29 0.039 0.016 )2.5 ++ ++30 0.048 0.023 )2.1 ++ ++31 0.048 0.049 1 ++ ++32 0.049 0.099 2 ++ ++33 0.057 0.05 )1.1 ++ ++34 0.063 0.12 1.9 ++ +35 0.115 0.21 1.8 + +36 0.135 0.16 1.2 + +37 0.172 0.15 )1.1 + +38 0.2 0.53 2.7 + +39 0.437 0.53 1.2 + +40 0.77 0.53 )1.5 + +41 1.21 0.61 )2 + +42 1.3 0.53 )2.5 + +
a+ means that the estimated IC50 is higher than the experimental IC50;) means that the estimated IC50 is lower than the experimental IC50; a valueof 1 indicates that the estimated IC50 is equal to the experimental IC50.bActivity scale: +++, IC50 £ 0.01 lM (highly active); ++, 0.01 lM < IC50 £0.1 lM (moderately active); +, IC50 > 0.1 lM (low active).
Table 2: Experimental and predicted IC50 values of the trainingset compounds
MoleculeExptlIC50 (lM)
EstimatedIC50 (lM) Errora
Fitvalueb
Exptlscalec
Estimatedscale
1 0.0003 0.00035 +1.2 7.09 +++ +++2 0.007 0.0083 +1.2 5.72 +++ +++3 0.007 0.0097 +1.4 5.65 +++ +++4 0.008 0.009 +1.1 5.68 +++ +++5 0.008 0.0093 +1.2 5.67 +++ +++6 0.009 0.0086 )1.1 5.71 +++ +++7 0.009 0.0081 )1.1 5.73 +++ +++8 0.009 0.014 +1.6 5.48 +++ ++9 0.013 0.013 )1 5.53 ++ ++
10 0.018 0.013 )1.4 5.54 ++ ++11 0.025 0.019 )1.3 5.37 ++ ++12 0.028 0.016 )1.7 5.42 ++ ++13 0.042 0.027 )1.5 5.21 ++ ++14 0.25 0.3 +1.2 4.16 + +15 0.3 0.51 +1.7 3.93 + +16 0.44 0.51 +1.2 3.93 + +17 0.53 0.51 )1 3.93 + +18 0.58 0.53 )1.1 3.91 + +19 0.59 0.51 )1.2 3.93 + +20 0.63 0.52 )1.2 3.92 + +
a+ means that the estimated IC50 is higher than the experimental IC50;) means that the estimated IC50 is lower than the experimental IC50; a valueof 1 indicates that the estimated IC50 is equal to the experimental IC50.bFit value indicates how well the features in the pharmacophore map thechemical features in the molecule.cActivity scale: +++, IC50 £ 0.01 lM (highly active); ++, 0.01 lM < IC50 £0.1 lM (moderately active); +, IC50 > 0.1 lM (low active).
Table 4: Results of Fischer's randomization test using CatScram-ble implemented in Catalyst software
Validationno. Total cost Fixed cost RMSD
Correlation(r)
Hypo1 73.5097 70.80 0.5199 0.9911Results for scrambled
Trial1 153.594 69.8206 2.8944 0.6708Trial2 156.908 63.9946 3.0371 0.6282Trial3 173.392 63.6171 3.2656 0.5483Trial4 170.779 69.8778 3.1703 0.5835Trial5 182.63 66.1838 3.4123 0.4853Trial6 153.41 71.5708 2.8285 0.6893Trial7 159.229 64.7401 3.0404 0.6274Trial8 184.613 63.9946 3.4489 0.4689Trial9 129.468 66.287 2.5084 0.7661Trial10 159.969 65.7461 3.0658 0.6189Trial11 178.152 66.1838 3.3354 0.5196Trial12 157.597 63.9946 3.0312 0.6303Trial13 160.665 66.287 3.0593 0.6211Trial14 149.625 60.1091 2.9904 0.6426Trial15 157.647 70.8369 2.9459 0.6559Trial16 163.771 60.1091 3.2043 0.5712Trial17 176.378 66.6524 3.2703 0.5465Trial18 139.431 70.8369 2.5876 0.7488Trial19 150.909 70.424 2.8358 0.6870
Wang et al.
120 Chem Biol Drug Des 2009; 73: 115–126

not mapped with any functional group on compound 20. Thesereflect the validity of the pharmacophore model Hypo1 to someextent.
Furthermore, we classified all the training set compounds into threecategories: highly active (IC50 £ 0.01 lM, +++), moderately active(0.01 lM < IC50 £ 0.1 lM, ++), and low active (IC50 > 0.1 lM, +).
Chart 3: Chemical structures of selective Aurora B inhibitors.
A Specific Pharmacophore Model of Aurora B Kinase Inhibitors
Chem Biol Drug Des 2009; 73: 115–126 121
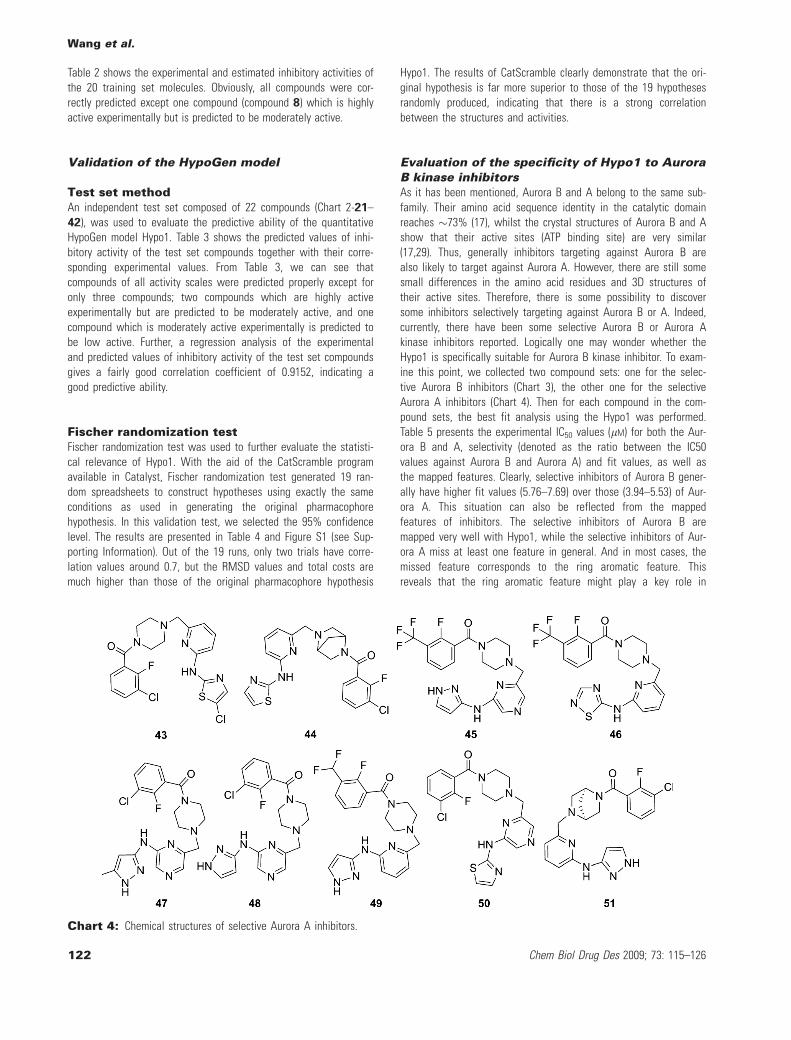
Table 2 shows the experimental and estimated inhibitory activities ofthe 20 training set molecules. Obviously, all compounds were cor-rectly predicted except one compound (compound 8) which is highlyactive experimentally but is predicted to be moderately active.
Validation of the HypoGen model
Test set methodAn independent test set composed of 22 compounds (Chart 2-21–42), was used to evaluate the predictive ability of the quantitativeHypoGen model Hypo1. Table 3 shows the predicted values of inhi-bitory activity of the test set compounds together with their corre-sponding experimental values. From Table 3, we can see thatcompounds of all activity scales were predicted properly except foronly three compounds; two compounds which are highly activeexperimentally but are predicted to be moderately active, and onecompound which is moderately active experimentally is predicted tobe low active. Further, a regression analysis of the experimentaland predicted values of inhibitory activity of the test set compoundsgives a fairly good correlation coefficient of 0.9152, indicating agood predictive ability.
Fischer randomization testFischer randomization test was used to further evaluate the statisti-cal relevance of Hypo1. With the aid of the CatScramble programavailable in Catalyst, Fischer randomization test generated 19 ran-dom spreadsheets to construct hypotheses using exactly the sameconditions as used in generating the original pharmacophorehypothesis. In this validation test, we selected the 95% confidencelevel. The results are presented in Table 4 and Figure S1 (see Sup-porting Information). Out of the 19 runs, only two trials have corre-lation values around 0.7, but the RMSD values and total costs aremuch higher than those of the original pharmacophore hypothesis
Hypo1. The results of CatScramble clearly demonstrate that the ori-ginal hypothesis is far more superior to those of the 19 hypothesesrandomly produced, indicating that there is a strong correlationbetween the structures and activities.
Evaluation of the specificity of Hypo1 to AuroraB kinase inhibitorsAs it has been mentioned, Aurora B and A belong to the same sub-family. Their amino acid sequence identity in the catalytic domainreaches �73% (17), whilst the crystal structures of Aurora B and Ashow that their active sites (ATP binding site) are very similar(17,29). Thus, generally inhibitors targeting against Aurora B arealso likely to target against Aurora A. However, there are still somesmall differences in the amino acid residues and 3D structures oftheir active sites. Therefore, there is some possibility to discoversome inhibitors selectively targeting against Aurora B or A. Indeed,currently, there have been some selective Aurora B or Aurora Akinase inhibitors reported. Logically one may wonder whether theHypo1 is specifically suitable for Aurora B kinase inhibitor. To exam-ine this point, we collected two compound sets: one for the selec-tive Aurora B inhibitors (Chart 3), the other one for the selectiveAurora A inhibitors (Chart 4). Then for each compound in the com-pound sets, the best fit analysis using the Hypo1 was performed.Table 5 presents the experimental IC50 values (lM) for both the Aur-ora B and A, selectivity (denoted as the ratio between the IC50values against Aurora B and Aurora A) and fit values, as well asthe mapped features. Clearly, selective inhibitors of Aurora B gener-ally have higher fit values (5.76–7.69) over those (3.94–5.53) of Aur-ora A. This situation can also be reflected from the mappedfeatures of inhibitors. The selective inhibitors of Aurora B aremapped very well with Hypo1, while the selective inhibitors of Aur-ora A miss at least one feature in general. And in most cases, themissed feature corresponds to the ring aromatic feature. Thisreveals that the ring aromatic feature might play a key role in
Chart 4: Chemical structures of selective Aurora A inhibitors.
Wang et al.
122 Chem Biol Drug Des 2009; 73: 115–126

differentiating selective inhibitors of Aurora B from those of AuroraA. Figure 3A and B shows the Hypo1 mapped with several selectiveinhibitors of Aurora B and Aurora A, respectively.
By the way, an alternative strategy to identify which features conferthe selectivity of Aurora B and A kinase inhibitors is to use thecrystal structural information of Aurora B and A since the crystalstructures of Aurora B and A have been known. However, the resi-due sequences (sequence identity �73%) and 3D structures of Aur-ora B and A are so similar that it is difficult to draw a correctconclusion about the selectivity. In contrast, the strategy of usingknown inhibitors to identify which features confer Aurora B selectiv-ity is a good choice as it does not need any receptor information.And also it is easy to be evaluated with other known inhibitors.
A comparison between the best pharmacophoremodel of Aurora B and Aurora A kinaseinhibitorsAs has already been mentioned, both the residue sequences and3D structures of Aurora B and A are very similar, and many com-pounds are dual inhibitors of Aurora B and A. One may be con-cerned about the similarity of pharmacophore models of Aurora Band A kinase inhibitors. In previous study, we have developed phar-macophore models of Aurora A kinase inhibitors (47). Thus, a com-parison between the best pharmacophore models of Aurora B andAurora A kinase inhibitors will be made here. Figure 4 presents thebest pharmacophore model of Aurora A kinase inhibitors (Hypo1-A).Comparing with Hypo1 for Aurora B (Figure 2A), they both containone hydrogen-bond acceptor and one hydrogen-bond donor. Buttheir spatial arrangement in Hypo1 and Hypo1-A is different. Inaddition, Hypo1-A contains another three chemical features: twohydrophobic features and one hydrophobic aromatic moiety, as wellas one excluded volume. And Hypo1 includes another two features:one hydrophobic aliphatic moiety and one ring aromatic feature.These indicate that the pharmacophore models derived from ligandsof Aurora A and B are different from each other, which is under-standable as it has been demonstrated that the pharmacophoremodels are strongly dependent on the training set compounds (48).
Virtual screeningThe validated Hypo1 was used as a 3D structural query for retrievingpotent compounds from chemical databases including Specs(135 556 molecules), NCI (238 819 molecules), MayBridge (59 652molecules) and CNPD (43 055 molecules). Only those compoundscompletely mapped onto the Hypo1 were selected. Number of thetotal hits is 1859, in which 346 hits (hit rate: 0.26%) are from theSpecs, 1299 hits (hit rate: 0.54%) from the NCI, 88 hits (hit rate:0.15%) from the Maybridge, and 126 from the CNPD (hit rate:0.29%). These hits were then screened by using the Lipinski's rule offive to make them more drug-like. A total of 202 molecules whichshow very good mapping with the Hypo1 passed this filtration.
Docking studiesTo further refine the retrieved hits, the 202 compounds were dockedinto the inhibitor binding site of Aurora B by using LigandFit withinCerius2 program package. The 3D structure of Aurora B was takenfrom the crystal structure of Aurora B combined with compound 14
(PDB entry: 2bfy). Several scoring functions are available withinLigandFit, including LigScore1, LigScore2 (49), PLP1, PLP2 (50), Jain(51), Ludi (52,53), and PMF (54), as well as a consensus score (55).However, a benchmark test to the scoring functions with the use ofthe known inhibitors indicated that the Ludi scoring functionshowed better performance than others. Thus, the hit compoundswere ranked based on the Ludi scoring function. Finally, more than20 compounds were selected from the top ranked hits, which havebeen suggested for further in vitro and in vivo, as well as structuralmodification studies. And 10 of them are shown in Table S1 (seeSupporting Information). The predicted binding affinity values(BestEst) by using the pharmacophore model Hypo1 (calculated byCatalyst) as well as the Ludi scoring function values (calculated byLigandFit) are also given in Table S1. From Table S1, we can see
Table 5: The experimental IC50 values (lM) for both the AuroraB and A, selectivity (denoted as the ratio between the IC50 valuesagainst Aurora B and Aurora A) and fit values, as well as themapped features
Compound no.
IC50(lM) SelectivityAurora B ⁄Aurora A
Fitvalue
Mappedfeatuer
Aurora A Aurora B A D L R
1 (AZD1152) 0.013 0.0003 1 ⁄ 43 7.69 + + + +6 1.9 0.009 1 ⁄ 211 5.8 + + + )
22 0.8 0.0075 1 ⁄ 107 5.83 + + + +25 1.4 0.014 1 ⁄ 100 6.28 + + + +27 1.6 0.018 1 ⁄ 89 6.47 + + + +52 0.45 0.002 1 ⁄ 225 7.67 + + + +53 0.22 <0.001 <1 ⁄ 220 5.79 + + ) +54 0.41 0.002 1 ⁄ 205 5.87 + ) + +55 0.23 0.001 1 ⁄ 230 5.88 + ) + +56 0.094 0.001 1 ⁄ 94 5.8 + + ) +57 0.28 <0.001 <1 ⁄ 280 6.26 + + + +58 0.11 0.001 1 ⁄ 110 6.73 + + + +59 0.69 0.001 1 ⁄ 690 5.76 + + ) +60 0.16 <0.001 <1 ⁄ 160 6.15 + + + +61 0.19 0.001 1 ⁄ 190 7.31 + + + +62 0.22 0.002 1 ⁄ 110 7.35 + + + +64 0.087 <0.001 <1 ⁄ 87 7.33 + + + +65 0.35 <0.001 <1 ⁄ 350 7.12 + + + +66 0.95 <0.001 <1 ⁄ 950 6.61 + + + +67 1.4 <0.001 <1 ⁄ 1400 6.71 + + + +68 0.98 <0.001 <1 ⁄ 980 7.68 + + + +69 1.4 <0.001 <1 ⁄ 1400 6.57 + + + +16 0.00067 0.44 657 3.94 ) ) + +17 0.0009 0.53 589 3.94 ) + + )19 0.00097 0.59 608 3.94 + ) + )37 (MLN8054) 0.004 0.172 43 4.79 + + ) +38 0.0005 0.2 400 3.99 + + + )40 0.0011 0.77 700 4.29 + + + )42 0.0018 1.3 722 4.02 + + + )43 0.00044 0.089 202 3.94 ) ) + +44 0.00049 0.092 188 3.94 + ) + )45 0.00089 1.1 1236 5.3 + + + )46 0.00099 1.9 1919 5.53 + + + )47 0.0021 2.9 1381 5.29 + + + )48 0.0022 5.4 2455 5.34 + + + )49 0.0029 1.5 517 4.22 + + + )50 0.0048 9.9 2063 5.24 + + + )51 0.0061 1.4 230 3.99 + + + )
A Specific Pharmacophore Model of Aurora B Kinase Inhibitors
Chem Biol Drug Des 2009; 73: 115–126 123
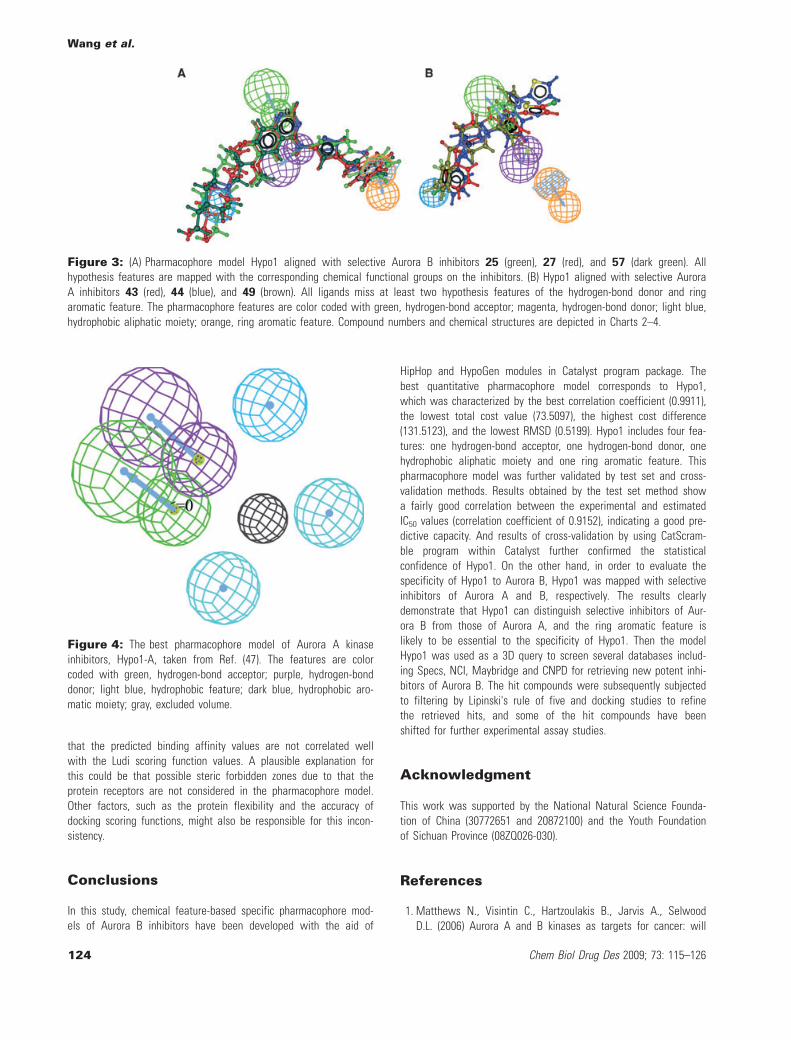
that the predicted binding affinity values are not correlated wellwith the Ludi scoring function values. A plausible explanation forthis could be that possible steric forbidden zones due to that theprotein receptors are not considered in the pharmacophore model.Other factors, such as the protein flexibility and the accuracy ofdocking scoring functions, might also be responsible for this incon-sistency.
Conclusions
In this study, chemical feature-based specific pharmacophore mod-els of Aurora B inhibitors have been developed with the aid of
HipHop and HypoGen modules in Catalyst program package. Thebest quantitative pharmacophore model corresponds to Hypo1,which was characterized by the best correlation coefficient (0.9911),the lowest total cost value (73.5097), the highest cost difference(131.5123), and the lowest RMSD (0.5199). Hypo1 includes four fea-tures: one hydrogen-bond acceptor, one hydrogen-bond donor, onehydrophobic aliphatic moiety and one ring aromatic feature. Thispharmacophore model was further validated by test set and cross-validation methods. Results obtained by the test set method showa fairly good correlation between the experimental and estimatedIC50 values (correlation coefficient of 0.9152), indicating a good pre-dictive capacity. And results of cross-validation by using CatScram-ble program within Catalyst further confirmed the statisticalconfidence of Hypo1. On the other hand, in order to evaluate thespecificity of Hypo1 to Aurora B, Hypo1 was mapped with selectiveinhibitors of Aurora A and B, respectively. The results clearlydemonstrate that Hypo1 can distinguish selective inhibitors of Aur-ora B from those of Aurora A, and the ring aromatic feature islikely to be essential to the specificity of Hypo1. Then the modelHypo1 was used as a 3D query to screen several databases includ-ing Specs, NCI, Maybridge and CNPD for retrieving new potent inhi-bitors of Aurora B. The hit compounds were subsequently subjectedto filtering by Lipinski's rule of five and docking studies to refinethe retrieved hits, and some of the hit compounds have beenshifted for further experimental assay studies.
Acknowledgment
This work was supported by the National Natural Science Founda-tion of China (30772651 and 20872100) and the Youth Foundationof Sichuan Province (08ZQ026-030).
References
1. Matthews N., Visintin C., Hartzoulakis B., Jarvis A., SelwoodD.L. (2006) Aurora A and B kinases as targets for cancer: will
Figure 3: (A) Pharmacophore model Hypo1 aligned with selective Aurora B inhibitors 25 (green), 27 (red), and 57 (dark green). Allhypothesis features are mapped with the corresponding chemical functional groups on the inhibitors. (B) Hypo1 aligned with selective AuroraA inhibitors 43 (red), 44 (blue), and 49 (brown). All ligands miss at least two hypothesis features of the hydrogen-bond donor and ringaromatic feature. The pharmacophore features are color coded with green, hydrogen-bond acceptor; magenta, hydrogen-bond donor; light blue,hydrophobic aliphatic moiety; orange, ring aromatic feature. Compound numbers and chemical structures are depicted in Charts 2–4.
Figure 4: The best pharmacophore model of Aurora A kinaseinhibitors, Hypo1-A, taken from Ref. (47). The features are colorcoded with green, hydrogen-bond acceptor; purple, hydrogen-bonddonor; light blue, hydrophobic feature; dark blue, hydrophobic aro-matic moiety; gray, excluded volume.
Wang et al.
124 Chem Biol Drug Des 2009; 73: 115–126

they be selective for tumors? Expert Rev Anticancer Ther;6:109–120.
2. Marumoto T., Zhang D., Saya H. (2005) Aurora-Asa guardian ofpoles. Nat ReV Cancer;5:42–50.
3. Andrews P.D., Knato E., Moore W.J., Swedlow J.R. (2003) Mito-tic mechanics: the Auroras come into view. Curr Opin CellBiol;15:672–683.
4. Giet R., Prigent C. (2001) The non-catalytic domain of the Xeno-pus laevis Aurora A kinase localises the protein to the centro-some. J Cell Sci;114:2095–2104.
5. Carmena M., Earnshaw W.C. (2003) The cellular geography ofAurora kinases. Nat Rev Mol Cell Biol;4:842–854.
6. Bischoff J.R., Plowman G.D. (1999) The Aurora ⁄ Ipl1p kinasefamily: regulators of chromosome segregation and cytokinesis.Trends Cell Biol;9:454–459.
7. Warner S.L., Bearss D.J., Han H., Von Hoff D.D. (2003) TargetingAurora-2 kinase in cancer. Mol Cancer Ther;2:589–595.
8. Goepfert T.M., Brinkley B.R. (2000) The centrosome-associatedAurora ⁄ Ipl-like kinase family. Curr Top Dev Biol;49:331–342.
9. Sakakura C., Hagiwara A., Yasuoka R., Fujita Y., Nakanishi M.,Masuda K., Shimomura K., Nakamura Y., Inazawa J., Abe T.,Yamagishi H. (2001) Tumour-amplified kinase BTAK is amplifiedand overexpressed in gastric cancers with possible involvementin aneuploid formation. Br J Cancer;84:824–831.
10. Bischoff J.R., Anderson L., Zhu Y., Mossie K., Ng L., Souza B.,Schryver B., Flanagan P., Clairvoyant F., Ginther C., Chan C.S.M.,Novotny M. (1998) A homologue of Drosophila Aurora kinase isoncogenic and amplified in colorectal cancers. EMBO J;17:3052–3065.
11. Zhou H., Kuang J., Zhong L., Kuo W.L., Gray J.W., Sahin A.,Brinkley B.R., Sen S. (1998) Tumour amplified kinaseSTK15 ⁄ BTAK induces centrosome amplification, aneuploidy andtransformation. Nat Genet;20:189–193.
12. Giet R., Prigent C. (1999) Aurora ⁄ Ipl1p-related kinases, a newfamily of mitotic serine-threonine kinases. J Cell Sci;112:3591–3601.
13. Tatsuka M., Katayama H., Ota T., Tanaka T., Odashima S., SuzukiF., Terada Y. (1998) Multinuclearity and increased ploidy causedby overexpression of the Aurora-and Ipl1-like midbody-asso-ciated protein mitotic kinase in human cancer cells. CancerRes;58:4811–4816.
14. Kimura M., Matsuda Y., Yoshioka T., Okano Y. (1999) Cell cycle-dependent expression and centrosomal localization of a thirdhuman Aurora ⁄ Ipl1-related protein kinase, AIK3. J BiolChem;274:7334–7340.
15. Takahashi T., Futamura M., Yoshimi N., Sano J., Katada M.,Takagi Y., Kimura M., Yoshioka T., Okano Y., Saji S. (2000) Cen-trosomal kinases, HsAIRk1 and HsAIRK3, are overexpressed inprimary colorectal cancers. Jpn J Cancer Res;91:1007–1014.
16. Keen N., Taylor S. (2004) Aurora-kinase inhibitors as anticanceragents. Nature Rev Cancer;4:927–936.
17. Mortlock A.A., Keen N.J., Jung F.H., Heron N.M., Foote K.M.,Wilkinson R.W., Green S. (2005) Progress in the development ofselective inhibitors of Aurora kinases. Curr Top MedChem;5:807–821.
18. Fancelli D., Moll J. (2005) Inhibitors of Aurora kinases forthe treatment of cancer. Expert Opin Ther Patents;15:1169–1182.
19. Girdler F., Gascoigne K.E., Eyers P.A., Hartmuth S., Crafter C.,Foote K.M. et al. (2006) Validating Aurora B as an anti-cancerdrug target. J Cell Sci;119:3664–3675.
20. Mahadevan D., Beeck S. (2007) Aurora kinase targeted thera-peutics in oncology: past, present and future. Expert Opin DrugDiscov;2:1011–1026.
21. Yang H., Burke T., Dempsey J., Diaz B., Collins E., Toth J., Beck-mann R., Ye X. (2005) Mitotic requirement for aurora A kinaseis bypassed in the absence of aurora B kinase. FEBS Lett;579:3385–3391.
22. Ditchfield C., Johnson V.L., Tighe A., Ellston R., Haworth C.,Johnson T., Mortlock A., Keen N., Taylor S.S. (2003) Aurora Bcouples chromosome alignment with anaphase by targetingBubR1, Mad2, and Cenp-E to kinetochores. J Cell Biol;161:267–280.
23. Hauf S., Cole R.W., LaTerra S., Zimmer C., Schnapp G., WalterR., Heckel A., Van Meel J., Rieder C.L., Peters J.-M. (2003) Thesmall molecule Hesperadin reveals a role for Aurora B in con-necting kinetochore-microtubule attachment and in maintainingthe spindle assembly checkpoint. J Cell Biol;161:281–294.
24. MurataHori M., Wang Y.L. (2002) The kinase activity of aurora Bis required for kinetochore-microtubule interactions during mito-sis. Curr Biol;12:894–899.
25. Kallio M.J., McCleland M.L., Stukenberg P.T., Gorbsky G.J.(2002) Inhibition of aurora B kinase blocks chromosome segrega-tion, overrides the spindle checkpoint, and perturbs microtubuledynamics in mitosis. Curr Biol;12:900–905.
26. Adams R.R., Maiato H., Earnshaw W.C., Carmena M. (2001)Essential roles of Drosophila inner centromere protein (INCENP)and aurora B in histone H3 phosphorylation, metaphase chromo-some alignment, kinetochore disjunction, and chromosome seg-regation. J Cell Biol;153:865–880.
27. Giet R., Glover D.M. (2001) Drosophila aurora B kinase isrequired for histone H3 phosphorylation and condensin recruit-ment during chromosome condensation and to organize the cen-tral spindle during cytokinesis. J Cell Biol;152:669–682.
28. Wilkinson R.W., Odedra R., Heaton S.P., Wedge S.R., Keen N.J.,Crafter C., Foster J.R. et al. (2007) AZD1152, a selective inhibi-tor of Aurora B kinase, inhibits human tumor xenograft growthby inducing apoptosis. Clin Cancer Res;13:3682–3688.
29. Moriarty K.J., Koblish H., Johnson D.L. Jr, Galemmo R.A. Jr.(2007) Progress in the development of agents to control the cellcycle. Top Med Chem;1:207–291.
30. Clement O.O., Mehl A.T. (2000) HipHop: pharmacophores basedon multiple common-feature alignments. In: G�ner O.F., editor.Pharmacophore Perception, Development, and Use in DrugDesign. La Jolla, CA: International University;p. 69–84.
31. Li H., Sutter J., Hoffman R. (2000) HypoGen: an automated sys-tem for generating 3D predictive pharmacophore models. In:G�ner O.F., editor. Pharmacophore Perception, Development, andUse in Drug Design. La Jolla, CA: International University;p.171–189.
32. Lipinski C.A., Lombardo F., Domiay B.W., Freeney P.J. (1997)Experimental and computational approaches to estimate solubi-lity and permeability in drug discovery and development settings[J]. Adv Drug Deliv Rev;23:3–25.
33. Fancelli D., Moll J. Jr, Varasi M., Bravo R., Artico R.,Berta D., Bindi S. et al. (2006) 1,4,5,6-Tetrahydropyrrolo[3,4-c]
A Specific Pharmacophore Model of Aurora B Kinase Inhibitors
Chem Biol Drug Des 2009; 73: 115–126 125

pyrazoles: identification of a potent aurora kinase inhibitorwith a favorable antitumor kinase inhibition profile. J MedChem;49:7247–7251.
34. Vianello P. (2007) Aminopyridines: selective Aurora-A inhibitors.Expert Opin Ther Patents;17:255–261.
35. Manfredi M.G., Ecsedy J.A., Meetze K.A., Balani S.K., BurenkovaO., Chen W., Galvin K.M. et al. (2007) Antitumor activity ofMLN8054, an orally active small-molecule inhibitor of Aurora Akinase. PNAS;104:4106–4111.
36. Jung Fdr.H., Pasquet G., Brempt C.L.-vd., Lohmann J.-J.M.,Warin N., Renaud F., Germain H., Savi C.D., Roberts N., JohnsonT., Dousson C., Hill G.B., Mortlock A.A. (2006) Discovery of noveland potent thiazoloquinazolines as selective Aurora A and Bkinase inhibitors. J Med Chem;49:955–970.
37. Mortlock A.A., Foote K.M., Heron N.M., Jung F.H., PasquetG., Lohmann J.-J.M., Warin N., Renaud F., Savi C.D. (2007)Discovery, synthesis, and in vivo activity of a new class ofpyrazoloquinazolines as selective inhibitors of Aurora B kinase.J Med Chem;50:2213–2224.
38. Foote K.M., Mortlock A.A., Heron N.M., Jung F.H., Hill G.B., Pas-quet G., Brady M.C., Green S. (2008) Synthesis and SAR of 1-acetanilide-4-aminopyrazolesubstituted quinazolines: selectiveinhibitors of Aurora B kinase with potent anti-tumor activity.Bioorg Med Chem Lett;18:1904–1909.
39. Brooks B.R., Brucolleri R.E., Olafson B.D., States D.J., Swami-nathan S., Karplus M. (1983) CHARMM: a program for macromo-lecular energy, minimization and dynamics calculations.J Comput Chem;4:187–217.
40. Smellie A., Kahn S.D., Teig S.L. (1995) Analysis of conforma-tional coverage. 1. Validation and estimation of coverage.J Chem Inf Comput Sci;35:285–294.
41. Smellie A., Kahn S.D., Teig S.L. (1995) Analysis of conforma-tional coverage. 2. Applications of conformational models.J Chem Inf Comput Sci;35:295–304.
42. Smellie A., Teig S.L., Towbin P. (1995) Poling: promoting confor-mational coverage. J Comput Chem;16:171–187.
43. Debnath A.K. (2002) Pharmacophore mapping of a series of 2,4-diamino-5- deazapteridine inhibitors of Mycobacterium aviumcomplex dihydrofolate reductase. J Med Chem;45:41–53.
44. Fischer R.A. (1966) The Design of Experiments. New York, USA:Hafner Publishing.
45. Berman H.M., Westbrook J., Feng Z., Gilliland G., Bhat T.N.,Weissig H., Shindyalv I.N., Bonrne P.E. (2000) The protein databank. Nucleic Acids Res;28:235–242.
46. Sessa F., Mapelli M., Ciferri C., Tarricone C., Areces L.B., Schnei-der T.R., Stukenberg P.T., Musacchio A. (2005) Mechanism ofAurora B activation by INCENP and inhibition by hesperadin.Mol Cell;18:379–391.
47. Deng X.-Q., Wang H.-Y., Zhao Y.-L., Xiang M.-L., Jiang P.-D., CaoZ.-X., Zheng Y.-Z., Luo S.D., Yu L.-T., Wei Y.-Q., Yang S.-Y. (2008)
Pharmacophore modelling and virtual screening for identificationof new Aurora-A kinase inhibitors. Chem Biol Drug Des;71:533–539.
48. Zou J., Xie H.-Z., Yang S.-Y., Chen J.-J., Ren J.-X., Wei Y.-Q.(2008) Towards more accurate pharmacophore modeling: multi-complex-based comprehensive pharmacophore map and most-frequent-feature pharmacophore model of CDK2. J Mol GraphModel;27:430–438. doi:10.1016/j.jmgm.2008.07.004
49. Venkatachalam C.M., Jiang X., Oldfield T., Waldman M. (2003)LigandFit: a novel method for the shape-directed rapid dockingof ligands to protein active sites. J Mol Graphics Mod-ell;21:289–307.
50. Gehlhaar D.K., Verkhivker G.M., Rejto P.A., Sherman C.J., FogelD.B., Fogel L.J. et al. (1995) Molecular recognition of the inhibi-tor AG-1343 by HIV-1 protease: conformationally flexible dockingby evolutionary programming. Chem Biol;2:317–324.
51. Jain A.N. (1996) Scoring noncovalent protein-ligand interactions:a continuous differentiable function tuned to compute bindingaffinities. J Comput-Aided Mol Des;10:427–440.
52. Bçhm H.J. (1994) The development of a simple empirical scoringfunction to estimate the binding constant for a protein-ligandcomplex of known three-dimensional structure. J Comput –AidedMol Des;8:243–256.
53. Bçhm H.J. (1998) Prediction of binding constants of proteinligands: a fast method for the prioritization of hits obtained fromde novo design or three-dimensional database search programs.J Comput –Aided Mol Des;12:309–323.
54. Muegge I., Martin Y.C. (1999) A general and fast scoring func-tion for protein-ligand interactions: a simplified potentialapproach. J Med Chem;42:791–804.
55. Clark R.D., Strizhev A., Leonard J.M., Blake J.F., Matthew J.B.(2002) Consensus scoring for ligand ⁄ protein interactions. J Mol-Graphics Modell;20:281–295.
Supporting Information
Additional Supporting Information may be found in the online ver-sion of this article:
Figure S1. The difference in costs between HypoGen runs andCatScramble runs. The 95% confidence level was selected.
Table S1. Part of the hits obtained from virtual screening.
Please note: Wiley-Blackwell are not responsible for the content orfunctionality of any supporting materials supplied by the authors.Any queries (other than missing material) should be directed to thecorresponding author for the article.
Wang et al.
126 Chem Biol Drug Des 2009; 73: 115–126