Modernizing irrigation operations: spatially differentiated resource allocations
Upload
independentCategory
view
2download
0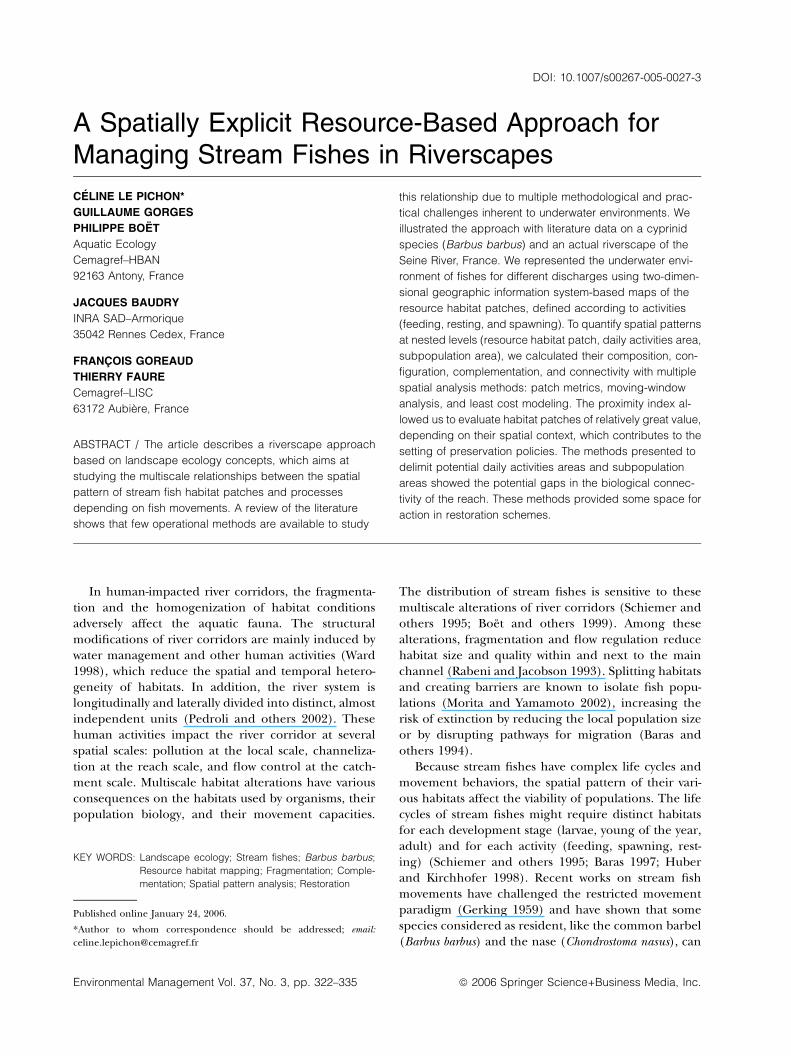
A Spatially Explicit Resource-Based Approach forManaging Stream Fishes in Riverscapes
CELINE LE PICHON*
GUILLAUME GORGES
PHILIPPE BOET
Aquatic EcologyCemagref–HBAN92163 Antony, France
JACQUES BAUDRY
INRA SAD–Armorique35042 Rennes Cedex, France
FRANCOIS GOREAUD
THIERRY FAURE
Cemagref–LISC63172 Aubi+re, France
ABSTRACT / The article describes a riverscape approachbased on landscape ecology concepts, which aims atstudying the multiscale relationships between the spatialpattern of stream fish habitat patches and processesdepending on fish movements. A review of the literatureshows that few operational methods are available to study
this relationship due to multiple methodological and prac-tical challenges inherent to underwater environments. Weillustrated the approach with literature data on a cyprinidspecies (Barbus barbus) and an actual riverscape of theSeine River, France. We represented the underwater envi-ronment of fishes for different discharges using two-dimen-sional geographic information system-based maps of theresource habitat patches, defined according to activities(feeding, resting, and spawning). To quantify spatial patternsat nested levels (resource habitat patch, daily activities area,subpopulation area), we calculated their composition, con-figuration, complementation, and connectivity with multiplespatial analysis methods: patch metrics, moving-windowanalysis, and least cost modeling. The proximity index al-lowed us to evaluate habitat patches of relatively great value,depending on their spatial context, which contributes to thesetting of preservation policies. The methods presented todelimit potential daily activities areas and subpopulationareas showed the potential gaps in the biological connec-tivity of the reach. These methods provided some space foraction in restoration schemes.
In human-impacted river corridors, the fragmenta-tion and the homogenization of habitat conditionsadversely affect the aquatic fauna. The structuralmodifications of river corridors are mainly induced bywater management and other human activities (Ward1998), which reduce the spatial and temporal hetero-geneity of habitats. In addition, the river system islongitudinally and laterally divided into distinct, almostindependent units (Pedroli and others 2002). Thesehuman activities impact the river corridor at severalspatial scales: pollution at the local scale, channeliza-tion at the reach scale, and flow control at the catch-ment scale. Multiscale habitat alterations have variousconsequences on the habitats used by organisms, theirpopulation biology, and their movement capacities.
The distribution of stream fishes is sensitive to thesemultiscale alterations of river corridors (Schiemer andothers 1995; Boet and others 1999). Among thesealterations, fragmentation and flow regulation reducehabitat size and quality within and next to the mainchannel (Rabeni and Jacobson 1993). Splitting habitatsand creating barriers are known to isolate fish popu-lations (Morita and Yamamoto 2002), increasing therisk of extinction by reducing the local population sizeor by disrupting pathways for migration (Baras andothers 1994).
Because stream fishes have complex life cycles andmovement behaviors, the spatial pattern of their vari-ous habitats affect the viability of populations. The lifecycles of stream fishes might require distinct habitatsfor each development stage (larvae, young of the year,adult) and for each activity (feeding, spawning, rest-ing) (Schiemer and others 1995; Baras 1997; Huberand Kirchhofer 1998). Recent works on stream fishmovements have challenged the restricted movementparadigm (Gerking 1959) and have shown that somespecies considered as resident, like the common barbel(Barbus barbus) and the nase (Chondrostoma nasus), can
KEY WORDS: Landscape ecology; Stream fishes; Barbus barbus;Resource habitat mapping; Fragmentation; Comple-mentation; Spatial pattern analysis; Restoration
Published online January 24, 2006.
*Author to whom correspondence should be addressed; email:
Environmental Management Vol. 37, No. 3, pp. 322–335 ª 2006 Springer Science+Business Media, Inc.
DOI: 10.1007/s00267-005-0027-3

move from 100 m up to several kilometers, dependingon exploratory trips or seasonal activities (Gowan andFausch 1996; Smithson and Johnston 1999; Lucas andBaras 2001). Therefore, large-scale spatial habitat pat-ches relationships, such as complementation (spatialproximity of nonsubstitutable resources), sink/sourcerelations, and neighborhood effects (Dunning andothers 1992), can be critical factors for fish populationdynamics (Schlosser 1995). Indeed, considering onlythe availability of one habitat is sometimes not suffi-cient to explain the spatial distribution of fishes(Freeman 1993): The spatial context of this habitat canbe critical. Kocik and Ferreri (1998) improved theunderstanding of juvenile Atlantic salmon productionwhen mapping the interspersion of spawning andrearing habitats.
Concepts of landscape ecology can be used toanalyze the role of spatial patterns in river ecology.The patch-dynamics concept, considering how specificpatch characteristics determine biotic and abioticprocesses over various scales, was formalised in loticsystems by Pringle and others (1988) and Townsend(1989). The hierarchical patch-dynamics (HPD) con-cept (Wu and Loucks 1995), viewing ecological sys-tems as nested and hierarchical mosaics of habitatpatches, was used for fishes by Schlosser (1991, 1995).A better consideration of longitudinal discontinuitiesprovides a conception of streams as a discontinuousmosaic of patches (Bretschko 1995; Ward and Stan-ford 1995). This conception also underlines theuniqueness of every reach of a river corridor (Poole2002). Moreover, fish habitats are dynamic in therelation to longitudinal and lateral hydrodynamicinteractions between the elements of the river corri-dor, which is consistent with the hydrological con-nectivity concept (Petts and Amoros 1996; Amorosand Bornette 2002). All of these concepts show theimportance of embracing the entire, heterogeneous,dynamic, and continuous nature of the river corridorwith its abrupt transitions, as pointed out recently byFausch and others (2002).
River management for biological conservation ofstream fishes involves the protection and rehabilita-tion of habitats and the restoration of the rivercontinuum (Schiemer and Waidbacher 1992; Cowxand Welcomme 1998). Small-scale physical rehabili-tation designs (100–1000 m) improving the hetero-geneity of depth and current velocities can beineffective to increase fish diversity because of aninappropriate location in degraded reaches (Prettyand others 2003). An inappropriate location meansthe isolation from other suitable habitats (comple-mentation) or from a source of available colonizers
(sink/source relationships). This assumption is sup-ported by research showing that fish recolonizationrates are influenced by the distance from sourcepopulations or by differences in the size or distri-bution of habitats (Detenbeck and others 1992;Lonzarich and others 1998). For example, artificialriffles built to ensure lithophilous spawning must beclose to backwater habitats used as nurseries (Schi-emer and Waidbacher 1992). The knowledge ofmovement rates and behaviors in the heterogeneousaquatic environment used by fishes to reach differenthabitats during the life cycle also contributes to asuccessful rehabilitation.
The main references to landscape ecology princi-ples in stream studies are as follows: (1) the adoptionof a ‘‘landscape scale’’ in streams (Lowe 2002) or (2)the use of terrestrial landscape parameters to explainthe distribution of aquatic organisms (Kelly and others1998; Watzin and McIntosh 1999). Only recently havearticles outlined the usefulness of this discipline in theriver corridor itself (Ward and others 2002; Wiens2002) and the need to develop distinct fluvial land-scape ecology (Poole 2002). The riverine landscape isincreasingly viewed as a ‘‘riverscape,’’ a term coined byWard (1998). However, behind this term are numerousacceptations, depending on which ones, among the sixcentral tenets of landscape ecology proposed by Wiens(2002), are explored. In particular, it could be anaquatic ecosystem within its catchment amenable tostudy over a wide range of scales (Allan 2004; Harrisand Heathwaite 2005).
For stream fishes, guidelines based on landscapeecology have been proposed for more effective man-agement and conservation research (Fausch and others2002; Rabeni and Sowa 2002). However, practicalapplications of these concepts dealing with the influ-ence of the spatial pattern of habitat on fish populationdynamics remain isolated. Most of the classical ap-proaches are typically site based, with selected sampleunits of 50–500 m assumed to be representative of theentire river and widely spaced along the river orcatchment area. An incomplete view can result fromsuch approaches, missing important phenomena at alarger scale, like the existence of a tributary or a bar-rier, which can play a role in fish population dynamics.Recently, Baxter (2002) proposed an approach basedon landscape ecology that combined continuous andsite-based surveys to analyze fish–habitat relationshipsat landscape scale but without an assessment of theirspatial pattern.
This article aims at providing a riverscape approachcombined with a set of relevant spatial analysis meth-ods to assess the multiscale relationships between the
Managing Stream Fishes in Riverscapes 323

spatial pattern of fish habitats and processes, depend-ing on fish movements. It has been developed for res-ident fishes with a freshwater life cycle, but it might beuseful for part of the life cycle of diadromous fishes. Toillustrate the spatial analysis, we have chosen a rheo-philic cyprinid species (Barbus barbus) and an actualriverscape: a reach of the Seine River, France. We haveused literature data to define habitat preferences andmovement capacities for Barbus barbus, whereas aquatichabitats of the 20-km reach have been measured in thefield. To put some of the methods into practice, wehave developed specific tools.
From Underwater Riverscape to ResourceHabitat Maps for Stream Fishes
The riverscape approach conceptualizes the rivernot as sampling points or lines but as a spatially con-tinuous mosaic (Fausch and others 2002). Underwaterenvironments are dynamic and hidden behind a rela-tively opaque layer that is not directly available to aterrestrial observer (Torgersen 2002). These intrinsicdifficulties limit the development of this approach torepresent fish habitats and to create maps. In the fol-lowing subsections, we discuss some methodologicaland practical challenges of the riverscape approachand we propose choices that might differ from classicalapproaches of stream ecology.
Representing an Underwater Environment: The FishActivity Point of View
Usual methods predefine habitat classes usingchannel geomorphic units as quasidiscrete areas ofrelatively homogeneous depth and flow (Hawkins andothers 1993). In that case, the underwater environmentis represented by a single map of fixed channel units (acombination of two variables). These channel units(called pools, glides, rapids, riffles, etc.) are sometimessubjective and depend on the morphological andhydrological properties of the reach as well as the scaleof observation, leading to the difficulty of building ageneral system of classification (Hawkins and others1993). Nevertheless, each channel unit can be reclas-sified according to its suitability for a fish species(Toepfer and others 2000; Srivastava and others 2001).This method provides maps of suitability or maps ofpercentages of suitable area for each previouslydelimited channel unit, but loses the spatial location ofsuitable habitat patches.
We predefine habitat classes using an organism-based point of view (Pringle and others 1988), the re-source-based concept of habitat (Dennis and others
2003), and a hierarchical partition of the habitat(Kotliar and Wiens 1990; Baguette and Mennechez2004). The underwater environment is then repre-sented by multiple maps of resource-based habitatpatches that are defined in relation to a particularactivity for a focal species (resting habitat, spawninghabitat, etc.). To allow a spatial delimitation of thesehabitat patches, we have proposed a classificationbased on the knowledge of the suitable range of eachselected variable for a species: its habitat preferences.Among the relevant variables influencing the differentactivities of Barbus barbus, we selected the ones that canbe mapped using available technologies. Variableclasses for depth, current velocity, bottom substrate,log jam, and riparian cover are defined according tohabitat preferences (Table 1) (Baras 1992; Cowx andWelcomme 1998). This habitat classification allows amore reliable comparison between different reachesbecause it resolves the problem of subjective classifi-cation by geomorphically defined channel units(Meaden 2004). However, this knowledge-based classi-fication might be arbitrary, depending on the validityof biological data in relation to the sampling strategy(Hirzel and Guisan 2002). It especially allows thedelimitation of boundaries for each gradient variableand their independent mapping as a mosaic of pat-ches. Each variable is of equal importance and is usedand combined with others according to its usefulnessfor mapping a particular resource habitat.
Increasing the Scope of the Study
Study scales are often influenced by previous edu-cational and traditional methodologies, which couldbe inappropriate for testing large-scale processes suchas migration and dispersal. The usual terms ‘‘micro-habitat scale,’’ ‘‘mesoscale,’’ ‘‘macroscale,’’ and ‘‘largescale’’ are not always precisely quantified in meters andremain fuzzy, leading to different acceptations amongstream ecologists and even among fish ecologists.Fausch and others (2002) noted the existing gap be-tween the microhabitat (10)1–100 m) and reach-scale(101–103 m) of most river fish research and the seg-ment scale (103–105 m) of natural processes and hu-man disturbances. Choosing the right scales requiresthe definition of the extent and the resolution adaptedto the detection of spatial patterns of habitats and tothe study of key processes. In scaling theory, the abilityto detect patterns at multiple scales is called the scope,or the ratio of extent to grain size (Schneider 2001).
The term ‘‘extent’’ refers to the size of the studyarea or temporal monitoring and ‘‘resolution’’ meansthe grain of the data (smallest object or feature dis-
324 C. Le Pichon and others

cernible in the observations or measurements, mini-mum mapping unit, pixel size, time interval, etc.). Fishactivities, processes, and movement capacities influ-ence the definition of the extent. For mobile species,daily activities occur at the reach level, whereas dis-persal occurs at the catchment level (105–106 m).Spawning migrations might occur at the reach levelinstead of the segment level for species with restrictedmovement capacities. For example, considering com-plementation between daily activities areas andspawning habitat, the extent should be at least 20 kmfor the nase (Chondrostoma nasus) (Lucas and Batley1996). The scale of human impacts and management isalso a determining factor in the definition of the extent(Bayley and Li 1992).
Characterizing the complexity of a habitat requiresthe use of a relevant resolution (Johnson and Gage1997). The importance of high-resolution data to studymobile stream fishes has been recently mentioned byFausch and others (2002) and Rabeni and Sowa (2002).In terrestrial environments, it is assumed that a coarserresolution is suitable for analyzing highly mobile spe-cies (Suarez-Seoane and Baudry 2002). However, rep-resenting the habitat of mobile fishes might require ahigher resolution and a larger extent, in accordancewith Torgensen’s recommendation (2002) to increasethe scope in order to reveal new patterns and rela-tionships between fishes and their environment.
We mapped a 22-km reach with a 50-m-wide channeland lateral water bodies, as a compromise between thepresence of upstream and downstream navigation weirsand common barbel spawning migration distancesranging from 2 to 6 km (Lucas and Batley 1996). Weused a high resolution of 1 m in a two-dimensional (2-D) representation to reveal the spatiotemporal heter-ogeneity of longitudinal and lateral fish habitats. It al-lows the representation of (1) both the main channeland banks, (3) small or thin habitats such as a log jamor bank of boulders, (3) the lateral water bodies forwhich the aquatic connection with the main channelcan be 1 or 2 m wide, depending on the water level,and (4) unique features such as barriers, dams, andother obstacles.
Using a GIS-Based Approach to Map ResourceHabitat Patches
With the availability of different high-spatial-resolu-tion remote sensing techniques (Johnson and Gage1997; Leuven and others 2002; Mertes 2002; Whitedand others 2002), geographic information systems(GISs) are increasingly used in freshwater systems(Fisher and Rahel 2004) to spatially delineate fishhabitats. Main approaches imply different data layers,representing the environmental variables (depth, cur-rent velocity, substrate, temperature, salinity, etc.), thatare overlaid to delimit potential areas of fish habitats(Dauble and others 1999) or to predict fish distribu-tion maps (Rubec and others 1998).
We used digital orthophotographs to delineate wa-ter boundaries of the channel, corresponding to onedischarge. For the same discharge, connected waterbodies and variables (depth, current velocities, sub-strate, log jam, and riparian cover) are located during afield mapping session with an accuracy of 1 m usingDifferential Global Positioning System (DGPS) equip-ment, as proposed by Schilling and Wolter (2000).These techniques are chosen as a compromise betweenhigh labor costs and relatively low data and equipmentcosts adapted to turbid water. The different datasources (vector data structure for GPS, raster datastructure for aerial imagery) are exported into GIS(ArcInfo�) to create a set of data layers for each vari-able (Figure 1A). To represent discrete habitat fea-tures, a vector GIS data structure is preferred toprecisely portray variables (points for logs, polygons forsubstrate type, islands, etc.). These data layers arecombined according to species habitat preferences inorder to create resource habitat maps (Figure 1A).
Evaluating the Spatial Pattern of ResourceHabitat Patches and Their SpatialRelationships at Various Scales
A Hierarchical Habitat-Based Model
Fish populations in natural or fragmented rivers canbe structured like a subdivided population (Lucas and
Table 1. Habitat preferences for barbel: body length > 150 mm
Available GIS layers Resting habitat map Feeding habitat map Spawning habitat map
Surface current velocity (m/s) 0–0.5 0.2–1.0 0.2–0.6Depth (m) 0.3–1.5 0.2–0.5 0.1–0.3Woody debris: log jam 2 m in diameterSelected bottom substrate Cobble, block Sand, gravel, pebble GravelRiparian cover: roots as shelters 2 m wideNatural water bodies connected to main channel All
Source: Adapted from Baras (1992) and Cowx and Welcomme (1998).
Managing Stream Fishes in Riverscapes 325
Batley 1996; Johnston 2000). This subdivided popula-tion can be spatially defined by distinct subpopulationareas, containing or not individuals of the species andlinked by dispersal migration. Subpopulation areas aredefined by the presence and accessibility of all thecomplementary resources required for a life cycle. Forterrestrial species, the spatial structure of potentialsubpopulation areas is used to model the viability ofthe population (Pain and others 2000; Jochem andothers 2002). A framework to map the spatial structureof a potential subpopulation was proposed by Leuvenand Poudevigne (2002).
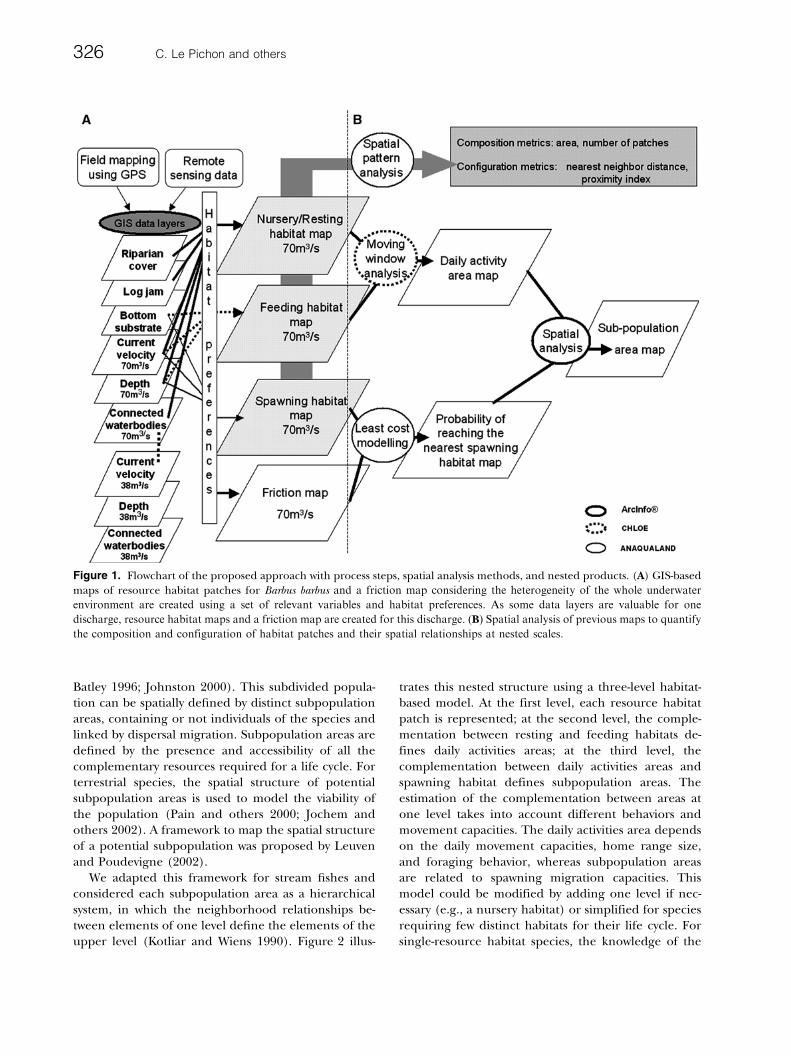
We adapted this framework for stream fishes andconsidered each subpopulation area as a hierarchicalsystem, in which the neighborhood relationships be-tween elements of one level define the elements of theupper level (Kotliar and Wiens 1990). Figure 2 illus-
trates this nested structure using a three-level habitat-based model. At the first level, each resource habitatpatch is represented; at the second level, the comple-mentation between resting and feeding habitats de-fines daily activities areas; at the third level, thecomplementation between daily activities areas andspawning habitat defines subpopulation areas. Theestimation of the complementation between areas atone level takes into account different behaviors andmovement capacities. The daily activities area dependson the daily movement capacities, home range size,and foraging behavior, whereas subpopulation areasare related to spawning migration capacities. Thismodel could be modified by adding one level if nec-essary (e.g., a nursery habitat) or simplified for speciesrequiring few distinct habitats for their life cycle. Forsingle-resource habitat species, the knowledge of the
Figure 1. Flowchart of the proposed approach with process steps, spatial analysis methods, and nested products. (A) GIS-basedmaps of resource habitat patches for Barbus barbus and a friction map considering the heterogeneity of the whole underwater
environment are created using a set of relevant variables and habitat preferences. As some data layers are valuable for one
discharge, resource habitat maps and a friction map are created for this discharge. (B) Spatial analysis of previous maps to quantify
the composition and configuration of habitat patches and their spatial relationships at nested scales.
326 C. Le Pichon and others

minimal area size and maximal movement capacitieswill delimit the subpopulation area level. At each levelof this habitat-based model, spatial analysis methodsare proposed to delimit the upper level.
Calculating Areas and Distances in a 2-D RiverSegment
The spatial analysis of 2-D habitat patches maps,requiring both areas and oriented distances, is imple-mented using a raster data structure. A 1-m pixel size ischosen to preserve the sharpness of the initial vectordata structures, especially with thin resting habitatssuch as shelters. In order to compute oriented calcu-lations of distance between habitats along the rivercourse (upstream and downstream), we have devel-
oped a specific computer GIS program, Anaqualand,which integrates the geometry of the river into thedistance between two points or patches and handleslarge amounts of data composed of few informativepixels (1–2%) through sparse formalism (Saad andSosonkina 1999).
Quantifying Habitat Patterns at Nested Scales
At the resource habitat patch scale (level A, Fig-ure 2), we used area, number, density, and nearest-neighbor distance to identify the composition andfragmentation of habitats (O’Neill and others 1988;MacGarigal and Marks 1995). We also selected theproximity index (Gustafson and Parker 1994), quanti-fying the spatial context of a habitat patch in relation
Figure 2. Hierarchical spatiotemporal structure of fish population, inspired by Frissell and others (1986), Schlosser (1995),Pain and others (2000), and Leuven and Poudevigne (2002): (A) Resource habitat patch scale; (B) daily activities areas scale in
which the feeding habitat and the refuge/resting habitat exist and have a complementation relationship; (C) subpopulation areas
scale in which previous daily activities areas have a complementation relationship with the spawning habitat via spawning
migrations. For species with restricted movements, the life cycle might require a spatial scale of 100 m, whereas highly mobile
species might necessitate 100 km. The hierarchical structure might also start at the B or C level, depending on whether the species
requires a single habitat or various habitats.
Managing Stream Fishes in Riverscapes 327

to its neighbors, for its ecological significance, sim-plicity, and possible adaptability to fish resource habi-tats, because only area and distance are required. Weused the formula modified by MacGarigal and Marks(1995),
Px ¼Xn
i ¼ 1
Areai
D2ix
ð1Þ
where n is the number of patches, the edges of whichare within a search radius of the patch x, Areai is thearea of patch i, and Dix is the distance between patch iand patch x. The main adaptation is the calculation ofeach Dix as edge-to-edge distance along the river courseusing Anaqualand (Figure 3A).
We defined the daily activities area scale using thecomplementation between feeding and resting habi-tats. This neighborhood relationship is evaluated withthe proximity index of the resting habitat in relation toeach feeding habitat (Figure 3B). The daily activitiesarea can be a single resource habitat patch in the caseof species that do not use distinct areas to performthese two activities. Global maps of potential dailyactivities areas were also proposed in addition to pre-vious metrics. We applied a moving-window analysisfrom image processing, characterizing the landscapestructure inside a search radius around each pixel(Schermann and Baudry 2002). In practice, a spatialindex is computed in a squared window and its value isassigned to the central pixel. The window is moved
systematically along the raster map and a new map ofthe spatial index is produced. Different spatial indexes,such as relative abundance, richness, diversity, or het-erogeneity, are computed using the Chloe softwaredeveloped by Baudry and others (2005). The propor-tion of feeding (or resting) habitats is calculated usinga relevant window size in relation to the spatial rela-tionship and the species (Figure 4A). Maps of eachhabitat proportion (Figure 4B) are then overlaid tocreate a complementation map that represents poten-tial daily activities areas (Figure 4C).
We defined the subpopulation area scale using thecomplementation between daily activities areas and theconnectivity to spawning habitats. The connectivitycould be measured by neighborhood indices, such asCsi (Hanski 1994), the lacunarity index (Plotnick andothers 1993), or the aggregation index (He and others2000), and modeling approaches. In some modelingapproaches, the landscape is considered as a binarysystem composed of habitat and nonhabitat (Metzgerand Decamps 1997; Rushton and others 1997). As thespawning migration might entail long-distance move-ments and is a vulnerable part of the life cycle (Smith1991), we considered the biological connectivity of theriverscape as a response of fishes to the heterogeneityof all the habitats traveled through during migration.Modeling approaches of the biological connectivitywere implemented using the concept of minimalcumulative resistance (MCR) (Knaapen and others
Figure 3. Two proximity indexes calculated for a focal patch Fj; the dashed line delimits the search radius from the edges of thefocal patch and Djs is the edge-to-edge distance along the 2-D river course. (A) The proximity index for a class of habitats (feeding
habitats); search radius = 200 m. (B) The proximity index for two classes of habitats to evaluate their complementation; this is an
example of the proximity of the resting habitat (Rs) to the feeding habitat Fj ; search radius = 60 m.
328 C. Le Pichon and others

1992) or, more recently, the ‘‘least cost’’ model (Ad-riaensen and others 2003), which assigns to each hab-itat a value (resistance or permeability) based onenergy expenses, mortality risks, and movement costs(Pain and others 2000; Ray and others 2002; Vuilleu-mier and Prelaz-Droux 2002; Joly and others 2003). Wedefined a resistance matrix for the barbel based onswimming capacities and predation risks in order tobuild a friction map (Figure 1A). We applied the MCRfor all spawning habitats and built a map of the prob-ability (pixel Aj) of reaching the nearest spawninghabitat (pixel Bj) using Anaqualand (Figure 1B). Thisprobability is a decreasing function of MCR and a;:: inwhich a
_is the potential mean distance covered by a fish
during the spawning migration. A similar species-spe-
cific parameter as, called the dispersal coefficient, isused to evaluate connectivity (Vos and others 2001).For the probability computation, we used a decreasingexponential:
Proba ðAiÞ¼ e�Bj
min MCR ðAj ;Bj Þ½ �a ð2Þ
The map of the probability of reaching the nearestspawning habitat visually illustrates gaps in the biolog-ical connectivity (Figure 5B). By overlaying the dailyactivities area map (Figure 5A) and the probabilitymap and choosing a threshold probability, we delin-eated potential areas that might support a subpopula-tion (Figure 5C). At each scale, one can remove anarea that is too small to be either a minimal resource
Figure 4. Identification of daily activities areas through complementation maps using the moving-window analysis. Identifi-cation of the complementation of stream fish habitats using the moving-window analysis. (A) The raster maps of resource habitatpatches are computed to create new raster maps of the proportion of each habitat in a 60 · 60-pixel window size. (B) Habitat
proportions are available from 1% to 100%. These two raster maps are overlaid and then reclassed to identify complementation of
the two habitats within a radius of 30 pixels. (C) The complementation is defined by thresholds of 4% for resting and 6% for feeding.
Managing Stream Fishes in Riverscapes 329

habitat area, a minimal daily activities area, or a mini-mal subpopulation area.
Conclusion and Perspectives
The spatial analysis of the riverscape approach at-tempted to contribute to the fluvial landscape ecologyby viewing lotic ecosystems as hierarchical and contin-uous mosaics of habitat patches. In the case of streamfishes, it meant the following: (1) changing the tradi-tional representation of aquatic habitats and consid-ering the resource habitats that support the entire lifecycle, (2) adopting a 2-D large-scale view if necessary,and (3) shifting from site-based to spatially continuousapproaches. This approach implied the resolution ofdifferent methodological and practical challenges. Themain two challenges were mapping resource habitatpatches using a GIS-based method and calculatingdistances in 2-D along the river course. Simple meth-ods were chosen because of the absence of automaticquantification of fish spatial patterns in 2-D. Theirecological relevance was put forward to assess each le-vel of the hierarchical spatial structure of the popula-
tion. The knowledge of this potential spatial structureshould be useful to analyze population viability, todesign sampling techniques in order to estimate theabundance of rare or threatened species (Toepfer andothers 2000), or to detect isolated populations usinggenetic methods (Spruell and others 1999). Themethods were also proposed for prioritizing the pres-ervation of habitats, designing restoration policies, andtesting scenarios following the addition or removal ofhabitat patches.
Prioritizing Preservation and Restoration Policies
Proposals emerged from this riverscape approach tohelp define management schemes. Each resourcehabitat covering the life cycle of the species was rep-resented by one or several maps according to thehabitat requirements of the species. Rearing/nurseryhabitat, feeding habitat, resting/refuge habitat, andspawning habitat patches might be distinct for somespecies or blend into a single resource habitat patch forothers. Methods at the resource habitat level identifiedpotential critical resource habitats, which should allowthe prioritization of management policies such as
Figure 5. Delimitation of potential subpopulation areas. (A) Daily activities areas map using moving-window analysis withChloe. (B) Probability of reaching the nearest spawning habitat map using Equation 2 with Anaqualand. Low probability areas (P
< 0.25) could be interpreted as gaps in biological connectivity (for spawning). (C) The ellipse delimits a potential subpopulation
area defined by areas with a high probability of reaching the nearest spawning habitat (P > 0.75) and containing daily activities
areas.
330 C. Le Pichon and others
restoration at a relevant location. Mapping resourcehabitat patches for different species is also useful toassess whether a rehabilitation scheme at a certainlocation for a given species might destroy critical hab-itats for other species. The relative value of a habitatpatch in relation to its spatial context could be esti-mated with the proximity index (within the samehabitat or between different habitats). The identifica-tion of habitat patches of great value contributes tosetting preservation priorities, and identifying low-va-lue habitats helps set restoration priorities of theirspatial context. The map of the probability of reachingthe nearest spawning habitat, or other habitats, illus-trates potential gaps in the biological connectivity of areach, allowing a localization of restoration schemes.All of these spatial analysis methods could be used tosimulate different scenarios of restoration. The conse-quences of the addition of a habitat patch at a specificlocation could be quantified and visualized using theproposed indexes and maps.
Remaining Challenges
Methodological difficulties still exist when applyingthis riverscape approach to stream fishes. They aremainly due to the shifting nature of the fish habitatmosaic. Two temporal scales can be distinguished: wa-ter-level fluctuations within a period of 1 year, leadingto a pulsing connectivity of water bodies, and at thedecade-to-century scale, the channel pattern dynamics(Amoros and Bornette 2002; Richards and others2002). In this context, mapping changing variables isparticularly challenging and should be done for arange of relevant flows, depending on processes andspecies. On the one hand, the availability of bathymetryassociated with a hydraulic model at the segment scalemakes the creation of depths and current velocitiesmaps for each relevant flow easier (Tiffan and others2002). On the other hand, only few flows can bemapped using remote sensing and field mapping, andthey must be carefully chosen. Relevant flows, accord-ing to hydrological conditions of the reach, could bemedian, dry, or wet 5-yearly flows. By mapping con-trasted flows, the range of temporal variation of fishhabitats is evaluated (Hilderbrand and others 1999). Insome cases, only a particular range of flows is relevantin relation to a specific activity. For example, high flowsand inundation maps are required for species usingtemporary habitats situated in the floodplain for astage of their life cycle. Pike (Esox lucius) migrate fromthe channel in February to spawn on inundatedmeadows (Casselman and Lewis 1996). For this species,mapping accessible spawning habitat requires inunda-tion maps, land-cover types, and migrating routes from
the channel. In regulated or channeled rivers, water-level fluctuations are often very limited and the river-scape might be ‘‘frozen in time’’ (Ward and others2002). In such cases, the habitat maps are valid year-round. For intermittent rivers, the validity of habitatmaps is restricted to flowing months. The range oftemporal variability patterns is critical for understand-ing the consequences of ecological processes anddefining management schemes such as flow regulation.Gustafson (1998) underlined the lack of indicesquantifying spatial patterns that include a measure oftemporal variation. An integrated parameter of thistemporal variation, such as a permanence index, in-spired by the aquatic habitat turnover (Ward and oth-ers 2002), can be mapped using the set of maps foreach flow.
In floodplain rivers with deep and turbid water, theavailability of high-resolution data over large spatialscales and for different water levels is also crucial. Inthat case, panchromatic aerial photography is usefulfor spotting water boundaries, riparian vegetation, andlarge woody debris (Muller 1997), but it is ineffectivefor evaluating water depths. More costly techniquessuch as laser telemetry (bathymetric LIDAR) and radarinterferometry systems could be used for the bathym-etry at a resolution of 1 m (Mertes 2002). Multispectralimage data, collected with a Compact Airborne Spec-trometric Imager (CASI), were used to assess classes ofcurrent velocities and bottom substrate (Puestow2001). However, currently, reliable evaluations of bot-tom substrate in cloudy waters seem limited to GPSfield surveys.
Toward the Validation of the Methods
To validate the ecological relevance of these indexesand maps, spatially continuous surveys of resourcehabitat patches are needed in order to acquire fishdata. Local species abundance can be tested for cor-relation with the relative value of the habitat patch orits spatial context. Potential subpopulation areas couldalso be evaluated by sampling juvenile fishes (young-of-the-year) because their distribution is linked to theselection of spawning habitats by adults (Poizat andPont 1996). Their presence is an appropriate indicatorof spawning habitats connected to daily activities areas.Linking specific ecological processes (complementa-tion between two habitats, accessibility of spawninghabitat, etc.) to particular spatial analysis methodsmight provide a tool for predicting said processes usingthe quantification of spatial patterns.
Despite the remaining methodological and practicalchallenges, the GIS-based riverscape approach is aflexible framework for the study of the influence of
Managing Stream Fishes in Riverscapes 331
habitat patterns on the spatial distribution of fishesand the enhancement of the detection of areas thatmight support viable populations. The spatial analysismethods developed for fish habitat patterns might helpin evaluating impacts of habitat alteration and isolationand prioritizing preservation and restoration policies.
AcknowledgmentsDiscussions with members of the different fish teams
of the Cemagref (Antony, Lyon, Aix) and with mem-bers of IALE provided fruitful ideas to build this ap-proach. We are grateful to Evelyne Tales, SteveOrmerod, Isabelle Poudevigne, and Pierre Joly fortheir interest in this study and for their comments,which improved the manuscript. We thank W. L.Fischer and two anonymous reviewers for their enthu-siasm and very constructive comments on an earlierdraft of this manuscript. This work was supported bythe Environmental Service of Ile-de-France (DIREN) torestore the biological connectivity of the Seine Riverfor fishes and the CNRS scientific program ‘‘Piren-Seine.’’
Literature Cited
Adriaensen, F., J. P. Chardon, G. De Blust, E. Swinnen,S. Villalba, H. Gulinck, and E. Matthysen. 2003. Theapplication of ‘‘least-cost’’ modelling as a functional land-scape model. Landscape and Urban Planning 64:233–247.
Allan, J. D. 2004. Landscapes and riverscapes: The influenceof land use on stream ecosystems. Annual Review of Ecologyand Systematics 35:257–284.
Amoros, C., and G. Bornette. 2002. Connectivity and bio-complexity in waterbodies of riverine floodplains. FreshwaterBiology 47:761–776.
Baguette, M., and G. Mennechez. 2004. Resource and habitatpatches, landscape ecology and metapopulation biology: Aconsensual viewpoint. Oikos 106:399–403.
Baras, E. 1992. A study of time and space utilisation strategiesin the common barbel Barbus barbus (L.). Cahiers d’Ethologie12:125–442.
Baras, E. 1997. Environmental determinants of residence areaselection by Barbus barbus in the river Ourthe. Aquatic LivingResources 10:195–206.
Baras, E., H. Lambert, and J. C. Philippart. 1994. A compre-hensive assessment of the failure of Barbus barbus spawningmigrations through a fish pass in the canalized river Meuse(Belgium). Aquatic Living Resources 7:181–189.
Baudry, J., H. Boussard, and N. Schermann 2005. CHLOE 3.0:Freeware of multi-scales analyses on ASCII raster files.Rennes, INRA, SAD-Armorique. Available from (http://www.rennes.inra.fr/sad/tools/indexoutil.htm).
Bayley, P. B., and H. W. Li. 1992. Riverine fishes. Pages 251–281 in P. Calow, and G. E. Petts (eds.), The rivers hand-
book: Hydrological and ecological principles. Blackwell,Oxford.
Baxter, C. V. 2002. Fish movement and assemblage dynamicsin a Pacific northwest riverscape. PhD dissertation. OregonState University, Corvallis.
Boet, P., J. Belliard, R. Berrebi dit Thomas, and E. Tales.1999. Multiple human impacts by the city of Paris on fishcommunities in the Seine river basin, France. Hydrobiologia410:59–68.
Bretschko, G. 1995. River/land ecotones: Scales and patterns.Hydrobiologia 303:83–91.
Casselman, J. M., and C. A. Lewis. 1996. Habitat requirementsof northern pike (Esox lucius). Canadian Journal of Fisheriesand Aquatic Sciences 53:161–174.
Cowx, I. G., and R. L. Welcomme. 1998. Rehabilitation ofrivers for fish. Fishing News Books.
Dauble, D. D., R. L. Johnson, and A. P. Garcia. 1999. FallChinook salmon spawning in the tailraces of Lower SnakeRiver hydroelectric projects. Transactions of the AmericanFisheries Society 128:672–679.
Dennis, R. L. H., T. G. Shreeve, and H. Van Dyck. 2003.Towards a functional resource-based concept for habitat: Abutterfly biology viewpoint. Oikos 102:417–426.
Detenbeck, N. E., P. W. DeVore, G. J. Niemi, and A. Lima.1992. Recovery of temperate-stream fish communities fromdisturbance: A review of case studies and synthesis of the-ory. Environmental Management 16:33–53.
Dunning, J. B., B. J. Danielson, and H. R. Pulliam. 1992.Ecological processes that affect populations in complexlandscapes. Oikos 65:169–175.
Fausch, K. D., C. E. Torgensen, C. V. Baxter, and H. W. Li.2002. Landscapes to riverscapes: Bridging the gap betweenresearch and conservation of stream fishes. BioScience52:483–498.
Fisher, W. L., and F. J. Rahel. 2004. Geographic informationsystems applications in stream and river fisheries. Pages 49–84 in W. L. Fisher, and F. J. Rahel (eds.), Geographicinformation systems in fisheries. American Fisheries Soci-ety, Bethesda, MD.
Freeman, M. C. 1993. Effects of habitat availability on dis-persion of a stream cyprinid. Environmental Biology of Fishes37:121–130.
Frissell, C. A., W. J. Liss, C. E. Warren, and M. D. Hurley.1986. A hierarchical framework for stream habitat classifi-cation: Viewing streams in a watershed context. Environ-mental Management 10:199–214.
Gerking, S. D. 1959. The restricted movement of fish popu-lations. Biological Review 34:221–242.
Gowan, C., and K. D. Fausch. 1996. Mobile brook trout in twohigh-elevation Colorado streams: Re-evaluating the conceptof restricted movement. Canadian Journal of Fisheries andAquatic Sciences 53:1370–1381.
Gustafson, E. J. 1998. Quantifying landscape spatial pattern:What is the state of the art? Ecosystems 1:143–156.
Gustafson, E. J., and G. R. Parker. 1994. Using an index ofhabitat patch proximity for landscape design. Landscapeand Urban Planning 29:117–130.
332 C. Le Pichon and others

Hanski, I. 1994. A practical model of metapopulationdynamics. Journal of Animal Ecology 63:151–162.
Harris, G., and A. L. Heathwaite. 2005. Inadmissible evidence:Knowledge and prediction in land and riverscapes. Journalof Hydrology 304:3–19.
Hawkins, C. P., J. L. Kershner, P. A. Bisson, M. D. Bryant, L.M. Decker, S. V. Gregory, D. A. Mccullough, C. K. Overton,G. H. Reeves, R. J. Steedman, and M. K. Young. 1993. Ahierarchical approach to classifying stream habitat features.Fisheries 18:3–12.
He, H. S., B. E. DeZonia, and D. J. Mladenoff. 2000. Anaggregation index (AI) to quantify spatial patterns oflandscapes. Landscape Ecology 15:591–601.
Hilderbrand, R. H., A. D. Lemly, and C. A. Dolloff. 1999.Habitat sequencing and the importance of discharge ininferences. North American Journal of Fisheries Management19:198–202.
Hirzel, A., and A. Guisan. 2002. Which is the optimal sam-pling strategy for habitat suitability modelling. EcologicalModelling 157:331–341.
Huber, M., and A. Kirchhofer. 1998. Radio telemetry as a toolto study habitat use of nase (Chondrostoma nasus L.) inmedium-sized rivers. Hydrobiologia 372:309–319.
Jochem, R., B. J. H. Koolstra, and J. P. Chardon. 2002.LARCH: An ecological application of GIS in riverstudies. Pages 63–74 in R. S. E. W. Leuven, I. Pou-devigne, and R. M. Teew (eds.), Application of geo-graphic information systems and remote sensing inriver studies. Backhuys Publishers, Leiden, The Neth-erlands.
Johnson, L. B., and S. H. Gage. 1997. Landscape approachesto the analysis of aquatic ecosystems. Freshwater Biology37:113–132.
Johnston, C. E. 2000. Movement patterns of imperiled blueshiners (Pisces : Cyprinidae) among habitat patches. Ecologyof Freshwater Fish 9:170–176.
Joly, P., C. Morand, and A. Cohas. 2003. Habitat fragmenta-tion and amphibian conservation: Building a tool forassessing landscape matrix connectivity. Comptes Rendus Bi-ologies 326:132–139.
Kelly, N. M., D. Field, F. A. Cross, and R. Emmet. 1998. Re-mote sensing of forest-clearing effects on essential fishhabitat of Pacific salmon. Pages 252–267 in L. R. Benaka(ed.), Fish habitat: Essential Fish. American FisheriesSociety, Bethesda, MD.
Knaapen, J. P., M. Scheffer, and B. Harms. 1992. Estimatinghabitat isolation in landscape planning. Landscape andUrban Planning 23:1–16.
Kocik, J. F., and C. P. Ferreri. 1998. Juvenile production var-iation in salmonids: Population dynamics, habitat, and therole of spatial relationships. Canadian Journal of Fisheries andAquatic Sciences 55:191–200.
Kotliar, N. B., and J. A. Wiens. 1990. Multiple scales ofpatchiness and patch structure: A hierarchical frameworkfor the study of heterogeneity. Oikos 59:253–260.
Leuven, R. S. E. W., and I. Poudevigne. 2002. Riverine land-scape dynamics and ecological risk assessment. FreshwaterBiology 47:845–865.
Leuven, R. S. E. W., I. Poudevigne, and R. M. Teeuw. 2002.Remote sensing and geographic information systems asemerging tools for riverine habitat and landscape evalua-tion: From concepts to models. Pages 63–74 in R. S. E. W.Leuven, I. Poudevigne, and R. M. Teew (eds.), Applicationof geographic information systems and remote sensingin river studies. Backhuys Publishers, Leiden, TheNetherlands.
Lonzarich, D. G., M. L. Warren, and M. R. E. Lonzarich. 1998.Effects of habitat isolation on the recovery of fish assem-blages in experimentally defaunated stream pools inArkansas. Canadian Journal of Fisheries Aquatic Science55:2141–2149.
Lowe, W. H. 2002. Landscape-scale spatial populationdynamics in human-impacted stream systems. EnvironmentalManagement 30:225–233.
Lucas, M. C., and E. Baras. 2001. Migration of freshwaterfishes. Blackwell Science, Oxford.
Lucas, M. C., and E. Batley. 1996. Seasonal movements andbehaviour of adult barbel Barbus barbus, a riverine cyprinidfish: Implications for river management. Journal of AppliedEcology 33:1345–1358.
MacGarigal, K., and B. J. Marks. 1995. FRAGSTATS: Spatialpattern analysis program for quantifying landscape struc-ture. General Technical Report PNW-351, USDA ForestService, Corvallis, OR.
Meaden, G. J. 2004. Challenges of using geographic infor-mation systems in aquatic environments. Pages 13–48 inW. L. Fisher, and F. J. Rahel (eds.), Geographic informa-tion systems in fisheries. American Fisheries Society, Beth-esda, MD.
Mertes, L. A. K. 2002. Remote sensing of riverine landscapes.Freshwater Biology 47:799–816.
Metzger, J.-P., and H. Decamps. 1997. The structural con-nectivity threshold: An hypothesis in conservation biologyat the landscape scale. Acta Oecologica 18:1–12.
Morita, K., and S. Yamamoto. 2002. Effects of habitat frag-mentation by damming on the persistence of stream-dwelling charr populations. Conservation Biology 16:1318–1323.
Muller, E. 1997. Mapping riparian vegetation along rivers:Old concepts and new methods. Aquatic Botany 58:411–437.
O’Neill, R. V., J. R. Krummel, R. H. Gardner, G. Sugihara,B. Jackson, D. L. DeAngelis, B. T. Milne, M. G. Turner, B.Zygmunt, S. W. Christensen, V. H. Dale, and R. L. Graham.1988. Indices of landscape pattern. Landscape Ecology 1:153–162.
Pain, G., J. Baudry, and F. Burel. 2000. LandPop: Un outild’etude de la structure spatiale des populations animalesfragmentees. Geomatique 10:89–106.
Pedroli, B., G. de Blust, K. Looy, and S. van Rooij. 2002.Setting targets in strategies for river restoration. LandscapeEcology 17:5–18.
Petts, G. E., and C. Amoros. 1996. Fluvial hydrosystems.Chapman & Hall, London.
Plotnick, R. E., R. H. Gardner, and R. V. O’Neill. 1993. La-cunarity indices as measures of landscape texture. Land-scape Ecology 8:201–211.
Managing Stream Fishes in Riverscapes 333
Poizat, G., and D. Pont. 1996. Multi-scale approach to species-habitat relationships: Juvenile fish in a large river section.Freshwater Biology 36:611–622.
Poole, G. C. 2002. Fluvial landscape ecology: Addressinguniqueness within the river discontinuum. Freshwater Biology47:641–660.
Pretty, J. L., S. C. Harrison, D. J. Shepherd, C. Smith,A. G. Hildrew, and R. D. Hey. 2003. River rehabilitation andfish populations: Assessing the benefit of instream struc-tures. Journal of Applied Ecology 40:251–265.
Pringle, C. M., R. J. Naiman, G. Bretschko, J. R. Karr, M. W.Oswood, J. R. Webster, R. L. Welcomme, and M. J.Winterbourn. 1988. Patch dynamics in lotic systems: Thestream as a mosaic. Journal of North American BenthologicalSociety 7:503–524.
Puestow, T. M., A. Simms, and K. Butler. 2001. Mapping ofsalmon habitat parameters using airborne imagery anddigital ancillary data. Photogrammetric Engineering & RemoteSensing 67:309–317.
Rabeni, C. F., and R. B. Jacobson. 1993. The importance offluvial hydraulics to fish-habitat restoration in low-gradientalluvial streams. Freshwater Biology 29:211–220.
Rabeni, C. F., and S. P. Sowa. 2002. A landscape approach tomanaging the biota of streams and rivers. Pages 114–142 inJ. Liu, and W. Taylor (eds.), Integrating landscape ecologyinto natural resource management. Cambridge UniversityPress, Cambridge.
Ray, N., A. Lehmann, and P. Joly. 2002. Modeling spatialdistribution of amphibian populations: A GIS approachbased on habitat matrix permeability. Biodiversity and Con-servation 11:2143–2165.
Richards, K., J. Brasington, and F. Hughes. 2002. Geo-morphic dynamics of floodplains: Ecological implicationsand a potential modelling strategy. Freshwater Biology47:559–579.
Rubec, P. J., M. S. Coyne, R. H. McMichael, Jr., and M. E.Monaco. 1998. Spatial methods being developed in Floridato determine essential fish habitat. Fisheries 23:21–25.
Rushton, S. P., P. W. W. Lurz, R. Fuller, and P. J. Garson.1997. Modelling the distribution of the red and greysquirrel at the landscape scale: A combined GIS and pop-ulation dynamics approach. Journal of Applied Ecology34:1137–1154.
Saad, Y., and M. Sosonkina. 1999. Distributed schur comple-ment techniques for general sparse linear systems. Journalof Science Computing 21:1337–1356.
Schermann, N., and J. Baudry. 2002. Analyse descriptivemulti-echelle de la structure d’un paysage: Application a lamosaıque d’occupation du sol d’un territoire agricole dansle bocage breton. Geomatique 12:169–186.
Schiemer, F., and H. Waidbacher. 1992. Strategies for con-servation of a danubian fish fauna. Pages 363–382 in P. J.Boon, P. Calow, and G. E. Petts (eds.), River conservationand management. John Wiley & Sons, Chichester.
Schiemer, F., M. Zalewski, and J. E. Thorpe. 1995. Land/inland water ecotones: Intermediate habitats critical forconservation and management. Hydrobiologia 303:259–264.
Schilling, K. E., and C. F. Wolter. 2000. Application of GPSand GIS to map channel features in Walnut Creek, Iowa.Journal of American Water Resources Association 36:1423–1434.
Schlosser, I. J. 1991. Stream fish ecology: A landscape per-spective. BioScience 41:704–712.
Schlosser, I. J. 1995. Critical landscape attributes that influ-ence fish population dyamics in headwater streams. Hyd-robiologia 303:71–81.
Schneider, D. C. 2001. The rise of the concept of scale inecology. BioScience 51:545–553.
Smith, C. 1991. Social behaviour, homing and migration.Pages 509–529 in I. J. Winfield, and J. S. Nelson (eds.),Cyprinid fishes: Systematics, biology and exploitation.Chapman & Hall, London.
Smithson, E. B., and C. E. Johnston. 1999. Movement patternsof stream fishes in a Ouachita Highlands stream: Anexamination of the restricted movement paradigm. Trans-actions of the American Fisheries Society 128:847–853.
Spruell, P., B. E. Rieman, K. L. Knudsen, F. M. Utter, andF. W. Allendorf. 1999. Genetic population structure withinstreams: Microsatellite analysis of bull trout populations.Ecology of Freshwater Fish 8:114–121.
Srivastava, S. K., U. K. Sarkar, and A. G. Ponniah. 2001.Arrangement of habitat information on a GIS platform toidentify optimum and degraded areas of golden mahseer(Tor putitora, Hamilton) habitat. Pages 302–314 inT. Nishida, P. J. Kailola, and C. E. Hollingworth (eds.),Proceeding of the first international symposium on geo-graphic information systems (GIS) in Fishery Science.Fishery GIS Research Group, Saitama, Japan.
Suarez-Seoane, S., and J. Baudry. 2002. Scale dependence ofspatial patterns and cartography on the detection of land-scape change: Relationships with species’ perception.Ecography 25:499–511.
Tiffan, K. F., R. D. Garland, and D. W. Rondorf. 2002.Quantifying flow-dependent changes in subyearling fallchinook salmon rearing habitat using two-dimensionalspatially explicit modeling. North American Journal of FisheriesManagement 22:713–726.
Toepfer, C. S., W. L. Fischer, and W. D. Warde. 2000. Amultistage approach to estimate fish abundance in streamsusing geographic information systems. North AmericanJournal of Fisheries Management 20:634–645.
Torgersen, C. E. 2002. A geographical framework for assess-ing longitudinal patterns in stream habitat and fish distri-bution. PhD, Oregon State University.
Townsend, C. R. 1989. The patch dynamics concept of streamcommunity ecology. Journal of North American BenthologicalSociety 8:36–50.
Vos, C., J. Verboom, P. F. M. Opdam, and C. J. F. TerBraak.2001. Toward ecologically scaled landscape indices. Ameri-can Naturalist 157:24–41.
Vuilleumier, S., and R. Prelaz-Droux. 2002. Map of ecologicalnetworks for landscape planning. Landscape and UrbanPlanning 58:157–170.
Ward, J. V. 1998. Riverine landscapes: Biodiversity patterns,disturbance regimes, and aquatic conservation. BiologicalConservation 83:269–278.
334 C. Le Pichon and others

Ward, J. V., and J. A. Stanford. 1995. The serial discontinuityconcept: Extending the model to floodplain rivers. Regu-lated River: Research and Management 10:159–168.
Ward, J. V., F. Malard, and K. Tockner. 2002. Landscapeecology: A framework for integrating pattern and processin river corridors. Landscape Ecology 17:35–45.
Watzin, M. C., and A. W. McIntosh. 1999. Aquatic ecosystemsin agricultural landscapes: A review of ecological indicatorsand achievable ecological outcomes. Journal of Soil andWater Conservation 54:636–644.
Whited, D., J. A. Stanford, and J. S. Kimball. 2002. Applicationof airborne multispectral digital imagery to quantify river-ine habitats at different base flows. River Research andApplications 18:583–594.
Wiens, J. A. 2002. Riverine landscapes: Taking landscapeecology into the water. Freshwater Biology 47:501–515.
Wu, J. G., and O. L. Loucks. 1995. From balance of nature tohierarchical patch dynamics: A paradigm shift in ecology.Quarterly Review of Biology 70:439–466.
Managing Stream Fishes in Riverscapes 335
Copyright © 2022 FDOKUMEN