A SNP based linkage map of the turkey genome reveals multiple intrachromosomal rearrangements...
11
RESEARCH ARTICLE Open Access A SNP based linkage map of the turkey genome reveals multiple intrachromosomal rearrangements between the Turkey and Chicken genomes Muhammad L Aslam 1* , John WM Bastiaansen 1 , Richard PMA Crooijmans 1 , Addie Vereijken 2 , Hendrik-Jan Megens 1 , Martien AM Groenen 1 Abstract Background: The turkey (Meleagris gallopavo) is an important agricultural species that is the second largest contributor to the world’s poultry meat production. The genomic resources of turkey provide turkey breeders with tools needed for the genetic improvement of commercial breeds of turkey for economically important traits. A linkage map of turkey is essential not only for the mapping of quantitative trait loci, but also as a framework to enable the assignment of sequence contigs to specific chromosomes. Comparative genomics with chicken provides insight into mechanisms of genome evolution and helps in identifying rare genomic events such as genomic rearrangements and duplications/deletions. Results: Eighteen full sib families, comprising 1008 (35 F1 and 973 F2) birds, were genotyped for 775 single nucleotide polymorphisms (SNPs). Of the 775 SNPs, 570 were informative and used to construct a linkage map in turkey. The final map contains 531 markers in 28 linkage groups. The total genetic distance covered by these linkage groups is 2,324 centimorgans (cM) with the largest linkage group (81 loci) measuring 326 cM. Average marker interval for all markers across the 28 linkage groups is 4.6 cM. Comparative mapping of turkey and chicken revealed two inter-, and 57 intrachromosomal rearrangements between these two species. Conclusion: Our turkey genetic map of 531 markers reveals a genome length of 2,324 cM. Our linkage map provides an improvement of previously published maps because of the more even distribution of the markers and because the map is completely based on SNP markers enabling easier and faster genotyping assays than the microsatellitemarkers used in previous linkage maps. Turkey and chicken are shown to have a highly conserved genomic structure with a relatively low number of inter-, and intrachromosomal rearrangements. Background The turkey (Meleagris gallopavo, MGA) is an important agricultural species that is largely used as a meat type bird. In 2008, turkey represented 6.65% of the world poultry meat production [1]. The world-wide turkey population has rapidly grown due to increased commer- cial farming. Global turkey stocks nearly tripled from 178 million in 1970 to over 482 million in 2008. Over the same time period, the production volume increased more than fivefold from 1.2 to 6.1 million tons [1]. The turkey genome consists of 39 pairs of autosomes and 1 pair of sex chromosomes [2]. The predicted size of the turkey genome is 1.1 billion bases on the turkey genome build UMD 2.01 which is based on sequences from a combination of two next generation sequencing platforms, Roche 454 and Illumina GAII with 5× and 25× coverage respectively. Limited information is avail- able on the turkey linkage and physical map although a small number of low resolution linkage maps using microsatellite markers [2,3] have been published. Link- age maps of chicken on the other hand are more abun- dant and have generally used larger numbers of markers [4-10]. Comparative cytogenetic and linkage maps between turkey and chicken showed conserved synteny and close ancestral relation among these species [2,3] * Correspondence: [email protected] 1 Animal Breeding and Genomics Centre, Wageningen University,6709PG, Wageningen, The Netherlands Full list of author information is available at the end of the article Aslam et al. BMC Genomics 2010, 11:647 http://www.biomedcentral.com/1471-2164/11/647 © 2010 Aslam et al; licensee BioMed Central Ltd. This is an Open Access article distributed under the terms of the Creative Commons Attribution License (http://creativecommons.org/licenses/by/2.0), which permits unrestricted use, distribution, and reproduction in any medium, provided the original work is properly cited.
-
Upload
independent -
Category
Documents
-
view
0 -
download
0
Transcript of A SNP based linkage map of the turkey genome reveals multiple intrachromosomal rearrangements...
RESEARCH ARTICLE Open Access
A SNP based linkage map of the turkey genomereveals multiple intrachromosomal rearrangementsbetween the Turkey and Chicken genomesMuhammad L Aslam1*, John WM Bastiaansen1, Richard PMA Crooijmans1, Addie Vereijken2,Hendrik-Jan Megens1, Martien AM Groenen1
Abstract
Background: The turkey (Meleagris gallopavo) is an important agricultural species that is the second largestcontributor to the world’s poultry meat production. The genomic resources of turkey provide turkey breeders withtools needed for the genetic improvement of commercial breeds of turkey for economically important traits.A linkage map of turkey is essential not only for the mapping of quantitative trait loci, but also as a framework toenable the assignment of sequence contigs to specific chromosomes. Comparative genomics with chickenprovides insight into mechanisms of genome evolution and helps in identifying rare genomic events such asgenomic rearrangements and duplications/deletions.
Results: Eighteen full sib families, comprising 1008 (35 F1 and 973 F2) birds, were genotyped for 775 singlenucleotide polymorphisms (SNPs). Of the 775 SNPs, 570 were informative and used to construct a linkage map inturkey. The final map contains 531 markers in 28 linkage groups. The total genetic distance covered by theselinkage groups is 2,324 centimorgans (cM) with the largest linkage group (81 loci) measuring 326 cM. Averagemarker interval for all markers across the 28 linkage groups is 4.6 cM. Comparative mapping of turkey and chickenrevealed two inter-, and 57 intrachromosomal rearrangements between these two species.
Conclusion: Our turkey genetic map of 531 markers reveals a genome length of 2,324 cM. Our linkage mapprovides an improvement of previously published maps because of the more even distribution of the markers andbecause the map is completely based on SNP markers enabling easier and faster genotyping assays than themicrosatellitemarkers used in previous linkage maps. Turkey and chicken are shown to have a highly conservedgenomic structure with a relatively low number of inter-, and intrachromosomal rearrangements.
BackgroundThe turkey (Meleagris gallopavo, MGA) is an importantagricultural species that is largely used as a meat typebird. In 2008, turkey represented 6.65% of the worldpoultry meat production [1]. The world-wide turkeypopulation has rapidly grown due to increased commer-cial farming. Global turkey stocks nearly tripled from178 million in 1970 to over 482 million in 2008. Overthe same time period, the production volume increasedmore than fivefold from 1.2 to 6.1 million tons [1].
The turkey genome consists of 39 pairs of autosomesand 1 pair of sex chromosomes [2]. The predicted sizeof the turkey genome is 1.1 billion bases on the turkeygenome build UMD 2.01 which is based on sequencesfrom a combination of two next generation sequencingplatforms, Roche 454 and Illumina GAII with 5× and25× coverage respectively. Limited information is avail-able on the turkey linkage and physical map although asmall number of low resolution linkage maps usingmicrosatellite markers [2,3] have been published. Link-age maps of chicken on the other hand are more abun-dant and have generally used larger numbers of markers[4-10]. Comparative cytogenetic and linkage mapsbetween turkey and chicken showed conserved syntenyand close ancestral relation among these species [2,3]
* Correspondence: [email protected] Breeding and Genomics Centre, Wageningen University,6709PG,Wageningen, The NetherlandsFull list of author information is available at the end of the article
Aslam et al. BMC Genomics 2010, 11:647http://www.biomedcentral.com/1471-2164/11/647
© 2010 Aslam et al; licensee BioMed Central Ltd. This is an Open Access article distributed under the terms of the Creative CommonsAttribution License (http://creativecommons.org/licenses/by/2.0), which permits unrestricted use, distribution, and reproduction inany medium, provided the original work is properly cited.

and support the hypothetical ancestral Galliform karyo-type [11]. Chromosome banding and zoo-FISH withchromosome paints for the turkey and chicken chromo-somes have suggested that chicken and turkeykaryotypes are distinguished by at least two interchro-mosomal rearrangements [2,12,13]. Chicken chromo-some 2 and 4 are represented by turkey chromosomes 3and 6 and by turkey chromosomes 4 and 9 respectively[2,3,13].Chromosome studies have revealed that the karyotype
is more conserved among avian lineages than it isamong other groups, such as mammals, with most avianspecies showing a diploid chromosome number between76 and 80 http://www.genomesize.com. This suggeststhat chromosomal evolution or large-scale rearrange-ments affecting chromosome number occur at a lowrate in birds and as a result many chromosomes haveremained more or less intact during avian evolution[14]. Chicken chromosome specific probes have beenused for in situ hybridization onto metaphase spreads ofother birds and revealed an overall picture of a highdegree of chromosomal homology between chicken andrepresentatives from many avian orders [15]. Hybridiza-tion results also indicated that interchromosomal rear-rangements have been rare during avian evolution[16,17].A linkage map is essential for the mapping of quanti-
tative trait loci (QTL) and very useful for the assemblyof genome sequence and subsequently mapping of genesalong the chromosomes. A high-resolution linkage mapfacilitates fine mapping of quantitative trait loci (QTLs)and can be produced because of the abundance of SNPswithin the genome [18]. SNP based genotyping is pre-ferred because it is highly accurate, quick and auto-mated, using limited human intervention. Increasing themarker density of the linkage map further enables theanalyses of genomic sequences associated with highrecombination rates [9].The present study was designed to develop a SNP
based linkage map in turkey and to detect genomic rear-rangements between turkey and chicken.
MethodsExperimental populationParents were randomly selected from two different linesto produce F1 offspring. Ten parent males were ran-domly selected from a line that was selected for highgrowth and ten parent females were randomly selectedfrom a line that was selected for high reproduction.Average body weight of males in the high growth linefrom which ten parent males were randomly selectedwas 20.6 Kg at 20 weeks of age and the average egg pro-duction of females in high reproduction line from whichten parent females were randomly selected was 115.5
hatching eggs/24 weeks. An F2 generation of 18 full sibfamilies was produced by crossing 17 randomly selectedF1 males and 18 randomly selected F1 females. Onemale was mated with two females, other F1 parentswere mated only once. In total, 973 F2 offspring wereproduced with an average full sib family size of 54.1with a range from 31-90 individuals. All families wereused for the SNPs genotyping to construct linkage mapsof different chromosomes.
DNA isolationGenomic DNA was isolated from blood samples col-lected in 10% EDTA using either the automated nucleicacid extraction CAS-1820 X-tractor Gene (Corbett LifeScience), or the manual nucleic acid extraction usingGentra Puregene Blood Kit (Qiagen) following manufac-turer’s protocol with minor modifications.DNA concentrations were measured using ND-1000
Spectrophotometer (NanoDrop) and diluted to therequired concentration of 50 hg μL-1.
SNP selectionPreviously, we identified 11,287 SNPs in turkey bysequencing reduced representation libraries on an Illu-mina GA sequencer [19]. To achieve an even spacing ofSNPs across the 40 turkey chromosomes while a turkeygenome sequence was not available, SNPs in turkeywere selected based on their orthologous position onthe chicken genome sequence (WASHUC2 build, May2006). Currently the chicken genome [20] covers 30of the 39 chromosomes in chicken which comprisesapproximately 95% of chicken genome. By thisapproach, we did not select SNPs in parts of the turkeygenome that are syntenic to genomic regions in chickenthat are currently not represented in the chicken gen-ome assembly. Assembled turkey short read contigsfrom Kerstens et al. [19] that contained SNPs weremapped on the chicken genome. Short read contigs inthe size range of 50-100 bp were mapped using Mega-blast [21] and short read contigs of 100 bp and longerwere mapped using BlastZ [22] with contig alignmentcriteria of at least 80% alignment and at least 60%sequence identity. In total 6,537 SNPs could be assigneda syntenic location on the chicken genome. In additionto chicken genome location, the final selection criteriafor SNPs also included the Illumina design score andthe estimated minor allele frequency based on the Illu-mina sequences from Kerstens et al [19]. The distance(in bps) between the selected SNPs was varied based onthe size of the chromosome, because of the higherrecombination frequency on the microchromosomes ofbirds. Chicken chromosomes were divided into threegroups; 1-10 + Z, 11-19 and 20-28 + LGE22 and theaverage SNP spacing chosen for these three groups was
Aslam et al. BMC Genomics 2010, 11:647http://www.biomedcentral.com/1471-2164/11/647
Page 2 of 11
1.4-1.9 SNP per Mb, 0.7-1.0 SNP per Mb and 0.4-0.6SNP per Mb respectively.In addition, seven SNPs derived from 5 different tur-
key genes i.e. Pit1, AFABP, PRKAG3, IGF2 and GDF8were also used.
GenotypingTwo 384-plex GoldenGate oligo pool assay (OPA) setswere designed for genotyping using VeraCode technol-ogy on an Illumina BeadXpress Reader. The GoldenGateassay was performed according to manufacturer’s proto-col and as described in Fan et al. [23] and Hyten et al.[24]. Automated genotype clustering and calling wasperformed with GenomeStudio™data analysis software(Illumina). All genotype calling results were manuallychecked and any obvious errors in calling the homozy-gous or heterozygous clusters were corrected.SNPs selected from the 5 turkey genes (Pit1, AFABP,
PRKAG3, IGF2 and GDF8) were genotyped with an ABISNaPshot assay and analyzed on an ABI 3730 DNAAnalyzer (Additional file 1).
Genetic Linkage analysisGenotyping data was filtered by removing uninformativemarkers, markers giving Mendelian errors in more thanone families and markers with low call rate as describedby Groenen et al. [9]. The modified CRI-MAP softwareversion 2.4 [25] by Xuelu Liu (Monsanto), which canhandle much larger numbers of markers segregating incomplex pedigrees was utilized for the linkage analysis.Map building was performed step by step using
AUTOGROUP, BUILD, CHROMPIC, FLIPSN, andFIXED options of CRI-MAP according to the proceduresused by Stapley et al. [26] and Elferink et al. [10]. UsingAUTOGROUP, parameter layers utilized for getting link-age groups were as follows: layer 1 (20, 0, 2, 0.3); layer 2(20, 0, 20, 0.3); layer 3 (10, 0, 20, 0.3) and layer 4 (5, 0, 20,0.3). Layer 4 had minimum stringency with likelihoodratio (LOD score) >5, 0 times the average number ofmeiosis, shared linkages with not more than 20 groupsand with 0.3 of minimum linkage ratio [25]. Linkagegroups were assigned to specific turkey chromosomesusing the already known physical positions of turkeySNPs in the chicken genome and comparative informa-tion from the cytogenetic study of Griffin et al. [2] onturkey and chicken. Turkey chromosome names wereassigned using the nomenclature used by Griffin et al. [2].Maps are reported as sex averaged maps unless other-
wise indicated and map figures were drawn with theMapChart software version 2.2 [27].
Comparative genetic analysisThe order of SNPs on our linkage map was compared tothe expected order based on the turkey and chicken
genome assemblies UMD 2.01 and WASHUC2, respec-tively. Positions on the chicken genome were obtainedearlier in the SNP selection step. Positions on the turkeygenome were obtained by aligning SNP flankingsequences (< 1.0 × E-4 ) using BLAST with megablastoption [28] against the turkey reference genomesequence (UMD 2.01).The turkey physical map order of SNPs was used to
validate the linkage map order with CRI-MAP using theBUILD option. The order of SNPs in linkage maps wasmodified if the physical map order had a higher likeli-hood and total chromosome map length was smallerthan the linkage map order. The genetic distancebetween the terminal markers of every chromosomefrom the turkey linkage map was compared to thegenetic distance between the corresponding positions ofthe chicken genome. First, the sequence positions (bp)of these terminal turkey markers were found on thechicken physical map. Second, chicken markers weretaken from the study of Elferink et al. [10] at the closestposition (bp) to these sequence positions (bp). Finallythe genetic distance between these chicken markers wascalculated and compared to the turkey map length.
Analysis of recombination rate and sequencemotif densitiesThe physical distance (Mb) on turkey chromosomes wascalculated between the first and the last SNP of the link-age map using the blastall option in BLAST [28]. Num-ber of Mb covered by the linkage map (cM) was used tocalculate recombination rate (cM/Mb) for every turkeychromosome which was compared to the physical size(Mb) of the chromosomes [9,26]. The recombinationrates (cM/Mb) were also compared to those for thechicken chromosomes described by Elferink et al. [10].Densities of sequence motifs/elements CCCCCCC,
CCTCCCT, CTCTCCC, CpG and CTCF consensussequence CCNCCNGGNGG were found to vary withchromosome in chicken [9], therefore we also calculatedthese densities for each turkey chromosome from theturkey genome sequence (UMD 2.01). Only the part ofthe chromosome sequence covered by the linkage mapwas used to calculate these densities. Number of ele-ments per Mb was calculated and compared againstchromosome length (cM) except for CpG that was com-pared against cM/Mb [9].
Ethical approval for the use of animals in this studyAlthough animals were used in this experimental work,no direct experiments were performed on them. Bloodsample collection was carried out by licensed andauthorized personnel under approval of Hendrix Genet-ics. No approval from the ethics committee wasnecessary.
Aslam et al. BMC Genomics 2010, 11:647http://www.biomedcentral.com/1471-2164/11/647
Page 3 of 11
ResultsGenotyping resultsGenotyping call rates with an average of 0.80 wereobtained. In total, 775 SNPs (2× 384-plex GoldenGate +7 additional SNPs) were selected for genotyping and outof these, 98 SNP assays failed (missing genotypes in thewhole population), 80 SNPs appeared to be mono-morphic (AA, or BB genotype) or positive for parolo-gous sequences (all genotypes AB), 13 SNPs showednon-Mendelian inheritance in more than one family and14 SNPs had zero informative meiosis. In total 205SNPs were removed from the dataset.
Linkage mapsAfter filtering of genotyping data, 570 SNP markerswere left for the linkage analysis. Of the total 570 mar-kers that met all quality criteria, 531 markers werefound significantly linked which were subsequentlyinserted at their most likely position (BUILD option,LOD > 3) on one of 28 linkage groups that subsequentlywere assigned to 27 autosomes and the Z chromosome(Table 1). The number of informative meiosis for a mar-ker varied from 7 to 666 with an average of 255. Thelargest chromosome, MGA1, had a map with 81 SNPsand a map size of 325.8 cM, followed by MGA2 with 55SNPs and a map size of 229 cM. The chromosomesMGA25 and MGA30 had the lowest number of SNPs (4each) as well as the smallest map sizes with map lengthsof 23.5 and 6.3 cM respectively (Table 1). The totallength of the sex average map (excluding the Z chromo-some) was 2,165 cM and the average marker spacingwas 4.4 cM. Sex specific analysis showed a difference inthe male and the female maps. For 70% of chromo-somes, male maps were longer than female maps, exceptfor chromosomes MGA10, 11, 15, 16, 23, 25, 26 andMGA28 where the female maps were longer (Table 1).In general, a difference in length of 9% was observedbetween sex specific maps.
Comparative genetic resultsMarker orderFor all except three of the turkey chromosomes thecomparison of the linkage and the physical maps didnot reveal any differences. For the three chromosomes,MGA2, 11 and 17, the marker order from the physicalmaps, showed a higher likelihood and a smaller mapdistance than the marker order obtained from our link-age analyses. Log likelihood values for MGA2, 11 and17 were increased by 20.6, 98.6 and 0.7 and map dis-tance reduced by 4.0, 17.0 and 1.3 cM respectively. Forthese three chromosomes the marker order based onthe physical map was used in further analyses.Marker orders were found to be highly conserved
between the turkey linkage and the chicken physical
maps although 57 rearrangements were still detectedbetween these species. The order of the SNP markerson chromosomes MGA14, 21, 25, 26 and MGAZ evenshowed 100% accordance with the order in the syntenicchicken chromosomes (Additional file 2).The linkage maps for the turkey and the chicken chro-
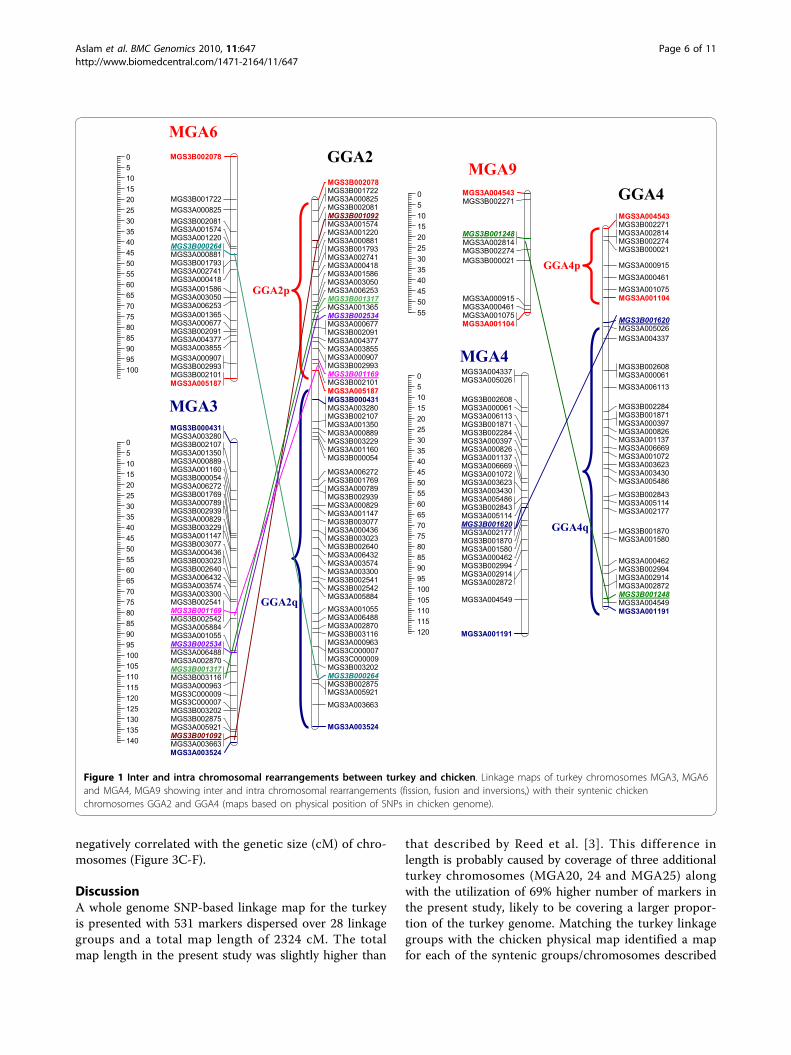
mosomes generally showed small differences in theirlengths. Three exceptions are turkey chromosomesMGA1, MGA7 and MGAZ that showed a difference ofmore than 25 cM with their syntenic chicken chromo-somes GGA1 GGA7 and GGAZ. Whole genome geneticmap size of chicken was 72.5 cM larger than the wholegenome genetic map size of turkey. In the comparisonsof genetic lengths of turkey and chicken chromosomes,the difference in the reference genome positions (bp) ofturkey SNPs genotyped in the present study and thegenome positions (bp) of chicken SNPs used inthe study by Elferink et al. [10] were small. On averagethe distance between the reference positions was 58,614bp which will have caused an average difference of 0.28cM/chromosome based on the average figure of 4.8 cMper Mb in Turkey. The total physical map size of turkeycovered by markers genotyped in this study was 939.4Mb. This is smaller than the region of the chicken phy-sical map covered by the turkey genetic map which is1146.5 Mb (Table 1).RearrangementsTwo interchromosomal and 57 intrachromosomal rear-rangements were observed between turkey and chicken(Figure 1). Two linkage groups, MGA3 and MGA6 wereobtained from the SNPs selected with syntenic positionson chicken chromosome 2 and similarly two linkagegroups, MGA4 and 9 were obtained from the SNPsselected from chicken chromosome 4 (Figure 1). Thesechromosomes (MGA3, 6 and MGA4, 9 Vs GGA2 andGGA3 respectively) did not only show interchromoso-mal rearrangements, but also showed multiple intra-chromosomal rearrangements between turkey andchicken (Figure 1).Regions with inverted marker order were observed on
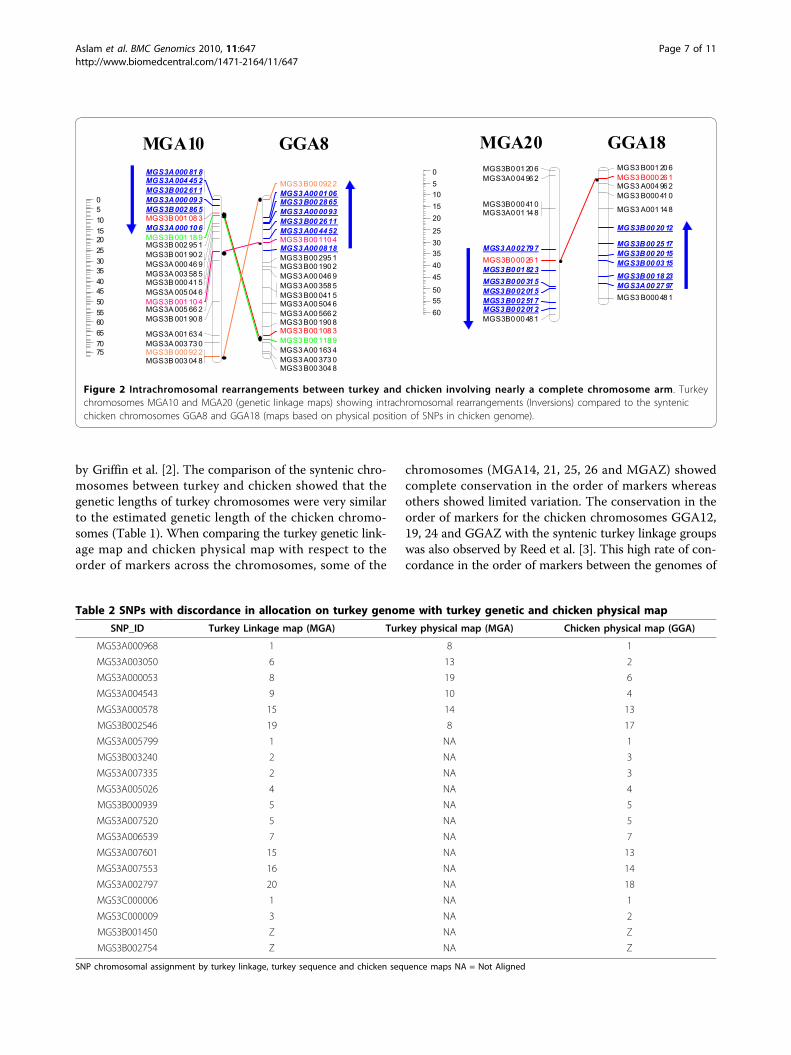
turkey chromosomes 10 and 20 when compared to theirsyntenic chicken chromosomes GGA8 and GGA18(Figure 2). Other complex intrachromosomal rearrange-ments were also observed on turkey chromosome 1, 2,5, 8, 11, 12, 13, 15, 16, 17, 19, 22, and 28 when com-pared to their syntenic chicken chromosomes (Addi-tional Files 2 &3).The number of rearrangements per Mb varied consid-
erably for different chromosomes. The average numberof rearrangements per Mb for larger chromosomes(MGA1-MGA10) was 0.06, ranging from 0.01-0.13 withhighest rate of rearrangements of 0.13 per Mb onMGA10. The average number of rearrangements perMb for the smaller chromosomes (MGA11-MGA30)
Aslam et al. BMC Genomics 2010, 11:647http://www.biomedcentral.com/1471-2164/11/647
Page 4 of 11
was 0.11, ranging from 0.08 - 0.42 with highest rate ofrearrangements of 0.42 per Mb on MGA12.Comparative analysis of the turkey linkage, the turkey
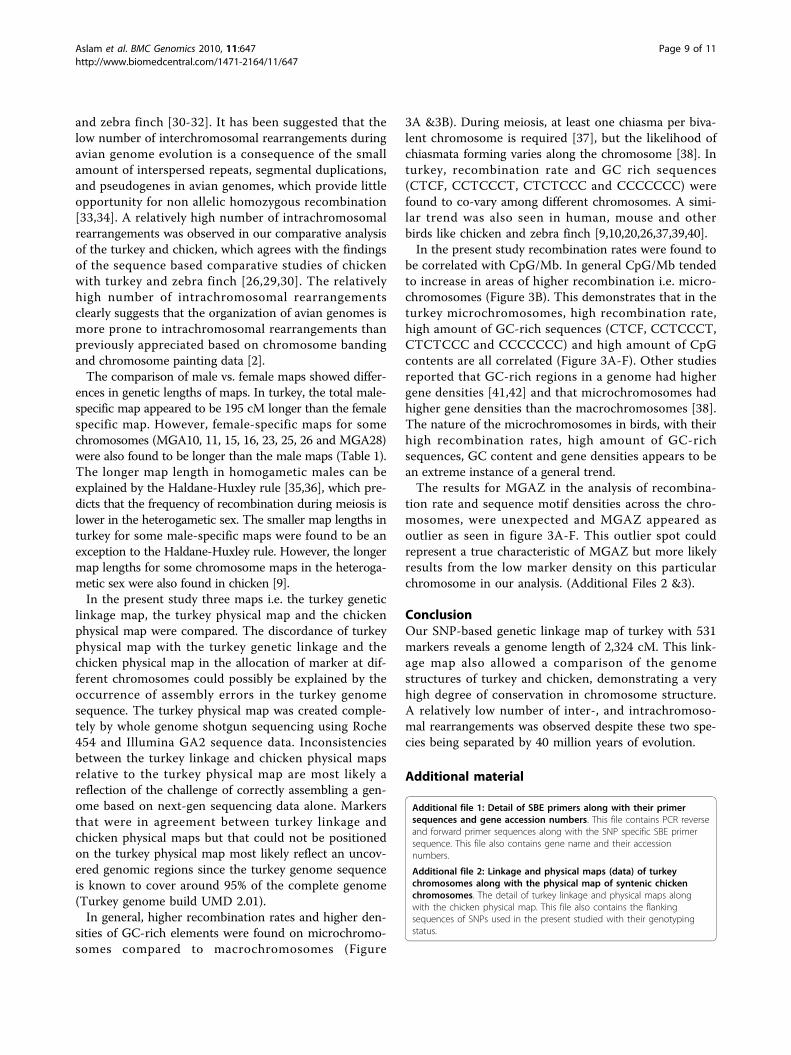
physical and the chicken physical maps showed discor-dance in the chromosomal allocation of 6 SNPs to thesemaps (Table 2). The turkey linkage and the chickenphysical maps agreed with each other in the chromoso-mal allocation of these 6 SNPs while the turkey physicalmap disagreed. For example, according to theturkey linkage and chicken physical maps the SNPMGS3A000968 was assigned to MGA1 and GGA1 whilethis SNP was positioned on MGA8 in the turkey physi-cal map (Table 2). Fourteen SNPs could not be assignedto any position on the turkey physical map while theallocation of these 14 SNPs to the turkey linkage map
and the chicken physical map also agreed with eachother (Table 2).
Recombination rate and sequence elementsRecombination rate of turkey chromosomes varied from1.6 to 17.2 cM/Mb. The physical length of chromosomesshowed an inverse relation with recombination rate whileCpG/Mb density across the chromosome showed a directrelation. Turkey and chicken chromosomes of smallersizes showed higher recombination rates than chromo-somes with larger sizes (Figure 3A). CpG content showedincreasing values with increasing recombination rate, i.e.higher CpG content in smaller chromosomes (Figure 3B).The frequency of sequence elements (CTCF, CCTCCCT,CTCTCCC and CCCCCCC) per Mb was found to be
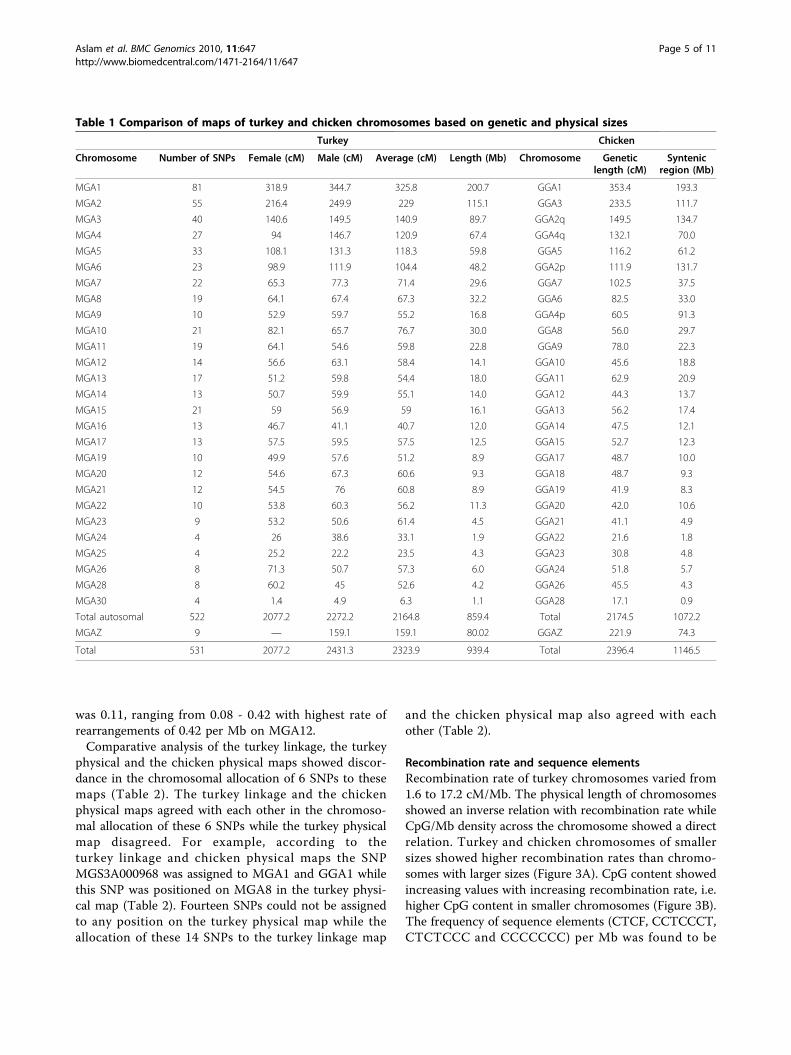
Table 1 Comparison of maps of turkey and chicken chromosomes based on genetic and physical sizes
Turkey Chicken
Chromosome Number of SNPs Female (cM) Male (cM) Average (cM) Length (Mb) Chromosome Geneticlength (cM)
Syntenicregion (Mb)
MGA1 81 318.9 344.7 325.8 200.7 GGA1 353.4 193.3
MGA2 55 216.4 249.9 229 115.1 GGA3 233.5 111.7
MGA3 40 140.6 149.5 140.9 89.7 GGA2q 149.5 134.7
MGA4 27 94 146.7 120.9 67.4 GGA4q 132.1 70.0
MGA5 33 108.1 131.3 118.3 59.8 GGA5 116.2 61.2
MGA6 23 98.9 111.9 104.4 48.2 GGA2p 111.9 131.7
MGA7 22 65.3 77.3 71.4 29.6 GGA7 102.5 37.5
MGA8 19 64.1 67.4 67.3 32.2 GGA6 82.5 33.0
MGA9 10 52.9 59.7 55.2 16.8 GGA4p 60.5 91.3
MGA10 21 82.1 65.7 76.7 30.0 GGA8 56.0 29.7
MGA11 19 64.1 54.6 59.8 22.8 GGA9 78.0 22.3
MGA12 14 56.6 63.1 58.4 14.1 GGA10 45.6 18.8
MGA13 17 51.2 59.8 54.4 18.0 GGA11 62.9 20.9
MGA14 13 50.7 59.9 55.1 14.0 GGA12 44.3 13.7
MGA15 21 59 56.9 59 16.1 GGA13 56.2 17.4
MGA16 13 46.7 41.1 40.7 12.0 GGA14 47.5 12.1
MGA17 13 57.5 59.5 57.5 12.5 GGA15 52.7 12.3
MGA19 10 49.9 57.6 51.2 8.9 GGA17 48.7 10.0
MGA20 12 54.6 67.3 60.6 9.3 GGA18 48.7 9.3
MGA21 12 54.5 76 60.8 8.9 GGA19 41.9 8.3
MGA22 10 53.8 60.3 56.2 11.3 GGA20 42.0 10.6
MGA23 9 53.2 50.6 61.4 4.5 GGA21 41.1 4.9
MGA24 4 26 38.6 33.1 1.9 GGA22 21.6 1.8
MGA25 4 25.2 22.2 23.5 4.3 GGA23 30.8 4.8
MGA26 8 71.3 50.7 57.3 6.0 GGA24 51.8 5.7
MGA28 8 60.2 45 52.6 4.2 GGA26 45.5 4.3
MGA30 4 1.4 4.9 6.3 1.1 GGA28 17.1 0.9
Total autosomal 522 2077.2 2272.2 2164.8 859.4 Total 2174.5 1072.2
MGAZ 9 — 159.1 159.1 80.02 GGAZ 221.9 74.3
Total 531 2077.2 2431.3 2323.9 939.4 Total 2396.4 1146.5
Aslam et al. BMC Genomics 2010, 11:647http://www.biomedcentral.com/1471-2164/11/647
Page 5 of 11
negatively correlated with the genetic size (cM) of chro-mosomes (Figure 3C-F).
DiscussionA whole genome SNP-based linkage map for the turkeyis presented with 531 markers dispersed over 28 linkagegroups and a total map length of 2324 cM. The totalmap length in the present study was slightly higher than
that described by Reed et al. [3]. This difference inlength is probably caused by coverage of three additionalturkey chromosomes (MGA20, 24 and MGA25) alongwith the utilization of 69% higher number of markers inthe present study, likely to be covering a larger propor-tion of the turkey genome. Matching the turkey linkagegroups with the chicken physical map identified a mapfor each of the syntenic groups/chromosomes described
Figure 1 Inter and intra chromosomal rearrangements between turkey and chicken. Linkage maps of turkey chromosomes MGA3, MGA6and MGA4, MGA9 showing inter and intra chromosomal rearrangements (fission, fusion and inversions,) with their syntenic chickenchromosomes GGA2 and GGA4 (maps based on physical position of SNPs in chicken genome).
Aslam et al. BMC Genomics 2010, 11:647http://www.biomedcentral.com/1471-2164/11/647
Page 6 of 11
by Griffin et al. [2]. The comparison of the syntenic chro-mosomes between turkey and chicken showed that thegenetic lengths of turkey chromosomes were very similarto the estimated genetic length of the chicken chromo-somes (Table 1). When comparing the turkey genetic link-age map and chicken physical map with respect to theorder of markers across the chromosomes, some of the
chromosomes (MGA14, 21, 25, 26 and MGAZ) showedcomplete conservation in the order of markers whereasothers showed limited variation. The conservation in theorder of markers for the chicken chromosomes GGA12,19, 24 and GGAZ with the syntenic turkey linkage groupswas also observed by Reed et al. [3]. This high rate of con-cordance in the order of markers between the genomes of
Figure 2 Intrachromosomal rearrangements between turkey and chicken involving nearly a complete chromosome arm. Turkeychromosomes MGA10 and MGA20 (genetic linkage maps) showing intrachromosomal rearrangements (Inversions) compared to the syntenicchicken chromosomes GGA8 and GGA18 (maps based on physical position of SNPs in chicken genome).
Table 2 SNPs with discordance in allocation on turkey genome with turkey genetic and chicken physical map
SNP_ID Turkey Linkage map (MGA) Turkey physical map (MGA) Chicken physical map (GGA)
MGS3A000968 1 8 1
MGS3A003050 6 13 2
MGS3A000053 8 19 6
MGS3A004543 9 10 4
MGS3A000578 15 14 13
MGS3B002546 19 8 17
MGS3A005799 1 NA 1
MGS3B003240 2 NA 3
MGS3A007335 2 NA 3
MGS3A005026 4 NA 4
MGS3B000939 5 NA 5
MGS3A007520 5 NA 5
MGS3A006539 7 NA 7
MGS3A007601 15 NA 13
MGS3A007553 16 NA 14
MGS3A002797 20 NA 18
MGS3C000006 1 NA 1
MGS3C000009 3 NA 2
MGS3B001450 Z NA Z
MGS3B002754 Z NA Z
SNP chromosomal assignment by turkey linkage, turkey sequence and chicken sequence maps NA = Not Aligned
Aslam et al. BMC Genomics 2010, 11:647http://www.biomedcentral.com/1471-2164/11/647
Page 7 of 11

these two avian species is indicative of a highly conservednature of avian genomes.Observed interchromosomal rearrangements (Figure 1)
in the present study between turkey and chicken are inagreement with the results of Griffin et al. [2]. A num-ber of complex intrachromosomal rearrangements(inversions) were also observed between turkey andchicken. The observed large inverted regions, of nearly acomplete chromosome arm on MGA10 and MGA20 incomparison to their syntenic chicken chromosomeGGA8 and GGA18 (Figure 2) were also observed in asequence based comparative study by Dalloul et al. [29].Cytogenetic studies using chromosome painting alsoreported an inversion on MGA10 in comparison to thesyntenic chicken chromosome GGA8 [2,13]. Our com-parative linkage map of turkey and chicken does notshow pericentic inversions on MGA2 and MGA3p aswere reported by Griffin et al. [2] but we have observedcomplex rearrangements resulting in a reversed order of
markers on these chromosomes (Additional file 3). Sev-eral other chromosomes, notably MGA1, 2, 5, 8, 11, 12,13, 15, 16, 17, 19, 22, and MGA28 as well as the chro-mosomes that showed interchromosomal rearrange-ments (MGA3 and MGA6; MGA4 and MGA9) betweenturkey and chicken, also showed additional complexrearrangements probably involving multiple inversionsor other complex rearrangements (Figure 1). A highernumber of rearrangements per Mb were observed onthe microchromosomes than on the macrochromo-somes. The occurrence of this high number of rearran-gements at the microchromosomes could be explainedby the positive association of rearrangements withrecombination rate [30].Our observed low number of interchromosomal rear-
rangements between the chicken and turkey genomes,confirms previous results of a high degree of interchro-mosomal synteny in birds as seen within a number of dif-ferent comparative studies of chicken with quail, duck
Figure 3 Distribution of recombination rates and sequence motif densities across the turkey chromosomes. Recombination rate cM/Mbwas correlated with chromosome length (Mb) and CpG/Mb was correlated with recombination rate (cM/Mb). All remaining sequence motifs(CCCCCCC, CCTCCCT, CTCF and CTCTCCC) were correlated with chromosome length (cM).
Aslam et al. BMC Genomics 2010, 11:647http://www.biomedcentral.com/1471-2164/11/647
Page 8 of 11
and zebra finch [30-32]. It has been suggested that thelow number of interchromosomal rearrangements duringavian genome evolution is a consequence of the smallamount of interspersed repeats, segmental duplications,and pseudogenes in avian genomes, which provide littleopportunity for non allelic homozygous recombination[33,34]. A relatively high number of intrachromosomalrearrangements was observed in our comparative analysisof the turkey and chicken, which agrees with the findingsof the sequence based comparative studies of chickenwith turkey and zebra finch [26,29,30]. The relativelyhigh number of intrachromosomal rearrangementsclearly suggests that the organization of avian genomes ismore prone to intrachromosomal rearrangements thanpreviously appreciated based on chromosome bandingand chromosome painting data [2].The comparison of male vs. female maps showed differ-
ences in genetic lengths of maps. In turkey, the total male-specific map appeared to be 195 cM longer than the femalespecific map. However, female-specific maps for somechromosomes (MGA10, 11, 15, 16, 23, 25, 26 and MGA28)were also found to be longer than the male maps (Table 1).The longer map length in homogametic males can beexplained by the Haldane-Huxley rule [35,36], which pre-dicts that the frequency of recombination during meiosis islower in the heterogametic sex. The smaller map lengths inturkey for some male-specific maps were found to be anexception to the Haldane-Huxley rule. However, the longermap lengths for some chromosome maps in the heteroga-metic sex were also found in chicken [9].In the present study three maps i.e. the turkey genetic
linkage map, the turkey physical map and the chickenphysical map were compared. The discordance of turkeyphysical map with the turkey genetic linkage and thechicken physical map in the allocation of marker at dif-ferent chromosomes could possibly be explained by theoccurrence of assembly errors in the turkey genomesequence. The turkey physical map was created comple-tely by whole genome shotgun sequencing using Roche454 and Illumina GA2 sequence data. Inconsistenciesbetween the turkey linkage and chicken physical mapsrelative to the turkey physical map are most likely areflection of the challenge of correctly assembling a gen-ome based on next-gen sequencing data alone. Markersthat were in agreement between turkey linkage andchicken physical maps but that could not be positionedon the turkey physical map most likely reflect an uncov-ered genomic regions since the turkey genome sequenceis known to cover around 95% of the complete genome(Turkey genome build UMD 2.01).In general, higher recombination rates and higher den-
sities of GC-rich elements were found on microchromo-somes compared to macrochromosomes (Figure
3A &3B). During meiosis, at least one chiasma per biva-lent chromosome is required [37], but the likelihood ofchiasmata forming varies along the chromosome [38]. Inturkey, recombination rate and GC rich sequences(CTCF, CCTCCCT, CTCTCCC and CCCCCCC) werefound to co-vary among different chromosomes. A simi-lar trend was also seen in human, mouse and otherbirds like chicken and zebra finch [9,10,20,26,37,39,40].In the present study recombination rates were found to
be correlated with CpG/Mb. In general CpG/Mb tendedto increase in areas of higher recombination i.e. micro-chromosomes (Figure 3B). This demonstrates that in theturkey microchromosomes, high recombination rate,high amount of GC-rich sequences (CTCF, CCTCCCT,CTCTCCC and CCCCCCC) and high amount of CpGcontents are all correlated (Figure 3A-F). Other studiesreported that GC-rich regions in a genome had highergene densities [41,42] and that microchromosomes hadhigher gene densities than the macrochromosomes [38].The nature of the microchromosomes in birds, with theirhigh recombination rates, high amount of GC-richsequences, GC content and gene densities appears to bean extreme instance of a general trend.The results for MGAZ in the analysis of recombina-
tion rate and sequence motif densities across the chro-mosomes, were unexpected and MGAZ appeared asoutlier as seen in figure 3A-F. This outlier spot couldrepresent a true characteristic of MGAZ but more likelyresults from the low marker density on this particularchromosome in our analysis. (Additional Files 2 &3).
ConclusionOur SNP-based genetic linkage map of turkey with 531markers reveals a genome length of 2,324 cM. This link-age map also allowed a comparison of the genomestructures of turkey and chicken, demonstrating a veryhigh degree of conservation in chromosome structure.A relatively low number of inter-, and intrachromoso-mal rearrangements was observed despite these two spe-cies being separated by 40 million years of evolution.
Additional material
Additional file 1: Detail of SBE primers along with their primersequences and gene accession numbers. This file contains PCR reverseand forward primer sequences along with the SNP specific SBE primersequence. This file also contains gene name and their accessionnumbers.
Additional file 2: Linkage and physical maps (data) of turkeychromosomes along with the physical map of syntenic chickenchromosomes. The detail of turkey linkage and physical maps alongwith the chicken physical map. This file also contains the flankingsequences of SNPs used in the present studied with their genotypingstatus.
Aslam et al. BMC Genomics 2010, 11:647http://www.biomedcentral.com/1471-2164/11/647
Page 9 of 11
Additional file 3: Linkage maps (Figures) of turkey chromosomesshowing rearrangements with syntenic chicken chromosomes.Figures showing comparative linkage maps of turkey and chickenincluding all the chromosomes mentioned in the present paper.
AcknowledgementsThe authors would like to thank Bert W Dibbits and Albertine Veenendaal(Animal Breeding and Genomics Centre, Wageningen University) for theirhelp on the lab work. We also thank Gerard Albers and the BreedingResearch and Technology Centre at Hendrix Genetics, for their help in thedesign of the experiment as well as the collection of blood samples.
Author details1Animal Breeding and Genomics Centre, Wageningen University,6709PG,Wageningen, The Netherlands. 2Hendrix Genetics, Research & TechnologyCentre, 5830 AC, Boxmeer, The Netherlands.
Authors’ contributionsMLA and MAMG analyzed the data. RPMAC organized the lab work andimproved the paper with suggestions and comments. MLA wrote the paperand all other authors gave suggestions and comments for the improvementof paper. All authors read and approved the final manuscript.
Received: 16 July 2010 Accepted: 20 November 2010Published: 20 November 2010
References1. Food and agriculture organization statistical division (FAOSTAT) of the
United Nations. [http://faostat.fao.org/].2. Griffin D, Robertson L, Tempest H, Vignal A, Fillon V, Crooijmans R,
Groenen M, Deryusheva S, Gaginskaya E, Carre W, Waddington D, Talbot R,Volker M, Masabanda J, Burt D: Whole genome comparative studiesbetween chicken and turkey and their implications for avian genomeevolution. BMC Genomics 2008, 9(1):168.
3. Reed KM, Chaves LD, Hall MK, Knutson TP, Harry DE: A comparativegenetic map of the turkey genome. Cytogenet Genome Res 2005,111:118-127.
4. Bumstead N, Palyga J: A preliminary linkage map of the chicken genome.Genomics 1992, 13(3):690-697.
5. Cheng HH, Levin I, Vallejo RL, Khatib H, Dodgson JB, Crittenden L, Hillel J:Development of a genetic map of the chicken with markers of highutility. Poult Sci 1995, 74:1855-1874.
6. Groenen MAM, Crooijmans RPMA, Veenendaal A, Cheng HH, Siwek M, Vander Poel JJ: A comprehensive microsatellite linkage map of the chickengenome. Genomics 1998, 49:265-274.
7. Herbergs J, Siwek M, Crooijmans RP, Van der Poel JJ, Groenen MA:Multicolour fluorescent detection and mapping of AFLP markers inchicken (Gallus domesticus). Anim Genet 1999, 30:274-285.
8. Groenen MAM, Cheng HH, Bumstead N, Benkel BF, Briles WE, Burke T,Burt DW, Crittenden LB, Dodgson J, Hillel J Lamont S, De Leon AP, Soller M,Takahashi H, Vignal A: A consensus linkage map of the chicken genome.Genome Res 2000, 10:137-147.
9. Groenen MAM, Wahlberg P, Foglio M, Cheng HH, Megens H-J,Crooijmans RPMA, Lathrop FBM, Muir WM, Ka-Shu Wong G, Gut I,Andersson L: A high-density SNP-based linkage map of the chickengenome reveals sequence features correlated with recombination rate.Genome Res 2009, 19(3):510-519.
10. Elferink M, van As P, Veenendaal T, Crooijmans R, Groenen M: Regionaldifferences in recombination hotspots between two chickenpopulations. BMC Genetics 2010, 11(1):11.
11. Griffin DK, Robertson LBW, Tempest HG, Skinner BM: The evolution of theavian genome as revealed by molecular cytogenetics. Cytogenet GenomeRes 2007, 117:64-77.
12. Stock AD, Bunch TD: The evolutionary implications of chromosome-banding pattern homologies in the bird order Galliformes. Cytogenet CellGenet 1982, 34:136-148.
13. Shibusawa M, Nishibori M, Nishida-Umehara C, Tsudzuki M, Masabanda J,Griffin DK, Matsuda Y: Karyotypic evolution in the Galliformes: An
examination of the process of karyotypic evolution by comparison ofthe molecular cytogenetic findings with the molecular phylogeny.Cytogenetic and Genome Research 2004, 106(1):111-119.
14. Ellegren H: Evolutionary stasis: the stable chromosomes of birds. Trendsin Ecology & Evolution 2010, 25(5):283-291.
15. Nie W, O’Brien PCM, Ng BL, Fu B, Volobouev V, Carter NP, Ferguson-Smith MA, Yang F: Avian comparative genomics: reciprocal chromosomepainting between domestic chicken (Gallus gallus) and the stone curlew(Burhinus oedicnemus, Charadriiformes)–An atypical species with lowdiploid number. Chromosome Res 2009, 17(1):99-113.
16. Guttenbach M, Nanda I, Feichtinger W, Masabanda JS, Griffin DK, Schmid M:Comparative chromosome painting of chicken autosomal paints 1-9 innine different bird species. Cytogenetic and Genome Research 2003, 103(1-2):173-184.
17. Derjusheva S, Kurganova A, Habermann F, Gaginskaya E: Highchromosome conservation detected by comparative chromosomepainting in chicken, pigeon and passerine birds. Chromosome Res 2004,12:715-723.
18. Heil J, Glanowski S, Scott J, Winn-Deen E, McMullen I, Wu L, Gire C,Sprague A: An automated computer system to support ultra highthroughput SNP genotyping. Pacific symposium on biocomputing: 20022002, 7:30-40.
19. Kerstens HHD, Crooijmans RPMA, Veenendaal A, Dibbits BW, Chin-A-Woeng TFC, Dunnen JTd, Groenen MAM: Large scale single nucleotidepolymorphism discovery in unsequenced genomes using secondgeneration high throughput sequencing technology: applied to turkey.BMC Genomics 2009, 10:479.
20. Hillier LW, Miller W, Birney E, Warren W, Hardison RC, Ponting CP, Bork P,Burt DW, Groenen MAM, Delany ME, Dodgson JB, Chinwalla AT, Cliften PF,Clifton SW, Delehaunty KD, Fronick C, Fulton RS, Graves TA, Kremitzki C,Layman D, Magrini V, McPherson JD, Miner TL, Minx P, Nash WE, Nhan MN,Nelson JO, Oddy LG, Pohl CS, Randall-Maher J, et al: Sequence andcomparative analysis of the chicken genome provide uniqueperspectives on vertebrate evolution. Nature 2004, 432:695-716.
21. Zhang Z, Schwartz S, Wagner L, Miller W: A greedy algorithm for aligningDNA sequences. J Comput Biol 2000, 7:203-214.
22. Schwartz S, Kent WJ, Smit A, Zhang Z, Baertsch R, Hardison RC, Haussler D,Miller W: Human-mouse alignments with BLASTZ. Genome Res 2003,13:103-107.
23. Fan JB, Oliphant A, Shen R, Kermani BG, Garcia F, Gunderson KL, Hansen M,Steemers F, Butler SL, Deloukas P, Galver L, Hunt S, McBride C, Bibikova M,Rubano T, Chen J, Wickham E, Doucet D, Chang W, Campbell D, Zhang B,Kruglyak S, Bentley D, Haas J, Rigault P, Zhou L, Stuelpnagel J, Chee MS:Highly parallel SNP genotyping. Cold Spring Harb Symp Quant Biol 2003,68:69-78.
24. Hyten DL, Song Q, Choi I-Y, Yoon M-S, Specht JE, Matukumalli LK,Nelson RL, Shoemaker RC, Young ND, Cregan PB: High-throughputgenotyping with the GoldenGate assay in the complex genome ofsoybean. Theor Appl Genet 2008, 116:945-952.
25. Green P, Falls K, Crooks S: CRI-MAP Program. St. Louis: Washingtonuniversity school of medicine, 2.4 1990.
26. Stapley J, Birkhead TR, Burke T, Slate J: A linkage map of the Zebra FinchTaeniopygia Guttata provides new insights into avian genomeevolution. Genetics 2008, 179:651-667.
27. Voorrips RE: MapChart: Software for the graphical presentation of linkagemaps and QTLs. J Hered 2002, 93(1):77-78.
28. Korf I, Yandell M, Bedell J: BLAST. O’Reilly Media 2003.29. Dalloul RA, Long JA, Zimin AV, Aslam L, Beal K, Ann Blomberg L, Bouffard P,
Burt DW, Crasta O, Crooijmans RPMA, Cooper K, Coulombe RA, De Supriyo ,Delany ME, Dodgson JB, Dong JJ, Evans C, Frederickson KM, Flicek P,Florea L, Folkerts O, Groenen MAM, Harkins TT, Herrero J, Hoffmann S,Megens H-Jan, Jiang A, de Jong P, Kaiser P, Kim H, et al: Multi-PlatformNext-Generation Sequencing of the Domestic Turkey (Meleagrisgallopavo): Genome Assembly and Analysis. PLoS Biol 2010, 8(9):e1000475.
30. Völker M, Backström N, Skinner BM, Langley EJ, Bunzey SK, Ellegren H,Griffin DK: Copy number variation, chromosome rearrangement, andtheir association with recombination during avian evolution. GenomeResearch 2010, 20(4):503-511.
31. Kayang B, Fillon V, Inoue-Murayama M, Miwa M, Leroux S, Feve K,Monvoisin J-L, Pitel F, Vignoles M, Mouilhayrat C, Beaumont C, Ito S,Minvielle F, Vignal A: Integrated maps in quail (Coturnix japonica)
Aslam et al. BMC Genomics 2010, 11:647http://www.biomedcentral.com/1471-2164/11/647
Page 10 of 11
confirm the high degree of synteny conservation with chicken (Gallusgallus) despite 35 million years of divergence. BMC Genomics 2006,7(1):101.
32. Skinner BM, Robertson LBW, Tempest HG, Langley EJ, Ioannou D, Fowler KE,Crooijmans RPMA, Hall AD, Griffin DK, Völker M: Comparative genomics inchicken and Pekin duck using FISH mapping and microarray analysis.BMC Genomics 2009, 10:357.
33. Burt DW, Bruley C, Dunn IC, Jones CT, Ramage A, Law AS, Morrice DR,Paton IR, Smith J, Windsor D, Sazanov A, Fries R, Waddington D: Thedynamics of chromosome evolution in birds and mammals. Nature 1999,402(6760):411-413.
34. Burt DW: Origin and evolution of avian microchromosomes. Cytogeneticand Genome Research 2002, 96(1-4):97-112.
35. Haldane JBS: Sex-ratio and unisexual sterility in hybrid animals. J Genet1922, 12:101-109.
36. Huxley JS: Sexual difference of linkage in Gammarus chereuxi. J Genet1928, 20:145-156.
37. Rodionov AV: Micro vs. macro: Structural-functional organization of avianmicro- and macrochromosomes. Genetika 1996, 32:597-608.
38. Smith J, Bruley CK, Paton IR, Dunn I, Jones CT, Windsor D, Morrice DR,Law AS, Masabanda J, Sazanov A, Waddington D, Fries R, Burt DW:Differences in gene density on chicken macrochromosomes andmicrochromosomes. Animal Genetics 2000, 31(2):96-103.
39. Myers S, Bottolo L, Freeman C, McVean G, Donnelly P: A fine-scale map ofrecombination rates and hotspots across the human genome. Science2005, 310:321-324.
40. Shifman S, Bell JT, Copley RR, Taylor MS, Williams RW, Mott R, Flint J: AHigh-resolution single nucleotide polymorphism genetic map of themouse genome. PLoS Biol 2006, 4(12):e395.
41. Versteeg R, van Schaik BD, van Batenburg MF, Roos M, Monajemi R,Caron H, Bussemaker HJ, van Kampen AH: The human transcriptome mapreveals extremes in gene density, intron length, GC content, and repeatpattern for domains of highly and weakly expressed genes. Genome Res2003, 13(9):1998-2004.
42. Spencer CCA, Deloukas P, Hunt S, Mullikin J, Myers S, Silverman B,Donnelly P, Bentley D, McVean G: The Influence of recombination onhuman genetic diversity. PLoS Genet 2006, 2(9):e148.
doi:10.1186/1471-2164-11-647Cite this article as: Aslam et al.: A SNP based linkage map of the turkeygenome reveals multiple intrachromosomal rearrangements between theTurkey and Chicken genomes. BMC Genomics 2010 11:647.
Submit your next manuscript to BioMed Centraland take full advantage of:
• Convenient online submission
• Thorough peer review
• No space constraints or color figure charges
• Immediate publication on acceptance
• Inclusion in PubMed, CAS, Scopus and Google Scholar
• Research which is freely available for redistribution
Submit your manuscript at www.biomedcentral.com/submit
Aslam et al. BMC Genomics 2010, 11:647http://www.biomedcentral.com/1471-2164/11/647
Page 11 of 11