A smeared crack analysis of reinforced concrete T-beams strengthened with GFRP composites
16
A smeared crack analysis of reinforced concrete T-beams strengthened with GFRP composites Hugo C. Biscaia ⇑ , Carlos Chastre, Manuel A.G. Silva UNIC, Faculdade de Ciências e Tecnologia, Universidade Nova de Lisboa, 2829-516 Caparica, Portugal article info Article history: Received 30 January 2012 Revised 18 May 2013 Accepted 6 July 2013 Available online 9 August 2013 Keywords: Glass fiber reinforced polymers (GFRP) Concrete Flexural strengthening Bond Debonding Interface Mohr–Coulomb criterion FE analysis abstract The strengthening of reinforced concrete structures with laminates of fibre reinforced polymeric (FRP) matrix has received considerable attention, although there still is lack of information on the more ade- quate modelling of the interface between FRP composites and concrete. An experimental programme is described and was designed to: (i) characterise glass FRP-to-concrete interface by shear tests; (ii) ana- lyse reinforced concrete T-beams with external GFRP plates. Double shear tests were carried out based on 15 cm cubes with GFRP bonded to two opposite faces. The concrete T-beams were 3.0 m long and 0.28 m high and were loaded till rupture in 4-point bending tests. The external reinforcement system showed great strength increment in relation to the non retrofitted T-beam, confirming to be an effective approach to the flexural strengthening of RC beams. The computational analysis was based on a three dimensional smeared crack model. In total, 22 computational analyses were made. Models with and without interface FE associated with Mohr–Coulomb failure criterion for the FRP-to-concrete interface were defined and different strength types of concrete were considered. The rigid interface does not predict the rupture of the T-beam with precision; however, the results obtained for low concrete strengths revealed that rigid interfaces can be assumed when conjugated with the fixed crack approach. Consequently, a slightly stiffer response of the beam is obtained. The maximum bond stresses obtained from Finite Element Analysis (FEA) revealed that the models with rigid interfaces developed lower bond stresses due to the lack of rel- ative displacements between both materials. The effects of assuming either fixed or rotated crack approaches were also compared. The rotated crack conjugated to a fine mesh in the vicinity of the GFRP-to-concrete stress led to a very good estimation of the bond stresses along the interface. The pre- diction of the T-beam rupture was also estimated with better results when the rotated crack was used in the model. In general, the FEA predicted with very good results the de-bonding of the GFRP-to-concrete interface of T-beams externally bonded with GFRP composites. Crown Copyright Ó 2013 Published by Elsevier Ltd. All rights reserved. 1. Introduction The strengthening of RC structures with fibre reinforced poly- mers (FRP) appears as a technique with high potential to eliminate the deficient strength of structural elements caused by design pro- cedures and construction flaws, or from structural degradation or damage due to environmental and natural hazards, or by changes on the initial service conditions or recent code requisites [1]. One of the most used FRP reinforcement systems is the exter- nally bonded reinforcement (EBR) which has proved to be an effec- tive technique of strengthening reinforced concrete beams. The light-weight of the reinforcing FRP material, its excellent durability properties, malleability and application speed, among others, turn it into an effective alternative. Nevertheless, premature failures such as de-bonding can significantly limit the system effectiveness, leading to possible brittle failure modes and prevent the use, by the designer, of the effective material potential [2]. The failure mechanisms of EBR concrete beams have been extensively studied [3]. Flexural and shear deformations endured by RC members determine the plate de-bonding mechanisms. Shear failure and critical diagonal cracking are not considered in this study and attention is concentrated on intermediate flexural crack mechanisms. The interface characteristics are very important on the response of structures reinforced by laminates. However, the failure at the interface may also relate to lack of aggregate interlock that can be measured from pull-tests. Material shear slip can be measured in these tests. Oehlers showed that, when de- bonding started at the plate end, large stresses normal to the plate-to-concrete interface develop in the vicinity and are resisted by strict tensile strength of the concrete, instead of aggregate inter- lock shear resistance, although interface shear stresses also devel- op [3]. 0141-0296/$ - see front matter Crown Copyright Ó 2013 Published by Elsevier Ltd. All rights reserved. http://dx.doi.org/10.1016/j.engstruct.2013.07.010 ⇑ Corresponding author. Tel.: +351 212948580; fax: +351 212948398. E-mail address: [email protected] (H.C. Biscaia). Engineering Structures 56 (2013) 1346–1361 Contents lists available at ScienceDirect Engineering Structures journal homepage: www.elsevier.com/locate/engstruct
Transcript of A smeared crack analysis of reinforced concrete T-beams strengthened with GFRP composites
Engineering Structures 56 (2013) 1346–1361
Contents lists available at ScienceDirect
Engineering Structures
journal homepage: www.elsevier .com/locate /engstruct
A smeared crack analysis of reinforced concrete T-beams strengthenedwith GFRP composites
0141-0296/$ - see front matter Crown Copyright � 2013 Published by Elsevier Ltd. All rights reserved.http://dx.doi.org/10.1016/j.engstruct.2013.07.010
⇑ Corresponding author. Tel.: +351 212948580; fax: +351 212948398.E-mail address: [email protected] (H.C. Biscaia).
Hugo C. Biscaia ⇑, Carlos Chastre, Manuel A.G. SilvaUNIC, Faculdade de Ciências e Tecnologia, Universidade Nova de Lisboa, 2829-516 Caparica, Portugal
a r t i c l e i n f o
Article history:Received 30 January 2012Revised 18 May 2013Accepted 6 July 2013Available online 9 August 2013
Keywords:Glass fiber reinforced polymers (GFRP)ConcreteFlexural strengtheningBondDebondingInterfaceMohr–Coulomb criterionFE analysis
a b s t r a c t
The strengthening of reinforced concrete structures with laminates of fibre reinforced polymeric (FRP)matrix has received considerable attention, although there still is lack of information on the more ade-quate modelling of the interface between FRP composites and concrete. An experimental programmeis described and was designed to: (i) characterise glass FRP-to-concrete interface by shear tests; (ii) ana-lyse reinforced concrete T-beams with external GFRP plates. Double shear tests were carried out based on15 cm cubes with GFRP bonded to two opposite faces. The concrete T-beams were 3.0 m long and 0.28 mhigh and were loaded till rupture in 4-point bending tests. The external reinforcement system showedgreat strength increment in relation to the non retrofitted T-beam, confirming to be an effective approachto the flexural strengthening of RC beams. The computational analysis was based on a three dimensionalsmeared crack model. In total, 22 computational analyses were made. Models with and without interfaceFE associated with Mohr–Coulomb failure criterion for the FRP-to-concrete interface were defined anddifferent strength types of concrete were considered. The rigid interface does not predict the ruptureof the T-beam with precision; however, the results obtained for low concrete strengths revealed that rigidinterfaces can be assumed when conjugated with the fixed crack approach. Consequently, a slightly stifferresponse of the beam is obtained. The maximum bond stresses obtained from Finite Element Analysis(FEA) revealed that the models with rigid interfaces developed lower bond stresses due to the lack of rel-ative displacements between both materials. The effects of assuming either fixed or rotated crackapproaches were also compared. The rotated crack conjugated to a fine mesh in the vicinity of theGFRP-to-concrete stress led to a very good estimation of the bond stresses along the interface. The pre-diction of the T-beam rupture was also estimated with better results when the rotated crack was used inthe model. In general, the FEA predicted with very good results the de-bonding of the GFRP-to-concreteinterface of T-beams externally bonded with GFRP composites.
Crown Copyright � 2013 Published by Elsevier Ltd. All rights reserved.
1. Introduction
The strengthening of RC structures with fibre reinforced poly-mers (FRP) appears as a technique with high potential to eliminatethe deficient strength of structural elements caused by design pro-cedures and construction flaws, or from structural degradation ordamage due to environmental and natural hazards, or by changeson the initial service conditions or recent code requisites [1].
One of the most used FRP reinforcement systems is the exter-nally bonded reinforcement (EBR) which has proved to be an effec-tive technique of strengthening reinforced concrete beams. Thelight-weight of the reinforcing FRP material, its excellent durabilityproperties, malleability and application speed, among others, turnit into an effective alternative. Nevertheless, premature failuressuch as de-bonding can significantly limit the system effectiveness,
leading to possible brittle failure modes and prevent the use, by thedesigner, of the effective material potential [2].
The failure mechanisms of EBR concrete beams have beenextensively studied [3]. Flexural and shear deformations enduredby RC members determine the plate de-bonding mechanisms.Shear failure and critical diagonal cracking are not considered inthis study and attention is concentrated on intermediate flexuralcrack mechanisms. The interface characteristics are very importanton the response of structures reinforced by laminates. However,the failure at the interface may also relate to lack of aggregateinterlock that can be measured from pull-tests. Material shear slipcan be measured in these tests. Oehlers showed that, when de-bonding started at the plate end, large stresses normal to theplate-to-concrete interface develop in the vicinity and are resistedby strict tensile strength of the concrete, instead of aggregate inter-lock shear resistance, although interface shear stresses also devel-op [3].

Table 1Concrete average properties.
T-beamspecimen
Days fcm,cube
(MPa)Standard deviation(MPa)
fctm
(MPa)Ecm
(GPa)
– 28 18.6 0.28 1.65 23.2HB1 (reference) 305HB2-M
(monotonic)310 22.9 0.73 1.97 24.7
HB3-C (cyclic) 342
Table 2Steel average tensile stress.
Diameter Yield strength (MPa) Ultimate strength (MPa)
Ø6 488 586Ø8 479 577Ø12 440 566
H.C. Biscaia et al. / Engineering Structures 56 (2013) 1346–1361 1347
Modelling these phenomena with the finite element method(FEM) is an important step towards progress in design. In particu-lar, the FRP-to-concrete interface modelling still is a great chal-lenge and according to several authors [4–7] can be reasonablywell simulated using non-linear numerical procedures. The behav-iour at the interface FRP-to-concrete can be studied through pulltests and a meso-scale FE model devised for the simulation ofinterfacial de-bonding in pull tests [8]. In general, the availablemodels of the interface FRP-to-concrete de-bonding mechanismare based, mainly, in the fracture energy law and take bond-slipinto consideration. The fracture energy is associated with the crackopening based on the fracture Mode I (tension) combined (or not,depending on the test) with Mode II (shear). A review of bondstrength and bond-slip relationships is offered in [9] where theauthors propose new bond-slip models that provide accurate pre-dictions of bond strength and strain distribution in the FRP plate.Typical bond-slip curves consist of an ascending branch till a peakbond stress is reached, followed by a descending branch until azero bond stress is attained for a finite value of slip. Bi-linearapproximations have the advantage of allowing analytical solu-tions whereas exponential laws, with non-linear post-peak behav-iour, better approximate especially the concrete non-linear post-peak behaviour.
A FE approach associated with the Mohr–Coulomb criterionwith tension cut off (limited by the concrete tensile strength, fct)for the interface de-bonding model is used in this study and the re-sults are hereby presented. The authors conceived appropriateshear tests that allowed the determination of the interface cohe-sion, c, and friction angle, / [10,11] required to apply Mohr–Cou-lomb criterion. Numerically, an initial rupture surface defined bythe cohesion and friction angle of the GFRP-to-concrete interfacecontrols the initiation of the interface de-bonding. From this pointforward, the development of the interface de-bonding is controlledby softening laws which are representative of the post-peak bond-slip curves of the GFRP-to-concrete interface. Therefore, the com-plete interface de-bonding is reached when Mode II fracture en-ergy is exhausted and dry friction (c = 0 MPa) is the final rupturesurface. The Mode II fracture energy and the correspondingbond-slip curves adopted in the study were obtained in previouswork of the authors [10,12].
2. Experimental program
A research programme has been developed at UniversidadeNova de Lisboa (UNL), which includes monotonic and cyclic testsof several retrofitted beams with GFRP composites using EBR tech-nique, as well as shear tests with the purpose of defining theMohr–Coulomb parameters as mentioned above. One referenceT-beam and two EBR T-beams strengthened with GFRP were se-lected to be presented and discussed in this work.
The concrete average compressive strength was evaluated bythe testing of 150 mm cubes after 28 days and again when theRC T-beams were tested (see Table 1). The concrete average tensilestrength and the Young modulus were not experimentally ob-tained and therefore the expressions proposed in Eurocode 2 [13]were used. The strength class of concrete found was C12/15, lowbut in line with values found in rehabilitation cases. The mechan-ical properties of the steel reinforcement were obtained from uni-axial tensile tests (see Table 2). The properties of the GFRP sheetswere determined from tests performed in a tensile Zwick machineleading to an average Young modulus of the GFRP composite equalto 23.49 GPa, maximum strain of 2.20% and an average tensilestrength equal to 513.9 MPa. The bonding agent used was Tyfo SEpoxy and according to the supplier the Young modulus and ulti-mate strain are 3.18 GPa and 5.0% respectively. Before application
of the GFRP composites on the contact surface, all specimens weretreated by dry sandblasting and then bonded to concrete by fol-lowing the wet lay-up technique.
2.1. Double shear tests
The shear tests campaign was designed to determine theparameters that characterise the Mohr–Coulomb criterion andconsequently the initial and the final rupture surfaces of theGFRP-to-concrete interface. The specimens consisted of a unidirec-tional GFRP laminate with 2.54 mm thick (2 layers with 1.57 mmeach), 520 mm long and 80 mm wide SEH51/Tyfo fabric bondedto opposite faces of the standard 150 mm side concrete cube. Theset-up for the tests is shown in Fig. 1 where typical aspect of sur-face of GFRP laminate after failure is also depicted.
Two variants of these tests were performed. The first one, here-after designated by MC, was done with the intention of obtainingthe cohesion of the GFRP-to-concrete interface, and the secondone, hereafter designated by MC-C, was done with the aim ofobtaining the friction angle of the interface. The difference be-tween MC-C and MC tests is the compression stress applied tothe GFRP plate. The compression stress is initially controlled bytwo TML (KCM-200KNA) pressure cells (see Fig. 1) with a maxi-mum non-linearity of the rate output equal to 1%. In both casesthe tests were run by displacement control with a rate of0.5 mm/min. Note that in the tests with compression stresses,the displacements were imposed to the specimens after the appli-cation of the compression stresses to the interfaces. The compres-sion stress history was recorded. Another pressure cell placedbelow the hydraulic jack measured the load applied to the speci-mens. The displacements were monitored by one standard100 mm LVDT (TML-CDP100) with a sensibility of 100 � 10�6 -mm�1 placed on the top of the specimen. More details can be foundelsewhere [10,11].
Mode II fracture energy and the bond-slip curve of the GFRP-to-concrete interface were determined based on the proposal pre-sented by Ueda and Dai [14]. Essentially, Ueda and Dai’s proposalconsists on the determination of the strain vs. slip (e–s) curve thatfits with the experiments leading to:
sðsÞ ¼ Ef � tf �deðsÞ
ds� eðsÞ ð1Þ
where Ef and tf are, respectively, the Young Modulus and the thick-ness of the FRP composite. The e–s curve proposed by Ueda and Dai[14] is:

Fig. 1. Standard system of the shear test (left side) and specimen rupture mode (right side).
1348 H.C. Biscaia et al. / Engineering Structures 56 (2013) 1346–1361
eðsÞ ¼ emax � ð1� e�B�sÞ ð2Þ
where B is a constant that is adjustable to the experimental e–scurve.
More details about the nonlinear bond-slip curve of the GFRP-to-concrete interfaces can be found in previous work of the authors[15].
2.2. Reinforced concrete T-beams EBR with GFRP
The test apparatus consisted of a RC T-beam with 3.0 m oflength subjected to vertical loads applied at one third and twothirds of the span. Hence, the central region of the beam (1.0 m)was, always, under a constant moment. The beams were simplesupported (see Fig. 2).
The transversal sections of the RC T-beams are shown in Fig. 3and were designed to prevent possible premature shear failure,assuring flexural failure. Steel stirrups Ø6//15 mm were adopted.The flexural reinforcement was designed to recreate usual currentsituations, being 3 Ø12 steel rebar adopted and 30 mm of coverconcrete.
One beam without any additional flexural reinforcement wasused as reference (HB1) for the additional tests, consisting of twobeams reinforced with 2 bonded GFRP sheet layers (HB2-M andHB3-C) with a 1.57 mm of thickness per layer. The full configura-tions of the tested beams are presented in Table 3. The reinforce-ment was externally bonded in the longitudinal length of 2.70 mand with 0.12 m of width. The T-beams HB1 and HB2-M were sub-mitted to monotonic loading history and HB3-C to a cyclic loading–unloading history.
The deflection control was guaranteed by seven standard100 mm LVDT (TML-CDP100) with a sensibility of 100 � 10�6 -mm�1, displayed along the longitudinal direction of the beam. Atmid-span, a wire controlled transducer (500 mm) with a sensibilityof 10 � 10�6 mm�1 was used in order to obtain the results of larger
deformation, if needed during the post-collapse of the test. Eighthorizontal displacement transducers with a sensibility of147 � 10�6 mm�1 (i2 to i5 and i7 to i10 – see Fig. 2) plus two morehorizontal displacement transducers with a sensibility of250 � 10�6 mm�1 (i1 and i6 – see Fig. 2) were distributed in twolayers along the longitudinal direction. Fig. 4 shows the externalinstrumentation used for all the T-beams tests. The GFRP was alsoinstrumented by several strain gauges (TML-FLA-5-11-5L) alongthe beam length (see Fig. 2). Two TML (KCM-200KNA) load cellswith a maximum non-linearity of the rate output equal to 1% wereinstalled on the reaction zone of both hydraulic cylinders to mea-sure the applied load during the test.
In particular, the cyclic test (HB3-C) was controlled by a proto-col that imposed a constant displacement of 0.03 mm/s during theloading phase and a constant unloading rate of 0.4 bar/s during theunloading cycles, until the load of 5 kN was attained. The protocolscheme that was imposed to the T-beam is shown in Fig. 5.
3. Experimental results
The results were obtained from the shear tests and from the RCT-beams EBR with GFRP. In general, the double shear tests allowthe quantification of the required values needed to characterisethe GFRP-to-concrete interface. The results of the RC T-beamsEBR with GFRP are presented as well. The ratio between the max-imum moment of every tested beam (M) and the yielding momentof the un-strengthened beam (My) is defined according toexpression:
q ¼ MMy
ð3Þ
The ultimate strengthening factor given by Eq. (3) is compared tothe corresponding drift.

Distribution of the strain gauges along the GFRP composite
Fig. 2. Standard system of the four point bending test and scheme of the instrumentation used.
H.C. Biscaia et al. / Engineering Structures 56 (2013) 1346–1361 1349
3.1. Double shear tests
The interface material available in the computational code isbased on the Mohr–Coulomb criterion where the initiation of thede-bonding is controlled by an initial rupture surface (with cohe-
sion and friction angle) and from that point forward till completede-bonding, all process is controlled by two nonlinear softeninglaws: (i) in cohesion (Mode II); and in tension (Mode I). The areasbeneath both softening laws are the fracture energy of Mode II andMode I, respectively. In order to define all parameters needed to

Fig. 3. Transversal section of the RC T-beam (m).
Table 3T-beam specimens configuration.
T-Beamdesignation
Historyload type
Age at test(days)
Longitudinalsteelreinforcement
Steelstirrups
GFRP
Top Bottom
HB1 Monotonic 305 –HB2-M Monotonic 310 6 Ø8 3 Ø12 3 Ø12 2 Layers
(Af = 304.8 mm2)(S400) (S400) (S400)HB3-C Cyclic 342
0 1000 2000 3000 4000 5000 6000 70000
5
10
15
20
25
Mid
span
disp
lace
men
t(m
m)
Time (sec)
Fig. 5. Protocol scheme followed during the HB3-C test.
1350 H.C. Biscaia et al. / Engineering Structures 56 (2013) 1346–1361
define the rupture criteria of the GFRP-to-concrete interface, theauthors conceived an experimental shear test [10,11]. The initialrupture envelope law was defined based on expression:
s ¼ c þ rL � tanð/Þ ð4Þ
where c is the interface cohesion; / is the internal friction angle ofthe interface; s is the shear stress; and rL is the normal stress ap-plied to the interface (perpendicular direction to the interface).
The double shear tests designated by MC1-C0, MC2-C0 andMC3-C0 are reference specimens, tested without normal compres-sion stress, and were carried out at concrete age of 355 days. Spec-imens MC4-C1 (with a normal compression stress of 0.51 MPa) andMC5-C2 (with a normal compression stress of 1.02 MPa) were car-ried out the day after. Therefore, from the point of view of the con-crete strength, no differences were expected in the interfacebehaviour. Average results of the double shear tests are presentedin Table 4.
The load–displacement curves of the experimental tests areshown in Fig. 6. From the analysis of this graph it can be seen thatthe GFRP-to-concrete interface has, approximately, a linear
Fig. 4. Different views of the external instrumen
behaviour until rupture. All the tests had a very fragile rupturealso. In MC5-C2 specimen, the maximum load achieved was34.56 kN per interface whereas in the MC-1 specimen the maxi-mum load achieved was 25.73 kN per interface. In the MC1-C0,MC2-C0 and MC3-C0 tests the average maximum load achievedwas 17.22 kN per interface. During the shear tests with compres-sion stress of the GFRP-to-concrete interface, an increase of thecompression stress of the interface was registered in the load cellsso, steel rods were adopted with 14 mm of diameter to avoid theyielding of the steel rods during the tests, preventing therefore, apremature collapse of the interface. This evidence was also foundin [10,11,16] and it can be explained by the fact that at the begin-ning of the test, the concrete aggregates and the GFRP layer near toconcrete adapt to each other and a slightly decrease of the interfacestress is registered. In the vicinity of the failure load, the aggregatesfriction becomes higher and some aggregate arrangements lead,also, to a growth of the interface normal stress [10]. This featureis shown in the graph of Fig. 7 where shear tests revealed thatthe compression stress at maximum load reached about0.73 MPa in the MC4-C1 test and 1.15 MPa in the MC5-C2 test, thatseems to be the cause of relative increase of the interface compres-sion stress of 43.1% and 12.8%, respectively.
3.2. Reinforced concrete T-beams EBR with GFRP
All RC T-beams were experimentally tested in a four pointbending test. The reference T-beam, without any external rein-forcement, provided reference values for maximum load capacity,displacements and curvatures, and no further parameters weredetermined. This beam revealed that the maximum load applied
tation used at the experimental programme.

Table 4Double shear tests results.
Designation Compression stress (MPa) Maximum force (kN/interface) Maximum displacement (mm) Shear stress (MPa) Cohesion (MPa) Friction angle (–)
MC1-C0 0 17.86 2.60 1.97 1.90 –MC2-C0 0 16.28 2.10 1.81 1.75 –MC3-C0 0 17.51 2.30 1.82 1.82 –MC4-C1 0.51 25.73 3.14 2.85 1.78 0.97MC5-C2 1.02 34.56 4.54 3.79 1.05
0 1 2 3 4 5 6 70
10
20
30
40
50
2=0MPa
=0.5MPa
2=1.0MPa
Load
per
eac
h in
terfa
ce (k
N)
Displacement (mm)
MC1-C0 MC2-C0 MC3-C0 MC4-C1 MC5-C2
Fig. 6. Load per each interface vs. displacement graph of the double shear tests.
H.C. Biscaia et al. / Engineering Structures 56 (2013) 1346–1361 1351
was 62.89 kN (My = 31.50 kN m) having a mid span displacementof 13.17 mm. After this point, the steel rods yielded and a quasi-constant behaviour of the beam was registered. In the othersbeams, strain gauges were bonded to GFRP and so, more datawas collected. Based on the data obtained from the strain gauges,the bond stresses were calculated according to
s ¼ De � Ef � tf
DLð5Þ
where Ef is the GFRP Young’s modulus; tf is the GFRP thickness; Deis the difference between consecutive strain gauges; and DL is thelength between consecutive gauges. These results can be found inTable 5.
For the conditions studied in this work, the structural behaviourof the T-beam EBR with GFRP has proved to be an effective
-3 -2 -1 0 1 2 30
1
2
3
4
5
6
Max
. She
ar S
tress
, m
ax (M
Pa)
Lateral Stress, L (MPa)
MC1-C0 MC2-C0 MC3-C0 MC4-C1 MC5-C2 Env. Fail. Law
(Eq. 2)Envelope Failure Law
Fig. 7. Compression stress in the GFRP-to-concrete interface vs. total load graph ofthe shear tests.
technique when it is taking into account the increase of 43–48%of the maximum bending moment compared to the un-strength-ened T-beam (see Fig. 8). Although partial stiffness increase wasobtained at the linear stage, the system with GFRP presented thehighest maximum drift of 2.43–2.79% till failure by typical fibrede-bonding when compared with other similar EBR systems withCFRP composites [2]. The post collapse behaviour showed an un-changed situation when compared to the un-strengthened beam,i.e., the beam had the same behaviour of the stage correspondingto the steel rods yielding as shown by the graph in Fig. 8. The samecharacteristic was observed in the HB3-C specimen after the GFRPde-bonding. In both T-beams EBR with GFRP, the rupture modewas characterised by a brittle and cohesive failure by concretedue to fibre de-bonding as depicted in Fig. 9. This figure showsthe particular rupture mode of the HB2-M specimen.
4. Computational modelling
Computational analyses were carried out using a commercial FEcode suitable for RC modelling, ATENA 3D [17]. The description ofconcrete was based on a 3D Non-Linear Cementitious constitutivemodel which includes non-linear behaviour and failure based onnonlinear fracture mechanics. In tension, the cracking in the con-crete elements are governed by fracture mechanics, classical ortho-tropic smeared crack models and by crack band approach. Itemploys the Rankine failure criterion, exponential softening, andthe rotated or fixed crack approach (see Section 4.1) can be as-sumed. In concrete elements, the tensile crack model for Mode Iand the sliding crack model for Model II were considered. Develop-ments of both concrete cracks (in tension and sliding) are modelledusing bi-linear softening laws in tension and in cohesion similar tothat shown in Fig. 10. In compression, the plasticity model adoptedfor concrete in compression is based on the Menétrey–Willam rup-ture surface. More details can be found in [17].
In case of the FRP-to-concrete interface, the initiation of the FRPde-bonding occurs when the stresses violate the condition writtenin (2). This surface collapses to a residual surface which corre-sponds to dry friction (see Fig. 10). However, before the residualsurface is attained, the propagation of the FRP de-bonding is con-trolled by similar softening laws which were based on exponentialbond-slip laws obtained from previous experimental work [10,12].The fracture energy for Mode II associated to those softening lawswas obtained by calculating the area beneath the exponentialbond-slip law and was approximated to the softening law in cohe-sion shown in Fig. 10 and the fracture energy for Mode I which isdefined by the area under the softening law in tension (seeFig. 10) was empirically set to a tenth of the fracture energy forMode II as recommended in [18]. In the final, the FRP de-bondingis achieved by the discrete separation between both materials, con-crete and composite.
Essentially, the GFRP-to-concrete interface was modelled bymeans of two different models: (i) using interface finite elementswhich failure is controlled by the Mohr–Coulomb rupture envelopeassociated to softening laws; (ii) and assuming a rigid interfacebetween the GFRP composite and concrete, i.e., no interface finite
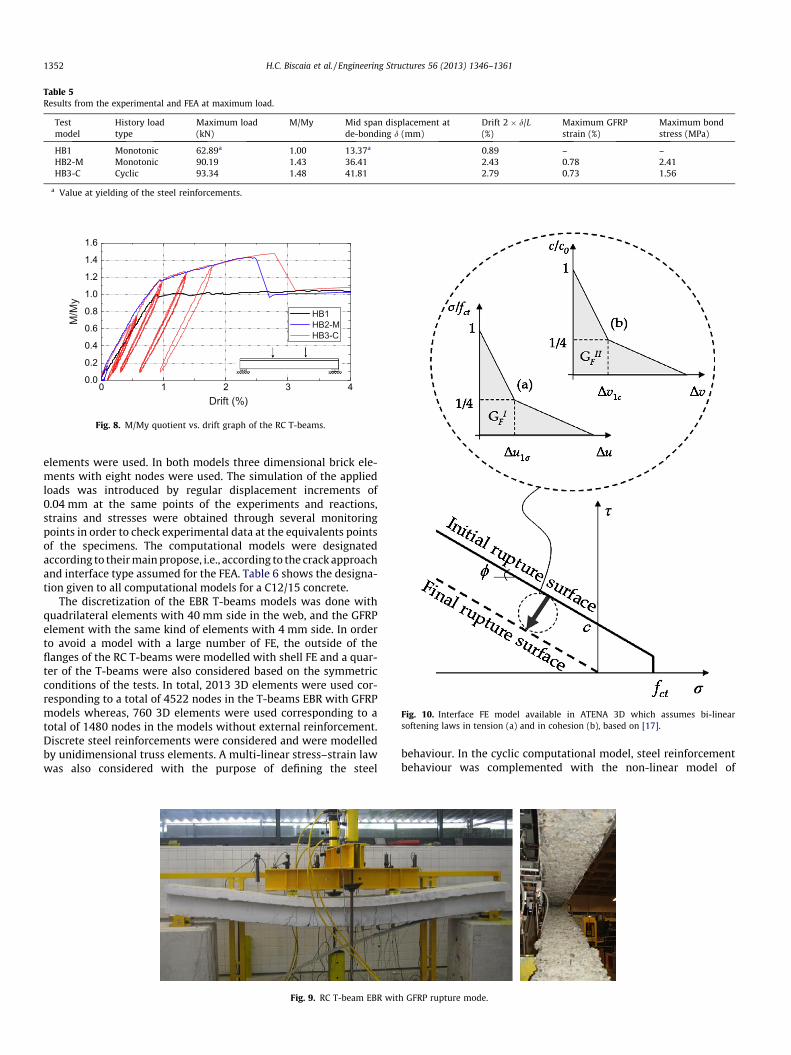
Table 5Results from the experimental and FEA at maximum load.
Testmodel
History loadtype
Maximum load(kN)
M/My Mid span displacement atde-bonding d (mm)
Drift 2 � d/L(%)
Maximum GFRPstrain (%)
Maximum bondstress (MPa)
HB1 Monotonic 62.89a 1.00 13.37a 0.89 – –HB2-M Monotonic 90.19 1.43 36.41 2.43 0.78 2.41HB3-C Cyclic 93.34 1.48 41.81 2.79 0.73 1.56
a Value at yielding of the steel reinforcements.
0 1 2 3 40.0
0.2
0.4
0.6
0.8
1.0
1.2
1.4
1.6
Drift (%)
M/M
y
HB1 HB2-M HB3-C
Fig. 8. M/My quotient vs. drift graph of the RC T-beams.
Fig. 10. Interface FE model available in ATENA 3D which assumes bi-linearsoftening laws in tension (a) and in cohesion (b), based on [17].
1352 H.C. Biscaia et al. / Engineering Structures 56 (2013) 1346–1361
elements were used. In both models three dimensional brick ele-ments with eight nodes were used. The simulation of the appliedloads was introduced by regular displacement increments of0.04 mm at the same points of the experiments and reactions,strains and stresses were obtained through several monitoringpoints in order to check experimental data at the equivalents pointsof the specimens. The computational models were designatedaccording to their main propose, i.e., according to the crack approachand interface type assumed for the FEA. Table 6 shows the designa-tion given to all computational models for a C12/15 concrete.
The discretization of the EBR T-beams models was done withquadrilateral elements with 40 mm side in the web, and the GFRPelement with the same kind of elements with 4 mm side. In orderto avoid a model with a large number of FE, the outside of theflanges of the RC T-beams were modelled with shell FE and a quar-ter of the T-beams were also considered based on the symmetricconditions of the tests. In total, 2013 3D elements were used cor-responding to a total of 4522 nodes in the T-beams EBR with GFRPmodels whereas, 760 3D elements were used corresponding to atotal of 1480 nodes in the models without external reinforcement.Discrete steel reinforcements were considered and were modelledby unidimensional truss elements. A multi-linear stress–strain lawwas also considered with the purpose of defining the steel
Fig. 9. RC T-beam EBR wit
behaviour. In the cyclic computational model, steel reinforcementbehaviour was complemented with the non-linear model of
h GFRP rupture mode.
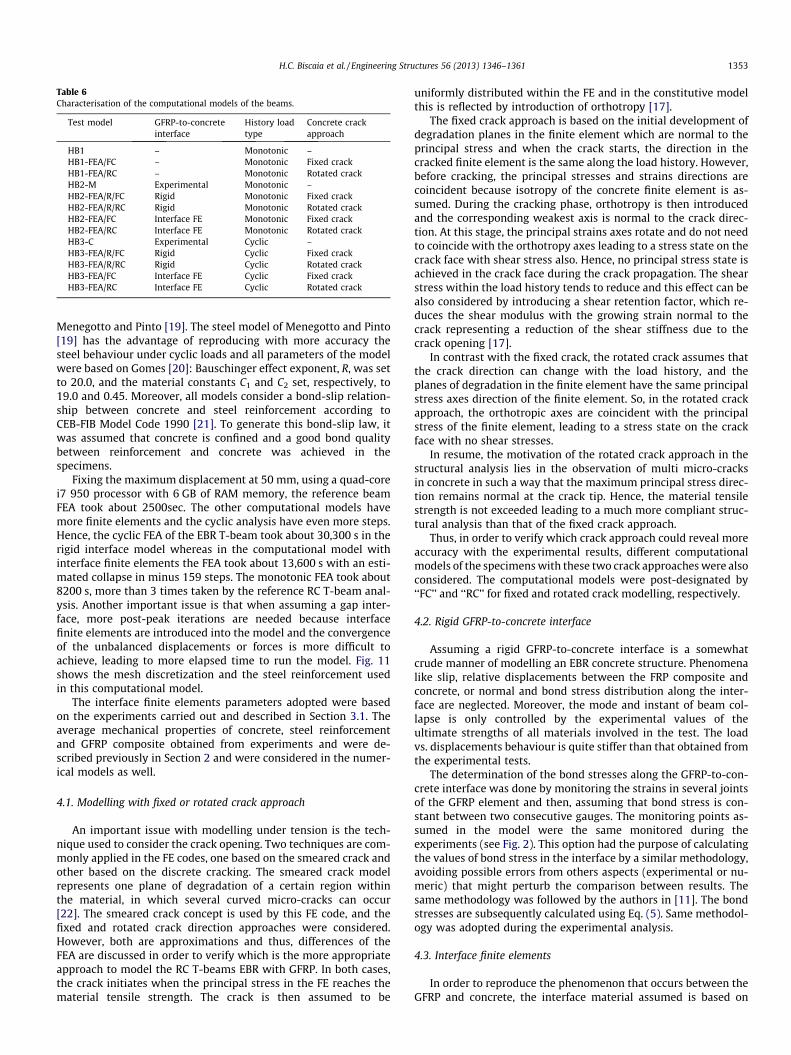
Table 6Characterisation of the computational models of the beams.
Test model GFRP-to-concreteinterface
History loadtype
Concrete crackapproach
HB1 – Monotonic –HB1-FEA/FC – Monotonic Fixed crackHB1-FEA/RC – Monotonic Rotated crackHB2-M Experimental Monotonic –HB2-FEA/R/FC Rigid Monotonic Fixed crackHB2-FEA/R/RC Rigid Monotonic Rotated crackHB2-FEA/FC Interface FE Monotonic Fixed crackHB2-FEA/RC Interface FE Monotonic Rotated crackHB3-C Experimental Cyclic –HB3-FEA/R/FC Rigid Cyclic Fixed crackHB3-FEA/R/RC Rigid Cyclic Rotated crackHB3-FEA/FC Interface FE Cyclic Fixed crackHB3-FEA/RC Interface FE Cyclic Rotated crack
H.C. Biscaia et al. / Engineering Structures 56 (2013) 1346–1361 1353
Menegotto and Pinto [19]. The steel model of Menegotto and Pinto[19] has the advantage of reproducing with more accuracy thesteel behaviour under cyclic loads and all parameters of the modelwere based on Gomes [20]: Bauschinger effect exponent, R, was setto 20.0, and the material constants C1 and C2 set, respectively, to19.0 and 0.45. Moreover, all models consider a bond-slip relation-ship between concrete and steel reinforcement according toCEB-FIB Model Code 1990 [21]. To generate this bond-slip law, itwas assumed that concrete is confined and a good bond qualitybetween reinforcement and concrete was achieved in thespecimens.
Fixing the maximum displacement at 50 mm, using a quad-corei7 950 processor with 6 GB of RAM memory, the reference beamFEA took about 2500sec. The other computational models havemore finite elements and the cyclic analysis have even more steps.Hence, the cyclic FEA of the EBR T-beam took about 30,300 s in therigid interface model whereas in the computational model withinterface finite elements the FEA took about 13,600 s with an esti-mated collapse in minus 159 steps. The monotonic FEA took about8200 s, more than 3 times taken by the reference RC T-beam anal-ysis. Another important issue is that when assuming a gap inter-face, more post-peak iterations are needed because interfacefinite elements are introduced into the model and the convergenceof the unbalanced displacements or forces is more difficult toachieve, leading to more elapsed time to run the model. Fig. 11shows the mesh discretization and the steel reinforcement usedin this computational model.
The interface finite elements parameters adopted were basedon the experiments carried out and described in Section 3.1. Theaverage mechanical properties of concrete, steel reinforcementand GFRP composite obtained from experiments and were de-scribed previously in Section 2 and were considered in the numer-ical models as well.
4.1. Modelling with fixed or rotated crack approach
An important issue with modelling under tension is the tech-nique used to consider the crack opening. Two techniques are com-monly applied in the FE codes, one based on the smeared crack andother based on the discrete cracking. The smeared crack modelrepresents one plane of degradation of a certain region withinthe material, in which several curved micro-cracks can occur[22]. The smeared crack concept is used by this FE code, and thefixed and rotated crack direction approaches were considered.However, both are approximations and thus, differences of theFEA are discussed in order to verify which is the more appropriateapproach to model the RC T-beams EBR with GFRP. In both cases,the crack initiates when the principal stress in the FE reaches thematerial tensile strength. The crack is then assumed to be
uniformly distributed within the FE and in the constitutive modelthis is reflected by introduction of orthotropy [17].
The fixed crack approach is based on the initial development ofdegradation planes in the finite element which are normal to theprincipal stress and when the crack starts, the direction in thecracked finite element is the same along the load history. However,before cracking, the principal stresses and strains directions arecoincident because isotropy of the concrete finite element is as-sumed. During the cracking phase, orthotropy is then introducedand the corresponding weakest axis is normal to the crack direc-tion. At this stage, the principal strains axes rotate and do not needto coincide with the orthotropy axes leading to a stress state on thecrack face with shear stress also. Hence, no principal stress state isachieved in the crack face during the crack propagation. The shearstress within the load history tends to reduce and this effect can bealso considered by introducing a shear retention factor, which re-duces the shear modulus with the growing strain normal to thecrack representing a reduction of the shear stiffness due to thecrack opening [17].
In contrast with the fixed crack, the rotated crack assumes thatthe crack direction can change with the load history, and theplanes of degradation in the finite element have the same principalstress axes direction of the finite element. So, in the rotated crackapproach, the orthotropic axes are coincident with the principalstress of the finite element, leading to a stress state on the crackface with no shear stresses.
In resume, the motivation of the rotated crack approach in thestructural analysis lies in the observation of multi micro-cracksin concrete in such a way that the maximum principal stress direc-tion remains normal at the crack tip. Hence, the material tensilestrength is not exceeded leading to a much more compliant struc-tural analysis than that of the fixed crack approach.
Thus, in order to verify which crack approach could reveal moreaccuracy with the experimental results, different computationalmodels of the specimens with these two crack approaches were alsoconsidered. The computational models were post-designated by‘‘FC’’ and ‘‘RC’’ for fixed and rotated crack modelling, respectively.
4.2. Rigid GFRP-to-concrete interface
Assuming a rigid GFRP-to-concrete interface is a somewhatcrude manner of modelling an EBR concrete structure. Phenomenalike slip, relative displacements between the FRP composite andconcrete, or normal and bond stress distribution along the inter-face are neglected. Moreover, the mode and instant of beam col-lapse is only controlled by the experimental values of theultimate strengths of all materials involved in the test. The loadvs. displacements behaviour is quite stiffer than that obtained fromthe experimental tests.
The determination of the bond stresses along the GFRP-to-con-crete interface was done by monitoring the strains in several jointsof the GFRP element and then, assuming that bond stress is con-stant between two consecutive gauges. The monitoring points as-sumed in the model were the same monitored during theexperiments (see Fig. 2). This option had the purpose of calculatingthe values of bond stress in the interface by a similar methodology,avoiding possible errors from others aspects (experimental or nu-meric) that might perturb the comparison between results. Thesame methodology was followed by the authors in [11]. The bondstresses are subsequently calculated using Eq. (5). Same methodol-ogy was adopted during the experimental analysis.
4.3. Interface finite elements
In order to reproduce the phenomenon that occurs between theGFRP and concrete, the interface material assumed is based on

Fig. 11. Standard mesh discretization and steel reinforcement of the RC T-beams.
0 1 2 3 40.0
0.2
0.4
0.6
0.8
1.0
1.2
1.4
1.6
Drift (%)
HB1 HB1 - FEA/RC HB1 - FEA/FC
0 1 2 3 40.0
0.2
0.4
0.6
0.8
1.0
1.2
1.4
1.6
Drift (%)
M/M
yM
/My
HB2-M HB2-FEA/RC HB2-FEA/FC HB2-FEA/R/RC HB2-FEA/R/FC
Fig. 12. Comparison between the monotonic tests and the FEA.
1354 H.C. Biscaia et al. / Engineering Structures 56 (2013) 1346–1361
Mohr–Coulomb failure criterion which associates softening laws inorder to control all the de-bonding process of the GFRP-to-concreteinterface. Thus, an improved accuracy is expected when this inter-face model alternative is adopted.
These FE are defined by a pair of surfaces each located in oppo-site side of the interface and in the original geometry, the surfacescan share the same position, or they can be separated by a quasizero distance. In other words, the FE considered have a nonzerothickness and they worked in two distinct states: (i) open state,where there is no contact between the elements; and (ii) closedstate, where the interaction between the two elements is full.Moreover, definition of these states, in the case of a three dimen-sional problem, is given by a constitutive relation according toequation:
s1
s2
r
8><>:
9>=>;¼
Ktt 0 00 Ktt 00 0 Knn
264
375 �
Dv1
Dv2
Du
8><>:
9>=>;
ð6Þ
where s1 and s2 are the shear stress at the interface (if a two dimen-sional problem is being studied then one of the shear components isset to zero); r is the normal stress at the interface (perpendicular tothe FRP-to-concrete interface); Ktt and Knn are, respectively, the tan-gential and the normal stiffness of the interface; Dv1 and Dv2 arethe relative displacements in the interface plane; Du is the relativedisplacement perpendicular to the interface plane. In the case of atwo dimensional problem the second row and column are omittedand, if tearing occurs (Mode III), the two first rows and columns areconsidered equal. The definition of these constitutive relations wasbased in the previous experimental work of the authors [11].
The envelope rupture laws for three different concrete strengthscan be seen elsewhere [10], where all parameters where obtainedaccording to an experimental programme based on double sheartests [10,11,16] as the ones previously described in Section 2.1.Essentially, the tests with no compressive stress (pure shear) al-lowed the finding of the interface cohesion, c, and the tests withcompression stress of the interface permitted to calculate theinternal friction angle of the interface, /, according to Eq. (4).
The FE code allows the removing of an element in the modelduring the FEA and for the modelling of the GFRP de-bonding ithas particular interest because allows to capture the post-peakbehaviour of the RC T-beam assuming the de-bonding rupture phe-nomena. Hence, when the model reaches the maximum load, theGFRP element is removed from the initial model and so, the yield-ing stage of the reference beam is then followed by the beam. Notethat the maximum load is determined by the FE code when the
convergence criteria of the unbalanced displacements or forcesare not satisfied, i.e, when the GFRP composite debonds from theconcrete element. This post-peak behaviour can be seen inFig. 12, and it can be noticed that the use of two construction casesand the interface material allowed an approximation of the post-peak behaviour of the test. The strategy followed is describedbriefly next. The first construction case includes the RC T-beamwith the external GFRP composite reinforcement. When the GFRPcomposite debonds, a lack of convergence of the FEA is reacheddue to the lack of constrains of the GFRP element. Therefore, usingtwo construction cases during the FEA allowed the determinationof the maximum load during the first construction case, and avoid-ing the lack of convergence obtained previously, the second con-struction case eliminates the GFRP composite from the FE modelin order to represent the composite de-bonding from the concretesurface.

0 1 2 3 40.0
0.2
0.4
0.6
0.8
1.0
1.2
1.4
1.6
Drift (%)
HB3-C HB3-C-FEA/RC HB3-C-FEA/R/RC
0.0
0.2
0.4
0.6
0.8
1.0
1.2
1.4
1.6
M/M
yM
/My
HB3-C HB3-C-FEA/FC HB3-C-FEA/R/FC
0 1 2 3 4Drift (%)
Fig. 13. Comparison between the cyclic tests and the FEA using: (i) rotated crack(RC) model (up); and (ii) fixed crack (FC) model (down).
H.C. Biscaia et al. / Engineering Structures 56 (2013) 1346–1361 1355
A comparison between the cyclic tests and the FEA is depictedin Fig. 13. The models with rigid interface could not estimate thede-bonding occurrence and they also have less concordance withthe experimental data than the models with an interface materialwhich collapsed prematurely. This fact can be explained by thestiffer response of the beam compared to the specimen leadingso to earlier de-bonding of the GFRP plate. Although the modelwith a rigid interface had a stiffer response also, the de-bondingphenomena is neglected and this analysis ends, obviously, later.
Table 7 shows the results from the FEA at maximum load for allmodels studied where the concrete strength is that obtained fromthe concrete cube tests. i.e., with fcm = 22.9 MPa. In general, themaximum load capacity is the parameter with more accuracy
Table 7Results from the experimental and FEA at maximum load.
Test model GFRP-to-concreteInterface
Historyload type
Concretecrackapproach
Maximumload (kN)
Relativeerror (%)
Midat d
HB1 – Monotonic – 62.89* – 13.HB1-FEA/FC – Monotonic Fixed crack 64.84* 3.1 11.HB1-FEA/RC – Monotonic Rotated
crack64.64* 2.8 13.
HB2-M Experimental Monotonic – 90.19 – 36.HB2-FEA/R/FC Rigid Monotonic Fixed crack 91.84 1.8 27.HB2-FEA/R/RC Rigid Monotonic Rotated
crack106.16 17.7 93.
HB2-FEA/FC Interface FE Monotonic Fixed crack 90.04 �0.2 28.HB2-FEA/RC Interface FE Monotonic Rotated
crack93.36 3.5 37.
HB3-C Experimental Cyclic – 93.34 – 41.HB3-FEA/R/FC Rigid Cyclic Fixed crack 87.16 �6.6 24.HB3-FEA/R/RC Rigid Cyclic Rotated
crack106.96 14.6 89.
HB3-FEA/FC Interface FE Cyclic Fixed crack 93.80 0.5 35.HB3-FEA/RC Interface FE Cyclic Rotated
crack93.04 �0.3 33.
* Value at yielding of the steel reinforcements.
when compared with the experimental results. The relative errorsare higher in the models in which a rigid interface was assumedcombined with the rotated crack approach. If only the models withinterface finite elements are considered, the relative errors of themaximum load capacity are minor than 3.5%. However, major er-rors can be found in the mid span displacements or in the maxi-mum bond stresses at the de-bonding instant. This evidenceoccurs specially for the computational models with a rigid inter-face and it is even more significantly when the rotated crack ap-proach is assumed.
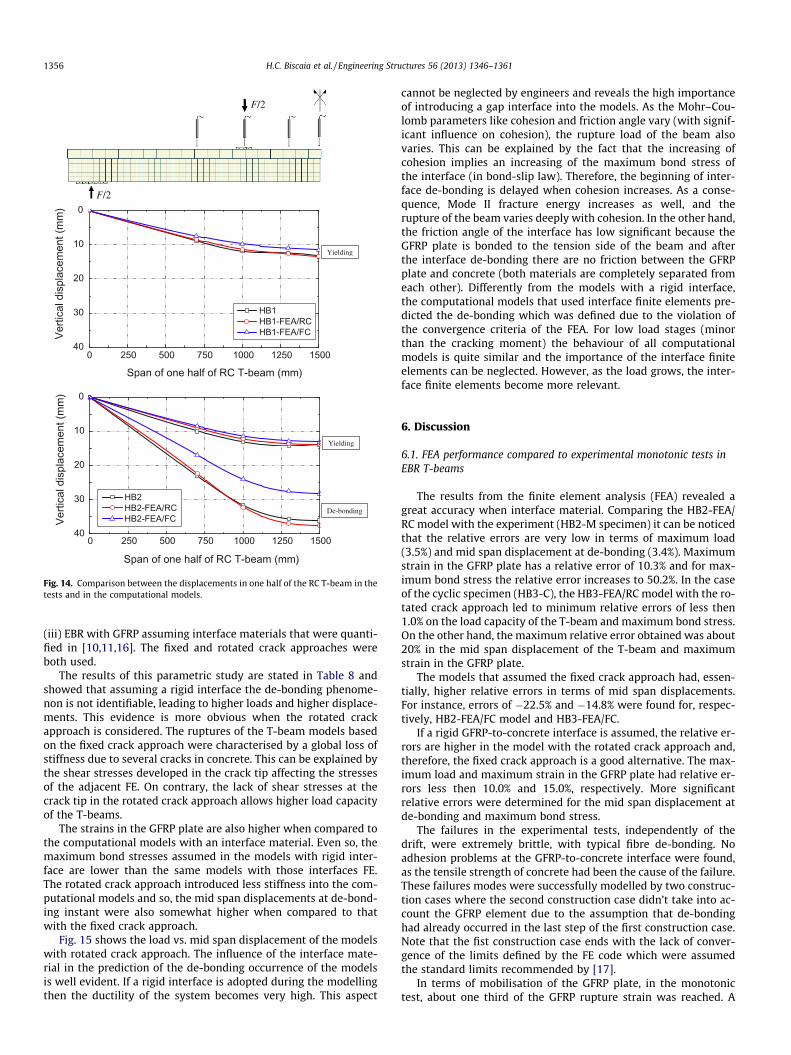
Fig. 14 shows the vertical displacements of one half of the RC T-beam span. The tests results of the HB1 and HB2-M are comparedwith those obtained from the computational models assuming ro-tated and fixed crack approaches. The deformed configurationsshown in Fig. 14 revealed that if the computational model assumedthe rotated crack approach then a good accuracy with the tests isachieved. For the HB2 test, the computational results with fixed crackapproach revealed to be more deficient especially in the prevision ofthe deformed shape of the T-beam at the de-bonding moment.
The bond stresses developed in the GFRP-to-concrete interfacemodels with interface finite elements are higher than those exper-imentally calculated. This may be explained by the fact that Eq. (5)assumes that the distribution of the bond stresses between consec-utive strain gauges is constant. However, in the FEA bond stressesconcentrations were stated leading to the possibility of failureassociated with those stresses. In the cyclic models the bond stres-ses weren’t so high because of the supposed premature de-bondingof the GFRP at an earlier stage due to the violation of the unbal-anced displacements or forces convergence criteria.
5. Parametric study
In order to evaluate the influence of the concrete strength in thestructural behaviour of T-beams retrofitted with externally bondedreinforcement (EBR), a parametric study was carried out. Three dif-ferent concrete strengths were considered, 22.9 MPa, 30.0 MPa and50.0 MPa. All Mohr–Coulomb values as cohesion and internal fric-tion angle of the GFRP-to-concrete interface and the nonlinear soft-ening laws associated to the de-bonding process were establishedaccording to [10,11,16] for those strengths. Beams were dividedinto three different computational models: (i) without externalreinforcement; (ii) EBR with GFRP assuming a rigid interface; and
span displacemente-bonding (mm)
Relativeerror (%)
MaximumGFRP strain(%)
Relativeerror (%)
Maximumbond stress(MPa)
Relativeerror (%)
37* – – – – –52* �13.8 – – – –38* 0.1 – – – –
41 – 0.78 – 2.41 –69 �24.0 0.76 �2.6 1.12 �53.547 156.7 1.46 87.2 1.23 �49.0
23 �22.5 0.75 �3.9 2.62 8.766 3.4 0.86 10.3 3.62 50.2
81 – 0.73 – 1.56 –12 �42.3 0.63 �14.0 1.03 �34.664 114.4 1.44 97.3 1.42 �9.0
60 �14.8 0.59 �19.2 1.51 �3.215 �20.7 0.59 �19.2 1.55 �0.6
0 250 500 750 1000 1250 150040
30
20
10
0
Span of one half of RC T-beam (mm)
Verti
cal d
ispl
acem
ent (
mm
)
HB1 HB1-FEA/RC HB1-FEA/FC
0 250 500 750 1000 1250 150040
30
20
10
0
Span of one half of RC T-beam (mm)
Verti
cal d
ispl
acem
ent (
mm
)
HB2 HB2-FEA/RC HB2-FEA/FC
Yielding
Yielding
De-bonding
F/2
F/2
Fig. 14. Comparison between the displacements in one half of the RC T-beam in thetests and in the computational models.
1356 H.C. Biscaia et al. / Engineering Structures 56 (2013) 1346–1361
(iii) EBR with GFRP assuming interface materials that were quanti-fied in [10,11,16]. The fixed and rotated crack approaches wereboth used.
The results of this parametric study are stated in Table 8 andshowed that assuming a rigid interface the de-bonding phenome-non is not identifiable, leading to higher loads and higher displace-ments. This evidence is more obvious when the rotated crackapproach is considered. The ruptures of the T-beam models basedon the fixed crack approach were characterised by a global loss ofstiffness due to several cracks in concrete. This can be explained bythe shear stresses developed in the crack tip affecting the stressesof the adjacent FE. On contrary, the lack of shear stresses at thecrack tip in the rotated crack approach allows higher load capacityof the T-beams.
The strains in the GFRP plate are also higher when compared tothe computational models with an interface material. Even so, themaximum bond stresses assumed in the models with rigid inter-face are lower than the same models with those interfaces FE.The rotated crack approach introduced less stiffness into the com-putational models and so, the mid span displacements at de-bond-ing instant were also somewhat higher when compared to thatwith the fixed crack approach.
Fig. 15 shows the load vs. mid span displacement of the modelswith rotated crack approach. The influence of the interface mate-rial in the prediction of the de-bonding occurrence of the modelsis well evident. If a rigid interface is adopted during the modellingthen the ductility of the system becomes very high. This aspect
cannot be neglected by engineers and reveals the high importanceof introducing a gap interface into the models. As the Mohr–Cou-lomb parameters like cohesion and friction angle vary (with signif-icant influence on cohesion), the rupture load of the beam alsovaries. This can be explained by the fact that the increasing ofcohesion implies an increasing of the maximum bond stress ofthe interface (in bond-slip law). Therefore, the beginning of inter-face de-bonding is delayed when cohesion increases. As a conse-quence, Mode II fracture energy increases as well, and therupture of the beam varies deeply with cohesion. In the other hand,the friction angle of the interface has low significant because theGFRP plate is bonded to the tension side of the beam and afterthe interface de-bonding there are no friction between the GFRPplate and concrete (both materials are completely separated fromeach other). Differently from the models with a rigid interface,the computational models that used interface finite elements pre-dicted the de-bonding which was defined due to the violation ofthe convergence criteria of the FEA. For low load stages (minorthan the cracking moment) the behaviour of all computationalmodels is quite similar and the importance of the interface finiteelements can be neglected. However, as the load grows, the inter-face finite elements become more relevant.
6. Discussion
6.1. FEA performance compared to experimental monotonic tests inEBR T-beams
The results from the finite element analysis (FEA) revealed agreat accuracy when interface material. Comparing the HB2-FEA/RC model with the experiment (HB2-M specimen) it can be noticedthat the relative errors are very low in terms of maximum load(3.5%) and mid span displacement at de-bonding (3.4%). Maximumstrain in the GFRP plate has a relative error of 10.3% and for max-imum bond stress the relative error increases to 50.2%. In the caseof the cyclic specimen (HB3-C), the HB3-FEA/RC model with the ro-tated crack approach led to minimum relative errors of less then1.0% on the load capacity of the T-beam and maximum bond stress.On the other hand, the maximum relative error obtained was about20% in the mid span displacement of the T-beam and maximumstrain in the GFRP plate.
The models that assumed the fixed crack approach had, essen-tially, higher relative errors in terms of mid span displacements.For instance, errors of �22.5% and �14.8% were found for, respec-tively, HB2-FEA/FC model and HB3-FEA/FC.
If a rigid GFRP-to-concrete interface is assumed, the relative er-rors are higher in the model with the rotated crack approach and,therefore, the fixed crack approach is a good alternative. The max-imum load and maximum strain in the GFRP plate had relative er-rors less then 10.0% and 15.0%, respectively. More significantrelative errors were determined for the mid span displacement atde-bonding and maximum bond stress.
The failures in the experimental tests, independently of thedrift, were extremely brittle, with typical fibre de-bonding. Noadhesion problems at the GFRP-to-concrete interface were found,as the tensile strength of concrete had been the cause of the failure.These failures modes were successfully modelled by two construc-tion cases where the second construction case didn’t take into ac-count the GFRP element due to the assumption that de-bondinghad already occurred in the last step of the first construction case.Note that the fist construction case ends with the lack of conver-gence of the limits defined by the FE code which were assumedthe standard limits recommended by [17].
In terms of mobilisation of the GFRP plate, in the monotonictest, about one third of the GFRP rupture strain was reached. A

Table 8Results from the FEA adopting three different concrete strengths at maximum load.
Test model GFRP-to-concreteInterface
Concretecrackapproach
Concretestrengths(MPa)
Cohesionb
(MPa)Frictionangleb
(rad)
Fractureenergyb (N/mm)
Maximumload (kN)
Mid span displacementat de-bonding (mm)
MaximumGFRP strain(%)
Maximumbond stress(MPa)
HB1-FEA/FC – Fixed crack 22.9 – – – 64.84a 11.52a – –HB1-FEA/RC – Rotated
crack22.9 – – – 64.64a 13.38a – –
HB2-FEA/R/FC Rigid Fixed crack 22.9 – – – 91.84 27.69 0.76 1.12HB2-FEA/R/RC Rigid Rotated
crack22.9 – – – 106.16 93.47 1.46 1.23
HB2-FEA/FC Interface FE Fixed crack 22.9 1.72 1.050 0.548 90.04 28.23 0.75 2.62HB2-FEA/RC Interface FE Rotated
crack22.9 1.72 1.050 0.548 93.36 37.66 0.86 3.62
HB4-FEA/FC – Fixed crack 30.0 – – – 66.44a 11.22a – –HB4-FEA/RC – Rotated
crack30.0 – – – 65.72a 13.04a – –
HB5-FEA/R/FC Rigid Fixed crack 30.0 – – – 113.36 60.15 1.27 1.47HB5-FEA/R/RC Rigid Rotated
crack30.0 – – – 115.32 92.50 1.61 1.20
HB5-FEA/FC Interface FE Fixed crack 30.0 2.53 1.092 0.578 103.40 43.57 1.09 1.80HB5-FEA/RC Interface FE Rotated
crack30.0 2.53 1.092 0.578 102.08 48.29 1.07 2.40
HB6-FEA/FC – Fixed crack 50.0 – – – 67.36a 10.76a – –HB6-FEA/RC – Rotated
crack50.0 – – – 66.64a 11.39a – –
HB7-FEA/R/FC Rigid Fixed crack 50.0 – – – 127.08 81.00 1.55 2.25HB7-FEA//R/RC Rigid Rotated
crack50.0 – – – 126.40 81.98 1.53 1.67
HB7-FEA/FC Interface FE Fixed crack 50.0 3.13 1.152 0.604 109.88 44.71 1.20 2.40HB7-FEA/RC Interface FE Rotated
crack50.0 3.13 1.152 0.604 119.56 66.56 1.48 4.55
a Value at yielding of the steel reinforcements.b According to the proposal of Biscaia et. al. [10].
H.C. Biscaia et al. / Engineering Structures 56 (2013) 1346–1361 1357
slightly less mobilisation of the GFRP plate was reached in the cyc-lic test. Same evidence was attained in the FEA.
Although, the crack pattern is not discussed here, the FEAshowed a great concordance with the experiments as depicted inFig. 16 for the same load and where a superposition of the testand the computational model is made.
The bond stress distribution along the GFRP-to-concrete inter-face in the specimens is quite different from the FEA. In order todetermine the bond stress distributions along the GFRP-to-con-crete interface, the monitoring strain points along the GFRP platewere considered the same as the ones assumed in the experimentsand the bond stress distributions determined according to Eq. (5).The results obtained from the computational models show asmooth distribution along the interface. The maximum bond stressoccurs at the interface below the applied external load and tendsfor zero at mid span of the beam, i.e., in the constant bending mo-ment region of the beam. The bond stress distribution obtainedfrom the FEA is therefore quite different from that obtained bythe experiments. The cause of these differences might be due tothe modelling of the opening and propagation of the cracks inthe concrete elements, i.e., due to the smeared crack concept usedin the FE code. Physically, the smeared crack approach cannotreproduce the crack opening and so, the inversion of the bondstress signal in the interface is not accomplished. This aspect wasalso verified by Giuseppe Simonelli [23] and Giulio Alfano et al.[24] in a 2D analysis of RC beams externally reinforced with carbonFRP (CFRP) under 4 points bending tests. These authors concludedthat modelling with the discrete crack approach, i.e., by introduc-ing a physical discontinuity into the FRP-to-concrete interface, willconduct to a bond stress field in the interface closer to the realisticsituations.
Fig. 17 shows the comparison between the computational mod-els HB1-FEA/FC and HB1-FEA/RC (with fixed crack and rotated
crack, respectively) at two different stages corresponding to the:(i) yielding of the steel reinforcement; and (ii) de-bonding of theGFRP plate. At the cracking load, it is not expectable to find differ-ences between those two computational models which can be ex-plained by fact that both crack approaches are implemented in theFEA after the concrete cracking. For that reason and because of thelow bond stresses at that stage are very low, Fig 17 does not showthe bond stress distributions along the interface for the crackingload.
Fig. 18 shows the comparison between the experimental testHB2-M and the computational models. The results were comparedbased on the readings of 16 strain gauges bonded on one half GFRPplate and show high discrepancies from the computational models.These discrepancies were already justified above and gain morepreponderance on the results as the load reaches the de-bondingof the GFRP plate.
Despite the bond stress distribution along the beam were not soin agreement with the experiments at the de-bonding stage,according to Lu et al. [25] and Teng et al. [26], the smeared crackapproach can be used if a very fine mesh is assumed near to theFRP-to-concrete interface. According to those authors, to simulatethe concrete failure in a thin layer (about 2–5 mm), with theshapes and paths of the cracks properly captured, the rotatingcrack approach can be used if concrete is modelled with FE withsimilar size of the thickness of the concrete layer. Alternatively,in a meso-scale level, the fixed crack approach is recommendedby [25,26] and concrete elements should have a dimension similarto the thickness of the fracture zone of concrete, i.e, 0.25 mm or0.50 mm. As result, solving the non-linear equations in the 3DFEA become too heavy and consuming much time to solve. Hence,it was made a 2D FEA with the same commercial code and the ro-tated crack approach was assumed and it was followed the recom-mendations made by [25,26]. In total, 13,738 finite elements and

0 10 20 30 40 50 60 70 80 90 1000
20
40
60
80
100
120
140
Mid span displacement (mm)
Load
(kN
)
HB1-FEA/RC HB4-FEA/RC HB6-FEA/RC
0 10 20 30 40 50 60 70 80 90 1000
20
40
60
80
100
120
140
Mid span displacement (mm)
Load
(kN
)
HB2-FEA/R/RC HB5-FEA/R/RC HB7-FEA/R/RC
0 10 20 30 40 50 60 70 80 90 1000
20
40
60
80
100
120
140
Mid span displacement (mm)
Load
(kN
)
HB2-FEA/RC HB5-FEA/RC HB7-FEA/RC
Fig. 15. Differences between the models with rigid interface and with interfacematerial.
Fig. 16. Comparison of the crack pattern (with fixed crack approach) between themodel and the HB1 test.
0 150 300 450 600 750 900 1050 1200 1350 1500-0.2
0.0
0.2
0.4
0.6
0.8
Length of the beam (mm)
bond
(MPa
)
Yielding (Fixed crack) Debonding (Fixed crack) Yielding (Rotated crack) Debonding (Rotated crack)
F/2
F/2
Fig. 17. Comparison of the bond stress distribution between the monotonic testand: model with rotated crack (up) and fixed crack (down).
0 150 300 450 600 750 900 1050 1200 1350 1500-1.0
-0.5
0.0
0.5
1.0
1.5
2.0
2.5
3.0FEA with rotated crack approach
Length of the beam (mm)
bond
(MPa
)
0 150 300 450 600 750 900 1050 1200 1350 1500-1.0
-0.5
0.0
0.5
1.0
1.5
2.0
2.5
3.0
Length of the beam (mm)
bond
(MPa
)
FEA with fixed crack approach
Yielding (FEA) Debonding (FEA) Yielding (Test) Debonding (Test)
F/2
F/2
Fig. 18. Comparison of the bond stress distribution between the monotonic testand: model with rotated crack (up) and fixed crack (down).
1358 H.C. Biscaia et al. / Engineering Structures 56 (2013) 1346–1361
17,217 nodes were used. Comparing with the experiments, thebond stress distribution along the interface is now more accurateas shown in Fig. 19.

0 150 300 450 600 750 900 1050 1200 1350 1500-2.0-1.5-1.0-0.50.00.51.01.52.02.53.0
FEA with rotated crack approach
Length of the beam (mm)
bond
(MPa
)
2D FEA with a very fine mesh Test
F/2
F/2
Fig. 19. Comparison of the bond stress distribution between the monotonic testand the 2D model with rotated crack.
10 20 30 40 50 600
20
40
60
80
100
120
140
Concrete strength (MPa)
Max
imum
load
(kN
)
0.0
0.5
1.0
1.5
2.0
Max
imum
stra
in in
the
GFR
P pl
ate
(%)
Without interface - FC Rigid interface - FC Interface FE - FC
10 20 30 40 50 60
Concrete strength (MPa)
Fig. 20. Influence of the concrete strengths on the load capacity of the T-beams, m
H.C. Biscaia et al. / Engineering Structures 56 (2013) 1346–1361 1359
6.2. FEA performance compared to experimental cyclic tests in EBR T-beams
A T-beam strengthened with an externally bonded reinforce-ment was tested under cyclic loads and simulated using FE modelswith a rigid interface or with the interface material. The influenceof a fixed crack or a rotated crack approach was also simulated. Theresults show that the cyclic curve envelope is better simulatedwhen a rotated crack approach and an interface material are as-sumed. In terms of maximum load, the fixed and the rotated crackapproach have similar results, with an error between �1.7% and1.1% of the experimental test. However, in terms of displacementsat mid span, both approaches presented a more rigid behaviourcompared to the experimental tests, with an error between �22%and �26%. The model with rigid interface and fixed crack presentsa good result in terms of displacements at mid span, with an errorof �8.7%, but a worse result in terms of maximum load with an er-ror of 6.2% compared to the experimental test.
The several FE models tested presented a similar yielding load tothe experimental test, but the stiffness behaviour until the yieldingload is better modelled when a rotated crack approach and an inter-face material are assumed. The different FE models simulate quitewell the stiffness of the load and unload branches. However, a globalbehaviour similar to the experimental test is only achieved when arotated crack approach and an interface material are assumed.
0
20
40
60
80
100
Mid
spa
n di
spl.
at d
e-bo
ndin
g (m
m)
0
1
2
3
4
5
Max
imum
bon
d st
ress
(MPa
)
Without interface - RC Rigid interface - RC Interface FE - RC
10 20 30 40 50 60
Concrete strength (MPa)
10 20 30 40 50 60
Concrete strength (MPa)
id span displacement, strains in the GFRP plate and maximum bond stress.

1360 H.C. Biscaia et al. / Engineering Structures 56 (2013) 1346–1361
6.3. Influence of the concrete strength in the structural behaviour ofEBR T-beams
Three concrete strengths were considered in order to determinethe gains or losses on the performance of the T-beams. The rigidGFRP-to-concrete interface and fixed and rotated crack approacheswere also considered.
Fig. 20 shows the influence of the concrete strengths on the T-beam performance for all the analysed models. The results empha-sise the importance of the interface finite elements in the globalbehaviour of the T-beams when low concrete strengths are used.Comparing with the models with interface finite elements, the ri-gid interface overestimated the load capacity of the T-beam testedfor both crack approaches. The mid span displacements and max-imum strain in the GFRP plate were also higher in the models withrigid interface and the values also increase with the concretestrength. The maximum strains in the GFRP plate were also higherin the models with rigid interface. It is important to notice that themaximum strains in the GFRP plate are less then the rupture strainof 2.14% verified on tensile tests of GFRP flat coupons. However,when the concrete strengths increase from 22.9 MPa to 50.0 MPa,it is verified an increment from one third to almost two thirds ofthe flat coupons strain at break instant.
The yielding point of the steel reinforcements didn’t suffer sig-nificant changes in all models. The parametric study revealed thatthe ductility of the T-beams increases with the increase of the con-crete strength as shown previously in Fig. 15. Comparing with theexperiments (fcm = 22.9 MPa), the drift obtained from the FEA withinterface finite elements combined with the rotated crack ap-proach were very similar, with a relative error of 3.3%.
7. Conclusions
The structural performance of reinforced concrete T-beamsexternally strengthened with GFRP plates was analysed. An exper-imental programme was conducted in order to characterise theinterface GFRP-to-concrete. These tests revealed to be effective,when compared with similar ones performed with CFRP compos-ites [2], although the number of RC T-beams experimentally testedmay not be completely representative, as some errors inherent tothe experimental activity (e.g. equipment measurements, geome-try of the specimens and the test setup, errors due to the skills ofthe experimenter) inevitably occur in this kind of tests..
During the experimental tests a strain mobilisation of approxi-mately one third of the strain rupture was obtained. However, inthe parametric study, two thirds of the strain rupture was achievedfor higher concrete strengths. Nevertheless, the effectiveness of theGFRP strengthening may be improved with an effective anchoragesystem, which can delay de-bonding failure.
The double shear tests allowed the definition of the necessaryparameters that characterises the initial rupture surface of theGFRP-to-concrete interface and had crucial importance on thenumerical modelling. This type of tests allowed the characterisa-tion of the initial rupture surface of the interface finite elementsused in the computational models, namely cohesion and internalfriction angle of the GFRP-to-concrete interface.
In order to simulate the GFRP-to-concrete interface a FE inter-face was introduced in the computational models, associated tothe bond-slip laws and combined with the Mohr–Coulomb failurecriterion. The results showed that this procedure predicts very wellthe de-bonding phenomenon.
The FEA also revealed that a more accurate result is obtainedwhen the interface material and the rotated crack approach arecombined. However, the models with fixed crack approach com-bined with a rigid interface fairly predicted the maximum load
capacity and maximum strain on GFRP plate (with errors smallerthan 14.0%). The displacements at mid-span showed higher rela-tive errors when a rigid interface is considered and if a rotatedcrack is assumed in the FEA. When the GFRP-to-concrete interfaceis rigid, the relative errors of the maximum bond stresses tend toincrease rapidly due to the lack of relative displacements betweenboth materials. Relative errors of almost 48% in the maximumbond stress were calculated in the monotonic tests and the rotatedcrack approach seems to be in accordance with the experimentsresults.
The bond stress distribution along the interface obtained from a2D FE analysis with a very fine mesh revealed to be a good alterna-tive to the 3D FE analysis. The results obtained from the 2D FEanalysis were closer to the ones obtained from the experiments. In-stead, the 3D FE analysis carried out, could not predict the bondstress distribution because of the not so refined mesh adopted. No-tice that refining the mesh in the 3D model will be very demandingin terms of computational effort and, therefore, too much time willbe consumed till the final solution.
If a rigid interface is assumed then some prudence is recom-mended, and the fixed crack approach must be assumed insteadof the rotated crack approach. However, this is only valid for lowconcrete strengths and in these cases a proper test campaign tofind cohesion and friction angle of the interface seems to be quiteprudent.
The fixed crack approach was also associated to a more rigid re-sponse of the reinforced concrete T-beams when compared to thecomputational models with rotated crack approach. In terms ofbond stresses, the rigid interface models showed more deviate val-ues when compared to the experimental tests. Hence, a rigid GFRP-to-concrete interface is the less efficient assumption to modulatethe EBR system.
The different FE models used to simulate the cyclic tests repro-duces quite well the stiffness of the load and unload branches. But,once again, the behaviour of the experimental test is betterachieved when a rotated crack approach and an interface materialare assumed.
The T-beams externally strengthened with GFRP plates pre-sented good serviceability behaviour when tested under mono-tonic or cyclic loads, and increase the yielding moment to around16%. In what concerns the ductility, T-beams reaching approxi-mately 2.5% of drift in the monotonic test and less than 2.8% of driftin the cyclic test.
The serviceability behaviour of the T-beams improves with theincrease of the concrete strengths, revealing that concrete has afundamental influence on the de- bonding phenomenon. Again,the FEA with interface finite elements combined with the rotatedcrack approach predicts very well the displacement at mid-spanand consequently the deformation of the T-beams.
Acknowledgments
The authors are grateful to Fundação para a Ciência e Tecnologiafor partial financing of the work under Project PTDC/ECM/100538/2008. We appreciate the help of Prof. Vladimir Cervenka and Dr.-Ing. Dobromil Pryl with ATENA.
References
[1] Chastre Rodrigues C, Silva MG. The behaviour of RC columns retrofitted withFRP or polymeric concrete under axial compression and cyclic horizontal loads.In: 9th International conference on inspection, appraisal, repairs &maintenance of structures, Fuzhou, China; October 2005.
[2] Carvalho T, Chastre C, Biscaia H, Paula R. Flexural behaviour of RC T-beamsstrengthened with different FRP materials. In: Third international fib congressWashington; May–June 2010.
[3] Oehlers DJ. FRP plates adhesively bonded to reinforced concrete beams:generic debonding mechanisms. Adv Struct Eng 2006:737–50.

H.C. Biscaia et al. / Engineering Structures 56 (2013) 1346–1361 1361
[4] Pham HB, Al-Mahaidi R, Saouma V. Modelling of CFRP-concrete bond usingsmeared and discrete cracks. Compos Struct 2006;75(1-4):145–50.
[5] Sena Cruz JM, Barros JAO, Gettu R, Azevedo AFM. Bond behaviour of near-surface mounted CFRP laminate strips under monotonic and cyclic loading. JCompos Construct, ASCE 2006;10:295–303.
[6] Camata G, Spacone E, Zarnic R. Experimental and nonlinear finite elementstudies of RC beams strengthened with FRP plates. Compos B Eng2007;38(2):277–88.
[7] Neale KW, Ebead UA, Abdel Maky HM, Elsayed WE, Godat A. Modelling ofdebonding phenomena in FRP-strengthened concrete beams and slabs.International Institute for FRP in Construction; 2005.
[8] Lu XZ, Ye LP, Teng JG, Jiang JJ. Meso-scale finite element model for FRP sheets/plates bonded to concrete. Eng Struct 2005;27(4):564–75.
[9] Lu XZ, Ye LP, Teng JG, Jiang JJ. Bond slip models for FRP sheets/plates bonded toconcrete. Eng Struct 2005;27(6):920–37.
[10] Biscaia HEC, Chastre C, Silva MAG. Double shear tests to evaluate the bondstrength between GFRP/concrete elements. Compos Struct2012;94(2):681–94.
[11] Biscaia HEC, Silva MAG, Chastre C. Experimental characterization andnumerical modeling of the interface GFRP/concrete. In: 7th Cong.experimental mechanics, Vila Real, Portugal; 2008 [in Portuguese].
[12] Biscaia HEC. Debonding between external GFRP reinforcement and concretestructural elements. M.Sc. thesis. Instituto Superior Técnico; October 2006 [inPortuguese]
[13] Eurocode 2 (EC2). Eurocode 2: design of concrete structures – Part 1-1: generalrules ad rules for buildings. EN 1992-1-1; December 2004.
[14] Dai J, Ueda T, Sato Y. Development of the nonlinear bond stress-slip model offiber reinforced plastics sheet-concrete interfaces with a simple method. JCompos Construct 2005;9(1):52–62.
[15] Biscaia H, Chastre C, Silva MAG. Linear and nonlinear analysis of bond-slipmodels for interfaces between FRP composites and concrete. Compos: Part B J2013;45(1):1554–68.
[16] Lucas D. Degradação da resistência mecânica de vigas reforçadas com FRP. MScThesis, Faculdade de Ciências e Tecnologia da Universidade Nova de Lisboa;2010 [in Portuguese].
[17] Cervenka V, Jendele L, Cervenka J. ATENA program documentation – Part 1 –theory. Prague: Cervenka Consulting; May 2009.
[18] Neto P, Alfaiate J, Pires EB, Almeida RA. A influência do Modo II de fractura noreforço do betão com FRP. VII Congresso de Mecânica Aplicada eComputacional. Évora, Portugal; 2003. p. 57–64 [in Portuguese].
[19] Menegotto M, Pinto PE. Method of analysis for cyclically loaded R.C. planeframes including changes in geometry and non-elastic behavior of elementsunder combined normal force and bending. In: International Association forBridge and Structural Engineering, Band 13, Lisboa; 1973.
[20] Gomes A. Comportamento e Reforço de Elementos de Betão Armado Sujeitos aAcções Cíclicas. PhD Thesis, Instituto Superior Técnico; July 1992 [inPortuguese].
[21] Comité Euro-International du Betón. CEB-FIP Model Code 1990; 1990.[22] Ohmenhauser F, Weihe S, Kroplin B. Classification and algorithmic
implementation of smeared crack models. In: de Borst R, Bicanic N, Mang H,Meschke G, editors. Computational modelling of concretestructures. Rotterdam: Balkema; 1998.
[23] Simonelli G. Finite element analysis of RC beams retrofitted with fibrereinforced polymers. PhD thesis; 2005. p. 179–205 [chapter 6].
[24] Alfano G, Rosati L, Simonelli G. Modelling of failure mechanisms in RC beamsretrofitted with FRP flexure. In: Oñate E, Owen DRJ, editors. VIII internationalconference on computational plasticity, Barcelona; 2005.
[25] Lu XZ, Ye LP, Teng JG, Huang YL, Tan Z, Zhang ZX. Recent researches oninterfacial behavior of FRP sheets externally bonded to RC structures. In:Seracino, editor. FRP composites in civil engineering, CICE 2004. London:Taylor & Francis Group; 2005.
[26] Teng JG, Lu XZ, Ye LP, Jiang JJ. Bond-slip models for interfaces betweenexternally bonded FRP and concrete. In: Seracino, editor. FRP composites incivil engineering, CICE 2004. London: Taylor & Francis Group; 2005.


![AutoCAD Crack Free Registration Code 2022 [New]](https://static.fdokumen.com/doc/165x107/633ddc36d497af1eca0ff28c/autocad-crack-free-registration-code-2022-new.jpg)