
A simple model for examining issues in radiotherapy optimization
10
A simple model for examining issues in radiotherapy optimization David M. Shepard, a) Gustavo Olivera, Lisa Angelos, Otto Sauer, Paul Reckwerdt, and T. Rockwell Mackie Department of Medical Physics, University of Wisconsin – Madison, Madison, Wisconsin 53706-1532 Received 18 May 1998; accepted for publication 30 March 1999 Convolution/superposition software has been used to produce a library of photon pencil beam dose matrices. This library of pencil beams is designed to serve as a tool for both education and investigation in the field of radiotherapy optimization. The elegance of this pencil beam model stems from its cylindrical symmetry. Because of the symmetry, the dose distribution for a pencil beam from any arbitrary angle can be determined through a simple rotation of a pre-computed dose matrix. Rapid dose calculations can thus be performed while maintaining the accuracy of a convolution/superposition based dose computation. The pencil beam data sets have been made publicly available. It is hoped that the data sets will facilitate a comparison of a variety of optimi- zation and delivery approaches. This paper will present a number of studies designed to demon- strate the usefulness of the pencil beam data sets. These studies include an examination of the extent to which a treatment plan can be improved through either an increase in the number of beam angles and/or a decrease in the collimator size. A few insights into the significance of heterogeneity corrections for treatment planning for intensity modulated radiotherapy will also be presented. © 1999 American Association of Physicists in Medicine. S0094-24059902007-6 I. INTRODUCTION In recent years, the development of intensity modulated ra- diation therapy IMRT has provided many new opportuni- ties in the delivery of conformal radiotherapy. 1–13 There are, however, many unanswered questions about this new method of treatment delivery. The goal of this project has been the development of a test environment that provides a means for efficiently investigating some of the unresolved issues in IMRT. The test environment is also designed to serve as an educational tool that can benefit those who wish to learn more about this emerging field. In research fields ranging from cellular biology to eco- nomics, investigators have often used models to improve their understanding of complex problems. With a model that is well designed, one can analyze a difficult problem in a more manageable form. Despite the incorporation of numer- ous simplifying assumptions, a model can provide investiga- tors with key insights while minimizing time demands. This paper will present a radiotherapy model that is in- tended to serve as a tool in studying IMRT. Because this model includes a number of simplifying assumptions, it can- not be used to provide specific conclusions regarding indi- vidual disease sites. Rather, it is designed to enhance our understanding of optimization algorithms and proposed de- livery techniques. This project involved the computation of three pencil beam data sets. The data sets and the convolution code used to produce them are available through our web site at www- .madrad.radiology.wisc.edu. It is hoped that these pencil beams will provide a means of comparing proposed optimi- zation and delivery techniques. The goal of this paper is to provide a description of the data sets and to demonstrate the usefulness of these data in a variety of optimization studies. II. MATERIALS AND METHODS A. Dose computation A convolution/superposition method 14–16 was used to de- termine the dose delivered to a cylindrical phantom by a series of photon pencil beams. 17 The computations were per- formed for three distinct phantom setups. The first simulated phantom was a 20-cm-diameter all-water cylinder with a density of 1 g/cm 3 see Fig. 1a. The second simulated phantom used two cylinders shar- ing a common central axis. The inner cylinder had a 10 cm diameter, and the outer cylinder had a 20 cm diameter. The material located within the inner cylinder was assigned a density of 0.3 g/cm 3 ‘‘lung’’, and the region between the two cylinders was assigned a density of 1.0 g/cm 3 ‘‘wa- ter’’. Circular symmetry was maintained with this setup. This phantom was primarily designed to evaluate the impor- tance of heterogeneity corrections in IMRT treatment plan- ning. For both setups, the outer cylinder was surrounded by a medium of density zero, and the cylinders were partitioned into voxels 0.2 cm on each side. With these setups, we did not model either the geometric penumbra or the collimator transmission. Intensity horns were not included, but they can easily be accounted for in the optimization. With small pen- cil beam sizes, not including the horns will have very little effect on the final dose distribution. This is because the horns can be accounted for by modifying the final beam weights before determining the actual intensity pattern that needs to be delivered. In Fig. 1a, pencil beam one illustrates the geometry for a single pencil beam entering from the top of the phantom. The geometry of the delivery was such that each pencil beam 1212 1212 Med. Phys. 26 „7…, July 1999 0094-2405/99/26„7…/1212/10/$15.00 © 1999 Am. Assoc. Phys. Med.
Transcript of A simple model for examining issues in radiotherapy optimization

A simple model for examining issues in radiotherapy optimizationDavid M. Shepard,a) Gustavo Olivera, Lisa Angelos, Otto Sauer, Paul Reckwerdt,and T. Rockwell MackieDepartment of Medical Physics, University of Wisconsin–Madison, Madison, Wisconsin 53706-1532
!Received 18 May 1998; accepted for publication 30 March 1999"
Convolution/superposition software has been used to produce a library of photon pencil beam dosematrices. This library of pencil beams is designed to serve as a tool for both education andinvestigation in the field of radiotherapy optimization. The elegance of this pencil beam modelstems from its cylindrical symmetry. Because of the symmetry, the dose distribution for a pencilbeam from any arbitrary angle can be determined through a simple rotation of a pre-computed dosematrix. Rapid dose calculations can thus be performed while maintaining the accuracy of aconvolution/superposition based dose computation. The pencil beam data sets have been madepublicly available. It is hoped that the data sets will facilitate a comparison of a variety of optimi-zation and delivery approaches. This paper will present a number of studies designed to demon-strate the usefulness of the pencil beam data sets. These studies include an examination of theextent to which a treatment plan can be improved through either an increase in the number of beamangles and/or a decrease in the collimator size. A few insights into the significance of heterogeneitycorrections for treatment planning for intensity modulated radiotherapy will also be presented.© 1999 American Association of Physicists in Medicine. #S0094-2405!99"02007-6$
I. INTRODUCTION
In recent years, the development of intensity modulated ra-diation therapy !IMRT" has provided many new opportuni-ties in the delivery of conformal radiotherapy.1–13 There are,however, many unanswered questions about this new methodof treatment delivery. The goal of this project has been thedevelopment of a test environment that provides a means forefficiently investigating some of the unresolved issues inIMRT. The test environment is also designed to serve as aneducational tool that can benefit those who wish to learnmore about this emerging field.In research fields ranging from cellular biology to eco-
nomics, investigators have often used models to improvetheir understanding of complex problems. With a model thatis well designed, one can analyze a difficult problem in amore manageable form. Despite the incorporation of numer-ous simplifying assumptions, a model can provide investiga-tors with key insights while minimizing time demands.This paper will present a radiotherapy model that is in-
tended to serve as a tool in studying IMRT. Because thismodel includes a number of simplifying assumptions, it can-not be used to provide specific conclusions regarding indi-vidual disease sites. Rather, it is designed to enhance ourunderstanding of optimization algorithms and proposed de-livery techniques.This project involved the computation of three pencil
beam data sets. The data sets and the convolution code usedto produce them are available through our web site at www-.madrad.radiology.wisc.edu. It is hoped that these pencilbeams will provide a means of comparing proposed optimi-zation and delivery techniques. The goal of this paper is toprovide a description of the data sets and to demonstrate theusefulness of these data in a variety of optimization studies.
II. MATERIALS AND METHODS
A. Dose computation
A convolution/superposition method14–16 was used to de-termine the dose delivered to a cylindrical phantom by aseries of photon pencil beams.17 The computations were per-formed for three distinct phantom setups. The first simulatedphantom was a 20-cm-diameter all-water cylinder with adensity of 1 g/cm3 #see Fig. 1!a"$.The second simulated phantom used two cylinders shar-
ing a common central axis. The inner cylinder had a 10 cmdiameter, and the outer cylinder had a 20 cm diameter. Thematerial located within the inner cylinder was assigned adensity of 0.3 g/cm3 !‘‘lung’’", and the region between thetwo cylinders was assigned a density of 1.0 g/cm3 !‘‘wa-ter’’". Circular symmetry was maintained with this setup.This phantom was primarily designed to evaluate the impor-tance of heterogeneity corrections in IMRT treatment plan-ning.For both setups, the outer cylinder was surrounded by a
medium of density zero, and the cylinders were partitionedinto voxels 0.2 cm on each side. With these setups, we didnot model either the geometric penumbra or the collimatortransmission. Intensity horns were not included, but they caneasily be accounted for in the optimization. With small pen-cil beam sizes, not including the horns will have very littleeffect on the final dose distribution. This is because the hornscan be accounted for by modifying the final beam weightsbefore determining the actual intensity pattern that needs tobe delivered.In Fig. 1!a", pencil beam one illustrates the geometry for a
single pencil beam entering from the top of the phantom. Thegeometry of the delivery was such that each pencil beam
1212 1212Med. Phys. 26 „7…, July 1999 0094-2405/99/26„7…/1212/10/$15.00 © 1999 Am. Assoc. Phys. Med.
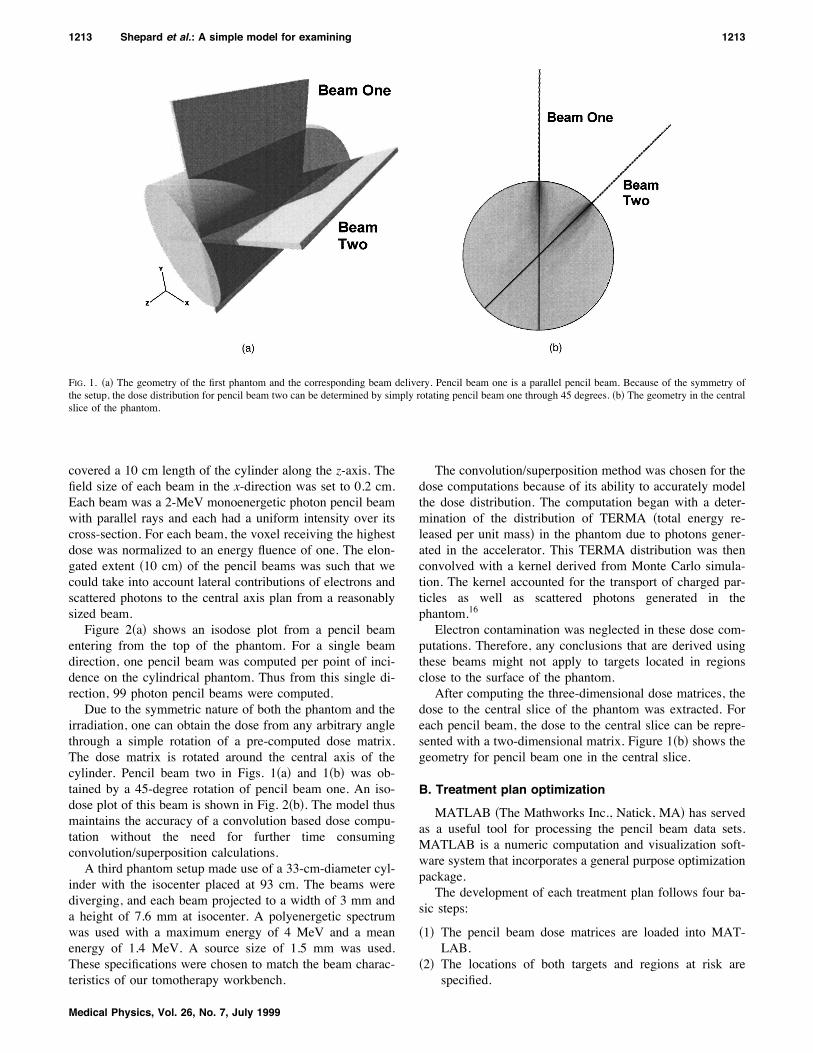
covered a 10 cm length of the cylinder along the z-axis. Thefield size of each beam in the x-direction was set to 0.2 cm.Each beam was a 2-MeV monoenergetic photon pencil beamwith parallel rays and each had a uniform intensity over itscross-section. For each beam, the voxel receiving the highestdose was normalized to an energy fluence of one. The elon-gated extent !10 cm" of the pencil beams was such that wecould take into account lateral contributions of electrons andscattered photons to the central axis plan from a reasonablysized beam.Figure 2!a" shows an isodose plot from a pencil beam
entering from the top of the phantom. For a single beamdirection, one pencil beam was computed per point of inci-dence on the cylindrical phantom. Thus from this single di-rection, 99 photon pencil beams were computed.Due to the symmetric nature of both the phantom and the
irradiation, one can obtain the dose from any arbitrary anglethrough a simple rotation of a pre-computed dose matrix.The dose matrix is rotated around the central axis of thecylinder. Pencil beam two in Figs. 1!a" and 1!b" was ob-tained by a 45-degree rotation of pencil beam one. An iso-dose plot of this beam is shown in Fig. 2!b". The model thusmaintains the accuracy of a convolution based dose compu-tation without the need for further time consumingconvolution/superposition calculations.A third phantom setup made use of a 33-cm-diameter cyl-
inder with the isocenter placed at 93 cm. The beams werediverging, and each beam projected to a width of 3 mm anda height of 7.6 mm at isocenter. A polyenergetic spectrumwas used with a maximum energy of 4 MeV and a meanenergy of 1.4 MeV. A source size of 1.5 mm was used.These specifications were chosen to match the beam charac-teristics of our tomotherapy workbench.
The convolution/superposition method was chosen for thedose computations because of its ability to accurately modelthe dose distribution. The computation began with a deter-mination of the distribution of TERMA !total energy re-leased per unit mass" in the phantom due to photons gener-ated in the accelerator. This TERMA distribution was thenconvolved with a kernel derived from Monte Carlo simula-tion. The kernel accounted for the transport of charged par-ticles as well as scattered photons generated in thephantom.16Electron contamination was neglected in these dose com-
putations. Therefore, any conclusions that are derived usingthese beams might not apply to targets located in regionsclose to the surface of the phantom.After computing the three-dimensional dose matrices, the
dose to the central slice of the phantom was extracted. Foreach pencil beam, the dose to the central slice can be repre-sented with a two-dimensional matrix. Figure 1!b" shows thegeometry for pencil beam one in the central slice.
B. Treatment plan optimization
MATLAB !The Mathworks Inc., Natick, MA" has servedas a useful tool for processing the pencil beam data sets.MATLAB is a numeric computation and visualization soft-ware system that incorporates a general purpose optimizationpackage.The development of each treatment plan follows four ba-
sic steps:
!1" The pencil beam dose matrices are loaded into MAT-LAB.
!2" The locations of both targets and regions at risk arespecified.
FIG. 1. !a" The geometry of the first phantom and the corresponding beam delivery. Pencil beam one is a parallel pencil beam. Because of the symmetry ofthe setup, the dose distribution for pencil beam two can be determined by simply rotating pencil beam one through 45 degrees. !b" The geometry in the centralslice of the phantom.
1213 Shepard et al.: A simple model for examining 1213
Medical Physics, Vol. 26, No. 7, July 1999

!3" The beams are rotated to the desired angles.!4" The beam intensity distributions are optimized to de-
velop the most favorable dose distribution.
For the studies presented in this paper, equispaced beamangles were used. The results for the few field optimizationscould potentially be improved with the use of optimally se-lected beam angles.18 Unfortunately, the problem of deter-mining the optimal angles for intensity-modulated beam de-livery is one of the most difficult in radiotherapy.3Each simulation uses a target placed within the central
slice. The voxels of the target are assumed to have the samedensity as the phantom. Thus the target does not alter thepre-computed dose matrices. Along with the target, one ormore regions at risk !RARs" are placed in the circular slice.A number of target shapes have been tested. In order to
test a simple target, a square shaped target was used with asmaller square shaped avoidance region located adjacent toit. An L-shaped target with a region at risk located betweenthe arms of the ‘‘L’’ was used to test a target of intermediatecomplexity. Finally, a U-shaped target has been used in thedevelopment of more complex treatment plans. This targethas a rectangular region at risk located in the concavity ofthe U. Each of the three target shapes was cut out of a 5 cmby 5 cm square. The pencil beam data sets have also beenused in simulations incorporating target shapes such as a
torus and a pseudo-prostate. These results are presentedelsewhere.19,20After the pre-computed dose matrices are loaded into
memory, the pencil beams are rotated to the specified angles.The weight of each beam is then optimized in order to pro-duce the most favorable dose distribution. For the resultspresented in this paper, each optimization was performedusing MATLAB’s Optimization Toolbox.21 A constrainednonlinear optimization routine called constr.m was used withall of the beam weights constrained to be nonnegative.22 Thisoptimization routine does not require the user to supply ana-lytic gradients.One useful implementation of these pencil beam data sets
is as a tool for exploring the advantages and disadvantages anumber of objective functions and optimization techniques.For example, the data sets have been used in a study ofiterative approaches to dose optimization including the maxi-mum likelihood estimator.19,23 A variety of linear, nonlinear,and mixed integer approaches to dose optimization have alsobeen tested using these pencil beams in conjunction with anumber of commercial optimization software packages in-cluding CONOPT, MINOS, OSL, and CPLEX.24–27 Approaches todose reconstruction have also been tested using these datasets.19This paper will not focus on optimization techniques. In-
stead, we will simply use a weighted least-squares objectivefunction in all of the analysis.11,13 In each simulation, theoptimizer sought to minimize the sum over all pixels of aweighted squared difference between the prescribed and theactual dose. The only constraint that was applied was a non-negativity constraint placed upon the beam weights. The op-timizer sought to minimize the objective function shown be-low:
Cost!% iTCi"% iNCi ,
TCi!!TWi /NT"*!Di#Dpre"2,
NCi!!NWi /NRAR"*!Di"2
where TC is the target cost, TW is the target weight, NC isthe normal tissue cost, NW is the normal tissue weight, Dpreis the prescribed dose, Di is the dose in voxel i, NT is thenumber of tumor voxels, NRAR is the number of voxels inRAR. Increasing the relative weight assigned to a targetforces the optimizer to seek a more uniform dose over thattarget. By increasing the relative weight assigned to a normaltissue, one forces the optimizer to reduce the dose to thattissue.TW1 is the weight assigned to the target. NW1 is the
weight assigned to the sensitive structure, and NW2 is theweight assigned to all other normal tissue. For our simula-tions, a single set of weighting factors was assigned previousto the optimization. It may be possible, however, to dynami-cally optimize the weighting factors, as was proposed byHristov.28The number of pixels in each region is used to normalize
the weighting factor assigned to that region. This prevents alarge sensitive structure from dominating the optimization.
FIG. 2. !a" An isodose plot of an individual pencil beam in the central sliceof the phantom. !b" The same beam rotated through 45 degrees. The dosedoes not need to be recomputed as a result of the symmetry.
1214 Shepard et al.: A simple model for examining 1214
Medical Physics, Vol. 26, No. 7, July 1999
Unless otherwise stated, the results presented in this paperused the following weights: TW1!15, NW1!1, NW2!1.After a number of optimizations were performed, it was de-termined that these beam weights consistently producedquality dose distributions.The least-squares objective function that was outlined
above is a convex function. Thus the optimizer can providethe global minimum of the objective function. It is likely,however, that the solution will not be unique. In other words,there may be a number of beam weight combinations thatproduce the global minimum of the objective function. Thusthe final dose distribution can in part depend upon the initialbeam weight selection. Tests have been performed to explorethe importance of this result.
C. Limitations
In any study making use of a model, it is essential that theuser understand the limitations of the model. Some of thelimitations of the pencil beam data sets are listed below:
!1" Only coplanar beams are available.!2" Charged particle contamination ignored.!3" Only photon beams are provided.!4" Although the dose was computed in 3D, the optimiza-
tions are performed in a single slice.!5" Two of the pencil beam data sets are parallel in nature.
!6" There are no heterogenieties with large atomic numberdifferences.
This model does not provide the ability to include noncopla-nar beams in the development of a treatment plan. Nonco-planar beams can be of assistance, particularly when a smallnumber of beam angles are used. With a large number ofbeam angles, however, the benefit of adding noncoplanarbeams is more limited.18 In tomotherapy only coplanarbeams are used.The first two pencil data sets consist of monoenergetic
parallel pencil beams with an energy of 2 MeV. Although thebeams have a relatively low energy, the choice was consid-ered appropriate for the 20-cm-diameter phantom.It should also be noted that the dose computation did not
account for charged particle contamination. Charged particlecontamination is of particular importance with superficialtargets where electron contamination can contribute substan-tially to the dose distribution.
III. RESULTS AND DISCUSSIONA. Beam delivery technique and target complexity
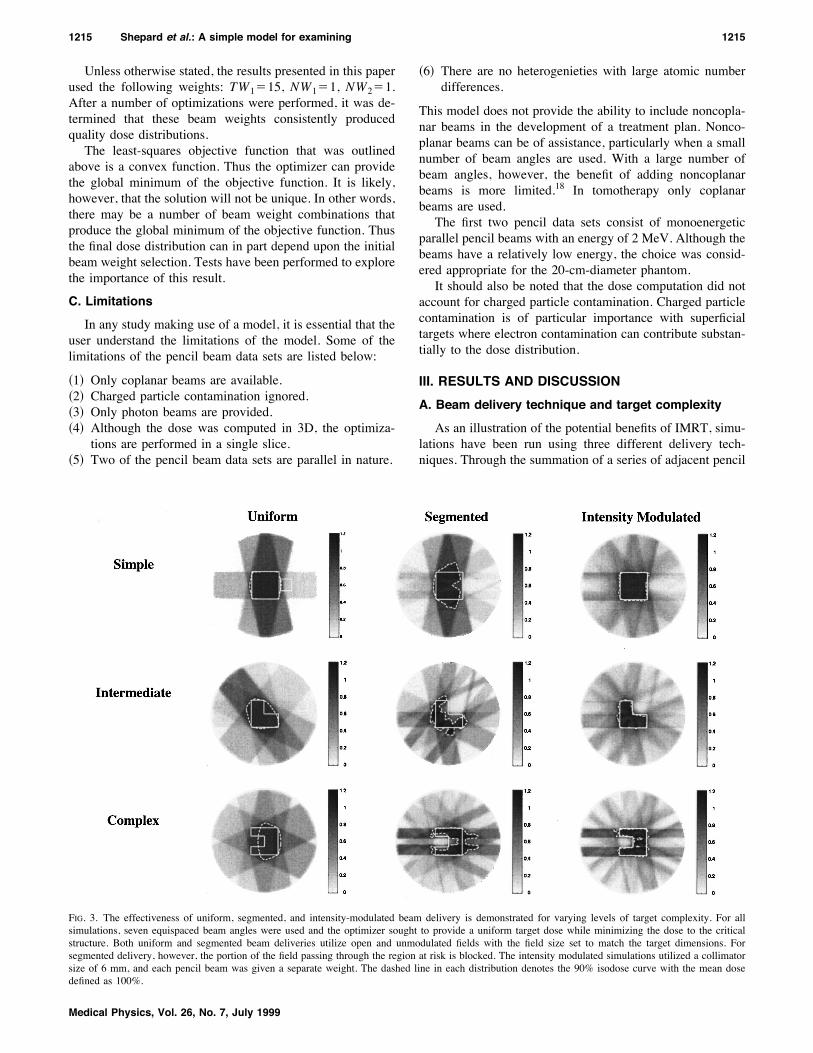
As an illustration of the potential benefits of IMRT, simu-lations have been run using three different delivery tech-niques. Through the summation of a series of adjacent pencil
FIG. 3. The effectiveness of uniform, segmented, and intensity-modulated beam delivery is demonstrated for varying levels of target complexity. For allsimulations, seven equispaced beam angles were used and the optimizer sought to provide a uniform target dose while minimizing the dose to the criticalstructure. Both uniform and segmented beam deliveries utilize open and unmodulated fields with the field size set to match the target dimensions. Forsegmented delivery, however, the portion of the field passing through the region at risk is blocked. The intensity modulated simulations utilized a collimatorsize of 6 mm, and each pencil beam was given a separate weight. The dashed line in each distribution denotes the 90% isodose curve with the mean dosedefined as 100%.
1215 Shepard et al.: A simple model for examining 1215
Medical Physics, Vol. 26, No. 7, July 1999
beams, one can produce uniform broad beams. This tech-nique provides the opportunity to simulate the delivery ofuniform or segmented fields for comparison with IMRT.Both uniform and segmented beam deliveries utilize openand unmodulated fields with the field size set to match thetarget dimensions. For segmented delivery, however, theportion of the field passing through the region at risk isblocked. The intensity-modulated simulations used a colli-mator size of 6 mm, and each pencil beam was given aseparate weight.Figure 3 compares optimized dose distributions obtained
using all three delivery methods. In all cases, seven equis-paced beam angles were used, and the beam weights wereoptimized using the weighted least-squares objective func-
tion. The benefits of intensity-modulation are most apparentwith the complex target shape. Although segmented fieldscan provide a significant sparing of sensitive structures lo-cated in close proximity to the target, only IMRT can pro-vide both sparing of the regions at a risk and dose uniformityin the target. In Fig. 3, one should note that IMRT providesthe ability to provide tight contours matching the tumorshape.
B. Collimator size and few versus many angles
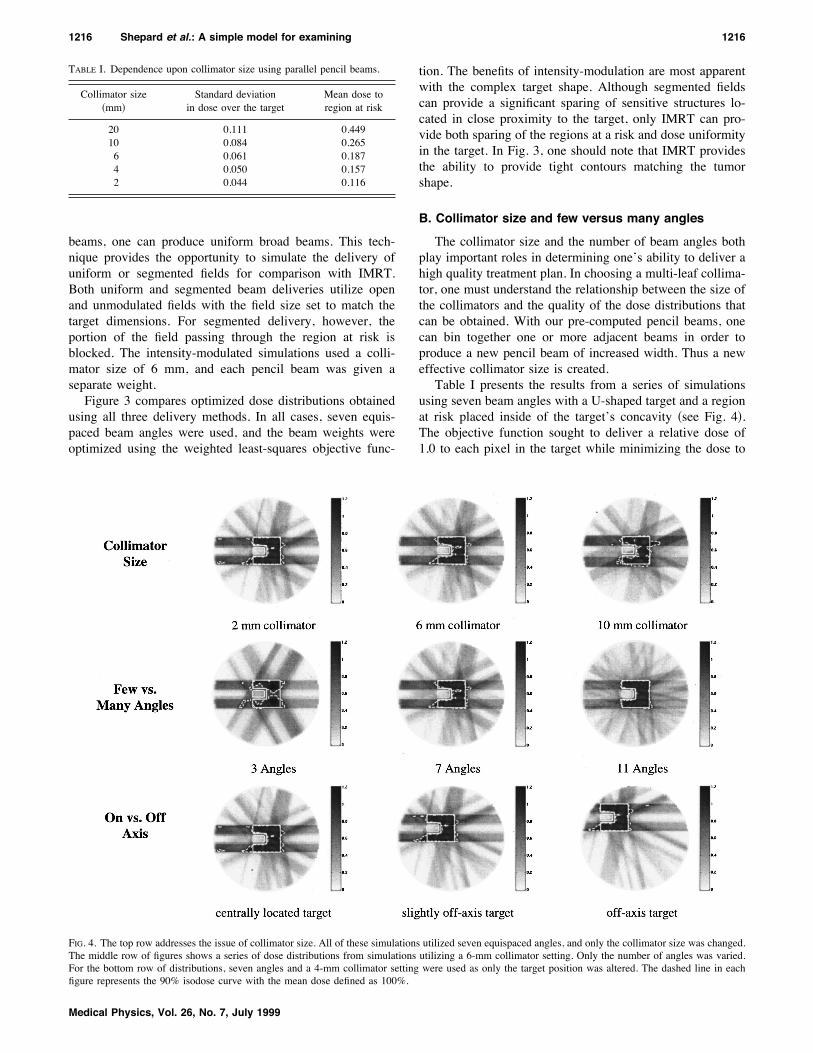
The collimator size and the number of beam angles bothplay important roles in determining one’s ability to deliver ahigh quality treatment plan. In choosing a multi-leaf collima-tor, one must understand the relationship between the size ofthe collimators and the quality of the dose distributions thatcan be obtained. With our pre-computed pencil beams, onecan bin together one or more adjacent beams in order toproduce a new pencil beam of increased width. Thus a neweffective collimator size is created.Table I presents the results from a series of simulations
using seven beam angles with a U-shaped target and a regionat risk placed inside of the target’s concavity !see Fig. 4".The objective function sought to deliver a relative dose of1.0 to each pixel in the target while minimizing the dose to
FIG. 4. The top row addresses the issue of collimator size. All of these simulations utilized seven equispaced angles, and only the collimator size was changed.The middle row of figures shows a series of dose distributions from simulations utilizing a 6-mm collimator setting. Only the number of angles was varied.For the bottom row of distributions, seven angles and a 4-mm collimator setting were used as only the target position was altered. The dashed line in eachfigure represents the 90% isodose curve with the mean dose defined as 100%.
TABLE I. Dependence upon collimator size using parallel pencil beams.
Collimator size!mm"
Standard deviationin dose over the target
Mean dose toregion at risk
20 0.111 0.44910 0.084 0.2656 0.061 0.1874 0.050 0.1572 0.044 0.116
1216 Shepard et al.: A simple model for examining 1216
Medical Physics, Vol. 26, No. 7, July 1999
the sensitive structure. Parallel pencil beams were used inthis case. It can be seen that as the collimator size is progres-sively reduced from 2.0 cm to 0.2 cm, there is a markedimprovement in the uniformity of the target dose.The results shown in Table II were produced using the
diverging pencil beams. A variety of collimator sizes weretested along with a U-shaped target and seven beam angles.Comparing Tables I and II, one might note that the simu-
lations that used parallel pencil beams always produced amore uniform target dose and a higher mean dose to theregion at risk. One must be careful, however, in making thiscomparison, because the setup used in computing the diverg-ing beams involved both a larger phantom and a differentbeam energy than was used in computing the parallel beams.
The use of an MLC with a small leaf size can be consid-ered analogous to the use of a small detector size in imaging.A smaller leaf size provides an improved ability to deliver adose distribution that incorporates high frequency compo-nents. Due to electron transport, however, the gains achiev-able with a decrease in the collimator size should reach aplateau. In Tables I and II, it is interesting to note that sig-nificant improvements in the dose distribution were obtainedeven as the leaf size was reduced to 2 mm. This is on theorder of the distance of the lateral electron transport. Al-
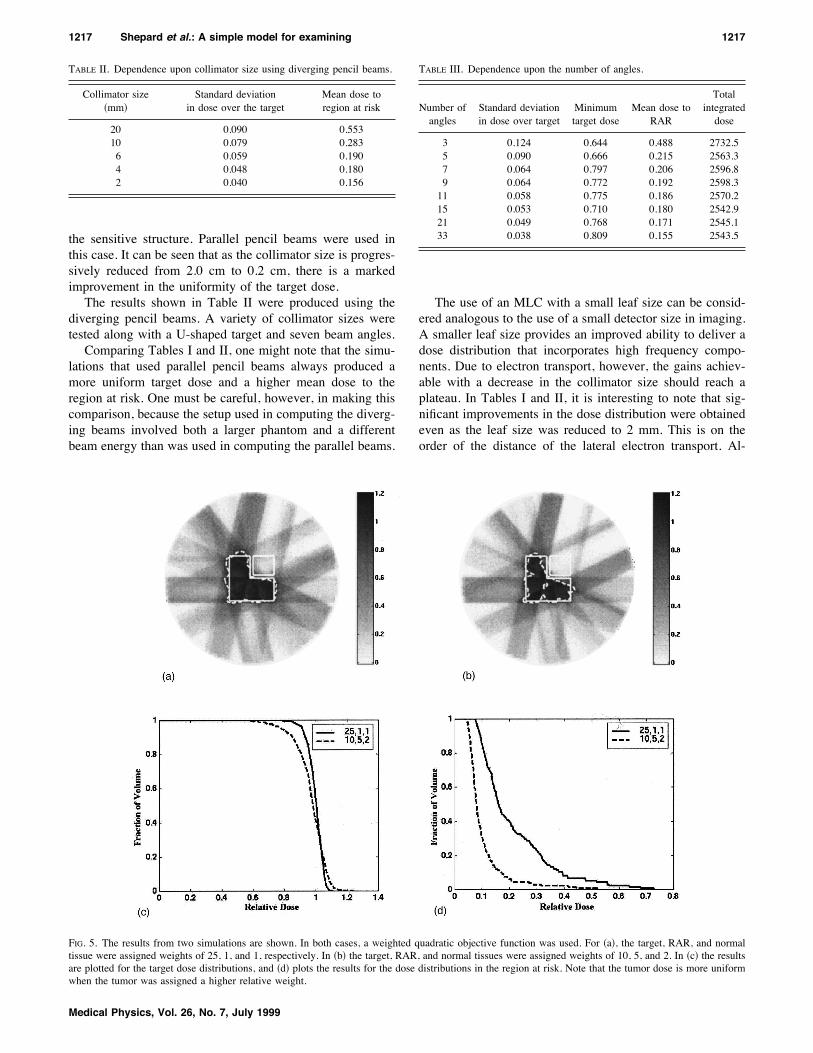
FIG. 5. The results from two simulations are shown. In both cases, a weighted quadratic objective function was used. For !a", the target, RAR, and normaltissue were assigned weights of 25, 1, and 1, respectively. In !b" the target, RAR, and normal tissues were assigned weights of 10, 5, and 2. In !c" the resultsare plotted for the target dose distributions, and !d" plots the results for the dose distributions in the region at risk. Note that the tumor dose is more uniformwhen the tumor was assigned a higher relative weight.
TABLE II. Dependence upon collimator size using diverging pencil beams.
Collimator size!mm"
Standard deviationin dose over the target
Mean dose toregion at risk
20 0.090 0.55310 0.079 0.2836 0.059 0.1904 0.048 0.1802 0.040 0.156
TABLE III. Dependence upon the number of angles.
Number ofangles
Standard deviationin dose over target
Minimumtarget dose
Mean dose toRAR
Totalintegrateddose
3 0.124 0.644 0.488 2732.55 0.090 0.666 0.215 2563.37 0.064 0.797 0.206 2596.89 0.064 0.772 0.192 2598.311 0.058 0.775 0.186 2570.215 0.053 0.710 0.180 2542.921 0.049 0.768 0.171 2545.133 0.038 0.809 0.155 2543.5
1217 Shepard et al.: A simple model for examining 1217
Medical Physics, Vol. 26, No. 7, July 1999
though the plateau was not reached, a leaf size smaller than 1or 2 mm would be very difficult to implement from a tech-nological point of view.The optimal number of beam angles for the delivery of
IMRT has been the subject of much debate.3,29–31 For deliv-ery methods other than tomotherapy, an increase in the num-ber of angles can lead to a more complex and more timeconsuming treatment delivery. It is thus important to under-stand the correlation between the number of beam angles andthe quality of the treatment plans that can be produced. Agroup of simulations have been run in which all parameterswere held constant except for the number of beam angles.The simulations employed the U-shaped target. The collima-tor size was set at 0.6 cm, and the angles were equispaced. Afew of the results are shown in Fig. 4, and more informationis presented in Table III.In Table III, the column of values showing the minimum
target dose may appear somewhat perplexing. The minimumtarget dose seems to be independent of the number of beamangles. This inconsistency reveals a weakness of the simplequadratic objective function. The objective function is deter-mined by summing squared differences over all of the voxelsin the patient. Thus one individual voxel has very little in-fluence on the total value of the objective function. As aresult, a dose distribution that provides the optimal objectivefunction value may significantly underdose a few target vox-els in order to spare a neighboring sensitive structure. Asuboptimal plan of this type could permit the survival of asmall number of clonogens, and this could eventually lead totumor recurrence.32 One could attempt to prevent this under-dosage by increasing the relative weight assigned to the tar-get. This is illustrated in Fig. 5.From Table III, it should also be noted that the mean dose
to the region at risk changed by less than 2% as the numberof beam angles was increased beyond seven. Of interest isthe fact that the mean dose to the region at risk did notstrictly decrease with each increase in the number of angles.One explanation of this result is that an increase in the mean
dose to the region at risk can accompany a decrease in theobjective function if there is a simultaneous improvement inthe tumor dose uniformity. A second explanation is that, withequispaced beam angles, it is possible that an increase in thenumber of beam angles could lead to a slightly less optimalset of beam directions. For example, one can imagine thatthree equispaced beam angles might provide a more accept-able set of beam directions that two sets of parallel opposedbeams. Thus the increase from three to four beam directionscould actually degrade the quality of the treatment plan.With a large number of angles, however, this effect wouldnot be seen.The preferred pencil beams are those that can irradiate the
tumor while simultaneously sparing the sensitive structures.Initially, each increase in the number of beam angles pro-vides a significant improvement in the available beam paths.For this particular setup, however, increasing the number ofangles beyond nine had little effect on the target dose uni-formity.A second approach to the addition of beam angles has
also been tested. After optimizing for an initial set of angles,new beams were added while maintaining the original beampositions. The new beams were placed between each of theexisting beams. A new optimization was then performed.Results using this technique are shown in Table IV. Whenthis approach to increasing the number of beams was used,
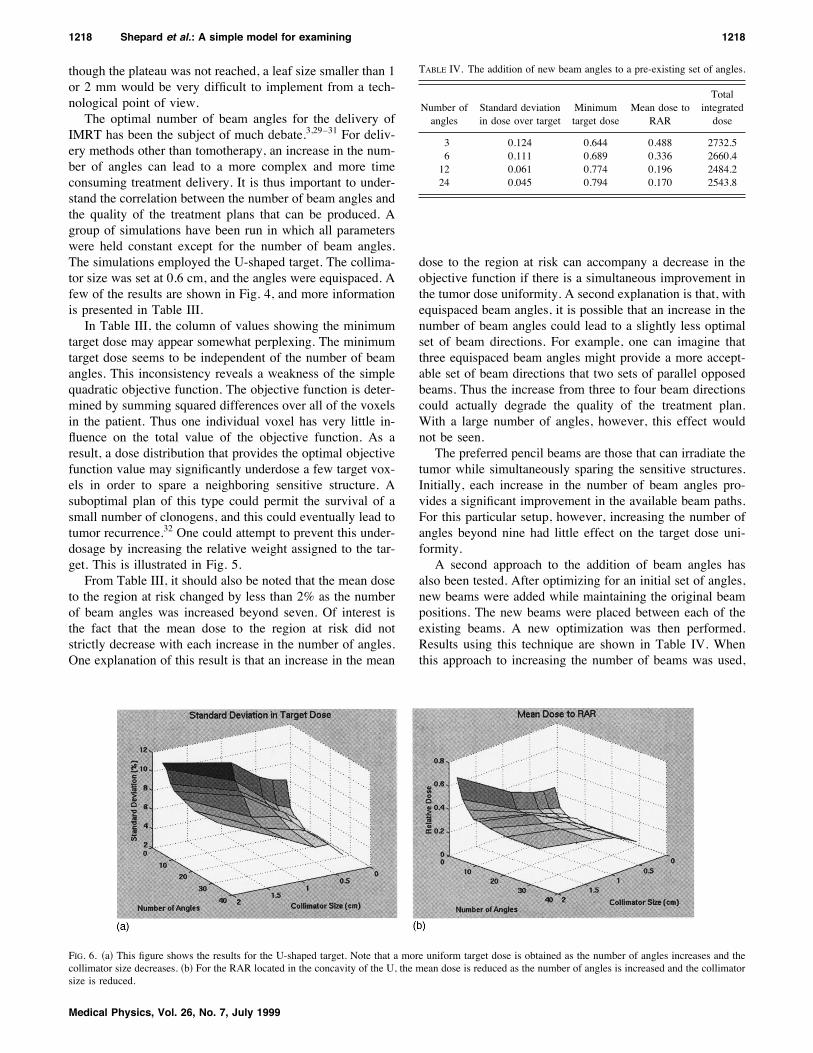
FIG. 6. !a" This figure shows the results for the U-shaped target. Note that a more uniform target dose is obtained as the number of angles increases and thecollimator size decreases. !b" For the RAR located in the concavity of the U, the mean dose is reduced as the number of angles is increased and the collimatorsize is reduced.
TABLE IV. The addition of new beam angles to a pre-existing set of angles.
Number ofangles
Standard deviationin dose over target
Minimumtarget dose
Mean dose toRAR
Totalintegrateddose
3 0.124 0.644 0.488 2732.56 0.111 0.689 0.336 2660.412 0.061 0.774 0.196 2484.224 0.045 0.794 0.170 2543.8
1218 Shepard et al.: A simple model for examining 1218
Medical Physics, Vol. 26, No. 7, July 1999
each parameter improved continuously as the number ofbeam angles was increased.From the last column in Tables III and IV, it is important
to note that the total integrated dose is nearly independent ofthe number of angles. Changing the number of angles simplyalters the manner in which the same integral dose is‘‘spent.’’ Thus a rotational beam delivery such as tomo-therapy should not increase the integral dose or the totalenergy delivered to the patient.The combined effects of changes in the collimator size
and the number of beam angles for the U-shaped target areshown in Fig. 6. The results are also presented in Table Vand Table VI. In general, as the number of angles is in-creased and the collimator size is decreased, one will seeboth a lower standard deviation in dose over the target and alower mean dose to the region at risk. This is analogous tocomputed tomography !CT" where the image quality im-proves as the number of projections is increased and thedetector size is decreased.In each optimization, a compromise is reached between
the need for target uniformity and the desire to spare thesensitive structure. With a small number of beam angles anda large collimator size, these two goals can become mutuallyexclusive. This can be seen in Fig. 6 when three beam angleswere used along with a collimator size of 2 cm. For thosesettings, the final dose distribution provided a uniform targetdose with very little sparing of the sensitive structure.
C. Target location
Simulations have been run using a number of differenttarget locations. The goal of these simulations was to exam-ine the extent to which target location influences the abilityto achieve a uniform target dose distribution.Two simulations were run at different off-axis locations
using seven beam angles, a collimator size of 6 mm, and theU-shaped target. In Table VII, the results are shown for acentrally located target. In Table VIII, the results are tabu-lated from a simulation using a target located in the periph-ery of the cylinder. This off-axis target was located farenough from the surface of the phantom so that the neglectof charged particle contamination should not have had a sig-nificant impact on the results. In both cases, the tumor wasprescribed a dose of one and a dose of zero was prescribedelsewhere.In the Tables VII and VIII, the ‘‘non-PTV’’ region incor-
porated all of the pixels located outside both the target andthe region at risk. The total integrated dose was approxi-mately 17% higher for the centrally located target. The pe-ripheral target location results in a reduction in the integraldose, because greater emphasis can be placed upon thosebeams that enter the patient in close proximity to the tumor.The results from a number of simulations suggest that theplacement of the target does not significantly impact the abil-ity to achieve a uniform target dose and spare the sensitivestructure !see Fig. 4".
D. Inhomogeneities
The second simulated phantom has provided an opportu-nity to study the extent to which inhomogeneities perturb thedose distribution. A set of simulations was run using thewater-and-lung phantom. Next, the beams computed for theall-water phantom were used in a new set of simulations thatincorporated the same target setups. For comparison, thebeam weights from the all-water simulations were applied tothe water-and-lung phantom. For example, Table IX showsresults obtained from an optimization using the water-and-
TABLE V. Percent standard deviation in the target dose as a function of thecollimator size and the number of beam angles for the U-shaped target.
Collimator size !cm"
2.0 1.0 0.6 0.4 0.2
Number of angles 3 10.5 12.1 11.8 11.7 11.65 11.5 10.1 8.0 7.4 7.17 11.1 8.4 6.1 5.0 4.49 9.8 7.6 5.7 4.5 3.811 9.3 7.3 5.5 4.7 3.615 9.0 5.6 5.1 4.2 2.921 8.5 5.2 4.5 4.1 3.133 8.7 5.5 4.1 4.1 2.7
TABLE VI. Mean dose to the region at risk as a function of the collimatorsize and the number of beam angles for the U-shaped target.
Collimator size !cm"
2.0 1.0 0.6 0.4 0.2
Number of angles 3 0.696 0.406 0.335 0.315 0.3105 0.526 0.275 0.209 0.182 0.1537 0.449 0.265 0.187 0.157 0.1169 0.386 0.266 0.174 0.141 0.09811 0.385 0.278 0.180 0.156 0.11415 0.357 0.232 0.182 0.134 0.08721 0.337 0.235 0.172 0.148 0.08933 0.329 0.239 0.191 0.145 0.092
TABLE VII. Dependence upon target location—centrally located.
Minimumdose
Maximumdose
Meandose Sum
Target 0.77 1.13 0.99 539.0Region at risk 0.14 0.50 0.23 15.0Non-PTV 0.00 1.05 0.30 2264.3Total dose 2803.3
TABLE VIII. Dependence upon target location—peripherally located.
Minimumdose
Maximumdose
Meandose Sum
Target 0.72 1.17 0.99 540.4Region at risk 0.08 0.44 0.17 11.1Non PTV 0.00 1.06 0.23 1790.2Total dose 2330.6
1219 Shepard et al.: A simple model for examining 1219
Medical Physics, Vol. 26, No. 7, July 1999
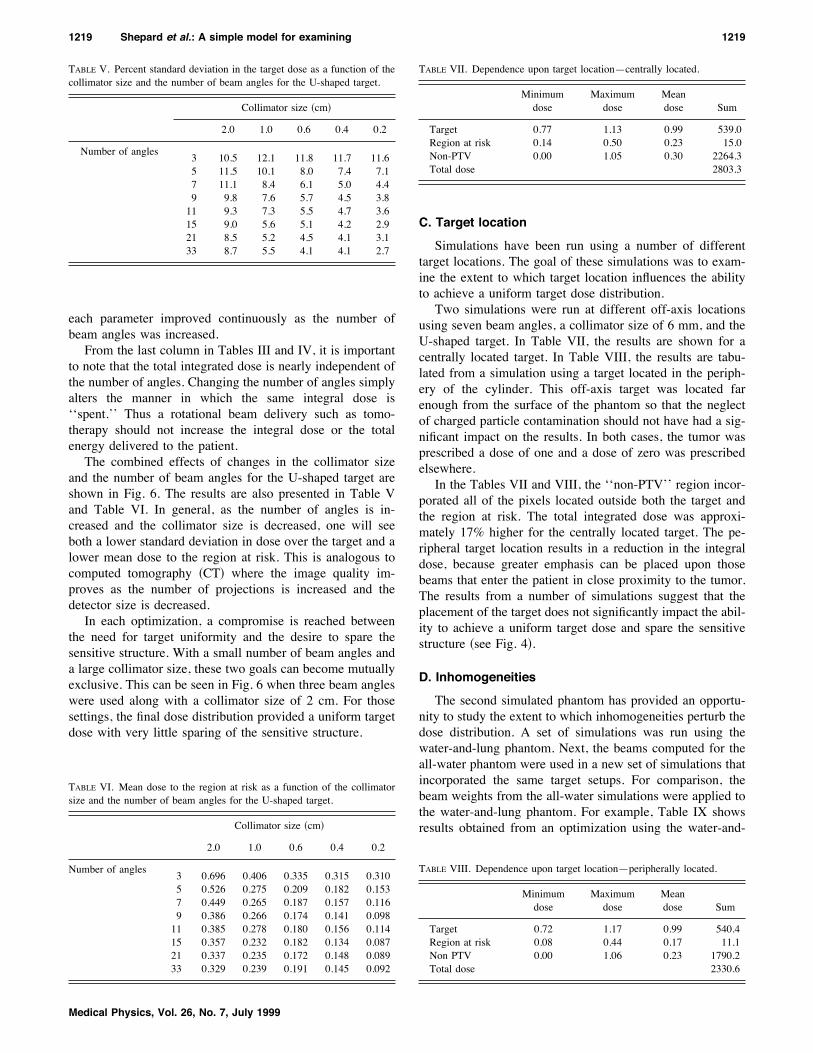
lung phantom with nine angles and a 6-mm collimator set-ting. An off-axis U-shaped target was used with the targetstraddling both the lung and the water portions of the phan-tom. Next, a second optimization was run using the samesetup and the all-water phantom. The beam weights calcu-lated for the all-water phantom were then applied to thebeams computed for the water-and-lung phantom. The re-sults are shown in Table X.The maximum dose to the target and region at risk were
both increased, but the cumulative dose volume histogramwas relatively unaffected. The relative change in the dosedistribution was influenced by two distinct phenomena. First,the beams passing through the lung region were attenuatedless rapidly than were those that only passed through water.Second, the portion of the tumor located in the lung had a
lower attenuation coefficient. A greater fluence was thusneeded to deposit the required dose to the lower density re-gion. The dose distributions for the two simulations alongwith their corresponding cumulative dose volume histogramsare shown in Fig. 7.For this case, a failure to properly correct for the phan-
tom’s inhomogeneity primarily affected the absolute ratherthan the relative dose distribution. In order to further ourunderstanding of the importance of heterogeneity correc-tions, we ran simulations with a variety of initial beamangles. In all instances, the beam weights for the all-watercase followed a pattern similar to that for the water-and-lungcase. It should be noted, however, that with a high densityinhomogeneity, there would be a much greater impact on thecontours of the dose distribution.
FIG. 7. !a" The optimized dose distribution for the U-shaped target with proper heterogeneity corrections. The lower left portion of the target is located withinthe centrally located lung heterogeneity. The dashed line represents the 90% isodose line. !b" Optimized beam weights were computed for the all-waterphantom. Those beam weights were then applied to the properly heterogeneity corrected pencil beams. Note the change in the 90% isodose line. !c" and !d"The cumulative dose volume histograms for the target and region at risk respectively. In !c" and !d", the solid line plots the result from !a" and the dashed lineplots the result from !b".
TABLE IX. Results of optimization performed on the water-and-lung phan-tom using inhomogeneity corrected pencil beams.
Minimumdose
Maximumdose
Meandose Sum
Target 0.76 1.10 0.99 539.7Region at risk 0.13 0.53 0.25 16.8
TABLE X. Results of applying all-water optimized beam weights to water-and-lung phantom.
Minimumdose
Maximumdose
Meandose Sum
Target 0.76 1.16 1.02 558.6Region at risk 0.19 0.57 0.30 19.6
1220 Shepard et al.: A simple model for examining 1220
Medical Physics, Vol. 26, No. 7, July 1999
Our results suggest that it may be useful to optimize atreatment plan without heterogeneity corrections. This wouldpermit the use of a very simple dose engine that could pro-vide a significant speed up. The resultant beam weightscould then be used as an initial guess in an optimization thatincludes an accurate heterogeneity correction. Overall, thistechnique might provide a more rapid path to an acceptablesolution.
IV. CONCLUSIONSA simple model for investigating issues in IMRT has been
presented. The pencil beam data sets have been designed toserve as a tool for education and investigation in radio-therapy. Their usefulness has been demonstrated through anumber of studies. The pencil beam data sets along with thecode used to compute them have been made publicly avail-able through our website at www.madrad.radiology.wis-c.edu. We are currently using these pencil beams in an ex-tensive study into the advantages and disadvantages of anumber of optimization approaches.
a"Present address: Department of Radiation Oncology, University of Mary-land School of Medicine, Baltimore, MD 21201-1532.1T. Bortfeld, A. L. Boyer, W. Schlegel, D. L. Kahler, and T. J. Waldron,‘‘Realization and verification of three-dimensional conformal radio-therapy with modulated fields #see comments$,’’ Int. J. Radiat. Oncol.,Biol., Phys. 30, 899–908 !1994".2A. L. Boyer, ‘‘Present and future developments in radiotherapy treatmentunits,’’ Seminars in Radiation Oncology 5, 146–155 !1995".3A. Brahme, ‘‘Optimization of radiation therapy and the development ofmultileaf collimation,’’ Int. J. Radiat. Oncol., Biol., Phys. 25, 373–375!1993".4M. Carol, H. Targovnik, D. Smith, and D. Cahill, ‘‘3-D planning anddelivery system for optimzed conformal therapy,’’ Int. J. Radiat. Oncol.,Biol., Phys. 24, 159 !1992".5M. Carol, W. H. Grant, A. R. Bleier, A. A. Kania, H. Targovnik, E. B.Butler, and S. W. Woo, ‘‘The field-matching problem as it applies to thePeacock three dimensional conformal system for intensity modulation,’’Int. J. Radiat. Oncol., Biol., Phys. 34, 183–187 !1996".6O. Dahl, D. Kardamakis, B. Lind, and J. C. Rosenwald, ‘‘Current statusof conformal radiotherapy,’’ Acta Oncol. 35, 41–57 !1996".7Z. Fuks, S. Leibel, G. J. Kutcher, R. Mohan, and C. C. Ling, ‘‘Three-dimensional conformal treatment: A new frontier in radiation therapy,’’Important Advances in Oncology, 151–172 !1991".8D. D. Leavitt, M. Martin, J. H. Moeller, and W. Lok Lee, ‘‘Dynamicwedge field techniques through computer-controlled collimator motionand dose delivery,’’ Med. Phys. 17, 87–92 !1990".9T. R. Mackie, T. Holmes, S. Swerdloff, P. Reckwerdt, J. O. Deasy, J.Yang, B. Paliwal, and T. Kinsella, ‘‘Tomotherapy: A new concept for thedelivery of dynamic conformal radiotherapy,’’ Med. Phys. 20, 1709–1719 !1993".
10R. Mohan, ‘‘Field shaping for three-dimensional conformal radiationtherapy and multileaf collimation,’’ Seminars in Radiation Oncology 5,86–99 !1995".
11E. S. Sternick, The Theory and Practice of Intensity Modulated RadiationTherapy !Advanced Medical Publishing, Madison, WI, 1997".
12L. J. Verhey, ‘‘3-D conformal therapy using beam intesity modulation,’’Frontiers in Radiation Therapy and Oncology 29, 139–155 !1996".
13S. Webb, The Physics of Conformal Radiotherapy: Advances in Technol-ogy !IOP Publishing, Philadelphia, 1997".
14T. R. Mackie, J. W. Scrimger, and J. J. Batista, ‘‘A convolution methodof calculating dose from 15 MeV x-rays,’’ Med. Phys. 12, 188–196!1985".
15N. Papanikolaou, T. R. Mackie, C. Meger-Wells, M. Gehring, and P.Reckwerdt, ‘‘Investigation of the convolution method for polyenergeticspectra,’’ Med. Phys. 20, 1327–1336 !1993".
16T. R. Mackie, P. Reckwerdt, and N. Papanikolau, ‘‘3-D photon beamdose algorithms,’’ presented at the 3-D Radiation Treatment Planning andConformal Therapy, St. Louis, MO, 1993 !unpublished".
17D. M. Shepard, L. Angelos, O. A. Sauer, and T. R. Mackie, ‘‘A simplemodel for examining radiotherapy optimization,’’ presented at the XIIInternational Conference on the Use of Computers in Radiation Therapy,Salt Lake City, Utah, 1997 !unpublished".
18M. Oldham, V. S. Khoo, C. G. Rowbottom, J. L. Bedford, and S. Webb,‘‘A case study comparing the relative benefit of optimizing beam weights,wedge angles, beam orientations and tomotherapy in stereotactic radio-therapy of the brain,’’ Phys. Med. Biol. 43, 2123–2146 !1998".
19G. H. Olivera, D. Shepard, P. J. Reckwerd, K. Ruchala, J. Zachman, E. E.Fitchard, and T. R. Mackie, ‘‘Maximum likelihood as a common compu-tational framework in tomotherapy,’’ Phys. Med. Biol. 43, 3277–3294!1998".
20D. M. Shepard, G. H. Olivera, P. J. Reckwerdt, and T. R. Mackie, ‘‘It-erative approaches to dose optimization in tomotherapy,’’ Phys. Med.Biol. !submitted".
21A. Grace, Optimization Toolbox for Use with Matlab !The Mathworks,Inc., Natick, MA, 1995".
22P. E. Gill, W. Murray and M. H. Wright, Practical Optimization !Aca-demic, London, 1981".
23J. Llacer, ‘‘Bayesian smoothing for iterative inverse radiation treatmentplanning,’’ presented at the American Association of Physicists in Medi-cine, San Antonio, 1998 !unpublished".
24D. M. Shepard, M. C. Ferris, G. H. Olivera, and T. R. Mackie, ‘‘Opti-mizing the delivery of radiation therapy to cancer patients,’’ SIAM !Soc.Ind. Appl. Math." Rev. !accepted" !1998".
25Using the CPLEX(TM) Linear Optimizer and CPLEX(TM) Mixed IntegerOptimization (Version 2.0) !CPLEX Optimization Inc., Incline Village,Nevada, 1992".
26A. Drud, ‘‘CONOPT: A GRG code for large sparse dynamic nonlinearoptimization problems,’’ Math. Program. 31, 153–191 !1985".
27B. A. Murtagh and M. A. Saunders, MINOS 5.0 user’s guide !StanfordUniversity, Stanford, CA, 1983".
28D. H. Hristov and B. G. Fallone, ‘‘A continuous penalty function methodfor inverse treatment planning,’’ Med. Phys. 25, 208–223 !1998".
29R. Mohan and C. Ling, ‘‘When becometh less more,’’ Int. J. Radiat.Oncol., Biol., Phys. 33, 235–237 !1995".
30S. Soderstrom and A. Brahme, ‘‘Which is the most suitable number ofphoton beam portals in coplanar radiation therapy? #see comments$,’’ Int.J. Radiat. Oncol., Biol., Phys. 33, 151–159 !1995".
31T. R. Mackie, J. Deasy, T. Holmes, and J. Fowler, ‘‘Letter in response to‘Optimization of radiation therapy and the development of multileaf col-limation’ by Anders Brahme,’’ Int. J. Radiat. Oncol., Biol., Phys. 28,784–785 !1994".
32S. Leibel and Z. Fuks, ‘‘The impact of local tumor control on the outcomein human cancer,’’ presented at the 3-D Radiation Treatment Planningand Conformal Therapy, St. Louis, MO, 1993 !unpublished".
1221 Shepard et al.: A simple model for examining 1221
Medical Physics, Vol. 26, No. 7, July 1999