A Review of Trends in Banking Indicators in North Eastern Region of India
38
A Review of Trends in Banking Indicators in North Eastern Region of India * The authors are Chief General Manager, RPCD, RBI, Mumbai, formerly Regional Director of North Eastern States and Director, Reserve Bank of India. These are personal views of the authors. Amarendra Sahoo and J.K. Khundrakpam* This paper reviews whether the rapid growth in banking indicators in the North Eastern region of India following nationalisation of 14 major banks in 1969 and another six in 1980 based on social banking was sustained or not. It finds a phenomenon of retarding trend in almost all the banking parameters in the region since the beginning of the 1990s. It then attempts to reason out the impediments typically affecting the region, which has given rise to such a situation and makes a number of suggestions that would enhance the financial intermediary role of scheduled commercial banks in the region. JEL Classification : G21 Keywords : Scheduled Commercial Banks, Credit, Deposit, Branch Network Reserve Bank of India Occasional Papers Vol. 27, No. 3, Winter 2006 Introduction Modern banking in some of the north eastern states is only a post-nationalisation phenomenon since 1969. As on June 1969, not a single branch of scheduled commercial banks (SCBs) existed in Arunachal Pradesh and Mizoram, a situation akin to only some pockets like island Union Territories of Dadra and Nagar Haveli and Lakshadweep at that time. Only two branches each of SCBs served the entire State in Manipur and Nagaland on that date, while as late as June 1975, only one SCB branch served the entire State of Mizoram. Assam with a longer history of tea and oil industry was better served by banks among the States in the region. This low level of banking development had much to do with the socio-economic and geographical reasons. Except the plain areas of Assam and Barak Valley (Assam), Tripura Valley and Imphal Valley, the rest are hilly States inhabited by more than one hundred different
Transcript of A Review of Trends in Banking Indicators in North Eastern Region of India

A Review of Trends in Banking Indicators inNorth Eastern Region of India
* The authors are Chief General Manager, RPCD, RBI, Mumbai, formerly RegionalDirector of North Eastern States and Director, Reserve Bank of India. These are personalviews of the authors.
Amarendra Sahoo and J.K. Khundrakpam*
This paper reviews whether the rapid growth in banking indicators in the North
Eastern region of India following nationalisation of 14 major banks in 1969 and anothersix in 1980 based on social banking was sustained or not. It finds a phenomenon of retardingtrend in almost all the banking parameters in the region since the beginning of the 1990s.It then attempts to reason out the impediments typically affecting the region, which hasgiven rise to such a situation and makes a number of suggestions that would enhance thefinancial intermediary role of scheduled commercial banks in the region.
JEL Classification : G21
Keywords : Scheduled Commercial Banks, Credit, Deposit, Branch Network
Reserve Bank of India Occasional PapersVol. 27, No. 3, Winter 2006
Introduction
Modern banking in some of the north eastern states is only apost-nationalisation phenomenon since 1969. As on June 1969, not asingle branch of scheduled commercial banks (SCBs) existed inArunachal Pradesh and Mizoram, a situation akin to only somepockets like island Union Territories of Dadra and Nagar Haveli andLakshadweep at that time. Only two branches each of SCBs servedthe entire State in Manipur and Nagaland on that date, while as lateas June 1975, only one SCB branch served the entire State ofMizoram. Assam with a longer history of tea and oil industry wasbetter served by banks among the States in the region.
This low level of banking development had much to do with thesocio-economic and geographical reasons. Except the plain areas ofAssam and Barak Valley (Assam), Tripura Valley and Imphal Valley,the rest are hilly States inhabited by more than one hundred different
(4) A Review of Trends.p65 9/28/2007, 1:48 PM87
88 RESERVE BANK OF INDIA OCCASIONAL PAPERS
tribes each one differing in terms of dialect, traditions and othersocial features. A much larger percentage of population live in therural areas, which was as high as 85.0 per cent as per 2001 census ascompared to the national average of 72.0 per cent, while it was over90.0 per cent in 1971, as compared to the national average of 80.0per cent. Besides factors leading to inaccessibility such as poortransport and communication network in hilly terrains with sparsesettlement of population, the subsistence nature of a traditional tribaleconomy has limited the demand for modern financial services.Furthermore, the typical financial institutions have neithercustomised the types of financial services they provide to theindigenous inhabitants nor innovated to suit the local demands.
Is the low level of economic development in the region due tolow level of banking penetration? Since the influential works ofMcKinnon (1973) and Shaw (1973), showing the positive correlationbetween financial intermediation and economic growth, a numberof studies have attempted to investigate the relative importance offinancial intermediation among the determinants of growth. Manyof them have assigned a greater role to financial intermediation thanother determinants in the process of economic growth (Gorton andWinton, 2002; Boyreau-Debray, 2001; Levine, 1997; and Levine etal, 1999). While financial intermediation and economic growth arecorrelated, does the former cause the latter or the vice versa that thedemand factors are equally important? This is an unsettled issue,though a number of studies have found that financial developmentlead to economic growth in a supply leading sequence (King andLevine, 1993; Benhabib and Spigel, 2000).
For the region typified by large infrastructural bottlenecks, wasthe expansion of modern banking system based on social bankingsince the nationalisation of major banks in 1969 sustainable? It hasbeen highlighted that though financial intermediation in supplyleading framework leads to economic development, without realsector development in terms of physical infrastructure andimprovement in supply elasticities, the financial sector can even
(4) A Review of Trends.p65 9/28/2007, 1:48 PM88
A REVIEW OF TRENDS IN BANKING INDICATORS 89
misallocate resources, potentially generate bubbles and possiblyamplify risks (Reddy, 2006). At the same time, provision of physicalinfrastructure, particularly in the rural areas, is equally important forgeneration of demand for financial services. This is so asimprovements in availability of electricity, roads andtelecommunications, warehouses in rural areas would lead to bettersupply chain management, enhance productivity and greater valueaddition to agriculture (Mohan, 2006). The unique socio-economicconditions and culture of the region would also warrant that withoutfinancial innovations to suit local demand conditions the process maynot be sustained.
Thus, the paper analyses the trend in some select bankingindicators capturing the extent of financial intermediation by thescheduled commercial banks in the region vis-à-vis the nationalpattern and at the same time brings out the divergence among theStates. These banking parameters are: branch network, the percentageof adult population resorting to banking transactions, credit anddeposit growth, level of per capita deposit and credit, the proportionof deposit and credit in state domestic product, credit-deposit ratio,and sectoral deployment of credit. It then attempts to reason out thecause for the observed trend and list out the impediments required tobe removed.
The rest of the paper is organised as follows. Section II analysesthe trend in the various banking indicators. In section III, an attemptis made to provide explanation for the observed trend and find outthe various impediments to flow of credit in the region. Summaryand concluding observations are contained in section IV.
Section II: Trends in Banking Indicators
Expansion in Branch Network
Starting from a low base, during the 1970s and 1980s, branchnetwork of scheduled commercial banks in the region expanded muchmore rapidly. Consequently, the average population per branch
(4) A Review of Trends.p65 9/28/2007, 1:48 PM89

90 RESERVE BANK OF INDIA OCCASIONAL PAPERS
(APPBO) in all the States declined much faster than the national levelduring these two decades. The APPBO in 1973 ranged from about 59thousand (Meghalaya) to 359 thousand (Mizoram), with a regionalaverage of over 90 thousand, as against the national average of 35thousand. In 1981, it had declined to a range of 18 thousand(Nagaland) to 41 thousand (Mizoram) with a regional average of 32thousand, and narrowed the gap from the national average of 18thousand. By 1991, the regional APPBO was less than 17 thousandwhile the national average was 13.7 thousand. Significantly, theAPPBO dropped below the national average in Arunachal Pradesh(12.7 thousand), Meghalaya (11.2 thousand) and Mizoram (9.5thousand). A similar trend decline was observed in the rural APPBOwith the notable feature that in Arunachal Pradesh and Mizoram theywere lower than the total average APPBO in the respective States.
The 1990s show a reversal in the trend and rise in the APPBO inthe country. Though the same phenomenon is also observed in theregion, and in each of the States, it rose much more in the region,particularly in Manipur and Nagaland. Further, while the APPBO atthe national level has again resumed a declining trend during thefirst half of the current decade (2001-2005), the rising trend observedsince 1991 continues in many of the States in the region. Though therural APPBO rose in all the States since 1991, in Manipur and Nagalandthey increased alarmingly to over 47 thousand by 2005, more thandoubled the level of 1991 and twice the national average (Table 1).
In hilly terrains characterised by sparse population distribution andtransport bottlenecks, despite a lower APPBO, a large section of thepopulation, however, may not be effectively served by the existing bankbranches. This would be the case in Arunanchal Pradesh, Meghalayaand Mizoram where APPBO is lower, but the average area per bankbranch range from 121 square kms. to 1,232 square kms.; far higherthan national average of 47 square kms. In the case of Manipur andNagaland, the very high APPBO coupled with larger area per bank branch(227 to 286 square Kms.) indicates the extremely low level of bankingpenetration, particularly in the rural areas (Table 1).
(4) A Review of Trends.p65 9/28/2007, 1:48 PM90

A REVIEW OF TRENDS IN BANKING INDICATORS 91
Gaps in Deposit and Credit Accounts per 100 Adult Population
Branch expansion and decline in APPBO should lead to increasedrecourse to banking transaction by the adult population, i.e., a highercurrent and savings accounts, and credit accounts per 100 adultpopulation.1 Reflecting the positive impact of higher branch expansionand the decline in APPBO, the number of current and savings accountsper 100 adult population increased at a much faster rate in the regionthan at the national level during 1973 to 1991. However, because ofthe low base, the gap in this measure of banking penetration fromthe national average remained glaring in 1991, exceptingMeghalaya. Till 1991, the States with the fastest branch expansionalso recorded a faster growth in the number of current and savingsaccounts per 100 adult population and the ratio was higher in thoseStates where the APPBO was lower, viz., Arunachal Pradesh,Meghalaya and Mizoram.
Since 1991, there was a concerting trend with the ratio decliningsubstantially in all the States, except Assam and Tripura. During 1991and 2005, the decline was to the extent of 19.0 percentage points inMeghalaya and over 20.0 percentage points in Nagaland that for thislatter State, the ratio in 2005 was lower than what was in 1981.
Table 1: APPBO and Area Covered
States Total APPBO Rural APPBO
1973 1981 1991 2001 2005 1973 1981 1991 2001 2005
1 2 3 4 5 6 7 8 9 10 11 12
A.P 82826 28720 12714 15813 16211 79678 26837 11424 15508 17294 1232
Assam 89906 36308 18135 21008 20960 194279 59301 22747 28422 30678 62
Manipur 126111 36435 21871 28436 29791 164173 45456 23777 38686 46931 286
Meghalaya 59432 21203 11233 12741 12658 182776 30402 12455 14257 15536 121
Mizoram 359429 41146 9449 11279 11278 n.a. 46493 5812 7377 7883 276
Nagaland 93287 18451 17036 28009 27990 252227 26188 21767 44211 49272 227
Tripura 96747 19553 15318 17438 17429 184179 26107 18536 22067 23701 56
N E Region 90523 32018 16870 19894 19885 188566 48318 20123 25629 27796 131
All India 34982 18062 13711 15209 14949 102270 27820 17996 22722 24856 47
Source : Compiled from Various Issues of BSR, RBI, Basic Statistics, NEC and Census Data.
Areaper
SCBBranch
Sq.Kms.
(4) A Review of Trends.p65 9/28/2007, 1:48 PM91
92 RESERVE BANK OF INDIA OCCASIONAL PAPERS
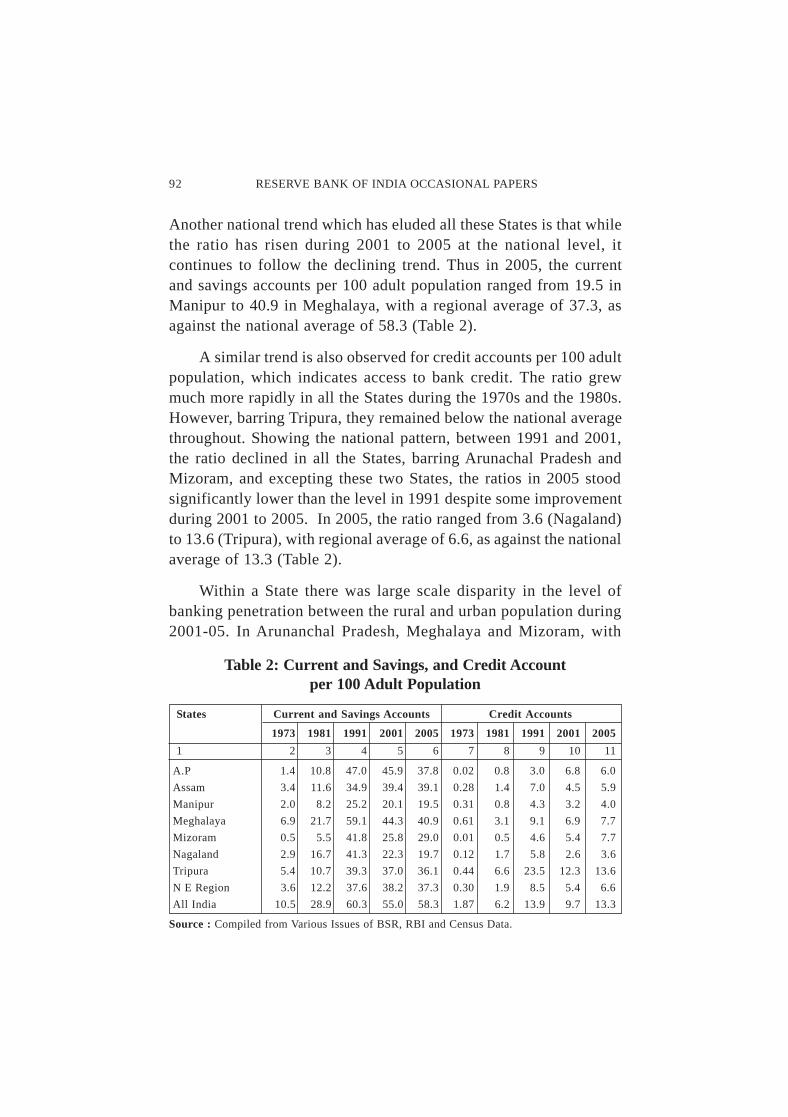
Another national trend which has eluded all these States is that whilethe ratio has risen during 2001 to 2005 at the national level, itcontinues to follow the declining trend. Thus in 2005, the currentand savings accounts per 100 adult population ranged from 19.5 inManipur to 40.9 in Meghalaya, with a regional average of 37.3, asagainst the national average of 58.3 (Table 2).
A similar trend is also observed for credit accounts per 100 adultpopulation, which indicates access to bank credit. The ratio grewmuch more rapidly in all the States during the 1970s and the 1980s.However, barring Tripura, they remained below the national averagethroughout. Showing the national pattern, between 1991 and 2001,the ratio declined in all the States, barring Arunachal Pradesh andMizoram, and excepting these two States, the ratios in 2005 stoodsignificantly lower than the level in 1991 despite some improvementduring 2001 to 2005. In 2005, the ratio ranged from 3.6 (Nagaland)to 13.6 (Tripura), with regional average of 6.6, as against the nationalaverage of 13.3 (Table 2).
Within a State there was large scale disparity in the level ofbanking penetration between the rural and urban population during2001-05. In Arunanchal Pradesh, Meghalaya and Mizoram, with
Table 2: Current and Savings, and Credit Accountper 100 Adult Population
States Current and Savings Accounts Credit Accounts
1973 1981 1991 2001 2005 1973 1981 1991 2001 2005
1 2 3 4 5 6 7 8 9 10 11
A.P 1.4 10.8 47.0 45.9 37.8 0.02 0.8 3.0 6.8 6.0
Assam 3.4 11.6 34.9 39.4 39.1 0.28 1.4 7.0 4.5 5.9
Manipur 2.0 8.2 25.2 20.1 19.5 0.31 0.8 4.3 3.2 4.0
Meghalaya 6.9 21.7 59.1 44.3 40.9 0.61 3.1 9.1 6.9 7.7
Mizoram 0.5 5.5 41.8 25.8 29.0 0.01 0.5 4.6 5.4 7.7
Nagaland 2.9 16.7 41.3 22.3 19.7 0.12 1.7 5.8 2.6 3.6
Tripura 5.4 10.7 39.3 37.0 36.1 0.44 6.6 23.5 12.3 13.6
N E Region 3.6 12.2 37.6 38.2 37.3 0.30 1.9 8.5 5.4 6.6
All India 10.5 28.9 60.3 55.0 58.3 1.87 6.2 13.9 9.7 13.3
Source : Compiled from Various Issues of BSR, RBI and Census Data.
(4) A Review of Trends.p65 9/28/2007, 1:48 PM92
A REVIEW OF TRENDS IN BANKING INDICATORS 93
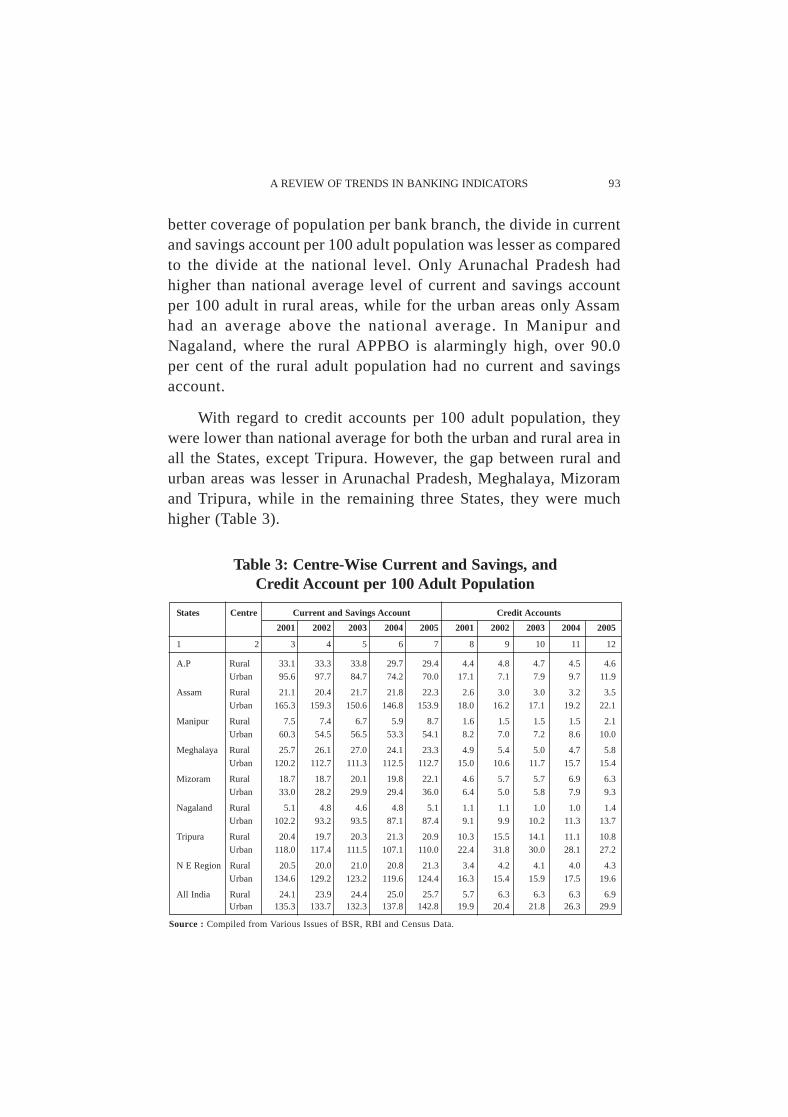
better coverage of population per bank branch, the divide in currentand savings account per 100 adult population was lesser as comparedto the divide at the national level. Only Arunachal Pradesh hadhigher than national average level of current and savings accountper 100 adult in rural areas, while for the urban areas only Assamhad an average above the national average. In Manipur andNagaland, where the rural APPBO is alarmingly high, over 90.0per cent of the rural adult population had no current and savingsaccount.
With regard to credit accounts per 100 adult population, theywere lower than national average for both the urban and rural area inall the States, except Tripura. However, the gap between rural andurban areas was lesser in Arunachal Pradesh, Meghalaya, Mizoramand Tripura, while in the remaining three States, they were muchhigher (Table 3).
Table 3: Centre-Wise Current and Savings, andCredit Account per 100 Adult Population
States Centre Current and Savings Account Credit Accounts
2001 2002 2003 2004 2005 2001 2002 2003 2004 2005
1 2 3 4 5 6 7 8 9 10 11 12
A.P Rural 33.1 33.3 33.8 29.7 29.4 4.4 4.8 4.7 4.5 4.6
Urban 95.6 97.7 84.7 74.2 70.0 17.1 7.1 7.9 9.7 11.9
Assam Rural 21.1 20.4 21.7 21.8 22.3 2.6 3.0 3.0 3.2 3.5
Urban 165.3 159.3 150.6 146.8 153.9 18.0 16.2 17.1 19.2 22.1
Manipur Rural 7.5 7.4 6.7 5.9 8.7 1.6 1.5 1.5 1.5 2.1
Urban 60.3 54.5 56.5 53.3 54.1 8.2 7.0 7.2 8.6 10.0
Meghalaya Rural 25.7 26.1 27.0 24.1 23.3 4.9 5.4 5.0 4.7 5.8
Urban 120.2 112.7 111.3 112.5 112.7 15.0 10.6 11.7 15.7 15.4
Mizoram Rural 18.7 18.7 20.1 19.8 22.1 4.6 5.7 5.7 6.9 6.3
Urban 33.0 28.2 29.9 29.4 36.0 6.4 5.0 5.8 7.9 9.3
Nagaland Rural 5.1 4.8 4.6 4.8 5.1 1.1 1.1 1.0 1.0 1.4
Urban 102.2 93.2 93.5 87.1 87.4 9.1 9.9 10.2 11.3 13.7
Tripura Rural 20.4 19.7 20.3 21.3 20.9 10.3 15.5 14.1 11.1 10.8
Urban 118.0 117.4 111.5 107.1 110.0 22.4 31.8 30.0 28.1 27.2
N E Region Rural 20.5 20.0 21.0 20.8 21.3 3.4 4.2 4.1 4.0 4.3
Urban 134.6 129.2 123.2 119.6 124.4 16.3 15.4 15.9 17.5 19.6
All India Rural 24.1 23.9 24.4 25.0 25.7 5.7 6.3 6.3 6.3 6.9Urban 135.3 133.7 132.3 137.8 142.8 19.9 20.4 21.8 26.3 29.9
Source : Compiled from Various Issues of BSR, RBI and Census Data.
(4) A Review of Trends.p65 9/28/2007, 1:48 PM93
94 RESERVE BANK OF INDIA OCCASIONAL PAPERS
Within this low level of banking penetration, there was also wideinter-district divergence. The total deposit accounts (including termdeposits) per 100 population reveal the following. 2
In 2005, the range in the ratio within a State was:3
Arunachal Pradesh - from 3.4 (Dibang Valley) to 55 (WestKameng);
Assam - from 13.6 (Dhubri) to 56.4 (Kamrup);
Manipur - from 2.3 (Tamenglong) to 20.4 (Imphal);
Meghalaya - from 2.9 (South Garo Hills) to 52 (East Khasi Hills);
Mizoram - from 5.4 (Lawngtlai) to 26.2 (Aizwal);
Nagaland - from 3.4 (Tuensang) to 37 (Dimapur); and
Tripura - from 18.9 (Dhalai) to 37 (West Tripura).
The ratio declined during 2001 to 2005 in most of the districtsin each of the States. Further, districts that had the highest ratio werealmost always the district with respective State capital or commercialtown/cities having better banking facility. This inter-district disparityacross the States is partly explained by APPBO, with correlationcoefficient of -0.54, i.e., the districts with higher bank penetration(lower the APPBO), in general also had higher deposit accounts per100 population.
Deposit and Credit Growth
The deposit and credit growth rate were estimated using a semi-log trend of the following type,
LogY = β0 + β
1 Trend
with β1 as the estimate of growth rate.
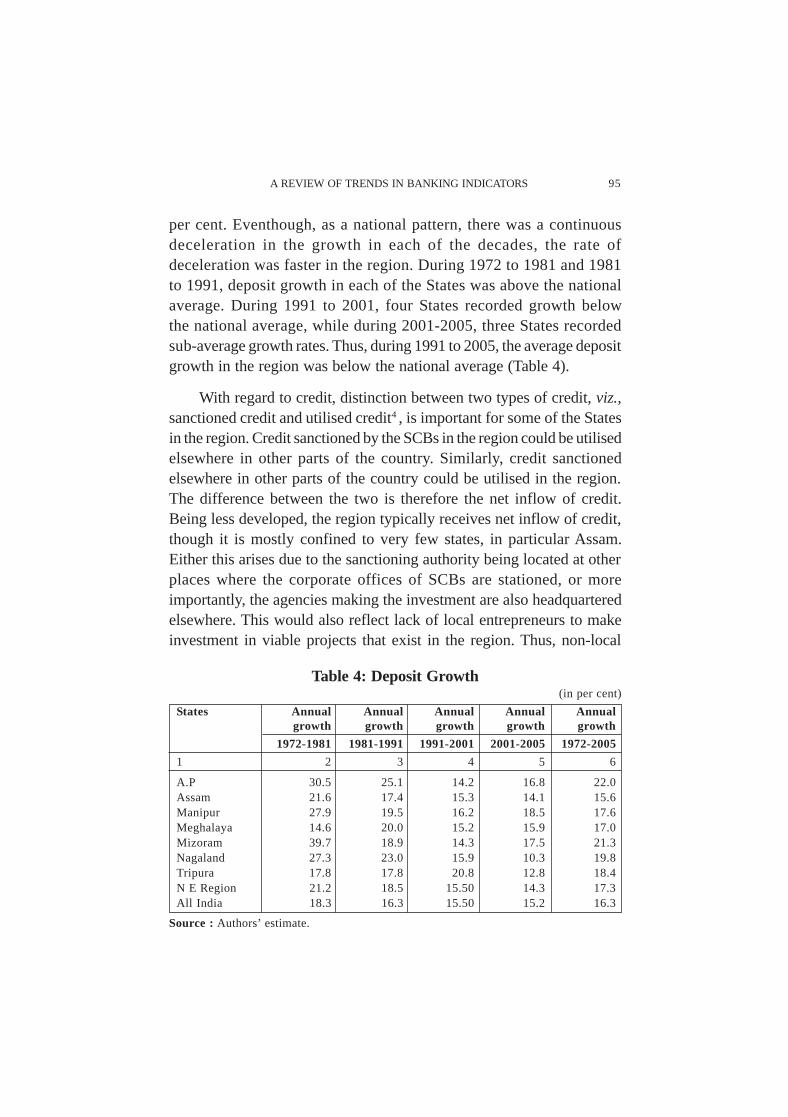
Over the entire period of 1972 to 2005, deposit growth for theregion as whole was 17.3 per cent, with each of the States, barringAssam, recording growth rates above the national average of 16.3
(4) A Review of Trends.p65 9/28/2007, 1:48 PM94
A REVIEW OF TRENDS IN BANKING INDICATORS 95
per cent. Eventhough, as a national pattern, there was a continuousdeceleration in the growth in each of the decades, the rate ofdeceleration was faster in the region. During 1972 to 1981 and 1981to 1991, deposit growth in each of the States was above the nationalaverage. During 1991 to 2001, four States recorded growth belowthe national average, while during 2001-2005, three States recordedsub-average growth rates. Thus, during 1991 to 2005, the average depositgrowth in the region was below the national average (Table 4).
With regard to credit, distinction between two types of credit, viz.,sanctioned credit and utilised credit4 , is important for some of the Statesin the region. Credit sanctioned by the SCBs in the region could be utilisedelsewhere in other parts of the country. Similarly, credit sanctionedelsewhere in other parts of the country could be utilised in the region.The difference between the two is therefore the net inflow of credit.Being less developed, the region typically receives net inflow of credit,though it is mostly confined to very few states, in particular Assam.Either this arises due to the sanctioning authority being located at otherplaces where the corporate offices of SCBs are stationed, or moreimportantly, the agencies making the investment are also headquarteredelsewhere. This would also reflect lack of local entrepreneurs to makeinvestment in viable projects that exist in the region. Thus, non-local
Table 4: Deposit Growth(in per cent)
States Annual Annual Annual Annual Annualgrowth growth growth growth growth
1972-1981 1981-1991 1991-2001 2001-2005 1972-2005
1 2 3 4 5 6
A.P 30.5 25.1 14.2 16.8 22.0Assam 21.6 17.4 15.3 14.1 15.6Manipur 27.9 19.5 16.2 18.5 17.6Meghalaya 14.6 20.0 15.2 15.9 17.0Mizoram 39.7 18.9 14.3 17.5 21.3Nagaland 27.3 23.0 15.9 10.3 19.8Tripura 17.8 17.8 20.8 12.8 18.4N E Region 21.2 18.5 15.50 14.3 17.3All India 18.3 16.3 15.50 15.2 16.3
Source : Authors’ estimate.
(4) A Review of Trends.p65 9/28/2007, 1:48 PM95

96 RESERVE BANK OF INDIA OCCASIONAL PAPERS
entrepreneurs or firms exploit these investment opportunities, but theyseek bank credit from those places where they are based and not fromthe region. It is interesting to find that over the period 1972 to 2005,sanctioned credit growth for the region as a whole of 16.4 per cent wasabove the national average of 15.5 per cent, with each of the constitutingStates recording a higher growth. They ranged from 15.6 per cent (Assam)to 26.9 per cent (Mizoram) (Table 5). However, growth in utilised creditwas below the national average for the region as whole, even though allthe States, barring Assam, recorded growth rates higher than the nationalaverage. This reflects the predominant share of Assam in credit utilisationin the region or most of the net inflow of credit was confined to Assam.
During 1991-2001, however, there was also large-scaledeceleration in the growth of both sanctioned and utilised credit, whileat the national level a marginal acceleration was observed. Further,this was the only decade when the growth in both types of credit wasbelow the national average in all the States. In the case of Assam, thesub-average growth rate continued during 2001-2005 also. During2001-2005, there was a substantial acceleration in the growth of bothsanctioned and utilised credit; far more than the trend at the nationallevel. While the growth in sanctioned credit during 1991 to 2001ranged from 1.93 per cent in Nagaland to 12.8 per cent in Meghalaya(national average of 14.83 per cent), they ranged from 16.0 per cent
Table 5: Credit Growth(in per cent)
States Sanction Utilisation
Annual Annual Annual Annual Annual Annual Annual Annual Annual Annualgrowth growth growth growth growth growth growth growth growth growth
1972- 1981- 1991- 2001- 1972- 1972- 1981- 1991- 2001- 1972-1981 1991 2001 2005 2005 1981 1991 2001 2005 2005
1 2 3 4 5 6 7 8 9 10 11
A.P 41.90 35.60 9.30 25.30 25.40 22.50 33.20 5.60 22.10 20.70Assam 20.80 19.50 10.10 16.00 15.60 15.50 18.30 7.00 9.20 14.60Manipur 24.90 26.30 10.00 21.40 18.50 27.50 25.60 10.20 20.90 18.60Meghalaya 15.30 21.10 12.80 41.00 17.90 19.80 24.10 10.30 53.40 19.20Mizoram 44.20 32.30 12.60 34.00 26.90 64.60 32.10 10.70 32.70 30.00Nagaland 28.90 23.70 1.93 24.00 18.00 30.60 24.20 1.70 19.30 18.10Tripura 40.00 22.00 6.20 20.20 19.30 34.10 21.20 6.97 19.60 18.30N E Region 21.80 20.70 9.50 20.00 16.40 16.90 19.60 7.10 16.40 15.40All India 17.80 14.80 14.83 18.20 15.50 17.80 14.80 14.83 18.20 15.50
Source : Authors’ estimate.
(4) A Review of Trends.p65 9/28/2007, 1:48 PM96
A REVIEW OF TRENDS IN BANKING INDICATORS 97
in Assam to 41.0 per cent in Meghalaya during 2001-2005 (nationalaverage of 18.2 per cent) (Table 5).
A similar pattern is also observed with regard to the growth inutilised credit during 2001-05, with the notable feature that in Assamthe acceleration was marginal, and as a result, the growth rate wasfar below the regional as well as the national average. In contrast, inMeghalaya, while the acceleration in the growth of sanctioned creditduring 1991-2001 to 2001-2005 was little over three times, in termsof utilisation it was about five times, suggesting substantial inflowof credit (Table 5). The sectoral composition of this trend in theutilised credit is carried out in a later section.
Given the above trend in the decadal growth rates, we attemptedto find out the most significant single year when a trend break in thegrowth rate could be detected during 1981 to 2005. The decade ofthe 1970s was excluded as many of the States started from a lowbase and consequently reflected exaggerated growth rates. For thesame, a semi-log trend of the following type was employed.
LogY = β0 + (β
2 + β
0) Dummy + β
1 Trend + (β
1 + β
3) Dummy * Trend
This is a kinked semi-log trend fit to check for presence of breakin the growth rate over the sample period. Dummy takes a value of 1from the point of significant departure from the overall trend growthand thereafter, and 0 otherwise.5 The point that gave the highest R-bar square, i.e., the best fit of the regression was chosen. The growthrate before the identified point is given by β
1, and thereafter, it is
given by (β1 + β
3).
The growth rate accelerates after the identified
point when β3 > 0 and decelerates with β
3 < 0.
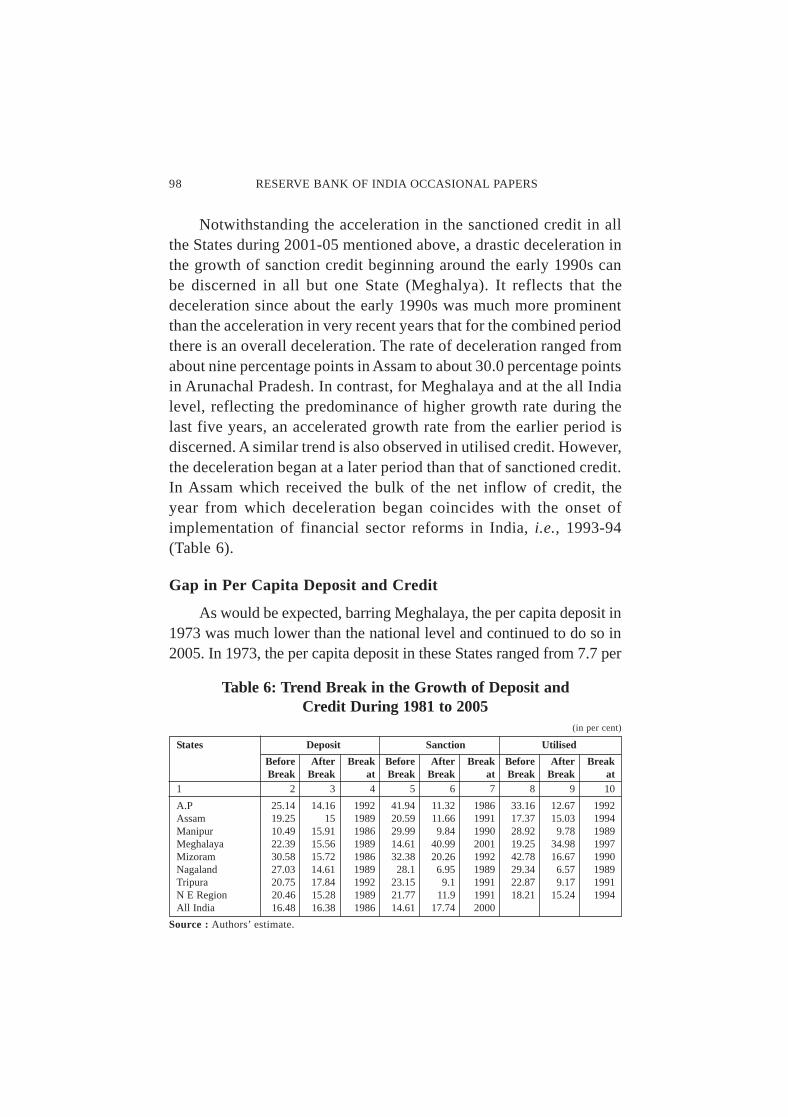
Deposit growth decelerated in all the States, except Manipur,with the years of deceleration spread between 1986, 1989 and 1992,while at the national level no such statistically significant trend wasobserved. The deceleration was over 10.0 percentage points inArunachal Pradesh, Mizoram and Nagaland. Interestingly, in Manipura contrasting trend of accelerated growth in deposit is discerned from1986, yet remained about the decelerated growth of other States only.
(4) A Review of Trends.p65 9/28/2007, 1:48 PM97
98 RESERVE BANK OF INDIA OCCASIONAL PAPERS
Notwithstanding the acceleration in the sanctioned credit in allthe States during 2001-05 mentioned above, a drastic deceleration inthe growth of sanction credit beginning around the early 1990s canbe discerned in all but one State (Meghalya). It reflects that thedeceleration since about the early 1990s was much more prominentthan the acceleration in very recent years that for the combined periodthere is an overall deceleration. The rate of deceleration ranged fromabout nine percentage points in Assam to about 30.0 percentage pointsin Arunachal Pradesh. In contrast, for Meghalaya and at the all Indialevel, reflecting the predominance of higher growth rate during thelast five years, an accelerated growth rate from the earlier period isdiscerned. A similar trend is also observed in utilised credit. However,the deceleration began at a later period than that of sanctioned credit.In Assam which received the bulk of the net inflow of credit, theyear from which deceleration began coincides with the onset ofimplementation of financial sector reforms in India, i.e., 1993-94(Table 6).
Gap in Per Capita Deposit and Credit
As would be expected, barring Meghalaya, the per capita deposit in1973 was much lower than the national level and continued to do so in2005. In 1973, the per capita deposit in these States ranged from 7.7 per
Table 6: Trend Break in the Growth of Deposit andCredit During 1981 to 2005
(in per cent)
States Deposit Sanction Utilised
Before After Break Before After Break Before After BreakBreak Break at Break Break at Break Break at
1 2 3 4 5 6 7 8 9 10
A.P 25.14 14.16 1992 41.94 11.32 1986 33.16 12.67 1992Assam 19.25 15 1989 20.59 11.66 1991 17.37 15.03 1994Manipur 10.49 15.91 1986 29.99 9.84 1990 28.92 9.78 1989Meghalaya 22.39 15.56 1989 14.61 40.99 2001 19.25 34.98 1997Mizoram 30.58 15.72 1986 32.38 20.26 1992 42.78 16.67 1990Nagaland 27.03 14.61 1989 28.1 6.95 1989 29.34 6.57 1989Tripura 20.75 17.84 1992 23.15 9.1 1991 22.87 9.17 1991N E Region 20.46 15.28 1989 21.77 11.9 1991 18.21 15.24 1994All India 16.48 16.38 1986 14.61 17.74 2000
Source : Authors’ estimate.
(4) A Review of Trends.p65 9/28/2007, 1:48 PM98
A REVIEW OF TRENDS IN BANKING INDICATORS 99
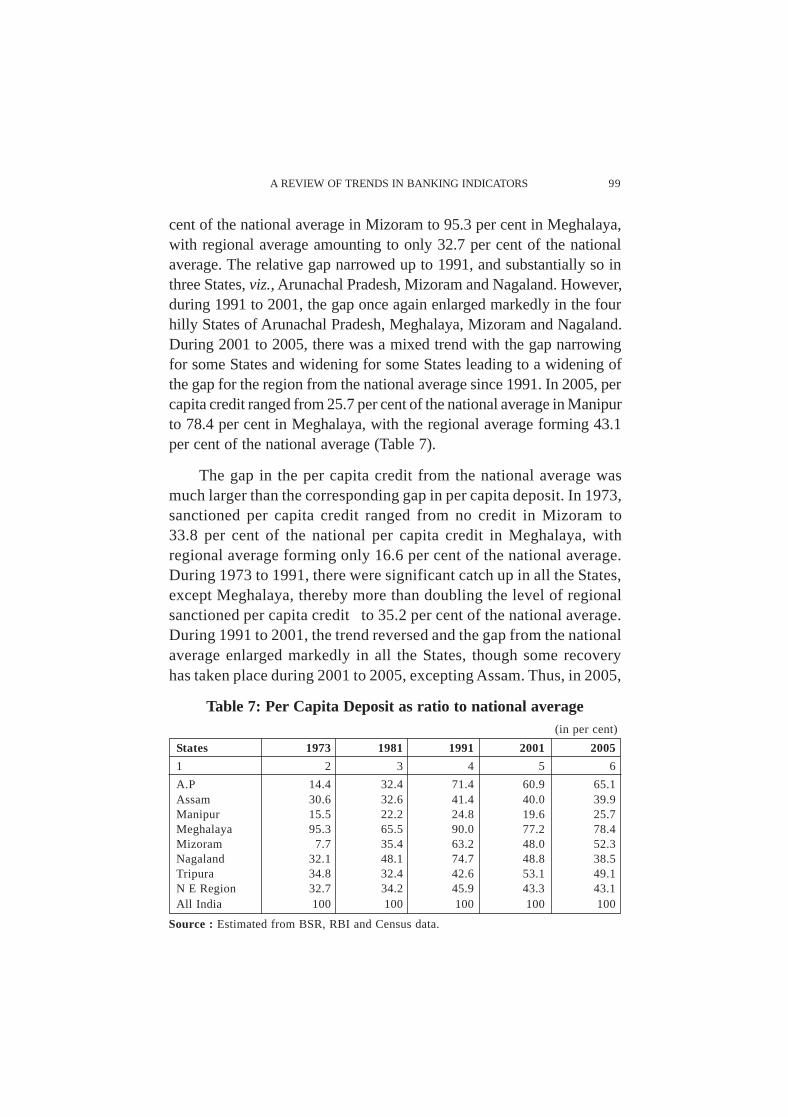
cent of the national average in Mizoram to 95.3 per cent in Meghalaya,with regional average amounting to only 32.7 per cent of the nationalaverage. The relative gap narrowed up to 1991, and substantially so inthree States, viz., Arunachal Pradesh, Mizoram and Nagaland. However,during 1991 to 2001, the gap once again enlarged markedly in the fourhilly States of Arunachal Pradesh, Meghalaya, Mizoram and Nagaland.During 2001 to 2005, there was a mixed trend with the gap narrowingfor some States and widening for some States leading to a widening ofthe gap for the region from the national average since 1991. In 2005, percapita credit ranged from 25.7 per cent of the national average in Manipurto 78.4 per cent in Meghalaya, with the regional average forming 43.1per cent of the national average (Table 7).
The gap in the per capita credit from the national average wasmuch larger than the corresponding gap in per capita deposit. In 1973,sanctioned per capita credit ranged from no credit in Mizoram to33.8 per cent of the national per capita credit in Meghalaya, withregional average forming only 16.6 per cent of the national average.During 1973 to 1991, there were significant catch up in all the States,except Meghalaya, thereby more than doubling the level of regionalsanctioned per capita credit to 35.2 per cent of the national average.During 1991 to 2001, the trend reversed and the gap from the nationalaverage enlarged markedly in all the States, though some recoveryhas taken place during 2001 to 2005, excepting Assam. Thus, in 2005,
Table 7: Per Capita Deposit as ratio to national average(in per cent)
States 1973 1981 1991 2001 2005
1 2 3 4 5 6
A.P 14.4 32.4 71.4 60.9 65.1Assam 30.6 32.6 41.4 40.0 39.9Manipur 15.5 22.2 24.8 19.6 25.7Meghalaya 95.3 65.5 90.0 77.2 78.4Mizoram 7.7 35.4 63.2 48.0 52.3Nagaland 32.1 48.1 74.7 48.8 38.5Tripura 34.8 32.4 42.6 53.1 49.1N E Region 32.7 34.2 45.9 43.3 43.1All India 100 100 100 100 100
Source : Estimated from BSR, RBI and Census data.
(4) A Review of Trends.p65 9/28/2007, 1:48 PM99

100 RESERVE BANK OF INDIA OCCASIONAL PAPERS
the gap in per capita sanctioned credit from the national levelremained glaring, with the level ranging from 12.9 per cent of nationalaverage in Nagaland to 50.4 per cent in Meghalya and a regionalaverage of 23.0 per cent (Table 8).
The gap with respect to per capita utilised credit was also largeand remained so, but due to net inflow of credit it was narrower thanthe gap in terms of per capita sanctioned credit. In 1973, due to Assam(37.3 per cent of national average), the regional per capita utlisedcredit was 30.0 per cent of the national average, much higher than16.6 per cent in terms of sanctioned credit. The State-wise range wasno credit in Mizoram to 37.3 per cent of the national average in Assam.In 1991, the regional average moved up to 45.1 per cent of nationalaverage, with State-wise range of 28.5 per cent in Manipur to 58.2per cent in Arunachal Pradesh. However, due to much slower growthin credit during 1991 to 2001, the per capita utlised credit for theregion formed only 24.4 per cent of the national average in 2001.The difference between the utlised and sanctioned credit also declinedduring this period, indicating decline in the share of net inflow ofcredit in the total utilised credit in the region.
During 2001 to 2005, the gap from the national average narroweddown once again in all the States, except Assam. Meghalya andMizoram particularly have made significant gain during the last fiveyears, and for the former, the level of per capita utilised credit in
Table 8: Per Capita Credit as a ratio to National Average(in per cent)
States Sanction Utilised
1973 1981 1991 2001 2005 1973 1981 1991 2001 2005
1 2 3 4 5 6 7 8 9 10 11
A.P 0.9 5.1 31.4 15.8 21.8 7.3 11.2 58.2 23.7 29.8Assam 18.2 26.1 34.7 23.2 21.6 37.3 31.6 46.7 26.9 25.7Manipur 6.9 10.9 28.2 14.4 16.4 5.5 13.3 28.5 14.0 16.4Meghalaya 33.8 16.7 29.9 22.9 50.4 16.4 19.6 37.5 23.6 99.0Mizoram 0.0 5.4 26.7 20.7 38.5 0.0 9.2 31.0 24.6 47.5Nagaland 15.8 12.8 38.3 10.4 12.9 15.5 22.7 57.4 11.7 13.1Tripura 5.2 25.3 49.4 20.4 21.4 8.2 27.3 41.7 20.3 21.6N E Region 16.6 22.6 35.2 21.5 23.0 30.0 28.6 45.1 24.4 29.3
All India 100 100 100 100 100 100 100 100 100 100
Source : Estimated from BSR, RBI and Census data.
(4) A Review of Trends.p65 9/28/2007, 1:48 PM100
A REVIEW OF TRENDS IN BANKING INDICATORS 101
2005 was about the national average. Yet, because of the enlargementof the gap during the decade of the 1990s and the continuance of thistrend in Assam, in 2005, the per capita utilised credit for the regionwas 29.3 per cent of the national average only; a gap even higherthan what was in 1973. Thus, it is observed that much of the gainachieved in narrowing down the gap during the decades of the 1970sand the 1980s lost its ground during the last 15 years, and in particularduring the decade of the 1990s (Table 8).
Gap in Deposit and Credit to Income (NSDP) Ratio
A number of studies [King and Levine (1992 and 1993), Benhabiband Spiegel (2000) and Khan and Snehadji (2003)] indicate thatfinancial development is one of the major determinants of economicgrowth. While the direction of causality between financialdevelopment and economic growth is an unsettled issue, the higherthe level of economic development the higher is the extent of financialdeepening measured by the ratio of deposit and credit to GDP. Inmany developed countries of the Western countries, where financialdeepening has reached a matured stage, credit and deposit to GDPratios are much above 100.0 per cent. For instances, credit to GDPratios in UK is around 159.0 per cent and in the Euro area it is about145.0 per cent. These ratios are much lower in the developingcountries like India, and more so in underdeveloped pockets such asNorth Eastern Indian States.
Deposit to NSDP ratio increased substantially since thebeginning of the 1980s. However, the absolute gap from the nationalaverage increased over the years. The regional deposit to NSDPratio, which stood at 17.7 per cent during 1981-1985 increased to35.8 per cent during 2001-05, as against the increase in the nationalaverage from 35.6 per cent to 63.6 per cent during the same period.The gap with the national average enlarged significantly during thequinquennium 2001-2005. The increase in the ratio during thisquinquennium over the previous one was 6.0 percentage points inthe region, which was less than half the increase at the national
(4) A Review of Trends.p65 9/28/2007, 1:48 PM101

102 RESERVE BANK OF INDIA OCCASIONAL PAPERS
level of 15.8 percentage points. Large divergence in the ratio persistsamong the constituting States. Mizoram and Nagaland have recordedthe slowest increase in the ratio, and as a result, from second andthird highest during 1981-85, they fell to third and second lowest,respectively, during 2001-05. Manipur and Meghalaya havecontinued to be the States with the lowest and the highest ratiothroughout. During 2001-05, the ratio ranged from 21.8 per cent inManipur to 56.8 per cent in Meghalaya, as against the national averageof 63.6 per cent (Table 9 and Chart 1).
Both sanctioned and utilised credit to NSDP ratio has remainednot only lower than the national ratio, but the gap has widened since1991-95. During 1986-90 and 1996-2000, while the ratio increasedslowly at the national level, they declined in each of the States forboth the types of credit. For utilised credit, the ratio for the region
Table 9: Deposit to NSDP Ratio(in per cent)
During A.P. Assam Manipur Meghalaya Mizoram Nagaland Tripura N.E. India
1 2 3 4 5 6 7 8 9 10
1981-85 13.7 18.0 8.5 29.1 26.2 21.2 12.3 17.7 35.61986-90 25.4 23.4 12.7 41.6 21.8 28.6 20.2 24.1 43.51991-95 31.7 24.1 13.6 41.9 24.4 21.9 24.6 25.0 45.61996-00 35.7 29.3 16.5 46.3 25.2 28.6 29.0 29.8 47.82001-05 45.9 39.5 21.8 56.8 27.9 26.9 34.2 35.8 63.6
Source : Estimated from BSR and Handbook of Statistics, RBI.
(4) A Review of Trends.p65 9/28/2007, 1:48 PM102

A REVIEW OF TRENDS IN BANKING INDICATORS 103
during 1996-2000 was lower than the ratio during 1981-85. Thedeclining trend in the ratio has continued in Manipur, Nagaland andTripura during 2001-05, while in the rest it increased. Thus, during2001-05, while the credit to NDP ratio for the country was 38.1 percent, for the region it was 9.8 per cent for sanctioned credit and 16.0per cent for utilised credit, with the respective range among the Statesfor the two types of credit being 3.5 per cent in Nagaland to 16.8 percent in Meghalaya for sanctioned credit and 4.0 per cent in Nagalandand 24.2 per cent in Meghalaya for utilised credit (Table 10, Chart 2 and 3).
Table 10: Credit to NSDP Ratio(in per cent)
Average A.P Assam Manipur Meghalaya
During sanction utilisation sanction utilisation sanction utilisation sanction utilisation
1 2 3 4 5 6 7 8 9
1981-85 2.5 4.0 8.3 13.0 4.3 4.5 6.5 6.31986-90 8.9 11.6 12.4 16.8 9.2 9.6 10.5 13.01991-95 6.0 10.8 11.0 15.8 9.2 9.2 8.0 11.71996-00 4.9 7.1 10.1 11.6 8.5 8.6 7.4 8.22001-05 7.9 11.8 12.7 19.4 7.5 7.5 16.8 24.2
Average Mizoram Nagaland Tripura NE India
During sanction utilisation sanction utilisation sanction utilisation sanction utilisation sanction1 2 3 4 5 6 7 8 9 10
1981-85 3.2 4.4 7.8 8.7 8.8 9.1 7.7 11.2 24.31986-90 7.6 13.4 9.7 10.9 14.8 15.1 12.0 15.5 26.01991-95 5.8 8.3 9.1 10.3 14.6 14.3 10.6 14.4 26.31996-00 4.8 5.6 5.6 6.7 9.9 10.1 9.2 10.4 27.02001-05 7.3 8.9 3.5 4.0 8.1 7.9 9.8 16.0 38.1
Source : Estimated from BSR and Handbook of Statistics, RBI.
(4) A Review of Trends.p65 9/28/2007, 1:48 PM103

104 RESERVE BANK OF INDIA OCCASIONAL PAPERS
Gap in Credit Deposit Ratio
The higher gap in credit vis-à-vis deposit from the nationalaverage is reflected on the lower CD ratio in the region. However,there are differences between the CD ratio as per sanction andutilisation, and also among the States. First, there has been asubstantial gap between the two types of credit in Arunachal Pradeshand Assam, and Meghalaya in the most recent years. Second, theratio for both types of credit increased in all the States during 1972-75 to 1986-90, while at the national level a declining trend wasobserved. Yet, during 1986-90, when the sanctioned C-D ratio wasat its peak in each of the States, they ranged from 25.6 per cent inMeghalaya to 71.3 per cent in Manipur, with a regional averageof 49. 6 per cent, as against the national average of 59.9 per cent(Table 11). Only two States, viz., Manipur and Tripura had higherthan national CD ratio during the major part of the 1980s and firsthalf of the 1990s. Third, while the gap with respect to sanctionedcredit was large, in terms of utilised credit, the regional averagedid not diverge much from the national averge during 1972-75 to1991-95 (Chart 4). This was due to a much higher CD ratio as perutilisation in Assam during this period. Fourth, since the first halfof the 1990s, both types of C-D ratio dipped substantially in all the
(4) A Review of Trends.p65 9/28/2007, 1:48 PM104

A REVIEW OF TRENDS IN BANKING INDICATORS 105
States, though Arunachal Pradesh, Meghlaya and Mizoram havemade some recovery during 2001-2005. The result was that, for theregion as a whole, a substantial gap from the national average
Table 11: Credit Deposit Ratio(in per cent)
Average A.P Assam Manipur Meghalaya
During sanction utilisation sanction utilisation sanction utilisation sanction utilisation
1 2 3 4 5 6 7 8 9
1972-1975 5.5 41.9 45.9 93.5 35.8 35.0 16.2 12.8
1976-1980 7.3 27.7 43.6 65.6 29.8 29.8 17.4 18.5
1981-1985 18.1 28.7 46.0 72.3 51.4 54.0 22.1 21.6
1986-1990 32.2 42.9 50.9 71.2 71.3 73.0 25.6 30.6
1991-1995 19.0 34.6 45.9 65.6 67.7 67.6 19.1 27.5
1996-2000 13.8 20.0 34.8 39.8 52.6 52.7 16.0 17.8
2001-2005 17.0 25.4 32.0 49.5 34.1 34.5 28.5 40.4
Average Mizoram Nagaland Tripura NE India
During sanction utilisation sanction utilisation sanction utilisation sanction utilisation sanction
1 2 3 4 5 6 7 8 9 10
1972-1975 4.0 1.8 25.1 25.4 11.8 18.5 37.0 70.6 70.5
1976-1980 5.2 6.4 29.8 36.9 38.6 42.7 38.4 55.6 71.2
1981-1985 13.0 18.2 36.8 40.8 71.6 73.9 43.4 62.9 68.0
1986-1990 32.4 58.8 36.1 40.4 67.8 68.0 49.6 64.1 59.9
1991-1995 23.7 34.6 41.5 46.8 60.0 58.4 42.5 57.4 57.7
1996-2000 19.4 22.6 20.3 24.4 34.5 35.2 31.0 35.0 56.5
2001-2005 32.1 38.9 15.3 16.7 24.7 24.1 29.4 42.3 59.7
Source : Estimated from BSR, RBI.
(4) A Review of Trends.p65 9/28/2007, 1:48 PM105

106 RESERVE BANK OF INDIA OCCASIONAL PAPERS
developed for both types of credit, while earlier the gap was onlyin terms of sanctioned credit. Fifth, the inter-State disparity in CDratio decreased substantially, but at a lower level than earlier. During2001-05, sanctioned CD ratio ranged from 15.3 per cent in Nagalandto 34.1 per cent in Manipur, with a regional average of 29.4 percent, as against the national average of 59.7 per cent. During thesame period, utilised CD ratio ranged from 26.7 per cent in Nagalandto 49.5 per cent in Assam (Table 11, Chart 5 and 6).
(4) A Review of Trends.p65 9/28/2007, 1:48 PM106

A REVIEW OF TRENDS IN BANKING INDICATORS 107
Sectoral Deployment of Credit
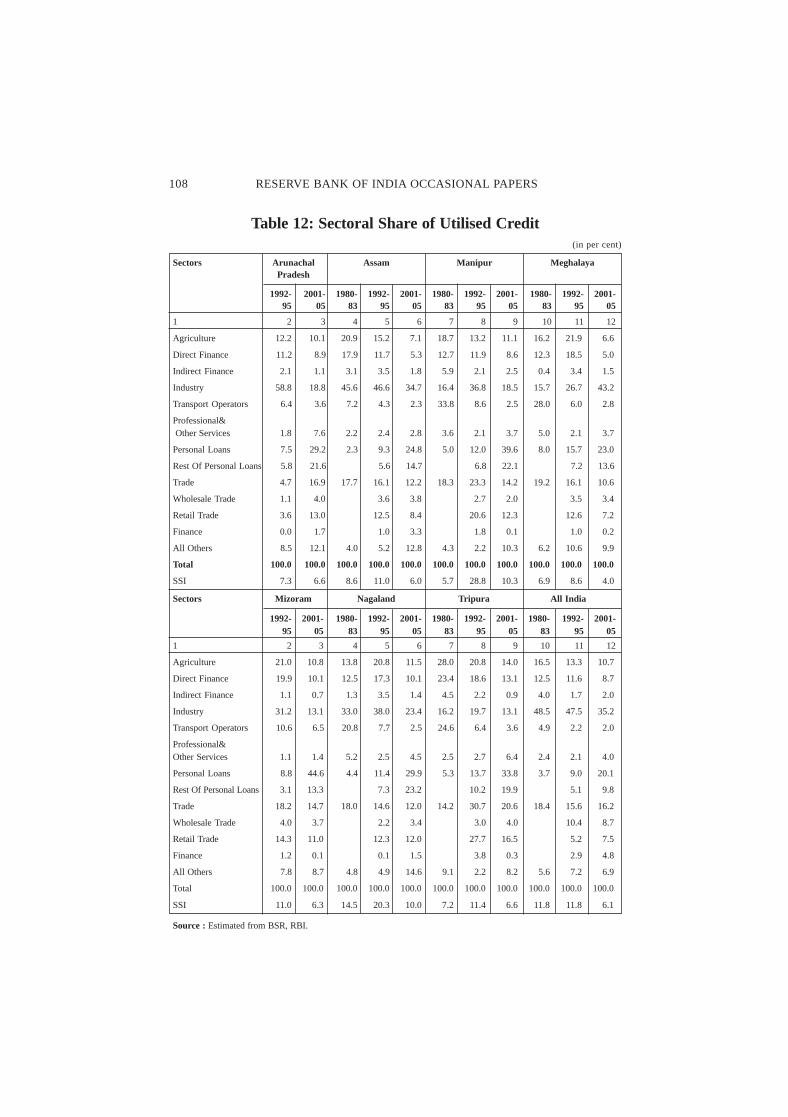
The following provides the trend in the sectoral composition ofutilised credit in these States vis-à-vis the national pattern. There hasbeen a decline in the share of agriculture, which in most of the Stateswere above 20.0 per cent during 1980-83 and 1992-95, and weremarkedly above the share in the national average. While this declinein the share of agriculture is a national phenomenon, the extent ofdecline between 1992-95 and 2001-05 was much more striking inmost of the States in the region. The decline in the share of industrywas even more than that of agriculture, with the exception ofMeghalaya (due to one time financing of state electricity board by anationalised bank) and Tripura where share of industry has beentraditionally low. The share of transport operators also dippedsignificantly, but most of the decline in its share took place during1980s. Similarly, barring Arunachal Pradesh, the share of trade alsodeclined in all the States. However, within trade, share of retail tradehas been predominant in the region, which is unlike at the nationallevel where wholesale trade, which is considered to be moreproductive than retail trading (Roy, 2006), corners a larger share(Table 12).
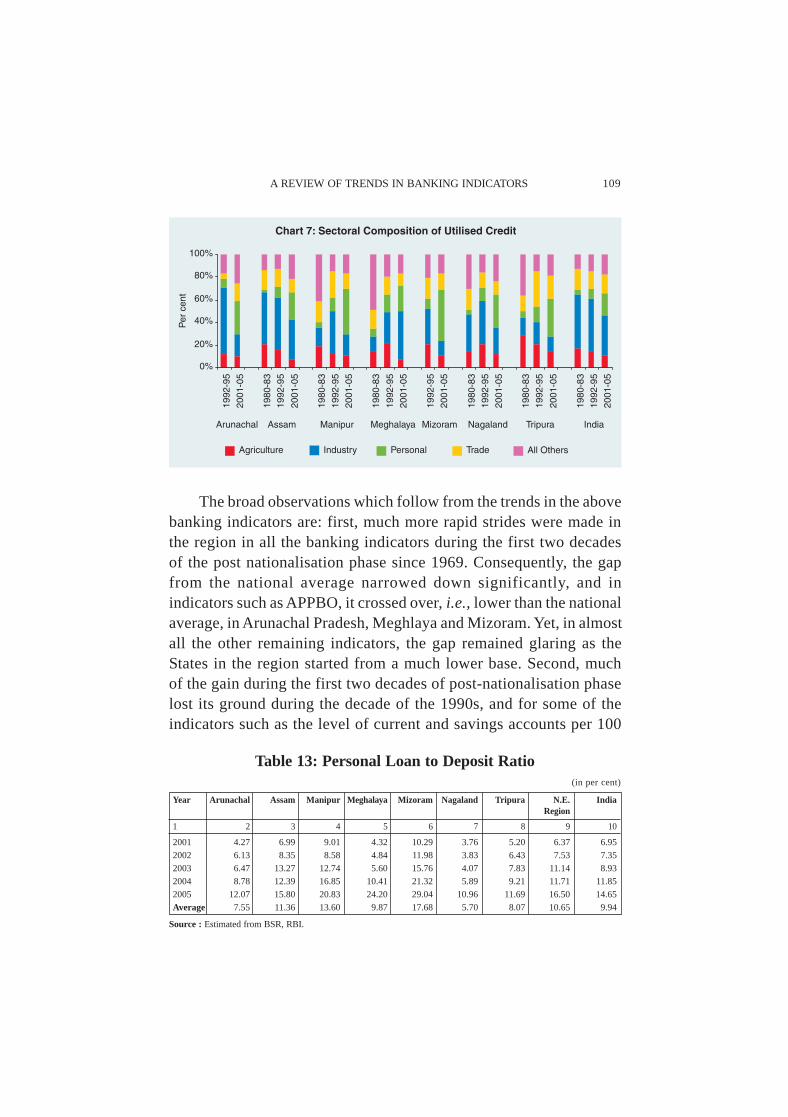
On the other hand, share of personal loans increased substantiallyin all the States. While this has been a national trend, it was muchmore prominent in the region that, for most of the States, this sectornow constitutes the most important sector in the utilisation of bankcredit. The share of personal loan during 2001-05 ranged from 23.0per cent in Meghalaya to 44.6 per cent in Mizoram, as against thenational average of 20.1 per cent (Table 12 and Chart 7).
Thus, even though the total CD ratio during 2001-05 wassubstantially lower than national average in all the States in the region,credit for personal loans to deposit ratio of 10.7 per cent for the regionas a whole was higher than the national average of 9.94 per cent,with three States exceeding the national average and the rest of theStates rapidly catching up (Table 13).
(4) A Review of Trends.p65 9/28/2007, 1:48 PM107
108 RESERVE BANK OF INDIA OCCASIONAL PAPERS
Table 12: Sectoral Share of Utilised Credit(in per cent)
Sectors Arunachal Assam Manipur MeghalayaPradesh
1992- 2001- 1980- 1992- 2001- 1980- 1992- 2001- 1980- 1992- 2001-95 05 83 95 05 83 95 05 83 95 05
1 2 3 4 5 6 7 8 9 10 11 12
Agriculture 12.2 10.1 20.9 15.2 7.1 18.7 13.2 11.1 16.2 21.9 6.6
Direct Finance 11.2 8.9 17.9 11.7 5.3 12.7 11.9 8.6 12.3 18.5 5.0
Indirect Finance 2.1 1.1 3.1 3.5 1.8 5.9 2.1 2.5 0.4 3.4 1.5
Industry 58.8 18.8 45.6 46.6 34.7 16.4 36.8 18.5 15.7 26.7 43.2
Transport Operators 6.4 3.6 7.2 4.3 2.3 33.8 8.6 2.5 28.0 6.0 2.8
Professional& Other Services 1.8 7.6 2.2 2.4 2.8 3.6 2.1 3.7 5.0 2.1 3.7
Personal Loans 7.5 29.2 2.3 9.3 24.8 5.0 12.0 39.6 8.0 15.7 23.0
Rest Of Personal Loans 5.8 21.6 5.6 14.7 6.8 22.1 7.2 13.6
Trade 4.7 16.9 17.7 16.1 12.2 18.3 23.3 14.2 19.2 16.1 10.6
Wholesale Trade 1.1 4.0 3.6 3.8 2.7 2.0 3.5 3.4
Retail Trade 3.6 13.0 12.5 8.4 20.6 12.3 12.6 7.2
Finance 0.0 1.7 1.0 3.3 1.8 0.1 1.0 0.2
All Others 8.5 12.1 4.0 5.2 12.8 4.3 2.2 10.3 6.2 10.6 9.9
Total 100.0 100.0 100.0 100.0 100.0 100.0 100.0 100.0 100.0 100.0 100.0
SSI 7.3 6.6 8.6 11.0 6.0 5.7 28.8 10.3 6.9 8.6 4.0
Sectors Mizoram Nagaland Tripura All India
1992- 2001- 1980- 1992- 2001- 1980- 1992- 2001- 1980- 1992- 2001-95 05 83 95 05 83 95 05 83 95 05
1 2 3 4 5 6 7 8 9 10 11 12
Agriculture 21.0 10.8 13.8 20.8 11.5 28.0 20.8 14.0 16.5 13.3 10.7
Direct Finance 19.9 10.1 12.5 17.3 10.1 23.4 18.6 13.1 12.5 11.6 8.7
Indirect Finance 1.1 0.7 1.3 3.5 1.4 4.5 2.2 0.9 4.0 1.7 2.0
Industry 31.2 13.1 33.0 38.0 23.4 16.2 19.7 13.1 48.5 47.5 35.2
Transport Operators 10.6 6.5 20.8 7.7 2.5 24.6 6.4 3.6 4.9 2.2 2.0
Professional&Other Services 1.1 1.4 5.2 2.5 4.5 2.5 2.7 6.4 2.4 2.1 4.0
Personal Loans 8.8 44.6 4.4 11.4 29.9 5.3 13.7 33.8 3.7 9.0 20.1
Rest Of Personal Loans 3.1 13.3 7.3 23.2 10.2 19.9 5.1 9.8
Trade 18.2 14.7 18.0 14.6 12.0 14.2 30.7 20.6 18.4 15.6 16.2
Wholesale Trade 4.0 3.7 2.2 3.4 3.0 4.0 10.4 8.7
Retail Trade 14.3 11.0 12.3 12.0 27.7 16.5 5.2 7.5
Finance 1.2 0.1 0.1 1.5 3.8 0.3 2.9 4.8
All Others 7.8 8.7 4.8 4.9 14.6 9.1 2.2 8.2 5.6 7.2 6.9
Total 100.0 100.0 100.0 100.0 100.0 100.0 100.0 100.0 100.0 100.0 100.0
SSI 11.0 6.3 14.5 20.3 10.0 7.2 11.4 6.6 11.8 11.8 6.1
Source : Estimated from BSR, RBI.
(4) A Review of Trends.p65 9/28/2007, 1:48 PM108
A REVIEW OF TRENDS IN BANKING INDICATORS 109
The broad observations which follow from the trends in the abovebanking indicators are: first, much more rapid strides were made inthe region in all the banking indicators during the first two decadesof the post nationalisation phase since 1969. Consequently, the gapfrom the national average narrowed down significantly, and inindicators such as APPBO, it crossed over, i.e., lower than the nationalaverage, in Arunachal Pradesh, Meghlaya and Mizoram. Yet, in almostall the other remaining indicators, the gap remained glaring as theStates in the region started from a much lower base. Second, muchof the gain during the first two decades of post-nationalisation phaselost its ground during the decade of the 1990s, and for some of theindicators such as the level of current and savings accounts per 100
Table 13: Personal Loan to Deposit Ratio(in per cent)
Year Arunachal Assam Manipur Meghalaya Mizoram Nagaland Tripura N.E. India Region
1 2 3 4 5 6 7 8 9 10
2001 4.27 6.99 9.01 4.32 10.29 3.76 5.20 6.37 6.95
2002 6.13 8.35 8.58 4.84 11.98 3.83 6.43 7.53 7.35
2003 6.47 13.27 12.74 5.60 15.76 4.07 7.83 11.14 8.93
2004 8.78 12.39 16.85 10.41 21.32 5.89 9.21 11.71 11.85
2005 12.07 15.80 20.83 24.20 29.04 10.96 11.69 16.50 14.65
Average 7.55 11.36 13.60 9.87 17.68 5.70 8.07 10.65 9.94
Source : Estimated from BSR, RBI.
(4) A Review of Trends.p65 9/28/2007, 1:48 PM109
110 RESERVE BANK OF INDIA OCCASIONAL PAPERS
adult population and per capita credit, the gaps from the nationalaverage reverted back to the level of earlier period. Given the trendat the national level, widening of gap in the banking indicators of theregion from the national average during the 1990s indicatesretardation on in the growth of activities of SCBs in the region duringthis period. Third, there has been a differential impact among theStates in the region.
Section III: Explaining Observed Trends and Impedimentsto Flow of Credit
Reasons for the Observed Trend
Given the unique features of the region, the financial sectorreforms introduced since the beginning of the 1990s will have muchto do with the observed trends. A substantial transformation of thebanking sector has taken place with the introduction of decontrol ofinterest rates, reduction of pre-emption of banking resources, whileat the same time putting in place the international best practices onprudential norms, income recognition and capital adequacy, amongothers. Given the health of the SCBs at that time, these measuresseverely restricted the leverage and the bottom lines of banks in India.In the new environment, SCBs slowed down branch expansion wherethe business prospect was limited, and curtailed credit when the riskof default was high.
In the region, these problems were much more severe due tothe unique features of the States. Low business prospects wascombined with lower recovery rate and higher NPAs, which led tosevere curtailment in branch expansion and credit disbursement inthe aftermath of financial sector reforms. These constraints werenot there earlier, as SCBs following nationalisation, adopted socialbanking with less consideration on commercial aspects. However,as pointed out by Mohan (2006), at the national level also thisstrategy of banking development may have reached its limit by the1990s.
(4) A Review of Trends.p65 9/28/2007, 1:48 PM110

A REVIEW OF TRENDS IN BANKING INDICATORS 111
Some of the indicators which reflect this lower volume of businessare deposit and credit per branch and per employee (Table 14). In1991, the average deposit per branch for the region was Rs. 183 lakh(state-wise range from Rs. 129 in Manipur to Rs. 301 lakh inNagaland), as against the national average of Rs. 325 lakh. As on2005, the respective figures were Rs. 1,432 lakh (state-wise rangefrom Rs. 986 in Mizoram to Rs. 1,798 in Nagaland) and Rs. 2,497lakh. However, deposits in general are mobilised at the lower cost inthe region, as the share of current deposits in total deposits is higherthan national average in almost all the States. For instance, in 2005,this share was 15.85 per cent for the region (State-wise range from11.74 per cent in Tripura to 31.64 per cent in Manipur), while at thenational level it was 12.13 per cent. The higher share of current depositcould arise on account of government deposit accounts, which arecurrent in nature.
Credit per branch was even lower. In 1991, the average creditper branch in the region was Rs. 86 lakh (state-wise range from Rs.39 lakh in Mizoram to Rs. 132 lakh in Nagaland), as against thenational average of Rs. 201 lakh. In 2005, credit per branch increasedto Rs. 501 lakh (state-wise range from Rs. 387 lakh in ArunachalPradesh to Rs. 723 in Meghalaya), but remained substantially lowerthan the national average of Rs. 1,647 lakh.
Table 14: Business Indicators of Banks(in Rs. Lakh and per cent)
States Deposit per Credit per Deposit per Credit per Share ofbranch branch employee employee Current Deposit
1991 2005 1991 2005 1991 2005 1991 2005 1992 2005
1 2 3 4 5 6 7 8 9 10 11
A.P 215 1762 60 387 20.9 193.0 5.8 42.4 19.3 22.4
Assam 178 1398 88 493 15.9 126.1 7.9 44.5 18.7 15.0
Manipur 129 1278 93 542 12.9 129.6 9.3 54.9 24.8 31.6
Meghalaya 239 1657 53 723 20.0 177.8 4.4 77.6 17.2 14.3
Mizoram 142 986 39 472 22.7 126.8 6.3 60.6 21.8 16.1
Nagaland 301 1798 132 412 24.6 170.9 10.8 39.1 14.3 20.6
Tripura 155 1429 105 409 13.2 128.3 9.0 36.7 18.5 11.7
N E Region 183 1432 86 501 16.5 134.5 7.8 47.1 18.6 15.9
All India 325 2497 201 1647 20.6 194.0 12.7 128.0 17.9 12.1
(4) A Review of Trends.p65 9/28/2007, 1:48 PM111
112 RESERVE BANK OF INDIA OCCASIONAL PAPERS
Deposit per employee in the region is also lower than the nationalaverage. However, the gap is much lesser than the gap in terms ofdeposit per branch, implying a lower number of employee per branchthan the national average. Yet, the number of customers (depositaccount) per staff in 2005 was lower than national average in all theStates, except Assam.6 In 1991, the regional average deposit peremployee was Rs. 16.54 lakh, as against the national average of Rs.20.56 lakh, but three States (viz., Arunachal Pradesh, Mizoram andNagaland) exceeded the national average. In 2005, none of the Statesexceeded the national average of Rs. 194 lakh, giving a regionalaverage of Rs. 134.47 lakh.
Similarly, credit per employee is lower but again not to the extentof the gap observed in credit per branch.7 However, the gap from thenational average is much higher for credit per employee than depositper employee. In 1991, credit per employee for the region was Rs.7.76 lakh (with a range of Rs. 4.42 lakh in Meghalaya to Rs. 10.81lakh in Nagaland), while the national average was Rs. 12.73 lakh.By 2005, the gap enlarged with regional average of Rs. 47.07 lakh asagainst the national average of Rs. 127.99 lakh, while State-wise, itranged from 36.75 lakh in Tripura to Rs. 77.56 lakh in Meghalaya.
In other words, both the business turnover per branch andemployee are lower than the national average and the gap grew.Within this situation, liability (deposit) per branch and per employeewas relatively higher than the corresponding asset (credit) perbranch and per employee in the region. On the other hand, the shareof non-performing component of these credits was much higher,thereby indicating that banks branches were more unviable in regionthan at the national level. Half a decade after the initiation offinancial sector reforms, i.e., in 1999, the NPA to advances ratio ofSBI, the commercial bank with largest business share in the region,ranged from 28.5 per cent in Meghalaya to as high as about 60.0per cent in Manipur and Nagaland, as against the banks total ratioof 15.6 per cent. Even in 2005, the NPA to advances ratio of allSCBs in four States, for which data are available, ranged from 8.4
(4) A Review of Trends.p65 9/28/2007, 1:48 PM112

A REVIEW OF TRENDS IN BANKING INDICATORS 113
per cent in Mizoram to about 14.5 per cent in Manipur and Nagaland,as against the national average of 5.2 per cent. These higher NPAin the region arises from very low recovery rate from priority sectoradvances, which accounts for bulk of the total advances in all theStates. In 1999, the recovery rate for all banks including co-operatives ranged from a low of 4.8 per cent in Manipur to 45.0 percent in Arunachal Pradesh, which is low by any standard.Improvement in the recovery rate has taken place in all the Statesby 2005, except Arunachal Pradesh, yet remained much to be desiredranging from 26.0 per cent in Arunachal Pradesh to 58.0 per cent inMizoram. The recovery rate under government schemes was evenlower, though it improved during 1999 to 2005 (Table 15).
The lower volume of business, higher proportion of bad loans,coupled with sparse settlement of population and growing law andorder problem, to mention a few of the problems, while the bankswere required to follow a stricter prudential norms, thus led todeceleration in the growth of activities of SCBs in the region.
Impediments
A number of factors which limit the credit absorption capacity,enhance the risk of default and impede increasing the outreach ofbanks and flow of bank credit in the region are identifiable.
Table 15: NPA to Advances Ratio and Recovery Rates (in per cent)
States NPA/Advances NPA/Advances Recovery rate Recovery fromof SBI of SCBs from PSA Govt. Schemes
in 1999 in 20051999 2005 1999 2005
1 2 3 4 5 6 7
A.P 30.5 n.a. 44.6 26 19.9 24
Assam 40.5 11.9 14.4 36 7.1 34
Manipur 59.5 14.44 4.8 37 5.4 17
Meghalaya 28.5 n.a. 31.2 49 9.9 49
Mizoram 36.7 8.35 36.7 58 17.7 58
Nagaland 59.8 14.3 11.4 46 5.3 46
Tripura 31.4 n.a. 12 30 9.3 30
All India 15.6 5.2 n.a. n.a. n.a. n.a.
Source : Report of Trend and Progress of Banking in India, SLBC Agenda Notes of Respective States and Kaveri(undated mimeo).
(4) A Review of Trends.p65 9/28/2007, 1:48 PM113
114 RESERVE BANK OF INDIA OCCASIONAL PAPERS
Lack of adequate infrastructure in the form of roads,communications and transport and power, which restricts themovement goods and services, people, and development of acommon market, has been the most important impediment to socio-economic growth of the region. Tenth Finance Commissionestimated that when the national economic and social infrastructureindex is 100, the index ranged from 48 in Arunachal Pradesh to 82in Assam. Barring Assam and almost a negligible part of Nagaland,there are no rail links. Even the existing links are mostly singletrack, which reduces the speed drastically. Most of the nationalhighways and the state highways continue to remain in dilapidatedconditions in hilly terrains with winding roads, while district andvillage roads are even worse.
Agriculture sector is highly underdeveloped with productionmostly for subsistence. In the plain areas, the population pressure ismuch higher than the national average, reflected in much loweroperational size of holding. The operational holding size in Assam,Manipur and Tripura ranged from 0.60 hectare to 1.17 hectare, asagainst the national average of 1.41 hectare. In these three States,marginal and small operational holdings account for 44 per cent(Assam) to 76 per cent (Tripura) of the total holdings, as against thenational average of 36 per cent. Small operational size of holdingrestricts use of modern inputs, which reduces the demand forinstitutional credit. Further, while the yield per hectare in the plainareas is higher than the national average (for instance foodgrain yieldin Manipur and Tripura in 2000-01 was 2,305 Kgs. per hectare and2,059 Kgs. per hectare respectively, as against the national averageof 1,636 Kgs. per hectare), yield per population dependent onagriculture is not necessarily higher because of the higher populationpressure. In Assam, both the yield per hectare and cultivators arelower. As a result, the available marketable surplus is lower limitinggeneration of cash flows. For instance, the marketable surplus ratioof rice in Assam in 2001-02 was 46 per cent, much lower than thenational average of 73.6 per cent and each of the major rice producingStates in the country (see GOI, 2004).
(4) A Review of Trends.p65 9/28/2007, 1:48 PM114
A REVIEW OF TRENDS IN BANKING INDICATORS 115
On the other hand, in the hill areas, large areas are still undershifting cultivation. Even under settled cultivation, due totopographical reasons, there are constraints to adoption of moderncultivation method, and consequently, the yield rate per hectare andper agricultural worker is much lower. In Arunachal Pradesh andNagaland, the operational holding size is higher ranging from 3.31hectare to 4.82 hectare, but the foodgrain yield ranged from 1,103Kgs. per hectare to 1,550 Kgs. per hectare in 2000-01. Thus, limitedmarketable surplus is again generated. This is also reflected from thefact that no States in the region is self-sufficient in foodgrainproduction, of which rice is the major crop. Besides, inadequate post-harvest infrastructure like warehouses facility and dearth of organisedmarket facilities under scattered production generating limited volumeof outputs severely restricts the monetisation and development ofagricultural sector. Despite being an agrarian economy with a higherpercentage of population dependent on agriculture and alliedactivities, and a greater share in NSDP than the national average of22.5 per cent (ranging from 24.21 per cent in Mizoram to 35.83 percent in Arunachal Pradesh), demand for credit from this sector,therefore, remain limited.
Due to inadequate infrastructure, various forms of subsidygranted in separate industrial policy for the region have failed toattract outside entrepreneurs, which the few first generation localentrepreneurs can not fill. Thus, no large-scale industries in the privatesector exist and the industrial sector remains underdeveloped.Consequently, the share of industry in NSDP ranged from a meagre0.15 per cent in Nagaland to 8.96 per cent in Meghalya and 15.33 percent in Assam, as against the national average of 20.6 per cent.
The demand for credit from real sector (agriculture and industry)is, therefore not only low, but also the economic structure is lopsidedwith disproportionate contribution from community, social andpersonal services (salaried sector) in State income, of which, publicadministration forms a major component. Barring Assam with 49.8per cent, the share of tertiary sector is distinctly higher than the
(4) A Review of Trends.p65 9/28/2007, 1:48 PM115

116 RESERVE BANK OF INDIA OCCASIONAL PAPERS
national average of 57.0 per cent in all the States, ranging from 60.0per cent in Arunachal Pradesh to as high as 74.0 per cent in Mizoram.Within the services sector, the contribution from community, socialand personal services (CSS) in the NSDP ranged from 17.4 per centin Assam to 35.2 per cent in Mizoram, as against the national averageof 14.5 per cent. Within CSS, public administration is dominant inall the States, except Assam which shows the all India pattern. Theshare of public administration in NSDP ranged from 12.6 per cent inNagaland to 18.2 per cent in Arunachal Pradesh, as compared tonational average of 6.5 per cent only. The predominance of publicadministration can be gauged from the fact that it is either the secondor third most important sub-sector after agriculture contributing tothe State income in all the States, except Assam.
Even within the limited demand for credit due to the constraintsprovided by the above factors, the unique land tenure system such ascommunity ownership in the hills, which not only leads to absenceof legalised ownership rights and proper land records but also restrictsalienation of land, disenables collaterisation of land for bank lending.While this problem is absent in the plain areas as inheritable rightsare established, due to non-segregation of pattas on lands inheritedover generations, collateralisation of land for bank lending in thisarea has also become a problem.
While low recovery rate would also follow from poor qualityof credit, repayment culture is lacking in the region, and particularlyso with government sponsored programmes. This could be theadverse fallout of grant culture in the region, which tends to imbibe amindset to the people that any involvement of government means agrant and not a loan. In the region, there could also be other irregularitiesnecessarily cropping up when government machinery is involved inbank financing that there is incentive for non-payment of loans. Infact, government is the main source of indebtedness of rural householdin the region, ranging from 9.2 per cent in Manipur to 97.6 per cent inMizoram, as against the national average of 6.1 per cent only. Even forthe urban households, government is the main source in five States,
(4) A Review of Trends.p65 9/28/2007, 1:48 PM116

A REVIEW OF TRENDS IN BANKING INDICATORS 117
ranging from 11.6 per cent in Manipur to 83.1 per cent in Nagaland(AIDIS, 1991).
The above impediments have also inflicted the local formalinstitutions like RRBs and Cooperatives, which together account formore than 41.0 per cent of the bank branches. As a result, while theseinstitutions should be in a better position than all India commercialbanks to cater to the local needs, they are mostly plagued with hugeaccumulated losses and lack of business plans. Consequently, RRBsare unable to expand their operations and a significant number ofdistricts (19 out of 34 districts) in Meghalaya, Nagaland andArunachal Pradesh are still not covered by them. Similarly, six ofthe seven Apex banks in the region are plagued by poor governanceand weak financials.
The level of awareness of people on various banking schemes islow due to socio-economic conditions and cultural factors and banksnot making any conscious effort to increase it. At the same time, amatured credit culture is lacking and there is preference for hasslefree informal channel instead of formal procedures of typical bankingtransactions that requires documentation. Lack of productdifferentiation and innovations to suit local conditions can be anotherfactor for inability of the formal financial institutions to replace thetraditional institutions, which are flexible and informal buttrustworthy being deep-rooted as it has run through generations. Forinstance, in the plain areas of Manipur a Chit Fund like socialinstitutions called ‘Marup’ is pervasive, which provides to the peoplea highly flexible alternative avenue to banks for saving and borrowingpurposes. A casual observation also finds mushrooming growth ofmicro lending institutions in Manipur who charges exorbitant ratesof interest, yet people prefer them to banks.
The consumption level is higher in the region, and consequently,rate of financial savings is low, limiting recourse to banking channel.Using NSS consumption and NSDP data from CSO, it is estimatedthat, in 2002-03, private consumption as a ratio to NSDP is estimatedat 52.8 per cent for the region as a whole, as against the national
(4) A Review of Trends.p65 9/28/2007, 1:48 PM117
118 RESERVE BANK OF INDIA OCCASIONAL PAPERS
average of 42.3 per cent. For instance, Mizoram is one State with thehighest literacy rate and the lowest APPBO, but with the highest levelof consumption relative to its income, the level of current and savingsaccounts per 100 adult population is the third lowest among theseseven States. While the socio-economic and cultural factors areimportant factors, lack of saving avenues due to inaccessibility to abank branch would also encourage consumption and/or savings cantake the form of non-financial assets. In this regard, as mentionedabove, due to hilly terrain and the sparse settlement of population,APPBO would not fully capture the accessibility of the people tobanking services.
Section IV: Summary and Concluding Remarks
From the trends in banking indicators reviewed above, the sevenStates in the region may be broadly classified into three sub-groups.In the first group are the Arunachal Pradesh, Meghalaya and Mizoramwith low APPBO. States with medium level of APPBO are Assamand Tripura, while Manipur and Nagaland belong to the third groupof very high APPBO. All the States have a much lower level of currentand savings accounts, and credit accounts per 100 adult populationthan at the national level, but within the region, these ratios are higherin the States belonging to the first and second sub-groups. The gap inper capita deposit and credit from the national average is the leastfor the first group followed by the second and third group in thatorder. Similarly, deposit and credit to NSDP ratio follow a similartrend, though they are much lower than the national average in allthe States.
The difference in CD ratio, however, does not conform to theabove categorisation of States. Three States which have plain areas,viz., Assam, Manipur and Tripura used to have a much higher CDratio, about or higher than the national average, during the 1980sand the first half of the 1990s. For Assam, much of the reason forhigher ratio was due to substantial inflow of credit. The remainingfour hilly States had a much lower ratio during the corresponding
(4) A Review of Trends.p65 9/28/2007, 1:48 PM118
A REVIEW OF TRENDS IN BANKING INDICATORS 119
period. Since the mid-1990s, there has been a substantial decline inthe ratio in the above three States with plain areas.
Notwithstanding the above broad categorisation differentiatingthe States, there was common trend of retardation in the growth ofactivities of SCBs in all the States during the decade of the 1990s.The number of current and savings accounts per 100 adult population(barring Assam) declined, deposit and credit growth -particularlycredit- decelerated substantially, the relative gap in per capita creditand deposit, and in deposit and credit to NSDP ratio from the nationalaverage enlarged. Some reversal of this trend, however, has takenplace during the last five years in most of the States. Another commontrend is the much larger decline in the share of agriculture and industryin utilised credit and corresponding increase in the share of retailcredit than at the national level.
Both the demand and supply gaps are important reasons for lowlevel of financial intermediation in the region. While socio-economicand cultural factors have inhibited demand for banking services, it isimportant to note that poor infrastructure has been one of mostimportant constraining factor. As Reddy (2006) notes, without realsector development in terms of physical infrastructure andimprovement in supply elasticities, supply led financialintermediation can lead to misallocation of resources, potentiallygenerate bubbles and possibly amplify the risks. Provision of thesefacilities will not only generate demand for rural credit (Mohan, 2006)but also improve the efficiency of supply. Much of the initiatives fordevelopment of infrastructure and formulating a development strategyto create a favourable investment climate and credit culture will haveto come from the State Governments. However, these facilities couldonly be provided over a longer horizon.
Meanwhile, the existing supply gap in banking services need tobe addressed soon.8 For this, banks will have to innovate and adaptthemselves to the given situation prevailing in the region byredesigning their products according to local demand and reach outto the people. The emphasis should be on productive sectors, as real
(4) A Review of Trends.p65 9/28/2007, 1:48 PM119
120 RESERVE BANK OF INDIA OCCASIONAL PAPERS
sector is underdeveloped and the economy is already lopsided. Owingto this lopsided nature of the economy, retail credit has shown a muchhigher growth in the region than at the national level, and is one ofthe most important reasons for the revival of credit growth in mostof the States during the last five years or so. This is a nationalphenomenon arising from growth of consumerism, easing of lendingstandards by banks, comparatively lower defaults, etc., (Roy, 2006).In the region, while the demand for credit to real sectors is lacking,retail credit has a ready demand due to disproportionately higher shareof public administration and other services in NSDP (salaried classpeople), and higher level of consumption relative to income emanatingfrom social habits. The non-requirement of immovable property suchas land collateral enhances both the demand and supply for thesetypes of loans. But, unlike in other parts of the country, such retailbank credits will not create economic activity in the region, and notsustainable, as the ensuing retail purchases will have to be sourcedfrom elsewhere outside the region.
Though there are a number of unbanked areas, given thetopography of the region with sparse settlement of population andtransport bottlenecks, branch expansion may not be always feasibleon account of financial viability. The alternatives to branch expansionfor outreach, viz., business correspondent and facilitator model isbest suited for the region, as there are a number of community basedorganisations, NGOs and post offices (about 8,000 as compared tosome odd 1,230 SCB branches), which are well dispersed in the regionthan bank branches. Besides, the disadvantage of topography andsparse settlement of population can be overcome through IT basedsolutions, as mobile connectivity has improved substantially in theregion. Smart cards and mobile payments allow banking transactionsfrom non-branch locations. The banks will, however, be required tohave an IT plan at the branch level and incur initial lump suminvestment for the purpose.
One important reason for the people keeping away from thebanking fold is the complexities of documentation required in a typical
(4) A Review of Trends.p65 9/28/2007, 1:48 PM120
A REVIEW OF TRENDS IN BANKING INDICATORS 121
banking transaction. A simplified procedure is a must, which can beintroduced as a pilot project in some select areas. After duecustomisation of simple deposit (such as ‘no frills account’) and creditproducts (like general credit card (GCC)) through awarenessprogrammes, more areas can be covered. For familiarising theseproducts, services of respected local persons like schoolteacher,retired official, postman, etc., could be taken on commission basis.The services of these people could also be taken for recovery of loans,as their respectability among the masses could be leveraged.
The operations of banks through self help groups (SHGs) isanother important route that needs to be reassessed and scaled up.SHGs movement which peaked up late is confined mostly in Assam,though rapid growth is also taking place in other States too. In general,the recovery rates have also been higher for finance to SHGs. Toencourage this, banks may be allowed to refinance MFIs for SHG lending.
Given the unique land tenure system in the region, the norm onland as collateral for bank loans need to be relaxed in the region. Theissue of land procession certificate (LPC) has begun by most of theStates in hill areas, but falls short of legal backing. Further, lack ofcadastral survey and multiplicity of authority and other complexitiesincluding limited transferability rights are inhibiting factors. Acontinued emphasis on such collateral by banks would hinder growthof credit in the region. The focus of the bank should be on the cashflow generating from the credit. Establishing the right to cultivatethe land by the borrower should be the focus, and not on individualownership and transferability of the land in the event of failure onloan repayment. Wherever available, LPC should serve the purposeas this is enough evidence on cultivable right of the borrower on theland. And if this is not available, a letter of comfort from thecommunity based organisation on cultivable right of the borrowershould suffice. For any viable projects in both agriculture and industry,other forms of guarantees such as primary security, personal guaranteeor other trust guarantee could replace land (immovable property)collateral.
(4) A Review of Trends.p65 9/28/2007, 1:48 PM121
122 RESERVE BANK OF INDIA OCCASIONAL PAPERS
For the RRBs, besides the measures such as reassessment of staffneeds, altering business strategy, implementing IT based solutionsand allowing greater freedom in operations, their synergy can beachieved through amalgamation. The Assam Gramin Vikash Bankformed after amalgamation of four RRBs is now the single largestscheduled commercial bank having highest number of bank branchesin Assam. The bank has achieved improved financials afteramalgamation.
With regard to State co-operative banks, in addition to infusionof capital, allowing management by professionals, designing ofsuitable banking products and charting out a clear road map forrevival, they can be considered for business correspondent oncommission basis by SCBs. This arrangement can help both theparties, as the co-operatives have experience in banking transactions,are well dispersed and their financials can improve, while for theSCBs their outreach will increase.
Notes:1 Among the two ratios, the former ratio is also considered as one of thebenchmark to assess the reach of financial services to the population(Leeladhar, 2005). These ratios are also considered as indicators of bankingpenetration (Mohan, 2006).2 Due to non-availability of data at the district level, we have consideredtotal deposit accounts per 100 populations, instead of current and savingsaccounts only.3 We have not reported the detailed estimates to preserve space, but theyare available from the authors.4 Thorat Committee on CD Ratio, appointed by Government of India in2004 distinguished the importance of utilization as against sanction tomeasure the CD ratio of a State.5 Since this point is not known a priori, we searched it within a range of 15per cent to 85 per cent of the sample period, which is the standard practice inthe literature to locate structural breaks at an unknown point of time.6 For States other than Assam (545), it ranged from 262 in Mizoram to483 in Tripura as against the national average of 518.
(4) A Review of Trends.p65 9/28/2007, 1:48 PM122
A REVIEW OF TRENDS IN BANKING INDICATORS 123
7 Credit accounts per employee was however lower, except Tripura (125),and ranged from 52 in Nagaland to 66 in Manipur, against the nationalaverage of 86.8 Financial Sector Plan for the North Eastern Region (Usha ThoratCommittee, 2006) has deliberated in great details and recommendedcomprehensive measures to raise the level of financial inclusion in all itsaspect in the region.
References:
All India Debt and Investment Survey (1991), National Sample SurveyOrganisation, Government of India.
Benhabib, J. and M Spiegel (2000), “The Role of Financial Development inGrowth and Investment”, Journal of Economic Growth, Vol. 5, December 2000.
Boyreau-Debray, G. (2001), “Financial Intermediation and Growth: ChineseStyle”, World Bank, Washington, DC, 2001.
Gorton, Gary and Andrew Winton (2002), “Financial Intermediation”,NBER Working Paper, No. 8928.
Government of India (2004), Agricultural Statistics at a Glance 2004,Ministry of Agriculture, August.
Kaveri V.S., (undated), “Banking in North Eastern Region- An Inter-StateAnalysis”, North Eastern Institute of Bank Management, Guwahati(Mimeo).
Khan, M.S. and Abdelhak S Snehadji (2003), “Financial Development andEconomic Growth: A Review and New Evidence”, Journal of AfricanEconomies, Centre for the Study of African Economies.
King, R.G. and R. Levine (1992), “Financial Indicators and Growth in aCross Section of Countries”, World Bank Policy Research Working PaperNo. 819.
King, R.G. and R. Levine (1993), “Finance and Growth: Schumpeter Mightbe Right”, Quarterly Journal of Economics, Vol. 108, 1993.
Leeladhar, V. (2005), “Taking Banking Services to the Common Man-Financial Inclusion”, Febank Hornis Memorial Foundation Lecture,Ernakulam, December 2, 2005.
Levine, R. (1997), “Financial Development and Economic Growth: Viewsand Agenda”, Journal of Economic Literature, 35(2), 1997, pp. 668-726.
(4) A Review of Trends.p65 9/28/2007, 1:48 PM123
124 RESERVE BANK OF INDIA OCCASIONAL PAPERS
Levine, R. Norman Loayza and Thorsten Beck (1999), “FinancialIntermediation and Growth: Causality and Causes”, World Bank CountryEconomics Department Papers 2059, Washington, DC, 1999.
McKinnon, R. I. (1973), Money and Capital in Economic Development,Washington DC, Brookings Institution, 1973.
Mohan, Rakesh (2006), “Economic Growth, Financial Deepening andFinancial Inclusion”, Address at the Bankers’ Conference 2006, Hyderbad,November 3, 2006.
Reddy, Y.V. (2006),”Globalisation, Money and Finance – Uncertainitiesand Dilemmas”, Valedictory address at the FICCI-IBA Conference,Mumbai, September 28, 2006.
Reserve Bank of India, Basic Statistical Returns, Various Issues.
Reserve Bank of India (2006), Committee of Financial Sector Plan forNorth Eastern Region (Usha Thorat Committee), Mumbai.
Reserve Bank of India (2005), Handbook of Statistics of Indian Economy,2004-05.
Roy, Mohua, (2006), “A Review of Bank Lending to Priority and RetailSectors”, Economic and Political Weekly, March 18, 2006.
Shaw, G. (1973), Financial Deepening in Economic Development, NewYork, Oxford University Press, 1973.
(4) A Review of Trends.p65 9/28/2007, 1:48 PM124