
БЕОГРАДСКА АСТРОНОМСКА ОПСЕРВАТОРИЈА У 1995; BELGRADE ASTRONOMICAL OBSERVATORY IN 1995
Upload
independentCategory
view
2download
0
BioMed CentralHealth Research Policy and Systems
ss
Open AcceResearchModeling trends of health and health related indicators in Ethiopia (1995-2008): a time-series studyMulu W Abraha*†1 and Tilahun H Nigatu†2Address: 1Health Promotion and Disease prevention Directorate, Federal Ministry of Health, Addis Ababa, Ethiopia and 2HIV/AIDS, Population and Nutrition office, United States Agency for International Development/USAID, Addis Ababa, Ethiopia
Email: Mulu W Abraha* - [email protected]; Tilahun H Nigatu - [email protected]
* Corresponding author †Equal contributors
AbstractBackground: The Federal Ministry of Health of Ethiopia has been publishing Health and Healthrelated indicators of the country annually since 1987 E.C. These indicators have been of highimportance in indicating the status of health in the country in those years. However, the trends/patterns of these indicators and the factors related to the trends have not yet been investigated ina systematic manner. In addition, there were minimal efforts to develop a model for predictingfuture values of Health and Health related indicators based on the current trend.
Objectives: The overall aim of this study was to analyze trends of and develop model forprediction of Health and Health related indicators. More specifically, it described the trends ofHealth and Health related indicators, identified determinants of mortality and morbidity indicatorsand developed model for predicting future values of MDG indicators.
Methods: This study was conducted on Health and Health related indicators of Ethiopia from theyear 1987 E.C to 2000 E.C. Key indicators of Mortality and Morbidity, Health service coverage,Health systems resources, Demographic and socio-economic, and Risk factor indicators wereextracted and analyzed. The trends in these indicators were established using trend analysistechniques. The determinants of the established trends were identified using ARIMA models inSTATA. The trend-line equations were then used to predict future values of the indicators.
Results: Among the mortality indicators considered in this study, it was only Maternal MortalityRatio that showed statistically significant decrement within the study period. The trends of TotalFertility Rate, physician per 100,000 population, skilled birth attendance and postnatal carecoverage were found to have significant association with Maternal Mortality Ratio trend. There wasa reversal of malaria parasite prevalence in 1999 E.C from Plasmodium Falciparum to PlasmodiumVivax. Based on the prediction from the current trend, the Millennium Development Goal targetfor under-five mortality rate and proportion of people having access to basic sanitation can beachieved.
Conclusion: The current trend indicates the need to accelerate the progress of the indicators toachieve MDGs at or before 2015, particularly for Maternal Health and access to safe water supply.
Published: 13 December 2009
Health Research Policy and Systems 2009, 7:29 doi:10.1186/1478-4505-7-29
Received: 21 September 2009Accepted: 13 December 2009
This article is available from: http://www.health-policy-systems.com/content/7/1/29
© 2009 Abraha and Nigatu; licensee BioMed Central Ltd. This is an Open Access article distributed under the terms of the Creative Commons Attribution License (http://creativecommons.org/licenses/by/2.0), which permits unrestricted use, distribution, and reproduction in any medium, provided the original work is properly cited.
Page 1 of 17(page number not for citation purposes)
Health Research Policy and Systems 2009, 7:29 http://www.health-policy-systems.com/content/7/1/29
IntroductionThere is no single "standard" measurement of health sta-tus for individuals or population groups. Individualhealth status may be measured by an observer (e.g., a phy-sician), who performs an examination and rates the indi-vidual along any of several dimensions, includingpresence or absence of life-threatening illness, risk factorsfor premature death, severity of disease, and overallhealth. Individual health status may also be assessed byasking the person to report his/her health perceptions inthe domains of interest, such as physical functioning,emotional well-being, pain or discomfort, and overall per-ception of health [1].
The Health of an entire population is determined byaggregating data collected on individuals. The health of anindividual is easier to define than the health of a popula-tion. Once the definition of optimum health for the indi-vidual is agreed upon, health status can be placed along acontinuum from perfect health to death. No comparablescale exists for whole populations. What is the popula-tion-level equivalent of death? (Keep in mind that it isunusual for entire populations to die.) In the absence ofcomprehensive or absolute measures of the health of apopulation, the average lifespan, the prevalence of pre-ventable diseases or deaths, and availability of health serv-ices serve as indicators of health status [2].
Hence, judgments regarding the level of health of a partic-ular population are usually made by comparing one pop-ulation to another, or by studying the trends in a healthindicator within a population over time. There are twomain goals of time-series analysis (a) identifying thenature of the phenomenon represented by the sequenceof observations, and (b) forecasting (predicting future val-ues of the time series variable). Both of these goals requirethat the pattern of observed time series data is identifiedand more or less formally described. Once the pattern isestablished, we can interpret and integrate it with otherdata [3].
One of the hallmarks of epidemiologic analysis is theunderstanding that health outcomes in a population canonly be fully understood if their frequency and distribu-tion is examined in terms of person, place, and time.Trend analysis is one leg of this analytic triangle, and isused for public health surveillance and monitoring, forforecasting, for program evaluation, for policy analysis,and for etiologic analysis, investigation of potentiallycausal relationships between risk factors and outcomes[4].
The Federal Ministry of Health of Ethiopia has been pub-lishing Health and Health related indicators as a stand-alone document since 1987 E.C. Through this document,
which is published on annual basis, the annual status ofseveral Health and Health related indicators is reported.Mortality and morbidity indicators, Health service cover-age indicators, Health system resource indicators andsocio-economic indicators are the major ones [5].
Though the Ministry has been producing such useful indi-cators the trend of those important indicators hasn't beensystematically investigated. This doesn't however meanthat there are no efforts in analyzing the trends. There areefforts in presenting trends through graphs and tableswithin the indicator documents. But as to the existingknowledge, there are no studies that tried to fit the trendsin modeling equations and predict future values based onthe current trends for the majority of the indicators.Besides, the determinants of changes in key health statusindicators like Maternal Mortality Ratio and Infant Mor-tality Rate hasn't been established through modeling exer-cises and regression models in a time-series dataset of theindicators [6].
In light of this, the envisaged study was designed todescribe the overall pattern of Health and Health relatedindicators overtime by comparing one time-period toanother time-period in the series. The study had alsodeveloped trend-line equations/models that can be usedto predict future values based on the current trend. More-over, these equations/models were used to predict MDGindicator values for 2015 which were then compared withtheir target values. Among the purposes was also identifi-cation of determinants of changes/improvements in mor-tality and morbidity indicators during the study period.This study therefore has identified determinants of mor-tality and morbidity indicators in Ethiopia during theperiod of 1987 E.C to 2000 E.C (1995 to 2008) [7].
MethodsStudy area and periodThis study was conducted on Health and Health relatedindicators of Ethiopia. The current population is approxi-mately 73.9 million, of which 83.86 percent live in ruralareas. Ethiopia is a Federal Democratic Republic com-posed of 9 National Regional states two Administrativestates. The national regional states as well as the two citiesadministrative councils are further divided into six hun-dred eleven woredas and around 15,000 kebeles (5,000Urban & 10,000 Rural). This study was conducted fromJanuary 2001 E.C to May 2001 E.C.
Study design and indicatorsThis study followed the time-series type of study designbased on the review of annual reports of Health andHealth related indicators in Ethiopia. The source indica-tors for this study were all Health and Health related indi-cators in Ethiopia. The units of analysis of this study were
Page 2 of 17(page number not for citation purposes)
Health Research Policy and Systems 2009, 7:29 http://www.health-policy-systems.com/content/7/1/29
Health and Health related indicators in Ethiopia for 14years period (1987-2000 E.C). Accordingly, the studyindicators were selected Health and Health related indica-tors in Ethiopia.
Sample and samplingThe number of time-periods being examined for eachhealth and health related indicator was 14 (1987-2000E.C), that is since the time at which Health and Healthrelated indicators were obtained. The number of Healthand Health related indicators considered in this study wasselected in the following way. First, the Health and Healthrelated indicators were categorized in to five major catego-ries based on the WHO 2008 health statistics.
The categories and the number of indicators in each cate-gory were Mortality and Morbidity indicators (14 indica-tors), Health service coverage indicators (10 indicators),Health systems resources indicators (10 indicators),Demographic and socio-economic indicators (10 indica-tors), and Risk factors indicators (6 indicators). These allmake the total number of indicators included in the studyto be 50.
From each category of Health & Health related indicator,study indicators were selected purposively. The criteriathat were used to select the indicators were: Public Healthimportance/widely used, data availability for the studyperiod, measurement at national, relevance to MDGs andpresence/absence of significant measurement change dur-ing the study period.
A total of 90 indicator documents were reviewed of which45 national and the rest 45 were international documents.Indicator values were cross-evaluated across and withinthese sources.
For the purpose of this study, three instruments wereemployed: Documents collection checklists, indicator col-lection format and indicator definition. In order to collectthe documents from which study indicators and/or theirdeterminant obtained a document collection checklistwas used to facilitate the collection of indicator docu-ments. An excel sheet to which the values of study indica-tors were filled was used to collect the relevant indicatorsof the study across the study duration. This definition wasbased on the definition of Ministry of Health and othersectors. The indicator definition was prepared (adopted)to assist the interpretation of the findings.
Six Public Health Professionals were oriented about thestudy and its data requirements based on the objective ofthe study. They collected the available documents (in softand/or hard copies) that bear indicator values and theyreferred for the rest of the documents to departments of
the Ministries (Authorities) and libraries. The principalinvestigator reviewed the collected documents andextracted the indicators.
Data analysis and interpretationAll the indicator values were entered in to a spreadsheet inMs-excel. The entered data were checked once again foraccuracy of data entry. Errors during the entry werecleaned and analysis started. The analysis of the data fol-lowed the following steps:
Describing TrendsThe first step in the analysis looked in to trend in eachHealth and Health related indicator. The patterns of eachHealth and Health related indicator were describednumerically and graphically. The changes of the indicatorswere also described using numerical summaries and linegraphs. Changes of mortality and morbidity indicatorswere additionally described by confidence intervals usingSTATA 8.0 and only those with statistically significantchanges, non-overlapping confidence intervals were con-sidered for Auto Regressive Iintegarted Moving Average(ARIMA) model.
Fitting trend-line equationsThe trend was plotted using a line graph by connecting thepoints on the X-Y axis, where X is the time in year and Y isvalue of the selected indicator for each year. Then an effortwas made to identify a trend-line equation that best fitsthe line using coefficient of determination (R2). Datatransformation and smoothing was made to change therate and flatten the series of rates without changing theshape of the trend (e.g. MMR≅ log MMR). The rate ofannual change of the indicator values (R) was estimatedby equating the indicator (I) and time (T): I = B0 + R (T),when linearity was assumed. If linearity was not assumed,other trend-line options (trend/regression types) includ-ing polynomial, logarithmic, exponential and power wereconsidered
Identifying determinantsHere morbidity and mortality indicators were consideredas outcome variables and any indicator that affected theoutcome variables was taken as independent variables.For the given period of 14 years, the morbidity (burden ofdisease) and mortality indicators which showed statisti-cally significant change were assessed for their associationwith possible determinants (based on literature evidence)which had statistically significant change across time. Firstcorrelation of variables was observed in a correlationmatrix. Then all potential determinants of a dependentvariable (indicator) were fitted in to ARIMA (Auto Regres-sion Integrated Moving Average) model in STATA 8.0. Forall cases, P-values < 0.05 was considered to be statisticallysignificant.
Page 3 of 17(page number not for citation purposes)
Health Research Policy and Systems 2009, 7:29 http://www.health-policy-systems.com/content/7/1/29
Predicting future valuesThe best fit equations of the trend-line of an indicatorwere used to predict the future values of the indicator for2015. These predicted values were then compared withthe targets for 2015 by the MDG. Then the findings werediscussed in the perspective of achieving the MDGs.
Ethical considerationEthical clearance was obtained from the Ethical reviewcommittee of Faculty of Health, Jimma University. Offi-cial permission was requested from the different organiza-tions for documents. For data obtained from publicationsand web pages, all the data sources were acknowledged.
Results1. Description of trendsMortality indicatorsIn this study five major mortality indicators were used:Infant Mortality Rate (IMR), Maternal Mortality Ratio(MMR), Under-five Mortality Rate (U5MR), Crude DeathRate (CDR), and Life Expectancy at Birth (LEB). Theseindicators were measured in 1994 census, DHS 2000 andDHS 2005. Hence these indicators have only three meas-urement values. The mortality indicators and their 95%confidence intervals are shown in Table 1.
As shown in Table 1, the 95% confidence intervals of themortality indicators overlap each other except for Mater-nal Mortality Ratio. For example the 1994 census InfantMortality Rate value was 110 with the confidence intervalof 90.6 and 129.3, and the DHS 2000 value of Infant Mor-tality Rate was 97 with confidence interval of 78.6 and115.3 which showed an overlap of values. The same is truefor under-five Mortality Ratio and Crude Death Rate. Thisshows that it is only the Maternal Mortality that shown astatistically significant decrement in the study period. Therest of the mortality indicators showed a decrement buthaven't shown any statistically significant reduction.
The decrease in the mortality rates (maternal mortalityrate, infant mortality rate, and under-five mortality rates)during the study period are shown in the following graph.The higher change (decrement) of Infant mortality ratewas occurred between years 1987 to 1993 however forMaternal Mortality Ratio, Under-five Mortality rate andCrude Death Rate greater change was shown between1987 and 1993 E.C. The highest decrease in mortality wasthe under-five mortality rate followed by the infant mor-tality rate. The least decrement is observed in Crude DeathRate followed by Maternal Mortality Ratio.
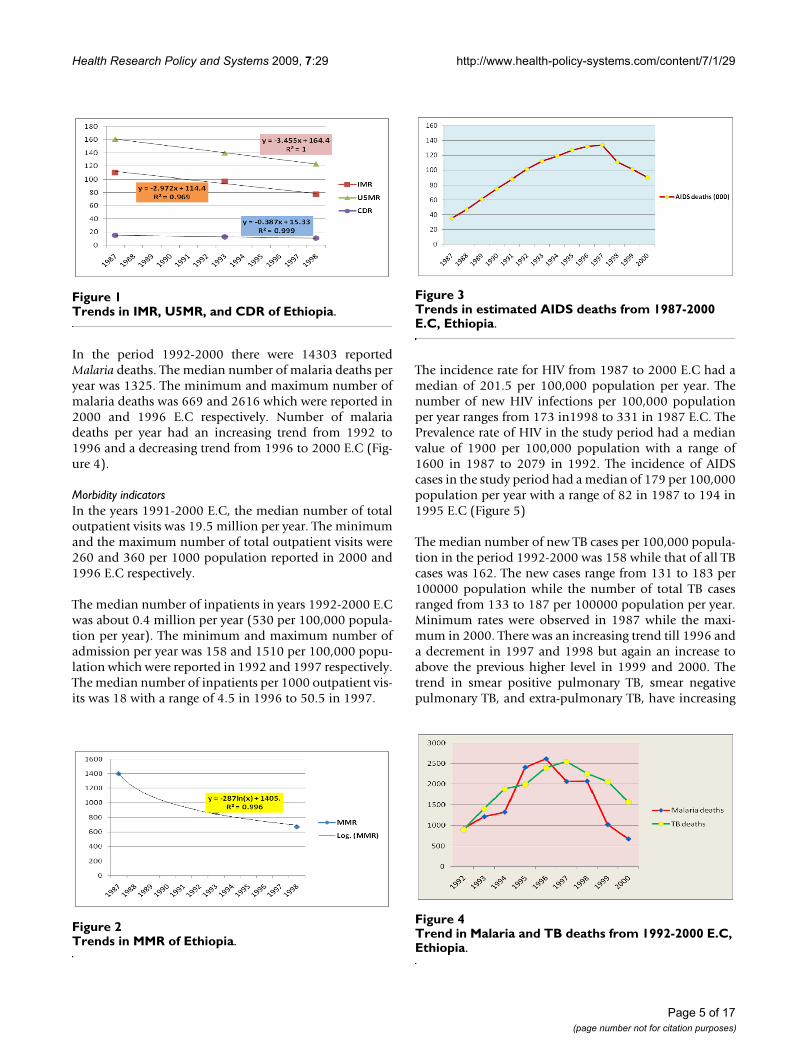
In analysis of trends in the major mortality indicators,infant mortality rate, under-five mortality rate, and crudedeath rate were found to have linear decrement trend. Theyearly decrement rates for these indicators were 2.97 per100,000 live births, 3.45 per 100,000 live births and 0.38per 1000 population respectively (Figure 1). However, theMaternal Mortality Ratio followed the logarithmic trendwith a yearly decrement rate of 672 per 100,000 live births(Figure 2).
With regard to AIDS related mortality, there were an esti-mated total of 1.3 million AIDS deaths in the study period(1987-2000). This will make median AIDS related deathsper year to be 101,000. The maximum estimated numberof AIDS deaths per year was 134 thousand which wasobserved in 1997. The trend of AIDS related deaths had anincreasing trend but it showed a decrement after 1997(Figure 3).
As to Tuberculosis related mortality, there were 17,022reported Tuberculosis deaths in the period 1992-2000.The median number of TB deaths per year was found to be1993 with a range of 898 to 2548. The smallest number ofTB deaths was observed in 1992 while the largest was in1997. The pattern of TB deaths had an increasing trend till1997 but a decreasing pattern after 1997.
Table 1: Mortality indicators of Ethiopia and their 95% confidence intervals, Ethiopia
Indicators 1994 census DHS 2000 DHS 2005
IMR 110 [90.6, 129.3] 97 [78.6, 115.3] 77 [60.5, 93.5]
MMR 1400 [1327, 1473] 871 [813, 928] 673 [622, 723]
U5MR 161 [138.2, 183.8] 140.1 [118.6, 161.6] 123 [102.6, 143.4]
CDR 14.96 [7.4, 22.5] 12.6 [5.7, 19.5] 10.7 [4.3, 17.1]
LEB Female 53 55.4 55.4
LEB Male 50.9 53.4 53.4
Page 4 of 17(page number not for citation purposes)
Health Research Policy and Systems 2009, 7:29 http://www.health-policy-systems.com/content/7/1/29
In the period 1992-2000 there were 14303 reportedMalaria deaths. The median number of malaria deaths peryear was 1325. The minimum and maximum number ofmalaria deaths was 669 and 2616 which were reported in2000 and 1996 E.C respectively. Number of malariadeaths per year had an increasing trend from 1992 to1996 and a decreasing trend from 1996 to 2000 E.C (Fig-ure 4).
Morbidity indicatorsIn the years 1991-2000 E.C, the median number of totaloutpatient visits was 19.5 million per year. The minimumand the maximum number of total outpatient visits were260 and 360 per 1000 population reported in 2000 and1996 E.C respectively.
The median number of inpatients in years 1992-2000 E.Cwas about 0.4 million per year (530 per 100,000 popula-tion per year). The minimum and maximum number ofadmission per year was 158 and 1510 per 100,000 popu-lation which were reported in 1992 and 1997 respectively.The median number of inpatients per 1000 outpatient vis-its was 18 with a range of 4.5 in 1996 to 50.5 in 1997.
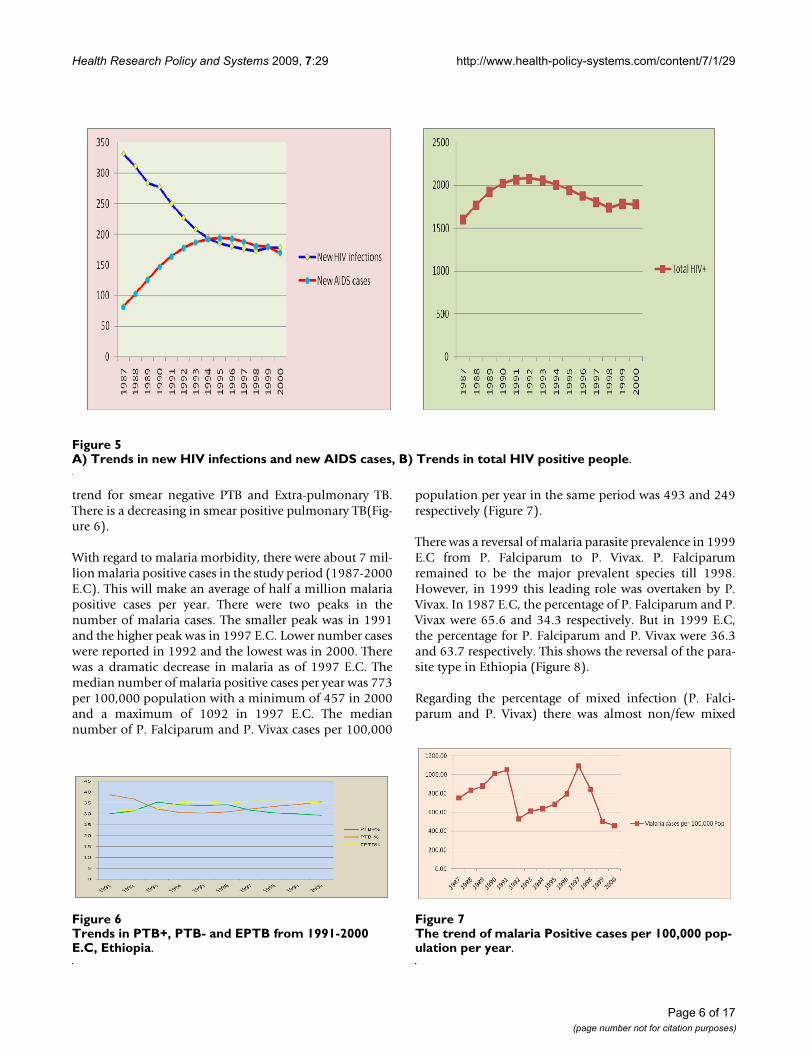
The incidence rate for HIV from 1987 to 2000 E.C had amedian of 201.5 per 100,000 population per year. Thenumber of new HIV infections per 100,000 populationper year ranges from 173 in1998 to 331 in 1987 E.C. ThePrevalence rate of HIV in the study period had a medianvalue of 1900 per 100,000 population with a range of1600 in 1987 to 2079 in 1992. The incidence of AIDScases in the study period had a median of 179 per 100,000population per year with a range of 82 in 1987 to 194 in1995 E.C (Figure 5)
The median number of new TB cases per 100,000 popula-tion in the period 1992-2000 was 158 while that of all TBcases was 162. The new cases range from 131 to 183 per100000 population while the number of total TB casesranged from 133 to 187 per 100000 population per year.Minimum rates were observed in 1987 while the maxi-mum in 2000. There was an increasing trend till 1996 anda decrement in 1997 and 1998 but again an increase toabove the previous higher level in 1999 and 2000. Thetrend in smear positive pulmonary TB, smear negativepulmonary TB, and extra-pulmonary TB, have increasing
Trends in IMR, U5MR, and CDR of EthiopiaFigure 1Trends in IMR, U5MR, and CDR of Ethiopia.
Trends in MMR of EthiopiaFigure 2Trends in MMR of Ethiopia.
Trends in estimated AIDS deaths from 1987-2000 E.C, Ethio-piaFigure 3Trends in estimated AIDS deaths from 1987-2000 E.C, Ethiopia.
Trend in Malaria and TB deaths from 1992-2000 E.C, Ethio-piaFigure 4Trend in Malaria and TB deaths from 1992-2000 E.C, Ethiopia.
Page 5 of 17(page number not for citation purposes)
Health Research Policy and Systems 2009, 7:29 http://www.health-policy-systems.com/content/7/1/29
trend for smear negative PTB and Extra-pulmonary TB.There is a decreasing in smear positive pulmonary TB(Fig-ure 6).
With regard to malaria morbidity, there were about 7 mil-lion malaria positive cases in the study period (1987-2000E.C). This will make an average of half a million malariapositive cases per year. There were two peaks in thenumber of malaria cases. The smaller peak was in 1991and the higher peak was in 1997 E.C. Lower number caseswere reported in 1992 and the lowest was in 2000. Therewas a dramatic decrease in malaria as of 1997 E.C. Themedian number of malaria positive cases per year was 773per 100,000 population with a minimum of 457 in 2000and a maximum of 1092 in 1997 E.C. The mediannumber of P. Falciparum and P. Vivax cases per 100,000
population per year in the same period was 493 and 249respectively (Figure 7).
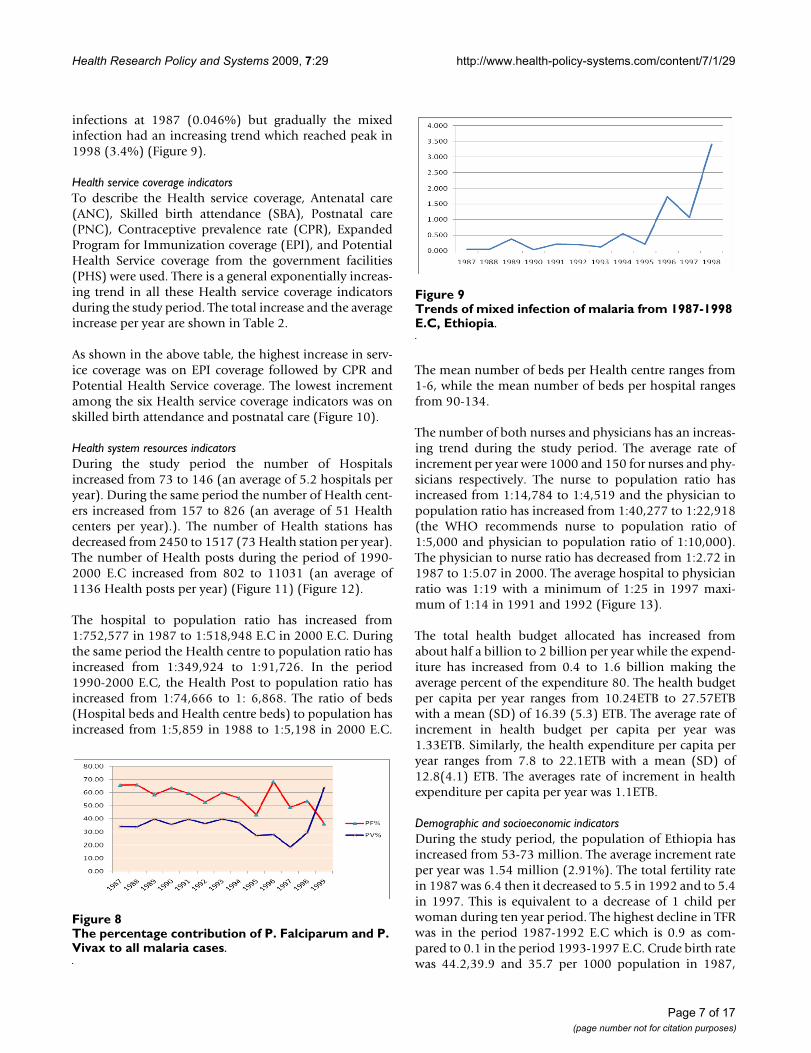
There was a reversal of malaria parasite prevalence in 1999E.C from P. Falciparum to P. Vivax. P. Falciparumremained to be the major prevalent species till 1998.However, in 1999 this leading role was overtaken by P.Vivax. In 1987 E.C, the percentage of P. Falciparum and P.Vivax were 65.6 and 34.3 respectively. But in 1999 E.C,the percentage for P. Falciparum and P. Vivax were 36.3and 63.7 respectively. This shows the reversal of the para-site type in Ethiopia (Figure 8).
Regarding the percentage of mixed infection (P. Falci-parum and P. Vivax) there was almost non/few mixed
A) Trends in new HIV infections and new AIDS cases, B) Trends in total HIV positive peopleFigure 5A) Trends in new HIV infections and new AIDS cases, B) Trends in total HIV positive people.
Trends in PTB+, PTB- and EPTB from 1991-2000 E.C, Ethio-piaFigure 6Trends in PTB+, PTB- and EPTB from 1991-2000 E.C, Ethiopia.
The trend of malaria Positive cases per 100,000 population per yearFigure 7The trend of malaria Positive cases per 100,000 pop-ulation per year.
Page 6 of 17(page number not for citation purposes)
Health Research Policy and Systems 2009, 7:29 http://www.health-policy-systems.com/content/7/1/29
infections at 1987 (0.046%) but gradually the mixedinfection had an increasing trend which reached peak in1998 (3.4%) (Figure 9).
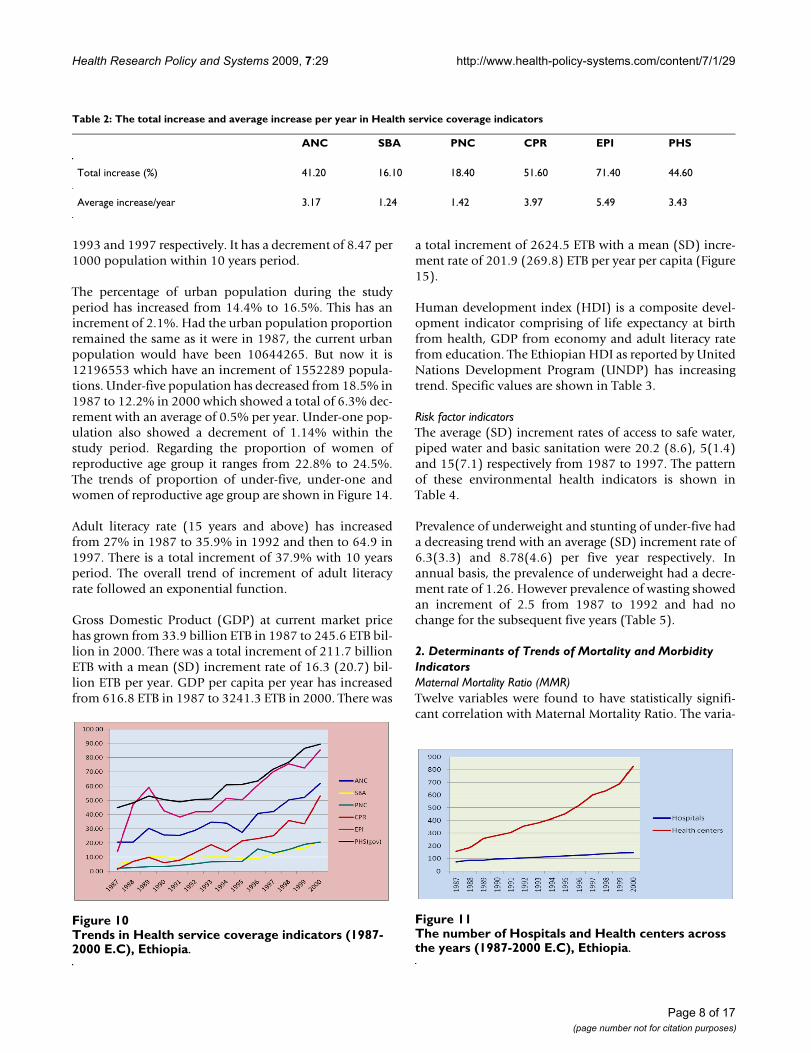
Health service coverage indicatorsTo describe the Health service coverage, Antenatal care(ANC), Skilled birth attendance (SBA), Postnatal care(PNC), Contraceptive prevalence rate (CPR), ExpandedProgram for Immunization coverage (EPI), and PotentialHealth Service coverage from the government facilities(PHS) were used. There is a general exponentially increas-ing trend in all these Health service coverage indicatorsduring the study period. The total increase and the averageincrease per year are shown in Table 2.
As shown in the above table, the highest increase in serv-ice coverage was on EPI coverage followed by CPR andPotential Health Service coverage. The lowest incrementamong the six Health service coverage indicators was onskilled birth attendance and postnatal care (Figure 10).
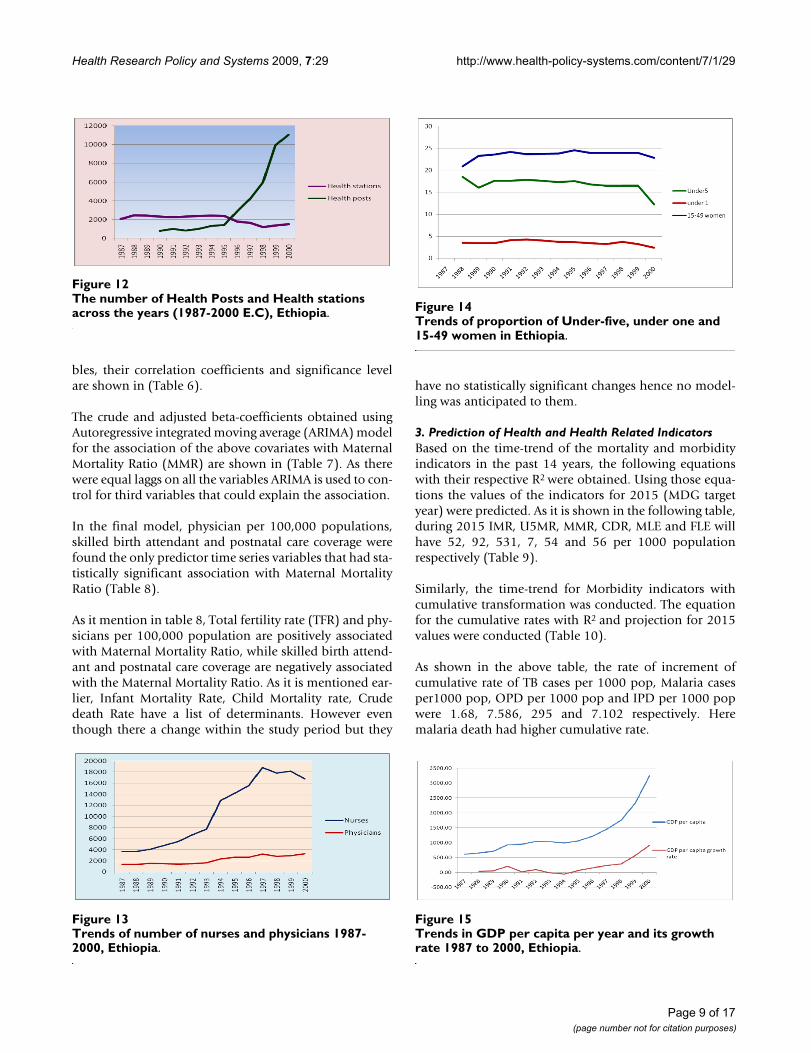
Health system resources indicatorsDuring the study period the number of Hospitalsincreased from 73 to 146 (an average of 5.2 hospitals peryear). During the same period the number of Health cent-ers increased from 157 to 826 (an average of 51 Healthcenters per year).). The number of Health stations hasdecreased from 2450 to 1517 (73 Health station per year).The number of Health posts during the period of 1990-2000 E.C increased from 802 to 11031 (an average of1136 Health posts per year) (Figure 11) (Figure 12).
The hospital to population ratio has increased from1:752,577 in 1987 to 1:518,948 E.C in 2000 E.C. Duringthe same period the Health centre to population ratio hasincreased from 1:349,924 to 1:91,726. In the period1990-2000 E.C, the Health Post to population ratio hasincreased from 1:74,666 to 1: 6,868. The ratio of beds(Hospital beds and Health centre beds) to population hasincreased from 1:5,859 in 1988 to 1:5,198 in 2000 E.C.
The mean number of beds per Health centre ranges from1-6, while the mean number of beds per hospital rangesfrom 90-134.
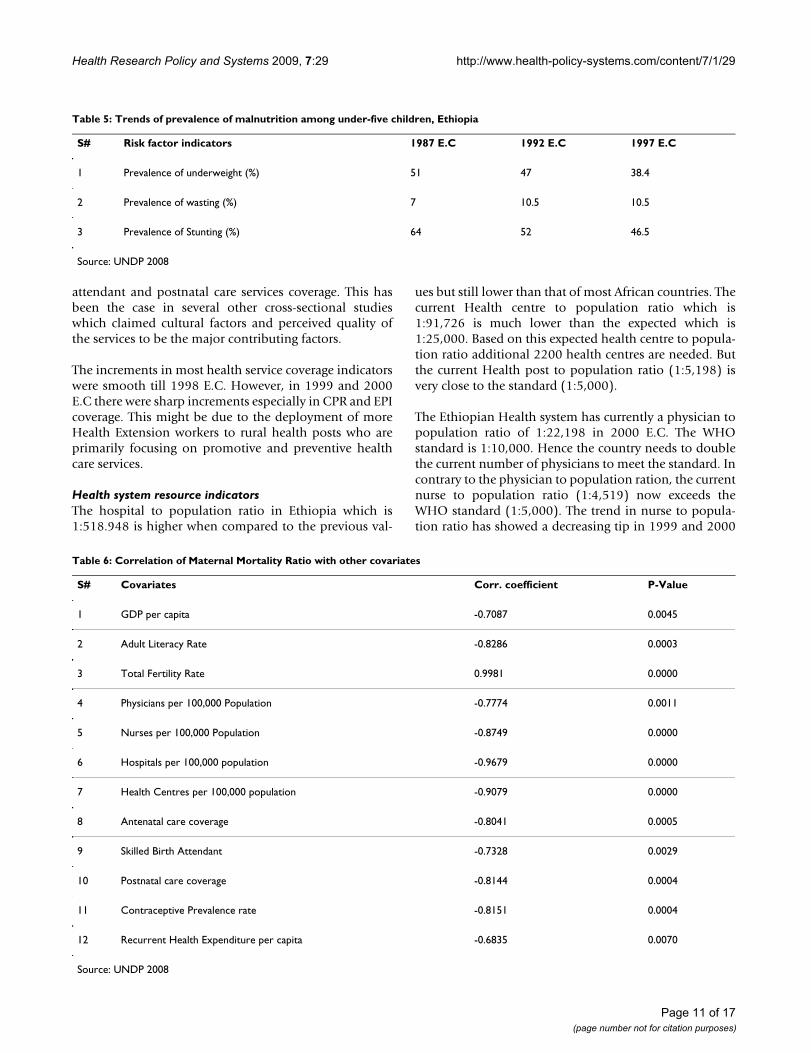
The number of both nurses and physicians has an increas-ing trend during the study period. The average rate ofincrement per year were 1000 and 150 for nurses and phy-sicians respectively. The nurse to population ratio hasincreased from 1:14,784 to 1:4,519 and the physician topopulation ratio has increased from 1:40,277 to 1:22,918(the WHO recommends nurse to population ratio of1:5,000 and physician to population ratio of 1:10,000).The physician to nurse ratio has decreased from 1:2.72 in1987 to 1:5.07 in 2000. The average hospital to physicianratio was 1:19 with a minimum of 1:25 in 1997 maxi-mum of 1:14 in 1991 and 1992 (Figure 13).
The total health budget allocated has increased fromabout half a billion to 2 billion per year while the expend-iture has increased from 0.4 to 1.6 billion making theaverage percent of the expenditure 80. The health budgetper capita per year ranges from 10.24ETB to 27.57ETBwith a mean (SD) of 16.39 (5.3) ETB. The average rate ofincrement in health budget per capita per year was1.33ETB. Similarly, the health expenditure per capita peryear ranges from 7.8 to 22.1ETB with a mean (SD) of12.8(4.1) ETB. The averages rate of increment in healthexpenditure per capita per year was 1.1ETB.
Demographic and socioeconomic indicatorsDuring the study period, the population of Ethiopia hasincreased from 53-73 million. The average increment rateper year was 1.54 million (2.91%). The total fertility ratein 1987 was 6.4 then it decreased to 5.5 in 1992 and to 5.4in 1997. This is equivalent to a decrease of 1 child perwoman during ten year period. The highest decline in TFRwas in the period 1987-1992 E.C which is 0.9 as com-pared to 0.1 in the period 1993-1997 E.C. Crude birth ratewas 44.2,39.9 and 35.7 per 1000 population in 1987,
The percentage contribution of P. Falciparum and P. Vivax to all malaria casesFigure 8The percentage contribution of P. Falciparum and P. Vivax to all malaria cases.
Trends of mixed infection of malaria from 1987-1998 E.C, EthiopiaFigure 9Trends of mixed infection of malaria from 1987-1998 E.C, Ethiopia.
Page 7 of 17(page number not for citation purposes)
Health Research Policy and Systems 2009, 7:29 http://www.health-policy-systems.com/content/7/1/29
1993 and 1997 respectively. It has a decrement of 8.47 per1000 population within 10 years period.
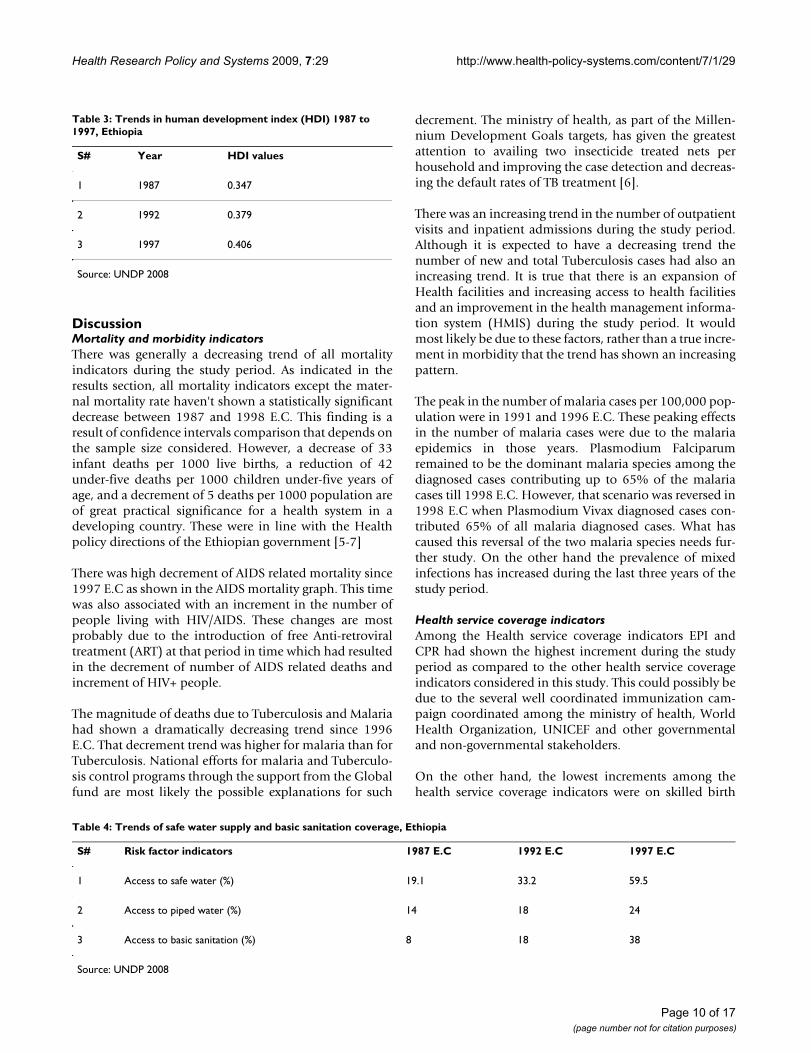
The percentage of urban population during the studyperiod has increased from 14.4% to 16.5%. This has anincrement of 2.1%. Had the urban population proportionremained the same as it were in 1987, the current urbanpopulation would have been 10644265. But now it is12196553 which have an increment of 1552289 popula-tions. Under-five population has decreased from 18.5% in1987 to 12.2% in 2000 which showed a total of 6.3% dec-rement with an average of 0.5% per year. Under-one pop-ulation also showed a decrement of 1.14% within thestudy period. Regarding the proportion of women ofreproductive age group it ranges from 22.8% to 24.5%.The trends of proportion of under-five, under-one andwomen of reproductive age group are shown in Figure 14.
Adult literacy rate (15 years and above) has increasedfrom 27% in 1987 to 35.9% in 1992 and then to 64.9 in1997. There is a total increment of 37.9% with 10 yearsperiod. The overall trend of increment of adult literacyrate followed an exponential function.
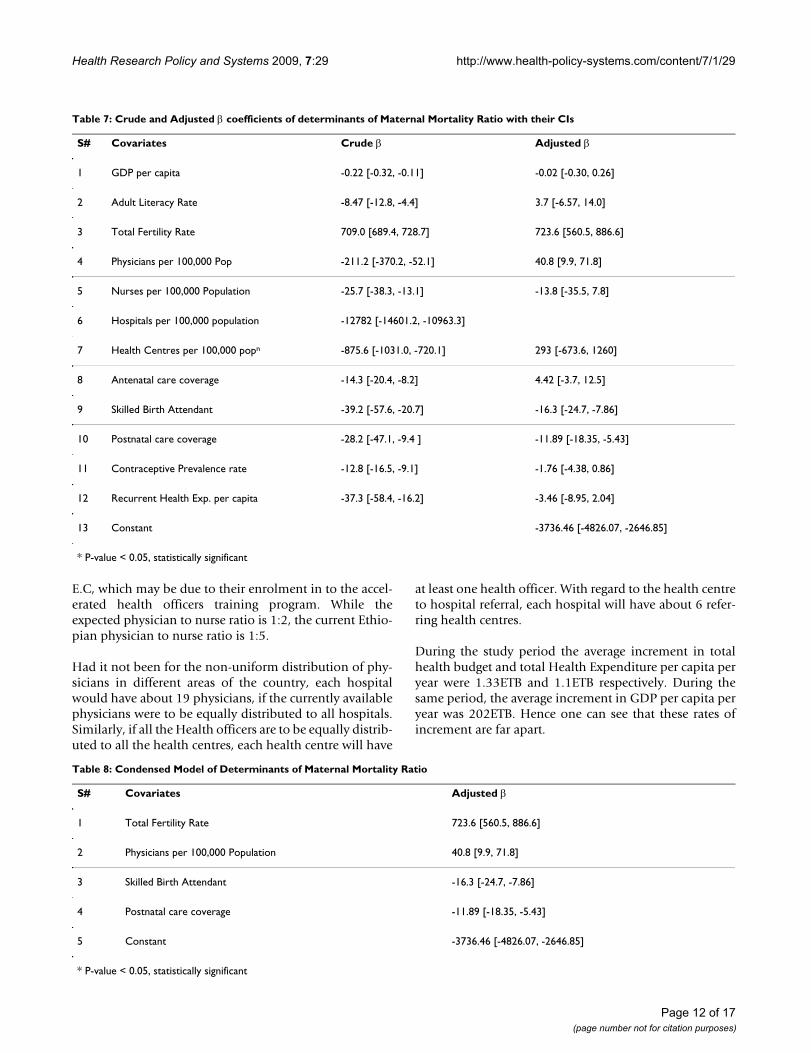
Gross Domestic Product (GDP) at current market pricehas grown from 33.9 billion ETB in 1987 to 245.6 ETB bil-lion in 2000. There was a total increment of 211.7 billionETB with a mean (SD) increment rate of 16.3 (20.7) bil-lion ETB per year. GDP per capita per year has increasedfrom 616.8 ETB in 1987 to 3241.3 ETB in 2000. There was
a total increment of 2624.5 ETB with a mean (SD) incre-ment rate of 201.9 (269.8) ETB per year per capita (Figure15).
Human development index (HDI) is a composite devel-opment indicator comprising of life expectancy at birthfrom health, GDP from economy and adult literacy ratefrom education. The Ethiopian HDI as reported by UnitedNations Development Program (UNDP) has increasingtrend. Specific values are shown in Table 3.
Risk factor indicatorsThe average (SD) increment rates of access to safe water,piped water and basic sanitation were 20.2 (8.6), 5(1.4)and 15(7.1) respectively from 1987 to 1997. The patternof these environmental health indicators is shown inTable 4.
Prevalence of underweight and stunting of under-five hada decreasing trend with an average (SD) increment rate of6.3(3.3) and 8.78(4.6) per five year respectively. Inannual basis, the prevalence of underweight had a decre-ment rate of 1.26. However prevalence of wasting showedan increment of 2.5 from 1987 to 1992 and had nochange for the subsequent five years (Table 5).
2. Determinants of Trends of Mortality and Morbidity IndicatorsMaternal Mortality Ratio (MMR)Twelve variables were found to have statistically signifi-cant correlation with Maternal Mortality Ratio. The varia-
Table 2: The total increase and average increase per year in Health service coverage indicators
ANC SBA PNC CPR EPI PHS
Total increase (%) 41.20 16.10 18.40 51.60 71.40 44.60
Average increase/year 3.17 1.24 1.42 3.97 5.49 3.43
Trends in Health service coverage indicators (1987-2000 E.C), EthiopiaFigure 10Trends in Health service coverage indicators (1987-2000 E.C), Ethiopia.
The number of Hospitals and Health centers across the years (1987-2000 E.C), EthiopiaFigure 11The number of Hospitals and Health centers across the years (1987-2000 E.C), Ethiopia.
Page 8 of 17(page number not for citation purposes)
Health Research Policy and Systems 2009, 7:29 http://www.health-policy-systems.com/content/7/1/29
bles, their correlation coefficients and significance levelare shown in (Table 6).
The crude and adjusted beta-coefficients obtained usingAutoregressive integrated moving average (ARIMA) modelfor the association of the above covariates with MaternalMortality Ratio (MMR) are shown in (Table 7). As therewere equal laggs on all the variables ARIMA is used to con-trol for third variables that could explain the association.
In the final model, physician per 100,000 populations,skilled birth attendant and postnatal care coverage werefound the only predictor time series variables that had sta-tistically significant association with Maternal MortalityRatio (Table 8).
As it mention in table 8, Total fertility rate (TFR) and phy-sicians per 100,000 population are positively associatedwith Maternal Mortality Ratio, while skilled birth attend-ant and postnatal care coverage are negatively associatedwith the Maternal Mortality Ratio. As it is mentioned ear-lier, Infant Mortality Rate, Child Mortality rate, Crudedeath Rate have a list of determinants. However eventhough there a change within the study period but they
have no statistically significant changes hence no model-ling was anticipated to them.
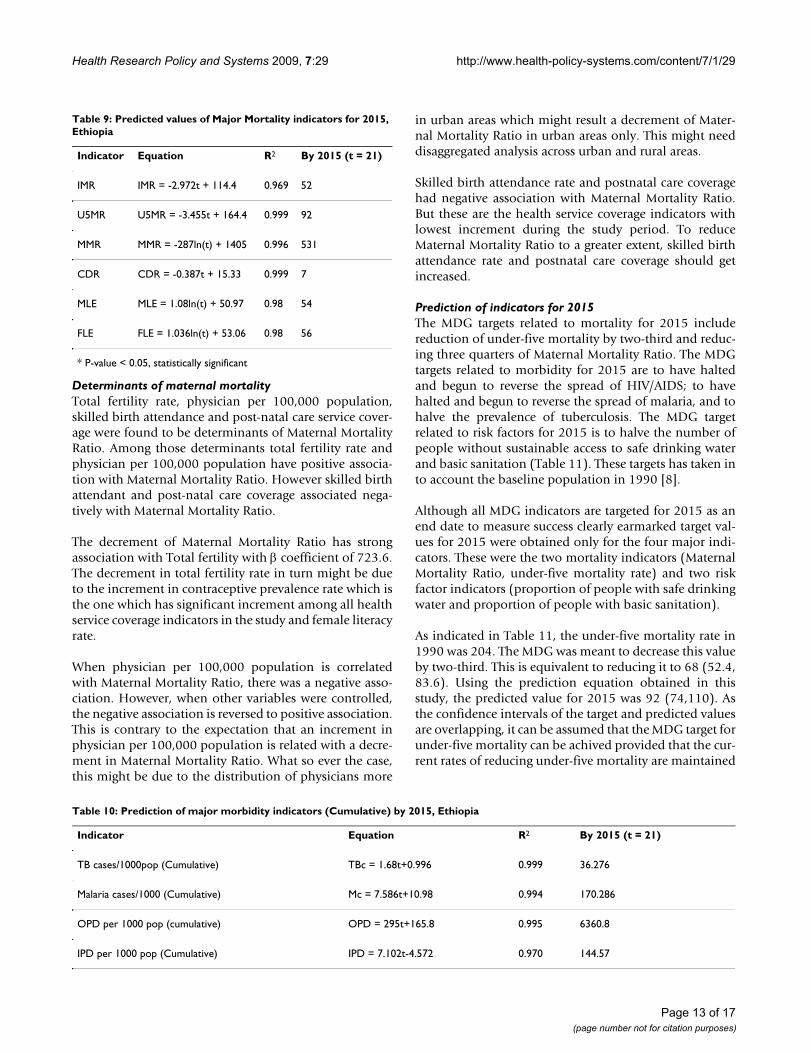
3. Prediction of Health and Health Related IndicatorsBased on the time-trend of the mortality and morbidityindicators in the past 14 years, the following equationswith their respective R2 were obtained. Using those equa-tions the values of the indicators for 2015 (MDG targetyear) were predicted. As it is shown in the following table,during 2015 IMR, U5MR, MMR, CDR, MLE and FLE willhave 52, 92, 531, 7, 54 and 56 per 1000 populationrespectively (Table 9).
Similarly, the time-trend for Morbidity indicators withcumulative transformation was conducted. The equationfor the cumulative rates with R2 and projection for 2015values were conducted (Table 10).
As shown in the above table, the rate of increment ofcumulative rate of TB cases per 1000 pop, Malaria casesper1000 pop, OPD per 1000 pop and IPD per 1000 popwere 1.68, 7.586, 295 and 7.102 respectively. Heremalaria death had higher cumulative rate.
The number of Health Posts and Health stations across the years (1987-2000 E.C), EthiopiaFigure 12The number of Health Posts and Health stations across the years (1987-2000 E.C), Ethiopia.
Trends of number of nurses and physicians 1987-2000, Ethio-piaFigure 13Trends of number of nurses and physicians 1987-2000, Ethiopia.
Trends of proportion of Under-five, under one and 15-49 women in EthiopiaFigure 14Trends of proportion of Under-five, under one and 15-49 women in Ethiopia.
Trends in GDP per capita per year and its growth rate 1987 to 2000, EthiopiaFigure 15Trends in GDP per capita per year and its growth rate 1987 to 2000, Ethiopia.
Page 9 of 17(page number not for citation purposes)
Health Research Policy and Systems 2009, 7:29 http://www.health-policy-systems.com/content/7/1/29
DiscussionMortality and morbidity indicatorsThere was generally a decreasing trend of all mortalityindicators during the study period. As indicated in theresults section, all mortality indicators except the mater-nal mortality rate haven't shown a statistically significantdecrease between 1987 and 1998 E.C. This finding is aresult of confidence intervals comparison that depends onthe sample size considered. However, a decrease of 33infant deaths per 1000 live births, a reduction of 42under-five deaths per 1000 children under-five years ofage, and a decrement of 5 deaths per 1000 population areof great practical significance for a health system in adeveloping country. These were in line with the Healthpolicy directions of the Ethiopian government [5-7]
There was high decrement of AIDS related mortality since1997 E.C as shown in the AIDS mortality graph. This timewas also associated with an increment in the number ofpeople living with HIV/AIDS. These changes are mostprobably due to the introduction of free Anti-retroviraltreatment (ART) at that period in time which had resultedin the decrement of number of AIDS related deaths andincrement of HIV+ people.
The magnitude of deaths due to Tuberculosis and Malariahad shown a dramatically decreasing trend since 1996E.C. That decrement trend was higher for malaria than forTuberculosis. National efforts for malaria and Tuberculo-sis control programs through the support from the Globalfund are most likely the possible explanations for such
decrement. The ministry of health, as part of the Millen-nium Development Goals targets, has given the greatestattention to availing two insecticide treated nets perhousehold and improving the case detection and decreas-ing the default rates of TB treatment [6].
There was an increasing trend in the number of outpatientvisits and inpatient admissions during the study period.Although it is expected to have a decreasing trend thenumber of new and total Tuberculosis cases had also anincreasing trend. It is true that there is an expansion ofHealth facilities and increasing access to health facilitiesand an improvement in the health management informa-tion system (HMIS) during the study period. It wouldmost likely be due to these factors, rather than a true incre-ment in morbidity that the trend has shown an increasingpattern.
The peak in the number of malaria cases per 100,000 pop-ulation were in 1991 and 1996 E.C. These peaking effectsin the number of malaria cases were due to the malariaepidemics in those years. Plasmodium Falciparumremained to be the dominant malaria species among thediagnosed cases contributing up to 65% of the malariacases till 1998 E.C. However, that scenario was reversed in1998 E.C when Plasmodium Vivax diagnosed cases con-tributed 65% of all malaria diagnosed cases. What hascaused this reversal of the two malaria species needs fur-ther study. On the other hand the prevalence of mixedinfections has increased during the last three years of thestudy period.
Health service coverage indicatorsAmong the Health service coverage indicators EPI andCPR had shown the highest increment during the studyperiod as compared to the other health service coverageindicators considered in this study. This could possibly bedue to the several well coordinated immunization cam-paign coordinated among the ministry of health, WorldHealth Organization, UNICEF and other governmentaland non-governmental stakeholders.
On the other hand, the lowest increments among thehealth service coverage indicators were on skilled birth
Table 3: Trends in human development index (HDI) 1987 to 1997, Ethiopia
S# Year HDI values
1 1987 0.347
2 1992 0.379
3 1997 0.406
Source: UNDP 2008
Table 4: Trends of safe water supply and basic sanitation coverage, Ethiopia
S# Risk factor indicators 1987 E.C 1992 E.C 1997 E.C
1 Access to safe water (%) 19.1 33.2 59.5
2 Access to piped water (%) 14 18 24
3 Access to basic sanitation (%) 8 18 38
Source: UNDP 2008
Page 10 of 17(page number not for citation purposes)
Health Research Policy and Systems 2009, 7:29 http://www.health-policy-systems.com/content/7/1/29
attendant and postnatal care services coverage. This hasbeen the case in several other cross-sectional studieswhich claimed cultural factors and perceived quality ofthe services to be the major contributing factors.
The increments in most health service coverage indicatorswere smooth till 1998 E.C. However, in 1999 and 2000E.C there were sharp increments especially in CPR and EPIcoverage. This might be due to the deployment of moreHealth Extension workers to rural health posts who areprimarily focusing on promotive and preventive healthcare services.
Health system resource indicatorsThe hospital to population ratio in Ethiopia which is1:518.948 is higher when compared to the previous val-
ues but still lower than that of most African countries. Thecurrent Health centre to population ratio which is1:91,726 is much lower than the expected which is1:25,000. Based on this expected health centre to popula-tion ratio additional 2200 health centres are needed. Butthe current Health post to population ratio (1:5,198) isvery close to the standard (1:5,000).
The Ethiopian Health system has currently a physician topopulation ratio of 1:22,198 in 2000 E.C. The WHOstandard is 1:10,000. Hence the country needs to doublethe current number of physicians to meet the standard. Incontrary to the physician to population ration, the currentnurse to population ratio (1:4,519) now exceeds theWHO standard (1:5,000). The trend in nurse to popula-tion ratio has showed a decreasing tip in 1999 and 2000
Table 5: Trends of prevalence of malnutrition among under-five children, Ethiopia
S# Risk factor indicators 1987 E.C 1992 E.C 1997 E.C
1 Prevalence of underweight (%) 51 47 38.4
2 Prevalence of wasting (%) 7 10.5 10.5
3 Prevalence of Stunting (%) 64 52 46.5
Source: UNDP 2008
Table 6: Correlation of Maternal Mortality Ratio with other covariates
S# Covariates Corr. coefficient P-Value
1 GDP per capita -0.7087 0.0045
2 Adult Literacy Rate -0.8286 0.0003
3 Total Fertility Rate 0.9981 0.0000
4 Physicians per 100,000 Population -0.7774 0.0011
5 Nurses per 100,000 Population -0.8749 0.0000
6 Hospitals per 100,000 population -0.9679 0.0000
7 Health Centres per 100,000 population -0.9079 0.0000
8 Antenatal care coverage -0.8041 0.0005
9 Skilled Birth Attendant -0.7328 0.0029
10 Postnatal care coverage -0.8144 0.0004
11 Contraceptive Prevalence rate -0.8151 0.0004
12 Recurrent Health Expenditure per capita -0.6835 0.0070
Source: UNDP 2008
Page 11 of 17(page number not for citation purposes)
Health Research Policy and Systems 2009, 7:29 http://www.health-policy-systems.com/content/7/1/29
E.C, which may be due to their enrolment in to the accel-erated health officers training program. While theexpected physician to nurse ratio is 1:2, the current Ethio-pian physician to nurse ratio is 1:5.
Had it not been for the non-uniform distribution of phy-sicians in different areas of the country, each hospitalwould have about 19 physicians, if the currently availablephysicians were to be equally distributed to all hospitals.Similarly, if all the Health officers are to be equally distrib-uted to all the health centres, each health centre will have
at least one health officer. With regard to the health centreto hospital referral, each hospital will have about 6 refer-ring health centres.
During the study period the average increment in totalhealth budget and total Health Expenditure per capita peryear were 1.33ETB and 1.1ETB respectively. During thesame period, the average increment in GDP per capita peryear was 202ETB. Hence one can see that these rates ofincrement are far apart.
Table 7: Crude and Adjusted β coefficients of determinants of Maternal Mortality Ratio with their CIs
S# Covariates Crude β Adjusted β
1 GDP per capita -0.22 [-0.32, -0.11] -0.02 [-0.30, 0.26]
2 Adult Literacy Rate -8.47 [-12.8, -4.4] 3.7 [-6.57, 14.0]
3 Total Fertility Rate 709.0 [689.4, 728.7] 723.6 [560.5, 886.6]
4 Physicians per 100,000 Pop -211.2 [-370.2, -52.1] 40.8 [9.9, 71.8]
5 Nurses per 100,000 Population -25.7 [-38.3, -13.1] -13.8 [-35.5, 7.8]
6 Hospitals per 100,000 population -12782 [-14601.2, -10963.3]
7 Health Centres per 100,000 popn -875.6 [-1031.0, -720.1] 293 [-673.6, 1260]
8 Antenatal care coverage -14.3 [-20.4, -8.2] 4.42 [-3.7, 12.5]
9 Skilled Birth Attendant -39.2 [-57.6, -20.7] -16.3 [-24.7, -7.86]
10 Postnatal care coverage -28.2 [-47.1, -9.4 ] -11.89 [-18.35, -5.43]
11 Contraceptive Prevalence rate -12.8 [-16.5, -9.1] -1.76 [-4.38, 0.86]
12 Recurrent Health Exp. per capita -37.3 [-58.4, -16.2] -3.46 [-8.95, 2.04]
13 Constant -3736.46 [-4826.07, -2646.85]
* P-value < 0.05, statistically significant
Table 8: Condensed Model of Determinants of Maternal Mortality Ratio
S# Covariates Adjusted β
1 Total Fertility Rate 723.6 [560.5, 886.6]
2 Physicians per 100,000 Population 40.8 [9.9, 71.8]
3 Skilled Birth Attendant -16.3 [-24.7, -7.86]
4 Postnatal care coverage -11.89 [-18.35, -5.43]
5 Constant -3736.46 [-4826.07, -2646.85]
* P-value < 0.05, statistically significant
Page 12 of 17(page number not for citation purposes)
Health Research Policy and Systems 2009, 7:29 http://www.health-policy-systems.com/content/7/1/29
Determinants of maternal mortalityTotal fertility rate, physician per 100,000 population,skilled birth attendance and post-natal care service cover-age were found to be determinants of Maternal MortalityRatio. Among those determinants total fertility rate andphysician per 100,000 population have positive associa-tion with Maternal Mortality Ratio. However skilled birthattendant and post-natal care coverage associated nega-tively with Maternal Mortality Ratio.
The decrement of Maternal Mortality Ratio has strongassociation with Total fertility with β coefficient of 723.6.The decrement in total fertility rate in turn might be dueto the increment in contraceptive prevalence rate which isthe one which has significant increment among all healthservice coverage indicators in the study and female literacyrate.
When physician per 100,000 population is correlatedwith Maternal Mortality Ratio, there was a negative asso-ciation. However, when other variables were controlled,the negative association is reversed to positive association.This is contrary to the expectation that an increment inphysician per 100,000 population is related with a decre-ment in Maternal Mortality Ratio. What so ever the case,this might be due to the distribution of physicians more
in urban areas which might result a decrement of Mater-nal Mortality Ratio in urban areas only. This might needdisaggregated analysis across urban and rural areas.
Skilled birth attendance rate and postnatal care coveragehad negative association with Maternal Mortality Ratio.But these are the health service coverage indicators withlowest increment during the study period. To reduceMaternal Mortality Ratio to a greater extent, skilled birthattendance rate and postnatal care coverage should getincreased.
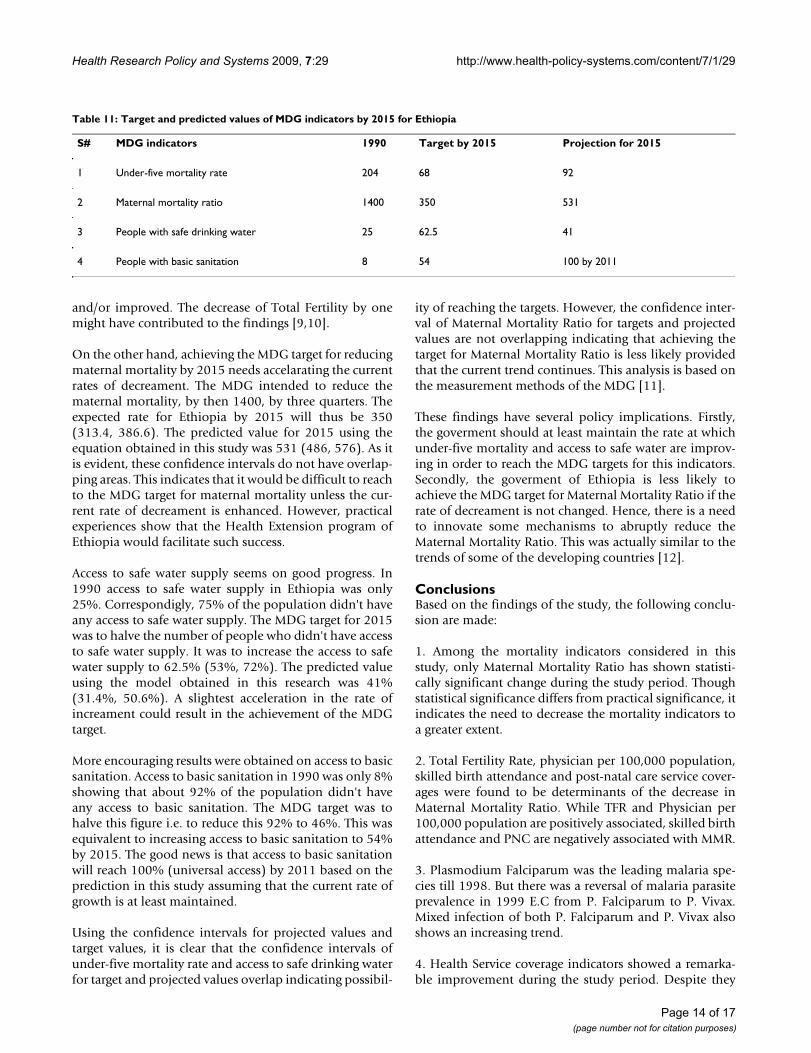
Prediction of indicators for 2015The MDG targets related to mortality for 2015 includereduction of under-five mortality by two-third and reduc-ing three quarters of Maternal Mortality Ratio. The MDGtargets related to morbidity for 2015 are to have haltedand begun to reverse the spread of HIV/AIDS; to havehalted and begun to reverse the spread of malaria, and tohalve the prevalence of tuberculosis. The MDG targetrelated to risk factors for 2015 is to halve the number ofpeople without sustainable access to safe drinking waterand basic sanitation (Table 11). These targets has taken into account the baseline population in 1990 [8].
Although all MDG indicators are targeted for 2015 as anend date to measure success clearly earmarked target val-ues for 2015 were obtained only for the four major indi-cators. These were the two mortality indicators (MaternalMortality Ratio, under-five mortality rate) and two riskfactor indicators (proportion of people with safe drinkingwater and proportion of people with basic sanitation).
As indicated in Table 11, the under-five mortality rate in1990 was 204. The MDG was meant to decrease this valueby two-third. This is equivalent to reducing it to 68 (52.4,83.6). Using the prediction equation obtained in thisstudy, the predicted value for 2015 was 92 (74,110). Asthe confidence intervals of the target and predicted valuesare overlapping, it can be assumed that the MDG target forunder-five mortality can be achived provided that the cur-rent rates of reducing under-five mortality are maintained
Table 9: Predicted values of Major Mortality indicators for 2015, Ethiopia
Indicator Equation R2 By 2015 (t = 21)
IMR IMR = -2.972t + 114.4 0.969 52
U5MR U5MR = -3.455t + 164.4 0.999 92
MMR MMR = -287ln(t) + 1405 0.996 531
CDR CDR = -0.387t + 15.33 0.999 7
MLE MLE = 1.08ln(t) + 50.97 0.98 54
FLE FLE = 1.036ln(t) + 53.06 0.98 56
* P-value < 0.05, statistically significant
Table 10: Prediction of major morbidity indicators (Cumulative) by 2015, Ethiopia
Indicator Equation R2 By 2015 (t = 21)
TB cases/1000pop (Cumulative) TBc = 1.68t+0.996 0.999 36.276
Malaria cases/1000 (Cumulative) Mc = 7.586t+10.98 0.994 170.286
OPD per 1000 pop (cumulative) OPD = 295t+165.8 0.995 6360.8
IPD per 1000 pop (Cumulative) IPD = 7.102t-4.572 0.970 144.57
Page 13 of 17(page number not for citation purposes)
Health Research Policy and Systems 2009, 7:29 http://www.health-policy-systems.com/content/7/1/29
and/or improved. The decrease of Total Fertility by onemight have contributed to the findings [9,10].
On the other hand, achieving the MDG target for reducingmaternal mortality by 2015 needs accelarating the currentrates of decreament. The MDG intended to reduce thematernal mortality, by then 1400, by three quarters. Theexpected rate for Ethiopia by 2015 will thus be 350(313.4, 386.6). The predicted value for 2015 using theequation obtained in this study was 531 (486, 576). As itis evident, these confidence intervals do not have overlap-ping areas. This indicates that it would be difficult to reachto the MDG target for maternal mortality unless the cur-rent rate of decreament is enhanced. However, practicalexperiences show that the Health Extension program ofEthiopia would facilitate such success.
Access to safe water supply seems on good progress. In1990 access to safe water supply in Ethiopia was only25%. Correspondigly, 75% of the population didn't haveany access to safe water supply. The MDG target for 2015was to halve the number of people who didn't have accessto safe water supply. It was to increase the access to safewater supply to 62.5% (53%, 72%). The predicted valueusing the model obtained in this research was 41%(31.4%, 50.6%). A slightest acceleration in the rate ofincreament could result in the achievement of the MDGtarget.
More encouraging results were obtained on access to basicsanitation. Access to basic sanitation in 1990 was only 8%showing that about 92% of the population didn't haveany access to basic sanitation. The MDG target was tohalve this figure i.e. to reduce this 92% to 46%. This wasequivalent to increasing access to basic sanitation to 54%by 2015. The good news is that access to basic sanitationwill reach 100% (universal access) by 2011 based on theprediction in this study assuming that the current rate ofgrowth is at least maintained.
Using the confidence intervals for projected values andtarget values, it is clear that the confidence intervals ofunder-five mortality rate and access to safe drinking waterfor target and projected values overlap indicating possibil-
ity of reaching the targets. However, the confidence inter-val of Maternal Mortality Ratio for targets and projectedvalues are not overlapping indicating that achieving thetarget for Maternal Mortality Ratio is less likely providedthat the current trend continues. This analysis is based onthe measurement methods of the MDG [11].
These findings have several policy implications. Firstly,the goverment should at least maintain the rate at whichunder-five mortality and access to safe water are improv-ing in order to reach the MDG targets for this indicators.Secondly, the goverment of Ethiopia is less likely toachieve the MDG target for Maternal Mortality Ratio if therate of decreament is not changed. Hence, there is a needto innovate some mechanisms to abruptly reduce theMaternal Mortality Ratio. This was actually similar to thetrends of some of the developing countries [12].
ConclusionsBased on the findings of the study, the following conclu-sion are made:
1. Among the mortality indicators considered in thisstudy, only Maternal Mortality Ratio has shown statisti-cally significant change during the study period. Thoughstatistical significance differs from practical significance, itindicates the need to decrease the mortality indicators toa greater extent.
2. Total Fertility Rate, physician per 100,000 population,skilled birth attendance and post-natal care service cover-ages were found to be determinants of the decrease inMaternal Mortality Ratio. While TFR and Physician per100,000 population are positively associated, skilled birthattendance and PNC are negatively associated with MMR.
3. Plasmodium Falciparum was the leading malaria spe-cies till 1998. But there was a reversal of malaria parasiteprevalence in 1999 E.C from P. Falciparum to P. Vivax.Mixed infection of both P. Falciparum and P. Vivax alsoshows an increasing trend.
4. Health Service coverage indicators showed a remarka-ble improvement during the study period. Despite they
Table 11: Target and predicted values of MDG indicators by 2015 for Ethiopia
S# MDG indicators 1990 Target by 2015 Projection for 2015
1 Under-five mortality rate 204 68 92
2 Maternal mortality ratio 1400 350 531
3 People with safe drinking water 25 62.5 41
4 People with basic sanitation 8 54 100 by 2011
Page 14 of 17(page number not for citation purposes)
Health Research Policy and Systems 2009, 7:29 http://www.health-policy-systems.com/content/7/1/29
are the key determinants of MMR, skilled birth attendantand post-natal care coverage have the least increment witha rate of 1.24 and 1.42 per year respectively among theHealth Service coverage indicators.
5. The MDG target for proportion of people having accessto basic sanitation can be achieved 100% by 2011. How-ever, Maternal Mortality Ratio, Under-five mortality rate,and proportion of people with safe and clean water MDGtargets might not be reached if the current trend isassumed to continue.
Lists of abbreviationsAIDS: Acquired Immune deficiency syndrome; E.C: Ethio-pian Calendar; ETB: Ethiopian Birr; GDP: Gross DomesticProduct; HIV: Human Immune virus; MDG: MillenniumDevelopment Goals; OPD: Outpatient Department; PoP:Population; TB: Tuberculosis; TFR: Total Fertility Rate;USAID: United States Agency for International Develop-ment; WHO: World Health Organization
Competing interestsThe authors declare that there are no competing interests
Authors' contributionsBoth Authors are involved in all the steps from the incep-tion of the research idea to the preparation of the manu-script. MAW has involved in writing the protocol, researchtools, data collection, and analysis and writes up of finalreports. TN has involved in reviewing the protocol, datacollection tools and reports. Both of the authors involvedin manuscript preparation.
Authors' informationMAW is Health promotion and Disease prevention officerat the Federal Ministry of Health of Ethiopia. She has anMPH degree and years of experience in the health system.TN is a Quality assurance specialist for HIV/AIDS pro-grams in the United States Agency for International Devel-opment (USAID/Ethiopia) with experiences in Healthsystem researches and evaluations.
Appendix 1Data sourcesMinistry of HealthThe Ministry of Health yearly publications of Health andHealth related indicators from 1987 to 2000 E.C were themajor guiding documents in this study. Besides, the AIDSreports from 1990 E.C to 1998 E.C were also considered.The TB database from the Ministry of Health was alsoused.
Central Statistical AuthorityTwo census reports (1994 and 2007) and two Demo-graphic and Health survey reports (2000 and 2005) were
used. The Health and Nutrition surveys and the welfaresurvey reports of the authority were also consulted for thisstudy. Statistical abstracts were also used.
Ministry of EducationThe Educational Management information system (EMIS)reports (Educational statistics were also used to obtain theliteracy indicators that could affect the Morbidity andmortality indicators of the country. The indicator valuesfrom these sources were taken as the basic sources of edu-cation related indicators.
Ministry of Finance and Economic DevelopmentThe Ministry of Finance and Economic Development(MOFED) was the source of Economic indicators like theGross Domestic Product (GDP) and Gross National Prod-uct (GNP) per capita. The reports of this ministry on MDGstatus were also used.
Ministry of Water Resources DevelopmentThe coverage of safe water supply and sanitation for themore recent years was obtained from the Ministry ofWater Resources Development (MoWRD). However, theolder data were on water and sanitation was from theMinistry of Health.
Ethiopian Health and Research Institute (EHNRI)The documents from this institute were on nutritional andlaboratory based indicators.
World Health OrganizationWorld Health Report from 1996 to 2008 was explored forthe indicators of Ethiopia. Besides, the World Healthorganization statistical information system is browsed forspecific Health and Health related indicators.
World BankThe World Bank World development reports from 1996 to2008 were scrutinized for several development relatedindicators for Ethiopia. These indicators were also quotedby the Health and Health related indicators of Ethiopia.
UNAIDSThe AIDS Epidemic updates of UNAIDS were also con-sulted for national figures on HIV and AIDS related issues.The data from these sources were also seen in relationwith the data from the national HIV/AIDS publications bythe Ministry of Health.
UNICEFThe publication of UNICEF about the country profile ofEthiopia was taken in to consideration for some impor-tant indicators in Ethiopia. However, the indicators areonly the most recent for use by the organization.
Page 15 of 17(page number not for citation purposes)
Health Research Policy and Systems 2009, 7:29 http://www.health-policy-systems.com/content/7/1/29
UNDPThe Millennium Development Goal reports for Ethiopiafrom the worldwide updates were also consulted to crosscheck some of the important indicators in Ethiopia. How-ever, these are only for a few numbers of years as pub-lished by the UN team.
USAIDThe Country update of USAID for Ethiopia in 2007 bearsthe major recent Health and Health related indicators ofEthiopia. These indicators were taken together with otherrecent indicators of other international and nationalsources.
Appendix 2Data quality assuranceAll the data collection process, entry and cleaning weredone with the direct involvement of the principal investi-gator. Backup copies were saved for each step of the work.All the indicator values were double checked against theirvalues in the indicator document. However, the followingproblems were faced and solutions were attempted.
Inconsistent valuesThere were some inconsistencies among the indicatorsvalues between national and international sources. Therewere also some discrepant values among national sourcestoo. Even different values of the same indicators on thesame source were observed at different reports of differenttimes, years. When there were differences as indicatedabove, the most proximate data source or reporting periodwas assumed to be the more reliable data and included inthis study. In cases where level of proximity of the datasources or the reporting period to the data is similar, themandate and expertise of the reporting body on the spe-cific indicators was used.
Incomplete valuesAs indicated in the documents themselves, some indica-tors values were reported for some part of the country onlyi.e. the indicator values do not include some regions. Forexample in the Health and Health related indicators of1992 E.C for proportion of fully immunized under-onechildren doesn't include the report from Addis Ababa cityadministration Health bureau. In situations where bettersources of indicator values can be obtained, such datasources were used. As the ministry and other nationaldecision making bodies were and are using this type ofdata, this study considered the inclusion of the data in theanalysis. However, the incompleteness of the data is con-sidered in the interpretation of the results.
Missing valuesDespite the rigorous exploration of the various datasources, some indicators values can't be obtained. How-
ever, the absence of the evidence may not be the evidenceof absence of the data. Different hierarchies of data explo-ration were used before declaring the data as missing.When the magnitude of missed values is minimal the val-ues were not considered in the analysis. For some of theindicator values, replacement was done by back and forthforecasting based on the equation derived from the exist-ing values of the indicator.
Recent introductionSome of the Health and Health related indicators wereintroduced very recently and complete values can't beobtained. Even some indicators were excluded from thereport in the recent years. An example in the Health exten-sion workers are reported as of 1997 E.C. The indicatorswere analyzed using the existing values only. These indi-cators are included because the stakeholders included thenew indicators because either it is found very relevantand/or it can be measured within the available resources.Just for the purpose of the analysis some valued werefilled using back projections.
Changes in measurementSome indicator values showed measurement changesacross the study years. For instance, the number of HIV/AIDS surveillance sites was increased and the projectionmethod was changed to spectrum model. There was alsoshifting of responsible bodies that might result in changesin measurement of the indicators such as water supplyshift from MOH to MoWRD. In such cases, the changes inmeasurement were to improve the quality of data. That isto increase representativeness, reliability, validity and cov-erage of the indicators values. As these changes can haveeffects on the results of this study, the changes were con-sidered in the interpretation of the results.
AcknowledgementsHealth and Health indicators in Ethiopia published annually by the Federal Ministry of health served as the major source for the majority data. Thus, we would like to extend our acknowledgement to all the data sources in general and the Federal Ministry of Health in particular. We are also deeply thankful to Jimma University, Faculty of Public Health, Department of Epi-demiology and Biostatistics for its continuous support and guidance during the implementation of this study. Besides, we want to extend our heart-felt appreciation to all experts who involved in the search, analysis, interpreta-tion and review processes during the progress of this study.
References1. Canadian Institute for Health Information (October 2001),
Developing environmental public health indicators in Can-ada, Paper submitted by Environment Canada - Health Can-ada.
2. Federal Ministry of Health, Ethiopia (2006/7), Health andHealth related indicators, Addis Ababa, Ethiopia.
3. Health policy of the transitional government of Ethiopia(Sept. 1993).
4. Federal Ministry of Health, Ethiopia (2007), The HSDP Har-monization Manual (HHM). 1st edition.
Page 16 of 17(page number not for citation purposes)
Health Research Policy and Systems 2009, 7:29 http://www.health-policy-systems.com/content/7/1/29
Publish with BioMed Central and every scientist can read your work free of charge
"BioMed Central will be the most significant development for disseminating the results of biomedical research in our lifetime."
Sir Paul Nurse, Cancer Research UK
Your research papers will be:
available free of charge to the entire biomedical community
peer reviewed and published immediately upon acceptance
cited in PubMed and archived on PubMed Central
yours — you keep the copyright
Submit your manuscript here:http://www.biomedcentral.com/info/publishing_adv.asp
BioMedcentral
5. Federal Ministry of Health, Ethiopia (2005), Health Sectordevelopment plan (HSDP III) 2005/6-2009/10, Addis Ababa,Ethiopia.
6. Central Statistical Agency [Ethiopia] and ORC Macro: EthiopiaDemographic and Health Survey 2005. Addis Ababa, Ethiopiaand Calverton, Maryland, USA: Central Statistical Agency and ORCMacro; 2006.
7. Central Statistical Authority [Ethiopia] and ORC Macro: EthiopiaDemographic and Health Survey 2000. Addis Ababa, Ethiopiaand Calverton, Maryland, USA: Central Statistical Authority and ORCMacro; 2001.
8. Central Statistical Authority (CSA) [Ethiopia]: The 1984 Popula-tion and Housing Census of Ethiopia. In Analytical Report atNational Level Addis Ababa, Ethiopia: Central Statistical Authority;1991.
9. Central Statistical Authority (CSA) [Ethiopia]: The 1990 Familyand Fertility Survey-Preliminary Report. Addis Ababa, Ethio-pia: Central Statistical Authority; 1991.
10. Central Statistical Authority (CSA) [Ethiopia]: The 1994 Popula-tion and Housing Census of Ethiopia. Results at CountryLevel. In Statistical Report Volume 1. Addis Ababa, Ethiopia: CentralStatistical Authority; 1998.
11. World Health Organization (2003), the Millennium Develop-ment Goals, The health indicators: scope, definitions andmeasurement methods, Geneva.
12. World Health Organization (2008), World Health Statistics,France.
Page 17 of 17(page number not for citation purposes)
Copyright © 2022 FDOKUMEN