A Review of Techniques for RSS-Based Radiometric Partial ...
21
sensors Review A Review of Techniques for RSS-Based Radiometric Partial Discharge Localization David W. Upton 1 , Keyur K. Mistry 2 , Peter J. Mather 3 , Zaharias D. Zaharis 4 , Robert C. Atkinson 5 , Christos Tachtatzis 5 and Pavlos I. Lazaridis 3, * Citation: Upton, D.W.; Mistry, K.K.; Mather, P.J.; Zaharis, Z.D.; Atkinson, R.C.; Tachtatzis, C.; Lazaridis, P.I. A Review of Techniques for RSS-Based Radiometric Partial Discharge Localization. Sensors 2021, 21, 909. https://doi.org/10.3390/s21030909 Academic Editor: Fabio Viola Received: 31 December 2020 Accepted: 26 January 2021 Published: 29 January 2021 Publisher’s Note: MDPI stays neutral with regard to jurisdictional claims in published maps and institutional affil- iations. Copyright: © 2021 by the authors. Licensee MDPI, Basel, Switzerland. This article is an open access article distributed under the terms and conditions of the Creative Commons Attribution (CC BY) license (https:// creativecommons.org/licenses/by/ 4.0/). 1 Swedish Institute of Space Physics, SE-981 Kiruna, Sweden; [email protected] 2 Oxford Space Systems, Harwell OX11 0RL, UK; [email protected] 3 Department of Engineering and Technology, University of Huddersfield, Huddersfield HD1 3DH, UK; [email protected] 4 Department of Electrical and Computer Engineering, Aristotle University of Thessaloniki, 54124 Thessaloniki, Greece; [email protected] 5 Department of Electronics and Electrical Engineering, University of Strathclyde, Glasgow G1 1XW, UK; [email protected] (R.C.A.); [email protected] (C.T.) * Correspondence: [email protected] Abstract: The lifespan assessment and maintenance planning of high-voltage power systems requires condition monitoring of all the operational equipment in a specific area. Electrical insulation of electrical apparatuses is prone to failure due to high electrical stresses, and thus it is a critical aspect that needs to be monitored. The ageing process of the electrical insulation in high voltage equipment may accelerate due to the occurrence of partial discharge (PD) that may in turn lead to catastrophic failures if the related defects are left untreated at an initial stage. Therefore, there is a requirement to monitor the PD levels so that an unexpected breakdown of high-voltage equipment is avoided. There are several ways of detecting PD, such as acoustic detection, optical detection, chemical detection, and radiometric detection. This paper focuses on reviewing techniques based on radiometric detection of PD, and more specifically, using received signal strength (RSS) for the localization of faults. This paper explores the advantages and disadvantages of radiometric techniques and presents an overview of a radiometric PD detection technique that uses a transistor reset integrator (TRI)-based wireless sensor network (WSN). Keywords: field trials; localization algorithm; partial discharge; radiometric detection; RSS; WSN 1. Introduction A widely used and very effective metric for assessing the condition of high voltage (HV) plants is partial discharge (PD). PD is an electrical fault that occurs within the insulating material of high voltage plant equipment, such as transformers, switch gear and transmission lines [1,2]. PD is caused due to several reasons, such as defects in manufacturing, defects during installation, ageing and deterioration, over-stressing in service, corona discharge, surface discharge, and cavities. One frequent causes of PD is by a decrease in permittivity, and therefore an increase in electric field strength, due to the presence of a void or defect within the dielectric, resulting in a discharge across the void that does not breach the conductors [3,4], but can worsen over time due to prolonged electrical stresses increasing the physical size of the void. PD is defined by the IEC60270 standard as: “a localized electrical discharge that only partially bridges the insulation between conductors and which can or cannot occur adjacent to a conductor. Partial discharges are in general a consequence of local electrical stress concentrations in the insulation or on the surface of the insulation. Generally, such discharges appear as pulses having a duration of much less than 1 microsecond” [5]. These discharges may increase over time if the defect becomes physically larger, due to damage such as treeing (cracking of the insulation surrounding the void) caused by Sensors 2021, 21, 909. https://doi.org/10.3390/s21030909 https://www.mdpi.com/journal/sensors
-
Upload
khangminh22 -
Category
Documents
-
view
1 -
download
0
Transcript of A Review of Techniques for RSS-Based Radiometric Partial ...

sensors
Review
A Review of Techniques for RSS-Based Radiometric PartialDischarge Localization
David W. Upton 1, Keyur K. Mistry 2, Peter J. Mather 3, Zaharias D. Zaharis 4 , Robert C. Atkinson 5 ,Christos Tachtatzis 5 and Pavlos I. Lazaridis 3,*
Citation: Upton, D.W.; Mistry, K.K.;
Mather, P.J.; Zaharis, Z.D.; Atkinson,
R.C.; Tachtatzis, C.; Lazaridis, P.I. A
Review of Techniques for RSS-Based
Radiometric Partial Discharge
Localization. Sensors 2021, 21, 909.
https://doi.org/10.3390/s21030909
Academic Editor: Fabio Viola
Received: 31 December 2020
Accepted: 26 January 2021
Published: 29 January 2021
Publisher’s Note: MDPI stays neutral
with regard to jurisdictional claims in
published maps and institutional affil-
iations.
Copyright: © 2021 by the authors.
Licensee MDPI, Basel, Switzerland.
This article is an open access article
distributed under the terms and
conditions of the Creative Commons
Attribution (CC BY) license (https://
creativecommons.org/licenses/by/
4.0/).
1 Swedish Institute of Space Physics, SE-981 Kiruna, Sweden; [email protected] Oxford Space Systems, Harwell OX11 0RL, UK; [email protected] Department of Engineering and Technology, University of Huddersfield, Huddersfield HD1 3DH, UK;
[email protected] Department of Electrical and Computer Engineering, Aristotle University of Thessaloniki,
54124 Thessaloniki, Greece; [email protected] Department of Electronics and Electrical Engineering, University of Strathclyde, Glasgow G1 1XW, UK;
[email protected] (R.C.A.); [email protected] (C.T.)* Correspondence: [email protected]
Abstract: The lifespan assessment and maintenance planning of high-voltage power systems requirescondition monitoring of all the operational equipment in a specific area. Electrical insulation ofelectrical apparatuses is prone to failure due to high electrical stresses, and thus it is a critical aspectthat needs to be monitored. The ageing process of the electrical insulation in high voltage equipmentmay accelerate due to the occurrence of partial discharge (PD) that may in turn lead to catastrophicfailures if the related defects are left untreated at an initial stage. Therefore, there is a requirement tomonitor the PD levels so that an unexpected breakdown of high-voltage equipment is avoided. Thereare several ways of detecting PD, such as acoustic detection, optical detection, chemical detection, andradiometric detection. This paper focuses on reviewing techniques based on radiometric detection ofPD, and more specifically, using received signal strength (RSS) for the localization of faults. This paperexplores the advantages and disadvantages of radiometric techniques and presents an overview of aradiometric PD detection technique that uses a transistor reset integrator (TRI)-based wireless sensornetwork (WSN).
Keywords: field trials; localization algorithm; partial discharge; radiometric detection; RSS; WSN
1. Introduction
A widely used and very effective metric for assessing the condition of high voltage(HV) plants is partial discharge (PD). PD is an electrical fault that occurs within theinsulating material of high voltage plant equipment, such as transformers, switch gearand transmission lines [1,2]. PD is caused due to several reasons, such as defects inmanufacturing, defects during installation, ageing and deterioration, over-stressing inservice, corona discharge, surface discharge, and cavities. One frequent causes of PD is bya decrease in permittivity, and therefore an increase in electric field strength, due to thepresence of a void or defect within the dielectric, resulting in a discharge across the void thatdoes not breach the conductors [3,4], but can worsen over time due to prolonged electricalstresses increasing the physical size of the void. PD is defined by the IEC60270 standardas: “a localized electrical discharge that only partially bridges the insulation betweenconductors and which can or cannot occur adjacent to a conductor. Partial discharges arein general a consequence of local electrical stress concentrations in the insulation or on thesurface of the insulation. Generally, such discharges appear as pulses having a duration ofmuch less than 1 microsecond” [5].
These discharges may increase over time if the defect becomes physically larger, dueto damage such as treeing (cracking of the insulation surrounding the void) caused by
Sensors 2021, 21, 909. https://doi.org/10.3390/s21030909 https://www.mdpi.com/journal/sensors

Sensors 2021, 21, 909 2 of 21
prolonged arcing across the void, eventually leading to catastrophic failure when the voidis so large that the potential is able to breach the inner and outer conductors (referred toas flashover) [6]. PD faults are more likely to occur in aged HV plants, where long-termexposure to constant changes in environmental conditions may accelerate deterioration ofthe insulating material, such as thermal expansion and retraction.
An example of a typical PD fault is a gas-filled void within the insulation of a HVtransmission line, represented by the Gemant and Phillippoff model [7] shown in Figure 1.
Sensors 2020, 20, x FOR PEER REVIEW 2 of 20
These discharges may increase over time if the defect becomes physically larger, due
to damage such as treeing (cracking of the insulation surrounding the void) caused by
prolonged arcing across the void, eventually leading to catastrophic failure when the void
is so large that the potential is able to breach the inner and outer conductors (referred to
as flashover) [6]. PD faults are more likely to occur in aged HV plants, where long-term
exposure to constant changes in environmental conditions may accelerate deterioration of
the insulating material, such as thermal expansion and retraction.
An example of a typical PD fault is a gas-filled void within the insulation of a HV
transmission line, represented by the Gemant and Phillippoff model [7] shown in
Figure 1.
Figure 1. Gemant and Phillippoff gas-filled void partial discharge (PD) model [7].
Cd is the capacitance of the insulation, Cv is the capacitance of the gas-filled void,
and Ca and Cb, are the dielectric capacitances in series with the void. As stated earlier, the
permittivity of the void is lower than that of the surrounding insulation since the void
tends towards the permittivity of air which is lower than that of the insulation; therefore,
the electric-field strength within the void is increased and arcing may occur as the AC
potential is increased across the conductors. The resulting arcing can weaken the sur-
rounding insulation causing treeing, eventually leading to an increase in the size of the
void and a greater risk of catastrophic failure. Figure 2 shows an example of a PD current
pulse discharged across an insulation void as a result of the increased field strength within
the void [8], where the strength of the PD is quantified by the total charge within it. Typ-
ically, the current pulse lasts between 1 and 1000 ns [8,9].
Figure 2. A PD current pulse across an HV insulation void.
Detecting and monitoring PD can give an indication of the current condition of the
fault and allows for any changes in the condition to be critically assessed over time. Indi-
cation that a fault is worsening allows for action to be taken before total failure occurs.
Traditional techniques for detecting partial discharge, which include galvanic contact de-
vices, high-frequency current transformers (HFCTs) and transient earth voltage (TEV)
sensors [10,11], provide highly accurate and detailed information on any PD activity
Figure 1. Gemant and Phillippoff gas-filled void partial discharge (PD) model [7].
Cd is the capacitance of the insulation, Cv is the capacitance of the gas-filled void,and Ca and Cb, are the dielectric capacitances in series with the void. As stated earlier, thepermittivity of the void is lower than that of the surrounding insulation since the void tendstowards the permittivity of air which is lower than that of the insulation; therefore, theelectric-field strength within the void is increased and arcing may occur as the AC potentialis increased across the conductors. The resulting arcing can weaken the surroundinginsulation causing treeing, eventually leading to an increase in the size of the void anda greater risk of catastrophic failure. Figure 2 shows an example of a PD current pulsedischarged across an insulation void as a result of the increased field strength within thevoid [8], where the strength of the PD is quantified by the total charge within it. Typically,the current pulse lasts between 1 and 1000 ns [8,9].
Sensors 2020, 20, x FOR PEER REVIEW 2 of 20
These discharges may increase over time if the defect becomes physically larger, due
to damage such as treeing (cracking of the insulation surrounding the void) caused by
prolonged arcing across the void, eventually leading to catastrophic failure when the void
is so large that the potential is able to breach the inner and outer conductors (referred to
as flashover) [6]. PD faults are more likely to occur in aged HV plants, where long-term
exposure to constant changes in environmental conditions may accelerate deterioration of
the insulating material, such as thermal expansion and retraction.
An example of a typical PD fault is a gas-filled void within the insulation of a HV
transmission line, represented by the Gemant and Phillippoff model [7] shown in
Figure 1.
Figure 1. Gemant and Phillippoff gas-filled void partial discharge (PD) model [7].
Cd is the capacitance of the insulation, Cv is the capacitance of the gas-filled void,
and Ca and Cb, are the dielectric capacitances in series with the void. As stated earlier, the
permittivity of the void is lower than that of the surrounding insulation since the void
tends towards the permittivity of air which is lower than that of the insulation; therefore,
the electric-field strength within the void is increased and arcing may occur as the AC
potential is increased across the conductors. The resulting arcing can weaken the sur-
rounding insulation causing treeing, eventually leading to an increase in the size of the
void and a greater risk of catastrophic failure. Figure 2 shows an example of a PD current
pulse discharged across an insulation void as a result of the increased field strength within
the void [8], where the strength of the PD is quantified by the total charge within it. Typ-
ically, the current pulse lasts between 1 and 1000 ns [8,9].
Figure 2. A PD current pulse across an HV insulation void.
Detecting and monitoring PD can give an indication of the current condition of the
fault and allows for any changes in the condition to be critically assessed over time. Indi-
cation that a fault is worsening allows for action to be taken before total failure occurs.
Traditional techniques for detecting partial discharge, which include galvanic contact de-
vices, high-frequency current transformers (HFCTs) and transient earth voltage (TEV)
sensors [10,11], provide highly accurate and detailed information on any PD activity
Figure 2. A PD current pulse across an HV insulation void.
Detecting and monitoring PD can give an indication of the current condition ofthe fault and allows for any changes in the condition to be critically assessed over time.Indication that a fault is worsening allows for action to be taken before total failure occurs.

Sensors 2021, 21, 909 3 of 21
Traditional techniques for detecting partial discharge, which include galvanic contactdevices, high-frequency current transformers (HFCTs) and transient earth voltage (TEV)sensors [10,11], provide highly accurate and detailed information on any PD activity withinthe equipment under observation, due to the close coupling of the sensor to the piece ofthe plant, such as a transformer or switchgear. This information includes apparent chargeand spectra, giving an indication of the type of PD fault, as well as any fault progressionover time.
Due to the requirement of close coupling to each piece of the plant to be observed,however, each sensor is only capable of monitoring the equipment it is coupled to, requiringseparate sensors for each item of the plant to be monitored. Therefore, extensive monitoringof HV equipment within a large-scale substation would be difficult using these techniques,due to the extensive wiring harnessing required, along with the complexity of the dataacquisition system needed. In addition, reconfiguration of the system, if required, wouldbe difficult, and likely costly, due to the amount of manual labor required to physicallyreconnect sensors, along with the design and cost of a replacement wiring harness. How-ever, wired techniques are used in several industries because direct coupling to devicesis preferred in several applications where monitoring of a selective single component isrequired. Futhermore, in many applications, direct coupling is preferred just becauseof being more sensitive and noise/interference immune. Even this way, it may still becomplicated to have sufficient sensitivity to detect and locate the fault within a component.For example, in the case of transformers with metallic enclosures, having to recognize andlocate PD sources within the transformer requires that the sensors be placed inside theenclosure, as hardly any signal can propagate through the bushings.
Various alternative techniques have been suggested and developed for PD detection,monitoring, and measurement; these include optical measurement [12], acoustic tech-niques [13], and radiometric techniques that utilize the far-field electromagnetic wavepropagated from the PD source due to the current discharged over the void. Optical PDmeasurement involves using fiber optic sensors and probes to detect ionization in oil andgas dielectrics [14] by detecting the light emitted during the ionization process. The benefitsof optical PD measurement techniques include immunity to electromagnetic interference,as well as isolation from the HV equipment, due to the use of light coupling. However,a disadvantage is the requirement that each sensor has to be physically connected to theplant under test.
Acoustic techniques involve capturing localized acoustic emissions from the sourceof PD via audio sensors [15]. Captured acoustic emissions can be cross correlated withknown PD transient acoustic patterns in order to assess if the acquired signal is of PDorigin [16]. As with optical detection, acoustic techniques have the advantage of immunityto electromagnetic radiation. A difficulty with this type of measurement is susceptibility tolocal ambient noise. Additionally, acoustic measurements suffer due to the unpredictabilityof propagation paths and attenuation, limiting the maximum dielectric thickness that canbe measured [17].
Radiometric PD measurement utilizes the electromagnetic signal that is propagatedfrom a source of PD due to the current across the void. This radiometric signal is measuredusing a radio-receiver placed at a certain distance from the PD source. Figure 3 shows theprocess of receiving a radiometric signal from a source of PD.
The 1–1000 ns current pulse discharged across the void transmits an electromagneticwave, which has a frequency range of approximately 50–3000 MHz, depending on thetype of defect and structure of the void [18]. However, due to the low-pass effect of theband-limiting propagation environment [19], the frequency range is limited to a range ofapproximately 50–800 MHz [20]. This radiometric signal is then received and measuredvia a radio receiver. Radiometric PD detection has various advantages, such as ease ofinstallation, comparatively low cost, and potential scale-ability. Various disadvantagesinclude susceptibility to electromagnetic interference, including locally transmitted radiosignals, and limited range due to sensor sensitivity and the propagation environment.

Sensors 2021, 21, 909 4 of 21
Sensors 2020, 20, x FOR PEER REVIEW 3 of 20
within the equipment under observation, due to the close coupling of the sensor to the
piece of the plant, such as a transformer or switchgear. This information includes apparent
charge and spectra, giving an indication of the type of PD fault, as well as any fault pro-
gression over time.
Due to the requirement of close coupling to each piece of the plant to be observed,
however, each sensor is only capable of monitoring the equipment it is coupled to, requir-
ing separate sensors for each item of the plant to be monitored. Therefore, extensive mon-
itoring of HV equipment within a large-scale substation would be difficult using these
techniques, due to the extensive wiring harnessing required, along with the complexity of
the data acquisition system needed. In addition, reconfiguration of the system, if required,
would be difficult, and likely costly, due to the amount of manual labor required to phys-
ically reconnect sensors, along with the design and cost of a replacement wiring harness.
However, wired techniques are used in several industries because direct coupling to de-
vices is preferred in several applications where monitoring of a selective single component
is required. Futhermore, in many applications, direct coupling is preferred just because of
being more sensitive and noise/interference immune. Even this way, it may still be com-
plicated to have sufficient sensitivity to detect and locate the fault within a component.
For example, in the case of transformers with metallic enclosures, having to recognize and
locate PD sources within the transformer requires that the sensors be placed inside the
enclosure, as hardly any signal can propagate through the bushings.
Various alternative techniques have been suggested and developed for PD detection,
monitoring, and measurement; these include optical measurement [12], acoustic tech-
niques [13], and radiometric techniques that utilize the far-field electromagnetic wave
propagated from the PD source due to the current discharged over the void. Optical PD
measurement involves using fiber optic sensors and probes to detect ionization in oil and
gas dielectrics [14] by detecting the light emitted during the ionization process. The bene-
fits of optical PD measurement techniques include immunity to electromagnetic interfer-
ence, as well as isolation from the HV equipment, due to the use of light coupling. How-
ever, a disadvantage is the requirement that each sensor has to be physically connected to
the plant under test.
Acoustic techniques involve capturing localized acoustic emissions from the source
of PD via audio sensors [15]. Captured acoustic emissions can be cross correlated with
known PD transient acoustic patterns in order to assess if the acquired signal is of PD
origin [16]. As with optical detection, acoustic techniques have the advantage of immunity
to electromagnetic radiation. A difficulty with this type of measurement is susceptibility
to local ambient noise. Additionally, acoustic measurements suffer due to the unpredict-
ability of propagation paths and attenuation, limiting the maximum dielectric thickness
that can be measured [17].
Radiometric PD measurement utilizes the electromagnetic signal that is propagated
from a source of PD due to the current across the void. This radiometric signal is measured
using a radio-receiver placed at a certain distance from the PD source. Figure 3 shows the
process of receiving a radiometric signal from a source of PD.
Figure 3. Radiometric PD propagation and reception using a radio receiver. Figure 3. Radiometric PD propagation and reception using a radio receiver.
It should be noted that the PD diagnostic techniques explained above are still widelyused in several industries; however, the selection of a particular technique depends onthe diagnostic requirement and applications. This paper concentrates on radiometric PDdetection techniques only, where an approximate location of PD is detected in a broad area.
2. Techniques for Radiometric Partial Discharge Measurement
Radiometric PD measurement has seen many developments over the past 20 years,due to the ease of installation and reconfiguration over other PD measurement techniques.Radiometric PD detection utilizes broadband radio receivers to detect and measure theelectromagnetically radiated UHF signal propagated from a PD source [21–23]. Generally,multiple radiometric sensors, separated by a spacing of at least several meters, can beused to detect and locate a source of PD [24]. Radiometric PD detection allows for easy,non-intrusive installation, and is simple to reconfigure if required [22]. It provides analternative that has several advantages over traditional PD measurement techniques sinceit does not require galvanic or physical contact with the item under observation; therefore,a single radiometric sensor is capable of monitoring multiple items of HV equipmentsimultaneously. Some wireless approaches for locating and monitoring PD utilize thereceived signal strength (RSS) of the electromagnetic energy propagated from a PD source,whilst more advanced techniques locate PD using the received time differences for a set ofmeasurement sensors, such as time of arrival (TOA) and time difference of arrival (TDOA).Each technique has advantages and limitations, in relation to cost, complexity, accuracy,and efficiency.
2.1. Characteristics of Radiometric PD
As previously stated, the charge displaced in an insulation fault results in an electro-magnetic signal propagated away from the discharge source. Whilst the actual currentdischarged in the fault is a pulse with a fall time in the order of 1 to 1000 ns, the resultingradiometric signal bears similarities to a classical decaying oscillation [25], with a frequencyrange in the order of 50–3000 MHz [26]. The frequency of the radiometric signal is de-pendent on the resonant structure of the insulation defect, resulting in a narrow-bandband-pass response [27]. The propagation environment effectively low-pass filters thisfrequency range to 50–800 MHz, with the majority of the frequency content residing below300 MHz.
A variety of radio receivers are capable of detecting and measuring the transmittedPD signal; however, a difficulty of radiometric PD monitoring is susceptibility to anyelectromagnetic interference. This includes locally transmitted signals within the VHF
Sensors 2021, 21, 909 5 of 21
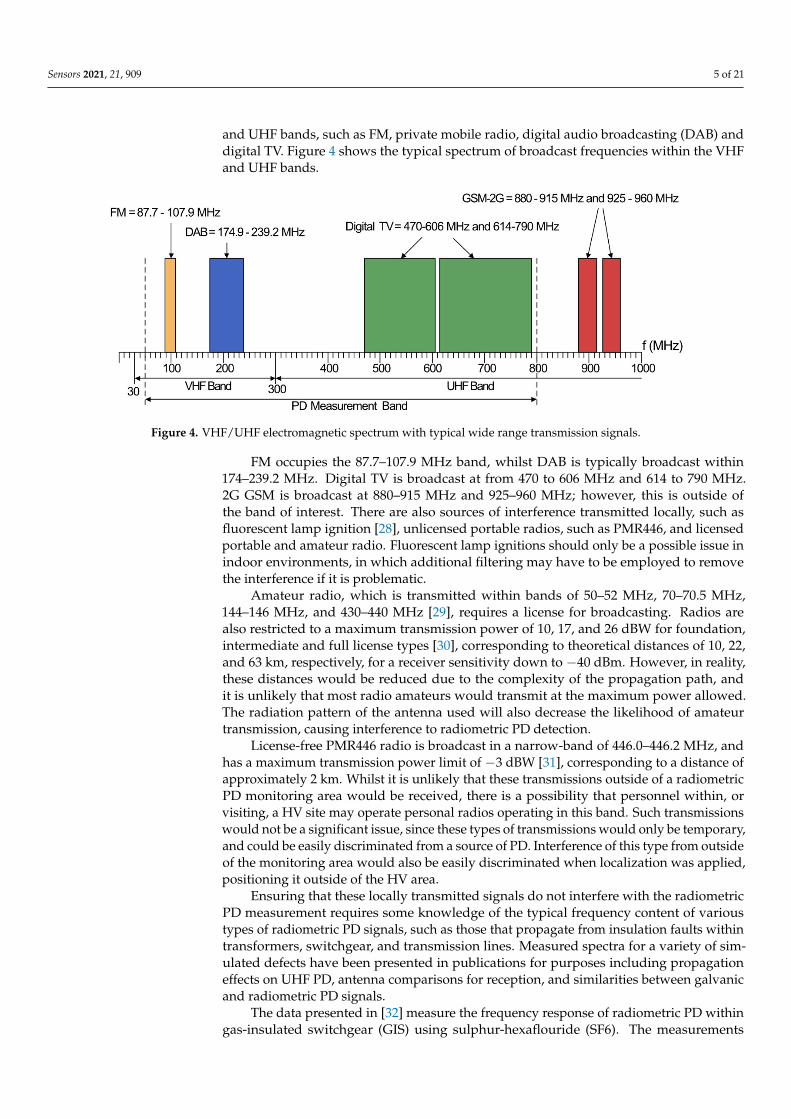
and UHF bands, such as FM, private mobile radio, digital audio broadcasting (DAB) anddigital TV. Figure 4 shows the typical spectrum of broadcast frequencies within the VHFand UHF bands.
Sensors 2020, 20, x FOR PEER REVIEW 5 of 20
amateur radio. Fluorescent lamp ignitions should only be a possible issue in indoor envi-
ronments, in which additional filtering may have to be employed to remove the interfer-
ence if it is problematic.
Figure 4. VHF/UHF electromagnetic spectrum with typical wide range transmission signals.
Amateur radio, which is transmitted within bands of 50–52 MHz, 70–70.5 MHz, 144–
146 MHz, and 430–440 MHz [29], requires a license for broadcasting. Radios are also re-
stricted to a maximum transmission power of 10, 17, and 26 dBW for foundation, inter-
mediate and full license types [30], corresponding to theoretical distances of 10, 22, and 63
km, respectively, for a receiver sensitivity down to −40 dBm. However, in reality, these
distances would be reduced due to the complexity of the propagation path, and it is un-
likely that most radio amateurs would transmit at the maximum power allowed. The ra-
diation pattern of the antenna used will also decrease the likelihood of amateur transmis-
sion, causing interference to radiometric PD detection.
License-free PMR446 radio is broadcast in a narrow-band of 446.0–446.2 MHz, and
has a maximum transmission power limit of −3 dBW [31], corresponding to a distance of
approximately 2 km. Whilst it is unlikely that these transmissions outside of a radiometric
PD monitoring area would be received, there is a possibility that personnel within, or vis-
iting, a HV site may operate personal radios operating in this band. Such transmissions
would not be a significant issue, since these types of transmissions would only be tempo-
rary, and could be easily discriminated from a source of PD. Interference of this type from
outside of the monitoring area would also be easily discriminated when localization was
applied, positioning it outside of the HV area.
Ensuring that these locally transmitted signals do not interfere with the radiometric
PD measurement requires some knowledge of the typical frequency content of various
types of radiometric PD signals, such as those that propagate from insulation faults within
transformers, switchgear, and transmission lines. Measured spectra for a variety of simu-
lated defects have been presented in publications for purposes including propagation ef-
fects on UHF PD, antenna comparisons for reception, and similarities between galvanic
and radiometric PD signals.
The data presented in [32] measure the frequency response of radiometric PD within
gas-insulated switchgear (GIS) using sulphur-hexaflouride (SF6). The measurements were
made using a biconical antenna and a log-periodic antenna, with bandwidths of 30–300
MHz and 80–1000 MHz respectively, at a distance of 2 m from the source of PD. The re-
ported spectra were between 30 and 820 MHz, with the majority of the energy from 30 to
75 MHz. In [33], radiometric PD spectra were measured for an air-blast circuit breaker,
with a focus on the change in spectra due to the propagation environment. Three sensor
positions were used, two of which were fixed at a distance of 12 m from the PD source,
Figure 4. VHF/UHF electromagnetic spectrum with typical wide range transmission signals.
FM occupies the 87.7–107.9 MHz band, whilst DAB is typically broadcast within174–239.2 MHz. Digital TV is broadcast at from 470 to 606 MHz and 614 to 790 MHz.2G GSM is broadcast at 880–915 MHz and 925–960 MHz; however, this is outside ofthe band of interest. There are also sources of interference transmitted locally, such asfluorescent lamp ignition [28], unlicensed portable radios, such as PMR446, and licensedportable and amateur radio. Fluorescent lamp ignitions should only be a possible issue inindoor environments, in which additional filtering may have to be employed to removethe interference if it is problematic.
Amateur radio, which is transmitted within bands of 50–52 MHz, 70–70.5 MHz,144–146 MHz, and 430–440 MHz [29], requires a license for broadcasting. Radios arealso restricted to a maximum transmission power of 10, 17, and 26 dBW for foundation,intermediate and full license types [30], corresponding to theoretical distances of 10, 22,and 63 km, respectively, for a receiver sensitivity down to −40 dBm. However, in reality,these distances would be reduced due to the complexity of the propagation path, andit is unlikely that most radio amateurs would transmit at the maximum power allowed.The radiation pattern of the antenna used will also decrease the likelihood of amateurtransmission, causing interference to radiometric PD detection.
License-free PMR446 radio is broadcast in a narrow-band of 446.0–446.2 MHz, andhas a maximum transmission power limit of −3 dBW [31], corresponding to a distance ofapproximately 2 km. Whilst it is unlikely that these transmissions outside of a radiometricPD monitoring area would be received, there is a possibility that personnel within, orvisiting, a HV site may operate personal radios operating in this band. Such transmissionswould not be a significant issue, since these types of transmissions would only be temporary,and could be easily discriminated from a source of PD. Interference of this type from outsideof the monitoring area would also be easily discriminated when localization was applied,positioning it outside of the HV area.
Ensuring that these locally transmitted signals do not interfere with the radiometricPD measurement requires some knowledge of the typical frequency content of varioustypes of radiometric PD signals, such as those that propagate from insulation faults withintransformers, switchgear, and transmission lines. Measured spectra for a variety of sim-ulated defects have been presented in publications for purposes including propagationeffects on UHF PD, antenna comparisons for reception, and similarities between galvanicand radiometric PD signals.
The data presented in [32] measure the frequency response of radiometric PD withingas-insulated switchgear (GIS) using sulphur-hexaflouride (SF6). The measurements

Sensors 2021, 21, 909 6 of 21
were made using a biconical antenna and a log-periodic antenna, with bandwidths of30–300 MHz and 80–1000 MHz respectively, at a distance of 2 m from the source of PD. Thereported spectra were between 30 and 820 MHz, with the majority of the energy from 30 to75 MHz. In [33], radiometric PD spectra were measured for an air-blast circuit breaker,with a focus on the change in spectra due to the propagation environment. Three sensorpositions were used, two of which were fixed at a distance of 12 m from the PD source, andone which was varied between 12 and 18 m. The mean spectra measured at each positionfluctuated by over 50 MHz between the three sensor positions; however, the majority ofthe frequency content was still between 50 and 400 MHz at each position.
In [34] and [35], a PD fault was emulated using a sandwich of transformer papersubmerged in transformer oil. Five sheets were used in [34] in between two electrodespaper, whilst eleven sheets were used in [35], with the five inner most sheets pierced witha 1 mm hole to produce an air-filled void. The radiometric PD signal produced was thenmeasured using four different antennas, a 5 and 10 cm monopole, a log-periodic and azig-zag antenna. The cumulative power was measured with and without the PD source inbands of 0–300 MHz and 1300 to 1900 MHz, with the ratio of the two cumulative quantitiesprovided, therefore allowing for the difference in received power to be determined betweenbackground broadcast interference and PD within these bands, along with the power levelin each band.
The results reported in [34] show that the majority of the received power is within the0–300 MHz band, with the exception of the 5 cm monopole antenna, where the majority ofreceived power was in the 1300–1900 MHz band. However, the reason for this is that thelower bandwidth of such an antenna is restricted due to its physical size, since a monopoleantenna should be half the wavelength of the received signal frequency [36].
The results shown in [35] divide the measured spectrum into 250 MHz bands for eachantenna, from DC to 2.5 GHz, with the log-periodic taken as the absolute measurementdue to its flat frequency response across the specified range. The antennas were placed at adistance of 45 cm from the PD source, with the exception of the log-periodic antenna, whichwas placed at a distance of 90 cm to ensure the antenna was in the far field. Approximately75% of the received power was measured in the 0–250 MHz band, along with 17% inthe 250–500 MHz band. The remaining energy was between 1.4% and 0.26% in eachconsecutive frequency band.
The spectra of three simulated PD faults within a HV transformer were measuredin [37]—an internal void PD fault, a surface PD fault and a insulator bushing PD fault.The internal PD fault was simulated with a dielectric oil-filled glass vessel placed inside atransformer tank which contained eleven layers of insulation, with a 1 mm hole perforatedthrough the three inner most layers to produce an air-filled void. Two electrodes are con-nected to each side of the vessel to attach a HV source, the air was removed using a vacuumin order to ensure a lower permittivity withing the void than in the insulating layers.
The surface PD fault was created using a twisted-pair of HV, resin polyamide-imideinsulation, enameled wire placed within the tank, which has an additional layer of polyestertris hydroxyethyl isocyanurate over the insulation. Finally, the bushing fault was generatedusing a porcelain bushing insulator whose surface was covered with a saline solution,which was allowed to dry in order to obtain a salt polluted surface to generate PD. Theemulated PD faults were measured using two 10 cm monopole antennas, one placedinside the tank and one outside at a distance of 30 cm from the fault under test. Thespectra were measured within three bands—a lower band of 0–300 MHz, a middle band of300–1200 MHz, and an upper band of 1200–2500 MHz.
The cumulative power within each band was measured, with and without the PDfault, to determine the contribution of locally transmitted interfering transmissions. Forthe internal PD fault, the percentages of power measured by the inner antenna were0.3%, 94.3%, and 5.4% for the lower, middle, and upper bands, respectively, whilst thepercentages were 61.9%, 35.8%, and 2.1% in the lower, middle, and upper bands for theouter antenna, respectively. For the surface PD fault, the measured powers in each band

Sensors 2021, 21, 909 7 of 21
were 0.1%, 99.1%, and 0.8%, and 89.2%, 10.7%, and 0.1%, in the lower, middle, and upperbands for the inner and outer antennas, respectively.
The cumulative energies for the bushing PD fault in the lower, middle, and upperbands were 69.3%, 27.4%, and 3.3% for the inner antenna, and 40.3%, 58.1%, and 1.6% forthe outer antenna. For the two internal fault types, the majority of the cumulative powermeasured by the internal antenna was in the middle band, whilst for the external antenna,the majority of power was in the lower band. The inverse of this is the case for the bushingfault, where the majority of the power was in the middle band. The reason for this was dueto the transformer tank causing low-pass filtering to the radiometric signal. However, thehigher frequency content of the measurements made where the tank was not an obstructionwas closely related. A measurement made at a distance greater than 3 m would likely haveincurred attenuation to the higher frequency content.
In [38], the spectra of an emulated HV floating electrode PD fault, which is a commonfault in switchgear [39], was obtained and compared using both galvanic and radiometricmeasurements.
A floating electrode PD test cell was energized to 6.2 kV using a HV DC supply. Themeasured energy was divided into bands of 50–290, 290–470, and 470–800 MHz. Forthe contact and radiometric measurements, the percentages of energy in each band were62.8% and 78.3% in the 50–290 MHz band, 0.76% and 4.33% in the 290–470 MHz band,and 0.56% and 1.59% in the 470–800 MHz band, respectively, and the remaining energywas below 50 MHz. In both cases, the majority of the measured energy was within the50–290 MHz band.
In [20,40], spectra were taken for a further two emulated PD faults using galvanic andradiometric measurements. Both PD cells emulated defects within solid insulation. Oneconsisted of an acrylic tube containing two electrodes at each end, between the electrodesa sandwich of three circular pieces of 1.5 mm thick FR4 insulation are placed, in whichthe middle piece has a 1 mm hole drilled in the center to create a higher electric fieldwithin it, and therefore, a discharge. The second consisted of a sandwich of three sheets of2.4 mm-thick epoxy glass dielectric between two electrodes, with a 1 mm diameter hole,again, drilled in the center of the middle sheet.
The acrylic tube PD source was filled with transformer oil in order to suppress anydischarges occurring at the edges of the electrodes. However, measurements were takenwith and without the presence of oil. The acrylic tube emulator was energized to 20 kV AC,both with and without oil, to generate PD, whilst the epoxy glass dielectric emulator wasenergized to 18 kV AC. Even though the frequency response of the acrylic tube emulatorwas higher with the presence of oil, almost the entire energy is in the 50–800 MHz band forall three measurements of the two emulators, with the majority of the energy being below300 MHz.
2.2. Time Difference of Arrival PD Measurement
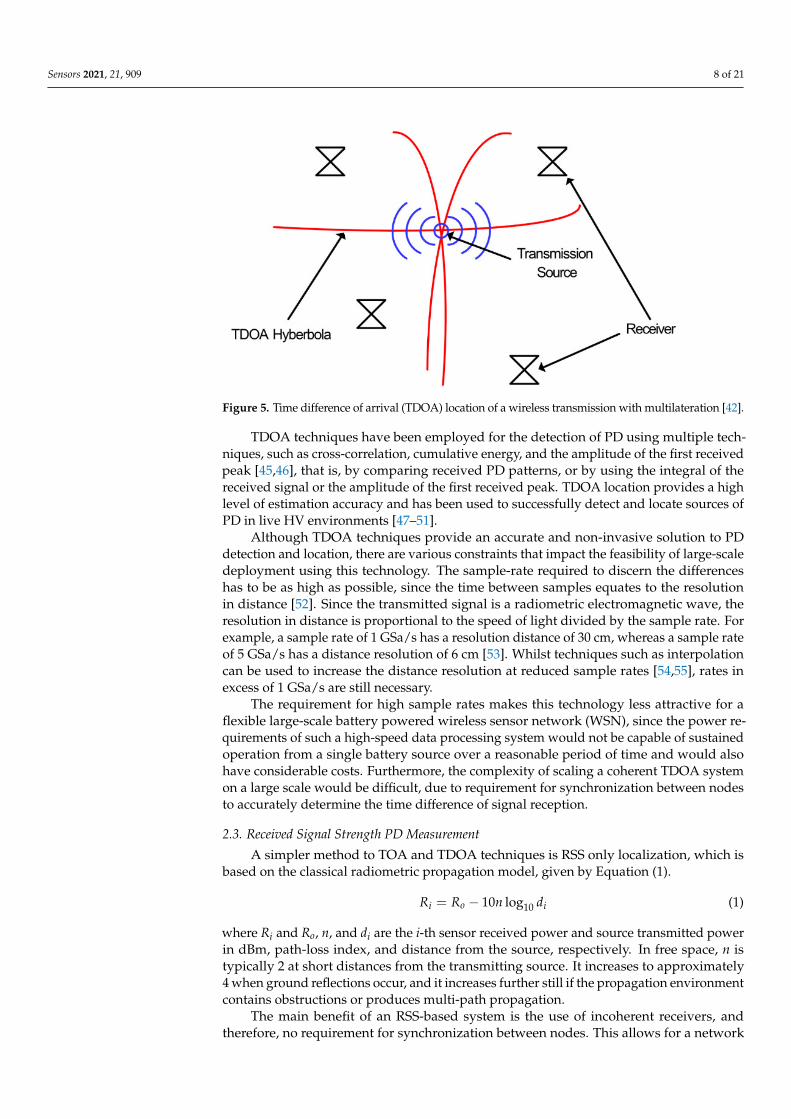
TOA and TDOA techniques, traditionally used for radio positioning systems, use thetimes that signals are received at specific receivers to determine the distance, using thespeed of light to convert time to distance, of a transmitting signal from each receiver, andtherefore, the location of the transmitting source [41]. TOA relies on the time at which thetransmitted signal was sent along with the reception time for each receiver, whereas TDOAonly requires the latter, and is therefore more versatile [42]. Figure 5 shows an example ofTDOA positioning.
In this example, four receivers are positioned around a transmitting signal whichis the target for location. The distance of the source from each receiver is calculated bydetermining the precise time difference of received signals between sensors. This is thenconverted to distance using the speed of light. The resulting distances are used to plothyperbolic lines via non-linear regression, at which the intersecting point of the lines isthe estimation for the transmission [43]. TDOA has been used in many schemes for PDlocation and can provide accuracy within 5 cm [44].
Sensors 2021, 21, 909 8 of 21
Sensors 2020, 20, x FOR PEER REVIEW 8 of 20
scale deployment using this technology. The sample-rate required to discern the differ-
ences has to be as high as possible, since the time between samples equates to the resolu-
tion in distance [52]. Since the transmitted signal is a radiometric electromagnetic wave,
the resolution in distance is proportional to the speed of light divided by the sample rate.
For example, a sample rate of 1 GSa/s has a resolution distance of 30 cm, whereas a sample
rate of 5 GSa/s has a distance resolution of 6 cm [53]. Whilst techniques such as interpola-
tion can be used to increase the distance resolution at reduced sample rates [54,55], rates
in excess of 1 GSa/s are still necessary.
Figure 5. Time difference of arrival (TDOA) location of a wireless transmission with
multilateration [42].
The requirement for high sample rates makes this technology less attractive for a
flexible large-scale battery powered wireless sensor network (WSN), since the power re-
quirements of such a high-speed data processing system would not be capable of sus-
tained operation from a single battery source over a reasonable period of time and would
also have considerable costs. Furthermore, the complexity of scaling a coherent TDOA
system on a large scale would be difficult, due to requirement for synchronization be-
tween nodes to accurately determine the time difference of signal reception.
2.3. Received Signal Strength PD Measurement
A simpler method to TOA and TDOA techniques is RSS only localization, which is
based on the classical radiometric propagation model, given by Equation (1).
1010 logi o iR R n d (1)
where Ri and Ro, n, and di are the i-th sensor received power and source transmitted power
in dBm, path-loss index, and distance from the source, respectively. In free space, n is
typically 2 at short distances from the transmitting source. It increases to approximately 4
when ground reflections occur, and it increases further still if the propagation environ-
ment contains obstructions or produces multi-path propagation.
The main benefit of an RSS-based system is the use of incoherent receivers, and there-
fore, no requirement for synchronization between nodes. This allows for a network that
is far more flexible than coherent-based detection and can be easily scaled for a given
monitoring area of HV plant [56]. This versatility comes at the cost of decreased accuracy
compared to TOA and TDOA techniques, due to the complexity of the propagation envi-
ronment [57]; however, this can be alleviated through calibration, by transmitting an arti-
ficial PD source of known strength from a single node within the WSN to each other node.
The received signal at each node can then be adjusted to account for the propagation en-
vironment for a given transmission path [58]. A further challenge is the limited signal-to-
noise ratio (SNR), due to the use of incoherent detectors with a wide bandwidth, and
therefore a limited dynamic range.
A typical technique used in some proposed implementations [59–61] is to measure
the energy of the received PD signal, since experimental data have been reported that link
Figure 5. Time difference of arrival (TDOA) location of a wireless transmission with multilateration [42].
TDOA techniques have been employed for the detection of PD using multiple tech-niques, such as cross-correlation, cumulative energy, and the amplitude of the first receivedpeak [45,46], that is, by comparing received PD patterns, or by using the integral of thereceived signal or the amplitude of the first received peak. TDOA location provides a highlevel of estimation accuracy and has been used to successfully detect and locate sources ofPD in live HV environments [47–51].
Although TDOA techniques provide an accurate and non-invasive solution to PDdetection and location, there are various constraints that impact the feasibility of large-scaledeployment using this technology. The sample-rate required to discern the differenceshas to be as high as possible, since the time between samples equates to the resolutionin distance [52]. Since the transmitted signal is a radiometric electromagnetic wave, theresolution in distance is proportional to the speed of light divided by the sample rate. Forexample, a sample rate of 1 GSa/s has a resolution distance of 30 cm, whereas a sample rateof 5 GSa/s has a distance resolution of 6 cm [53]. Whilst techniques such as interpolationcan be used to increase the distance resolution at reduced sample rates [54,55], rates inexcess of 1 GSa/s are still necessary.
The requirement for high sample rates makes this technology less attractive for aflexible large-scale battery powered wireless sensor network (WSN), since the power re-quirements of such a high-speed data processing system would not be capable of sustainedoperation from a single battery source over a reasonable period of time and would alsohave considerable costs. Furthermore, the complexity of scaling a coherent TDOA systemon a large scale would be difficult, due to requirement for synchronization between nodesto accurately determine the time difference of signal reception.
2.3. Received Signal Strength PD Measurement
A simpler method to TOA and TDOA techniques is RSS only localization, which isbased on the classical radiometric propagation model, given by Equation (1).
Ri = Ro − 10n log10 di (1)
where Ri and Ro, n, and di are the i-th sensor received power and source transmitted powerin dBm, path-loss index, and distance from the source, respectively. In free space, n istypically 2 at short distances from the transmitting source. It increases to approximately4 when ground reflections occur, and it increases further still if the propagation environmentcontains obstructions or produces multi-path propagation.
The main benefit of an RSS-based system is the use of incoherent receivers, andtherefore, no requirement for synchronization between nodes. This allows for a network

Sensors 2021, 21, 909 9 of 21
that is far more flexible than coherent-based detection and can be easily scaled for agiven monitoring area of HV plant [56]. This versatility comes at the cost of decreasedaccuracy compared to TOA and TDOA techniques, due to the complexity of the propagationenvironment [57]; however, this can be alleviated through calibration, by transmitting anartificial PD source of known strength from a single node within the WSN to each othernode. The received signal at each node can then be adjusted to account for the propagationenvironment for a given transmission path [58]. A further challenge is the limited signal-to-noise ratio (SNR), due to the use of incoherent detectors with a wide bandwidth, andtherefore a limited dynamic range.
A typical technique used in some proposed implementations [59–61] is to measurethe energy of the received PD signal, since experimental data have been reported thatlink the total radio frequency (RF) energy propagated from a PD source to the apparentcharge conducted across the void [62,63], suggesting that the two quantities have a linearrelationship; therefore, the integral of the received PD power may contain useful diagnosticinformation.
Methods of RSS PD localization have been proposed which directly sample the re-ceived PD signal [64–67]. Whilst these techniques eliminate the need for synchronization,they still employ sample rates above 1 GSa/s. Although direct sampling of the received PDsignal obtains detailed information of the PD signal, which allows for frequency analysis viafast-Fourier transform, along with pattern recognition and better noise immunity [66,68], itstill requires excessive power consumption.
To reduce the required sample-rate, various techniques have been proposed whichutilize envelope detection to remove the VHF/UHF frequency components, thus leavingonly the envelope of the received PD signal [69], allowing for sample rates of approximately20 MSa/s at a reduced measurement accuracy. Data published in [70] state an error of0.54% at a sample rate of 100 MSa/s, with 20 samples per pulse for a 200 ns radiometric PDsignal, compared to a sample-rate of 10 GSa/s and 20,000 samples per pulse. This accuracydrops to 8.68% at 10 MSa/s, with only two samples per pulse. Whilst this does not seem asignificant error, due to the stochastic nature of the PD, it is likely that in some cases onlyone sample will be obtained for a received signal, therefore reducing the accuracy of themeasurement.
A technique utilizing envelope detection, along with basic frequency measurement,was proposed in [59,71]. The proposed system, shown in Figure 6, used three parallelfiltered channels to obtain basic spectra of the received PD signal.
Sensors 2020, 20, x FOR PEER REVIEW 9 of 20
the total radio frequency (RF) energy propagated from a PD source to the apparent charge
conducted across the void [62,63], suggesting that the two quantities have a linear rela-
tionship; therefore, the integral of the received PD power may contain useful diagnostic
information.
Methods of RSS PD localization have been proposed which directly sample the re-
ceived PD signal [64–67]. Whilst these techniques eliminate the need for synchronization,
they still employ sample rates above 1 GSa/s. Although direct sampling of the received
PD signal obtains detailed information of the PD signal, which allows for frequency anal-
ysis via fast-Fourier transform, along with pattern recognition and better noise immunity
[66,68], it still requires excessive power consumption.
To reduce the required sample-rate, various techniques have been proposed which
utilize envelope detection to remove the VHF/UHF frequency components, thus leaving
only the envelope of the received PD signal [69], allowing for sample rates of approxi-
mately 20 MSa/s at a reduced measurement accuracy. Data published in [70] state an error
of 0.54% at a sample rate of 100 MSa/s, with 20 samples per pulse for a 200 ns radiometric
PD signal, compared to a sample-rate of 10 GSa/s and 20,000 samples per pulse. This ac-
curacy drops to 8.68% at 10 MSa/s, with only two samples per pulse. Whilst this does not
seem a significant error, due to the stochastic nature of the PD, it is likely that in some
cases only one sample will be obtained for a received signal, therefore reducing the accu-
racy of the measurement.
A technique utilizing envelope detection, along with basic frequency measurement,
was proposed in [59,71]. The proposed system, shown in Figure 6, used three parallel fil-
tered channels to obtain basic spectra of the received PD signal.
The received RF signal is applied to three separate parallel filters, a 450 MHz cutoff
low-pass filter, and 400–750 MHz and 700–3200 MHz band-pass filters. The filtered signals
are each applied to a Schottky diode power detector with bandwidths of 5 MHz, which
remove the UHF components from the received PD signal. The detected signals are then
sampled at a rate of 1 GSa/s by a digital sampling oscilloscope (DSO). The sampled data
are then processed via a PC to calculate the energy of received PD signals in each fre-
quency band. This is then used to plot a histogram of the received pulses for a given en-
ergy band.
Whilst this system is only a prototype, it is limited for large-scale use due to various
factors. The 1 GSa/s sample-rate would make the cost per sensor too high for a WSN to be
a viable option for PD monitoring. Along with this, three ADCs are required to digitize
each frequency band, increasing the cost and power consumption threefold. ADCs with a
sample rate at least a factor of ten lower could be used to reduce this limitation. However,
the data processing requirements would still require significant power consumption, par-
ticularly if the sampled data were transmitted back to the gateway before any processing
was performed. Furthermore, the parallel connection of the RF front-end would result in
the received signal power being split between each channel due to the 50 Ω matching,
reducing the signal strength, and therefore the sensitivity of the sensor.
Figure 6. A frequency-based RF PD sensor [59]. Figure 6. A frequency-based RF PD sensor [59].
The received RF signal is applied to three separate parallel filters, a 450 MHz cutofflow-pass filter, and 400–750 MHz and 700–3200 MHz band-pass filters. The filtered signalsare each applied to a Schottky diode power detector with bandwidths of 5 MHz, whichremove the UHF components from the received PD signal. The detected signals are then

Sensors 2021, 21, 909 10 of 21
sampled at a rate of 1 GSa/s by a digital sampling oscilloscope (DSO). The sampled dataare then processed via a PC to calculate the energy of received PD signals in each frequencyband. This is then used to plot a histogram of the received pulses for a given energy band.
Whilst this system is only a prototype, it is limited for large-scale use due to variousfactors. The 1 GSa/s sample-rate would make the cost per sensor too high for a WSN to be aviable option for PD monitoring. Along with this, three ADCs are required to digitize eachfrequency band, increasing the cost and power consumption threefold. ADCs with a samplerate at least a factor of ten lower could be used to reduce this limitation. However, the dataprocessing requirements would still require significant power consumption, particularlyif the sampled data were transmitted back to the gateway before any processing wasperformed. Furthermore, the parallel connection of the RF front-end would result in thereceived signal power being split between each channel due to the 50 Ω matching, reducingthe signal strength, and therefore the sensitivity of the sensor.
A single channel sensor using envelope detection was proposed in [56], shown inFigure 7, which utilizes the internal ADC of a micro-controller to digitize the received PD.
Sensors 2020, 20, x FOR PEER REVIEW 10 of 20
A single channel sensor using envelope detection was proposed in [56], shown in
Figure 7, which utilizes the internal ADC of a micro-controller to digitize the received PD.
Figure 7. Single channel PD sensor proposed in [56].
The sensor is composed of a wideband receiving disk-cone antenna, LNA, band-pass
filter, envelope detector and micro-controller. The disk-cone antenna is used to receive the
radiometric PD signal. This is applied to an LNA to provide some amplification, increas-
ing the sensitivity of the sensor. The amplified signal is band-limited to a bandwidth of
50–600 MHz via the band-pass filter, before being applied to the envelope detector, which
removes the high frequency content from the PD signal. The envelope of the received PD
is then sampled by the micro-controller’s internal ADC.
This arrangement alleviates the requirement for high-speed sampling, and thus, pro-
vides a low-power technique for radiometric PD monitoring. The envelope detector is a
square responding device; therefore, each sample acquired by the micro-controller’s ADC
is proportional to the power at a given point of the envelope of the received PD signal.
The micro-controller can therefore process these samples to obtain the total received en-
ergy of the envelope. A disadvantage to this technique is the low sampling rate of the
ADC, which decreases the accuracy of the measured PD signal, as well as there being no
way to discern between received PD and other interfering signals.
Further developments were made to the previous sensor, as proposed in [72]. The
sensor, shown in Figure 8, is designed around the single channel version with the addition
of calibration circuitry and a communications module for transmission of received data.
Figure 8. Advanced single channel PD sensor proposed in [72].
The receiving radiometer antenna is, again, a disk-cone type. Here, the radiometer
antenna is connected to an RF switch, which configures the sensor as a receiver or trans-
mitter. The signal processing section is nearly identical to that of Figure 7, with the excep-
tion that a logarithmic detector is used in place of the square-law detector, therefore
providing higher sensor sensitivity and dynamic range. The main addition is the PD emu-
lation circuitry, which is activated by the micro-controller in order to transmit a known
PD-like signal to the other sensor nodes within the WSN. This allows for the propagation
environment to be calibrated between nodes, increasing the accuracy of the radiometric
localization. A further modification is the addition of a Zigbee communications module
to transmit received data to a data collection point.
Figure 7. Single channel PD sensor proposed in [56].
The sensor is composed of a wideband receiving disk-cone antenna, LNA, band-passfilter, envelope detector and micro-controller. The disk-cone antenna is used to receive theradiometric PD signal. This is applied to an LNA to provide some amplification, increasingthe sensitivity of the sensor. The amplified signal is band-limited to a bandwidth of50–600 MHz via the band-pass filter, before being applied to the envelope detector, whichremoves the high frequency content from the PD signal. The envelope of the received PDis then sampled by the micro-controller’s internal ADC.
This arrangement alleviates the requirement for high-speed sampling, and thus, pro-vides a low-power technique for radiometric PD monitoring. The envelope detector is asquare responding device; therefore, each sample acquired by the micro-controller’s ADCis proportional to the power at a given point of the envelope of the received PD signal. Themicro-controller can therefore process these samples to obtain the total received energy ofthe envelope. A disadvantage to this technique is the low sampling rate of the ADC, whichdecreases the accuracy of the measured PD signal, as well as there being no way to discernbetween received PD and other interfering signals.
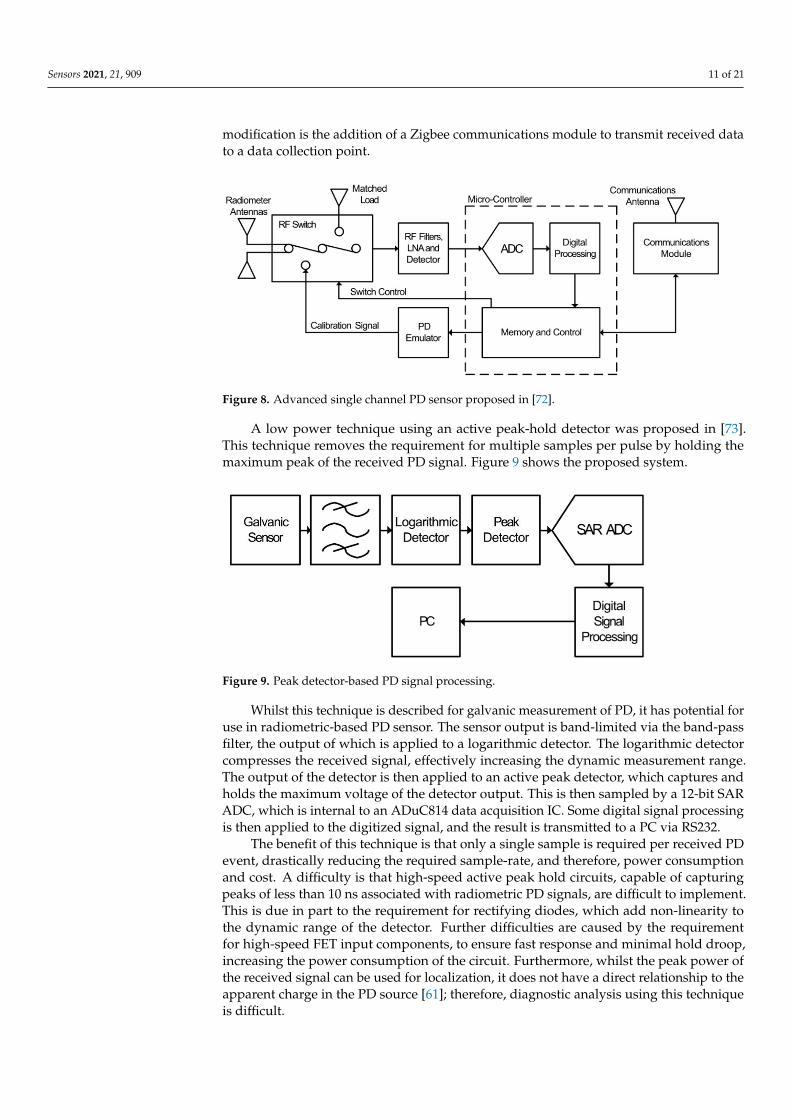
Further developments were made to the previous sensor, as proposed in [72]. Thesensor, shown in Figure 8, is designed around the single channel version with the additionof calibration circuitry and a communications module for transmission of received data.
The receiving radiometer antenna is, again, a disk-cone type. Here, the radiometer an-tenna is connected to an RF switch, which configures the sensor as a receiver or transmitter.The signal processing section is nearly identical to that of Figure 7, with the exception that alogarithmic detector is used in place of the square-law detector, therefore providing highersensor sensitivity and dynamic range. The main addition is the PD emulation circuitry,which is activated by the micro-controller in order to transmit a known PD-like signal tothe other sensor nodes within the WSN. This allows for the propagation environment to becalibrated between nodes, increasing the accuracy of the radiometric localization. A further
Sensors 2021, 21, 909 11 of 21
modification is the addition of a Zigbee communications module to transmit received datato a data collection point.
Sensors 2020, 20, x FOR PEER REVIEW 10 of 20
A single channel sensor using envelope detection was proposed in [56], shown in
Figure 7, which utilizes the internal ADC of a micro-controller to digitize the received PD.
Figure 7. Single channel PD sensor proposed in [56].
The sensor is composed of a wideband receiving disk-cone antenna, LNA, band-pass
filter, envelope detector and micro-controller. The disk-cone antenna is used to receive the
radiometric PD signal. This is applied to an LNA to provide some amplification, increas-
ing the sensitivity of the sensor. The amplified signal is band-limited to a bandwidth of
50–600 MHz via the band-pass filter, before being applied to the envelope detector, which
removes the high frequency content from the PD signal. The envelope of the received PD
is then sampled by the micro-controller’s internal ADC.
This arrangement alleviates the requirement for high-speed sampling, and thus, pro-
vides a low-power technique for radiometric PD monitoring. The envelope detector is a
square responding device; therefore, each sample acquired by the micro-controller’s ADC
is proportional to the power at a given point of the envelope of the received PD signal.
The micro-controller can therefore process these samples to obtain the total received en-
ergy of the envelope. A disadvantage to this technique is the low sampling rate of the
ADC, which decreases the accuracy of the measured PD signal, as well as there being no
way to discern between received PD and other interfering signals.
Further developments were made to the previous sensor, as proposed in [72]. The
sensor, shown in Figure 8, is designed around the single channel version with the addition
of calibration circuitry and a communications module for transmission of received data.
Figure 8. Advanced single channel PD sensor proposed in [72].
The receiving radiometer antenna is, again, a disk-cone type. Here, the radiometer
antenna is connected to an RF switch, which configures the sensor as a receiver or trans-
mitter. The signal processing section is nearly identical to that of Figure 7, with the excep-
tion that a logarithmic detector is used in place of the square-law detector, therefore
providing higher sensor sensitivity and dynamic range. The main addition is the PD emu-
lation circuitry, which is activated by the micro-controller in order to transmit a known
PD-like signal to the other sensor nodes within the WSN. This allows for the propagation
environment to be calibrated between nodes, increasing the accuracy of the radiometric
localization. A further modification is the addition of a Zigbee communications module
to transmit received data to a data collection point.
Figure 8. Advanced single channel PD sensor proposed in [72].
A low power technique using an active peak-hold detector was proposed in [73].This technique removes the requirement for multiple samples per pulse by holding themaximum peak of the received PD signal. Figure 9 shows the proposed system.
Sensors 2020, 20, x FOR PEER REVIEW 11 of 20
A low power technique using an active peak-hold detector was proposed in [73]. This
technique removes the requirement for multiple samples per pulse by holding the maxi-
mum peak of the received PD signal. Figure 9 shows the proposed system.
Figure 9. Peak detector-based PD signal processing.
Whilst this technique is described for galvanic measurement of PD, it has potential
for use in radiometric-based PD sensor. The sensor output is band-limited via the band-
pass filter, the output of which is applied to a logarithmic detector. The logarithmic detec-
tor compresses the received signal, effectively increasing the dynamic measurement
range. The output of the detector is then applied to an active peak detector, which captures
and holds the maximum voltage of the detector output. This is then sampled by a 12-bit
SAR ADC, which is internal to an ADuC814 data acquisition IC. Some digital signal pro-
cessing is then applied to the digitized signal, and the result is transmitted to a PC via
RS232.
The benefit of this technique is that only a single sample is required per received PD
event, drastically reducing the required sample-rate, and therefore, power consumption
and cost. A difficulty is that high-speed active peak hold circuits, capable of capturing
peaks of less than 10 ns associated with radiometric PD signals, are difficult to implement.
This is due in part to the requirement for rectifying diodes, which add non-linearity to the
dynamic range of the detector. Further difficulties are caused by the requirement for high-
speed FET input components, to ensure fast response and minimal hold droop, increasing
the power consumption of the circuit. Furthermore, whilst the peak power of the received
signal can be used for localization, it does not have a direct relationship to the apparent
charge in the PD source [61]; therefore, diagnostic analysis using this technique is difficult.
2.4. Summary of the Reviewed Literature
This paper has outlined the techniques for the acquisition of short-duration analogue
pulses, along with the advantages and limitations of each technique. The basic operation
of relevant ADCs was discussed, with the suitability for analogue pulse acquisition, and
in particular radiometric PD, being assessed. The type and functionality of typical RF en-
velope tracking detectors were described and evaluated. The typical frequency spectra for
various radiometric PD faults were detailed, along with the frequency spectrum of locally
transmitted signal that would likely be detected within the range of radiometric PD. Fi-
nally, techniques for radiometric partial discharge measurement were presented and dis-
cussed, with a focus on the suitability for their deployment in a large-scale PD monitoring
WSN. The main points taken from this literature review are as follows:
Whilst undersampling acquisition allows for a lower power ADC to be used, the
lower sample rate limits the accuracy of the measurement. Conversely, oversampling
provides a high level of measurement accuracy, but is limited by the requirement for
higher power consumption.
Schottky diode-based RF power detectors, e.g., LTC5507, can provide an accurate
measurement of received power, at no or low power consumption, and can track the
fast envelope of a received PD signal. However, their dynamic range is limited due
to the requirement for them to operate in the square-law region of the diode.
Figure 9. Peak detector-based PD signal processing.
Whilst this technique is described for galvanic measurement of PD, it has potential foruse in radiometric-based PD sensor. The sensor output is band-limited via the band-passfilter, the output of which is applied to a logarithmic detector. The logarithmic detectorcompresses the received signal, effectively increasing the dynamic measurement range.The output of the detector is then applied to an active peak detector, which captures andholds the maximum voltage of the detector output. This is then sampled by a 12-bit SARADC, which is internal to an ADuC814 data acquisition IC. Some digital signal processingis then applied to the digitized signal, and the result is transmitted to a PC via RS232.
The benefit of this technique is that only a single sample is required per received PDevent, drastically reducing the required sample-rate, and therefore, power consumptionand cost. A difficulty is that high-speed active peak hold circuits, capable of capturingpeaks of less than 10 ns associated with radiometric PD signals, are difficult to implement.This is due in part to the requirement for rectifying diodes, which add non-linearity tothe dynamic range of the detector. Further difficulties are caused by the requirementfor high-speed FET input components, to ensure fast response and minimal hold droop,increasing the power consumption of the circuit. Furthermore, whilst the peak power ofthe received signal can be used for localization, it does not have a direct relationship to theapparent charge in the PD source [61]; therefore, diagnostic analysis using this techniqueis difficult.
Sensors 2021, 21, 909 12 of 21
2.4. Summary of the Reviewed Literature
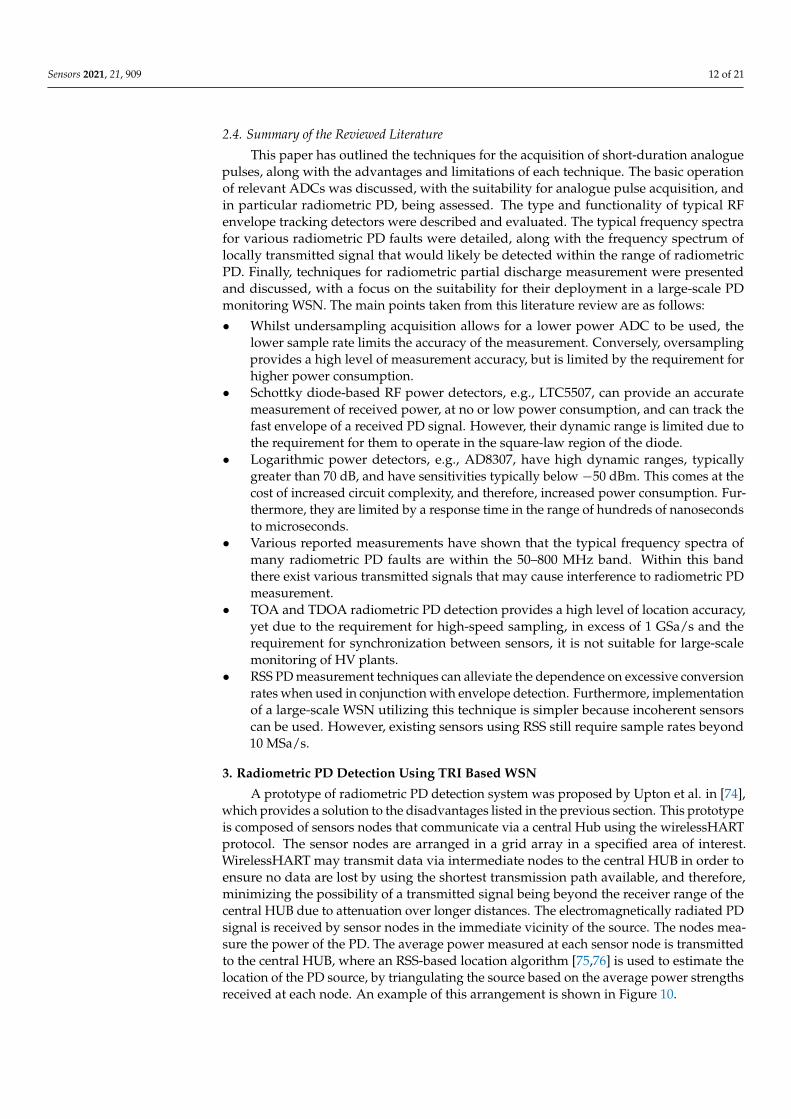
This paper has outlined the techniques for the acquisition of short-duration analoguepulses, along with the advantages and limitations of each technique. The basic operationof relevant ADCs was discussed, with the suitability for analogue pulse acquisition, andin particular radiometric PD, being assessed. The type and functionality of typical RFenvelope tracking detectors were described and evaluated. The typical frequency spectrafor various radiometric PD faults were detailed, along with the frequency spectrum oflocally transmitted signal that would likely be detected within the range of radiometricPD. Finally, techniques for radiometric partial discharge measurement were presentedand discussed, with a focus on the suitability for their deployment in a large-scale PDmonitoring WSN. The main points taken from this literature review are as follows:
• Whilst undersampling acquisition allows for a lower power ADC to be used, thelower sample rate limits the accuracy of the measurement. Conversely, oversamplingprovides a high level of measurement accuracy, but is limited by the requirement forhigher power consumption.
• Schottky diode-based RF power detectors, e.g., LTC5507, can provide an accuratemeasurement of received power, at no or low power consumption, and can track thefast envelope of a received PD signal. However, their dynamic range is limited due tothe requirement for them to operate in the square-law region of the diode.
• Logarithmic power detectors, e.g., AD8307, have high dynamic ranges, typicallygreater than 70 dB, and have sensitivities typically below −50 dBm. This comes at thecost of increased circuit complexity, and therefore, increased power consumption. Fur-thermore, they are limited by a response time in the range of hundreds of nanosecondsto microseconds.
• Various reported measurements have shown that the typical frequency spectra ofmany radiometric PD faults are within the 50–800 MHz band. Within this bandthere exist various transmitted signals that may cause interference to radiometric PDmeasurement.
• TOA and TDOA radiometric PD detection provides a high level of location accuracy,yet due to the requirement for high-speed sampling, in excess of 1 GSa/s and therequirement for synchronization between sensors, it is not suitable for large-scalemonitoring of HV plants.
• RSS PD measurement techniques can alleviate the dependence on excessive conversionrates when used in conjunction with envelope detection. Furthermore, implementationof a large-scale WSN utilizing this technique is simpler because incoherent sensorscan be used. However, existing sensors using RSS still require sample rates beyond10 MSa/s.
3. Radiometric PD Detection Using TRI Based WSN
A prototype of radiometric PD detection system was proposed by Upton et al. in [74],which provides a solution to the disadvantages listed in the previous section. This prototypeis composed of sensors nodes that communicate via a central Hub using the wirelessHARTprotocol. The sensor nodes are arranged in a grid array in a specified area of interest.WirelessHART may transmit data via intermediate nodes to the central HUB in order toensure no data are lost by using the shortest transmission path available, and therefore,minimizing the possibility of a transmitted signal being beyond the receiver range of thecentral HUB due to attenuation over longer distances. The electromagnetically radiated PDsignal is received by sensor nodes in the immediate vicinity of the source. The nodes mea-sure the power of the PD. The average power measured at each sensor node is transmittedto the central HUB, where an RSS-based location algorithm [75,76] is used to estimate thelocation of the PD source, by triangulating the source based on the average power strengthsreceived at each node. An example of this arrangement is shown in Figure 10.

Sensors 2021, 21, 909 13 of 21
Sensors 2020, 20, x FOR PEER REVIEW 12 of 20
Logarithmic power detectors, e.g., AD8307, have high dynamic ranges, typically
greater than 70 dB, and have sensitivities typically below −50 dBm. This comes at the
cost of increased circuit complexity, and therefore, increased power consumption.
Furthermore, they are limited by a response time in the range of hundreds of nano-
seconds to microseconds.
Various reported measurements have shown that the typical frequency spectra of
many radiometric PD faults are within the 50–800 MHz band. Within this band there
exist various transmitted signals that may cause interference to radiometric PD meas-
urement.
TOA and TDOA radiometric PD detection provides a high level of location accuracy,
yet due to the requirement for high-speed sampling, in excess of 1 GSa/s and the
requirement for synchronization between sensors, it is not suitable for large-scale
monitoring of HV plants.
RSS PD measurement techniques can alleviate the dependence on excessive conver-
sion rates when used in conjunction with envelope detection. Furthermore, imple-
mentation of a large-scale WSN utilizing this technique is simpler because incoherent
sensors can be used. However, existing sensors using RSS still require sample rates
beyond 10 MSa/s.
3. Radiometric PD Detection Using TRI Based WSN
A prototype of radiometric PD detection system was proposed by Upton et al. in [74],
which provides a solution to the disadvantages listed in the previous section. This proto-
type is composed of sensors nodes that communicate via a central Hub using the wire-
lessHART protocol. The sensor nodes are arranged in a grid array in a specified area of
interest. WirelessHART may transmit data via intermediate nodes to the central HUB in
order to ensure no data are lost by using the shortest transmission path available, and
therefore, minimizing the possibility of a transmitted signal being beyond the receiver
range of the central HUB due to attenuation over longer distances. The electromagneti-
cally radiated PD signal is received by sensor nodes in the immediate vicinity of the
source. The nodes measure the power of the PD. The average power measured at each
sensor node is transmitted to the central HUB, where an RSS-based location algorithm
[75,76] is used to estimate the location of the PD source, by triangulating the source based
on the average power strengths received at each node. An example of this arrangement is
shown in Figure 10.
Figure 10. An example of a wireless sensor network (WSN) layout in a switchyard to detect PD
using the prototype proposed in [74]. Figure 10. An example of a wireless sensor network (WSN) layout in a switchyard to detect PD usingthe prototype proposed in [74].
The sensor nodes of this system are developed to provide a system that is easy toinstall, low-cost, portable, and consumes as little power as possible. These nodes aredesigned to process and measure PD signals down to a level of at least −30 dBm, whilstalso providing immunity to interference from broadcasting signals. A block diagram of thestructure of the sensor node is shown in Figure 11.
Sensors 2020, 20, x FOR PEER REVIEW 13 of 20
The sensor nodes of this system are developed to provide a system that is easy to
install, low-cost, portable, and consumes as little power as possible. These nodes are de-
signed to process and measure PD signals down to a level of at least −30 dBm, whilst also
providing immunity to interference from broadcasting signals. A block diagram of the
structure of the sensor node is shown in Figure 11.
Figure 11. Block diagram of the sensor node of the PD detection system [74].
The radiometric PD signal is received via a dipole antenna, connected via a 4:1 balun
to provide a wider antenna bandwidth by providing a closer impedance match to the fol-
lowing section over a broader frequency range. A dipole antenna is used, as an omni-
directional pattern is required. The received signal is then applied to the RF front-end
block as shown in Figure 11. The RF front-end is represented as a block diagram in Figure
12.
Figure 12. Block diagram of RF front-end.
The signal is then applied to the filters and LNA. The band-pass filter removes inter-
ference and noise outside the 30–320 MHz band of measurement interest. Notably, it re-
moves digital TV broadcasting signals and mobile communications signals in the UHF
range. The band-stop filter removes FM, DAB, and other communications signals in the
region of 70–250 MHz. The LNA then provides a gain of approximately 16 dB. The com-
bined transfer function results in two passbands from 30 to 75 MHz and from 250 to 330
MHz, with a gain between 11.7 and 14.4 dB in the mid-band, and a measured noise figure
between 5 and 7 dB [77]. The frequency response of the RF front-end is shown in Figure
13.
Figure 13. Frequency response of the RF front-end.
Figure 11. Block diagram of the sensor node of the PD detection system [74].
The radiometric PD signal is received via a dipole antenna, connected via a 4:1 balunto provide a wider antenna bandwidth by providing a closer impedance match to thefollowing section over a broader frequency range. A dipole antenna is used, as an omni-directional pattern is required. The received signal is then applied to the RF front-end blockas shown in Figure 11. The RF front-end is represented as a block diagram in Figure 12.
Sensors 2020, 20, x FOR PEER REVIEW 13 of 20
The sensor nodes of this system are developed to provide a system that is easy to
install, low-cost, portable, and consumes as little power as possible. These nodes are de-
signed to process and measure PD signals down to a level of at least −30 dBm, whilst also
providing immunity to interference from broadcasting signals. A block diagram of the
structure of the sensor node is shown in Figure 11.
Figure 11. Block diagram of the sensor node of the PD detection system [74].
The radiometric PD signal is received via a dipole antenna, connected via a 4:1 balun
to provide a wider antenna bandwidth by providing a closer impedance match to the fol-
lowing section over a broader frequency range. A dipole antenna is used, as an omni-
directional pattern is required. The received signal is then applied to the RF front-end
block as shown in Figure 11. The RF front-end is represented as a block diagram in Figure
12.
Figure 12. Block diagram of RF front-end.
The signal is then applied to the filters and LNA. The band-pass filter removes inter-
ference and noise outside the 30–320 MHz band of measurement interest. Notably, it re-
moves digital TV broadcasting signals and mobile communications signals in the UHF
range. The band-stop filter removes FM, DAB, and other communications signals in the
region of 70–250 MHz. The LNA then provides a gain of approximately 16 dB. The com-
bined transfer function results in two passbands from 30 to 75 MHz and from 250 to 330
MHz, with a gain between 11.7 and 14.4 dB in the mid-band, and a measured noise figure
between 5 and 7 dB [77]. The frequency response of the RF front-end is shown in Figure
13.
Figure 13. Frequency response of the RF front-end.
Figure 12. Block diagram of RF front-end.

Sensors 2021, 21, 909 14 of 21
The signal is then applied to the filters and LNA. The band-pass filter removes interfer-ence and noise outside the 30–320 MHz band of measurement interest. Notably, it removesdigital TV broadcasting signals and mobile communications signals in the UHF range. Theband-stop filter removes FM, DAB, and other communications signals in the region of70–250 MHz. The LNA then provides a gain of approximately 16 dB. The combined transferfunction results in two passbands from 30 to 75 MHz and from 250 to 330 MHz, with again between 11.7 and 14.4 dB in the mid-band, and a measured noise figure between 5and 7 dB [77]. The frequency response of the RF front-end is shown in Figure 13.
Sensors 2020, 20, x FOR PEER REVIEW 13 of 20
The sensor nodes of this system are developed to provide a system that is easy to
install, low-cost, portable, and consumes as little power as possible. These nodes are de-
signed to process and measure PD signals down to a level of at least −30 dBm, whilst also
providing immunity to interference from broadcasting signals. A block diagram of the
structure of the sensor node is shown in Figure 11.
Figure 11. Block diagram of the sensor node of the PD detection system [74].
The radiometric PD signal is received via a dipole antenna, connected via a 4:1 balun
to provide a wider antenna bandwidth by providing a closer impedance match to the fol-
lowing section over a broader frequency range. A dipole antenna is used, as an omni-
directional pattern is required. The received signal is then applied to the RF front-end
block as shown in Figure 11. The RF front-end is represented as a block diagram in Figure
12.
Figure 12. Block diagram of RF front-end.
The signal is then applied to the filters and LNA. The band-pass filter removes inter-
ference and noise outside the 30–320 MHz band of measurement interest. Notably, it re-
moves digital TV broadcasting signals and mobile communications signals in the UHF
range. The band-stop filter removes FM, DAB, and other communications signals in the
region of 70–250 MHz. The LNA then provides a gain of approximately 16 dB. The com-
bined transfer function results in two passbands from 30 to 75 MHz and from 250 to 330
MHz, with a gain between 11.7 and 14.4 dB in the mid-band, and a measured noise figure
between 5 and 7 dB [77]. The frequency response of the RF front-end is shown in Figure
13.
Figure 13. Frequency response of the RF front-end. Figure 13. Frequency response of the RF front-end.
The output signal from the LNA is then applied to an RF envelope detector, which re-moves the high frequency components and produces an output voltage proportional to thelinear or logarithmic power of the received PD signal envelope, depending on the type ofdetector used. The envelope-detected PD signal is then applied to the signal processing sec-tion, which consists of an ADC [74] or of a composite transistor reset integrator (TRI), [78].A block diagram and the signal representation of the TRI-based signal processing section isshown in Figure 14a,b, respectively.
The output signal from the LNA is applied to an RF envelope square law detector,which removes the high-frequency components and produces an output voltage pro-portional to the instantaneous input power. The detected signal is then amplified by ahigh-speed NI amplifier to increase the amplitude of the signal to span the supply rail,which is then applied to the precision comparator and the TRI. The precision comparator iscomposed of a NI amplifier and a high-speed comparator. The NI amplifier increases thesignal in order for the comparator threshold to be set to a voltage that is at least 40 mV abovethe noise floor, therefore ensuring that no oscillation occurs at the output of the comparatordue to false triggering. When the output of the NI amplifier exceeds the threshold level, thecomparator triggers high, activating the analog switch and producing a pulse at the outputof the mono-stable circuit for a pulse count. The analog switch activates the TRI whichintegrates the received PD signal to a DC level. The TRI comprises a precision invertingintegrator, a transistor, and a comparator. Each received PD signal causes a DC step changeto the output of the integrator, proportional to the integral of the instantaneous power ofthe received pulse. Once the output voltage of the integrator reaches a predetermined level,the TRI comparator resets the TRI and the process is then repeated. The output of the TRIis then applied to an inverting amplifier to obtain a positive signal, which is then sampledby the internal successive approximation register (SAR) ADC of the micro-controller unit(MCU). In contrast to a standard TRI, a composite TRI technique involves utilization ofcomposite multiple amplifiers that enhance performance beyond the capabilities of anysingle commercial amplifiers. Using composite TRI helps in improving speed and precision,and reduced power consumption compared to a standard TRI. A detailed circuit of the

Sensors 2021, 21, 909 15 of 21
composite TRI signal processing section is presented in [78]. Figure 15a shows a receivedradiometric PD signal at the output of the LNA, the zero-bias detector output, and the TRIoutput, whilst Figure 15b shows the TRI output for multiple received emulated PD events.
Sensors 2020, 20, x FOR PEER REVIEW 14 of 20
The output signal from the LNA is then applied to an RF envelope detector, which
removes the high frequency components and produces an output voltage proportional to
the linear or logarithmic power of the received PD signal envelope, depending on the type
of detector used. The envelope-detected PD signal is then applied to the signal processing
section, which consists of an ADC [74] or of a composite transistor reset integrator (TRI),
[78]. A block diagram and the signal representation of the TRI-based signal processing
section is shown in Figure 14a,b, respectively.
(a)
(b)
Figure 14. Transistor reset integrator (TRI): (a) block diagram and (b) signals [78].
The output signal from the LNA is applied to an RF envelope square law detector,
which removes the high-frequency components and produces an output voltage propor-
tional to the instantaneous input power. The detected signal is then amplified by a high-
speed NI amplifier to increase the amplitude of the signal to span the supply rail, which
is then applied to the precision comparator and the TRI. The precision comparator is com-
posed of a NI amplifier and a high-speed comparator. The NI amplifier increases the sig-
nal in order for the comparator threshold to be set to a voltage that is at least 40 mV above
the noise floor, therefore ensuring that no oscillation occurs at the output of the compara-
tor due to false triggering. When the output of the NI amplifier exceeds the threshold
level, the comparator triggers high, activating the analog switch and producing a pulse at
the output of the mono-stable circuit for a pulse count. The analog switch activates the
TRI which integrates the received PD signal to a DC level. The TRI comprises a precision
inverting integrator, a transistor, and a comparator. Each received PD signal causes a DC
step change to the output of the integrator, proportional to the integral of the instantane-
ous power of the received pulse. Once the output voltage of the integrator reaches a pre-
determined level, the TRI comparator resets the TRI and the process is then repeated. The
output of the TRI is then applied to an inverting amplifier to obtain a positive signal,
which is then sampled by the internal successive approximation register (SAR) ADC of
the micro-controller unit (MCU). In contrast to a standard TRI, a composite TRI technique
involves utilization of composite multiple amplifiers that enhance performance beyond
the capabilities of any single commercial amplifiers. Using composite TRI helps in im-
proving speed and precision, and reduced power consumption compared to a standard
TRI. A detailed circuit of the composite TRI signal processing section is presented in [78].
Figure 15a shows a received radiometric PD signal at the output of the LNA, the zero-bias
Figure 14. Transistor reset integrator (TRI): (a) block diagram and (b) signals [78].
The output of the signal processing section is then inputted into an MCU, whichcalculates the energy of the received radiometric PD signal and provides a count of the totalnumber of PD events received over a predefined measurement period. The average of thereceived energy is then calculated by the MCU, and the mean received energy and count aretransmitted back to the central HUB via a wireless HART transmitter. Since only two valuesare transmitted per measurement period, the requirement for data processing and memoryare kept to a minimum, and therefore, power consumption is reduced. To ascertain theaccuracy of the TRI-based signal processing systems for location estimation based on RSS,the data acquired by the system were then entered into a simple localization algorithm. Thealgorithm is based upon the ratio of received power for sensor node pairs [44], since thetransmitted PD power is unknown. The algorithm uses the ratio of received sensor powersto estimate the distance of the PD source from the receiving nodes. The power ratio datafrom each sensor node are then processed to localize the PD source. Detailed calculationsand explanations regarding the proposed localization algorithm are included in [75,76],along with comparisons with other existing algorithms. The proposed PD detection systemand the localization algorithm were validated by performing two measurements: scenario1: PD source localization using six sensors, and scenario 2: PD source localization usingeight sensors. In both scenarios, the true location of the PD source from the origin is (13.5 m,4.5 m), and is left unchanged.

Sensors 2021, 21, 909 16 of 21
Sensors 2020, 20, x FOR PEER REVIEW 15 of 20
output of the LNA, the zero-bias detector output, and the TRI output, whilst Figure 15b
shows the TRI output for multiple received emulated PD events.
(a)
(b)
Figure 15. (a) TRI output for a single PD event and (b) TRI output for multiple PD events.
The output of the signal processing section is then inputted into an MCU, which
calculates the energy of the received radiometric PD signal and provides a count of the
total number of PD events received over a predefined measurement period. The average
of the received energy is then calculated by the MCU, and the mean received energy and
count are transmitted back to the central HUB via a wireless HART transmitter. Since only
two values are transmitted per measurement period, the requirement for data processing
and memory are kept to a minimum, and therefore, power consumption is reduced. To
ascertain the accuracy of the TRI-based signal processing systems for location estimation
based on RSS, the data acquired by the system were then entered into a simple localization
algorithm. The algorithm is based upon the ratio of received power for sensor node pairs
[44], since the transmitted PD power is unknown. The algorithm uses the ratio of received
sensor powers to estimate the distance of the PD source from the receiving nodes. The
power ratio data from each sensor node are then processed to localize the PD source.
Detailed calculations and explanations regarding the proposed localization algorithm are
included in [75,76], along with comparisons with other existing algorithms. The proposed
PD detection system and the localization algorithm were validated by performing two
measurements: scenario 1: PD source localization using six sensors, and scenario 2: PD
source localization using eight sensors. In both scenarios, the true location of the PD
source from the origin is (13.5 m, 4.5 m), and is left unchanged.
Figure 15. (a) TRI output for a single PD event and (b) TRI output for multiple PD events.
The measurement setup of the PD detection system with the location of the receivingsensor nodes, the true location of the PD source, and the estimated location of the PD sourceusing the localization algorithm is shown in Figure 16. The estimated coordinates of the PDsource using six sensor nodes is (10.3 m, 7.6 m), and using eight sensor nodes it is (12.4 m,4.4 m). The localization error using six sensor nodes is relatively high at 4.5 m, whereas thelocalization error using eight sensor nodes is only 1.06 m. This suggests that increasingthe number of receiving sensor nodes used in the WSN greatly improves the localizationaccuracy of the system. Furthermore, the performance evaluation of the proposed algorithmand its comparison with other existing algorithms using several measurements is presentedin [75]. It should be noted that most of the measurements for PD detection were carriedout in outdoor environments; however, a few of the PD measurements were performedindoors. These indoor measurements might have radio reflections from the walls or otherobjects that generally reduce the accuracy of the localization algorithm.
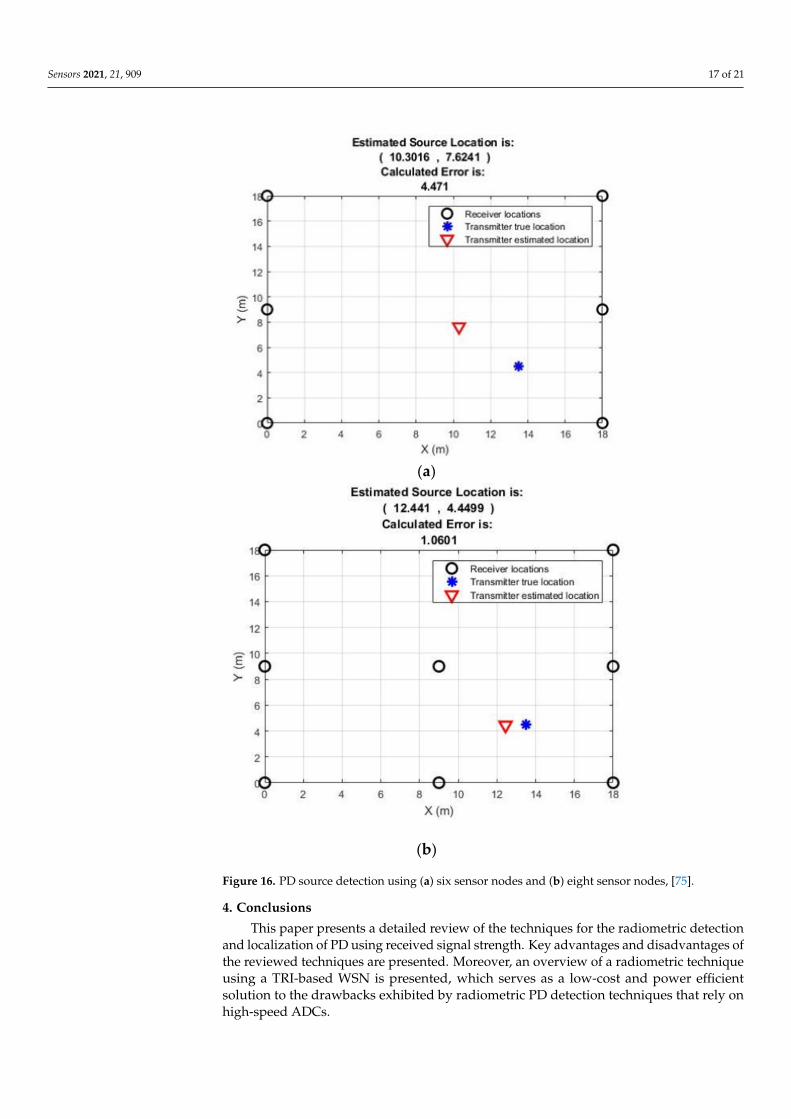
Sensors 2021, 21, 909 17 of 21
Sensors 2020, 20, x FOR PEER REVIEW 16 of 20
The measurement setup of the PD detection system with the location of the receiving
sensor nodes, the true location of the PD source, and the estimated location of the PD
source using the localization algorithm is shown in Figure 16. The estimated coordinates
of the PD source using six sensor nodes is (10.3 m, 7.6 m), and using eight sensor nodes it
is (12.4 m, 4.4 m). The localization error using six sensor nodes is relatively high at 4.5 m,
whereas the localization error using eight sensor nodes is only 1.06 m. This suggests that
increasing the number of receiving sensor nodes used in the WSN greatly improves the
localization accuracy of the system. Furthermore, the performance evaluation of the
proposed algorithm and its comparison with other existing algorithms using several
measurements is presented in [75]. It should be noted that most of the measurements for
PD detection were carried out in outdoor environments; however, a few of the PD
measurements were performed indoors. These indoor measurements might have radio
reflections from the walls or other objects that generally reduce the accuracy of the
localization algorithm.
(a)
(b)
Figure 16. PD source detection using (a) six sensor nodes and (b) eight sensor nodes, [75].
4. Conclusions
Figure 16. PD source detection using (a) six sensor nodes and (b) eight sensor nodes, [75].
4. Conclusions
This paper presents a detailed review of the techniques for the radiometric detectionand localization of PD using received signal strength. Key advantages and disadvantages ofthe reviewed techniques are presented. Moreover, an overview of a radiometric techniqueusing a TRI-based WSN is presented, which serves as a low-cost and power efficientsolution to the drawbacks exhibited by radiometric PD detection techniques that rely onhigh-speed ADCs.

Sensors 2021, 21, 909 18 of 21
Author Contributions: Conceptualization, D.W.U., P.J.M. and P.I.L.; methodology, D.W.U., P.J.M.,P.I.L. and K.K.M.; software, D.W.U.; validation, P.J.M., P.I.L., Z.D.Z., R.C.A. and C.T.; formal anal-ysis, D.W.U.; investigation, D.W.U.; resources, P.J.M. and P.I.L.; data curation, D.W.U. and K.K.M.;writing—D.W.U.; writing—review and editing, D.W.U. and K.K.M.; visualization, D.W.U. and K.K.M.;supervision, P.J.M. and P.I.L.; project administration, P.J.M. and P.I.L.; funding acquisition, P.J.M.,P.I.L., R.C.A. and C.T. All authors have read and agreed to the published version of the manuscript.
Funding: This research was funded by Engineering and Physical Sciences Research Council, UKunder grant EP/J015873/1.
Data Availability Statement: Data can be made available with request to the correspondence.
Acknowledgments: The authors acknowledge the Engineering and Physical Sciences ResearchCouncil, UK, for their support of this work under grant EP/J015873/1.
Conflicts of Interest: The authors declare no conflict of interest.
References1. Ryan, M.H. High Voltage Engineering and Testing, 2nd ed.; IEE: Herts, UK, 2001.2. Lemke, E.; Berlijn, S.; Gulski, E.; Muhr, H.M.; Pultrum, E.; Strehl, T.; Hauschild, W.; Rickmann, J.; Rizzi, G. Guide for Electrical
Partial Discharge Measurements in compliance to IEC 60270. Electra 2008, 241, 60–68.3. Bartnikas, R.; McMahon, E.J. Engineering Dielectrics, 1st ed.; American Society for Testing and Materials, Baltimore: West
Conshohocken, PA, USA, 1979.4. Arief, Y.Z.; Izzati, W.A.; Adzis, Z.A. Modeling of Partial Discharge Mechanisms in Solid Dielectric Material. Int. J. Eng. Innov.
Technol. 2012, 1, 315–320.5. 60270, I.I.S. High Voltage Test Techniquies—Partial Discharge Measurements, 3rd ed.; International Electrotechnical Commission (IEC):
Geneva, Switzerland, 2000.6. Short, A.T. Electric Power Distribution Handbook, 2nd ed.; CRC Press: Boca Raton, FL, USA, 2014.7. Gemant, A.; Philipoff, W. Die Funkenstrecke mit Vorkondensator. (German) [The spark gap with precondenser]. Zeitschift F.
Techn. Phys. 1931, 9, 425–430.8. Okubo, H.; Hayakawa, N.; Matsushita, A. The Relationship Between Partial Discharge Current Pulse Waveforms and Physical
Mechanisms. IEEE Electr. Insul. Mag. 2002, 18, 38–45. [CrossRef]9. Kind, D.; Feser, K. High Voltage Test Techniques, 2nd ed.; Newnes: Oxford, UK, 2001.10. Stone, G.C. Partial Discharge Diagnostics and Electrical Equipment Insulation Condition Assessment. IEEE Trans. Dielectr. Electr.
Insul. 2005, 12, 891–903. [CrossRef]11. Jennings, E.; Collinson, A. A Partial Discharge Monitor for the Measurement of Partial Discharges in a High Voltage Plant by the
Transient Earth Voltage Technique. In Proceedings of the IET International Conference on Partial Discharge, Canterbury, UK,28–30 September 1993; pp. 90–91.
12. Schwarz, R.; Muhr, M. Modern Technologies in Optical Partial Discharge Detection. In Proceedings of the Electrical Insulationand Dielectric Phenomena (CEIDP), Vancouver, BC, Canada, 14–17 October 2007; pp. 163–166.
13. Markalous, S.M.; Tenbohlen, S.; Feser, K. Detection and Location of Partial Discharges in Power Transformers using Acoustic andElectromagnetic Signals. IEEE Trans. Dielectr. Electr. Insul. 2008, 15, 1576–1583. [CrossRef]
14. Czichos, H. Handbook of Technical Diagnostics—Fundamentals and Application to Structures and Systems, 1st ed.; Springer: Berlin,Germany, 2013.
15. Ao, S.L.; Gelman, L. Electrical Engineering and Applied Computing, 1st ed.; Springer: New York, NY, USA, 2011.16. Swedan, A.; El-Hag, A.H.; Assaleh, K. Enhancement of Acoustic based Partial Discharge Detection using Pattern Recognition
Techniques. In Proceedings of the International Conference on Electric Power and Energy Conversion Systems (EPECS), Sharjah,United Arab Emirates, 15–17 November 2011; pp. 1–4.
17. Cselko, R.; Tamus, Z.A.; Szabo, A.; Berta, I. Comparison of Acoustic and Electrical Partial Discharge Measurements on CableTerminations. In Proceedings of the IEEE International Symposium on Electrical Insulation, San Diego, CA, USA, 6–9 June2010; pp. 1–4.
18. Chen, Q.; Gong, X.; Gao, W.; Li, F.; Tan, K. The UHF Method for Measurement of Partial Discharge in Oil-Impregnated Insulation.In Proceedings of the 7th International Conference on Properties and Applications of Dielectric Materials, Nagoya, Japan, 1–5June 2003; pp. 451–454.
19. Franceschetti, M. Wave Theory of Information, 1st ed.; Cambridge University Press: Cambridge, UK, 2018.20. Jaber, A.A.; Lazaridis, P.I.; Moradzadeh, M.; Glover, I.A.; Zaharis, Z.D.; Vieira, M.F.Q.; Judd, M.D.; Atkinson, R.C. Calibration of
Free-Space Radiometric Partial Discharge Measurements. IEEE Trans. Dielectr. Electr. Insul. 2017, 24, 3004–3014. [CrossRef]21. Candela, R.; Stefano, A.D.; Fiscelli, G.; Bononi, S.F.; Rai, L.D. A novel partial discharge detection system based on wireless
technology. In Proceedings of the AEIT Annual Conference, Mondello, Italy, 3–5 October 2013; pp. 1–6.22. Moore, P.J.; Portugues, I.; Glover, I.A. A non-intrusive partial discharge measurement system based on RF technology. In Proceed-
ings of the IEEE Power Engineering Society General Meeting, Toronto, ON, Canada, 13–17 July 2003; Volume 4, pp. 628–633.

Sensors 2021, 21, 909 19 of 21
23. Meijer, S.; Agoris, P.D.; Gulski, E.; Seitz, P.P.; Hermans, T.J.W.H. Condition assessment of power cable accessories using advancedVHF/UHF PD radio-frequency techniques. In Proceedings of the IEEE International Symposium on Electrical Insulation, Toronto,ON, Canada, 11–14 June 2006; pp. 482–485.
24. Kakeeto, P.; Judd, M.; Pearson, J.; Templeton, D. Experimental investigation of positional accuracy for UHF partial dischargelocation. In Proceedings of the International Conference on Condition Monitoring and Diagnosis (CMD 2008), Beijing, China,21–24 April 2008; pp. 1070–1073.
25. Liu, Y.; Zhou, W.; Li, P.; Yang, S.; Tian, Y. An Ultrahigh Frequency Partial Discharge Signal De-Noising Method Based on aGeneralized S-Transform and Module Time-Frequency Matrix. Sensors 2016, 16, 941. [CrossRef]
26. Tenbohlen, S.; Denissov, D.; Hoek, S.M.; Markalous, S.M. Partial Discharge Measurement in the Ultra High Frequency (UHF)Range. IEEE Trans. Dielectr. Electr. Insul. 2008, 15, 1544–1552. [CrossRef]
27. Siegel, M.; Tenbohlen, S. Comparison between Electrical and UHF PD Measurement concerning Calibration and Sensitivity forPower Transformers. In Proceedings of the International Conference on Condition Monitoring and Diagnosis (CMD), Jeju, Korea,22 September 2014; pp. 5–8.
28. Albarracin, R.; Ardila-Rey, J.A.; Mas’ud, A.A. Separation of Sources in Radiofrequency Measurements of Partial DIscharges usingTime-Power Ratio Maps. Isa Trans. 2015, 58, 389–397. [CrossRef]
29. Ofcom. United Kingdom Frequency Allocation Table; Issue No. 18v1.1.; Ofcom: London, UK, 2017.30. Ofcom. UK Interface Requirement 2028; 2015/1535/EU Notification Number: 2006/511/UK; Ofcom: London, UK, 2018.31. Ofcom. Analogue and Digital PMR446 Information Sheet; Ofcom: London, UK, 2018.32. Hoshino, T.; Kato, K.; Hayakawa, N.; Okubo, H. A Novel Technique for Detecting Electromagnetic Wave Caused by Partial
Discharge in GIS. IEEE Trans. Power Deliv. 2001, 16, 545–551. [CrossRef]33. Portugues, I.E.; Moore, P.J. Study of Propagation Effects of Wideband Radiated RF Signals from PD Activity. In Proceedings of
the IEEE International Instrumentation and Measurement Technology Conference (I2MTC), Montreal, QC, Canada, 1 January2006; pp. 1–6.
34. Robles, G.; Martinez-Tarifa, J.M.; Rojas-Moerno, M.V.; Albarracin, R.; Ardila-Rey, J. Antenna selection and frequency responsestudy for UHF detection of partial discharges. In Proceedings of the IEEE International Instrumentation and MeasurementTechnology Conference (I2MTC), Graz, Austria, 13–16 May 2012; pp. 1–4.
35. Robles, G.; Sanchez-Fernandez, M.; Albarracin, R.; Rojas-Merno, M.V.; Rajo-Iglesias, E.; Martinez-Tarifa, J.M. Antenna Parametriza-tion for the Detection of Partial Discharges. IEEE Trans. Instrum. Meas. 2013, 62, 932–941. [CrossRef]
36. Weiner, M.M. Monopole Antennas, 1st ed.; Marcel Dekker, Inc.: New York, NY, USA, 2003.37. Albarracin, R.; Ardila-Rey, J.A.; Mas’ud, A.A. On the Use of Monopole Antennas for Determining the Effect of the Enclosure of a
Power Transformer Tank in Partial Discharges Electromagnetic Propagation. Sensors 2016, 16, 148. [CrossRef] [PubMed]38. Jaber, A.; Lazaridis, P.; Saeed, B.; Zhang, Y.; Khan, U.; Upton, D.; Ahmed, H.; Mather, P.; Vieira, M.F.Q.; Atkinson, R.; et al.
Frequency Spectrum Analysis of Radiated Partial Discharge Signals. In Proceedings of the IET European ElectromagneticsSymposium (EUROOEM), London, UK, 11–14 July 2016; pp. 1–2.
39. Yao, R.; Zhang, Y.; Si, G.; Yuan, Y.; Xie, Q. Measurement and Analysis of Partial Discharge on Floating Electrode Defect in GIS.In Proceedings of the IEEE International Conference on High Voltage Engineering and Application (ICHVE), Chengdu, China,19–22 September 2016; pp. 1–4.
40. Jaber, A.; Lazaridis, P.; Saeed, B.; Mather, P.; Vieira, M.F.Q.; Atkinson, R.; Tachtatzis, C.; Iorkyase, E.; Judd, M.; Glover, I.A.Diagnostic Potential of Free-Space Radiometric Partial Discharge Measurements. In Proceedings of the URSI General Assemblyand Scientific Symposium (GASS), Montreal, QC, Canada, 19–26 August 2017; pp. 1–4.
41. Bensky, A. Wireless Positioning Technologies and Applications, 2nd ed.; Artech House: Norwood, MA, USA, 2016.42. Yu, K.; Sharp, I.; Guo, Y.J. Ground-Based Wireless Positioning, 1st ed.; Wiley/IEEE: Chichester, UK, 2009.43. Nakashima, H.; Aghajan, H.; Augusto, J.C. Handbook of Ambient Intelligence and Smart Environments, 1st ed.; Springer: New York,
NY, USA, 2010.44. Liu, Y.; Yang, Z.; Wang, X.; Jian, L. Location, Localization, and Localizability. J. Comput. Sci. Technol. 2010, 25, 274–297. [CrossRef]45. Sinaga, H.H.; Phung, B.T.; Blackburn, T.R. Partial Discharge Localization in Transformers Using UHF Detection Method. Trans.
Dielectr. Electr. Insul. 2012, 19, 1891–1900. [CrossRef]46. Tian, Y.; Qi, B.; Zhuo, R.; Fu, M.; Li, C. Locating partial discharge source occurring on transformer bushing by using the improved
TDOA method. In Proceedings of the International Conference on Condition Monitoring and Diagnosis (CMD), Xi’ian, China,25–28 September 2016; pp. 144–147.
47. Judd, M.D. Radiometric Partial Discharge Detection. In Proceedings of the International Conference on Condition Monitoringand Diagnosis (CMD), Beijing, China, 21–24 April 2008; pp. 1–6.
48. Portugues, I.E.; Moore, P.J.; Glover, I.A.; Johnstone, C.; McKosty, R.H.; Goff, M.B.; van der Zel, L. RF-Based Partial DischargeEarly Warning System for Air-Insulated Substations. Trans. Dielectr. Electr. Insul. 2009, 24, 20–29.
49. Zhu, M.X.; Wang, Y.B.; Li, Y.; Mu, H.B.; Deng, J.B.; Shao, X.J.; Zhang, G.J. Detection and Localization of Partial Dischargein Air-Insulated Substations using UHF Antenna Array. In Proceedings of the IEEE Conference on Power Engineering andRenewable Energy (ICPERE), Yogyakarta, Indonesia, 29–30 November 2016; pp. 221–224.

Sensors 2021, 21, 909 20 of 21
50. Zhu, M.X.; Wang, Y.B.; Liu, Q.; Zhang, J.N.; Deng, J.B.; Zhang, G.J.; Shao, X.J.; He, W.L. Localization of Multiple PartialDischarge Sources in Air-Insulated Substation using Probability-Based Algorithm. IEEE Trans. Dielectr. Electr. Insul. 2017, 24,157–166. [CrossRef]
51. Li, P.; Zhou, W.; Yang, S.; Liu, Y.; Tian, Y.; Wang, Y. Method for Partial Discharge Localization in Air-Insulated Substations. Iet Sci.Meas. Technol. 2017, 11, 331–338.
52. Buchanan, W.J. The Handbook of Data Communications and Networks, 2nd ed.; Springer: Dordrecht, The Netherlands, 2004.53. Robles, G.; Fresno, J.M.; Sanchez-Fernandez, M.; Martinex-Tarifa, J.M. Antenna Deployment for the Localization of Partial
Discharges in Open-Air Substations. Sensors 2016, 16, 541. [CrossRef]54. Moore, P.J.; Portugues, I.E.; Glover, I.A. Radiometric Location of Partial Discharge Sources on Energized High-Voltage Plant.
IEEE Trans. Power Deliv. 2005, 20, 2264–2272. [CrossRef]55. Robles, G.; Fresno, J.M.; Martinex-Tarifa, J.M. Separation of Radio-Frequency Sources and Localization of Partial Discharges in
Noisy Environments. Sensors 2015, 15, 9882–9898. [CrossRef] [PubMed]56. De Souza Neto, J.M.R.; de Macedo, E.C.T.; da Rocha Neto, J.S.; Glover, I.A.; Judd, M.D.; Atkinson, R.; Soraghan, J. Plausability of
Incoherent Detection for Radiometric Monitoring of Insulation Integrity in HV Substations. In Proceedings of the LoughboroughAntennas & Propagation Conference, Loughborough, UK, 11–12 November 2013; pp. 494–499.
57. Karl, H.; Willig, A. The Handbook of Data Communications and Networks, 1st ed.; Wiley: Hoboken, NJ, USA, 2007.58. Zekavat, R.; Buehrer, R.M. Handbook of Position Location: Theory, Practice and Advances, 1st ed.; Wiley/IEEE Press: Hoboken, NJ,
USA, 2012.59. Baker, P.C.; Judd, M.D.; McArthur, S.D.J. A Frequency-Based RF Partial Discharge Detector for Low-Power Wireless Sensing.
IEEE Trans. Dielectr. Electr. Insul. 2010, 17, 133–140.60. Baker, P.C.; Stephen, B.; JUdd, M.D. Compositional Modeling of Partial Discharge Pulse Spectral Characteristics. Trans. Instrum.
Meas. 2013, 62, 1909–1916. [CrossRef]61. Reid, A.J.; Judd, M.D.; Fouracre, R.A.; Stewart, B.G.; Hepburn, B.M. Simultaneous measurement of partial discharge using
IEC60270 and radio-frequency techniques. Trans. Dielectr. Electr. Insul. 2011, 18, 444–455. [CrossRef]62. Reid, A.J.; Judd, M.D.; Stewart, B.G.; Fouracre, R.A.; Venkatesan, S. Correlation between RF energy and IEC60270 apparent
charge for selected partial discharge source geometries. In Proceedings of the 15th International Symposium on High VoltageEngineering, Ljubljana, Slovenia, 27–31 August 2007; p. T7-531.
63. Reid, A.J.; Judd, M.D.; Stewart, B.G.; Fouracre, R.A. Comparing IEC60270 and RF partial discharge patterns. In Proceedings ofthe International Conference on Condition Monitoring and Diagnosis (CMD), Beijing, China, 21–24 April 2008; pp. 89–92.
64. Reid, A.J.; Judd, M.D.; Duncan, G. Simultaneous Measurement of Partial Discharge using TEV, IEC60270 and UHF Techniques. InProceedings of the IEEE Symposium on Electrical Insulation (ISEI), San Juan, PR, USA, 10–13 June 2012; pp. 439–442.
65. Iorkyase, E.T.; Tachtatzis, C.; Atkinson, R.C.; Glover, I.A. Localization of Partial Discharge Sources using Radio FingerprintingTechnique. In Proceedings of the Loughborough Antennas and Propagation Conference (LAPC), Loughborough, UK, 2–3November 2015; pp. 1–5.
66. Zhang, W.; Bi, K.; Li, Z.; Luo, L.; Sheng, G.; Jiang, X. RSSI Fingerprinting-based UHF Partial Discharge Localization Technology.In Proceedings of the IEEE PES Asia-Pacific Power and Energy Engineering Conference (APPEEC), Xi’ian, China, 25–28 October2016; pp. 1364–1367.
67. Sarkar, B.; Koley, C.; Roy, N.K.; Kumbhakar, P. Low-Cost RF Sensor for Partial Discharge Detection of High Voltage Apparatus. InProceedings of the IEEE International Conference on Condition Assessment Techniques in Electrical Systems, Kolkata, India, 6–8December 2013; pp. 259–264.
68. Luo, Y.; Li, Z.; Wang, H. A Review of Online Partial Discharge Measurement of Large Generators. Energies 2017, 10, 1694. [CrossRef]69. Huang, W.; Zhang, C.; Dong, M.; Zhou, J. Research on Partial Discharge Monitoring System of Switchgear Based on Wireless
Distributed TEV Sensors. In Proceedings of the 1st International Conference on Electrical Materials and Power Equipment(ICEMPE), Xi’ian, China, 14–17 May 2017; pp. 647–650.
70. Neto, J.M.R.D.S.; Neto, J.S.D.R.; Macedo, E.C.T.; Glover, I.A.; Judd, M.D. An envelope detector as a trading cost techniquefor radiometric partial discharge detection. In Proceedings of the IEEE Int’l Instrumentation and Measurement TechnologyConference (I2MTC), Montevideo, Uruguay, 12–15 May 2014; pp. 1584–1589.
71. Baker, P.C.; Stephen, B.; Judd, M.D.; McArthur, S.D.J. Development of an Integrated Low-Power RF Partial Discharge Detector. InProceedings of the IEEE Electrical Insulation Conference (EIC), Montreal, QC, Canada, 31 May–3 June 2009; pp. 273–277.
72. De Souza Neto, J.M.R.; de Macedo, E.C.T.; da Rocha Neto, J.S.; da Costa, E.G.; Bhatti, S.A.; Glover, I.A. Partial Discharge Locationusing Unsynchronized Radiometer Network for Condition Monitoring in HV Substations–A Proposed Approach. J. Phys. Conf.Ser. 2012, 361, 1–11. [CrossRef]
73. Vedral, J.; Kriz, M. Signal Processing in Partial Discharge Measurement. Metrol. Meas. Syst. 2010, 17, 55–64. [CrossRef]74. Upton, D.W.; Haigh, R.P.; Mather, P.J.; Lazaridis, P.I.; Mistry, K.K.; Zaharis, Z.D.; Tachtatzis, C.; Atkinson, R.C. Gated Pipelined
Folding ADC-Based Low Power Sensor for Large-Scale Radiometric Partial Discharge Monitoring. IEEE Sens. J. 2020, 20,7826–7836. [CrossRef]
75. Khan, U.F.; Lazaridis, P.I.; Mohamed, H.; Albarracín, R.; Zaharis, Z.D.; Atkinson, R.C.; Tachtatzis, C.; Glover, I.A. An Effi-cient Algorithm for Partial Discharge Localization in High-Voltage Systems Using Received Signal Strength. Sensors 2018, 18,4000. [CrossRef]

Sensors 2021, 21, 909 21 of 21
76. Mohamed, H.; Lazaridis, P.; Mather, P.; Tachtatzis, C.; Judd, M.; Atkinson, R.; Glover, I.A. Partial Discharge Detection andLocalization: Using Software-Defined Radio. Ind. Electron. Mag. 2019, 13, 77–85. [CrossRef]
77. Upton, D.W.; Saeed, B.I.; Mather, P.J.; Lazaridis, P.I.; Vieira, M.F.Q.; Atkinson, R.C.; Tachtatzis, C.; Garcia, M.S.; Judd, M.D.;Glover, I.A. Wireless Sensor Network for Radiometric Detection and Assessment of Partial Discharge in High-Voltage Equipment.Radio Sci. 2018, 53, 357–364. [CrossRef]
78. Upton, D.W.; Saeed, B.I.; Mather, P.J.; Sibley, M.J.N.; Lazaridis, P.I.; Mistry, K.K.; Glover, I.A.; Filho, F.T.; Tachtatzis, C.;Atkinson, R.C.; et al. Low power radiometric partial discharge sensor using composite transistor-reset integrator. Trans. Dielectr.Electr. Insul. 2018, 25, 984–992. [CrossRef]