A relational approach to knowledge spillovers in biotech. Network structures as drivers of...
21
http://econ.geo.uu.nl/peeg/peeg.html Papers in Evolutionary Economic Geography # 11.20 A relational approach to knowledge spillovers in biotech. Network structures as drivers of inter-organizational citation patterns Ron Boschma, Pierre-Alexandre Balland and Dieter Kogler
Transcript of A relational approach to knowledge spillovers in biotech. Network structures as drivers of...

http://econ.geo.uu.nl/peeg/peeg.html
Papers in Evolutionary Economic Geography
# 11.20
A relational approach to knowledge spillovers in biotech.
Network structures as drivers of inter-organizational citation patterns
Ron Boschma, Pierre-Alexandre Balland and Dieter Kogler
1
A relational approach to knowledge spillovers in biotech.
Network structures as drivers of inter-organizational citation patterns
Ron Boschma, Pierre-Alexandre Balland and Dieter Kogler
Abstract
In this paper, we analyze the geography of knowledge spillovers in biotech by investigating the way
in which knowledge ties are organized. Following a relational account on knowledge spillovers, we
depict knowledge networks as complex evolving structures that build on pre-existing knowledge and
previously formed ties. In economic geography, there is still little understanding of how structural
network forces (like preferential attachment and closure) shape the structure and formation of
knowledge spillover networks in space. Our study investigates the knowledge spillover networks of
biotech firms by means of inter-organizational citation patterns based on USPTO biotech patents in
the years 2008-2010. Using a Stochastic Actor-Oriented Model (SAOM), we explain the driving forces
behind the decision of actors to cite patents produced by other actors. Doing so, we address directly
the endogenous forces of knowledge dynamics.
Key words: knowledge spillovers, network structure, patent citations, biotech, proximity
1. Introduction
Since the 1990s, economic geographers have embarked on the study of the geography of knowledge
spillovers. Not only did they show that geographical distance forms a real barrier to knowledge
spillovers (Jaffe et al., 1993; Feldman 1994; Acs et al., 2002), they also observed a high degree of
spatial concentration of Research and Development (R&D) spending and patenting in a small number
of regions (Storper, 1992; Acs et al., 1994; Audretsch and Feldman, 1996; Caniels, 2000; Cantwell and
Santangelo, 2002). These studies often relied on patent citations as a proxy for knowledge flows and
used information on the geography of citing patents and cited patents to determine the geography
of knowledge spillovers. What they demonstrated is that knowledge spillovers are often
geographically localized, and that place matters for knowledge production and knowledge exchange.
Network studies have demonstrated that knowledge networks are not randomly structured
but highly skewed, that is, some nodes are highly connected, while other nodes are not (Ozman,
2009). This might be attributed to geographical proximity as a potential driver of network formation,
but not necessarily, as there might be other network drivers involved (Breschi and Lissoni, 2003).
Only recently, economic geographers have started to conduct network studies on knowledge
spillovers by investigating the geography of inventor networks and collaborative research projects
(Breschi and Lissoni, 2003; Balconi et al., 2004; Ejermo and Karlsson 2006; Gluckler, 2007; Ponds et
al., 2007; Maggioni et al., 2007; Hoekman et al., 2009; Boschma and Frenken, 2010). In this respect,
networks are conceptualized as ‘space of flows’ (Castells, 1996) and perceived as important vehicles
of knowledge transfer and diffusion (Ter Wal and Boschma, 2009).
In this chapter, we analyze the geography of knowledge spillovers by investigating the way in
which knowledge ties are organized. Following a relational account of knowledge spillovers, we
depict knowledge networks as complex evolving structures that build on pre-existing knowledge and

2
ties. In doing so, we describe knowledge spillovers as complex and dynamic relational structures that
contain important features of knowledge production and diffusion. In economic geography, there is
still little understanding of how the structure of knowledge networks are formed over time, and how
the current network structure impacts on future network states. The objective of this book chapter is
to explain the dynamics of inter-organizational knowledge spillovers, i.e. we aim to explain the
driving forces behind the decision of actors to cite patents produced by other actors. In particular, we
address directly the endogenous forces of knowledge dynamics, because we claim that the particular
structure of knowledge ties provide unequal positions in terms of opportunities, cost and risks. Our
study investigates the knowledge spillover networks of biotech firms by means of inter-
organizational citation patterns based on USPTO biotech patents in the years 2008-2010.
The structure of the book chapter is as follows. Section 2 briefly discusses the theoretical
background. Section 3 explains the biotech patent database. Section 4 will introduce the statistical
modeling of the knowledge network. Section 5 presents the main variables and Section 6 sets out the
main findings. Section 7 concludes.
2. Spatial networks of knowledge spillovers
In economic geography, the study of the geography of knowledge spillovers took off in the 1990s.
There were very good reasons to expect that geographical distance acts as a barrier to knowledge
spillovers, due to the tacit and complex nature of knowledge that requires face-to-face interaction
(Storper, 1992). This expectation has been confirmed in many empirical studies that used patent
citations as a proxy for knowledge flows (e.g. Jaffe et al., 1993; Feldman 1994; Audretsch and
Feldman, 1996; Caniels, 2000; Acs et al., 2002). In addition, studies often found high correlations
between inputs to knowledge (like R&D) and output to technical knowledge (such as patent
intensity) to explain the geography of innovation. These studies demonstrated that knowledge
spillovers are often geographically bounded, and what mattered for knowledge exchange and
innovation is the space of place (Castells, 1996).
However, these studies did not analyze knowledge spillovers from a network perspective.
Networks studies observe again and again that knowledge networks are not randomly structured but
very biased (Newman, 2003; Ozman, 2009), just like knowledge spillovers are geographically biased.
With structure, we mean that the set of links between nodes in a network is very different from the
properties of a random network, i.e. the properties one obtains by randomly connecting nodes to
create a network structure. In reality, the degree distribution of nodes in networks is skewed almost
by rule: few nodes have a high degree while many nodes have a low degree, meaning that some
nodes are more popular to link with than other nodes. In addition, clustering is a very significant
feature of networks, meaning that friends of friends are often friends with one another, and some
nodes are so much more than other nodes. This implies that networks are not random but structured
or organized, and therefore require a full explanation (Boschma and Frenken, 2010).
Preferential attachment can provide an explanation for differences in the degree of nodes. The
process of preferential attachment describes the growth of a network in which the probability that a
new node will link to a certain other node is proportional to the number of links this nodes (that is,
its degree) already has (Barabasi and Albert, 1999). As a result, central nodes tend to become more
central, whereas peripherally positioned nodes stay peripheral (Orsenigo et al., 1998; Powell et al.,
2005). This mechanism reflects the benefits of linking to nodes with high degree as such ‘hubs’
provide new nodes with short pathways to many other nodes in the network. Closure can explain
clustering of nodes in networks. In this case, new network relations follow from existing relations as
two actors are introduced to one another by a third actor which whom both already have a relation.

3
The reason for the establishment of such triangle relationships is that each actor can be informed by
the common third party about the other in terms of its trustworthiness and the knowledge it
possesses, and once the relationship is established, the two partners have less incentive to behave
opportunistically as they may jeopardize their relation with the third actor. Ter Wal (2011) found in a
study on the evolution of co-inventor networks that closure is particularly relevant as a mechanism
of network formation in exploitation rather than exploration contexts.
However, there might be limits to the number of network relations a node can meaningfully
maintain, as is the case of inter-firm networks (Holme et al., 2004). This implies that well-connected
nodes will often not be responsive to proposals for networking and will select only the most
beneficial partners (cf. Giuliani 2007). In addition, there is a tendency of new nodes to connect to
nodes with lower degree when these are more proximate or similar to them in a number of
dimensions (Boschma and Frenken, 2010). Geographical proximity might be a crucial driver here, as a
node may opt to collaborate locally to save on travel time and transportation costs, and to
circumvent linguistic and cultural barriers. In that case, firms will connect not necessarily with the
most central firms that are located in other regions, but will connect to those that are close by in a
geographical sense (Guimera and Amaral 2004). But there may be other forms of proximity that bias
the partnering choice to similar firms. Breschi and Lissoni (2003) argued that it is not geographical
proximity itself that causes knowledge spillovers to be geographically bounded. Instead, it is the
underlying social networks of inventors and the mobility of inventors across firms that tend to be
geographically localized and in turn cause knowledge spillovers to have a limited geographical reach.
Firms also tend to select partners that are cognitively similar. Cognitive proximity favours
collaboration between agents because absorptive capacity is needed to communicate and to
interpret and exploit the knowledge that is exchanged (Cohen and Levinthal 1990). That is, their own
cognitive bases should be close enough in order to understand and absorb each other’s knowledge
(Breschi and Lissoni 2006; Nooteboom et al. 2007).
Nevertheless, it is not necessarily true that all forms of proximity may matter equally in
partnering decisions. Proximity dimensions in knowledge networks may actually be substitutes rather
than complements (Boschma, 2005). Singh (2005) found evidence that geographical proximity is
especially important in the establishment of interdisciplinary research collaboration (when cognitive
proximity is low), while inventors working in the same field (high cognitive proximity) collaborate on
average over longer geographical distances. Agrawal et al. (2006) found that knowledge is
transferred between firms in different locations (so geographical proximity is low) by employees that
are socially linked due to a shared past, like a common working experience. Breschi et al. (2009)
found similar results when analyzing the social networks of US inventors who are mobile in space.
A drawback of the knowledge spillovers literature in economic geography is that they did not
analyze knowledge spillovers from such a network perspective until very recently. Breschi and Lissoni
(2003) were among the first to use patent data as true relational data. Economic geographers have
started to conduct spatial network studies on knowledge spillovers by investigating inventor
networks and collaborative research projects (Ejermo and Karlsson 2006; Ponds et al. 2007; Maggioni
et al. 2007; Hoekman et al. 2009). Only a few of these network studies have applied the proximity
framework, and there is still little understanding of what role cognitive capabilities of agents,
geographical proximity and social connectedness play in the spatial formation of knowledge
networks. Moreover, as far as we know, no study has accounted for structural network forces (like
preferential attachment and closure) that shape the formation of knowledge networks, with two
exceptions (Balland et al. 2011; Ter Wal 2011). These structural forces account for the self-
reproducing, path-dependent process behind knowledge dynamics, i.e. that knowledge production
builds on pre-existing knowledge and previously formed ties. These structural patterns of knowledge

4
spillovers are often left unconsidered in statistical models of knowledge spillovers. In this chapter, we
incorporate these structural forces and the various proximity dimensions to explain the structure of
the knowledge spillover network of biotech firms.
3. The biotech patent database
The biotechnology sector makes extensive use of patent protection (Kortum and Lerner, 1999).
Essentially, if a firm or individual believes that a biotech invention has potential economic value,
there is a high probability that they will seek intellectual property protection in form of a patent.
Most attractive in this context is to file for a patent in the largest economic markets like the United
States (Niosi and Bas, 2001). Thus, one could argue that an analysis based on United States Patent
and Trademark Office (USPTO) patent data, which is utilized in the present study, is potentially
representative of the worldwide stock of knowledge in a particular technology sector in which it is
customary to patent. Furthermore, patent data provide a wealth of information regarding the
individual inventors and assignees, as well as references to prior art, i.e. citations to previous patents,
that were instrumental in the development of a new invention. Thus patent data provide an
excellent opportunity to investigate the networks of knowledge spillovers of biotech firms, based on
inter-organizational citation patterns (Gittelman and Kogut, 2003).
All patent data utilized in this study originally are from the United States Patent and Trademark
Office (USPTO). Several publicly available patent datasets as well as supplementary data were used
to derive the various measures that are employed in our model. These include the “Patent Network
Dataverse” at the Institute for Quantitative Social Science at Harvard University (Lai et al., 2011), the
NBER Patent and Citations Data (Hall et al., 2001) and the USPTO harmonization of names of
organizations data file (USPTO, 2010).
The initial sample of USPTO biotech patents granted in the years 2008, 2009 and 2010 was selected
according to the USPTO’s definition of biotechnology based on U.S. Patent Classes, i.e. primary and
sub-class (USPTO, 2002) 1
. We identified 1,081 organizations that were awarded at least three
patents over the 3-year time period, i.e. one patent per year on average, in order to formalize our
network dimensions. Patents assigned to individuals rather than organizations, which represent a
very small fraction of total biotech patents granted, were excluded from the analysis. This selection
procedure resulted in the inclusion of about 13,000 patents, which represent over 75% of all USPTO
biotech patents awarded in the 3-year time period analyzed.
Subsequently, we identified all citation linkages between these organizations based on the generated
sample of network patents and their respective assignees, i.e. the organizations listed as assignee on
the actual patent document. This allowed for the construction of annual citation matrices between
the 1,081 organizations in the sample, which essentially indicate the occurrence of knowledge
spillovers between each pair of firms. Over 90,000 individual citations are accounted for in the three
matrices that indicate knowledge spillovers between the organizations of interest.
4. Statistical modelling of knowledge structures
1 This specific definition of biotechnology has been previously used in other studies (Johnson, 2009; Lee, 2010),
and includes the following U.S. Patent Classes (primary and sub-classes): 47/1.1-47/1.4, 47/57.6-47758,
424/9.1-424/9.2, 424/9.34-424/9.81, 424/85.1-424/94.67, 424/130.1-424/283.1, 424/520-424/583,
424/800-424/832, 435/1.1-435/7.95, 435/40.5-435/261, 435/317.1-435/975, 436/500-436/829, 514/2-514/22,
514/44, 514/783, 530/300-530/427, 530/800-530/868, 536/1.11-536/23.74, 536/25.1-536/25.2, 800, 930, 935.

5
Our objective is to explain the dynamics of inter-organizational knowledge spillovers, i.e. we want to
explain the driving forces behind the decision of actors to cite patents produced by other actors.
Moreover, we want to address directly the endogenous forces of knowledge dynamics, because the
particular organization of knowledge ties provides unequal positions in terms of opportunities, cost
and risks. Therefore, we are interested in modelling explicitly the complex interdependencies
between organizations, which raises a set of econometrical issues.
A fundamental characteristic of structures of relationships is the existence of conditional
dependencies between observations, i.e. the interdependencies between the set of pairs of actors
that can be potentially linked. A first kind of interdependency is that dyads (pairs of actors) that have
one actor in common cannot be assumed to be statistically independent. Such structural
dependencies violate standard statistical procedures in generalized linear modeling that assume
independence among observations. In this case, however, one can correct for this problem by
introducing actor level or dyadic level fixed effects (Mizruchi and Marquis 2005). But in case of more
complex interdependencies (like indirect relationships), the resulting correlation between
observations can lead to unreliable estimations of parameter coefficients and standard errors
(Steglich et al., 2010). A crucial point is that the structure of knowledge spillovers contains a lot of
information in terms of hierarchy, cohesive sub-groups of actors and relational positioning of
organizations that should not be left out in a study that investigates patent citations.
To model knowledge dynamics, we employ a class of statistical network models based on Markov
chain Monte Carlo simulation procedures. This class of model is known as the class of Stochastic
Actor-Oriented Models (SAOM), and they are the most promising class of models allowing for
statistical inference of network dynamics. An introduction to the SAOM can be found in Snijders et
al. (2010), while the mathematical foundation of these models are detailed in Snijders (2001). In
economic geography, there are some very recent applications (Giuliani 2010; Balland 2011; Ter Wal
2011; Balland, de Vaan and Boschma 2011). We use SAOM implemented in the RSiena2 statistical
software (Ripley et al., 2011). In the literature, this class of models is also referred as SIENA models.
The acronym "SIENA" stands for "Simulation Investigation for Empirical Network Analysis".
The basic principle of SAOM is to estimate parameters by simulating the evolution of a particular
network structure from a given starting configuration (the observation of the network structure in t0)
to another given configuration (the observation of the network structure in t1). Therefore, the
dependent variable in SAOM is slightly different than the one employed in conventional
econometrics, since the variable to be explained is the structure resulting from knowledge spillovers
between a set of actors, i.e. the particular way patent citations between actors are organized. In our
study, the dependent variable is more precisely a set of consecutive (yearly) observations of the
architecture of citations that firms decide to make between each other. More formally, these
observations take the form of three successive square (n*n) matrices, and we explain why knowledge
ties are created or maintained between organizations.
Table 1 presents a simple description of the dynamics of knowledge spillovers we model, indicating
the number of ties created, maintained and dissolved from one observation to another3. The ties
2 The RSiena package is implemented in the R language and can be downloaded from the CRAN website:
http://cran.r-project.org/web/packages/RSiena/. In this chapter, we use the RSiena version 1.0.12.167. 3 The Jaccard coefficient indicates the degree of stability of the network structure from one observation to
another (Snijders et al., 2010). Since we decide to set the duration of a tie to one year, the structure is quite

6
between the n actors are represented by dichotomous4 (0/1) and directed linkages, which means
that we are analysing asymmetric adjacency matrices. To give an example, if organization i cites in
the year 2008 one or more patents granted by organization j, then xij (2008) = 1. But if organization j
does not cite any patent from organization i in the year 2008, then xij (2008) = 1 # xji (2008) = 0. The
link is deleted in the next year if ego does not decide in a new patent to cite again organization j.
Obviously, patenting is a necessary condition for the actors to have out-going ties, but they can
receive ties (citations) without patenting during the observed year.
Periods 0 -> 0 0 -> 1 1 -> 0 1 -> 1 Jaccard
2008-2009 1158167 3723 3598 1992 0.214
2009-2010 1157845 3920 3676 2039 0.212
Table 1. Changes in citation ties between observations
The dynamics of the structure of knowledge spillovers is modelled on the basis of several principles
and assumptions. These assumptions are related to the modelling procedure, since the evolution of
the structure of patent citations is modelled as a Markov chain. It implies that change probability
only depends on the current state of the network (t) and not on its past configurations (t-1). The
second principle is related to the idea of non-simultaneity of events. Time runs continuously between
observations, and actors can only make one citation at a time. Three actors can only be connected as
a result of a sequence of citations between the three pairs of actors. Finally, the observed network
dynamics is supposed to be the result of the decisions of actors. Such relational choices are based on
their preferences, constraints, costs or opportunities. It is assumed that organizations are actors that
have the ability to elaborate on their own strategic decisions. It should be noted that these
assumptions would be less realistic in the case of citations between patents directly, since patents
are not actors with an own strategy.
A key principle of the model is that the dynamics of knowledge spillovers is driven by micro-level
decision of actors to cite patents invented by others, which in turn will form an aggregated
knowledge structure. Given that an actor i has the opportunity to make a relational change
(determined stochastically), the choice for this actor is to change one of the tie variablesji
x , which
will lead to a new state )(, 0xCxx ∈ . A traditional logistic regression is used to model choice
probabilities (Snijders et al. 2010):
{ )(tXP changes to x | i has a change opportunity at time }0)(, xtXt =
( )( )∑ ∈
==)('
0
00
0 ),,',(exp
),,,(exp),,,(
xCx i
ii
wvxxf
wvxxfwvxxp
When actors have the opportunity to change their relations, the objective function describes
preferences, opportunities, or constraints of actors, for instance to cite patents developed by
organizations from the same technological class, or from the same spatial area. Patent citations
dynamic and therefore the Jaccard coefficient is a bit low, but it does not affect the convergence of the
algorithm. 4 The current implementation of RSiena does not allow to analyze easily weighted, i.e. valued networks.

7
choices are determined by a linear combination of effects, depending on the current state (x0), the
potential new state (x), individual attributes5 (v) and proximity (w):
As detailed in Snijders (2001), the estimation of the different parameters of the objective
function is achieved by an iterative Markov chain Monte Carlo algorithm based on the method of
moments. The stochastic approximation algorithm simulates the evolution of the network and
estimates the parameters that minimize the deviation between observed and simulated
networks. The specification of the objective function used in the empirical section is described
below.
5. Model specification: structural and non-structural variables
Figure 1 indicates the cumulative degree distribution of organizations over the period 2008-20106.
We can observe a typical statistical signature of knowledge structure, i.e. the fact that very few
actors are active players, while most of the actors make or receive very few citations. This structural
characteristic is known as the scale free distribution in statistical physics (Barabási and Albert 1999),
and it indicates the hierarchical nature of relational structures. Interestingly, we can observe that the
shape of the citations received (in-degree) is even more hierarchical than the shape of the citations
made (out-degree). It suggests that the production of successful patents (that will be highly cited) is
more unequal than the production of patents.
Figure 1. Degree distribution (2007-2010)
To have a better idea of the centrality of the biggest players in the structure of knowledge spillovers
in biotech, Table 2 indicates the top 20 companies in terms of in-degree and out-degree. This ranking
5 Individual and proximity variables are centered around the mean.
6 We aggregate the structure of knowledge spillovers in 2008, 2009 and 2010.
8
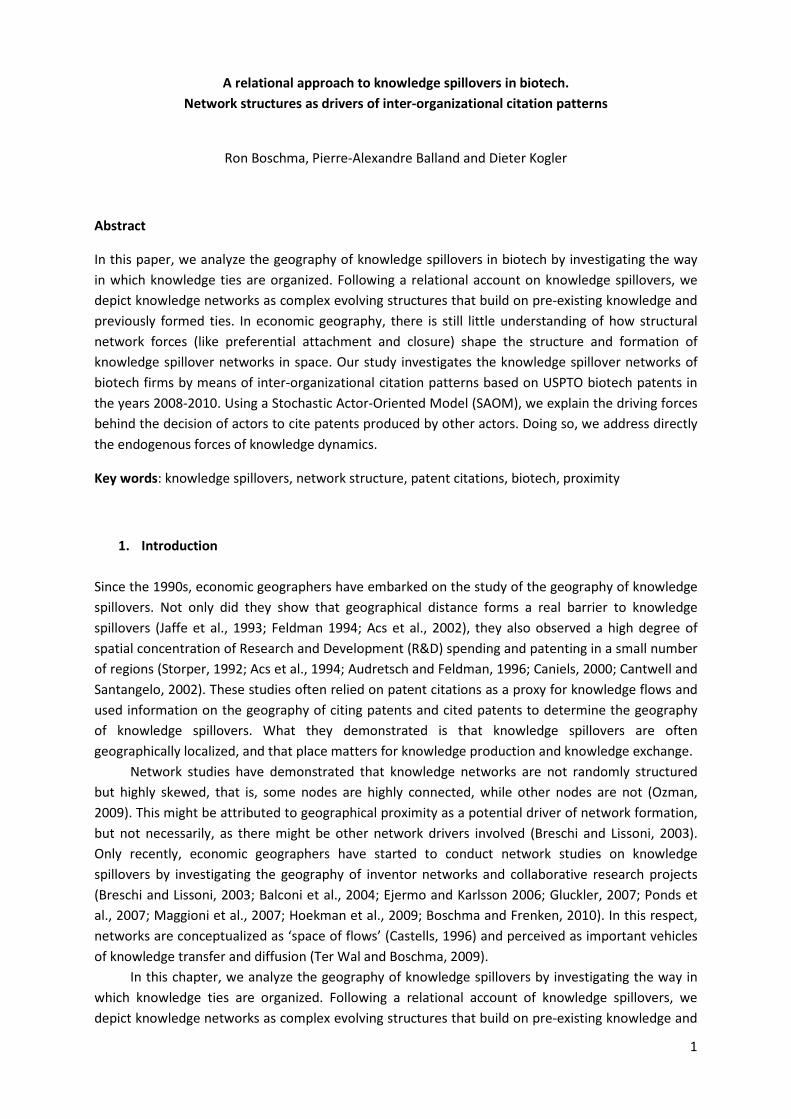
confirms the influential role of universities in biotechnology (Zucker et al., 1998; Zucker et al., 2002).
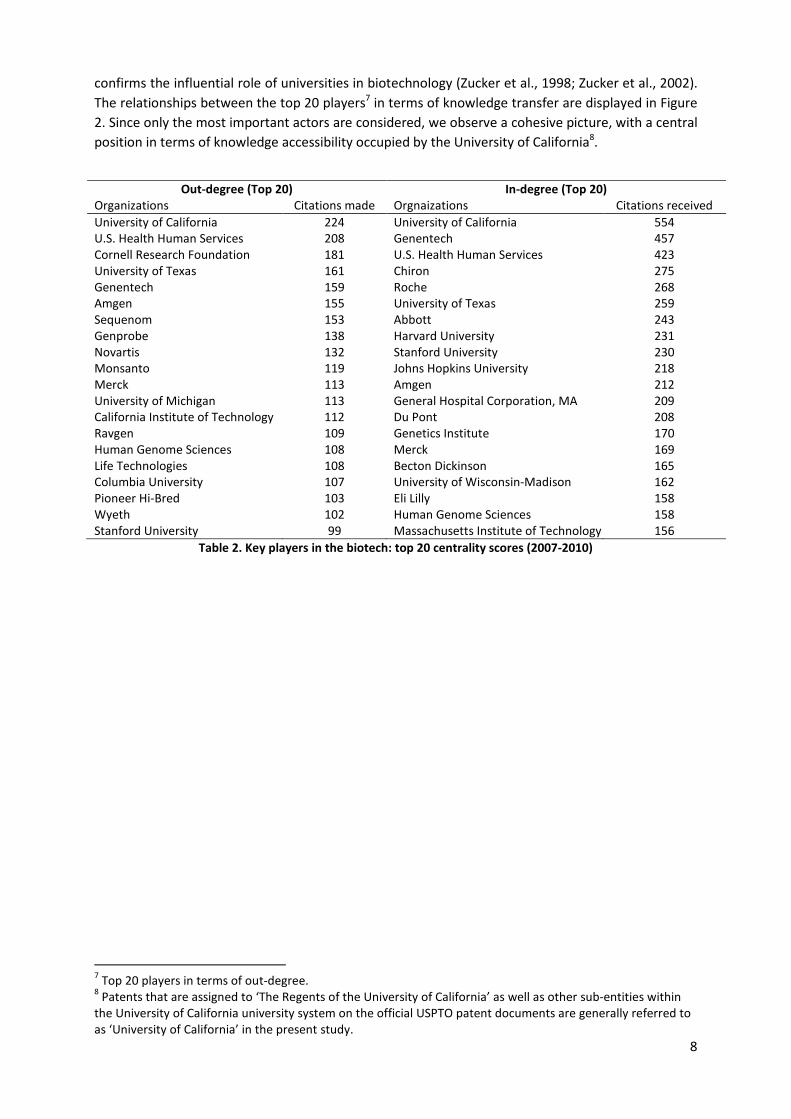
The relationships between the top 20 players7 in terms of knowledge transfer are displayed in Figure
2. Since only the most important actors are considered, we observe a cohesive picture, with a central
position in terms of knowledge accessibility occupied by the University of California8.
Out-degree (Top 20) In-degree (Top 20)
Organizations Citations made Orgnaizations Citations received
University of California 224 University of California 554
U.S. Health Human Services 208 Genentech 457
Cornell Research Foundation 181 U.S. Health Human Services 423
University of Texas 161 Chiron 275
Genentech 159 Roche 268
Amgen 155 University of Texas 259
Sequenom 153 Abbott 243
Genprobe 138 Harvard University 231
Novartis 132 Stanford University 230
Monsanto 119 Johns Hopkins University 218
Merck 113 Amgen 212
University of Michigan 113 General Hospital Corporation, MA 209
California Institute of Technology 112 Du Pont 208
Ravgen 109 Genetics Institute 170
Human Genome Sciences 108 Merck 169
Life Technologies 108 Becton Dickinson 165
Columbia University 107 University of Wisconsin-Madison 162
Pioneer Hi-Bred 103 Eli Lilly 158
Wyeth 102 Human Genome Sciences 158
Stanford University 99 Massachusetts Institute of Technology 156
Table 2. Key players in the biotech: top 20 centrality scores (2007-2010)
7 Top 20 players in terms of out-degree.
8 Patents that are assigned to ‘The Regents of the University of California’ as well as other sub-entities within
the University of California university system on the official USPTO patent documents are generally referred to
as ‘University of California’ in the present study.
9
Figure 2. Knowledge exchanges between the top 20 actors (2007-2010)
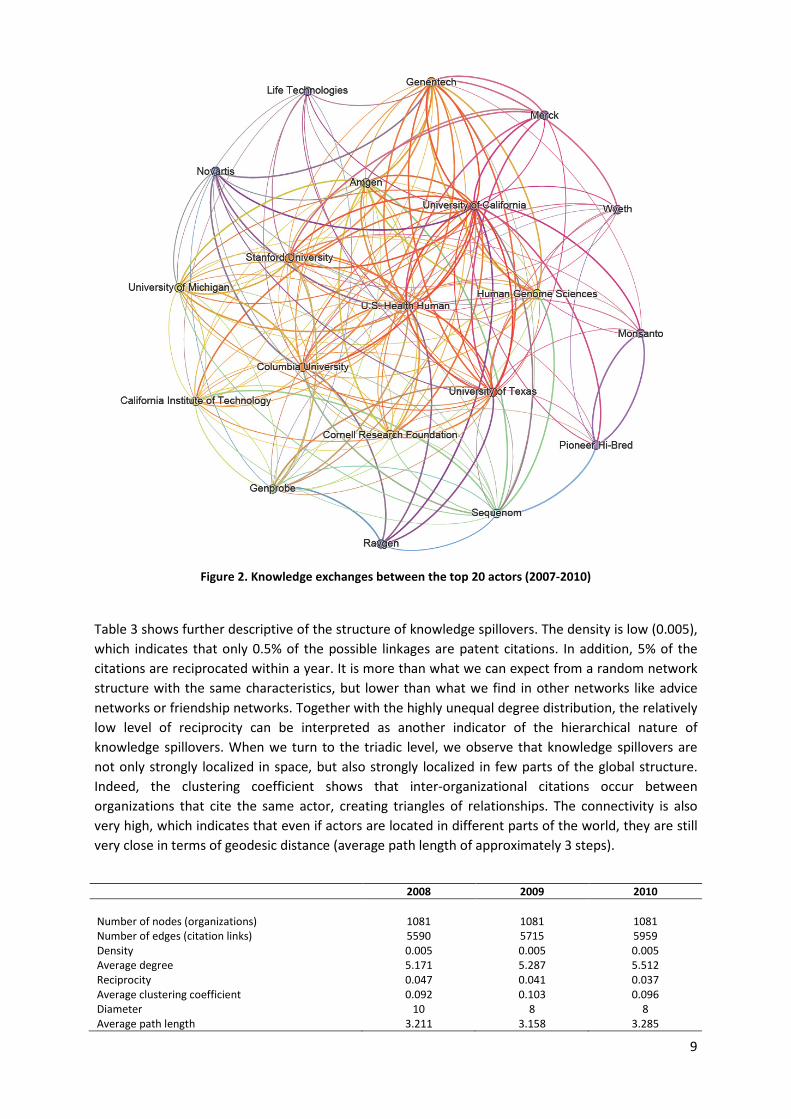
Table 3 shows further descriptive of the structure of knowledge spillovers. The density is low (0.005),
which indicates that only 0.5% of the possible linkages are patent citations. In addition, 5% of the
citations are reciprocated within a year. It is more than what we can expect from a random network
structure with the same characteristics, but lower than what we find in other networks like advice
networks or friendship networks. Together with the highly unequal degree distribution, the relatively
low level of reciprocity can be interpreted as another indicator of the hierarchical nature of
knowledge spillovers. When we turn to the triadic level, we observe that knowledge spillovers are
not only strongly localized in space, but also strongly localized in few parts of the global structure.
Indeed, the clustering coefficient shows that inter-organizational citations occur between
organizations that cite the same actor, creating triangles of relationships. The connectivity is also
very high, which indicates that even if actors are located in different parts of the world, they are still
very close in terms of geodesic distance (average path length of approximately 3 steps).
2008 2009 2010
Number of nodes (organizations) 1081 1081 1081
Number of edges (citation links) 5590 5715 5959
Density 0.005 0.005 0.005
Average degree 5.171 5.287 5.512
Reciprocity 0.047 0.041 0.037
Average clustering coefficient 0.092 0.103 0.096
Diameter 10 8 8
Average path length 3.211 3.158 3.285

10
Table 3. Structural characteristics of knowledge spillovers
These descriptive statistics confirm that the structure of knowledge spillovers contains a lot of
information in terms of non-spatial positioning of actors. Therefore, this structure should be taken
into account in models of knowledge spillovers. The main challenge is to operationalize this global
structure into a set of structural variables at the micro-level, and to model the decision of actors to
cite other actors. Taking into account the observed structural patterns, we model explicitly the
following structural variables using SAOM: density, transitivity, cyclicity and preferential attachment.
Structural variables
The structural variables accounting for the structural patterns of knowledge spillovers are described
below. All are represented visually in table 4 to facilitate their interpretation.
Name Visual representation
Reciprocity
Transitivity
Cyclicity
Preferential
attachment
Note: The dashed arrows represent the expected link if the corresponding structural
effect is positive
Table 4. Structural variables

11
Density. This variable can be interpreted as the constant term in regression analysis. It is a structural
determinant that indicates the general tendency of organizations to cite patents granted by others.
As specified by Snijders et al. (2010), this variable should always be included in SAOM to control for
the general likelihood of ties to appear. Density is measured by the out-degree of organizations:
∑= j iji xD
Reciprocity. Reciprocity is a relevant variable for the dynamics of directed knowledge spillovers. It
indicates the general tendency of actors to cite patents of organizations that also cites their patents.
Reciprocity is based on the counts of the number of reciprocal citations of actor i: ∑= j jiiji xxR .
Transitivity. We also control for the effect of transitivity which leads to triadic network closure. A
positive effect indicates that actor i and actor h are more likely to cite each other if they both already
cite actor j. Although transitivity can be measured in several ways, the most common is based on the
counts of number of transitive triplets, i.e. the number of times an actor i is tied with two actors that
cites each other (Ripley et al., 2011): ∑= hj jhihiji xxxT,
Cyclicity. Transitivity refers to local clustering of actors, but it does not account for the direction of
linkages. Knowledge spillovers can be transferred as a cycle, from actor i citing actor j, then actor h
citing actor i, and then actor j citing actor h. Such a cyclic process of knowledge spillovers would
indicate a non-hierarchical structure, and a collaborative way of producing knowledge. The cyclicity
effect counts the number of three cycles in citations of actor i : ∑= hj hijhiji xxxC,
Preferential attachment. The preferential attachment variable models the in-degree distribution of
actors, i.e. the fact that few actors are cited very often, while most of the actors receive very few
citations. A positive effect would reflect the attractiveness of actors that already receive many
citations, for instance because they invented groundbreaking patents in the past that have been the
basis of many further developments in the field. More precisely, we consider the square root version
of the in-degree distribution, in order to avoid co-linearity issues with other structural effects, and to
smooth the in-degree distribution (Ripley et al. 2011). Therefore, preferential attachment is
measured as the sum of the square roots of the in-degrees (citations received) of the actors that
actor i cites: ∑ ∑=j h hjiji xxPA
Non-structural variables
Geographical Proximity. The location of the ‘inventive headquarter’ of an organization was
determined based on the primary location of knowledge production as indicated by the inventor
residences9. Almost every firm in our sample has patents assigned to it that have been developed by
inventors in various different localities. However, organizations’ inventor pools are not randomly
distributed in space, but rather show distinct patterns of spatial clustering. This in turn enabled us to
identify one primary place of knowledge production for each firm. In order to measure geographical
proximity between organizations based on their primary locations of knowledge production, we
9 Our attempt in this chapter is not to provide a detailed account of the diffusion of knowledge spillovers in
space, or to find the best measure of geographical proximity. Such an approach would require more fine
grained measures of geographical proximity.

12
computed the inverse of the natural logarithm of the physical distance (+1) between the locations of
two organizations in kilometres. We subtract the results from the maximum distance obtained to
convert the measure into a proximity measure.
Cognitive Proximity. The cognitive proximity between two organizations is a result of their
commonalities of patenting in similar biotech classes as defined previously. Specifically we count the
total number of technology classes that two firms have patents assigned to, and then calculate the
cognitive proximity measure based on the share of the total number of classes covered by each
individual firm. The observation time frame to derive this asymmetric measure between all
organizations in a network is the previous 5-year window of the actual observation that is
investigated. Essentially, cognitive proximity measures the similarity of two firms in terms of having
patents granted in specific patent classes that comprise biotechnology, and thus indicates the
relatedness of two organizations’ technology expertise and focus.
Same country. We also control for belonging to the same country, on the basis of the location of the
organizations. The measure of the same country is binary: 1 if both organizations have their
‘inventive headquarter’ in the same country, and 0 if they have not.
Absorptive Capacity. In addition to the structural and the proximity variables, we also control for
heterogeneity in the patenting behaviour of organizations. Absorptive capacity is measured as the
capacity of organizations to absorb knowledge produced by others. These organizations are also
more likely to be leaders in the patent race, and therefore they are more likely to diffuse knowledge
(Alcacer and Chung, 2007), i.e. in our case to receive citations. We measure absorptive capacity by
computing the natural logarithm of the number of patents an organization developed in the biotech
industry in the five last years before our first observation, i.e. during the period 2003-2007. Indeed,
by construction, organizations that patent a lot are more likely to cite patents from others (ego
effect). Since we analyze the dynamics of knowledge spillovers as a directed process of knowledge
transfer, we also control for the fact that organizations that patent a lot are therefore more likely to
be cited by others (alter effect).
Minimum Maximum Mean Standard
deviation
Geographical proximity 0 9 0.896 1.302
Cognitive proximity 0 10 3.967 3.693
Same country 0 1 0.338 0.473
Absorptive capacity 0 7 1.913 1.343
Table 5. Descriptive statistics of the control variables
6. Estimation results
Table 6 presents the results of SAOM estimating the driving forces of the dynamics of inter-
organizational knowledge spillovers for the period 2008 to 2010. Four different model specifications
are reported. The first model is a "baseline" model that only includes the tendency of actors to cite
patents from other actors, and the tendency to reciprocate citations. Then we explore more complex
structural characteristics by including triadic level effects (transitivity and cyclicity) and degree
related effects (preferential attachment) in the "structural" model. A third model specification is
employed to test the influence of variables that have been found to be important in the literature on

13
knowledge spillovers (i.e. geographical proximity, cognitive proximity, belonging to the same country
and absorptive capacity), but without taking the knowledge structure into account. The final model
combines the variables of the structural and the non-structural model.
All parameter estimations are based on 1,000 simulation runs, and convergence of the
approximation algorithm is excellent for all the variables of the different models. This convergence is
a way to evaluate the goodness of fit of the different models, and it indicates if the deviation of the
simulated structures compared to the observed structures is acceptable (t-values < 0.1). The
parameter estimates of SAOM can be interpreted as non-standardized coefficients obtained from
logistic regression analysis (Steglich et al. 2010). Therefore, the parameter estimates that are
reported can be read as log-odds ratio, i.e. how the log-odds of tie formation (decision to cite a
patent from another actor) change with one unit change in the corresponding independent variable.
Because odds ratios are more easy to interpret, we will sometimes refer in the text to the odds ratios
(OR) to discuss the results. Odds ratio can be computed as the exponentiated form of the coefficients
of each predictor.
Baseline
Model
Structural
Model
Non-structural
Model
Final
Model
Structural variables
Density -2.848**
[0.008]
-3.513**
[0.009]
-3.441**
[0.012]
-3.529**
[0.012]
Reciprocity 1.270**
[0.047]
0.439**
[0.056]
0.323**
[0.053]
Transitivity
0.175**
[0.004]
0.146**
[0.003]
Cyclicity -0.067**
[0.008]
-0.112**
[0.008]
Preferential
attachment
0.168**
[0.002]
0.083**
[0.004]
Control variables
Geographical
proximity
0.034**
[0.006]
0.038**
[0.005]
Cognitive
proximity
0.020**
[0.002]
0.019**
[0.002]
Same country 0.415**
[0.017]
0.242**
[0.017]
Absorptive
capacity [alter]
0.475**
[0.005]
0.225**
[0.008]
Absorptive
capacity [ego]
0.183**
[0.006]
0.122**
[0.005]
Note: Number of actors: n = 1081. The asterisks indicate that the parameter estimates are
significantly different from 0 at a 5% level (*), and at a 1% level (**). Standard errors are
reported in brackets.
Table. 6: The determinants of inter-organizational knowledge spillovers: 2008-2010
14
The different model specifications confirm the importance of endogenous, structural effects in the
dynamics of knowledge spillovers. Although the coefficients of all predictors are very robust across
the different specifications, we discuss the coefficients obtained in the final model, in order to
control simultaneously for the effect of other structural effects and control variables. The density
coefficient is an indicator of the general tendency of actors to form linkages. The negative and
significant density effect indicates that, on average, organizations cite very few other organizations
(Est. = -3.529; OR = 0.029). Organizations are more likely to cite patents from organizations that
already cite them10
. Other variables held constant, organizations are 38 % more likely (Est. = 0.323;
OR = 1.381) to cite an actor that also cite them compared to an actor that does not. This result
probably relates to the fact that there is a strong, cohesive group of actors (see figure 2) that cite
each other, but this should not be interpreted as an absence of hierarchy in knowledge spillovers
dynamics.
Indeed, when we extend the analysis to the triadic level, we find that actors are more likely to create
a sub-group of actors (positive effect of triadic closure), but they exchange knowledge in a non-cyclic,
hierarchical manner (negative cyclicity effect). The positive effect of transitivity means that actors are
15% more likely (Est. = 0.146; OR = 1.157) to cite other organizations if they are already linked by one
common intermediary11
. This preference for closed local networks is an important determinant of
knowledge spillovers, and this structural configuration can capture other cognitive or social variables
that are more difficult to observe in large scale studies. These closed local networks, however, are
hierarchical because the coefficient for cyclicity is negative (Est. = -0.112; OR = 0.894). It indicates
that the configuration where two actors, A and B, cite each other (regardless of the direction of the
citation), and where these two actors cite the same actor C (that does not cite these two actors A
and B in turn) is more likely to happen than a cyclic configuration where A cites B, B cites C and C
cites A. In the non-cyclic configuration, and if C is an active12
actor, the position of C is an interesting
position where C diffuse knowledge to A and B, while C is absorbing knowledge elsewhere in the
structure. The degree distribution (figure 1) provides also important information on the individual
capacity of actors to absorb and diffuse knowledge in the structure of the network. The preferential
attachment coefficient is positive and significant, describing the behavior of actors to cite actors that
are already cited by many others (Est. = 0.083; OR = 1.086). This result reflects a certain status of
organizations that is not necessarily achieved by producing many patents, but by producing
successful/groundbreaking patents, like Stanford's recombinant DNA method, which was one of the
first biotech patents granted altogether.
Our results also confirm the effects of variables that do not operate at the structural level, but at the
dyadic (geographical and cognitive proximity, same country) and organizational level (absorptive
capacity). As expected, geographical proximity strongly influences the citation patterns of
organizations (Est. = 0.038; OR = 1.038), even when we control for belonging to the same country. It
means that organizations are 40% more likely to cite an organization of the same spatial area
10
In a network where the nodes are patents, the coefficient of reciprocity would be negative, since citations
can only be made toward previous patents that, by nature, cannot reciprocate the citation. 11
If two actors A and B are indirectly linked by more than one intermediary, the probability that a tie is created
between A and B also increases, because it would lead to the simultaneous closure of more than one triad. 12
If C is not an active node, this pattern might be artificially driven, because if C does not patent, C cannot by
definition contributes to close the knowledge spillover cycle.

15
compared to an organization located in the most remote location in the world13
. Interestingly, this
coefficient does not change from the non-structural to the final model, suggesting that the
information contained in the structure of knowledge spillovers and in the geography of knowledge
spillovers is different. The same conclusion can be drawn from the reading of the coefficient of
cognitive proximity. Organizations that have patented in the same technological classes are more
likely to cite each other in the future (Est. = 0.019; OR = 1.019). Obviously, the effect of cognitive
proximity would be even stronger if different industries are included in the sample. In our case, since
we only consider biotech organizations, cognitive proximity is a pre-requisite to be part of the
knowledge dynamics we model. In this case again, the inclusion of structural variables does seem to
decrease the explanatory power of cognitive proximity. The belonging to the same country is an
important determinant of knowledge spillovers (Est. = 0.242; OR = 1.273) but the coefficient is
strongly reduced by the inclusion of structural variables. The absorptive capacity variable is positive
and significant, and it simply controls for the fact that organizations that have substantially patented
in the last years are more likely to cite other organizations in general (ego effect; Est. = 0.122; OR =
1.129), but also more likely to be cited (alter effect; Est. = 0.225; OR = 1.252). While our measure of
absorptive capacity only counts the number of patents, the information contained in the actual
distribution of citations (modeled via preferential attachment) seems to provide an additional
explanation, probably about the technological value of the patents.
7. Conclusion
In this chapter, we explicitly adopted a "relational" approach to knowledge spillovers, following the
seminal claim by Breschi and Lissoni (2001). The different model specifications show that the
structure of knowledge spillovers contains in itself important information that can explain patterns of
knowledge dynamics and technological evolution. Therefore we argue that these complex
interdependencies should not only be included in traditional econometric approaches, but they
should also be modeled explicitly through variables representing local clustering, hierarchical
positioning and degree distributions for instance. These variables provide additional explanatory
power to the existing determinants of knowledge spillovers that have been discussed in the literature
so far. In fact, evaluating the importance of structural effects in the dynamics of knowledge spillovers
could allow for evaluating more precisely the influence of geographical proximity per se. Moreover,
such an approach also allows to capture variables that are not easily observable, like cognitive
proximity or social proximity, because they shape the structure of knowledge networks (Boschma
and Frenken, 2010; Balland, 2011).
This chapter, however, should not be considered as an attempt to obtain the best model possible to
describe the dynamics of knowledge spillovers, but more as a first step toward the analysis of
endogenous effects of knowledge dynamics. This approach opens a set of research questions that
should be investigated further. First, the model proposed is admittedly quite simple in terms of non-
structural effects, and further research should consider other variables that have been shown to be
relevant in the literature on inter-organizational patent citations. Social networks constructed from
13
The scale of geographical proximity is constructed in such a way that minimum geographical proximity = 0,
and maximum geographical proximity = 9. Since the coefficient are not standardized, the odd ratio of choosing
an organization from the same spatial area versus an organization from the most remote spatial area should
consider the scale of the input variable : OR = exp (0.038*9) = 1.407.

16
teams of inventors play an important role in explaining knowledge spillovers (Singh, 2005; Breschi
and Lissoni, 2009), but also R&D collaborations (Gomes-Casseres, Hagedoorn and Jaffe 2006;
Frankort, Hagedoorn and Letterie 2011) and labor mobility (Almeida and Kogut, 1999; Corredoira and
Rosenkopf 2010). Second, the model only considers a short period of time (2008-2010) in a specific
industry (biotech). It should be noted, however, that the changing role of the drivers of network
dynamics over time is an emerging research topic in economic geography and network theory
(Rivera, Soderstrom and Uzzi 2010; Hoekman, Frenken and Tijssen 2010; Balland, De Vaan and
Boschma, 2011; Ter Wal 2011). Therefore, a next logical step would be to analyze how structural and
non structural effects influence differently the dynamics of knowledge spillovers at different stages
of the technology life cycle. Moreover, an interesting research question concerns whether
incremental and radical innovations are driven by the same forces, and whether these forces are
constant across industries. Third, we did not account for performance of organizations. It is often
assumed that knowledge spillovers are important for economic performance of organizations, but it
is rarely empirically assessed. Our approach provides an interesting opportunity to test whether the
position of actors in knowledge structures influence their economic performance, and in turn, how
the economic performance of actors influence their probability to diffuse (i.e., to be cited by other
organizations) or to access (i.e., to cite other organizations) knowledge in the future. Such a research
question could be an extension of our approach, since the class of statistical models we use in this
chapter allows for the analysis of the co-evolution between network dynamics and performance of
actors (Snijders et al. 2010; Steglich et al. 2010).
8. References
Acs, Z.J., L. Anselin and A. Varga (2002) Patents and innovation counts as measures of regional
production of new knowledge, Research Policy 31 (7): 1069-1085.
Acs, Z.J., D.B. Audretsch and M.P. Feldman (1994) R&D spillovers and innovation activity, Managerial
and Decision Economics 15: 131-138.
Alcacer, J. and Chung, W. (2007) Location strategies and knowledge spillovers, Management Science
53(5): 760-776.
Almeida, P., and Kogut, B. (1999) Localization of knowledge and the mobility of engineers in regional
networks. Management Science, 45: 905–917.
Audretsch, D.B. and M.P.Feldman (1996) R&D spillovers and the geography of innovation and
production, American Economic Review 86 (3): 630-640.
Balconi, M., S. Breschi and F. Lissoni (2004) Networks of inventors and the role of academia: an
exploration of Italian patent data. Research Policy 33: 127-145.
Balland P.A., de Vaan M. and Boschma R. (2011) The Dynamics of Interfirm Networks along the
Industry Life Cycle: The Case of the Global Video Games Industry 1987-2007, Papers in Evolutionary
Economic Geography #11.14, Section of Economic Geography, Utrecht University.
Balland, P.A. (2011) Proximity and the Evolution of Collaboration Networks: Evidence from Research
and Development Projects within the Global Navigation Satellite System (GNSS) Industry. Regional
Studies, forthcoming.
Boschma, R.A. (2005) Proximity and innovation. A critical assessment. Regional Studies 39(1): 61–74.

17
Boschma, R., Frenken, K. (2010) The spatial evolution of innovation networks: a proximity
perspective. In R. Boschma and R. Martin (eds) The Handbook on Evolutionary Economic Geography.
Cheltenham, UK: Edward Elgar, 120-135.
Barabási, A.L., Albert, R. (1999) Emergence of scaling in random networks. Science, 286: 509-512.
Breschi S., Lissoni, F., and Malerba, F. (2003) Knowledge networks from patent citations?
Methodological issues and preliminary results. DRUID summer conference.
Breschi, S., Lissoni, F. (2003) Mobility and social networks: Localised knowledge spillovers revisited.
CESPRI Working Paper 142, Bocconi University, Milan.
Breschi, S., Lissoni, F. (2006) Mobility of inventors and the geography of knowledge spillovers. New
evidence on US data. CESPRI Working Paper 184, Bocconi University, Milan.
Breschi, S. and Lissoni, F. (2009) Mobility of skilled workers and co-invention networks: An anatomy
of localized knowledge flows. Journal of Economic Geography 9(4) 439–468.
Breschi, S., Lissoni, F. (2001) Knowledge Spillovers and Local Innovation Systems: A Critical Survey.
Industrial and Corporate Change, 10: 975-1005.
Bud, R. (1993) The Uses of Life: A History of Biotechnology, Cambridge University Press, Cambridge,
UK.
Caniels, M. (2000) Knowledge spillovers and economic growth. Regional growth differentials across
Europe, Cheltenham: Edward Elgar.
Cantwell, J. and G.D. Santangelo (2002) The new geography of corporate research in Information and
Communications Technology (ICT), Journal of Evolutionary Economics 12: 163-197.
Castells, M. (1996) The rise of the network society. Oxford: Blackwell.
Cohen, S.; Chang, A.; Boyer, H.; Helling, R. (1973) Construction of biologically functional bacterial
plasmids in vitro. Proceedings of the National Academy of Sciences of the United States of America 70
(11): 3240–3244.
Corredoira, R. A., and Rosenkopf, L. (2010) Should auld acquaintance be forgot? The reverse transfer
of knowledge through mobility ties. Strategic Management Journal 31(2): 159–181.
Ejermo, O. and C. Karlsson (2006) Interregional inventor networks as studied by patent
coinventorships. Research Policy 35 (3):412-430.
Feldman, M.P. (1994) The geography of innovation, Dordrecht: Kluwer Academic Publishers.
Frankort, H., Hagedoorn, J. and Letterie, W. (2011) R&D partnership portfolios and the inflow of
technological knowledge. Industrial and Corporate Change, forthcoming.
Gittelman M. and Kogut B. (2003) Does Good Science Lead to Valuable Knowledge? Biotechnology
Firms and the Evolutionary Logic of Citation Patterns, Management Science 49(4): 366-382.
Giuliani, E. (2007). The selective nature of knowledge networks in clusters: evidence from the wine
industry, Journal of Economic Geography 7(2): 139-168.

18
Giuliani, E. (2010) Network Dynamics in Regional Clusters: The Perspective of an Emerging Economy,
Papers in Evolutionary Economic Geography 10-14, Section of Economic Geography, Utrecht
University.
Gluckler, J. (2007) Economic Geography and the Evolution of Networks, Journal of Economic
Geography 7 (5): 619-634.
Gomes-Casseres, B., Hagedoorn, J. and Jaffe A. (2006) Do alliances promote knowledge flows?
Journal of Financial Economics, 80: 5-33.
Guimera, R. and L.A.N. Amaral (2004) Modelling the world-wide airport network. European Physical
Journal B 38 (2): 381-385.
Hall, B. H., A. B. Jaffe, and M. Trajtenberg. (2001). The NBER patent Citations Data File: Lessons
Insights and Methodological Tools, NBER.
Hoekman, J., Frenken, K., Van Oort, F. (2009). The geography of collaborative knowledge production
in Europe. Annals of Regional Science 43 (3), in press
Hoekman, J., Frenken, K., Tijssen, R. (2010) Research collaboration at a distance: changing spatial
patterns of scientific collaboration within Europe. Research Policy, 39: 662-673.
Holme, P., C.R. Edling and F. Liljeros (2004) Structure and time evolution of an Internet dating
community, Social Networks 26: 155-174.
Jaffe, A.B., M. Trajtenberg and R. Henderson (1993) Geographic localisation of knowledge spillovers
as evidenced by patent citations. Quarterly Journal of Economics 108:577-598.
Johnson, D. K. N. (2009) Not far from the madding crowd: The role of proximity in biotechnology
innovation, International Review of Business Research Papers 5(2): 420-429.
Kortum S. and Lerner J. (1999) What is behind the recent surge in patenting, Research Policy 28:1-22.
Lee J. (2010) Heterogeneity, Brokerage, and Innovative Performance: Endogenous Formation of
Collaborative Inventor Networks, Organization Science 21(4): 804-822.
Maggioni, M.A., Nosvelli, M., Uberti, T.E. (2007) Space vs. networks in the geography of innovation: A
European analysis. Papers in Regional Science 86(3): 471-493
Mizruchi, M.S., Marquis, C., 2005. Egocentric, sociocentric, or dyadic? identifying the appropriate
level of analysis in the study of organizational networks. Social Networks 28:187-208.
Newman, M.E.J. (2003) The structure and function of complex networks, SIAM Review 45: 167-256.
Niosi J. and Bas T. G. (2001) The Competencies of Regions – Canada’s Clusters in Biotechnology, Small
Business Economics 17: 31-42.
Orsenigo, L., F. Pammolli, M. Riccaboni, A. Bonaccorsi and G. Turchetti (1998) The evolution of
knowledge and the dynamics of an industry network. Journal of Management and Governance 1:
147-175.
Ozman, M. (2009) Inter-firm networks and innovation: a survey of literature
Economics of Innovation and New Technology 18(1): 39-67.
19
Ponds, R., van Oort, F.G., Frenken, K. (2007) The geographical and institutional proximity of research
collaboration. Papers in Regional Science 86: 423–443.
Powell WW, Koput K, Smith-Doerr L (1996) Interorganizational collaboration and the locus of
innovation: networks of learning in biotechnology. Administrative Science Quarterly 41: 116-145
Powell, W.W., White, D.R., Koput, K.W., Owen-Smith, J. (2005) Network Dynamics and Field
Evolution: The Growth of Interorganizational Collaboration in the Life Sciences. American Journal of
Sociology 110(4): 1132-1205
Ripley, R., Snijders, T., Preciado Lopez, P. (2011) Manual for RSiena, University of Oxford,
Department of Statistics; Nuffield College, May 1.
Rivera, M., Soderstrom, S., Uzzi, B. (2010) Dynamics of Dyads in Social Networks: Assortative,
Relational, and Proximity Mechanisms. Annual Review of Sociology, 36: 91-115.
Ronald Lai; Alexander D'Amour; Amy Yu; Ye Sun; Lee Fleming, 2011, "Disambiguation and Co-
authorship Networks of the U.S. Patent Inventor Database (1975 - 2010)",
http://hdl.handle.net/1902.1/15705 UNF:5:RqsI3LsQEYLHkkg5jG/jRg== V3 [Version]
Singh, J. (2005) Collaborative Networks as Determinants of Knowledge Diffusion Patterns.
Management Science, 51: 756-770.
Snijders, T. (2001) The statistical evaluation of social network dynamics. In M. Sobel and M. Becker
(eds) Sociological Methodology. Boston and London: Basil Blackwell, 361–395.
Snijders, T., Van De Bunt, G., Steglich, C. (2010) Introduction to actor-based models for network
dynamics. Social Networks, 32: 44-60.
Sorenson, O. Rivkin, J.W., Fleming, L. (2006) Complexity, networks and knowledge flow.
Research Policy 35(7): 994-1017
Steglich, C., Snijders, T., Pearson, M. (2010) Dynamic Networks and Behavior: Separating Selection
from Influence. Sociological Methodology, 40: 329–393.
Storper, M. (1992) The limits to globalization: Technology districts and international trade, Economic
Geography 68 (1): 60-93.
Ter Wal, A.L.J. and R.A. Boschma (2009), Applying social network analysis in economic geography:
framing some key analytical issues. Annals of Regional Science 43 (3): 739-756.
Ter Wal, A. (2011) The spatial dynamics of the inventor network in German biotechnology:
Geographical proximity versus triadic closure, Papers in Evolutionary Economic Geography 11-02,
Section of Economic Geography, Utrecht University.
United States Patent and Trademark Office (2010) USPTO Assignee Harmonization Data File.
Retrieved October 8th
, 2011, from
http://www.uspto.gov/web/offices/ac/ido/oeip/taf/data/misc/data_cd.doc/assignee_harmonization
/

20
United States Patent and Trademark Office (2002) Technology Profile Report: Patent Examining
Technology Center Groups 1630–1650, Biotechnology. Patent Technology Monitoring Division
Report, United States Patent and Trademark Office, Alexandria, VA.
Zucker, L.G., Darby, M.R., Armstrong, J. (2002) Commercializing knowledge: university science,
knowledge capture, and firm performance in biotechnology. Management Science 48, 138-153.
Zucker, L.G., Darby, M.R., Brewer, M.B. (1998b) Intellectual human capital and the birth of U.S.
Biotechnology Enterprises. American Economic Review 88, 290-306.