Financial globalisation, monetary policy spillovers and macro ...
64
Working Paper Series Financial globalisation, monetary policy spillovers and macro-modelling: tales from 1001 shocks Georgios Georgiadis, Martina Jančoková Disclaimer: This paper should not be reported as representing the views of the European Central Bank (ECB). The views expressed are those of the authors and do not necessarily reflect those of the ECB. No 2082 / June 2017
-
Upload
khangminh22 -
Category
Documents
-
view
1 -
download
0
Transcript of Financial globalisation, monetary policy spillovers and macro ...

Working Paper Series Financial globalisation, monetary policy spillovers and macro-modelling: tales from 1001 shocks
Georgios Georgiadis, Martina Jančoková
Disclaimer: This paper should not be reported as representing the views of the European Central Bank (ECB). The views expressed are those of the authors and do not necessarily reflect those of the ECB.
No 2082 / June 2017

Abstract
Financial globalisation and spillovers have gained immense prominence over thelast two decades. Yet, powerful cross-border financial spillover channels have notbecome a standard element of structural monetary models. Against this back-ground, we hypothesise that New Keynesian DSGE models that do not featurepowerful financial spillover channels confound the effects of domestic and foreigndisturbances when confronted with the data. We derive predictions from thishypothesis and subject them to data on monetary policy shock estimates for 29economies obtained from more than 280 monetary models in the literature. Con-sistent with the predictions from our hypothesis we find: Monetary policy shockestimates obtained from New Keynesian DSGE models that do not account forpowerful financial spillover channels are contaminated by a common global com-ponent; the contamination is more severe for economies that are more susceptibleto financial spillovers in the data; and the shock estimates imply implausibly sim-ilar estimates of the global output spillovers from monetary policy in the US andthe euro area. None of these findings applies to monetary policy shock estimatesobtained from VAR and other statistical models, financial market expectationsand the narrative approach.
Keywords: Financial globalisation, spillovers, monetary policy shocks, New Key-
nesian DSGE models.
JEL-Classification: F42, E52, C50.
ECB Working Paper 2082, June 2017 1

Non-technical summary
A salient feature of the global economy since the 1990s has been the dramatic rise of financial globalisation. Whether measured by capital flows or indicators reflecting the extent of legal capital account restrictions, economies' financial markets have been exhibiting an increasing degree of interdependence. As a result, the global economy has become subject to large cross-country spillovers through financial channels. At the same time, important advances in structural monetary macroeconomic modelling have been achieved over the last two decades. In particular, New Keynesian dynamic stochastic general equilibrium (NK DSGE) models have been established as the standard monetary macroeconomic model. However, despite progress in structural macroeconomic modelling (e.g. financial frictions) many, in particular medium-scale, models used for the analysis of monetary policy still do not routinely account for cross-country financial spillover channels.
In this paper we document that there is a significant, positive cross-country correlation between a large number of monetary policy shock time-series estimates implied by a range of NK DSGE models routinely used in the profession. In order to rationalise this finding, we argue that when confronted with the data NK DSGE models that do not adequately account for financial spillover channels erroneously label foreign monetary policy shocks as domestic ones.
We first illustrate the mechanics underlying this hypothesis in a stylised counterfactual Monte Carlo experiment. Specifically, we show that when the true data-generating process is a multi-country model that features large financial spillovers, using single-country models to estimate the underlying structural shocks produces monetary policy shock estimates that are contaminated by a global component. The common global component is mainly driven by monetary policy shocks of the core economy, and it gives rise to positively cross-country correlated monetary policy shock estimates.
We test whether the NK DSGE models in the literature are subject to contamination by a common component in the monetary policy shock estimates in a meta-study-like fashion. More specifically, we explore the interrelations between estimates of monetary policy shock time series from more than 280 macroeconomic models, including NK DSGE models, empirical reduced-form models, approaches based on financial market expectations and the narrative approach. The cross-country correlations between the monetary policy shock estimates are larger for country-pairs which in the data are more susceptible to financial spillovers from the rest of the world.
The empirical evidence we obtain in this paper also supports the hypothesis of a global financial cycle driven by US monetary policy (Bekaert et al., 2013; Bruno and Shin, 2015b,a; Miranda-Agrippino and Rey, 2015; Passari and Rey, 2015; Rey, 2015). Specifically, a prediction from the global financial cycle hypothesis in the light of our paper is that monetary policy shock estimates from NK DSGE models which do not feature powerful financial spillover channels should contain a US component. Indeed, we find that monetary policy shock estimates for non-US economies obtained from NK DSGE models are systematically correlated with their US counterparts, and that the cross-country correlation is larger for country pairs
ECB Working Paper 2082, June 2017 2

that are more financially integrated with US – in addition to global – financial markets. The empirical evidence we obtain is also consistent with the important role of global banks for the increase in financial integration prior to the global financial crisis (see Goldberg, 2009; Cetorelli and Goldberg, 2012; Bruno and Shin, 2015b,a; Morais et al., 2015). Specifically, we find that the cross-country correlation between monetary policy shock estimates obtained from NK DSGE models is particularly strong for country pairs that are more financially integrated through international banking linkages.
Our paper is related to the literature which is concerned with the role of powerful financial spillover channels in structural monetary models for cross-country business cycle correlations (Iacoviello and Minetti, 2006; Ueda, 2012; Yao, 2012; Chin et al., 2015). Within this literature, our paper is most closely related to Justiniano and Preston (2010) as well as Alpanda and Aysun (2014), who find that standard open-economy NK DSGE models fail to replicate the large degree of cross-country business cycle co-movement in the data, and that they imply only an implausibly minor role of foreign disturbances for the evolution of domestic variables. More specifically, these studies find that the theoretical moments implied by standard NK DSGE models which do not account for powerful financial spillover channels are much closer to their empirical counterparts if it is assumed that the structural shocks are cross-country correlated. This finding is typically interpreted as suggesting that standard NK DSGE models lack empirically relevant cross-border transmission channels for country-specific shocks or a global dimension that would allow toconsider common shocks. This interpretation is consistent with the finding in this paper that NK DSGE models that do not account for powerful financial spillover channels produce cross-country correlated monetary policy shock estimates. At the same time, our findings of course do not imply that the lack of financial spillover channels is the only – or even the most important – source of mis-specification in standard NK DSGE models. Finally, while the analyses of Justiniano and Preston (2010) as well as Alpanda and Aysun (2014) are based on counterfactual simulations of two specific structural models, in this paper we consider a database of monetary policy shock estimates from more than 280 monetary – including non-structural – models estimated for a range of economies.
The results from this paper imply that the modelling of powerful financial spillover channels in structural monetary macroeconomic models needs be taken more seriously. Standard macroeconomic models without such elements might compromise the likelihood-based estimation of these models and provide severely misleading results regarding spillovers, historical decompositions and estimation of parameters as they are based on a convolution of the true domestic and foreign monetary policy shocks.
ECB Working Paper 2082, June 2017 3

1 Introduction
A salient feature of the global economy since the 1990s has been the dramatic rise of financial
globalisation. Whether measured by (gross) capital flows or indicators reflecting the extent
of legal capital account restrictions, economies’ financial markets have been exhibiting an
increasing degree of integration. As a result, the global economy is progressively becoming
subject to large cross-country spillovers through financial channels, in particular in case of
monetary policies in systemic economies. Indeed, a growing body of empirical research pro-
vides evidence that financial interlinkages play a critical role in the transmission of shocks
across economies (Ehrmann and Fratzscher, 2003, 2005, 2009; Ehrmann et al., 2011; Hale
et al., 2016). Similarly, several studies document the sizable impact of—in particular US—
monetary policy on output and inflation in the rest of the world that materialises through
financial spillover channels (Kim, 2001; Canova, 2005; Nobili and Neri, 2006; Dedola et al.,
2015; Feldkircher and Huber, 2015; Georgiadis, 2016). And related work even suggests that
economies’ financial markets are subject to a global financial cycle, which is argued to mate-
rialise in variations in global risk aversion and to be driven by US monetary policy (Bekaert
et al., 2013; Ghosh et al., 2014; Bruno and Shin, 2015b,a; Miranda-Agrippino and Rey, 2015;
Passari and Rey, 2015; Rey, 2015).
At the same time, over the last two decades important advances in structural monetary
modelling have been achieved, as reflected in the huge amount of work on New Keynesian
dynamic stochastic general equilibrium (NK DSGE) models. While the first NK DSGE
models focused on frictions in price setting and labor markets (Smets and Wouters, 2003;
Christiano et al., 2005), the global financial crisis epitomised the role of frictions in financial
markets for the propagation of shocks. The resulting wave of work has focused on introducing
frictions in domestic financial markets (Gertler and Karadi, 2011; Christiano et al., 2014).
Advances have also been made in generalising the initially closed-economy NK DSGE models
to analyse the international transmission of shocks and policy design in open economies, giving
rise to New Open-Economy Macroeconomics (Obstfeld and Rogoff, 1996). After two decades
of continuous development and research it is fair to say that NK DSGE models have become
standard elements of macroeconomists’ toolbox. In particular at central banks elaborate
versions of NK DSGE models are routinely used, for example in order to determine what
shocks have been drivers of recent business cycle movements. This is an important exercise,
as the appropriate policy response to business cycle fluctuations depends on what type of
shocks are driving the economy. Against the background of the continuous strengthening
of cross-border financial integration, it is noteworthy that powerful spillover channels based
on frictions in international financial markets—for example involving cross-border interbank
balance sheet exposures, collateral constraints and currency mismatches—are not routinely
incorporated in NK DSGE models.1 Possible consequences of this particular discrepancy
1NK DSGE models that do consider frictions in international financial markets include Devereux and
ECB Working Paper 2082, June 2017 4

between empirics and theory have not been explored systematically yet. We aim to fill part
of this gap in the literature.
In this paper we hypothesise that the structural monetary models used in the profession
typically fail to adequately account for the importance of financial spillover channels in the
data. We argue that, as a consequence, when confronted with the data these models label rest-
of-the-world monetary policy shocks as domestic ones. We test this hypothesis by verifying—
in a meta-study-like fashion—if three predictions are borne out by the NK DSGE models used
in the literature. Specifically, under our hypothesis we expect: First, domestic monetary
policy shock estimates are contaminated by a common global component and are therefore
positively correlated across economies.2 Second, the contamination by the common global
component is more severe and thereby gives rise to larger cross-country correlations for pairs
of economies that are more strongly integrated with global financial markets. Third, estimates
of the global spillovers from domestic monetary policy obtained using shock estimates from
NK DSGE models in time-series regressions are implausibly similar across spillover-sending
economies, as they all reflect the response to a common global monetary policy shock.
We provide empirical evidence that is consistent with the predictions from our hypothesis
based on a database of monetary policy shock estimates for 29 economies obtained from
more than 280 structural and non-structural monetary models used in the literature for the
time period from 1993 to 2007. First, we document that when confronted with the data NK
DSGE models produce domestic monetary policy shock estimates that are positively corre-
lated across economies. In contrast, monetary policy shock estimates obtained from VAR
and other statistical models, derived from financial market expectations and the narrative
approach are essentially cross-country uncorrelated. Interestingly, we document that the con-
tamination by a common global component is as severe for monetary policy shock estimates
obtained from NK DSGE models used at central banks and international organisations as
for shock estimates obtained from stylised NK DSGE models used in academia. Second, the
cross-country correlations between monetary policy shock estimates obtained from NK DSGE
models are larger for economies that are more strongly integrated with global financial mar-
kets. Importantly, this finding is robust to accounting for other possible explanations for the
cross-country correlations between monetary policy shock estimates, such as mis-specification
of the Taylor-rule or failure to account for spillovers through trade. Third, using shock es-
timates obtained from NK DSGE models in time-series regressions produces estimates for
the global output spillovers from US and euro area monetary policy which are implausibly
Yetman (2010), Kollmann et al. (2011), Dedola and Lombardo (2012), Ueda (2012), Banerjee et al. (2016) aswell as Nuguer (2016).
2That the true structural shocks are uncorrelated is impossible to verify, but is a fundamental assumption inmacroeconomics. For example, Bernanke (1986) states that “shocks should be primitive exogenous forces thatare uncorrelated with each other”, as only un-correlatedness allows a meaningful interpretation of impulseresponse functions and variance decompositions. Andrle (2014) discusses in detail the notion that (cross-country) correlated estimates of structural shocks are a sign of model mis-specification in NK DSGE models.
ECB Working Paper 2082, June 2017 5

similar. In contrast, the relative magnitudes of the estimates of the global output spillovers
from monetary policy in the US and the euro area obtained from time-series regressions are
more plausible when using shock estimates that stem from non-NK DSGE models.
Our paper is related to the literature which is concerned with the role of powerful financial
spillover channels in structural monetary models for cross-country business cycle correlations
(Iacoviello and Minetti, 2006; Ueda, 2012; Yao, 2012; Chin et al., 2015). Within this literature,
our paper is most closely related to Justiniano and Preston (2010) as well as Alpanda and
Aysun (2014), who find that standard open-economy NK DSGE models fail to replicate the
large degree of cross-country business cycle co-movement in the data, and that they imply only
an implausibly minor role of foreign disturbances for the evolution of domestic variables. More
specifically, these studies find that the theoretical moments implied by standard NK DSGE
models—which do not account for powerful financial spillover channels—are much closer
to their empirical counterparts if it is assumed that the structural shocks are cross-country
correlated. This finding is typically interpreted as suggesting that standard NK DSGE models
lack empirically relevant cross-border transmission channels for country-specific shocks or
a global dimension that would allow to consider common shocks. This interpretation is
consistent with the finding in this paper that NK DSGE models that do not account for
powerful financial spillover channels produce cross-country correlated monetary policy shock
estimates. At the same time, our findings of course do not imply that the lack of financial
spillover channels is the only—or even the most important—source of mis-specification in
standard NK DSGE models. Finally, while the analyses of Justiniano and Preston (2010)
as well as Alpanda and Aysun (2014) are based on counterfactual simulations of two specific
structural models, in this paper we consider a database of monetary policy shock estimates
from more than 280 monetary—including non-structural—models estimated for a range of
economies.
The empirical evidence we obtain in this paper is also consistent with several additional
predictions from our hypothesis. First, the evidence supports the hypothesis of a global fi-
nancial cycle that is driven by US monetary policy (Bekaert et al., 2013; Bruno and Shin,
2015b,a; Miranda-Agrippino and Rey, 2015; Passari and Rey, 2015; Rey, 2015). Specifically,
a prediction from the global financial cycle hypothesis in the light of our paper is that mon-
etary policy shock estimates from NK DSGE models which do not feature powerful financial
spillover channels should be contaminated by a US component. Indeed, we find that the
cross-country correlations between the monetary policy shock estimates obtained from NK
DSGE models for non-US economies are larger for country pairs that are more financially
integrated with US—in addition to global—financial markets. Second, the evidence we ob-
tain is also consistent with the important role of global banks in financial integration prior
to the global financial crisis (Goldberg, 2009; Cetorelli and Goldberg, 2012; Bruno and Shin,
2015b,a; Morais et al., 2015). Specifically, we find that the contamination by a common global
component is particularly severe for monetary policy shock estimates for economies which are
ECB Working Paper 2082, June 2017 6

more financially integrated through international banking linkages. Finally, we also obtain
some tentative evidence that is consistent with the trilemma in international macroeconomics
(Obstfeld et al., 2005; di Giovanni and Shambaugh, 2008; Klein and Shambaugh, 2015; Ob-
stfeld, 2015): The contamination by a common global component is less severe for monetary
policy shock estimates for emerging market economies which impose capital controls and
which feature flexible exchange rate regimes.
Failure to account for the global context and powerful financial spillover channels in NK DSGE
models may imply inconsistent parameter estimates obtained by likelihood-based methods,
as the monetary policy shock estimates entering the likelihood function are mis-measured.
Moreover, mis-measured monetary policy shock estimates imply incorrect variance and his-
torical decompositions. Ultimately, this might lead to mis-leading policy recommendations.
Having said that, it is important to emphasise that our paper is not to be read as a general
critique or dismissal of the use of NK DSGE models in the profession. Consistent with the
view of Blanchard (2016), we believe that NK DSGE models “are eminently improvable and
central to the future of macroeconomics”, and that whether specific elements—such as pow-
erful financial spillover channels—are necessary depends on the purpose the models are used
for. The insights from our paper suggest that more efforts need to be devoted to the modelling
of the global context as well as powerful financial spillover channels in structural monetary
models that are used for policy analysis, especially at central banks and international or-
ganisations. Indeed, we also find that the contamination by a common global component
is less severe if the monetary policy shock estimates stem from NK DSGE models that do
feature an explicit multi-country dimension and/or frictions in international financial mar-
kets. Which particular frictions in cross-border financial markets are the most appropriate
to be introduced into NK DSGE models to mitigate the contamination by a common global
component most plausibly depends on country specifics, and we leave this investigation for
future research.
The rest of this paper is organised as follows. In Section 2, we illustrate the mechanics of our
hypothesis and derive testable predictions from a stylised counterfactual Monte Carlo exper-
iment. In Section 3 we present our monetary policy shock database and test the predictions
from our hypothesis derived in Section 2. Section 4 presents additional testable predictions,
competing hypotheses that may explain the positive cross-country correlations between the
NK DSGE model monetary policy shock estimates in our database as well as robustness
checks. Finally, Section 5 concludes.
ECB Working Paper 2082, June 2017 7

2 Financial globalisation, monetary policy spillovers and struc-
tural macro-modeling
In this section we consider a counterfactual Monte Carlo experiment in order to motivate
our hypothesis. Specifically, the Monte Carlo experiment consists of three steps. First, we
simulate data based on a structural multi-country model with financial spillover channels
and cross-country uncorrelated monetary policy shocks. The model features “core” (the US)
and “non-core” (the euro area and Japan) economies which differ in the magnitude of the
financial spillovers they emit. Second, we obtain estimates of the monetary policy shocks
for the euro area and Japan by feeding the simulated data into intentionally mis-specified
single-country versions of the true data-generating process; specifically, the single country
models do not feature financial spillover channels. Third, we determine the cross-country
correlation between the monetary policy shock estimates for the non-core economies of the
euro area and Japan obtained in step two. We also utilise the shock time series estimates to
obtain estimates of the spillovers from monetary policy in the euro area (or Japan) to the US
using local projections. We run the Monte Carlo experiment for different parameterisations
of the data-generating process in order to assess the role of the strength of financial spillovers
for the properties of the monetary policy shock estimates. It is important to emphasise that
we consider this Monte Carlo experiment in order to illustrate how failure to account for
financial spillover channels can give rise to cross-country correlated monetary policy shock
estimates, and not in order to establish that this is the only possible reason for cross-country
correlated monetary policy shock estimates. We explore alternative explanations for cross-
country correlated monetary policy shock estimates in Section 4.
2.1 The data-generating process
The basic building blocks of the multi-country model of Coenen and Wieland (2002) are an
IS-curve, a Phillips curve, an uncovered interest rate parity condition, and a Taylor-rule for
each economy.3 Importantly, we specify the monetary policy shocks in the data-generating
process to be uncorrelated across economies. We introduce a financial spillover channel by
modifying the original specification of nominal long-term interest rates i(l)it through the term
structure in Coenen and Wieland (2002) and consider
i(l)it = (1− ϑi) ·
(1
8
7∑`=0
Eti(s)i,t+`
)+ ϑi ·
N∑j=1,j 6=i
ωij i(l)jt
, (1)
3The model of Coenen and Wieland (2002) is semi-structural: The components are not explicitly derivedfrom micro-founded optimisation problems, but are very similar to those in rigorously constructed structuralmonetary models. Appendix C.2 provides a detailed description of the model.
ECB Working Paper 2082, June 2017 8

where i, j ∈ {us, ea, ja}, i(s)it represents the nominal short-term interest rate, and wij denotes
bilateral weights. The second term on the right-hand side of Equation (1) gives rise to
potentially powerful financial spillovers. Specifically, the higher ϑi, the stronger the spillovers
from foreign to domestic long-term interest rates. Analogously, the higher ωij , the stronger
the spillovers to domestic long-term interest rates in economy i from economy j relative
to those from other foreign economies s, s 6= i, j. This specification of financial spillovers
through long-term interest rates is consistent with their strong co-movement in the data (see,
for example, Ehrmann and Fratzscher, 2003, 2005; Ehrmann et al., 2011; Chin et al., 2015).
We examine two polar parameterisations for ϑi and ωi,us in Equation (1), namely a “no finan-
cial spillovers” and a “financial spillovers” parametrisation. In the “no financial spillovers”
parametrisation we set ϑi = ωi,us = 0. In the “financial spillovers” parametrisation we set
ϑi = 0.2 and ωi,us = 0.8. For the US we fix ϑus = 0.2 and wus,j = 0.5, reflecting our assump-
tion of the US being the core economy. The dynamics of domestic and foreign variables in
response to monetary policy shocks under the two polar parameterisations are qualitatively
plausible and—in particular for the “financial spillovers” parametrisation—consistent with
the findings on monetary policy spillovers in the empirical literature (see Figures 7 and 8 in
Appendix C.2 as well as Dedola et al., 2015; Feldkircher and Huber, 2015; Banerjee et al.,
2016; Chen et al., 2016; Georgiadis, 2016).
2.2 Cross-country correlations of monetary policy shocks
Figure 1 presents the distribution of the cross-country correlations between the monetary
policy shock estimates for the non-core economies of the euro area and Japan obtained from
feeding the data simulated from the multi-country data-generating process into the corre-
sponding single-country versions across the 1,000 replications of the Monte Carlo experiment.
Under the “no financial spillovers” parametrisation, the cross-country correlations are not no-
ticeably (and statistically significantly) different from zero, which is in line with the absence of
such correlation in the data-generating process. In contrast, under the “financial spillovers”
parametrisation the cross-country correlations are large and positive, with a mean of around
0.2 across replications. Thus, using single-country models that do not adequately account for
the presence of powerful financial spillover channels in the data-generating process produces
domestic monetary policy shock estimates which are positively cross-country correlated.
In order to identify the source of this correlation, we run the regression
empea,t =
∑i∈ea,us,ja
(βmpi · emp
it + βdi · edit + βcpi · ecpit
)+ uit, (2)
where empea,t represents the euro area monetary policy shock estimates obtained from the single-
country model, and empit , edit, and ecpit denote the true monetary policy, demand and cost-push
ECB Working Paper 2082, June 2017 9
shocks.4 Figure 2 presents the distribution of the coefficient estimates β`i in Equation (2)
across replications of the Monte Carlo experiment. The results suggest that in particular
under the “financial spillovers” parametrisation the estimate of the euro area monetary pol-
icy shock empea,t obtained from the single-country model is a convolution of the true monetary
policy, demand and cost-push shocks of the euro area, the US and Japan. Most importantly,
the true US monetary policy shock exhibits the largest loading on the estimated euro area
monetary policy shock besides the true euro area monetary policy shock; the results for the
regression of empjp,t are analogous. Thus, the cross-country correlation between the estimated
monetary policy shocks of the euro area and Japan arises due to a common US component.
In particular, the contamination of domestic monetary policy shock estimates by a US com-
ponent occurs because (i) in the true data-generating process a US monetary policy shock
spills over to domestic financial markets in the euro area and Japan according to Equation
(1); (ii) when using the mis-specified single-country models for the non-core economies of
the euro area and Japan for the estimation of the monetary policy shocks, the US monetary
policy shock is erroneously labelled as domestic monetary policy shock.
2.3 Spillover estimates
In each replication of the Monte Carlo experiment we estimate spillovers from euro area
monetary policy to the US using local projections (Jorda, 2005). Specifically, we estimate
yus,t+h = α(h) +
p∑k=0
γ(h)k emp
ea,t−k +n∑
k=1
δ(h)k yus,t−k +
q∑k=0
xus,t−kβ(h)k + u
(h)us,t, (3)
for h = 0, 1, . . . ,H, where yus,t+h represents the US output gap and empea,t the euro area
monetary policy shock estimates obtained from using the single-country model. The control
variables in xus,t include inflation, short and long-term interest rates as well as the real
effective exchange rate. The data for yus,t and xus,t stem from the simulation of the multi-
country data-generating process. In every replication of the Monte Carlo experiment we use
the simulated data both to estimate the monetary policy shocks in the single-country models
and for the controls in the estimation of the local projections in Equation (3).
Figure 3 presents the estimated spillovers from euro area monetary policy to the US output
gap for the “no financial spillovers” (left-hand side panel) and the “financial spillovers” (right-
hand side panel) parametrisation. The black solid lines represent the true spillovers in the
data-generating process, and the red dashed lines the averages and medians of the spillover
estimates across replications of the Monte Carlo experiment. The results suggest that using
domestic monetary policy shock estimates obtained from a single-country model that does
4We standardise the time-series of all variables in Equation (2) in order to facilitate the comparison of themagnitudes of the coefficient estimates.
ECB Working Paper 2082, June 2017 10

not adequately account for the powerful financial spillover channels in the data produces
excessively large estimates of the spillovers from euro area monetary policy to the US. The
explanation for this result is that the euro area monetary policy shock estimates empea,t used
in the local projections in Equation (3) contain a US component. Specifically, as the US
component accounts for a large share of the variation in the euro area monetary policy shock
estimates under the “financial spillovers” parametrisation, the estimates of spillovers from
euro area monetary policy actually represent the effects of a US monetary policy shock on
US variables; and, of course, in the true data-generating process the domestic effects of a US
monetary policy shock are quantitatively significant (see Figure 7 in Appendix C.2).5
2.4 Testable predictions
We hypothesise that NK DSGE models used in the profession are generally subject to the
same failure to account for financial spillovers as the single-country models in the counter-
factual Monte Carlo experiment presented above. In the rest of this paper we thus test the
following three predictions from our hypothesis:
Prediction 1: Monetary policy shock estimates obtained from NK DSGE models are posi-
tively cross-country correlated.
Prediction 2: The cross-country correlation is larger for country pairs which are more sus-
ceptible to financial spillovers.
Prediction 3: Estimating the global effects of domestic monetary policy using the mone-
tary policy shock estimates obtained from NK DSGE models in time-series—such as local
projection—regressions results in large and implausibly similar spillover estimates for differ-
ent spillover-sending economies.
In order to test our hypothesis, we examine in a meta-study-like fashion whether Predictions
1-3 prevail in a sample of monetary policy shock estimates obtained from a wide range of NK
DSGE and non-NK DSGE models in the literature.
3 A monetary policy shock database
The database we have set up contains more than 280 time series of monetary policy shock
estimates. The monetary policy shock estimates pertain to 29 economies (see Table 1), and are
obtained from estimated NK DSGE models, various blends of VAR models (structural VAR
5Analogously, the estimates of the spillovers from euro area monetary policy to Japan would in fact representspillovers from US monetary policy to Japan, which are—due to the core properties of the US economy inour Monte Carlo experiment—notably larger than the true monetary policy spillovers from the euro area toJapan.
ECB Working Paper 2082, June 2017 11

and VECM models, factor-augmented VAR models, dynamic factor models), other statistical
models (term-structure models, shadow-rate models, Taylor-rule estimations), approaches
based on financial market expectations, as well as the narrative approach (see Table 2).
Tables 3 to 6 provide information on the reference, the time period coverage, the model type
and other characteristics of the models from which the monetary policy shock estimates are
obtained. One noteworthy observation is that only few of the NK DSGE models from which
the monetary policy shock estimates in our database stem have an explicit multi-country
dimension in the sense that they feature a foreign block (see Table 7); even fewer models
feature financial spillover channels based on frictions in international financial markets. The
sample period we consider for the analysis in the rest of this paper is 1993q1 to 2007q2. We
choose this period in order to maximise the length of the sample period while at the same time
having the shock time-series estimates overlap pair-wise for reasonably similar time periods.
3.1 Correlation patterns of monetary policy shock estimates
We start testing the predictions from our hypothesis by examining the correlation patterns
of the monetary policy shock estimates in our database. Figure 4 displays a heat map of the
correlations between the monetary policy shock estimates obtained from NK DSGE models.
The correlations between monetary policy shock estimates which stem from different NK
DSGE models but pertain to the same economy are located on the diagonal blocks; the
correlations between monetary policy shock estimates which stem from different NK DSGE
models and pertain to different economies are located on the off-diagonal blocks. The top
panel in Figure 5 shows the distribution of the cross-country correlations between monetary
policy shock estimates which stem from NK DSGE models. The mean of the cross-country
correlations is positive and statistically significantly different from zero. This evidence is
consistent with the first prediction from our hypothesis.
Recall that we hypothesise that monetary policy shock estimates obtained from NK DSGE
models are contaminated by a global component because the structure of these models typi-
cally does not account for economies’ susceptibility to monetary policy spillovers from abroad
through financial channels in the data. Given that we also have monetary policy shock esti-
mates obtained from non-NK DSGE models in our database, we can carry out placebo tests
of our hypothesis. Specifically, as non-NK DSGE models impose a looser structure on the
data, the cross-country correlation between the corresponding monetary policy shock esti-
mates obtained should be significantly smaller than for NK DSGE models.6 Accordingly, a
placebo test of the first prediction from our hypothesis is shown in the second panel in Fig-
ure 5: The mean of the cross-country correlations between monetary policy shock estimates
6Indeed, when we estimate country-specific VAR models on the simulated data in the Monte Carlo exper-iment in Section 2 and apply recursive identification, the resulting monetary policy shock estimates for theeuro area and Japan are on average uncorrelated.
ECB Working Paper 2082, June 2017 12

obtained from non-NK DSGE models is significantly smaller than in case of the NK DSGE
models.7
One might argue that the mean of the cross-country correlations for the monetary policy shock
estimates obtained from NK DSGE models displayed in the top panel in Figure 5—while being
positive—is rather small, questioning the importance of this finding. However, recall that
according to the second prediction from our hypothesis we expect contamination by a common
global component and thereby the cross-country correlations to be quantitatively significantly
larger than zero only for country pairs which are susceptible to financial spillovers, and thus
not necessarily for all country pairs. The third panel in Figure 5 suggests that the evidence
from our monetary policy shock estimates database is consistent with this prediction: The
cross-country correlations are substantially larger for advanced economies, which are typically
more financially integrated and thereby more susceptible to financial spillovers than emerging
market economies; and the fourth panel shows that the cross-country correlations are even
larger if we consider only pairs of economies which are particularly financially integrated.8
In the next section we explore the role of financial integration in the light of our hypothesis
in more detail.
3.2 The role of financial integration for cross-country correlations between
monetary policy shock estimates
According to the second prediction from our hypothesis, we expect contamination by a com-
mon global component and thereby the cross-country correlations to be larger for country
pairs which are more susceptible to financial spillovers from abroad. Moreover, also consis-
tent with the “global financial cycle” hypothesis (Rey, 2015), if the common component in
the monetary policy shock estimates is largely driven by the core economy’s monetary policy,
we expect the cross-country correlations to be larger for pairs of economies which are more
strongly integrated with US financial markets. In order to test these predictions, we consider
country-pair regressions. Specifically, suppose we have monetary policy shock estimates for
N economies in our database. Furthermore, suppose that for economy i we have a total of
Li monetary policy shock estimates, and that we refer to one of those series by `i; similarly,
suppose we have a total of Mj monetary policy shock estimates for economy j, and that we
7Of course one has to keep in mind the caveat that the finding that the monetary policy shock estimatesfrom non-NK DSGE models are uncorrelated across economies does not necessarily imply that they reflectdifferent objects. This point is made forcefully in the literature on the effects of monetary policy shocks inVAR models (see Bagliano and Favero, 1998; Sims, 1998).
8We consider the median of economies gross foreign asset and liability position relative to GDP in oursample as cutoff.
ECB Working Paper 2082, June 2017 13

refer to one of those time series by mj . We then estimate the regression
ρ`i,mj= αi + γj + xij · β + u`i,mj
, (4)
i, j = 1, 2, . . . , N, i 6= j, i, j 6= us, `i = 1, 2, . . . , Li, mj = 1, 2, . . . ,Mj ,
where αi and γj are country fixed effects, and xij includes measures of economy i’s and j’s
combined susceptibility to financial spillovers from the rest of the world as well as the US.
We measure the former by the product of economy i’s and j’s overall gross foreign asset and
liability position relative to GDP, and the latter by the product of the shares of economy i’s
and j’s bilateral gross foreign asset and liability position with the US in their overall external
balance sheet. The data are taken from the External Wealth of Nations (EWN) Database
of Lane and Milesi-Ferretti (2007) and the IMF’s Coordinated Portfolio Investment Survey
(CPIS).9 For easier interpretation we standardise the explanatory variables in Equation (4)
based on the moments in the baseline sample. We run the regression of Equation (4) on the
sample of cross-country correlations between monetary policy shock estimates obtained from
NK DSGE models. Also, in the baseline regression sample we only include economies for
which we have at least three NK DSGE model monetary policy shock time series estimates
in our database; this we do in order to preclude that our results are driven by economies
for which the information stems from a rather small number of models. Finally, we only
include cross-country correlations that are calculated on the basis of at least 16 time series
observations. Imposing these requirements implies dropping somewhat more than 10% of the
cross-country correlations of monetary policy shock estimates from our sample.10,11
The estimation results for Equation (4) are reported in columns (1) to (3) in Table 8. Con-
sistent with the second prediction from our hypothesis, the results indicate that the cross-
country correlations between monetary policy shock estimates obtained from NK DSGE
models are higher for pairs of economies which are more susceptible to financial spillovers
from the rest of the world and the US. The role of economies’ susceptibility to financial
spillovers for the mis-measurement of domestic monetary policy shock estimates in the NK
DSGE models in our database is also quantitatively significant: The cross-country correlation
between the monetary policy shock estimates for a pair of economies whose susceptibility to
financial spillovers is one standard deviation above the mean of all country pairs is higher by
0.08, which is approximately equal to the average cross-country correlation in our database
(see Figure 5).
Finally, also the second prediction from our hypothesis passes the placebo test: The results
9Figure 9 in Appendix C.3 presents economies’ overall and bilateral financial integration with the US inthe data.
10We consider all correlations ρ`i,mj whether or not they are statistically significantly different from zero inthe regression of Equation (4). Robustness checks in Section 4 document that our results are unchanged if weset to zero correlations which are not statistically significantly different from zero.
11In the estimation of the regression in Equation (4) we cluster standard errors at the country-pair level.
ECB Working Paper 2082, June 2017 14

reported in column (4) in Table 8 document that cross-country correlations between monetary
policy shock estimates obtained from non-NK DSGE models are not systematically related
to economies’ susceptibility to financial spillovers. This finding is not due to (i) differences
between the sets of country-pairs included in the sample underlying our baseline regression
and the non-NK DSGE sample (column (5)), or (ii) the possibility that the shock time series
estimates from VAR models, other statistical models, based on the narrative approach or
financial market expectations represent different aspects of monetary policy shocks (columns
(6) and (7)).
3.3 Spillover estimates
The third prediction from our hypothesis is that using shock estimates obtained from NK
DSGE models in time-series regressions to estimate the effects of domestic monetary policy
on the rest of the world produces large and implausibly similar spillover estimates for dif-
ferent spillover-sending economies. In order to test this prediction, we estimate the global
output spillovers from domestic monetary policy shocks using the shock estimates in our
database in local projections analogous to those in Equation (3). The sample we consider
includes quarterly observations for 45 spillover-receiving economies spanning—depending on
data availability—the time period from 1993q1 to 2007q2. For the dependent variable in the
local projections we consider the logarithm of economies’ real GDP. The control variables
include domestic and trading-partner short-term interest rates, consumer-price inflation, and
real GDP.12 We focus on the spillovers from monetary policy shocks for the US and the
euro area. For each spillover-sending economy we extract the first principal component from
all monetary policy shock time series estimates obtained from NK DSGE models which are
available for the entire time period from 1993q1 to 2007q2, and use that principal component
as shock measure in the estimation of the local projection.
The left-hand side panel in Figure 6 presents the averages of the estimates of the output
spillovers from US and the euro area monetary policy across spillover-recipient economies.
The estimates of the global output spillovers from monetary policy shocks in the US and
the euro area are very similar. This finding is at odds with what we would expect given the
differences in these two economies’ systemic importance for trade and finance in the global
economy (Bruno and Shin, 2015b,a; Gopinath, 2015; Casas et al., 2016). However, this finding
is consistent with the third prediction from our hypothesis that the spillover estimates reflect
12For data on real GDP, consumer price inflation and short-term interest rates we draw on the GVARToolbox (see Smith and Galesi, 2011). The economies included are Argentina, Australia, Austria, Belgium,Brazil, Canada, Chile, China, Germany, Finland, France, Indonesia, India, Italy, Japan, Mexico, Malaysia,Netherlands, Norway, New Zealand, Peru, Philippines, Singapore, South Africa, South Korea, Spain, Sweden,Switzerland, Thailand, Turkey, UK, and the US. We add data obtained from Haver Analytics for Bolivia,Colombia, Croatia, Czech Republic, Denmark, Hungary, Ireland, Israel, Poland, Portugal, Paraguay, Romania,and Russia. The trade weights we use for the calculation of country-specific trading partner variables stemfrom the IMF Direction of Trade Statistics.
ECB Working Paper 2082, June 2017 15

the effects of a global or US monetary policy shock by which the domestic monetary policy
shock estimates obtained from NK DSGE models for the euro area are contaminated.
Finally, also the third prediction from our hypothesis passes the placebo test: The right-
hand side panel in Figure 6 shows that when using the principal components of non-NK
DSGE model shock time series estimates in the local projections the estimates of the global
output spillovers from US monetary policy are notably larger than those from the euro area,
consistent with the extraordinary role of the US in the global economy.
4 Additional testable predictions, alternative explanations and
robustness checks
4.1 Additional testable predictions
4.1.1 Role of banking integration
The findings of research on financial integration prior to the global financial crisis allows us
to refine the second prediction from our hypothesis. Specifically, the literature has empha-
sised the role of cross-border banking linkages for the international transmission of monetary
policy in our sample period (see Goldberg, 2009; Cetorelli and Goldberg, 2012; Bruno and
Shin, 2015b,a; Morais et al., 2015; Hale et al., 2016). We therefore replace the cross-country
interaction between economies’ gross foreign asset and liability position relative to GDP in
Equation (4) by the interactions between portfolio, foreign direct and other investment rela-
tive to GDP. The results in column (2) in Table 9 suggest that contamination of monetary
policy shock estimates obtained from NK DSGE models in our database by a common global
component is indeed more severe for economies for which “other investment”—which includes
bank loans—accounts for a larger share in their overall gross foreign asset and liability po-
sition. Of course, the category of “other investment” also includes items unrelated to bank
loans, for example trade credit and advances, special drawing rights or currency and deposits.
Therefore, in column (3) we consider the ratio of non-resident bank loans relative to GDP as
an alternative and possibly more accurate measure of the importance of cross-border banking
linkages.13 The results are consistent with the evidence on the importance of global banking
integration for the international transmission of monetary policy prior to the global financial
crisis.
13The data originally stem from the Bank for International Settlements and are consolidated in the WorldBank’s Financial Development and Structure Dataset (see Cihak et al., 2012).
ECB Working Paper 2082, June 2017 16

4.1.2 Open-economy models
Another prediction from our hypothesis is that NK DSGE models that feature an explicit
open-economy dimension and/or frictions in international financial markets should be less
prone to labelling foreign monetary policy shocks as domestic ones when confronted with
the data. We test this prediction by entering dummy variables that equal unity in case at
least one of the shock estimates stems from a model with open-economy elements—a multi-
country model or a small open-economy model with or without financial spillover channels—
interacted with economies’ susceptibility to financial spillovers in the regression of Equation
(4). The results reported in Table 10 suggest that consistent with our baseline results the
contamination of monetary policy shock estimates by a common global component—and
thereby the cross-country correlations—is larger for economies which are more financially
integrated overall and with the US bilaterally, but that this is mitigated if the modelling
framework is a multi-country and/or small open-economy models with financial spillover
channels.14
4.1.3 Capital controls and exchange rate flexibility
According to the Mundellian trilemma in international macroeconomics, economies are less
susceptible to financial spillovers if they impose capital controls and/or let their exchange
rate float. As a consequence, for a given degree of susceptibility to financial spillovers as
measured by the stock of foreign assets and liabilities, we expect cross-country correlations
between monetary policy shock estimates in our database to be lower for pairs of economies
which impose capital controls and/or feature a higher degree of exchange rate flexibility.
In column (2) in Table 11 we therefore report results from the regression of Equation (4)
in which we include the products of economies’ capital controls and their exchange rate
flexibility as additional explanatory variables.15 Notice that this exercise is complicated
by possible endogeneity between the strength of financial spillovers—and thereby the cross-
country correlation between monetary policy shock estimates—and the degree of capital
controls as well as exchange rate flexibility: Economies which exhibit larger financial spillovers
should also be those which impose tighter capital controls and feature a flexible exchange
rate, precisely because they intend to shield their domestic financial markets from foreign
disturbances. However, notice that this endogeneity bias is working against finding evidence
for capital controls and flexible exchange rates reducing the cross-country correlations between
14We do not consider the observations on the cross-country correlations involving the monetary policyshock estimates from Vitek (2014), as these account for a very large share of the open-economy models in ourdatabase and as we want to preclude that the monetary policy shock estimates from one model might drivethe results. However, the results are similar when these are included.
15We measure capital controls by the first principal component of the capital control/capital account open-ness indicators of Chinn and Ito (2006), Quinn and Toyoda (2008), as well as Fernandez et al. (2015). Theindex of exchange rate flexibility is taken from Ilzetzki et al. (2010).
ECB Working Paper 2082, June 2017 17

the monetary policy shock estimates in the regression of Equation (4). The results in column
(3) indicate that cross-country correlations are indeed lower for—at least emerging market—
economies which impose capital controls and/or feature flexible exchange rates, even if the
relevant coefficient estimates are not large and/or estimated precisely, with p-values of around
11% and 18%.
4.2 Alternative explanations
4.2.1 Spillovers through trade
One might argue that an alternative explanation for the positive cross-country correlation be-
tween the monetary policy shock estimates in our database could be the existence of spillovers
through trade combined with common mistakes in assessing current and future economic con-
ditions by central banks in real time. Specifically, suppose the Federal Reserve and non-US
central banks, say the ECB and the Bank of Japan, all over-estimated real activity and infla-
tion in the US in real time. As a result, the Federal Reserve would tighten monetary policy.
Similarly, in order to mitigate the inflationary pressures from the expected stronger import
demand from the US, the ECB and the Bank of Japan would also tighten their monetary
policy. Ex post, the monetary policy tightening in the US, the euro area and Japan would be
interpreted as contractionary monetary policy shocks by the econometrician. Importantly,
these contractionary monetary policy shock estimates would be positively correlated across
the euro area and Japan. In this scenario, the cross-country correlation between the mon-
etary policy shock estimates arises due to trade integration between the US and the rest of
the world.16 As trade and financial market integration in the data are strongly positively
correlated, our baseline results in Table 8 might reflect omitted variable bias. However, our
results are unchanged when we include measures of economies’ overall trade integration and
their bilateral trade integration with the US as additional explanatory variables (column (2)
in Table 12).
4.2.2 Bilateral common component
One could also argue that the monetary policy shock estimates in our database are cross-
country correlated not because they contain a common global component, but because they
share a bilateral component. In particular, the cross-country correlation between monetary
policy shock estimates of two non-core economies could arise due to their bilateral trade and
16A variation of this argument is that the ECB and the Bank of Japan could actually loosen monetarypolicy in order to counter negative spillovers that follow from the tightening of monetary policy in the US.However, also under this scenario the monetary policy shocks of the euro area and Japan would be positivelycorrelated ex post.
ECB Working Paper 2082, June 2017 18

financial integration in connection with similar arguments on common mis-assessments of
future growth and inflation as in Section 4.2.1. However, our baseline results are unchanged
if we include in the regression of Equation (4) measures of the strength of economies’ bilateral
trade and financial integration (columns (3) and (4) in Table 12).17
4.2.3 Mis-specification of the Taylor-rule
Another alternative explanation for the cross-country correlation between the monetary pol-
icy shock estimates in our database could be mis-specification of the Taylor-rule in estimated
NK DSGE models. For example, economies might be subject to fear-of-floating even in the
absence of a formal peg due to currency mismatches on their external balance sheet (see
Calvo and Reinhart, 2002; Eichengreen et al., 2003). In such a setting, a depreciation of the
domestic currency in response to a tightening of foreign monetary policy increases the home-
currency value of domestic firms’ foreign liabilities denominated in foreign currency, which
are—at least in emerging economies—often not matched by foreign-currency cash flows. In
this case, foreign monetary policy would enter directly in the true domestic monetary policy
reaction function; estimates of domestic monetary policy shocks would then be contaminated
by foreign monetary policy shocks if the Taylor-rule specified in the NK DSGE model does
not account for the dependence of domestic on foreign monetary policy. However, our base-
line results are unchanged if we enter the interaction between economies’ net short position
in foreign currency as an additional explanatory variable (column (2) in Table 13).18 Cross-
country correlated monetary policy shock estimates could also arise if policymakers respond
to variables that are correlated across countries, but this is not accounted for in the Taylor-
rules specified in the NK DSGE models. However, our baseline results are unchanged if we
include a dummy variable indicating if at least one model features a Taylor-rule with open
economy elements (such as the exchange rate, terms of trade or commodity prices) or vari-
ables which indicate susceptibility to global shocks such as the interaction of economies’ share
of fuel, ore and metal imports and exports in total imports and exports, or a dummy variable
indicating if both economies are commodity exporters (see columns (3) to (5) in Table 13).
4.2.4 Common global demand and supply shocks
Finally, as discussed in Section 2, the lack of financial spillover channels in standard NK
DSGE models might not only give rise to a global monetary policy component in domestic
monetary policy shock estimates, but the common component might also consist of global
demand and supply shocks. Under this hypothesis, we would expect the global component
17For bilateral trade the data are taken from the IMF’s Direction of Trade Statistics and for bilateralfinancial integration from the IMF CPIS.
18The data on net foreign currency exposures are taken from Benetrix et al. (2015).
ECB Working Paper 2082, June 2017 19

in the domestic monetary policy shock estimates to be less strongly correlated for economies
that are more heterogeneous regarding their susceptibility to spillovers from a range of for-
eign shocks. In order to test this competing hypothesis, we consider additional explanatory
variables in the regression of Equation (4) that reflect the heterogeneity of economies along
a number of dimensions. Specifically, we enter the absolute value of differences in economies’
(i) overall trade integration with the rest of world, (ii) centrality in the global trade network,
(iii) position and participation in global value chains, as well as their (iv) output, export and
import structures.19 The results in Table 14 suggest our hypothesis that the common com-
ponent in the monetary policy shock estimates is indeed mainly related to a global monetary
policy shock.
4.3 Robustness
4.3.1 Alternative samples
It is worthwhile to slice our sample along several dimensions in order to explore the sensitivity
of our results. First, one could argue that most of the NK DSGE monetary policy shock
estimates in our database stem from parsimonious academic models that are meant to shed
light on a particular transmission channel rather than to produce accurate estimates of the
true monetary policy shocks. However, our results are unchanged if we restrict the sample
to cross-country correlations between monetary policy shock estimates that are obtained
from large and more sophisticated NK DSGE models used for policy advice at central banks
and international organisations (column (2) in Table 15). In fact, the average cross-country
correlation is equally large for monetary policy shock estimates that stem from structural
models used at central banks and international organisations.20
Around a quarter of the cross-country correlations in our sample involves monetary policy
shock estimates from the 40-country NK DSGE model of Vitek (2014). In order to ensure
that our results are not driven by the monetary policy shock estimates from one particular
19The measure for the heterogeneity of economies’ sectoral composition is the sum of the squared differencesbetween two economies’ output shares accounted for by a particular sector; for each sector, the squareddifference is weighted by the share of that sector in global output. Global value chain participation andposition are measures based on indirect and foreign value added. The data are taken from the World Input-Output Database (WIOD; Timmer et al., 2015). We use real GDP per capita and geographic variables inorder to impute the observations on the measure of sectoral composition and global value chain propertiesfor economies in our sample which are not available in the WIOD. Data on the centrality in the global tradenetwork are taken from CEPII.
20The average cross-country correlation for monetary policy shock estimates from the NK DSGE models inour database that are used at central banks and international organisations is 0.094, while for the remainingNK DSGE models the average correlation is 0.051. This difference is mostly due to differences between thesets of country-pairs included in the baseline sample and the central bank/international organisations sample:The average cross-country correlation between the monetary policy shock estimates obtained from academicNK DSGE models is 0.093 when only those country-pairs for which we also have shock estimates from modelsused at central banks or international organisations are considered.
ECB Working Paper 2082, June 2017 20

model, we exclude the shocks from Vitek (2014) from the regression sample (column (3) in
Table 15). The results suggest that the relationship between the cross-country correlations
and economies’ susceptibility to financial spillovers in our baseline results is not driven by
the monetary policy shock estimates obtained from Vitek (2014).
Recall that in our baseline regression sample we only include economies for which we have
at least three time series of monetary policy shock estimates and cross-country correlations
which are calculated on the basis of at least 16 time series observations. However, our results
do not change when we consider a sample which includes cross-country correlations of all NK
DSGE monetary policy shock estimates in our database (column (4) in Table 15).
Not all of the monetary policy shock estimates in our database can be made publicly available
due to confidentiality restrictions. However, our baseline results—and all specifications ex-
plored in this section—are robust to using only those monetary policy shock estimates which
can be made publicly available (column (5)).
One might argue that we should not base our findings on monetary policy shock estimates
obtained from studies which have not undergone peer review processes, as these might not
(yet) meet the quality standards of the profession. The results reported in Table 16 indicate
that our results are not driven by monetary policy shock estimates from non-peer-reviewed
studies. Whether we consider only monetary policy shock estimates from studies that have
been published in a journal or from studies which have been published in journals ranked
above a certain “Keele”-list threshold, our baseline results are—in particular taking into
account the substantial reduction in the sample—confirmed.
4.3.2 Alternative model specifications
In our baseline specification for the dependent variable we include cross-country correlations
regardless of whether or not they are statistically significantly different from zero. However,
our results are robust to setting the cross-country correlations ρ`i,mjon the left-hand side in
Equation (4) which are not statistically significantly different from zero at the 10% significance
level to zero (column (2) in Table 17).
One could also argue that our estimation could be inconsistent as our dependent variable
is bounded between minus/plus unity, which is not accounted for by a linear regression. A
common approach to circumvent this is to consider the logit transformation of the dependent
variable. Our results are not sensitive to this variation of the regression specification (column
(3) in Table 17). Moreover, our results are also robust to consider a Tobit regression, which
accounts for the censored nature of the dependent variable explicitly (column (4)).
We also consider a more general but significantly more strongly parameterised specification
ECB Working Paper 2082, June 2017 21

with shock-country instead of country fixed effects in Equation (4) by estimating
ρ`i,mj= α`i + γmj + xij · β + u`i,mj
. (5)
Column (5) in Table 17 documents that our results are unchanged for this alternative regres-
sion specification.
Robust (median) regression in column (6) in Table 17 that accounts for possible outliers
delivers results which are unchanged relative to the baseline.
Our baseline measure of economies’ susceptibility to financial spillovers—the product of their
financial integration—might be too crude to adequately capture asymmetries in the contam-
ination of domestic monetary policy shock estimates by a global component. Specifically,
consider two country pairs. In the first country pair, both economies are moderately suscep-
tible to financial spillovers from abroad. In the second country pair, one economy is highly
susceptible to financial spillovers, while the second economy is almost completely insulated
from global financial markets. While the product of economies’ susceptibility to financial
spillovers might be similar for both country pairs, we should expect different cross-country
correlations between their monetary policy shock estimates. In particular, because in the
second country pair one economy is essentially immune to financial spillovers in the data its
monetary policy shock estimates should not be contaminated by a common global component;
as a result, regardless of how severely contaminated the monetary policy shock estimates of
the other economy are, the cross-country correlation should be zero. Put differently, while
taking the product between economies’ susceptibility to financial spillovers as explanatory
variables does account for non-linearities, it might be that multiplication features too lit-
tle curvature in order to capture consistently the relationship between economies’ combined
susceptibility to financial spillovers and the extent of mis-measurement of the monetary pol-
icy shocks. Therefore, as an alternative we consider the minimum of the values of the two
economies’ susceptibility to financial spillovers. The results in column (7) in Table 17 are
unchanged compared to the baseline.
To the extent that we have monetary policy shock estimates from several NK DSGE models
for a given economy in our database, the sample we consider for the regression of Equation (4)
in the baseline in general includes a different number of observations on cross-country correla-
tions for country pair (i, j) than country pair (m, `). One reason we choose this specification
is that it implies a weighting of country-pair observations: A larger number of monetary
policy shock estimates exists for economies which have been studied more intensively and for
which data are more readily available; country pairs involving one or both of these economies
receive a greater weight in our baseline regression. However, one might want to ensure that
our results are not driven by such an implicit weighting. Therefore, we consider as depen-
dent variable in Equation (4) observations of the cross-country correlations ρ`i,mjaveraged
ECB Working Paper 2082, June 2017 22
within country pairs. However, at least for the overall susceptibility to financial spillovers,
our results are robust to this alternative specification (column (8) in Table 17).
4.3.3 US vs. euro area as core economy
Finally, one may wonder if the common global component in domestic monetary policy
shock estimates exclusively reflects a US component. In particular, for the many Euro-
pean economies in our sample the common component may also be driven by a euro area
component. Column (2) in Table 18 reports results from a regression of Equation (4) in
which we drop the cross-country correlations for country pairs that involve the euro area, in
addition to those that involve the US; we also enter as additional explanatory variable the
share of economies’ overall financial integration accounted for by the euro area. Essentially,
we hereby allow both the US and the euro area to represent core economies. The results
for the coefficient estimate on economies’ overall financial integration are unchanged. More
importantly, the coefficient estimates of the shares of economies’ overall financial integration
accounted for by the US or the euro area are both positive. This finding is consistent with
the notion that the common component in the monetary policy shock estimates contains
both a US and a euro area component. While the coefficient estimates are not statistically
significant at conventional significance levels, this finding nevertheless raises some doubts
concerning the unique role of the US in driving a global financial cycle as well as the common
component in the NK DSGE model monetary policy shock estimates in our database. Indeed,
if we augment the regression of Equation (4) by a variable reflecting the share of economies’
overall financial integration accounted for by the regional core—the euro area for European
and the US for all other country pairs—then among the bilateral share variables only the
coefficient estimate on this variable is statistically significant. Thus, the results are consistent
with notion of the euro area being the driver of the European financial cycle, while the US
that of the financial cycle of the rest of the world.
5 Conclusion
In this paper we provide evidence that is consistent with the hypothesis that many esti-
mated NK DSGE models in the literature erroneously label foreign monetary policy shocks
as domestic ones because they fail to adequately account for financial spillovers in the data.
Specifically, we document that there is a statistically and economically significant, positive
cross-country correlation between monetary policy shock estimates obtained from NK DSGE
models. Also, the correlations are larger for pairs of economies which are more susceptible to
financial spillovers in the data, as measured by their financial integration with the rest of the
world and the US. Finally, we document that shock estimates from NK DSGE models imply
ECB Working Paper 2082, June 2017 23

large and implausibly similar estimates for the global output spillovers from monetary policy
in a range of economies, such as the US and the euro area. The insights from this paper sug-
gest that if NK DSGE models are to be used for policy advice, they should feature powerful
financial spillover channels. Models without such elements are likely to provide misleading
historical decompositions and inconsistent parameter estimates.
ECB Working Paper 2082, June 2017 24

6 Acknowledgments
We would like to thank for sharing their code and/or data (in alphabetical order) PabloAguilar, Shahzad Ahmad, Viktors Ajevskis, Harun Alp, Sami Alpanda, Martin Andreasen,Katrin Assenmacher-Wesche, Uluc Aysun, Oxana Babecka-Kucharcukova, Emanuele Bac-chiocchi, Gregor Baeurle, Mehmet Balcilar, Alina Barnett, Mahdi Barakchian, Jean Barthelemy,Joselito Basilio, Daniel Beltran, Jonathan Benchimon, Konstantins Benkovskis, Alon Binyamini,Hilde Bjørnland, Martin Bodenstein, Michal Brzoza-Brzezina, Daniel Buncic, Matthias Burg-ert, Petre Caraiani, Julio Carrillo, Fabia de Carvalho, Michele Ca’Zorzi, Ambrogio Cesa-Bianchi, Jaqian Chen, Xiaoshan Chen, Kai Christoffel, Hess Chung, Edda Claus, FrancescoColumba, Mihai Copaciu, Vesna Corbo, Tobias Cwik, Vincent Dadam, Riccardo DiCecio,Taeyoung Doh, Mardi Dungey, Michael Ehrmann, Adam Elbourne, Selim Elekdag, An-gelo Fasolo, Daniel Felcser, Martin Feldkircher, Daria Finocchario, Jorge Fornero, MatteoFragetta, Takuji Fueki, Alain Gabler, Vasco Gabriel, Luca Gambetti, Carlos Garcia, An-drea Gazzani, Javier Garcia-Cicco, Paolo Gelain, Andrea Gerali, Karsten Gerdrup, TaniyaGhosh, Federico Giri, Caio Goncalves, Wildo Gonzalez, Denis Gorea, Rangan Gupta, YuongHa, Adnan Haider, Richard Harrison, Klemens Hauzenberger, Reinhold Henlein, Yasuo Hi-rose, Mathias Hoffmann, Nikolay Hristov, Patrick Huertgen, Matteo Iacoviello, PunnooseJacob, Nils Jannsen, Jiadan Jiang, Monika Junicke, Alain Kabundi, Sohei Kaihatsu, GunesKamber, Muneesh Kapur, Peter Karadi, Mitsuru Katagiri, Tae Bong Kim, Markus Kirchner,Bohdan Klos, Lena Korber, Jenny Korner, Dimitris Korobilis, Kevin Kotze, Michael Kuhl,Abhishek Kumar, Romain Lafarguette, Sean Langcakes, Stefan Laseen, Jungick Lee, Kir-dan Lees, Stefan Leist, Fernando Linardi, Marco Lo Duca, Matteo Luciani, Lena MalesevicPerovic, Shuyun May Li, Krzysztof Makarski, Martin Mandler, Pym Manopimoke, BrunoMartins, Renee McKibbin, Rossana Merola, Fabio Milani, Stephen Millard, Silvia Miranda-Agrippino, Benoit Mojon, Konstantinos Mouratidis, Haroon Mumtaz, Jouchi Nakajima,Ruthira Naraidoo, Jean-Marc Natal, Eliphas Ndou, Daniel Nemec, Matthias Neuenkirch,Eric Ng, Anh Nguyen, Kris Nimark, Victoria Nuguer, Alberto Ortiz, Oguzhan Ozcelebi,Alessia Paccagnini, Michael Paetz, Matthias Paustian, Jesper Pedersen, Tao Peng, NapatPhongluangtham, Massimiliano Pisani, Alexey Ponomarenko, Raluca Pop, Ioannis Pragidis,Dominic Quint, Mala Raghavan, Tovonony Razafindrabe, Daniel Rees, Muhammad Rehman,Sigal Ribon, Tim Robinson, Ørjan Robstad, Diego Rodriguez, Norberto Rodriguez Nino, Bar-bara Rudolph, Yuliya Rychalovska, Jakub Rysanek, Kouji Takahashi, Konstantinos Theodor-idis, Dawid Trzeciakiewicz, Tomohiro Tsugura, Stanislav Tvrz, Jean-Guillaume Sahuc, LucaSala, Frank Schorfheide, Roman Semko, Andrei Shulgin, Martin Slanicay, Juste Some, RudiSteinbach, Grzegorz Szafranski, Surach Tanboon, Jaromir Tonner, Lenno Uuskula, Joab DanValdivia Coria, Osvald Vasicek, Gauthier Vermandel, Fabio Verona, Alejandro Vicondoa, Ste-fania Villa, Francis Vitek, Balazs Vonnak, Graham Voss, Marija Vukotic, Ben Zhe Wang, RafWouters, Bo Yang, Pawel Zabzcyk, Francesco Zanetti, Juraj Zeman, Xuan Zhang, JasmineZheng, Peng Zhou and Sarah Zubairy.
Moreover, we would like to thank colleagues at Bank of Canada, Bank of Finland, Bank ofIsrael, Bank of Italy, Bank of Japan, Bank of Korea, Bank of Mexico, Bank of Russia, Bankof Thailand, Bundesbank, Central Bank of Brazil, Central Bank of Chile, Central Bank ofColombia, Central Bank of Iceland, Czech National Bank, European Central Bank, FederalReserve Board, International Monetary Fund, National Bank of Poland, National Bank ofRomania, Norges Bank, Reserve Bank of South Africa, Reserve Bank of Australia, Reserve
ECB Working Paper 2082, June 2017 25

Bank of New Zealand, Sveriges Riksbank, and Swiss National Bank, who helped the colleagueslisted above to make the data available to us.
We would also wish to thank for their comments Michael Binder, Alberto Ortiz Bolanos, Ben-jamin Born, Giancarlo Corsetti, Luca Dedola, Jesus Fernandez-Villaverde, Wouter den Haan,Jordi Gali, Robert Kollmann, Falk Mazelis, Paul McNelis, Luca Onorante, Gert Peersman,Bruce Preston, Giorgio Primiceri, Stephanie Schmitt-Grohe, Livio Stracca, Georg Strasser,Roland Straub, Cedric Tille, and Stanislav Tvrz.
Finally, we would also like to thank conference and seminar participants at European CentralBank, Asian Development Bank, Center for Latin American Monetary Studies, the Bank ofEngland-ECB-IMF workshop on “Global Spillovers: How much do we really know?”, theCEPR-IMFS Conference “New Methods for Macroeconomic Modelling, Model Comparisonand Policy Analysis”, the 6th Bangko Sentral ng Pilipinas International Research Confer-ence on “Revisiting Macro-financial Linkages”, the 6th IWH/INFER Workshop on “(Ending)Unconventional Monetary Policy”, the National Bank of Slovakia conference on “MonetaryPolicy Challenges from a Small Country Perspective”, the 20th International Conference onMacroeconomic Analysis and International Finance, the 31st Irish Economic Association An-nual Conference, the 21st Spring Meeting of Young Economists, the 9th FIW Research Con-ference on International Economics, and the 2016 Ioannina Meeting on Applied Economicsand Finance.
ECB Working Paper 2082, June 2017 26

References
Adame, F., Carrillo, J., Roldan-Pena, J., Zerecero, M., 2016. Financial Considerations in aSmall Open Economy Model for Mexico. mimeo.
Adolfson, M., Laseen, S., Christiano, L., Trabandt, M., Walentin, K., 2013. RAMSES II -Model Description. Sveriges Riksbank Occasional Paper 12.
Adolfson, M., Laseen, S., Linde, J., Svensson, L. E. O., 2011. Optimal monetary policy in anoperational medium-sized DSGE model. Board of Governors of the Federal Reserve SystemInternational Finance Discussion Papers 1023.
Aguilar, P., Vzquez, J., 2015. The Role of Term Structure in an Estimated DSGE Modelwith Learning. Universite Catholique de Louvain Institut de Recherches Economiques etSociales Discussion Paper 2015007.
Ahmad, S., 2017. Comparison of Forecasting Performance of DSGE And VAR Models: TheCase of Pakistan. mimeo.
Ahmed, W., Jahanzeb Malik, M., Rehman, M., 2014. Quarterly Bayesian DSGE Model ofPakistan Economy with Informality. State Bank of Pakistan Working Paper 68.
Ajevskis, V., Vitola, K., 2011. Fixed Exchange Rate Versus Inflation Targeting: Evidencefrom DSGE Modelling. Latvijas Banka Working Paper 2011/02.
Albonico, A., Paccagnini, A., Tirelli, P., 2014. Estimating a DSGE Model with LimitedAsset Market Participation for the Euro Area. University of Milano-Bicocca Departmentof Economics Working Papers 286.
Albonico, A., Paccagnini, A., Tirelli, P., forthcoming. In Search of the Euro Area FiscalStance. Journal of Empirical Finance.
Alp, H., Elekdag, S., 2013. The Role of Monetary Policy in Turkey During the Global Finan-cial Crisis. In: Braude, J., Eckstein, Z., Fischer, S., Flug, K. (Eds.), The Great Recession:Lessons for Central Bankers. MIT Press, pp. 51–80.
Alp, H., Elekdag, S., Lall, S., 2012. Did Korean Monetary Policy Help Soften the Impact ofthe Global Financial Crisis of 2008-2009? IMF Working Paper 12/5.
Alpanda, S., Aysun, U., 2014. International Transmission of Financial Shocks in an EstimatedDSGE Model. Journal of International Money and Finance 47 (C), 21–55.
Andreasen, M., 2012. An Estimated DSGE Model: Explaining Variation in Nominal TermPremia, Real Term Premia, and Inflation Risk Premia. European Economic Review 56 (8),1656–1674.
Andrle, M., 2014. Estimating Structural Shocks with DSGE Models. mimeo.
Argov, E., Barnea, E., Binyamini, A., Borenstein, E., Elkayam, D., Rozenshtrom, I., 2012.MOISE: A DSGE Model for the Israeli Economy. Bank of Israel Discussion Paper 2012.06.
Assenmacher-Wesche, K., 2008. Modeling Monetary Transmission in Switzerland with aStructural Cointegrated VAR Model. Swiss Journal of Economics and Statistics (SJES)144, 197–246.
ECB Working Paper 2082, June 2017 27

Avouyi-Dovi, S., Sahuc, J.-G., 2016. On the Sources of Macroeconomic Stability in the EuroArea. European Economic Review 83 (C), 40–63.
Azoulay, E., Ribon, S., 2010. A Basic Structural VAR of Monetary Policy in Israel UsingMonthly Frequency Data. Bank of Israel Discussion Paper (2010.04).
Babecka Kucharcukova, O., Claeys, P., Vasicek, B., 2016. Spillover of the ECB’s MonetaryPolicy Outside the Euro Area: How Different is Conventional From Unconventional Policy?Journal of Policy Modeling 38 (2), 199–225.
Bacchiocchi, E., Castelnuovo, E., Fanelli, L., forthcoming. Gimme a Break! Identification andEstimation of the Macroeconomic Effects of Monetary Policy Shocks in the US. Macroe-conomic Dynamics.
Bacchiocchi, E., Fanelli, L., 2015. Identification in Structural Vector Autoregressive Modelswith Structural Changes, with an Application to US Monetary Policy. Oxford Bulletin ofEconomics and Statistics 77 (6), 761–779.
Bagliano, F., Favero, C., 1998. Measuring Monetary Policy with VAR Models: An Evaluation.European Economic Review 42 (6), 1069–1112.
Banerjee, R., Devereux, M., Lombardo, G., 2016. Self-Oriented Monetary Policy, GlobalFinancial Markets and Excess Volatility of International Capital Flows. Journal of Inter-national Money and Finance 68, 275–297.
Barakchian, M., Crowe, C., 2013. Monetary Policy Matters: Evidence from New Shocks Data.Journal of Monetary Economics 60 (8), 950–966.
Baranowski, P., Gorajski, M., Malaczewski, M., Szafranski, G., 2016. Inflation in Polandunder State-dependent Pricing. Ekonomicky Casopis/Economic Journal 10 (64), 937–957.
Barigozzi, M., Conti, A. M., Luciani, M., October 2014. Do Euro Area Countries RespondAsymmetrically to the Common Monetary Policy? Oxford Bulletin of Economics andStatistics 76 (5), 693–714.
Barnett, W., Bhadury, S., Ghosh, T., 2015. An SVAR Approach to Evaluation of MonetaryPolicy in India: Solution to the Exchange Rate Puzzles in an Open Economy 201503.
Bekaert, G., Hoerova, M., Lo Duca, M., 2013. Risk, Uncertainty and Monetary Policy. Journalof Monetary Economics 60 (7), 771–788.
Beltran, D., Draper, D., 2008. Estimating the Parameters of a Small Open-Economy DSGEModel: Identifiability and Inferential Validity. International Finance Discussion Papers955.
Benchimol, J., 2016. Money and Monetary Policy in Israel During the Last Decade. Journalof Policy Modeling 38 (1), 103–124.
Benchimol, J., Fourcans, A., forthcoming. Money and Monetary Policy in the Eurozone: AnEmpirical Analysis During Crises. Macroeconomic Dynamics.
Benetrix, A., Lane, P., Shambaugh, J., 2015. International Currency Exposures, ValuationEffects and the Global Financial Crisis. Journal of International Economics 96 (S1), 98–209.
ECB Working Paper 2082, June 2017 28

Benkovskis, K., Bessonovs, A., Feldkircher, M., Worz, J., 2011. The Transmission of EuroArea Monetary Shocks to the Czech Republic, Poland and Hungary: Evidence from aFAVAR Model. Focus on European Economic Integration (3), 8–36.
Bernanke, B., 1986. Alternative Explanations of the Money-income Correlation. Carnegie-Rochester Conference Series on Public Policy 25 (1), 49–99.
Bernanke, B., Boivin, J., Eliasz, P., 2005. Measuring the Effects of Monetary Policy: A Factor-Augmented Vector Autoregressive (FAVAR) Approach. Quarterly Journal of Economics120 (1), 387–422.
Bernanke, B., Kuttner, K., 2005. What Explains the Stock Market’s Reaction to FederalReserve Policy? Journal of Finance 60 (3), 1221–1257.
Bernanke, B., Mihov, I., 1998. Measuring Monetary Policy. The Quarterly Journal of Eco-nomics 113 (3), 869–902.
Bhattaraia, K., Trzeciakiewiczb, D., 2017. Macroeconomic Impacts of Fiscal Policy Shocksin the UK: A DSGE Analysis. Economic Modelling 61, 321–338.
Binder, M., Chen, Q., Zhang, X., 2010. On the Effects of Monetary Policy Shocks on ExchangeRates. CESifo Working Paper 3162.
Bjørnland, H., Jacobsen, D., 2010. The Role of House Prices in the Monetary Policy Trans-mission Mechanism in Small Open Economies. Journal of Financial Stability 6 (4), 218–229.
Blanchard, O., 2016. Do DSGE Models Have a Future? PIIE Policy Brief PB16-11.
Boivin, J., Giannoni, M., Mojon, B., December 2009. How Has the Euro Changed the Mon-etary Transmission Mechanism? In: NBER Macroeconomics Annual 2008, Volume 23.NBER Chapters. National Bureau of Economic Research, pp. 77–125.
Bong, K. S., Doh, T., Park, W. Y., 2016. Yield Curve and Monetary Policy Expectations inSmall Open Economies. Federal Reserve Bank of Kansas City Working Paper 14-13.
Brayton, F., Laubach, T., Reifschneider, D., 2014. The FRB/US Model: A Tool for Macroeco-nomic Policy Analysis. FEDS Notes 2014-11-21, Board of Governors of the Federal ReserveSystem.
Breuss, F., Fornero, J., 2009. An Estimated DSGE Model of Austria, the Euro Area and theUS: Some Welfare Implications of EMU. FIW Working Paper 034.
Bruno, V., Shin, H. S., 2015a. Capital Flows and the Risk-taking Channel of Monetary Policy.Journal of Monetary Economics 71 (C), 119–132.
Bruno, V., Shin, H. S., 2015b. Cross-Border Banking and Global Liquidity. Review of Eco-nomic Studies 82 (2), 535–564.
Brzoza-Brzezina, M., Makarski, K., 2011. Credit crunch in a small open economy. Journal ofInternational Money and Finance 30 (7), 1406–1428.
Burgess, S., Fernandez-Corugedo, E., Groth, C., Harrison, R., Monti, F., Theodoridis, K.,Waldron, M., 2013. The Bank of England’s Forecasting Platform: COMPASS, MAPS,EASE and the Suite of Models. Bank of England Working Paper 471.
ECB Working Paper 2082, June 2017 29

Burlon, L., Notarpietro, A., Pisani, M., 2016. Forecasting for a Large-scale Open-economyDSGE Model for the Euro Area. mimeo.
Caglayan, M., Kandemir Kocaaslan, O., Mouratidis, K., 2016. Financial Depth and theAsymmetric Impact of Monetary Policy. Oxford Bulletin of Economics and Statistics.
Calvo, G., Reinhart, C., 2002. Fear of Floating. The Quarterly Journal of Economics 117 (2),379–408.
Canova, F., 2005. The Transmission of US Shocks to Latin America. Journal of AppliedEconometrics 20 (2), 229–251.
Carabenciov, I., Ermolaev, I., Freedman, C., Juillard, M., Kamenik, O., Korshunov, D.,Laxton, D., Laxton, J., 2008. A Small Quarterly Multi-Country Projection Model withFinancial-Real Linkages and Oil Prices. IMF Working Paper 08/208.
Caraiani, P., 2013. Comparing Monetary Policy Rules in CEE Economies: A Bayesian Ap-proach. Economic Modelling 32 (C), 233–246.
Carlstrom, C., Fuerst, T., Ortiz, A., Paustian, M., 2014. Estimating Contract Indexation in aFinancial Accelerator Model. Journal of Economic Dynamics and Control 46 (C), 130–149.
Casas, C., Diez, F., Gopinath, G., Gourinchas, P.-O., 2016. Dominant Currency Paradigm.NBER Working Papers 22943.
Ca’Zorzi, M., Kolasa, M., Rubaszek, M., 2016. Exchange Rate Forecasting with DSGE Mod-els. ECB Working Paper 1905.
Cesa-Bianchi, A., Thwaites, G., Vicondoa, A., 2016. Monetary Policy Transmission in anOpen Economy: New Data and Evidence from the United Kingdom. mimeo.
Cetorelli, N., Goldberg, L., 2012. Banking Globalization and Monetary Transmission. Journalof Finance 67 (5), 1811–1843.
Chen, J., Columba, F., 2016. Macroprudential and Monetary Policy Interactions in a DSGEModel for Sweden. IMF Working Paper 16/74.
Chen, Q., Filardo, A., He, D., Zhu, F., 2016. Financial Crisis, US Unconventional MonetaryPolicy and International Spillovers. Journal of International Money and Finance 67 (C),62–81.
Chen, X., Macdonald, R., 2012. Realized and Optimal Monetary Policy Rules in an EstimatedMarkovSwitching DSGE Model of the United Kingdom. Journal of Money, Credit andBanking 44 (6), 1091–1116.
Chin, M., Filippeli, T., Theodoridis, K., 2015. Cross-country Co-movement in Long-termInterest Rates: A DSGE Approach. Bank of England Working Paper 530.
Chinn, M., Ito, H., 2006. What Matters for Financial Development? Capital Controls, Insti-tutions, and Interactions. Journal of Development Economics 81 (1), 163–192.
Christiano, L., Eichenbaum, M., Evans, C., 1999. Monetary Policy Shocks: What Have WeLearned and to What End? In: Taylor, J. B., Woodford, M. (Eds.), Handbook of MonetaryEconomics. Amsterdam: Elsevier Science, pp. 65–148.
ECB Working Paper 2082, June 2017 30

Christiano, L. J., Eichenbaum, M., Evans, C. L., 2005. Nominal Rigidities and the DynamicEffects of a Shock to Monetary Policy. Journal of Political Economy 113 (1), 1–45.
Christiano, L. J., Motto, R., Rostagno, M., 2014. Risk Shocks. American Economic Review104 (1), 27–65.
Christoffel, K., Coenen, G., Warne, A., 2008. The New Area-Wide Model of the Euro Area: AMicro-Founded Open-Economy Model for Forecasting and Policy Analysis. ECB WorkingPaper 0944.
Chung, H., Kiley, M., Laforte, J.-P., 2010. Documentation of the Estimated, Dynamic,Optimization-based (EDO) model of the U.S. economy: 2010 Version. Board of Gover-nors of the Federal Reserve System Finance and Economics Discussion Series 2010-29.
Cihak, M., Demirguc-Kunt, A., Feyen, E., Levine, R., 2012. Benchmarking Financial SystemsAround the World. World Bank Policy Research Working Paper 6175.
Claus, E., Claus, I., Krippner, L., 2016. Monetary Policy Spillovers across the Pacific whenInterests are at the Zero Lower Bound. Asian Economic Papers 15 (3), 1–27.
Claus, E., Dungey, M., 2012. US Monetary Policy Surprises: Identification with Shifts andRotations in the Term Structure. Journal of Money, Credit and Banking 44 (7), 1443–1453.
Claus, E., Dungey, M., 2016. Can Monetary Policy Surprises Affect the Term Structure?Journal of Macroeconomics 47, 68–83.
Cloyne, J., Hurtgen, P., forthcoming. The Macroeconomic Effects of Monetary Policy: ANew Measure for the United Kingdom. American Economic Journal: Macroeconomics.
Coenen, G., Wieland, V., 2002. Inflation Dynamics and International Linkages: A Model ofthe United States, the Euro Area and Japan. ECB Working Paper 0181.
Copaciu, M., Nalban, V., Bulete, C., 2016. R.E.M. 2.0 - A DSGE Model with Partial Eu-roization Estimated for Romania. National Bank of Romania Occasional Papers 21.
Cuche-Curti, N., Dellas, H., Natal, J.-M., 2009. A Dynamic Stochastic General EquilibriumModel for Switzerland. Swiss National Bank Economic Studies 2009-05.
Dadam, V., Viegi, N., 2014. Labour Market and Monetary Policy in South Africa. In: Four-teen Years of Inflation Targeting in South Africa and the Challenge of a Changing Mandate.South African Reserve Bank, pp. 113–137.
Dai, L., Minford, P., Zhou, P., 2015. A DSGE Model of China. Applied Economics 47 (59),6438–6460.
de Carvalho, F. A., Castro, M. R., May 2015. Foreign Capital Flows, Credit Growth andMacroprudential Policy in a DSGE Model with Traditional and Matter-of-Fact FinancialFrictions. Central Bank of Brazil, Research Department Working Paper Series (387).
de Carvalho, F. A., Castro, M. R., Costa, S. M. A., 2014. Traditional and Matter-of-factFinancial Frictions in a DSGE Model for Brazil: The Role of Macroprudential Instrumentsand Monetary Policy.
ECB Working Paper 2082, June 2017 31

de Carvalho, F. A., Valli, M., Apr. 2011. Fiscal Policy in Brazil through the Lens of an Esti-mated DSGE Model. Central Bank of Brazil, Research Department Working Paper (240).
Dedola, L., Lombardo, G., 2012. Financial Frictions, Financial Integration and the Interna-tional Propagation of Shocks. Economic Policy 27 (70), 319–359.
Dedola, L., Rivolta, G., Stracca, L., 2015. When the Fed Sneezes, Who Gets a Cold? mimeo.
Devereux, M., Yetman, J., 2010. Leverage Constraints and the International Transmission ofShocks. Journal of Money, Credit and Banking 42 (s1), 71–105.
di Giovanni, J., Shambaugh, J., 2008. The Impact of Foreign Interest Rates on the Economy:The Role of the Exchange Rate Regime. Journal of International Economics 74 (2), 341–361.
DiCecio, R., Nelson, E., November 2010. Euro Membership as a U.K. Monetary Policy Op-tion: Results from a Structural Model. In: Europe and the Euro. NBER Chapters. NationalBureau of Economic Research, Inc, pp. 415–439.
Dorich, J., Johnston, M., Mendes, R., Murchison, S., Zhang, Y., 2013. ToTEM II: An Up-dated Version of the Bank of Canada’s Quarterly Projection Model. Technical Reports 100,Bank of Canada.
Drygalla, A., 2015. Switching to Exchange Rate Flexibility? The Case of Central and EasternEuropean Inflation Targeters. FIW Working Paper 139.
Dungey, M., Osborn, D., 2014. Modelling Large Open Economies With International Link-ages: The Usa And Euro Area. Journal of Applied Econometrics 29 (3), 377–393.
Dungey, M., Osborn, D., Raghavan, M., 2014. International Transmissions to Australia: TheRoles of the USA and Euro Area. The Economic Record 90 (291), 421–446.
Ehrmann, M., Fratzscher, M., 2003. Monetary Policy Announcements and Money Markets:A Transatlantic Perspective. International Finance 6 (3), 309–28.
Ehrmann, M., Fratzscher, M., 2005. Equal Size, Equal Role? Interest Rate InterdependenceBetween the Euro Area and the United States. Economic Journal 115 (506), 928–948.
Ehrmann, M., Fratzscher, M., 2009. Global Financial Transmission of Monetary PolicyShocks. Oxford Bulletin of Economics and Statistics 71 (6), 739–759.
Ehrmann, M., Fratzscher, M., Rigobon, R., 2011. Stocks, Bonds, Money Markets and Ex-change Rates: Measuring International Financial Transmission. Journal of Applied Econo-metrics 26 (6), 948–974.
Eichengreen, B., Hausmann, R., Panizza, U., 2003. Le peche originel: Le calvaire, le mystereet le chemin de la redemption. L’Actualite Economique 79 (4), 419–455.
Ellis, C., Mumtaz, H., Zabczyk, P., 05 2014. What Lies Beneath? A Time-varying FAVARModel for the UK Transmission Mechanism. Economic Journal 124 (576), 668–699.
Errit, G., Uuskula, L., 2014. Euro Area Monetary Policy Transmission in Estonia. BalticJournal of Economics 14 (1-2), 55–77.
ECB Working Paper 2082, June 2017 32

Faccini, R., Millard, S., Zanetti, F., 2013. Wage Rigidities in an Estimated Dynamic, Stochas-tic, General Equilibrium Model of the UK Labour Market. The Manchester School 81,66–99.
Felcser, D., Vonnak, B., 2014. Carry Trade, Uncovered Interest Parity and Monetary Policy.MNB Working Papers 2014/3.
Feldkircher, M., Huber, F., 2015. The International Transmission of US Structural Shocks:Evidence from Global Vector Autoregressions. European Economic Review 81, 167–188.
Feldkircher, M., Huber, F., 2016. The International Transmission of US Shocks: Evidencefrom Bayesian Global Vector Autoregressions. European Economic Review 81 (C), 167–188.
Fernandez, A., Klein, M., Rebucci, A., Schindler, M., Uribe, M., 2015. Capital ControlMeasures: A New Dataset. NBER Working Paper 20970.
Feve, P., Sahuc, J.-G., 2016. In Search of the Transmission Mechanism of Fiscal Policy in theEuro Area. Journal of Applied Econometrics.
Forni, M., Gambetti, L., 2010. The Dynamic Effects of Monetary Policy: A Structural FactorModel Approach. Journal of Monetary Economics 57 (2), 203–216.
Fragetta, M., Melina, G., 2013. Identification of Monetary Policy in SVAR Models: A Data-oriented Perspective. Empirical Economics 45 (2), 831–844.
Fueki, T., Fukunaga, I., Ichiue, H., Shirota, T., 2016. Measuring Potential Growth with anEstimated DSGE Model of Japan’s Economy. International Journal of Central Banking12 (1), 1–32.
Furlanetto, F., Gelain, P., Sanjani, M., 2014. Output Gap in Presence of Financial Frictionsand Monetary Policy Trade-offs. IMF Working Paper 14/128.
Gabriel, V., Levine, P., , Yang, B., 2016. An Estimated DSGE Open-Economy Model of theIndian Economy with Financial Frictions. In: Ghate, C., Kletzer, K. (Eds.), MonetaryPolicy in India: A Modern Macroeconomic Perspective. Springer.
Gabriel, V., Levine, P., Pearlman, J., Yang, B., 2012. An Estimated DSGE Model of theIndian Economy. In: Ghate, C. (Ed.), Oxford Handbook of the Indian Economy. OxfordUniversity Press.
Gadatsch, N., Hauzenberger, K., Stahler, N., 2016. Fiscal Policy During the Crisis: A Lookon Germany and the Euro Area with GEAR. Economic Modelling 52 (PB), 997–1016.
Galı, J., Gambetti, L., 2015. The Effects of Monetary Policy on Stock Market Bubbles: SomeEvidence. American Economic Journal: Macroeconomics 7 (1), 233–57.
Gallic, E., Vermandel, G., 2016. Climate Shocks and Business Cycles. mimeo.
Garcia, C., Gonzalez, W., 2014. Why Does Monetary Policy Respond to the Real ExchangeRate in Small Open Economies? A Bayesian Perspective. Empirical Economics 46 (3),789–825.
Gazzani, A., Vicondoa, A., 2016. Proxy-SVAR as a Bridge between Mixed Frequencies.mimeo.
ECB Working Paper 2082, June 2017 33

Gelain, P., 2010. The External Finance Premium in the Euro Area: A Dynamic StochasticGeneral Equilibrium Analysis. The North American Journal of Economics and Finance21 (1), 49–71.
Georgiadis, G., 2016. Determinants of Global Spillovers from US Monetary Policy. Journalof International Money and Finance 67, 41–61.
Gerali, A., Neri, S., Sessa, L., Signoretti, F. M., 2010. Credit and Banking in a DSGE Modelof the Euro Area. Journal of Money, Credit and Banking 42 (1), 107–141.
Gerdrup, K., Motzfeldt Kravik, E., Saterhagen Paulsen, K., 2017. Documentation of NEMO- Norges Bank’s Core Model for Monetary Policy Analysis and Forecasting. mimeo.
Gertler, M., Karadi, P., 2011. A Model of Unconventional Monetary Policy. Journal of Mon-etary Economics 58 (1), 17–34.
Gertler, M., Karadi, P., 2015. Monetary Policy Surprises, Credit Costs, and Economic Ac-tivity. American Economic Journal: Macroeconomics 7 (1), 44–76.
Gertler, M., Sala, L., Trigari, A., 2008. An Estimated Monetary DSGE Model with Unem-ployment and Staggered Nominal Wage Bargaining. Journal of Money, Credit and Banking40 (8), 1713–1764.
Gervais, O., Gosselin, M.-A., 2014. Analyzing and Forecasting the Canadian Economythrough the LENS Model. Technical Reports 102, Bank of Canada.
Ghosh, A., Qureshi, M., Kim, J., Zalduendo, J., 2014. Surges. Journal of International Eco-nomics 92 (2), 266–285.
Giri, F., 2014. Does Interbank Market Matter for Business Cycle Fluctuation? An EstimatedDSGE Model with Financial Frictions for the Euro Area. Universita’ Politecnica delleMarche Dipartimento di Scienze Economiche e Sociali Working Paper 398.
Goldberg, L., 2009. Understanding Banking Sector Globalization. IMF Staff Papers 56 (1),171–197.
Gonzalez, A., Hamann, F., Rodriguez, D., 2015. Macroprudential Policies in a CommodityExporting Economy. BIS Working Paper 506.
Gopinath, G., 2015. The International Price System. NBER Working Papers 21646.
Goyal, A., Kumar, A., 2016. A DSGE Model-Based Analysis of The Indian Slowdown. mimeo.
Grabek, G., Klos, B., 2013. Unemployment in the Estimated New Keynesian SoePL-2012DSGE Model. National Bank of Poland Working Paper 144.
Gregor Baurle, M. G., Kanzig, D., 2016. Time-Varying Effects of Oil Supply Shocks on theUS Economy. mimeo.
Gupta, R., Steinbach, R., 2013. A DSGE-VAR Model for Forecasting Key South AfricanMacroeconomic Variables. Economic Modelling 33, 19–33.
Hale, G., Kapan, T., Minoiu, C., 2016. Crisis Transmission in the Global Banking Network.IMF Working Paper 16/91.
ECB Working Paper 2082, June 2017 34

Harrison, R., Oomen, O., 2010. Evaluating and Estimating a DSGE Model for the UnitedKingdom. Bank of England Working Paper 380.
Heinlein, R., Krolzig, H.-M., 2013. Monetary Policy and Exchange Rates: A Balanced Two-Country Cointegrated VAR Model Approach 1321.
Herber, P., Nemec, D., 2009. Estimating Output Gap in the Czech Republic: DSGE Ap-proach. Mathematical Methods in Economics 8, 117–124.
Herber, P., Nemec, D., 2012. Investigating Structural Differences of the Czech Economy:Does Asymmetry of Shocks Matter? Bulletin of the Czech Econometric Society 19 (29).
Hernan Hernandez, M., Ortiz Bolanos, A., 2016. Monetary and Fiscal Policies in Latin Amer-ica: Evidence from an Estimated DSGE Model. mimeo.
Hirose, Y., 2014. An Estimated DSGE Model with a Deflation Steady State. CAMA WorkingPaper 2014-52.
Hristov, N., 2016. The Ifo DSGE Model for the German Economy. Ifo Working Paper 210.
Iacoviello, M., Minetti, R., 2006. International Business Cycles with Domestic and ForeignLenders. Journal of Monetary Economics 53 (8), 2267–2282.
Iacoviello, M., Neri, S., 2010. Housing Market Spillovers: Evidence from an Estimated DSGEModel. American Economic Journal: Macroeconomics 2 (2), 125–64.
Ilzetzki, E., Reinhart, C., Rogoff, K., 2010. Exchange Rate Arrangements Entering the 21stCentury: Which Anchor Will Hold? mimeo, London School of Economics.
IMF, 2017. Are Countries Losing Control of Domestic Financial Conditions? In: GlobalFinancial Stability Report, Chpt. 3.
Ito, H., 2014. Monetary Policy in Asia and the Pacific in the Post, Post-Crisis Era. mimeo.
Jacob, P., Munro, A., 2016. A Macroprudential Stable Funding Requirement and MonetaryPolicy in a Small Open Economy DP2016/04.
Jannsen, N., Klein, M., 2011. The International Transmission of Euro Area Monetary PolicyShocks. Kiel Institute for the World Economy Working Paper 1718.
Jiang, J., Kim, D., 2013. Is China’s Monetary Policy Effective? Evaluating the VAR Evidence.China Economic Policy Review 2 (2), 1–21.
Jorda, O., 2005. Estimation and Inference of Impulse Responses by Local Projections. Amer-ican Economic Review 95 (1), 161–182.
Junicke, M., 2015. Trend inflation and monetary policy in Eastern Europe. mimeo.
Justiniano, A., Preston, B., 2010. Can Structural Small Open-economy Models Account forthe Influence of Foreign Disturbances? Journal of International Economics 81 (1), 61–74.
Kaihatsu, S., Kurozumi, T., 2014. Sources of Business Fluctuations: Financial or TechnologyShocks? Review of Economic Dynamics 17 (2), 224–242.
ECB Working Paper 2082, June 2017 35

Kamber, G., McDonald, C., Sander, N., Theodoridis, K., 2016. Modelling the Business Cycleof a Small Open Economy: The Reserve Bank of New Zealand’s DSGE Model. EconomicModelling 59, 546–569.
Kamber, G., Millard, S., December 2012. Using Estimated Models to Assess Nominal andReal Rigidities in the United Kingdom. International Journal of Central Banking 8 (4),97–119.
Kamber, G., Smith, C., Thoenissen, C., 2015. Financial Frictions and The role of Investment-specific Technology Shocks in the Business Cycle. Economic Modelling 51, 571–582.
Kapur, M., Behera, H., 2012. Monetary Transmission Mechanism in India: A QuarterlyModel. mimeo.
Katagiri, M., Takahashi, K., 2016. The Effects of Unconventional Monetary Policy in anOpen Economy. mimeo.
Kim, S., 2001. International Transmission of U.S. Monetary Policy Shocks: Evidence fromVAR’s. Journal of Monetary Economics 48 (2), 339–372.
Kim, T. B., 2014. Analysis on Korean Economy with an Estimated DSGE Model after 2000.KDI Journal of Economic Policy 36 (2), 1–64.
Kimura, T., Nakajima, J., 2016. Identifying Conventional and Unconventional MonetaryPolicy Shocks: A Latent Threshold Approach. The B.E. Journal of Macroeconomics 16 (1),277–300.
Klein, M., Shambaugh, J., 2015. Rounding the Corners of the Policy Trilemma: Sources ofMonetary Policy Autonomy. American Economic Journal: Macroeconomics 7 (4), 33–66.
Kollmann, R., Enders, Z., Muller, G., 2011. Global banking and international business cycles.European Economic Review 55 (3), 407–426.
Kollmann, R., Pataracchia, B., Raciborski, R., Ratto, M., Roeger, W., Vogel, L., 2016. ThePost-Crisis Slump in the Euro Area and the US: Evidence from an Estimated Three-regionDSGE Model. European Economic Review C (88), 21–41.
Korner, J., 2015. Monetary Transmission in the Czech Republic after the Transformation.Eastern European Business and Economics Journal 1 (3), 19–47.
Kuhl, M., 2016. The effects of government bond purchases on leverage constraints of banksand non-financial firms. Bundesbank Discussion Paper (38/2016).
Lane, P. R., Milesi-Ferretti, G. M., 2007. The External Wealth of Nations Mark II: Revisedand Extended Estimates of Foreign Assets and Liabilities, 1970-2004. Journal of Interna-tional Economics 73 (2), 223–250.
Leist, S., 2013. Driving Forces of the Swiss Output Gap. Swiss Journal of Economics andStatistics 149 (IV), 493–531.
Li, S., Spencer, A., 2015. Effectiveness of the Australian Fiscal Stimulus Package: A DSGEAnalysis. Economic Record 92, 94–120.
ECB Working Paper 2082, June 2017 36

Linardi, F., 2016. Assessing the Fit of a Small Open-economy DSGE Model for the BrazilianEconomy. Central Bank of Brazil WOrking Paper 424.
Lopez, M., Prada, J., Rodriguez, N., 2008. Financial Accelerator Mechanism in a Small OpenEconomy. Banco de la Republica de Colombia Borradores de Economia 525.
Lopez, M., Rodriguez, N., 2008. Financial Accelerator Mechanism: Evidence for Colombia.Banco de la Republica de Colombia Borradores de Economia 481.
Luciani, M., 03 2015. Monetary Policy and the Housing Market: A Structural Factor Analysis.Journal of Applied Econometrics 30 (2), 199–218.
Malakhovskaya, O., Minabutdinov, A., 2014. Are Commodity Price Shocks Important? ABayesian Estimation of a DSGE Model for Russia. International Journal of ComputationalEconomics and Econometrics 4 (1/2), 148–180.
Mandler, M., Scharnagl, M., Volz, U., 2016. Heterogeneity in euro-area monetary policytransmission: Results from a large multi-country BVAR model. Deutsche BundesbankDiscussion Paper 03/2016.
Medina, J. P., Soto, C., 2007. The Chilean Business Cycles Through the Lens of a StochasticGeneral Equilibrium Model. Central Bank of Chile Working Papers 457.
Melecky, M., Buncic, D., 2008. An Estimated, New Keynesian Policy Model for Australia.Economic Record 84 (264), 1–16.
Merola, R., 2015. The role of financial frictions during the crisis: An estimated DSGE model.Economic Modelling 48 (C), 70–82.
Milani, F., 2011. The Impact of Foreign Stock Markets on Macroeconomic Dynamics in OpenEconomies: A Structural Estimation. Journal of International Money and Finance 30 (1),111–129.
Milani, F., Park, S. H., 2015. The Effects of Globalization on Macroeconomic Dynamics in aTrade-dependent EEconomy: The Case of Korea. Economic Modelling 48 (C), 292–305.
Minetti, R., Peng, T., forthcoming. Credit Policies, Macroeconomic Stability and Welfare:The Case of China. Journal of Comparative Economics.
Miranda-Agrippino, S., 2016. Unsurprising Shocks: Information, Premia, and the MonetaryTransmission. Bank of England Working Paper 626.
Miranda-Agrippino, S., Rey, H., 2015. World Asset Markets and the Global Financial Cycle.NBER Working Paper 21722.
Miyajima, K., Mohanty, M., Yetman, J., 2014. Spillovers of US Unconventional MonetaryPolicy to Asia: The Role of Long-term Interest Rates. BIS Working Paper 478.
Morais, B., Peydro, J., Ruiz, C., 2015. The International Bank Lending Channel of Mone-tary Policy Rates and QE: Credit Supply, Reach-for-Yield, and Real Effects. InternationalFinance Discussion Papers 1137.
Mumtaz, H., Theophilopoulou, A., 2016. The Impact of Monetary Policy on Inequality in theUK: An Empirical Analysis. Queen Mary University of London Working Paper 738.
ECB Working Paper 2082, June 2017 37

Naraidoo, R., Paya, I., 2012. Forecasting Monetary Policy Rules in South Africa. InternationalJournal of Forecasting 28 (2), 446–455.
Ncube, M., Ndou, E., 2011. Monetary Policy Transmission, House Prices and ConsumerSpending in South Africa: An SVAR Approach. African Development Bank Working Paper317.
Ncube, M., Ndou, E., 2013. Monetary Policy and Exchange Rate Shocks on South AfricanTrade Balance. African Development Bank Working Paper 448.
Neuenkirch, M., 2013. Monetary Policy Transmission in Vector Autoregressions: A NewApproach Using Central Bank Communication. Journal of Banking & Finance 37 (11),4278–4285.
Nguyen, A., 2015. Financial Frictions and the Volatility of Monetary Policy in a DSGEModel. Lancaster University Management School Economics Department Working Paper2015/006.
Nobili, A., Neri, S., 2006. The Transmission of Monetary Policy Shocks from the US to theEuro Area. Bank of Italy Temi di Discussione 606.
Nuguer, V., 2016. Financial Intermediation in a Global Environment. International Journalof Central Banking 12.
Obstfeld, M., 2015. Trilemmas and Trade-offs: Living with Financial Globalisation. BISWorking Paper 480.
Obstfeld, M., Rogoff, K., 1996. Foundations of International Macroeconomics. No.0262150476. The MIT Press.
Obstfeld, M., Shambaugh, J., Taylor, A., 2005. The Trilemma in History: Tradeoffs AmongExchange Rates, Monetary Policies, and Capital Mobility. The Review of Economics andStatistics 87 (3), 423–438.
Paetz, M., Gupta, R., 2016. Stock Price Dynamics and the Business Cycle in an EstimatedDSGE Model for South Africa. Journal of International Financial Markets, Institutionsand Money 18 (1), 166–182.
Passari, E., Rey, H., 2015. Financial Flows and the International Monetary System. EconomicJournal 125 (584), 675–698.
Patra, M., Kapur, M., 2012. A Monetary Policy Model for India. Macroeconomics and Fi-nance in Emerging Market Economies 5 (1), 18–41.
Peersman, G., Smets, F., 2001. The Monetary Transmission Mechanism in the Euro Area:More Evidence from VAR Analysis. ECB Working Paper 91.
Perez, F., 2015. Comparing the Transmission of Monetary Policy Shocks in Latin America:A Hierarchical Panel VAR. Banco Central de Reserva del Peru Working Paper 2015-015.
Phan, T., 09 2014. Output Composition of the Monetary Policy Transmission Mechanism: IsAustralia Different? The Economic Record 90 (290), 382–399.
ECB Working Paper 2082, June 2017 38

Pop, R.-E., 2016. A Small-scale DSGE-VAR Model for the Romanian Economy. EconomicModelling.
Poutineau, J.-C., Vermandel, G., 2015a. Cross-border Banking Flows Spillovers in the Eu-rozone: Evidence from an Estimated DSGE Model. Journal of Economic Dynamics andControl 51, 378–403.
Poutineau, J.-C., Vermandel, G., 2015b. Financial Frictions and the Extensive Margin ofActivity. Research in Economics 69 (4), 525–554.
Poutineau, J.-C., Vermandel, G., 2016. Global Banking and the Conduct of MacroprudentialPolicy in a Monetary Union. mimeo.
Pragidis, I., Gogas, P., Tabak, B., 2013. Asymmetric Effects of Monetary Policy in the USand Brazil. Democritus University of Thrace Research Papers in Economics 7-2013.
Quinn, D., Toyoda, M., 2008. Does Capital Account Liberalization Lead to Growth? Reviewof Financial Studies 21 (3), 1403–1449.
Quint, D., Rabanal, P., 2014. Monetary and Macroprudential Policy in an Estimated DSGEModel of the Euro Area. International Journal of Central Banking 10 (2), 169–236.
Raghavan, M., Athanasopoulos, G., Silvapulle, P., 2016. Canadian Monetary Policy AnalysisUsing a Structural VARMA Model. Canadian Journal of Economics 49 (1).
Razafindrabe, T., 2016. A Multi-country DSGE Model with Incomplete Exchange Rate Pass-through: An Application for the Euro-area. Economic Modelling 52, 78–100.
Rees, D., Smith, P., Hall, J., 2016. A Multi-sector Model of the Australian Economy. Eco-nomic Record 92 (298), 374–408.
Rey, H., 2015. Dilemma not Trilemma: The Global Financial Cycle and Monetary PolicyIndependence. NBER Working Paper 21162.
Robstad, Ø., 2014. House Prices, Credit and the Effect of Monetary Policy in Norway: Evi-dence from Structural VAR Models. Norges Bank Working Paper 2014/05.
Romer, C., Romer, D., 2004. A New Measure of Monetary Shocks: Derivation and Implica-tions. American Economic Review 94 (4), 1055–1084.
Rossi, B., Zubairy, S., 2011. What Is the Importance of Monetary and Fiscal Shocks inExplaining U.S. Macroeconomic Fluctuations? Journal of Money, Credit and Banking43 (6), 1247–1270.
Rudolf, B., Zurlinden, M., 2014. A Compact Open-Economy DSGE Model for Switzerland.Swiss National Bank Economic Studies 2014-08.
Rychalovska, Y., 2013. The Implications of Financial Frictions and Imperfect Knowledge inthe Estimated DSGE Model of the US Economy. CERGE-EI Working Paper 482.
Rysanek, J., Tonner, J., Tvrz, S., Vasicek, O., 2012. Monetary Policy Implications of FinancialFrictions in the Czech Republic. Czech Journal of Economics and Finance 62 (5), 413–429.
ECB Working Paper 2082, June 2017 39

Semko, R., 2013. Optimal Economic Policy and Oil Prices Shocks in Russia. EkonomskaIstrazivanja Economic Research 26 (2).
Senaj, M., Vyskrabka, M., Zeman, J., 2012. MUSE: Monetary Union and Slovak EconomyModel. Ekonomicky casopis 5 (60).
Seneca, M., 2010. A DSGE Model for Iceland. Central bank of Iceland Working Paper 50.
Sheena, J., Wang, B., 2016. Assessing labor market frictions in a small open economy. Journalof Macroeconomics 48, 231–251.
Shulgin, A., 2017. Two-dimensional Monetary Policy Shocks in DSGE Model Estimated forRussia. Journal of New Economic Assosiation 1 (33).
Sims, C., 1998. Comment on Glenn Rudebusch’s Do Measures of Monetary Policy in a VARMake Sense? International Economic Review 39 (4), 933–41.
Sims, C., Zha, T., 2006. Were There Regime Switches in US Monetary Policy? AmericanEconomic Review 96 (1), 54–81.
Slanicay, M., 2011. Structural Differences and Asymmetric Shocks between the Czech Econ-omy and the Euro Area 12. Review of Economic Perspectives 11 (3), 168–192.
Slanicay, M., 2013. Business Cycle Synchronization through the Lens of a DSGE Model.Czech Journal of Economics and Finance 63 (2), 180–196.
Slanicay, M., 2016a. A Proposal for a Flexible Trend Specification in DSGE Models. Reviewof Economic Perspectives 16 (2), 73–85.
Slanicay, M., 2016b. Analysis of Structural Differences and Asymmetry of Shocks Betweenthe Czech Economy and the Euro Area. Statistika Journal 96 (1), 34–49.
Smets, F., Warne, A., Wouters, R., 2013. Professional Forecasters and the Real-time Forecast-ing Performance of an Estimated New Keynesian Model for the Euro Area. ECB WorkingPaper 1571.
Smets, F., Wouters, R., 2003. An Estimated Dynamic Stochastic General Equilibrium Modelof the Euro Area. Journal of the European Economic Association 1 (5), 1123–1175.
Smith, L., Galesi, A., 2011. GVAR Toolbox 1.1 User Guide. mimeo.
Some, J., 2014. Welfare Effects of Oil Storage. mimeo.
Steinbach, R., Mathuloe, P., Smit, B., 2009. An Open-Economy New Keynesian DSGE Modelof the South African Economy 09/01.
Timmer, M., Dietzenbacher, E., Los, B., Stehrer, R., Vries, G., 08 2015. An Illustrated UserGuide to the World InputOutput Database: The Case of Global Automotive Production.Review of International Economics 23 (3), 575–605.
Tonner, J., Polansky, J., Vasicek, O., 2011. Parameter Drifting in a DSGE Model Estimatedon Czech Data. Czech Journal of Economics and Finance 61 (5), 510–524.
Tonner, J., Tvrz, S., Vasicek, O., 2015. Labour Market Modelling within a DSGE Approach.Czech National Bank Working Papers 2015/06.
ECB Working Paper 2082, June 2017 40

Toroj, A., Konopczak, K., 2012. Crisis Resistance Versus Monetary Regime: A Polish SlovakCounterfactual Exercise. Central European Journal of Economic Modelling and Economet-rics 4 (1), 1–22.
Tvrz, S., Vasicek, O., 2016. The Great Recession in the Non-EMU Visegrad Countries: ANonlinear DSGE Model with Time-Varying Parameters. Czech Journal of Economics andFinance 66 (3), 207–235.
Ueda, K., 2012. Banking Globalization and International Business Cycles: Cross-borderChained Credit Contracts and Financial Accelerators. Journal of International Economics86 (1), 1–16.
Villa, S., 2016. Financial Frictions in the Euro Area and the United States: A BayesianAssessment. Macroeconomic Dynamics 20 (05), 1313–1340.
Vitek, F., 2014. Policy and Spillover Analysis in the World Economy: A Panel DynamicStochastic General Equilibrium Approach 14/200.
Vitek, F., 2015. Macrofinancial Analysis in the World Economy : A Panel Dynamic StochasticGeneral Equilibrium Approach. IMF Working Paper 15/227.
Voss, G., Willard, L., 2009. Monetary Policy and the Exchange Rate: Evidence from a Two-country Model. Journal of Macroeconomics 31 (4), 708–720.
Yao, W., 2012. International Business Cycles and Financial Frictions. Bank of Canada Work-ing Paper 12-19.
ECB Working Paper 2082, June 2017 41

A Tables
Table 1: Country Coverage of the Monetary Policy Shocks Database
DSGE FME NARR SM VAR Total
AUS 8 1 0 1 5 15BRA 6 0 0 1 1 8CAN 6 0 0 1 3 10CHE 6 0 0 0 1 7CHL 3 0 0 0 2 5CHN 4 0 0 0 1 5COL 5 0 0 0 2 7CZE 12 0 0 0 2 14EAR 35 1 0 0 13 49GBR 12 3 1 0 7 23HUN 1 0 0 0 0 1IND 4 0 0 2 1 7ISL 1 0 0 0 0 1ISR 3 0 0 0 1 4JPN 6 0 0 1 1 8KOR 5 0 0 0 0 5MEX 2 0 0 0 1 3NOR 2 1 0 0 2 5NZL 6 1 0 0 1 8PAK 2 0 0 0 0 2PER 1 0 0 0 2 3POL 8 0 0 0 2 10ROU 3 0 0 0 1 4RUS 5 0 0 0 0 5SWE 5 1 0 0 3 9THA 2 0 0 0 0 2TUR 2 0 0 0 0 2USA 27 5 2 3 20 57ZAF 4 0 0 1 3 8
Total 186 13 3 10 75 287
Table 2: Model Type Coverage of the Monetary Policy Shocks Database
Number of shocks Percent
DSGE 186 64.8FME 13 4.5NARR 3 1.0SM 10 3.5VAR 75 26.1
Total 287 100.0
ECB Working Paper 2082, June 2017 42

Table 3: Overview of US Monetary Policy Shock Time Series Estimates
Reference Acronym Type Sample period MC SOE FS Pub Keele
Aguilar and Vzquez (2015) agv DSGE 1965q2-2007q3 n n n nAlpanda and Aysun (2014) aya DSGE 1996q1-2009q2 y n y y 3Bacchiocchi and Fanelli (2015) bf VAR 1956q2-2008q3 y 3Bacchiocchi et al. (forthcoming) bfc VAR 1961q1-2008q2 y 2Barakchian and Crowe (2013) bc FME 1988m12-2008m6 y 4Bernanke and Kuttner (2005) bk FME 1988m12-2008m6 y 4Bernanke and Mihov (1998) bm VAR 1990m1-2007m11 y 4Bernanke et al. (2005) bbe VAR 1960q1-2007q2 y 4Binder et al. (2010) bcz VAR 1978m1-2006m12 nBrayton et al. (2014) frb DSGE 1970q1-2010q4 y n n y 3Breuss and Fornero (2009) forn DSGE 1984q1-2015q3 y n n nBurlon et al. (2016) bnp DSGE 1995q2-2014q4 y n * nCaglayan et al. (2016) ckm NARR 1970q4-2008q4 n 3Carabenciov et al. (2008) gpm DSGE 1994q1-2008q1 y n y nCarlstrom et al. (2014) cfop DSGE 1972q2-2008q4 n n n y 3Ca’Zorzi et al. (2016) jp DSGE 1975q1-2013q3 n n n y 3Chin et al. (2015) cft DSGE 1976q1-2013q2 n n n nChristiano et al. (1999) cee VAR 1989q4-2007q3 y 0Christiano et al. (2014) cmr DSGE 1981q1-2010q2 n n n y 4Chung et al. (2010) edo DSGE 1984q4-2016q2 n n n nClaus and Dungey (2012) cld SM 1994m1d1-2008m10d31 y 3Claus et al. (2016) cck SM 1996m1d1-2015m11d30 nConsensus Forecast cpf FME 1990q1-2013q1 nDungey and Osborn (2014) duo VAR 1983q1-2007q4 y 3Dungey et al. (2014) dor VAR 1984q3-2008q1 y 2Feldkircher and Huber (2016) fel VAR 1995q1-2012q4 y 4Forni and Gambetti (2010) fg VAR 1990m1-2007m11 y 4Fragetta and Melina (2013) frm VAR 1965q4-2007q4 y 2Furlanetto et al. (2014) fgs DSGE 1964q2-2009q4 n n n nGalı and Gambetti (2015) gag VAR 1960q1-2011q4 y 3Gazzani and Vicondoa (2016) gvi1 VAR 1991m1-2007m7 nGazzani and Vicondoa (2016) gvi2 VAR 1991m1-2007m7 nGertler and Karadi (2015) kg FME 1991m1-2012m6d30 y 3Gertler et al. (2008) gst DSGE 1960q1-2005q1 n n n y 3Heinlein and Krolzig (2013) hek VAR 1972m3-2010m8 nIacoviello and Neri (2010) in DSGE 1965q1-2006q4 n n n y 3Kaihatsu and Kurozumi (2014) kak DSGE 1985q1-2008q4 n n n y 3Kamber et al. (2015) kst DSGE 1954q3-2011q4 n n n y 2Kollmann et al. (2016) quest DSGE 1999q1-2015q1 y n n y 4Luciani (2015) luc VAR 1983q1-2010q4 y 3Merola (2015) swrm DSGE 1965Q1-2012Q4 n n n y 2Merola (2015) swrmff DSGE 1965q1-2012q4 n n n y 2Miranda-Agrippino (2016) sma FME 1990m1-2009m12 nNguyen (2015) ngu DSGE 1960q1-2007q1 n n n nPhan (2014) pta VAR 1982q4-2007q4 y 2Poutineau and Vermandel (2015b) pov1 DSGE 1993q1-2012q3 n n n y 1Pragidis et al. (2013) pgt SM 1980m1-2011m10 nRazafindrabe (2016) raz DSGE 1999q1-2011q2 y n n y 2Romer and Romer (2004) rr NARR 1988m1-2008m6 y 4Rossi and Zubairy (2011) roz VAR 1955q3-2006q4 y 3Rychalovska (2013) ryc1 DSGE 1954q1-2008q3 n n n y 3Sims and Zha (2006) sz VAR 1989q4-2008q2 y 2Some (2014) som DSGE 1973q1-2005q4 y n n nVilla (2016) vbgg DSGE 1983q1-2008q3 n n n y 2Villa (2016) vgk DSGE 1983q1-2008q3 n n n y 2Vitek (2015) vit DSGE 1999q3-2008q4 y n y nVoss and Willard (2009) vow VAR 1985q2-2007q4 y 2
Note: The table lists the studies from which we obtained monetary policy shock time series estimates for the US. Regarding model types, “FME” stands for financial market expectations,“NARR” for the narrative approach, and “SM” for statistical model. “MC” for multi-country model, “SOE” for small open-economy model, “FS” for whether the model involvesfrictions in international financial markets, “Pub” for published, and “Keele” for the journal ranking in the Keele list. For journals which are not included in the original Keele list, weallocated the International Journal of Central Banking, the American Economic Journal: Macroeconomics, the Journal of Financial Stability, and the Economic Journal to rank three,and The B.E. Journal of Macroeconomics, Manchester School, and the South African Journal of Economics to rank two. We construct monetary policy shocks for the US based onConsensus Forecast data as described in Appendix C.1. * indicates that no model documentation is currently available.
ECB Working Paper 2082, June 2017 43

Table 4: Overview of Euro Area Monetary Policy Shock Time Series Estimates
Reference Acronym Type Sample period MC SOE FS Pub Keele
Albonico et al. (2014) alb1 DSGE 1993q2-2012q4 n n n nAlbonico et al. (forthcoming) alb2 DSGE 1985q1-2012q4 n n n y 2Alpanda and Aysun (2014) aya DSGE 1996q1-2009q2 y n y y 3Avouyi-Dovi and Sahuc (2016) ads DSGE 1980q2-2007q4 n n n y 4Babecka Kucharcukova et al. (2016) bab VAR 2001m4-2015m7 y 2Gregor Baurle and Kanzig (2016) bgk VAR 1992q3-2011q2 nBarigozzi et al. (2014) bcl VAR 1984q1-2007q4 y 3Benchimol and Fourcans (forthcoming) benf DSGE 1995q2-2013q1 n n n y 2Benkovskis et al. (2011) bbfw VAR 1999q3-2010q3 y 0Boivin et al. (2009) bgm VAR 1988q1-2007q3 nBreuss and Fornero (2009) forn DSGE 1984q1-2015q3 y n n nBurlon et al. (2016) bnp DSGE 1995q2-2014q4 y n * nCarabenciov et al. (2008) gpm DSGE 1994q1-2008q1 y n y nCa’Zorzi et al. (2016) jp DSGE 1975q1-2013q3 n y n y 3Christoffel et al. (2008) nawm DSGE 1985q1-2011q4 n y n y 3Consensus Forecast cpf FME 1990q1-2013q1DiCecio and Nelson (2010) dcn DSGE 1981q1-2005q4 y n n y 0Dungey and Osborn (2014) duo VAR 1983q1-2007q4 y 3Dungey et al. (2014) dor VAR 1984q3-2008q1 y 2Errit and Uuskula (2014) ues VAR 2000q3-2012q4 y 0Feve and Sahuc (2016) fes DSGE 1980q2-2007q4 n n n y 3Gadatsch et al. (2016) gear DSGE 1999q2-2013q4 n y n y 2Gelain (2010) gel DSGE 1980q1-2008q3 n n n y 1Gerali et al. (2010) ger DSGE 1998q1-2009q4 n n n y 3Giri (2014) gir DSGE 1998q1-2014q2 n n n nHerber and Nemec (2012) hen2 DSGE 1999q1-2009q4 n y n y 0Hristov (2016) ifo DSGE 2000q1-2016q2 n y n nJannsen and Klein (2011) jk VAR 1990q1-2008q4 nKollmann et al. (2016) quest DSGE 1999q1-2015q1 y n n y 4Kuhl (2016) kue DSGE 1997q4-2013q3 n n n nMandler et al. (2016) msv VAR 1999q1-2014q3 nNeuenkirch (2013) neu VAR 1999m1-2012m12 y 3Peersman and Smets (2001) ovar VAR 1990q2-2011q2 nPhan (2014) pta VAR 1982q4-2007q4 y 2Poutineau and Vermandel (2015a) pov2 DSGE 1999q1-2013q3 n n n y 3Poutineau and Vermandel (2016) pov3 DSGE 1999q1-2013q4 n n n nQuint and Rabanal (2014) qir DSGE 1996q1-2011q4 n n n y 3Razafindrabe (2016) raz DSGE 1999q1-2011q2 y n n y 2Senaj et al. (2012) svz DSGE 1997q1-2016q2 y n n y 0Slanicay (2011) rep2 DSGE 1999q1-2010q2 n y n y 0Slanicay (2013) cjef DSGE 2000q2-2011q3 y n n y 0Slanicay (2016b) sta DSGE 2000q2-2014q1 y n n y 0Slanicay (2016a) rep1 DSGE 2000q2-2014q1 y n n y 0Smets et al. (2013) sww DSGE 1970q2-2010q2 n n n y 2Some (2014) som DSGE 1973q1-2005q4 y n n nToroj and Konopczak (2012) tor DSGE 1995q2-2011q2 y n n y 0Villa (2016) vbgg DSGE 1983q1-2008q3 n n n y 2Villa (2016) vgk DSGE 1983q1-2008q3 n n n y 2Vitek (2015) vit DSGE 1999q3-2008q4 y n y n
Note: See the note to Table 3.
ECB Working Paper 2082, June 2017 44

Table 5: Overview of UK Monetary Policy Shock Time Series Estimates
Reference Acronym Type Sample period MC SOE FS Pub Keele
Ajevskis and Vitola (2011) vaj DSGE 1996q1-2010q1 n y n nAndreasen (2012) and DSGE 1990q1-2008q3 n n n y 4Babecka Kucharcukova et al. (2016) bab VAR 2001m4-2015m7 y 2Bhattaraia and Trzeciakiewiczb (2017) bht DSGE 1987q2-2011q1 n n n y 2Bjørnland and Jacobsen (2010) bjo VAR 1983q1-2006q4 y 3Burgess et al. (2013) boe DSGE 1987q3-2007q4 n y n nCa’Zorzi et al. (2016) jp DSGE 1975q1-2013q3 n y n y 3Cesa-Bianchi et al. (2016) ctv FME 1997m7d1-2015m6d30 nChen and Macdonald (2012) cmc DSGE 1975q2-2010q2 n y n y 3Chin et al. (2015) cft DSGE 1976q1-2013q2 n y y nCloyne and Hurtgen (forthcoming) clh NARR 1975m1-2007m12 y 3Consensus Forecast cpf FME 1990q1-2013q1DiCecio and Nelson (2010) dcn DSGE 1981q1-2005q4 y n n y 0Ellis et al. (2014) mum VAR 1976q1-2005q4 y 3Faccini et al. (2013) fmz DSGE 1971q1-2009q4 n n n y 2Felcser and Vonnak (2014) fev VAR 1993q2-2007q4 nHarrison and Oomen (2010) harr DSGE 1958q1-2007q1 n y n nHeinlein and Krolzig (2013) hek VAR 1972m3-2010m8 nKamber and Millard (2012) km VAR 1979q4-2007q4 y 3Miranda-Agrippino (2016) sma FME 2000m1-2012m6 nMumtaz and Theophilopoulou (2016) mut VAR 1976q2-2009q1 nRazafindrabe (2016) raz DSGE 1999q1-2011q2 y n n y 2Vitek (2015) vit DSGE 1999q3-2008q4 y n y n
Note: See the note to Table 3.
ECB Working Paper 2082, June 2017 45

Table 6: Overview of Non-US, Non-Euro Area and Non-UK Monetary Policy Shock TimeSeries Estimates
Reference Acronym Country Type Sample period MC SOE FS Pub Keele
Adame et al. (2016) acrz MEX DSGE 2001q1-2016q2 n y n nAdolfson et al. (2011) ado SWE DSGE 1980q2-2007q3 n y n y 3Adolfson et al. (2013) rams SWE DSGE 1995q2-2015q2 n y n nAhmad (2017) ahm PAK DSGE 1980q4-2016q2 n y n nAhmed et al. (2014) amr PAK DSGE 1991q1-2012q4 n n n nAjevskis and Vitola (2011) vaj CZE, POL, SWE DSGE 1996q1-2010q1 n y n nAlp and Elekdag (2013) has TUR DSGE 2002q1-2010q4 n y n y 0Alp et al. (2012) ael KOR DSGE 2000q1-2012q4 n y n nArgov et al. (2012) moi ISR DSGE 1992q1-2011q4 n y n nAssenmacher-Wesche (2008) asw CHE VAR 1975q1-2006q4 y 1Azoulay and Ribon (2010) azr ISR VAR 2000m1-2008m12 nBabecka Kucharcukova et al. (2016) bab SWE, POL, CZE VAR 2001m4-2015m7 y 2Bank of Korea bok KOR DSGE 2001q1-2015q2 * * *Bank of Thailand bot THA DSGE 2002q1-2015q3 n n n nBaranowski et al. (2016) bgms POL DSGE 1997q1-2012q4 n n n y 0Barnett et al. (2015) gho IND VAR 1996m1-2013m12 y 1Beltran and Draper (2008) bel CHE DSGE 1970q2-2005q2 n y n nBenchimol (2016) ben ISR DSGE 1995q2-2013q1 n n n y 2Bjørnland and Jacobsen (2010) bjo NOR, SWE VAR 1983q1-2006q4 y 3Brzoza-Brzezina and Makarski (2011) bbm POL DSGE 1997q1-2009q2 n y n y 3Melecky and Buncic (2008) bud AUS DSGE 1984q1-2005q4 n y n y 2Melecky and Buncic (2008) buv AUS VAR 1984q1-2005q4 y 2Carabenciov et al. (2008) gpm JPN DSGE 1994q1-2008q1 y n y nCaraiani (2013) car HUN DSGE 2000q1-2010q2 n y n y 2Ca’Zorzi et al. (2016) jp AUS, CAN DSGE 1975q1-2013q3 n y n y 3Chen and Columba (2016) cco SWE DSGE 1996q1-2014q4 n y n nClaus and Dungey (2016) cd AUS, CAN SM 1993m1d1-2014m11d30 y 2Claus et al. (2016) cck JPN SM 1998m1d1-2015m6d30 y 0Copaciu et al. (2016) cnb ROM DSGE 2005q1-2014q1 y n y nCuche-Curti et al. (2009) cdn CHE DSGE 1995q2-2015q4 n y n nDadam and Viegi (2014) dav ZAF DSGE 1994q1-2013q3 n n n nDai et al. (2015) dmz CHN DSGE 1978q2-2007q4 n n n y 2de Carvalho and Castro (2015) dc BRA DSGE 1999q3-2013q4 n y n nde Carvalho and Valli (2011) dv BRA DSGE 1999q1-2010q2 n y n nde Carvalho et al. (2014) dcc BRA DSGE 1999q3-2012q4 n n n nBong et al. (2016) dpb AUS, NZL, CAN DSGE 1989q2-2006q4 n y n nDorich et al. (2013) tot CAN DSGE 1990q1-2014q4 n y n nDrygalla (2015) dry POL VAR 1994q1-2013q4 nFelcser and Vonnak (2014) fev AUS, CAN VAR 1993q2-2007q4 nFueki et al. (2016) fue JPN DSGE 1990q1-2008q4 n n n y 3Gabriel et al. (2012) glpy IND DSGE 1996q1-2008q4 n n n y 0Gabriel et al. (2016) gly IND DSGE 1996q1-2008q4 n y n y 0Gallic and Vermandel (2016) gav NZL DSGE 1989q1-2014q2 n y n nGarcia and Gonzalez (2014) gga AUS, CHL, COL, NZL, PER VAR 1995q1-2015q4 y 2Gerdrup et al. (2017) nemo NOR DSGE 1994q1-2016q3 * * *Gervais and Gosselin (2014) lens CAN DSGE 1993q1-2014q4 * * * nGonzalez et al. (2015) ghr COL DSGE 1999q1-2013q3 n y n nGoyal and Kumar (2016) gku IND DSGE 1996q3-2015q4 n n n nGrabek and Klos (2013) grk POL DSGE 1999q1-2011q3 n y n nGupta and Steinbach (2013) gs ZAF VAR 1981q2-2010q4 y 2Herber and Nemec (2009) hen1 CZE DSGE 1996q2-2008q4 n n n nHerber and Nemec (2012) hen2 CZE DSGE 1999q1-2009q4 y n n y 0Hernan Hernandez and Ortiz Bolanos (2016) hhob BRA, CHL, COL, MEX, PER DSGE 1999q1-2015q3 n y n nHirose (2014) hir JPN DSGE 1983q2-2013q1 n n n nIMF (2017) gfsr AUS, NOR, NZL, SWE FME 1999m1-2016m12Jacob and Munro (2016) jam NZL DSGE 1998q4-2014q3 n y n nJiang and Kim (2013) jkc CHN VAR 1993q1-2009q3 y 0Junicke (2015) mju POL DSGE 1996q4-2012q4 n y n nKamber et al. (2016) nzsim NZL DSGE 1993q2-2013q1 n y n y 2Kapur and Behera (2012) kbe IND SM 1999q3-2010q3 nKatagiri and Takahashi (2016) kta JPN DSGE 1987q1-2016q1 n y n nKim (2014) tbk KOR DSGE 2000q2-2012q4 n y n y 0Kimura and Nakajima (2016) nik JPN VAR 1990q1-2015q3 y 2Korner (2015) koe CZE VAR 1999m1-2011m9 y 0Kreptsev and Seleznev (2016) krs RUS DSGE 2003q1-2013q1 n y nLeist (2013) lei CHE DSGE 1989q1-2010q2 n y n y 0Li and Spencer (2015) lsp AUS DSGE 1993q1-2013q4 n y n y 2Linardi (2016) lin BRA DSGE 2000q1-2014q1 n y n nLopez and Rodriguez (2008) lro COL DSGE 1980q1-2005q4 n n n nLopez et al. (2008) lpr COL DSGE 1980q1-2005q4 n y n nMalakhovskaya and Minabutdinov (2014) mmi RUS DSGE 1999q3-2011q3 n y n y 0Medina and Soto (2007) mas CHL DSGE 2001q2-2016q1 n y n nMilani (2011) mil2 AUS, CAN, NZL DSGE 1982q3-2007q2 y n n y 3Milani and Park (2015) mil KOR DSGE 1991q2-2012q4 n y n y 2Minetti and Peng (forthcoming) tpe CHN DSGE 1999q1-2011q3 n n n y 3Naraidoo and Paya (2012) run ZAF SM 1986m1-2008m11 y 2Ncube and Ndou (2011) nd1 ZAF VAR 1976q1-2009q4 y 0Ncube and Ndou (2013) nd2 ZAF VAR 1983q3-2010q1 nPaetz and Gupta (2016) pag ZAF DSGE 1971q1-2013q1 n y n y 2Patra and Kapur (2012) pka IND SM 1998q1-2009q1 y 0Perez (2015) pef BRA, CHL, COL, MEX, PER VAR 1999m12-2013m12 nPhan (2014) pta AUS VAR 1982q4-2007q4 y 2Pop (2016) pre ROM VAR 2001q1-2015q4 y 2Pragidis et al. (2013) pgt BRA SM 1980m1-2011m10 nRaghavan et al. (2016) ras1 CAN VAR 1974m3-2007m12 y 3Raghavan et al. (2016) ras2 CAN VAR 1975m1-2007m12 y 3Razafindrabe (2016) raz JPN, CHE, CHN DSGE 1999q1-2011q2 y n n y 2Rees et al. (2016) rsh AUS DSGE 1992q1-2013q4 n y n y 2Robstad (2014) rob NOR VAR 1994q3-2013q4 nRudolf and Zurlinden (2014) ruz CHE DSGE 1983q2-2015q4 n y n nRysanek et al. (2012) tov CZE DSGE 1998q3-2010q4 n y n y 0Semko (2013) sem RUS DSGE 2003q1-2012q1 n y n y 0Seneca (2010) ice ISL DSGE 1992q1-2016q1 n y n nSheena and Wang (2016) shw AUS DSGE 1993q2-2013q1 n y n y 2Shulgin (2017) shu RUS DSGE 2001q1-2014q2 * * * y 0Slanicay (2011) rep2 CZE DSGE 1999q1-2010q2 n y n y 0Slanicay (2013) cjef CZE DSGE 2000q2-2011q3 y n n y 0Slanicay (2016b) sta CZE DSGE 2000q2-2014q1 y n n y 0Slanicay (2016a) rep1 CZE DSGE 2000q2-2014q1 y n n y 0Steinbach et al. (2009) sms ZAF DSGE 1990q1-2007q4 n y n y 2Sveriges Riksbank bvar SWE VAR 1995q4-2014q4Tonner et al. (2011) tpv CZE DSGE 1999q3-2010q2 n y n y 0Tonner et al. (2015) tvt CZE DSGE 1998q1-2014q4 n y n nToroj and Konopczak (2012) tor POL DSGE 1995q2-2011q2 y n n y 0Tvrz and Vasicek (2016) tvv CZE, HUN, POL DSGE 1999q2-2014q4 n y n y 0Vitek (2015) vit NZL, AUS, SWE, CAN, ZAF, KOR, CHN, JPN, CHE, ISR, CHL,
IND, TUR, COL, CZEDSGE 1999q3-2008q4 y n y n
Voss and Willard (2009) vow AUS VAR 1985q2-2007q4 y 2
Note: See the note to Table 3.
ECB Working Paper 2082, June 2017 46

Table 7: Number of Monetary Policy Shock Time-Series Estimates obtained from SmallOpen-economy and Multi-country NK DSGE Models with and without Financial Spillovers
Small open-economy Multi-country Of which: with financial spillovers Closed-economy
EAR 6 13 (12) 3 (2) 15GBR 6 3 (2) 2 (1) 3USA 0 8 (7) 3 (2) 18Other 60 28 (13) 17 (2) 14
Note: The table provides the number of monetary policy shock time series estimates obtained from NK DSGE with specific model elements.The numbers in parentheses represent the frequencies without the monetary policy shock time-series estimates obtained from the modelof Vitek (2015). The sum of monetary policy shock estimates obtained from NK DSGE models across economies reported in this table issmaller than that in Tables 1 and 2 because for some models there is no documentation available so that we cannot determine the modelelements (see Tables 3 to 6).
Table 8: Relationship between the Monetary Policy Shock Time Series Estimates’Cross-country Correlations and Economies’ International Financial Integration
(1) (2) (3) (4) (5) (6) (7)DSGE DSGE DSGE Non-DSGE DSGE VAR Non-DSGE/non-VAR
Overall financial integration 0.09∗∗∗ 0.08∗∗∗ 0.02 0.10∗∗∗ 0.01 0.03(0.00) (0.00) (0.31) (0.00) (0.82) (0.80)
Share of US in overall financial integration 0.09∗∗∗ 0.08∗∗∗ 0.00 0.07∗∗∗ 0.00 0.08(0.00) (0.00) (0.89) (0.00) (0.99) (0.68)
Country 1 dummies Yes Yes Yes Yes Yes Yes Yes
Country 2 dummies Yes Yes Yes Yes Yes Yes Yes
Adj. R-squared 0.15 0.15 0.16 0.03 0.17 0.05 -0.01Observations 9214 8658 8658 1758 7360 1006 97Country pairs 171 153 153 120 120 120 45
p-values in parentheses∗ p < 0.1, ∗∗ p < 0.05, ∗∗∗ p < 0.01
Table 9: Testing Additional Predictions—Role of Banking Integration
(1) (2) (3)
Overall financial integration 0.08∗∗∗
(0.00)
Share of US in overall financial integration 0.08∗∗∗ 0.07∗∗∗ 0.08∗∗∗
(0.00) (0.00) (0.00)
FDI assets and liabilities/GDP 0.04 0.03(0.11) (0.20)
Portfolio assets and liabilities/GDP -0.10∗ 0.00(0.05) (0.86)
Other inv. assets and liabilities/GDP 0.32∗∗∗
(0.00)
Non-resident bank loans/GDP 0.03∗∗∗
(0.00)
Country 1 dummies Yes Yes Yes
Country 2 dummies Yes Yes Yes
Adj. R-squared 0.16 0.16 0.16Observations 8658 8658 8658Country pairs 153 153 153
p-values in parentheses∗ p < 0.1, ∗∗ p < 0.05, ∗∗∗ p < 0.01
ECB Working Paper 2082, June 2017 47

Table 10: Testing Additional Predictions—Structural Multi-country Models, Models withInternational Financial Frictions, and Small-open Economy Models
(1) (2) (3) (4)
Overall financial integration 0.10∗∗∗ 0.10∗∗∗ 0.11∗∗∗ 0.11∗∗∗
(0.00) (0.00) (0.00) (0.00)
Share of US in overall financial integration 0.09∗∗∗ 0.09∗∗∗ 0.09∗∗∗ 0.08∗∗∗
(0.00) (0.00) (0.00) (0.00)
At least one multi-country model -0.00 -0.01 -0.00 -0.01(0.71) (0.68) (0.80) (0.61)
Over. fin. integr. x at least one multi-country model -0.01 -0.01(0.20) (0.54)
Share of US in over. fin. integr. x at least one multi-country model -0.01 -0.01(0.52) (0.51)
At least one MC-model with fin. spillovers 0.00 0.01(0.94) (0.51)
At least one MC-model with fin. spillovers x Overall fin. integr. -0.04∗∗
(0.02)
At least one MC-model with fin. spillovers x Share of US in overall fin. integr. 0.03(0.15)
At least one SOE model -0.00 -0.01 -0.00 -0.00(0.77) (0.60) (0.86) (0.78)
Over. fin. integr. x at least one SOE model -0.00 -0.00(0.63) (0.83)
Share of US in over. fin. integr. x at least one SOE model 0.01 0.01(0.51) (0.32)
At least one SOE model with fin. spillovers 0.01 0.01(0.46) (0.45)
At least one SOE model with fin. spillovers x Overall fin. integr. -0.02(0.12)
At least one SOE model with fin. spillovers x Share of US in overall fin. integr -0.07∗∗∗
(0.00)
Country 1 dummies Yes Yes Yes Yes
Country 2 dummies Yes Yes Yes Yes
Adj. R-squared 0.16 0.16 0.16 0.16Observations 6101 6017 6017 6017Country pairs 153 153 153 153
p-values in parentheses∗ p < 0.1, ∗∗ p < 0.05, ∗∗∗ p < 0.01
ECB Working Paper 2082, June 2017 48

Table 11: Testing Additional Predictions—Capital Controls and Exchange Rate Flexibility
(1) (2) (3)
Overall financial integration 0.083∗∗∗ 0.076∗∗∗ 0.072∗∗∗
(0.000) (0.000) (0.004)
Share of US in overall financial integration 0.079∗∗∗ 0.079∗∗∗ 0.079∗∗∗
(0.000) (0.000) (0.000)
Capital controls (PC) 0.006 0.053∗
(0.550) (0.099)
FX flexibility -0.015 0.009(0.795) (0.868)
Capital controls x At least one economy is EME -0.053(0.106)
FX flexibility x At least one economy is EME -0.041(0.177)
At least one economy is EME 0.058(0.320)
Country 1 dummies Yes Yes Yes
Country 2 dummies Yes Yes Yes
Adj. R-squared 0.16 0.16 0.16Observations 8658 8658 8658Country pairs 153 153 153
p-values in parentheses∗ p < 0.1, ∗∗ p < 0.05, ∗∗∗ p < 0.01
Table 12: Robustness Checks—Alternative Explanations I
(1) (2) (3) (4) (5)
Overall financial integration 0.08∗∗∗ 0.08∗∗∗ 0.06∗∗ 0.06∗∗∗ 0.06∗∗
(0.00) (0.00) (0.01) (0.00) (0.02)
Share of US in overall financial integration 0.08∗∗∗ 0.08∗∗∗ 0.08∗∗∗ 0.07∗∗∗ 0.08∗∗∗
(0.00) (0.00) (0.00) (0.00) (0.00)
Trade integration 0.02 0.02(0.38) (0.37)
Share of US in trade integration -0.00 -0.00(0.78) (0.70)
Bilateral financial integration 0.01∗∗∗ 0.01(0.00) (0.37)
Bilateral trade integration 0.01∗∗ 0.00(0.03) (0.77)
Country 1 dummies Yes Yes Yes Yes Yes
Country 2 dummies Yes Yes Yes Yes Yes
Adj. R-squared 0.16 0.16 0.16 0.16 0.16Observations 8658 8658 8658 8658 8658Country pairs 153 153 153 153 153
p-values in parentheses∗ p < 0.1, ∗∗ p < 0.05, ∗∗∗ p < 0.01
ECB Working Paper 2082, June 2017 49

Table 13: Robustness Checks—Alternative Explanations II
(1) (2) (3) (4) (5) (6)
Overall financial integration 0.08∗∗∗ 0.10∗∗∗ 0.08∗∗∗ 0.08∗∗∗ 0.08∗∗∗ 0.09∗∗∗
(0.00) (0.00) (0.00) (0.00) (0.00) (0.00)
Share of US in overall financial integration 0.08∗∗∗ 0.08∗∗∗ 0.08∗∗∗ 0.08∗∗∗ 0.07∗∗∗ 0.07∗∗∗
(0.00) (0.00) (0.00) (0.00) (0.00) (0.00)
Foreign currency net short position -0.02 -0.02(0.15) (0.22)
At least one model with open-economy variables in Taylor rule 0.00 0.00(0.69) (0.67)
Ratio of fuel/ore/metals exports to GDP 0.01 -0.00(0.33) (0.82)
Ratio of fuel/ore/metals imports to GDP -0.02 -0.02(0.20) (0.14)
Both commodity exporters 0.05∗ 0.08(0.06) (0.12)
Country 1 dummies Yes Yes Yes Yes Yes Yes
Country 2 dummies Yes Yes Yes Yes Yes Yes
Adj. R-squared 0.16 0.16 0.16 0.16 0.16 0.16Observations 8658 8658 7911 8658 8658 7911Country pairs 153 153 153 153 153 153
p-values in parentheses∗ p < 0.1, ∗∗ p < 0.05, ∗∗∗ p < 0.01
ECB Working Paper 2082, June 2017 50

Table 14: Robustness Checks—Alternative Explanations III
(1) (2) (3) (4) (5) (6) (7) (8) (9)
Overall financial integration 0.08∗∗∗ 0.08∗∗∗ 0.08∗∗∗ 0.08∗∗∗ 0.07∗∗∗ 0.09∗∗∗ 0.08∗∗∗ 0.09∗∗∗ 0.07∗∗∗
(0.00) (0.00) (0.00) (0.00) (0.00) (0.00) (0.00) (0.00) (0.00)
Share of US in overall financial integration 0.08∗∗∗ 0.08∗∗∗ 0.08∗∗∗ 0.10∗∗∗ 0.09∗∗∗ 0.10∗∗∗ 0.10∗∗∗ 0.10∗∗∗ 0.10∗∗∗
(0.00) (0.00) (0.00) (0.00) (0.00) (0.00) (0.00) (0.00) (0.00)
Difference in trade integration -0.01 -0.01(0.18) (0.23)
Difference in centrality -0.00 -0.01(0.48) (0.12)
Difference in GVC position 0.00 0.01(0.64) (0.44)
Difference in GVC participation -0.01 -0.01(0.28) (0.47)
Heterogeneity in output structure 0.01 0.01(0.44) (0.54)
Heterogeneity in export structure 0.01 0.01(0.30) (0.27)
Heterogeneity in import structure 0.01 0.00(0.58) (0.81)
Country 1 dummies Yes Yes Yes Yes Yes Yes Yes Yes Yes
Country 2 dummies Yes Yes Yes Yes Yes Yes Yes Yes Yes
Adj. R-squared 0.16 0.16 0.16 0.16 0.16 0.16 0.16 0.16 0.16Observations 8658 8658 8658 8250 8250 8250 8250 8250 8250Country pairs 153 153 153 136 136 136 136 136 136
p-values in parentheses∗ p < 0.1, ∗∗ p < 0.05, ∗∗∗ p < 0.01
Table 15: Robustness Checks—Alternative Samples
(1) (2) (3) (4) (5)Baseline CBs/IOs w/o Vitek Max. sample Public
Overall financial integration 0.08∗∗∗ 0.12∗ 0.10∗∗∗ 0.06∗∗∗ 0.07∗∗∗
(0.00) (0.06) (0.00) (0.00) (0.00)
Share of US in overall financial integration 0.08∗∗∗ 0.13∗∗∗ 0.10∗∗∗ 0.07∗∗∗ 0.08∗∗∗
(0.00) (0.00) (0.00) (0.00) (0.00)
Country 1 dummies Yes Yes Yes Yes Yes
Country 2 dummies Yes Yes Yes Yes Yes
Adj. R-squared 0.16 0.30 0.16 0.15 0.15Observations 8658 258 6448 10555 7298Country pairs 153 120 153 325 153
p-values in parentheses∗ p < 0.1, ∗∗ p < 0.05, ∗∗∗ p < 0.01
ECB Working Paper 2082, June 2017 51

Table 16: Robustness Checks—Published Papers
(1) (2) (3) (4)Baseline Published Keele> 1 Keele> 2
Overall financial integration 0.08∗∗∗ 0.07∗∗∗ 0.05∗ 0.11(0.00) (0.00) (0.08) (0.27)
Share of US in overall financial integration 0.08∗∗∗ 0.10∗∗∗ 0.12∗∗∗ 0.16∗
(0.00) (0.01) (0.00) (0.08)
Country 1 dummies Yes Yes Yes Yes
Country 2 dummies Yes Yes Yes Yes
Adj. R-squared 0.16 0.17 0.18 0.24Observations 8658 1963 666 149Country pairs 153 105 66 28
p-values in parentheses∗ p < 0.1, ∗∗ p < 0.05, ∗∗∗ p < 0.01
Table 17: Robustness Checks—Alternative Model Specifications
(1) (2) (3) (4) (5) (6) (7) (8)Baseline Insign.=0 Logit Tobit FE rreg Min. Collapsed
Overall financial integration 0.08∗∗∗ 0.06∗∗∗ 0.18∗∗∗ 0.08∗∗∗ 0.08∗∗∗ 0.09∗∗∗ 0.08∗∗∗ 0.03∗∗∗
(0.00) (0.00) (0.00) (0.00) (0.00) (0.00) (0.00) (0.00)
Share of US in overall financial integration 0.08∗∗∗ 0.06∗∗∗ 0.17∗∗∗ 0.08∗∗∗ 0.08∗∗∗ 0.08∗∗∗ 0.08∗∗∗ 0.01(0.00) (0.00) (0.00) (0.00) (0.00) (0.00) (0.00) (0.12)
Country 1 dummies Yes Yes Yes Yes No Yes Yes No
Country 2 dummies Yes Yes Yes Yes No Yes Yes No
Country-shock 1 dummies No No No No Yes No No No
Country-shock 2 dummies No No No No Yes No No No
Adj. R-squared 0.16 0.12 0.16 0.28 0.15 0.16 0.05Observations 8658 8658 8658 8658 8658 8658 8658 153Country pairs 153 153 153 153 153
p-values in parentheses∗ p < 0.1, ∗∗ p < 0.05, ∗∗∗ p < 0.01
Table 18: Robustness Checks—US vs. Euro Area as Core Economy
(1) (2) (3)Baseline US+EA core Regional core
Overall financial integration 0.08∗∗∗ 0.06∗∗∗ 0.06∗∗
(0.00) (0.00) (0.01)
Share of US in overall financial integration 0.08∗∗∗ 0.04 0.00(0.00) (0.12) (0.94)
Share of EA in overall financial integration 0.04 -0.03(0.19) (0.46)
Share of regional core in overall financial integration 0.03∗∗∗
(0.01)
Country 1 dummies Yes Yes Yes
Country 2 dummies Yes Yes Yes
Adj. R-squared 0.16 0.10 0.11Observations 8658 5022 5022Country pairs 153 136 136
p-values in parentheses∗ p < 0.1, ∗∗ p < 0.05, ∗∗∗ p < 0.01
ECB Working Paper 2082, June 2017 52

B Figures
Figure 1: Distribution of Correlation between Smoothed Monetary Policy Shocks for theEuro Area and Japan across Replications in the Monte Carlo Experiment
−0.3 −0.2 −0.1 0 0.1 0.2 0.3 0.4Correlation coefficient
No fin. spilloversWith fin. spillovers
Note: The figure shows the distribution of the correlations between the smoothed monetary policy shocks for thenon-core economies of the euro area and Japan across the 1,000 replications of the Monte Carlo experiment. Thesmoothed monetary policy shocks are obtained from applying the Kalman-filter with the corresponding single-countrymodels on the data simulated based on the multi-country data-generating process. The dark green bars refer tothe distribution of the cross-country correlations under the “no financial spillover” parametrisation of the data-generating process, and the light yellow bars to the distribution of the cross-country correlations under the “financialspillover” parametrisation.
ECB Working Paper 2082, June 2017 53

Figure 2: Distribution of Coefficient Estimates in the Regression of Estimated Euro AreaMonetary Policy Shocks on the True Shocks Across Replications of the Monte Carlo
Experiment
−0.2 0 0.2 0.4 0.6 0.8 1
βmpus
No fin. spilloversWith fin. spillovers
−0.2 0 0.2 0.4 0.6 0.8 1
βmpea
−0.2 0 0.2 0.4 0.6 0.8 1
βmpjp
−0.2 0 0.2 0.4 0.6 0.8 1
βdus
−0.2 0 0.2 0.4 0.6 0.8 1
βdea
−0.2 0 0.2 0.4 0.6 0.8 1
βdjp
−0.2 0 0.2 0.4 0.6 0.8 1
βcpus
−0.2 0 0.2 0.4 0.6 0.8 1
βcpea
−0.2 0 0.2 0.4 0.6 0.8 1
βcpja
Note: The figure displays the distribution of the coefficient estimates in the regression of Equation (2).
Figure 3: True and Local Projection Spillover Estimates for Euro Area Monetary PolicyShocks to the US in the Monte Carlo Experiment
0 4 8 12 16
−15
−10
−5
0
x 10−3
Quarters
No fin. spillovers
TrueLocal projection with shocks from mis−specified single−country model
0 4 8 12 16
−15
−10
−5
0
x 10−3
Quarters
With fin. spillovers
Note: The figure shows the spillovers from a euro area monetary policy shock to the US output gap. The black solidline represents the true value of the spillover implied by the multi-country model of Coenen and Wieland (2002),and the thick (thin) red dashed line the average (median) spillover estimate across all replications of the MonteCarlo experiment. The left-hand side panel displays the spillovers for the “no financial spillover” parametrisation,and the right-hand side panel under the “financial spillover” parametrisation. The spillover estimates are obtainedusing the smoothed monetary policy shocks and data on the US output gap in local projections. In each replicationof the Monte Carlo experiment, the smoothed monetary policy shocks are obtained applying the Kalman-filter withthe corresponding single-country models on the data simulated based on the multi-country data-generating process.The US output gap data stem from the corresponding simulations of the multi-country data-generating process.
ECB Working Paper 2082, June 2017 54

Fig
ure
4:C
orre
lati
onh
eat
map
of
NK
DS
GE
Mon
etary
Poli
cyS
hock
Tim
eS
erie
sE
stim
ate
s
AUS
BRA
CAN
CHE
CHLCHN
COL
CZE
EAR
GBR
HUNINDISLISR
JPN
KOR
MEXNOR
NZL
PAKPER
POL
ROURUS
SWETHATUR
USA
ZAF
AU
S
BR
A
CA
N
CH
E
CH
LC
HN
CO
L
CZ
E
EA
R
GB
R
HU
NIN
DIS
LIS
R
JPN
KO
RM
EX
NO
RN
ZL
PA
KP
ER
PO
L
RO
UR
US
SW
ET
HA
TU
R
US
A
ZA
F
−0.
4
−0.
2
00.2
0.4
0.6
0.8
1
No
te:
Th
efi
gure
dis
pla
ysth
eh
eat
ma
po
fth
eco
rrel
ati
on
sbe
twee
nth
em
on
eta
rypo
licy
shoc
kti
me
seri
eses
tim
ate
so
bta
ined
fro
mN
KD
SG
Em
odel
sin
the
da
taba
se.
ECB Working Paper 2082, June 2017 55

Figure 5: Distribution of Cross-country Correlations Between Monetary Policy Shock TimeSeries Estimates
−0.8 −0.6 −0.4 −0.2 0 0.2 0.4 0.6 0.8
DSGE models
−0.8 −0.6 −0.4 −0.2 0 0.2 0.4 0.6 0.8
Non-DSGE models
−0.8 −0.6 −0.4 −0.2 0 0.2 0.4 0.6 0.8
DSGE models for AEs
−0.8 −0.6 −0.4 −0.2 0 0.2 0.4 0.6 0.8
DSGE models for financially integrated economies
Note: The figure displays the distributions of the cross-country correlations between the monetary policy shocktime series estimates in our database. The red dashed lines indicate the mean of the distributions.
ECB Working Paper 2082, June 2017 56

Figure 6: Estimates of Global Output Spillovers from Monetary Policy based on LocalProjections and Monetary Policy Shock Estimates from DSGE Models and Non-DSGE
Approaches
0 3 6
−0.15
−0.1
−0.05
Quarters
DSGE shocks
USAEAR
0 3 6
−0.15
−0.1
−0.05
Quarters
Non-DSGE shocks
Note: The figure shows the cross-country averages of the estimates of the spillovers from US (black solid line)and the euro area (blue dash-dotted line) monetary policy to global output. The spillovers are estimated usinglocal projections with the first principal component of all monetary policy shock estimates available over thetime period 1993 to 2007 for the US and the euro area. The left-hand side panel displays the spillover estimatesfor the case when only DSGE model monetary policy shocks are used to determine the principal component,and the right-hand side panel for the case when only non-DSGE model shocks are used.
ECB Working Paper 2082, June 2017 57

C Online Appendix
C.1 Construction of monetary policy shocks based on Consensus Forecast
data
We use monthly data on three-month ahead financial market expectations about of short-
term interest rates from Consensus Economics in order to form monetary policy shock time
series. To identify the benchmark interest rate to use for the construction of monetary policy
surprise series we follow closely the target interest rate for the surveyed financial institu-
tions as reported by Consensus Economics and change the benchmark according to changes
reported. For the US we first subtract from the actual realised short-term interest rate one-
quarter lagged, three-month ahead Consensus Forecast short-term interest rate expectation.
We then regress the resulting difference on four lags of the log-difference of US industrial
production and the consumer price index. The residual from this regression in our time se-
ries of US monetary policy shocks constructed based on Consensus Forecast data. For the
time period from 2003 onwards, we additionally regress this time series of residuals on Citi-
Group macroeconomic surprises, and use the residuals from this regression as US monetary
policy shocks. For the euro area and the UK, in the first regression in addition to domestic
variables we also include US industrial production and inflation. For the euro area, prior to
January 2005, when a euro area survey was established, the financial-market expectations are
a weighted average of the euro area countries’ data. From January 1990 through December
1998, the euro area average was weighted by GDP at purchasing power parities. From Jan-
uary 1999 onwards the euro area average was weighted by the nominal stock of government
bonds.
C.2 The Model of Coenen and Wieland (2002)
C.2.1 Model description
For i ∈ {us, ea, ja}, the IS-curve for the domestic output gap qit is given by
qit =
3∑j=1
δqijqi,t−j + δzi zit + δrli (r(l)i,t−1 − r
(l)i ) + σe
dedit, (C.1)
where zit =∑N
j=1,j 6=iwij · ωij,t is an economy’s real effective exchange rate with wij rep-
resenting bilateral trade shares and ωij,t bilateral exchange rates; r(l)it is the real long-term
interest rate; and edit is a demand shock. Quarter-on-quarter inflation is determined in a
ECB Working Paper 2082, June 2017 58

backward-looking Phillips-curve
πit =
3∑j=1
φji
−1 3∑j=0
φjicwpi,t−j − (φ2i + φ3i)πi,t−1 − φ3iπi,t−2
, (C.2)
where cwpit is the contract wage. Based on specification tests Coenen and Wieland (2002)
consider fixed-duration Taylor-style wage contracts for the euro area and Japan
cwpit = (φ1i + φ2i + φ3i)Etπi,t+1 + (φ2i + φ3i)Etπi,t+2 + φ3iEtπi,t+3
+ γi
3∑j=0
φjiEtqi,t+j + σcwi ecwit , i ∈ {ea, ja}, (C.3)
and relative real wage contracts for the US
cwpus,t =3∑
j=0
φj,usEt$us,t+j + γus
3∑j=0
φj,usEtqus,t+j + σcwus ecwus,t,
$us,t =
3∑j=0
φj,uscwpus,t−j . (C.4)
The model is closed by monetary policy rules which determine the nominal short-term interest
rate i(s)it according to
i(s)it = ρisi
(s)i,t−1 + αi
(π(4)it − π
Ti
)+ βiqit + (1− ρi)
(r(l)i + π
(4)it
)+ σi
s
i empit , (C.5)
where πTi represents the inflation target, and empit is a monetary policy shock. Year-on-year
inflation π(4)it is given by
π(4)it =
3∑j=0
πi,t−j . (C.6)
The real long-term interest rate is defined as
r(l)it = i
(l)it −
1
8
8∑j=1
Etπi,t+j . (C.7)
Finally, the uncovered interest rate parity condition is given by
ωi,us,t = Etωi,us,t+1 + 4 · Etπi,t+1 − i(l)it + i(l)us,t − 4 · Etπus,t+1. (C.8)
ECB Working Paper 2082, June 2017 59
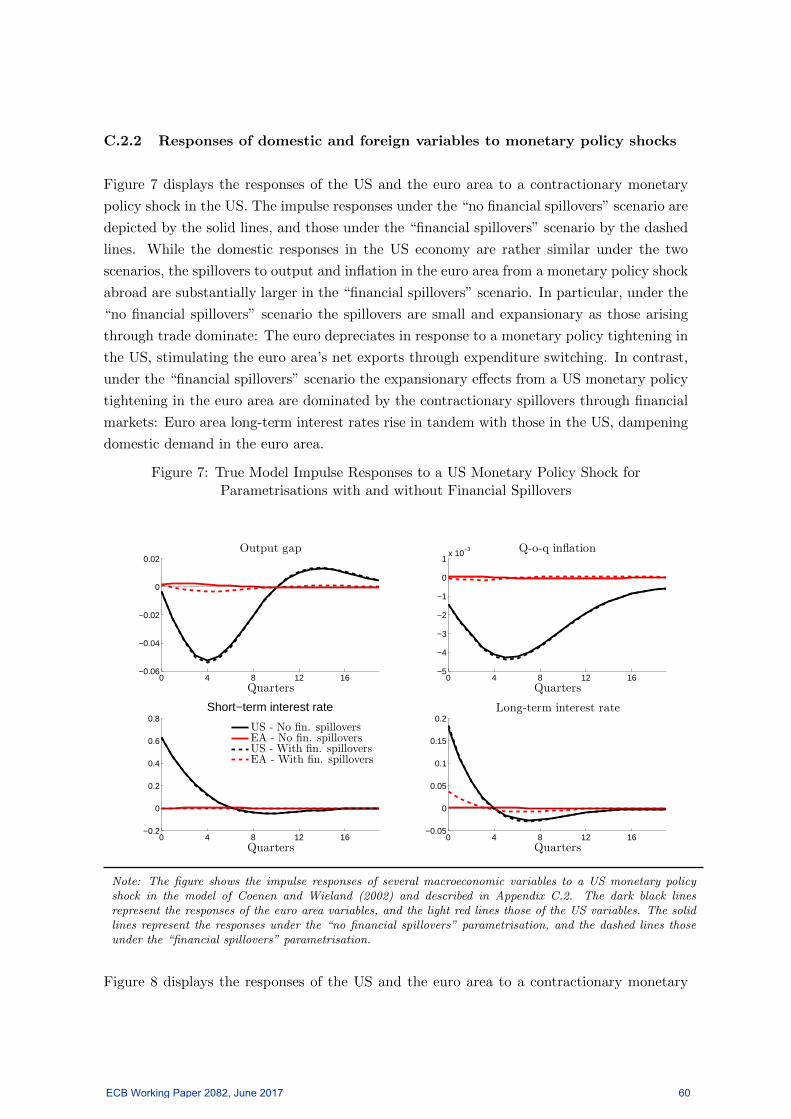
C.2.2 Responses of domestic and foreign variables to monetary policy shocks
Figure 7 displays the responses of the US and the euro area to a contractionary monetary
policy shock in the US. The impulse responses under the “no financial spillovers” scenario are
depicted by the solid lines, and those under the “financial spillovers” scenario by the dashed
lines. While the domestic responses in the US economy are rather similar under the two
scenarios, the spillovers to output and inflation in the euro area from a monetary policy shock
abroad are substantially larger in the “financial spillovers” scenario. In particular, under the
“no financial spillovers” scenario the spillovers are small and expansionary as those arising
through trade dominate: The euro depreciates in response to a monetary policy tightening in
the US, stimulating the euro area’s net exports through expenditure switching. In contrast,
under the “financial spillovers” scenario the expansionary effects from a US monetary policy
tightening in the euro area are dominated by the contractionary spillovers through financial
markets: Euro area long-term interest rates rise in tandem with those in the US, dampening
domestic demand in the euro area.
Figure 7: True Model Impulse Responses to a US Monetary Policy Shock forParametrisations with and without Financial Spillovers
0 4 8 12 16−0.06
−0.04
−0.02
0
0.02
Quarters
Output gap
0 4 8 12 16−5
−4
−3
−2
−1
0
1x 10
−3
Quarters
Q-o-q inflation
0 4 8 12 16−0.2
0
0.2
0.4
0.6
0.8
Quarters
Short−term interest rate
US - No fin. spilloversEA - No fin. spilloversUS - With fin. spilloversEA - With fin. spillovers
0 4 8 12 16−0.05
0
0.05
0.1
0.15
0.2
Quarters
Long-term interest rate
Note: The figure shows the impulse responses of several macroeconomic variables to a US monetary policyshock in the model of Coenen and Wieland (2002) and described in Appendix C.2. The dark black linesrepresent the responses of the euro area variables, and the light red lines those of the US variables. The solidlines represent the responses under the “no financial spillovers” parametrisation, and the dashed lines thoseunder the “financial spillovers” parametrisation.
Figure 8 displays the responses of the US and the euro area to a contractionary monetary
ECB Working Paper 2082, June 2017 60

policy shock in the euro area. In contrast to the spillovers from US monetary policy, those
emitted from the euro area are contractionary both under the “no financial spillovers” and
the “financial spillovers” scenarios. This is due to the relatively large susceptibility of US
long-term interest rates to foreign shocks in our calibration compared to the polar case of the
“no financial spillovers” scenario calibration for the euro area. For the euro area, the domestic
impact of a euro area monetary policy shock is smaller under the “financial spillovers” scenario
as the transmission from short to long-term interest rates is weaker. This is consistent with
the recent “dilemma hypothesis” according to which financial globalisation reduces monetary
policy autonomy and effectiveness, partly due to a dampened transmission of short term to
long-term interest rates (Ito, 2014; Miyajima et al., 2014; Obstfeld, 2015; Rey, 2015).
Figure 8: True Model Impulse Responses to a Euro Area Monetary Policy Shock forParametrisations with and without Financial Spillovers
0 4 8 12 16−0.05
−0.04
−0.03
−0.02
−0.01
0
0.01
Quarters
Output gap
0 4 8 12 16−5
−4
−3
−2
−1
0
1x 10
−3
Quarters
Q-o-q inflation
0 4 8 12 16−0.2
0
0.2
0.4
0.6
0.8
Quarters
Short−term interest rate
US - No fin. spilloversEA - No fin. spilloversUS - With fin. spilloversEA - With fin. spillovers
0 4 8 12 16−0.1
0
0.1
0.2
0.3
Quarters
Long-term interest rate
Note: The figure shows the impulse responses of several macroeconomic variables to a euro area monetarypolicy shock in the model of Coenen and Wieland (2002) and described in Appendix C.2. The dark black linesrepresent the responses of the euro area variables, and the light red lines those of the US variables. The solidlines represent the responses under the “no financial spillovers” parametrisation, and the dashed lines thoseunder the “financial spillovers” parametrisation.
ECB Working Paper 2082, June 2017 61

C.3 Additional figures
Figure 9: Economies’ International Financial Integration Patterns
0 0.5 1 1.5 2 2.5
EMEAE
AUSBRACANCHECHLCHNCOLCZEEARGBRHUNINDISLISRJPNKORMEXNORNZLPAKPERPOLROURUSSWETHATURZAF GFALi/GDPi
0 0.2 0.4 0.6 0.8 1
EMEAE
AUSBRACANCHECHLCHNCOLCZEEARGBRHUNINDISLISRJPNKORMEXNORNZLPAKPERPOLROURUSSWETHATURZAF GFALi,us/GFALi
Note: The figure displays economies’ gross foreign asset and liability positions relative to GDP (left-hand sidepanel) as well as the share of economies’ gross foreign asset and liability position accounted for by the US(right-hand side panel). The overall gross foreign asset and liability positions are taken from Lane and Milesi-Ferretti (2007), and the bilateral gross foreign asset and liability positions with the US from the IMF CPIS.The latter refer only to portfolio investment assets and liabilities. The depicted values are averages over thetime period from 1993 to 2007 for the left-hand side panel and 2001 to 2007 for the right-hand side panel. Thedepicted values are one plus the logarithm of the original values. There are no data on portfolio asset holdingsfor China and Peru in the IMF CPIS. The data on the gross foreign assets and liabilities in the left-hand sidepanel are not plotted for the US.
ECB Working Paper 2082, June 2017 62

Acknowledgements We would like to thank a large number of researchers for sharing their data and codes as well as providing valuable comments. As the number of names exceeds the space available here we list them in a separate section in the Appendix of this paper. The database of monetary policy shock estimates gathered for the purpose of this paper is available from our websites. Researchers using specific shock time series from the database are kindly asked to also quote the original source. The views expressed in the paper are those of the authors and do not necessarily reflect those of the ECB or the Eurosystem and should not be reported as such. None of the monetary policy shock estimates used in this paper represent the views of the central banks, international organisations, ministries and their policy committees. Georgios Georgiadis European Central Bank, Frankfurt am Main, Germany; email: [email protected] Martina Jančoková European Central Bank, Frankfurt am Main, Germany; email: [email protected]
© European Central Bank, 2017
Postal address 60640 Frankfurt am Main, Germany Telephone +49 69 1344 0 Website www.ecb.europa.eu
All rights reserved. Any reproduction, publication and reprint in the form of a different publication, whether printed or produced electronically, in whole or in part, is permitted only with the explicit written authorisation of the ECB or the authors.
This paper can be downloaded without charge from www.ecb.europa.eu, from the Social Science Research Network electronic library or from RePEc: Research Papers in Economics. Information on all of the papers published in the ECB Working Paper Series can be found on the ECB’s website.
ISSN 1725-2806 (pdf) DOI 10.2866/301834 (pdf) ISBN 978-92-899-2804-5 (pdf) EU catalogue No QB-AR-17-094-EN-N (pdf)