A Quasi-Dimensional NOx Emission Model for Spark Ignition Direct Injection (SIDI) Gasoline Engines
13
ABSTRACT A fundamentally based quasi-dimensional NO x emission model for spark ignition direct injection (SIDI) gasoline engines was developed. The NO x model consists of a chemical mechanism and three sub-models. The classical extended Zeldovich mechanism and N 2 O pathway for NO x formation mechanism were employed as the chemical mechanism in the model. A characteristic time model for the radical species H, O and OH was incorporated to account for non-equilibrium of radical species during combustion. A model of homogeneity which correlates fundamental dimensionless numbers and mixing time was developed to model the air-fuel mixing and inhomogeneity of the charge. Since temperature has a dominant effect on NO x emission, a flame temperature correlation was developed to model the flame temperature during the combustion for NO x calculation. Measured NO x emission data from a single cylinder SIDI research engine at different operating conditions was used to validate the NO x model. The effects of fuel injection timing, injection pressure, spark timing, overall engine AFR, and intake temperature on NO x emission were examined and well captured by the model. Comparison of all the NO x emission data with the model indicates that the NO x model is a good predictive tool for NO x emissions in SIDI engines. INTRODUCTION Spark ignition direct injection (SIDI) gasoline engines offer significant fuel economy improvement while maintaining higher power output over conventional port fuel injection (PFI) engines. Better fuel economy is mainly achieved by lower throttling and reduced heat losses during stratified combustion as well as higher compression ratios [ 1]. In SIDI engines, direct fuel injection, in-cylinder air motion and combustion chamber contour are used to optimize fuel distribution for reliable ignition and combustion. However, unburned hydrocarbons (UHCs) and NO x emissions from SIDI engines are relatively higher than those of PFI engines [ 2, 3]. In-cylinder temperature in SIDI engines is higher compared to throttled PFI engines at a comparable load because of a larger compressed mass in the cylinder. Furthermore, in a SIDI engine which is operated at a stratified mode, temperature within the reaction zone is high due to a stoichiometric or slightly rich mixture in the core region of the charge. NO x is high in these areas even though the engine is operated at overall lean conditions. Classical reviews on NO x emission modeling in combustion systems were given by Miller and Bowman [ 4]. Quasi- dimensional NO x emission models of PFI gasoline engines [ 5, 6] and diesel engines [ 7, 8] were studied extensively and gave a good prediction of NO x emissions. Multi-dimensional modeling of SIDI engines with a detailed NO x mechanism was demonstrated the capability to predict NO x emissions [ 9, 10, 11]. However, few quasi-dimensional NO x emission models of SIDI engines can be found in the literatures. In this paper, a fundamentally based method for calculating NO x emissions in SIDI engines was developed. The present model employs flame-chemistry developments to provide equations needed for NO x prediction. Experimental data from a SIDI gasoline engine was used to validate the model. Effects of various engine operating conditions on NO x emissions were examined by the model. A Quasi-Dimensional NO x Emission Model for Spark Ignition Direct Injection (SIDI) Gasoline Engines 2013-01-1311 Published 04/08/2013 Jian Gong and Christopher Rutland University of Wisconsin-Madison Copyright © 2013 SAE International doi: 10.4271/2013-01-1311 Downloaded from SAE International by Jian Gong, Tuesday, April 21, 2015
Transcript of A Quasi-Dimensional NOx Emission Model for Spark Ignition Direct Injection (SIDI) Gasoline Engines
ABSTRACTA fundamentally based quasi-dimensional NOx emissionmodel for spark ignition direct injection (SIDI) gasolineengines was developed. The NOx model consists of achemical mechanism and three sub-models. The classicalextended Zeldovich mechanism and N2O pathway for NOxformation mechanism were employed as the chemicalmechanism in the model. A characteristic time model for theradical species H, O and OH was incorporated to account fornon-equilibrium of radical species during combustion. Amodel of homogeneity which correlates fundamentaldimensionless numbers and mixing time was developed tomodel the air-fuel mixing and inhomogeneity of the charge.Since temperature has a dominant effect on NOx emission, aflame temperature correlation was developed to model theflame temperature during the combustion for NOxcalculation.
Measured NOx emission data from a single cylinder SIDIresearch engine at different operating conditions was used tovalidate the NOx model. The effects of fuel injection timing,injection pressure, spark timing, overall engine AFR, andintake temperature on NOx emission were examined and wellcaptured by the model. Comparison of all the NOx emissiondata with the model indicates that the NOx model is a goodpredictive tool for NOx emissions in SIDI engines.
INTRODUCTIONSpark ignition direct injection (SIDI) gasoline engines offersignificant fuel economy improvement while maintaininghigher power output over conventional port fuel injection(PFI) engines. Better fuel economy is mainly achieved bylower throttling and reduced heat losses during stratifiedcombustion as well as higher compression ratios [1]. In SIDI
engines, direct fuel injection, in-cylinder air motion andcombustion chamber contour are used to optimize fueldistribution for reliable ignition and combustion.
However, unburned hydrocarbons (UHCs) and NOxemissions from SIDI engines are relatively higher than thoseof PFI engines [2,3]. In-cylinder temperature in SIDI enginesis higher compared to throttled PFI engines at a comparableload because of a larger compressed mass in the cylinder.Furthermore, in a SIDI engine which is operated at astratified mode, temperature within the reaction zone is highdue to a stoichiometric or slightly rich mixture in the coreregion of the charge. NOx is high in these areas even thoughthe engine is operated at overall lean conditions.
Classical reviews on NOx emission modeling in combustionsystems were given by Miller and Bowman [4]. Quasi-dimensional NOx emission models of PFI gasoline engines[5,6] and diesel engines [7,8] were studied extensively andgave a good prediction of NOx emissions. Multi-dimensionalmodeling of SIDI engines with a detailed NOx mechanismwas demonstrated the capability to predict NOx emissions[9,10,11]. However, few quasi-dimensional NOx emissionmodels of SIDI engines can be found in the literatures.
In this paper, a fundamentally based method for calculatingNOx emissions in SIDI engines was developed. The presentmodel employs flame-chemistry developments to provideequations needed for NOx prediction. Experimental data froma SIDI gasoline engine was used to validate the model.Effects of various engine operating conditions on NOxemissions were examined by the model.
A Quasi-Dimensional NOx Emission Model for SparkIgnition Direct Injection (SIDI) Gasoline Engines
2013-01-1311Published
04/08/2013
Jian Gong and Christopher RutlandUniversity of Wisconsin-Madison
Copyright © 2013 SAE International
doi:10.4271/2013-01-1311
Downloaded from SAE International by Jian Gong, Tuesday, April 21, 2015

EXPERIMENTAL SETUPNOx emission data [12] used to validate the model wascollected on a SIDI engine in Engine Research Center (ERC).The engine was modified from a HCCI operating engine to afuel-neutral, spark ignition direct injection (SIDI) engine. Theengine is a single cylinder engine with a flat-top piston. Forthe research reported here, the engine was fueled withgasoline. The technical specifications of this engine includingdimensions and valve timings are given in Table 1.
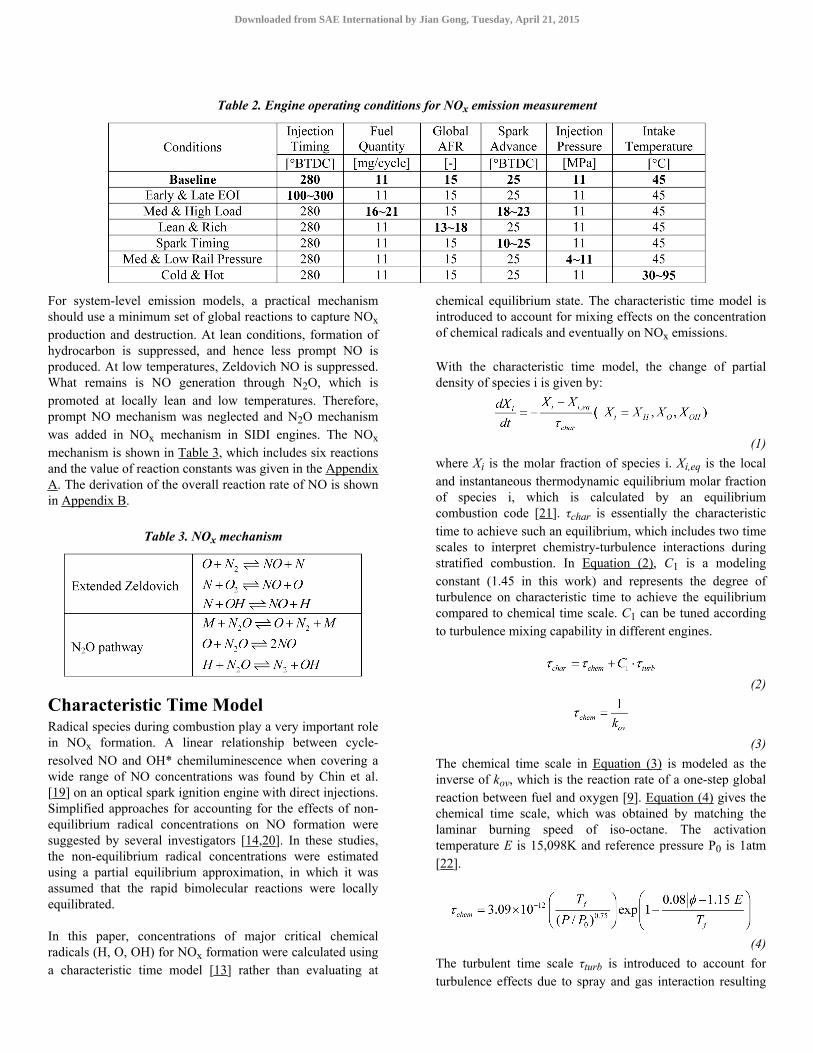
The experimental data available at this time was collected at aconstant engine speed of 2000 rpm. More data at differentspeeds may be available in the near future. The baseline waschosen as a starting point for comparison. As the baselineoperating condition was established, a number of otheroperating conditions were chosen as deviations from thebaseline to investigate the effects of various operatingparameters on NOx emission. As shown in Table 2, changesof operating conditions include variations in injection timing,fuel quantity, global air-fuel ratio, spark timing, injectionpressure, and intake temperature.
MODEL DESCRIPTIONThe NOx model consists of a chemical mechanism and threesub-models. Each of these sub-models interacts with eachother. The overall structure of the NOx model is shown inFigure 1. The mechanisms include a classical extendedZeldovich mechanism and a N2O pathway mechanism forNOx formation. A characteristic time model based on theclassical characteristic time combustion model [13] in dieselengines was adapted in order to account for mixing effect onthe critical radical species, which play a very important roleon NOx formation and destruction. A model of homogeneitywas developed to model air-fuel mixing. Rather than usingbulk mean gas temperature or adiabatic flame temperature, afundamental based flame temperature correlation wasproposed for NOx calculations.
Experimental in-cylinder information including crank-angleresolved pressure, heat release rate associated with enginespecification and operating parameters were used as inputs tothe model. The focus of this study is on NOx modeling inGDI engines rather than developing a predictive combustionmodel, therefore using the experimental pressure and heatrelease data will be more appropriate and helpful to constructa solid NOx emission model.
Figure 1. NOx model structure
MechanismThe kinetics of NOx formation and destruction in combustionsystems were extensively discussed in [4,14,15]. Basically,NOx emission from combustion system results from fourmain paths: thermal NO, prompt NO, N2O pathway and fuelnitrogen. Thermal NO is from oxidation of nitrogen atrelatively high temperature at fuel-lean environment,therefore has a strong dependence on temperature, residencetime and oxygen concentration. Prompt NO is formedthrough reactions of nitrogen with hydrocarbon radicals infuel-rich region of flames [16]. N2O plays a significant rolein NO formation at low temperatures (below 1500∼1600K),fuel-lean combustion under conditions of intense mixing[14,17,18]. Fuel nitrogen is a particular important source forNOx emission from coal rather than liquid fuels [4].Therefore, fuel nitrogen is not considered in current NOmechanism.
Table1. Engine specification
Downloaded from SAE International by Jian Gong, Tuesday, April 21, 2015
For system-level emission models, a practical mechanismshould use a minimum set of global reactions to capture NOxproduction and destruction. At lean conditions, formation ofhydrocarbon is suppressed, and hence less prompt NO isproduced. At low temperatures, Zeldovich NO is suppressed.What remains is NO generation through N2O, which ispromoted at locally lean and low temperatures. Therefore,prompt NO mechanism was neglected and N2O mechanismwas added in NOx mechanism in SIDI engines. The NOxmechanism is shown in Table 3, which includes six reactionsand the value of reaction constants was given in the AppendixA. The derivation of the overall reaction rate of NO is shownin Appendix B.
Table 3. NOx mechanism
Characteristic Time ModelRadical species during combustion play a very important rolein NOx formation. A linear relationship between cycle-resolved NO and OH* chemiluminescence when covering awide range of NO concentrations was found by Chin et al.[19] on an optical spark ignition engine with direct injections.Simplified approaches for accounting for the effects of non-equilibrium radical concentrations on NO formation weresuggested by several investigators [14,20]. In these studies,the non-equilibrium radical concentrations were estimatedusing a partial equilibrium approximation, in which it wasassumed that the rapid bimolecular reactions were locallyequilibrated.
In this paper, concentrations of major critical chemicalradicals (H, O, OH) for NOx formation were calculated usinga characteristic time model [13] rather than evaluating at
chemical equilibrium state. The characteristic time model isintroduced to account for mixing effects on the concentrationof chemical radicals and eventually on NOx emissions.
With the characteristic time model, the change of partialdensity of species i is given by:
(1)where Xi is the molar fraction of species i. Xi,eq is the localand instantaneous thermodynamic equilibrium molar fractionof species i, which is calculated by an equilibriumcombustion code [21]. τchar is essentially the characteristictime to achieve such an equilibrium, which includes two timescales to interpret chemistry-turbulence interactions duringstratified combustion. In Equation (2), C1 is a modelingconstant (1.45 in this work) and represents the degree ofturbulence on characteristic time to achieve the equilibriumcompared to chemical time scale. C1 can be tuned accordingto turbulence mixing capability in different engines.
(2)
(3)The chemical time scale in Equation (3) is modeled as theinverse of kov, which is the reaction rate of a one-step globalreaction between fuel and oxygen [9]. Equation (4) gives thechemical time scale, which was obtained by matching thelaminar burning speed of iso-octane. The activationtemperature E is 15,098K and reference pressure P0 is 1atm[22].
(4)The turbulent time scale τturb is introduced to account forturbulence effects due to spray and gas interaction resulting
Table 2. Engine operating conditions for NOx emission measurement
Downloaded from SAE International by Jian Gong, Tuesday, April 21, 2015

from direct injection of fuel. τturb is proportional to the eddyturnover time in Equation (5) and shown as:
(5)
Turbulence kinetic energy by definition is given by:
(6)
where u′ is turbulence intensity. u′ is not a constant during thecombustion process and was found to be proportional to thesquare root of unburned gas density at spark timing and
correlated well with mean piston speed [23]. ρi is gasdensity during combustion.
(7)
Dissipation rate ε is related to integral scale by Equation (8)with a dissipation rate constant CD =0.09 [23]. The integralscale can be taken as proportional to the clearance height inEquation (9) [24].
(8)
(9)
The chemical time scale associated with the flametemperature at an engine operating condition is shown inFigure 2. The chemical time scale is inversely proportional tothe flame temperature. Similarly, an inversely proportionalrelationship between turbulent time scale and turbulenceintensity is shown in Figure 3. Comparison of the magnitudesbetween the chemical time scale and the turbulence timescale indicates that the turbulence time scale is much largerthan the chemical time scale. This means the combustion isdominated by the turbulent mixing.
Figure 4 shows sensitivities of characteristic time on NOemission. As characteristic time increases, NO reaction ratedecreases as well as NO. The equilibrium NO calculated fromthe equilibrium combustion code [21] shows about zero NOemission, which is much less than the data. This indicates thatengine out NO from combustion is far from equilibrium andthe radical species characteristic time is much less than theequilibrium NO time scale.
Figure 2. Chemical time scale and flame temperature(2000 rpm, 3.28 bar IMEP)
Figure 3. Turbulence time scale and turbulence intensity(2000 rpm, 3.28 bar IMEP)
Figure 4. Predicted NO reaction rates and NO emissionswith change of characteristic time (2000 rpm, 3.28 bar
IMEP)
Downloaded from SAE International by Jian Gong, Tuesday, April 21, 2015

Homogeneity ModelIn SIDI gasoline engines, as fuel is directly injected into acylinder in late intake or compression stroke, there isinhomogeneity in the combustion chamber. The objective ofdeveloping the homogeneity model is trying to capture theeffect of fuel-air mixing on NOx emission. The quality offuel-air mixing can be evaluated in terms of inhomogeneityindex, which will be used for the NOx emission calculation.
The dimensionless inhomogeneity index is introduced inEquation (10) by correlating to three dimensionless numbersin order to capture the effects of injection timing, in-cylinderbulk flow, and the interaction between ambient gas and sprayon air-fuel mixing respectively.
(10)Duffy et al. [8] showed that NOx emissions in diesel enginesrevealed an inverse proportionality to N1.5, where N is theengine speed. In Equation (10), −1.5 is used as the exponentof Reynolds number, which is scaled with engine speed. Theexponents of the other two dimensionless numbers areestimated based on the assumption that the available mixingtime dominates air-fuel mixing and bulk mean flow plays asecondary role on the charge inhomogeneity compared to theinteraction between spray and ambient gas.
A dimensionless mixing time τmix in Equation (11) is used toaccount for effect of actual mixing time available between theend of injection (EOI) and start of combustion (SOC) on air-fuel mixing. The denominator in Equation (11) is theinjection duration, which is a reference time scale andevaluated from the start of injection (SOI) to the end ofinjection (EOI). The Reynolds number (Re) is scaled by the
mean piston speed ( ) and engine bore diameter (B) andaccounts for effect of bulk flow on mixing. The Webernumber (We) is scaled with fuel injection velocity and nozzlediameter and accounts for the effect of spray and ambient gasinteraction on the charge inhomogeneity.
(11)
(12)
(13)Essentially, the dimensionless inhomogeneity index reflectsthe degree of inhomogeneity of local air and fuel mixture
before the start of combustion. In other words, if IH equalszero, the charge is homogenous. If IH is close to one, thecharge tends to be inhomogeneous. The model constant C2 inEquation 10 is a steepness factor, which characterizes howthe inhomogeneity index changes with three dimensionlessnumbers. Physically, C2 represents the mixing property of aparticular combustion chamber design.
Figure 5. Inhomogeneity index with respect todimensionless mixing time for all the data
Figure 6. Inhomogeneity index with respect to Webernumber at three different injection pressures
Inhomogeneity index distribution with respect todimensionless mixing time is shown in Figure 5. With longermixing time, the inhomogeneity index tends to be zero, whichmeans the charge is more homogeneous. Inhomogeneityindexes with respect to Weber number at three injectionpressures are shown in Figure 6. At higher injectionpressures, interaction between spray and gas is stronger,which enhances the mixing and leads to more homogeneouscharge. As discussion above, the inhomogeneity index is a
Downloaded from SAE International by Jian Gong, Tuesday, April 21, 2015
very good diagnostic tool to measure the inhomogeneity ofthe charge.
Using the inhomogeneity index, the equivalence ratio nearthe spark plug at the start of combustion can be correlated via
(14)
where ɸglobal is the global engine equivalence ratio. It isassumed that the local equivalence ratio near the spark plug atthe start of combustion is lightly rich, which is observed byDrake et al. [25] through experimental measurements ofequivalence ratio near the spark plug at spark timing. ɸcombwill be equal to ɸglobal if the charge is homogeneous.Otherwise, ɸcomb is higher than ɸglobal.
As the equivalence ratio near the spark plug at the start ofcombustion is calculated, instantaneous composition of themixture can be modeled through Equation (15) consideringmixing and dilution effect during flame propagation.
(15)
Flame propagation in terms of instantaneous localcomposition of mixture can be modeled using a progressvariable c, which is normalized cumulative heat release rateand obtained from heat release analysis.
Once the flame kernel is formed at the beginning of thecombustion, the flame kernel develops and propagates fromlocal rich areas to stoichiometric areas then to local lean areasand finally extinction occurs due to flammability limits.Essentially, Equation (15) shows that at the start ofcombustion (c = 0), ɸ is the equivalence ratio at spark timing.At the end of the combustion (c = 1), ɸ is close to C4·ɸglobal(C4 is the dilution constant and should be than 1), which isless than the global equivalence ratio due to dilution effects.
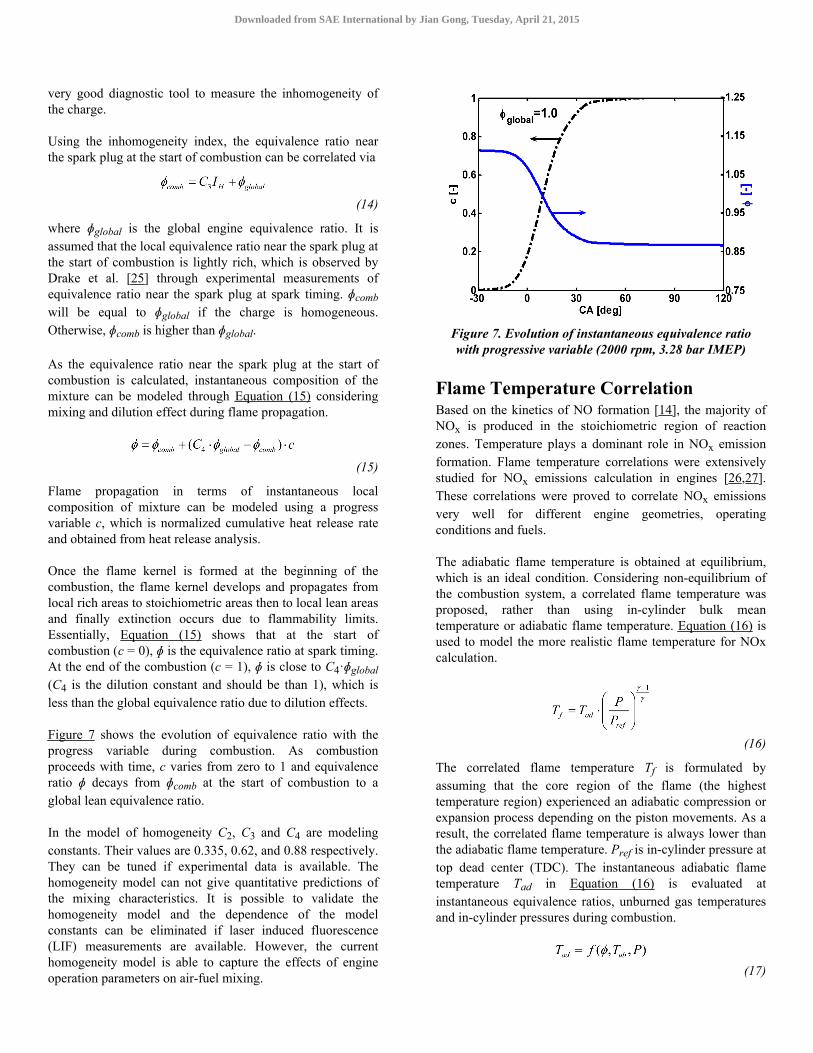
Figure 7 shows the evolution of equivalence ratio with theprogress variable during combustion. As combustionproceeds with time, c varies from zero to 1 and equivalenceratio ɸ decays from ɸcomb at the start of combustion to aglobal lean equivalence ratio.
In the model of homogeneity C2, C3 and C4 are modelingconstants. Their values are 0.335, 0.62, and 0.88 respectively.They can be tuned if experimental data is available. Thehomogeneity model can not give quantitative predictions ofthe mixing characteristics. It is possible to validate thehomogeneity model and the dependence of the modelconstants can be eliminated if laser induced fluorescence(LIF) measurements are available. However, the currenthomogeneity model is able to capture the effects of engineoperation parameters on air-fuel mixing.
Figure 7. Evolution of instantaneous equivalence ratiowith progressive variable (2000 rpm, 3.28 bar IMEP)
Flame Temperature CorrelationBased on the kinetics of NO formation [14], the majority ofNOx is produced in the stoichiometric region of reactionzones. Temperature plays a dominant role in NOx emissionformation. Flame temperature correlations were extensivelystudied for NOx emissions calculation in engines [26,27].These correlations were proved to correlate NOx emissionsvery well for different engine geometries, operatingconditions and fuels.
The adiabatic flame temperature is obtained at equilibrium,which is an ideal condition. Considering non-equilibrium ofthe combustion system, a correlated flame temperature wasproposed, rather than using in-cylinder bulk meantemperature or adiabatic flame temperature. Equation (16) isused to model the more realistic flame temperature for NOxcalculation.
(16)
The correlated flame temperature Tf is formulated byassuming that the core region of the flame (the highesttemperature region) experienced an adiabatic compression orexpansion process depending on the piston movements. As aresult, the correlated flame temperature is always lower thanthe adiabatic flame temperature. Pref is in-cylinder pressure attop dead center (TDC). The instantaneous adiabatic flametemperature Tad in Equation (16) is evaluated atinstantaneous equivalence ratios, unburned gas temperaturesand in-cylinder pressures during combustion.
(17)
Downloaded from SAE International by Jian Gong, Tuesday, April 21, 2015

The adiabatic flame temperature was calculated through aniterative approach [21] by assuming the absolute enthalpy ofthe reactants at the initial state equals the absolute enthalpy ofthe products at chemical equilibrium state considering elevenproduct species: H, O, N, H2, OH, CO, NO, O2, H2O, CO2,N2.
Figure 8 shows the correlated flame temperature associatedwith unburned gas temperature, bulk mean gas temperature aswell as heat release rate at one engine operating condition. Asindicated in Figure 8, before the start of combustion (SOC),the correlated temperature is the same as bulk mean gastemperature. When combustion is initiated, there is a quickjump of the flame temperature right after SOC. From SOC toTDC, the flame goes through an adiabatic compressionprocess and the correlated flame temperature is higher thanthe adiabatic flame temperature. After TDC, even though theflame experiences an adiabatic expansion process, thecorrelated flame temperature is still increasing due to a largeamount of heat released. As heat release rate decreases, thecorrelated flame temperature decreases as well because of theexpansion and approaches to the bulk mean gas temperaturegradually.
Figure 8. Unburned gas temperature, bulk mean gastemperature, correlated flame temperature and heat
release rate (2000 rpm, 3.28 bar IMEP)
RESULTS AND DISCUSSIONThe fundamental based NOx model was described in theprevious section. In order to validate the NOx model, effectsof engine operating parameters on NOx emission such as fuelinjection timing, injection pressure, spark timing, overallengine AFR, and intake temperature were examinedseparately using the conditions in Table 2. The modelconstants were calibrated and fixed for all the test cases inthis study.
Injection TimingInjection timing control is a good and effective strategy tocontrol NOx emissions in engines. Retard injection willrestrict NOx formation by limiting the mixing time of air andfuel. The effect of injection timing was incorporated in themodel of homogeneity in Equation (11). Experimental data inFigure 9 clearly shows that late injections lead to less NOx.The model shows the same trend as the data and givesquantitatively comparable predictions as well.
Figure 9. Effects of EOI on NOx emissions (model vsexperiments)
Injection PressureRather than injection timing, which directly affects the actualmixing time, direct injection of fuel introduces extramomentum into the combustion chamber and enhancesmixing. As injection pressure is increased, NOx emissionincreases due to the more stoichiometric reaction zones,which are resulted from augmented mixing.
Figure 10. Effects of rail pressure on NOx emissions(model vs experiments)
Downloaded from SAE International by Jian Gong, Tuesday, April 21, 2015

The effect of injection pressure on air-fuel mixing wasmodeled in Equation (13) through the Weber number. Figure10 shows the comparison of NOx emission at three differentinjection pressures. As injection pressure increases, the modelshows increased NOx as well as the data. The effect ofinjection pressure on NOx emission is well captured by themodel.
Global Equivalence RatioIt is widely accepted and understood that the highest NOxemission is produced at slightly lean operating condition dueto the high flame temperature and oxygen available [16]. InFigure 11, the global equivalence ratio is varied to study thesensitivity of the NOx model on global equivalence ratio.NOx emission is slightly over-predicted at stoichiometriccondition due to the very high flame temperature atstoichiometry. It can be seen that the model is sensitive to theflame temperature. At a lean condition (equivalence ratio of0.8) NOx is higher than that at a slightly rich condition(equivalence ratio of 1.15) due to excess oxygen available atlean conditions. Even though the model does not predictexactly the same amount of NOx as the data, the trend iscorrectly predicted.
Figure 11. Effects of equivalence ratio on NOx emissions(model vs experiments)
Spark TimingAs shown in Figure 12, retarding spark timing from 25 to 10BTDC causes the NOx emission decreases from 2300 to 700ppm. The spark timing effect on NOx emissions is wellcaptured by the NOx model. Lower NOx by retarding sparktiming is normally observed in PFI as well as SIDI gasolineengines [1]. The spark timing effect on NOx emission wasimplicitly modeled in the flame temperature correlation bycorrelating the start of combustion.
Figure 12. Effects of spark timing on NOx emissions(model vs experiments)
Intake TemperatureThe effect of intake temperature on NOx emission isstraightforward. High intake temperature results in higherflame temperature and eventually higher NOx emissions.Figure 13 shows the NOx emissions at two different intaketemperatures. Even though the model gives slightly lowerNOx compared to the data, the temperature effect on NOxemissions is captured.
Figure 13. Effects of intake temperature on NOxemissions (model vs experiments)
Overall ComparisonAbout sixty NOx emission data points at various operatingconditions were used to validate the NOx model. Overallcomparison of all the NOx data with the model is shown inFigure 14. Statistically, the predicted NOx emission correlateswith the data quite well with a normalized standard deviationof 0.02. Most of the predictions are in a reasonable rangecompared to the experimental data.
Downloaded from SAE International by Jian Gong, Tuesday, April 21, 2015
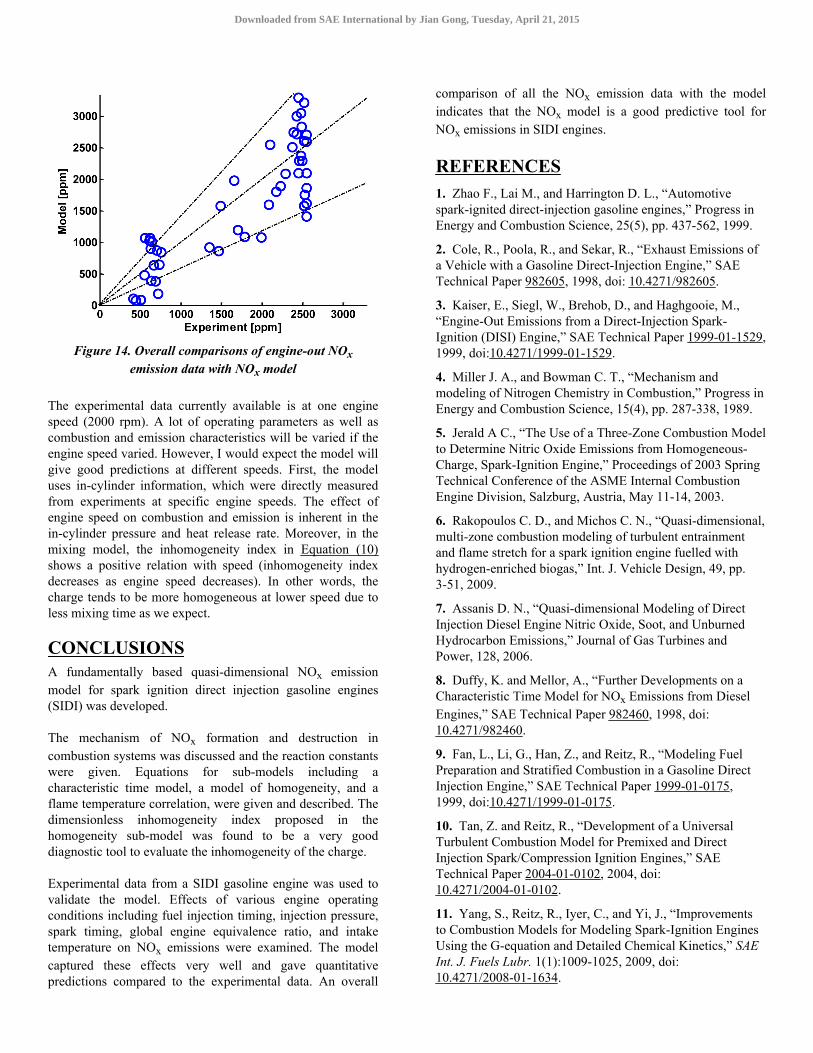
Figure 14. Overall comparisons of engine-out NOxemission data with NOx model
The experimental data currently available is at one enginespeed (2000 rpm). A lot of operating parameters as well ascombustion and emission characteristics will be varied if theengine speed varied. However, I would expect the model willgive good predictions at different speeds. First, the modeluses in-cylinder information, which were directly measuredfrom experiments at specific engine speeds. The effect ofengine speed on combustion and emission is inherent in thein-cylinder pressure and heat release rate. Moreover, in themixing model, the inhomogeneity index in Equation (10)shows a positive relation with speed (inhomogeneity indexdecreases as engine speed decreases). In other words, thecharge tends to be more homogeneous at lower speed due toless mixing time as we expect.
CONCLUSIONSA fundamentally based quasi-dimensional NOx emissionmodel for spark ignition direct injection gasoline engines(SIDI) was developed.
The mechanism of NOx formation and destruction incombustion systems was discussed and the reaction constantswere given. Equations for sub-models including acharacteristic time model, a model of homogeneity, and aflame temperature correlation, were given and described. Thedimensionless inhomogeneity index proposed in thehomogeneity sub-model was found to be a very gooddiagnostic tool to evaluate the inhomogeneity of the charge.
Experimental data from a SIDI gasoline engine was used tovalidate the model. Effects of various engine operatingconditions including fuel injection timing, injection pressure,spark timing, global engine equivalence ratio, and intaketemperature on NOx emissions were examined. The modelcaptured these effects very well and gave quantitativepredictions compared to the experimental data. An overall
comparison of all the NOx emission data with the modelindicates that the NOx model is a good predictive tool forNOx emissions in SIDI engines.
REFERENCES1. Zhao F., Lai M., and Harrington D. L., “Automotivespark-ignited direct-injection gasoline engines,” Progress inEnergy and Combustion Science, 25(5), pp. 437-562, 1999.
2. Cole, R., Poola, R., and Sekar, R., “Exhaust Emissions ofa Vehicle with a Gasoline Direct-Injection Engine,” SAETechnical Paper 982605, 1998, doi: 10.4271/982605.
3. Kaiser, E., Siegl, W., Brehob, D., and Haghgooie, M.,“Engine-Out Emissions from a Direct-Injection Spark-Ignition (DISI) Engine,” SAE Technical Paper 1999-01-1529,1999, doi:10.4271/1999-01-1529.
4. Miller J. A., and Bowman C. T., “Mechanism andmodeling of Nitrogen Chemistry in Combustion,” Progress inEnergy and Combustion Science, 15(4), pp. 287-338, 1989.
5. Jerald A C., “The Use of a Three-Zone Combustion Modelto Determine Nitric Oxide Emissions from Homogeneous-Charge, Spark-Ignition Engine,” Proceedings of 2003 SpringTechnical Conference of the ASME Internal CombustionEngine Division, Salzburg, Austria, May 11-14, 2003.
6. Rakopoulos C. D., and Michos C. N., “Quasi-dimensional,multi-zone combustion modeling of turbulent entrainmentand flame stretch for a spark ignition engine fuelled withhydrogen-enriched biogas,” Int. J. Vehicle Design, 49, pp.3-51, 2009.
7. Assanis D. N., “Quasi-dimensional Modeling of DirectInjection Diesel Engine Nitric Oxide, Soot, and UnburnedHydrocarbon Emissions,” Journal of Gas Turbines andPower, 128, 2006.
8. Duffy, K. and Mellor, A., “Further Developments on aCharacteristic Time Model for NOx Emissions from DieselEngines,” SAE Technical Paper 982460, 1998, doi:10.4271/982460.
9. Fan, L., Li, G., Han, Z., and Reitz, R., “Modeling FuelPreparation and Stratified Combustion in a Gasoline DirectInjection Engine,” SAE Technical Paper 1999-01-0175,1999, doi:10.4271/1999-01-0175.
10. Tan, Z. and Reitz, R., “Development of a UniversalTurbulent Combustion Model for Premixed and DirectInjection Spark/Compression Ignition Engines,” SAETechnical Paper 2004-01-0102, 2004, doi:10.4271/2004-01-0102.
11. Yang, S., Reitz, R., Iyer, C., and Yi, J., “Improvementsto Combustion Models for Modeling Spark-Ignition EnginesUsing the G-equation and Detailed Chemical Kinetics,” SAEInt. J. Fuels Lubr. 1(1):1009-1025, 2009, doi:10.4271/2008-01-1634.
Downloaded from SAE International by Jian Gong, Tuesday, April 21, 2015
12. Matthias, N., “Particulate Matter Sampling and VolatileOrganic Compound Removal for Characterization of SparkIgnited Direct Injection Engine Emissions,” M.S. Thesis,Engine Research Center, University of Wisconsin-Madison,Madison, WI, 2010.
13. Abraham, J., Bracco, F.V. and Reitz, R.D.,“Comparsions of Computed and Measured Premixed ChargeEngine Combustion”, Combustion and Flame, 60, pp.309-322, 1985.
14. Bowman Craig T., “Kinetics of pollutant formation anddestruction in combustion,” Progress in Energy andCombustion Science. Vol. 1(1), pp. 33-45. 1975.
15. Hill S. C., and Smoot L. D., “Modeling of nitrogenoxides formation and destruction in combustion systems,”Progress in Energy and Combustion Science, 26(4-6), pp.417-458, 2000.
16. Turns S. R., “Understanding NOx Formation inNonpremixed Flames: Experiments and Modeling,” Progressin Energy and Combustion Science, 21, pp. 361-385, 1995.
17. Hernández J. J., Perez-Collado J., and Sanz-Argent J.,“Role of the Chemical Kinetics on Modeling NOx Emissionsin Diesel Engines,” Energy & Fuels, 22(1), pp. 262-272,2008.
18. Lavoie, G. A., Heywood, J. B., and Keck, J. C.,“Experimental and theoretical study of nitric oxide formationin internal combustion engines,” Combust. Sci. Tech., Vol. 1,pp. 313-326, 1970
19. Chin, M., Smith, J., and Sick, V., “Cycle-Resolved NOMeasurements in a Spray-Guided SIDI Engine using FastExhaust Measurements and High-Speed OH*Chemiluminescence Imaging,” SAE Int. J. Fuels Lubr. 1(1):570-577, 2009, doi:10.4271/2008-01-1072.
20. Li S. C., Williams F. A., and Gebert K., “A Simplified,Fundamentally Based Method for Calculating NOx Emissionsin Lean Premixed Combustors,” Combustion and Flame,119(3), pp. 367-373, 1999.
21. Olikara, C. and Borman, G., “A Computer Program forCalculating Properties of Equilibrium Combustion Productswith Some Applications to I.C. Engines,” SAE TechnicalPaper 750468, 1975, doi: 10.4271/750468.
22. Metghalchi M., and Keck J. C., “Laminar burningvelocity of propane-air mixtures at high temperature andpressure,” Combustion and Flame, 38, pp. 143-154, 1980.
23. Keck J. C., “Turbulent flame structure and speed inspark-ignition engines,” Nineteenth Symposium(International) on Combustion, The Combustion Institute,19(1), pp. 1451-1466, 1982.
24. Heywood, J.B., “Internal combustion EngineFundamentals,” McGraw-Hill, New York, 1988
25. Drake M. C., Fansler T. D., and Lippert A. M.,“Stratified-charge combustion: modeling and imaging of a
spray-guided direct-injection spark-ignition engine,”Proceedings of the Combustion Institute, 30, pp. 2683-2691,2005.26. Rizk N. K., and Mongia H. C., “NOx Model for LeanCombustion Concept,” Journal of Propulsion and Power,11(1), pp. 161-169, 1995.27. Wu, K. and Peterson, R., “Correlation of Nitric OxideEmission from a Diesel Engine with Measured Temperatureand Burning Rate,” SAE Technical Paper 861566, 1986, doi:10.4271/861566.28. Smith Gregory P., Golden David M., Frenklach Michael,Moriarty Nigel W., Eiteneer Boris, Goldenberg Mikhail,Bowman C. Thomas, Hanson Ronald K., Song Soonho,Gardiner William C.Jr., Lissianski Vitali V., and Qin Zhiweihttp://www.me.berkeley.edu/gri_mech/29. Mehl M., Curran H. J., Pitz W. J. and Westbrook C. K.,“Chemical kinetic modeling of component mixtures relevantto gasoline,” European Combustion Meeting, Vienna,Austria, 2009.
CONTACT INFORMATIONJian [email protected] Engineering DepartmentUniversity of Wisconsin-Madison1008 Engineering Research Building1500 Engineering Drive, Madison, WI 53706
Christopher J. [email protected] Engineering DepartmentUniversity of Wisconsin-Madison1018B Engineering Research Building1500 Engineering Drive, Madison, WI 53706
ACKNOWLEDGMENTSThe author would like to thank General Motors Research andDevelopment for their continued funding and support of thisresearch through the GM-UW collaborative researchlaboratory program.
ABBREVIATIONS AND DEFINITIONSSIDI - Spark ignition direct injectionPFI - Port fuel injectionTDC - Top dead centerEOI - End of injectionSOC - Start of combustionLIF - Laser induced fluorescenceXi - Molar fraction of species i [-]
Xi,eq - Equilibrium molar fraction of species i [-]
Downloaded from SAE International by Jian Gong, Tuesday, April 21, 2015
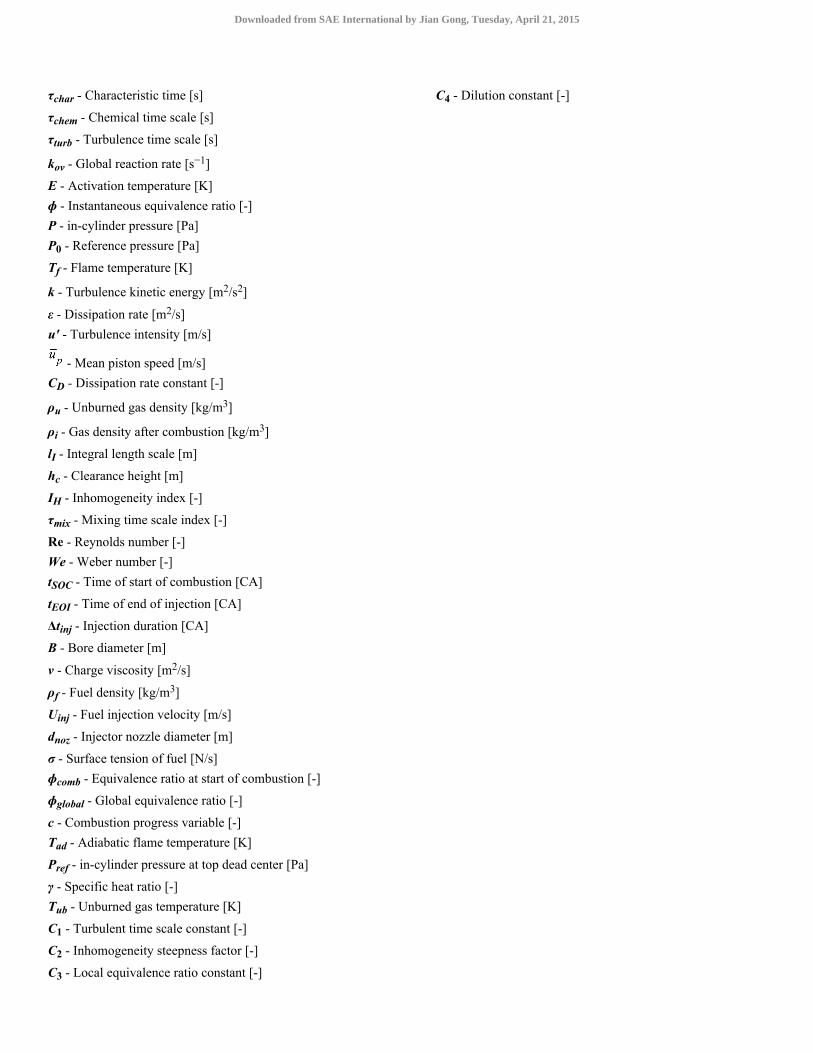
τchar - Characteristic time [s]
τchem - Chemical time scale [s]
τturb - Turbulence time scale [s]
kov - Global reaction rate [s−1]
E - Activation temperature [K]ɸ - Instantaneous equivalence ratio [-]P - in-cylinder pressure [Pa]P0 - Reference pressure [Pa]
Tf - Flame temperature [K]
k - Turbulence kinetic energy [m2/s2]
ε - Dissipation rate [m2/s]u′ - Turbulence intensity [m/s]
- Mean piston speed [m/s]CD - Dissipation rate constant [-]
ρu - Unburned gas density [kg/m3]
ρi - Gas density after combustion [kg/m3]
lI - Integral length scale [m]
hc - Clearance height [m]
IH - Inhomogeneity index [-]
τmix - Mixing time scale index [-]
Re - Reynolds number [-]We - Weber number [-]tSOC - Time of start of combustion [CA]
tEOI - Time of end of injection [CA]
Δtinj - Injection duration [CA]
B - Bore diameter [m]
ν - Charge viscosity [m2/s]
ρf - Fuel density [kg/m3]
Uinj - Fuel injection velocity [m/s]
dnoz - Injector nozzle diameter [m]
σ - Surface tension of fuel [N/s]ɸcomb - Equivalence ratio at start of combustion [-]
ɸglobal - Global equivalence ratio [-]
c - Combustion progress variable [-]Tad - Adiabatic flame temperature [K]
Pref - in-cylinder pressure at top dead center [Pa]
γ - Specific heat ratio [-]Tub - Unburned gas temperature [K]
C1 - Turbulent time scale constant [-]
C2 - Inhomogeneity steepness factor [-]
C3 - Local equivalence ratio constant [-]
C4 - Dilution constant [-]
Downloaded from SAE International by Jian Gong, Tuesday, April 21, 2015
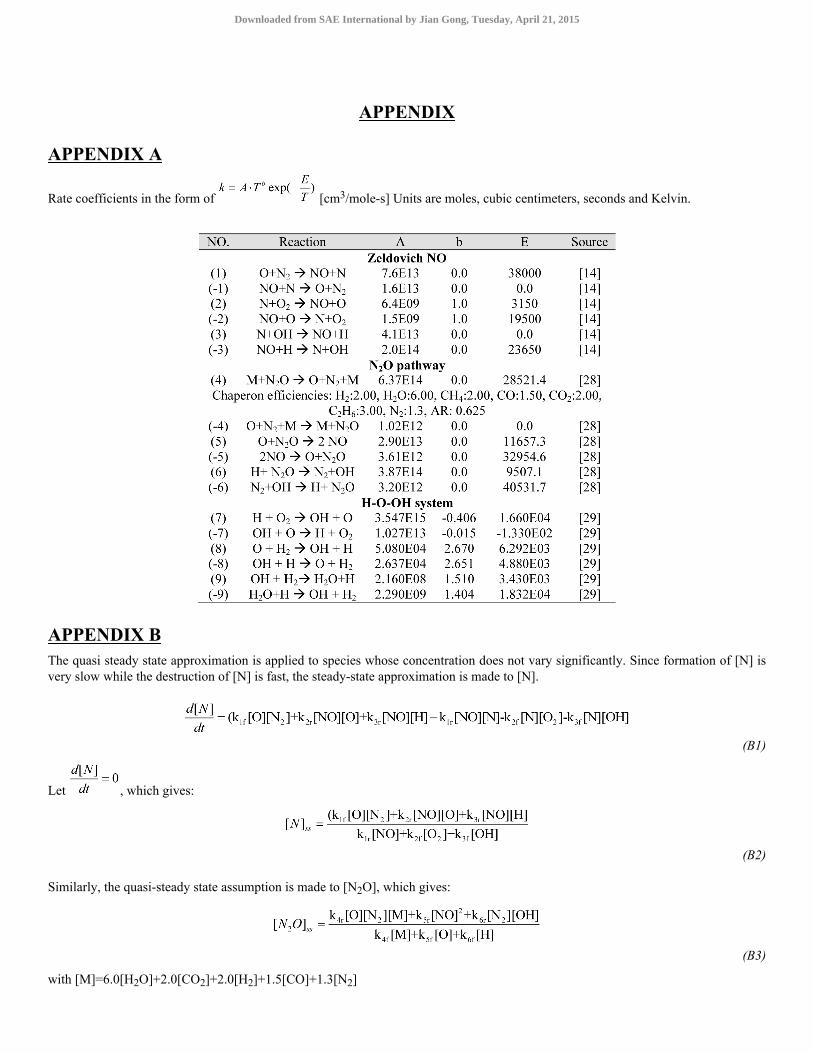
APPENDIX A
Rate coefficients in the form of [cm3/mole-s] Units are moles, cubic centimeters, seconds and Kelvin.
APPENDIX BThe quasi steady state approximation is applied to species whose concentration does not vary significantly. Since formation of [N] isvery slow while the destruction of [N] is fast, the steady-state approximation is made to [N].
(B1)
Let , which gives:
(B2)
Similarly, the quasi-steady state assumption is made to [N2O], which gives:
(B3)
with [M]=6.0[H2O]+2.0[CO2]+2.0[H2]+1.5[CO]+1.3[N2]
APPENDIX
Downloaded from SAE International by Jian Gong, Tuesday, April 21, 2015
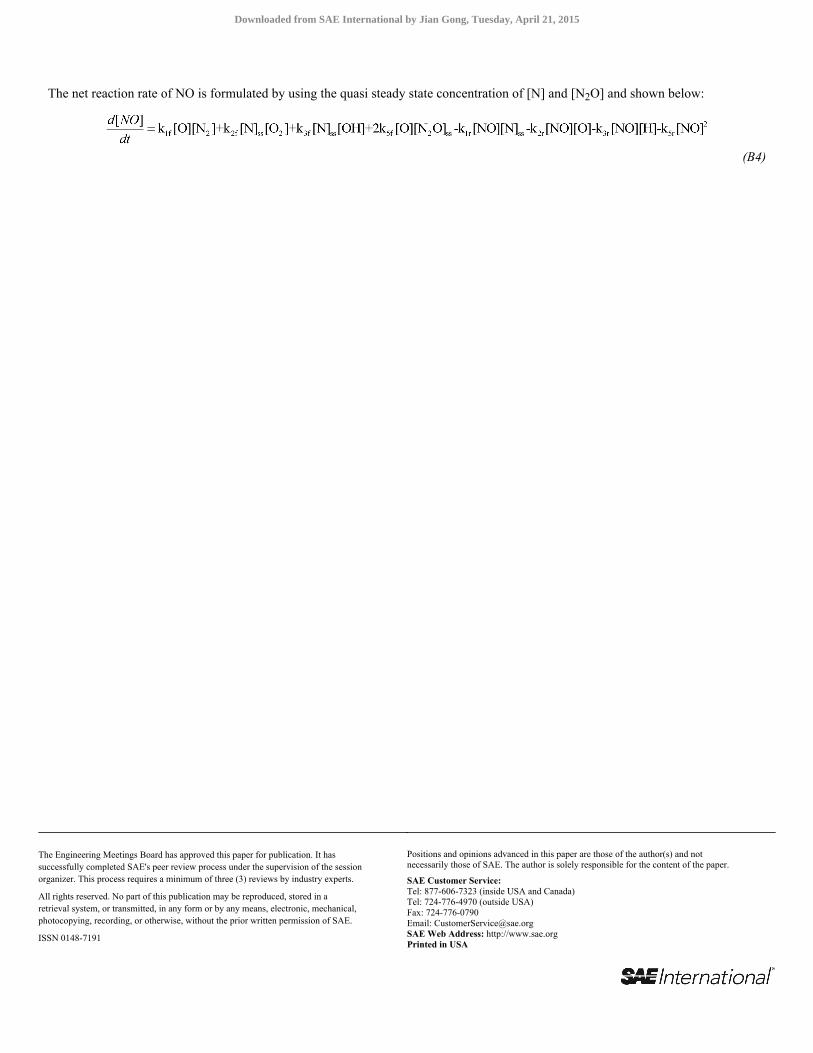
The net reaction rate of NO is formulated by using the quasi steady state concentration of [N] and [N2O] and shown below:
(B4)
The Engineering Meetings Board has approved this paper for publication. It hassuccessfully completed SAE's peer review process under the supervision of the sessionorganizer. This process requires a minimum of three (3) reviews by industry experts.
All rights reserved. No part of this publication may be reproduced, stored in aretrieval system, or transmitted, in any form or by any means, electronic, mechanical,photocopying, recording, or otherwise, without the prior written permission of SAE.
ISSN 0148-7191
Positions and opinions advanced in this paper are those of the author(s) and notnecessarily those of SAE. The author is solely responsible for the content of the paper.
SAE Customer Service:Tel: 877-606-7323 (inside USA and Canada)Tel: 724-776-4970 (outside USA)Fax: 724-776-0790Email: [email protected] Web Address: http://www.sae.orgPrinted in USA
Downloaded from SAE International by Jian Gong, Tuesday, April 21, 2015