
A gasoline fuel processor designed to study quick-start performance
9
Journal of Power Sources xxx (2005) xxx–xxx A gasoline fuel processor designed to study quick-start performance S. Ahmed ∗ , R. Ahluwalia, S.H.D. Lee, S. Lottes Argonne National Laboratory, 9700 S. Cass Avenue, Argonne, IL 60439, USA Received 23 February 2005; accepted 15 March 2005 Abstract A fast-start capability is a key requirement for on-board fuel processors for automotive fuel cell systems operating on gasoline fuel. This paper reports on the design and fabrication of a suitable fuel processor having this capability and discusses estimates of the start-up fuel consumption for the laboratory unit. Also discussed are the start-up strategy and the results of a start-up simulation, which showed that the fuel processor can deliver 90% of the rated hydrogen capacity in 60 s, producing a product gas that contains >30% hydrogen and <50 ppm carbon monoxide. The start-up fuel consumption was estimated on the basis of the thermal mass of the fabricated components; the 10-kW e laboratory unit was estimated to require >2.9 MJ of fuel energy. © 2005 Elsevier B.V. All rights reserved. Keywords: Fuel processor; Fast start; Reformer; Hydrogen; Gasoline; Automotive fuel cell 1. Introduction On-board fuel processors (FPs) for automotive fuel cell systems have been studied for over a decade for the possible early introduction of fuel cell vehicles 1 into the automotive marketplace. These devices have the potential to eliminate the chicken-and-egg controversy – which comes first, the fuel cell car or the hydrogen refueling infrastructure – by allowing the use of a current infrastructure fuel such as gasoline. This approach would allow time to develop: (1) the hydrogen pro- duction and distribution infrastructure and (2) the technology to support the fast refueling and on-board hydrogen storage options capable of supporting a 300-mile driving range that automobile customers expect. It has proved to be a major challenge to design a device capable of converting a complex hydrocarbon fuel such as gasoline into a hydrogen-rich reformate that could fuel a polymer-electrolyte fuel cell – with its extreme sensitivities to being poisoned by carbon monoxide, sulfur, ammonia, etc., ∗ Corresponding author. Tel.: +1 630 252 4553; fax: +1 630 972 4553. E-mail address: [email protected] (S. Ahmed). 1 These vehicles include a battery to permit load leveling and regenerative braking. – while also meeting all of the constraints and desirable fea- tures of the automotive platform (see Appendix A for the set of targets defined by the U.S. Department of Energy). Yet researchers and developers have responded to the challenge, demonstrating numerous new technologies (catalysts, reac- tor designs, membranes, heat exchangers, etc.) and setting new standards of performance (higher efficiency, compact and lightweight hardware, etc.) [1]. Despite the advances in efficiency, power density, etc., start-up performance has remained a concern. The shortest start-up time of 4 min [2] demonstrated by HydrogenSource LLC, while setting a new benchmark, is considerably longer than the 30–60 s start-up time sought by the automobile man- ufacturers. Furthermore, a significant amount of fuel energy is needed to heat the fuel processor to its operating tempera- ture. This start-up fuel consumption would penalize the fuel economy of the fuel cell vehicle. To limit this penalty to an acceptable value, a start-up fuel energy consumption of 2 MJ (for a 50-kW e FP) was set as a target. The start-up energy requirement is discussed further in a later section of this paper. This study was sponsored by the U.S. Department of Energy to generate data on fuel processor design, fabrica- tion, operation and model development, to provide technical insight into the feasibility of on-board fuel processing. Led 0378-7753/$ – see front matter © 2005 Elsevier B.V. All rights reserved. doi:10.1016/j.jpowsour.2005.03.224
Transcript of A gasoline fuel processor designed to study quick-start performance

Journal of Power Sources xxx (2005) xxx–xxx
A gasoline fuel processor designed to study quick-start performance
S. Ahmed∗, R. Ahluwalia, S.H.D. Lee, S. LottesArgonne National Laboratory, 9700 S. Cass Avenue, Argonne, IL 60439, USA
Received 23 February 2005; accepted 15 March 2005
Abstract
A fast-start capability is a key requirement for on-board fuel processors for automotive fuel cell systems operating on gasoline fuel. Thispaper reports on the design and fabrication of a suitable fuel processor having this capability and discusses estimates of the start-up fuelconsumption for the laboratory unit. Also discussed are the start-up strategy and the results of a start-up simulation, which showed that thefuel processor can deliver 90% of the rated hydrogen capacity in 60 s, producing a product gas that contains >30% hydrogen and <50 ppmcarbon monoxide. The start-up fuel consumption was estimated on the basis of the thermal mass of the fabricated components; the 10-kWe
laboratory unit was estimated to require >2.9 MJ of fuel energy.©
K
1
semtctadtoa
cgpt
b
fea-tYet
llenge,reac-ettingpact
etc.,ortestrceger
man-ergypera-fuelan2 MJergyaper.t of
0d
2005 Elsevier B.V. All rights reserved.
eywords:Fuel processor; Fast start; Reformer; Hydrogen; Gasoline; Automotive fuel cell
. Introduction
On-board fuel processors (FPs) for automotive fuel cellystems have been studied for over a decade for the possiblearly introduction of fuel cell vehicles1 into the automotivearketplace. These devices have the potential to eliminate
he chicken-and-egg controversy – which comes first, the fuelell car or the hydrogen refueling infrastructure – by allowinghe use of a current infrastructure fuel such as gasoline. Thispproach would allow time to develop: (1) the hydrogen pro-uction and distribution infrastructure and (2) the technology
o support the fast refueling and on-board hydrogen storageptions capable of supporting a 300-mile driving range thatutomobile customers expect.
It has proved to be a major challenge to design a deviceapable of converting a complex hydrocarbon fuel such asasoline into a hydrogen-rich reformate that could fuel aolymer-electrolyte fuel cell – with its extreme sensitivities
o being poisoned by carbon monoxide, sulfur, ammonia, etc.,
∗ Corresponding author. Tel.: +1 630 252 4553; fax: +1 630 972 4553.
– while also meeting all of the constraints and desirabletures of the automotive platform (seeAppendix Afor the seof targets defined by the U.S. Department of Energy).researchers and developers have responded to the chademonstrating numerous new technologies (catalysts,tor designs, membranes, heat exchangers, etc.) and snew standards of performance (higher efficiency, comand lightweight hardware, etc.)[1].
Despite the advances in efficiency, power density,start-up performance has remained a concern. The shstart-up time of 4 min[2] demonstrated by HydrogenSouLLC, while setting a new benchmark, is considerably lonthan the 30–60 s start-up time sought by the automobileufacturers. Furthermore, a significant amount of fuel enis needed to heat the fuel processor to its operating temture. This start-up fuel consumption would penalize theeconomy of the fuel cell vehicle. To limit this penalty toacceptable value, a start-up fuel energy consumption of(for a 50-kWe FP) was set as a target. The start-up enrequirement is discussed further in a later section of this p
This study was sponsored by the U.S. Departmen
E-mail address:[email protected] (S. Ahmed).1 These vehicles include a battery to permit load leveling and regenerativeraking.
Energy to generate data on fuel processor design, fabrica-tion, operation and model development, to provide technicalinsight into the feasibility of on-board fuel processing. Led
378-7753/$ – see front matter © 2005 Elsevier B.V. All rights reserved.
oi:10.1016/j.jpowsour.2005.03.224
2 S. Ahmed et al. / Journal of Power Sources xxx (2005) xxx–xxx
by Argonne National Laboratory, the project (Feasibility ofAcceptable Start Time Experimental Reformer—FASTER)was conducted by a consortium, with contributions from LosAlamos National Laboratory, Oak Ridge National Labora-tory, Pacific Northwest National Laboratory, Precision Com-bustion Inc., ArvinMeritor and Quantum Group.
2. Objective and approach
The objective of the FASTER project was to study thefeasibility of on-board fuel processing from the perspectiveof start-up performance in terms of: (1) the ability to delivera significant fraction of the rated hydrogen capacity (in areformate stream acceptable to a polymer electrolyte fuelcell) within 60 s and (2) limiting the fuel energy consumed to40 kJ kWe
−1 (2 MJ for a 50-kWe FP) or less, to heat the FPto its design point temperatures.
The approach was to design a fuel processor capable of afast start, that is, design hardware and a start-up strategy thatin combination could produce the requisite hydrogen flowrates within 60 s. The integrated FP consisted of an autother-mal [3] reformer (ATR) followed by water–gas shift (WGS)and preferential oxidation (PrOx) reactors, which is a pro-cess strategy favored by many fuel cell system developers.The FP was designed to convert gasoline (low-sulfur, Cal-i tedh tainsa onox-i le thec dels.T ce ofa signsa
3
3
livers wera iodo hist e bat-t ce oft ortert packt pro-c atteryp hiclew thef rce.H tiona fueln con-
Fig. 1. Heating strategy using combustion air.
omy (miles per gallon), the need for equipment dedicatedfor start up, and the effects of thermal shock and cycling ondurability, cost, etc. This difficult task is best approached bycombining an effective design with a suitable start-up heatingstrategy.
With a generic ATR/WGS/PrOx-type fuel processor as astarting point, a number of start-up heating strategies wereconsidered. We considered generating hot combustion gas inan external burner, and then injecting the hot gas at a tem-perature appropriate for the target zone (as shown inFig. 1).This approach was rejected because it required an air handlingcapacity (dedicated blower) that was several times larger thanwould be needed during regular operation. Also, the compo-nents and conduits in the fuel processor would have to besignificantly enlarged (increasing the FP mass and volume)to accommodate the large gas flows during start-up heating.Similarly, electrical heating was rejected, because in additionto the large battery necessary to store the requisite energy, theinefficient conversion of fuel to electrical energy would haveimposed a large multiplier on the fuel consumed to providethe energy. For example, a fuel cell system net efficiency of50% results in a multiplier of 2.
The implemented strategy consisted of taking advantageof the controllable exothermicity of the ATR. The essentialfeatures of the start-up strategy include the following ele-ments:
• thexi-
rmalingrmermix-
fornia reformulated gasoline) to deliver 90% of the raydrogen capacity in 60 s in a reformate stream that cont least 30% hydrogen and less than 50 ppm carbon m
de. The experimental hardware was fabricated to enabollection of data, which served to validate computer mohese models were then used to project the performandvanced FPs by considering alternative component dend thermal integration strategies.
. Fuel processor design
.1. Start-up strategy
An on-board fuel processor should be designed to deufficient hydrogen to the fuel cell stack such that the povailable to the vehicle is not limited during the initial perf the drive cycle. In a fuel cell/battery hybrid vehicle, t
ranslates to a tradeoff between the energy capacity of thery (size, weight, cost, etc.) and the start-up performanhe fuel processor (time, fuel, etc.). In other words, the shhe fuel processor start-up time, the smaller the batteryhat would be needed. It is possible to start the fuelessor by using electrical heating (requires adequate bower and energy storage capacity), operating the veith stored hydrogen, burning gasoline to rapidly heat
uel processor or by utilizing some alternative energy souowever, practical solutions for the automotive applicare limited by a myriad of factors, such as the amount ofeeded at start up and its impact on the vehicle’s fuel e
Using a small amount of electrical energy, ignitefuel–air mixture on the reformer catalyst in the partial odation mode (no water), then switch to the autothemode by starting liquid water injection as the reformcatalyst warms up to a few hundred degrees. The refozone is thus able to rapidly produce a flammable gasture containing hydrogen and carbon monoxide.

S. Ahmed et al. / Journal of Power Sources xxx (2005) xxx–xxx 3
Fig. 2. Parallel heating strategy using reformate oxidation at WGS and PrOx zones.
• Use reactive heating in the essential zones with air injec-tions to allow controlled oxidation of the flammable gases(H2, CO) produced by the reformer. These essential zonesinclude the water–gas shift reactor and the preferential oxi-dation zones[4,5]. Fig. 2shows air injections upstream ofthe essential WGS and PrOx zones.
This start-up heating strategy offers several advantages.The parallel heating strategy (by simultaneous air injections)ensures simultaneous heating of the essential components.This approach also allows prioritization and eliminates delaysin heating the downstream elements, as is typical in sequen-tial heating. It additionally eliminates the need to flow largevolumes of hot gas through the fuel processor and precludesthe need to heat the heat exchangers, which are necessary forhigh fuel processing efficiency but not critical for reformatequality during the initial start up. In contrast, a sequentialheating approach would delay the start up of downstreamcomponents or require very large mass flows of combustiongas.
3.2. The process train
Dynamic response, the ability to quickly change the pro-cessing rate, is an important feature of the on-board fuelprocessor, since it reduces the size of the battery needed to
buffer the delay between when power is needed at the wheelsand when hydrogen is available to the fuel cell to generatethe power. Past experience has shown that catalytic reactorsdevelop temperature profiles that depend on the processingrate. The readjustment of the temperature profile that accom-panies changes in the processing rate can be quite significant(tens of degrees Celsius), takes time and affects product qual-ity in the interim.
Automotive fuel processors are expected to go throughnumerous and often rapid changes in processing rate. Main-taining the inlet temperatures into each catalyst zone within avery narrow temperature band can eliminate the delay causedby the shifting of temperature profiles, and the fuel proces-sor response is then only limited by the response times ofthe balance of the plant components that accommodate feedrate changes, i.e., the processor temperature profile does notchange, only the air, fuel and water feed rates change withthe changing hydrogen demand.
The WGS and PrOx catalyst zones are most effective (highconversion of desired reactions) when they can be operatedat the design point. WGS and PrOx reactors are very sen-sitive to deviations from the design temperature because ofselectivity and thermodynamic equilibrium; thus maintain-ing the design point temperature is critical to effective useof these components. To achieve this goal in the FASTERdesign, these reactors were separated by temperature-control
wing p
TD
GCIEOSHCH
Fig. 3. Simplified schematic sho
able 1esign conditions for the laboratory-scale (10-kWe) fuel processor
ATR WGS1 WGS2
HSV (K h−1) 74 66 41atalyst weight (kg) 0.15 0.24 0.38
nlet temperature (◦C) 375 350xit temperature (◦C) 775 440 367/C ratio (at inlet) 0.75/C ratio (at inlet) 2.1
2 at exit (%-wet) 31.8 37.5 39.1O at exit (%-wet) 9.7 4.0 2.5
2O at exit (%-wet) 23.9 18.1 16.6
rocess streams in the fuel processor.
WGS3 WGS4 P1 P2 P3
22 13 37 37 370.69 1.15 0.29 0.29 0.29
300 280 140 140 100310 287 220 188 113
2.339.9 39.7 38.7 37.7 37.51.6 1.0 0.3 0.1 0.001
15.8 16.9 16.9 17.2 17.2
4 S. Ahmed et al. / Journal of Power Sources xxx (2005) xxx–xxx
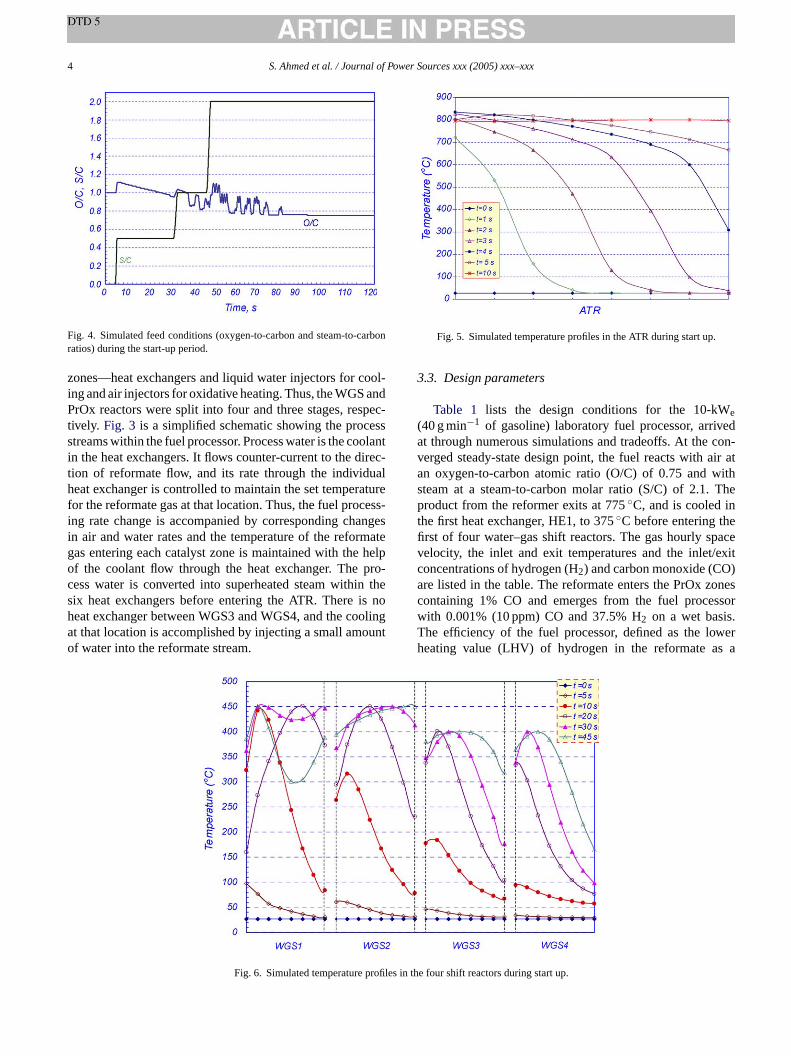
Fig. 4. Simulated feed conditions (oxygen-to-carbon and steam-to-carbonratios) during the start-up period.
zones—heat exchangers and liquid water injectors for cool-ing and air injectors for oxidative heating. Thus, the WGS andPrOx reactors were split into four and three stages, respec-tively. Fig. 3 is a simplified schematic showing the processstreams within the fuel processor. Process water is the coolantin the heat exchangers. It flows counter-current to the direc-tion of reformate flow, and its rate through the individualheat exchanger is controlled to maintain the set temperaturefor the reformate gas at that location. Thus, the fuel process-ing rate change is accompanied by corresponding changesin air and water rates and the temperature of the reformategas entering each catalyst zone is maintained with the helpof the coolant flow through the heat exchanger. The pro-cess water is converted into superheated steam within thesix heat exchangers before entering the ATR. There is noheat exchanger between WGS3 and WGS4, and the coolingat that location is accomplished by injecting a small amountof water into the reformate stream.
Fig. 5. Simulated temperature profiles in the ATR during start up.
3.3. Design parameters
Table 1 lists the design conditions for the 10-kWe(40 g min−1 of gasoline) laboratory fuel processor, arrivedat through numerous simulations and tradeoffs. At the con-verged steady-state design point, the fuel reacts with air atan oxygen-to-carbon atomic ratio (O/C) of 0.75 and withsteam at a steam-to-carbon molar ratio (S/C) of 2.1. Theproduct from the reformer exits at 775◦C, and is cooled inthe first heat exchanger, HE1, to 375◦C before entering thefirst of four water–gas shift reactors. The gas hourly spacevelocity, the inlet and exit temperatures and the inlet/exitconcentrations of hydrogen (H2) and carbon monoxide (CO)are listed in the table. The reformate enters the PrOx zonescontaining 1% CO and emerges from the fuel processorwith 0.001% (10 ppm) CO and 37.5% H2 on a wet basis.The efficiency of the fuel processor, defined as the lowerheating value (LHV) of hydrogen in the reformate as a
ofiles in
Fig. 6. Simulated temperature pr the four shift reactors during start up.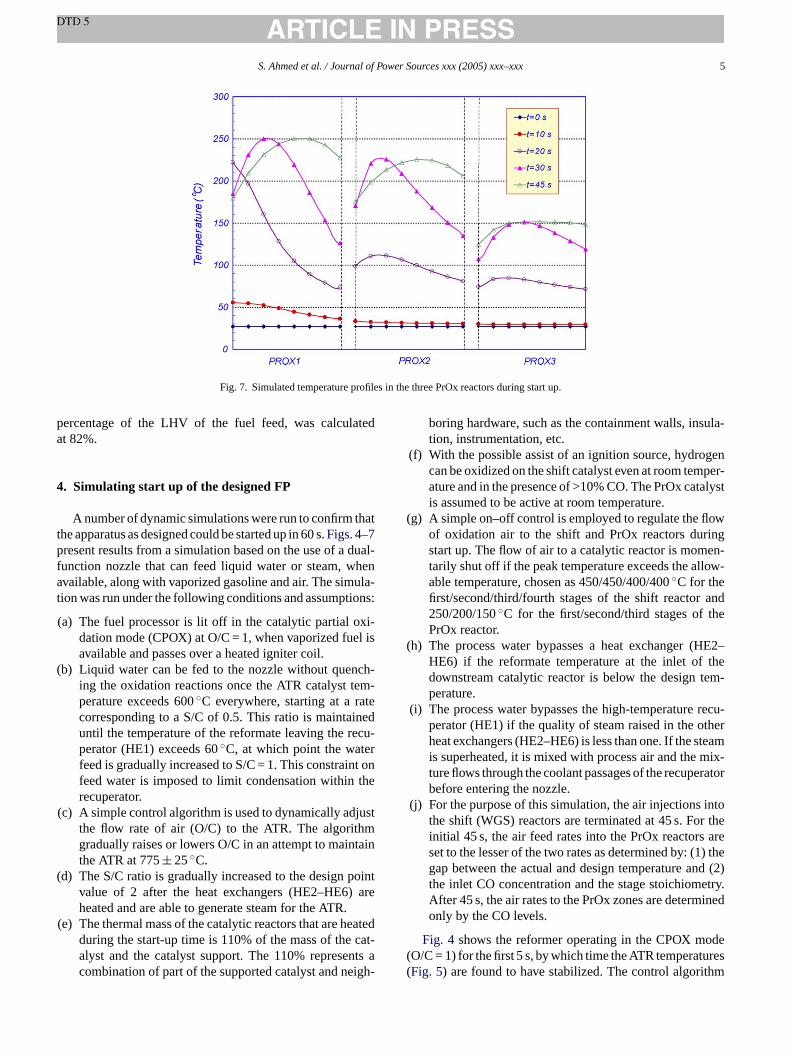
S. Ahmed et al. / Journal of Power Sources xxx (2005) xxx–xxx 5
Fig. 7. Simulated temperature profiles in the three PrOx reactors during start up.
percentage of the LHV of the fuel feed, was calculatedat 82%.
4. Simulating start up of the designed FP
A number of dynamic simulations were run to confirm thatthe apparatus as designed could be started up in 60 s.Figs. 4–7present results from a simulation based on the use of a dual-function nozzle that can feed liquid water or steam, whenavailable, along with vaporized gasoline and air. The simula-tion was run under the following conditions and assumptions:
(a) The fuel processor is lit off in the catalytic partial oxi-dation mode (CPOX) at O/C = 1, when vaporized fuel isavailable and passes over a heated igniter coil.
(b) Liquid water can be fed to the nozzle without quench-ing the oxidation reactions once the ATR catalyst tem-perature exceeds 600◦C everywhere, starting at a ratecorresponding to a S/C of 0.5. This ratio is maintaineduntil the temperature of the reformate leaving the recu-perator (HE1) exceeds 60◦C, at which point the waterfeed is gradually increased to S/C = 1. This constraint onfeed water is imposed to limit condensation within therecuperator.
(c) A simple control algorithm is used to dynamically adjustmtain
( ointare
eatedcat-nts aigh-
boring hardware, such as the containment walls, insula-tion, instrumentation, etc.
(f) With the possible assist of an ignition source, hydrogencan be oxidized on the shift catalyst even at room temper-ature and in the presence of >10% CO. The PrOx catalystis assumed to be active at room temperature.
(g) A simple on–off control is employed to regulate the flowof oxidation air to the shift and PrOx reactors duringstart up. The flow of air to a catalytic reactor is momen-tarily shut off if the peak temperature exceeds the allow-able temperature, chosen as 450/450/400/400◦C for thefirst/second/third/fourth stages of the shift reactor and250/200/150◦C for the first/second/third stages of thePrOx reactor.
(h) The process water bypasses a heat exchanger (HE2–HE6) if the reformate temperature at the inlet of thedownstream catalytic reactor is below the design tem-perature.
(i) The process water bypasses the high-temperature recu-perator (HE1) if the quality of steam raised in the otherheat exchangers (HE2–HE6) is less than one. If the steamis superheated, it is mixed with process air and the mix-ture flows through the coolant passages of the recuperatorbefore entering the nozzle.
(j) For the purpose of this simulation, the air injections intothe shift (WGS) reactors are terminated at 45 s. For the
are) thed (2)etry.ined
ode( res( hm
the flow rate of air (O/C) to the ATR. The algorithgradually raises or lowers O/C in an attempt to mainthe ATR at 775± 25◦C.
d) The S/C ratio is gradually increased to the design pvalue of 2 after the heat exchangers (HE2–HE6)heated and are able to generate steam for the ATR.
(e) The thermal mass of the catalytic reactors that are hduring the start-up time is 110% of the mass of thealyst and the catalyst support. The 110% represecombination of part of the supported catalyst and ne
initial 45 s, the air feed rates into the PrOx reactorsset to the lesser of the two rates as determined by: (1gap between the actual and design temperature anthe inlet CO concentration and the stage stoichiomAfter 45 s, the air rates to the PrOx zones are determonly by the CO levels.
Fig. 4 shows the reformer operating in the CPOX mO/C = 1) for the first 5 s, by which time the ATR temperatuFig. 5) are found to have stabilized. The control algorit

6 S. Ahmed et al. / Journal of Power Sources xxx (2005) xxx–xxx
rapidly raises the O/C ratio to about 1.1 as the reformingmode transitions to ATR, as shown inFig. 4. Over the next25 s, the S/C is held at 0.5, and, as the recuperator heats upand elevates the preheat temperature of the air entering theATR, the O/C is steadily reduced to below 0.9. Att= 30 s,the reformate temperature at the exit of recuperator reaches60◦C (not shown). At this time, the control algorithm raisesthe S/C to 1 and dynamically adjusts the O/C to maintain theATR exit at 775± 25◦C. According to this simulation, steamfirst becomes available (not shown) at about 45 s, at whichpoint the S/C is rapidly increased to 2 and the O/C is adjustedto maintain the ATR temperature. The reformate leaving theATR contains up to 24% CO in the CPOX mode, 15% CO atS/C = 0.5, 12% CO at S/C = 1 and <10% CO at S/C = 2.
Fig. 6 shows the calculated temperature profiles in theshift reactors. It is seen that it takes 30 s to heat the first andsecond stages above 350◦C and 45 s to heat the third stageabove 300◦C. At the end of the start-up period of 45 s, only60% of the fourth stage is above 300◦C.
Fig. 7 shows the calculated temperature profiles in thePrOx reactors. It indicates that within 30 s the first and secondstages are heated above∼150◦C and the third stage is above100◦C.
The simulated hydrogen yield from the fuel processor isplotted inFig. 8as a percentage of the rated design capacity.During the start-up period, it is desirable to oxidize all of theh r toa foamh thati tionw dro-g city)u s, forf ateri r ont nt at3c
F ) fromt
5. Three-dimensional CFD simulation used to meetdesign point conditions
The design and control strategy to meet the efficiencygoals requires maintaining catalyst component temperaturesvery close to the design point temperatures given inTable 1.Variations in temperature and reactant mixture ratios are bothtemporal and spatial. The control system uses from one tothree thermocouple point measurements to adjust feed ratesto maintain conditions near the design operating point. Three-dimensional computational fluid dynamics (CFD) simula-tions for all major reactor components and the upstreamreactant injection and mixing zones were used to determine ormodify component designs, to provide a sufficiently uniformmixture over component cross-sections. Mixing zone designsoptimized to meet uniformity constraints ensure that controlbased on point measurements keeps the entire cross-sectionof the reactor within a given tolerance value of deviation fromthe design operating point.
Minimization of the root mean square (rms) deviation oftemperature, species concentration or mixture ratios as fluidenters catalyst reactor zones is necessary to achieve opera-tion close to theoretical efficiency. Minimizing flow variabledeviations is limited in practice by a variety of fabricationrequirements, such as the need for retainer rings and thepresence of tubing in the flow path. Limiting the maximumd eac-t hortenc ir tos 0i eart n inOi hichw ed uplep
tainc sw e ana tsw 6, ass airi ix-i he Oc eatert notg -t nentw erfor-m d inF Airi ase,a HE1o oft
ydrogen produced in the ATR within the fuel processoccelerate the heating of the catalytic reactors and theeat exchangers (HE2–HE6). This simulation indicates
t may not be possible to achieve 100% hydrogen utilizaithout producing hot zones in the reactors. Also, the hyen yield is below 90% (as a percentage of the FP capantil superheated steam is available and S/C >1.8. Thu
aster start up, the nozzle has to be able to handle liquid wn quantities greater than S/C = 1.8. The effects of watehe reaction chemistry and the hydrogen yield are evide0 and 45 s, when the steam-to-carbon ratios (seeFig. 4) arehanged.
ig. 8. Simulated hydrogen yield (as a percentage of rated capacityhe fuel processor.
eviation from the mean is also a constraint in catalyst rion zones, because local hot spots may degrade and satalyst life. For example, the control system shuts off ahift reactors WGS1 or WGS2 if a peak temperature of 45◦Cs exceeded. InFig. 6, WGS1 and WGS2 are operating nhis peak temperature after 20 s. A 10% local deviatio
2 concentration above the mean results in∼25◦C increasen adiabatic temperature rise in the shift reactors, would cause a local hot spot of∼475◦C that would not betected by the control system if it was not at a thermocoosition.
Three-dimensional CFD simulation was used to obomponent designs with O2 concentration nonuniformitieell under 10% at reactor stage inlet planes. To providdditional flow path length for mixing air, injection poinere placed upstream of heat exchangers HE2–HEhown inFigs. 2 and 3. Depending on the alignment ofnjectors with slots in the inlet planes of HE2–HE6, air mng during flow through these heat exchangers reduces t2oncentration deviation by a factor between two and grhan 10 (Fig. 9). Because fabrication procedures coulduarantee the alignment required to maintain O2 concentra
ion deviations under 10%, an additional mixer compoas inserted before the heat exchangers. The mixing pance of this additional mixer component is also plotteig. 9 and was found to be acceptable for this project.
njection upstream of HE1 was not feasible. For this cmicrochannel interleaved air injector was used at theutlet, with an additional mixer component just upstream
he WGS1 inlet.
S. Ahmed et al. / Journal of Power Sources xxx (2005) xxx–xxx 7
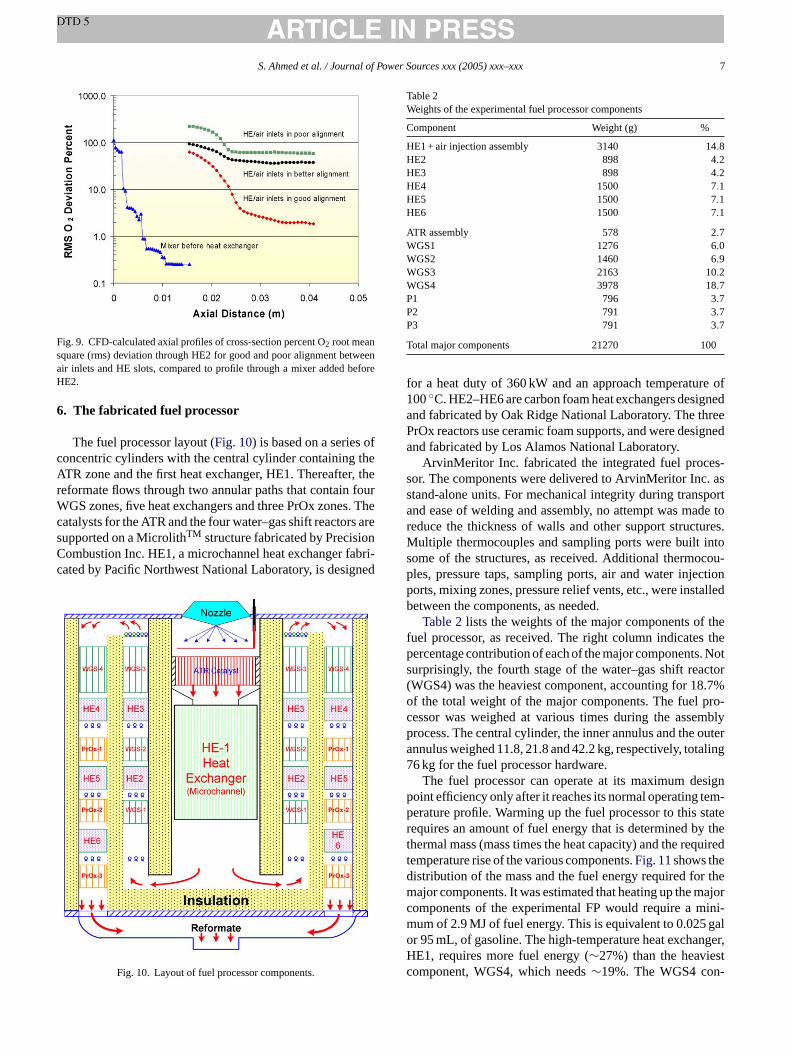
Fig. 9. CFD-calculated axial profiles of cross-section percent O2 root meansquare (rms) deviation through HE2 for good and poor alignment betweenair inlets and HE slots, compared to profile through a mixer added beforeHE2.
6. The fabricated fuel processor
The fuel processor layout (Fig. 10) is based on a series ofconcentric cylinders with the central cylinder containing theATR zone and the first heat exchanger, HE1. Thereafter, thereformate flows through two annular paths that contain fourWGS zones, five heat exchangers and three PrOx zones. Thecatalysts for the ATR and the four water–gas shift reactors aresupported on a MicrolithTM structure fabricated by PrecisionCombustion Inc. HE1, a microchannel heat exchanger fabri-cated by Pacific Northwest National Laboratory, is designed
Table 2Weights of the experimental fuel processor components
Component Weight (g) %
HE1 + air injection assembly 3140 14.8HE2 898 4.2HE3 898 4.2HE4 1500 7.1HE5 1500 7.1HE6 1500 7.1
ATR assembly 578 2.7WGS1 1276 6.0WGS2 1460 6.9WGS3 2163 10.2WGS4 3978 18.7P1 796 3.7P2 791 3.7P3 791 3.7
Total major components 21270 100
for a heat duty of 360 kW and an approach temperature of100◦C. HE2–HE6 are carbon foam heat exchangers designedand fabricated by Oak Ridge National Laboratory. The threePrOx reactors use ceramic foam supports, and were designedand fabricated by Los Alamos National Laboratory.
ArvinMeritor Inc. fabricated the integrated fuel proces-sor. The components were delivered to ArvinMeritor Inc. asstand-alone units. For mechanical integrity during transportand ease of welding and assembly, no attempt was made toreduce the thickness of walls and other support structures.Multiple thermocouples and sampling ports were built intosome of the structures, as received. Additional thermocou-ples, pressure taps, sampling ports, air and water injectionports, mixing zones, pressure relief vents, etc., were installedbetween the components, as needed.
Table 2lists the weights of the major components of thefuel processor, as received. The right column indicates thepercentage contribution of each of the major components. Notsurprisingly, the fourth stage of the water–gas shift reactor(WGS4) was the heaviest component, accounting for 18.7%of the total weight of the major components. The fuel pro-cessor was weighed at various times during the assemblyprocess. The central cylinder, the inner annulus and the outerannulus weighed 11.8, 21.8 and 42.2 kg, respectively, totaling76 kg for the fuel processor hardware.
The fuel processor can operate at its maximum designp em-p stater y thet uiredtd r them ajorc ini-m galo nger,H stc -
Fig. 10. Layout of fuel processor components.oint efficiency only after it reaches its normal operating terature profile. Warming up the fuel processor to thisequires an amount of fuel energy that is determined bhermal mass (mass times the heat capacity) and the reqemperature rise of the various components.Fig. 11shows theistribution of the mass and the fuel energy required foajor components. It was estimated that heating up the m
omponents of the experimental FP would require a mum of 2.9 MJ of fuel energy. This is equivalent to 0.025r 95 mL, of gasoline. The high-temperature heat exchaE1, requires more fuel energy (∼27%) than the heavieomponent, WGS4, which needs∼19%. The WGS4 con

8 S. Ahmed et al. / Journal of Power Sources xxx (2005) xxx–xxx
Fig. 11. Distribution of mass and energy needs for start up of the fuel pro-cessor.
verts only 6.9% of the total CO converted in the shift reactionzones, but contributes 45% to the mass of the shift reac-tor zones. These figures suggest that eliminating the fourthwater–gas shift zone(s) and reducing the mass of the heatexchangers, especially those at high temperature, offer thebest potential for reducing the start-up fuel energy consump-tion, albeit with possibly a small reduction in steady-statefuel processor efficiency.
7. Conclusions
A fuel processor has been designed along with a parallelheating start-up strategy. The design is based on catalyticATR/WGS/PrOx zones separated by temperature-controlzones that use microchannel and foam heat exchangersSimulation shows that the fuel processor can deliver 90%of the rated hydrogen capacity within 60 s. Based on themass of the delivered components, it is estimated that the10-kWe laboratory unit will require 2.9 MJ of gasoline toreach the design point temperatures. The high-temperatureheat exchanger (HE1) and the low-temperature shift zone(WGS4) represent the largest contribution to this start-up fuelconsumption.
A
t ofE olo-g ecialt visa horsa ilityo R)p
iver-s tory( theU s for
itself, and others acting on its behalf, a paid-up, nonexclusive,irrevocable worldwide license in said article to reproduce,prepare derivative works, distribute copies to the public andperform publicly and display publicly, by or on behalf of theGovernment.
Appendix A
The U.S. Department of Energy’s technical targets foran on-board fuel processor.Source: Multi-Year Research,Development and Demonstration Plan Planned Activitiesfor 2003–2010 (Draft 6/3/03) [http://www.eere.energy.gov/hydrogenandfuelcells/mypp].
Technical targets: fuel-flexible fuel processorsa to generate hydrogen-containing fuel gas from reformulated gasoline containing 30 ppm sulfur,average for 50-kWe (net) fuel cell systemsb
Characteristics Calendar year
2003 Status 2005 2010
Energy efficiencyc (%) 78 78 80Power density (W L−1) 700 700 800Specific power (W kg−1) 600 700 800Costd ($ per kWe) 65 25 10
C@@
T
E
DS
CSTHN
, heate sistentwith those of FreedomCAR.
c Fuel processor efficiency = total fuel cell system efficiency/fuel cell stacksystem efficiency, where total fuel cell system efficiency accounts for ther-mal integration. For purposes of testing fuel-processor-only systems, theefficiency can be estimated by measuring the derated heating value efficiency(lower heating value of H2 × 0.95/lower heating value of the fuel in) wherethe derating factor represents parasitic system power losses attributable tothe fuel processor.
d High-volume production: 500,000 units per year.e 0.07 g mile−1 NOx and 0.01 g mile−1 PM (particulate matter).f Time between catalyst and major component replacement; performance
targets must be achieved at the end of the durability period.g Continuous operation.h Includes thermal cycling.i Includes thermal and realistic driving cycles.j Performance targets must be achieved at the end of an 8-h cold soak at
specified temperature.k Dependent on stack development (CO tolerance) progress.
cknowledgments
This work was supported by the U.S. Departmennergy, Hydrogen, Fuel Cells and Infrastructure Technies Program, under Contract W-31-109-Eng-38. Sp
hanks to Nancy Garland, Valri Lightner, Patrick Dand Steve Chalk for supporting this study. The autlso wish to thank the participants of the Feasibf Acceptable Time Experimental Reformer (FASTEroject.
The submitted manuscript has been created by the Unity of Chicago as Operator of Argonne National Labora“Argonne”) under Contract No. W-31-109-ENG-38 with.S. Department of Energy. The U.S. Government retain
.
old start-up time to maximum power−20◦C ambient temperature (min) TBD 2.0 1.0+20◦C ambient temperature (min) <10 <1 <0.5
ransient response (time for 10–90%power) (s)
15 5 1
missionse <Tier 2 <Tier 2 <Tier 2Bin 5 Bin 5 Bin 5
urabilityf (h) 2000g 4000h 5000i
urvivabilityj TBD −30 −40
O content in product streamk
teady-state (ppm) 10 10 10ransient (ppm) 100 100 100
2S content in product stream (ppb) <200 <50 <10H3 content in product stream (ppm) <10 <0.5 <0.1a With catalyst system suitable for use in vehicles.b Excludes fuel storage; includes controls, shift reactors, CO cleanupxchangers. All targets must be achieved simultaneously and are con

S. Ahmed et al. / Journal of Power Sources xxx (2005) xxx–xxx 9
References
[1] http://www.eere.energy.gov/hydrogenandfuelcells/annualreport04.html.[2] Fuel Cells Bulletin (6) June 2003.[3] S. Ahmed, M. Krumpelt, Int. J. Hydrogen Energy 24 (4) (2001)
291–301.
[4] S. Ahmed, Presented at the 2003 DOE Hydrogen and Fuel Cells MeritReview Meeting, May, 2003.
[5] S. Springmann, M. Bohnet, A. Docter, A. Lamm, G. Eigenberger, JPower Sources 128 (2004) 13–24.