Intel Processor Tracing - Jack's Blog
14
Intel Processor Tracing Jack Henschel August 2017 Introduction Intel Processor Trace (PT) is a new feature of Intel processors which provides machine instruction-level tracing. This can aid in low-level debugging and performance analysis of programs and even state recov- ery of crashed applications. This papers documents the underlying design concept of Intel PT, the requirements on the Linux platform as well as some of its perfor- mance measurement use-cases. 1 Overview The Linux operating system has a vast landscape of tracing tools [1]. kprobes, uprobes, kernel tracepoints and dtrace probes are all data sources for captur- ing data. ftrace, eBPF, perf, SystemTap and LTTng are tools to extract the data and provide a frontend for the user. These can be used to hook into run- ning programs and analyze their behavior (metrics like systems calls, time spent in functions or waiting/blocking). Intel PT is another data source, but it is dedicated, parallelized hardware inside the CPU’s performance moni- toring unit (PMU) to trace software running on the CPU. It tracks branch executions on each individual core, which allows the reconstruction of the control flow of all executed code [2]. However, with the speed of modern CPUs (billions of clock cycles per sec- ond), storing the collected data anywhere becomes challenging, because the buffer is either not fast enough or too small (Memory Hierarchy). Intel PT solves this problem by storing only the data absolutely required for recon- structing the control flow of the program later. As an example, conditional branches are only stored as a single bit (taken or not-taken). It also captures certain processor execution mode changes (such as CR3, 32-bit/64-bit mode and TSX transaction state) and timings. The combination of specialized hardware for tracing and the highly com- pressed tracing stream enables Intel PT to have very low overhead, but it requires some effort to decode the packet stream. Since Linux kernel version 4.3 Intel PT is fully integrated into the Linux operating system (the kernel driver got merged in 4.1, perf user tools sup- 1
-
Upload
khangminh22 -
Category
Documents
-
view
0 -
download
0
Transcript of Intel Processor Tracing - Jack's Blog

Intel Processor Tracing
Jack Henschel
August 2017
Introduction
Intel Processor Trace (PT) is a new feature of Intel processors whichprovides machine instruction-level tracing. This can aid in low-leveldebugging and performance analysis of programs and even state recov-ery of crashed applications.
This papers documents the underlying design concept of Intel PT,the requirements on the Linux platform as well as some of its perfor-mance measurement use-cases.
1 Overview
The Linux operating system has a vast landscape of tracing tools [1]. kprobes,uprobes, kernel tracepoints and dtrace probes are all data sources for captur-ing data. ftrace, eBPF, perf, SystemTap and LTTng are tools to extract thedata and provide a frontend for the user. These can be used to hook into run-ning programs and analyze their behavior (metrics like systems calls, timespent in functions or waiting/blocking). Intel PT is another data source, butit is dedicated, parallelized hardware inside the CPU’s performance moni-toring unit (PMU) to trace software running on the CPU. It tracks branchexecutions on each individual core, which allows the reconstruction of thecontrol flow of all executed code [2].
However, with the speed of modern CPUs (billions of clock cycles per sec-ond), storing the collected data anywhere becomes challenging, because thebuffer is either not fast enough or too small (Memory Hierarchy). Intel PTsolves this problem by storing only the data absolutely required for recon-structing the control flow of the program later. As an example, conditionalbranches are only stored as a single bit (taken or not-taken). It also capturescertain processor execution mode changes (such as CR3, 32-bit/64-bit modeand TSX transaction state) and timings.
The combination of specialized hardware for tracing and the highly com-pressed tracing stream enables Intel PT to have very low overhead, but itrequires some effort to decode the packet stream.
Since Linux kernel version 4.3 Intel PT is fully integrated into the Linuxoperating system (the kernel driver got merged in 4.1, perf user tools sup-
1

port was merged in 4.3) and the GNU Debugger gdb (since 7.10, enablesbackwards-debugging).
It has two basic operating modes, although more might be added in thefuture [3, slide 8, “PT modes”]. Full trace mode allows continuous tracingwhich runs as long as the disk keeps up (otherwise data loss may occur).Snapshot mode runs in a special ring buffer (provided by the operatingsystem), stops tracing on an event of interest and only saves the snapshotof the ring buffer at that time [4].
Intel PT was first featured in the Broadwell micro-architecture, followingmicro-archictectures (Skylake and Goldmont) saw additional enhancementssuch as fine grained timing and address filtering. It is also available onthe Atom platform (Silvermont and Airmont based products), but is calledReal-Time Instruction Trace (RTIT) there [5].
It should be noted that for any meaningful analysis, the compiler mustnot omit the frame pointer. Modern compilers re-use the frame pointer reg-ister (EBP on x86 platforms) as a general purpose register and to avoid theinstructions to save, set and restore frame pointer. However, it makes recon-struction of call stacks (and therefore debugging in general) impossible. Forexample, gcc omits the frame pointer by default, but this can be preventedby using the --fno-omit-framepointer options [6].
2 Collection
After data has been captured by the CPU it needs to be fetched, decodedand interpreted. The fetching happens via Linux’ perf_event interface, thedecoding can either be done manually or one can use the free, open-sourceProcessor Trace Decoder Library (libipt) provided by Intel to decode thepacket stream [7]. Alternatively, one can also use the Linux perf-tools orgdb which come with integrated Intel PT support.
3 Packets
The Intel PT hardware writes individual packets into the log stream. Thesepackets need to be decoded, bound to an event and then the execution flowcan be reconstructed. These three steps are all implemented in the IntelProcessor Trace Decoding library (libipt) [7].
1. PSB (Packet Stream Boundary): heartbeats, generated at regularintervals (first packet in stream)
2. TNT (Taken Not-Taken): direct conditional branches
3. TIP (Target IP): target address of indirect branches, exception andinterrupts
2

4. FUP (Flow Update Packets): source IP address for asynchronousevents
5. PIP (Paging Information Packet): modifications to CR3 register
6. TSC (Time-Stamp Counter): tracks wall clock data (contains someportion of the software-visible time-stamp counter)
7. MODE: processor execution information and mode (16-, 32- or 64-bit)
8. CBR (Core Bus Ratio): core to bus clock ratio
9. MWAIT: indicate successful completion of an MWAIT operation toa C-state deeper than C0.0
10. PWRE (Power State Entry): indicate entry to a C-state deeper thanC0.0
11. PWRX (Power State Exit): indicate exit from a C-state deeper thanC0.0, returning to C0.
12. EXSTOP (Execution Stopped): indicate that software execution hasstopped, due to events such as P-state change, C-state change, orthermal throttling
13. CYC (Cycle-Accurate Mode): provides elapsed time as measured inprocessor core clock cycles relative to the last CYC packet (Not avail-able on Broadwell)
14. MTC (Mini Time Counter): provides a periodic indication of wall-clock time (Not available on Broadwell)
15. OVF (Overflow): indicates internal buffer overflow (packets beingdropped)
16. PAD: padding
For performance analysis and debugging the Time-Stamp Counter packet(TSC) is especially interesting. But for tracing with instruction-level granu-larity, this packet is not generated often and regularly enough (its generationcan also not be configured). This is an application of the Cycle-AccurateMode (with the CYC packet, whose generation is very regular and frequent),as the Cycle Counter field increments at the same rate as the processor coreclock ticks. This feature is only available on Skylake and onwards.
For more information on these packets please refer to Intel’s SoftwareDeveloper’s Manual Volume 3 [8, Chapter 35].
3

4 Use Cases
4.1 Peformance Profiling
The Linux perf tooling can be used to profile the performance of the appli-cation. Profiling means analyzing the program in intervals and measuringhow often something happened (as opposed to counting).
$ perf record --event intel_pt//u --delay 100 -g -- ./simple 129129637
129129637 = 83471.000000 * 1547.000000
[ perf record: Woken up 2549 times to write data ]
[ perf record: Captured and wrote 159.771 MB perf.data ]
We profile the application (the program and its arguments are specified afterthe --) with the Intel PT ’event’ (due to the trailing u only in userspace), witha delay of 100 microseconds (to skip the startup and initialization phase) andrecord the call-graph. Instead of not recording the first 100 microseconds ofthe application, we could later also choose to skip them when analyzing thedata.
$ perf report --show-nr-samples --stdio
# Samples: 40K of event ’instructions:u’
# Event count (approx.): 3598905087
#
# Children Self Samples Command Shared Object Symbol
# ........ ........ ............ ....... ............. ..................................
#
100.00% 0.15% 71 simple simple [.] factor
|
---factor
|
--99.85%--isSquareNumber
99.85% 99.85% 40731 simple simple [.] isSquareNumber
|
---factor
isSquareNumber
0.00% 0.00% 1 simple libc-2.24.so [.] _dl_addr
0.00% 0.00% 0 simple simple [.] main
0.00% 0.00% 0 simple libc-2.24.so [.] printf
0.00% 0.00% 0 simple libc-2.24.so [.] vfprintf
0.00% 0.00% 0 simple libc-2.24.so [.] _IO_file_xsputn@@GLIBC_2.2.5
0.00% 0.00% 0 simple libc-2.24.so [.] _IO_file_overflow@@GLIBC_2.2.5
0.00% 0.00% 0 simple libc-2.24.so [.] _IO_doallocbuf
0.00% 0.00% 0 simple libc-2.24.so [.] _IO_file_doallocate
0.00% 0.00% 0 simple libc-2.24.so [.] malloc_hook_ini
0.00% 0.00% 0 simple libc-2.24.so [.] ptmalloc_init.part.5
We instruct perf to report on the previously recorded perf.data file, printthe output to the console (instead of using the interactive user interface)and show the total number of recorded samples. As expected, the CPUspends most of its cycles in the compute intensive isSquareNumber function,99.85% to be precise. We can also see that due to not recording the first
4

100 microseconds of the application, Perf did not record a single sample ofthe main function.
In newer micro-architectures (beginning with Skylake) Intel PT also sup-ports address filtering. This feature can be used to trace only specific func-tions or ranges in the application:
perf record -e intel_pt//
--filter ’filter main @ /path/to/program’
-- program
perf record -e intel_pt//
--filter ’start func1 @ /path/to/program’
--filter ’stop func2 @ /path/to/program’
-- program
This feature is not supported on the Broadwell micro-architecture.
Perf also lets one dump the raw packets generated by the Intel PT hardware:
$ perf report -D
...snip...
0x3ba0 [0x30]: PERF_RECORD_AUXTRACE size: 0x200000 offset: 0 ref: 0xf48c901095c50
idx: 35 tid: 14554 cpu: 35
.
. ... Intel Processor Trace data: size 2097152 bytes
. 00000000: 02 82 02 82 02 82 02 82 02 82 02 82 02 82 02 82 PSB
. 00000010: 19 10 08 73 f8 c8 48 0f TSC 0xf48c8f8730810
. 00000018: 02 03 0c 00 00 00 00 00 CBR 0xc
. 00000020: 02 23 00 00 00 00 00 00 PSBEND
. 00000028: 02 82 02 82 02 82 02 82 02 82 02 82 02 82 02 82 PSB
. 00000038: 19 e0 fa 77 f8 c8 48 0f TSC 0xf48c8f877fae0
. 00000040: 02 03 0c 00 CBR 0xc
. 00000044: 99 20 MODE.TSX TXAbort:0 InTX:0
. 00000046: 99 01 MODE.Exec 64
. 00000048: 7d 20 2c 5c 49 45 7f 00 FUP 0x7f45495c2c20
. 00000050: 02 23 00 00 00 00 00 00 PSBEND
. 00000058: 71 20 2c 5c 49 45 7f 00 TIP.PGE 0x7f45495c2c20
. 00000060: 7d 20 2c 5c 49 45 7f 00 FUP 0x7f45495c2c20
. 00000068: 01 00 00 00 00 00 00 00 TIP.PGD no ip
. 00000070: 02 82 02 82 02 82 02 82 02 82 02 82 02 82 02 82 PSB
. 00000080: 19 70 3f 78 f8 c8 48 0f TSC 0xf48c8f8783f70
. 00000088: 02 03 0c 00 CBR 0xc
. 0000008c: 99 20 MODE.TSX TXAbort:0 InTX:0
. 0000008e: 99 01 MODE.Exec 64
. 00000090: 7d 20 2c 5c 49 45 7f 00 FUP 0x7f45495c2c20
. 00000098: 02 23 00 00 00 00 00 00 PSBEND
. 000000a0: 71 20 2c 5c 49 45 7f 00 TIP.PGE 0x7f45495c2c20
. 000000a8: 7d 7f 38 5c 49 45 7f 00 FUP 0x7f45495c387f
. 000000b0: 01 00 00 00 00 00 00 00 TIP.PGD no ip
. 000000b8: 02 82 02 82 02 82 02 82 02 82 02 82 02 82 02 82 PSB
. 000000c8: 19 f8 65 78 f8 c8 48 0f TSC 0xf48c8f87865f8
. 000000d0: 02 03 0c 00 CBR 0xc
Instead of recording the application execution from the start, we canalso leverage the snapshot mode. To switch to this mode with perf, wesimply use the -S or --snapshot argument for perf record and send a USR2
5

signal (user-defined signal 2 ) to the recording process whenever we want tosave data. Here is a generic example:
$ perf record -e intel_pt// --snapshot -- program &
[1] 1713
$ PERF_PID=$!
# execute workload / wait for event
# event happens
$ kill -USR2 $PERF_PID
# end recording session
$ kill $PERF_PID
Perf will again store the data in the perf.data file and we can analyze it withperf report or perf script.
It is possible to export the data from Perf with instruction level gran-ularity using --itrace=i1i, where 1i sets the sampling interval (here: eachinstruction). However without restrictions on address filtering (e.g. onlytracing specific functions) or time (via Perf’s --time argument) this producesextremely high volume output.
4.2 Flame Graphs
Since Intel PT is able to generate so much data (hundreds of megabytes persecond per core) and modern software is almost always very complex, one hasto think carefully about which data to collect and analyze. Flame Graphsprovide a quick, high-level overview of what is happening during programexecution and where the hot spots are. Each box represents a stack frame(a function on the stack), the y-axis displays the depth of the stack (numberof frames on the stack) and the x-axis spans the sample population (it isordered alphabetically and does not indicate the passing of time from leftto right). To generate a flame graph, one first has to capture the stack ofthe application (for example with Intel PT or any other profiling tool), thenfold the stack (i.e. count how often each unique function was on top of thestack) and finally generate a graphic visualization. The latter two steps areimplemented by the free, open-source FlameGraph Tool, which generatesinteractive and searchable SVG (Scalable Vector Graphics) output.
$ perf record -e intel_pt//u --delay 100 -- ./tickler
-l libl2ps.so -t libproc_exp_ul.so
...snip...
[ perf record: Woken up 12054 times to write data ]
[ perf record: Captured and wrote 755.170 MB perf.data ]
6

$ perf script --itrace=i99usg |
./stackcollapse-perf.pl > workload.folded
$ ./flamegraph.pl workload.folded > workload.svg
The above perf-command profiles the application after a delay of 100milliseconds (-D). Afterwards, the collected data is sampled at intervals of99 microseconds (the odd number was choosen to eliminate any accidentalalignment with other, regular events). The resulting graphic can be viewedin any SVG viewer, such as modern web browsers. Figure 1 shows thecomplete generated graphic, figure 2 is a zoomed example.
Figure 1: Full Flame Graph of L2-PS Tickler
Figure 2: Zoomed Flame Graph of L2-PS Tickler
Depending on the size of the profiling sample (this one is quite large withfour quarters of a gigabyte) and the specified sampling interval the foldingof the stack and the generation of the graphic can take quite some time.
4.3 Debugging
Since gdb supports Intel PT, both tools can be combined for debuggingapplications. Consider the following C program:
int main(void) {
int *a = 0;
for (int i = 0; i < 10; i++)
7
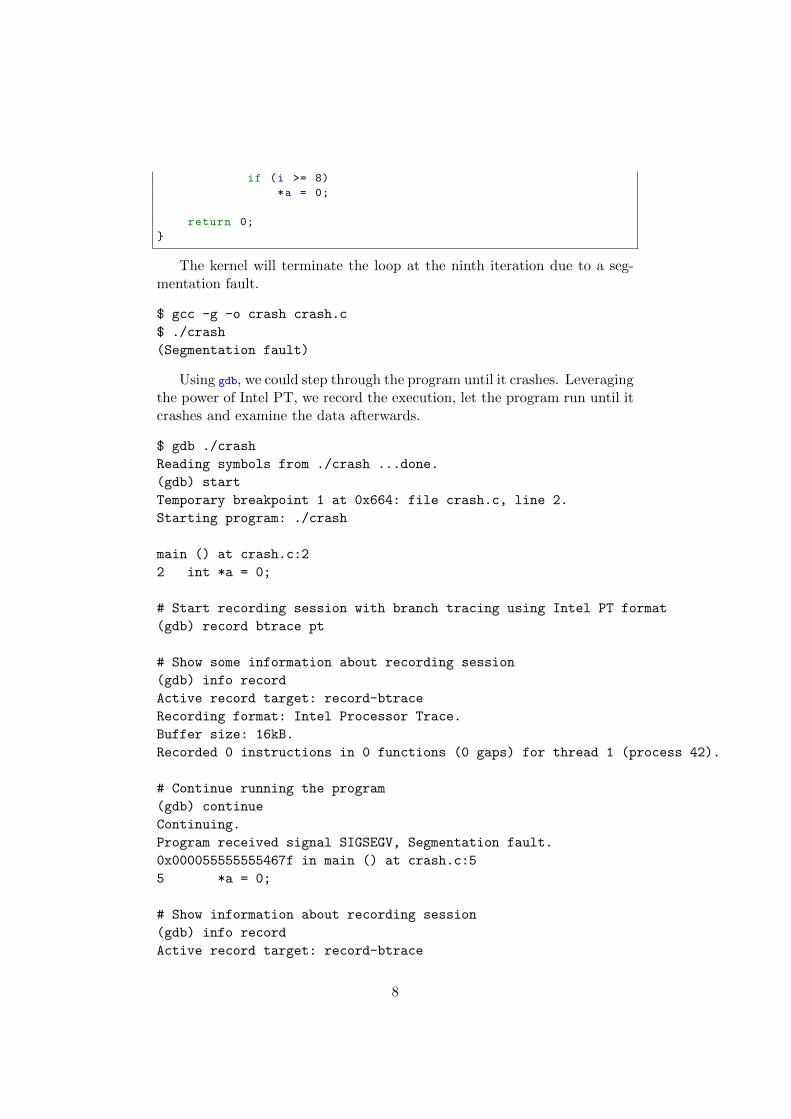
if (i >= 8)
*a = 0;
return 0;
}
The kernel will terminate the loop at the ninth iteration due to a seg-mentation fault.
$ gcc -g -o crash crash.c
$ ./crash
(Segmentation fault)
Using gdb, we could step through the program until it crashes. Leveragingthe power of Intel PT, we record the execution, let the program run until itcrashes and examine the data afterwards.
$ gdb ./crash
Reading symbols from ./crash ...done.
(gdb) start
Temporary breakpoint 1 at 0x664: file crash.c, line 2.
Starting program: ./crash
main () at crash.c:2
2 int *a = 0;
# Start recording session with branch tracing using Intel PT format
(gdb) record btrace pt
# Show some information about recording session
(gdb) info record
Active record target: record-btrace
Recording format: Intel Processor Trace.
Buffer size: 16kB.
Recorded 0 instructions in 0 functions (0 gaps) for thread 1 (process 42).
# Continue running the program
(gdb) continue
Continuing.
Program received signal SIGSEGV, Segmentation fault.
0x000055555555467f in main () at crash.c:5
5 *a = 0;
# Show information about recording session
(gdb) info record
Active record target: record-btrace
8

Recording format: Intel Processor Trace.
Buffer size: 16kB.
Recorded 48 instructions in 1 functions (0 gaps) for thread 1 (process 42).
# Show last ten instructions with source lines annotated
(gdb) record instruction-history /s -
39 0x0000555555554689 <main+41>: cmpl $0x9,-0x4(%rbp)
40 0x000055555555468d <main+45>: jle 0x555555554675 <main+21>
crash.c:4 if (i >= 8)
41 0x0000555555554675 <main+21>: cmpl $0x7,-0x4(%rbp)
42 0x0000555555554679 <main+25>: jle 0x555555554685 <main+37>
crash.c:3 for (int i = 0; i < 10; i++)
43 0x0000555555554685 <main+37>: addl $0x1,-0x4(%rbp)
44 0x0000555555554689 <main+41>: cmpl $0x9,-0x4(%rbp)
45 0x000055555555468d <main+45>: jle 0x555555554675 <main+21>
crash.c:4 if (i >= 8)
46 0x0000555555554675 <main+21>: cmpl $0x7,-0x4(%rbp)
47 0x0000555555554679 <main+25>: jle 0x555555554685 <main+37>
crash.c:5 *a = 0;
48 0x000055555555467b <main+27>: mov -0x10(%rbp),%rax
# Show function call history reflecting stack depth
(gdb) record function-call-history /ilc
1 main inst 1,49 at crash.c:2,5
# Do a backwards step
(gdb) reverse-step
5 *a = 0;
Because Intel PT is specifically for While Intel PT does allow full control-flow reconstruction, it does not enable data viewing:
(gdb) print i
$1 = <unavailable>
To increase the size of the ring buffer Intel PT uses for storing the packetstream (e.g. to increase the available context for debugging), use gdb’s set
command:
set record btrace pt buffer-size <size>
When specifying 0 or unlimited for size, gdb allocates a buffer of 4MB.For more information on “process record and replay” in gdb please refer
to the GNU Debugger Documentation [9].
9

4.4 Simple PT
Simple PT (by Andi Kleen, an Intel engineer) is a simple yet full-stackimplementation for Intel PT. It consists of a kernel driver (for talking to theIntel PT hardware block), a command to collect the data, a command todisplay function or instruction traces and a command to dump raw traces.It uses the previously mentioned libipt [7] to decode the packet stream. Tocommunicate with the Intel PT hardware block, it loads a kernel module(.ko). It may serve as a resource for writing low-level interfaces for Intel PT.
The simple-pt contains a tool to check available hardware features:
$ ./ptfeature
Supports PT
toPA output support: 1
multiple toPA entries: 0
single range: 0
trace transport output: 0
payloads are LIP: 0
cycle accurate mode / psb freq: 0
filtering / stop / mtc: 0
CR3 match: 1
Number of address ranges: 0
Supports filter ranges: 0
Supports stop ranges: 0
Valid cycles thresholds:
Valid PSB frequencies:
Valid MTC frequencies:
Family: 6
Model: 79
Stepping: 1
The output above shows that the hardware has support for Intel PT,however it does not support address filtering.
The following command initializes the Intel PT hardware and configuresfor filter for “simple”. Alternatively, one can also trace the whole system(discard the -c option), only user-space (with --no-kernel or -K) or onlykernel (with --no-user or -U).
$ ./sptcmd --comm simple -- ./simple 123456789
123456789 = 11409.000000 * 10821.000000
cpu 0 offset 80, 0 KB, writing to ptout.0
cpu 1 offset 80, 0 KB, writing to ptout.1
cpu 2 offset 80, 0 KB, writing to ptout.2
...snip...
cpu 40 offset 80, 0 KB, writing to ptout.40
10
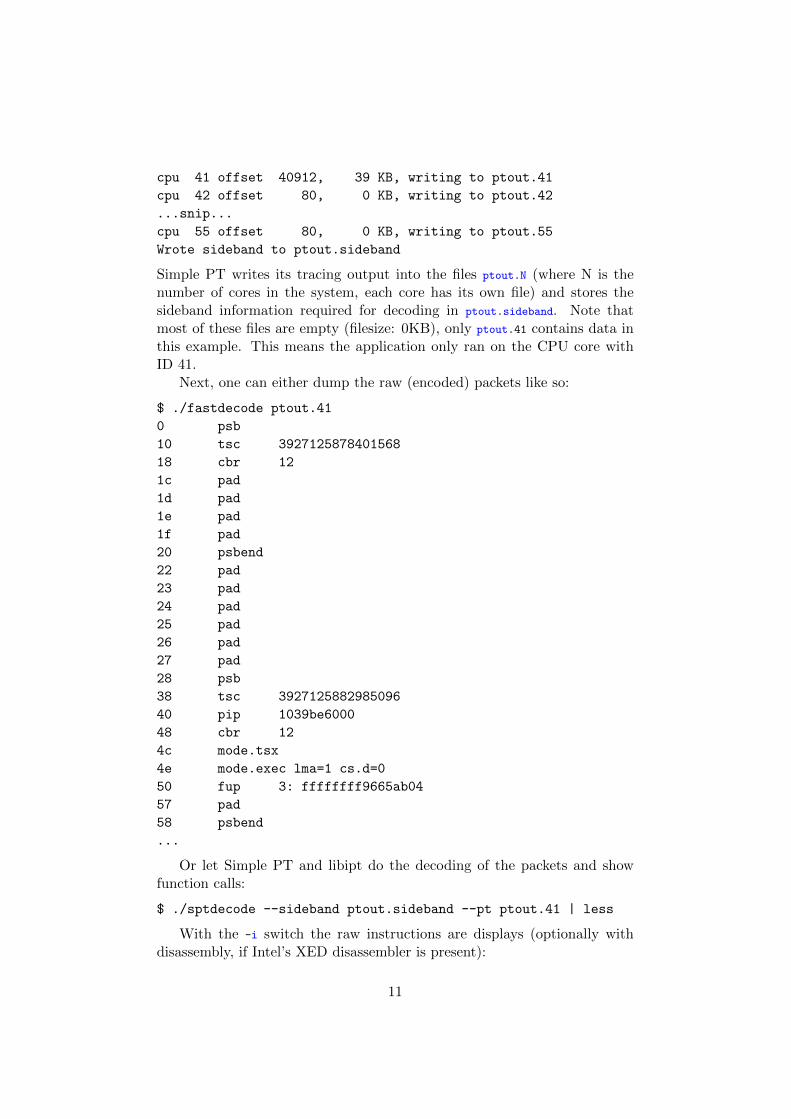
cpu 41 offset 40912, 39 KB, writing to ptout.41
cpu 42 offset 80, 0 KB, writing to ptout.42
...snip...
cpu 55 offset 80, 0 KB, writing to ptout.55
Wrote sideband to ptout.sideband
Simple PT writes its tracing output into the files ptout.N (where N is thenumber of cores in the system, each core has its own file) and stores thesideband information required for decoding in ptout.sideband. Note thatmost of these files are empty (filesize: 0KB), only ptout.41 contains data inthis example. This means the application only ran on the CPU core withID 41.
Next, one can either dump the raw (encoded) packets like so:
$ ./fastdecode ptout.41
0 psb
10 tsc 3927125878401568
18 cbr 12
1c pad
1d pad
1e pad
1f pad
20 psbend
22 pad
23 pad
24 pad
25 pad
26 pad
27 pad
28 psb
38 tsc 3927125882985096
40 pip 1039be6000
48 cbr 12
4c mode.tsx
4e mode.exec lma=1 cs.d=0
50 fup 3: ffffffff9665ab04
57 pad
58 psbend
...
Or let Simple PT and libipt do the decoding of the packets and showfunction calls:
$ ./sptdecode --sideband ptout.sideband --pt ptout.41 | less
With the -i switch the raw instructions are displays (optionally withdisassembly, if Intel’s XED disassembler is present):
11

$ ./sptdecode --sideband ptout.sideband --pt ptout.41 -i
ffffffff9665ab06 0 other insn: 31 c0 xor %eax, %eax
ffffffff9665ab08 0 other insn: 0f 1f 44 00 00 nopl %eax, (%rax,%rax,1)
ffffffff9665ab0d 0 ret insn: c3 retq
ffffffffc032b49e 0 other insn: 66 90 data16 nop
ffffffffc032b4a0 0 other insn: 49 89 c4 mov %rax, %r12
ffffffffc032b4a3 0 other insn: 0f 1f 44 00 00 nopl %eax, (%rax,%rax,1)
ffffffffc032b4a8 0 other insn: 48 8b 44 24 10 movq 0x10(%rsp), %rax
ffffffffc032b4ad 0 other insn: 65 48 33 04 25 28 00 00 00 xorq %gs:0x28, %rax
ffffffffc032b4b6 0 cjump insn: 0f 85 7a 01 00 00 jnz 0xffffffffc032b636 <set_cr3_filter+0x266>
ffffffffc032b4bc 0 other insn: 48 83 c4 18 add $0x18, %rsp
ffffffffc032b4c0 0 other insn: 5b popq %rbx
4.5 AutoFDO
Automatic Feedback Directed Optimizer (AutoFDO) can be used to drivefeedback directed compiler optimizations based on sampling profiles. Thisallows the compiler to optimize for a specific use case of the binary. BothGCC and LLVM can consume samples collected by perf with Intel PT (trans-formed by the AutoFDO tool). Note that the application need not be pro-filed with a full load, even a small but representative load is enough tocollect valuable information. Google has begun deploying AutoFDO on itssystems and by 2016 more than half of CPU cycles are now spent in feed-back directed optimized-binaries. Google’s profile collector crawls machinein random order and requests a 10-second system-wide profile. This equatesto “about 10% of machines each day, so around 0.001% of observable cyclesare profiled. During profiling, less than 1% overhead is observed.” [10]
$ gcc -O3 sort.c -o sort_optimized
$ ./sort_optimized 30000
Bubble sorting array of 30000 elements
2254 ms
$ cat ~/.perfconfig
[intel-pt]
mispred-all = on
$ perf record -e intel_pt//u ./sort 3000
Bubble sorting array of 3000 elements
58 ms
[ perf record: Woken up 2 times to write data ]
[ perf record: Captured and wrote 3.939 MB perf.data ]
$ perf inject -i perf.data -o perf.inj --itrace=i100usle --strip
$ ./create_gcov --binary=./sort --profile=perf.inj
--gcov=sort.gcov -gcov_version=1
12

$ gcc -O3 -fauto-profile=sort.gcov sort.c -o sort_autofdo
$ ./sort_autofdo 30000
Bubble sorting array of 30000 elements
2155 ms
The above example is from the Intel PT documentation in the Linux ker-nel tree. Currently, the AutoFDO conversion tool does not work with thelatest Linux Perf version, however a pull request has been opened by AndiKleen (https://github.com/google/autofdo/pull/44) and after apply-ing the patch the conversion worked.
4.6 Intel Tools
Intel has integrated Processor Trace into two of its other software products.Intel VTune Amplifier is a commercial performance profiler. Intel SATT(Software Analyze Trace Tool) is a free and open-source Linux programto trace, process and analyze full stack software traces utilizing Intel PT,featuring a web-based UI for studying execution in function level from allCPUs, processes, threads and modules.
4.7 Other Uses
As shown in a presentation by two vulnerability researches, Intel PT mayalso be used for diagnostic code coverage, coverage driven fuzzing (automat-ically finding software vulnerabilities) and malware analysis [11].
References
[1] Linux Tracing Tools, Brendan Gregg, http://www.brendangregg.com/Perf/linux_observability_tools.png
[2] Intel Blog: Processor Tracing, James R. Reinders, September18, 2013, https://software.intel.com/en-us/blogs/2013/09/18/
processor-tracing
[3] Intel Processor Trace on Linux, Andi Kleen and Beeman Strong, 2015-08-20, http://halobates.de/pt-tracing-summit15.pdf
[4] Linux Kernel Documentation, https://git.kernel.
org/pub/scm/linux/kernel/git/torvalds/linux.git/
tree/tools/perf/Documentation/intel-pt.txt?id=
510c8a899caf095cb13d09d203573deef15db2fe
13

[5] Intel Real-Time Instruction Tracing (RTIT), https://
www-ssl.intel.com/content/www/us/en/processors/atom/
real-time-instruction-trace-atom-reference.html
[6] GNU C Compiler gcc 5.3.0 Documentation, 3.10 OptimizationOptions https://gcc.gnu.org/onlinedocs/gcc-5.3.0/gcc/
Optimize-Options.html
[7] Intel Processor Trace Decoding library: libipt, https://github.com/
01org/processor-trace
[8] Intel Software Developer’s Manual, Volume 3, https://
software.intel.com/sites/default/files/managed/a4/60/
325384-sdm-vol-3abcd.pdf
[9] GNU Debugger Documentation: Process Record and Re-play, https://sourceware.org/gdb/onlinedocs/gdb/
Process-Record-and-Replay.html
[10] AutoFDO: Automatic Feedback-Directed Optimization for Warehouse-Scale Applications, Dehao Chen and David Xinliang Li and Tipp Mose-ley, 2016, https://research.google.com/pubs/pub45290.html
[11] Harnessing Intel Processor Trace on Windows for Vulnerabil-ity Discovery, Andrea Allievi and Richard Johnson, 2017-04-13,https://conference.hitb.org/hitbsecconf2017ams/materials/
D1T1%20-%20Richard%20Johnson%20-%20Harnessing%20Intel%
20Processor%20Trace%20on%20Windows%20for%20Vulnerability%
20Discovery.pdf
[12] Efficient and Large Scale Program Flow Tracing in Linux, AlexanderShishkin, 2013-09-16, http://events.linuxfoundation.org/sites/
events/files/slides/lcna13_kleen.pdf
[13] Adding Processor Trace support to Linux, Andi Kleen, 2015-07-01,https://lwn.net/Articles/648154/
14