Mitigation of NOx with Pyrolysate Fragments of Solid Fuels ...
266
Mitigation of NO x with Pyrolysate Fragments of Solid Fuels and Their Surrogates Ibukun OLUWOYE, BSc (Hons), MSc This thesis is presented for the degree of Doctor of Philosophy School of Engineering and Information Technology, Murdoch University, Western Australia 2017
-
Upload
khangminh22 -
Category
Documents
-
view
1 -
download
0
Transcript of Mitigation of NOx with Pyrolysate Fragments of Solid Fuels ...

Mitigation of NOx with Pyrolysate Fragments of
Solid Fuels and Their Surrogates
Ibukun OLUWOYE, BSc (Hons), MSc
This thesis is presented for the degree of
Doctor of Philosophy
School of Engineering and Information Technology,
Murdoch University, Western Australia
2017

ii
Declaration
I declare that this thesis is my own account of my research and contains as its main content
work which has not previously been submitted for a degree at any tertiary education institution.
....................................
Ibukun OLUWOYE
February, 2017

iii
Supervisory Statement
We, the undersigned, attest that Higher Research Degree candidate, Ibukun OLUWOYE, has
devised and synthesised the experimental program, conducted experiments, analysed data,
performed computational quantum-mechanical calculations and has written all papers included
in this thesis. Professor Bogdan Z. DLUGOGORSKI and Dr Mohammednoor
ALTARAWNEH provided the necessary advice on the experimental program, project
direction and assisted with the editing of the papers, consistent with normal supervisors-
candidate relations.
....................................
Professor Bogdan Z. DLUGOGORSKI
February, 2017
....................................
Dr Mohammednoor ALTARAWNEH
February, 2017

iv
Dedications
To my families;
Both biologicals and within the congregation of Christ.

v
Acknowledgments
I appreciate GOD for the supreme assistance and strength – Dei sub numine viget.
The research work presented in this thesis reflects the help and support of many kind people
around me, only to some of whom it is possible to give noteworthy salutations here.
I would like to thank my supervisors Professor Bogdan Z Dlugogorski and Dr Mohammednoor
Altarawneh for their unwavering and exceptional support. Their understanding, mentorship,
encouragement, dedication and magnanimity have provided a good fundamental driving force
for the present study. Thank you again, your quick correspondences, corrections and gestures
achieved the intended.
I am grateful to Murdoch University for the award of a postgraduate research scholarship which
provided a valuable financial support for this research. This study has also been funded by the
Australian Research Council (ARC) and Dyno Nobel Asia Pacific, with grants of computing
time from the National Computational Infrastructure (NCI) and the Pawsey Supercomputing
Centre in Perth, Australia.
Special thanks to Dr Jeff Gore of Dyno Nobel Asia Pacific Pty Limited, as well as Murdoch
University’s Mr Kris Parker, Mr Andrew Foreman, Mr Kenneth Seymour, Mr Stewart Kelly,
Mr John Boulton, Dr Marc Hampton and Mr Iafeta Laava for their professional and technical
assistance.

vi
I acknowledge my gratitude to my fellow student colleagues and staffs of the Fire Safety and
Combustion Kinetics Research Laboratory: Zhe Zeng, Anam Saeed, Niveen Assaf, Ehsan
Mohammadpour, Nassim Zeinali, Kamal Siddique, Arif Abdullah, Jomana Al-Nu’airat, Alaa
Kamaluldeen, Sidra Jabeen, Sana Zahid, Pablo Fernández-Castro (University of Cantabria,
Spain), Dr Juita and Dr Jakub Skut. Courtesy of you all, I experienced an exciting and fun-
filled years of research and experiments.
I am highly privileged to receive the School of Engineering and Information Technology’s
Graduate Poster Prize (2014), as well as the Western Australian Joint Chemical Engineering
Committee (JCEC), i.e., the Institution of Chemical Engineers (IChemE) and the Engineers
Australia’s (EA) selected finalist Postgraduate Research Excellence Award (2016).
Ultimately, I value the benevolent support of my family members – omnia vincit amor.

vii
Abstract
This thesis presents a series of scientific studies exploring the thermal mitigation of nitrogen
oxides (NOx) with solid fuel (waste polyethylene) and biomass surrogate (morpholine). These
studies have revealed new mechanistic insights, have described the associated set of reactions,
and have developed a sustainable means of reducing industrially formed NOx, for example, in
combustion processes and during blasting of ammonium nitrate explosive.
Comprehensive quantum-mechanical calculations afforded the investigation of low-
temperature oxidation of polyethylene (PE) film under representative NOx environments.
Investigations of thermal reduction of NOx with recycled PE involved sample characterisation
techniques, such as, carbon-hydrogen-nitrogen-sulfur (CHNS) elemental analyses, ion
chromatography (IC) and inductively coupled plasma optical emission spectroscopy (ICP-
OES), as well as thermogravimetric experiments under practical NOx atmospheres. Innovative
application of the on-line Fourier transform infrared (FTIR) spectroscopy and NOx
chemiluminescence quantitated the reaction product species and established the removal
efficiency of NOx by fragments of pyrolysing PE.
Studies on modelled surrogates, i.e., morpholine, resolved the fundamentals of thermal
interaction of biomass with NOx. The experiment applied a flow-through tubular reactor
coupled with FTIR spectroscopy and chemiluminescence NOx analysis, at constant pressure,
reaction time, and representative fuel-rich condition. Furthermore, density-functional-theory
(DFT) calculations uncovered new mechanistic insights into initial nitration reactions, and
yielded their energetic characteristics, such as exothermic formation of nitro- and nitroso-
adducts.

viii
Results obtained in this study elucidated, for the very first time, initial products of low-
temperature reaction of NOx with polymers and biomass, and determined the rate parameters,
from the isoconversional degradation analysis, that are of great practical importance. A typical
NOx removal efficiency (by fragments of pyrolysing PE) amounts to 80 % at moderate
temperatures. Investigations employing a biomass surrogate revealed the sensitising role of
NOx in combustion of biomass fuels. NOx reduction by biomass occurs only at temperatures
in excess of 800 °C. The thesis also provides kinetic expression for process modelling. The
results of the present work prove that, carbon-hydrogen-type waste polymers and biomass
provide an effective means of mitigation of NOx emission in combustion processes.
Furthermore, the scientific approach can be optimised to deploy solid fuels in bulk ammonium
nitrate/fuel oil (ANFO)/emulsions explosive mixtures, so as to reduce the NOx formation
during detonation of nitrate-based explosives in mining operations.

ix
Table of Contents
Thesis Declaration ii
Supervisory Statement iii
Dedications iv
Acknowledgements v
Abstract vii
Table of Contents ix
Contribution towards Publication xiv
Glossary of Abbreviations and Technical Terms xvii
List of Figures and Tables xviii
1. Introduction 1
1.1. General Overture 2
1.2. Research Motivation 3
1.3. Objectives 5
1.4. Thesis Structure 7
1.5. References 9
2. Paper I: Anthropogenic Formation of NOx from Mining-Grade
Explosives and Its Abatement
12
x
2.0. Abstract 13
2.1. Introduction 14
2.2. Environmental Impact of Mining 18
2.3. Overview of Global NOx Formation 20
2.3.1. Anthropogenic NOx emissions 21
2.3.2. NOx in the environment and mining workplaces: processes and
health effects
24
2.4. Mechanism of NOx Formation During the Use of AN Explosives 26
2.4.1. Stoichiometrically unbalanced blasting 26
2.4.2. Deflagration of AN prills 31
2.4.3. Chemical gassing of emulsion blends 35
2.5. Effective control measures and abatement techniques 38
2.5.1. Operation guidelines for controlling NOx emission in blasting
operations
38
2.5.2. Abatement techniques 39
2.6. Perspectives and Future Outlooks 45
2.7. References 46
3. Methodology 63
3.1. Computational Techniques 64
3.2. Experimental Configurations 66

xi
3.3. Data Analyses 72
3.4. References 73
4. Paper II: Oxidation of Crystalline Polyethylene 75
4.0. Abstract 76
4.1. Introduction 77
4.2. Methodology 79
4.2.1. Computational details 80
4.2.2. Molecular and crystallographic structural parameters of
polyethylene
80
4.2.3. Reaction modelling 83
4.3 Results and Discussion 85
4.3.1. Initiation reactions 85
4.3.2. Formation of hydroperoxide group 89
4.3.3. Hydroperoxide decomposition and other reactions 92
4.3.4 Kinetic considerations 96
4.4 Conclusions 100
4.5 References 101
5. Paper III: Oxidation of Polyethylene under Corrosive NOx
Atmosphere
109

xii
5.0. Abstract 110
5.1. Introduction 111
5.2. Methodology 113
5.3 Results and Discussion 116
5.3.1. Initiation reactions and formation of radical species 116
5.3.2. Addition reactions and fate of consequential N-derivative species 118
5.3.3. Formation of organic nitrites and nitrates 121
5.3.4. Thermodynamics and reaction kinetics 124
5.4 Conclusions 130
5.5 References 131
6. Paper IV: Thermal Reduction of NOx with Recycled Polyethylene 138
6.0. Abstract 139
6.1. Introduction 140
6.2. Experimental Section 142
6.2.1. Materials and sample characterisation 142
6.2.2. Experimental methods 145
6.3. Results and Discussion 147
6.3.1. Thermal decomposition of PE in NOx atmosphere and evolved
gas analysis
147

xiii
6.3.2. Degradation kinetics 154
6.4. Conclusions 158
6.5. References 158
7. Paper V: Enhanced Ignition of Biomass in Presence of NOx 166
7.0. Abstract 167
7.1. Introduction 168
7.2. Applied Methodologies 170
7.2.1. Materials and experimental setup 170
7.2.2. Computational methods 172
7.3. Results and Discussion 174
7.3.1. Effect of NOx on ignition temperature of morpholine 174
7.3.2. Initial steps in nitration of morpholine 177
7.4. Conclusions 182
7.5. References 182
8. Paper VI: Experimental Study on Thermal Reaction of Modelled
Biofuel (Morpholine) with NOx
191
8.0. Abstract 192
8.1. Introduction 193
8.2. Applied Methodologies 194

xiv
8.2.1. Materials and experimental apparatus 194
8.2.2. Product sampling and analyses 196
8.3. Results and Discussion 198
8.3.1. Overview of ignition temperatures 198
8.3.2. Quantitative analysis of N-conversion at high temperatures 200
8.3.3. Comments on NOx reduction and formation of N2 203
8.4. Conclusions 205
8.5. References 206
9. Conclusion and Recommendations 212
9.1. Conclusion 213
9.2. Recommendations 217
10. Supplementary Document 221
Appendix I Supporting Information for Chapter 6 222
Appendix II Supporting Information for Chapters 7 and 8 247

xv
Contribution towards Publication
The work embodied in this thesis contains published joint-authored papers as listed below. I
am the principal contributor in the publications. I have included as part of the thesis a written
statement, endorsed by my supervisors, attesting to my significant contribution to the joint
publications.
Paper I: Atmospheric Emission of NOx from Mining Explosives: A Critical Review
Oluwoye, I.; Dlugogorski, B. Z.; Gore, J.; Oskierski, H. C.; Altarawneh, M.
Atmospheric Environment (submitted)
2015 impact factor: 3.459
Paper II: Oxidation of Crystalline Polyethylene
Oluwoye, I.; Altarawneh, M.; Gore, J.; Dlugogorski, B. Z.
Combustion and Flame 2015, 162, 3681-3690
DOI:10.1016/j.combustflame.2015.07.007
2015 impact factor: 4.168
Paper III: Oxidation of Polyethylene under Corrosive NOx Atmosphere
Oluwoye, I.; Altarawneh, M.; Gore, J.; Bockhorn, H.; Dlugogorski, B. Z.
The Journal of Physical Chemistry C 2016, 120, 3766-3775
DOI: 10.1021/acs.jpcc.5b10466
2015 impact factor: 4.509
Paper IV: Thermal Reduction of NOx with Recycled Polyethylene
Oluwoye, I.; Dlugogorski, B. Z.; Gore, J.; Vyazovkin, S.; Boyron, O.;
Altarawneh, M.

xvi
Environmental Science and Technology 2017
DOI: 10.1021/acs.est.6b05560
2015 impact factor: 5.393
Paper V Enhanced Ignition of Biomass in Presence of NOx
Oluwoye, I.; Altarawneh, M.; Gore, J.; Dlugogorski, B. Z.
12th International Symposium on Fire Safety Science, Lund, Sweden.
published as a Special Issue in the Fire Safety Journal 2017
DOI: 10.1016/j.firesaf.2017.03.042
2015 impact factor: 0.936
Paper VI: Experimental Study on Thermal Reaction of Modelled Biofuel
(Morpholine) with NOx
Oluwoye, I.; Dlugogorski, B. Z.; Gore, J.; Altarawneh, M.
(In preparation)
The list below itemises the publications to which I have contributed during the course of the
PhD study, but which fall outside the scope of this thesis.
i: Formation of Environmentally Persistent Free Radicals on α-Al2O3
Assaf, N. W., Altarawneh, M., Oluwoye, I., Radny, M., Lomnicki, S. M.,
Dlugogorski, B. Z.
Environmental Science and Technology 2016, 50 (20), 11094–11102
DOI:10.1021/acs.est.6b02601
2015 impact factor: 5.393

xvii
ii: Phenol Dissociation on Pristine and Defective Graphene
Widjaja, H., Oluwoye, I., Altarawneh, M., Hamra, A. A. B., Lim, H. N.,
Huang, N. M., .Yin C. Y., Jiang, Z. T.
Surface Science 2017, 657, 10-14
DOI: 10.1016/j.susc.2016.10.010
2015 impact factor: 1.931
iii: Inhibition and Promotion of Pyrolysis by Hydrogen Sulfide (H2S) and
Sulfanyl Radical (SH)
Zeng, Z., Altarawneh, M., Oluwoye, I., Glarborg, P., Dlugogorski, B. Z.
The Journal of Physical Chemistry A 2016, 120 (45), 8941-8948
DOI: 10.1021/acs.jpca.6b09357
2015 impact factor: 2.883
iv Formation of PCDDs and PCDFs in the torrefaction of biomass with
different chemical composition
Gao, Q., Edo, M., Larsson, S. H., Collina, E., Rudolfsson, M., Gallina, M.,
Oluwoye, I.; Altarawneh, M., Dlugogorski, B. Z., Jansson, S.
Journal of Analytical and Applied Pyrolysis 2017, 123, 126-133
DOI: 10.1016/j.jaap.2016.12.015
2015 impact factor: 3.652

xviii
Glossary of Abbreviations and Technical Terms
AEISG Australian Explosive Industry and Safety Group
AMD Acidic mine discharge
AN Ammonium nitrate
ANFO Ammonium nitrate/fuel oil
AP ammonium perchlorate
ADN ammonium dinitramide
AOP Acidity–oxidation potential measurements
ATR Attenuated total reflectance
BDH Bond dissociation enthalpy
BEZ Blast exclusion zones
CHNS Carbon-hydrogen-nitrogen-sulfur
DFT Density functional theory
DNP Numerical plus polarisation
DSC Differential scanning calorimetry
EPR Electron paramagnetic resonance
FMZ Fume management zones
FTIR Fourier transform infrared
GC-MS Gas chromatography mass spectrometry
GGA Generalised gradient approximation
HDPE High density polyethylene
HEDM High-energy-density material
HT-SEC High temperature size exclusion chromatography

xix
IC Ion chromatography
ICP-OES Inductively coupled plasma emission spectroscopy
IPCC Intergovernmental Panel on Climate Change
IR Infrared
LDPE Low density polyethylene
LST/QST Linear synchronous and quadratic synchronous transit
MMD Molecular mass distributions
NOx Oxides of nitrogen
Nr Reactive nitrogen
OB Oxygen balance
OECD Organization for Economic Cooperation and Development
PAC Photoacoustic calorimetry
PAN Peroxyacyl nitrates
PBE Perdew-Burke-Ernzerhof
PE Polyethylene
PM Particulate matters
PES Potential energy surfaces
PPM Parts per million
VOD Velocity of detonation
SOx Oxides of sulfur
STP Standard temperature and pressure
ST Shock tube
TGA Thermogravimetry apparatus
TMWL Temperature of maximum rate of weight loss
TST Transition state theory

1
CHAPTER 1
Introduction
This chapter sets the stage for the entire thesis, comprising
detailed expression of research motivation, purpose, as
well as concise outline of the dissertation
…

CHAPTER 1 — Introduction
2
1.1. General Overture
The recent expository report by the Intergovernmental Panel on Climate Change (IPCC)1
presented the global inventory of nitrogen oxides (NOx) in the environment. The report has
established that, the anthropogenic emission of NOx adds substantially to overall discharge of
reactive nitrogen species into the atmosphere. The term NOx refers to nitric oxide (NO),
nitrogen dioxide (NO2) and other higher oxides based on the various possible oxidation states
of nitrogen. Apart from its limited industrial and medical applications, NOx contributes to acid
rain, eco-eutrophication, photochemical smog, ground level ozone, greenhouse effect,
stratospheric ozone depletion, and health deterioration (e.g., chronic respiratory and obstructive
pulmonary dysfunction) of predisposed organisms.2-6
As industrial mitigation of NOx remains a prominent issue, most of the applied methods 3, 7-11
are designed solely for combustion systems. However, other emission sources, e.g. blasting of
nitrate explosive in mining activities, require adequate and reliable NOx reduction technology.
Practical technological limitations prevent the direct application of the post-combustion NOx
mitigation techniques to blasting. These limitations comprise: (a) the fast dispersion of
atmospheric air mixture, i.e., mixing of post-blast fume with air prevents its effective capturing,
scrubbing, treatment and/or reprocessing; (b) nitrate blasting agents exhibit incompatibilities
with materials (e.g., metal nitrides)12 that may serve, in the form of additives, to scavenge the
generated NOx.
This thesis presents a series of scientific studies exploring both fundamental and practical
aspects of the thermal mitigation of NOx with solid hydrocarbon fuel (waste polyethylene) and
biomass surrogate (morpholine). It aims at developing new sustainable technologies for

CHAPTER 1 — Introduction
3
reducing industrially formed NOx, based on biomass and recycled plastics, especially for
applications relevant to blasting of mining-grade ammonium nitrate (AN) based high-energy
materials.
1.2. Research Motivation
Figure 1 presents the United Nations’ statistics on NOx emission per capita of different
countries across the globe.13 Accordingly, and in consistent with the Organization for
Economic Cooperation and Development (OECD) report,14 some countries (e.g. Australia)
display high emission (127 kg for the year 2007 and 75 kg for the year 2012) of NOx per capita.
This could be rationalised as a result of lack of mitigation of NOx emission in power plants,
some industrial processes, combustion activities involving untreated fossil, bushfires and
mining operations, especially large open cut mines that require significant movement of
materials (including overburden) by diesel-driven excavators and trucks.15-17

CHAPTER 1 — Introduction
4
Figure 1.1. Global NOx emission per capita. The main source for NOx is burning of fuels,
particularly petroleum products. In some countries agriculture and burning of savannas is
also an important contributor.13 Anomalies associated with some countries such as Gabon,
Niue, Paraguay, St. Vincent and the Grenadines, and Zambia are explicitly discussed in the
cited reference.
Attention of environmental agencies and concerned citizens usually focuses on anthropogenic
combustion of fossil fuel and/or biomass as the primary source of human-related NOx emission.
Yet, according to some scientific studies available in open literature18-20 and in daily press,21,
22 mining operations contribute significantly to the local emission of NOx. The AN explosive
mixtures used in blasting processes may produce NOx because of imbalanced stoichiometry
and intricacies of geological conditions. For instance, in open-cast mining, measurements
reveal that the post-blast plume can comprise up to 500 parts per million (ppm) of NOx, –
primarily nitric oxide (NO) and nitrogen dioxide (NO2) – with the latter embodying the plumes
with their orange hue.18-20

CHAPTER 1 — Introduction
5
The current World Health Organisation air quality guidelines for NO2 amount to a one hour
level of 200 µg/m3 (1.88 µg/m3 of NO2 = 10-3 ppm), and an annual average of 40 µg/m3.23 The
typical high concentrations of NOx in post-blast clouds, measuring between 5.6 to 580 ppm,
exceed the safe limits by around 30 to 3000 times. These high emission values can lead to
health deterioration of predisposed organisms.20 Consequently, emissions of NOx in mining
operations have come under intense scrutiny by chief inspectors of mines and explosives or
other health and safety authorities in the Australian jurisdictions, for example, the Chief
Inspector of Coal Mines and the Chief Inspector of Explosives in the State of Queensland.24
The clouds of NOx from the detonation sites do not dissipate rapidly, and may drift outside
mine boundaries into populated areas, in spite of stringent mining guidelines, causing protests
of local residents.
Thus, the prime motivation behind the present study was to fill the existing gaps in knowledge
and to find practical solutions to tackle the problems of NOx emissions from blasting of
ammonium nitrate (AN) based explosives by developing new abatement technologies, gaining
detailed knowledge of the fundamental mechanisms underpinning these technologies, and
estimating the contribution of AN explosives to the total anthropogenic NOx formation.
1.3. Objectives
The purpose of this research lies in its environmental and industrial implications. It aims to
investigate the thermal reactions relevant to mitigation of NOx with waste plastics and biomass
surrogate. To achieves this, the thesis targets fulfilling the following objectives:

CHAPTER 1 — Introduction
6
i. Exploration of anthropogenic NOx formation: (a) To review the global NOx emission
channels, in light of consequential environmental impacts and mitigation methods. (b)
To introduce mining and infrastructure grade explosives, and overview of
environmental impact of mining. (c) To evaluate the pollutant loads from blasting
operations, to quantitate the NOx formation during detonation of ammonium nitrate
blasting agents with valid explanation of different underlying mechanisms, as well as
to assess their contributions with respect to the global nitrogen budget. (d) To present
various abatement technologies, prevailing challenges, and outlooks on future
developments regarding pollution-free blasting activities.
ii. Development of sustainable solid organic fuel for reduction of NOx emission: (a) To
characterise waste polymer pellets towards their applicability for the intended purpose.
(b) To measure the thermal decomposition pattern of neat and recycled polymer
samples under controlled and representative NOx environments. (c) To develop a
mechanistic insight explaining the formation of initial product, as well as to construct
the necessary isoconversional kinetic parameter governing the thermal decomposition
events. (d) To quantitate the NOx reduction efficiency of pyrolysing fragments of waste
polymer, and hence provide optimum operating conditions in combustion systems.
iii. Investigation of thermal interaction of biomass with NOx: (a) To gauge the sensitising
effect of NOx on biomass ignition/combustion. (b) To quantify the species produced
during pyrolysis and combustion of modelled biofuel in NOx presence. (c) To establish
the N-selectivity and NOx reduction profile as function of temperature. In order to
avoid the complex nature of biomass residues, to perform experiments using
representative model compounds, such as morpholine.

CHAPTER 1 — Introduction
7
In agreement with principles of green chemistry and engineering,25, 26 thermal reduction of NOx
by recycled polyethylene assigns value to minimisation of solid wastes by providing an
ecofriendly exit route for excess plastic wastes in our society. Moreover, its application to NOx
formation in combustion plants will promote the growth of innocuous degradation products,
thereby enhancing low-emission technologies and effective energy recovery from polymeric
waste materials. Furthermore, the scientific approach can be optimised to deploy waste
polyethylene in bulk ammonium nitrate/fuel oil (ANFO)/emulsions explosive mixtures, so as
to mitigate the NOx formation during detonation of nitrate-based explosives, for example, in
mining operations. In view of the aforementioned tasks, the following section outlines the
specific outcomes of the thesis.
1.4. Thesis Structure
This dissertation represents a coordinated study assessing the thermal mitigation of NOx with
solid fuels and their surrogates. The following chapter presents a comprehensive literature
review designed to provide a balanced assessment of the contribution of mining-grade AN
explosives to anthropogenic NOx formation, to explain the mechanism of emission of NOx in
sensitisation and blasting of AN explosives, to describe the existing abatement technologies as
compared to those developed in this thesis, and to point out the gaps in knowledge.
Chapter 3 illustrates the main experimental and computational techniques employed within the
scope of this study.

CHAPTER 1 — Introduction
8
Chapters 4 and 5 present systematic investigations of low-temperature interaction of
polyethylene with NOx, discovering pathways leading to the formation of initial nitro and
nitroso products. These pathways govern the mitigation of NOx by fragments of pyrolysed
polymers.
Chapter 6 develops technology for mitigation of NOx formed in thermal processes using waste
polyethylene. This chapter has two objectives: (a) to appraise the NOx reduction efficiency of
fragments of pyrolysing PE; and, (b) to construct a kinetic mechanism that operate during the
removal of NOx from the post-detonation gases.
Chapter 7 analyses the initial nitration steps and establishes the reasons for enhanced ignition
of biomass in presence of NOx. This enhanced ignition represents an unintended consequence
for process safety of using biomass for mitigation of NOx. This can be circumvented by proper
(and separate) venting of NOx exhausts in organic dust-laden areas.
Chapter 8 focuses on high-temperature reaction of biomass surrogate (morpholine) with NOx,
elucidating the N-conversion profiles, and NOx-reduction efficiency as compared to
conventional hydrocarbon fuels.
Chapter 9 draws the concluding remark of this thesis, and makes suggestions and
recommendations for future investigations.
Finally, Chapter 10 provides all necessary supplementary material.

CHAPTER 1 — Introduction
9
1.5. References
1. Stocker, T. F.; Qin, D.; Plattner, G.-K.; Tignor, M.; Allen, S. K.; Boschung, J.; Nauels,
A.; Xia, Y.; Bex, V.; Midgley, P. M. Climate Change 2013: The Physical Science Basis;
International Panel on Climate Change (IPCC): Cambridge University Press Cambridge, UK,
and New York, 2014.
2. Seinfeld, J. H.; Pandis, S. N., Atmospheric Chemistry and Physics: from Air Pollution
to Climate Change. John Wiley & Sons: 2006.
3. Baukal, C. E.; Schwartz, R.; John Zink Company., The John Zink Combustion
Handbook. CRC Press: Boca Raton, Fla; London, 2001.
4. Galloway, J. N.; Aber, J. D.; Erisman, J. W.; Seitzinger, S. P.; Howarth, R. W.;
Cowling, E. B.; Cosby, B. J., The nitrogen cascade. Bioscience 2003, 53, (4), 341-356.
5. Glarborg, P.; Jensen, A. D.; Johnsson, J. E., Fuel nitrogen conversion in solid fuel fired
systems. Prog. Energy Combust. Sci. 2003, 29, (2), 89-113.
6. Williams, A.; Jones, J. M.; Ma, L.; Pourkashanian, M., Pollutants from the combustion
of solid biomass fuels. Prog. Energy Combust. Sci. 2012, 38, (2), 113-137.
7. Glarborg, P., Fuel nitrogen conversion in solid fuel fired systems. Prog. Energy
Combust. Sci. 2003, 29, (2), 89-113.
8. Boardman, R.; Smoot, L., Pollutant formation and control. Coal Sci. Technol 1993, 20,
433-509.
9. EPA, Nitrogen Oxide (NOx), Why and How They are Controlled (EPA 456/F-99-006R).
Clean Air Technology Center, United States Environmental Protection Agency: North
Carolina, 1999.
10. Hill, S. C.; Smoot, L. D., Modeling of nitrogen oxides formation and destruction in
combustion systems. Prog. Energy Combust. Sci. 2000, 26, (4-6), 417-458.

CHAPTER 1 — Introduction
10
11. Smoot, L. D.; Hill, S. C.; Xu, H., NOx control through reburning. Prog. Energy
Combust. Sci. 1998, 24, (5), 385-408.
12. Bretherick, L.; Urben, P.; Pitt, M. J.; Battle, L., Bretherick’s Handbook of Reactive
Chemical Hazards, Vol. 1. Butterworth-Heinemann: 1999.
13. UN, NOx Emissions Per Capital. United Nations Statistic Division.
http://unstats.un.org/unsd/environment/air_nox_emissions.htm (January 10, 2017).
14. OECD, Sulphur oxides (SOx) and nitrogen oxides (NOx) emissions. In Environment at
a Glance 2015: OECD Indicators, Organization for Economic Cooperation and Development
Publishing: Paris, 2015.
15. DEE, National Pollutant Inventory, Emission Estimation Technique Manual for
Explosives Detonation and Firing Ranges. 3.1 ed.; Department of Environment and Energy,
Australia: 2016.
16. DEE, 2014/2015 data within Australia - Oxides of Nitrogen from All Sources.
http://www.npi.gov.au/npidata/action/load/emission-by-source-
result/criteria/substance/69/destination/ALL/source-type/ALL/substance-
name/Oxides%2Bof%2BNitrogen/subthreshold-data/Yes/year/2015 (January 10, 2017).
17. Weng, Z.; Mudd, G. M.; Martin, T.; Boyle, C. A., Pollutant loads from coal mining in
Australia: Discerning trends from the National Pollutant Inventory (NPI). Environ. Sci. Policy
2012, 19–20, (0), 78-89.
18. Attalla, M.; Day, S. J.; Lange, T.; Lilley, W.; Morgan, S., NOx Emissions from Blasting
in Open Cut Coal Mining in the Hunter Valley. CSIRO Energy Technology: 2007.
19. Attalla, M. I.; Day, S. J.; Lange, T.; Lilley, W.; Morgan, S., NOx emissions from
blasting operations in open-cut coal mining. Atmos. Environ. 2008, 42, (34), 7874-7883.

CHAPTER 1 — Introduction
11
20. McCray, R. B. Utilization of a Small Unmanned Aircraft System for Direct Sampling
of Nitrogen Oxides Produced by Full-Scale Surface Mine Blasting. University of Kentucky,
2016.
21. Kelly, M., Toxic cocktail in fumes and dust. Newcastle Herald Newspaper April 13,
2013, pp 4-5.
22. Kelly, M., Effects of blasts worry residents. Newcastle Herald Newspaper May 13,
2013, pp 4-5.
23. WHO, Air Quality Guidelines: Global Update 2005: Particulate Matter, Ozone,
Nitrogen dioxide, and Sulfur dioxide. World Health Organization: 2006.
24. Queensland Guidance Note 20; Management of Oxides of Nitrogen in Open Cut
Blasting In DEEDI, Ed. The State of Queensland: Qeensland, 2011.
25. Anastas, P.; Eghbali, N., Green chemistry: principles and practice. Chem. Soc. Rev.
2010, 39, (1), 301-312.
26. Anastas, P. T.; Zimmerman, J. B., Peer reviewed: design through the 12 principles of
green engineering. Environ. Sci. Technol. 2003, 37, (5), 94A-101A.

12
CHAPTER 2
Paper I: Atmospheric Emission of NOx from Mining
Explosives: A Critical Review
Oluwoye, I.; Dlugogorski, B. Z.; Gore, J.; Oskierski H.C.; Altarawneh, M., Atmospheric
Emission of NOx from Mining Explosives: A Critical Review: Atmos. Environ.: Submitted (in
modified form) for publication 2017.
Overview of NOx forming mechanisms during the use of ammonium nitrate
explosives in mining operations
Transformation of nitrogen in NH4NO3
Chemical gassing of AN emulsion
Detonation of ANFO & emulsion
Decomposition of AN
Effect of sensitising and
nucleophilic agents
Positive oxygen balance as a result
of presence of moisture, intricacies
in mineral deposition and changes in
reaction stoichiometry
Post-blast cloud containing hazardous NOx species
The chapter presents a comprehensive focused review of one of the major
influences of mining activities on atmospheric chemistry. It provides a balanced
explanation on the contribution of AN explosives to anthropogenic NOx formation,
describing in detail the underlying mechanisms and abatement technologies as
compared to those developed in this thesis
…

CHAPTER 2 — Atmospheric Emission of NOx from Mining Explosives: A Critical Review
13
2.0. Abstract
High-energy materials such as emulsions, slurries and ammonium-nitrate fuel-oil (ANFO)
explosives play crucial roles in mining, quarrying, tunnelling and many other infrastructure
activities, because of their excellent transport and blasting properties. However, these
explosives engender environmental concerns, due to atmospheric pollution caused by emission
of nitrogen oxides (NOx) from blasts that amounts up to 5 kg/(t AN explosive), on average.
This first-of-its-kind review provides a concise literature account of the formation of NOx
during blasting of AN-based explosives, employed in surface operations. We estimate the total
NOx emission from AN-based explosives as 0.05 Tg (i.e., 5×10⁴ t) N per annum, which
compares to the total global anthropogenic NOx emissions of 41.3×10⁶ t N/y. Although the
global budget is only on the scale of one per mille on a global scale, these emissions involve
concentrated discharges characterised by NOx concentration in the order of 500 ppm which can
have workplace and local effects. The review describes different types of AN energetic
materials for civilian applications, and summarises the essential properties and terminologies
pertaining to their use. Furthermore, we recapitulate the mechanisms that lead to the formation
of the reactive nitrogen species, and compare them with those experienced in other thermal and
combustion operations. We also review the mitigation approaches, including guidelines and
operational-control measures that minimise or manage the risk of post-blast NOx fumes during
mining operations. The review discusses the abatement technologies such as formulation of
new explosive mixtures, comprising secondary fuels, spin traps and other additives, in light of
their effectiveness and efficiency. We conclude the review with a summary of unresolved
problems, identifying possible future developments and their impacts on the environment with
emphasis on local and workplace loads.

CHAPTER 2 — Atmospheric Emission of NOx from Mining Explosives: A Critical Review
14
2.1. Introduction
High-energy-density materials (HEDMs) have revolutionised the world’s mining,
infrastructure and aviation industries. These materials generally consist of explosives,
propellants and pyrotechnics. They generate high temperature and pressure via complex
combustion phenomena involving physicochemical phase changes, complemented by rapid
exothermic reactions.1-3 Technically, the term “explosion” defines a sudden release of energy
confined in (but not limited to) HEDMs, accompanied by dramatic discharge of expanding
gases4 that enables impacting work done on the surroundings.
HEDMs fall into two broad categories, namely, the low and the high explosives. The salient
features entrenched in this classification include the reaction velocities and pressures achieved
during the combustion processes.1, 5 Low explosives, otherwise known as fast-burning or
deflagrating substances, burn in a regular but less shattering manner, while exhibiting a
relatively low reaction velocities between 0.01 – 400 m/s, and bar-range pressures. Typical
examples of low explosives comprise black powders, smokeless powders, propellants and
pyrotechnic mixtures. On the contrary, high explosives demonstrate superior rates of reaction,
i.e., velocity of detonation (VOD) ranging from 1000 – 9000 m/s, as well as higher pressure of
explosion. High explosives generate supersonic shock waves and perform relatively higher
work on their surroundings. Sensitivity of high explosives to detonation serves as a convenient
criterion to subdivide them into three main classes:2, 6, 7
(i) Primary high explosives (primers) represent extremely sensitive materials that easily
explode with the application of shock, spark, fire, friction, impact and heat. They
remain dangerous to handle and find use in comparatively small quantities in primers,

CHAPTER 2 — Atmospheric Emission of NOx from Mining Explosives: A Critical Review
15
detonators and percussion caps. Examples of primary high explosives include mercury
fulminate, lead azide, lead styphnate, silver azide, tetrazene, and diazodinitrophenol.
(ii) Secondary high explosives (base explosives) display relative insensitivity to
mechanical shock, friction or flame, but shock waves of primary explosives can set
them off, i.e., detonators. Common examples comprise nitro-glycerine, nitroglycol,
nitromethane, dynamite, TNT, RDX, PETN, HMX, etc.
(iii) Tertiary high explosives (blasting agents) exhibit the least sensitivity. They cannot
reliably detonate by application of practical quantities of primary explosive, requiring
a booster of secondary explosives. This class consists of oxidisers such as ammonium
nitrate (AN), ammonium perchlorate (AP), ammonium dinitramide (ADN), etc., and
their corresponding fuel-composite mixtures.
Tertiary high explosives excel other high explosives for their stability, demanding more energy
to set off. Blasting agents afford variety of civilian applications involving local displacement
of earth crust, structural demolitions and building implosions, spanning large-scale mineral
extraction, quarrying, tunnelling, and many other construction operations. AN-based blasting
agents display desirable compromise between production, handling, safety, economic, and
performance characteristics as compared to nitrated hydrocarbon compounds, i.e., molecular
explosives.
AN-fused high energy products include emulsions, slurries and ammonium-nitrate-fuel-oil
(ANFO) mixtures. Owing to their excellent transport and blasting properties, they represent
nearly 90 % of the total explosives employed worldwide in the civilian sector.8 A mixture of

CHAPTER 2 — Atmospheric Emission of NOx from Mining Explosives: A Critical Review
16
a well-balanced bulk ANFO usually consists of 5.7 wt. % fuel oil in an oxidising AN matrix,
whereas, formulations of emulsion and slurry explosives consist of additional components that
improve the contact between the oxidising salt and the fuel, and sensitise these materials. For
instance, emulsion explosives contain droplets of supersaturated aqueous phase of AN
dispersed in continuous oil phase (mixture of fuel and emulsifier). The literature8-11 provides
further information on the composition, manufacturing and underlying properties of these
materials. Volatile oils give the greatest sensitivity towards the reaction. However, petroleum
fractions with low flash points pose hazards. Therefore, the optimum choice incorporates fuel
oils similar to those used in diesel engines, i.e., No 2 distillate fuel oil, biodiesel, etc. As seen
by comparing the exothermicity of overall Equations (a) and (b), the fuel component of AN
explosives increases their energy density.8, 12
NH4NO3 → N2(g) + 2H2O + ½O2(g), ΔHr = -1440 kJ/kg (a)
3NH4NO3 + CH2 → 3N2(g) + CO2(g) + 7H2O, ΔHr = -3900 kJ/kg (b)
Global (or overall) Equations (a) and (b) summarise a number of elementary steps that underpin
each of these reactions. We use the right-headed arrows in the equations to stress their
irreversibility. If a practical explosive formulation deviates from the stoichiometric
requirements defined by Equation (b), the resulting fuel rich and lean fuel conditions lead to
redox processes described in Equations (c) and (d), respectively.
2NH4NO3(s) + CH2 → 2N2(g) + CO(g) + 5H2O, ΔHr = -3400 kJ/kg (c)
5NH4NO3(s) + CH2 → 4N2(g) + CO2(g) + 11H2O + 2NO, ΔHr = -2500 kJ/kg (d)

CHAPTER 2 — Atmospheric Emission of NOx from Mining Explosives: A Critical Review
17
Imbalanced stoichiometric reactions and intricacies in mineral deposits results in noxious
footprint of ammonium nitrate explosives. For instance, in open-cast mining, observations
reveal that, the post-blast plume can harbour more than 500 parts per million (ppm) of nitrogen
oxides (NOx),12-14 consisting mainly of nitric oxide (NO), which subsequently undergoes
atmospheric oxidation to form nitrogen dioxide (NO2) according to overall Equation (e).
2NO(g) + O2(g) → 2NO2(g), ΔHr = -57 kJ/mol (e)
Orange-hue post-blast fumes indicate the presence of NO2. Clouds of NOx from the detonation
sites do not dissipate rapidly, and may drift outside mine boundaries into populated areas, in
spite of stringent mining guidelines, causing protests of local residents. Managing exclusion
zones by industry adds to the cost of mine operations. The average emission flux of NOx from
blasts scales up to 5 kg/(t AN explosive).15-19
This critical review presents a comprehensive summary of the influence of mining activities
on atmospheric chemistry. We commence by introducing the main environmental impacts of
mining, and then provide a critical evaluation of mechanisms of NOx formation. The review
offers a balanced explanation on the contribution of AN explosives to anthropogenic NOx
formation as generalised in Figure 2.1, emphasising the relevant abatement technologies. From
this perspective, the review informs researchers and engineers across germane environmental
disciplines and interested citizens on how to tackle unconfined NOx emissions with best-
practice technologies.

CHAPTER 2 — Atmospheric Emission of NOx from Mining Explosives: A Critical Review
18
Figure 2.1. Outline of NOx forming activities during the use of ammonium nitrate explosives
in mining operations.
2.2. Environmental impact of mining
This section briefs the reader on the overall impact of mining on the environment, to set the
scene for subsequent discussion:
(i) Typical air contamination: This category includes the emission of harmful gases, dust,
explosive residues and particulate matters (PM).17, 20-32 The major gaseous load from
mining activities corresponds to NOx, sulfur oxides, carbon oxides, photochemical
oxidants, volatile organic compounds (VOCs) and methane.12, 17, 20, 33-35 Overall, these
emissions originate from either mobile, stationary or fugitive sources. The mobile
sources involve vehicles and excavation equipment with on-board abatement
techniques, such as catalytic converters. Stationary sources comprise large operations

CHAPTER 2 — Atmospheric Emission of NOx from Mining Explosives: A Critical Review
19
such as drying, roasting and smelting that allow post-activity emission treatments,
whereas fugitive emissions result from rapid activities such as blasting and wind
erosion preventing the gas clean-up by venting technologies.36-40
(ii) Water resources impact: The environmental influence of mining on water resources
embodies quantity- and quality-related issues. The former refer to drop and alterations
in groundwater table.20 High water consumption in mining processes results in shortage
of local water supplies.37, 41, 42 In the interest of public concerns for aquatic life, the
quality of ground and surface water deteriorates as a result of suspended solids, leached
contaminants (basically heavy metals), erosion of soil and mine wastes, and acidic mine
discharge (AMD, formed when pyrite (FeS2) reacts with water and air to produce
sulfuric acid and dissolved iron).20, 39, 43
(iii) Land and soil infectivity: In addition to physical subsidence and topographical
disturbances,20, 41, 44-46 mining operations contribute to soil contamination via chemical
channels.47 The common contaminants include heavy metals and inorganic ions that
can persist long after mine remediation.47, 48 Other environmental pathways operate
through atmospheric deposition to affect the soil and water quality. The aftermaths of
soil pollution disturbs the biological food chain, progressing from absorption of
pollutants by plants to ingestion of plant material by individual organisms.
(iv) Miscellaneous issues: Other significant impact of mining includes thermal-related
losses, waste treatment and disposal, ecological imbalance, noise and vibration
pollution, resettlements, habitat loss and fragmentation, and economic waves.20, 37, 39, 41,
49-51

CHAPTER 2 — Atmospheric Emission of NOx from Mining Explosives: A Critical Review
20
Blasting activities result in formation of dust, primary particles and gaseous (basically NOx)
emissions. The air quality remains highly vulnerable as, unlike water or soil, practical
considerations prevent reprocessing of atmospheric air mixtures.41 The post-blast fumes
require adequate on-site control measures to reduce their negative impacts on the surrounding
communities and the environment. The recent growth of mining industries, and continuous
shift from underground mining to open-pit excavations have exacerbated the fume hazards.
Other activities in mining operations also contribute to the formation of NOx species, however,
this review focuses on emissions pertinent to direct use of AN explosives.
2.3. Overview of global NOx formation
On a global scale, reactive nitrogen (Nr) species arise from various human-related activities
and natural terrestrial processes.52-55 Figure 2.2 demonstrates the speciation, environmental
interactions and global sources of NOx.56-59 The major Nr species comprise NOx, ammonia,
ammonium, nitrous oxide, nitrate and nitric compounds. Atmospheric NOx contributes
substantially (nearly half) to the overall balance of Nr species, by trailing only the emission of
ammonia. Also, Nr accumulates in the environment as a result of higher emission rates,
relatively to denitrification to nonreactive N2.56

CHAPTER 2 — Atmospheric Emission of NOx from Mining Explosives: A Critical Review
21
Figure 2.2. Annual atmospheric emissions and interactions of NOx. The data on the
rightward figure, except for “others”, are extracted from IPCC 2014.66 All values are
reported in Tg N/y. Conversion details; 1 Tg = 1012 g or 106 tonnes. “Others” denotes
emission sources with unknown global estimates, which may include aircraft (≈ 0.7 Tg
N/y),67 oxidation of NH3 (≈ 3.0 Tg N/y)68 and dispersed use of nitrate explosives (estimated
to be ≈ 0.05 Tg N/y). Total anthropogenic emission correspond to 41.3 Tg N/y.
2.3.1. Anthropogenic NOx emissions
Of all the sources of anthropogenic NOx, combustion of fossil fuels induces the most emission,
mainly due to the constituent nitrogenous heterocyclic species in the fuels’ structure.70,71
During combustion processes, NOx and its precursors arise via the four routes: (a) the thermal
process involving the Zeldovich reaction between atmospheric nitrogen and oxygen as a result

CHAPTER 2 — Atmospheric Emission of NOx from Mining Explosives: A Critical Review
22
of high combustion temperature (above 1500 °C); 72-74 (b) the fuel-N channel arising from
oxidation of nitrogen compounds chemically bounded with the fuel organic matter. This
corridor generates about 80 % of NOx emission in pulverised solid fuel combustion; 73,75-78 (c)
the prompt process characterising the reaction of atmospheric nitrogen with hydrocarbon
radicals to form NOx precursors via a series of gas-phase reactions; 73 (d) the heterogeneous
route occurring as the result of the reactions of solid carbonaceous substance, i.e., char
remaining after devolatilisation.70,78 The net amount of NOx formed from heterogeneous
reactions depends on the intrinsic reactivity and the internal surface area of the char, as well as
charring conditions.78-80 In addition, moderate nitrogen content of biofuels and lower
temperature of biofuel combustion (in comparison to fossil-fuel combustion) decrease the
release of NOx species in biomass firing.73,78,81-83
Other human-related emission sources include agricultural activities, emission of NH3 in
chemical industry (e.g. from the Haber-Bosch process) and use of nitrate oxidisers in aviation,
infrastructure and mining industries. Assessing the amount of NOx produced from a blast
depends on the relative position (distance and angle) of the observer and the prevailing weather
conditions.84 The Australian Explosive Industry and Safety Group (AEISG) has developed a
viable qualitative chart ,85 as seen in Table 2.1, to rate the post-blast NOx (typically NO2) on a
simple scale of 0 to 5, but without linking the fume appearance to NOx concentration.

CHAPTER 2 — Atmospheric Emission of NOx from Mining Explosives: A Critical Review
23
Table 2.1. Field colour chart for visual rating of blast-generate NOx.75
Level Colour Pantone number Typical appearance
Level 0
No NOx gas
Warm Grey 1C
(RGB 244, 222, 217)
Level 1
Slight NOx gas
Pantone 155C
(RGB 244, 219, 170)
Level 2
Minor yellow/orange gas
Pantone 157C
(RGB 237, 160, 79)
Level 3
Orange gas
Pantone 158C
(RGB 232, 117, 17)
Level 4
Orange/red gas
Pantone 1525C
(RGB 181, 84, 0)
Level 5
Red/purple gas
Pantone 161C
(RGB 99, 58, 17)
The pollutant release and transfer registers implemented since 1990s in all OECD countries86
do not provide estimates of the contribution of NOx from blasting to the total anthropogenic
emission of this gas. For example, the Australian National Pollutant Inventory (NPI) reports
combined emission of NOx from all activities at each mining facility, focussing on the amount
of each pollutant rather than on establishing links between the amounts and the underlying
discharge mechanisms.26,27 This is not a satisfactory situation. The increasingly prevalent open
cut mines in Australia move large amount of overburden, an effort that tends to govern the NOx
footprint of each mine. An additional, somewhat intractable, problem lies with the estimation
approach itself that assumes emission factors that do not account for episodes of large discharge

CHAPTER 2 — Atmospheric Emission of NOx from Mining Explosives: A Critical Review
24
of NOx fumes from blasting. For this reason, in this article we adopt an average yield of NOx
emission of 5 kg/(t AN explosive),25-29 as a first-order conservative approximation, and
consider the global annual (for the year 2016) AN production of 58.2 million tonnes,87 of which
35 % are deployed in the explosive industry,88 to arrive at a global annual emission of
approximately 0.1 Tg/y of NO (i.e. 0.05 Tg N/y, or 5×10⁴ t N/y) generated as a result of mining-
related blasting. This number is rather small in comparison to the total emissions of
anthropogenic NOx from all sources that corresponds to 41.2×10⁶ t N/y (cf. Figure 2.2). Thus,
in spite of its potential for large localised dispersive emission of NOx that may result in
fatalities, blasting is not a major contributor to the environmental inventories of this pollutant.
2.3.2. NOx in the environment and mining workplaces: processes and health effects
2.3.2.1 Direct NOx health effects
Accumulation of atmospheric NOx can lead to various environmental and bio-related hazards.
In the context of public health, NOx induces a number of chronic diseases. Low levels can
irritate eyes, nose, throat and lungs, possibly leading to coughing and bleeding, shortness of
breath, tiredness and nausea, and can also result in temporary build-up of lung fluids. Exposure
to high concentration of NOx can cause pulmonary oedema as well as acquired or type II
methemoglobinemia that exhibits symptoms of rapid burning, spasms and swelling of tissues
in the throat and upper respiratory tract, reduced oxygenation of tissues, build-up of lung fluids,
and possibly death.26,89 The current World Health Organisation air quality guidelines for NO2
allow one hour-level safe limit of 200 µg/m3 (1.88 µg/m3 of NO2 = 1 parts per billion), and an
annual average of 40 µg/m3.90 However, typical concentrations of NOx in post-blast clouds

CHAPTER 2 — Atmospheric Emission of NOx from Mining Explosives: A Critical Review
25
can reach between 5.6 to 580 ppm, 12,23,24 exceeding the safe limits by around 30 to 3000 times.
Exposure of humans and wildlife to these high concentrations can lead to injuries24 and
fatalities.91
2.3.2.2 Atmospheric NOx processing and the consequential health impacts
The chemical reactivity of NOx in the presence of other atmospheric substances produces
secondary pollutants. For instance, ground-level ozone, abundant in photochemical smog,
arises as a result of chemical interaction of NOx with reactive hydrocarbons and other volatile
organic compounds (VOC), in a process facilitated by heat and sunlight.74 Likewise, oxidation
of NOx contributes to atmospheric formation of nitrate aerosols, 66,92-95 and notably, the mineral
particles and fugitive dusts synchronously present in post-blast fumes easily facilitate such
reactions. Concerns about effects on human health include damage of lung tissue and
dysfunction of respiratory system, such as emphysema and bronchitis. Furthermore, dissolved
N in the form of nitrate species in groundwater have negative impacts on human health.66,96,97
Short-term exposure to nitrate in drinking water (contaminated by groundwater) at levels above
the health standard of 10 mg/L nitrate-N remains a potential health problem, primarily for
infants and people previously subjected to kidney dialysis treatment. In the human body, NO3–
converts into nitrite, which can cause methemoglobinemia by interfering with the ability of
haemoglobin to take up O2. Most cases of methemoglobinemia occur after consuming water
with high concentrations of NO3–.98 Other health consequences of ingestion of nitrate at
elevated concentrations include respiratory infection, reproductive risks, alteration of thyroid
metabolism, and cancers induced by conversion of NO3– to N nitroso compounds (especially

CHAPTER 2 — Atmospheric Emission of NOx from Mining Explosives: A Critical Review
26
to nitrosamine, under certain conditions of gastric achlorhydria in the oral cavity, bowel or
bladder) in the body.62,99,100
2.3.2.3. Impact to ecosystems
With respect to impact on ecosystems, the wet (e.g., acid rain) and dry deposition of NOx
increase the nitrogen contents in the soil and terrestrial water bodies. This leads to eco-
eutrophication and depletion of aquatic oxygen (hypoxia), as well as to rare anoxic conditions
(anoxic conditions refer to severe hypoxia). Excessive level of these conditions affects marine
life, causes leaf and root damage, and contributes to soil and water acidity.26,49,89 Other
environmental impact of NOx includes stratospheric ozone depletion and corrosive effects of
acid rain on life and property.
.
2.4. Mechanism of NOx formation during the use of AN explosives
Three distinct mechanistic pathways generate NOx during blasting of AN agents in various
mining, civilian and infrastructural activities, as explored in the following sections; i.e.,
stoichiometrically unbalanced blasting, deflagration of AN prills and gassing of emulsion
blends.

CHAPTER 2 — Atmospheric Emission of NOx from Mining Explosives: A Critical Review
27
2.4.1. Stoichiometrically unbalanced blasting
The following general reaction101 balances the chemical species appearing in the blasting
process:
(3x + 1)NH4NO3 + CxH(2x+2) → (3x + 1)N2 + (7x + 3)H2O + xCO2 (2.6)
Equations 2.7 and 2.8 recast Equation 2.6 for the fuel oil and carbon residue, respectively, the
two most common fuels comprised in the emulsion. In general, however, the fuel could be
carbon-based 8,101,102 or nonconventional, depending on fuel availablity.12,103-105
3NH4NO3 + CH2 → 3N2 + CO2 + 7H2O (2.7)
2NH4NO3 + C → 2N2 + CO2 + 4H2O (2.8)
Alterations in bulk material composition, wicking of fuel content (i.e., removal of fuel by
capillary suction of the surrounding rock), as well as intricacies of geological conditions such
as moisture in blast hole (wet blast condition) and the presence of mineral matter prompt the
formation of CO and NO. Manufacturers and end users often employ a characteristic property
called “oxygen balance” (OB) to describe the reaction stoichiometry. The OB value of the
constituent component of an explosive mixture expresses the amount of oxygen, in mass
fraction unit (i.e., g O2/(g compound)), in excess or deficiency with respect to stoichiometry.
It is calculated according to: 106
OB = 16 (O - 2C -
12
H + M)
MW
(2.9)
CHAPTER 2 — Atmospheric Emission of NOx from Mining Explosives: A Critical Review
28
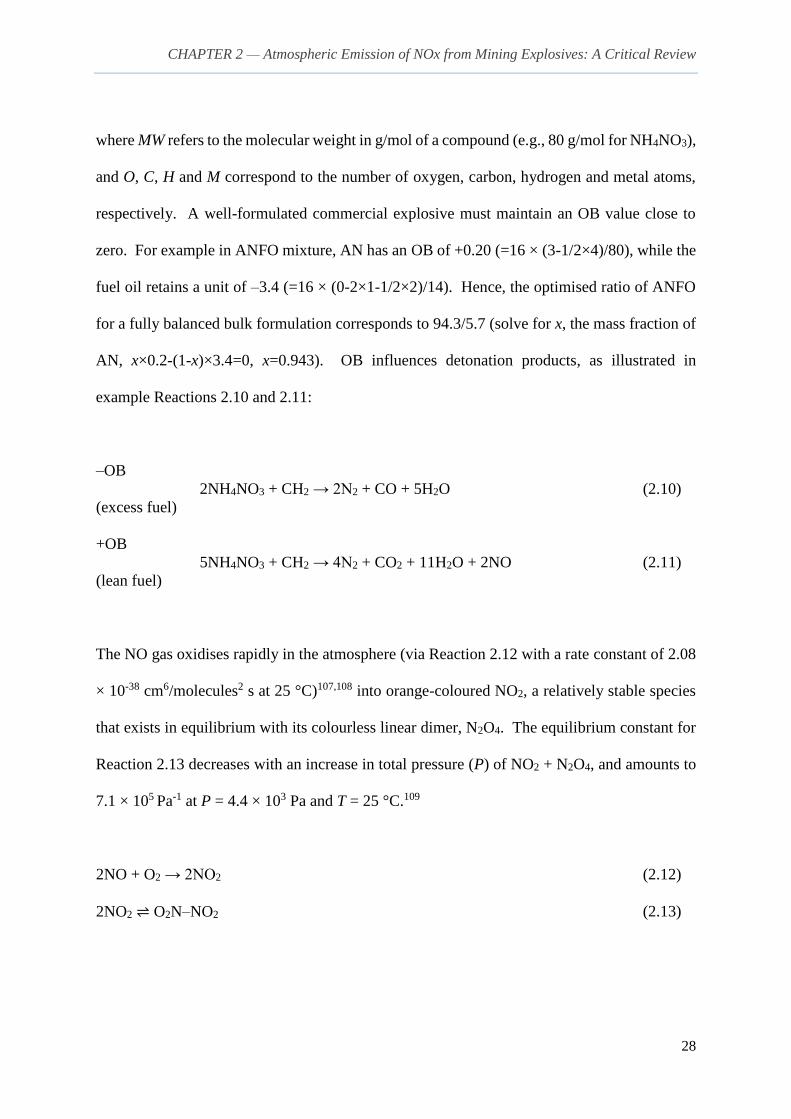
where MW refers to the molecular weight in g/mol of a compound (e.g., 80 g/mol for NH4NO3),
and O, C, H and M correspond to the number of oxygen, carbon, hydrogen and metal atoms,
respectively. A well-formulated commercial explosive must maintain an OB value close to
zero. For example in ANFO mixture, AN has an OB of +0.20 (=16 × (3-1/2×4)/80), while the
fuel oil retains a unit of –3.4 (=16 × (0-2×1-1/2×2)/14). Hence, the optimised ratio of ANFO
for a fully balanced bulk formulation corresponds to 94.3/5.7 (solve for x, the mass fraction of
AN, x×0.2-(1-x)×3.4=0, x=0.943). OB influences detonation products, as illustrated in
example Reactions 2.10 and 2.11:
–OB
(excess fuel)
2NH4NO3 + CH2 → 2N2 + CO + 5H2O (2.10)
+OB
(lean fuel)
5NH4NO3 + CH2 → 4N2 + CO2 + 11H2O + 2NO (2.11)
The NO gas oxidises rapidly in the atmosphere (via Reaction 2.12 with a rate constant of 2.08
× 10-38 cm6/molecules2 s at 25 °C)107,108 into orange-coloured NO2, a relatively stable species
that exists in equilibrium with its colourless linear dimer, N2O4. The equilibrium constant for
Reaction 2.13 decreases with an increase in total pressure (P) of NO2 + N2O4, and amounts to
7.1 × 10⁵ Pa-1 at P = 4.4 × 10³ Pa and T = 25 °C.109
2NO + O2 → 2NO2 (2.12)
2NO2 ⇌ O2N–NO2 (2.13)

CHAPTER 2 — Atmospheric Emission of NOx from Mining Explosives: A Critical Review
29
Figure 2.3 illustrates the effect of OB, fuel content and moisture on NOx formation from typical
ANFO blends. The literature also provides information on the aspect of other parameters such
as degree of confinement and emulsion additives.29,110

CHAPTER 2 — Atmospheric Emission of NOx from Mining Explosives: A Critical Review
30
Figure 2.3. Effect of oxygen balance (a) and percent fuel oil (b) on NOx formation from
different ANFO blends, and the influence of water content (c) on NOx emission from 94/6
ANFO. Digitised data are sourced from Rowland and Mainiero’s study.18 NOx
concentrations are recorded in (L at STP)/(kg bulk explosive).

CHAPTER 2 — Atmospheric Emission of NOx from Mining Explosives: A Critical Review
31
Furthermore, as shown in Figure 2.4a, the interaction of fuel with AN under fuel-lean
conditions leads to NOx species via the nitrous acid, nitro- and nitroso-hydrocarbon
intermediates. According to Oxley and co-workers, the NO2 generated during thermolysis of
AN reacts with the fuel content, producing additional NO.111
Figure 2.4. (a) NOx formation by interactions of fuel content of AN blasting agents during
stoichiometrically unbalanced detonation. Deficiency of fuel results in positive oxygen
balance. (b) Mechanism of NOx formation as a result of N transformation in AN deflagration
during blasting of bulk explosive mixtures. (c) NOx formation during chemical gassing of
emulsion explosives. Boxes denote the reactants and the dash-line circles the NOx products.
“D”, in pane (c), represents diffusion steps across the oil films.
2.4.2. Deflagration of AN prills

CHAPTER 2 — Atmospheric Emission of NOx from Mining Explosives: A Critical Review
32
Deflagration occurs in blasting of AN explosives when the fuel content is insufficient for a
complete chemical reaction, and as a result, the AN prill provides a nitrogen based fuel
source.110 This condition also arises as a consequence of fuel deficiency and/or mixture
inhomogeneity due to inadequate integration of ANFO. Literature comprehensively reviews
the properties of AN, especially those relevant to its use in explosive mixtures.8,9,112,113
Although various mode of decomposition chemistry of AN have been postulated,8,9,114 the
complete mechanism remains poorly understood. The current consensus of opinion explains
the thermal decomposition of solid AN to proceed by two channels in the condensed phase,
ionic and radical. Species that leave the condensed phase participate in further radical reactions
in the gas phases.13
Except for evaporation of water, during heating, AN remains thermally stable until the
temperature reaches the melting point. AN melts at around 169 °C, and then starts
decomposing as the ionic species react with each other.115 This begins by an endothermic
dissociation step (Equation 2.14), followed by decomposition of HNO3 and subsequent
oxidation of NH3 according to Equations 2.15, 2.16 and 2.17, respectively.10,14,15,111,116 A
broader list of reactions and their corresponding rate parameters in the liquid phase have been
provided by Skalis’s et al.,15 though, the decomposition period depends on imposed heating
rates and particle size.
NH4NO3 → NH3 + HNO3 (2.14)
HNO3+ HX → NO2+ + H2O + X-
where HX = NH4+, HNO3, H3O, and others
(2.15)
NH3+ NO2+ → products (N2O, H2O) (2.16)

CHAPTER 2 — Atmospheric Emission of NOx from Mining Explosives: A Critical Review
33
NH3 + X-→ products (NO, NO2, H2O) (2.17)
The gas-phase mechanism becomes noticeable at higher temperatures, when species emanating
from the surface (above the melt front) undergo further radical oxidation and/or decomposition
to form a relatively more stable products. Analysis of the rapid decomposition (at 4800
°C/min) products of AN by in situ Fourier transform infrared (FTIR) spectroscopy identified
HNO3 as an intermediate species and revealed the formation of NO2 alongside N2O and
H2O.117,118 As HNO3 transforms into the gas phase,119 it experiences successive homolysis of
O‒N bond, acting as the chain initiation reaction as shown in Equation 2.18.14,120,121
HNO3 → OH + NO2 (2.18)
The complex gas-phase mechanism propagates via reaction of NH3 with the decomposition
products of HNO3 (from Equation 2.18), involving H and OH as the key chain carriers, whilst
NHx and NOx (x = 1 – 3) serve as the major participants in the redox process.16,18,19,120,122-124
The principal gas products comprise NO, NO2, N2O and H2O. Furthermore, reactions
involving NH3, NO, and water form AN aerosol, as follows:117,125
3NO + 3
2O2 → 3NO2 (2.19)
2NO2 + H2O → HNO2 + HNO3 (2.20)
NH3 + HNO3 → NH4NO3 (2.21)
Skalis et al.’s 15 semi-empirical model combines the condensed- and gas-phase sub-
mechanisms. Predictions from the model concur reasonably well with experimental
measurements.126,127 Kinetic rather than thermodynamic considerations govern the

CHAPTER 2 — Atmospheric Emission of NOx from Mining Explosives: A Critical Review
34
decomposition of AN. This is evident from the results of experiments and the Skalis et al.
model and from the calculations of classical thermodynamics, say, using the Equilib program
in the Chemkin-Pro distribution.128 In general, the formation of NOx during deflagration of
AN prill depends on rates of condensed and gas-phase reactions that reflect the underlying
conditions of temperature, heating rates, and pressure and confinement. Figures 2.4b and 2.5
portray the simplified mechanism of NOx formation at moderate heating conditions and the
effect of heating rate on nitrogen selectivity in the gas-phase product species, respectively.
Figure 2.5. Impact of heating rate on nitrogen selectivity among gas-phase products. The
calculations were done by performing temperature-programmed decomposition of 1 mg AN
(pressure 1 atm, initial temperature 27 °C, bath gas helium, inlet volumetric flow rate 200
standard cm3 min−1). The temperature reached at 50 % AN conversion (T50) is represented by
a supplementary horizontal axis. Reproduced with permission from ref.15 Copyright 2014
Elsevier.

CHAPTER 2 — Atmospheric Emission of NOx from Mining Explosives: A Critical Review
35
2.4.3. Chemical gassing of emulsion blends
Sensitisation of emulsion explosives with chemically-generated nitrogen bubbles (~ 400 μm in
size)129 can also contribute to emission of NOx. A typical AN emulsion explosive involves a
concentrated aqueous phase of oxidiser salts, consisting of droplet 10-20 μm in diameter,
stabilised by an emulsifying agent; comprised in the continuous fuel phase (Table 2.2).8 In
practice, solutions of sodium nitrite (NaNO2) and acid (e.g. acetic; CH3COOH) are injected
into the pumped AN emulsion, during emulsion pumping into a blast hole. Once the bubbles
grow to their desired size and emulsion reaches its target density, setting off a booster induces
a shock wave to propagate through the emulsion column, adiabatically compressing the bubbles
and providing a large number of hot spots to engender the explosion.

CHAPTER 2 — Atmospheric Emission of NOx from Mining Explosives: A Critical Review
36
Table 2.2. Typical composition of AN emulsion explosive. This type of formulations are
usually referred to as water-in-oil (W/O) emulsion.8
Components Percent quantity (%)
Ammonium nitrate 62
Sodium nitrate 6
Sodium perchlorate 5
Calcium nitrate 8
Water 11
Fuel oil (oil phase) 3
Waxes 2
Emulsifier 1.2
Atomised aluminium 0.8
Gassing agent 1.0
Oxygen balance Close to 0.0
As shown in Figure 2.4c, generation of N2 bubbles commences with molecular diffusion of
CH3COOH through the oil interface to droplets containing NO2- anions.130 Protonation of NO2
-
forms nitrous acid:
NO2- + H+ ⇌ HONO (2.22)
The nitrous acid diffuses out of sodium nitrite droplet into the emulsion phase with three
possible fates. It can react with strong nucleophilic species (X-) to from nitrosating agents of
the form ONX,8,131 which reacts with amine substrate, such as thiourea, to produce nitrogen
gas needed for the generation of hot spots. In practice, pH of the aqueous phase (see below) is

CHAPTER 2 — Atmospheric Emission of NOx from Mining Explosives: A Critical Review
37
not high enough to deprotonated NH4+ and release ammonia. This limits the availability of
NH3 as substrate for N2 formation.
HONO + X- + H+ ⇌ ONX + H2O (2.23)
ONX + SC(NH2)2 → N2 + SCN- + X-+ 2H+ + H2O (2.24)
The nitrosating agent (ONX) can also decompose to form nitric oxide. For example, when
thiocyanate functions as a nucleophilic agent, nitrosyl thiocyanate (ONSCN) is formed as the
resulting nitrosating agent. Other types of sulfur-bound amine substrates include aminothiones
and thioacetamide.132,133 The unstable ONSCN decomposes at temperature approaching -60
˚C to form nitric oxide.
HONO + SCN- + H+ ⇌ ONSCN + H2O (2.25)
2ONSCN → 2NO + (SCN)2 (2.26)
In addition, SCN- reacts with ONSCN to form NO according to the following reaction: 134
ONSCN + SCN- → NO + (SCN)2
- (2.27)
Without nucleophilic species, nitrous acid follows the second fate to produce nitrosating agent,
dinitrogen trioxide (N2O3), under relatively mild acidic conditions (pH range ≈ 4-6) as a
product of reaction of nitrous acid with nitrite ion.135 Dinitrogen trioxide represents the
nitrosating agent that operates in practical emulsion explosives.
HONO + NO2- + H+ ⇌ N2O3 + H2O (2.28)

CHAPTER 2 — Atmospheric Emission of NOx from Mining Explosives: A Critical Review
38
The third fate operates at high rate in acidic conditions, at pH of 2 and below, where nitrous
acid decomposes rapidly to form NOx via side Reaction 2.29:
2HONO ⇌ NO + NO2 + H2O (2.29)
As nitrosation (gassing) reactions accelerate at low pH, the dosing systems must include
devices that prevent intentional (but undesirable) addition of extra acid to speed up the gassing
process. Note that, one cannot eliminate completely the formation of NOx from HONO.
Hence, all gassed emulsions always contain a small amount of NOx. Most of that NOx remains
dissolved in the aqueous phase but a fraction may enter the nitrogen bubbles.130,135,136 Figure
2.4c demonstrates the NOx formation mechanism in chemical gassing of emulsion explosives.
2.5. Effective control measures and abatement techniques
2.5.1. Operation guidelines for controlling NOx emission in blasting operations
The Australian State of Queensland’s Guidance Note 2084 provides useful precautionary
measures for preventing, controlling and managing the formation of NOx fumes in open cast
mining. Note 20 comprises standards for manufacturing, storage time-limit, selection of proper
initiating devices, better design of mine shots and confinements, as well as appropriate planning
and personnel training. At present, all major manufacturers of AN explosives offer
formulations that can tolerate wet conditions, usually, with the resistance to these conditions
related to the percent loading of emulsion in prill/emulsion (heavy ANFO) mixes. In practice,

CHAPTER 2 — Atmospheric Emission of NOx from Mining Explosives: A Critical Review
39
selection of appropriate explosive formulation, dewatering of holes prior to loading and
minimising the sleep time prior the detonation displays the largest impact on preventing the
fume formation.84 Moreover, from a managerial perspective, Note 20 recommends
considerations for establishing fume management zones (FMZ) and determination of blast
exclusion zones (BEZ) that account for effects of meteorological (e.g., wind speed and
direction, temperature, humidity, etc.) and geological conditions. FMZ represents an area
likely to contain fumes after blast, requiring workers to remain outside the zone. For industry,
managing exclusion zones adds to the cost of mine operations.
2.5.2. Abatement techniques
The NOx mitigation technologies employed in post combustion plants78,137-140 do not carry over
to blasting activities. This is because: (a) the post-explosion atmospheric air mixture do not
yield itself to capturing, scrubbing, treatment and/or reprocessing; (b) AN exhibits
incompatibilities with materials (Table 2.3)141 that could serve for scavenging NOx. However,
strategic research into NOx abatement led to the development of the following mitigation
technologies:

CHAPTER 2 — Atmospheric Emission of NOx from Mining Explosives: A Critical Review
40
Table 2.3. Selected incompatibility of AN with some chemicals.118
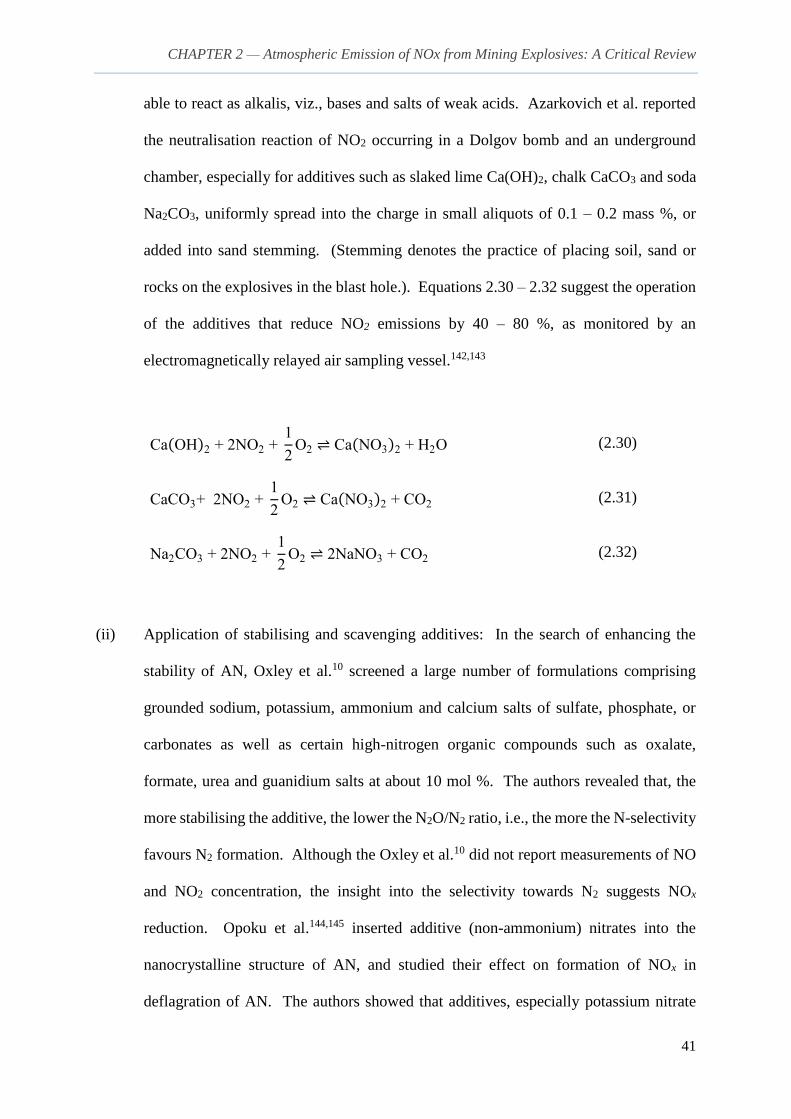
(i) Alkalimetric neutralisation: One of the earliest studies on tackling the formation of
NOx in blasting operation involved the use of neutralising additives. Azarkovich142
proposed the addition of inexpensive substances (to AN explosive charges) that possess
the capacity of binding oxides of nitrogen. The author recommended additives that are
Substances Effects on AN
Powdered metals Most metals react violently or explosively with fused ammonium nitrate
below 200 °C. May also sensitise AN to shock.
Metal oxides Lower the ignition temperature of AN-fuel mixtures.
Metal sulfides Lead to runaway reaction, resulting in detonation at temperature below
40 °C, if the pH is less than 2.
Metal nitrite/nitrate Magnesium nitrate may desensitise AN. Contact of AN with potassium
nitrite causes incandescence.
Urea Dehydrated AN mixtures containing 35 – 39 % urea can produce a residue
capable of deflagration at 240 °C. The recommended processing
temperature for such formulation should not exceed 120 °C.
Ammonia Free ammonia may either stabilise, or tend to destabilise the AN salt
depending on the condition.
Halide salts Promote the thermal decomposition of AN. Lower the initiation
temperature sufficiently to give a violent or explosive decomposition, i.e.,
premature spontaneous ignition.
Acids Mineral acids destabilise. Concentrated acetic acid mixtures ignite on
warming.
Organic fuels Increases the heat of combustion. 2 – 4 % of organic fuel are used in
commercial explosives.
CHAPTER 2 — Atmospheric Emission of NOx from Mining Explosives: A Critical Review
41
able to react as alkalis, viz., bases and salts of weak acids. Azarkovich et al. reported
the neutralisation reaction of NO2 occurring in a Dolgov bomb and an underground
chamber, especially for additives such as slaked lime Ca(OH)2, chalk CaCO3 and soda
Na2CO3, uniformly spread into the charge in small aliquots of 0.1 – 0.2 mass %, or
added into sand stemming. (Stemming denotes the practice of placing soil, sand or
rocks on the explosives in the blast hole.). Equations 2.30 – 2.32 suggest the operation
of the additives that reduce NO2 emissions by 40 – 80 %, as monitored by an
electromagnetically relayed air sampling vessel.142,143
Ca(OH)2 + 2NO2 + 1
2O2 ⇌ Ca(NO3)2 + H2O (2.30)
CaCO3+ 2NO2 + 1
2O2 ⇌ Ca(NO3)2 + CO2 (2.31)
Na2CO3 + 2NO2 + 1
2O2 ⇌ 2NaNO3 + CO2 (2.32)
(ii) Application of stabilising and scavenging additives: In the search of enhancing the
stability of AN, Oxley et al.10 screened a large number of formulations comprising
grounded sodium, potassium, ammonium and calcium salts of sulfate, phosphate, or
carbonates as well as certain high-nitrogen organic compounds such as oxalate,
formate, urea and guanidium salts at about 10 mol %. The authors revealed that, the
more stabilising the additive, the lower the N2O/N2 ratio, i.e., the more the N-selectivity
favours N2 formation. Although the Oxley et al.10 did not report measurements of NO
and NO2 concentration, the insight into the selectivity towards N2 suggests NOx
reduction. Opoku et al.144,145 inserted additive (non-ammonium) nitrates into the
nanocrystalline structure of AN, and studied their effect on formation of NOx in
deflagration of AN. The authors showed that additives, especially potassium nitrate

CHAPTER 2 — Atmospheric Emission of NOx from Mining Explosives: A Critical Review
42
that forms 5 mol % K in the co-recrystallised AN salt, achieve up to 40 % reduction in
NO emission.
(iii) Reburning-like technique: In boilers, reburning abates NOx by using a supplementary
fuel to reduce NOx,146 to achieve an overall decrease in NOx emission of about 50 – 85
%. Reburning constitutes a three-stage process. In the first stage (primary zone), the
main fuel burns under slightly fuel-lean condition. The produced NOx then reacts with
supplementary hydrocarbon radicals in the “reburning zone” to form intermediate
nitrogenous species, and then molecular nitrogen (N2). Finally, addition of air in the
last stage (burnout zone) completes the combustion process by oxidising all unreacted
fuels and N-species.78,147 These interactions involve several elementary steps
summarised in the following overall equation:147
∑ CiHj + NO → HCN +... (2.33)
In excess NOx, the HCN decays through series of intermediates, and ultimately reaches
N2 via the reverse Zeldovich reaction (Equation 2.37):
HCN + O → NCO + H (2.34)
NCO + H → NH + CO (2.35)
NH + H → N + H2 (2.36)
N + NO → N2+ O (2.37)
Many practitioners had applied reburning-like technology to reduce NOx emission in
blasting of AN explosives adding supplementary fuel (usually solid) of higher oxidation

CHAPTER 2 — Atmospheric Emission of NOx from Mining Explosives: A Critical Review
43
stability compared to fuel oil used in AN explosives. As seen in Figure 2.6, the fuel
with lower oxidation stability (fuel oil) participates solely in primary detonation
reaction, with the resulting NOx species subsequently reduced to nitrogen. However,
the excess fuel conditions, if they arise in the reburning of detonation-generated NOx,
may lead to formation of CO, as shown in Equation 2.10.
Figure 2.6. Conceptual schematic of the application of reburning-like method
during blasting. The arrows indicate the direction of oxidation. Atmospheric O2
completes the process by oxidising all unreacted fuels.
Sapko and co-workers25 demonstrated that the use of pulverised coal dust (mean
particle size of 74 μm) as an additive mitigates the total NOx emission by 10 – 50 %.
Likewise, biomass briquette and advanced reburning materials such as urea147 offer
better NOx-mitigation performance.10,25 Other potential fuel additives may include non-
hazardous waste polymers, such as polyethylene.148

CHAPTER 2 — Atmospheric Emission of NOx from Mining Explosives: A Critical Review
44
(iv) Chemical trapping: Spin traps can provide an effective reduction of in the overall
release of nitric oxide in sensitisation (chemical gassing) of emulsion explosives. Spin
trapping reaction remove radical species, such as NO, by forming stable adducts.
Venpin et al. exploited the spin-trapping technique to develop NO scavengers to control
NOx emission from industrial processes, including sensitisation of emulsion
explosives.149-151 In their experiments, they applied aromatic ortho substituted nitroso
compounds, such as nitrosobenzene sulfonate (NBS), 3,5-dibromo-4-nitrosobenzene
sulfonate (DBNBS), 3,5-dimethyl-4-nitrosobenzene sulfonate (DMNBS) and 3,5-
dichloro-4-nitrosobenzene sulfonate, obtaining up to 70 % removal efficiency of NO
during sensitisation of AN emulsion blends. The reaction pathways leading to the
formation of N2 are shown in Equation 2.38 – 2.40:149
(2.38)
(2.39)
(2.40)
(v) Use of alternative oxidising agents: Even though the AN technologies have been
established for applications in civilian explosives, there exist at least one non-nitrogen

CHAPTER 2 — Atmospheric Emission of NOx from Mining Explosives: A Critical Review
45
based formulation. Araos and Onederra152 replaced AN with oxygenated water
(hydrogen peroxide, H2O2, OW) and used micro balloons, rather than chemical gassing,
to avoid NOx formation both in detonation and in emulsion sensitisation. Such OW/fuel
blends detonate with similar heat release and VOD to AN explosives, 152-154 but without
NOx hazards. The technology requires further testing to verify its large-scale
performance.
Some noteworthy patents include formulating the blasting agent to contain from about 1 % to
about 20 % silicon powder,155 or appreciable amount of urea in the discontinuous oxidiser salt
phase,156,157 improved composition of hydrogen peroxide based explosives,158 application of
other nitrogen-free oxidisers,159 and appropriate gassing method.160
2.6. Perspectives and future outlooks
We have identified the possibility of the formation of secondary pollutants (nitrate aerosols) as
a result of atmospheric nitration of the mineral particles and fugitive dusts synchronously
present in post-blast fumes. Development of new sampling methodologies should include the
environmental monitoring of such species from blasting activities. Lightweight remote-
controlled drone-sampling instrumentation, as well as surface sampling, could facilitate the
measurements of nitrate aerosols, as well as other pollutants including supplementary Nr
species (e.g. HNO3, NH3, and N2O), hydrocarbons, nitrogenated analogues161 of dioxins and
secondary contaminants such as peroxyacyl nitrates (PAN)162. Understanding the mechanism
of the formation and the survival of these pollutants in detonation of heavy AN explosives is
crucial to achieve sustainable mining activities, as are further testing of OW emulsions and

CHAPTER 2 — Atmospheric Emission of NOx from Mining Explosives: A Critical Review
46
bulking agents, and generating new knowledge on the exact mechanism of deflagration that
involves the surface burning of AN particles.
2.7. References
1. Kubota, N., Propellants and Explosives: Thermochemical Aspects of Combustion.
Wiley-VCH: Weinheim, 2002.
2. Agrawal, J. P., High Energy Materials: Propellants, Explosives and Pyrotechnics.
Wiley-VCH: Weinheim, 2010.
3. Klapotke, T. M., High Energy Density Materials. Springer Verlag: 2007.
4. Fordham, S., High Explosives and Propellants. 1st ed.; Pergamon Press: Oxford, New
York, 1966.
5. Akhavan, J., The Chemistry of Explosives. Royal Society of Chemistry: 2011.
6. Francois, C.; Doyle, A.; Jackson, O.; Wilson, N., Materials Handbook, a Concise
Desktop Reference. Springer, Berlin: 2000.
7. Badgujar, D.; Talawar, M.; Asthana, S.; Mahulikar, P., Advances in science and
technology of modern energetic materials: an overview. J. Hazard. Mater. 2008, 151, (2), 289-
305.
8. Mahadevan, E. G., Ammonium Nitrate Explosives for Civil Applications: Slurries,
Emulsions and Ammonium Nitrate Fuel Oils. Wiley-VCH: Weinheim, 2013.
9. Oommen, C.; Jain, S. R., Ammonium nitrate: a promising rocket propellant oxidizer. J.
Hazard. Mater. 1999, 67, (3), 253-281.
10. Oxley, J. C.; Smith, J. L.; Rogers, E.; Yu, M., Ammonium nitrate: thermal stability and
explosivity modifiers. Thermochim. Acta 2002, 384, (1–2), 23-45.

CHAPTER 2 — Atmospheric Emission of NOx from Mining Explosives: A Critical Review
47
11. Sudweeks, W. B., Physical and chemical properties of industrial slurry explosives. Ind.
Eng. Chem. Prod. Res. Dev. 1985, 24, (3), 432-436.
12. Attalla, M. I.; Day, S. J.; Lange, T.; Lilley, W.; Morgan, S., NOx emissions from
blasting operations in open-cut coal mining. Atmos. Environ. 2008, 42, (34), 7874-7883.
13. Beckstead, M. W.; Puduppakkam, K.; Thakre, P.; Yang, V., Modeling of combustion
and ignition of solid-propellant ingredients. Prog. Energy Combust. Sci. 2007, 33, (6), 497-
551.
14. Izato, Y.-i.; Miyake, A., Thermal decomposition mechanism of ammonium nitrate and
potassium chloride mixtures. J. Therm. Anal. Calorim. 2015, 121, (1), 287-294.
15. Skarlis, S. A.; Nicolle, A.; Berthout, D.; Dujardin, C.; Granger, P., Combined
experimental and kinetic modeling approaches of ammonium nitrate thermal decomposition.
Thermochim. Acta 2014, 584, 58-66.
16. Mendiara, T.; Glarborg, P., Ammonia chemistry in oxy-fuel combustion of methane.
Combust. Flame 2009, 156, (10), 1937-1949.
17. Lucassen, A.; Labbe, N.; Westmoreland, P. R.; Kohse-Höinghaus, K., Combustion
chemistry and fuel-nitrogen conversion in a laminar premixed flame of morpholine as a model
biofuel. Combust. Flame 2011, 158, (9), 1647-1666.
18. Ermolin, N. E., Modeling of Pyrolysis of Ammonium Dinitramide Sublimation
Products under Low‐Pressure Conditions. Combust. Explos. Shock Waves 2004, 40, (1), 92-
109.
19. Park, J.; Gates, S.; Lin, M., Photolytically and thermally initiated reactions of NH3 with
NOx (X= 1, 2). Combust. Sci. Technol. 2010, 182, (4-6), 365-379.
20. Musin, R. N.; Lin, M. C., Novel bimolecular reactions between NH3 and HNO3 in the
gas phase. J. Phys. Chem. A 1998, 102, (10), 1808-1814.

CHAPTER 2 — Atmospheric Emission of NOx from Mining Explosives: A Critical Review
48
21. Xu, Z.-X.; Wang, Q.; Fu, X.-Q., Thermal stability and mechanism of decomposition of
emulsion explosives in the presence of pyrite. J. Hazard. Mater. 2015, 300, 702-710.
22. Priyananda, P.; Djerdjev, A. M.; Gore, J.; Neto, C.; Beattie, J. K.; Hawkett, B. S.,
Premature detonation of an NH4NO3 emulsion in reactive ground. J. Hazard. Mater. 2015, 283,
314-320.
23. Attalla, M.; Day, S. J.; Lange, T.; Lilley, W.; Morgan, S., NOx Emissions from Blasting
in Open Cut Coal Mining in the Hunter Valley. CSIRO Energy Technology: 2007.
24. McCray, R. B. Utilization of a Small Unmanned Aircraft System for Direct Sampling
of Nitrogen Oxides Produced by Full-Scale Surface Mine Blasting. Master of Engineering
Thesis, University of Kentucky, 2016.
25. Sapko, M.; Rowland, J.; Mainiero, R.; Zlochower, I., Chemical and physical factors
that influence NOx production during blasting - Exploratory study. Proceedings of the Twenty-
Eighth Annual Conference on Explosives and Blasting Technique, Vol II 2002, 317-330.
26. Weng, Z.; Mudd, G. M.; Martin, T.; Boyle, C. A., Pollutant loads from coal mining in
Australia: Discerning trends from the National Pollutant Inventory (NPI). Environ. Sci. Policy
2012, 19–20, (0), 78-89.
27. DEE, National Pollutant Inventory, Emission Estimation Technique Manual for
Explosives Detonation and Firing Ranges. 3.1 ed.; Department of Environment and Energy,
Australia: 2016.
28. Rowland, J.; Mainiero, R., Factors affecting ANFO fumes production. Proceedings of
the Annual Conference on Explosives and Blasting Technique 2000, 1, 163-174.
29. Rowland, J.; Mainiero, R.; Hurd, D., Factors affecting fumes production of an emulsion
and ANFO/emulsion blends. Proceedings of the Annual Conference on Explosives and
Blasting Technique 2001, 2, 133-142.

CHAPTER 2 — Atmospheric Emission of NOx from Mining Explosives: A Critical Review
49
30. Bian, Z.; Inyang, H. I.; Daniels, J. L.; Otto, F.; Struthers, S., Environmental issues from
coal mining and their solutions. Min. Sci. Technol. (China) 2010, 20, (2), 215-223.
31. English, L. M.; Luo, Y. Mountaintop Mining/Valleyfill Technical Studies - Study of
Fugitive Dust and Fumes; OSM Blasting Reports; U.S. Office of Surface Mining and
Reclamation: 2001
32. Kissell, F. N., Handbook for Dust Control in Mining. US Department of Health and
Human Services, Public Health Service, Centers for Disease Control and Prevention, National
Institute for Occupational Safety and Health, Pittsburgh Research Laboratory: 2003.
33. Petavratzi, E.; Kingman, S.; Lowndes, I., Particulates from mining operations: a review
of sources, effects and regulations. Miner. Eng. 2005, 18, (12), 1183-1199.
34. Abdul-Karim, N.; Blackman, C. S.; Gill, P. P.; Wingstedt, E. M. M.; Reif, B. A. P.,
Post-blast explosive residue - a review of formation and dispersion theories and experimental
research. RSC Advances 2014, 4, (97), 54354-54371.
35. Donoghue, A., Occupational health hazards in mining: an overview. Occup. Med. 2004,
54, (5), 283-289.
36. Gautam, S.; Prusty, B. K.; Patra, A. K., Pollution due to particulate matter from mining
activities. Health (N. Y.) 2012, 4, 5.
37. Anderson, J. O.; Thundiyil, J. G.; Stolbach, A., Clearing the air: a review of the effects
of particulate matter air pollution on human health. J. Med. Toxicol. 2012, 8, (2), 166-175.
38. Aneja, V. P.; Isherwood, A.; Morgan, P., Characterization of particulate matter (PM
10) related to surface coal mining operations in Appalachia. Atmos. Environ. 2012, 54, 496-
501.
39. Csavina, J.; Field, J.; Taylor, M. P.; Gao, S.; Landázuri, A.; Betterton, E. A.; Sáez, A.
E., A review on the importance of metals and metalloids in atmospheric dust and aerosol from
mining operations. Sci. Total Environ. 2012, 433, 58-73.

CHAPTER 2 — Atmospheric Emission of NOx from Mining Explosives: A Critical Review
50
40. Huertas, J. I.; Huertas, M. E.; Izquierdo, S.; González, E. D., Air quality impact
assessment of multiple open pit coal mines in northern Colombia. J. Environ. Manage. 2012,
93, (1), 121-129.
41. Huertas, J. I.; Huertas, M. E.; Solís, D. A., Characterization of airborne particles in an
open pit mining region. Sci. Total Environ. 2012, 423, 39-46.
42. Abdollahisharif, J.; Bakhtavar, E.; Nourizadeh, H., Green biocompatible approach to
reduce the toxic gases and dust caused by the blasting in surface mining. Environ. Earth Sci.
2016, 75, (3), 1-12.
43. Harris, M. L.; Mainiero, R. J., Monitoring and removal of CO in blasting operations.
Saf. Sci. 2008, 46, (10), 1393-1405.
44. Day, S. J.; Carras, J. N.; Fry, R.; Williams, D. J., Greenhouse gas emissions from
Australian open-cut coal mines: Contribution from spontaneous combustion and low-
temperature oxidation. Environ. Monit. Assess. 2010, 166, (1-4), 529-541.
45. Mainiero, R.; Harris, M.; Rowland, J., Dangers of Toxic Fumes from Blasting.
Proceedings Of The Annual Conference On Explosives And Blasting Technique 2007, 33, (1),
73.
46. Lashgari, A.; Johnson, C.; Kecojevic, V.; Lusk, B.; Hoffman, J., NOx emission of
equipment and blasting agents in surface coal mining. Mining Eng. 2013, 65, (10).
47. Jain, R. K.; Cui, Z.; Domen, J. K., Environmental Impact of Mining and Mineral
Processing: Management, Monitoring, and Auditing Strategies. Butterworth-Heinemann:
Boston, 2015; p 1-307.
48. Darcovich, K.; Jonasson, K.; Capes, C., Developments in the control of fine particulate
air emissions. Adv. Powder Technol. 1997, 8, (3), 179-215.
49. Guidebook for Evaluating Mining Project EIAs. Environmental Law Alliance
Worldwide Eugene, Oregon, 2010.

CHAPTER 2 — Atmospheric Emission of NOx from Mining Explosives: A Critical Review
51
50. Arpacıoğlu, C.; Er, C. In Estimation of fugitive dust impacts of open-pit mines on local
air quality-a case study: Bellavista gold mine, Costa Rica, 18th International Mining Congress
and Exhibition of Turkey-IMCET; 2003.
51. Jain, R.; Urban, L.; Balbach, H.; Webb, M. D., Handbook of Environmental
Engineering Assessment: Strategy, Planning, and Management. Butterworth-Heinemann:
2012.
52. Maupin, M. A.; Kenny, J. F.; Hutson, S. S.; Lovelace, J. K.; Barber, N. L.; Linsey, K.
S. Estimated Use of Water in the United States in 2010; 2330-5703; US Geological Survey:
2014.
53. Jennings, S. R.; Blicker, P. S.; Neuman, D. R., Acid Mine Drainage and Effects on Fish
Health and Ecology: A Review. Reclamation Research Group: Bozeman, MT, 2008.
54. Ambrožič, T.; Turk, G., Prediction of subsidence due to underground mining by
artificial neural networks. Comput. Geosci. 2003, 29, (5), 627-637.
55. Ge, L.; Chang, H.-C.; Rizos, C., Mine subsidence monitoring using multi-source
satellite SAR images. Photogramm. Eng. Remote Sens. 2007, 73, (3), 259-266.
56. Reddish, D.; Whittaker, B., Subsidence: Occurrence, Prediction and Control. Elsevier:
2012; Vol. 56.
57. Wuana, R. A.; Okieimen, F. E., Heavy metals in contaminated soils: a review of
sources, chemistry, risks and best available strategies for remediation. ISRN Ecology 2011,
2011.
58. Li, Z.; Ma, Z.; van der Kuijp, T. J.; Yuan, Z.; Huang, L., A review of soil heavy metal
pollution from mines in China: pollution and health risk assessment. Sci. Total Environ. 2014,
468–469, 843-853.
59. Turcotte, R.; Lightfoot, P. D.; Fouchard, R.; Jones, D. E. G., Thermal hazard assessment
of AN and AN-based explosives. J. Hazard. Mater. 2003, 101, (1), 1-27.

CHAPTER 2 — Atmospheric Emission of NOx from Mining Explosives: A Critical Review
52
60. Barber, J. R.; Crooks, K. R.; Fristrup, K. M., The costs of chronic noise exposure for
terrestrial organisms. Trends Ecol. Evol. 2010, 25, (3), 180-189.
61. Vasović, D.; Kostić, S.; Ravilić, M.; Trajković, S., Environmental impact of blasting at
Drenovac limestone quarry (Serbia). Environ. Earth Sci. 2014, 72, (10), 3915-3928.
62. Galloway, J. N.; Aber, J. D.; Erisman, J. W.; Seitzinger, S. P.; Howarth, R. W.;
Cowling, E. B.; Cosby, B. J., The nitrogen cascade. Bioscience 2003, 53, (4), 341-356.
63. Galloway, J. N.; Dentener, F. J.; Capone, D. G.; Boyer, E. W.; Howarth, R. W.;
Seitzinger, S. P.; Asner, G. P.; Cleveland, C.; Green, P.; Holland, E., Nitrogen cycles: past,
present, and future. Biogeochemistry 2004, 70, (2), 153-226.
64. Dentener, F.; Stevenson, D.; Ellingsen, K.; van Noije, T.; Schultz, M.; Amann, M.;
Atherton, C.; Bell, N.; Bergmann, D.; Bey, I.; Bouwman, L.; Butler, T.; Cofala, J.; Collins, B.;
Drevet, J.; Doherty, R.; Eickhout, B.; Eskes, H.; Fiore, A.; Gauss, M.; Hauglustaine, D.;
Horowitz, L.; Isaksen, I. S. A.; Josse, B.; Lawrence, M.; Krol, M.; Lamarque, J. F.; Montanaro,
V.; Müller, J. F.; Peuch, V. H.; Pitari, G.; Pyle, J.; Rast, S.; Rodriguez, J.; Sanderson, M.;
Savage, N. H.; Shindell, D.; Strahan, S.; Szopa, S.; Sudo, K.; Van Dingenen, R.; Wild, O.;
Zeng, G., The global atmospheric environment for the next generation. Environ. Sci. Technol.
2006, 40, (11), 3586-3594.
65. Davidson, E. A.; Kingerlee, W., A global inventory of nitric oxide emissions from soils.
Nutri. Cycl. Agroecosyst. 1997, 48, (1-2), 37-50.
66. Stocker, T. F.; Qin, D.; Plattner, G.-K.; Tignor, M.; Allen, S. K.; Boschung, J.; Nauels,
A.; Xia, Y.; Bex, V.; Midgley, P. M. Climate Change 2013: The Physical Science Basis;
International Panel on Climate Change (IPCC): Cambridge University Press Cambridge, UK,
and New York, 2014.
67. Seinfeld, J. H.; Pandis, S. N., Atmospheric Chemistry and Physics: from Air Pollution
to Climate Change. John Wiley & Sons: 2006.

CHAPTER 2 — Atmospheric Emission of NOx from Mining Explosives: A Critical Review
53
68. Nelson, P. Coal Nitrogen & NOx; ACARP Report: 2006.
69. Vuuren, D. P. v.; Bouwman, L. F.; Smith, S. J.; Dentener, F., Global projections for
anthropogenic reactive nitrogen emissions to the atmosphere: an assessment of scenarios in the
scientific literature. Curr. Opin. Environ. Sustainability 2011, 3, (5), 359-369.
70. Leppalahti, J.; Koljonen, T., Nitrogen Evolution from Coal, Peat and Wood during
Gasification - Literature-Review. Fuel Process. Technol. 1995, 43, (1), 1-45.
71. Thomas, K. M., The release of nitrogen oxides during char combustion. Fuel 1997, 76,
(6), 457-473.
72. Zeldovich, Y. B., The oxidation of nitrogen in combustion and explosions. Acta
Physicochem USSR 1946, 21, 577- 628.
73. Glarborg, P.; Jensen, A. D.; Johnsson, J. E., Fuel nitrogen conversion in solid fuel fired
systems. Prog. Energy Combust. Sci. 2003, 29, (2), 89-113.
74. Baird, C.; Cann, M., Environmental Chemistry. W. H. Freeman: 2008.
75. Gil, S., Fuel-N Conversion to NO, N2O and N2 During Coal Combustion. Intech: 2012.
76. Miller, J. A.; Bowman, C. T., Mechanism and modeling of nitrogen chemistry in
combustion. Prog. Energy Combust. Sci. 1989, 15, (4), 287-338.
77. Goel, S. K.; Morihara, A.; Tullin, C. J.; Sarofim, A. F., Effect of NO and O2
concentration on N2O formation during coal combustion in a fluidized-bed combustor:
modeling results. Symp. (Int.) Combust. 1994, 25, (1), 1051-1059.
78. Hill, S. C.; Smoot, L. D., Modeling of nitrogen oxides formation and destruction in
combustion systems. Prog. Energy Combust. Sci. 2000, 26, (4-6), 417-458.
79. Shimizu, T.; Sazawa, Y.; Adschiri, T.; Furusawa, T., Conversion of char-bound
nitrogen to nitric oxide during combustion. Fuel 1992, 71, (4), 361-365.
80. Wanxing, W.; Thomas, K. M., The release of nitrogen species from carbons during
gasification: models for coal char gasification. Fuel 1992, 71, (8), 871-877.

CHAPTER 2 — Atmospheric Emission of NOx from Mining Explosives: A Critical Review
54
81. Kohse-Höinghaus, K.; Oßwald, P.; Cool, T. A.; Kasper, T.; Hansen, N.; Qi, F.;
Westbrook, C. K.; Westmoreland, P. R., Biofuel combustion chemistry: from ethanol to
biodiesel. Angew. Chem. Int. Ed. 2010, 49, (21), 3572-3597.
82. Ren, Q.; Zhao, C., NOx and N2O precursors from biomass pyrolysis: nitrogen
transformation from amino acid. Environ. Sci. Technol. 2012, 46, (7), 4236-4240.
83. Ren, Q.; Zhao, C., Evolution of fuel-N in gas phase during biomass pyrolysis. Renew.
Sustainable Energy Rev. 2015, 50, 408-418.
84. Queensland Guidance Note 20; Management of Oxides of Nitrogen in Open Cut
Blasting In DEEDI, Ed. The State of Queensland: Qeensland, 2011.
85. AEISG, Code of Practice: Prevention and Management of Blast Generated NOx Gases
in Surface Blasting, Ed 2. In Australian Explosives Industry And Safety Group Inc.: New South
Wales, 2011.
86. OECD, Sulphur oxides (SOx) and nitrogen oxides (NOx) emissions. In Environment at
a Glance 2015: OECD Indicators, Organization for Economic Cooperation and Development
Publishing: Paris, 2015.
87. Ammonium Nitrate (AN): 2014 World Market Outlook and Forecast up to 2018.
Abstract available at:. https://mcgroup.co.uk/researches/ammonia-nitrate
88. Chemical Economics Handbook: Ammonium Nitrate. Abstract available at:.
https://www.ihs.com/products/ammonium-nitrate-chemical-economics-handbook.html
89. EPA, Nitrogen Oxide (NOx), Why and How They are Controlled (EPA 456/F-99-006R).
Clean Air Technology Center, United States Environmental Protection Agency: North
Carolina, 1999.
90. WHO, Air Quality Guidelines: Global Update 2005: Particulate Matter, Ozone,
Nitrogen dioxide, and Sulfur dioxide. World Health Organization: 2006.

CHAPTER 2 — Atmospheric Emission of NOx from Mining Explosives: A Critical Review
55
91. Madden, V., Prevention and Management of Blast Fumes; Explosives Safety Alert No.
44. Department of Natural Resources and Mines. The State of Queensland: Queensland, 2011.
92. Orel, A. E.; Seinfeld, J. H., Nitrate formation in atmospheric aerosols. Environ. Sci.
Technol. 1977, 11, (10), 1000-1007.
93. Gibson, E. R.; Hudson, P. K.; Grassian, V. H., Physicochemical properties of nitrate
aerosols: implications for the atmosphere. J. Phys. Chem. A 2006, 110, (42), 11785-11799.
94. Rubasinghege, G.; Grassian, V. H., Photochemistry of adsorbed nitrate on aluminum
oxide particle surfaces. J. Phys. Chem. A 2009, 113, (27), 7818-7825.
95. Bauer, S.; Koch, D.; Unger, N.; Metzger, S.; Shindell, D.; Streets, D., Nitrate aerosols
today and in 2030: a global simulation including aerosols and tropospheric ozone. Atmos.
Chem. Phys. 2007, 7, (19), 5043-5059.
96. Moorcroft, M. J.; Davis, J.; Compton, R. G., Detection and determination of nitrate and
nitrite: a review. Talanta 2001, 54, (5), 785-803.
97. Fan, A. M.; Steinberg, V. E., Health implications of nitrate and nitrite in drinking water:
an update on methemoglobinemia occurrence and reproductive and developmental toxicity.
Regul. Toxicol. Pharm. 1996, 23, (1), 35-43.
98. Follett, J. R.; Follett, R. F., Chapter 4 - Utilization and Metabolism of Nitrogen by
Humans. In Nitrogen in the Environment: Sources, Problems and Management, Elsevier
Science: Amsterdam, 2001; pp 65-92.
99. Galloway, J. N.; Townsend, A. R.; Erisman, J. W.; Bekunda, M.; Cai, Z.; Freney, J. R.;
Martinelli, L. A.; Seitzinger, S. P.; Sutton, M. A., Transformation of the nitrogen cycle: recent
trends, questions, and potential solutions. Science 2008, 320, (5878), 889-892.
100. Morales-Suarez-Varela, M. M.; Llopis-Gonzalez, A.; Tejerizo-Perez, M. L., Impact of
nitrates in drinking water on cancer mortality in Valencia, Spain. Eur. J. Epidemiol. 1995, 11,
(1), 15-21.

CHAPTER 2 — Atmospheric Emission of NOx from Mining Explosives: A Critical Review
56
101. Cook, M. A.; Talbot, E. L., Explosive sensitivity of ammonium nitrate-hydrocarbon
Mixtures. Ind. Eng. Chem. 1951, 43, (5), 1098-1102.
102. Nazarian, A.; Presser, C., Thermal signature measurements for ammonium nitrate/fuel
mixtures by laser heating. Thermochim. Acta 2016, 623, 120-135.
103. Resende, S. A.; Lima, H. M. d., Study of non-conventional fuels for explosives mixes.
Rem: Revista Escola de Minas 2014, 67, (3), 297-302.
104. Hurley, C.; Petr, V.; Liu, S.; Banker, J., Properties of alternatively fueled ammonium
nitrate explosives. Rock Fragmentation by Blasting - Proceedings of the 9th International
Symposium on Rock Fragmentation by Blasting, FRAGBLAST 9 2010, 135-139.
105. Meyers, S.; Shanley, E. S., Industrial explosives-a brief history of their development
and use. J. Hazard. Mater. 1990, 23, (2), 183-201.
106. Cooper, P. W., Explosives Engineering. Wiley-Vch 1996.
107. Mainiero, R.; Rowland, J.; Harris, M.; Sapko, M., Behavior of nitrogen oxides in the
product gases from explosive detonations. Proceedings of the Annual Conference on
Explosives And Blasting Technique 2006, 32, (2), 93.
108. Baulch, D. L., Evaluated Kinetic Data for High Temperature Reactions: Homogeneous
Gas Phase Reactions of the H2-N2-O2 System. CRC Press: 1972.
109. Hall, T. C.; Blacet, F. E., Separation of the absorption spectra of NO2 and N2O4 in the
range of 2400–5000A. J. Chem. Phys. 1952, 20, (11), 1745-1749.
110. Onederra, I.; Bailey, V.; Cavanough, G.; Torrance, A., Understanding main causes of
nitrogen oxide fumes in surface blasting. Min. Technol. 2012, 121, (3), 151-159.
111. Oxley, J. C.; Kaushik, S. M.; Gilson, N. S., Thermal decomposition of ammonium
nitrate-based composites. Thermochim. Acta 1989, 153, 269-286.
112. Chaturvedi, S.; Dave, P. N., Review on thermal decomposition of ammonium nitrate.
J. Energ. Mater. 2013, 31, (1), 1-26.

CHAPTER 2 — Atmospheric Emission of NOx from Mining Explosives: A Critical Review
57
113. Buczkowski, D., Explosive properties of mixtures of ammonium nitrate(V) and
materials of plant origin – danger of unintended explosion. Cent. Eur. J. Energ. Mater. 2014,
11, (1), 115 - 127.
114. Kołaczkowski, A. Spontaneous decomposition of ammonium nitrate. Scientific papers
Institute of Inorganic Technology and Mineral Fertilizers, Wrocław Technical University,
1980.
115. Chowdhury, A.; Thynell, S. T., Kinetics of decomposition of energetic ionic liquids.
Propellants Explos. Pyrotech. 2010, 35, (6), 572-581.
116. Rosser, W. A., The kinetics of decomposition of liquid ammonium nitrate. J. Phys.
Chem. (1952) 1963, 67, (9), 1753-1757.
117. Patil, D. G.; Jain, S. R.; Brill, T. B., Thermal decomposition of energetic materials 56.
On the fast thermolysis mechanism of ammonium nitrate and its mixtures with mangnesium
and carbon. Propellants Explos. Pyrotech. 1992, 17, (3), 99-105.
118. Russell, T. P.; Brill, T. B., Thermal-decomposition of energetic materials .31. fast
thermolysis of ammonium-nitrate, ethylenediammonium dinitrate and hydrazinium nitrate and
the relationship to the burning Rate. Combust. Flame 1989, 76, (3-4), 393-401.
119. Chaiken, R., A thermal layer mechanism of combustion of solid composite propellants:
Application to ammonium nitrate propellants. Combust. Flame 1959, 3, 285-300.
120. Park, J.; Lin, M., Thermal decomposition of gaseous ammonium nitrate at low pressure:
kinetic modeling of product formation and heterogeneous decomposition of nitric acid. J. Phys.
Chem. A 2009, 113, (48), 13556-13561.
121. Lurie, B.; Lianshen, C., Kinetics and mechanism of thermal decomposition of
ammonium nitrate powder under the action of carbon black. Combust. Explos. Shock Waves
2000, 36, (5), 607-617.

CHAPTER 2 — Atmospheric Emission of NOx from Mining Explosives: A Critical Review
58
122. Glarborg, P.; Dam‐Johansen, K.; Miller, J. A., The reaction of ammonia with nitrogen
dioxide in a flow reactor: Implications for the NH2+ NO2 reaction. Int. J. Chem. Kinet. 1995,
27, (12), 1207-1220.
123. Glarborg, P.; Dam‐Johansen, K.; Miller, J. A.; Kee, R. J.; Coltrin, M. E., Modeling the
thermal DENOx process in flow reactors. Surface effects and nitrous oxide formation. Int. J.
Chem. Kinet. 1994, 26, (4), 421-436.
124. Bedford, G.; Thomas, J., Reaction between ammonia and nitrogen dioxide. J. Chem.
Soc. Faraday Trans. 1, 1972, 68, 2163-2170.
125. Rossi, M. J.; Bottaro, J. C.; McMillen, D. F., The thermal decomposition of the new
energetic material ammoniumdinitramide (NH4N(NO2)2) in relation to nitramide (NH2NO2)
and NH4NO3. Int. J. Chem. Kinet. 1993, 25, (7), 549-570.
126. Vyazovkin, S.; Clawson, J. S.; Wight, C. A., Thermal dissociation kinetics of solid and
liquid ammonium nitrate. Chem. Mater. 2001, 13, (3), 960-966.
127. Brill, T. B.; Brush, P. J.; Patil, D. G., Thermal decomposition of energetic materials .58.
chemistry of ammonium-nitrate and ammonium dinitramide near the burning surface-
temperature. Combust. Flame 1993, 92, (1-2), 178-186.
128. R.D. CHEMKIN-PRO, 15131; Reaction Design: San Diego, CA, 2013.
129. Turner, D.; Dlugogorski, B.; Palmer, T., Factors affecting the stability of foamed
concentrated emulsions. Colloids Surf. Physicochem. Eng. Aspects 1999, 150, (1–3), 171-184.
130. da Silva, G.; Dlugogorski, B. Z.; Kennedy, E. M., Water-in-oil emulsion foaming by
thiourea nitrosation: Reaction and mass transfer. AlChE J. 2006, 52, (4), 1558-1565.
131. Silva, G. d.; Kennedy, E. M.; Dlugogorski, B. Z., Nucleophilic catalysis of nitrosation:
relationship between nitrosating agent equilibrium constant and catalyst nucleophilicity. J.
Chem. Res. 2002, 2002, (12), 589-590.

CHAPTER 2 — Atmospheric Emission of NOx from Mining Explosives: A Critical Review
59
132. Dorado, J. B.; Dlugogorski, B. Z.; Kennedy, E. M.; Mackie, J. C.; Gore, J.; Altarawneh,
M., S-Nitrosation of aminothiones. J. Org. Chem. 2015, 80, (14), 6951-6958.
133. Dorado, J. B.; Dlugogorski, B. Z.; Kennedy, E. M.; Mackie, J. C.; Gore, J.; Altarawneh,
M., Decomposition of S-nitroso species. RSC Advances 2015, 5, (38), 29914-29923.
134. Rayson, M. S.; Mackie, J. C.; Kennedy, E. M.; Dlugogorski, B. Z., Experimental study
of decomposition of aqueous nitrosyl thiocyanate. Inorg. Chem. 2011, 50, (16), 7440-7452.
135. Silva, G. D.; Dlugogorski, B. Z.; Kennedy, E. M., Elementary reaction step model of
the N-nitrosation of ammonia. Int. J. Chem. Kinet. 2007, 39, (12), 645-656.
136. da Silva, G.; Dlugogorski, B. Z.; Kennedy, E. M., An experimental and theoretical
study of the nitrosation of ammonia and thiourea. Chem. Eng. Sci. 2006, 61, (10), 3186-3197.
137. Dvořák, R.; Chlápek, P.; Jecha, D.; Puchýř, R.; Stehlík, P., New approach to common
removal of dioxins and NOx as a contribution to environmental protection. J. Clean. Prod.
2010, 18, (9), 881-888.
138. Gómez-García, M. A.; Pitchon, V.; Kiennemann, A., Pollution by nitrogen oxides: an
approach to NOx abatement by using sorbing catalytic materials. Environ. Int. 2005, 31, (3),
445-467.
139. Skalska, K.; Miller, J. S.; Ledakowicz, S., Trends in NOx abatement: a review. Sci.
Total Environ. 2010, 408, (19), 3976-3989.
140. Baukal, C. E.; Schwartz, R.; John Zink Company., The John Zink Combustion
Handbook. CRC Press: Boca Raton, Fla; London, 2001.
141. Bretherick, L.; Urben, P.; Pitt, M. J.; Battle, L., Bretherick’s Handbook of Reactive
Chemical Hazards, Vol. 1. Butterworth-Heinemann: 1999.
142. Azarkovich, A. E., Possibility of minimizing generation of nitrogen oxides in blasting
of ammonium nitrate explosives. J. Min. Sci. 1995, 31, (2), 147-151.

CHAPTER 2 — Atmospheric Emission of NOx from Mining Explosives: A Critical Review
60
143. Ishibe, T.; Sato, T.; Hayashi, T.; Kato, N.; Hata, T., Absorption of nitrogen dioxide and
nitric oxide by soda lime. Br. J. Anaesth. 1995, 75, (3), 330-333.
144. Opoku, M. K.; Dlugogorski, B. Z., Preparation and characterisation of potassium
ammonium nitrates (Kx(NH4)1-xNO3). In 9th International Symposium on Hazards,
Prevention, and Mitigation of Industrial Explosions, Cracow, Poland.
145. Opoku, M. K.; Dlugogorski, B. Z.; Kennedy, E. M.; Mackie, J. C., The Effect of
Additive on NOx Emission During Thermal Decomposition of Nano-Recrystallised Nitrate
Salts. In Advances in Materials Science for Environmental and Energy Technologies III, John
Wiley & Sons, Inc.: 2014; pp 307-319.
146. Wendt, J. O. L.; Sternling, C. V.; Matovich, M. A., Reduction of sulfur trioxide and
nitrogen oxides by secondary fuel injection. Symp. (Int.) Combust. 1973, 14, (1), 897-904.
147. Smoot, L. D.; Hill, S. C.; Xu, H., NOx control through reburning. Prog. Energy
Combust. Sci. 1998, 24, (5), 385-408.
148. Oluwoye, I.; Altarawneh, M.; Gore, J.; Bockhorn, H.; Dlugogorski, B. Z., Oxidation of
polyethylene under corrosive NOx atmosphere. J. Phys. Chem. C 2016, 120, (7), 3766-3775.
149. Venpin, W. K. P. F.; Kennedy, E. M.; Mackie, J. C.; Dlugogorski, B. Z., Mechanistic
study of trapping of NO by 3,5-dibromo-4-nitrosobenzene sulfonate. Ind. Eng. Chem. Res.
2012, 51, (44), 14325-14336.
150. Venpin, W. K. P. F.; Kennedy, E. M.; Mackie, J. C.; Dlugogorski, B. Z., Comparative
study of the physicochemical properties of ortho-substituted aromatic nitroso compounds. J.
Chem. Eng. Data 2013, 58, (4), 1005-1010.
151. Venpin, W. K. P. F.; Kennedy, E. M.; Mackie, J. C.; Dlugogorski, B. Z., Trapping of
nitric oxide, generated during sensitization of ammonium nitrate emulsion explosive, by
aromatic nitroso sulfonates. Ind. Eng. Chem. Res. 2013, 52, (31), 10561-10568.
CHAPTER 2 — Atmospheric Emission of NOx from Mining Explosives: A Critical Review
61
152. Araos, M.; Onederra, I., Development of a novel mining explosive formulation to
eliminate nitrogen oxide fumes. Min. Technol. 2015, 124, (1), 16-23.
153. Armstrong, M. R.; Zaug, J. M.; Goldman, N.; Kuo, I.-F. W.; Crowhurst, J. C.; Howard,
W. M.; Carter, J. A.; Kashgarian, M.; Chesser, J. M.; Barbee, T. W., Ultrafast shock initiation
of exothermic chemistry in hydrogen peroxide. J. Phys. Chem. A 2013, 117, (49), 13051-13058.
154. Sheffield, S. A.; Dattelbaum, D. M.; Stahl, D. B.; Gibson, L. L.; Bartram, B. D.;
Engelke, R., Shock initiation and detonation study on high concentration H2O2/H2O solutions
using in-situ magnetic gauging. In 14th International Detonation Symposium Meeting, Coeur
d'alene, ID, Aprill 11-16, 2010.
155. Granholm, R. H. Blasting method for reducing nitrogen oxide fumes. U.S. Patent
6,539,870 B1. April 1, 2003.
156. Granholm, R. H.; Lawrence, L. D. Method of reducing nitrogen oxide fumes in blasting.
U.S. Patent 5608185 A. March 4, 1997.
157. Forshey D; C, M. Urea-modified ammonium nitrate-fuel oil explosives. U.S. Patent
3708356 A. January 2, 1973.
158. ARAOS, M. Ιmproved explosive composition. WO2013013272 A1. January 31, 2013.
159. Day, J. T. Methods of blasting using nitrogen-free explosives. U.S. Patent US5920030
A. July 6, 1999.
160. Dlugogorski, B. Z.; Kennedy, E. M.; Rayson, M. S.; Da, S. G. Methods for gassing
explosives especially at low temperatures. EP2125675 A1. December 2, 2009.
161. Altarawneh, M.; Dlugogorski, B. Z., Formation and chlorination of carbazole,
phenoxazine, and phenazine. Environ. Sci. Technol. 2015, 49, (4), 2215-2221.
162. Alvarado, M.; Logan, J.; Mao, J.; Apel, E.; Riemer, D.; Blake, D.; Cohen, R.; Min, K.-
E.; Perring, A.; Browne, E., Nitrogen oxides and PAN in plumes from boreal fires during

CHAPTER 2 — Atmospheric Emission of NOx from Mining Explosives: A Critical Review
62
ARCTAS-B and their impact on ozone: an integrated analysis of aircraft and satellite
observations. Atmos. Chem. Phys. 2010, 10, (20), 9739-9760.

CHAPTER 3 — Methodology
63
CHAPTER 3
Methodology
This chapter presents an overview of the main experimental and
computational techniques employed within the scope of this study. Details
of specific computational settings and experimental conditions are provided
in subsequent chapters.
…

CHAPTER 3 — Methodology
64
3.1. Computational Techniques
Computational ab initio methods have been used in this dissertation to study all necessary
reaction steps. Ab initio (Latin for “from the beginning”) represents computation practices
derived directly from theoretical principles without the inclusion of experimental data. This
remains an approximate quantum mechanical calculation, reflecting only mathematical
approximations, such as using a simpler functional form for a function or finding an
approximate solution to a differential equation.1 The ab initio techniques solve the Schrödinger
equation to predict the energy and optimum conformational structure of a molecule. Equation
3.1 depicts the Schrodinger equation, where Ψ represents the wavefunction, and m, h, and V
denote the mass of particle, Planck’s constant and the potential energy, respectively.1-3
{-h2
8π2m∇2+V} Ψ(r, t )=
i h
2π ∂Ψ(r ,t)
∂t (3.1)
The accuracy of the final molecular energy relies on the level of assumptions made, as well as
the precision of the numerical simulation – generally termed as “theory”. This work applies
the density functional theory (DFT) within the framework of two selected model chemistries
as enumerated below:
i. Three-dimensional slab model enabled the investigation of solid-gas interaction of
polyethylene with oxidising species, such as atmospheric oxygen and NOx gases.
DMol3 package4, 5 supported this kind of theoretical simulations, assisting all structural
optimisations, and serving to calculate all energies and vibrational frequencies. In the
optimisation of all stationary points, the theoretical approach comprised the generalised

CHAPTER 3 — Methodology
65
gradient approximation (GGA) as the exchange-correlation potential alongside with the
Perdew-Burke-Ernzerhof (PBE) functional. The total energy converged with a
tolerance of 1 × 10⁻⁶ Ha. The electronic core treatment included all electrons in the
calculations while deploying a double numerical plus polarisation (DNP) basis set4, and
a global cut-off of 4.0 Å. The applied Brillouin zone involved automatic generation of
2×3×6 and 1×2×1 k-points for the unit cell and periodic slabs, respectively, through the
Monkhorst-Pack grid scheme. The average computational cost, for each periodic slab
typically amounts to 20 h on a 32 parallel processing cores. Where necessary,
Tkatchenko and Scheffler’s semiemperical dispersion correction scheme6 offered the
necessary measures to validate the compromise between the cost of evaluation of the
dispersion terms and the need to improve non-bonding interactions in our system.
ii. Gas-phase reaction modelling allowed the development of theoretical insight into the
formation of initial nitration products during thermal reaction of biomass surrogate
(morpholine) with NOx. Gaussian09 suite of programs7 implemented the complete-
basis-set CBS-QB38 composite method to facilitate all structural optimisations, and
served to calculate all enthalpies as well as vibrational frequencies using the tight
convergence criteria and rigid-rotor/harmonic-oscillator approximations. In agreement
with previous studies9, 10, the adopted computational method offered an accurate
evaluation of thermochemical properties of all species studied herein.
Furthermore, each chapter involving ab initio calculations contains a detailed description of the
specific computational procedures.

CHAPTER 3 — Methodology
66
3.2. Experimental Configurations
The experimental work of this thesis essentially investigates the conversion of NOx with
polyethylene (PE, selected solid fuel), and morpholine as the chosen biomass surrogate. The
following text describes the experimental rigs. Subsequent chapters elaborate the details of the
applied methodologies.
3.2.1. Experiments involving thermal reaction of recycled polyethylene with NOx
i. Characterisation techniques:
Fourier transform infrared (FTIR) spectroscopy: This method elucidated the major
functional groups present in the polymer samples, using the Agilent Cary 670
equipped with the attenuated total reflectance (ATR, germanium crystal, Pike
Technologies) accessory. Prior to analyses, samples were cryogenically pulverised
to achieve reproducible measurements. The FTIR recorded the spectra at 4 cm-1
resolution, with accumulation of 32 scans per spectrum. The bands at 2916 cm-1,
2848 cm-1, 1470 cm-1 and 718 cm-1 correspond to CH2 asymmetric stretch, CH2
symmetric stretch, CH2 scissors and CH2 rock modes, respectively.
Carbon-hydrogen-nitrogen-sulfur (CHNS) analysis: CHNS elemental analyser
(Australia National University, Australia) provided a means for rapid determination
of carbon, hydrogen, nitrogen and sulfur in the organic polymer matrices.
Pulverised samples were fed into the pre-calibrated instrument (EuroVector
EA3000) under dry helium and O2 purge, and the combustion furnace operated at

CHAPTER 3 — Methodology
67
approximately 1100 °C. The reactor functioned in a dynamic flash combustion
mode, and contained both the oxidation zone represented by tungsten oxide and
copper wired reduction zone. Two repeated runs resulted in precise measurements
of the constituent elements.
Ion chromatography: This method determined the trace concentration of halogens
in polymers. Dissolved samples were injected into a DX-120 anion chromatograph.
Inductively coupled plasma emission spectroscopy (ICP-OES): Varian 715-ES ICP
OES (University of Newcastle, Australia) served to measure the metal
concentration in the sample. About 140 mg of the recycled PE were digested in
microwave, and then transferred via Varian SPS 3 sample preparation system for
analyses. High-purity ICP multi-element standard solution containing different
metal cations in 2.0 % HNO3 facilitated the necessary calibration.
High temperature size exclusion chromatography (HT-SEC) in TCB: The HT-SEC
(Université Claude Bernard Lyon 1, France) analyses operated on Viscotek system
(from Malvern Instruments) equipped with three columns (Polefin 300 mm × 8 mm
I. D. from Polymer Standards Service, porosity of 1000 Å, 100 000 Å and 1 000
000 Å). Sample solutions 200 µL in volume, with a concentration of 5 mg/mL,
were eluted in 1,2,4-trichlorobenzene (1,2,4 TCB) with a flow rate of 1 mL/min at
150 °C. The mobile phase was stabilised with 2,6-di(tert-butyl)-4-methylphenol
(200 mg/L). Online detection was performed with a differential refractive index
detector and a dual light scattering detector (LALS and RALS) for absolute molar

CHAPTER 3 — Methodology
68
mass measurement. The OmniSEC 5.02 software facilitated the calculation of the
SEC parameters.
ii. Parametric and Temperature Profile of Experimental Setups
This aspect of the laboratory work involved three series of experiments. As shown in
Figure 3.1, a standalone thermogravimetry apparatus (TGA)11-13 has been employed
with the intention of eliminating any unwanted experimental artefacts that could be
carried over into the subsequent kinetic evaluations. Furthermore, hyphenated infrared
spectroscopy (TGA-FTIR, PerkinElmer Frontier) and chemiluminescence (TGA-NOx,
Thermo Scientific model 42i-HL) enabled the identification and quantitation of
evolved gases.

CHAPTER 3 — Methodology
69
Figure 3.1. Schematic diagrams of adopted experimental configurations for the TGA-FTIR-
NOx analyses.
The reference standards for the mass and temperature calibration were selected
according to the desired experimental range. Table 3.1 lists the measured values as
compared to the expected quantities. The table also provides the calculated percent

CHAPTER 3 — Methodology
70
error. During the entire duration of the study, replicate runs randomly carried out on
different days quantified for the instrumental drift and reproducibility of experimental
data.
Table 3.1. Verification of the Instrument’s (TGA-DSC) measured values
Weight (mg)
Expected Measured1 Measured2 Percent error
Certified mass 54.37 54.59 54.36 7.36 × 10⁻³
Temperature3 (C)
Expected Measured1 Measured2 Percent error
Indium 156.60 156.21 156.45 9.58 × 10⁻²
Zinc 419.47 417.12 419.20 6.44 × 10⁻²
Aluminium 660.10 662.67 660.30 3.03 × 10⁻²
Heat flow4 (J/g)
Expected Measured1 Measured2 Percent error
Zinc 108.37 115.70 110.20 0.17 × 10⁻¹
Aluminium 400.10 410.02 400.80 1.74 × 10⁻¹
1 Measured values before calibration.
2 Measured values after calibration.
3 Onset melting temperatures.
4 Enthalpy of fusion (∆Hf).

CHAPTER 3 — Methodology
71
3.2.2. Experiments involving thermal reaction of morpholine with NOx
This section of exploration involved a flow-through tubular reactor typically employed in
similar studies.14-18 Figure 3.2 provides a schematic representation of the experimental setup
in which a digital syringe pump delivered the reactant fuel (morpholine; TCI, purity > 99.0 %)
into the preheated dilute stream of helium/NOx/oxygen flowing through the system. The
concentration of morpholine in the diluted stream corresponded to 1000 ppm. An electrically
heated three-zone horizontal split furnace accommodated the quartz reactor tube, and ensured
a well-defined isothermal regime. The use of helium (99.999 %) as primary dilution gas
facilitated better conductive heat transfer in the reaction zone, and also allowed quantitative
measurement of N2. The stream concentrations, stoichiometric conditions, and other
parametric details are provided in the subsequent relevant chapters.
Figure 3.2. Schematic representation of experiment rig for the study of the reaction of
biomass surrogate with NOx.

CHAPTER 3 — Methodology
72
As illustrated in Figure 3.2, product analyses involved three parallel stages. Firstly, FTIR
spectroscopy (Perkin Elmer) facilitated online monitoring of product species exiting the tubular
reactor. The setup incorporated an electrically heated transfer line (3.175 mm ID × 300 mm)
linking the reactor to a small volume (100 mL) 2.4 m path-length online gas sampling cell
(Pike) placed inside the FTIR compartment. The spectrometer averaged 64 accumulated scans
per spectrum at 1 cm-1 resolution. Both the sample line and the sampling cell operated at 140
C, to avoid the condensation of product volatiles prior and during the analysis. Furthermore,
the chemiluminescence NOx analyser (Thermo Scientific model 42i-HL) monitored the
concentration of NO and NO2. Finally, the use of μGC (Agilent 490 micro-gas
chromatography, 20 m MolSieve-5A column, heated injection) assisted N2 quantitation. The
train of three impingers consisting of glass units filled with standardised 0.1 M H2SO4, 1 M
NaOH, and orange silica gel removed any contaminant species, e.g. ammonia and H2O that
could damage the GC column.
3.3. Data Analyses
Unless otherwise stated, Microsoft excel and Origin program served as the main numerical
analysis tools for data presented in this thesis. The results from analytical instruments were
processed in the respective software provided by the vendors. Regarding the FTIR spectra,
QASoft database enabled the semi-quantitation of product species by their characteristic IR
bands. Further details are provided in the subsequent chapters.

CHAPTER 3 — Methodology
73
3.4. References
1. Young, D., Computational Chemistry: A Practical Guide for Applying Techniques to
Real World Problems. John Wiley & Sons: 2004.
2. Cramer, C. J., Essentials of Computational Chemistry: Theories and Models. John
Wiley & Sons: 2013.
3. Jensen, F., Introduction to Computational Chemistry. John Wiley & Sons: 2013.
4. Delley, B., An all‐electron numerical method for solving the local density functional
for polyatomic molecules. J. Chem. Phys. 1990, 92, (1), 508-517.
5. Delley, B., From molecules to solids with the DMol3 approach. J. Chem. Phys. 2000,
113, (18), 7756-7764.
6. Tkatchenko, A.; Scheffler, M., Accurate molecular van der waals interactions from
ground-state electron density and free-atom reference data. Phys. Rev. Lett. 2009, 102, (7),
073005.
7. Frisch, M.; Trucks, G.; Schlegel, H. B.; Scuseria, G.; Robb, M.; Cheeseman, J.;
Scalmani, G.; Barone, V.; Mennucci, B.; Petersson, G. e., Gaussian 09. In Gaussian, Inc.
Wallingford, CT: 2009.
8. Montgomery Jr, J. A.; Frisch, M. J.; Ochterski, J. W.; Petersson, G. A., A complete
basis set model chemistry. VI. Use of density functional geometries and frequencies. J. Chem.
Phys. 1999, 110, (6), 2822-2827.
9. Lucassen, A.; Labbe, N.; Westmoreland, P. R.; Kohse-Höinghaus, K., Combustion
chemistry and fuel-nitrogen conversion in a laminar premixed flame of morpholine as a model
biofuel. Combust. Flame 2011, 158, (9), 1647-1666.

CHAPTER 3 — Methodology
74
10. Li, S.; Davidson, D. F.; Hanson, R. K.; Labbe, N. J.; Westmoreland, P. R.; Oßwald, P.;
Kohse-Höinghaus, K., Shock tube measurements and model development for morpholine
pyrolysis and oxidation at high pressures. Combust. Flame 2013, 160, (9), 1559-1571.
11. Brown, M. E., Introduction to Thermal Analysis: Techniques and Applications.
Springer Netherlands: 2001.
12. Haines, P. J., Principles of Thermal Analysis and Calorimetry. Royal Society of
Chemistry: 2002.
13. Höhne, G.; Hemminger, W.; Flammersheim, H. J., Differential Scanning Calorimetry.
Springer: 2003.
14. Bromly, J. H.; Barnes, F. J.; Mandyczewsky, R.; Edwards, T. J.; Haynes, B. S., An
experimental investigation of the mutually sensitised oxidation of nitric oxide and n-butane.
Symposium (International) on Combustion 1992, 24, (1), 899-907.
15. Bromly, J. H.; Barnes, F. J.; Muris, S.; You, X.; Haynes, B. S., Kinetic and
thermodynamic sensitivity analysis of the NO-sensitised oxidation of methane. Combust. Sci.
Technol. 1996, 115, (4-6), 259-296.
16. Bromly, J. H.; Barnes, F. J.; Nelson, P. F.; Haynes, B. S., Kinetics and modeling of the
H2-O2-NOx system. Int. J. Chem. Kinet. 1995, 27, (12), 1165-1178.
17. Glarborg, P.; Kubel, D.; Kristensen, P. G.; Hansen, J.; Dam-Johansen, K., Interactions
of CO, NOx and H2O Under Post-Flame Conditions. Combust. Sci. Technol. 1995, 110-111,
(1), 461-485.
18. Nelson, P. F.; Haynes, B. S., Hydrocarbon-NOx interactions at low temperatures—
1.Conversion of NO to NO2 promoted by propane and the formation of HNCO. Symposium
(International) on Combustion 1994, 25, (1), 1003-1010.

75
CHAPTER 4
Paper II: Oxidation of Crystalline Polyethylene
Oluwoye, I.; Altarawneh, M.; Gore, J.; Dlugogorski, B. Z., Oxidation of crystalline
polyethylene. Combust. Flame 2015, 162, (10), 3681-3690.
γ- path; formation of
aldehyde and oxetane
α- path; formation of
ketone
β- path; formation of
epoxide
Intermolecular path;
formation of alkoxy
and alkyl hydroxide
This chapter develops a systematic approach of investigating polymer-gas
reactions. The interaction of O2 with crystalline polyethylene have been
studied, with appropriate comparison to analogous reactions in gas medium.
This allows adequate investigation of the intended NOx-polymer reaction later
presented in Chapter 5 of this thesis
…

CHAPTER 4 — Oxidation of Crystalline Polyethylene
76
1
4.0. Abstract
Auto-oxidation of polyethylene (PE) is of a common occurrence and could be triggered by
several physical and chemical factors. In this study, for the first time, we report a
comprehensive theoretical account on the initial oxidation of crystalline PE at low temperatures
prior to its melting. We map out potential energy surfaces for large number of reactions, most
notably, initial abstraction by O2 molecules, formation of peroxy- and hydroperoxyl adducts,
unimolecular eliminations of HO2 and H2O as well as C-C bond fissions. Rate constants have
been estimated for all considered reactions over the temperature range of 300 – 800 K. We
have discussed noticeable similarities between the oxidation of PE and that of gas-phase
alkanes. Results presented herein provide new insights into the solid-state oxidation of PE and
germane crystalline polyolefins/paraffins and pure carbon-hydrogen-type polymers.

CHAPTER 4 — Oxidation of Crystalline Polyethylene
77
4.1. Introduction
Polyethylene (PE) holds wide range of applications in the society. As a nontoxic low-priced
polymer, PE resins have emerged as an important raw material for various industrial uses,
frequently deployed, in substantial amount, in medical, automobile, food, pipeline, civil, and
domestic sectors.1, 2 The key to the adaptability of PE lies in its adjustable semicrystalline
morphology, giving rise to its existence in various forms. Major types of PE include high
density polyethylene (HDPE), low density polyethylene (LDPE), linear low density
polyethylene (LLDPE), and ethylene-vinyl acetate copolymer (EVA).1, 3 Due to their elevated
calorific value and suitable combustion properties,1, 4, 5 used PE finds outlets in an extensive
array of recycling processes, such as thermal energy recovery via incineration technologies,
thermolytic conversion into liquid fuels6-9 and even pyrolytic conversion to low-carbon
hydrocarbon gases for application in hybrid rocket propulsion systems.10, 11 Practical
applications of thermal degradation of solid fuels often occur in oxidative environment,12 thus,
it is important to understand the thermo-oxidative degradation mechanism of PE.
The thermal decomposition of PE arises by homolysis of C–C bond, unzipping, in successive
enchained β-scission reactions, yielding monomer from the polymer. The decomposition then
proceeds by free radical mechanism involving multistep chain reactions. This consists of
consecutive H-abstraction and β C‒C scission, intramolecular hydrogen transfer (backbiting)
and intermolecular hydrogen shift (random scission). At high temperature under pyrolytic
conditions, PE undergoes both backbiting and random scission pathways.6, 13-16 The overall
relatively high activation energy for the inert decomposition of PE (150 – 260 kJ/mol) is linked
to a limiting step characterised by the initial random scission.6, 12, 17-20

CHAPTER 4 — Oxidation of Crystalline Polyethylene
78
In presence of oxygen, the reactions proceed differently with lower activation energy of around
80 – 143 kJ/mol.11, 12, 20, 21 Experiments on oxidation of low density PE and related polymers
usually involve irradiation at low temperature (photo-oxidative accelerated weathering) or a
temperature controlled air-circulated operation at moderate temperature of between 373 to 428
K (i.e., thermal ageing).21-24 Reactors and/or thermogravimetric analysers serve to perform
high temperature oxidation experiments above 473 K (thermo-oxidative degradation).12, 20
Different pathways exist for the oxidation mechanism of PE.21, 22, 25-30 In the most general
form, thermo-oxidative degradation begins by formation of radical sites initiated by induced
temperature, but UV radiation as well as existence of trace peroxides and hydroperoxides also
influence the initiation of photo-oxidative pathways. Oxygen reacts with the chain radical to
form a peroxy-radical intermediate during the propagation step:
Initiation: RH → R˙ + H˙ (a)
Propagation: R˙ + O2 → ROO˙ (b)
The peroxy radical abstracts hydrogen to form hydroperoxide and a radical centre. The former
yields an alkoxyl radical via a unimolecular or bimolecular decomposition mechanism. An
alkoxyl radical can effectively abstract a hydrogen to form a hydroxyl group. Intermolecular
and intramolecular H-abstractions lead to formation of new radical sites, thereby accelerating
the oxidative degradation.
ROO˙ + RH → ROOH + R˙ (c)
ROOH → RO˙ + OH (d)
ROOH + RH → RO˙ + R˙ + HOH (e)

CHAPTER 4 — Oxidation of Crystalline Polyethylene
79
RH + RO˙ → ROH + R˙ (f)
Amorphous zone of PE has more access to oxygen compared to the densely packed crystalline
regions. The amorphous zone oxidises first and then acts as a buffer, protecting the crystalline
region from attack during thermal degradation. Therefore, increasing the crystallinity lowers
the oxidation rate and increases the sensitivity of mechanical properties of PE towards
oxidation.31, 32
While oxidative decomposition of PE mainly occurs in liquid media upon melting, auto-
oxidation of solid PE at relatively low temperatures is a common phenomenon that could be
triggered by many physical or chemical factors. These factors encompass presence of
structural defects in PE, ultraviolet and ionising radiation, prompt heating, ultrasound, or direct
exposure to catalysis, singlet molecular or atomic oxygen and ozone.33
To this end, the present study deploys the density functional theory (DFT) to investigate initial
steps encountered in the oxidation of crystalline PE. We analyse the reaction mechanisms
pertinent to thermo-oxidative degradation of PE, and evaluate and compare the kinetic and
thermochemical parameters with limited experimental measurements from the literature.
Results presented herein provide improved insights into the solid-state oxidation of crystalline
polyolefins/paraffins and carbon-hydrogen-type polymers. Such knowledge is instrumental to
understand the auto-oxidation process of crystalline PE that underpins its natural ageing
mechanism under thermo- and photo-oxidative conditions.
CHAPTER 4 — Oxidation of Crystalline Polyethylene
80
4.2. Methodology
4.2.1. Computational details
DMol3 package34, 35 facilitates all structural optimisations, and serves to calculate all energies
and vibrational frequencies. In the optimisation of all stationary points, our theoretical
approach comprises the generalised gradient approximation (GGA) as the exchange-
correlation potential alongside with the Perdew-Burke-Ernzerhof (PBE) functional. The total
energy converges with a tolerance of 1 × 10⁻⁶ Ha. The electronic core treatment includes all
electrons in the calculations while deploying a double numerical plus polarisation (DNP) basis
set,34 and a global cut-off of 4.0 Å. Based on the subsequent thorough benchmarking against
analogous experimental and theoretical values from the literature, we have found that, the
adopted DFT functional and basis set offer a satisfying accuracy threshold for the system at
hand. We carry out integration of the Brillouin zone via automatic generation of 2×3×6 and
1×2×1 k-points for the unit cell and periodic slabs, respectively, through the Monkhorst-Pack
grid scheme. The average computational cost, for each periodic slab typically amounts to 20
h on a 32 parallel processing cores. Last of all, Tkatchenko and Scheffler’s semiemperical
dispersion correction scheme36 offers the necessary measures to validate the compromise
between the cost of evaluation of the dispersion terms and the need to improve non-bonding
interactions in our system.

CHAPTER 4 — Oxidation of Crystalline Polyethylene
81
4.2.2. Molecular and crystallographic structural parameters of polyethylene
Crystalline PE exhibits an orthorhombic crystal structure under all but the most exceptional
circumstances. Its unit cell contains all crystallographic data needed for a complete crystallite.1,
37 We generated the reference unit cell structure by optimising the orthorhombic crystalline
arrangement reported by Avitabile et al.38 The primitive cell exhibits a Pnam space group 39,
40 that consists of twelve atoms, equivalent to two -CH2- chains as shown in Figure 4.1.
Figure 4.1. Unit cell of ideal orthorhombic polyethylene; plan (left) and isometric (right)
views.
Tables 4.1 and 4.2 report optimised structural parameters, i.e., lattice constants a, b, and c, and
the fractional atomic coordinates for the optimised PE unit cell. Our calculated lattice
parameters are within the slightly scattered experimental measurements37, 38 and computed
values41, 42 available in literature. Note a negligible difference in the fractional atomic
coordinates, if compared with the analogous experimental values.38, 43, 44 Although, dispersion-
correction approach reduces the lattice constants somewhat closer to experimental values, it
also increases the computation time by approximately 20 %. As dispersion corrections display
importance in the modelling of some, but not all, physical systems.45 For the present

CHAPTER 4 — Oxidation of Crystalline Polyethylene
82
calculations, the application of the dispersion correction does not change the chemical
interpretations of the results.46 Therefore, our chemical reaction modelling excludes the
dispersion correction.
Table 4.1. Optimised geometrical parameter of crystalline polyethylene unit cell without (1)
and with (2) dispersion correction as compared to experimental values. Unit conversion: 1 Å
equals 0.1 nm.
Parameters Computational results Experimental measurements
This work LDA
41
GGA
41
GGA
42
Neutron
scattering
(4 K) 38
Neutron
scattering
(90 K) 38
X-ray
diffraction
37 (1) (2)
Lattice
constants
(Å)
a 7.803 7.211 6.549 7.304 8.28 7.121 7.161 7.400
b 5.251 4.776 4.446 5.017 5.64 4.851 4.866 4.930
c 2.566 2.555 2.515 2.565 2.57 2.548 2.546 2.543
Bond
length (Å)
C-C 1.532 1.526 1.5 1.53 1.523 1.578 1.574 1.530
C-H 1.104 1.101 1.12 1.11 1.110 1.100 1.070 -
Bond
angle (°)
C-C-C 113.8 113.6 113.5 113.5 113.0 107.7 108.1 112.0
H-C-H 105.9 105.9 105.4 106.1 105.8 109.0 110.0 -

CHAPTER 4 — Oxidation of Crystalline Polyethylene
83
Table 4.2. Calculated fractional coordinates of atoms in the unit cell of orthorhombic PE. ψ1
= 0.0399761, ψ2 = 0.0531014, ψ3 = 0.1788820, ψ4 = 0.0127033, ψ5 = 0.0279984, ψ6 =
0.2627310.
Atoms Fractional coordinates
C ± (ψ1, ψ2, 1
4)
H ± (ψ3, ψ4, 1
4)
H ± (ψ5, ψ6, 1
4)
C ± (1
2 – ψ1,
1
2 + ψ2, −
1
4)
H ± (1
2 – ψ3,
1
2 + ψ4, −
1
4)
H ± (1
2 – ψ5,
1
2 + ψ6, −
1
4)
4.2.3. Reaction modelling
A vacuum slab parallel to a plane defined by Miller index of (100) is constructed from the
optimised unit cell to represent a PE(100) surface. Figure 4.2 depicts optimised geometry of
the PE(100) surface. The vacuum slab has four repeated periodic layers. In all structural
optimisations, we relax fully the two top layers and molecules, while the two bottom layers
remain fixed at their corresponding bulk positions. A vacuum thickness of at least 10.0 Å (1
nm) separates each slab from its corresponding repeated images along the z axis. This
eliminates the interactions within the periodic images of the slab. A dipole correction, applied
along the direction perpendicular to the surface, minimises any surface deformation owing to
the dipole accumulation along the z direction.

CHAPTER 4 — Oxidation of Crystalline Polyethylene
84
Figure 4.2. Vacuum slab of crystalline PE(100). Unit conversion: 1 Å equals 0.1 nm.
Search for transition states deploys the complete linear synchronous and quadratic synchronous
transit approaches (LST/QST), as implemented in DMol3. Reaction rate constants are fitted to
the Arrhenius equation (i.e., k(T) = A exp(-Ea/RT)) in the temperature range of 298.15 – 800 K,
according to the classical transition state theory (TST):47
RT
ΔH
R
ΔS
h
Tkσk(T) B
e expexp
(4.1)
In Equation 4.1, σe signifies the reaction degeneracy number, i.e., set to unity in all considered
reactions (i.e. per C/H/O site). ΔS≠ and ΔH≠ refer to entropy and enthalpy of activation at
temperature T, in that order. The remaining symbols, kB, h, and R denote Boltzmann’s, Planck’s
and the universal gas constants, respectively. DMol3 package computes vibrational frequencies

CHAPTER 4 — Oxidation of Crystalline Polyethylene
85
from which it obtains the temperature-dependent thermochemical parameters (∆H, ∆S, ΔH≠
and ΔS≠).
4.3. Results and Discussion
4.3.1. Initiation reactions
Figure 4.3 presents energetics of two possible initiation pathways. Henceforth, we show only
the two top layers (unrestricted layers) of all modelled slabs. The C‒H bond dissociation
enthalpy (BDH) (1a) in PE amounts to 416.2 kJ/mol. This value concurs with the
corresponding BDH in secondary C‒H bonds in alkanes.48, 49 Direct abstraction of an H atom
by a triplet oxygen molecule (1b) entails a highly endothermic process of 351.1 kJ/mol at
298.15 K (all thermodynamic and kinetic parameters are calculated and discussed at this
temperature). Thus, it is unlikely that, direct H abstraction by the triplet oxygen molecule from
PE represents a significant initiation channel.

CHAPTER 4 — Oxidation of Crystalline Polyethylene
86
Figure 4.3. Initiation reactions in the oxidative decomposition of PE. The location of radical
site is indicated by the bolded C atom.
Figure 4.4 portrays detailed mechanisms for subsequent oxidation steps. In real oxidation
scenario, O/H radicals readily abstract an H from the CH site to form a radical centre. With
the appearance of a radical site, oxygen molecule reacts in two modes; namely, direct addition
and H abstraction. Figure 4.5 presents enthalpic profiles for these two reactions. Barrierless
addition of O2 (2a) to a –C(H)‒ site forms a highly reactive peroxy adduct intermediate. In an
ordered medium, such as a crystalline PE, there are restrictions to diffusion of oxygen.
Calculations yield the exothermicity of this reaction as 131.2 kJ/mol. Corresponding values of
the analogous reactions involving gaseous ethyl and butyl radicals amount to 141.8 kJ/mol and
136.0 kJ/mol, respectively.50, 51

CHAPTER 4 — Oxidation of Crystalline Polyethylene
87
Figure 4.4. Reaction pathway for thermo-oxidation of crystalline polyethylene. Reactive
hydrogen atoms are labelled α, β, and γ, according to their position relatively to the peroxy
group. Note the location of radical sites, for the figures that follow.
In the parallel competing pathway (2b), triplet oxygen abstracts an H-atom from the carbon
atom adjacent to the radical centre. This reaction leads to formation of an alkene molecule and
a hydroperoxyl radical. These two reactions constitute the major initiation channels in the low-
temperature combustion of alkyl radicals. Calculations yield the enthalpy of activation for the
abstraction channel as 212.5 kJ/mol and a modest reaction exothermicity of 44.2 kJ/mol, i.e.,
in a close agreement with the corresponding value for the formation of 1-butene + HO2 from
the n-butyl + O2 51 reaction. Based on enthalpic values included in Figure 4.5, the formation
of a peroxy adduct, via the addition channel (2a), represents a more preferred channel than the
competing abstraction corridor (2b).

CHAPTER 4 — Oxidation of Crystalline Polyethylene
88
Figure 4.5. Reactions between oxygen and the alkyl-type radical of PE. Enthalpy values are
calculated at 298.15 K and the bolded C atoms indicate radical sites.
Direct elimination of HO2 from peroxyalkyl (3) constitutes a principal corridor for the
formation of alkenes from peroxyalkanes at low temperatures.50 This reaction plays a crucial

CHAPTER 4 — Oxidation of Crystalline Polyethylene
89
role by generating HO2, a propagating radical that sustains the oxidation process via the
reaction sequence (HO2 + RH → H2O2 + R˙ → 2OH + R˙). In case of PE, our calculated value
reveals endothermicity of 87.0 kJ/mol, and a reaction barrier of 97.4 kJ/mol (TS2). For the
reactions of n-propyl radical with O2 molecules, concerted elimination of HO2 from RO2 adduct
implies endothermicity of 79.1 kJ/mol and a barrier height of 124.3 kJ/mol.50
4.3.2. Formation of hydroperoxide group
Apart from its contribution to the generation of alkenes and HO2 radicals, peroxy intermediate
branches also into three other channels. Isomerisation of peroxy radical consists of
intramolecular hydrogen transfer, driven principally by the conversion of alkyl peroxy species
into alkyl hydroperoxide radicals.52 A peroxy radical abstracts hydrogen atom intramolecularly
from α, β and γ positions (refer to Figure 4.4). Figure 4.6 represents potential energy surface
(PES) for these reactions. Abstraction of hydrogen atom from the α position (4c) does not lead
to formation of hydroperoxide species, rather yielding molecules of water and γ-alkyl ketone
radical in an exothermic reaction. Despite of our best attempts, we were unsuccessful in
locating a transition state for this reaction (4c). Previous studies attributed this reaction to
formation of radical species that dissociate in microseconds into a long-range complex between
a hydroxyl radical and an ester-type adduct.24, 53, 54
On the other hand, H-abstraction from the γ (4a) and β (4b) position are endothermic by 66.9
kJ/mol and 69.3 kJ/mol and require activation enthalpies of 82.6 kJ/mol (TS3) and 91.9 kJ/mol
(TS4), in that order. Barrier heights of TS3 and TS4 compare well with analogous values
encountered in the intramolecular hydrogen-transfer reaction induced by alkyl peroxy
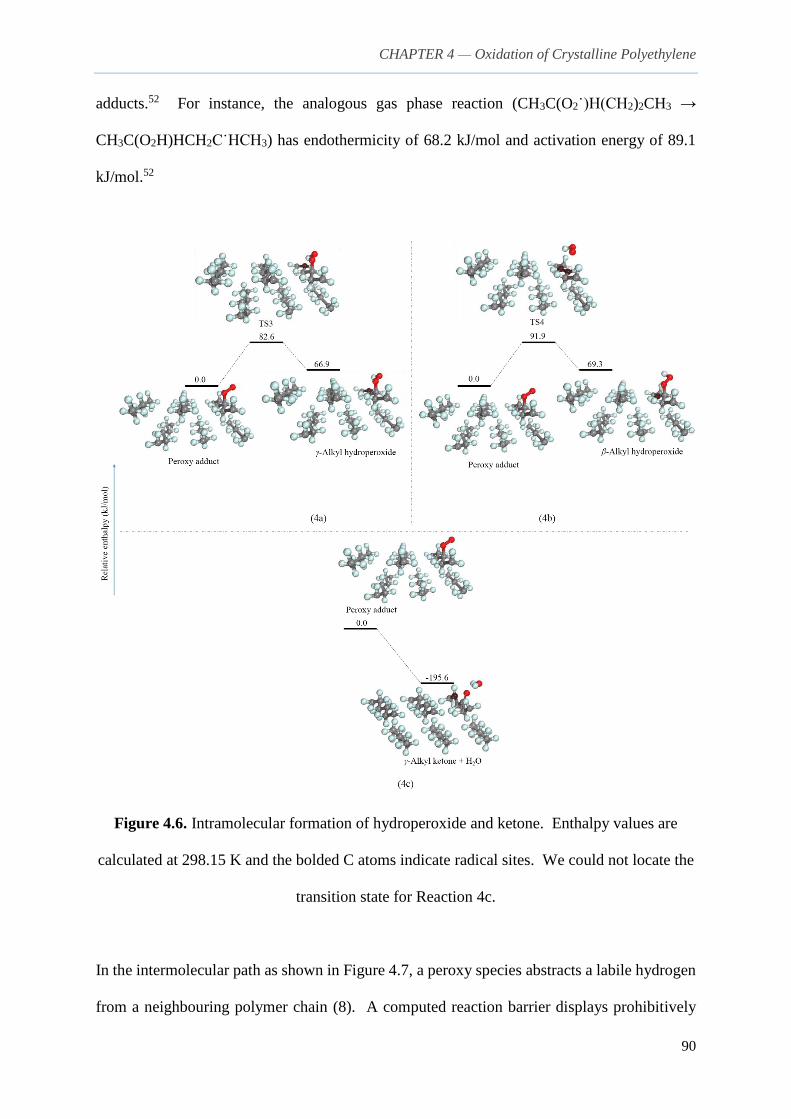
CHAPTER 4 — Oxidation of Crystalline Polyethylene
90
adducts.52 For instance, the analogous gas phase reaction (CH3C(O2˙)H(CH2)2CH3 →
CH3C(O2H)HCH2C˙HCH3) has endothermicity of 68.2 kJ/mol and activation energy of 89.1
kJ/mol.52
Figure 4.6. Intramolecular formation of hydroperoxide and ketone. Enthalpy values are
calculated at 298.15 K and the bolded C atoms indicate radical sites. We could not locate the
transition state for Reaction 4c.
In the intermolecular path as shown in Figure 4.7, a peroxy species abstracts a labile hydrogen
from a neighbouring polymer chain (8). A computed reaction barrier displays prohibitively

CHAPTER 4 — Oxidation of Crystalline Polyethylene
91
high enthalpy value of 443.9 kJ/mol. From a view of a typical reaction coordinate, the
geometry of the neighbouring chain constitutes the only factor that could be at play here, to
make the barrier so high. The geometrical arrangement of PE might be highly constrained by
the crystal structure, rendering the hydrogen atom inaccessible. It follows that, hydrogen
abstraction from a neighbouring hydrocarbon chain carries negligible importance in auto-
oxidation of PE.
Figure 4.7. Formation of hydroperoxide by intermolecular abstraction of H atom. Enthalpy
values are calculated at 298.15 K and the bolded C atoms indicate radical sites.
However, at higher temperatures near the melting point, the chains acquire sufficient
conformational flexibility to render the hydrogen atoms more accessible between chains,
thereby substantially lowering the barrier. To provide a more realistic kinetic data germane to
Reaction 8 near melting point of PE, we invoke an alternative procedure to account for the
intermolecular H-transfer. Korcek et al.’s equation55 establishes a generalised linear

CHAPTER 4 — Oxidation of Crystalline Polyethylene
92
relationships among the activation energy, rate constant per hydrogen atom, and R‒H bond
strength for intermolecular H-abstraction by secondary peroxy radicals; Ea = 0.55 × (ΔH˚ −
62.5) and log(k) = 16.4 – (0.2 × ΔH˚ ), where ΔH˚ is expressed in kcal/mol. This relationship
allows obtaining approximate values of the activation energy and the rate constant for Reaction
8, from BDH of C-H bonds in PE of 416.2 kJ/mol.
4.3.3. Hydroperoxide decomposition and other reactions
Hydroperoxide from the γ pathway undergoes a O‒O bond dissociation and C‒C β scission
(5a1) to yield molecules of an alkene and an aldehyde. As shown in Figure 4.8, exothermicity
of this process amounts to 19.9 kJ/mol with 116.0 kJ/mol (TS5) as its enthalpy of activation.
The endothermic formation of alkyl oxetane (5a2) represents a competing pathway. This
reaction requires a barrier height of 89.0 kJ/mol associated with TS6. On the other hand,
hydroperoxide from the β channel decomposes through a similar barrier height of 92.9 kJ/mol
(TS7), assuming structural rearrangement to form an alkyl epoxide in exothermic reaction (5b)
of 27.1 kJ/mol.

CHAPTER 4 — Oxidation of Crystalline Polyethylene
93
Figure 4.8. Decomposition of intramolecular hydroperoxide species. Enthalpy values are
calculated at 298.15 K and the bolded C atoms indicate radical sites.
Figure 4.9 portrays conventional barrierless unimolecular decomposition that either yields
alkoxy radical (9a), through an endothermic reaction of 191.3 kJ/mol, or loses HO2 (9b), to
form alkyl radical with endothermicity of 292.7 kJ/mol. In comparison to similar reaction
types, values of BDH of nBuO‒OH and nBu‒OOH correspond to 189.1 kJ/mol and 293.7
kJ/mol respectively.56 The alkoxy radicals can ultimately generate alkyl hydroxide by

CHAPTER 4 — Oxidation of Crystalline Polyethylene
94
intramolecular hydrogen abstraction from γ (10a1) and β (10a2) sites. These reactions proceed
with modest activation enthalpies of 90.4 kJ/mol (TS8) and 133.0 kJ/mol (TS9), respectively,
as shown in Figure 4.10.
Figure 4.9. Decomposition of intermolecular hydroperoxide species. Enthalpy values are
calculated at 298.15 K and the bolded C atoms indicate radical sites.

CHAPTER 4 — Oxidation of Crystalline Polyethylene
95
Figure 4.10. . Formation of alkyl hydroxide species by intramolecular abstraction of H atom.
Enthalpy values are calculated at 298.15 K and the bolded C atoms indicate radical sites.
Barrierless addition of an oxygen molecule (6) at the γ radical site, formed by peroxy group
abstracting the H atom in Reaction 4a, is found to be exothermic by 98.5 kJ/mol and results in
the formation of peroxyalkyl hydroperoxide radical (a chain comprising peroxy radical on the
γ carbon with respect to the hydroperoxide group). This radical can isomerise by internal
transfer of hydrogen atom in an analogy to the well-documented process for the corresponding
gas-phase reactions of alkanes to form alkyl dihydroperoxide radicals.57 Such rearrangements
comprise mechanisms that are similar to that of α, β and γ H shift. Herein, we investigate
intermolecular abstraction of a hydrogen atom (7). The reaction is endothermic by 57.8 kJ/mol
and associated with a modest reaction barrier of 85.4 kJ/mol. Figure 4.11 shows the PES for
Reactions 6 and 7.

CHAPTER 4 — Oxidation of Crystalline Polyethylene
96
Figure 4.11. Formation of alkyl dihydroperoxide. Enthalpy values are calculated at 298.15 K
and the bolded C atoms indicate radical.
4.3.4. Kinetic considerations
Reactions passing through the initially-formed peroxy adducts play significant role in the
overall low-temperature oxidation of PE, as depicted in Figure 4.4. Thermal oxidation of PE
is typically modelled by adapting global reaction schemes.12, 20 Reaction rate constants in
oxidation of liquid or solid phase polymers originate from matching gas phase reactions with
corrections due to inversion or transposition of the polymers into the liquid or solid phase. In
this approach, Ea values are corrected (i.e. lowered) by subtracting condensation heats of
reactants. Correction in values of A factors reflects the loss of degree of freedom when shifting
from a gas to a solid or liquid phase. This loss is expressed by translational and rotational
entropy contributions according to the following expression:58

CHAPTER 4 — Oxidation of Crystalline Polyethylene
97
kliq/solid = kgas exp (-∆Hgas→liq/solid
RT) exp (
∆Sgas→liq/solid
R)
Likewise, rate parameters exist only for limited number of elementary kinetic steps27 and
mechanistic schemes built from the elementary reactions rarely involve reactive pathways
comprising intramolecular reactions.
We evaluate accuracy limits implicit in our calculated kinetic data based on a comparison with
corresponding experimental values obtained by Vana Sickle and co-workers,52, 59 for the
intramolecular 1,5-hydrogen shift during auto-oxidation of liquid 2-peroxypentane. Our
kinetic estimation for this reaction affords a barrier of 81.9 kJ/mol and log A of 13.1 s-1; i.e., in
agreement with the corresponding experimental assessment for this reaction, 82.4 kJ/mol and
11.5 s-1, respectively.
Figure 4.12 depicts Arrhenius plots for several reactions investigated in this work, and Table
4.3 itemises reaction rate parameters in terms of activation energies (Ea) and the Arrhenius pre-
exponential A factors. However, since molecular oxygen diffuses more easily in unordered
medium, we expect higher rates in the amorphous and defected regions of PE. Values in Table
4.3 represent the first set of kinetic data that are calculated specifically for PE. Literature
studies50, 52, 57, 60, 61 have adopted kinetic parameters of the corresponding gas-phase reactions.
The overall rate-limiting step revolves around formation and decomposition of hydroperoxides
that follow an experimental reaction rate expression of k(T) = 1.5 × 10¹⁰ exp(-73
(kJ/mol)/(R·T)) [L/(mol s)] and k(T) = 2.5 × 10¹⁴ exp(-146 (kJ/mol)/(R·T)) [s-1] respectively.21,
62 The latter accounts only for a typical unimolecular O‒O bond fission (ROOH → RO˙ +
˙OH). As listed in Table 4.3, the decomposition of hydroperoxides follow three additional
routes, in which the structural rearrangement of RO˙ lowers the activation energies. Baum63

CHAPTER 4 — Oxidation of Crystalline Polyethylene
98
explicitly followed the actual change in structure of PE during oxidation. At moderate
temperature, the rate of formation of hydroperoxides proves that, the adducts rapidly reach
their equilibrium concentration. Subsequently, their decomposition to free radicals accelerates
the oxidation process. Essentially, while our calculated values describe auto-oxidation process
in crystalline PE, they may also serve to model the oxidative decomposition of melted PE,
provided that they are adjusted by the transposition approach.
Reaction rate parameters for channels 2a, 4c, 6, 9a and 9b cannot be computed by the
conventional TST method because they appear barrierless. As an alternative approach, the
variational transition state theory64, 65 affords a robust procedure in which the reaction rate
constant is minimised as a function of temperature and reaction coordinate. However,
application of such methodology in our system proves highly challenging in terms of
computational cost. To the best of our knowledge, literature provides no application of the
VTST on a periodic-boundary system. Nonetheless, as a limiting case scenario, one can
assume the calculated enthalpies for these reactions as the energy term in the Arrhenius
equation. A factors for these reactions follow from those of analogous gas-phase reactions of
alkanes, corrected by the transposition method.

CHAPTER 4 — Oxidation of Crystalline Polyethylene
99
Figure 4.12. Arrhenius plots for the studied reactions.
1.0 1.5 2.0 2.5 3.0 3.5
-35
-30
-25
-20
-15
-10
-5
0
5
10
15 lo
g k
(s-1
)
1000/T (K-1)
2b
3
4a
4b
5a1
5a2
5b
10a1
10a2

CHAPTER 4 — Oxidation of Crystalline Polyethylene
100
Table 4.3. Kinetic parameters of reactions involving key radical intermediates.
* Estimated from linear relationship among R-H BDH, activation energy and rate constant for
intermolecular H-abstraction by secondary peroxy radicals.
4.4. Conclusions
This chapter has analysed the initial elementary steps occurring during the low-temperature
oxidation of PE, locating optimised geometries and estimating thermodynamic properties of all
plausible products and transition structures. Aldehydes, epoxides, oxetanes and ketones appear
as a consequence of intramolecular H-transfer from three adjacent ‒CH2‒ sites, on the same
hydrocarbon chain, to the outer oxygen atom in the initially-formed peroxy adduct. Secondary
alkoxy and hydroxy groups arise from intermolecular H-transfer from a neighbouring chain,
with a generalised linear relationship deployed to estimate the respective activation energy and
Reaction Ea (kJ/mol) A (s-1); for Reactions 2b
and 8, A [L/(mol s)]
2b: R˙+ O2 → Alkene + HO2 212.6 1.72 × 10²
3: ROO˙ → Alkene + HO2 97.1 5.90 × 10¹²
4a: ROO˙ → Rγ˙OOH 84.0 1.67 × 10⁷
4b: ROO˙ → Rβ˙OOH 91.3 4.41 × 10⁹
5a1: Rγ˙OOH → Alkene + RO + HO˙ 111.5 1.30 × 10¹³
5a2: Rγ˙OOH → ROoxetane + HO˙ 93.5 1.67 × 10¹⁸
5b: Rβ˙OOH → ROepoxide + HO˙ 95.9 4.24 × 10¹⁵
8*: ROO˙ + RH → ROOH + R˙ 85.4 1.51 × 10¹¹
10a1: RO˙ → Rγ˙OH 90.7 8.50 × 10⁷
10a2: RO˙ → Rβ˙OH 135.0 1.36 × 10¹¹
CHAPTER 4 — Oxidation of Crystalline Polyethylene
101
rate constant of H-transfer. Moderate activation energies accompany intermolecular reactions
if compared with intramolecular reactions. Thermochemical and kinetic parameters obtained
in this study provide an understanding of the solid-state auto-oxidation of PE and afford
insights into oxidation of other crystalline polyolefins.
4.5. References
1. Peacock, A. J., Handbook of Polyethylene: Structures, Properties, and Applications.
Marcel Dekker: New York, 2000; p vii, 534 p.
2. Barbucci, R., Integrated Biomaterials Science. Kluwer Academic/Plenum,: New York,
2002.
3. Malpass, D. B., Introduction to Industrial Polyethylene: Properties, Catalysts, and
Processes. Scrivener ; Wiley: Salem, Mass. Hoboken, N.J., 2010; p xvii, 133 p.
4. Osborn, P. D., Handbook of Energy Data and Calculations Including Directory of
Products and Services. Butterworths: London, 1985; p 257 p.
5. Williams, E. A.; Williams, P. T., The pyrolysis of individual plastics and a plastic
mixture in a fixed bed reactor. J. Chem. Technol. Biotechnol. 1997, 70, (1), 9-20.
6. Al-Salem, S. M.; Lettieri, P., Kinetic study of high density polyethylene (HDPE)
pyrolysis. Chem. Eng. Res. Des. 2010, 88, (12A), 1599-1606.
7. Onwudili, J. A.; Insura, N.; Williams, P. T., Composition of products from the pyrolysis
of polyethylene and polystyrene in a closed batch reactor: Effects of temperature and residence
time. J. Anal. Appl. Pyrolysis 2009, 86, (2), 293-303.
8. Kumar, S.; Panda, A. K.; Singh, R. K., A review on tertiary recycling of high-density
polyethylene to fuel. Resour. Conserv. Recy. 2011, 55, (11), 893-910.

CHAPTER 4 — Oxidation of Crystalline Polyethylene
102
9. Kumar, S.; Singh, R. K., Recovery of hydrocarbon liquid from waste high density
polyethylene by thermal pyrolysis. Braz. J. Chem. Eng. 2011, 28, (4), 659-667.
10. Chiaverini, M. J.; Kuo, K. K.; Lu, F. K., Fundamentals of Hybrid Rocket Combustion
and Propulsion. American Institute of Aeronautics and Astronautics,: Reston, Va., 2007.
11. Gascoin, N.; Fau, G.; Gillard, P.; Mangeot, A., Experimental flash pyrolysis of high
density polyethylene under hybrid propulsion conditions. J. Anal. Appl. Pyrolysis 2013, 101,
45-52.
12. Senneca, O.; Chirone, R.; Salatino, P., Oxidative pyrolysis of solid fuels. J. Anal. Appl.
Pyrolysis 2004, 71, (2), 959-970.
13. Gascoin, N.; Navarro-Rodriguez, A.; Gillard, P.; Mangeot, A., Kinetic modelling of
high density polyethylene pyrolysis: Part 1. Comparison of existing models. Polym. Degrad.
Stab. 2012, 97, (8), 1466-1474.
14. Nemeth, A.; Blazso, M.; Baranyai, P.; Vidoczy, T., Thermal degradation of
polyethylene modeled on tetracontane. J. Anal. Appl. Pyrolysis 2008, 81, (2), 237-242.
15. Wampler, T. P., Applied Pyrolysis Handbook. 2nd ed.; CRC Press: Boca Raton, Fla. ;
London, 2007; p 288 p.
16. Levine, S. E.; Broadbelt, L. J., Detailed mechanistic modeling of high-density
polyethylene pyrolysis: Low molecular weight product evolution. Polym. Degrad. Stab. 2009,
94, (5), 810-822.
17. Westerhout, R. W. J.; Waanders, J.; Kuipers, J. A. M.; van Swaaij, W. P. M., Kinetics
of the low-temperature pyrolysis of polyethene, polypropene, and polystyrene modeling,
experimental determination, and comparison with literature models and data. Ind. Eng. Chem.
Res. 1997, 36, (6), 1955-1964.

CHAPTER 4 — Oxidation of Crystalline Polyethylene
103
18. Bockhorn, H.; Hornung, A.; Hornung, U., Mechanisms and kinetics of thermal
decomposition of plastics from isothermal and dynamic measurements. J. Anal. Appl. Pyrolysis
1999, 50, (2), 77-101.
19. Burnham, A. K.; Braun, R. L., Global kinetic analysis of complex materials. Energy
Fuels 1999, 13, (1), 1-22.
20. Peterson, J. D.; Vyazovkin, S.; Wight, C. A., Kinetics of the thermal and thermo-
oxidative degradation of polystyrene, polyethylene and poly(propylene). Macromol. Chem.
Phys. 2001, 202, (6), 775-784.
21. Colin, X.; Fayolle, B.; Audouin, L.; Verdu, J., About a quasi-universal character of
unstabilised polyethylene thermal oxidation kinetics. Polym. Degrad. Stab. 2003, 80, (1), 67-
74.
22. Gardette, M.; Perthue, A.; Gardette, J. L.; Janecska, T.; Foldes, E.; Pukanszky, B.;
Therias, S., Photo- and thermal-oxidation of polyethylene: Comparison of mechanisms and
influence of unsaturation content. Polym. Degrad. Stab. 2013, 98, (11), 2383-2390.
23. Sugimoto, M.; Shimada, A.; Kudoh, H.; Tamura, K.; Seguchi, T., Product analysis for
polyethylene degradation by radiation and thermal ageing. Radiat. Phys. Chem. 2013, 82, 69-
73.
24. de Sainte Claire, P., Degradation of PEO in the solid state: a theoretical kinetic Model.
Macromolecules 2009, 42, (10), 3469-3482.
25. Colin, X.; Audouin, L.; Verdu, J., Determination of thermal oxidation rate constants by
an inverse method. Application to polyethylene. Polym. Degrad. Stab. 2004, 86, (2), 309-321.
26. Colin, X.; Khelidj, N.; Audouin, L.; Verdu, J. In Radiochemical aging of polyethylene:
a simplified approach for lifetime prediction, Solid Dielectrics, 2004. ICSD 2004. Proceedings
of the 2004 IEEE International Conference on, 5-9 July 2004, 2004; 2004; pp 296-299 Vol.1.

CHAPTER 4 — Oxidation of Crystalline Polyethylene
104
27. Khelidj, N.; Colin, X.; Audouin, L.; Verdu, J.; Monchy-Leroy, C.; Prunier, V.,
Oxidation of polyethylene under irradiation at low temperature and low dose rate. Part II. Low
temperature thermal oxidation. Polym. Degrad. Stab. 2006, 91, (7), 1598-1605.
28. Khelidj, N.; Colin, X.; Audouin, L.; Verdu, J.; Monchy-Leroy, C.; Prunier, V.,
Oxidation of polyethylene under irradiation at low temperature and low dose rate. Part I. The
case of "pure" radiochemical initiation. Polym. Degrad. Stab. 2006, 91, (7), 1593-1597.
29. Tidjani, A., Comparison of formation of oxidation products during photo-oxidation of
linear low density polyethylene under different natural and accelerated weathering conditions.
Polym. Degrad. Stab. 2000, 68, (3), 465-469.
30. Chiellini, E.; Corti, A.; D'Antone, S.; Baciu, R., Oxo-biodegradable carbon backbone
polymers - Oxidative degradation of polyethylene under accelerated test conditions. Polym.
Degrad. Stab. 2006, 91, (11), 2739-2747.
31. Crompton, T. R., Thermo-oxidative Degradation of Polymers. iSmithers,: Shrewsbury,
2010.
32. Hikmet, R.; Keller, A., Crystallinity dependent free radical formation and decay in
irradiated polyethylene in the presence of oxygen. Int. J. Radiat. Appl. Instrum. C Radiat.
Phys. Chem 1987, 29, (1), 15-19.
33. Shibryaeva, L., Thermal Oxidation of Polypropylene and Modified Polypropylene -
Structure Effects. In Polypropylene, Dogan, D. F., Ed. InTech: 2012.
34. Delley, B., An all‐electron numerical method for solving the local density functional
for polyatomic molecules. J. Chem. Phys. 1990, 92, (1), 508-517.
35. Delley, B., From molecules to solids with the DMol3 approach. J. Chem. Phys. 2000,
113, (18), 7756-7764.

CHAPTER 4 — Oxidation of Crystalline Polyethylene
105
36. Tkatchenko, A.; Scheffler, M., Accurate molecular van der Waals interactions from
ground-state electron density and free-atom reference data. Phys. Rev. Lett. 2009, 102, (7),
073005.
37. Bunn, C. W., The crystal structure of long-chain normal paraffin hydrocarbons. The
"shape" of the <CH2 group. Trans. Faraday Society 1939, 35, (0), 482-491.
38. Avitabile, G.; Napolitano, R.; Pirozzi, B.; Rouse, K. D.; Thomas, M. W.; Willis, B. T.
M., Low temperature crystal structure of polyethylene: Results from a neutron diffraction study
and from potential energy calculations. J. Polym. Sci. Polym. Lett. Ed. 1975, 13, (6), 351-355.
39. Tadokoro, H., Structure of Crystalline Polymers. Wiley: New York ; Chichester, 1979.
40. Pnam Space Group. http://img.chem.ucl.ac.uk/sgp/large/062bz1.htm
41. Miao, M. S.; Zhang, M.-L.; Van Doren, V. E.; Van Alsenoy, C.; Martins, J. L., Density
functional calculations on the structure of crystalline polyethylene under high pressures. J.
Chem. Phys. 2001, 115, (24), 11317-11324.
42. Montanari, B.; Ballone, P.; Jones, R. O., Density functional study of molecular crystals:
Polyethylene and a crystalline analog of bisphenol-A polycarbonate. J. Chem. Phys. 1998, 108,
(16), 6947-6951.
43. Takahashi, Y., Neutron structure analysis of polyethylene-d4. Macromolecules 1998,
31, (12), 3868-3871.
44. Bruno, J. A. O.; Allan, N. L.; Barron, T. H. K.; Turner, A. D., Thermal expansion of
polymers: Mechanisms in orthorhombic polyethylene. Phys. Rev. B 1998, 58, (13), 8416-8427.
45. DiLabio, G. A.; Otero-de-la-Roza, A., Noncovalent interactions in density-functional
theory. arXiv preprint arXiv:1405.1771 2014.
46. Castro, L.; Kirillov, E.; Miserque, O.; Welle, A.; Haspeslagh, L.; Carpentier, J.-F.;
Maron, L., Are solvent and dispersion effects crucial in olefin polymerization DFT

CHAPTER 4 — Oxidation of Crystalline Polyethylene
106
calculations? Some insights from propylene coordination and insertion reactions with group 3
and 4 metallocenes. ACS Catalysis 2014, 5, (1), 416-425.
47. Laidler, K. J.; King, M. C., Development of transition-state theory. J. Phys. Chem.
(1952) 1983, 87, (15), 2657-2664.
48. Blanksby, S. J.; Ellison, G. B., Bond dissociation energies of organic molecules. Acc.
Chem. Res. 2003, 36, (4), 255-263.
49. Solomons, T. W. G.; Fryhle, C. B., Organic Chemistry. 10th ed.; John Wiley & Sons:
Hoboken, N.J., 2011.
50. DeSain, J. D.; Klippenstein, S. J.; Miller, J. A.; Taatjes, C. A., Measurements, theory,
and modeling of OH formation in ethyl plus O2 and propyl plus O2 reactions. J. Phys. Chem.
A 2003, 107, (22), 4415-4427.
51. Zador, J.; Taatjes, C. A.; Fernandes, R. X., Kinetics of elementary reactions in low-
temperature autoignition chemistry. Prog. Energy Combust. Sci. 2011, 37, (4), 371-421.
52. Pfaendtner, J.; Yu, X. R.; Broadbelt, L. J., Quantum chemical investigation of low-
temperature intramolecular hydrogen transfer reactions of hydrocarbons. J. Phys. Chem. A
2006, 110, (37), 10863-10871.
53. Blitz, M. A.; Heard, D. E.; Pilling, M. J., Wavelength dependent photodissociation of
CH3OOH - Quantum fields for CH3O and OH, and measurement of the OH+CH3OOH rate
coefficient. J. Photochem. Photobiol. A 2005, 176, (1-3), 107-113.
54. Vereecken, L.; Nguyen, T. L.; Hermans, I.; Peeters, J., Computational study of the
stability of alpha-hydroperoxyl-alpha-alkylperoxyl substituted alkyl radicals. Chem. Phys. Lett.
2004, 393, (4-6), 432-436.
55. Korcek, S.; Chenier, J. H. B.; Howard, J. A.; Ingold, K. U., Absolute rate constants for
hydrocarbon autoxidation. XXI. Activation energies for propagation and the correlation of

CHAPTER 4 — Oxidation of Crystalline Polyethylene
107
propagation rate constants with carbon–hydrogen bond strengths. Can. J. Chem. 1972, 50, (14),
2285-2297.
56. Simmie, J. M.; Black, G.; Curran, H. J.; Hinde, J. P., Enthalpies of formation and bond
dissociation energies of lower alkyl hydroperoxides and related hydroperoxy and alkoxy
radicals. J. Phys. Chem. A 2008, 112, (22), 5010-5016.
57. Battin-Leclerc, F., Detailed chemical kinetic models for the low-temperature
combustion of hydrocarbons with application to gasoline and diesel fuel surrogates. Prog.
Energy Combust. Sci. 2008, 34, (4), 440-498.
58. Marongiu, A.; Bozzano, G.; Dente, M.; Ranzi, E.; Faravelli, T., Detailed kinetic
modeling of pyrolysis of tetrabromobisphenol A. J. Anal. Appl. Pyrolysis 2007, 80, (2), 325-
345.
59. Vana Sickle, D. E.; Mill, T.; Mayo, F. R.; Richardson, H.; Gould, C. W., Intramolecular
propagation in the oxidation of n-alkanes. Autoxidation of n-pentane and n-octane. J. Org.
Chem. 1973, 38, (26), 4435-4440.
60. Villano, S. M.; Huynh, L. K.; Carstensen, H.-H.; Dean, A. M., High-pressure rate rules
for alkyl + O2 reactions. 1. The dissociation, concerted elimination, and isomerization channels
of the alkyl reroxy radical. J. Phys. Chem. A 2011, 115, (46), 13425-13442.
61. Villano, S. M.; Huynh, L. K.; Carstensen, H.-H.; Dean, A. M., High-pressure rate rules
for alkyl + O2 reactions. 2. The isomerization, cyclic ether formation, and β-scission reactions
of hydroperoxy alkyl radicals. J. Phys. Chem. A 2012, 116, (21), 5068-5089.
62. Gol'dberg, V.; Paverman, N.; Akutin, M.; Kashina, G., The autoxidation and the liquid
phase oxidation of melts of low density polyethylene. Polymer Science USSR 1978, 20, (6),
1415-1421.
63. Baum, B., The mechanism of polyethylene oxidation. J. Appl. Polym. Sci. 1959, 2, (6),
281-288.

CHAPTER 4 — Oxidation of Crystalline Polyethylene
108
64. Garrett, B. C.; Truhlar, D. G., Variational Transition State Theory. Elsevier:
Amsterdam, The Netherlands: 2005.
65. Knyazev, V. D., Kinetics and Mechanisms of Elementary Reactive Processes in
Polymer Pyrolysis. US Department of Commerce, National Institute of Standards and
Technology: 2009.

109
CHAPTER 5
Paper III: Oxidation of Polyethylene under Corrosive
NOx Atmosphere
Oluwoye, I.; Altarawneh, M.; Gore, J.; Bockhorn, H.; Dlugogorski, B. Z., Oxidation of
polyethylene under corrosive NOx atmosphe1re. J. Phys. Chem. C 2016, 120, (7), 3766-3775.
The paper has been reformatted for Australia English.
Nitroso ⇌ Oxime
Nitroxyl
Nitro ⇌ Aci form
Nitrous acid
Organic nitrite
Organic nitrate
Macromolecular Polyethylene
O2
NO2
NO
This chapter describes the low-temperature interaction of polyethylene
with NOx. It investigates the relevant pathways leading to the formation
of initial products, hence, furnishes insights into the experimental
observation reported in Chapter 6
…

CHAPTER 5 — Oxidation of Polyethylene under Corrosive NOx Atmosphere
110
1
5.0. Abstract
This chapter reports the results of comprehensive quantum-mechanical calculations of low-
temperature oxidation (i.e., below the softening point) of polyethylene (PE) film in a corrosive
NOx environment, by mapping out the potential energy surface for a large set of reactions,
developing thermokinetic parameters for each elementary reaction and discussing in detail the
most energetically-favourable paths. Remarkably, addition of nitric oxide (NO) and nitrogen
dioxide (NO2) results in formation of C-nitroso and nitro species, respectively, and
successively leads to internal tautomerisation or concerted elimination of nitroxyl (HNO) and
nitrous acid (HNO2). We demonstrate that, the presence of molecular oxygen sustains the
formation of O-nitroso compounds, organic nitrites and nitrates. Reaction rate parameters have
been established for all considered reactions over the temperature range of 300 K to 800 K.
The results presented herein provide new insights into the solid-state polymer-gas reactivity of
PE in NOx atmosphere pertinent to thermal recycling of materials laden with PE and to co-
combustion of PE with a nitrogen-rich fuel such as biomass. The results will find application
to systems that involve oxidative decomposition of germane crystalline polyolefins/paraffins
and pure carbon-hydrogen-type polymers induced by aggressive gases such as NO and NO2.

CHAPTER 5 — Oxidation of Polyethylene under Corrosive NOx Atmosphere
111
5.1. Introduction
Long-established and widespread use of polymers necessitates the study of their reactivity,
thermal stability, degradation and decomposition under conditions typical of their intended
function. Polyethylene (PE), for example, as one of the major non-toxic commercially
available polymer, serves in wide range of applications; from household utensils to industrial
and medical paraphernalia.2, 3 The deployment of PE had encouraged a great deal of research
on its pyrolysis, oxidation and chemical reactivity.4-10 This research has mainly aimed to
understand the decomposition behaviour of PE for application related to thermal recycling of
materials laden with PE and energy recovery of main stream municipal wastes, often loaded
with significant amounts of pure carbon-hydrogen-type polymers.
Regarding thermal studies, a clear distinction rests between thermal degradation and thermal
decomposition. The former describes a process wherein certain defining properties of a
polymeric material deteriorate under heat exposure, while the latter is characterised by a
variation in the chemical structure or an extensive change in chemical identity caused by heat.11
Although, to a reasonable extent, both phenomena for PE had been understood under oxidative
O2 conditions,12-15 the literature lacks detailed demonstrations on how PE decays in other
reactive fumes.
In the 1950s, Ogihara pioneered the study of reaction of nitrogen dioxide with PE.16, 17
Afterwards, Jellinek and collaborators investigated reactions of different classes of polymers
with air pollutants, such as oxides of sulfur (SOx) and nitrogen (NOx).18, 19 At low atmospheric
concentration and standard conditions, the aggressive pollutants (NOx) exert limited effect on
vinyl polymers. However, a slight increase in concentration and temperature induces a

CHAPTER 5 — Oxidation of Polyethylene under Corrosive NOx Atmosphere
112
pronounced interactions within their macromolecular structure.20 In fact, this kind of
conditions becomes practically important when industrial applications deploy PE in processes
characterised by elevated concentration of NOx. For instance, in high-voltage systems,
polymer insulators could suffer NOx attack during a coronal discharge.21-24 Likewise, a
discharge treatment of oxidative corona of PE films in air yields an unsaturated surface,
abundant in oxygenated species such as ketones, aldehydes, alcohols, and esters, with large
numbers of macroradicals,3, 25, 26 which can possibly react with oxides of nitrogen, produced
concurrently in the course of the same process.27, 28 Furthermore, in another type of surface
modification (hydrophilic plasma treatment), a stream of reactive nitrogen oxides implants
nitrogen-bearing functional groups on the surface of a polymeric material.29, 30 In addition,
oxidation of PE in fuming nitric acid (HNO3) also incurs the contributions of nitrogen-oxide
functionalities.31, 32 Furthermore, the polyethylene-enhanced selective catalytic reduction
(SCR) of NOx33 and co-combustion of PE with a nitrogen-rich fuel could serve as additional
examples for the co-existence of O2 – NOx – PE.
Primarily, NOx includes nitric oxide (NO) and nitrogen dioxide (NO2). Because of the toxicity
of NO and NO2, 34 their study remains a thematic research topic among environmentalists,
chemists and engineers. Gas-phase reaction of NOx with hydrocarbons attracts much interest,
as it plays an important role in combustion, as well as in atmospheric and tropospheric
chemistry.35-44 However, results from such findings cannot fully describe analogous
condensed-phase reactions. For instance, reaction of NO2 with alkene experiences different
competitive pathways in solutions.45 In gas-solid systems, molecules have insufficient
conformational flexibility that restricts mobility of constituent chains.

CHAPTER 5 — Oxidation of Polyethylene under Corrosive NOx Atmosphere
113
To this end, in the present chapter, we provide the first comprehensive theoretical evidence of
oxidative decomposition of PE under corrosive NOx atmosphere. By deploying the density
functional theory (DFT), from mechanistic and kinetic viewpoints, we analyse primary
initiation reactions of NOx with modelled PE species. Results presented herein provide new
physical insights into the solid-state oxidation of crystalline polyolefins/paraffins and carbon-
hydrogen-type polymers in NOx environment. In addition to the aforementioned systems, in
which NOx interferes with PE oxidation, our mechanistic and kinetic analyses are of broad
interest in understanding the role of nitrogen oxides during an auto-oxidation process of
crystalline PE, as apparent in its natural ageing mechanism under thermo- and photo-oxidative
conditions.
Finally, this work should not be confused with the so-called pinking or yellowing
(discolouring) of PE. This colour change arises from the reaction of NOx with a phenolic
antioxidant present in the resin. The surface oxidation leads to formation of quinone-like
structure that can be easily reversed in UV light.46, 47
5.2. Methodology
The reaction modelling rests on a similar approach applied in our recent theoretical
investigation of the oxidation of crystalline polyethylene by molecular oxygen.1 DMol3
package48, 49 enables all structural optimisations, and serves to calculate all energy and
vibrational frequencies. As illustrated in Figure 5.1, we develop a PE(100) surface defined by
the (100) Miller index, by employing an optimised form of a primitive orthorhombic crystalline
arrangement reported by Avitabile et al.50

CHAPTER 5 — Oxidation of Polyethylene under Corrosive NOx Atmosphere
114
Figure 5.1. Illustration of the adopted methodology. The prior study1 provides the complete
crystallographic structural parameters of the unit cell.
The vacuum distance between each periodic slab sufficiently eliminates any interactions within
the recurring images, while accommodating all target species, as well as dissociative products.
For the purpose of representation in this paper, we show only the major singular PE chain in
all potential energy surfaces (PES).
The DFT exchange-correlation potential employs the generalised gradient approximation
(GGA) of the Perdew-Burke-Ernzerhof (PBE) functional, with the tolerance on the
convergence of the total energy of 1 × 10⁻⁶ Ha. In the calculations, the electronic core treatment
includes all electrons while applying a double numerical plus polarisation (DNP) atomic basis
set, confined within a global cut-off of 4.0 Å. The integration of the Brillouin zone involves
automatic generation of 2×3×6 and 1×2×1 k-points for the unit cell and periodic slabs,

CHAPTER 5 — Oxidation of Polyethylene under Corrosive NOx Atmosphere
115
respectively, through the Monkhorst-Pack grid scheme. The average computational cost
typically amounts to 20 h (on 32 parallel processing cores) for each periodic slab. Our earlier
study1 revealed that, the selected choice of DFT functional and basis set offers a satisfying
accuracy threshold for the system at hand, even without semiemperical dispersion correction
scheme.
Furthermore, as implemented in DMol3, the complete linear synchronous and quadratic
synchronous transit approaches (LST/QST) locate all necessary transition states. Reaction rate
constants are fitted to the Arrhenius equation (i.e., k(T) = A exp(-Ea/RT)) in the temperature
range of 298.15 K to 800 K, according to the classical transition state theory (TST)51:
RT
ΔH
R
ΔS
h
Tkσk(T) B
e expexp
(5.1)
DMol3 package computes vibrational frequencies from which it obtains the temperature-
dependent thermochemical parameters. In Equation 5.1, we set the reaction degeneracy
number σe to unity (i.e. per C/H/O/N site) in all considered reactions. ΔS≠ and ΔH≠ refer to
entropy and enthalpy of activation at temperature T in that order, kB, h, and R symbolise
Boltzmann’s, Planck’s and the universal gas constants, respectively. The implicit accuracy
limit for the calculated reaction rate parameters have been validated by intramolecular 1,5-
hydrogen shift during auto-oxidation of liquid 2-peroxypentane. Our kinetic estimation for this
reaction affords a barrier of 81.9 kJ/mol and log A of 13.1 s-1; i.e., in reasonable agreement
with the corresponding experimental assessment for this reaction of 82.4 kJ/mol and 11.5 s-1,
respectively.52, 53

CHAPTER 5 — Oxidation of Polyethylene under Corrosive NOx Atmosphere
116
5.3. Results and Discussion
5.3.1. Initiation reactions and formation of radical species
Figure 5.2 portrays the energetics of the three initiation pathways. According to reaction (1a),
the bond dissociation enthalpy (BDH) of a secondary C‒H bond in PE amounts to 416.2 kJ/mol.
This value agrees well with the corresponding values for gas-phase alkanes; i.e., 410.0 – 416.0
kJ/mol.54, 55
RH → R˙ + H (1a)
Elevated temperature, UV radiation as well as mechanical or chemical factors may overcome
the sizable enthalpic requirement for the barrierless fission of a C‒H bond, permitting the
appearance of infinitesimal fraction of radical sites in the polymer matrix, ready for further
reaction.1
Earlier experimental studies speculated the initiation reactions to involve direct hydrogen
abstraction by NO2.19 Generally, such mechanism could take the form:
RH + NO → R˙ + HNO (1b)
RH + NO2 → R˙ + HONO (1c)
In this mechanism, the oxides of nitrogen abstract H atom from a polymer chain. Our
calculated results at 298.15 K (all reaction and activation enthalpies are discussed at this
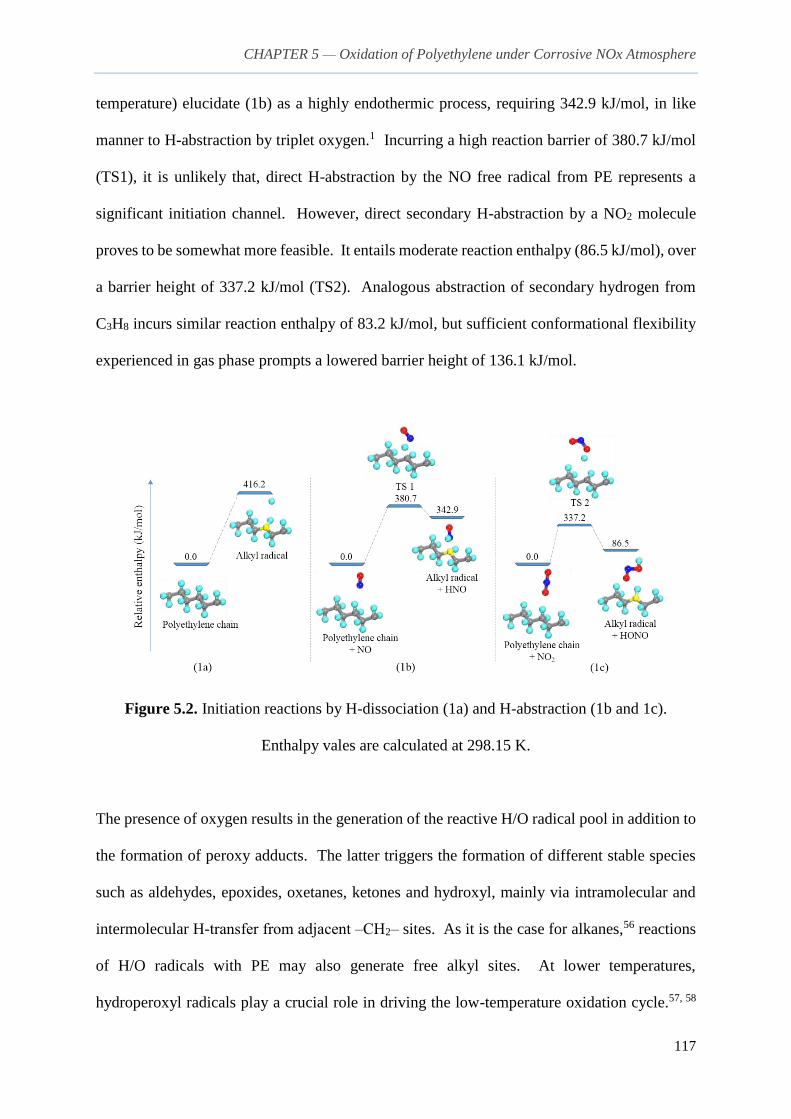
CHAPTER 5 — Oxidation of Polyethylene under Corrosive NOx Atmosphere
117
temperature) elucidate (1b) as a highly endothermic process, requiring 342.9 kJ/mol, in like
manner to H-abstraction by triplet oxygen.1 Incurring a high reaction barrier of 380.7 kJ/mol
(TS1), it is unlikely that, direct H-abstraction by the NO free radical from PE represents a
significant initiation channel. However, direct secondary H-abstraction by a NO2 molecule
proves to be somewhat more feasible. It entails moderate reaction enthalpy (86.5 kJ/mol), over
a barrier height of 337.2 kJ/mol (TS2). Analogous abstraction of secondary hydrogen from
C3H8 incurs similar reaction enthalpy of 83.2 kJ/mol, but sufficient conformational flexibility
experienced in gas phase prompts a lowered barrier height of 136.1 kJ/mol.
Figure 5.2. Initiation reactions by H-dissociation (1a) and H-abstraction (1b and 1c).
Enthalpy vales are calculated at 298.15 K.
The presence of oxygen results in the generation of the reactive H/O radical pool in addition to
the formation of peroxy adducts. The latter triggers the formation of different stable species
such as aldehydes, epoxides, oxetanes, ketones and hydroxyl, mainly via intramolecular and
intermolecular H-transfer from adjacent ‒CH2‒ sites. As it is the case for alkanes,56 reactions
of H/O radicals with PE may also generate free alkyl sites. At lower temperatures,
hydroperoxyl radicals play a crucial role in driving the low-temperature oxidation cycle.57, 58

CHAPTER 5 — Oxidation of Polyethylene under Corrosive NOx Atmosphere
118
In subsequent steps, hydroxyl and hydroperoxyl radicals could add to vacant radical sites in
the PE chain. Consequently, oxidation of PE produces three main radical-type species; namely,
alkyl, hydroxyalkyl and hydroperoxyalkyl.1 In a rich NOx-environment, oxides of nitrogen
potentially react with three PE-type radicals as depicted in Figure 5.3. As the next sections
demonstrate, the reactivity of these radicals varies based on the characteristics of vicinal
functional groups.
Figure 5.3. Reaction pathways for primary initiations during oxidation of crystalline
polyethylene in NOx atmosphere.
5.3.2. Addition reactions and fate of consequential N-derivative species
The appearance of radical sites allows subsequent reactions. Remarkably, barrierless additions
of NO (2, 13 and 23) and NO2 (4, 15 and 25) are exothermically competitive. As shown in
Figure 5.4, these reactions lead to the formation of C-nitroso and nitro adducts, and respectively

CHAPTER 5 — Oxidation of Polyethylene under Corrosive NOx Atmosphere
119
release 164 – 192 kJ/mol and 383 – 411 kJ/mol, depending on the functionality of neighbouring
chemical groups, i.e. alkyl, hydroxyalkyl and hydroperoxyalkyl.
Figure 5.4. Addition of molecular oxygen, nitric oxide and nitrogen dioxide to different
carbon radical sites on a PE chain. Enthalpy vales are calculated at 298.15 K.
Generally, nitroso compounds convert into more thermodynamically stable oxime tautomers
by migration of an α H atom (i.e., from the same carbon atom attached to NO) to the nitroso
group.59 According to Figure 5.5, transformation of nitrosoalkyl in a PE chain (3a) reveals
exothermicity of 49.9 kJ/mol and a reaction barrier of 328.4 kJ/mol (TS3). However,
availability of hydroxyl (14) and hydroperoxyl groups (24), closely located on the same PE
chain, moderates the reaction barrier to 201.1 kJ/mol (TS4) and 231.1 kJ/mol (TS5),
respectively. On the other hand, with the exemption of nitromethanes, nitroalkanes exist as
highly versatile stable compounds.59, 60 As a result, in PE, tautomerisation of nitroalkyl into its

CHAPTER 5 — Oxidation of Polyethylene under Corrosive NOx Atmosphere
120
aci form (5a) proceeds via the enthalpy of activation of 285.6 kJ/mol with endothermicity of
73.1 kJ/mol. In addition, the presence of a hydroxyl group on the same chain (16) significantly
lowers the barrier to 132.4 kJ/mol, but existence of hydroperoxyl group (26) raises the barrier
up to 434.9 kJ/mol, with a significant change in the endothermicity of the reactions. Based on
results from our recent work on dehydrohalogenation of ethyl halides,61 we envisage that the
presence of the vicinal hydroxyl and hydroperoxyl functional groups alters the activation
energies via modifying the charge distribution environment around the transferred H atom.
Nevertheless, the exact effect of introducing these groups requires further scrutiny.
Figure 5.5. Tautomerisation of nitroso- and nitroadducts. Enthalpy vales are calculated at
298.15 K.

CHAPTER 5 — Oxidation of Polyethylene under Corrosive NOx Atmosphere
121
Owing to sizable activation enthalpy associated with the intramolecular H transfer in reactions
3a and 5a, the initially formed N-derivative species must have competing exit routes. In Figure
5.6, each of the two NOx species departs the PE chain simultaneously with a β-hydrogen atom.
This results in concerted eliminations of nitroxyl (3b) and nitrous acid (5b), with modest
endothermic reaction enthalpies of 112.7 kJ/mol and 84.0 kJ/mol, in that order. The reactions
lead to the formation of alkenes, over moderate barrier heights of 124.1 kJ/mol (TS9) and 165.4
kJ/mol (TS10).
Figure 5.6. Concerted elimination of nitroxyl (HNO) and nitrous acid (HONO) from the
initial N-derivative species. Enthalpy vales are calculated at 298.15 K.
5.3.3. Formation of organic nitrites and nitrates
As previously established, the presence of oxygen produces a peroxy adduct. Along this
corridor, NO or NO2 bond with the outer oxygen atom of peroxy species. In urban areas with
high NOx concentration, addition of NO/NO2 remains the major sink for ROO˙ radicals.40, 62, 63
In gas phase, considering the typical rate parameters for this set of reactions,64, 65 and excessive
NOx level, the pseudo-first-order rate will predominate over the unimolecular reactions of
CHAPTER 5 — Oxidation of Polyethylene under Corrosive NOx Atmosphere
122
ROO˙ species.1, 53, 66 Figure 5.7 illustrates the formation of alkylperoxy nitrites (7a and 7b)
and alkylperoxy nitrates (8), by respective exothermic addition of NO (-131.7 kJ/mol and 117.0
kJ/mol) and NO2 (-261.0 kJ/mol) to the peroxyl group. Alkylperoxy nitrite has two
conformers; namely, the cis- and the relatively less stable trans-structures, depending on the
arrangement of the ROO-NO link. Structural rearrangement of cis-alkylperoxy nitrite (9a2) is
exothermic by 128 kJ/mol, requiring a barrier height of 96.8 kJ/mol (TS11a). Likewise, similar
reaction for trans-alkylperoxy nitrite species (9b2) reveals exothermicity of 142 kJ/mol, and a
reaction barrier of 118 kJ/mol (TS11b). Furthermore, dissociation of NO2 from the alkylperoxy
nitrite conformers (9a1 and 9b1) or alkyl nitrates (10) remain less probable due to the relatively
high endothermicity of the reactions involved.

CHAPTER 5 — Oxidation of Polyethylene under Corrosive NOx Atmosphere
123
Figure 5.7. Formation of organic nitrites and nitrates. Reactions with a1 and b1 subscripts
represent NO2 dissociation from the cis- and trans-peroxy adducts respectively, according to
Figure 5.3. Enthalpy vales are calculated at 298.15 K.

CHAPTER 5 — Oxidation of Polyethylene under Corrosive NOx Atmosphere
124
The progress of NO or NO2 addition to an OH-functionalised PE chain (18a – 21) follows the
same profile, with slight alterations in energetics. However, in OOH-functionalised PE chain,
structural transformation of trans-peroxy nitrite adduct appears barrierless, expressing the
reaction as concerted elimination and re-addition of NO2. Also, dissociation of NO2 leads to
the formation of hydroxyalkyl peroxy, as the H atom of the OOH group preferentially migrates
to the adjacent alkoxy end.
The usual O2 oxidation route contributes to the formation of alkoxy species.1, 56 These species
combine with NO molecules to form alkyl nitrites. As shown in Figure 5.8, such reactions
exhibit exothermicity of 178.8 kJ/mol (11), and the presence of neighbouring hydroxyl and
hydroperoxyl functional groups reduces the exothermicity of the reactions to 140.5 kJ/mol (22)
and 113.1 kJ/mol (32), respectively.
5.3.4. Thermodynamics and reaction kinetics
Figure 5.9 presents changes of thermodynamic potentials of reactions involving addition of NO
and NO2 molecules as function of temperature. Over the considered temperature range, the
exothermic reaction enthalpies display weak dependence on temperature. However, on a ΔrG˚
scale, the reactions become gradually less spontaneous as temperature increases. Such
occurrences can be attributed to the orderliness of the system (negative change of entropy) due
to disappearance of gaseous species, and from a thermodynamic outlook, the spontaneity of
these reactions requires low temperature. In a more practical sense, at high temperature, the
rate of kinetic processes increases, and the system can more easily attain equilibrium, as both
forward and backward reactions operate at higher rates.
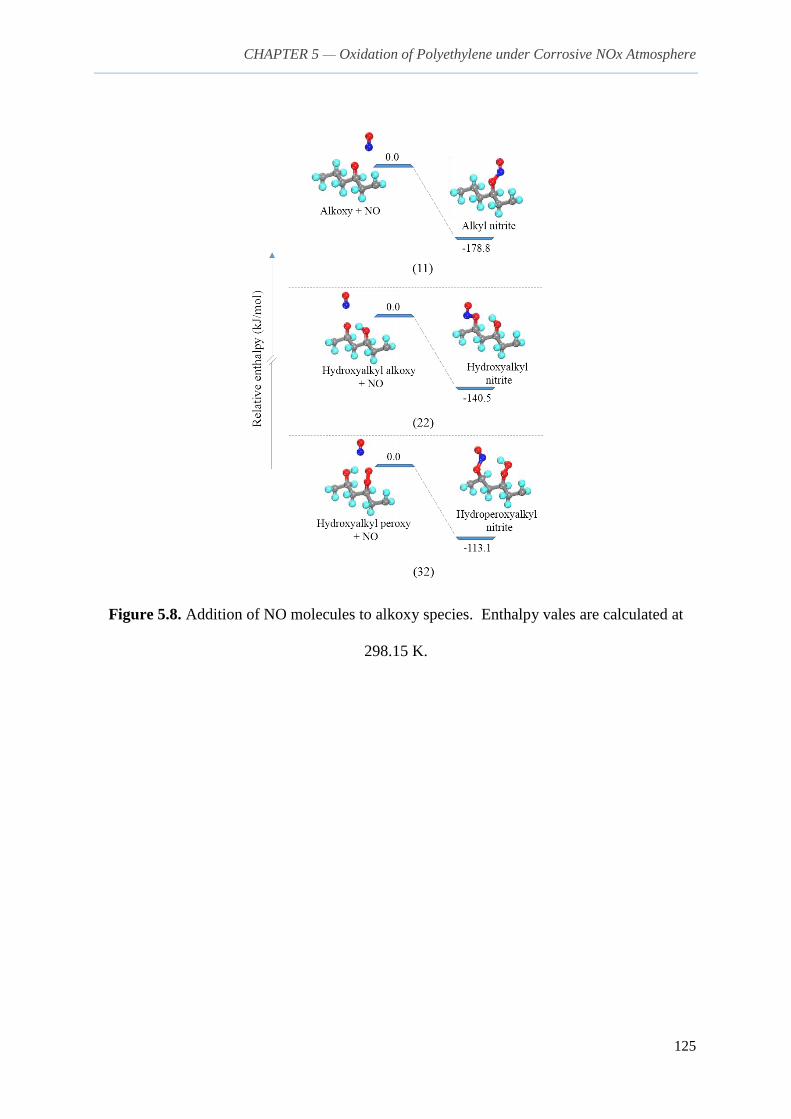
CHAPTER 5 — Oxidation of Polyethylene under Corrosive NOx Atmosphere
125
Figure 5.8. Addition of NO molecules to alkoxy species. Enthalpy vales are calculated at
298.15 K.

CHAPTER 5 — Oxidation of Polyethylene under Corrosive NOx Atmosphere
126
Figure 5.9. Variation of enthalpy (a), entropy (b) and Gibbs energy (c) with temperatures, for
all reactions attributed to addition of NO and NO2. Refer to Figure 5.3 for the corresponding
reaction sequences.

CHAPTER 5 — Oxidation of Polyethylene under Corrosive NOx Atmosphere
127
Reactions of polymers with NOx constitute an important factor responsible for deterioration
and chemical transformation of their macromolecular structures. Concerning carbon-chain
polymers containing no carbon‒carbon double bonds, pioneering studies16, 17 have confirmed
that, NO2 cannot abstract secondary and tertiary hydrogen atoms from PE and polypropylene
(PP) at 298 K, however at temperatures above 373 K, direct H-abstraction may occur.19, 20, 67
On the other hand, NO cannot abstract tertiary or allylic hydrogen from organic molecules, but
it readily reacts with free radicals to form nitroso compounds by addition to vacant radical
sites.20
Figure 5.10 depicts Arrhenius plots for several reactions comprising key radical intermediates,
and Table 5.1 assembles their respective reaction rate parameters in terms of activation energies
(Ea) and the Arrhenius pre-exponential A factors. Based on reaction rate constants reported in
Table 5.1, concerted eliminations of HNO (3b) and HONO (5b) dominate the fate of initially
formed nitroso- and nitroadducts, and tautomerisation of nitrosoalkyl compounds favours their
oxime derivatives. In case of nitroalkyls, the position of equilibrium lies towards the nitro
form. In addition, the rate parameters reveal that, alkylperoxy nitrites exhibit rapid structural
transformation into the corresponding alkyl nitrate species. While the rate parameters listed in
Table 5.1 remain valid for crystalline PE, they can also serve to describe similar reactions in
melted PE provided that, the Ea and A are accurately adjusted by considering the inversion or
transposition of the polymer into the liquid phase:
kliq = ksolid exp (-∆Hsolid→liq
RT) exp (
∆Ssolid→liq
R)

CHAPTER 5 — Oxidation of Polyethylene under Corrosive NOx Atmosphere
128
Unlike gas-to-liquid transposition,68 the energy term represents the heat of fusion required to
melt the polymeric material, and the positive change in entropy increases the A factor as the
system becomes more disordered in liquid phase.
Figure 5.10. Arrhenius plots for the studied reactions.
1.0 1.5 2.0 2.5 3.0 3.5-70
-60
-50
-40
-30
-20
-10
0
10
20
12
3
4
5
6
7
8
910
1112
1314
1516
1718
19202122
AB
C
D
E
F
G
H
I
J
K
LM
NO
PQ
RS
TU
V
log k
(s
-1)
or
(cm
3/(
moles
))
1000/T (K-1)
1b
1c
3a ()
3a ()
3b
5a ()
5a ()
5b
9a2
9b2
14 ()
14 ()
16 ()
16 ()
20a2
20b2
1 24 ()A 24 ()
26 ()
26 ()
30a2

CHAPTER 5 — Oxidation of Polyethylene under Corrosive NOx Atmosphere
129
Table 5.1. Kinetic parameters of reactions involving key radical intermediates.
As an extra note, hydroperoxide species constitute reactive intermediates in the oxidative
decomposition of polymers. Apart from their usual disappearance route,1 nitrogen oxides
Reaction Ea (kJ/mol)
A (s-1); for Reactions 1b and
1c, A [cm3/(mole s)]
1b: RH+ NO → R˙ + HNO 425.0 7.11 × 10¹⁹
1c: RH + NO2 → R˙ + HONO 383.6 1.57 × 1033
3aforward: RNO → RNOH 332.0 1.39 × 10¹⁴
3abackward: RNOH → RNO 382.0 1.71 × 10¹⁴
3b: RNO → R˙ + HNO 125.3 9.79 × 10¹¹
5aforward: RNO2 → RNO2H 290.0 8.91 × 10¹⁴
5abackward: RNO2H → RNO2 220.0 1.09 × 10¹⁹
5b: RNO2 → R˙+ HONO 167.4 6.54 × 10¹¹
9a2: cis-ROONO → RONO2 85.4 1.21 × 10⁵
9b2: trans-ROONO → RONO2 104.3 4.36 × 10³
14forward: OH‒RNO → OH‒RNOH 207.0 3.19 × 10¹⁵
14backward: OH‒RNOH → OH‒RNO 270.5 1.33 × 10¹⁷
16forward: OH‒RNO2 → OH‒RNO2H 133.8 3.50 × 10¹⁰
16backward: OH‒RNO2H → OH‒RNO2 67.0 3.87 × 10¹²
20a2: cis-OH‒ROONO → OH‒RONO2 64.3 1.20 × 10⁸
20b2: trans-OH‒ROONO → OH‒RONO2 83.9 7.16 × 10¹⁰
24forward: OOH‒RNO → OOH‒RNOH 223.1 1.31 × 10⁵
24backward: OOH‒RNOH → OOH‒RNO 289.1 1.08 × 10⁸
26forward: OOH‒RNO2 → OOH‒RNO2H 437.2 1.73 × 10¹¹
26backward: OOH‒RNO2H → OOH‒RNO2 358.8 1.15 × 10¹³
30a2: cis-OOH‒ROONO → OOH‒RONO2 52.5 9.55 × 10⁸

CHAPTER 5 — Oxidation of Polyethylene under Corrosive NOx Atmosphere
130
induce autoaccelerated decomposition of polymeric hydroperoxides. For instance, in PP, NO2
dimer initiates ROOH decomposition, resulting in the generation of a thermally unstable
peroxy nitrite20, 69 that undergoes fast intracage conversion into nitrate as in (9), (20) or (30) of
our proposed mechanism.
5.4. Conclusions
This contribution has analysed the primary initiation reactions occurring during aggressive
low-temperature oxidation of PE. In the NOx-laden atmosphere, formation of diverse nitrogen-
containing species ultimately accompanies the free-radical processes in solid PE. Nitroso and
nitroalkyl species appear as a result of respective addition of NO and NO2 molecule to a carbon
radical site in PE chain. Availability of a neighbouring chemical functional group alters the
thermodynamic and kinetic properties of the reactions. Concerted elimination of HNO and
HONO from nitroso- and nitroadducts, respectively, requires moderate activation energies,
compared with unimolecular tautomerisation of the adducts. The presence of molecular
oxygen induces the formation of peroxy species, that subsequently bond with NO and/or NO2,
thereby serving as a potential source of organic nitrites and nitrates. In comparison with
previous studies that substantiated the addition of nitrogen oxides to solid polymer resins, the
current investigation delivers the concrete thermodynamic evidence of such events, and
provides the reaction channels describing the fate of consequential nitrogenous species. On
this note, the thermochemical and kinetic parameters obtained in this study offer an improved
understanding of the polymer-gas reactions, and present insights into similar reaction
sequences in other crystalline polyolefins.

CHAPTER 5 — Oxidation of Polyethylene under Corrosive NOx Atmosphere
131
5.5. References
1. Oluwoye, I.; Altarawneh, M.; Gore, J.; Dlugogorski, B. Z., Oxidation of crystalline
polyethylene. Combust. Flame 2015, 162, (10), 3681-3690.
2. Barbucci, R., Integrated Biomaterials Science. Kluwer Academic/Plenum,: New York,
2002.
3. Peacock, A. J., Handbook of Polyethylene: Structures, Properties, and Applications.
Marcel Dekker: New York, 2000; p vii, 534 p.
4. Al-Salem, S. M.; Lettieri, P., Kinetic study of high density polyethylene (HDPE)
pyrolysis. Chem. Eng. Res. Des. 2010, 88, (12A), 1599-1606.
5. Bockhorn, H.; Hornung, A.; Hornung, U., Mechanisms and kinetics of thermal
decomposition of plastics from isothermal and dynamic measurements. J. Anal. Appl. Pyrolysis
1999, 50, (2), 77-101.
6. Bockhorn, H.; Hornung, A.; Hornung, U.; Schwaller, D., Kinetic study on the thermal
degradation of polypropylene and polyethylene. J. Anal. Appl. Pyrolysis 1999, 48, (2), 93-109.
7. Baum, B., The mechanism of polyethylene oxidation. J. Appl. Polym. Sci. 1959, 2, (6),
281-288.
8. Colin, X.; Fayolle, B.; Audouin, L.; Verdu, J., About a quasi-universal character of
unstabilised polyethylene thermal oxidation kinetics. Polym. Degrad. Stab. 2003, 80, (1), 67-
74.
9. Colin, X.; Khelidj, N.; Audouin, L.; Verdu, J. In Radiochemical aging of polyethylene:
a simplified approach for lifetime prediction, Solid Dielectrics, 2004. ICSD 2004. Proceedings
of the 2004 IEEE International Conference on, 5-9 July 2004, 2004; 2004; pp 296-299 Vol.1.

CHAPTER 5 — Oxidation of Polyethylene under Corrosive NOx Atmosphere
132
10. Devilliers, C.; Fayolle, B.; Laiarinandrasana, L.; Oberti, S.; Gaudichet-Maurin, E.,
Kinetics of chlorine-induced polyethylene degradation in water pipes. Polym. Degrad. Stab.
2011, 96, (7), 1361-1368.
11. Standard Terminology of Fire Standards. In ASTM International: West Conshohocken,
PA.
12. Gardette, M.; Perthue, A.; Gardette, J. L.; Janecska, T.; Foldes, E.; Pukanszky, B.;
Therias, S., Photo- and thermal-oxidation of polyethylene: Comparison of mechanisms and
influence of unsaturation content. Polym. Degrad. Stab. 2013, 98, (11), 2383-2390.
13. Gascoin, N.; Fau, G.; Gillard, P.; Mangeot, A., Experimental flash pyrolysis of high
density polyethylene under hybrid propulsion conditions. J. Anal. Appl. Pyrolysis 2013, 101,
45-52.
14. Khelidj, N.; Colin, X.; Audouin, L.; Verdu, J.; Monchy-Leroy, C.; Prunier, V.,
Oxidation of polyethylene under irradiation at low temperature and low dose rate. Part II. Low
temperature thermal oxidation. Polym. Degrad. Stab. 2006, 91, (7), 1598-1605.
15. Peterson, J. D.; Vyazovkin, S.; Wight, C. A., Kinetics of the thermal and thermo-
oxidative degradation of polystyrene, polyethylene and poly(propylene). Macromol. Chem.
Phys. 2001, 202, (6), 775-784.
16. Ogihara, T., Oxidative degradation of polyethylene in nitrogen dioxide. Bull. Chem.
Soc. Jpn. 1963, 36, (1), 58-63.
17. Ogihara, T.; Tsuchiya, S.; Kuratani, K., Initial stage of the oxidation reaction of
polyethylene by nitrogen dioxide. Bull. Chem. Soc. Jpn. 1965, 38, (6), 978-984.
18. Jellinek, H. H. G., Aspects of Degradation and Stabilization of Polymers. In Aspects of
Degradation and Stabilization of Polymers, Elsevier Scientific Pub. Co.: Amsterdam/New
York, 1977.

CHAPTER 5 — Oxidation of Polyethylene under Corrosive NOx Atmosphere
133
19. Jellinek, H. H.; Flajsman, F.; Kryman, F. J., Reaction of SO2 and NO2 with polymers.
J. Appl. Polym. Sci. 1969, 13, (1), 107-116.
20. Pariiskii, G. B.; Gaponova, I. S.; Davydov, E. Y., Reactions of nitrogen oxides with
polymers. Russ. Chem. Rev. 2000, 69, (11), 985-999.
21. Cooray, V.; Rahman, M.; Rakov, V., On the NOx production by laboratory electrical
discharges and lightning. J. Atmos. Sol.-Terr. Phys. 2009, 71, (17–18), 1877-1889.
22. Martinez, P.; Brandvold, D. K., Laboratory and field measurements of NOx produced
from corona discharge. Atmos. Environ. 1996, 30, (24), 4177-4182.
23. Rehbein, N.; Cooray, V., NOx production in spark and corona discharges. J.
Electrostatics 2001, 51–52, (0), 333-339.
24. Coppens, F.; Berton, R.; Bondiou-Clergerie, A.; Gallimberti, I., Theoretical estimate of
NOx production in lightning corona. J. Geophys. Res. 1998, 103, (D9), 10769-10785.
25. Sun, C.; Zhang, D.; Wadsworth, L. C., Corona treatment of polyolefin films—A review.
Adv. Polym. Tech. 1999, 18, (2), 171-180.
26. Zhang, D.; Sun, Q.; Wadsworth, L. C., Mechanism of corona treatment on polyolefin
films. Polym. Eng. Sci. 1998, 38, (6), 965-970.
27. Podhajny, R. M., Corona treatment of polymeric films. J. Plast. Film and Sheet. 1988,
4, (3), 177-188.
28. Clark, D. T.; Feast, W. J., Polymer Surfaces. Wiley: Chichester ; New York, 1978; p
xvi, 441 p.
29. Chan, C. M.; Ko, T. M.; Hiraoka, H., Polymer surface modification by plasmas and
photons. Surf. Sci. Rep. 1996, 24, (1–2), 1-54.
30. Inagaki, N., Plasma Surface Modification and Plasma Polymerization. Technomic:
Lancaster, Pa, 1996.

CHAPTER 5 — Oxidation of Polyethylene under Corrosive NOx Atmosphere
134
31. Fu, P.-F.; Tomalia, M. K., Carboxyl-terminated isotactic polypropylene. preparation,
characterization, kinetics, and reactivities. Macromolecules 2004, 37, (2), 267-275.
32. Melby, L. R., Nitric acid oxidation of high-density polyethylene. organic chemical
aspects. Macromolecules 1978, 11, (1), 50-56.
33. Abu-Jrai, A. M.; Yamin, J. A.; Ibrahim, K. A.; Al-Khashman, O. A.; Al-Shaweesh, M.
A.; Hararah, M. A.; Rashid, U.; Ahmad, M.; Walker, G. M.; Al-Muhtaseb, A. a. H., NOx
removal efficiency and N2 selectivity during selective catalytic reduction processes over Al2O3
supported highly cross-linked polyethylene catalysts. J. Ind. Eng. Chem. 2014, 20, (4), 1650-
1655.
34. Galloway, J. N.; Aber, J. D.; Erisman, J. W.; Seitzinger, S. P.; Howarth, R. W.;
Cowling, E. B.; Cosby, B. J., The nitrogen cascade. Bioscience 2003, 53, (4), 341-356.
35. Chilton, H. T. J.; Gowenlock, B. G., Reaction of nitric oxide with gaseous hydrocarbon
free radicals. Nature 1953, 172, (4367), 73-73.
36. Glarborg, P.; Alzueta, M. U.; Dam-Johansen, K.; Miller, J. A., Kinetic modeling of
hydrocarbon/nitric oxide interactions in a flow reactor. Combust. Flame 1998, 115, (1–2), 1-
27.
37. Chilton, H. T. J.; Gowenlock, B. G., 641. Reaction of nitric oxide with gaseous
hydrocarbon free radicals. Part I. Isopropyl radical. J. Chem. Soc. 1953, (0), 3232-3236.
38. Chilton, H. T. J.; Gowenlock, B. G., Reaction of nitric oxide with gaseous hydrocarbon
free radicals. Part II. Radicals produced by pyrolysis of di-n-butylmercury. J. Chem. Soc. 1954,
(0), 3174-3178.
39. Christie, M. I.; Gillbert, C.; Voisey, M. A., 599. The disproportionation of nitric oxide:
a reaction of nitroso-compounds. J. Chem. Soc. 1964, (0), 3147-3155.

CHAPTER 5 — Oxidation of Polyethylene under Corrosive NOx Atmosphere
135
40. Aschmann, S. M.; Long, W. D.; Atkinson, R., Pressure dependence of pentyl nitrate
formation from the OH radical-initiated reaction of n-pentane in the presence of NO. J. Phys.
Chem. A 2006, 110, (21), 6617-6622.
41. Lohr, L. L.; Barker, J. R.; Shroll, R. M., Modeling the organic nitrate yields in the
reaction of alkyl peroxy radicals with nitric oxide. 1. Electronic structure calculations and
thermochemistry. J. Phys. Chem. A 2003, 107, (38), 7429-7433.
42. Zhang, J.; Dransfield, T.; Donahue, N. M., On the mechanism for nitrate formation via
the peroxy radical + NO reaction. J. Phys. Chem. A 2004, 108, (42), 9082-9095.
43. Bernard, F.; Cazaunau, M.; Mu, Y.; Wang, X.; Daële, V.; Chen, J.; Mellouki, A.,
Reaction of NO2 with selected conjugated alkenes. J. Phys. Chem. A 2013, 117, (51), 14132-
14140.
44. Chan, W.-T.; Heck, S. M.; Pritchard, H. O., Reaction of nitrogen dioxide with
hydrocarbons and its influence on spontaneous ignition. A computational study. PCCP 2001,
3, (1), 56-62.
45. Giamalva, D. H.; Kenion, G. B.; Church, D. F.; Pryor, W. A., Rates and mechanisms
of reactions of nitrogen dioxide with alkenes in solution. J. Am. Chem. Soc. 1987, 109, (23),
7059-7063.
46. Bangee, O. D.; Wilson, V. H.; East, G. C.; Holme, I., Antioxidant-induced yellowing
of textiles. Polym. Degrad. Stab. 1995, 50, (3), 313-317.
47. Bart, J. C., Polymer Additive Analytics: Industrial Practice and Case Studies. Firenze
University Press: 2006; Vol. 14.
48. Delley, B., An all‐electron numerical method for solving the local density functional
for polyatomic molecules. J. Chem. Phys. 1990, 92, (1), 508-517.
49. Delley, B., From molecules to solids with the DMol3 approach. J. Chem. Phys. 2000,
113, (18), 7756-7764.

CHAPTER 5 — Oxidation of Polyethylene under Corrosive NOx Atmosphere
136
50. Avitabile, G.; Napolitano, R.; Pirozzi, B.; Rouse, K. D.; Thomas, M. W.; Willis, B. T.
M., Low temperature crystal structure of polyethylene: Results from a neutron diffraction study
and from potential energy calculations. J. Polym. Sci. Polym. Lett. Ed. 1975, 13, (6), 351-355.
51. Laidler, K. J.; King, M. C., Development of transition-state theory. J. Phys. Chem.
(1952) 1983, 87, (15), 2657-2664.
52. Vana Sickle, D. E.; Mill, T.; Mayo, F. R.; Richardson, H.; Gould, C. W., Intramolecular
propagation in the oxidation of n-alkanes. Autoxidation of n-pentane and n-octane. J. Org.
Chem. 1973, 38, (26), 4435-4440.
53. Pfaendtner, J.; Yu, X. R.; Broadbelt, L. J., Quantum chemical investigation of low-
temperature intramolecular hydrogen transfer reactions of hydrocarbons. J. Phys. Chem. A
2006, 110, (37), 10863-10871.
54. Luo, Y.-R., Handbook of Bond Dissociation Energies in Organic Compounds. CRC
press: 2002.
55. Blanksby, S. J.; Ellison, G. B., Bond dissociation energies of organic molecules. Acc.
Chem. Res. 2003, 36, (4), 255-263.
56. Battin-Leclerc, F., Detailed chemical kinetic models for the low-temperature
combustion of hydrocarbons with application to gasoline and diesel fuel surrogates. Prog.
Energy Combust. Sci. 2008, 34, (4), 440-498.
57. Altarawneh, M.; Dlugogorski, B. Z., Reactions of HO2 with n-propylbenzene and its
phenylpropyl radicals. Combust. Flame 2015, 162, (4), 1406-1416.
58. Altarawneh, M.; Dlugogorski, B. Z.; Kennedy, E. M.; Mackie, J. C., Theoretical study
of reactions of HO2 in low-temperature oxidation of benzene. Combust. Flame 2010, 157, (7),
1325-1330.
59. Bailey, P. D.; Morgan, K. M., Organonitrogen Chemistry. Oxford University Press:
Oxford, 1996; p 92 p.

CHAPTER 5 — Oxidation of Polyethylene under Corrosive NOx Atmosphere
137
60. Goldwhite, H., Chapter 6 - Nitrogen Derivatives of the Aliphatic Hydrocarbons. In
Rodd's Chemistry of Carbon Compounds (Second Edition), Coffey, S., Ed. Elsevier:
Amsterdam, 1964; pp 93-164.
61. Ahubelem, N.; Altarawneh, M.; Dlugogorski, B. Z., Dehydrohalogenation of ethyl
halides. Tetrahedron Lett. 2014, (35), 4860-4868.
62. Sehested, J.; Nielsen, O. J.; Wallington, T. J., Absolute rate constants for the reaction
of NO with a series of peroxy radicals in the gas phase at 295 K. Chem. Phys. Lett. 1993, 213,
(5–6), 457-464.
63. Atkinson, R.; Arey, J., Atmospheric degradation of volatile organic compounds. Chem.
Rev. 2003, 103, (12), 4605-4638.
64. Atkinson, R., Gas-phase tropospheric chemistry of volatile organic compounds: 1.
Alkanes and alkenes. J. Phys. Chem. Ref. Data 1997, 26, (2), 215-290.
65. Eberhard, J.; Howard, C. J., Rate coefficients for the reactions of some C3 to C5
hydrocarbon peroxy radicals with NO. J. Phys. Chem. A 1997, 101, (18), 3360-3366.
66. de Sainte Claire, P., Degradation of PEO in the solid state: a theoretical kinetic model.
Macromolecules 2009, 42, (10), 3469-3482.
67. Jellinek, H. H. G.; Toyoshima, Y., Reaction of nitrogen dioxide with polystyrene films.
J. Polym. Sci. Part A-1: Polym. Chem. 1967, 5, (12), 3214-3218.
68. Marongiu, A.; Bozzano, G.; Dente, M.; Ranzi, E.; Faravelli, T., Detailed kinetic
modeling of pyrolysis of tetrabromobisphenol A. J. Anal. Appl. Pyrolysis 2007, 80, (2), 325-
345.
69. Gaponova, I. S.; Pariiskii, G. B.; Zaikov, G. E., Decomposition of polypropylene
hydroperoxides induced by nitric oxide: New concept of reaction mechanism. J. Appl. Polym.
Sci. 2001, 80, (3), 407-414.

138
CHAPTER 6
Paper IV: Thermal Reduction of NOx with Recycled
Plastics
Oluwoye, I.; Dlugogorski, B. Z.; Gore, J.; Vyazovkin, S.; Boyron, O.; Altarawneh, M.,
Thermal Reduction of NOx with Recycled Polyethylene:. Environ. Sci. Technol. 2017, doi:
10.1021/acs.est.6b05560.
The paper has been reformatted for Australia English, and the Supporting Information is placed
as Appendix I in Chapter 10.
Fossil fuel combustion
Biomass firing
Power plants
Mining operationsDetonation of AN explosives
NOx from industrial
processes
Waste plastics
Low-emission combustion
Effective energy recovery system
Clean mine blasting operationsIsoconversional kinetics
Online IR and NOx scrutiny1
The chapter develops technology for mitigation of NOx formed in
thermal processes using waste polyethylene. It assesses the NOx
reduction efficiency of fragments of pyrolysing PE, providing the
kinetic evaluations for the thermal reactions
…

CHAPTER 6 — Thermal Reduction of NOx with Recycled Plastics
139
6.0. Abstract
This study develops technology for mitigation of NOx formed in thermal processes using
recycled plastics such as polyethylene (PE). Experiments involve sample characterisation, and
thermogravimetric decomposition of PE under controlled atmospheres, with NOx concentration
relevant to industrial applications. TGA–Fourier transform infrared (FTIR) spectroscopy and
NOx chemiluminescence serve to obtain the removal efficiency of NOx by fragments of
pyrolysing PE. Typical NOx removal efficiency amounts to 80 %. We apply the
isoconversional method to derive the kinetic parameters, and observe an increasing dependency
of activation energy with the reaction progress. The activation energies of the process span
135 kJ/mol – 226 kJ/mol, and 188 kJ/mol – 268 kJ/mol, for neat and recycled PE, respectively,
and the so-called compensation effect accounts for the natural logarithmic pre-exponential ln
(A/min-1) factors of ca 19 – 35 and 28 – 41, in the same order, depending on the PE conversion
in the experimental interval of between 5 and 95 %. The observed thermal delay of recycled
PE reflects different types of PE in the plastic, as well as possible molecular rearrangements
during the recycling processes. These measurements also provide data for kinetic modelling
of both isothermal and non-isothermal decomposition of PE in NOx atmosphere in practical
situations.

CHAPTER 6 — Thermal Reduction of NOx with Recycled Plastics
140
6.1. Introduction
Apart from its limited industrial and medical applications, oxides of nitrogen (NOx) contribute
to acid rain, eco-eutrophication, photochemical smog, ground level ozone, greenhouse effect,
stratospheric ozone depletion, and health deterioration (e.g., chronic respiratory and obstructive
pulmonary dysfunction) of predisposed organisms. Primarily, NOx consists of nitric oxide
(NO) and nitrogen dioxide (NO2). Typical anthropogenic emission of NOx (comprising mostly
NO) amounts up to 800 ppm in untreated combustion systems burning fossil/nitrogenous fuels
for power generation, and can soar as high as 500 ppm during decomposition of nitrate
oxidisers in some aviation propellants and mining-grade explosives.1-11
The quest for reliable NOx reduction has led to implementation of strict environmental
regulations and development of industrial-scale technologies. In combustion systems, these
technologies include fuel pre-treatment, combustion modification and post-treatment
techniques.12-14 Although post-flame gas clean-up remains viable, strategic modification of
combustion processes often controls NOx emission more economically.2,15,16
Noticeably, fuel reburning provides a commercially available technological retrofit that
appears more effective than alternative modifications of combustion processes. The process
abates NOx by using fuel as a reducing agent.17 Since 1950s, a number of practical and
experimental studies investigated the reburning technique,4,18-24 including a collateral effect of
SO2 reduction.25 Conceptually, reburning occurs in three stages (see Figure 6.1) to achieve
between 50 % and 85 % reduction in the total NOx emission. In the first stage (primary zone),
the main fuel burns under slightly fuel-lean condition. Afterwards, the produced NOx reacts
with supplementary hydrocarbon radicals in the “reburning zone” to form intermediate

CHAPTER 6 — Thermal Reduction of NOx with Recycled Plastics
141
nitrogenous species, and then molecular nitrogen (N2). Finally, addition of air in the last stage
(burnout zone) completes the combustion process by oxidising all unreacted fuels and reduced
N-species.2,4
Figure 6.1. Schematic diagram of the three stages of the reburning process.
Although, large-scale reburning systems usually rely on hydrocarbon gases (e.g., methane),
carbonaceous solid residues have proven equally suitable. Spliethoff et al. employed the
pyrolysate fragments of coal as a reburn fuel to mitigate NOx formation in a bench-scale
reburning facility, and attained good reduction efficiency of about 80 %.26 Likewise,
demonstrations of application of coal reburning in commercial boilers achieved excellent NOx
control averaged at around 70 % reduction efficiency.27-30 Biomass fuels such as wood, straw,
rice husk, bio-oil, sewage sludge, and carbonised municipal solid waste also provide effective
means of reducing NOx formation (50 – 75 %) in combustion systems.31-40 Yet surprisingly,
only a few studies assessed the performance of polymeric materials (e.g., waste tyres41-43) as a
secondary reburn fuel for NOx remediation.
NOx-rich flue gas
from primary
combustion zone
NO
HCN
NHi
NO
(ab
undan
t)
N2 + …
CHi
O2
(def
icie
nt)
Oxidation of
unreacted
hydrocarbons
and
intermediate
N-species
Primary fuel and air
Ash and flue gas
Gaseous; natural gas, C1-C3
Liquid; oil
Solid; coal, biomass,
sludge, polymers, etc.
Advanced reburning;
ammonia, urea supplements
Reburnfuel
Burnoutair

CHAPTER 6 — Thermal Reduction of NOx with Recycled Plastics
142
Unlike coal or biomass, plastics, such as polyethylene (PE), lack nitrogen functionalities that
can further contribute to fuel-NOx formation within the reburning zone. Owing to its high
calorific value, good volatile content and favourable combustion rate,44-46 waste PE finds
outlets in recycling processes such as thermal energy recovery, as it burns without prompting
environmental concerns, e.g., formation of pollutants and fire-related hazards.47,48
Measurements of pyrolytic conversion of PE to low-carbon gases in hybrid rocket
propulsion49,50 indicate the suitability of the polymer in reburning applications, and as a
potential NOx reductant during detonation of ammonium nitrate-based explosives in open-cut
mining operations.
To this end, the current study presents a series of experimental investigations of thermal
mitigation of NOx with PE. We hypothesis that, waste PE can potentially serve to reduce NOx
emission in industrial activities. We aim at solving two crucial environmental problems, to
develop a sustainable solution to NOx emission, and to provide additional means of dealing
with excessive plastic wastes in the society. In particular, we report the result of thermal
decomposition of PE in NOx atmosphere, providing a detailed analysis of reaction products.
The insights from the present study apply equally to abatement of NOx with materials laden
with PE, polyolefins/paraffins and pure carbon-hydrogen-type polymers, as well as to co-
combustion/pyrolysis of PE with nitrogen-rich fuels such as biomass and coal.

CHAPTER 6 — Thermal Reduction of NOx with Recycled Plastics
143
6.2. Experimental Section
6.2.1. Materials and sample characterisation
The experiments involved recycled polyethylene received in form of extruded black cylindrical
pellets, around 2.5 mm in diameter and 2 mm in length. We sliced the pellets into thin oblong
particles of uniform size distribution of between 250 μm and 400 μm. Sigma-Aldrich, USA,
provided neat low-density polyethylene, employed in control studies, to gauge the effect of
impurities in the recycled PE on its thermal and NOx-abatement behaviour. The attenuated
total reflectance (ATR) produced the IR spectra of the recycled PE, and a carbon-hydrogen-
nitrogen-sulfur (CHNS) elemental analyser yielded the elemental composition of the material.
Further analyses comprised the multi-detector high temperature size exclusion chromatography
(HT-SEC), ion (anion) chromatography (IC) and inductively coupled plasma optical emission
spectroscopy (ICP-OES) for determination of molecular mass distributions (MMD), halogens
and trace metals, respectively. Supporting Information (Chapter 10) includes details of these
analytical techniques. Table 6.1 itemises the molecular characteristics of the PE samples. The
FTIR spectrum of the recycled PE, documented in Figure 6.2, indicates no contamination with
other plastics, and Table 6.2 reveals the combined amount of metals and halogens, mostly Fe,
Ca and Cl, of less than 1 %. The recycled PE contains no sulfur, nitrogen, fluorine and
bromine-containing contaminants, confirming presence of no brominated flame retardants in
the sample.
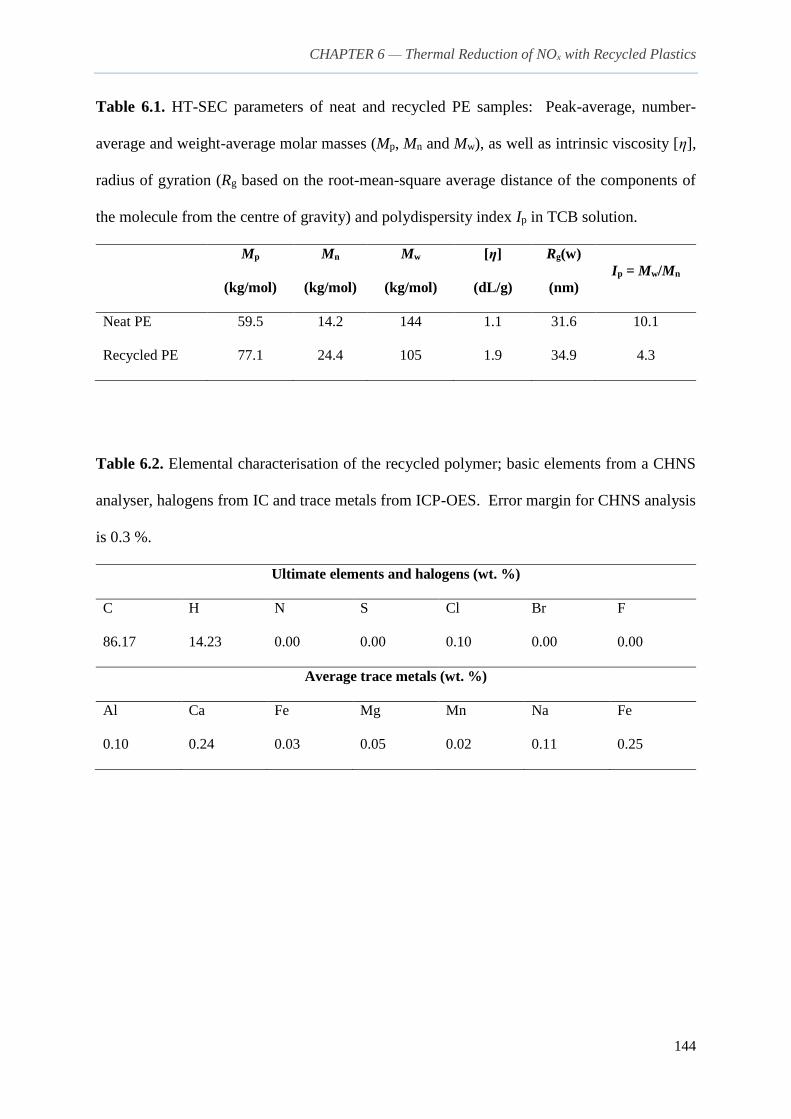
CHAPTER 6 — Thermal Reduction of NOx with Recycled Plastics
144
Table 6.1. HT-SEC parameters of neat and recycled PE samples: Peak-average, number-
average and weight-average molar masses (Mp, Mn and Mw), as well as intrinsic viscosity [η],
radius of gyration (Rg based on the root-mean-square average distance of the components of
the molecule from the centre of gravity) and polydispersity index Ip in TCB solution.
Mp
(kg/mol)
Mn
(kg/mol)
Mw
(kg/mol)
[η]
(dL/g)
Rg(w)
(nm)
Ip = Mw/Mn
Neat PE 59.5 14.2 144 1.1 31.6 10.1
Recycled PE 77.1 24.4 105 1.9 34.9 4.3
Table 6.2. Elemental characterisation of the recycled polymer; basic elements from a CHNS
analyser, halogens from IC and trace metals from ICP-OES. Error margin for CHNS analysis
is 0.3 %.
Ultimate elements and halogens (wt. %)
C H N S Cl Br F
86.17 14.23 0.00 0.00 0.10 0.00 0.00
Average trace metals (wt. %)
Al Ca Fe Mg Mn Na Fe
0.10 0.24 0.03 0.05 0.02 0.11 0.25

CHAPTER 6 — Thermal Reduction of NOx with Recycled Plastics
145
Figure 6.2. FT-IR spectrum of the recycled polymer.
6.2.2. Experimental methods
Figure 6.3 illustrates the complete schematics of the three arrangements of the experimental
apparatus. A carefully calibrated (by melting point standards) PerkinElmer STA 8000 system
facilitated all thermogravimetric analyses (TGA), with the quantitation of the gases performed
by infrared spectroscopy (TGA-FTIR, PerkinElmer Frontier) and chemiluminescence (TGA-
NOx, Thermo Scientific model 42i-HL). All TGA experiments involved three replicable runs
(Figure S6.4) of 5.2 ± 0.2 mg samples, placed in alumina crucible, subjected to the nominal
heating rates of 5, 10, 15, and 20 K/min, bracketing temperatures between 25 C to 600 C in
argon, synthetic air and NOx (610 ± 5 ppm NO and 18 ± 3 ppm NO2 with balance of dry helium
gas) atmosphere. The continuous flow rate of the purge gases amounted to 80 mL/min, as
measured under the standard temperature and pressure (STP). Blank runs completed under
identical conditions to the production experiments yielded the thermal buoyancy corrections.

CHAPTER 6 — Thermal Reduction of NOx with Recycled Plastics
146
We have achieved excellent reproducibility of the TGA results (Figure S6.3 of Supporting
Information).
Figure 6.3. Schematics of adopted experimental configurations. A standalone
thermogravimetry apparatus (TGA, top) eliminates any unwanted experimental artefacts that
could be carried over into the subsequent kinetic evaluations. Hyphenated TGA–FTIR
(middle) and TGA–NOx analyser (bottom) enabled identification and quantitation of evolved
gases.

CHAPTER 6 — Thermal Reduction of NOx with Recycled Plastics
147
The TGA-FTIR and TGA-NOx measurements required larger sample sizes of 10.2 ± 0.2 mg to
improve the detection and quantitation of gaseous species. The FTIR spectrometer averaged
two accumulated scans per spectrum at 1 cm-1 resolution. This resulted in a temporal resolution
of 30 s, which we found sufficient even for the fastest temperature TGA ramp of 20 K/min.
The TGA-FTIR set-up incorporated an electrically heated transfer line (PerkinElmer TL 8500)
linking the TGA system to 100 mm path-length online gas sampling cell placed inside the FTIR
compartment. Both the sample line and the sampling cell operated at 220 C, to avoid the
condensation of product volatiles prior and during the analysis. An externally controlled
vacuum pump maintained a balanced flow throughout the system. The lag time between the
TGA and FTIR corresponded to 10 s, requiring a time-delay correction for comparison of the
mass-loss and the evolved gas-composition signals.
6.3. Results and Discussion
6.3.1. Thermal decomposition of PE in NOx atmosphere and evolved gas analysis
Figure 6.4 presents the characteristic thermogravimetric measurements of neat and recycled
PE, as the samples decompose under Ar, He-NOx and air atmospheres. In agreement with
previous studies, in inert argon purge, the pyrolysis proceeds in an apparent single-step process
that commences at around 446 °C (extrapolated onset temperature), attains a maximum at
around 477 °C, and then rapidly slows down owing to depletion of the material, to cease by
490 °C (extrapolated offset temperature). The residual char and ash constitutes about 0.8 %
for neat and 2 % for the recycled PE, respectively. Furthermore, the presence of oxygen

CHAPTER 6 — Thermal Reduction of NOx with Recycled Plastics
148
triggers multi-step, low-temperature, peroxy-channelled reactions, because of O2 addition to
radical sites in the polymer chains.51
Figure 6.4. TGA curves for the thermal decomposition of neat (a) and recycled (b) PE in
different purge atmospheres at a nominal heating rate of 10 K/min. Inset plots magnify the
respective normalised derivatives of the thermal events. NOx denotes a mixture of 610 ppm
NO and 18 ppm NO2 in balance of dry helium.
50 100 150 200 250 300 350 400 450 500 550 600
0
10
20
30
40
50
60
70
80
90
100
200 300 400 500 600
0.0
0.1
0.2
0.3
474 479
424
Mas
s per
cent
(%)
Temperature (°C)
Argon
NOx
Air
-(d
m/d
t)/m
o
Temperature (°C)
50 100 150 200 250 300 350 400 450 500 550 600
0
10
20
30
40
50
60
70
80
90
100
200 300 400 500 600
0.0
0.1
0.2
0.3
398
471
420
Mas
s p
erce
nt
(%)
Temperature (°C)
Argon
NOx
Air
477
-(d
m/d
t)/m
o
Temperature (°C)
(a)
(b)

CHAPTER 6 — Thermal Reduction of NOx with Recycled Plastics
149
Under an inert shield gas, PE decomposes into a series of lower molecular weight
hydrocarbons, mostly linear n-alkanes and n-alkenes,48,50,52 and this can be monitored by the
series of CHi bands, most easily at 2922 cm-1 that corresponds to CH2 asymmetric stretch; see
Figure 6.5. Other evolved functional group characteristics include CH3 asymmetric and
symmetric stretches, C–H out-of-plane bend, CH2 rocking vibration and symmetric stretch, as
well as CH3 asymmetric bend. These species emerge within the temporal range, corresponding
to ca 400 °C – 500 °C, correlating well with the thermal decomposition period of the samples
shown in Figure 6.4.

CHAPTER 6 — Thermal Reduction of NOx with Recycled Plastics
150
Figure 6.5. IR monitoring of hydrocarbon bands evolved during thermal decomposition of
PE samples (10 mg) in two purge atmospheres at nominal heating rate of 20 K/min. The four
inset plots represent the maximum evolution events with respect to absorbance values, at
different time t. List of observed absorbance peaks (cm-1) - 2922: CH2 asymmetric stretch;
2850: CH2 symmetric stretch; CH3 asymmetric bend; 915/990: out-of-plane C–H bend; 723:
CH2 rocking vibration. CH2 bands overlap with the CH3 asymmetric stretch at 2962 and the
symmetric stretch at 2873.
The presence of NOx, delivered in helium bath gas, accelerates the thermal decomposition of
PE, resulting in the maximum rate of pyrolysis shifting from 477 °C (or 479 °C in the case of
recycled PE) to 471 °C and 474 °C, for neat and recycled PE, in that order. This acceleration
occurs due to the oxidative nature of NOx. The onset and completion temperatures, under He-
NOx purge, correspond to 433 and 483 °C as well as 444 and 486 °C, for neat and recycled PE,
respectively. The observed delay in the thermal events of recycled PE suggests different

CHAPTER 6 — Thermal Reduction of NOx with Recycled Plastics
151
molecular branching structures53 (Figure S6.1 of Supporting Information) as well as possible
confining activity of the constituent inorganic residues. Inorganic residues can form micro-
glassy layers that may become impenetrable to volatiles, hence inhibit the thermal breakdown
of the underlying organic matrices.54
As shown in Figure 6.6,55 below the decomposition temperature, the barrierless exothermic
addition of NO and NO2 follows the formation of radical sites in condensed-phase PE. This
process results in formation of C-nitroso and nitro species, respectively, and leads to internal
tautomerisation or concerted elimination of nitroxyl (HNO) and nitrous acid (HNO2). This set
of reactions can disrupt the C‒C bonding configurations, and in turn lower the overall enthalpic
requirements for the homolysis of the C‒C bond and unzipping of the polymer in the successive
β-scission reactions.56
Figure 6.6. Reaction networks for interactions between condensed-phase PE and aggressive
NOx species. Bolded values represent reaction enthalpies and values in italic correspond to
the activation enthalpies. All values (in kJ/mol) relate to respective reactants at 298.15 K.55

CHAPTER 6 — Thermal Reduction of NOx with Recycled Plastics
152
The peak value of 2922 cm-1 (Figure 6.5) reduces substantially when similar amount (10 mg)
of PE decomposes under NOx atmosphere, signifying decrease in concentration of CHi
fragments and hence, gas-phase reactions between the PE pyrolysates and the NOx gases. This
interaction involves several chain steps that can be globalised as4,40:
∑ CiHj + NO → HCN + ... (6.1)
In excess NOx, the HCN decays through series of intermediates, and ultimately reaches N2 via
the reverse Zeldovich reaction, Equation (6.5):
HCN + O → NCO + H (6.2)
NCO + H → NH + CO (6.3)
NH + H → N + H2 (6.4)
N + NO → N2 + O (6.5)
In the absence of fuel-N in PE, the other NH3 pathways remain dormant. The detection limit
of the employed gas cell (100 mm path-length and 11.3 cm3 volume) restrains the online
elucidation of nitrogenous species. However, the chemiluminescence analyser monitors the
NO/NOx profile ensuing under the dynamic thermal conditions. As illustrated in Figure 6.7 (as
well as Figures S6.11 and S6.12 in Supporting Information), within the decomposition regime
of the polymer, the experimental measurements show significant reduction of NOx up to 80 %.
The heating ramp affects the reaction via the Arrhenius term in the rate expression,57 dictating
the composition of the volatile species.48,50,58 Even though the moderate heating rates alter the
NOx conversion profile in Figure S12, the maximum conversion efficiency remains

CHAPTER 6 — Thermal Reduction of NOx with Recycled Plastics
153
approximately the same (Figure 6.7b). As explained earlier, although the recycled PE displays
a delay in the evolution of volatile fragments, the maximum NOx reduction efficiency remains
the same when compared to that of neat PE samples.
Figure 6.7. Typical NOx conversion history during the thermal decomposition of PE samples
(10 mg) in NOx atmosphere under a nominal heating rate of 20 K/min (a), and a comparison
of maximum possible conversion efficiency as function of the dynamic temperature ramp (b).
The overall weighted mean for NOx conversion corresponds to 81 %. Online NOx data
treatment involves response analysis (time-lag corrections), but it does not account for the
spatial dispersion in the system.
0
20
40
60
80
100
2010
Max
imu
m N
OX c
on
ver
sio
n (
%)
Heating rate (K/min)
Neat PE
Recycled PE
5
320 340 360 380 400 420 440 460 480 500 520
0
10
20
30
40
50
60
70
80
90
100
Neat PE
NO
NOx
Sample temperature (C)
Mas
s p
erce
nt
(%)
0
10
20
30
40
50
60
70
80
90
100
NO
x c
on
ver
sio
n (
%)
(a)
(b)

CHAPTER 6 — Thermal Reduction of NOx with Recycled Plastics
154
6.3.2. Degradation kinetics
As expected, the decomposition of PE exhibits strong dependency on the heating rate (Figures
6.4 and S6.4). This allows the application of the isoconversional principle,57 to obtain the
activation energy as function of the conversion α. As illustrated in Supporting Information,
the calculations rely on the advanced isoconversional method of Vyazovkin57,59 (Equation 6.6)
that provides an accurate estimation of activation energy values from the temperature integral,
as compared to Lyon,60 Kissinger-Akahira-Sunose,61 and Starink’s62 approximate approaches.
For a series of runs performed at different heating rates, the appropriate activation energy value
minimises the following function:
∅(𝐸𝛼) = ∑ ∑𝐼(𝐸𝛼, 𝑇𝛼,𝑖)𝛽𝑗
𝐼(𝐸𝛼, 𝑇𝛼,𝑗)𝛽𝑖
𝑛
𝑗≠𝑖
𝑛
𝑖=1
(6.6)
The subscripts i and j represent integer numbers of different experiments performed under
varying heating programs, i.e., i equals 1 – 3 for replicates, and j corresponds to 1 – 4 for
heating rates, and I(E,T) denotes the Arrhenius temperature integral. Furthermore, the so-
called compensation effect permits the determination of the pre-exponential factor A by the
substitution of integral form of various reaction models g(α) into numerical approximation of
Equation 6.57,63 Although this method relies on the assumption that the thermal process obeys
single-step kinetics, it can also provide a reasonable estimation64 of Aα dependency on α,
provided that the processes underlying this dependency follow a general model of f(α) = (1-
α)n. Figure S6.6 indicates that, the thermal decomposition of PE remains consistent with the

CHAPTER 6 — Thermal Reduction of NOx with Recycled Plastics
155
Mampel first order model of f(α) = (1-α) over the range of measured activation energies,
satisfying this requirement. Supporting Information provides detailed discussion of the
adopted method to determine the pre-exponential factor A.
Previous investigators obtained the kinetic parameters for the pyrolysis of neat PE. 51 Their
reported isoconversional activation energies (150 – 240 kJ/mol) match with our estimated
values of 160 – 255 kJ/mol. The illustrated growth in Eα (Figure 6.8b) is a result of change in
reaction mechanism. The initial low value relates to the initiation process occurring at the
defect sites in the polymer chain. Eα varies as the limiting step of the degradation process shifts
towards other mechanisms, such as unzipping, backbiting, random scission and
branching.48,51,65,66 As shown in Figure 6.8, the presence of ca 600 ppm of NOx lowers the Eα
values for the decomposition of neat PE by 13 – 18 %. Returning to Figure 6.4, both the neat
and recycled PE experience acceleration of degradation (shift to lower temperature) under NOx
atmosphere. However, the effect manifests itself differently in the kinetics. For neat PE, the
drop in Eα (Figure 6.8a) represents a lower energy barrier in the presence of NOx, hence reaction
is faster. On the contrary, Eα increases in the case of recycled PE, but Figure 6.4 depicts
accelerating reaction. This means that, the mechanism of acceleration for recycled PE differs
from that of neat PE. The observed acceleration during decomposition of recycled PE under
He-NOx relates to a higher pre-exponential A factor. This factor depends on MMD, in
particular on higher number-average molar mass (Mn in Table 6.1) for recycled PE. The
recycled PE comprises longer linear chains (as also evident from the higher value of intrinsic
viscosity [η] for recycled polymer in Table 6.1). The longer the chain that breaks during the
reaction with NOx, the higher entropy change, and larger the pre-exponential A factor.
.

CHAPTER 6 — Thermal Reduction of NOx with Recycled Plastics
156
Figure 6.8. Kinetic parameters accompanying the thermal decomposition of neat (a) and
recycled (b) PE in argon and He-NOx baths. The grey trend-shades depict accuracy
thresholds of the evaluated parameters.
The isoconversional kinetic parameters (plotted in Figure 6.8 and assembled in Tables S6.4
and S6.5 in Supporting Information) substituted in Equation 6.767 provide a means to estimate
the time (tα) needed to achieve a target conversion α under isothermal condition (T0):
0.0 0.2 0.4 0.6 0.8 1.00
40
80
120
160
200
240
280
0.0 0.2 0.4 0.6 0.8 1.025
30
35
40
45
E (
kJ/
mo
l)
Conversion ()
Argon
NOx
ln (
A/m
in-1)
0.0 0.2 0.4 0.6 0.8 1.00
40
80
120
160
200
240
280
0.0 0.2 0.4 0.6 0.8 1.0
20
25
30
35
40
E (
kJ/
mo
l)
Conversion ()
Argon
NOx
ln (
A/m
in-1)
(a)
(b)

CHAPTER 6 — Thermal Reduction of NOx with Recycled Plastics
157
tα =
1β ∫ exp (-
Eα
RT) dT
Tα
0
exp (-Eα
RT0)
(6.7)
Figure 6.9 provides validation of the kinetic evaluations. At moderate temperatures, our
calculated Eα values predict well (according to Equation 6.7) the conversion-time required to
reach a target conversion during the isothermal operation.
Figure 6.8. Isothermal decomposition of neat (a) and recycled (b) PE under the He-NOx
atmosphere at three moderate temperatures. Continuous lines represent experimental results,
and dotted points denote the corresponding theoretical predictions (up to α = 0.95) as
evaluated from Equation 6.7.
In practical applications, strict isothermal processing of PE would not be possible, as heating
and cooling do not occur at infinite rate. In such situations, for process design under non-
isothermal conditions, one can rely on the isoconversional data presented in Tables S6.4 and
S6.5. The fundamental kinetic and conversion measurements revealed in the current
0 5 10 15 20 25 300.0
0.2
0.4
0.6
0.8
1.0
0 5 10 15 20 25 300.0
0.2
0.4
0.6
0.8
1.0
Co
nv
ersi
on
(
)
Time (min)
450 C
470 C
500 C
Time (min)
450 C
470 C
500 C
(b)(a)

CHAPTER 6 — Thermal Reduction of NOx with Recycled Plastics
158
contribution make it possible to optimise practical systems for removal of NOx by pyrolysates
from neat and recycled PE.
6.4. Conclusions
In conclusion, the pyrolysates of PE reduced NOx content by about 80 % with PE decomposing
under the nonisothermal heating conditions. The maximum NOx reduction efficiency of
recycled PE remains approximately the same relatively to that of neat samples. The injection
of waste PE into a reburning zone of combustors may significantly reduce the emission of NOx.
Reburning of NOx in practical combustors usually occurs in a temperature window between
1000 °C and 1200 °C. Therefore, a change of the reaction mechanism may occur at those high
temperatures. A subsequent study should address the high-temperature isothermal and flash-
particle heating conditions in drop-tube experiments. This will reveal possible effects of the
presence of oxygen and mass transfer on the reaction of NOx with PE pyrolysates under realistic
reburning temperatures (i.e., 1000 – 1200 °C).
The Supporting Information is included in Chapter 10 (Appendix I) of the thesis. It comprises
the assessments of calibration and repeatability of TGA experiments, thermal characterisation
of recycled PE, derivation of cited equations, as well as analysis of the compensation effect,
complete isoconversional kinetic data, enlarged time-resolved FTIR spectra, and complete NOx
reduction trends.

CHAPTER 6 — Thermal Reduction of NOx with Recycled Plastics
159
6.5. References
1. Glarborg, P., Fuel nitrogen conversion in solid fuel fired systems. Prog. Energy
Combust. Sci. 2003, 29, (2), 89-113.
2. Hill, S. C.; Smoot, L. D., Modeling of nitrogen oxides formation and destruction in
combustion systems. Prog. Energy Combust. Sci. 2000, 26, (4-6), 417-458.
3. Williams, A.; Jones, J. M.; Ma, L.; Pourkashanian, M., Pollutants from the combustion
of solid biomass fuels. Prog. Energy Combust. Sci. 2012, 38, (2), 113-137.
4. Smoot, L. D.; Hill, S. C.; Xu, H., NOx control through reburning. Prog. Energy
Combust. Sci. 1998, 24, (5), 385-408.
5. Agrawal, J. P., High Energy Materials: Propellants, Explosives and Pyrotechnics.
Wiley-VCH: Weinheim, 2010.
6. Mahadevan, E. G., Ammonium Nitrate Explosives for Civil Applications: Slurries,
Emulsions and Ammonium Nitrate Fuel Oils. Wiley-VCH: Weinheim, 2013.
7. Attalla, M. I.; Day, S. J.; Lange, T.; Lilley, W.; Morgan, S., NOx emissions from
blasting operations in open-cut coal mining. Atmos. Environ. 2008, 42, (34), 7874-7883.
8. Chaturvedi, S.; Dave, P. N., Review on thermal decomposition of ammonium nitrate.
J. Energ. Mater. 2013, 31, (1), 1-26.
9. Attalla, M.; Day, S. J.; Lange, T.; Lilley, W.; Morgan, S., NOx Emissions from Blasting
in Open Cut Coal Mining in the Hunter Valley. CSIRO Energy Technology: 2007.
10. Galloway, J. N.; Aber, J. D.; Erisman, J. W.; Seitzinger, S. P.; Howarth, R. W.;
Cowling, E. B.; Cosby, B. J., The nitrogen cascade. Bioscience 2003, 53, (4), 341-356.
11. Seinfeld, J. H.; Pandis, S. N., Atmospheric chemistry and physics: from air pollution to
climate change. John Wiley & Sons: 2012.

CHAPTER 6 — Thermal Reduction of NOx with Recycled Plastics
160
12. Baukal, C. E.; Schwartz, R.; John Zink Company., The John Zink Combustion
Handbook. CRC Press: Boca Raton, Fla; London, 2001.
13. Boardman, R.; Smoot, L., Pollutant formation and control. Coal Sci. Technol 1993, 20,
433-509.
14. EPA, Nitrogen Oxide (NOx), Why and How They are Controlled (EPA 456/F-99-006R).
Clean Air Technology Center, United States Environmental Protection Agency: North
Carolina, 1999.
15. Ma, L.; Fang, Q.; Lv, D.; Zhang, C.; Chen, Y.; Chen, G.; Duan, X.; Wang, X., Reducing
NOx Emissions for a 600 MWe Down-Fired Pulverized-Coal Utility Boiler by Applying a
Novel Combustion System. Environ. Sci. Technol. 2015, 49, (21), 13040-13049.
16. Song, M.; Zeng, L.; Chen, Z.; Li, Z.; Zhu, Q.; Kuang, M., Industrial Application of an
Improved Multiple Injection and Multiple Staging Combustion Technology in a 600 MWe
Supercritical Down-Fired Boiler. Environ. Sci. Technol. 2016, 50, (3), 1604-1610.
17. Wendt, J. O. L.; Sternling, C. V.; Matovich, M. A., Reduction of sulfur trioxide and
nitrogen oxides by secondary fuel injection. Symp. (Int.) Combust. 1973, 14, (1), 897-904.
18. Patry, M.; Engel, G., Formation of HCN by the action of nitric oxide on methane at
atmospheric pressure, 1. General conditions of formation. Compt. rend 1950, 231, 1302-1304.
19. Pratapas, J.; Bluestein, J., Natural gas reburn: Cost effective NOx control. Power Eng.
(US) 1994, 98, (5), 47-51.
20. Alzueta, M. U.; Glarborg, P.; Dam-Johansen, K., Low temperature interactions between
hydrocarbons and nitric oxide: an experimental study. Combust. Flame 1997, 109, (1), 25-36.
21. Glarborg, P.; Alzueta, M. U.; Dam-Johansen, K.; Miller, J. A., Kinetic modeling of
hydrocarbon/nitric oxide interactions in a flow reactor. Combust. Flame 1998, 115, (1), 1-27.
22. Prada, L.; Miller, J., Reburning using several hydrocarbon fuels: a kinetic modeling
study. Combust. Sci. Technol. 1998, 132, (1-6), 225-250.

CHAPTER 6 — Thermal Reduction of NOx with Recycled Plastics
161
23. Spliethoff, H.; Greul, U.; Rüdiger, H.; Hein, K. R., Basic effects on NO x emissions in
air staging and reburning at a bench-scale test facility. Fuel 1996, 75, (5), 560-564.
24. Zabetta, E. C.; Hupa, M.; Saviharju, K., Reducing NOx emissions using fuel staging,
air staging, and selective noncatalytic reduction in synergy. Ind. Eng. Chem. Res. 2005, 44,
(13), 4552-4561.
25. Folsom, D. B. A.; Sommer, T. M.; Payne, D. R., Demonstration of combined NOx and
SO2 emission control technologies involving gas reburning. 1991.
26. Spliethoff, H.; Greul, U.; Rüdiger, H.; Magel, H. C.; Schnell, U.; Hein, K. R. G.; Li, C.
Z.; Nelson, P. F., NOx reduction using coal pyrolysis gas as reburn fuel: Effects of pyrolysis
gas composition. In Coal Sci. Technol., Pajares, J. A.; Tascón, J. M. D., Eds. Elsevier: 1995;
Vol. Volume 24, pp 1775-1778.
27. Demonstration of Coal Reburning for Cyclone Boiler NOx Control; DE-FC22-
90PC89659 U.S. Department of Energy, contracted to Babcock & Wilcox Company:
Barberton, OH, February, 1994
28. (CCT) Clean Coal Technology Demonstration Program: Program Update 2001;
DOE/FE-0444; U.S. Department of Energy: Washington, DC, July, 2002.
29. Li, S.; Xu, T.; Zhou, Q.; Tan, H.; Hui, S.; Hu, H., Optimization of coal reburning in a
1MW tangentially fired furnace. Fuel 2007, 86, (7), 1169-1175.
30. Zarnitz, R.; Pisupati, S., Identification of Significant Factors in Reburning with Coal
Volatiles. Environ. Sci. Technol. 2008, 42, (6), 2004-2008.
31. Adams, B.; Harding, N., Reburning using biomass for NOx control. Fuel Process.
Technol. 1998, 54, (1), 249-263.
32. Casaca, C.; Costa, M., NOx control through reburning using biomass in a laboratory
furnace: effect of particle size. P Combust Inst 2009, 32, (2), 2641-2648.

CHAPTER 6 — Thermal Reduction of NOx with Recycled Plastics
162
33. Harding, N. S.; Adams, B. R., Biomass as a reburning fuel: a specialized cofiring
application. Biomass Bioenergy 2000, 19, (6), 429-445.
34. Kicherer, A.; Spliethoff, H.; Maier, H.; Hein, K., The effect of different reburning fuels
on NOx-reduction. Fuel 1994, 73, (9), 1443-1446.
35. Maly, P.; Zamansky, V.; Ho, L.; Payne, R., Alternative fuel reburning. Fuel 1999, 78,
(3), 327-334.
36. Rüdiger, H.; Greul, U.; Spliethoff, H.; Hein, K. R. G., Distribution of fuel nitrogen in
pyrolysis products used for reburning. Fuel 1997, 76, (3), 201-205.
37. Salzmann, R.; Nussbaumer, T., Fuel staging for NOx reduction in biomass combustion:
experiments and modeling. Energy Fuels 2001, 15, (3), 575-582.
38. Casaca, C.; Costa, M., The effectiveness of reburning using rice husk as secondary fuel
for NOx reduction in a furnace. Combust. Sci. Technol. 2005, 177, (3), 539-557.
39. Pisupati, S. V.; Bhalla, S., Numerical modeling of NOx reduction using pyrolysis
products from biomass-based materials. Biomass Bioenergy 2008, 32, (2), 146-154.
40. Fang, P.; Tang, Z.-J.; Huang, J.-H.; Cen, C.-P.; Tang, Z.-X.; Chen, X.-B., Using sewage
sludge as a denitration agent and secondary fuel in a cement plant: A case study. Fuel Process.
Technol. 2015, 137, 1-7.
41. Nimmo, W.; Singh, S.; Gibbs, B.; Williams, P., The evaluation of waste tyre pulverised
fuel for NOx reduction by reburning. Fuel 2008, 87, (13), 2893-2900.
42. Singh, S.; Nimmo, W.; Gibbs, B.; Williams, P., Waste tyre rubber as a secondary fuel
for power plants. Fuel 2009, 88, (12), 2473-2480.
43. Su, Y.; Ren, L.; Deng, W., Experiment study on NO reduction by reburning of waste
tire. Procedia Environmental Sciences 2013, 18, 359-365.
44. Peacock, A. J., Handbook of Polyethylene: Structures, Properties, and Applications.
Marcel Dekker: New York, 2000.

CHAPTER 6 — Thermal Reduction of NOx with Recycled Plastics
163
45. Osborn, P. D., Handbook of Energy Data and Calculations Including Directory of
Products and Services. Butterworths: London, 1985.
46. Williams, E. A.; Williams, P. T., The pyrolysis of individual plastics and a plastic
mixture in a fixed bed reactor. J. Chem. Technol. Biotechnol. 1997, 70, (1), 9-20.
47. Kumar, S.; Panda, A. K.; Singh, R. K., A review on tertiary recycling of high-density
polyethylene to fuel. Resour. Conserv. Recy. 2011, 55, (11), 893-910.
48. Bockhorn, H.; Hornung, A.; Hornung, U.; Schwaller, D., Kinetic study on the thermal
degradation of polypropylene and polyethylene. J. Anal. Appl. Pyrolysis 1999, 48, (2), 93-109.
49. Chiaverini, M. J.; Kuo, K. K.; Lu, F. K., Fundamentals of Hybrid Rocket Combustion
and Propulsion. American Institute of Aeronautics and Astronautics,: Reston, Va., 2007.
50. Gascoin, N.; Fau, G.; Gillard, P.; Mangeot, A., Experimental flash pyrolysis of high
density polyethylene under hybrid propulsion conditions. J. Anal. Appl. Pyrolysis 2013, 101,
45-52.
51. Peterson, J. D.; Vyazovkin, S.; Wight, C. A., Kinetics of the thermal and thermo-
oxidative degradation of polystyrene, polyethylene and poly(propylene). Macromol. Chem.
Phys. 2001, 202, (6), 775-784.
52. Wu, J.; Chen, T.; Luo, X.; Han, D.; Wang, Z.; Wu, J., TG/FTIR analysis on co-pyrolysis
behavior of PE, PVC and PS. Waste Manage. (Oxford) 2014, 34, (3), 676-682.
53. Haney, M. A.; Johnston, D. W.; Clampitt, B. H., Investigation of short-chain branches
in polyethylene by pyrolysis - GCMS. Macromolecules 1983, 16, (11), 1775-1783.
54. Beyler, C. L.; Hirschler, M. M., Thermal decomposition of polymers. In SFPE
handbook of fire protection engineering, DiNenno, P. J., Ed. National Fire Protection
Association, Inc.: Massachusetts, 2002; Vol. 2, pp 110-131.
55. Oluwoye, I.; Altarawneh, M.; Gore, J.; Bockhorn, H.; Dlugogorski, B. Z., Oxidation of
polyethylene under corrosive NOx atmosphere. J. Phys. Chem. C 2016, 120, (7), 3766-3775.

CHAPTER 6 — Thermal Reduction of NOx with Recycled Plastics
164
56. Oluwoye, I.; Altarawneh, M.; Gore, J.; Dlugogorski, B. Z., Oxidation of crystalline
polyethylene. Combust. Flame 2015, 162, (10), 3681-3690.
57. Vyazovkin, S.; Burnham, A. K.; Criado, J. M.; Pérez-Maqueda, L. A.; Popescu, C.;
Sbirrazzuoli, N., ICTAC Kinetics Committee recommendations for performing kinetic
computations on thermal analysis data. Thermochim. Acta 2011, 520, (1–2), 1-19.
58. Bockhorn, H.; Hornung, A.; Hornung, U., Mechanisms and kinetics of thermal
decomposition of plastics from isothermal and dynamic measurements. J. Anal. Appl. Pyrolysis
1999, 50, (2), 77-101.
59. Vyazovkin, S., Advanced isoconversional method. J. Therm. Anal. 1997, 49, (3), 1493-
1499.
60. Lyon, R. E., An integral method of nonisothermal kinetic analysis. Thermochim. Acta
1997, 297, (1–2), 117-124.
61. Akahira, T.; Sunose, T., Method of determining activation deterioration constant of
electrical insulating materials. Res. Rep. Chiba Inst. Technol.(Sci. Technol.) 1971, 16, 22-31.
62. Starink, M. J., The determination of activation energy from linear heating rate
experiments: a comparison of the accuracy of isoconversion methods. Thermochim. Acta 2003,
404, (1–2), 163-176.
63. Coats, A. W.; Redfern, J. P., Kinetic Parameters from Thermogravimetric Data. Nature
1964, 201, (4914), 68-69.
64. Vyazovkin, S.; Linert, W., False isokinetic relationships found in the nonisothermal
decomposition of solids. Chem. Phys. 1995, 193, (1), 109-118.
65. Al-Salem, S. M.; Lettieri, P., Kinetic study of high density polyethylene (HDPE)
pyrolysis. Chem. Eng. Res. Des. 2010, 88, (12A), 1599-1606.

CHAPTER 6 — Thermal Reduction of NOx with Recycled Plastics
165
66. Gascoin, N.; Navarro-Rodriguez, A.; Gillard, P.; Mangeot, A., Kinetic modelling of
high density polyethylene pyrolysis: Part 1. Comparison of existing models. Polym. Degrad.
Stab. 2012, 97, (8), 1466-1474.
67. Vyazovkin, S., A unified approach to kinetic processing of nonisothermal data. Int. J.
Chem. Kinet. 1996, 28, (2), 95-101.

166
CHAPTER 7
Paper V: Enhanced Ignition of Biomass in Presence of
NOx
Oluwoye, I.; Dlugogorski, B. Z.; Gore, J.; Westmoreland, P.R.; Altarawneh, M., 12th
International Symposium on Fire Safety Science, Lund, Sweden. Special Issue in the Fire Saf.
J. 2017, doi.org/10.1016/j.firesaf.2017.03.042.
NOx - O2O2atmosphere atmosphere
Biomass
residue
500 C
350 C
The chapter demonstrates the effect of emitted NOx on ignition of biomass
residues. It elucidates the low-temperature interaction of NOx with biomass,
establishing the necessary bases for N-conversion at high temperatures as
later describe in Chapter 8
…

CHAPTER 7 — Enhanced Ignition of Biomass in Presence of NOx
167
7.0. Abstract
This chapter presents an experimental study on a relative effect of nitrogen oxides (NOx) on
ignition temperature of morpholine, an important surrogate of biomass, to reveal the sensitising
role of NOx in combustion of biomass fuels and to gain mechanistic insights into this behaviour.
The experiments employed a flow-through tubular reactor, operated at constant pressure and
residence time of 1.01 bar and 1.0 s, respectively, and coupled with a Fourier-transform
infrared spectroscope. For a representative fuel-rich condition ( = 1.25), the concentration of
NOx as small as 0.06 % lowers the ignition temperature of morpholine by 150 °C, i.e., from
approximately 500 °C to 350 °C. The density functional theory (DFT) calculations performed
with the CBS-QB3 composite method, that comprises a complete basis set, characterised the
dynamics and energies of the elementary nitration reactions. We related the observed reduction
in ignition temperature to the formation of unstable nitrite and nitrate adducts, as the result of
addition of NOx species to morphyl and peroxyl radicals. Furthermore, the reaction of NOx
with low-temperature hydroperoxyl radical leads to the formation of active OH species that
also propagate the ignition process. The present findings quantify the ignition behaviour of
biomass residues under NOx–doped atmospheres, the result that is of great importance in
practical applications.

CHAPTER 7 — Enhanced Ignition of Biomass in Presence of NOx
168
7.1. Introduction
Thermal interaction of biomass with oxides of nitrogen (NOx, mainly NO and NO2) has
important practical implications. While such interaction serves the intended industrial
purposes in low-emission combustion technologies,1-3 it has an unintended consequence of
degrading the safety of organic dust-producing plants. One reason for this is the particular way
in which NOx reacts with hydrocarbons, by accelerating their oxidation process.4,5 In other
words, NOx enhances the ignition of combustible materials, and this effect is generally referred
to as sensitisation via nitration reactions.6-10 The addition of NO and/or NO2, to fuel-oxygen
systems, significantly alters the overall kinetics by turning the usual low-temperature chain-
terminating steps of formation of peroxyl (RO2) radicals into a chain-propagating step.5
Premature ignition of biomass particles, as a result of the sensitising effect of NOx gases, can
lead to unexpected fires and dust explosions. The latter occur upon direct exposure of
combustible dust clouds (dispersed in air at concentrations above the flammability limit) to an
ignition source, such as electrical or electrostatic sparks, overheated powder particles, hot
surfaces, etc., within a certain degree of confinement.11-14 Wood dusts in the timber industry
display the same potential to explode as coal powders in underground mining operations.15,16
Minor quantities of NOx (e.g., from diesel engines) promote the primary ignition of small wood
particles. These enflamed particles prompt the formation of dust clouds creating conditions for
secondary deflagration or detonation. In fact, the industrial safety literature presents numerous
examples of explosions and fire accidents in wood-processing plants, for example,
sawmills.11,17-19 Biomass dusts form during harvesting, sizing, transportation, preparation,
storage, as well as through usage in combustion plants. Fire hazard arises when the dust
sediments (and suspensions) accumulate on hot surfaces of electrical, and mechanical devices,

CHAPTER 7 — Enhanced Ignition of Biomass in Presence of NOx
169
such as conveyers, dryers, hot bearings and other machineries.20 Although, the storage
conditions in silos aggravate the propensity for low temperature ignition,21-23 local conditions,
such as NOx presence from plant equipment, constitutes a contributing factor. Examples of
biomass-related fire incidents involved storage facilities and power plants.24
The complex nature of biomass necessitates the use of representative model compounds to gain
an understanding of the ignition, combustion and pyrolysis of biomass-derived fuels. These
model compounds include hetero-element species, also known as surrogates, embodying the
well-defined N- and O-functionalities within their structures.25-27 Morpholine (C4H9NO, 1-
oxa-4-aza-cyclohexane) represents an excellent surrogate species for an oxygen and nitrogen-
containing biofuel, due to its unique heterocyclic structure, well-characterised and studied
behaviour, and a wide range of industrial applications. Its N-, C-, and O-content correspond to
that revealed by ultimate analysis of typical biomass feedstocks. Furthermore, morpholine is
widely used as an impregnating agent for fruit, cardboard, and paper, and as a fuel additive.
The molecule also bears structural resemblance to ethanol, dimethyl ether, ethyl amine, and
dimethyl amine.26 Several investigations have described its decomposition, combustion,
ignition and flame characteristics.26,28-33
Accordingly, the present work focuses on experimental and theoretical aspects of initiation of
thermal decomposition of morpholine, as a model for oxygen and nitrogen-containing
compounds present in real biomass fuel, exposed to NOx-laden atmosphere. Our results offer
insights into the low-temperature nitration reactions that govern the interaction of biomass with
NOx. The conclusions drawn from the present work apply equally to herbaceous, woody and/or
chaff biomass.

CHAPTER 7 — Enhanced Ignition of Biomass in Presence of NOx
170
7.2. Applied Methodologies
7.2.1. Materials and experimental setup
Figure 7.1 provides a schematic representation of the experimental setup in which a digital
syringe pump delivered the reactant fuel (morpholine; TCI, purity > 99.0 %, 2.6 – 1.4 μL/min)
into the preheated combined stream of helium, NOx and oxygen gases flowing through the
system at combined rates of between 730 and 390 mL/min (at STP). The concentration of
morpholine in the diluted stream amounted to 1000 ppm on molar basis. An electrically heated
three-zone horizontal split furnace accommodated the quartz reactor tube, and ensured a well-
defined isothermal reaction zone (cf. Figure 7.1). The current experimental rig represents a
typical bench-scale flow-through tubular-reactor system employed in similar gas-phase kinetic
studies.34-38. The reactor operated at nominal Reynolds numbers of 7.8 (at 300 °C) – 2.8 (at
800 °C), indicating a laminar flow regime with an average hydrodynamic entry length of
approximately 0.9 % of the total reaction zone (300 mm). We maintained NOx concentration
at 620 ppm (600 ppm of NO and 20 ppm of NO2), adjusting the flow rate of O2 to maintain the
fuel-oxygen equivalence ratio of 1.25 (i.e., moderately fuel rich condition, also corresponds
to oxygen-fuel equivalent ratio λ = 0.8) as per the following stoichiometric reaction:
C4H9NO + 5.75O2 = 4CO2 + 4.5H2O + 0.5N2 (7.1)
We maintained a constant residence time of 1.0 s in the reaction zone, at ambient pressure of
1.01 bar, by regulating the flowrate. Charles’ temperature-volume relationship served to adjust
the gas flow rates metered by the mass flow controllers (MFC, operated at the room

CHAPTER 7 — Enhanced Ignition of Biomass in Presence of NOx
171
temperature) but preheated just before the reactor entry. Similarly, we employed a mass
balance to convert the flow rate of the fuel needed for the predefined concentration at
isothermal reaction temperature, into the corresponding set-values at room temperature. The
relatively small volume of the annual space of zones 1 and 3 (Figure 7.1) makes a minor
contribution to the overall reaction in the system. The volume of the preheating and cooling-
down zones amounts to 4 % of the reaction zone.
Fourier transform infrared (FTIR) spectroscopy facilitated online monitoring of product
species exiting the tubular reactor. The setup incorporated an electrically heated transfer line
(3.175 mm ID × 300 mm) linking the reactor to a small volume (100 mL) 2.4 m path-length
online gas sampling cell (Pike) placed inside the FTIR compartment. The spectrometer
averaged 64 accumulated scans per spectrum at 1 cm-1 resolution. Both the sample line and
the sampling cell operated at 140 C, to avoid the condensation of volatile products prior and
during the analysis.
Figure 7.1. Schematic representation of experiment rig. Symbol “T” denotes thermocouples.
.

CHAPTER 7 — Enhanced Ignition of Biomass in Presence of NOx
172
7.2.2. Computational methods
Gaussian 09 suite of programs39 served to study the structures of reacting species, transition
states, reaction products, as well as the dynamics and energetics of the nitration reactions
themselves.. The complete-basis-set CBS-QB340 composite method afforded all structural
optimisations, reaction enthalpies, as well as vibrational frequencies, using the tight
convergence criteria and rigid-rotor/harmonic-oscillator approximations. In agreement with
previous studies,30,33 the adopted computational method offers an accurate evaluation of
thermochemical properties of all species studied herein. The accuracy limit of the
computational basis set (CBS-QB3) usually settles within the mean absolute deviation of 6
kJ/mol from experimental values of gas-phase enthalpy.41-45 To confirm this, we have
computed the absolute mean error to be 4.5 kJ/mol for bond dissociation enthalpies (BDH) of
selected nitrogenated heterocyclic compounds (Table 7.1). Furthermore, the reported
exothermicity of O2 addition to o-morphyl (152 kJ/mol) and, m-morphyl (136 kJ/mol) concur
with the literature values of 148 and 136 kJ/mol, respectively.32

CHAPTER 7 — Enhanced Ignition of Biomass in Presence of NOx
173
Table 7.1. Comparison of the calculated CBS-QB3 BDH with the literature values for selected
heterocyclic hydrocarbons. Bracketed values in italics correspond to the results an alternative
high-level composite G4 method. The second last column assembles the experimental
estimates obtained from photoacoustic calorimetry (PAC), acidity–oxidation potential
measurements (AOP) and shock tube (ST) techniques, as well as one computational value
calculated at the G2(MP2) level of theory.
Heterocyclic
species Homolytic BDH reaction
Calculated CBS-
QB3 (and G4)
BDH (kJ/mol)
Experimental 46,47
and theoretical 48
BDH (kJ/mol)
Absolute
error
(kJ/mol)
Morpholine
393.8
(386.6)
393.3
PAC
0.5
(6.7)
377.1
(371.0)
384.9±8.4
PAC
7.8
(13.9)
Piperidine
381.9
(376.0)
385.0±10.0
PAC
3.1
(9.0)
451.1
(444.3) N/A N/A
Pyrrolidine
385.9
(377.9)
377.0±10.0
PAC
8.9
(0.9)
387.1
(387.6)
384.3
Theory
2.8
(3.3)
Pyrrole
505.6
(498.2)
495.4 ±4.2
ST
10.2
(2.8)
403.0
(397.4)
405.8
AOP
2.8
(8.4)
Mean absolute error 4.5
(5.6)

CHAPTER 7 — Enhanced Ignition of Biomass in Presence of NOx
174
7.3. Results and Discussion
7.3.1. Effect of NOx on ignition temperature of morpholine
As illustrated in Figure 7.2, the IR spectrum of vaporised morpholine (e.g. at 300 °C) contains
CH2 stretches (2840 – 2955 cm-1), CH2 scissors (1455 cm-1), CH2 wagging (1321 cm-1), and
oxazines signatures of C-O-C symmetric stretches (1237 cm-1, 1062 cm-1), asymmetric C-N-C
stretching (1320 cm-1) and aromatic N-H wag (712 cm-1). Previous studies on thermal
decomposition of morpholine28-33 have demonstrated the vulnerability of the heterocyclic ring
that readily opens up into linear adducts via homolytic cleavages and/or β-scissions at elevated
temperatures. Hence, we selected one of the aromatic group frequencies at 1132 cm-1 to
compute the fuel conversion, as indicated in Equation 7.2:
𝑋 = ⌊𝐴𝑏𝑠𝑖 − 𝐴𝑏𝑠𝑇
𝐴𝑏𝑠𝑖⌋ × 100 % (7.2)
where Absi denotes the initial concentration (proportional to absorbance value at 1132 cm-1) at
the reactor inlet, and AbsT stands for the concentration of the fuel at the reactor outlet. This
band represents a characteristic vibration of morpholine that does not appear in any of the
product species.

CHAPTER 7 — Enhanced Ignition of Biomass in Presence of NOx
175
Figure 7.2. IR spectrum of vaporised morpholine. I: CH2 stretches (2840 – 2955 cm-1), II:
CH2 scissors (1455 cm-1), III: CH2 wagging (1321 cm-1), IV: oxazines signatures of C-O-C
symmetric stretches (1237 cm-1, 1062 cm-1), V: asymmetric C-N-C stretches (1320 cm-1), VI:
aromatic N-H wag (712 cm-1), and VII: selected group frequency (1132 cm-1).
Figures 7.3a, 7.3b, 7.3c, and 7.3d depict the IR profiles in He, He-NOx, He-O2, and He-O2-
NOx, respectively. The additional low-temperature peaks (1755 – 1960 cm-1) appearing in
experiments for He-NOx and He-O2-NOx bath gases correspond to NO. The figures elucidate
the structural identities of the products exiting the reactor. At relatively low temperatures
(denoted by black-coloured spectra), the fuel remains unchanged, i.e., no detectable chemical
addition, decomposition, or isomerisation reactions occur. However, as the operating
temperature increases, morpholine converts into acetylene (C2H2), ethylene (C2H4),
formaldehyde (CH2O), methane (CH4), carbon monoxide (CO), carbon dioxide (CO2),
hydrogen cyanide (HCN) and ammonia NH3, depending on the composition of the inlet gas
mixture (indicated in red in Fig. 7.3). NOx concentration of 620 ppm, selected for experiments,
represents that of untreated diesel engine exhausts.

CHAPTER 7 — Enhanced Ignition of Biomass in Presence of NOx
176
Figure 7.3. IR profile of morpholine decomposition at different temperatures, in He (a), He-
NOx (b), He-O2 (c) and He-O2-NOx (d) atmospheres. Black coloured spectra correspond to
morpholine, with functional identities as described in the text of the chapter. Red coloured
spectra indicate obvious conversion to product species.
Figure 7.4 plots the fuel conversion, as well as the extrapolated onset ignition temperatures for
all experiments. The presence of NOx inhibits the decomposition of morpholine under
pyrolytic conditions. Under oxidative environment (i.e., in presence of O2), NOx reduces the
ignition temperature by 150 °C, i.e., from 500 °C to 350 °C. The trend is similar to that
experienced in other types of fuels.4,5,7-10,34-36 For instance, Bendtsen et al.4 reported that the
presence of NO or NO2 lowered the onset temperature for oxidation of methane (CH4) by 250
°C, at shorter residence time of 200 ms. This implies that, with an adequate heat/ignition
source, NOx can initiate premature atmospheric combustion of biomass residues. The present
measurements indicate that, safe operation of wood-working plants requires avoiding trace
concentration of NOx within the vicinity of dust-prone areas. This can be facilitated by proper
(and separate) venting of engine exhausts.

CHAPTER 7 — Enhanced Ignition of Biomass in Presence of NOx
177
Figure 7.4. Conversion profile of morpholine, at the reactor outlet, at different temperature
and atmospheres (left). The points have been connected by basis-spline function, as guide to
the eye, and extrapolated for determination of the onset ignition temperatures (right). The
two tangential lines indicate an example of extrapolation of the onset ignition temperature for
He-NOx condition.
7.3.2. Initial steps in nitration of morpholine
The initial reaction of NO/NO2 with biomass produces nitro and nitro species (Equations 7.3
and 7.4) which then decompose to generate two new radical species RO· and NO2/NO3. The
latter, chain-branching reactions, underpin the sensitising effect of NO/NO2.49 Equation 7.5
expresses the biomolecular O-abstraction.7
R· + NO → RNO (7.3)
R· + NO2 → RNO2 (7.4)
R· + NO2 → RO· + NO (7.5)

CHAPTER 7 — Enhanced Ignition of Biomass in Presence of NOx
178
Oxidative environments allow the biomolecular H-abstraction by triplet oxygen to form HO2
radicals (see Figure 7.5a), opening channels for the formation of peroxyl adducts (Reaction
7.6), an important combustion intermediates.50-54 Reactions 7.7 and 7.8 describe the
subsequent interaction of oxides of nitrogen with the peroxyl radicals.
R· + O2 → ROO· (7.6)
ROO· + NO → RO· + NO2 (7.7)
ROO· + NO2 ⇌ ROONO2 (7.8)
The thermal stability of peroxynitrate (RO2NO2) depends on the chemical nature of the R
backbone.55,56 It can dissociate back into peroxyl adduct, or preferably form alkoxy radical via
Reaction 7.9:57
ROONO2 → RO· + NO3 (7.9)
Previous studies35,38 described the importance of low temperature chemistry in understanding
the sensitisation effect of NOx during oxidation and ignition of hydrocarbons. In fact, these
calculations confirmed that, modelled results remain incomplete, as well as insensitive (to the
effect of NOx) without the inclusion of the low-temperature initiation in the overall mechanism.
Work is underway in our laboratory to produce a kinetic mechanism describing the initiation
reaction responsible for the enhanced ignition of morpholine by NO/NOx.
In the present context, initial decomposition of morpholine involves abstraction and direct
dissociation (under pyrolytic condition) of H atom and formation of three morphyl radicals,
namely, o-morphyl, m-morphyl and p-morphyl, depending on the relative position of the

CHAPTER 7 — Enhanced Ignition of Biomass in Presence of NOx
179
radical site to the oxazine O atom. Figure 7.5 illustrates the enthalpies (ΔrH°298) of these
reactions, and of the barrierless addition of molecular (triplet) oxygen.
Figure 7.5. Radical initiation of morpholine decomposition by H-abstraction (a) and H-
dissociation (b) and formation of peroxyl adducts. Reaction enthalpies (ΔrH°298) and Gibbs
energies (ΔrG°298, in bold and italic) are reported in kJ/mol at 298.15 K (25 ° C).
HO2 radical remains highly stable at low temperatures. However, NO reacts with HO2
according to Reactions 7.10,58-60 generating OH, an active propagating radical sustaining the
oxidation process. Reactions 7.11 61,62 and 7.12 63,64 illustrate the interaction of NO2 with HO2.
The nitrous acid (HNO2) also dissociates and/or reacts with H/O radicals to form OH species.
HO2 + NO → OH + NO2 k(T) = 3.5 × 10⁻¹² [cm3/molecule s] exp(250/T) (7.10)
HO2 + NO2 → HO2NO2 k(T) = 2.1 × 10⁻³¹ [cm6/molecule2 s] (T/298 K)-3.1 (7.11)
HO2 + NO2 → HNO2 + O2 k(296 K) = 5.0 × 10⁻¹⁶ [cm3/molecule s] (7.12)

CHAPTER 7 — Enhanced Ignition of Biomass in Presence of NOx
180
The appearance of radical sites (Figure 7.5) enables subsequent addition reactions. Figure 7.6
depicts the addition of NO/NO2 to morphyl radicals under inert atmosphere, such as that of He-
NOx. These reactions proceed without a barrier, and lead to formation of C-nitroso and nitro
species, respectively. The nitro products convert into more thermodynamically stable
tautomers (i.e., aci forms) by migration of α-H atom (i.e., from the ipso carbon atom) to the
nitro group. The nitroso and nitro compounds, except for nitromethane, are highly stable,65,66
and this explains why we observe no reduction to the onset temperature of decomposition of
morpholine under the He-NOx atmosphere. Along the same line of inquiry, Venkatesh et al. 67
also reported higher inert decomposition temperatures for 2- and 4-nitroimidazoles, relatively
to that of imidazole. The authors have demonstrated that, the underlying Arrhenius constants
remain relatively large for the nitro compounds.
Figure 7.6. Pyrolytic nitration of morpholine with NOx. Reaction enthalpies (ΔrH°298) and
Gibbs energies (ΔrG°298, in bold and italic) are reported in kJ/mol at 298.15 K (25 °C). The
reversibility signs indicate the preferred reaction direction based on thermodynamic
stabilities.

CHAPTER 7 — Enhanced Ignition of Biomass in Presence of NOx
181
Figure 7.7. Oxidative nitration of morpholine with NOx. Reaction enthalpies (ΔrH°298) and
Gibbs energies (ΔrG°298, in bold and italic) are reported in kJ/mol at 298.15 K (25 °C).
Bracketed digit implies corresponding trans conformation.
In presence of O2, hydrocarbons degrade along the peroxyl (ROO·) corridor50,51,68 into
oxidation products, such as aldehydes, epoxides, oxetanes, ketones and hydroxyl, with the first
step often involving the isomerisation (ROO·→ ·R’OOH). However, under NOx-containing
atmosphere (e.g. He-O2-NOx), as shown in Figure 7.7, NO/NO2 attaches to the outer oxygen
atom of peroxyl species, leading to formation of unstable organic peroxynitrites and
peroxynitrates, respectively. The addition channels release considerable amount of energy.
The heat feedback from the exothermicity of these reactions compensates the endothermicity
of reactions of Figure 7.4, sustaining the ignition process. Analogous reactions constitute the
major sink for ROO· in urban areas with high levels of NOx concentration.69-71 From a kinetic
viewpoint, considering the typical rate parameters for the addition of NO/NO2 to peroxyl
species,72,73 and the representative NOx level (i.e., ca 620 ppm), the bimolecular addition
reactions predominate over unimolecular isomerisation of ROO· adducts.

CHAPTER 7 — Enhanced Ignition of Biomass in Presence of NOx
182
7.4. Conclusions
This chapter presented new results from experimental measurements and theoretical
calculations on the ignition of a representative biomass surrogate, due to sensitising effect of
NOx. Approximately 620 ppm of NOx reduces the ignition temperature of morpholine by 150
°C under a characteristic fuel-rich condition. The formation of organic nitrites and nitrates
plays an important role in decreasing the ignition temperature of fuel in NOx-laden oxidative
environments, but has negligible contributions in pyrolytic decompositions. The addition
reactions exhibit significant exothermicity. Further studies at varying fuel-oxygen equivalence
ratio, and NOx concentrations will help elucidate the limit of the sensitising effect.
Measurements of the ignition induction time involving actual biomass should provide further
insights into this behaviour. We recommend other experimental parameters for assessing the
risk of biomass ignition, e.g., thermogravimetrically-derived apparent activation energy (Ea)
and the temperature of maximum rate of weight loss (TMWL).20,22,23,74 The thermochemical
parameters of low-temperature intermediates identified herein will facilitate the development
of an improved reaction mechanism.
7.5. References
1. Smoot, L. D.; Hill, S. C.; Xu, H., NOx control through reburning. Prog. Energy
Combust. Sci. 1998, 24, (5), 385-408.
2. Adams, B.; Harding, N., Reburning using biomass for NOx control. Fuel Process.
Technol. 1998, 54, (1), 249-263.

CHAPTER 7 — Enhanced Ignition of Biomass in Presence of NOx
183
3. Maly, P.; Zamansky, V.; Ho, L.; Payne, R., Alternative fuel reburning. Fuel 1999, 78,
(3), 327-334.
4. Bendtsen, A. B.; Glarborg, P.; Dam-Johansen, K., Low temperature oxidation of
methane: the influence of nitrogen oxides. Combust. Sci. Technol. 2000, 151, (1), 31-71.
5. Tan, Y.; Fotache, C.; Law, C., Effects of NO on the ignition of hydrogen and
hydrocarbons by heated counterflowing air. Combust. Flame 1999, 119, (3), 346-355.
6. Ashmore, P. G.; Levitt, B. P., Further studies of induction periods in mixtures of H2,
O2 and NO2. Symp. (Int.) Combust. 1958, 7, (1), 45-52.
7. Rasmussen, C. L.; Rasmussen, A. E.; Glarborg, P., Sensitizing effects of NOx on CH4
oxidation at high pressure. Combust. Flame 2008, 154, (3), 529-545.
8. Dagaut, P.; Lecomte, F.; Chevailler, S.; Cathonnet, M., Mutual sensitization of the
oxidation of nitric oxide and simple fuels over an extended temperature range: Experimental
and detailed kinetic modeling. Combust. Sci. Technol. 1999, 148, (1-6), 27-57.
9. Dagaut, P.; Luche, J.; Cathonnet, M., The low temperature oxidation of DME and
mutual sensitization of the oxidation of DME and nitric oxide: Experimental and detailed
kinetic modeling. Combust. Sci. Technol. 2001, 165, (1), 61-84.
10. Dayma, G.; Ali, K. H.; Dagaut, P., Experimental and detailed kinetic modeling study
of the high pressure oxidation of methanol sensitized by nitric oxide and nitrogen dioxide. P.
Combust. Inst. 2007, 31, (1), 411-418.
11. Abbasi, T.; Abbasi, S. A., Dust explosions – Cases, causes, consequences, and control.
J. Hazard. Mater. 2007, 140, (1–2), 7-44.
12. Amyotte, P. D., An Introduction to Dust Explosions: Understanding the Myths and
Realities of Dust Explosions for a Safer Workplace. Butterworth-Heinemann: 2013.
13. Cashdollar, K. L., Overview of dust explosibility characteristics. J. Loss Prev. Process
Indust. 2000, 13, (3–5), 183-199.

CHAPTER 7 — Enhanced Ignition of Biomass in Presence of NOx
184
14. Cross, J.; Farrer, D., Dust Explosions. Springer US: 2012.
15. Cashdollar, K. L., Coal dust explosibility. J. Loss Prev. Process Indust. 1996, 9, (1),
65-76.
16. Gillies, A.; Jackson, S., Some investigations into the explosibility of mine dust laden
atmospheres. In Coal Operators Conference Wollongong, 1998; pp 626–640.
17. Callé, S.; Klaba, L.; Thomas, D.; Perrin, L.; Dufaud, O., Influence of the size
distribution and concentration on wood dust explosion: Experiments and reaction modelling.
Powder Technol. 2005, 157, (1–3), 144-148.
18. National Fire Protection Association, NFPA 654: Standard for the Prevention of Fire
and Dust Explosions from the Manufacturing, Processing, and Handling of Combustible
Particulate Solids. In Massachusetts 2005.
19. National Fire Protection Association, NFPA 664: Standard for the Prevention of Fires
and Explosions in Wood Processing and Woodworking Facilities. In Massachusetts 2007.
20. Chin, Y. S.; Darvell, L. I.; Lea-Langton, A. R.; Jones, J. M.; Williams, A., Ignition risks
of biomass dust on hot surfaces. Energy Fuels 2016, 30, (6), 4398-4404.
21. Krause, U., Fires in Silos: Hazards, Prevention, and Fire Fighting. John Wiley & Sons:
2009.
22. Jones, J. M.; Saddawi, A.; Dooley, B.; Mitchell, E. J. S.; Werner, J.; Waldron, D. J.;
Weatherstone, S.; Williams, A., Low temperature ignition of biomass. Fuel Process. Technol.
2015, 134, 372-377.
23. Ramírez, Á.; García-Torrent, J.; Tascón, A., Experimental determination of self-heating
and self-ignition risks associated with the dusts of agricultural materials commonly stored in
silos. J. Hazard. Mater. 2010, 175, (1–3), 920-927.

CHAPTER 7 — Enhanced Ignition of Biomass in Presence of NOx
185
24. Todaka, M.; Kowhakul, W.; Masamoto, H.; Shigematsu, M., Thermal analysis and dust
explosion characteristics of spent coffee grounds and jatropha. J. Loss Prev. Process Indust.
2016, 44, 538-543.
25. Ren, Q.; Zhao, C., Evolution of fuel-N in gas phase during biomass pyrolysis. Renew.
Sustainable Energy Rev. 2015, 50, 408-418.
26. Kohse-Höinghaus, K.; Oßwald, P.; Cool, T. A.; Kasper, T.; Hansen, N.; Qi, F.;
Westbrook, C. K.; Westmoreland, P. R., Biofuel combustion chemistry: from ethanol to
biodiesel. Angew. Chem. Int. Ed. 2010, 49, (21), 3572-3597.
27. Lucassen, A.; Zhang, K.; Warkentin, J.; Moshammer, K.; Glarborg, P.; Marshall, P.;
Kohse-Höinghaus, K., Fuel-nitrogen conversion in the combustion of small amines using
dimethylamine and ethylamine as biomass-related model fuels. Combust. Flame 2012, 159,
(7), 2254-2279.
28. Nau, P.; Seipel, A.; Lucassen, A.; Brockhinke, A.; Kohse-Höinghaus, K., Intermediate
species detection in a morpholine flame: contributions to fuel-bound nitrogen conversion from
a model biofuel. Exp. Fluids 2010, 49, (4), 761-773.
29. Lucassen, A.; Oßwald, P.; Struckmeier, U.; Kohse-Höinghaus, K.; Kasper, T.; Hansen,
N.; Cool, T. A.; Westmoreland, P. R., Species identification in a laminar premixed low-
pressure flame of morpholine as a model substance for oxygenated nitrogen-containing fuels.
P. Combust. Inst. 2009, 32, (1), 1269-1276.
30. Lucassen, A.; Labbe, N.; Westmoreland, P. R.; Kohse-Höinghaus, K., Combustion
chemistry and fuel-nitrogen conversion in a laminar premixed flame of morpholine as a model
biofuel. Combust. Flame 2011, 158, (9), 1647-1666.
31. Altarawneh, M.; Dlugogorski, B. Z., A mechanistic and kinetic study on the
decomposition of morpholine. J. Phys. Chem. A 2012, 116, (29), 7703-7711.

CHAPTER 7 — Enhanced Ignition of Biomass in Presence of NOx
186
32. Dholabhai, P. P.; Yu, H.-G., Exploring the ring-opening pathways in the reaction of
morpholinyl radicals with oxygen molecule. J. Phys. Chem. A 2012, 116, (26), 7123-7127.
33. Li, S.; Davidson, D. F.; Hanson, R. K.; Labbe, N. J.; Westmoreland, P. R.; Oßwald, P.;
Kohse-Höinghaus, K., Shock tube measurements and model development for morpholine
pyrolysis and oxidation at high pressures. Combust. Flame 2013, 160, (9), 1559-1571.
34. Bromly, J. H.; Barnes, F. J.; Mandyczewsky, R.; Edwards, T. J.; Haynes, B. S., An
experimental investigation of the mutually sensitised oxidation of nitric oxide and n-butane.
Symp. (Int.) Combust. 1992, 24, (1), 899-907.
35. Bromly, J. H.; Barnes, F. J.; Muris, S.; You, X.; Haynes, B. S., Kinetic and
thermodynamic sensitivity analysis of the NO-sensitised oxidation of methane. Combust. Sci.
Technol. 1996, 115, (4-6), 259-296.
36. Bromly, J. H.; Barnes, F. J.; Nelson, P. F.; Haynes, B. S., Kinetics and modeling of the
H2-O2-NOx system. Int. J. Chem. Kinet. 1995, 27, (12), 1165-1178.
37. Glarborg, P.; Kubel, D.; Kristensen, P. G.; Hansen, J.; Dam-Johansen, K., Interactions
of CO, NOx and H2O Under Post-Flame Conditions. Combust. Sci. Technol. 1995, 110-111,
(1), 461-485.
38. Nelson, P. F.; Haynes, B. S., Hydrocarbon-NOx interactions at low temperatures—
1.Conversion of NO to NO2 promoted by propane and the formation of HNCO. Symp. (Int.)
Combust. 1994, 25, (1), 1003-1010.
39. Frisch, M.; Trucks, G.; Schlegel, H. B.; Scuseria, G.; Robb, M.; Cheeseman, J.;
Scalmani, G.; Barone, V.; Mennucci, B.; Petersson, G. e., Gaussian 09. In Gaussian, Inc.
Wallingford, CT: 2009.
40. Montgomery Jr, J. A.; Frisch, M. J.; Ochterski, J. W.; Petersson, G. A., A complete
basis set model chemistry. VI. Use of density functional geometries and frequencies. J. Chem.
Phys. 1999, 110, (6), 2822-2827.

CHAPTER 7 — Enhanced Ignition of Biomass in Presence of NOx
187
41. Bugler, J.; Somers, K. P.; Simmie, J. M.; Güthe, F.; Curran, H. J., Modeling nitrogen
species as pollutants: Thermochemical influences. J. Phys. Chem. A 2016, 120, (36), 7192-
7197.
42. Pokon, E. K.; Liptak, M. D.; Feldgus, S.; Shields, G. C., Comparison of CBS-QB3,
CBS-APNO, and G3 predictions of gas phase deprotonation data. J. Phys. Chem. A 2001, 105,
(45), 10483-10487.
43. Simmie, J. M., A database of formation enthalpies of nitrogen species by compound
methods (CBS-QB3, CBS-APNO, G3, G4). The Journal of Physical Chemistry A 2015, 119,
(42), 10511-10526.
44. Simmie, J. M.; Somers, K. P., Benchmarking compound methods (CBS-QB3, CBS-
APNO, G3, G4, W1BD) against the active thermochemical tables: a litmus test for cost-
effective molecular formation enthalpies. J. Phys. Chem. A 2015, 119, (28), 7235-7246.
45. Zeng, Z.; Altarawneh, M.; Oluwoye, I.; Glarborg, P.; Dlugogorski, B. Z., Inhibition and
promotion of pyrolysis by hydrogen sulfide (H2S) and sulfanyl radical (SH). J. Phys. Chem. A
2016, 120, (45), 8941-8948.
46. Luo, Y.-R., Handbook of Bond Dissociation Energies in Organic Compounds. CRC
press: 2002.
47. Wayner, D.; Clark, K.; Rauk, A.; Yu, D.; Armstrong, D., C−H Bond Dissociation
Energies of Alkyl Amines: Radical Structures and Stabilization Energies J. Am. Chem. Soc.
1997, 119, (38), 8925-8932.
48. Feng, Y.; Liu, L.; Wang, J.-T.; Zhao, S.-W.; Guo, Q.-X., Homolytic C−H and N−H
Bond Dissociation Energies of Strained Organic Compounds. J. Org. Chem. 2004, 69, (9),
3129-3138.
49. Oluwoye, I.; Altarawneh, M.; Gore, J.; Bockhorn, H.; Dlugogorski, B. Z., Oxidation of
polyethylene under corrosive NOx atmosphere. J. Phys. Chem. C 2016, 120, (7), 3766-3775.

CHAPTER 7 — Enhanced Ignition of Biomass in Presence of NOx
188
50. Battin-Leclerc, F., Detailed chemical kinetic models for the low-temperature
combustion of hydrocarbons with application to gasoline and diesel fuel surrogates. Prog.
Energy Combust. Sci. 2008, 34, (4), 440-498.
51. Oluwoye, I.; Altarawneh, M.; Gore, J.; Dlugogorski, B. Z., Oxidation of crystalline
polyethylene. Combust. Flame 2015, 162, (10), 3681-3690.
52. Pitz, W. J.; Mueller, C. J., Recent progress in the development of diesel surrogate fuels.
Prog. Energy Combust. Sci. 2011, 37, (3), 330-350.
53. Simmie, J. M., Detailed chemical kinetic models for the combustion of hydrocarbon
fuels. Prog. Energy Combust. Sci. 2003, 29, (6), 599-634.
54. Zador, J.; Taatjes, C. A.; Fernandes, R. X., Kinetics of elementary reactions in low-
temperature autoignition chemistry. Prog. Energy Combust. Sci. 2011, 37, (4), 371-421.
55. Kirchner, F.; Mayer–Figge, A.; Zabel, F.; Becker, K., Thermal stability of
peroxynitrates. Int. J. Chem. Kinet. 1999, 31, (2), 127-144.
56. Kirchner, F.; Thüner, L. P.; Barnes, I.; Becker, K. H.; Donner, B.; Zabel, F., Thermal
lifetimes of peroxynitrates occurring in the atmospheric degradation of oxygenated fuel
additives. Environ. Sci. Technol. 1997, 31, (6), 1801-1804.
57. Jagiella, S.; Zabel, F., Reaction of phenylperoxy radicals with NO2 at 298 K. PCCP
2007, 9, (36), 5036-5051.
58. Tyndall, G. S.; Cox, R. A.; Granier, C.; Lesclaux, R.; Moortgat, G. K.; Pilling, M. J.;
Ravishankara, A. R.; Wallington, T. J., Atmospheric chemistry of small organic peroxy
radicals. J. Geophys. Res. Atmos. 2001, 106, (D11), 12157-12182.
59. Zhou, S.; Barnes, I.; Zhu, T.; Bejan, I.; Benter, T., Kinetic study of the gas-phase
reactions of oh and NO3 radicals and O3 with selected vinyl ethers. J. Phys. Chem. A 2006, 110,
(23), 7386-7392.
CHAPTER 7 — Enhanced Ignition of Biomass in Presence of NOx
189
60. Gierczak, T.; Jimenez, E.; Riffault, V.; Burkholder, J. B.; Ravishankara, A., Thermal
decomposition of HO2NO2 (peroxynitric acid, PNA): Rate coefficient and determination of the
enthalpy of formation. J. Phys. Chem. A 2005, 109, (4), 586-596.
61. Christensen, L. E.; Okumura, M.; Sander, S. P.; Friedl, R. R.; Miller, C. E.; Sloan, J. J.,
Measurements of the Rate Constant of HO2 + NO2+ N2 → HO2NO2 + N2 Using Near-Infrared
Wavelength-Modulation Spectroscopy and UV− Visible Absorption Spectroscopy. J. Phys.
Chem. A 2004, 108, (1), 80-91.
62. Atkinson, R.; Baulch, D. L.; Cox, R. A.; Crowley, J. N.; Hampson, R. F.; Hynes, R. G.;
Jenkin, M. E.; Rossi, M. J.; Troe, J., Evaluated kinetic and photochemical data for atmospheric
chemistry: Volume I - gas phase reactions of Ox, HOx, NOx and SOx species. Atmos. Chem.
Phys. 2004, 4, (6), 1461-1738.
63. Tyndall, G. S.; Orlando, J. J.; Calvert, J. G., Upper Limit for the Rate Coefficient for
the Reaction HO2+ NO2 → HONO+ O2. Environ. Sci. Technol. 1995, 29, (1), 202-206.
64. Sander, S.; Golden, D.; Kurylo, M.; Moortgat, G.; Wine, P.; Ravishankara, A.; Kolb,
C.; Molina, M.; Finlayson-Pitts, B.; Huie, R. Chemical kinetics and photochemical data for use
in atmospheric studies evaluation number 15; Pasadena, CA: Jet Propulsion Laboratory,
National Aeronautics and Space Administration, 2006: 2006.
65. Bailey, P. D.; Morgan, K. M., Organonitrogen Chemistry. Oxford University Press:
Oxford, 1996; p 92 p.
66. Goldwhite, H., Chapter 6 - Nitrogen Derivatives of the Aliphatic Hydrocarbons. In
Rodd's Chemistry of Carbon Compounds (Second Edition), Coffey, S., Ed. Elsevier:
Amsterdam, 1964; pp 93-164.
67. Venkatesh, M.; Ravi, P.; Tewari, S. P., Isoconversional kinetic analysis of
decomposition of nitroimidazoles: Friedman method vs Flynn–Wall–Ozawa method. J. Phys.
Chem. A 2013, 117, (40), 10162-10169.

CHAPTER 7 — Enhanced Ignition of Biomass in Presence of NOx
190
68. Altarawneh, M.; Dlugogorski, B. Z.; Kennedy, E. M.; Mackie, J. C., Theoretical
investigation into the low-temperature oxidation of ethylbenzene. P. Combust. Inst. 2013, 34,
(1), 315-323.
69. Aschmann, S. M.; Long, W. D.; Atkinson, R., Pressure dependence of pentyl nitrate
formation from the OH radical-initiated reaction of n-pentane in the presence of NO. J. Phys.
Chem. A 2006, 110, (21), 6617-6622.
70. Atkinson, R.; Arey, J., Atmospheric degradation of volatile organic compounds. Chem.
Rev. 2003, 103, (12), 4605-4638.
71. Sehested, J.; Nielsen, O. J.; Wallington, T. J., Absolute rate constants for the reaction
of NO with a series of peroxy radicals in the gas phase at 295 K. Chem. Phys. Lett. 1993, 213,
(5–6), 457-464.
72. Atkinson, R., Gas-phase tropospheric chemistry of volatile organic compounds: 1.
Alkanes and alkenes. J. Phys. Chem. Ref. Data 1997, 26, (2), 215-290.
73. Eberhard, J.; Howard, C. J., Rate coefficients for the reactions of some C3 to C5
hydrocarbon peroxy radicals with NO. J. Phys. Chem. A 1997, 101, (18), 3360-3366.
74. Saddawi, A.; Jones, J. M.; Williams, A.; Le Coeur, C., Commodity fuels from biomass
through pretreatment and torrefaction: Effects of mineral content on torrefied fuel
characteristics and quality. Energy Fuels 2012, 26, (11), 6466-6474.
191
CHAPTER 8
Paper VI: Experimental Study on Thermal Reaction of
Modelled Biofuel (Morpholine) with NOx
Oluwoye, I.; Dlugogorski, B. Z.; Gore, J.; Altarawneh, M. Manuscript in preparation as an
extension of Chapter 7.
Industrial processes such as
combustion plants
Biomass and biofuels
Interaction of morpholine
with NOx
The chapter inspects the thermal interaction of NOx with biomass fuels.
It focuses on high-temperature reaction of biofuel surrogate (morpholine)
with NOx, elucidating the N-conversion profiles, and NOx-reduction
efficiency as compared to conventional hydrocarbon fuels
…
CHAPTER 8 — Experimental Study on Thermal Reaction of Modelled Biofuel (Morpholine) with NOx
192
8.0. Abstract
This chapter investigates the thermal reaction of a biomass surrogate (morpholine), with oxides
of nitrogen (NOx). At conditions pertinent to industrial applications, we synergistically
employed experimental and analytical techniques to explore the effect of NOx on the pyrolytic
and oxidative thermal decomposition of morpholine. A laboratory-scale tubular laminar-flow
reactor enabled a flexible optimisation of reaction parameters within the temperature range of
300 C to 1100 C at different helium/oxygen/NOx reactive mixtures. Fourier transform
infrared (FTIR) spectroscopy, NOx chemiluminescence analysis and gas chromatography
(μGC) supported the assessment of major gas products as well as the N-conversion profiles.
The results indicate that, the presence of NOx lowers the ignition temperature of the fuel via
nitration processes. Furthermore, at high temperature, above 800 C, the fuel effectively
convert NOx (ca 80 %) via HCN/NH3 oxidation channel, depending on the abundance of O2 in
the system. These findings shed light on biomass-NOx interactions occurring in various
industrial processes, such as interaction of reactive nitrogen species with biomass residues
during thermal firing of solid fuels, and particularly, in fuel stagging technology utilising
biomass as the major reburn fuel.

CHAPTER 8 — Experimental Study on Thermal Reaction of Modelled Biofuel (Morpholine) with NOx
193
8.1. Introduction
Practical interaction of biofuel and nitrogen oxides (NOx, mainly NO and NO2) occurs in
several industrial thermal processes. For instance, a broad assessment of biomass co-firing and
combustion framework reveals various NOx formation channels, categorically grouped as the
fuel, the thermal, and the prompt mechanisms. These channels serve as an active platform for
the NOx species (and its precursors) to react with volatile hydrocarbons, as well as the parent
biofuel. Such reactions can occur homogeneously within the gas-phase entities, and in form
of heterogeneous reaction with solid fuel residues.1-3
Furthermore, reburning technology serves in mitigating NOx formation during thermal
utilisation of solid fuels in combustion plants. The process basically involves the use of
secondary fuels (in a reburning zone) to reduce the NOx produced in a slightly lean-fuel
condition (primary zone) to intermediate nitrogenous species and molecular nitrogen (N2).4-7
Among other alternatives, it has been proven that the injection of organic-based materials such
as wood, straw, rice husk, bio-oil, sewage sludge, and carbonised municipal solid waste
effectively supports the reduction of NOx formation in this kind of combustion-modification
technology.8-17 Thus, it is essential to further understand the fundamental parameters
underpinning the thermal decomposition of biomass/biofuel in reactive NOx atmospheres, in
terms of product selectivity and NOx conversion efficiency.
The complex nature of biomass necessitates the use of representative model compounds in
understanding the conversion of nitrogen species during combustion and pyrolysis of biomass-
derived fuels. This includes hetero-element compounds, also known as surrogates, embodying
N- and O-functionalities within their structural entities.3,18 Morpholine (C4H9NO, 1-oxa-4-aza-

CHAPTER 8 — Experimental Study on Thermal Reaction of Modelled Biofuel (Morpholine) with NOx
194
cyclohexane) has been revealed as an excellent surrogate candidate for an oxygenated and
nitrogen-containing biofuel compound due to its unique structure and wide industrial
applications.18 The molecule bears structural resemblances to ethanol, dimethyl ether, ethyl
amine, as well as dimethyl amine, and it is widely used as an impregnating agent for fruit,
cardboard, and paper, and as a fuel additive.18 Its N-, C-, and O-content correspond to that
revealed by ultimate analysis of typical biomass feedstocks. Several studies have described its
decomposition, combustion, ignition and flame characteristics.18-24
To this end, the present chapter focuses on experimental aspects of high-temperature
decomposition of morpholine, as a model for oxygenated nitrogen-containing compounds
present in the real biomass fuel, in different NOx-laden atmospheres. As it furnished
knowledge to the conversion of fuel-N in excess NOx conditions, it also aims to provide insight
into the interaction of biomass with NOx ensuing during thermal energy recovery from biofuels,
and in fuel reburning technology utilising herbaceous, woody and/or chaff biomass as the
secondary reburn fuel. In addition, it can also help describe the effect of NOx, arising from
detonation of ammonium nitrate explosives, on the ignition of lignocellulosic materials in
open-cut mines.
8.2. Applied Methodologies
8.2.1. Materials and experimental apparatus
We obtained the morpholine chemical from commercial source (TCI, purity > 99.0 %). Figure
8.1 presents a schematic representation of the experimental apparatus in which a digital syringe
CHAPTER 8 — Experimental Study on Thermal Reaction of Modelled Biofuel (Morpholine) with NOx
195
pump delivered the reactant fuel (2.6 – 1.1 μL/min) into the preheated dilute stream of
helium/NOx/oxygen running through the reactor at combined rates of between 730 and 305
mL/min, at standard temperature and pressure (STP). The concentration of morpholine in the
diluted stream amounted to 1000 ppm on molar basis. An electrically heated three-zone
horizontal split furnace accommodated the quartz reactor tube, and ensured a well-defined
isothermal regime bracket a temperature range of 300 C and 1100 C. The use of helium
(99.999 %) as primary dilution gas allowed quantitative measurement of N2 formation. The
reactor operated at nominal Reynolds numbers of 7.8 (at 300 °C) – 1.8 (at 1100 °C), indicating
a laminar flow regime with an average hydrodynamic entry length of approximately 0.9 % of
the total reaction zone (300 mm).The NOx concentration remained constant at 620 ppm (600
ppm of NO and 20 ppm of NO2). During oxidative experimental conditions, we adjusted the
O2 concentration to deliver the fuel-oxygen equivalence ratio of 1.25 (i.e., moderately fuel
rich condition) as per the following stoichiometric reaction:
C4H9NO + 5.75O2 = 4CO2 + 4.5H2O + 0.5N2 (8.1)
We set a residence time of 1.0 s in the reaction zone at ambient pressure of 1.01 bar. The
reaction time corresponds to the average residence time in a practical reburning zone and a
typical experimental set-value in study of combustion of cyclic compounds.4,6 Furthermore,
we employed Charles’ temperature-volume relationships to adjust the gas flow rates metered
by the mass flow controllers (MFC, operated at the room temperature) but preheated just before
the reactor. Similarly, we employed a mass balance to convert the flow rate of the fuel needed
for the predefined concentration at isothermal reaction temperature, into the corresponding set-
values at room temperature. Due to the relatively small volume (4 % of the reaction zone) of
the annual preheating space of zone 1 (Figure 8.1), we conclude that the annual volume has

CHAPTER 8 — Experimental Study on Thermal Reaction of Modelled Biofuel (Morpholine) with NOx
196
negligible contribution in the system. The products exit into various assemblages designed for
appropriate sampling and quantitation.
Figure 8.1. Schematic representation of experiment setup. Symbol “T” denotes
thermocouples.
.
8.2.2. Product sampling and analyses
As illustrated in Figure 8.1, gaseous product analyses involved three parallel stages. Firstly,
FTIR spectroscopy (Perkin Elmer) facilitated online monitoring of product species exiting the
tubular reactor. The setup incorporated an electrically heated transfer line (3.175 mm ID × 300
mm) linking the reactor to a small volume (100 mL) 2.4 m path-length online gas sampling cell

CHAPTER 8 — Experimental Study on Thermal Reaction of Modelled Biofuel (Morpholine) with NOx
197
(Pike) placed inside the FTIR compartment. The spectrometer averaged 64 accumulated scans
per spectrum at 1 cm-1 resolution. Both the sample line and the sampling cell operated at 140
C, to avoid the condensation of product volatiles prior and during the analysis. Furthermore,
the chemiluminescence NOx analyser (Thermo Scientific model 42i-HL) monitored the
concentration of NO and NO2. Finally, the use of μGC (Agilent 490 micro-gas
chromatography, 20 m MolSieve-5A column, heated injection) assisted N2 quantitation. The
train of three impingers consisting of glass units filled with standardised 0.1 M H2SO4, 1 M
NaOH, and orange silica gel removed any contaminant species, e.g. ammonia and H2O that
could damage the GC column.
It must be noted that the spectroscopy technique25-27 has proven highly instrumental in the
detection and quantitation of the aforementioned gaseous nitrogenous compounds. QASoft
database (Infrared Analysis, Inc., Anaheim, CA) enabled semi-quantitation of the species by
their characteristic IR bands listed in Table 8.1. The accuracy of the measurements is highly
dependent upon the tolerance of the absorption coefficients of the reference spectra. This is
estimated to be within ±5 % in the QASoft library.

CHAPTER 8 — Experimental Study on Thermal Reaction of Modelled Biofuel (Morpholine) with NOx
198
Table 8.1. List of gaseous species studied, and their selected unique IR frequencies.
Compounds Chemical formula Analysis frequency (cm-1)
Methane CH4 3019 – 3011
Ethyne (acetylene) C2H2 729 (Q-branch)
Ethylene C2H4 950 (Q-branch)
Formaldehyde CH2O 1747 – 1743
Carbon monoxide CO 2171 – 2157
Carbon dioxide CO2 2420 – 2207
Hydrogen cyanide HCN 712 (Q-branch)
Ammonia NH3 1047 – 1045
Nitric oxide1 NO 1901 – 1900
1 Concentration confirmed by chemiluminescence NOx analyser.
8.3. Results and Discussion
8.3.1. Overview of ignition temperatures
We selected one of the group frequencies of morpholine (at 1132 cm-1) for quantitative
monitoring of the fuel conversion according to Equation 8.2:
𝛼 = ⌊𝐴𝑏𝑠𝑖 − 𝐴𝑏𝑠𝑇
𝐴𝑏𝑠𝑖⌋ × 100 % (8.2)
where Absi represents the initial concentration (proportional to absorbance value at 1132 cm-1)
before the thermal reaction, and AbsT denotes the concentration of the fuel at the outlet of the

CHAPTER 8 — Experimental Study on Thermal Reaction of Modelled Biofuel (Morpholine) with NOx
199
reactor. Figure 8.2 presents the conversion of morpholine under different gas-stream
conditions. It is evident that, the presence of NOx plays a crucial role in the ignition features
of the fuel. This can be attributed to the distinct way in which NOx reacts with hydrocarbons,
by accelerating their oxidation process.28,29 NOx enhances the ignition of organic fuels in a
process generally referred to as sensitisation via nitration reactions.30-34 The addition of NO
and/or NO2, to fuel-oxygen systems, significantly alters the overall kinetics by turning the usual
chain-terminating steps of formation of peroxy (RO2) radicals into a chain-propagating step.29
Figure 8.2. Conversion of morpholine at the outlet of the reactor, under different reaction
atmospheres. The extrapolated onset ignition temperatures amount to 581 °C, 613 °C, 494
°C, and 356 °C for He, He-NOx, He-O2, and He-O2-NOx conditions, respectively.
As shown in Chapter 7, the sensitisation of morpholine develops within the chain-propagating
NO/NO2 cycle.35 In the absence of oxygen, addition of NOx species to morphyl radicals
(formed as the result of H abstraction from the ortho, meta and para sites of morpholine)
operates via Equations 8.3 and 8.4:
300 400 500 600 700 800
0
20
40
60
80
100
Per
cen
t co
nv
ersi
on
(%
)
Temperature (C)
He
He-NOx
He-O2
He-O2-NO
x

CHAPTER 8 — Experimental Study on Thermal Reaction of Modelled Biofuel (Morpholine) with NOx
200
R· + NO → RNO (8.3)
R· + NO2 → RNO2 (8.4)
Furthermore, the presence of O2 allows the formation of peroxy (ROO·) adducts and
hydroperoxyl radical (HO2),36-40 that subsequently interact with NOx in following reactions:
R· + O2 → ROO· (8.5)
ROO· + NO → RO· + NO2 (8.6)
ROO· + NO2 ⇌ ROONO2 → RO· + NO3 (8.7)
HO2 + NO → OH + NO2 (8.8)
HO2 + NO2 → HNO2 + O2 (8.9)
8.3.2. Quantitative analysis of N-conversion at high temperatures
This section focuses on the formation of N-products, but also describes the consumption of
some major hydrocarbons species. As shown in Figure 8.3, the principal reaction products
include acetylene (C2H2), ethylene (C2H4), methane (CH4), formaldehyde (CH2O), carbon
monoxide (CO), carbon dioxide (CO2), hydrogen cyanide (HCN), ammonia (NH3) and nitric
oxide (NO), depending on the composition of the inlet gas mixture.

CHAPTER 8 — Experimental Study on Thermal Reaction of Modelled Biofuel (Morpholine) with NOx
201
Figure 8.3. Annotated IR spectra of product species during decomposition of morpholine at
different temperatures, in He (a), He-NOx (b), He-O2 (c) and He-O2-NOx (d) atmospheres.
Figure 8.4 plots the measured product species’ profiles over a wide range of temperatures, at
different atmospheres. The influence of these variables has been studied by measuring the
output concentration of the reaction zone of different nitrogenous species (NO, HCN, NH3),
carbonaceous species (in particular CO and CO2), and low molecular weight hydrocarbons
(C2H2, C2H4, CH4 and CH2O).

CHAPTER 8 — Experimental Study on Thermal Reaction of Modelled Biofuel (Morpholine) with NOx
202
Figure 8.4. Mole-fraction profile of selected product species during decomposition of
morpholine at different temperatures, in He (a), He-NOx (b), He-O2 (c) and He-O2-NOx (d)
atmospheres. The initial concentration of morpholine amounted to 1000 ppm; reaction
residence time equalled 1 s; and initial concentration of NO in (b) and (d) corresponded to
600 ppm.
Previous studies have describe the pyrolysis and oxidative decomposition of morpholine.19-24
The interaction of NO relies on the action of the hydrocarbon radicals/fragments originated
from the decomposition and/or oxidation of the hydrocarbon fuel. Radicals from the
morpholine fuel can originate by two important mechanisms: oxidation and/or thermal
decomposition. The thermal decomposition (i.e., pyrolysis) of hydrocarbons occurs at high
temperatures. However, the presence of oxygen initiates relatively low-temperature

CHAPTER 8 — Experimental Study on Thermal Reaction of Modelled Biofuel (Morpholine) with NOx
203
degradation. Hence, CHi radicals from the oxidation of hydrocarbons will be responsible for
the NO conversion at low temepratures.5 Comparing Figures 8.4a and 8.4b, the presence of
NOx somewhat reduced the concentration of the low molecular weight hydrocarbons. The
observed trend of CH2O match that of previous studies on its formation and destruction in
exhaust system of gas engines.41 The characteristic temperature regime for the oxidation
(Figures 8.4c and 8.4d) of the morpholine to CO and CO2 at similar reaction times differs
appreciably between the stream compositions. In the case of He-O2, the CO forms in relatively
lower concentration (at a temperature of approximately 500 °C) and rapidly increases to peak
at around 750 °C. Above this temperature, the CO concentration remains approximately
constant. He-O2-NOx results in higher CO concentration. However, the oxidation of CO to
CO2 is generally favoured at higher temperatures
The concentrations of NH3 and fuel-NOx appear negligible in all the experiments as compared
to the concentration of the total reactive nitrogenous species. Figure 8.4 shows that, the
interaction of NO with hydrocarbon radical increases HCN concentration. The subsequent role
of HCN remain highly dependent of the conditions that exist in the reaction zone. Reaction of
HCN with O2 recycled it into NO, while the total NOx (He-NOx + fuel NOx) converts it into
molecular nitrogen. The peak concentration of HCN, in oxidative conditions, also appears at
around 750 °C, after which it decreases significantly to its valley at higher temperatures.
Hence, the presence of oxygen in the reaction zone promotes the conversion of the intermediate
nitrogenous species to N2, since it is responsible for an increase of the radical pool.5,42-44

CHAPTER 8 — Experimental Study on Thermal Reaction of Modelled Biofuel (Morpholine) with NOx
204
8.3.3. Comments on NO reduction and formation of N2
Equation 8.10 defines the transient NO conversion in terms of NO concentrations at the inlet
of the reactor [NO]𝑖,inlet, the outlet of the reactor [NO]𝑖,outlet, and the diminutive NO
concentration in the decomposition product of morpholine [NO]𝑖,fuel. The subscript i denotes
the gas composition, i.e., with and without O2.
NO conversion =[NO]𝑖,inlet − ([NO]𝑖,outlet − [NO]𝑖,fuel)
[NO]𝑖,inlet× 100 % (8.10)
Figure 8.5a depicts the NO conversion efficiency of morpholine in pyrolytic and oxidative (
= 1.25) conditions. The results show that, HCN, formed from fuel-N transformation and as an
intermediate, plays crucial role in overall conversion of NO. The oxygen content of
morpholine also allowed low temperature NOx reduction during pyrolytic conditions, in
agreement with former experimental study on furan (C4H4O).45 The maximum NO conversion
amounts to approximately 83 %, at 900 °C, after which it decreases to 80 % due to the activity
of the reduction scheme at higher temperatures.4,5,44
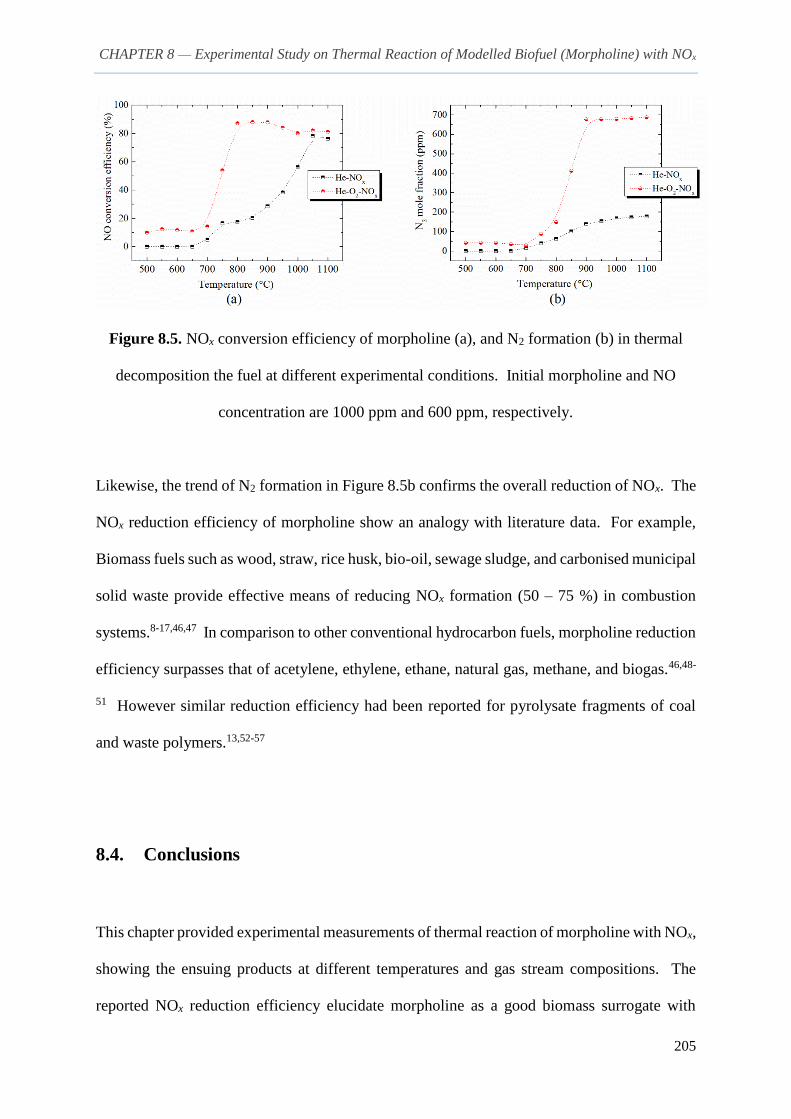
CHAPTER 8 — Experimental Study on Thermal Reaction of Modelled Biofuel (Morpholine) with NOx
205
Figure 8.5. NOx conversion efficiency of morpholine (a), and N2 formation (b) in thermal
decomposition the fuel at different experimental conditions. Initial morpholine and NO
concentration are 1000 ppm and 600 ppm, respectively.
Likewise, the trend of N2 formation in Figure 8.5b confirms the overall reduction of NOx. The
NOx reduction efficiency of morpholine show an analogy with literature data. For example,
Biomass fuels such as wood, straw, rice husk, bio-oil, sewage sludge, and carbonised municipal
solid waste provide effective means of reducing NOx formation (50 – 75 %) in combustion
systems.8-17,46,47 In comparison to other conventional hydrocarbon fuels, morpholine reduction
efficiency surpasses that of acetylene, ethylene, ethane, natural gas, methane, and biogas.46,48-
51 However similar reduction efficiency had been reported for pyrolysate fragments of coal
and waste polymers.13,52-57
8.4. Conclusions
This chapter provided experimental measurements of thermal reaction of morpholine with NOx,
showing the ensuing products at different temperatures and gas stream compositions. The
reported NOx reduction efficiency elucidate morpholine as a good biomass surrogate with

CHAPTER 8 — Experimental Study on Thermal Reaction of Modelled Biofuel (Morpholine) with NOx
206
efficiency values similar to that of actual biomass residues. In presence of oxygen, the
effectiveness of morpholine as NO reduction reagent compares well to that of C3H6. For
conventional hydrocarbon fuels, it has been demonstrated that the NO reduction efficiency
follows the order of C2H2 > C3H6 > CH4.48,58 Hence, morpholine should be more effective than
CH4, and better preferred to C2H2 that usually leads to the formation of NO2 rather than the
more desirable N2 or HCN. Finally, the O-content of morpholine permits NOx reduction at
relatively lower temperature, making it an excellent reburning fuel in O2-deficient
environment.
8.5. References
1. Hill, S. C.; Smoot, L. D., Modeling of nitrogen oxides formation and destruction in
combustion systems. Prog. Energy Combust. Sci. 2000, 26, (4-6), 417-458.
2. Glarborg, P., Fuel nitrogen conversion in solid fuel fired systems. Prog. Energy
Combust. Sci. 2003, 29, (2), 89-113.
3. Ren, Q.; Zhao, C., Evolution of fuel-N in gas phase during biomass pyrolysis. Renew.
Sustainable Energy Rev. 2015, 50, 408-418.
4. Smoot, L. D.; Hill, S. C.; Xu, H., NOx control through reburning. Prog. Energy
Combust. Sci. 1998, 24, (5), 385-408.
5. Alzueta, M. U.; Glarborg, P.; Dam-Johansen, K., Low temperature interactions between
hydrocarbons and nitric oxide: an experimental study. Combust. Flame 1997, 109, (1), 25-36.
6. Spliethoff, H.; Greul, U.; Rüdiger, H.; Hein, K. R., Basic effects on NOx emissions in
air staging and reburning at a bench-scale test facility. Fuel 1996, 75, (5), 560-564.

CHAPTER 8 — Experimental Study on Thermal Reaction of Modelled Biofuel (Morpholine) with NOx
207
7. Wendt, J. O. L.; Sternling, C. V.; Matovich, M. A., Reduction of sulfur trioxide and
nitrogen oxides by secondary fuel injection. Symp. (Int.) Combust. 1973, 14, (1), 897-904.
8. Adams, B.; Harding, N., Reburning using biomass for NOx control. Fuel Process.
Technol. 1998, 54, (1), 249-263.
9. Casaca, C.; Costa, M., NOx control through reburning using biomass in a laboratory
furnace: effect of particle size. P Combust Inst 2009, 32, (2), 2641-2648.
10. Harding, N. S.; Adams, B. R., Biomass as a reburning fuel: a specialized cofiring
application. Biomass Bioenergy 2000, 19, (6), 429-445.
11. Kicherer, A.; Spliethoff, H.; Maier, H.; Hein, K., The effect of different reburning fuels
on NOx-reduction. Fuel 1994, 73, (9), 1443-1446.
12. Maly, P.; Zamansky, V.; Ho, L.; Payne, R., Alternative fuel reburning. Fuel 1999, 78,
(3), 327-334.
13. Rüdiger, H.; Greul, U.; Spliethoff, H.; Hein, K. R. G., Distribution of fuel nitrogen in
pyrolysis products used for reburning. Fuel 1997, 76, (3), 201-205.
14. Salzmann, R.; Nussbaumer, T., Fuel staging for NOx reduction in biomass combustion:
experiments and modeling. Energy Fuels 2001, 15, (3), 575-582.
15. Casaca, C.; Costa, M., The effectiveness of reburning using rice husk as secondary fuel
for NOx reduction in a furnace. Combust. Sci. Technol. 2005, 177, (3), 539-557.
16. Pisupati, S. V.; Bhalla, S., Numerical modeling of NOx reduction using pyrolysis
products from biomass-based materials. Biomass Bioenergy 2008, 32, (2), 146-154.
17. Fang, P.; Tang, Z.-J.; Huang, J.-H.; Cen, C.-P.; Tang, Z.-X.; Chen, X.-B., Using sewage
sludge as a denitration agent and secondary fuel in a cement plant: A case study. Fuel Process.
Technol. 2015, 137, 1-7.

CHAPTER 8 — Experimental Study on Thermal Reaction of Modelled Biofuel (Morpholine) with NOx
208
18. Kohse-Höinghaus, K.; Oßwald, P.; Cool, T. A.; Kasper, T.; Hansen, N.; Qi, F.;
Westbrook, C. K.; Westmoreland, P. R., Biofuel combustion chemistry: from ethanol to
biodiesel. Angew. Chem. Int. Ed. 2010, 49, (21), 3572-3597.
19. Nau, P.; Seipel, A.; Lucassen, A.; Brockhinke, A.; Kohse-Höinghaus, K., Intermediate
species detection in a morpholine flame: contributions to fuel-bound nitrogen conversion from
a model biofuel. Exp. Fluids 2010, 49, (4), 761-773.
20. Lucassen, A.; Oßwald, P.; Struckmeier, U.; Kohse-Höinghaus, K.; Kasper, T.; Hansen,
N.; Cool, T. A.; Westmoreland, P. R., Species identification in a laminar premixed low-
pressure flame of morpholine as a model substance for oxygenated nitrogen-containing fuels.
P. Combust. Inst. 2009, 32, (1), 1269-1276.
21. Lucassen, A.; Labbe, N.; Westmoreland, P. R.; Kohse-Höinghaus, K., Combustion
chemistry and fuel-nitrogen conversion in a laminar premixed flame of morpholine as a model
biofuel. Combust. Flame 2011, 158, (9), 1647-1666.
22. Altarawneh, M.; Dlugogorski, B. Z., A mechanistic and kinetic study on the
decomposition of morpholine. J. Phys. Chem. A 2012, 116, (29), 7703-7711.
23. Dholabhai, P. P.; Yu, H.-G., Exploring the ring-opening pathways in the reaction of
morpholinyl radicals with oxygen molecule. J. Phys. Chem. A 2012, 116, (26), 7123-7127.
24. Li, S.; Davidson, D. F.; Hanson, R. K.; Labbe, N. J.; Westmoreland, P. R.; Oßwald, P.;
Kohse-Höinghaus, K., Shock tube measurements and model development for morpholine
pyrolysis and oxidation at high pressures. Combust. Flame 2013, 160, (9), 1559-1571.
25. Ren, Q.; Zhao, C., NOx and N2O precursors from biomass pyrolysis: nitrogen
transformation from amino acid. Environ. Sci. Technol. 2012, 46, (7), 4236-4240.
26. Ren, Q.; Zhao, C.; Wu, X.; Liang, C.; Chen, X.; Shen, J.; Tang, G.; Wang, Z., Effect of
mineral matter on the formation of NOx precursors during biomass pyrolysis. J. Anal. Appl.
Pyrolysis 2009, 85, (1–2), 447-453.
CHAPTER 8 — Experimental Study on Thermal Reaction of Modelled Biofuel (Morpholine) with NOx
209
27. Ren, Q.; Zhao, C.; Wu, X.; Liang, C.; Chen, X.; Shen, J.; Wang, Z., Formation of NOx
precursors during wheat straw pyrolysis and gasification with O2 and CO2. Fuel 2010, 89, (5),
1064-1069.
28. Bendtsen, A. B.; Glarborg, P.; Dam-Johansen, K., Low temperature oxidation of
methane: the influence of nitrogen oxides. Combust. Sci. Technol. 2000, 151, (1), 31-71.
29. Tan, Y.; Fotache, C.; Law, C., Effects of NO on the ignition of hydrogen and
hydrocarbons by heated counterflowing air. Combust. Flame 1999, 119, (3), 346-355.
30. Ashmore, P. G.; Levitt, B. P., Further studies of induction periods in mixtures of H2,
O2 and NO2. Symp. (Int.) Combust. 1958, 7, (1), 45-52.
31. Rasmussen, C. L.; Rasmussen, A. E.; Glarborg, P., Sensitizing effects of NOx on CH4
oxidation at high pressure. Combust. Flame 2008, 154, (3), 529-545.
32. Dagaut, P.; Lecomte, F.; Chevailler, S.; Cathonnet, M., Mutual sensitization of the
oxidation of nitric oxide and simple fuels over an extended temperature range: Experimental
and detailed kinetic modeling. Combust. Sci. Technol. 1999, 148, (1-6), 27-57.
33. Dagaut, P.; Luche, J.; Cathonnet, M., The low temperature oxidation of DME and
mutual sensitization of the oxidation of DME and nitric oxide: Experimental and detailed
kinetic modeling. Combust. Sci. Technol. 2001, 165, (1), 61-84.
34. Dayma, G.; Ali, K. H.; Dagaut, P., Experimental and detailed kinetic modeling study
of the high pressure oxidation of methanol sensitized by nitric oxide and nitrogen dioxide. P.
Combust. Inst. 2007, 31, (1), 411-418.
35. Oluwoye, I.; Dlugogorski, B. Z.; Gore, J.; Westmoreland, P. R.; Altarawneh, M.,
Enhanced ignition of biomass in presence of NOx. Fire Saf. J.: Submitted for publication 2017.
36. Battin-Leclerc, F., Detailed chemical kinetic models for the low-temperature
combustion of hydrocarbons with application to gasoline and diesel fuel surrogates. Prog.
Energy Combust. Sci. 2008, 34, (4), 440-498.

CHAPTER 8 — Experimental Study on Thermal Reaction of Modelled Biofuel (Morpholine) with NOx
210
37. Oluwoye, I.; Altarawneh, M.; Gore, J.; Dlugogorski, B. Z., Oxidation of crystalline
polyethylene. Combust. Flame 2015, 162, (10), 3681-3690.
38. Pitz, W. J.; Mueller, C. J., Recent progress in the development of diesel surrogate fuels.
Prog. Energy Combust. Sci. 2011, 37, (3), 330-350.
39. Simmie, J. M., Detailed chemical kinetic models for the combustion of hydrocarbon
fuels. Prog. Energy Combust. Sci. 2003, 29, (6), 599-634.
40. Zador, J.; Taatjes, C. A.; Fernandes, R. X., Kinetics of elementary reactions in low-
temperature autoignition chemistry. Prog. Energy Combust. Sci. 2011, 37, (4), 371-421.
41. Alzueta, M. U.; Glarborg, P., Formation and destruction of CH2O in the exhaust system
of a gas engine. Environ. Sci. Technol. 2003, 37, (19), 4512-4516.
42. Faravelli, T.; Frassoldati, A.; Ranzi, E., Kinetic modeling of the interactions between
NO and hydrocarbons in the oxidation of hydrocarbons at low temperatures. Combust. Flame
2003, 132, (1), 188-207.
43. Frassoldati, A.; Faravelli, T.; Ranzi, E., Kinetic modeling of the interactions between
NO and hydrocarbons at high temperature. Combust. Flame 2003, 135, (1), 97-112.
44. Glarborg, P.; Alzueta, M. U.; Dam-Johansen, K.; Miller, J. A., Kinetic modeling of
hydrocarbon/nitric oxide interactions in a flow reactor. Combust. Flame 1998, 115, (1), 1-27.
45. Guarneri, F.; Ikeda, E.; Mackie, J. C., A study of furan as a model oxygenated reburn
fuel for nitric oxide reduction. Energy Fuels 2001, 15, (3), 743-750.
46. Prada, L.; Miller, J., Reburning using several hydrocarbon fuels: a kinetic modeling
study. Combust. Sci. Technol. 1998, 132, (1-6), 225-250.
47. Dagaut, P.; Lecomte, F., Experiments and kinetic modeling study of NO-reburning by
gases from biomass pyrolysis in a JSR. Energy Fuels 2003, 17, (3), 608-613.
48. Bilbao, R.; Millera, A.; Alzueta, M. U.; Prada, L., Evaluation of the use of different
hydrocarbon fuels for gas reburning. Fuel 1997, 76, (14–15), 1401-1407.

CHAPTER 8 — Experimental Study on Thermal Reaction of Modelled Biofuel (Morpholine) with NOx
211
49. Giménez-López, J.; Aranda, V.; Millera, A.; Bilbao, R.; Alzueta, M. U., An
experimental parametric study of gas reburning under conditions of interest for oxy-fuel
combustion. Fuel Process. Technol. 2011, 92, (3), 582-589.
50. Lecomte, F.; Dagaut, P.; Chevailler, S.; Cathonnet, M., NO-reduction by ethane in a
JSR at atmospheric pressure: experimental and kinetic modeling. Combust. Sci. Technol. 2000,
150, (1-6), 181-203.
51. Zhao, J.; Wang, Q.; Yu, L.; Wu, L., Influence of the biogas reburning for reducing nitric
oxide emissions in an alundum-tube reactor. Atmos. Environ. 2016, 132, 290-295.
52. Hampartsoumian, E.; Folayan, O. O.; Nimmo, W.; Gibbs, B. M., Optimisation of NOx
reduction in advanced coal reburning systems and the effect of coal type☆. Fuel 2003, 82, (4),
373-384.
53. Demonstration of Coal Reburning for Cyclone Boiler NOx Control; DE-FC22-
90PC89659 U.S. Department of Energy, contracted to Babcock & Wilcox Company:
Barberton, OH, February, 1994
54. (CCT) Clean Coal Technology Demonstration Program: Program Update 2001;
DOE/FE-0444; U.S. Department of Energy: Washington, DC, July, 2002.
55. Li, S.; Xu, T.; Zhou, Q.; Tan, H.; Hui, S.; Hu, H., Optimization of coal reburning in a
1MW tangentially fired furnace. Fuel 2007, 86, (7), 1169-1175.
56. Zarnitz, R.; Pisupati, S., Identification of Significant Factors in Reburning with Coal
Volatiles. Environ. Sci. Technol. 2008, 42, (6), 2004-2008.
57. Oluwoye, I.; Dlugogorski, B. Z.; Gore, J.; Vyazovkin, S.; Boyron, O.; Altarawneh, M.,
Thermal Reduction of NOx with Recycled Polyethylene:. Environ. Sci. Technol.: Submitted for
publication 2016.
58. Dagaut, P.; Luche, J.; Cathonnet, M., Experimental and kinetic modeling of the
reduction of NO by propene at 1 atm. Combust. Flame 2000, 121, (4), 651-661.

212
CHAPTER 9
Conclusion and Recommendations
This chapter concludes the entire dissertation, and lays out
some significant recommendations for future studies
…

CHAPTER 9 — Conclusion and Recommendations
213
9.1. Conclusion
This thesis contributed towards finding sustainable solutions that could alleviate the
unprecedented increasing anthropogenic emission of NOx, serving to mitigate adverse effects
on the environment. NOx discharge surfaces as a result of lack of adequate mitigation
techniques in power plants, oxidation of reactive nitrogen species (e.g. NH3 from the Haber-
Bosch system) in chemical and agricultural processes, combustion activities involving
untreated fossil, bushfires and mining operations, especially large open cut mines that require
significant movement of materials (including overburden) by diesel-driven excavators and
trucks. To tackle this problem, supplementary-fuel reburning remains a viable technological
approach through which an overall decrease in NOx emission of about 50 – 85 % can be
attained. Therefore, the present research work explored new sustainable technologies for
reducing industrially formed NOx, based on biomass and recycled plastics, particularly for
applications relevant to blasting of mining-grade ammonium nitrate (AN) based high-energy
materials.
The thesis reviewed the global NOx formation channels in light of consequential environmental
impacts. It quantitates NOx emissions during detonation of ammonium nitrate blasting agents
with valid explanation of different underlying mechanisms, and assesses their contributions
with respect to the global nitrogen budget. The estimated NOx emission from AN-based
explosives amounts to 0.05 Tg (i.e., 5×10⁴ t) N per annum, in comparison to the total rate of
NOx of 41.3×10⁶ t N/y, entering the environment from all anthropogenic sources. Although
small on a global scale, these emissions involve concentrated discharges characterised by NOx
concentration in the order of 500 ppm. With respect to the current World Health Organisation
air quality guidelines, the typical concentrations of NOx in post-blast clouds exceeds the safe

CHAPTER 9 — Conclusion and Recommendations
214
limits by around 30 to 3000 times. Furthermore, the chemical reactivity of blasting-related
NOx, in the presence of other atmospheric substances, produces secondary pollutants. For
instance, the mineral particles and fugitive dusts synchronously present in post-blast fumes can
easily facilitate the oxidation of NOx, contributing to atmospheric formation of nitrate aerosols.
The computational studies analysed the primary initiation reactions occurring during
aggressive low-temperature oxidation of PE. In the NOx-laden atmosphere, formation of
diverse nitrogen-containing species ultimately accompanies the free-radical processes in solid
PE. Nitroso and nitroalkyl species appear as a result of respective addition of NO and NO2
molecule to a carbon radical site in PE chain. It has been noted that, the availability of
neighbouring chemical functional groups alters the thermodynamic and kinetic properties of
the reactions. Concerted elimination of HNO and HONO from nitroso- and nitroadducts,
respectively, requires moderate activation energies, compared with unimolecular
tautomerisation of the adducts. However, the presence of molecular oxygen induces the
formation of peroxy species, that subsequently bond with NO and/or NO2, thereby serving as
a potential source of organic nitrites and nitrates. In comparison with previous studies that
substantiated the addition of nitrogen oxides to solid polymer resins, the current investigation
delivered the concrete thermodynamic evidence of such events, and provides the reaction
channels describing the fate of consequential nitrogenous species. On this note, the calculated
thermochemical and kinetic parameters offer an improved understanding of the polymer-gas
reactions, and present insights into similar reaction sequences in other crystalline polyolefins.
Although fuel reburning constitutes an effective technologies for NOx reduction, practical
applications are sometimes influenced by cost. This study has shown that, recycled plastics
offer a relatively effective and cheaper means of reburning. An extensive experimental study

CHAPTER 9 — Conclusion and Recommendations
215
characterised the behaviour of waste polymer pellets under pyrolytic low-temperature (<600
°C) conditions. In particular, TGA-based analyses measured the thermal decomposition
pattern of neat and recycled polymer samples under controlled and representative NOx
environments, and developed a mechanistic insight explaining the formation of initial product.
The limiting initial step of thermal decomposition involved H-dissociation to form an alkyl
radical. NOx then acts in the further decomposition steps by adding to the radical sites to form
double bonds in the oligomer chain, eliminating HNO or HONO, respectively. The well-
established isoconversional method constructed the kinetic parameters showing conversion
dependent apparent activation energies of 135 kJ/mol – 226 kJ/mol, and 188 kJ/mol – 268
kJ/mol, for neat and recycled PE, respectively. Also, the so-called compensation effect
accounted for the natural logarithmic of the pre-exponential factors ln (A/min-1 ) ranging
between ca 19 – 35 and 28 – 41, in same order., depending on the PE conversion in the
experimental interval between 5 and 95 %. The typical NOx reduction efficiency of pyrolysing
fragments of waste PE amounted 80 %, hence the injection of waste PE into a reburning zone
of combustors may significantly reduce the emission of NOx. The gathered kinetic data on the
thermal decomposition of PE in a NOx atmosphere, in the absence of mass transfer limitation
will serve to predict the polymer conversion (in NOx atmosphere) at elevated temperatures, to
plan the practical vertically-entrained drop-tube experiments.
In agreement with principles of green chemistry and engineering, thermal reduction of NOx by
recycled polyethylene assigns value to minimisation of solid wastes by providing an
ecofriendly exit route for excess plastic wastes in our society. Moreover, its application to NOx
formation in combustion plants promotes the growth of innocuous degradation products,
thereby enhancing low-emission technologies and effective energy recovery from polymeric
waste materials. Furthermore, the scientific approach can be optimised to deploy waste

CHAPTER 9 — Conclusion and Recommendations
216
polyethylene in bulk ammonium nitrate/fuel oil (ANFO)/emulsions explosive mixtures, so as
to mitigate the NOx formation during detonation of nitrate-based explosives, for example, in
mining operations. Application of waste PE in reducing NOx emissions from detonation of AN
explosives relies strongly on the heating condition. Since explosions are generally
characterised with flash heating rates of the order of 10,000 K/s, defragmentation of PE at such
conditions results in relatively low molecular weight hydrocarbon, which are expected to
further enhance the reduction efficiency of the system.
The second wing of this dissertation investigated the thermal interaction of biomass with NOx.
In which, low-temperature tubular reactor experiments gauged the sensitising role of NOx on
biomass ignition/combustion. We concluded that, this has an unintended consequence of
degrading the safety of organic dust-producing plants. For a representative fuel-rich condition
( = 1.25), the concentration of NOx as small as 0.06 % lowers the ignition temperature of
morpholine by 150 °C, i.e., from approximately 500 °C to 350 °C. The formation of organic
nitrites and nitrates, as the result of addition of NOx species to morphyl and peroxyl radicals,
plays an important role in decreasing the ignition temperature of biomass fuel in NOx-laden
oxidative environments, but has negligible contributions in pyrolytic decompositions. Other
contributing factor includes the reaction of NOx with low-temperature hydroperoxyl radical
leading to the formation of active OH species that also propagate the ignition process. The
present measurements indicate that, safe operation of wood-working plants requires avoiding
trace concentration of NOx within the vicinity of dust-prone areas. This can be facilitated by
proper (and separate) venting of engine exhausts.
Furthermore, our high temperature tubular reactor arrangements elucidated morpholine as a
good biomass surrogate with NOx reduction efficiency values similar to that of actual biomass

CHAPTER 9 — Conclusion and Recommendations
217
residues at conditions pertinent to industrial applications. The principal reaction products
include acetylene (C2H2), ethylene (C2H4), methane (CH4), formaldehyde (CH2O), carbon
monoxide (CO), carbon dioxide (CO2), hydrogen cyanide (HCN), ammonia (NH3) and nitric
oxide (NO), depending on the composition of the reaction mixture. In presence of oxygen, the
effectiveness of morpholine as NO reduction reagent compares well to that of propene (C3H6).
For conventional hydrocarbon fuels, it has been demonstrated that the NO reduction efficiency
follows the order of C2H2 > C3H6 > CH4. Hence, morpholine should be more effective than
CH4, and better preferred to C2H2 that usually leads to the formation of NO2 rather than the
more desirable N2 or HCN intermediate. Finally, the O-content of morpholine permits NOx
reduction at relatively lower temperature, making it an excellent reburning fuel in O2-deficient
environment. These findings shed light on biomass-NOx interactions occurring in various
industrial processes, such as interaction of reactive nitrogen species with biomass residues
during thermal firing of solid fuels, and particularly, in fuel stagging technology utilising
biomass as the major reburn fuel. In addition, it also help describe the effect of NOx, arising
from detonation of ammonium nitrate explosives, on the ignition of lignocellulosic materials
in open-cut mines.
9.2. Recommendations
The scientific studies embodied in this dissertation had led to a number of intriguing research
questions. The following paragraphs discuss some suggestion for potential future work.
We have identified the possibility of the formation of secondary pollutants (nitrate aerosols) as
a result of atmospheric nitration of the mineral particles and fugitive dusts synchronously

CHAPTER 9 — Conclusion and Recommendations
218
present in post-blast fumes. Therefore, development of new sampling methodologies should
include the environmental monitoring of such species from blasting activities. Lightweight
remote-controlled drone-sampling instrumentation, as well as surface sampling, could facilitate
the measurements of nitrate aerosols, as well as other pollutants including supplementary Nr
species (e.g. HNO3, NH3, and N2O), hydrocarbons, nitrogenated analogues of dioxins and
secondary contaminants such as peroxyacyl nitrates (PAN). Understanding the mechanism of
the formation and the survival of these pollutants in detonation of heavy AN explosives is
crucial to achieve sustainable mining activities, as are further testing of OW emulsions and
bulking agents, and generating new knowledge on the exact mechanism of deflagration that
involves the surface burning of AN particles.
The low-temperature non-isothermal measurements in Chapter 6 gathered the kinetic data on
the thermal decomposition of PE in a NOx atmosphere, in the absence of mass transfer
limitation, serving to predict the polymer conversion (in NOx atmosphere) at elevated
temperatures. The preliminary quantitative NOx reduction efficiency concluded that, the
injection of waste PE into a reburning zone of combustors may significantly reduce the
emission of NOx. Reburning of NOx in practical combustors usually occurs in a temperature
window between 1000 °C and 1200 °C. Therefore, a change of the reaction mechanism may
occur at those high temperatures. Hence, we recommend a subsequent study to address the
high-temperature isothermal and flash-particle heating conditions in drop-tube experiments,
with valid economic analysis. This will reveal possible effects of the presence of oxygen and
mass transfer on the reaction of NOx with PE pyrolysates under realistic reburning temperatures
(i.e., 1000 – 1200 °C). Along the same line of interest, the suitability of other complex-chain
polymer should be investigated, with respective to their NOx reduction efficiencies, and most
importantly, the likelihood of the formation of ecotoxic nitrogenated analogue dioxins, such as

CHAPTER 9 — Conclusion and Recommendations
219
diphenylamine (DPA), carbazole, phenoxazine, and phenazine. Figure 9.1 illustrates a
proposed laboratory-scale vertically-entrained drop-tube experimental setup for high-
temperature studies.
Figure 9.1. Proposed laboratory-scaled drop tube furnace reactor, equipped with variable
speed DC motor that allows the adjustment of feeding rate of pulverised polymer sample,
being carried downstream by inert (helium) gas. The symbol “T” refers to thermocouples.
Finally, regarding the sensitising role of NOx in biomass ignition, further studies at varying
fuel-oxygen equivalence ratio, and NOx concentrations would help elucidate the limit of the
sensitising effect. Measurements of the ignition induction time involving actual biomass
should provide further insights into this behaviour. We recommend other experimental
parameters for assessing the risk of biomass ignition, e.g., thermogravimetrically-derived
apparent activation energy (Ea) and the temperature of maximum rate of weight loss (TMWL).
Inert gas
NOx gas
T
T
Gas preheater
M
Iso
ther
mal
tem
per
atu
re z
on
e
Particulate filter
Product analysers;
FTIR, NOx analyser
Particle sampling and
characterisation
+ -
T

CHAPTER 9 — Conclusion and Recommendations
220
Finally, confirmation of interactions between fuel-N and NOx, (e.g., by experiments involving
isotopically labelled 15NOx), and quantitative measurements of nitro- and nitroso-adducts (e.g.,
by employing Tenax cartridge in thermal desorption unit, coupled with gas
chromatography/mass spectrometry setup) would constitute a significant advance in our
understanding of N-selectivity in high-temperature thermal reaction of morpholine with NOx.
Future work should assemble a complete reaction mechanism, validated by the experimental
conversion profile of morpholine, and the quantitative data on the formation of product species.

221
CHAPTER 10
Supplementary Document
This section provides the necessary supporting information
for some of the chapters included in this thesis
…
CHAPTER 10 — Supplementary Document
222
Appendix I: Supporting Information for Chapter 6
S6.1. Characterisation Techniques
Fourier transform infrared (FTIR) spectroscopy: This method elucidated the major
functional groups present in the polymer samples. We applied Agilent Cary 670 equipped
with attenuated total reflectance (ATR) accessory. Prior to analyses, samples were
cryogenically pulverised to achieve reproducible measurements. The FTIR recorded the
spectra at 4 cm-1 resolution, with accumulation of 32 scans per spectrum. The bands at
2916 cm-1, 2848 cm-1, 1470 cm-1 and 718 cm-1 correspond to CH2 asymmetric stretch, CH2
symmetric stretch, CH2 scissors and CH2 rock modes, respectively.
Carbon-hydrogen-nitrogen-sulfur (CHNS) analysis: CHNS elemental analyser provided a
means for rapid determination of carbon, hydrogen, nitrogen and sulfur in the organic
polymer matrices. Pulverised samples were fed into the pre-calibrated instrument
(EuroVector EA3000) under dry helium and O2 purge, and the combustion furnace operated
at approximately 1100 °C. The reactor functioned in a dynamic flash combustion mode,
and contained both the oxidation zone represented by tungsten oxide and copper wired
reduction zone. Two repeated runs resulted in 86.24 and86.10 wt. % for C, 14.25 and 14.20
wt. % for H, 0.00 and 0.00 wt. % for N as well as 0.00 and 0.00 wt. % for S.
Ion chromatography: Dissolved sample was injected into DX-120 anion chromatograph.
The result showed no trace of halogens, except for Cl present at < 0.1 %.

CHAPTER 10 — Supplementary Document
223
Inductively coupled plasma emission spectroscopy (ICP-OES): Varian 715-ES ICP OES
(University of Newcastle, Australia) served to measure the metal concentration in the
sample. About 140 mg of the recycled PE were digested in microwave, and then transferred
via Varian SPS 3 sample preparation system for analyses. High-purity ICP multi-element
standard solution containing different metal cations in 2.0 % HNO3 facilitated the necessary
calibration.
High temperature size exclusion chromatography (HT-SEC) in TCB: We performed HT-
SEC analyses using a Viscotek system (from Malvern Instruments) equipped with three
columns (Polefin 300 mm × 8 mm I. D. from Polymer Standards Service, porosity of 1000
Å, 100 000 Å and 1 000 000 Å). Sample solutions 200 µL in volume, with a concentration
of 5 mg/mL, were eluted in 1,2,4-trichlorobenzene (1,2,4 TCB) with a flow rate of 1
mL/min at 150 °C. The mobile phase was stabilised with 2,6-di(tert-butyl)-4-methylphenol
(200 mg/L). Online detection was performed with a differential refractive index detector
and a dual light scattering detector (LALS and RALS) for absolute molar mass
measurement. The OmniSEC 5.02 software facilitated the calculation of the SEC
parameters.

CHAPTER 10 — Supplementary Document
224
Figure S6.1. High temperature size exclusion chromatogram of neat (a) and recycled (b) PE,
and estimated molecular parameters. Symbols are explained in the caption to Table 6.1 in the
main manuscript. Ret. Vol. denotes the corresponding peak retention volume.
During recycling processes, the polymer chains of the recycled PE break, with chains of higher
molar mass displaying more probability of breaking. Therefore, the molecular mass
distributions (MMD) of the recycled PE reveals lower dispersity Ip values. Other contributions
to MMD include:
(a) Melting point: Our DSC result (Figure S6.2) showed that, the recycled PE displays a
higher melting point (123 °C) with broader peak, compared to the neat sample (116 °C).
Higher melting point suggests larger-molecular-mass, i.e., a higher Mp value. However,
when Mp varies only by around 18 kg/mol (our case here), there are no effects on melting
temperature.1,2 Rather, the structure of the PE samples induces this behaviour. The
intrinsic viscosity of the recycled PE (1.9 dL/g) exceeds that of the neat PE (1.1 dL/g).

CHAPTER 10 — Supplementary Document
225
This means that, the neat PE is more branched (short-chain branched LDPE) than the
recycled PE. More branches imply lower melting point and lower intrinsic viscosity.3
(b) Delayed decomposition of recycled PE: As shown in Figure S6.3, the relative
decomposition of the recycled PE is somewhat delayed due to the presence of more linear
chain. Neat PE is more branched, hence, its decomposition occurs earlier at the relatively
more sensitive branching-carbon sites. The alpha and beta scission mechanisms around
such carbons, during thermal degradation, have been well explained by Haney et al.4
S6.2. Assessments of Calibration and Repeatability of TGA Experiments
Prior to experiments, we carefully calibrated the instrument. The reference standards for the
mass and temperature calibration were selected according to the desired experimental range.
Table S6.1 lists the measured values as compared to the expected correspondence. The table
also provides the calculated percent error.
Table S6.1. Verification of the Instrument’s measured values.
Weight (mg)
Expected Measured1 Measured2 Percent error
Certified mass 54.37 54.59 54.36 7.36 × 10⁻³
Temperature3 (C)
Expected Measured1 Measured2 Percent error
Indium 156.60 156.21 156.45 9.58 × 10⁻²
Zinc 419.47 417.12 419.20 6.44 × 10⁻²
Aluminium 660.10 662.67 660.30 3.03 × 10⁻²

CHAPTER 10 — Supplementary Document
226
Heat flow4 (J/g)
Expected Measured1 Measured2 Percent error
Zinc 108.37 115.70 110.20 0.17 × 10⁻¹
Aluminium 400.10 410.02 400.80 1.74 × 10⁻¹
1 Measured values before calibration.
2 Measured values after calibration.
3 Onset melting temperatures.
4 Enthalpy of fusion (∆Hf).
During the entire duration of the study, we acquired replicate runs randomly at different dates
in order to check for the instrumental drift and reproducibility of experimental data. Figure
S6.2 shows a typical result of the thermal analysis, and Figure S6.3 depicts the selective
reproducibility of three experimental runs under different conditions (Table S6.2).
Table S6.2. Experimental conditions for the thermogravimetry analyses
Runs Sample Treatment Scan
condition
Purge
rate
Crucible Sample
mass (m)
Buoyancy
effect
1-3 Neat
PE
Sliced
(-400 μm)
25 – 620 C 80
mL/min
Alumina;
uncovered
5≤m≤5.4
mg
Corrected
1-3 Recycled
PE
Sliced
(-400 μm)
25 – 620 C 80
mL/min
Alumina;
uncovered
5≤m≤5.4
mg
Corrected

CHAPTER 10 — Supplementary Document
227
Figure S6.2. Thermal characterisation of recycled PE sample at nominal heating rate of 10
K/min under inert (argon) purge. The DSC signal of the simultaneous thermal analysers
(STA) cannot facilitate accurate quantitative analysis of thermodynamic properties. The
recycled PE sample dissolved completely in toluene (at 80 °C), indicating the absence of
cross-linked polymer.

CHAPTER 10 — Supplementary Document
228
Figure S6.3. Reproducibility of TGA results.

CHAPTER 10 — Supplementary Document
229
S6.3. Monotonic Behaviour of Heated PE Samples
Under non-isothermal conditions, in which a sample heats at a constant rate, the decomposition
pattern often relies on the applied heating rate. The conversion of the tested PE samples
exhibits an increasing monotonic behaviour with increasing temperature. This means that, NOx
is not incorporated permanently in the reacting solid, consistently with the mechanism of
Figure 6.5, included in the body of the article. Figure S6.4 portrays the dependence of α on
temperature. Herein, α refers to the fractional conversion of polymer sample, and it represents
the normalised form of mass loss data from the thermogravimetry analysis:
𝛼 =𝑚i − 𝑚t
𝑚i − 𝑚f (S6.1)
in terms of initial mass before the thermal analysis mi, instantaneous mass at any
temperature/time mt, and the final mass after the entire decomposition process mf.

CHAPTER 10 — Supplementary Document
230
Figure S6.4. The monotonic behaviour of samples studied in different purge atmospheres.
S6.4. Derivation of Cited Equations and the Compensation Effect
S6.4.1 . Isoconversional method
In solid-state reactions, the rate can be described in terms of three main variables: the
temperature T, the conversion α (already defined), and the pressure P, according to the
following equation:

CHAPTER 10 — Supplementary Document
231
𝑑𝛼
𝑑𝑡= 𝑘(𝑇)𝑓(𝛼)ℎ(𝑃) (S6.2)
Ignoring the pressure dependence h(P), the process rate hinges solely on the temperature
function k(T) and the conversion parameter f(α), otherwise termed as the reaction model.
Model-free or isoconversional methods rely on the assumption that, at constant conversion, the
reaction rate remains function of temperature only. Furthermore, Arrhenius equation expresses
the temperature dependence:
𝑘(𝑇) = 𝐴exp (−
𝐸
𝑅𝑇) (S6.3)
where the kinetic parameters A and E respectively represent the pre-exponential factor and the
activation energy, while R denotes the universal gas constant. In a non-isothermal experiment,
when temperature changes linearly with time, the heating rate β can be expressed as:
𝛽 =
𝑑𝑇
𝑑𝑡= 𝑐𝑜𝑛𝑠𝑡 (S6.4)
Combination of equations (S6.2), (S6.3) and (S6.4) yields:
𝛽𝑑𝛼
𝑑𝑇= 𝐴exp (−
𝐸
𝑅𝑇) 𝑓(𝛼) (S6.5)
Rearranging, and integrating, one obtains:

CHAPTER 10 — Supplementary Document
232
𝑔(𝛼) = ∫
𝑑𝛼
𝑓(𝛼)
𝛼
0
=𝐴
𝛽∫ exp (−
𝐸
𝑅𝑇) 𝑑𝑇
𝑇𝛼
0
=𝐴
𝛽𝐼(𝐸, 𝑇) (S6.6)
where g(α) is the integral form of the reaction model, and the corresponding limits of
integration, α and Tα follow from Figure S6.3. The integration of Equation (S6.6) eliminates
the need for a priori knowledge of the reaction model. However, the temperature integral I(E,T)
has no analytical solution. Consequently, according to Vyazovkin approach,5,6 for a series of
runs conducted at different heating rates, the Eα can be determined by minimisation of the
following function:
∅(𝐸𝛼) = ∑ ∑
𝐼(𝐸𝛼, 𝑇𝛼,𝑖)𝛽𝑗
𝐼(𝐸𝛼, 𝑇𝛼,𝑗)𝛽𝑖
𝑛
𝑗≠𝑖
𝑛
𝑖=1
(S6.7)
In this work, we experimented with four temperature ramps (5, 10, 15 and 20 K/min), repeating
each run three times. The activation energy can be estimated at any particular value of α, by
finding Eα for which the function attains a global minimum. The subscripts i and j represent
integer numbers of different experiments performed under varying heating programs, i.e., i
equals 1 – 3 for replicates, and j corresponds to 1 – 4 for heating rates. The temperature integral,
also known as the Arrhenius integral, corresponds to:
𝐼(𝐸𝛼, 𝑇𝛼) = ∫ exp (−
𝐸
𝑅𝑇) 𝑑𝑇
𝑇𝛼
0
(S6.8)
The presence of systematic errors (as a result of the integral approximation) can be eliminated
by performing the integration over a small segment of temperature:

CHAPTER 10 — Supplementary Document
233
𝐼(𝐸𝛼, 𝑇𝛼) = ∫ exp (−
𝐸
𝑅𝑇) 𝑑𝑇
𝑇𝛼
𝑇𝛼−∆𝛼
(S6.9)
In which α varies from 2∆α to 1-∆α, with a step of ∆α = (m+1)-1, and m defines the number of
equidistant values of α selected for the analysis. We applied the fourth order Senum and Yang
approximation7 for the integral function, and minimised Equation S6.7 by employing the solver
tool in Microsoft excel. The minimisation task has been repeated for each value of α to obtain
the dependency of Eα on α.
Alternatively, owing to other forms of numerical approximation of I(E,T), there have been
various standard integral isoconversional methods, in the form:
ln (
𝛽𝑖
𝑇𝛼,𝑖𝐵 ) = Const − 𝐶 (
𝐸𝛼
𝑅𝑇𝛼,𝑖) (S6.10)
The subscript i represents an integer number for the four heating ramps; i.e., i = 1 to 4.
According to the International Confederation for Thermal Analysis and Calorimetry (ICTAC),6
the use of B = 2 and C = 1 (as in the Kissinger-Akahira-Sunose method; KAS8) offers a
significant improvement in the accuracy of activation energy values. Also, setting B = 1.92
and C = 1.0008 (as proposed in Starink’s approach9) provides further improvement in accuracy.
Thus, at constant α, the plot of ln 𝛽𝑖/𝑇𝛼,𝑖𝐵 against 1/Tα,i yields a straight line whose slope (Figure
S6.4) can conveniently be used to evaluate Eα values.
Another accurate integral method was proposed by Lyon10:

CHAPTER 10 — Supplementary Document
234
𝐸𝛼,𝑖 = −𝑅 (
𝑑𝑙𝑛𝛽
𝑑1/𝑇𝛼,𝑖 + 2𝑇𝛼,𝑖) (S6.11)
with the differential term representing the slope of ln β versus reciprocal temperature 1/Tα
(Figure S6.5)
In other to estimate the errors in the activation energies, we applied combinations of different
replicates of the heating rates. The resulting values (at a specific conversion) then served to
compute the standard errors.

CHAPTER 10 — Supplementary Document
235
Figure S6.5. Parametric plots of ln 𝛽𝑖/𝑇𝛼,𝑖𝐵 against 1/Tα,i for the thermal decomposition of PE
samples in He-NOx.

CHAPTER 10 — Supplementary Document
236
S6.4.2 Compensation effect
The compensation effect relies on the determination of several kinetic triplets, namely, Ei, Ai
and fi(α) or gi(α) over a wide range of reaction models6. This can easily be achieved by
employing the integral analogue of equation (S6.5), i.e., Coats-Redfern equation:11
ln [
𝑔𝑖(𝛼)
𝑇𝛼2
] = ln (𝐴𝑖𝑅
𝛽𝐸𝑖) −
𝐸𝑖
𝑅𝑇𝛼 (S6.12)
For a constant heating rate, the slope and y-intercept of the plot of ln 𝑔(𝛼)/𝑇𝛼2 against 1/Tα
enable the evaluation of Ei and Ai. Table S6.3 lists the appropriate g(α) function for different
models.
Table S6.3. Set of kinetic models used in describing thermal decomposition of solids
i Reaction model Code f(α) g(α)
1 Power law P4 4α3/4 α1/4
2 Power law P3 3α2/3 α1/3
3 Power law P2 2α1/2 α1/2
4 Power law P2/3 2/3α-1/2 α3/2
5 One-dimensional diffusion D1 1/2α-1 α2
6 Mampel (first order) F1 1-α -ln(1-α)
7 Avrami-Erofeev A4 4(1-α)[-ln(1-α)]3/4 [-ln(1-α)]1/4
8 Avrami-Erofeev A3 3(1-α)[-ln(1-α)]2/3 [-ln(1-α)]1/3
9 Avrami-Erofeev A2 2(1-α)[-ln(1-α)]1/2 [-ln(1-α)]1/2
10 Three-dimensional diffusion D3 3/2(1-α)2/3[1-(1-α)1/3]-1 [1-(1-α)1/3]2
11 Contracting sphere R3 3(1-α)2/3 1-(1-α)1/3
12 Contracting cylinder R2 2(1-α)1/2 1-(1-α)1/2
13 Two-dimensional diffusion D2 [-ln(1-α)]-1 (1-α)ln(1-α)+α
14 Second order F2 (1-α)2 (1-α)-1-1

CHAPTER 10 — Supplementary Document
237
For kinetic parameter of associated with the models in Table S6.3, the plot of ln Ai versus Ei
will also yield a straight line (see Figure S6.6), with slope a, and y-intercept b.
ln 𝐴𝛼 = 𝑎𝐸𝛼 + 𝑏 (S6.13)
The substitution of isoconversional values of Eα allows the estimation of the dependence of ln
Aα over the entire conversion α. We stress that, theoretically, the compensation effect is not
affected by heating rates. Thus, we have repeated the evaluation steps for two different heating
rates (10 and 20 K/min), and confirmed similar values of the rate constant.

CHAPTER 10 — Supplementary Document
238
Figure S6.6. The compensation effect during thermal decomposition of PE samples in He-
NOx. Each point and each boxed number on the graph correspond to the ith kinetic
parameters, i.e., ln Ai and Ei derived for different reaction models in Table S6.3. Shaded
regions depict the range of experimental data. Models 6, 11 and 12 fall within the window of
the experimental results. As our approach to determine A is valid only for models described
by a general formula of f(α) = (1-α)n, the thermal decomposition of PE conforms with model
6 (Mampel, first order). Indeed, this model falls in the middle of both shaded regions.
S6.5. Complete Isoconversional Kinetic Data

CHAPTER 10 — Supplementary Document
239
Table S6.4. Kinetic constants for decomposition of neat PE sample in NOx according to
isoconversional methods
α
Eα isoconversional methods (kJ/mol) Reported parameters
Numerical
minimisation KAS1 Starink1 Lyon1
Eα2
(kJ/mol)
Standard
error
In (A/min-
1)
Standard
error
0.05 134.9 135.8 136.1 135.8 135.9 ± 2.1 19.9 ± 0.2
0.10 149.4 149.6 150.0 149.6 149.7 ± 2.7 22.1 ± 0.3
0.15 158.5 158.2 158.5 158.1 158.3 ± 3.0 23.5 ± 0.3
0.20 165.0 164.4 164.7 164.4 164.5 ± 3.2 24.5 ± 0.3
0.25 170.9 170.7 171.0 170.6 170.8 ± 3.2 25.5 ± 0.3
0.30 177.5 176.4 176.7 176.4 176.5 ± 3.4 26.5 ± 0.4
0.35 184.8 182.9 183.3 182.9 183.0 ± 3.5 27.5 ± 0.4
0.40 190.5 188.8 189.1 188.7 188.9 ± 3.5 28.5 ± 0.4
0.45 197.2 194.2 194.5 194.1 194.3 ± 3.5 29.4 ± 0.4
0.50 201.5 199.3 199.6 199.2 199.4 ± 3.5 30.2 ± 0.4
0.55 206.4 204.0 204.3 204.0 204.1 ± 3.5 31.0 ± 0.4
0.60 211.9 208.4 208.7 208.4 208.5 ± 3.4 31.7 ± 0.4
0.65 214.7 212.3 212.7 212.3 212.4 ± 3.3 32.3 ± 0.3
0.70 218.6 216.1 216.5 216.1 216.2 ± 3.2 32.9 ± 0.3
0.75 222.0 219.5 219.8 219.4 219.5 ± 3.1 33.5 ± 0.3
0.80 226.0 222.2 222.6 222.2 222.3 ± 3.1 33.9 ± 0.3
0.85 226.2 224.4 224.7 224.4 224.5 ± 3.0 34.3 ± 0.3
0.90 228.6 226.0 226.3 225.9 226.0 ± 2.6 34.5 ± 0.3
0.95 228.6 226.2 226.6 226.2 226.3 ± 2.0 34.6 ± 0.2
1 Average of three values, estimated from the results of three repeatable experimental runs at four
heating rates.
2 Average of the four models; standard error based on the standard deviation from the population mean.

CHAPTER 10 — Supplementary Document
240
Table S6.5. Kinetic constants for decomposition of recycled PE sample in NOx according to
isoconversional methods
α
Eα isoconversional methods (kJ/mol) Reported parameters
Numerical
minimisation KAS1 Starink1 Lyon1
Eα2
(kJ/mol)
Standard
error
In (A/min-
1)
Standard
error
0.05 188.1 188.1 188.4 188.0 188.1 ± 2.1 28.2 ± 0.2
0.10 220.2 220.0 220.3 220.0 220.1 ± 1.4 33.4 ± 0.2
0.15 231.8 231.6 231.9 231.6 231.7 ± 1.2 35.3 ± 0.1
0.20 238.3 238.1 238.4 238.1 238.2 ± 1.1 36.3 ± 0.1
0.25 241.2 241.0 241.3 241.0 241.1 ± 1.2 36.8 ± 0.1
0.30 243.6 243.4 243.6 243.3 243.4 ± 1.2 37.2 ± 0.1
0.35 246.0 245.9 246.2 245.9 246.0 ± 1.6 37.6 ± 0.2
0.40 249.3 249.2 249.5 249.2 249.3 ± 1.7 38.1 ± 0.3
0.45 252.9 252.8 253.1 252.8 252.9 ± 1.9 38.7 ± 0.2
0.50 257.3 257.2 257.5 257.2 257.3 ± 2.0 39.4 ± 0.2
0.55 261.8 261.7 262.0 261.7 261.8 ± 1.9 40.1 ± 0.2
0.60 266.4 266.3 266.6 266.3 266.4 ± 1.9 40.9 ± 0.2
0.65 269.4 269.2 269.5 269.2 269.3 ± 1.2 41.4 ± 0.1
0.70 271.3 271.1 271.4 271.1 271.2 ± 0.6 41.7 ± 0.1
0.75 273.2 273.0 273.2 272.9 273.1 ± 0.3 42.0 ± 0.1
0.80 273.5 273.2 273.5 273.2 273.3 ± 0.3 42.0 ± 0.1
0.85 272.6 272.3 272.6 272.3 272.4 ± 0.2 41.9 ± 0.1
0.90 270.9 270.7 271.0 270.6 270.7 ± 0.2 41.6 ± 0.1
0.95 267.9 267.6 267.9 267.6 267.7 ± 0.1 41.1 ± 0.1
1 Average of three values, estimated from the results of three repeatable experimental runs at four
heating rates.
2 Average of the four models; standard error based on the standard deviation from the population mean.

CHAPTER 10 — Supplementary Document
241
S6.6. Enlarged Time-Resolved FTIR Spectra
Figure S6.7. Time-resolved FTIR spectra acquired during thermal decomposition of neat PE
in argon.
Figure S6.8. Time-resolved FTIR spectra acquired during thermal decomposition of neat PE
in NOx.

CHAPTER 10 — Supplementary Document
242
Figure S6.9. Time-resolved FTIR spectra acquired during thermal decomposition of recycled
PE in argon.
Figure S6.10. Time-resolved FTIR spectra acquired during thermal decomposition of
recycled PE in NOx.

CHAPTER 10 — Supplementary Document
243
S6.7. Complete NOx Conversion Profile
The NOx analyser was pre-calibrated within the experimental range as shown below:
Table S6.6. Calibration of NOx analyser.
Precision NO
(ppm)
Precision
NOx (ppm)
Measured
NO (ppm)
Measured NOx (ppm) Error (% FS)
0 0 0 0 0.0
2030 2080 2030 2080 0.0
1000 1030 998 1030 -0.1
500 516 496 516 -0.2
250 258 244 258 -0.3
Figure S6.11 depicts the concentration trend of NO and NOx (NO + NO2), and Figure S6.12
shows the instantaneous NOx conversion according to Equation S6.14.
𝑋 =𝐹NO𝑥𝑖𝑛
− 𝐹NO𝑥𝑜𝑢𝑡
𝐹NO𝑥𝑖𝑛
× 100 % (S6.14)
𝐹NO𝑥𝑖𝑛= [𝑁𝑂𝑥𝑖𝑛
] ⋅ 𝑄𝑖𝑛 (S6.15)
𝐹NO𝑥𝑜𝑢𝑡= [𝑁𝑂𝑥𝑜𝑢𝑡
] ⋅ (𝑄𝑖𝑛 + 𝑄𝑣𝑜𝑙𝑎𝑡𝑖𝑙𝑒) (S6.16)
𝐹NO𝑥𝑖𝑛 and 𝐹NO𝑥𝑜𝑢𝑡
represent the molar flows in terms of the NOx concentrations and gas flow
rates entering (Qin = 80 mL/min at STP) and leaving the furnace, respectively. On the other
hand, 𝑄𝑣𝑜𝑙𝑎𝑡𝑖𝑙𝑒 corresponds to the estimated dilution term due to generation of volatile products
(from pyrolysing PE) in the furnace. Equation S6.17 yields the volumetric rate (in mL/min) of
volatile formation.

CHAPTER 10 — Supplementary Document
244
𝑄𝑣𝑜𝑙𝑎𝑡𝑖𝑙𝑒 = m
ρ=
��
𝑀𝑒𝑡ℎ𝑦𝑙𝑒𝑛𝑒⋅
𝑅𝑇
𝑃 (S6.17)
𝜌 denotes the average density of volatile species, taken as the density of ethylene for simplicity
sake, while �� signifies the decomposition rate of PE (in mg/min) as obtained from derivative
thermogravimetry data of neat (and recycled) PE decomposition in He-NOx. According to
Equation S6.17, the maximum volumetric rate of volatile product of PE (at 10 K/min) amounts
to 1.9 mL/min, i.e. approximately 2.4 % of the Qin.
Figure S6.11. Continuous NOx concentration profile during thermal of PE samples in NOx
atmosphere.
Recycled PE
0 1000 2000 3000 4000 5000 6000 7000 80000
100
200
300
400
500
600
700
5 K/min
NO
x c
on
cen
trat
ion
(p
pm
)
Time (s)
NO
NOx
0 1000 2000 3000 4000 5000 6000 7000 80000
100
200
300
400
500
600
700
5 K/min
NO
x c
on
cen
trat
ion
(p
pm
)
Time (s)
NO
NOx
0 1000 2000 3000 4000 5000 60000
100
200
300
400
500
600
700
10 K/min
NO
x c
on
cen
trat
ion
(p
pm
)
Time (s)
NO
NOx
0 1000 2000 3000 4000 5000 60000
100
200
300
400
500
600
700
10 K/min
NO
x c
on
cen
trat
ion
(p
pm
)
Time (s)
NO
NOx
0 1000 2000 3000 40000
100
200
300
400
500
600
700
20 K/min
NO
x c
on
cen
trat
ion
(p
pm
)
Time (s)
NO
NOx
0 1000 2000 3000 40000
100
200
300
400
500
600
700
NO
x c
on
cen
trat
ion
(p
pm
)
Time (s)
NO
NOx
20 K/min
Neat PE

CHAPTER 10 — Supplementary Document
245
Figure S6.12. Percent NOx conversion during thermal of PE samples in NOx atmosphere.
S6.8. References
1. Cossoul, E.; Baverel, L.; Martigny, E.; Macko, T.; Boisson, C.; Boyron, O.,
Homogeneous Copolymers of Ethylene with α‐olefins Synthesized with Metallocene Catalysts
and Their Use as Standards for TREF Calibration. In Macromolecular Symposia, Wiley Online
Library: 2013; Vol. 330, pp 42-52.
2. Nieto, J.; Oswald, T.; Blanco, F.; Soares, J. B.; Monrabal, B., Crystallizability of
ethylene homopolymers by crystallization analysis fractionation. J. Polym. Sci., Part B: Polym.
Phys. 2001, 39, (14), 1616-1628.
3. Striegel, A.; Yau, W. W.; Kirkland, J. J.; Bly, D. D., Modern size-exclusion liquid
chromatography: practice of gel permeation and gel filtration chromatography. John Wiley &
Sons: 2009.
0 1000 2000 3000 4000 5000 6000 7000 8000
0
10
20
30
40
50
60
70
80
90
100
5 K/min
NO
x c
on
centr
atio
n (
ppm
)
Time (s)
NO
NOx
0 1000 2000 3000 4000 5000 6000 7000 8000
0
10
20
30
40
50
60
70
80
90
100
5 K/min
NO
x c
on
centr
atio
n (
ppm
)
Time (s)
NO
NOx
0 1000 2000 3000 4000 5000 6000
0
10
20
30
40
50
60
70
80
90
100
10 K/min
NO
x c
on
centr
atio
n (
ppm
)
Time (s)
NO
NOx
0 1000 2000 3000 4000 5000 6000
0
10
20
30
40
50
60
70
80
90
100
10 K/min
NO
x c
on
centr
atio
n (
ppm
)
Time (s)
NO
NOx
0 1000 2000 3000 4000
0
10
20
30
40
50
60
70
80
90
100
20 K/min
NO
x c
on
centr
atio
n (
ppm
)
Time (s)
NO
NOx
0 1000 2000 3000 4000
0
10
20
30
40
50
60
70
80
90
100
20 K/min
NO
x c
on
centr
atio
n (
ppm
)
Time (s)
NO
NOx
Recycled PE
Neat PE

CHAPTER 10 — Supplementary Document
246
4. Haney, M. A.; Johnston, D. W.; Clampitt, B. H., Investigation of short-chain branches
in polyethylene by pyrolysis - GCMS. Macromolecules 1983, 16, (11), 1775-1783.
5. Vyazovkin, S., Advanced isoconversional method. J. Therm. Anal. 1997, 49, (3), 1493-
1499.
6. Vyazovkin, S.; Burnham, A. K.; Criado, J. M.; Pérez-Maqueda, L. A.; Popescu, C.;
Sbirrazzuoli, N., ICTAC Kinetics Committee recommendations for performing kinetic
computations on thermal analysis data. Thermochim. Acta 2011, 520, (1–2), 1-19.
7. Senum, G. I.; Yang, R. T., Rational approximations of the integral of the Arrhenius
function. J. Therm. Anal. 1977, 11, (3), 445-447.
8. Akahira, T.; Sunose, T., Method of determining activation deterioration constant of
electrical insulating materials. Res. Rep. Chiba Inst. Technol.(Sci. Technol.) 1971, 16, 22-31.
9. Starink, M. J., The determination of activation energy from linear heating rate
experiments: a comparison of the accuracy of isoconversion methods. Thermochim. Acta 2003,
404, (1–2), 163-176.
10. Lyon, R. E., An integral method of nonisothermal kinetic analysis. Thermochim. Acta
1997, 297, (1–2), 117-124.
11. Coats, A. W.; Redfern, J. P., Kinetic Parameters from Thermogravimetric Data. Nature
1964, 201, (4914), 68-69.

CHAPTER 10 — Supplementary Document
247
Appendix II: Supporting Information for Chapter 7 and 8
S7.1. Extrapolated Onset Ignition Temperatures
Figure S7.1. Conversion of morpholine at the outlet of the reactor, under different reaction
atmospheres. The extrapolated onset ignition temperatures amount to 581 °C, 613 °C, 494
°C, and 356 °C for He, He-NOx, He-O2, and He-O2-NOx conditions, respectively.
300 400 500 600 700 800
0
20
40
60
80
100
Per
cen
t co
nv
ersi
on
(%
)
Temperature (C)
He
He-NOx
He-O2
He-O2-NO
x