A Primary Assembly of a Bovine Haplotype Block Map Based on a 15,036-Single-Nucleotide Polymorphism...
10
Copyright Ó 2007 by the Genetics Society of America DOI: 10.1534/genetics.106.069369 A Primary Assembly of a Bovine Haplotype Block Map Based on a 15,036-Single-Nucleotide Polymorphism Panel Genotyped in Holstein–Friesian Cattle Mehar S. Khatkar,* ,†,1 Kyall R. Zenger,* ,† Matthew Hobbs,* ,† Rachel J. Hawken, †,‡ Julie A. L. Cavanagh,* ,† Wes Barris, †,‡ Alexander E. McClintock,* ,† Sara McClintock, †,§ Peter C. Thomson,* ,† Bruce Tier, † Frank W. Nicholas* ,† and Herman W. Raadsma* ,† *Centre for Advanced Technologies in Animal Genetics and Reproduction (ReproGen), University of Sydney, Camden NSW 2570, Australia, ‡ CSIRO Livestock Industries, St. Lucia QLD 4067, Australia, § Animal Genetics and Breeding Unit, University of New England, Armidale NSW 2351, Australia and † CRC for Innovative Dairy Products, Melbourne, Vic 3000, Australia Manuscript received December 6, 2006 Accepted for publication April 3, 2007 ABSTRACT Analysis of data on 1000 Holstein–Friesian bulls genotyped for 15,036 single-nucleotide polymorphisms (SNPs) has enabled genomewide identification of haplotype blocks and tag SNPs. A final subset of 9195 SNPs in Hardy–Weinberg equilibrium and mapped on autosomes on the bovine sequence assembly (release Btau 3.1) was used in this study. The average intermarker spacing was 251.8 kb. The average minor allele frequency (MAF) was 0.29 (0.05–0.5). Following recent precedents in human HapMap studies, a haplotype block was defined where 95% of combinations of SNPs within a region are in very high linkage dis- equilibrium. A total of 727 haplotype blocks consisting of $3 SNPs were identified. The average block length was 69.7 6 7.7 kb, which is 5–10 times larger than in humans. These blocks comprised a total of 2964 SNPs and covered 50,638 kb of the sequence map, which constitutes 2.18% of the length of all autosomes. A set of tag SNPs, which will be useful for further fine-mapping studies, has been identified. Overall, the results suggest that as many as 75,000–100,000 tag SNPs would be needed to track all important haplotype blocks in the bovine genome. This would require 250,000 SNPs in the discovery phase. T HERE is great enthusiasm about the promise of genomewide association studies in cattle, with the recent availability of many thousands of single- nucleotide polymorphism (SNP) markers and rapid improvement in high-throughput SNP genotyping tech- nologies (Craig and Stephan 2005; Gunderson et al. 2005; Hardenbol et al. 2005; Hirschhorn and Daly 2005). For the whole-genome association approach to be applied successfully, there is a need to understand the structure of linkage disequilibrium (LD), particularly the distance to which LD extends and how much it varies from one chromosomal region to another in the population under study. LD maps have been found to be very useful for describing the pattern of LD in humans (De La Vega et al. 2005; Tapper et al. 2005; Service et al. 2006). The application of this approach in cattle has given preliminary pictures of the extent and pattern of LD (Khatkar et al. 2006a), which is being extended to the construction of dense genomewide bovine LD maps (M. S. Khatkar, unpublished data). While LD maps provide information on the extent and pattern of LD in populations, for high-resolution association mapping, it is also necessary to identify haplotype blocks and SNP(s) that most effectively ‘‘tag(s)’’ each block for high-resolution association mapping. Haplotype blocks are chromosome regions of high linkage disequilibrium and typically show low haplotype diversity. Haplotype blocks typically represent regions of low recombina- tion flanked by recombination hotspots. Construction of haplotype blocks and identification of tag SNPs have been found to be quite informative in identification of specific markers for association mapping in humans (Barrett et al. 2005; Hinds et al. 2005; International HapMap Consortium 2005; Zhang et al. 2005; Pe’er et al. 2006). Hinds et al. (2005) estimated that 300,000 and 500,000 tag SNPs would give the same power of associa- tion mapping as using 1.6 million randomly located SNPs, in non-African and African human popula- tions, respectively. Similar observations were made in the recent HapMap report for three ethnic groups (International HapMap Consortium 2005). The study of the haplotype blocks and tag SNPs is an active topic of research. Many algorithms have recently been developed for identifying blocks (reviewed in 1 Corresponding author: Centre for Advanced Technologies in Animal Genetics and Reproduction (ReproGen), University of Sydney, PMB 3, Camden NSW 2570, Australia. E-mail: [email protected] Genetics 176: 763–772 ( June 2007)
-
Upload
independent -
Category
Documents
-
view
2 -
download
0
Transcript of A Primary Assembly of a Bovine Haplotype Block Map Based on a 15,036-Single-Nucleotide Polymorphism...
Copyright � 2007 by the Genetics Society of AmericaDOI: 10.1534/genetics.106.069369
A Primary Assembly of a Bovine Haplotype Block Map Based on a15,036-Single-Nucleotide Polymorphism Panel Genotyped
in Holstein–Friesian Cattle
Mehar S. Khatkar,*,†,1 Kyall R. Zenger,*,† Matthew Hobbs,*,† Rachel J. Hawken,†,‡
Julie A. L. Cavanagh,*,† Wes Barris,†,‡ Alexander E. McClintock,*,†
Sara McClintock,†,§ Peter C. Thomson,*,† Bruce Tier,†
Frank W. Nicholas*,† and Herman W. Raadsma*,†
*Centre for Advanced Technologies in Animal Genetics and Reproduction (ReproGen), University of Sydney, Camden NSW 2570, Australia,‡CSIRO Livestock Industries, St. Lucia QLD 4067, Australia, §Animal Genetics and Breeding Unit, University of New England,
Armidale NSW 2351, Australia and †CRC for Innovative Dairy Products, Melbourne, Vic 3000, Australia
Manuscript received December 6, 2006Accepted for publication April 3, 2007
ABSTRACT
Analysis of data on 1000 Holstein–Friesian bulls genotyped for 15,036 single-nucleotide polymorphisms(SNPs) has enabled genomewide identification of haplotype blocks and tag SNPs. A final subset of 9195SNPs in Hardy–Weinberg equilibrium and mapped on autosomes on the bovine sequence assembly (releaseBtau 3.1) was used in this study. The average intermarker spacing was 251.8 kb. The average minor allelefrequency (MAF) was 0.29 (0.05–0.5). Following recent precedents in human HapMap studies, a haplotypeblock was defined where 95% of combinations of SNPs within a region are in very high linkage dis-equilibrium. A total of 727 haplotype blocks consisting of $3 SNPs were identified. The average blocklength was 69.7 6 7.7 kb, which is �5–10 times larger than in humans. These blocks comprised a total of2964 SNPs and covered 50,638 kb of the sequence map, which constitutes 2.18% of the length of allautosomes. A set of tag SNPs, which will be useful for further fine-mapping studies, has been identified.Overall, the results suggest that as many as 75,000–100,000 tag SNPs would be needed to track all importanthaplotype blocks in the bovine genome. This would require �250,000 SNPs in the discovery phase.
THERE is great enthusiasm about the promise ofgenomewide association studies in cattle, with
the recent availability of many thousands of single-nucleotide polymorphism (SNP) markers and rapidimprovement in high-throughput SNP genotyping tech-nologies (Craig and Stephan 2005; Gunderson et al.2005; Hardenbol et al. 2005; Hirschhorn and Daly
2005).For the whole-genome association approach to be
applied successfully, there is a need to understand thestructure of linkage disequilibrium (LD), particularlythe distance to which LD extends and how much itvaries from one chromosomal region to another in thepopulation under study. LD maps have been found to bevery useful for describing the pattern of LD in humans(De La Vega et al. 2005; Tapper et al. 2005; Service et al.2006). The application of this approach in cattle hasgiven preliminary pictures of the extent and pattern ofLD (Khatkar et al. 2006a), which is being extendedto the construction of dense genomewide bovine LDmaps (M. S. Khatkar, unpublished data). While LD
maps provide information on the extent and patternof LD in populations, for high-resolution associationmapping, it is also necessary to identify haplotype blocksand SNP(s) that most effectively ‘‘tag(s)’’ each block forhigh-resolution association mapping. Haplotype blocksare chromosome regions of high linkage disequilibriumand typically show low haplotype diversity. Haplotypeblocks typically represent regions of low recombina-tion flanked by recombination hotspots. Constructionof haplotype blocks and identification of tag SNPs havebeen found to be quite informative in identification ofspecific markers for association mapping in humans(Barrett et al. 2005; Hinds et al. 2005; International
HapMap Consortium 2005; Zhang et al. 2005; Pe’er
et al. 2006).Hinds et al. (2005) estimated that �300,000 and
500,000 tag SNPs would give the same power of associa-tion mapping as using 1.6 million randomly locatedSNPs, in non-African and African human popula-tions, respectively. Similar observations were made inthe recent HapMap report for three ethnic groups(International HapMap Consortium 2005).
The study of the haplotype blocks and tag SNPs is anactive topic of research. Many algorithms have recentlybeen developed for identifying blocks (reviewed in
1Corresponding author: Centre for Advanced Technologies in AnimalGenetics and Reproduction (ReproGen), University of Sydney, PMB 3,Camden NSW 2570, Australia. E-mail: [email protected]
Genetics 176: 763–772 ( June 2007)
Cardon and Abecasis 2003; Wall and Pritchard
2003a,b). The criteria for block identification are mainlybased on pairwise D9-values (as defined by Hedrick
1987), haplotype diversity, and the location of knownrecombination hotspots. Daly et al. (2001) searched forregions of low haplotype diversity by comparing theobserved haplotypic heterozygosity in sliding windows.Dawson et al. (2002) used both D9 and a reduced hap-lotype diversity criterion. Zhang and Jin (2003) im-plemented several algorithms in a program namedHaploBlockFinder.
Using the confidence interval of D9, Gabriel et al.(2002) defined a block as a region within which onlya small proportion of SNP pairs (e.g., 5%) exhibit strongevidence of historical recombination (upper confi-dence bound of D9 is ,0.9). Others (Phillips et al.2003; Twells et al. 2003) have used a similar approach.We have adopted the approach of Gabriel et al. (2002)in this study.
Most studies in livestock have been mainly restrictedto the estimation of the extent of LD based on pairwisemeasures of LD and have detected extensive long-rangeLD in cattle (Farnir et al. 2000; Tenesa et al. 2003;Vallejo et al. 2003; Khatkar et al. 2006b; Odani et al.2006), sheep (McRae et al. 2002), pig (Nsengimana
et al. 2004), and horse (Tozaki et al. 2005). Long-rangeLD in livestock populations appears to be much moreextensive than in humans, where typically it extends foronly a few kilobases (Hinds et al. 2005). So far there hasbeen no attempt to construct a haplotype block map incattle and other livestock species. However, this type ofanalysis is now possible with the availability of medium-density SNP panels covering the bovine genome.
As a result of a large-scale international resequencingcollaboration (http://www.hgsc.bcm.tmc.edu/projects/bovine/), 10,410 bovine SNP markers became availablein 2005. In addition, Hawken et al. (2004) identified17,344 putative coding-region bovine SNPs from ananalysis of a large number of expressed sequence tags(ESTs). Gene-centric variants are more likely to affectgene function than those that occur outside genes( Jorgenson and Witte 2006). We added the mostpromising 4626 of these gene-centric SNPs to the10,410, to give a total pool of 15,036 SNPs that weregenotyped in 1546 Holstein–Friesian bulls. In thisarticle, we report the use of these data to constructhaplotype blocks for the whole bovine genome andidentify tag SNPs. The chromosomal coverage by theblocks was then determined. The usefulness of thesemethods based on present SNP density is discussed.
MATERIALS AND METHODS
DNA samples and selection of bulls: A panel of 1546Holstein–Friesian bulls born between 1955 and 2001 wasselected for genotyping. Most of these bulls were born inAustralia (1435) with smaller numbers being born in the
United States (53), Canada (35), New Zealand (8), TheNetherlands (8), Great Britain (3), France (3), and Germany(1). There were more bulls from the recent cohorts thanfrom older cohorts. This panel of bulls represents near-to-normal distributions for Australian breeding values (ABVs)for the most common production traits recorded throughthe Australian Dairy Herd Improvement Scheme (ADHIS;http://www.adhis.com.au/). From ADHIS pedigree informa-tion and using FORTRAN programs in the PEDIG package ofD. Boichard (http://dga.jouy.inra.fr/sgqa/diffusions/pedig/pedigE.htm), kinship (coefficient of coancestry) was calcu-lated for each pairwise combinations of bulls. On this basis, theleast-related 1000 bulls were chosen for this analysis, from theoriginal 1546 bulls. The mean kinship (coefficient of coances-try) among these 1000 bulls is 0.012, with 0 and 0.017 for thefirst and third quartiles, respectively. These bulls were assumedunrelated for the purpose of the present analysis.
Extraction and amplification of DNA: Semen samples formost of these bulls, obtained from Genetics Australia (BacchusMarsh, Victoria, Australia), were the source of genomic DNA.The genomic DNA of 18 bulls was kindly provided by JerryTaylor, University of Missouri, Columbia, Missouri. DNA wasextracted from straws of frozen semen by a salting-out methodadapted from Heyen et al. (1997). As the yields of somegenomic DNA per straw were limited, all DNA samples wereamplified using a whole-genome amplification (WGA) kit(Repli-G, Molecular Staging). A comparison of the genotypesof genomic DNA and the WGA DNA, for the SNP markersgenotyped in this study, showed an average inconsistency of,1% (details are given in Hawken et al. 2006). All genotypingon which the present analysis is based was carried out usingWGA DNA.
Identification and source of SNPs: A genomewide high-density panel of 15,036 SNPs was assembled for genotypingacross the panel of bulls. Of these SNPs, 10,410 (MegAlleleGenotyping Bovine 10,000-SNP Panel, ParAllele) were gener-ated as part of the community project of the InternationalBovine Genome Sequencing Consortium (IBGSC) (http://www.hgsc.bcm.tmc.edu/projects/bovine/). The remaining4626 custom SNPs were selected from the Interactive BovineIn Silico SNP (IBISS) database (Hawken et al. 2004) (http://www.livestockgenomics.csiro.au/ibiss/), from in-house se-quencing, and from publications (Grosse et al. 1999; Heaton
et al. 1999; Prinzenberg et al. 1999; Olsen et al. 2000, 2005;Cohen et al. 2004). IBISS is a database application constructedby clustering all publicly available bovine ESTs. From eachcluster, a consensus sequence was obtained. When a base in anEST differed from the corresponding base in the consensussequence, the position was recorded as a SNP candidate. SNPcandidates were organized according to their proximity toother SNP candidates and the number of ESTs exhibiting thealternate base at that same location. The custom SNPs de-scribed above were taken from a pool of what were consideredto be the ‘‘best’’ SNP candidates in IBISS. The best SNP candi-dates are those where the alternate base occurs in at least 30%of the ESTs in that alignment and where no more than twoSNP candidates occur in a sliding window of 10 bases. BovineQTL regions of interest (Khatkar et al. 2004) were translatedto the human genome. The 4626 custom SNPs were those withpredicted human locations most closely corresponding to theQTL regions of interest and/or from key candidate genes.
SNP genotyping: A high-throughput SNP assay serviceprovided by Affimetrix was used for genotyping. A highlymultiplexed molecular inversion probe (MIP) technologydeveloped by ParAllele Bioscience (Hardenbol et al. 2005)was applied. MIPs are unimolecular oligonuclotide SNP-specific probes that are insensitive to cross-reactivity amongmultiple probe molecules. MIPs hybridize to genomic DNA,
764 M. S. Khatkar et al.
and an enzymatic ‘‘gap fill’’ process produces an allele-specificsignature. The resulting circularized probe can be separatedfrom cross-reacted or unreacted probes by a simple exonu-clease reaction and then amplified with a universal set ofprimers for all probes. Each specific SNP assay is detected viahybridization to an Affymetrix gene chip that has a uniquephysical position (Hardenbol et al. 2003, 2005). To ensurestrict data integrity, concealed duplicated DNA samples wereincluded throughout the entire genotyping process. Themean concordance between 23 duplicated DNA samples was99.4%.
Estimation of SNP locations: The locations of the SNPswere determined on the bovine sequence assembly Btau3.1 (ftp://ftp.hgsc.bcm.tmc.edu/pub/data/Btaurus/fasta/Btau20060815-freeze/). The SNPs were placed on chromo-somal linearized scaffolds using sequence similarity. TheFASTA sequence data for each candidate SNP were generatedby taking 100 bases of flanking consensus (EST) sequencefrom either side of the SNP. These FASTA sequences werecompared with sequences in the 3.1 assembly using BLAT(Kent 2002) similarity searching specifying a minimum of95% identity. SNP positions within the flanking sequence wereconverted to ‘‘exact’’ positions within the assembly using theBLAT output. The positions for all the 15,036 genotyping as-says on this sequence map could be estimated. However, only13,705 SNPs were placed on sequence scaffolds that have beenassigned to a real chromosome; the rest (1331 SNPs) were onchromosomally unanchored scaffolds. After screening outSNPs with low MAF (MAF , 0.05), deviations from Hardy–Weinberg equilibrium (as detected by Fisher’s exact test, P ,0.0001), and other quality measures, 9195 SNPs mapped onautosomes were used in this analysis.
Identification of genes matching SNP locations: Details ofthe bovine records in NCBI’s Entrez Gene database wereextracted from the files gene_info (downloaded from ftp://ftp.ncbi.nlm.nih.gov/gene/DATA/ on January 15, 2007) andseq_gene.md (downloaded from ftp://ftp.ncbi.nlm.nih.gov/genomes/Bos_taurus/mapview/ on January 6, 2007). Pre-dicted genes that span SNP locations were noted.
Construction of the haplotype block map: Haplotypeblocks were identified as per the definition of Gabriel et al.(2002) for all autosomes, using Haploview software (Barrett
et al. 2005), on the basis of estimates of D9 for all pairwisecombinations of SNPs within each chromosome. As discussedin the preceding section, the animals included in the analysiswere relatively unrelated. Hence estimates of LD are basedon the estimates of population frequencies of haplotypes asdetermined from the unphased input, using the algorithm ofQin et al. (2002) implemented in Haploview. Ninety-fivepercent confidence bounds on D9 were generated as per thealgorithm of Gabriel et al. (2002) implemented in Haploview.Following Gabriel et al. (2002), a pair of SNPs is defined to bein ‘‘strong LD’’ if the upper 95% confidence bound of D9 is.0.98 (consistent with no historical recombination) and thelower bound is .0.7. Using the Haploview default valuesfor blocks (Gabriel et al. 2002), a haplotype block is definedas a region over which 95% of informative SNP pairs showstrong LD.
Identification of tag SNPs: Two approaches were used toidentify tag SNPs. In the first approach, haplotype tag SNPs(htSNPs) were selected on a block-by-block basis. Specifically,the htSNPs in each block were identified that could define allthe common haplotypes in that block. However, this set is notnecessarily the most parsimonious one for the entire data set.Hence a second approach, which is based on a joint consid-eration of all SNPs, was also applied using the pairwise taggingmethod of the Tagger program (de Bakker et al. 2005) im-plemented in Haploview. This method selects a minimal set of
markers such that all alleles to be captured are correlated at anr2 greater than a defined threshold (r2 $ 0.8) with a marker inthat set. Pairwise tagging means that all tag SNPs will act asdirect proxies to all other unselected SNPs because they arehighly correlated with one another.
Haplotype diversity within blocks: Haplotype frequency wascalculated in Haploview using an accelerated EM algorithmmethod described by Qin et al. (2002). This estimated pop-ulation frequency of haplotypes is based on maximum likeli-hood as determined from the unphased input. Haplotypediversity within a block was then computed as
H ¼ n
n � 13 1�
Xk
i¼1
p2i
" #;
where k is the number of haplotypes observed with frequencypi, and n is the total number of chromosomes (Nei 1987).
RESULTS
Of the 15,036 SNPs genotyped, 13,049 (87%) werepolymorphic (minor allele frequency, MAF . 0) in the1000 bulls finally included in this study. A further 1776(14% of the biallelic) SNPs had ,0.05 MAF. Of thepolymorphic SNPs on the autosomes, 824 (7%) showeddeviation from Hardy–Weinberg equilibrium (P ,
0.0001) and were excluded from this analysis. The SNPs(232) typed in ,50% of animals were also removedfrom the analysis. Of the remaining SNPs, 9195 wereable to be located on autosomes in the bovine sequenceassembly Btau 3.1 and were included in this analysis. Ofthese, 7057 (77%) of SNPs are from the MegAllele10,000-SNP panel and 2138 (23%) are from the customSNP panel. These SNPs were on an average typed on 992bulls of 1000 included in this analysis with a minimum of732 bulls for any SNP. The details of these SNPs, whichcompose the set used in these analyses, are providedin supplemental Table S1 at http://www.genetics.org/supplemental/. The number of SNPs on chromosomesvaried from 158 on BTA27 to 528 on BTA1. The averageintermarker spacing for the entire genome was 251.8 6
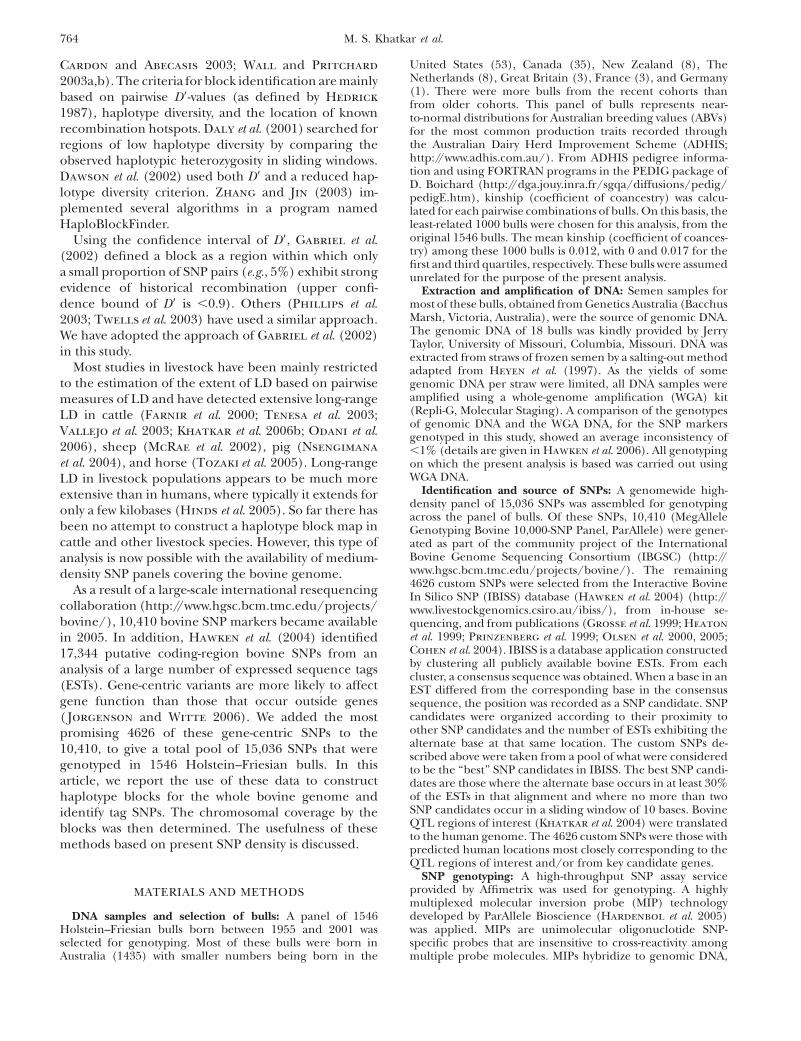
4.0 kb with a median spacing of 93.9 kb. There were59 intermarker intervals .2 Mb and only 5 intervals.3 Mb. The distribution of SNP spacing over the ge-nome is shown in Figure 1a. The overall MAF of theSNPs used in these analyses was 0.286 6 0.001.
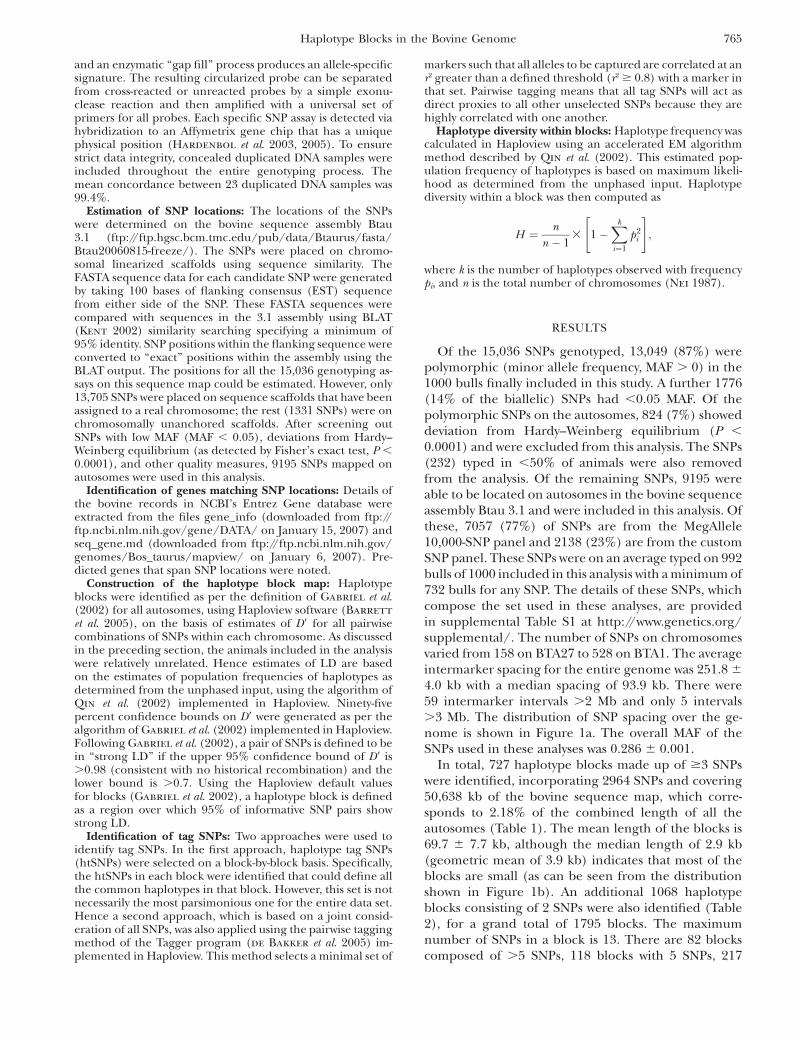
In total, 727 haplotype blocks made up of $3 SNPswere identified, incorporating 2964 SNPs and covering50,638 kb of the bovine sequence map, which corre-sponds to 2.18% of the combined length of all theautosomes (Table 1). The mean length of the blocks is69.7 6 7.7 kb, although the median length of 2.9 kb(geometric mean of 3.9 kb) indicates that most of theblocks are small (as can be seen from the distributionshown in Figure 1b). An additional 1068 haplotypeblocks consisting of 2 SNPs were also identified (Table2), for a grand total of 1795 blocks. The maximumnumber of SNPs in a block is 13. There are 82 blockscomposed of .5 SNPs, 118 blocks with 5 SNPs, 217
Haplotype Blocks in the Bovine Genome 765
blocks with 4 SNPs, and 310 blocks with 3 SNPs. Meanblock length varies from 2.0 kb for the 2-SNP blocks to153.8 kb for blocks with 5 SNPs. The biggest block covers2296.3 kb on chromosome 5 and includes 4 SNPs. De-tailed information on individual blocks in each chro-mosome is presented in supplemental Tables S1 and S2at http://www.genetics.org/supplemental/.
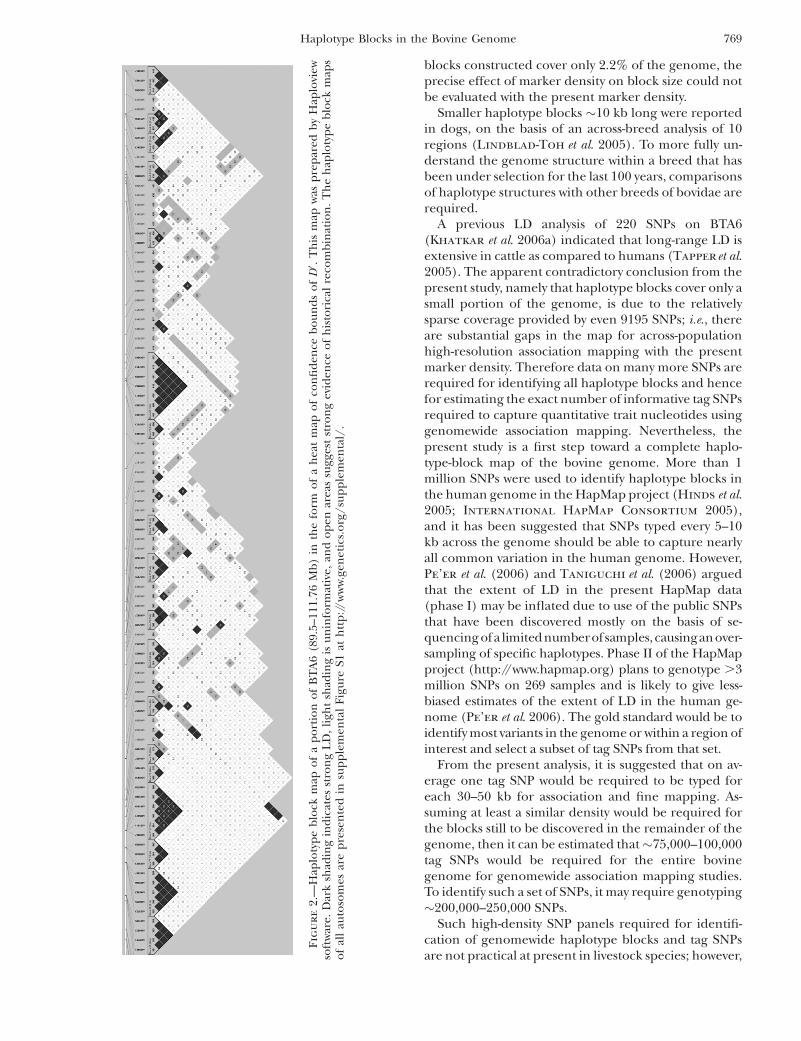
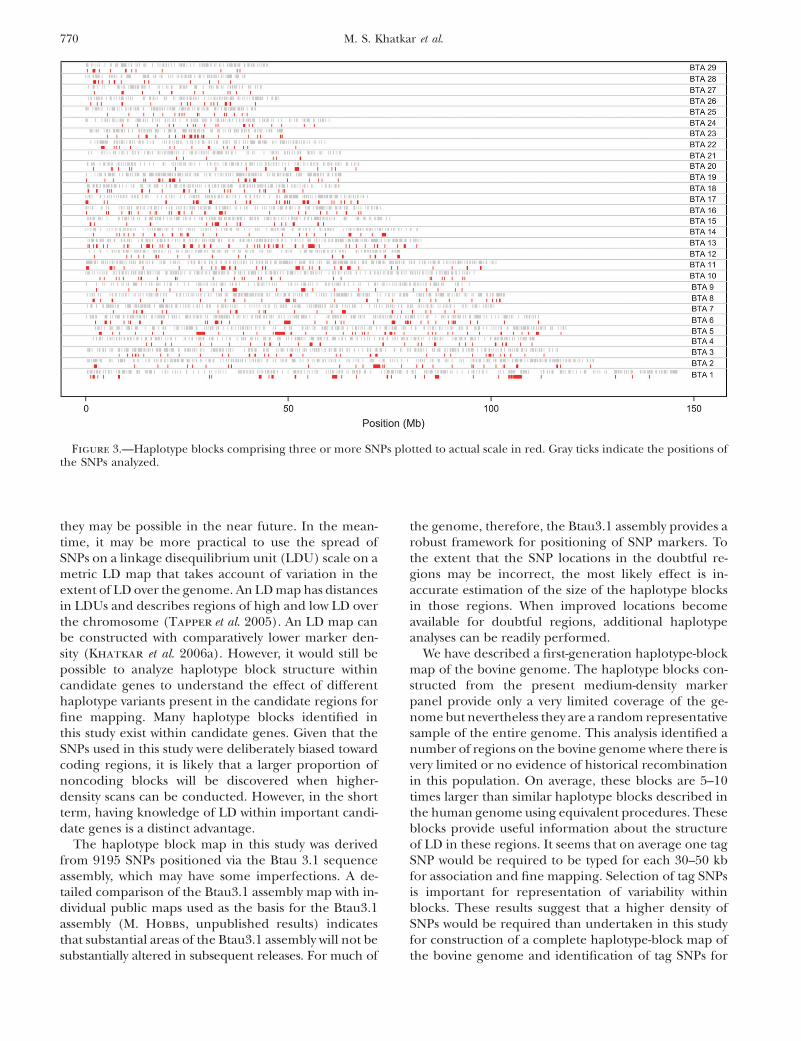
Haplotype-block maps of all the autosomes arepresented in supplemental Figure S1 at http://www.genetics.org/supplemental/ in the form of an LD matrixheat map, in which all haplotype blocks identified inthis analysis are shown in dark shading. Electronic copiesof higher-resolution images of the haplotype-blockmaps can be obtained from the corresponding author.As an example, the haplotype-block map of a portionof chromosome 6 is presented in Figure 2. The locationsof the 727 blocks made up of three or more adjacentSNPs are presented graphically on an actual megabasescale in Figure 3. Perusal of supplemental Figure S1
and Figure 3 indicates that most of these blocks exist atregions of high SNP density and that possibly the in-creased SNP density has allowed these blocks to beidentified. There were 341 blocks in which gene namesfor at least two SNPs could be assigned. SNPs withinblocks were compared for their gene names and it wasfound that in 72% of these 341 blocks, SNPs within ablock occur in a single gene. Names of genes predictedto contain SNPs are given in supplemental Table S1 athttp://www.genetics.org/supplemental/. It can also benoted in supplemental Table S1 that there are many re-gions where SNPs are in close proximity but do not formhaplotype blocks.
The number of common haplotypes within a blockas defined by haplotypes composing $80% of all haplo-types in a block, in the sample of 1000 bulls, rangesfrom 1 to 5 (mean 2.22). This represents limited haplo-type diversity within a block, which is also indicated byan overall haplotype diversity of 0.53 for all haplotypeblocks (Table 2). Haplotype diversity in the individualblocks is given in supplemental Table S2 at http://www.genetics.org/supplemental/.
The mean D9-values between SNPs within haplotypeblocks are close to one for all the categories of blocks(Table 2). This is expected as per the stringent defini-tion of haplotype blocks. Overall mean r 2-values varyfrom 0.65 to 0.72 for the blocks comprising differentnumbers of SNPs. The mean D9- and r 2-values withinindividual blocks are given in supplemental Table S2 athttp://www.genetics.org/supplemental/. In contrast toaverage D9 within blocks, there is substantial variation inthe mean r 2-values of individual haplotype blocks andthere are many blocks with a low mean r 2 (supplementalTable S2). This may emphasize the importance of iden-tifying tag SNPs with haplotype blocks.
The htSNPs identified for each block are presentedin supplemental Table S1 at http://www.genetics.org/supplemental/ and are summarized in supplementalTable S2 at http://www.genetics.org/supplemental/and in Table 1. A total of 1552 htSNPs were identifiedin the 727 blocks comprising $3 SNPs. This numberrepresents 52.4% of all SNPs in these blocks. From thetotal length of the haplotype blocks and the number ofhtSNPs in the blocks composed of $3 SNPs, it can beestimated that on an average 1 SNP would be requiredeach 33 kb in these blocks for association mapping. Ifonly blocks comprising $4 SNPs are considered, onaverage 1 SNP would be required for each 50 kb inthese blocks. However, there is considerable variation inLD and in the proportion of htSNPs in individualblocks, as shown in supplemental Table S2.
As mentioned in materials and methods, htSNPs,selected on a block-by-block basis, may not be the mostparsimonious set of tag SNPs. Hence the second ap-proach was used to identify tag SNPs on the basis of pair-wise tagging (r2 $ 0.8) of all SNPs. The number of tagSNPs identified by this approach for each chromosome
Figure 1.—(a) The distribution of SNP spacing ½the dis-tance in base pairs (kilobases) from one SNP marker to thenext SNP marker�. (b) Frequency distribution of size of hap-lotype blocks consisting of more than two SNPs.
766 M. S. Khatkar et al.
TA
BL
E1
Ch
rom
oso
mew
ide
sum
mar
yo
fh
aplo
typ
eb
lock
s(c
on
sist
ing
of
thre
eo
rm
ore
SN
Ps)
inth
eb
ovi
ne
gen
om
e
Ch
rom
oso
me
No
.o
fSN
Ps
No
.o
fb
lock
sT
ota
lb
lock
len
gth
(kb
)B
lock
mea
nsi
ze6
SE(k
b)
Blo
cksi
ze(m
in)
Blo
cksi
ze(m
ax)
Ch
rom
oso
me
len
gth
(Mb
)%
cove
rage
No
.o
fSN
Ps
inb
lock
sh
tSN
P%
htS
NP
Tag
SNP
s(p
airw
ise)
a
%p
airw
ise
tag
SNP
sb
152
836
4,72
913
1.4
651
.50.
100
1,50
2.3
145.
93.
2415
675
48.1
381
72.2
246
235
2,23
663
.96
42.2
0.09
11,
475.
912
5.3
1.79
141
8056
.734
875
.33
469
381,
709
45.0
617
.50.
201
537.
011
6.3
1.47
145
7954
.535
776
.14
384
291,
180
40.7
620
.80.
075
499.
011
0.7
1.07
110
5550
.028
875
.05
417
396,
192
158.
86
75.8
0.17
62,
296.
311
8.5
5.23
146
7350
.030
974
.16
443
373,
569
96.4
645
.40.
093
1,45
3.9
111.
73.
2015
475
48.7
329
74.3
735
724
1,05
243
.86
26.1
0.13
561
1.5
100.
71.
0493
4851
.628
379
.38
389
281,
699
60.7
631
.00.
285
787.
210
3.2
1.65
109
5954
.130
979
.49
265
211,
447
68.9
644
.90.
184
725.
594
.61.
5378
3443
.619
874
.710
403
2747
017
.46
6.7
0.07
812
3.9
95.8
0.49
111
6558
.630
876
.411
452
324,
513
141.
06
48.6
0.11
595
5.6
101.
14.
4613
986
61.9
343
75.9
1227
622
563
25.6
610
.60.
169
154.
577
.40.
7396
4243
.820
574
.313
406
475,
080
108.
16
35.0
0.12
51,
345.
682
.76.
1420
411
254
.928
069
.014
303
271,
969
72.9
639
.50.
161
995.
781
.92.
4011
561
53.0
216
71.3
1530
920
1,54
277
.16
41.5
0.05
877
1.1
75.1
2.05
8540
47.1
224
72.5
1631
731
1,34
543
.46
24.1
0.16
167
4.4
72.7
1.85
127
5845
.722
270
.017
302
283,
026
108.
16
36.0
0.19
366
1.3
69.5
4.35
117
6757
.322
574
.518
294
2749
318
.36
6.0
0.12
812
7.2
62.5
0.79
106
5955
.721
874
.119
344
251,
503
60.1
621
.00.
249
423.
963
.02.
3811
058
52.7
269
78.2
2025
417
888
52.2
632
.90.
116
544.
667
.31.
3267
3552
.218
572
.821
181
621
135
.16
21.5
0.19
913
8.4
62.9
0.33
3112
38.7
154
85.1
2225
217
656
38.6
621
.00.
195
307.
659
.01.
1178
3747
.418
874
.623
260
251,
350
54.0
625
.40.
127
454.
348
.62.
7898
5758
.219
173
.524
222
1856
531
.46
20.8
0.25
137
6.4
60.0
0.94
7542
56.0
160
72.1
2522
518
206
11.4
64.
30.
089
71.6
41.9
0.49
6735
52.2
172
76.4
2618
416
462
28.9
617
.10.
127
268.
847
.50.
9759
3457
.614
679
.327
158
1452
037
.26
20.0
0.19
028
1.9
43.2
1.20
5328
52.8
120
75.9
2815
912
741
61.7
653
.90.
179
653.
039
.41.
8845
2555
.612
880
.529
180
1172
465
.86
45.6
0.37
349
7.6
44.9
1.61
4921
42.9
134
74.4
To
tal
9,19
572
750
,638
69.7
67.
70.
058
2,29
6.3
2,32
3.4
2.18
2,96
41,
552
52.4
6,89
074
.9
aT
he
nu
mb
ero
fta
gSN
Ps
iden
tifi
edo
nth
eb
asis
of
the
pai
rwis
eta
ggin
gm
eth
od
usi
ng
all
the
SNP
so
nth
ech
rom
oso
me.
bT
he
per
cen
tage
of
pai
rwis
eta
gSN
Ps
of
all
the
SNP
so
nth
ech
rom
oso
me.
Haplotype Blocks in the Bovine Genome 767
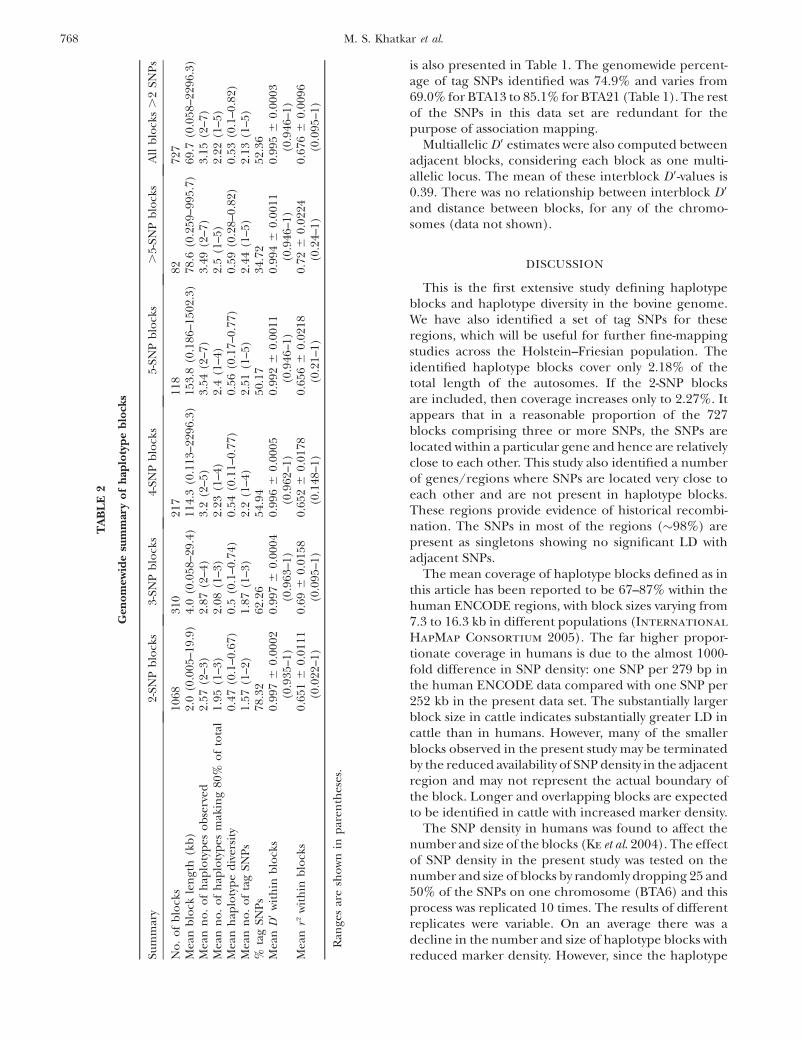
is also presented in Table 1. The genomewide percent-age of tag SNPs identified was 74.9% and varies from69.0% for BTA13 to 85.1% for BTA21 (Table 1). The restof the SNPs in this data set are redundant for thepurpose of association mapping.
Multiallelic D9 estimates were also computed betweenadjacent blocks, considering each block as one multi-allelic locus. The mean of these interblock D9-values is0.39. There was no relationship between interblock D9
and distance between blocks, for any of the chromo-somes (data not shown).
DISCUSSION
This is the first extensive study defining haplotypeblocks and haplotype diversity in the bovine genome.We have also identified a set of tag SNPs for theseregions, which will be useful for further fine-mappingstudies across the Holstein–Friesian population. Theidentified haplotype blocks cover only 2.18% of thetotal length of the autosomes. If the 2-SNP blocksare included, then coverage increases only to 2.27%. Itappears that in a reasonable proportion of the 727blocks comprising three or more SNPs, the SNPs arelocated within a particular gene and hence are relativelyclose to each other. This study also identified a numberof genes/regions where SNPs are located very close toeach other and are not present in haplotype blocks.These regions provide evidence of historical recombi-nation. The SNPs in most of the regions (�98%) arepresent as singletons showing no significant LD withadjacent SNPs.
The mean coverage of haplotype blocks defined as inthis article has been reported to be 67–87% within thehuman ENCODE regions, with block sizes varying from7.3 to 16.3 kb in different populations (International
HapMap Consortium 2005). The far higher propor-tionate coverage in humans is due to the almost 1000-fold difference in SNP density: one SNP per 279 bp inthe human ENCODE data compared with one SNP per252 kb in the present data set. The substantially largerblock size in cattle indicates substantially greater LD incattle than in humans. However, many of the smallerblocks observed in the present study may be terminatedby the reduced availability of SNP density in the adjacentregion and may not represent the actual boundary ofthe block. Longer and overlapping blocks are expectedto be identified in cattle with increased marker density.
The SNP density in humans was found to affect thenumber and size of the blocks (Ke et al. 2004). The effectof SNP density in the present study was tested on thenumber and size of blocks by randomly dropping 25 and50% of the SNPs on one chromosome (BTA6) and thisprocess was replicated 10 times. The results of differentreplicates were variable. On an average there was adecline in the number and size of haplotype blocks withreduced marker density. However, since the haplotype
TA
BL
E2
Gen
om
ewid
esu
mm
ary
of
hap
loty
pe
blo
cks
Sum
mar
y2-
SNP
blo
cks
3-SN
Pb
lock
s4-
SNP
blo
cks
5-SN
Pb
lock
s.
5-SN
Pb
lock
sA
llb
lock
s.
2SN
Ps
No
.o
fb
lock
s10
6831
021
711
882
727
Mea
nb
lock
len
gth
(kb
)2.
0(0
.005
–19.
9)4.
0(0
.058
–29.
4)11
4.3
(0.1
13–2
296.
3)15
3.8
(0.1
86–1
502.
3)78
.6(0
.259
–995
.7)
69.7
(0.0
58–2
296.
3)M
ean
no
.o
fh
aplo
typ
eso
bse
rved
2.57
(2–3
)2.
87(2
–4)
3.2
(2–5
)3.
54(2
–7)
3.49
(2–7
)3.
15(2
–7)
Mea
nn
o.
of
hap
loty
pes
mak
ing
80%
of
tota
l1.
95(1
–3)
2.08
(1–3
)2.
23(1
–4)
2.4
(1–4
)2.
5(1
–5)
2.22
(1–5
)M
ean
hap
loty
pe
div
ersi
ty0.
47(0
.1–0
.67)
0.5
(0.1
–0.7
4)0.
54(0
.11–
0.77
)0.
56(0
.17–
0.77
)0.
59(0
.28–
0.82
)0.
53(0
.1–0
.82)
Mea
nn
o.
of
tag
SNP
s1.
57(1
–2)
1.87
(1–3
)2.
2(1
–4)
2.51
(1–5
)2.
44(1
–5)
2.13
(1–5
)%
tag
SNP
s78
.32
62.2
654
.94
50.1
734
.72
52.3
6M
ean
D9
wit
hin
blo
cks
0.99
76
0.00
02(0
.935
–1)
0.99
76
0.00
04(0
.963
–1)
0.99
66
0.00
05(0
.962
–1)
0.99
26
0.00
11(0
.946
–1)
0.99
46
0.00
11(0
.946
–1)
0.99
56
0.00
03(0
.946
–1)
Mea
nr2
wit
hin
blo
cks
0.65
16
0.01
11(0
.022
–1)
0.69
60.
0158
(0.0
95–1
)0.
652
60.
0178
(0.1
48–1
)0.
656
60.
0218
(0.2
1–1)
0.72
60.
0224
(0.2
4–1)
0.67
66
0.00
96(0
.095
–1)
Ran
ges
are
sho
wn
inp
aren
thes
es.
768 M. S. Khatkar et al.
blocks constructed cover only 2.2% of the genome, theprecise effect of marker density on block size could notbe evaluated with the present marker density.
Smaller haplotype blocks �10 kb long were reportedin dogs, on the basis of an across-breed analysis of 10regions (Lindblad-Toh et al. 2005). To more fully un-derstand the genome structure within a breed that hasbeen under selection for the last 100 years, comparisonsof haplotype structures with other breeds of bovidae arerequired.
A previous LD analysis of 220 SNPs on BTA6(Khatkar et al. 2006a) indicated that long-range LD isextensive in cattle as compared to humans (Tapper et al.2005). The apparent contradictory conclusion from thepresent study, namely that haplotype blocks cover only asmall portion of the genome, is due to the relativelysparse coverage provided by even 9195 SNPs; i.e., thereare substantial gaps in the map for across-populationhigh-resolution association mapping with the presentmarker density. Therefore data on many more SNPs arerequired for identifying all haplotype blocks and hencefor estimating the exact number of informative tag SNPsrequired to capture quantitative trait nucleotides usinggenomewide association mapping. Nevertheless, thepresent study is a first step toward a complete haplo-type-block map of the bovine genome. More than 1million SNPs were used to identify haplotype blocks inthe human genome in the HapMap project (Hinds et al.2005; International HapMap Consortium 2005),and it has been suggested that SNPs typed every 5–10kb across the genome should be able to capture nearlyall common variation in the human genome. However,Pe’er et al. (2006) and Taniguchi et al. (2006) arguedthat the extent of LD in the present HapMap data(phase I) may be inflated due to use of the public SNPsthat have been discovered mostly on the basis of se-quencing ofa limitednumberofsamples, causinganover-sampling of specific haplotypes. Phase II of the HapMapproject (http://www.hapmap.org) plans to genotype .3million SNPs on 269 samples and is likely to give less-biased estimates of the extent of LD in the human ge-nome (Pe’er et al. 2006). The gold standard would be toidentify most variants in the genome or within a region ofinterest and select a subset of tag SNPs from that set.
From the present analysis, it is suggested that on av-erage one tag SNP would be required to be typed foreach 30–50 kb for association and fine mapping. As-suming at least a similar density would be required forthe blocks still to be discovered in the remainder of thegenome, then it can be estimated that�75,000–100,000tag SNPs would be required for the entire bovinegenome for genomewide association mapping studies.To identify such a set of SNPs, it may require genotyping�200,000–250,000 SNPs.
Such high-density SNP panels required for identifi-cation of genomewide haplotype blocks and tag SNPsare not practical at present in livestock species; however,
Fig
ur
e2.
—H
aplo
typ
eb
lock
map
of
ap
ort
ion
of
BT
A6
(89.
5–11
1.76
Mb
)in
the
form
of
ah
eat
map
of
con
fid
ence
bo
un
ds
of
D9.
Th
ism
apw
asp
rep
ared
by
Hap
lovi
ewso
ftw
are.
Dar
ksh
adin
gin
dic
ates
stro
ng
LD
,li
ght
shad
ing
isu
nin
form
ativ
e,an
do
pen
area
ssu
gges
tst
ron
gev
iden
ceo
fh
isto
rica
lre
com
bin
atio
n.
Th
eh
aplo
typ
eb
lock
map
so
fal
lau
toso
mes
are
pre
sen
ted
insu
pp
lem
enta
lF
igu
reS1
ath
ttp
://w
ww
.gen
etic
s.o
rg/
sup
ple
men
tal/
.
Haplotype Blocks in the Bovine Genome 769
they may be possible in the near future. In the mean-time, it may be more practical to use the spread ofSNPs on a linkage disequilibrium unit (LDU) scale on ametric LD map that takes account of variation in theextent of LD over the genome. An LD map has distancesin LDUs and describes regions of high and low LD overthe chromosome (Tapper et al. 2005). An LD map canbe constructed with comparatively lower marker den-sity (Khatkar et al. 2006a). However, it would still bepossible to analyze haplotype block structure withincandidate genes to understand the effect of differenthaplotype variants present in the candidate regions forfine mapping. Many haplotype blocks identified inthis study exist within candidate genes. Given that theSNPs used in this study were deliberately biased towardcoding regions, it is likely that a larger proportion ofnoncoding blocks will be discovered when higher-density scans can be conducted. However, in the shortterm, having knowledge of LD within important candi-date genes is a distinct advantage.
The haplotype block map in this study was derivedfrom 9195 SNPs positioned via the Btau 3.1 sequenceassembly, which may have some imperfections. A de-tailed comparison of the Btau3.1 assembly map with in-dividual public maps used as the basis for the Btau3.1assembly (M. Hobbs, unpublished results) indicatesthat substantial areas of the Btau3.1 assembly will not besubstantially altered in subsequent releases. For much of
the genome, therefore, the Btau3.1 assembly provides arobust framework for positioning of SNP markers. Tothe extent that the SNP locations in the doubtful re-gions may be incorrect, the most likely effect is in-accurate estimation of the size of the haplotype blocksin those regions. When improved locations becomeavailable for doubtful regions, additional haplotypeanalyses can be readily performed.
We have described a first-generation haplotype-blockmap of the bovine genome. The haplotype blocks con-structed from the present medium-density markerpanel provide only a very limited coverage of the ge-nome but nevertheless they are a random representativesample of the entire genome. This analysis identified anumber of regions on the bovine genome where there isvery limited or no evidence of historical recombinationin this population. On average, these blocks are 5–10times larger than similar haplotype blocks described inthe human genome using equivalent procedures. Theseblocks provide useful information about the structureof LD in these regions. It seems that on average one tagSNP would be required to be typed for each 30–50 kbfor association and fine mapping. Selection of tag SNPsis important for representation of variability withinblocks. These results suggest that a higher density ofSNPs would be required than undertaken in this studyfor construction of a complete haplotype-block map ofthe bovine genome and identification of tag SNPs for
Figure 3.—Haplotype blocks comprising three or more SNPs plotted to actual scale in red. Gray ticks indicate the positions ofthe SNPs analyzed.
770 M. S. Khatkar et al.
whole-genome populationwide LD studies in dairycattle.
We thank Genetics Australia for semen samples and the AustralianDairy Herd Improvement Scheme for pedigree data. This research issupported by the Cooperative Research Centre for Innovative DairyProducts, Victoria, Australia.
LITERATURE CITED
Barrett, J. C., B. Fry, J. Maller and M. J. Daly, 2005 Haploview:analysis and visualization of LD and haplotype maps. Bioinfor-matics 21: 263–265.
Cardon, L. R., and G. R. Abecasis, 2003 Using haplotype blocks tomap human complex trait loci. Trends Genet. 19: 135–140.
Cohen, M., M. Reichenstein, A. Everts-van der Wind, J. Heon-Lee, M. Shani et al., 2004 Cloning and characterization ofFAM13A1—a gene near a milk protein QTL on BTA6: evidencefor population-wide linkage disequilibrium in Israeli Holsteins.Genomics 84: 374–383.
Craig, D. W., and D. A. Stephan, 2005 Applications of whole-genome high-density SNP genotyping. Expert Rev. Mol. Diagn.5: 159–170.
Daly, M. J., J. D. Rioux, S. F. Schaffner, T. J. Hudson and E. S.Lander, 2001 High-resolution haplotype structure in the hu-man genome. Nat. Genet. 29: 229–232.
Dawson, E., G. R. Abecasis, S. Bumpstead, Y. Chen, S. Hunt et al.,2002 A first-generation linkage disequilibrium map of humanchromosome 22. Nature 418: 544–548.
de Bakker, P. I., R. Yelensky, I. Pe’er, S. B. Gabriel, M. J. Daly et al.,2005 Efficiency and power in genetic association studies. Nat.Genet. 37: 1217–1223.
DeLaVega, F.M.,H. Isaac,A.Collins, C.R.Scafe, B.V.Halldorsson
et al., 2005 The linkage disequilibrium maps of three hu-man chromosomes across four populations reflect their demogra-phic history and a common underlying recombination pattern.Genome Res. 15: 454–462.
Farnir, F., W. Coppieters, J. J. Arranz, P. Berzi, N. Cambisano et al.,2000 Extensive genome-wide linkage disequilibrium in cattle.Genome Res. 10: 220–227.
Gabriel, S. B., S. F. Schaffner, H. Nguyen, J. M. Moore, J. Roy et al.,2002 The structure of haplotype blocks in the human genome.Science 296: 2225–2229.
Grosse, W. M., S. M. Kappes, W. W. Laegreid, J. W. Keele, C. G.Chitko-McKown et al., 1999 Single nucleotide polymorphism(SNP) discovery and linkage mapping of bovine cytokine genes.Mamm. Genome 10: 1062–1069.
Gunderson, K. L., F. J. Steemers, G. Lee, L. G. Mendoza and M. S.Chee, 2005 A genome-wide scalable SNP genotyping assay us-ing microarray technology. Nat. Genet. 37: 549–554.
Hardenbol, P., J. Baner, M. Jain, M. Nilsson, E. A. Namsaraev et al.,2003 Multiplexed genotyping with sequence-tagged molecularinversion probes. Nat. Biotechnol. 21: 673–678.
Hardenbol, P., F. Yu, J. Belmont, J. Mackenzie, C. Bruckner et al.,2005 Highly multiplexed molecular inversion probe genotyp-ing: over 10,000 targeted SNPs genotyped in a single tube assay.Genome Res. 15: 269–275.
Hawken, R. J., W. C. Barris, S. M. McWilliam and B. P. Dalrymple,2004 An interactive bovine in silico SNP database (IBISS).Mamm. Genome 15: 819–827.
Hawken, R. J., J. A. Cavanagh, J. R. Meadows, M. S. Khatkar, Y.Husaini et al., 2006 Technical note: whole-genome amplifica-tion of DNA extracted from cattle semen samples. J. Dairy Sci. 89:2217–2221.
Heaton, M. P., W. W. Laegreid, C. W. Beattie, T. P. Smith and S. M.Kappes, 1999 Identification and genetic mapping of bovinechemokine genes expressed in epithelial cells. Mamm. Genome10: 128–133.
Hedrick, P. W., 1987 Gametic disequilibrium measures: proceedwith caution. Genetics 117: 331–341.
Heyen, D. W., J. E. Beever, Y. Da, R. E. Evert, C. Green et al.,1997 Exclusion probabilities of 22 bovine microsatellite mark-ers in fluorescent multiplexes for semiautomated parentage test-ing. Anim. Genet. 28: 21–27.
Hinds, D. A., L. L. Stuve, G. B. Nilsen, E. Halperin, E. Eskin et al.,2005 Whole-genome patterns of common DNA variation inthree human populations. Science 307: 1072–1079.
Hirschhorn, J. N., and M. J. Daly, 2005 Genome-wide associationstudies for common diseases and complex traits. Nat. Rev. Genet.6: 95–108.
International HapMap Consortium, 2005 A haplotype map ofthe human genome. Nature 437: 1299–1320.
Jorgenson, E., and J. S. Witte, 2006 A gene-centric approach togenome-wide association studies. Nat. Rev. Genet. 7: 885–891.
Ke, X., S. Hunt, W. Tapper, R. Lawrence, G. Stavrides et al.,2004 The impact of SNP density on fine-scale patterns of link-age disequilibrium. Hum. Mol. Genet. 13: 577–588.
Kent, W. J., 2002 BLAT—the BLAST-like alignment tool. GenomeRes. 12: 656–664.
Khatkar, M. S., P. C. Thomson, I. Tammen and H. W. Raadsma,2004 Quantitative trait loci mapping in dairy cattle: reviewand meta-analysis. Genet. Sel. Evol. 36: 163–190.
Khatkar, M. S., A. Collins, J. A. Cavanagh, R. J. Hawken,M. Hobbs et al., 2006a A first-generation metric linkage disequi-librium map of bovine chromosome 6. Genetics 174: 79–85.
Khatkar, M. S., P. C. Thomson, I. Tammen, J. A. Cavanagh, F. W.Nicholas et al., 2006b Linkage disequilibrium on chromosome6 in Australian Holstein-Friesian cattle. Genet. Sel. Evol. 38: 463–477.
Lindblad-Toh, K., C. M. Wade, T. S. Mikkelsen, E. K. Karlsson,D. B. Jaffe et al., 2005 Genome sequence, comparative anal-ysis and haplotype structure of the domestic dog. Nature 438:803–819.
McRae, A. F., J. C. McEwan, K. G. Dodds, T. Wilson, A. M.Crawford et al., 2002 Linkage disequilibrium in domesticsheep. Genetics 160: 1113–1122.
Nei, M., 1987 Molecular Evolutionary Genetics. Columbia UniversityPress, New York.
Nsengimana, J., P. Baret, C. S. Haley and P. M. Visscher,2004 Linkage disequilibrium in the domesticated pig. Genetics166: 1395–1404.
Odani, M., A. Narita, T. Watanabe, K. Yokouchi, Y. Sugimoto et al.,2006 Genome-wide linkage disequilibrium in two Japanese beefcattle breeds. Anim. Genet. 37: 139–144.
Olsen, H. G., D. I. Vage, S. Lien and H. Klungland, 2000 A DNApolymorphism in the bovine c-kit gene. Anim. Genet. 31: 71.
Olsen, H. G., S. Lien, M. Gautier, H. Nilsen, A. Roseth et al.,2005 Mapping of a milk production quantitative trait locus toa 420-kb region on bovine chromosome 6. Genetics 169: 275–283.
Pe’er, I., Y. R. Chretien, P. I. de Bakker, J. C. Barrett, M. J. Daly
et al., 2006 Biases and reconciliation in estimates of linkage dis-equilibrium in the human genome. Am. J. Hum. Genet. 78: 588–603.
Phillips, M. S., R. Lawrence, R. Sachidanandam, A. P. Morris, D. J.Balding et al., 2003 Chromosome-wide distribution of haplo-type blocks and the role of recombination hot spots. Nat. Genet.33: 382–387.
Prinzenberg, E. M., I. Krause and G. Erhardt, 1999 SSCP analysisat the bovine CSN3 locus discriminates six alleles correspondingto known protein variants (A, B, C, E, F, G) and three new DNApolymorphisms (H, I, A1). Anim. Biotechnol. 10: 49–62.
Qin, Z. S., T. Niu and J. S. Liu, 2002 Partition-ligation-expectation-maximization algorithm for haplotype inference with single-nucleotide polymorphisms. Am. J. Hum. Genet. 71: 1242–1247.
Service, S., J. Deyoung, M. Karayiorgou, J. L. Roos, H. Pretorious
et al., 2006 Magnitude and distribution of linkage disequilibriumin population isolates and implications for genome-wide associa-tion studies. Nat. Genet. 38: 556–560.
Taniguchi, H., C. E. Lowe, J. D. Cooper, D. J. Smyth, R. Bailey et al.,2006 Discovery, linkage disequilibrium and association analysesof polymorphisms of the immune complement inhibitor, decay-accelerating factor gene (DAF/CD55) in type 1 diabetes. BMCGenet. 7: 22.
Tapper, W., A. Collins, J. Gibson, N. Maniatis, S. Ennis et al.,2005 A map of the human genome in linkage disequilibriumunits. Proc. Natl. Acad. Sci. USA 102: 11835–11839.
Tenesa, A., S. A. Knott, D. Ward, D. Smith, J. L. Williams et al.,2003 Estimation of linkage disequilibrium in a sample of the
Haplotype Blocks in the Bovine Genome 771
United Kingdom dairy cattle population using unphased geno-types. J. Anim. Sci. 81: 617–623.
Tozaki, T., K. I. Hirota, T. Hasegawa, M. Tomitaand M. Kurosawa,2005 Prospects for whole genome linkage disequilibrium map-ping in thoroughbreds. Gene 346: 127–132.
Twells, R. C., C. A. Mein, M. S. Phillips, J. F. Hess, R. Veijola
et al., 2003 Haplotype structure, LD blocks, and uneven re-combination within the LRP5 gene. Genome Res. 13: 845–855.
Vallejo, R. L., Y. L. Li, G. W. Rogers and M. S. Ashwell, 2003 Ge-netic diversity and background linkage disequilibrium in theNorth American Holstein cattle population. J. Dairy Sci. 86: 4137–4147.
Wall, J. D., and J. K. Pritchard, 2003a Assessing the performanceof the haplotype block model of linkage disequilibrium. Am. J.Hum. Genet. 73: 502–515.
Wall, J. D., and J. K. Pritchard, 2003b Haplotype blocks and linkagedisequilibrium in the human genome. Nat. Rev. Genet. 4: 587–597.
Zhang, K., and L. Jin, 2003 HaploBlockFinder: haplotype blockanalyses. Bioinformatics 19: 1300–1301.
Zhang, K., Z. Qin, T. Chen, J. S. Liu, M. S. Waterman et al.,2005 HapBlock: haplotype block partitioning and tag SNP se-lection software using a set of dynamic programming algorithms.Bioinformatics 21: 131–134.
Communicating editor: C. Haley
772 M. S. Khatkar et al.