Genetic dissimilarity, genetic diversity, and mate preferences in humans
Upload
independentCategory
view
0download
0
(2007) 120–131www.elsevier.com/locate/livsci
Livestock Science 106
Genetic evaluation of length of productive life in the SpanishHolstein-Friesian population. Model validation
and genetic parameters estimation
Zuleima Chirinos a,⁎, María Jesús Carabaño b, Delfino Hernández c
a Departamento de Zootecnia, Facultad de Agronomía, Universidad del Zulia, Maracaibo,Av. Guajira, Núcleo Agropecuario, Zulia 4005, Venezuela
b Departamento de Mejora Genética Animal, INIA Ctra. de La Coruña Km. 7, 28040, Madrid, Spainc Departamento Técnico, CONAFE, Apdo. 31, 28340 Valdemoro, Madrid, Spain
Received 14 April 2006; received in revised form 9 July 2006; accepted 11 July 2006
Abstract
Functional longevity (FL), measured as length of productive life (LPL) adjusted by production level, has been regarded as animportant trait to measure the global functional aptitude of a cow, particularly when direct measures of the functional traits (healthand reproductive performance) are not available. The objective of this study was to analyze the trait FL making use of survivalanalysis techniques in order to propose a model for the genetic evaluation of this trait in the Spanish Holstein Friesian population.The data set consisted of 133,629 registered cows of three regions; Andalusia, Basque Country and Catalonia. The hazard functionwas described as the product of a baseline hazard function and the time-independent effects of age at first calving, lactationnumber-stage of lactation, annual change in herd size, milk, fat and protein yield. Sire and maternal grandsire and herd-year-seasonof calving were considered as random effects. Percentage of right-censored data ranged from 41.9% to 52.7% for the analysed datasets. All the effects analyzed were significant (Pb0.0001) and had a great influence on the risk of culling of a cow, except for theage at first calving which showed a relatively small effect. Higher risk for factors such as age at first calving, change in herd sizeand relative level of milk production was associated with the more extreme classes. The consistency of the results among regionalsamples which represent diverse production systems in the population indicated that the proposed model could be applied at thenational level. The relatively low heritability (0.048 to 0.074) suggests that genetic improvement of LPL could be effective if thedirect evaluation is combined with indirect measures of LPL.© 2006 Elsevier B.V. All rights reserved.
Keywords: Genetic evaluation; Length of productive life; Dairy cattle; Survival analysis
1. Introduction
Functional longevity (FL), measured as length ofproductive life (LPL) adjusted by production level, has
⁎ Corresponding author. Tel./fax: +58 261 7596191.E-mail address: [email protected] (Z. Chirinos).
1871-1413/$ - see front matter © 2006 Elsevier B.V. All rights reserved.doi:10.1016/j.livsci.2006.07.006
been regarded as an important trait to measure the globalfunctional aptitude of a cow, particularly when directmeasures of the functional traits (health and reproduc-tive performance) are not available. Conformation traitsand somatic cell count are the only non production traitsrecorded at a national level in the Spanish recordingsystem for the Holstein-Friesian population, making the

121Z. Chirinos et al. / Livestock Science 106 (2007) 120–131
genetic evaluation of FL relevant for this population inorder to improve functional characteristics.
Several procedures have been proposed for geneticevaluation of FL in dairy populations. These are the useof stayability measures (Everett et al., 1976), survivalscores (Madgwick and Goddard, 1989), phenotypicextension of incomplete data (Van Raden and Klaaskate,1993; Brotherstone et al., 1997) and the use of survivalanalysis techniques (Famula, 1981; Ducrocq et al.,1988a,b). Discussions about the alternative methods canbe found in revision articles (Essl, 1998; Strandberg andSölkner, 1996). From all the methods proposed, the useof survival analysis techniques is widely accepted as themethod of choice to analyse longevity in dairy cattle. Theimplementation of survival analysis techniques in thecomputer program Survival kit (Ducrocq and Sölkner,1998; Sölkner andDucrocq, 1999) has made possible thelarge scale application of these techniques to the geneticevaluation of several populations of dairy cattle (e.g.,Schneider and Miglior, 1999; Vollema et al., 2000;Vukasinovic et al., 2001; Fuerst and Egger-Danner,2002; Ducrocq, 2005). The risk factors commonlyconsidered in these evaluations as environmental factorsare the herd in which the animal produces, with changesalong consecutive years and seasons, the age at firstcalving, the lactation number and stage of lactation, theherd size changes along years and the production level(measured in different manners). AWeibull proportionalhazards model is used in all cases, but few studies(Ducrocq et al., 1988a) have dealt with the verification ofthis basic assumption. Sire and maternal grandsireeffects are commonly included as random genetic factorsunder the assumption of homogeneity of variance.However, Caraviello et al. (2004) found differences inthe variances and associated heritabilities for FL acrossregions in the United States using survival analysis.
In this work, the objective was to study the trait FLmaking use of survival analysis techniques in order topropose a model for the genetic evaluation of this trait inthe Spanish Holstein Friesian population. Emphasis is puton the assumptions about the baseline distribution andabout the parameters for different production subsystems.The use of several procedures to estimate the heritabilityof FL in this population is also undertaken.
2. Materials and methods
The data files for this study were obtained from theofficial milk recording scheme, and from the SpanishFriesian herd book, both provided by the breed asso-ciation (CONAFE). The longevity measure, LPL, wasobtained from the milk recording data by computing the
number of days between the date of first calving and thedate of last recording. Dates of last recording instead ofculling dates were used because the dates of culling in themilk recording system were not fully reliable. The cowwas considered as culled (complete record) if the numberof days between the last day of recording for that cow andthe last day of recording in the herd exceeded 210 days.Otherwise, the record was considered as censored. LPLfor cows changing herds was the time between the firstcalving and the last recording date in the first herd and therecord was coded as censored.
Data from three different regions, Andalusia, BasqueCountry and Catalonia, representing different systems ofproduction, were extracted and analysed separately toinvestigate possible differences in longevity modelling.Each data set was edited to discard records from animalswith missing calving dates, age at first calving outsidethe interval [540, 1220 days], with calving intervals lessthan 305 days, without production records or productionout of the intervals [3000, 20,000 kg] for milk yield,[1.5, 9.0%] for fat percentage, and, [1.0, 7.0%] forprotein percentage, according to CONAFE's rules forediting data for genetic evaluations for production.Additionally, data were required to come from herdswith at least three years of data recorded, containinginformation of at least 20 animals. The resulting datasets (LPL1) were used to assess the significance of theenvironmental factors in each region. Then, an addi-tional requirement of sires having at least 10 daughtersin three or more herds was imposed to obtain a secondset of files (LPL2), which were used to fit a morecomplete model including genetic effects. All analyseswere carried out with the computer software “SurvivalKit” V. 3.12 (Ducrocq and Sölkner, 1998; Sölkner andDucrocq, 1999).
Table 1 presents a summary of statistics describing thedata sets LPL1 and LPL2 for the three regions understudy. Average LPL for animals with complete dataranged from 828 in Andalusia to 1059 days in the Basquecountry, corresponding to 2.0 and 2.5 lactations, respec-tively. Percentage of censored data was minimum in theBasque country LPL1 subset, 41.9% andmaximum in theAndalusia LPL2 subset, 52.7%.
2.1. Analysis of baseline hazard and environmentalfactors by region
A non parametric Kaplan–Meier (KM) estimator (see,e.g. Klein and Moeschberger, 1997) of the survivorfunction (S(t)) for each region was firstly obtained toinvestigate possible regional differences for the baselineculling process. The hypothesis of a Weibull distribution
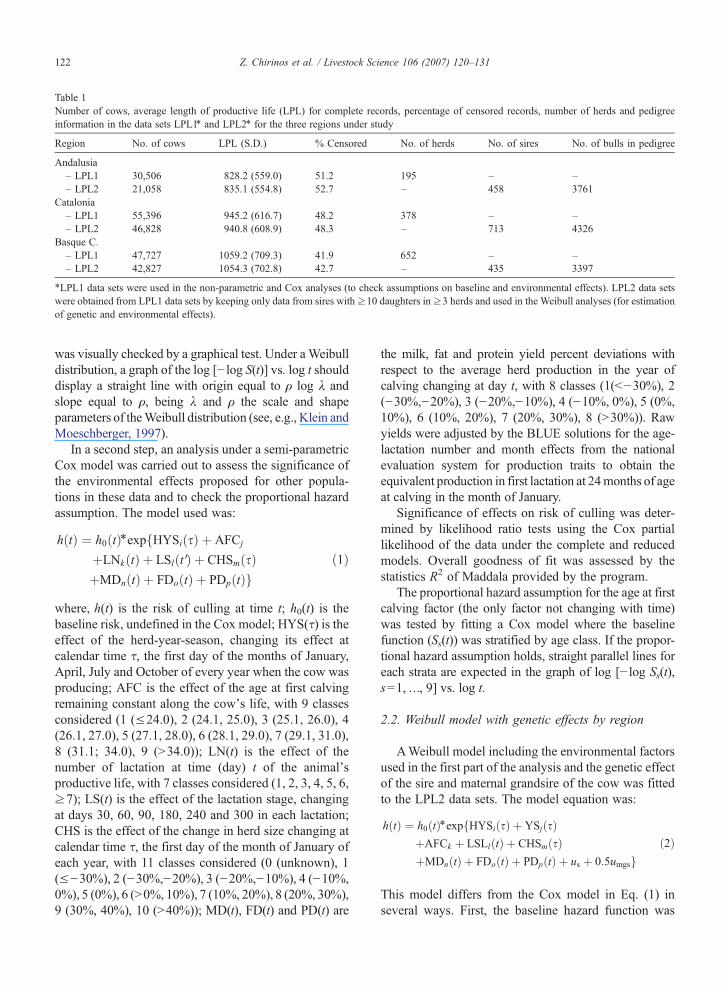
Table 1Number of cows, average length of productive life (LPL) for complete records, percentage of censored records, number of herds and pedigreeinformation in the data sets LPL1⁎ and LPL2⁎ for the three regions under study
Region No. of cows LPL (S.D.) % Censored No. of herds No. of sires No. of bulls in pedigree
Andalusia– LPL1 30,506 828.2 (559.0) 51.2 195 – –– LPL2 21,058 835.1 (554.8) 52.7 – 458 3761
Catalonia– LPL1 55,396 945.2 (616.7) 48.2 378 – –– LPL2 46,828 940.8 (608.9) 48.3 – 713 4326
Basque C.– LPL1 47,727 1059.2 (709.3) 41.9 652 – –– LPL2 42,827 1054.3 (702.8) 42.7 – 435 3397
⁎LPL1 data sets were used in the non-parametric and Cox analyses (to check assumptions on baseline and environmental effects). LPL2 data setswere obtained from LPL1 data sets by keeping only data from sires with≥10 daughters in≥3 herds and used in the Weibull analyses (for estimationof genetic and environmental effects).
122 Z. Chirinos et al. / Livestock Science 106 (2007) 120–131
was visually checked by a graphical test. Under aWeibulldistribution, a graph of the log [− log S(t)] vs. log t shoulddisplay a straight line with origin equal to ρ log λ andslope equal to ρ, being λ and ρ the scale and shapeparameters of theWeibull distribution (see, e.g., Klein andMoeschberger, 1997).
In a second step, an analysis under a semi-parametricCox model was carried out to assess the significance ofthe environmental effects proposed for other popula-tions in these data and to check the proportional hazardassumption. The model used was:
hðtÞ ¼ h0ðtÞ⁎expfHYSiðsÞ þ AFCj
þLNkðtÞ þ LSlðt VÞ þ CHSmðsÞþMDnðtÞ þ FDoðtÞ þ PDpðtÞg
ð1Þ
where, h(t) is the risk of culling at time t; h0(t) is thebaseline risk, undefined in the Cox model; HYS(τ) is theeffect of the herd-year-season, changing its effect atcalendar time τ, the first day of the months of January,April, July and October of every year when the cow wasproducing; AFC is the effect of the age at first calvingremaining constant along the cow's life, with 9 classesconsidered (1 (≤24.0), 2 (24.1, 25.0), 3 (25.1, 26.0), 4(26.1, 27.0), 5 (27.1, 28.0), 6 (28.1, 29.0), 7 (29.1, 31.0),8 (31.1; 34.0), 9 (N34.0)); LN(t) is the effect of thenumber of lactation at time (day) t of the animal'sproductive life, with 7 classes considered (1, 2, 3, 4, 5, 6,≥7); LS(t) is the effect of the lactation stage, changingat days 30, 60, 90, 180, 240 and 300 in each lactation;CHS is the effect of the change in herd size changing atcalendar time τ, the first day of the month of January ofeach year, with 11 classes considered (0 (unknown), 1(≤−30%), 2 (−30%,−20%), 3 (−20%,−10%), 4 (−10%,0%), 5 (0%), 6 (N0%, 10%), 7 (10%, 20%), 8 (20%, 30%),9 (30%, 40%), 10 (N40%)); MD(t), FD(t) and PD(t) are
the milk, fat and protein yield percent deviations withrespect to the average herd production in the year ofcalving changing at day t, with 8 classes (1(b−30%), 2(−30%,−20%), 3 (−20%,−10%), 4 (−10%, 0%), 5 (0%,10%), 6 (10%, 20%), 7 (20%, 30%), 8 (N30%)). Rawyields were adjusted by the BLUE solutions for the age-lactation number and month effects from the nationalevaluation system for production traits to obtain theequivalent production in first lactation at 24months of ageat calving in the month of January.
Significance of effects on risk of culling was deter-mined by likelihood ratio tests using the Cox partiallikelihood of the data under the complete and reducedmodels. Overall goodness of fit was assessed by thestatistics R2 of Maddala provided by the program.
The proportional hazard assumption for the age at firstcalving factor (the only factor not changing with time)was tested by fitting a Cox model where the baselinefunction (Ss(t)) was stratified by age class. If the propor-tional hazard assumption holds, straight parallel lines foreach strata are expected in the graph of log [− log Ss(t),s=1, …, 9] vs. log t.
2.2. Weibull model with genetic effects by region
AWeibull model including the environmental factorsused in the first part of the analysis and the genetic effectof the sire and maternal grandsire of the cow was fittedto the LPL2 data sets. The model equation was:
hðtÞ ¼ h0ðtÞ⁎expfHYSiðsÞ þ YSjðsÞþAFCk þ LSLlðtÞ þ CHSmðsÞþMDnðtÞ þ FDoðtÞ þ PDpðtÞ þ us þ 0:5umgsg
ð2Þ
This model differs from the Cox model in Eq. (1) inseveral ways. First, the baseline hazard function was
123Z. Chirinos et al. / Livestock Science 106 (2007) 120–131
now the Weibull hazard, h0(t)=λρ(λt)ρ−1. Secondly, for
the environmental effects, the HYS factor was consid-ered as a random effect, following a log Gamma (γ)distribution, and, a systematic year-season, YS, and, theinteraction LSL between the number and stage oflactation were additionally fitted. Thirdly, the geneticeffects of the sire, us, and the maternal grandsire, umgs,were added in order to obtain genetic parameters.
Heritability was estimated in several ways. An estimatein the log–linear scalewas obtained in first place followingthe procedure proposed inDucrocq andCassella (1996) as,
h2logT ¼ 4r2strigammaðgÞ þ 5
4 r2s þ p2
6
� �
The heritability in the log–linear scale lacks a bio-logical interpretation and it has been found to be weaklyrelated with the reliability of genetic evaluations (Duc-rocq et al., 1988b; Ducrocq and Cassella, 1996; Duc-rocq, 1999).
The procedure developed by Ducrocq (1999) toestimate the heritability on the original scale was thenused, applying the formula,
h2o ¼h2logT
expfnu=qg½ �2
where, nu=E[HYS+us+0.5umgs+w], with E[HYS]=digamma(γ)− ln(γ).
Ducrocq (1999) mentions that this formula providesgood results for the reliability of genetic evaluationsonly when ρ is close to two. However, large biases arefound when ρ is less than ± or close to one.
Yazdi et al. (2002) argued that the fact that ho2 de-
pends only on one of the two parameters of the Weibullfunction implies that, due to the relatively strong nega-tive correlation between the two Weibull parameters,different combinations of these parameters may lead to asimilar fit of the data but provide different heritabilityvalues. These authors developed an alternative expres-sion for the heritability in the original scale which doesnot depend on the Weibull parameters. They named theheritability estimate as effective heritability. The origi-nal expression developed by Yazdi et al. (2002) under asimple Weibull model including a general mean and asire genetic effect was calculated as,
h2ef l ¼4r2s
ðr2s þ 1Þ
The extension of this expression to more complexmodels, such as the ones used in this study, which includeother random factors such as the HYS and the genetic
maternal grandsire effects, is not obvious. Büenger et al.(2001), Roxström et al. (2003), and Ducrocq (2005) haveused the following formula,
h2ef2 ¼4r2s
ðr2s þ varðHYSÞ þ 1Þ¼ 4r2s
ðr2s þ trigammaðgÞ þ 1Þwhich was also applied in this study.
3. Results and discussion
3.1. Analysis of baseline survival and environmentalfactors
Fig. 1 shows the estimated hazard at day t for theBasque country data. The estimated hazard was obtainedfrom the KM estimates of the cumulative hazard providedby the Survival kit. Similar patterns were observed for theother two regions under study (not shown). Risk of cullingwas null for, approximately, the first 65 days. This wasimposed by the data editing, given that animals wererequired to have milk production information in order toobtain a measure of functional longevity and thisinformation is only available when cows have at leastthe first two test day records. After this period, risk ofbeing culled was low up to day 200, increasing afterwardsuntil the end of the milking period (day 300, approxi-mately). Risk decreases again to nearly null values duringthe first period of what should be the beginning of thesecond lactation, to repeat a similar but less clear patternthan the one observed for the first lactation. An increase inrisk along the productive life is then observed, with a largedispersion of the hazard estimates after day 1500,approximately. A sharp increase in risk was found ataround day 450 in this data set (day 450 and 400 in theAndalusia and Catalonia data, respectively). Due to thefact that test day information is only registered up to the14th test in this population, a proportion of the data istruncated at around 420 days but coded as completeinformation if no more data are available for the cow andthe herd has continued under milk recording. Theproportion of animals in this situation is, nevertheless,low (1.7, 1.5 and 1.1% in the Andalusia, Catalonia andBasqueCountry data sets, respectively). Additionally, dueto the fact that culling dates are not reliable and LPL iscalculated from the date of last recording, all cullingsoccurring during the dry period and previous to the firsttest date of the following lactation have a longevity datacorresponding to the date of the last test day recorded.This is expected to result in an overestimation of the risk

Fig. 1. Kaplan–Meier (scattered plot) and Weibull (continuous line) estimate of the hazard function (h(t)) for the Basque country data set.
124 Z. Chirinos et al. / Livestock Science 106 (2007) 120–131
of culling at the end of the lactation and an underestima-tion during the dry period and at the beginning of the nextlactation.
Fig. 2. Estimates of the survivor function (S(t)) for Andalusia and Basque counobtained from the KM analysis (Weibull-KM) and Weibull survivor function
Kaplan Meier estimates of the survivor function forthe Andalusia and Basque country data sets arepresented in Fig. 2. The Catalonia data set provided a
try by Kaplan–Meier (KM), Weibull survivor function with parameterswith parameters obtained from the Weibull analysis (Weibull-Wei).

Table 2Test statistics for the likelihood ratio test (−2ΔLL) for each environmentalfactors added sequentially in the model, degrees of freedom (D.F.) andMaddala's R2 statistics for the Basque country data set
Factora −2ΔLL D.F. Maddala's R2
HYS 34,768.0 12,505 0.52AFC 928.2 8 0.53LN 4844.0 6 0.57SL 8196.2 6 0.64CHS 309.0 10 0.64MD 6677.8 7 0.69FD 235.7 7 0.69PD 146.2 7 0.69
aHYS=Herd-year-season of calving; AFC=Age at first calving;LN=Lactation number; SL=Stage of lactation; CHS=Change inherd size; MD/FD/PD=milk/fat/protein deviation from herd average.
125Z. Chirinos et al. / Livestock Science 106 (2007) 120–131
similar pattern and intermediate values (not shown). Therate of decay of the survival probability along timeshowed deviations from an expected smooth decayunder parametric models (e.g. Weibull model) duringthe first part of the productive life, as expected from theestimated hazard pattern shown in Fig. 1.
Using the KM estimate of the survivor function, plotsof log (− log S(t)) vs. log t were drawn and linear trendsadjusted for each data set to check theWeibull distributionassumption. Results are presented in Fig. 3. Deviationsfrom the expected linear trend are observed at thebeginning of the first lactation (for the first 65 dayswhen cullings are not considered), and, for the period oftime around the end of the first and beginning of thesecond lactation (around day 420 due to data truncation atthe 14th test day). Very similar curves were obtained forthe three data sets. The values of the slope and interceptof the adjusted linear trends were used as raw estimatesof the Weibull parameters. The corresponding hazard andsurvivor functions obtained can be seen in Figs. 1 and 2,respectively. A reasonable agreement between the KaplanMeier estimates and the Weibull functions was observed,except for a period around 420 days. Also, the similarvalues of the Weibull parameters and patterns of thesurvivor and hazard functions obtained for the three datasets might indicate that a common baseline function forthe three data sets might be a reasonable assumption.
Fig. 3. Plots of log (− log S(t)) vs. log t and adjusted linear trends for the threemethod.
Few studies providing non parametric estimates ofthe baseline survivor or hazard functions for dairy cattlepopulations have been found. Ducrocq (1987) founda similar deviation in the survivor function aroundday 305 due to truncation of data at that point for oldrecords. Vukasinovic et al. (1997) found as similar pat-tern for the hazard function in the Swiss Brown cattle,except for the sharp spike at around day 420 found inthis study. No truncation of data was reported in thatstudy.
data sets for the survivor function S(t) estimated by the Kaplan–Meier

126 Z. Chirinos et al. / Livestock Science 106 (2007) 120–131
Results from the analysis of the Cox model in Eq. (1)indicated that all effects showed a significant contribu-tion (Pb0.0001) to the risk of culling, according to thelikelihood ratio test. The factor showing the largestcontribution to the likelihood was the HYS effect, follo-wed by the stage of lactation effect and the relative milkproduction level. Fat and protein yields showed a lowercontribution than milk yield, indicating that culling forcontents is less important than culling for total milkyield in this population. Change in herd size also had arelatively small contribution to the data likelihood,which might be explained by the fact that including atime dependent HYS effect may be capturing the effecton culling of eventual changes of herd size along time.The Maddala's R2 statistics for the full model rangedfrom 0.56 for Catalonia and Andalusia to 0.69 for theBasque country data. Results for the Basque countrydata set are shown in Table 2.
A plot of the log [− log Ss(t), s=1,9] vs. log t, where Ss(t) was estimated from the Cox model in Eq. (1) assumingbaseline hazards stratified by age at calving is presented inFig. 4 for the Andalusia data set. Results were very similarfor the other two regions. The plot shows that the pro-portional hazard model seems a reasonable assumption forAFC given that parallel lines are obtained for the linescorresponding to different age classes. Therefore, stratifi-cation for the age at first calving does not seem necessary.
Fig. 4. Plot of the log [− log Ss(t), s=1,9] vs. log t, where Ss(t) was estimatecalving for the Andalusia data set.
3.2. Analysis under Weibull model
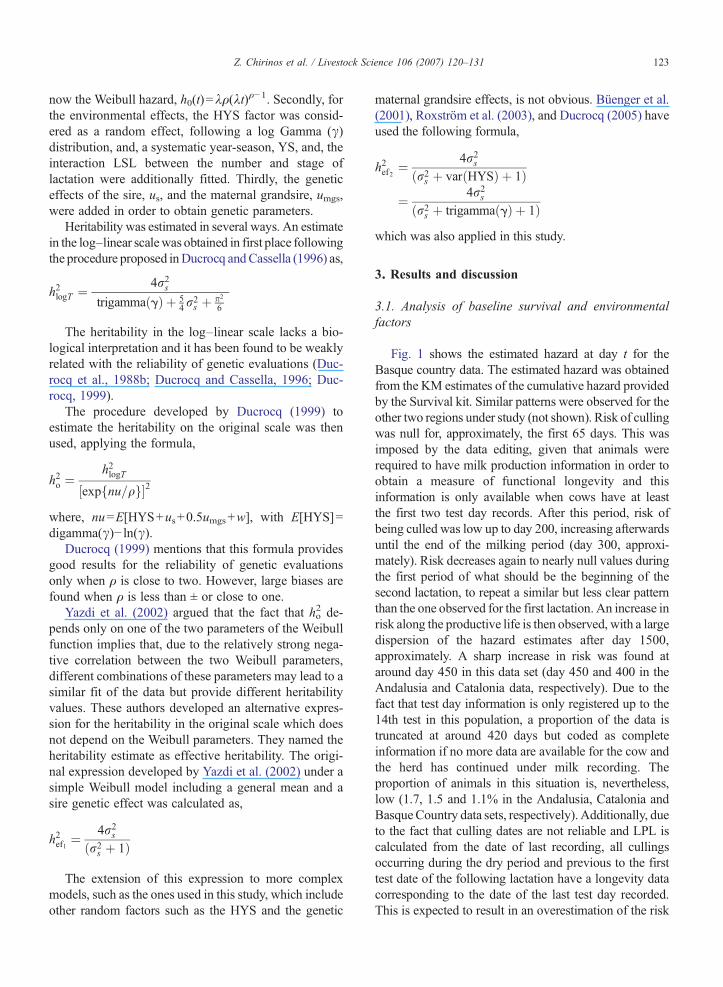
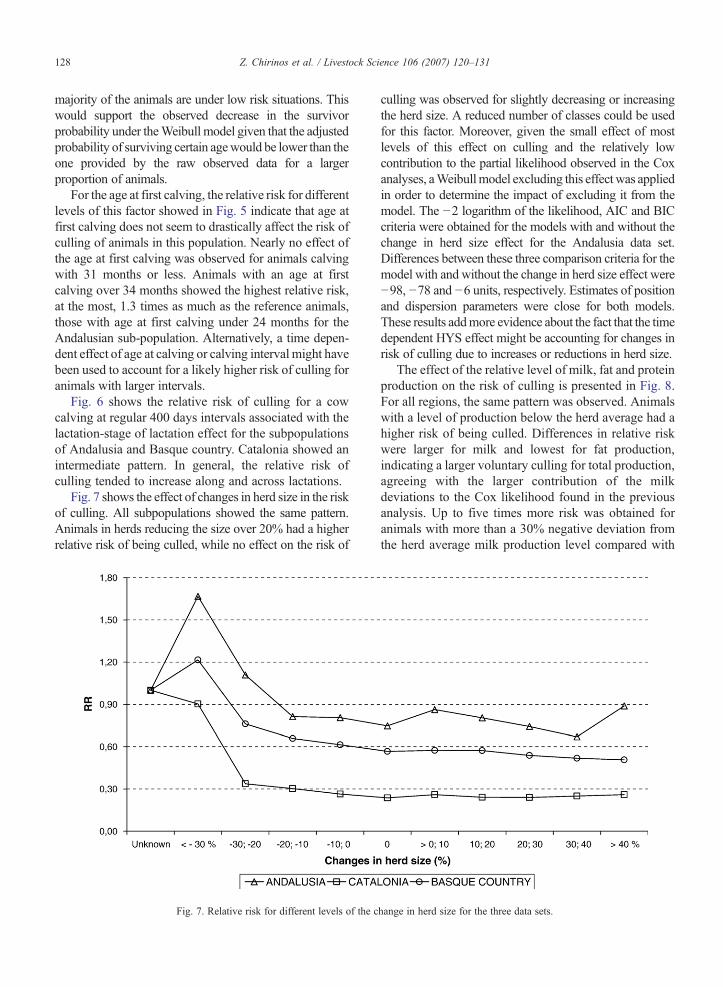
The estimates of the Weibull parameters, ρ / intercept (ρlog λ) obtained for the Andalusia, Basque country andCatalonia data sets under model (2) were 2.06/−13.43,2.28/−15.24 and 1.69/−11.27, respectively. Both Weibullparameters were larger in absolute terms than the rawestimates obtained from the KM estimator of the survivorfunction (shown in Fig. 3). The Weibull survivor functionsobtained from model (2) have been plotted in Fig. 2 alongwith the estimates of the non-parametric KM method andthe Weibull functions resulting from using the raw esti-mates of the parameters obtained from the KM estimator.Estimates obtained from the parametric Weibull modelshowed a faster decay in survivor probability than the esti-mates obtained from the non-parametric model. Departuresfrom the expected Weibull pattern observed at the begin-ning of the productive life and adjustment by environmen-tal and genetic factors might be causing the discrepancybetween the two estimators. The observed decrease in thesurvivor probability under the Weibull model with respectto the raw KM estimate would be expected if a larger pro-portion of the animals were under lower risk classes than inhigher risk classes for the stress factors considered in theWeibull model. Estimates of the relative risk associatedwith the factors included in model (2) are presented in Figs.5, 6, 7, and 8. Solutions for the three regions have been
d from the Cox model assuming baseline hazards stratified by age at
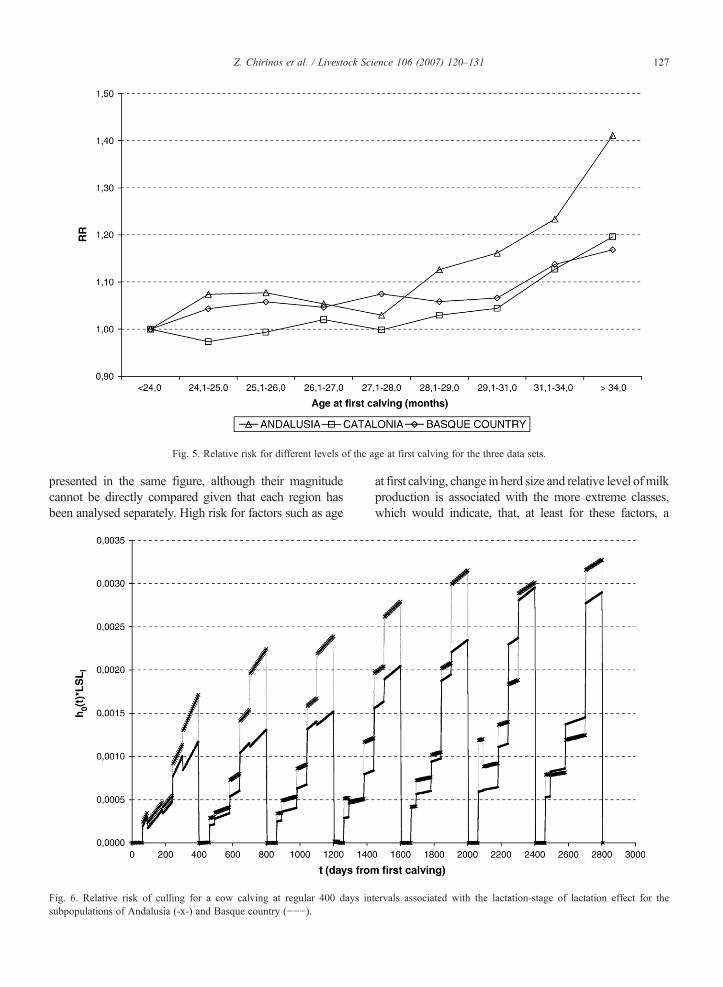
Fig. 5. Relative risk for different levels of the age at first calving for the three data sets.
127Z. Chirinos et al. / Livestock Science 106 (2007) 120–131
presented in the same figure, although their magnitudecannot be directly compared given that each region hasbeen analysed separately. High risk for factors such as age
Fig. 6. Relative risk of culling for a cow calving at regular 400 days insubpopulations of Andalusia (-x-) and Basque country ().
at first calving, change in herd size and relative level ofmilkproduction is associated with the more extreme classes,which would indicate, that, at least for these factors, a
tervals associated with the lactation-stage of lactation effect for the
128 Z. Chirinos et al. / Livestock Science 106 (2007) 120–131
majority of the animals are under low risk situations. Thiswould support the observed decrease in the survivorprobability under theWeibull model given that the adjustedprobability of surviving certain agewould be lower than theone provided by the raw observed data for a largerproportion of animals.
For the age at first calving, the relative risk for differentlevels of this factor showed in Fig. 5 indicate that age atfirst calving does not seem to drastically affect the risk ofculling of animals in this population. Nearly no effect ofthe age at first calving was observed for animals calvingwith 31 months or less. Animals with an age at firstcalving over 34 months showed the highest relative risk,at the most, 1.3 times as much as the reference animals,those with age at first calving under 24 months for theAndalusian sub-population. Alternatively, a time depen-dent effect of age at calving or calving interval might havebeen used to account for a likely higher risk of culling foranimals with larger intervals.
Fig. 6 shows the relative risk of culling for a cowcalving at regular 400 days intervals associated with thelactation-stage of lactation effect for the subpopulationsof Andalusia and Basque country. Catalonia showed anintermediate pattern. In general, the relative risk ofculling tended to increase along and across lactations.
Fig. 7 shows the effect of changes in herd size in the riskof culling. All subpopulations showed the same pattern.Animals in herds reducing the size over 20% had a higherrelative risk of being culled, while no effect on the risk of
Fig. 7. Relative risk for different levels of the c
culling was observed for slightly decreasing or increasingthe herd size. A reduced number of classes could be usedfor this factor. Moreover, given the small effect of mostlevels of this effect on culling and the relatively lowcontribution to the partial likelihood observed in the Coxanalyses, aWeibullmodel excluding this effect was appliedin order to determine the impact of excluding it from themodel. The −2 logarithm of the likelihood, AIC and BICcriteria were obtained for the models with and without thechange in herd size effect for the Andalusia data set.Differences between these three comparison criteria for themodel with and without the change in herd size effect were−98, −78 and −6 units, respectively. Estimates of positionand dispersion parameters were close for both models.These results addmore evidence about the fact that the timedependent HYS effect might be accounting for changes inrisk of culling due to increases or reductions in herd size.
The effect of the relative level of milk, fat and proteinproduction on the risk of culling is presented in Fig. 8.For all regions, the same pattern was observed. Animalswith a level of production below the herd average had ahigher risk of being culled. Differences in relative riskwere larger for milk and lowest for fat production,indicating a larger voluntary culling for total production,agreeing with the larger contribution of the milkdeviations to the Cox likelihood found in the previousanalysis. Up to five times more risk was obtained foranimals with more than a 30% negative deviation fromthe herd average milk production level compared with
hange in herd size for the three data sets.
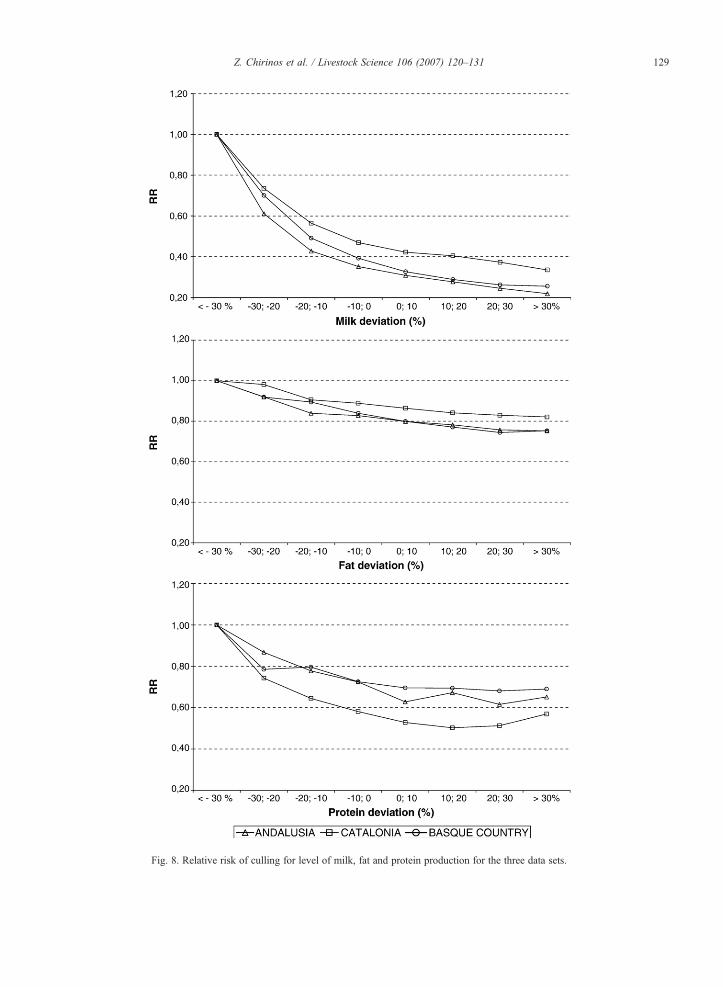
Fig. 8. Relative risk of culling for level of milk, fat and protein production for the three data sets.
129Z. Chirinos et al. / Livestock Science 106 (2007) 120–131
130 Z. Chirinos et al. / Livestock Science 106 (2007) 120–131
animals producing over a 30% more than the average. Anon linear response was observed, with larger differencesin risk when looking at animals producing less than theaverage than the more productive animals.
The results for the relative risk of the factors con-sidered in this study agree with results reported in otherdairy cattle populations (Dürr et al., 1999; Pasman andReinhardt, 1999; Schneider and Miglior, 1999; Vollemaet al., 2000, Vukasinovic et al., 2001).
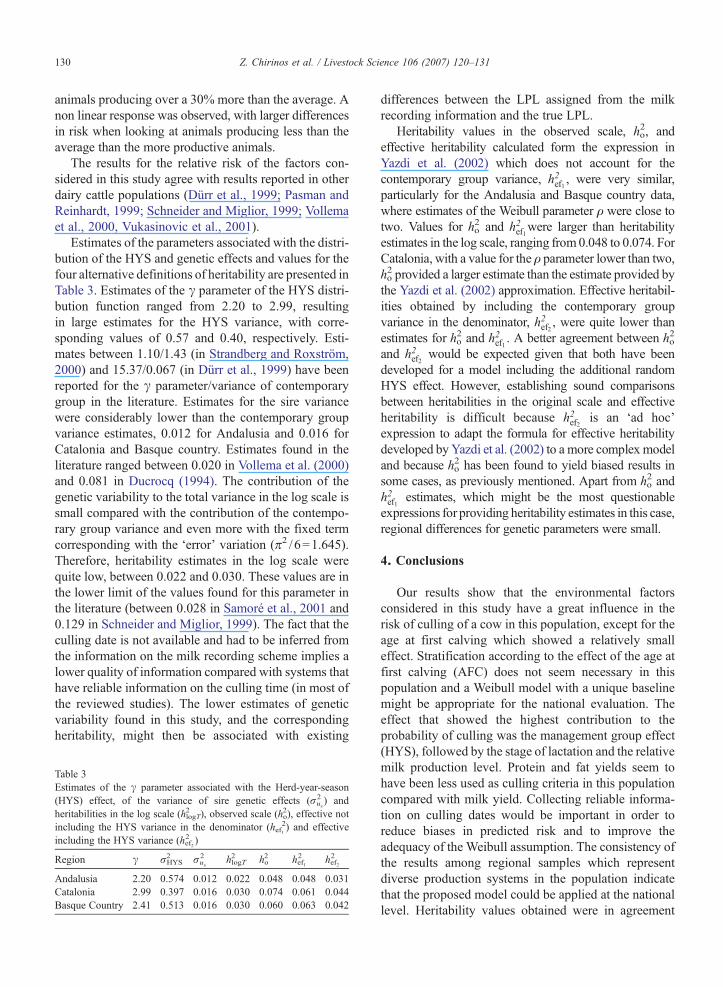
Estimates of the parameters associated with the distri-bution of the HYS and genetic effects and values for thefour alternative definitions of heritability are presented inTable 3. Estimates of the γ parameter of the HYS distri-bution function ranged from 2.20 to 2.99, resultingin large estimates for the HYS variance, with corre-sponding values of 0.57 and 0.40, respectively. Esti-mates between 1.10/1.43 (in Strandberg and Roxström,2000) and 15.37/0.067 (in Dürr et al., 1999) have beenreported for the γ parameter/variance of contemporarygroup in the literature. Estimates for the sire variancewere considerably lower than the contemporary groupvariance estimates, 0.012 for Andalusia and 0.016 forCatalonia and Basque country. Estimates found in theliterature ranged between 0.020 in Vollema et al. (2000)and 0.081 in Ducrocq (1994). The contribution of thegenetic variability to the total variance in the log scale issmall compared with the contribution of the contempo-rary group variance and even more with the fixed termcorresponding with the ‘error’ variation (π2 /6=1.645).Therefore, heritability estimates in the log scale werequite low, between 0.022 and 0.030. These values are inthe lower limit of the values found for this parameter inthe literature (between 0.028 in Samoré et al., 2001 and0.129 in Schneider and Miglior, 1999). The fact that theculling date is not available and had to be inferred fromthe information on the milk recording scheme implies alower quality of information compared with systems thathave reliable information on the culling time (in most ofthe reviewed studies). The lower estimates of geneticvariability found in this study, and the correspondingheritability, might then be associated with existing
Table 3Estimates of the γ parameter associated with the Herd-year-season(HYS) effect, of the variance of sire genetic effects (σus
2 ) andheritabilities in the log scale (hlogT
2 ), observed scale (ho2), effective not
including the HYS variance in the denominator (hef12) and effective
including the HYS variance (hef22 )
Region γ σHYS2 σus
2 hlogT2 ho
2 hef12 hef2
2
Andalusia 2.20 0.574 0.012 0.022 0.048 0.048 0.031Catalonia 2.99 0.397 0.016 0.030 0.074 0.061 0.044Basque Country 2.41 0.513 0.016 0.030 0.060 0.063 0.042
differences between the LPL assigned from the milkrecording information and the true LPL.
Heritability values in the observed scale, ho2, and
effective heritability calculated form the expression inYazdi et al. (2002) which does not account for thecontemporary group variance, h2ef1 , were very similar,particularly for the Andalusia and Basque country data,where estimates of the Weibull parameter ρ were close totwo. Values for ho
2 and h2ef1were larger than heritabilityestimates in the log scale, ranging from0.048 to 0.074. ForCatalonia, with a value for theρ parameter lower than two,ho2 provided a larger estimate than the estimate provided bythe Yazdi et al. (2002) approximation. Effective heritabil-ities obtained by including the contemporary groupvariance in the denominator, h2ef2 , were quite lower thanestimates for ho
2 and h2ef1 . A better agreement between ho2
and h2ef2 would be expected given that both have beendeveloped for a model including the additional randomHYS effect. However, establishing sound comparisonsbetween heritabilities in the original scale and effectiveheritability is difficult because h2ef2 is an ‘ad hoc’expression to adapt the formula for effective heritabilitydeveloped by Yazdi et al. (2002) to a more complex modeland because ho
2 has been found to yield biased results insome cases, as previously mentioned. Apart from ho
2 andh2ef1 estimates, which might be the most questionableexpressions for providing heritability estimates in this case,regional differences for genetic parameters were small.
4. Conclusions
Our results show that the environmental factorsconsidered in this study have a great influence in therisk of culling of a cow in this population, except for theage at first calving which showed a relatively smalleffect. Stratification according to the effect of the age atfirst calving (AFC) does not seem necessary in thispopulation and a Weibull model with a unique baselinemight be appropriate for the national evaluation. Theeffect that showed the highest contribution to theprobability of culling was the management group effect(HYS), followed by the stage of lactation and the relativemilk production level. Protein and fat yields seem tohave been less used as culling criteria in this populationcompared with milk yield. Collecting reliable informa-tion on culling dates would be important in order toreduce biases in predicted risk and to improve theadequacy of the Weibull assumption. The consistency ofthe results among regional samples which representdiverse production systems in the population indicatethat the proposed model could be applied at the nationallevel. Heritability values obtained were in agreement
131Z. Chirinos et al. / Livestock Science 106 (2007) 120–131
with values found in the literature but are relatively low.Therefore, the direct selection by this character wouldrequire a large number of recorded progeny to obtainaccurate predictions of sire breeding values. Combiningthe direct evaluation of LPL with indirect measures oflongevity such as morphological traits related withfunctionality or somatic cell counts would be recom-mended to increase the reliability of the longevityevaluation and to make it a useful tool for improving theglobal functionality of animals in this population.
Acknowledgements
This work was supported by a grant of the R&DProgramme of the Ministry of Agriculture, Fish and Foodof Spain (SC00-039). Data and pedigreewere provided bythe Spanish Friesian Association (CONAFE). The firstauthor was supported by a grant of the National Scientific,Technological and Innovation Fund (FONACIT) and TheNational University of Zulia (LUZ) of Venezuela.
References
Brotherstone, S., Veerkamp, R.F., Hill, W.G., 1997. Genetic parametersfor a simple predictor of the lifespan of Holstein-Friesian dairycattle and its relationship to production. Anim. Sci. 65, 31–37.
Büenger,A.,Ducrocq,V., Swalve,H.H., 2001.Analysis of survival in dairycows using supplementary data on type scores and housing systemsfrom a region of Northwest Germany. J. Dairy Sci. 84, 1531–1541.
Caraviello, D.Z., Weigel, K.A., Gianola, D., 2004. Prediction oflongevity breeding values for US Holstein sires using survivalanalysis methodology. J. Dairy Sci. 87, 3518–3525.
Ducrocq, V.P., 1987. An analysis of length of productive life in dairycattle. Ph.D. Thesis, Cornell University, Ithaca, New York, USA.
Ducrocq, V.P., 1994. Statistical analysis of length of productive life fordairy cows of the Normande breed. J. Dairy Sci. 77, 855–866.
Ducrocq, V.P., 1999. Topics that may deserve further attention insurvival analysis applied to dairy cattle breeding—some sugges-tions. Proceedings of an International Workshop on EU Con-certed Action for Genetic Improvement of Functional Traits inCattle (GIFT): Longevity. Jouy-en-Josas, Francia. InterbullBulletin, vol. 21, pp. 181–189. http://www-interbull.slu.se.
Ducrocq, V.P., 2005. An improved model for the French geneticevaluation of dairy bulls on length of productive life of theirdaughters. Anim. Sci. 80, 249–256.
Ducrocq, V.P., Cassella, G., 1996. A bayesian analysis of mixedsurvival models. Genet. Sel. Evol. 28, 505–529.
Ducrocq, V.P., Sölkner, J., 1998. The Survival Kit—a Fortran packagefor the analysis of survival data. Proceedings of the 6th WorldCongress on Genetics Applied to Livestock Production. Armidale,Australia, vol. 27, pp. 447–448.
Ducrocq, V.P, Quaas, R.L., Pollak, E.J., Cassella, G., 1988a. Length ofproductive life of dairy cows. 1. Justification of a Weibull model.J. Dairy Sci. 71, 3071–3079.
Ducrocq, V.P., Quaas, R.L., Pollak, E.J., Cassella, G., 1988b. Lengthof productive life of dairy cows. 2. Variance component estimationand sire evaluation. J. Dairy Sci. 71, 3071–3079.
Dürr, J.W.,Monardes, R.I., Cue, R.I., 1999. Genetic analysis of herd life inQuebec Holstein using Weibull models. J. Dairy Sci. 82, 2503–2513.
Essl, A., 1998. Longevity in dairy cattle breeding: a review. Livest.Prod. Sci. 57, 79–89.
Everett, R.W., Keown, J.F., Clapp, E.E., 1976. Production andstayability trends in dairy cattle. J. Dairy Sci. 59, 1532–1539.
Famula, T.R., 1981. Exponential stayability model with censoring andcovariates. J. Dairy Sci. 64, 538–545.
Fuerst, C., Egger-Danner, C., 2002. Joint genetic evaluation forfunctional longevity in Austria and Germany. In CD-ROM of the7th World Congress on Genetics Applied to Livestock Production.Montpellier, Francia. Communication No. 01-16.
Klein, J.P., Moeschberger, M.L., 1997. Survival Analysis: Techni-ques for Censored and Truncated Data. Springer-Verlag, NewYork Inc.
Madgwick, P.A.,Goddard,M.E., 1989.Genetic and phenotypic parametersof longevity in Australian dairy cattle. J. Dairy Sci. 72, 2624–2632.
Pasman, E., Reinhardt, F., 1999. Genetic evaluation for length ofproductive life of Holstein cattle in Germany. Proceedings of anInternational Workshop on EU Concerted Action for GeneticImprovement of Functional Traits in Cattle (GIFT): Longevity.Jouy-en-Josas, Francia. Interbull Bulletin, vol. 21, pp. 55–59.http://www-interbull.slu.se.
Roxström, A., Ducrocq, V., Strandberg, E., 2003. Survival analysis oflongevity in dairy cattle on a lactation basis. Genet. Sel. Evol. 35,305–318.
Samoré, A.B., Schneider, M.P., Canavesi, F., Bagnato, A., Groen, A.F.,2001. Relationship between SCC and functional longevityestimated using survival analysis in Italian Holstein Friesian.52nd Annual Meeting of the European Association for AnimalProduction, Budapest, Hungary. Abstract Paper G2.7.
Schneider, M.P., Miglior, F., 1999. A proposal for genetic evaluationfor functional herd life in Italian Holsteins. 50th Annual Meeting ofthe European Association for Animal Production, Zurich, Switzer-land. Abstract Paper G2.2.
Sölkner, J., Ducrocq, V., 1999. The Survival Kit: a tool for analysis ofsurvival data. Proceedings of an International Workshop on EUConcerted Action for Genetic Improvement of Functional Traits inCattle (GIFT): Longevity. Jouy-en-Josas, Francia. InterbullBulletin, vol. 21, pp. 11–15. http://www-interbull.slu.se.
Strandberg, E., Sölkner, J., 1996. Breeding for longevity and survival indairy cattle. Proceedings International Workshop on GeneticImprovement of Functional Traits in Cattle. Gembloux, Belgium.Interbull Bulletin, vol. 12, pp. 111–119. http://www-interbull.slu.se.
Strandberg, E., Roxström, A., 2000. Genetic parameters of functionaland fertility determined length of productive life in Swedish dairycattle. Anim. Sci. 70, 383–389.
Van Raden, P.M., Klaaskate, E.J.H., 1993. Genetic evaluation oflength of productive life including predicted longevity of livescows. J. Dairy Sci. 76, 2758–2764.
Vollema, A.R., Van Der Beek, S., Harbers, A.G.F., De Jong, G., 2000.Genetic evaluation for longevity of Dutch dairy bulls. J. Dairy Sci.83, 2629–2639.
Vukasinovic, N., Moll, J., Kunzi, N., 1997. Analysis of productive lifein Swiss Brown cattle. J. Dairy Sci. 80, 2572–2579.
Vukasinovic, N., Moll, J., Casanova, L., 2001. Implementation of aroutine genetic evaluation for longevity based on survival analysistechniques in dairy cattle populations in Switzerland. J. Dairy Sci.84, 2073–2080.
Yazdi, M.H., Visscher, P.M., Ducrocq, V., Thompson, R., 2002.Heritability, reliability of genetic evaluations and response toselection in proportional hazardmodels. J. Dairy Sci. 85, 1563–1577.
Copyright © 2022 FDOKUMEN