A practical procedure for real-time functional mapping of eloquent cortex using...
22
A Practical Procedure for Real-Time Functional Mapping of Eloquent Cortex Using Electrocorticographic Signals in Humans Peter Brunner a,b , Anthony L. Ritaccio c , Timothy M. Lynch c , Joseph F. Emrich d , J. Adam Wilson e , Justin C. Williams e , Erik J. Aarnoutse f , Nick F. Ramsey f , Eric C. Leuthardt g , Horst Bischof b , and Gerwin Schalk a,c,g,h,i,* a Brain–Computer Interface R&D Program, Wadsworth Center, New York State Department of Health, Albany, NY, USA b Institute for Computer Graphics and Vision, Graz University of Technology, Graz, Austria c Department of Neurology, Albany Medical College, Albany, NY, USA d Department of Neurosurgery, Albany Medical College, Albany, NY, USA e Department of Biomedical Engineering, University of Wisconsin at Madison, Madison, WI, USA f Rudolf Magnus Institute of Neuroscience, University Medical Center Utrecht, Utrecht, Netherlands g Department of Neurological Surgery, Washington University School of Medicine, St. Louis, MO, USA h Department of Biomedical Engineering, Rensselaer Polytechnic Institute, Troy, NY, USA i Department of Biomedical Sciences, School of Public Health, State University of New York at Albany, Albany, NY, USA Abstract Functional mapping of eloquent cortex is often necessary prior to invasive brain surgery, but current techniques that derive this mapping have important limitations. In this paper, we demonstrate the first comprehensive evaluation of a rapid, robust, and practical mapping system that uses passive recordings of electrocorticographic (ECoG) signals. This mapping procedure is based on the BC12000 and SIGFRIED technologies that we have been developing over the past several years. In our study, we evaluated ten epilepsy patients from four different institutions and compared the results of our procedure to the results derived using electrical cortical stimulation (ECS) mapping. The results show that our procedure derives a functional motor cortical map in only a few minutes. They also show a substantial concurrence with the results derived using ECS mapping. Specifically, compared to ECS maps, a next-neighbor evaluation showed no false negatives, and only 0.46% and 1.10% false positives for hand and tongue maps, respectively. In summary, we demonstrate the first comprehensive evaluation of a practical and robust mapping procedure that could become a new tool tor planning or invasive brain surgeries. Keywords electrical cortical stimulation; functional mapping; ECS; fMRI; ECoG; electrocorticography © 2009 Elsevier Inc. All rights reserved. *Corresponding author. Brain-Computer Interface R&D Program, New York State Department of Health, C650 Empire State Plaza, Albany, New York 12201, USA, Fax: +1 518 486 4910. [email protected] (Gerwin Schalk). Publisher's Disclaimer: This is a PDF file of an unedited manuscript that has been accepted for publication. As a service to our customers we are providing this early version of the manuscript. The manuscript will undergo copyediting, typesetting, and review of the resulting proof before it is published in its final citable form. Please note that during the production process errors may be discovered which could affect the content, and all legal disclaimers that apply to the journal pertain. NIH Public Access Author Manuscript Epilepsy Behav. Author manuscript; available in PMC 2010 July 1. Published in final edited form as: Epilepsy Behav. 2009 July ; 15(3): 278–286. doi:10.1016/j.yebeh.2009.04.001. NIH-PA Author Manuscript NIH-PA Author Manuscript NIH-PA Author Manuscript
Transcript of A practical procedure for real-time functional mapping of eloquent cortex using...
A Practical Procedure for Real-Time Functional Mapping ofEloquent Cortex Using Electrocorticographic Signals in Humans
Peter Brunnera,b, Anthony L. Ritaccioc, Timothy M. Lynchc, Joseph F. Emrichd, J. AdamWilsone, Justin C. Williamse, Erik J. Aarnoutsef, Nick F. Ramseyf, Eric C. Leuthardtg, HorstBischofb, and Gerwin Schalka,c,g,h,i,*
a Brain–Computer Interface R&D Program, Wadsworth Center, New York State Department ofHealth, Albany, NY, USA b Institute for Computer Graphics and Vision, Graz University ofTechnology, Graz, Austria c Department of Neurology, Albany Medical College, Albany, NY, USAd Department of Neurosurgery, Albany Medical College, Albany, NY, USA e Department ofBiomedical Engineering, University of Wisconsin at Madison, Madison, WI, USA f Rudolf MagnusInstitute of Neuroscience, University Medical Center Utrecht, Utrecht, Netherlands g Department ofNeurological Surgery, Washington University School of Medicine, St. Louis, MO, USA h Departmentof Biomedical Engineering, Rensselaer Polytechnic Institute, Troy, NY, USA i Department ofBiomedical Sciences, School of Public Health, State University of New York at Albany, Albany, NY,USA
AbstractFunctional mapping of eloquent cortex is often necessary prior to invasive brain surgery, but currenttechniques that derive this mapping have important limitations. In this paper, we demonstrate thefirst comprehensive evaluation of a rapid, robust, and practical mapping system that uses passiverecordings of electrocorticographic (ECoG) signals. This mapping procedure is based on theBC12000 and SIGFRIED technologies that we have been developing over the past several years. Inour study, we evaluated ten epilepsy patients from four different institutions and compared the resultsof our procedure to the results derived using electrical cortical stimulation (ECS) mapping. Theresults show that our procedure derives a functional motor cortical map in only a few minutes. Theyalso show a substantial concurrence with the results derived using ECS mapping. Specifically,compared to ECS maps, a next-neighbor evaluation showed no false negatives, and only 0.46% and1.10% false positives for hand and tongue maps, respectively. In summary, we demonstrate the firstcomprehensive evaluation of a practical and robust mapping procedure that could become a new tooltor planning or invasive brain surgeries.
Keywordselectrical cortical stimulation; functional mapping; ECS; fMRI; ECoG; electrocorticography
© 2009 Elsevier Inc. All rights reserved.*Corresponding author. Brain-Computer Interface R&D Program, New York State Department of Health, C650 Empire State Plaza,Albany, New York 12201, USA, Fax: +1 518 486 4910. [email protected] (Gerwin Schalk).Publisher's Disclaimer: This is a PDF file of an unedited manuscript that has been accepted for publication. As a service to our customerswe are providing this early version of the manuscript. The manuscript will undergo copyediting, typesetting, and review of the resultingproof before it is published in its final citable form. Please note that during the production process errors may be discovered which couldaffect the content, and all legal disclaimers that apply to the journal pertain.
NIH Public AccessAuthor ManuscriptEpilepsy Behav. Author manuscript; available in PMC 2010 July 1.
Published in final edited form as:Epilepsy Behav. 2009 July ; 15(3): 278–286. doi:10.1016/j.yebeh.2009.04.001.
NIH
-PA Author Manuscript
NIH
-PA Author Manuscript
NIH
-PA Author Manuscript
1. IntroductionResective brain surgery is often performed in people with intractable epilepsy, congenitalstructural lesions, vascular anomalies, and neoplasms. Surgical planning of the resectionprocedure depends substantially on the delineation of abnormal tissue, e.g., epileptic foci ortumor tissue, and on the creation of functional map of eloquent cortex in the area close to thatabnormal tissue. Traditionally, different methodologies have been used to produce thisfunctional map: electrical cortical stimulation (ECS) [1,2,3], functional magnetic resonanceimaging (fMRI) [4], positron emission tomography (PET) [5,6], magnetoencephalography(MEG) [7], or evoked potentials (EP) [8]. Each of these methods has problems that includemorbidity, time consumption, expense, or practicality. Since ECS has three quarters of acentury of historical and clinical relevance [9], and perhaps also due to its relative proceduralsimplicity and low cost, ECS has become the gold standard in mapping eloquent cortex. It hasgained broad acceptance despite limited data to support efficacy [10] and despite of severalsubstantial issues. For example, ECS is time consuming because it requires a comprehensivesearch, i.e., stimulation of each grid contact, while simultaneously determining the appropriatestimulation amplitude. ECS can also produce after-discharges that may trigger seizures or evenstatus epilepticus. This can result in substantial delays, aborted procedures, and patientmorbidity. The results derived using ECS may also not be correct because: 1) stimulation mayproduce inhibitory responses that cannot readily be observed; 2) propagation of stimulationcurrent is affected by the anatomy and potential after-discharges, and thus variable; 3) theremay be substantial procedural variability; and 4) stimulation-based mapping is based on alesional and not a physiological model. Finally, ECS depends on patient compliance and thuscannot easily be used in some patient populations (such as pediatric patients). Thecharacteristics of ECS are summarized in Table 1, and are reviewed in [11] and [12]. Theproblems described above increase the risk to the patient and the time and cost associated withsurgical planning.
Patients undergoing invasive brain surgery would benefit greatly from a mapping methodologythat does not have the problems associated with existing techniques, i.e., a method that is safe,can be rapidly applied, is comparatively inexpensive, procedurally simple, and also congruentto existing techniques (in particular to electrical stimulation). Task-related changes detectedin electrocorticographic (ECoG) recordings appear to have attractive properties (see Table 1)and thus could provide the basis for a technique with those desirable characteristics. Thisapproach seems attractive in particular because existing surgical protocols typically alreadyinclude the placement of subdural electrodes, and because a number of recent studies showedthat ECoG activity recorded from these electrodes reflect task-related changes [13,14,15,16,17,18,19,20,21,22,23,24]. These studies showed that ECoG amplitudes in particular frequencybands carry substantial information about movement or language tasks. Specifically,amplitudes typically decrease in the mu (8-12 Hz) and beta (18-25 Hz) bands, whereasamplitudes usually increase in the gamma (>40 Hz) band (see Fig. 1). Furthermore, recentstudies demonstrated that such ECoG changes, in particular those in the gamma band, were ingeneral agreement with those derived using fMRI [25] and with results determined using ECS[22,24,23]. However, these traditional ECoG-based analyses usually need to be optimized foreach individual. Typically they are generated by signal processing experts after comprehensivepost-hoc analyses. While a few recent studies have provided encouraging evidence that ECoG-based analyses could become more accessible to clinicians [26,27,28], a widely available androbust procedure that can be utilized by non-experts is needed.
We demonstrate here a comprehensive evaluation of a robust, practical, and readily availableprocedure for presurgical functional mapping of eloquent cortex using subdural electrodes.This procedure is based on our BCI2000 and SIGFRIED (STGnal modeling For Real-timeIdentification and Event Detection) technologies. BCI2000 is a general-purpose software
Brunner et al. Page 2
Epilepsy Behav. Author manuscript; available in PMC 2010 July 1.
NIH
-PA Author Manuscript
NIH
-PA Author Manuscript
NIH
-PA Author Manuscript
platform for real-time biosignal acquisition, processing, and feedback [29,30](http://www.bci2000.org). In collaboration with other institutions, most notably the Universityof Tübingen in Germany, we have been developing BCI2000 for close to ten years. BCI2000is currently in use by more than 300 laboratories world-wide for a variety of studies. It supportsmore than 15 different signal acquisition devices and can thus be readily integrated in differentresearch or clinical environments. SIGFRIED [31,32] is a signal processing procedureimplemented within BCI2000 that can detect and visualize task-related changes in real timewithout prior parameterization (e.g., of frequency bands, visualization parameters, etc.) by anexpert.
In this paper, we demonstrate the use of the SIGFRIED/BCI2000 system for delineating corticalareas related to tongue and hand motor function in ten patients from four institutions. Theresults show that our method can provide a functional map within only a few minutes and thatthis map is in strong congruence to that derived by ECS mapping. Furthermore, theydemonstrate that our technique provides robust and practical mapping capabilities in differentclinical environments.
2. Material and Methods2.1. Human Subjects
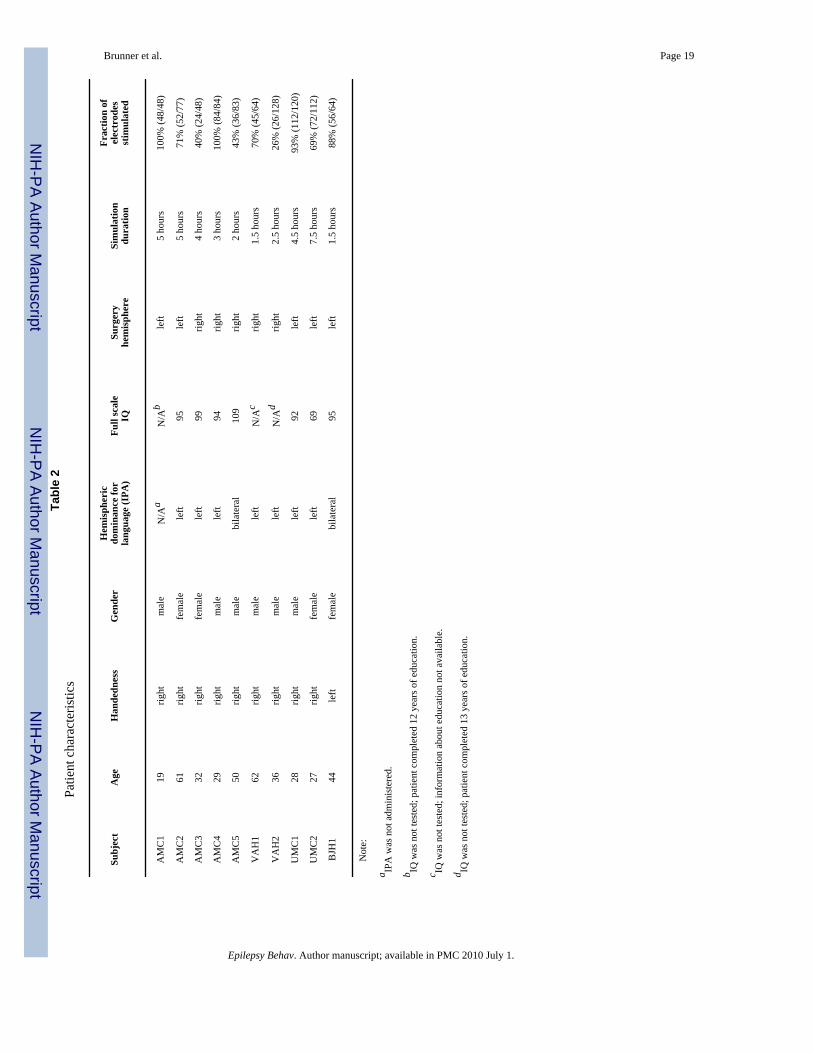
A total of 10 patients (Table 2) at Albany Medical Center (Albany, NY) [AMC1-5], Barnes-Jewish Hospital (St. Louis, MO) [BJH1], Middleton Memorial Veterans Hospital (Madison,WI) [VAH1-2] and University Medical Center Utrecht (Utrecht, The Netherlands) [UMC1-2]were implanted with subdural platinum electrodes arrays (4 mm diameter, 2.3 mm exposed, 1cm inter-electrode spacing, Ad-Tech, Racine, WT) for a period of 5-12 days prior to resectionof a seizure focus. In each patient, the seizure focus. In each patient, the seizure focus wasidentified by neurologists using visual inspection, and eloquent cortex was identified over aperiod of 1.5-7.5 hours using electrical cortical stimulation (ECS). For the majority of patients,this stimulation was not completed, thereby leaving 12% to 74% of the covered cortex withoutstimulation results. Grid locations were classified as hand or tongue function if stimulation(typically 1 to 4 mA) elicited or inhibited motor activity or sensation. Some of the contactswere not stimulated for different reasons: (1) tney had no relevance to the surgical procedure,i.e., they were sufficiently distant to any planned resection; (2) the minimum stimulation current(e.g., 4 mA) could not be reached without inducing pain; (3) stimulation induced a seizurebefore any response was detected; (4) time constraints; (5) stimulation induced global after-discharges. The locations of the seizure foci and eloquent cortex were subsequently used forplanning of surgical resection. Location and duration of the implantation were solelydetermined by clinical criteria and only patients with some peri-rolandic coverage wereincluded in the study. All patients gave informed consent through a protocol reviewed andapproved by each of the participating institution's review board.
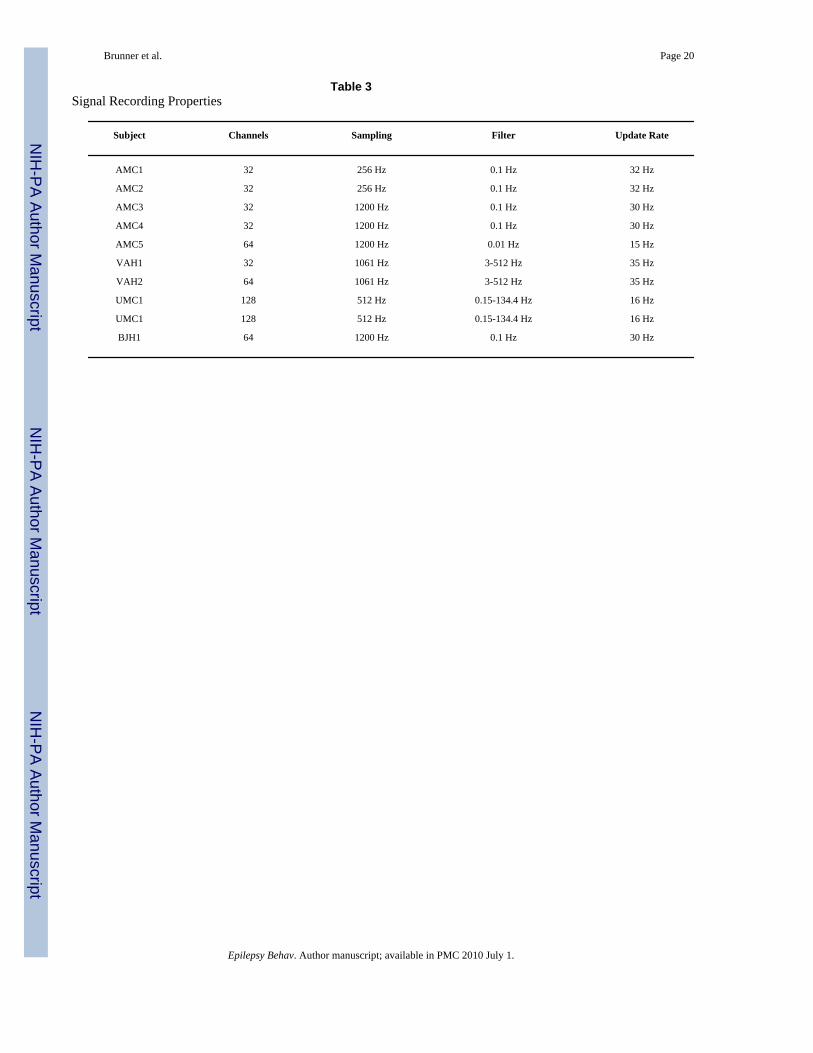
2.2. Data CollectionDuring the monitoring period, we recorded ECoG signals at the bedside from 32-128 contactsof the implanted grids using different biosignal acquisition devices (Table 3). Scalp or gridelectrodes were used for reference and ground. Data collection and stimulus presentation wasaccomplished using BCI2000 [29] software, a general-purpose system for real-time biosignalacquisition, processing and feedback. Real-time signal processing and visualization wasperformed using the SIGFRIED method [31,32] implemented within BCI2000.
2.3. Experimental ProtocolWe first recorded 6 minutes of baseline data during which the subject was asked to remainrelaxed and to avoid any movements. Then, each subject performed alternating sequences of
Brunner et al. Page 3
Epilepsy Behav. Author manuscript; available in PMC 2010 July 1.
NIH
-PA Author Manuscript
NIH
-PA Author Manuscript
NIH
-PA Author Manuscript
repetitive movements of the tongue, i.e., protrusion and retracting of the tongue, movementsof the hand, i.e., opening and closing of the hand contralateral to the side of the grid placement,and resting. The subject was visually cued by the words “tongue” or “hand”, which werepresented on a computer screen (a blank screen indicated the resting period). Each task wasperformed for a duration of 3 seconds (15 seconds for subject UMC1) at a self-paced rate ofabout two repetitions per second, followed by a resting period of the same duration (Fig. 3)before the next task. One run consisted of 15 repetitions of this sequence over the course of180 seconds. We typically recorded one initial run to familiarize the subject with the task. Allanalyses in this paper are for one run following the initial training run. The visual display tothe investigator during online operation of this run was provided as described below.
2.4. Signal AnalysisTo provide a basis for real-time feedback, we first used the SIGFRIED procedure [31,32] toestablish a statistical model of the recorded baseline data. While the subject executed the task,we then used this procedure to identify in real-time those grid contacts that showed activitychanges that were statistically different from the baseline model. In short, we used the followingsignal preprocessing, feature extraction and feature selection configurations: first, the signalfrom each grid contact was re-referenced using a common average reference (CAR) filter[33]. Then, for each grid contact and 500 ms time period, the time series ECoG signal wasconverted into the frequency domain using an autoregressive model [34,35,36] with a modelorder of l/10th of the sampling rate. Frequencies between 70-100 Hz (ten bins at 4 Hzbandwidth) were submitted to SIGFRIED. During online processing, SIGFRIED then utilizedthe established baseline model to calculate for each grid contact the likelihood that the signalat that grid contact was statistically different from the modeled baseline signals. This likelihoodwas calculated every 28.27 to 66.66 ms (see Table 2).
Fig. 4 illustrates time courses of the negative log-transformed likelihood values for twolocations recorded from subject VAH2. The upper trace corresponds to the location markedwith a star in Fig. 7. The bottom trace corresponds to the location marked with a rectangle. Thetimes of cue presentation for hand movements are marked with yellow bars and for tonguemovements with red bars. Interleaved rest periods are shown in white. The SIGFRIED tracein the upper figure detects hand movements but not tongue movements, whereas the bottomtrace detects tongue but not hand movements.
Finally, for each grid contact and task, the distribution of the negative log-transformedlikelihood values was further re-referenced to those values calculated during the resting periodbetween the tasks by calculating the value of r2, i.e., the proportion of values that was accountedfor by the task. This resulted in a value between 0 (not different) and 1 (very different) for eachgrid contact and task.
2.5. Interface to the investigatorThe results from the signal analyses described above were presented to the investigator in realtime using a topo-graphic interface (Fig. 5). The interface contained, for each task (i.e., handor tongue), a display of the r2 values at each location. Each display contained one circle at eachelectrode's location. The size of each circle and its tint was proportional to the r2 value. Thus,a large red circle represented a large statistical difference between the corresponding task andrest, while a small black circle indicated a small statistical difference. The displaycorresponding to each task was autoscaled to the minimum and maximum r2 value. Thus, noparameter (e.g., frequency range, display or detection parameters, etc.) needed to be changedby the investigator prior to or during system operation.
Brunner et al. Page 4
Epilepsy Behav. Author manuscript; available in PMC 2010 July 1.
NIH
-PA Author Manuscript
NIH
-PA Author Manuscript
NIH
-PA Author Manuscript
3. Results3.1. Qualitative Results
The following paragraphs present the results derived using the SIGFRIED mapping procedure,and qualitatively and quantitatively compare the results to those obtained with ECS mapping.
The main results of this paper are shown for all subjects in Fig. 6 and 7, and in SupplementaryVideos 1 and 2. In each figure, the lateral radiographs (all subjects except UMC1 and UMC2)or computer tomography (CT) images (UMC1 and UMC2) on the left show grid contactsmarked by colored circles. Contacts that were stimulated and identified as cloquent cortexassociated with hand function are shown in yellow, those associated with tongue function areshown in red, and those associated with neither hand nor tongue function are shown in white.Semi-transparent white circles indicate locations that were not stimulated.
The four detailed lateral radiographs/CT images on the right show the results of the SIGFRIEDmapping procedure derived after 30, 60, 120 and 180 seconds. Similarly to the ECS resultsshown on the very left, yellow circles indicate the results for the hand task, and red circlesindicate tne results for the tongue task. Locations that were excluded (e.g., due to brokenconnectors) or not recorded (e.g., due to limitation in the number of channels) are left blank.The final maximum r2 (i.e., the value of r2 of the largest circle in each figure) after 180 secondsis noted on the right for hand (range 0.05 to 0.61) and tongue (range 0.10 to 0.51).
3.2. Quantitative ResultsThe results in Fig. 6 and 7 show substantial agreement to those derived using electricalstimulation. In addition, we assessed these results using two quantitative comparisons. For bothcomparisons of tongue and hand, the r2 values at each location were classified as eloquent ornon-eloquent with a threshold that was derived using Minimum Bayesian Error [37].
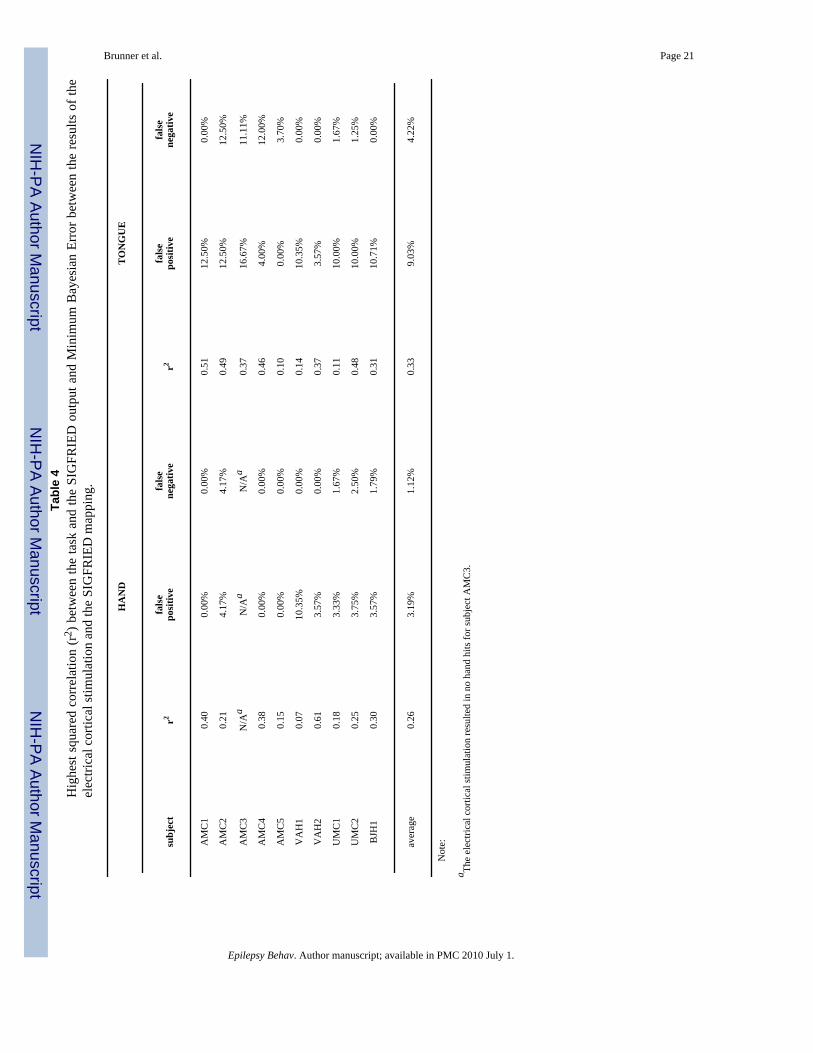
The first comparison in Table 4 provides a quantitative analysis for the 18 to 77 contacts thatwere both stimulated by ECS and mapped with SIGFRIED. This comparison was doneindependently for hand and tongue and resulted in a correct or incorrect match between ECSand SIGFRIED at each location. The incorrect results were further classified into falsepositives, i.e., contacts identified by SIGFRIED but not by ECS, and false negatives, i.e.,contacts identified by ECS but not by SIGFRIED. Table 4 shows that there were more falsepositives than false negatives. For three subjects (AMC1, VAH1 and VAH2), no false negativesfor hand and tongue were identified. We hypothesized that most of the incorrect results wouldhave been correct if they had been derived for a next neighbor. Table 5 shows the results ofthe corresponding analysis. While this analysis effectively corresponds to a reduction in theresolution of the mapping, this procedure resulted in no false negatives, and only in 0.46% and1.10% false positives for hand and tongue maps, respectively.
4. DiscussionWe provide the first comprehensive demonstration of a functional mapping procedure that israpid, practical, robust, and accurate in localizing primary motor cortex. In our evaluation often patients from four institutions, we found that the SIGFRIED procedure identifies at leastthe same contacts or their immediate neighbors compared to ECS mapping.
These results may have important implications for functional localization prior to invasivebrain surgery. Our method can be used with little training and can be readily implemented inthe typical clinical environment. In fact, our system is currently in evaluation by a number ofepilepsy centers in the US and Europe. Thus, we believe that the SIGFRIED/BCI2000 systemhas the potential for widespread adoption in a large number of centers world-wide. At the same
Brunner et al. Page 5
Epilepsy Behav. Author manuscript; available in PMC 2010 July 1.
NIH
-PA Author Manuscript
NIH
-PA Author Manuscript
NIH
-PA Author Manuscript
time, this new mapping platform is opening up several important research questions: e.g., whichtasks are best suited to elicit appropriate responses for different classes of anatomical areas?What are the situations or populations (e.g., children) for which this method provides themaximum benefit? What is the efficacy of the SIGFRIED method for other brain functions, inparticular for mapping expressive and receptive language? (Ongoing work in our laboratory isproviding encouraging evidence in this regard.) It is at present also unclear how this methodwill be integrated in the clinical workflow. Despite the strong congruence of the SIGFRIED-based results to ECS-based results, it is likely premature to replace ECS mapping withSIGFRIED-based mapping. Rather, it seems to be more appropriate to optimize ECS mappingbased on the results of prior SIGFRIED mapping.
Like the recent study by Miller et al. [23], our study demonstrates considerable variance in thesomatotopy across subjects and coherence with the ECS mapping results. Both location andarea identified as eloquent cortex vary among subjects. While for Miller et al. it was not clearwhether this was due to subject variability or expert variability in performing the ECS, ourstudy shows that a next-neighbor analysis achieves an almost perfect coherence with the ECSmapping results. This suggests that most of the variance is due to expert variability.
Crone et al. [14] reported that not all subjects displayed changes in the gamma band. This isin contrast to the results of this study that showed adequate task-related changes of gammaamplitudes (which were the basis for the SIGFRIED calculations) in all ten subjects. It ispossible that this is due to a difference in hardware, processing, or motor tasks. For example,our own experience, and also results from a previous study [15], suggest that more complextasks (such as the Rubic's cube manipulation task in Supplementary Videos 1 and 2) increasethe amplitude of the gamma changes.
The SIGFRIED results were generally in substantial agreement to those derived using electricalstimulation, but there were some differences. These differences could be attributed to severalfactors that include expert variability in ECS mapping or ECS's variable current spread, lowstatistical significance, or the characteristics of the subject's task. Cortex at remote locationsmay be activated due to current spread, and thus result in a site that is registered by ECS andnot by SIGFRIED. Conversely, SIGFRIED may falsely register sites with low statisticalsignificance. For example, consider the map for hand function in subject AMC3 (shown in Fig.6). This subject's grid did not have hand coverage, i.e., ECS mapping did not detect handfunction in any electrode. The SIGFRIED map highlights several sites, although the maximumr2 value (0.05) was very low. Thus, the magnitude of the maximum r2 value gives an index ofconfidence in a particular map. Future versions of the software could even calculate such aconfidence index (i.e. a p-value) explicitly. The factor that may have the larsest influence onthe differences between the ECS and the SIGFRIED maps may be the nature of the subject'stask. In one extreme, this task would be very simple, and only require very limited areas ofcortex for its execution. In this case, SIGFRIED would only register very few electrodes ornone at all. In the other extreme, the subject's task would be difficult and require engagementof different cortical facilities. Thus, the use of this task would result in activation of morewidespread areas of cortex, and consequently, SIGFRIED would detect changes in moreelectrodes. As described above, recent experiments suggest that the use of more complexvisuomotor tasks results in even more robust maps. In sum, the optimal tasks for mappingmotor and other cortices using the SIGFRIED method are currently unknown. However, therapidity of our method facilitates the use of several tasks that engage the desired cortical areain different ways.
The SIGFRIED mapping overcomes many problems associated with ECS. It is also based ona different principle. While ECS is based on a lesional model [38], SIGFRIED is based on task-related changes in ECoG signals. The clinical impact of this difference is currently unclear. It
Brunner et al. Page 6
Epilepsy Behav. Author manuscript; available in PMC 2010 July 1.
NIH
-PA Author Manuscript
NIH
-PA Author Manuscript
NIH
-PA Author Manuscript
is thought that the lesional model utilized with ECS closely resembles the effect of surgicalresection, in that it allows the identification of those areas that are critical for a particularfunction. In contrast, SIGFRIED detects those areas that change their activity with a particulartask. It may not detect areas that do not change their activity but are critical for a particularfunction, or may detect areas that change their activity but are not critical. At the same time,ECS clearly has problems of accuracy itself, e.g., because there is no defined standard for ECSmapping, because there are practical (in particular time) constraints for using ECS, and becausethe resolution of ECS is limited due to current spread and the need for bipolar stimulation. Insummary, at this early stage of clinical validation, replacing ECS with the SIGFRIED/BCI2000system is not warranted. Nevertheless, despite its potential limitations, there may already bedistinct advantages over ECS mapping.
The ECS protocol labels each contact with the eloquent function that is elicited or inhibited asthe contact is stimulated. Finding eloquent function at a low threshold terminates the protocolfor this contact, assuming that each type eloquent function is spatially contiguous as it issuggested by the motor homunculus model [39]. Recent fMRI [40] and ECS [10] studies,however, show a more complex and spatially noncontiguous somatotopy. The SIGFRIEDmapping could establish a comparable somatotopy by exploring different tasks, for example adedicated motor/sensory evaluation for each finger. This could allow more detailed surgicalplanning and thus benefit the outcome of the resection procedure. However, the lack of averifiable gold standard makes it difficult to assess the quality of such a more detailedsomatotopy. Only surgical outcome can provide a detailed assessment on whether a moredetailed somatotopy may be beneficial.
Studies have shown task-related changes associated with ipsilateral movements in the lowfrequency band [41,42,43,44,45,46,47,48]. The implications of resecting cortical areasassociated with these ipsilateral movements have not been defined, mainly because ECS is notable to elicit ipsilateral limb movement within the conventional stimulation thresholds [49,50]. The SIGFRIED mapping could facilitate such studies by exploring ipsilateral tasks.
An initial application of the SIGFRIED/BCI2000 system is shown here, but there are severalways in which this system can be further improved. As a first example of the potential forimprovement, we observed a noticeable delay between stimulus onset and the patient's responseeven when there was good compliance of the subiect. Crone et al. also reported such delays,and estimated them to be in the 300-400 ms range for simple visually cued hand movementsand tongue protrusions [14]. Our results show similar delays (see Fig. 4). Because the totalduration of each stimulus was only 3 sec (15 sec for subject UMC1), a significant fraction ofthe signals were thus effectively assigned to the incorrect task category. In more recentexperiments, we have begun to alert the subject to the change in condition by presenting anauditory stimulus, and we suspend data analysis for 1 sec. In the end, it may be possible topartially or even completely eliminate this need for patient compliance, which is currently anissue for all mapping techniques. For example, for motor tasks it would be relativelystraightforward to utilize motion sensors, such as a data glove, motion capture device, or EMGelectrodes, and to simply correlate SIGFRIED values with the detected motion rather than withthe stimulus. For sensory input, it would be possible to use programmable tactile stimulatorsand earphones. Thus, such approaches may fully remove the requirement for patientcompliance and facilitate mapping in pediatric environments where patient compliance is eitherimpossible (e.g., with infants) or hard to obtain (e.g., with young children). As another examplefor potential further improvements, it may be possible to use the SIGFRIED mappingintraoperatively. This possibility could replace the two surgeries that are currently necessarywith one surgery that encompasses grid placement, mapping of eloquent cortex, and resection.In particular in patients that do not require longer monitoring periods (e.g., tumor patients),this would significantly decrease risks to the patient and costs of the hospitalization.
Brunner et al. Page 7
Epilepsy Behav. Author manuscript; available in PMC 2010 July 1.
NIH
-PA Author Manuscript
NIH
-PA Author Manuscript
NIH
-PA Author Manuscript
In conclusion, in this paper we presented the SIGFRIED/BCI2000 system as a practicalfunctional mapping procedure. This system is readily available at no cost for research andeducational purposes at www.bci2000.org, and there is substantial documentation on its theory[29,30,31,32] and use (doc.bci2000.org). BCI2000 currently supports signal acquisition from15 different devices, and more are continually added. This should facilitate the integration inexisting clinical environments.
Supplementary MaterialRefer to Web version on PubMed Central for supplementary material.
5. AcknowledgmentsWe would like to acknowledge Dr. Michael Gruenthal for his helpful comments and Dr. Karl Sillay for his strongsupport for this study. This work was supported by the US Army Research Office (W911NF-07-1-0415 (GS) andW911NF-08-1-0216 (GS)), and the NIH (EB006356 (GS), EB00856 (JRW and GS), K12-HD049077 (JCW),1KL2RR025012-01 (JCW), and 1T90DK070079-01 (JCW)).
References1. Hara K, Ucmatsu S, Lesser R, Gordon B, Hart J, Vining E. Representation of primary motor cortex in
humans: studied with chronic subdural grid. Epilepsia 1991;32(suppl):23–24.2. Ojemann GA. Cortical organization of language. J Neurosci 1991;11(8):2281–2287. [PubMed:
1869914]3. Uematsu S, Lesser R, Fisher RS, Gordon B, Hara K, Krauss GL, Vining EP, Webber RW. Motor and
sensory cortex in humans: topography studied with chronic subdural stimulation. Neurosurgery1992;31(1):59–71. [PubMed: 1641111]
4. Chakraborty A, McEvoy AW. Presurgical functional mapping with functional MRI. Curr Opin Neurol2008;21(4):446–451. [PubMed: 18607205]
5. Bittar RG, Olivier A, Sadikot AF, Andermann F, Comeau RM, Cyr M, Peters TM, Reutens DC.Localization of somatosensory function by using positron emission tomography scanning: acomparison with intraoperative cortical stimulation. J Neurosurg 1999;90(3):478–483. [PubMed:10067916]
6. Meyer PT, Sturz L, Sabri O, Schreckenberger M, Spetzger U, Setani KS, Kaiser HJ, Buell U.Preoperative motor system brain mapping using positron emission tomography and statisticalparametric mapping: hints on cortical reorganisation. J Neurol Neurosurg Psychiatry 2003;74(4):471–478. [PubMed: 12640066]
7. Ganslandt O, Fahlbusch R, Nimsky C, Kober H, Möller M, Steinmeier R, Romstöck J, Vieth J.Functional neuronavigation with magne-toencephalography: outcome in 50 patients with lesionsaround the motor cortex. J Neurosurg 1999;91(1):73–79. [PubMed: 10389883]
8. Dinner DS, Lüders H, Lesser RP, Morris HH. Invasive methods of somatosensory evoked potentialmonitoring. J Clin Neurophysiol 1986;3(2):113–130. [PubMed: 3084558]
9. Foerster O. The cerebral cortex in man. Lancet 1931;221:309–312.10. Hamberger MJ. Cortical language mapping in epilepsy: a critical review. Neuropsychol Rev 2007;17
(4):477–489. [PubMed: 18004662]11. Devinsky O, Beric A, Dogali M. Electrical and Magnetic Stimulation of the Brain and Spinal Cord.
Raven Press. 199312. Ojcmann G, Ojcmann J, Lcttich E, Bcrger M. Cortical language localization in left, dominant
hemisphere, an electrical stimulation mapping investigalion in 117 patients. J Neurosurg 1989;71(3):316–326. [PubMed: 2769383]
13. Crone NE, Miglioretti DI, Gordon B, Sieracki JM, Wilson MT, Uemalsu S, Lesser RP. Functionalmapping of human sensorimotor cortex with electrocorticographic spectral analysis. T. Alpha andbeta event-related desynchronization. Brain 1998;121(Pt 12):2271–2299. [PubMed: 9874480]
Brunner et al. Page 8
Epilepsy Behav. Author manuscript; available in PMC 2010 July 1.
NIH
-PA Author Manuscript
NIH
-PA Author Manuscript
NIH
-PA Author Manuscript
14. Crone NE, Miglioretti DL, Gordon B, Lesser RP. Functional mapping of human sensorimotor cortexwith electrocorticographic spectral analysis, II. Event-related synchronization in the gamma band.Brain 1998;121(Pt 12):2301–2315. [PubMed: 9874481]
15. Aoki F, Fetz EE, Shupe L, Lettich E, Ojemann GA. Increased gamma-range activity in humansensorimotor cortex during performance of visuomotor tasks. J Clin Neurophysiol 1999;110(3):524–537.
16. Aoki F, Fetz EE, Shupe L, Lettich E, Ojemann GA. Changes in power and coherence of brain activityin human sensorimotor cortex during performance of visuomotor tasks. Biosystems 2001;63(13):89–99. [PubMed: 11595332]
17. Crone NE, Boatman D, Gordon B, Hao L. Induced electrocorticographic gamma activity duringauditory perception. J Clin Neurophysiol 2001;112(4):565–582.
18. Varela F, Lachaux JP, Rodriguez E, Martinerie J. The brainweb: phase synchronization and large-scale integration. Nat Rev Neurosci 2001;2(4):229–239. [PubMed: 11283746]
19. Graimann B, Huggins JE, Lcvinc SP, Pfurtschellcr G. Visualization of significant ERD/ERS patternsin multichannel LEG and ECoG data. J Clin Neurophysiol 2002;113(1):43–47.
20. Lachaux JP, Rudrauf D, Kahane P. Intracranial FEG and human brain mapping. J Physiol Paris2003;97(46):613–628. [PubMed: 15242670]
21. Fries P. A mechanism lor cognitive dynamics: neuronal communication through neuronal coherence.Trends Cogn Sci 2005;9(10):474–480. [PubMed: 16150631]
22. Sinai A, Bowers CW, Crainiceanu CM, Boatman D, Gordon B, Lesser RP, Lenz FA, Crone NE.Electrocorticographic high gamma activity versus electrical cortical stimulation mapping of naming.Brain 2005;128(Pt 7):1556–1570. [PubMed: 15817517]
23. Miller KJ, Leuthardt EC, Schalk G, Rao RP, Anderson NR, Moran DW, Miller JW, Ojemann JG.Spectral changes in cortical surface potentials during motor movement. J Neurosci 2007;27(9):2424–2432. [PubMed: 17329441]
24. Leuthardt EC, Miller K, Anderson NR, Schalk G, Dowling J, Miller J, Moran DW, Ojemann JG.Electrocorticographic frequency alteration mapping: a clinical technique for mapping the motorcortex. Neurosurgery. 2007;60(4 Suppl 2):260–270.
25. Lachaux JP, Fonlupt P, Kahane P, Minotti L, Hoffmann D, Bertrand O, Baciu M. Relationshipbetween task-related gamma oscillations and bold signal: new insights from combined fMRI andintracranial EEG. Hum Brain Mapp 2007;28(12):1368–1375. [PubMed: 17274021]
26. Lachaux JP, Jerbi K, Bertrand O, Minotti L, Hoffmann D, Schoendorff B, Kahane P. A blueprint lorreal-time functional mapping via human intracranial recordings. PLoS ONE 2(10)
27. Lachaux JP, Jerbi K, Bertrand O, Minotti L, Hoffmann D, Schoendorff B, Kahane P. BrainTV: anovel approach for online mapping of human brain functions. Biol Res 2007;40(4):401–413.[PubMed: 18575675]
28. Miller KJ, denNijs M, Shenoy P, Miller JW, Rao RP, Ojemann JG. Real-time functional brain mappingusing electrocorticography. Neuroimage 2007;37(2):504–507. [PubMed: 17604183]
29. Schalk G, McFarland D, Hinterberger T, Birbaumcr N, Wolpaw J. BCI2000: A general-purpose brain-computer interface (BCI) system. IEEE Trans Biomed Eng 2004;51:1034–1043. [PubMed:15188875]
30. Mellinger, J.; Schalk, G. BCI2000: A general-purpose software platform for BCI. In: Dornhege, G.;del, J.; Millan, R.; Hinterberger, T.; McFarland, D.; Müller, K., editors. Toward Brain-ComputerInterfacing. MIT Press; 2007. p. 359-367.
31. Schalk G, Brunner P, Gerhardt LA, Bischof H, Wolpaw JR. Brain–computer interfaces (BCIs):Detection instead of classification. J Neurosci Meth 2008;167(1):51–62.
32. Schalk G, Leuthardt EC, Brunner P, Ojemann JG, Gerhardt LA, Wolpaw JR. Real-time detection ofevent-related brain activity. Neuroimage 2008;43(2):245–249. [PubMed: 18718544]
33. McFarland DJ, McCane LM, David SV, Wolpaw JR. Spatial filter selection for EEG-basedcommunication. Electroenceph Clin Neurophysiol 1997;103(3):386–394. [PubMed: 9305287]
34. Burg JP. A new analysis technique for time scries data, NATO Advanced Study Institute on SignalProcessing: Underwater Acoustics :42–48.Reprinted in [36]
35. Burg JP. The relationship between maximum entropy spectra and maximum likelihood spectra.Geophysics 1972;37:375–376.
Brunner et al. Page 9
Epilepsy Behav. Author manuscript; available in PMC 2010 July 1.
NIH
-PA Author Manuscript
NIH
-PA Author Manuscript
NIH
-PA Author Manuscript
36. Childers, D., editor. Modern Spectrum Analysis. IEEE Press; 1978.37. Berger J. Statistical Decision Theory and Bayesian Analysis. Springer-Verlag. 198538. Engel, J., editor. Surgical Treatment of the Epilepsies. Vol. 2nd Edition. Lippincott Williams &
Wilkins; 1993.39. Penfield, W.; Rasmussen, T., editors. The Cerebral Cortex of Man. MacMillan; New York: 1950.40. Meier JD, Aflalo TN, Kastner S, Graziano MS. Complex organization of human primary motor cortex:
a high-resolution fMRI study. J Neurophysiol 2008;100(4):1800–1812. [PubMed: 18684903]41. Yoshii E, Ginsberg MD, Kelley RE, Chang JY, Barker WW, Ingenito G, Apicella AM, Globus MY,
Duara R, Boothe TE. Asymmetric somatosensory activation with right- vs left-hand stimulation: apositron emission tomographic study. Brain Res 1989;483(2):355–360. [PubMed: 2784991]
42. Chollet F, DiPiero V, Wise RJ, Brooks DJ, Dolan RJ, Frackowiak RS. The functional anatomy ofmotor recovery after stroke in humans: a study with positron emission tomography. Ann Neurol1991;29(1):63–71. [PubMed: 1996881]
43. Colebatch JG, Adams L, Murphy K, Martin AJ, Lammertsma AA, Tochon-Danguy HJ, Clark JC,Friston KJ, Guz A. Regional cerebral blood flow during volitional breathing in man. J Physiol1991;443:91–103. [PubMed: 1822545]
44. Grafton ST, Mazziotta JC, Presty S, Friston KJ, Frackowiak RS, Phelps ME. Functional anatomy ofhuman procedural learning determined with regional cerebral blood flow and PET. J Neurosci1992;12(7):2542–2548. [PubMed: 1613546]
45. Kawashima R, Yamada K, Kinomura S, Yamaguchi T, Matsui H, Yoshioka S, Fukuda H. Regionalcerebral blood How changes of cortical motor areas and prefrontal areas in humans related toipsilateral and contralateral hand movement. Brain Res 1993;623(1):33–40. [PubMed: 8221091]
46. Kawashima R, Roland PE, O' Sullivan BT. Activity in the human primary motor cortex related toipsilateral hand movements. Brain Res 1994;663(2):251–256. [PubMed: 7874508]
47. Kim SG, Ashe J, Georgopoulos AP, Merkle H, Ellermann JM, Menon RS, Ogawa S, Ugurbil K.Functional imaging of human motor cortex at high magnetic field. J Neurophysiol 1993;69(1):297–302. [PubMed: 8433133]
48. Wisneski KJ, Anderson N, Schalk G, Smyth M, Moran D, Leuthardt EC. Unique cortical physiologyassociated with ipsilateral hand movements and neuroprosthetic implications. Stroke 2008;39(12):3351–3359. [PubMed: 18927456]
49. Foerster O. The motor cortex in man in the light of Hughlings Jackson's Doctrines. Brain 1936;59:135–59.
50. Penfield W, Boldrey E. Somatic motor and sensory representation in the cerebral cortex of man asstudied by electrical stimulation. Brain 1937;60:389–443.
Brunner et al. Page 10
Epilepsy Behav. Author manuscript; available in PMC 2010 July 1.
NIH
-PA Author Manuscript
NIH
-PA Author Manuscript
NIH
-PA Author Manuscript
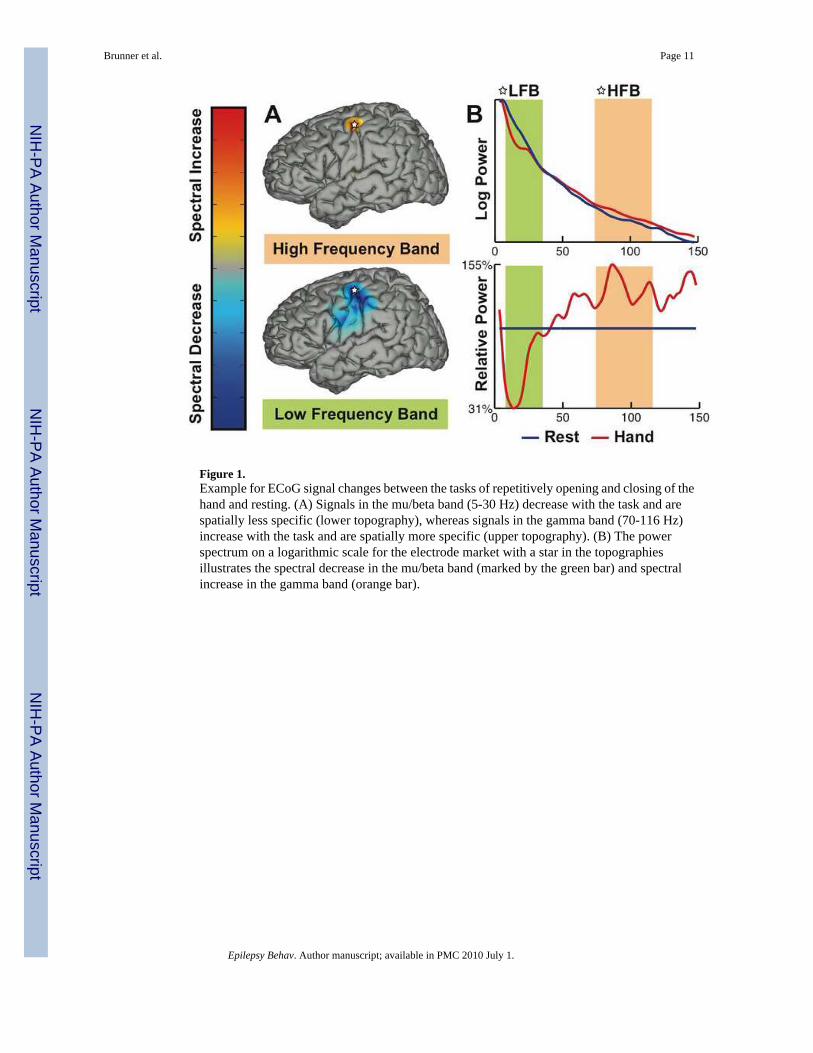
Figure 1.Example for ECoG signal changes between the tasks of repetitively opening and closing of thehand and resting. (A) Signals in the mu/beta band (5-30 Hz) decrease with the task and arespatially less specific (lower topography), whereas signals in the gamma band (70-116 Hz)increase with the task and are spatially more specific (upper topography). (B) The powerspectrum on a logarithmic scale for the electrode market with a star in the topographiesillustrates the spectral decrease in the mu/beta band (marked by the green bar) and spectralincrease in the gamma band (orange bar).
Brunner et al. Page 11
Epilepsy Behav. Author manuscript; available in PMC 2010 July 1.
NIH
-PA Author Manuscript
NIH
-PA Author Manuscript
NIH
-PA Author Manuscript
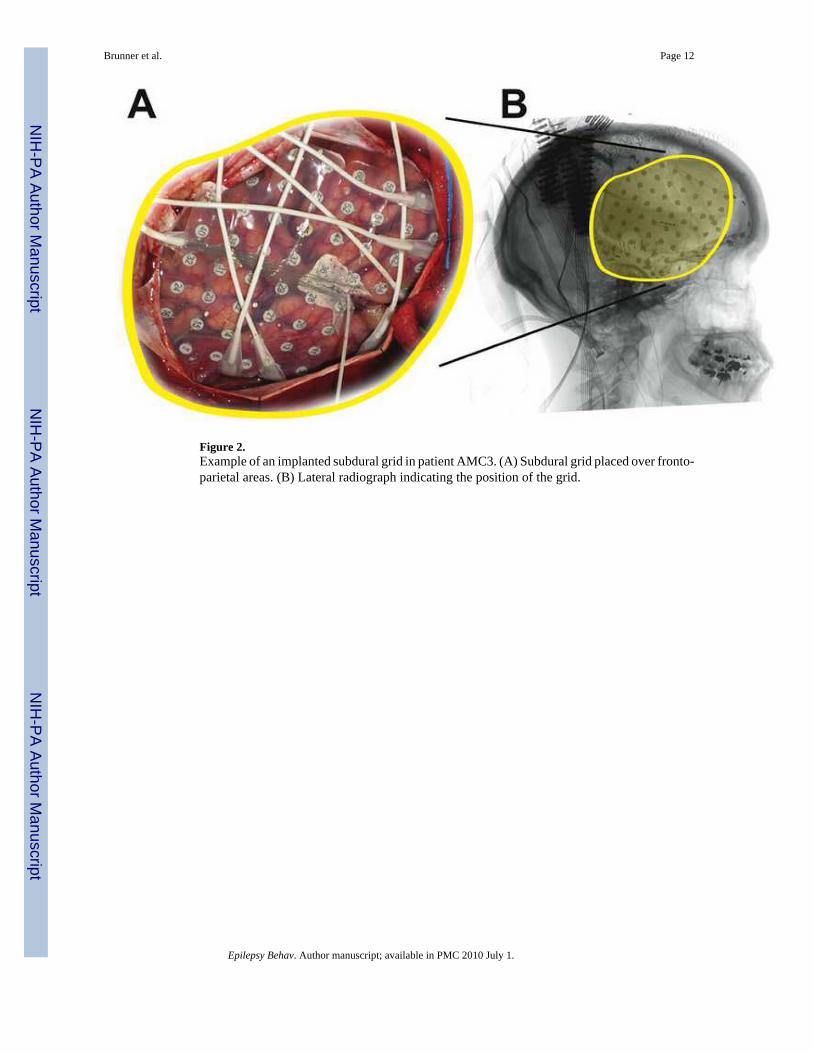
Figure 2.Example of an implanted subdural grid in patient AMC3. (A) Subdural grid placed over fronto-parietal areas. (B) Lateral radiograph indicating the position of the grid.
Brunner et al. Page 12
Epilepsy Behav. Author manuscript; available in PMC 2010 July 1.
NIH
-PA Author Manuscript
NIH
-PA Author Manuscript
NIH
-PA Author Manuscript
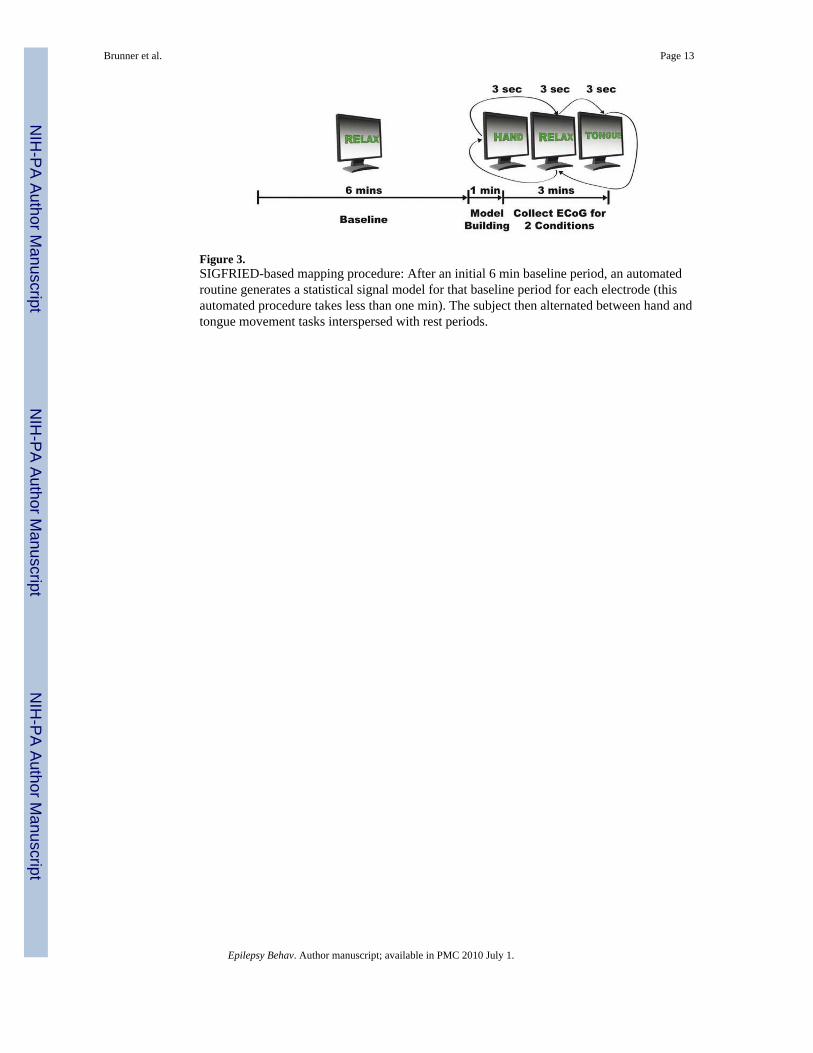
Figure 3.SIGFRIED-based mapping procedure: After an initial 6 min baseline period, an automatedroutine generates a statistical signal model for that baseline period for each electrode (thisautomated procedure takes less than one min). The subject then alternated between hand andtongue movement tasks interspersed with rest periods.
Brunner et al. Page 13
Epilepsy Behav. Author manuscript; available in PMC 2010 July 1.
NIH
-PA Author Manuscript
NIH
-PA Author Manuscript
NIH
-PA Author Manuscript
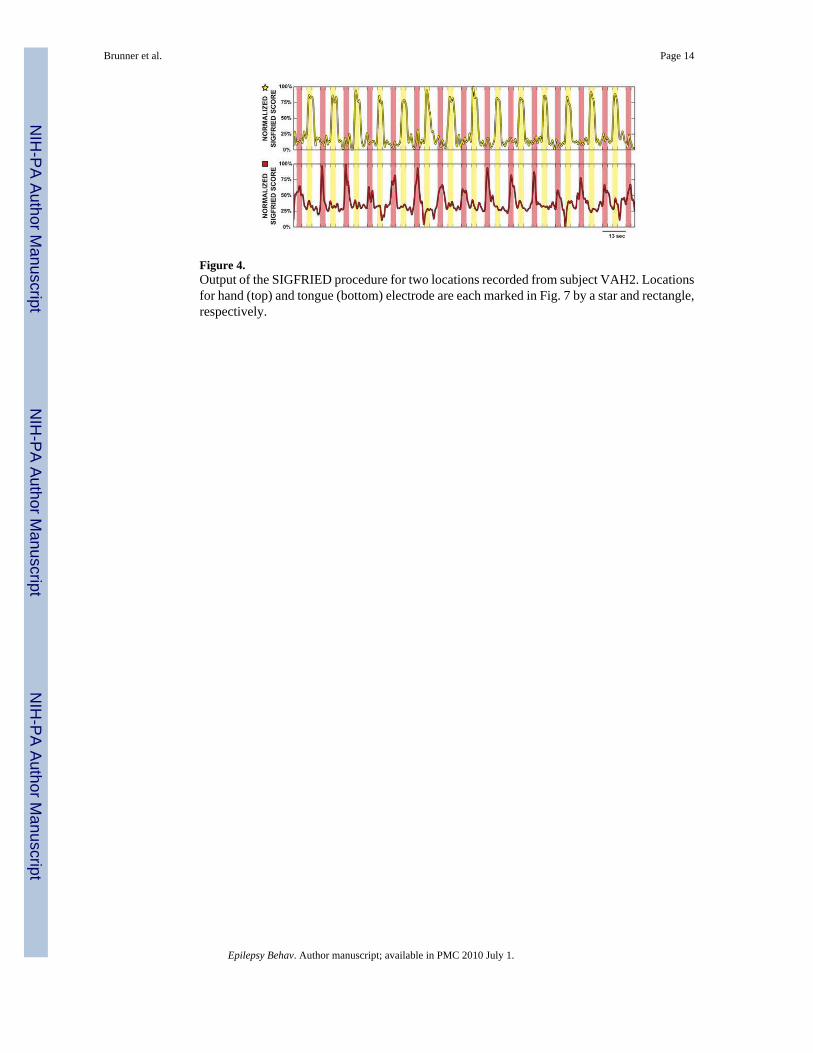
Figure 4.Output of the SIGFRIED procedure for two locations recorded from subject VAH2. Locationsfor hand (top) and tongue (bottom) electrode are each marked in Fig. 7 by a star and rectangle,respectively.
Brunner et al. Page 14
Epilepsy Behav. Author manuscript; available in PMC 2010 July 1.
NIH
-PA Author Manuscript
NIH
-PA Author Manuscript
NIH
-PA Author Manuscript
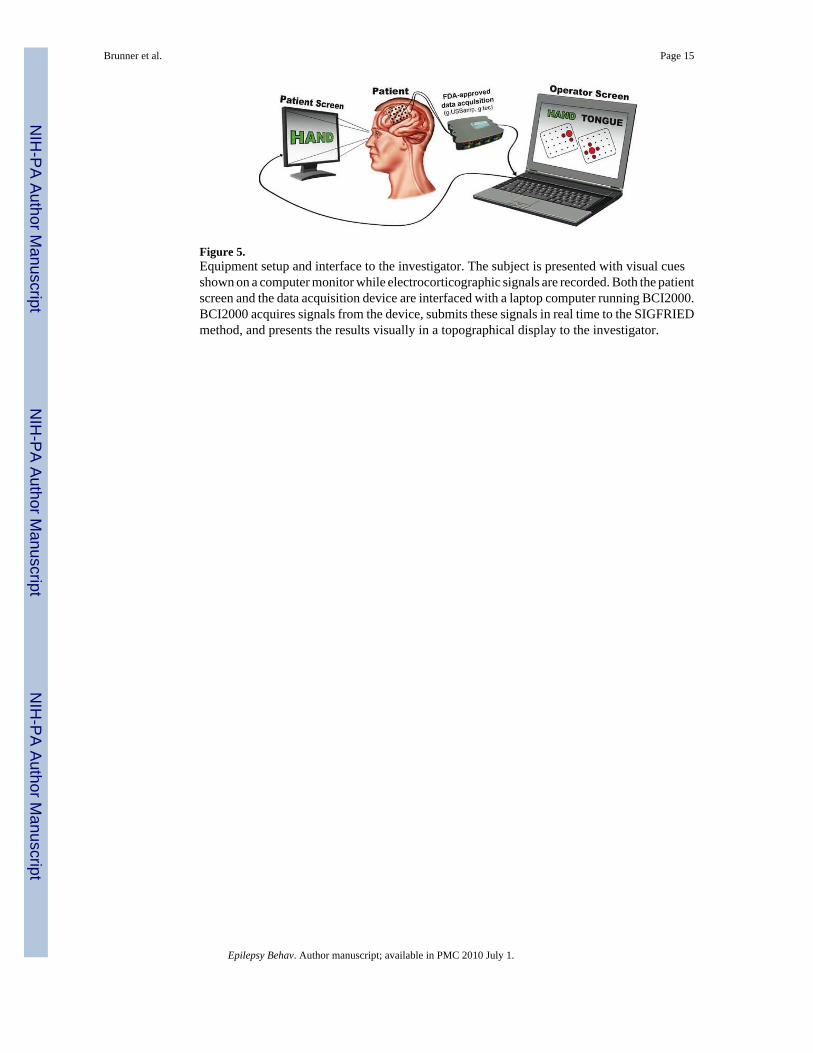
Figure 5.Equipment setup and interface to the investigator. The subject is presented with visual cuesshown on a computer monitor while electrocorticographic signals are recorded. Both the patientscreen and the data acquisition device are interfaced with a laptop computer running BCI2000.BCI2000 acquires signals from the device, submits these signals in real time to the SIGFRIEDmethod, and presents the results visually in a topographical display to the investigator.
Brunner et al. Page 15
Epilepsy Behav. Author manuscript; available in PMC 2010 July 1.
NIH
-PA Author Manuscript
NIH
-PA Author Manuscript
NIH
-PA Author Manuscript
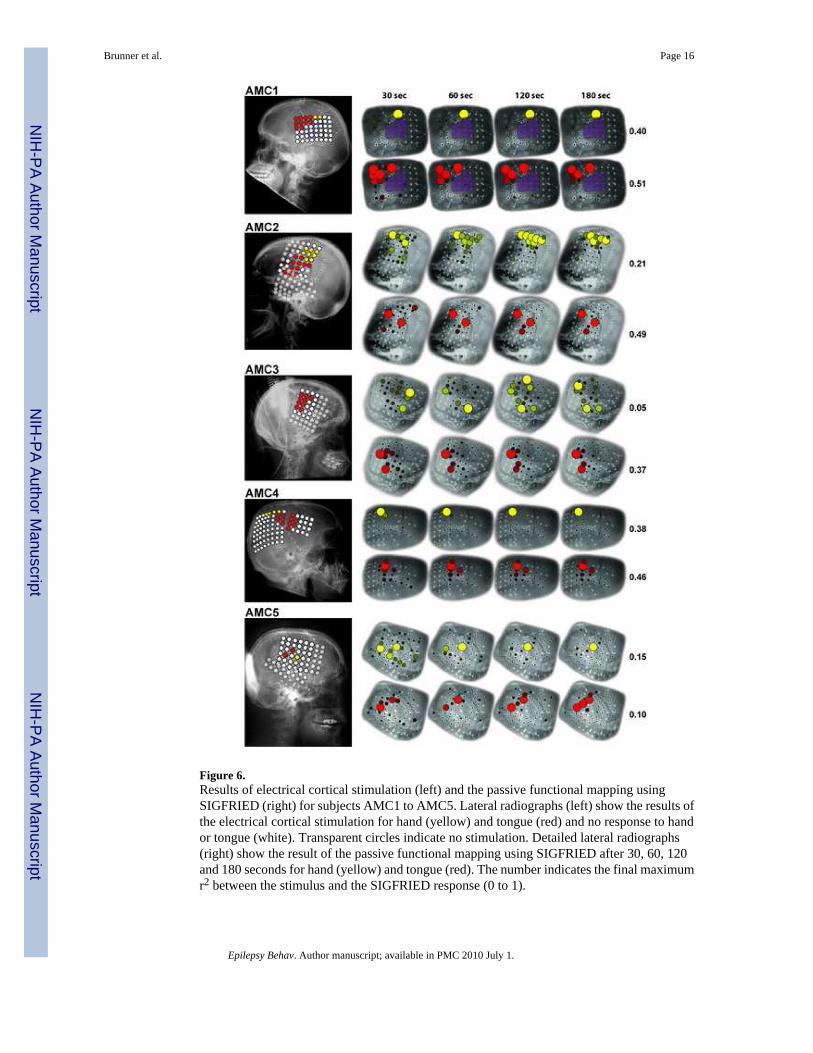
Figure 6.Results of electrical cortical stimulation (left) and the passive functional mapping usingSIGFRIED (right) for subjects AMC1 to AMC5. Lateral radiographs (left) show the results ofthe electrical cortical stimulation for hand (yellow) and tongue (red) and no response to handor tongue (white). Transparent circles indicate no stimulation. Detailed lateral radiographs(right) show the result of the passive functional mapping using SIGFRIED after 30, 60, 120and 180 seconds for hand (yellow) and tongue (red). The number indicates the final maximumr2 between the stimulus and the SIGFRIED response (0 to 1).
Brunner et al. Page 16
Epilepsy Behav. Author manuscript; available in PMC 2010 July 1.
NIH
-PA Author Manuscript
NIH
-PA Author Manuscript
NIH
-PA Author Manuscript
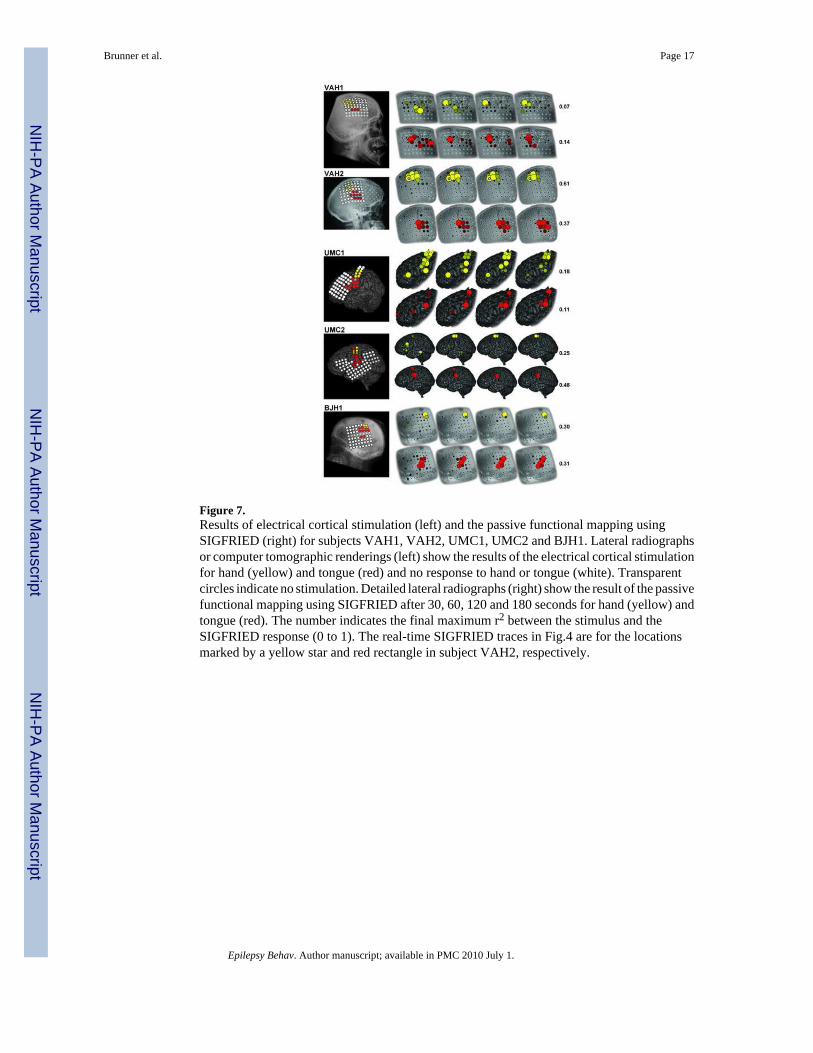
Figure 7.Results of electrical cortical stimulation (left) and the passive functional mapping usingSIGFRIED (right) for subjects VAH1, VAH2, UMC1, UMC2 and BJH1. Lateral radiographsor computer tomographic renderings (left) show the results of the electrical cortical stimulationfor hand (yellow) and tongue (red) and no response to hand or tongue (white). Transparentcircles indicate no stimulation. Detailed lateral radiographs (right) show the result of the passivefunctional mapping using SIGFRIED after 30, 60, 120 and 180 seconds for hand (yellow) andtongue (red). The number indicates the final maximum r2 between the stimulus and theSIGFRIED response (0 to 1). The real-time SIGFRIED traces in Fig.4 are for the locationsmarked by a yellow star and red rectangle in subject VAH2, respectively.
Brunner et al. Page 17
Epilepsy Behav. Author manuscript; available in PMC 2010 July 1.
NIH
-PA Author Manuscript
NIH
-PA Author Manuscript
NIH
-PA Author Manuscript
NIH
-PA Author Manuscript
NIH
-PA Author Manuscript
NIH
-PA Author Manuscript
Brunner et al. Page 18
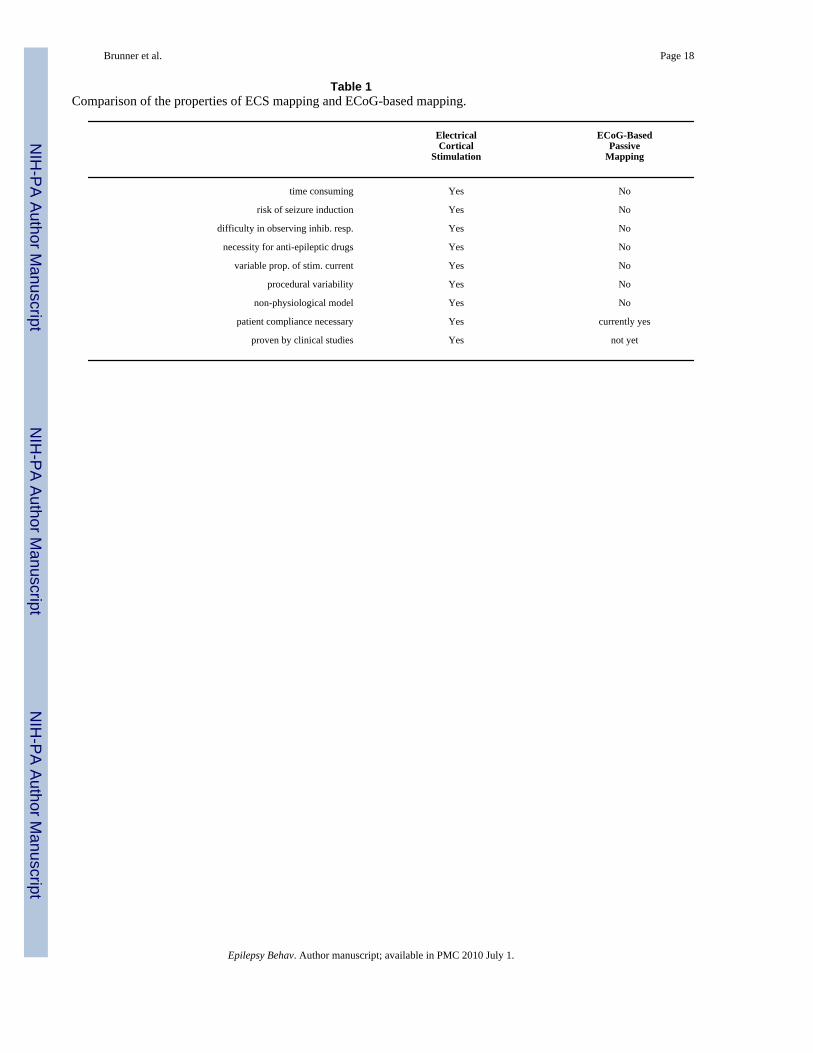
Table 1Comparison of the properties of ECS mapping and ECoG-based mapping.
ElectricalCortical
Stimulation
ECoG-BasedPassive
Mapping
time consuming Yes No
risk of seizure induction Yes No
difficulty in observing inhib. resp. Yes No
necessity for anti-epileptic drugs Yes No
variable prop. of stim. current Yes No
procedural variability Yes No
non-physiological model Yes No
patient compliance necessary Yes currently yes
proven by clinical studies Yes not yet
Epilepsy Behav. Author manuscript; available in PMC 2010 July 1.
NIH
-PA Author Manuscript
NIH
-PA Author Manuscript
NIH
-PA Author Manuscript
Brunner et al. Page 19Ta
ble
2Pa
tient
cha
ract
eris
tics
Subj
ect
Age
Han
dedn
ess
Gen
der
Hem
isph
eric
dom
inan
ce fo
rla
ngua
ge (I
PA)
Full
scal
eIQ
Surg
ery
hem
isph
ere
Sim
ulat
ion
dura
tion
Frac
tion
ofel
ectr
odes
stim
ulat
ed
AM
C1
19rig
htm
ale
N/A
aN
/Ab
left
5 ho
urs
100%
(48/
48)
AM
C2
61rig
htfe
mal
ele
ft95
left
5 ho
urs
71%
(52/
77)
AM
C3
32rig
htfe
mal
ele
ft99
right
4 ho
urs
40%
(24/
48)
AM
C4
29rig
htm
ale
left
94rig
ht3
hour
s10
0% (8
4/84
)
AM
C5
50rig
htm
ale
bila
tera
l10
9rig
ht2
hour
s43
% (3
6/83
)
VA
H1
62rig
htm
ale
left
N/A
crig
ht1.
5 ho
urs
70%
(45/
64)
VA
H2
36rig
htm
ale
left
N/A
drig
ht2.
5 ho
urs
26%
(26/
128)
UM
C1
28rig
htm
ale
left
92le
ft4.
5 ho
urs
93%
(112
/120
)
UM
C2
27rig
htfe
mal
ele
ft69
left
7.5
hour
s69
% (7
2/11
2)
BJH
144
left
fem
ale
bila
tera
l95
left
1.5
hour
s88
% (5
6/64
)
Not
e:
a IPA
was
not
adm
inis
tere
d.
b IQ w
as n
ot te
sted
; pat
ient
com
plet
ed 1
2 ye
ars o
f edu
catio
n.
c IQ w
as n
ot te
sted
; inf
orm
atio
n ab
out e
duca
tion
not a
vaila
ble.
d IQ w
as n
ot te
sted
; pat
ient
com
plet
ed 1
3 ye
ars o
f edu
catio
n.
Epilepsy Behav. Author manuscript; available in PMC 2010 July 1.
NIH
-PA Author Manuscript
NIH
-PA Author Manuscript
NIH
-PA Author Manuscript
Brunner et al. Page 20
Table 3Signal Recording Properties
Subject Channels Sampling Filter Update Rate
AMC1 32 256 Hz 0.1 Hz 32 Hz
AMC2 32 256 Hz 0.1 Hz 32 Hz
AMC3 32 1200 Hz 0.1 Hz 30 Hz
AMC4 32 1200 Hz 0.1 Hz 30 Hz
AMC5 64 1200 Hz 0.01 Hz 15 Hz
VAH1 32 1061 Hz 3-512 Hz 35 Hz
VAH2 64 1061 Hz 3-512 Hz 35 Hz
UMC1 128 512 Hz 0.15-134.4 Hz 16 Hz
UMC1 128 512 Hz 0.15-134.4 Hz 16 Hz
BJH1 64 1200 Hz 0.1 Hz 30 Hz
Epilepsy Behav. Author manuscript; available in PMC 2010 July 1.
NIH
-PA Author Manuscript
NIH
-PA Author Manuscript
NIH
-PA Author Manuscript
Brunner et al. Page 21Ta
ble
4H
ighe
st s
quar
ed c
orre
latio
n (r
2 ) b
etw
een
the
task
and
the
SIG
FRIE
D o
utpu
t and
Min
imum
Bay
esia
n Er
ror b
etw
een
the
resu
lts o
f the
elec
trica
l cor
tical
stim
ulat
ion
and
the
SIG
FRIE
D m
appi
ng.
HA
ND
TO
NG
UE
subj
ect
r2fa
lse
posi
tive
fals
ene
gativ
er2
fals
epo
sitiv
efa
lse
nega
tive
AM
C1
0.40
0.00
%0.
00%
0.51
12.5
0%0.
00%
AM
C2
0.21
4.17
%4.
17%
0.49
12.5
0%12
.50%
AM
C3
N/A
aN
/Aa
N/A
a0.
3716
.67%
11.1
1%
AM
C4
0.38
0.00
%0.
00%
0.46
4.00
%12
.00%
AM
C5
0.15
0.00
%0.
00%
0.10
0.00
%3.
70%
VA
H1
0.07
10.3
5%0.
00%
0.14
10.3
5%0.
00%
VA
H2
0.61
3.57
%0.
00%
0.37
3.57
%0.
00%
UM
C1
0.18
3.33
%1.
67%
0.11
10.0
0%1.
67%
UM
C2
0.25
3.75
%2.
50%
0.48
10.0
0%1.
25%
BJH
10.
303.
57%
1.79
%0.
3110
.71%
0.00
%
aver
age
0.26
3.19
%1.
12%
0.33
9.03
%4.
22%
Not
e:
a The
elec
trica
l cor
tical
stim
ulat
ion
resu
lted
in n
o ha
nd h
its fo
r sub
ject
AM
C3.
Epilepsy Behav. Author manuscript; available in PMC 2010 July 1.

NIH
-PA Author Manuscript
NIH
-PA Author Manuscript
NIH
-PA Author Manuscript
Brunner et al. Page 22Ta
ble
5H
ighe
st s
quar
ed c
orre
latio
n (r
2 ) b
etw
een
the
task
and
the
SIG
FRIE
D o
utpu
t and
Min
imum
Bay
esia
n Er
ror b
etw
een
the
resu
lts o
f the
elec
trica
l cor
tical
stim
ulat
ion
and
the
SIG
FRIE
D m
appi
ng in
a n
ext-n
eigh
bor c
ompa
rison
.
HA
ND
TO
NG
UE
subj
ect
r2fa
lse
posi
tive
fals
ene
gativ
er2
fals
epo
sitiv
efa
lse
nega
tive
AM
C1
0.40
0.00
%0.
00%
0.51
0.00
%0.
00%
AM
C2
0.21
4.17
%0.
00%
0.49
4.17
%0.
00%
AM
C3
N/A
aN
/Aa
N/A
a0.
375.
56%
0.00
%
AM
C4
0.38
0.00
%0.
00%
0.46
0.00
%0.
00%
AM
C5
0.15
0.00
%0.
00%
0.10
0.00
%0.
00%
VA
H1
0.07
0.00
%0.
00%
0.14
0.00
%0.
00%
VA
H2
0.61
0.00
%0.
00%
0.37
0.00
%0.
00%
UM
C1
0.18
0.00
%0.
00%
0.11
0.00
%0.
00%
UM
C2
0.25
0.00
%0.
00%
0.48
1.25
%0.
00%
BJH
10.
300.
00%
0.00
%0.
310.
00%
0.00
%
aver
age
0.26
0.46
%0.
00%
0.33
1.10
%0.
00%
Not
e:
a The
elec
trica
l cor
tical
stim
ulat
ion
resu
lted
in n
o ha
nd h
its fo
r sub
ject
AM
C3.
Epilepsy Behav. Author manuscript; available in PMC 2010 July 1.