Ant Foraging on Plant Foliage: Contrasting Effects on the Behavioral Ecology of Insect Herbivores

A practical algorithm to infer soil and foliage componenttemperatures from bi-angular ATSR-2 data
L. JIA{*, Z.-L. LI{§, M. MENENTI{, Z. SU{, W. VERHOEF} and
Z. WAN{{{ALTERRA Green World Research, Wageningen University and ResearchCentre, PO Box 47, 6700AA Wageningen, The Netherlands;e-mail: [email protected]{TRIO/LSIIT, Universite Louis Pasteur, 5 Bld Sebastien Brant, 67400Illkirch, France;e-mail: [email protected]§Institute of Geographical Sciences and Natural Resources Research, ChineseAcademy of Sciences, Beijing 100101, P.R. China}National Aerospace Laboratory, 8316 PR Marknesse, The Netherlands{{Institute for Computational Earth System Science, University of California,Santa Barbara, USA*Cold and Arid Regions Environmental and Engineering Research Institute(CAREERI) Chinese Academy of Sciences (CAS), Lanzhou 730000, P.R. China
(Received 23 July 2001; in final form 13 December 2002 )
Abstract. An operational algorithm is proposed to retrieve soil and foliagecomponent temperatures over heterogeneous land surface based on the analysisof bi-angular multi-spectral observations made by ATSR-2. Firstly, on the basisof the radiative transfer theory in a canopy, a model is developed to infer thetwo component temperatures using six channels of ATSR-2. Four visible, near-infrared and short wave infrared channels are used to estimate the fractionalvegetation cover within a pixel. A split-window method is developed to eliminatethe atmospheric effects on the two thermal channels. An advanced method usingall four visible, near-infrared and short wave channel measurements at two viewangles is developed to perform atmospheric corrections in those channelsallowing simultaneous retrieval of aerosol opacity and land surface bi-directionalreflectance. Secondly, several case studies are undertaken with ATSR-2 data.The results indicate that both foliage and soil temperatures can be retrieved frombi-angular surface temperatures measurements. Finally, limitations and uncer-tainties in retrieving component temperatures using the present algorithm arediscussed.
1. Introduction
A mixture of soil and vegetation comprises an important category of land
surface over which significant angular variations in thermal infrared radiance (TIR)
are observed (Kimes 1980, Nielsen et al. 1984, Lagouarde et al. 1995). The
architecture of vegetation canopies leads to significant variability of radiative and
convective energy fluxes in the canopy space. The latter implies significant thermal
heterogeneity and, with that, changes of the observed surface temperature with view
International Journal of Remote SensingISSN 0143-1161 print/ISSN 1366-5901 online # 2003 Taylor & Francis Ltd
http://www.tandf.co.uk/journalsDOI: 10.1080/0143116031000101576
INT. J. REMOTE SENSING, 10 DECEMBER, 2003,
VOL. 24, NO. 23, 4739–4760

angle. Studies based on model simulations and field measurements show large
angular variations of the brightness surface temperatures (Kimes 1983, Sobrino and
Caselles 1990, Prevot et al. 1993, Smith et al. 1996), which may be usable to infer
vegetation and soil temperatures (Kimes and Kirchner 1983).
However, angular changes in exitance may be relatively small, so only
observations at very different angles give a signal significantly larger than the
accuracy of observations. This limits to very few the number of significant and
independent angular measurements of exitance, which implies that only very simple
models (i.e. with very few unknowns) can be used to interpret the observations and
to obtain estimates of the component temperatures of vegetation canopies.
The second Along-Track Scanning Radiometer (ATSR-2) on board the European
Remote Sensing (ERS) satellite is currently the only observing system able to
provide quasi-simultaneous multispectral (from visible to TIR) measurements at
two view angles (approximately 0‡ and 53‡ at surface). In addition to three thermal
infrared channels centred at 3.7 mm, 11 mm and 12 mm and one short wave infrared
(SWIR) channel at 1.6 mm, ATSR-2 has three visible-near infrared channels centred
at 0.56 mm, 0.67 mm and 0.87 mm intended for vegetation analysis. Further details of
this instrument can be found on the World Wide Web at http://www.atsr.rl.ac.uk/
software.html. The footprint is 1 km61 km at nadir and 1.5 km62.5 km at 53‡View Zenith Angle (VZA).
Such data provide access to the thermodynamic properties of soil–foliage
mixtures over a larger area of land surface. Improvement of land surface process
models is feasible through the use of the improved visible and near infrared
atmospheric corrections and the separate retrievals of different component (soil and
foliage) temperatures in a pixel (Jia et al. 2001, van den Hurk et al. 2002).
In this study, an operational algorithm is developed to retrieve soil and foliage
temperature over heterogeneous land surface based on the analysis of bi-angular
and multi-channels observations made by ATSR-2. Limitations and uncertainties in
retrieving component temperatures using the present algorithm are discussed
through several case studies.
2. Methodology
2.1. Inversion of a simple linear model of thermal infrared radiation of foliage–soil
mixture
A soil–vegetation system composed of foliage and soil is characterized by large
temperature differences within the canopy space. Besides the ‘angular emissivity’
effects for such system, directionality of TIR radiance will appear because of the
thermal heterogeneity and the three-dimensional (3D) structure of the system. The
surface radiometric temperature measured by a radiometer varies with the zenith
view angle of the radiometer since different proportions of elements fill in the
instantaneous field of view (IFOV) of the sensor at different VZAs.
This anisotropy of exitance, on one hand, leads to a difficulty in obtaining a
reliable surface temperature measurement, but on the other hand, provides an
opportunity to extract component temperatures of the surface elements. The
radiance measured by a radiometer is contributed by the emittances of the targets
viewed in the IFOV of the radiometer (and by the emittance from the
surroundings). Therefore, the radiance measured by a radiometer can be related
4740 L. Jia et al.

to the radiances from each elements by weighing their emittance with the fraction of
IFOV. Considering a canopy system with soil and foliage components, such a
relationship can be expressed by a simple linear radiation transfer model (Li et al.
2001a, Menenti et al. 2001):
B Trad hð Þð Þ~F hð Þef hð ÞB Tf
� �z 1{F hð Þð Þes hð ÞB Tsð Þ, ð1Þ
where B is the Planck function; Trad is the radiometric surface temperature at
ground level; h is the view angle of the radiometer; F(h) is the fractional cover of
foliage; ef (h) is the effective emissivity of foliage; Tf is foliage temperature; (1–F(h))
is the fractional cover of soil; es(h) is the effective soil emissivity; and Ts is soil
temperature. In this inversion model (equation 1), we have assumed that: (1) foliage
has a constant temperature Tf ; (2) both the soil and the foliage surfaces are
Lambertian; and (3) the effective emissivity of soil and foliage are used due to the
consideration of the interaction between vegetation–soil and vegetation–vegetation
(see Li et al. 2001a).
With radiance measurements at two view angles (i.e. obtained by ATSR-2 at
nadir and forward view angles), equation 1 can be rewritten (for a given spectral
range) as two equations for each pixel, making it possible to derive two component
temperatures Ts and Tf . In a previous study (Menenti et al. 2001), we used a
different approach. We used equation 1 for two VZAs and two wavelengths to
retrieve Ts, Tf and LAI. This approach required:
(a) atmospheric correction for each TIR channel and view angle using the
MODTRAN4 code and radiosoundings;(b) an assumption to be made about the values of soil and foliage spectral
emissivities at both wavelengths.
These assumptions made the approach less robust and led to the idea ofdeveloping the algorithm described in this paper.
One should note that in principle there are at least four component
temperatures in the IFOV: (1) sunlit foliage, (2) shadowed foliage, (3) sunlit soil,
and (4) shadowed soil. However, it is impossible to get these four component
temperatures simultaneously from only bi-angular measurements, so multi-angular
observations would be necessary for this purpose. Therefore, the soil and foliage
temperatures obtained using equation 1 should be considered as the effective soil
(the mixture of sunlit and shadowed soil) and effective foliage (the mixture of
sunlit and shadowed foliage) temperatures. Moreover, to reduce the unknowns in
equation 1, the emissivity angular effect has been neglected due to the cavity effects
(Li et al. 2001a) so that es h1ð Þ~es h2ð Þ~es and ef h1ð Þ~ef h2ð Þ~ef .
With these assumptions, the directional radiance measured at ground level
comes only from the emittance of soil and foliage existing in the IFOV in the
direction h:
B Trad hð Þð Þ~F hð Þef B Tf
� �z 1{F hð Þð Þes B Tsð Þ: ð2Þ
Equation 2 is used to infer soil and foliage component temperatures Ts and Tf
provided that the vegetation fractional cover can be estimated from visible and near
infrared reflectances and ef and es are known.
An algorithm to infer soil and foliage component temperatures 4741

2.2. Determination of vegetation fraction cover F(h)To retrieve soil and foliage temperatures from equation 2, the viewing angle-
dependent vegetation fraction needs to be determined independently from
additional observation. Two different approaches were applied in this study to
estimate the fractional vegetation cover using visible and near infrared data. Both
have drawbacks and are based on a set of assumptions, which require evaluation.
Baret et al. (1995) established a semi-empirical relationship between vegetation
fraction and spectral vegetation indices such as NDVI (normalized difference
vegetation index), i.e.
F hð Þ~1{NDVI hð Þ{NDVI hð Þmax
NDVI hð Þmin{NDVI hð Þmax
� �K
, ð3Þ
where NDVI(h)max and NDVI(h)min are the vegetation index after atmospheric
corrections for infinite leaf area index (LAI) and for the bare soil (LAI~0),
respectively. Using a radiative transfer model, these authors found for a sugar beet
crop NDVImin~0.0151, NDVImax~0.8858 and K~0.4631.Another approach to estimate F(h) from surface reflectances ri(hs,h,Dw)) is to
use the stepwise multiple linear regression
F hð Þ~a0 hs,hð ÞzXni~1
ai hs,hð Þri hs,h,Dwð Þ, ð4Þ
where n is the number of channels used in the range of visible to SWIR channels, hsis the solar zenith angle, and Dw is the relative azimuth angle between sun and
satellite direction. The model OSCAR (Verhoef 1998) has been applied to generate
surface reflectances for the viewing and illumination conditions applying to the
ATSR-2 observations used in this study and to an ensemble of canopy and
atmospheric conditions. OSCAR stands for Optical Soil-Canopy-Atmosphere
Radiance and is a coupled model based on four-stream radiative transfer theory. It
includes the model SAILH (i.e. the SAIL model with the hot spot effect modelled
according to Kuusk (1985)) and a simple model of atmospheric bi-directional
scattering. The OSCAR model includes the atmospheric adjacency effect and
therefore the properties of the surroundings of the target pixel need to be specified.
Strictly speaking OSCAR is not a turbid medium model, as in SAILH the
hot spot effect related to the finite leaf size is modelled. Clumped vegetation
cannot be modelled using SAILH. Reflectances in the three optical bands (green,
red and NIR) were simulated for nadir view and a VZA of 53‡. The relative
azimuth angle between the sensor and the sun was roughly estimated to be equal
to 120‡.It should be noted that the coefficients ai in equation 4 apply to the ensemble of
conditions simulated with OSCAR. These conditions comprise the variation over
ten LAI values, three leaf inclination distribution function (LIDF), four hot spot
parameters, four types of leaf, four types of soil, four surroundings which consist of
a simple description of the terrain surrounding the target, three atmospheric
visibilities and five solar zenith angles. The LAI values range from 0 to 6. The three
LIDFs are representative for moderately planophile (most leaves having 25‡inclination), plagiophile (most leaves having 45‡ inclination) and moderately
erectophile (most leaves having 65‡ inclination) canopies, respectively. The hot spot
size parameter q is the ratio of the horizontal correlation length of leaf projections
4742 L. Jia et al.

and the height of the canopy layer. The series of q values are taken as 0.05, 0.10,
0.20 and 0.50. Spectrally different leaf types were taken from the literature
(Gausman et al. 1978). Spectral reflectance data of four soil types were taken
from atmospherically corrected Landsat Thematic Mapper (TM) images of the
Netherlands (1986), supplemented with data for the spectral band at 1250 nm.
The three atmospheric visibility conditions were taken as 5 km, 10 km, and 40 km
(see Verhoef 1998, Verhoef and Menenti 1998, Verhoef 2001 for details).
For all combinations of the above conditions (115 200 cases in total) the
reflectance was computed in the three ATSR-2 bands in the two directions, at the
surface level. Table 1 gives the values of regression coefficients between the surface
reflectance and the fractional vegetation cover (see equation 4 at the different solar
zenith angles (hs) and the correlation coefficient R2 which is the measure of the
quality of parameter retrieval. The coefficients in table 1 are then interpolated to
each ATSR-2 pixel according to the solar zenith angle for each pixel.
3. Atmospheric corrections3.1. Column water vapour determination
Column water vapour content in the atmosphere plays an important role in
atmospheric corrections in the visible, NIR and thermal infrared channels. Because
water vapour varies rapidly in time and space, the radiosoundings made at one
place and at one time are generally not representative for the whole image. It is
therefore desirable to retrieve water vapour content directly from satellite data.
Several methods have been proposed and developed for different instruments
(Klesspies and McMillin 1990, Sobrino et al. 1994). An operational algorithm of
deriving water vapour content from two thermal channels of ATSR-2 has been
developed by Li et al. (2001b) and is used in this study.
3.2. Atmospheric corrections in thermal infrared channels
To obtain the surface temperature at the bottom of atmosphere (BOA),
atmospheric correction is needed for the correction of the atmospheric effects on
the radiance measured at the top of atmosphere (TOA). Following the procedure
developed by Becker and Li (1995), a general split-window (SW) algorithm
Table 1. The regression coefficients in the stepwise multiple linear regression (equation 4)generated by OSCAR model at different solar zenith angle (hs). R2 is the squaredcorrelation coefficient of the F(h) values (known a priori) with the values estimated bythe multiple regression model.
hs(‡) a 0 a 1 a 2 a 3 R 2
F(nadir) 15 0.1684 0.94 23.79 1.46 92.030 0.1550 0.92 23.84 1.51 92.345 0.1239 0.90 23.79 1.58 92.760 0.0762 0.69 23.53 1.67 93.075 0.0388 0.19 23.12 1.75 92.6
F( Forward ) 15 0.2213 1.05 24.26 1.50 90.330 0.2045 1.02 24.21 1.54 91.245 0.1660 0.98 24.05 1.59 92.660 0.1066 0.80 23.67 1.65 93.775 0.0447 0.38 23.14 1.71 93.9
An algorithm to infer soil and foliage component temperatures 4743

depending explicitly on the total column water vapour content in the atmosphere
(W) is derived for ATSR-2 nadir and forward views:
Trad hð Þ~ a hð Þzb hð ÞW½ �z c hð Þzd hð ÞW½ �T11 hð Þz e hð Þzf hð ÞW½ � T11 hð Þ{T12 hð Þ½ �, ð5Þwhere Trad is the brightness surface temperatures at the ground level; h is the zenith
view angle of ATSR-2; and T11 and T12 are the brightness temperatures at TOA
measured by ATSR-2 at 11 mm and 12 mm channels, respectively. First a large range
of surface and atmospheric conditions is taken as a reference scenario: Wf4.5/g cm{2,
air temperature near surface Ta, 272 KfTaf311 K and 25 KfTrad2T2af15 K.
Next the T11 and T12 at TOA are computed using the radiative transfer model
MODTRAN 4 for each combination of these variables, obtaining a synthetic
dataset. Finally the coefficients a–f in equation 5 are determined by a multi-linear
regression analysis. This was done separately for the ATSR-2 nadir and forward
views (see table 2).
3.3. Atmospheric corrections in visible and near infrared channel
Atmospheric perturbations (mainly due to absorption and scattering processes)
are responsible for substantial modifications of the surface spectral reflectance
measured by satellite instruments. It is therefore necessary to correct for the
atmospheric effects to retrieve the surface reflectance. Methods of atmospheric
correction are generally concerned with the estimation of the atmospheric effects
associated with molecular absorption, molecular and aerosol scattering. Current
methods for estimation of atmospheric effects employ a radiative transfer model
(Vermote et al. 1997, Beck et al. 1999) whose inputs are generally the vertically
integrated gaseous contents, aerosol optical properties and geometric conditions.
If r�i is the reflectance measured in channel i at the top of atmosphere (TOA),
from radiative transfer theory, the surface reflectance in channel i, ri, can be
expressed as (Rahman and Dedieu 1994, Vermote et al. 1997):
ri hs,h,Dwð Þ~ raci hs,h,Dwð Þ1zSir
aci hs,h,Dwð Þ , ð6Þ
where Si is the spherical albedo of atmosphere in channel i; tgi is the total gaseous
transmission in channel i associated with gaseous absorption along the sun–target–
sensor atmospheric path; rai hs,h,Dwð Þ is the atmospheric reflectance; and ti(hs) and
ti(h) are the total atmospheric transmittance along the sun–target and target–sensor
atmospheric paths, respectively.In general, the independent measurements of atmospheric composition and
aerosol optical properties are not available; it is therefore desirable to derive them
directly from satellite data. The most important gases for atmospheric correction in
the visible and near infrared channels are water vapour and ozone. Water vapour
Table 2. The coefficients of split-window method (equation 5) to invert surface temperaturefrom ATSR-2 thermal infrared channels at nadir and forward view angles. s is theroot mean square difference (RMSD) of surface temperature retrieval.
a b c d e f s (K)
Nadir 24.89 3.74 1.0205 20.0151 0.916 0.509 0.10Forward 214.41 8.51 1.0582 20.0343 0.565 0.857 0.24
4744 L. Jia et al.

content in the atmosphere may be derived from the two split-window channel
measurements as shown in §3.1, and ozone content is taken from climatological
data. As for the determination of the aerosol optical properties, if the surface
reflectance may be considered isotropic, then the difference in surface reflectance
retrieved from multi-angle directions using equation (6) may be used to derive the
atmospheric optical thickness if aerosol type is assumed. However, most land
surfaces are far from Lambertian (Hapke 1981). With multi-angle measurements, it
is imperative to consider non-Lambertian reflectance. Several multi-look aerosol
retrieval schemes for ATSR-2 have been proposed (Flowerdew and Haigh 1997,
Mackay and Steven 1998, North et al. 1999). The simplest relies on the assumption
that the functional shape of the bidirectional effects is invariant with respect to the
wavelength within the visible and NIR region (Flowerdew and Haigh 1997, Mackay
and Steven 1998, North et al. 1999).
ri h1ð Þri h2ð Þ~
rj h1ð Þrj h2ð Þ ð7Þ
This relationship gives a constraint for atmospheric correction by forcing the
retrieved at-surface bidirectional reflectances in channels i and j to have a consistent
angular variation, even though the magnitude of the reflectance in two channels
may be very different.
The aerosol optical thickness is therefore obtained through the minimization of
the error matrix function:
E~Xni~1
Xnj>i
ri h1ð Þri h2ð Þ{
rj h1ð Þrj h2ð Þ
!2
, ð8Þ
where i and j are channel numbers and n is the total number of channel used (nf4
for ATSR-2).
4. Operational implementation
To apply the inversion model described above to ATSR-2 multi-spectral and
bi-angular measurements, several pre-processing steps are needed to obtain the input
variables required in equation 2. For instance, the ATSR-2 measures radiance at
TOA, which includes the atmospheric effects. Atmospheric corrections are needed
to obtain the BOA values for each channel measurement. A general scheme of the
ATSR-2 data processing procedures is shown in figure 1, composed of eight steps.
4.1. Cloud and water surface screening
The cloud screening algorithm is based on the threshold method proposed by
Saunders and Kriebel (1988) and is adapted to ATSR-2. Threshold values are
subjectively determined for each image based on ATSR-2 visible and infrared data.
Moreover, pixels in which the TIR sensors are saturated (approximately w319 K)
are screened. Finally water pixels are screened out, since the separation of soil and
foliage temperatures is not relevant in these cases.
4.2. Water vapour determination
After the cloud and water screening procedures, a box size of m6n (N~m6n)
has to be defined so that the algorithm developed by Li et al. (2001b) to retrieve
An algorithm to infer soil and foliage component temperatures 4745

water vapour content can be applied to each box area. The choice of the box size is
somewhat arbitrary. In the current study, the size of the box was 10610 (N~100)
pixels. Readers interested in the detailed procedures are referred to Li et al. (2001b).
4.3. Retrieval of aerosol optical depth
Retrieval of the aerosol optical depth is performed by aggregating the top of
atmosphere data for a box of 10610 pixels to minimize noise and the effect of
misregistration between the two views and to reduce the computing time. Given an
initial estimate of aerosol optical depth at 550 nm, ta550, the water vapour content W
retrieved as described in §4.2 and the climatological ozone content, initial estimates
of land surface reflectances are obtained by inversion of atmospheric model 6S
(Second Simulation of the Satellite Signal in the Solar Spectrum; Vermote et al.
1997) for each set of ATSR-2 observations. The degree of fit of this set of
reflectances to the land surface bi-directional reflectance model (equation 7) gives an
error matrix as shown in equation 8, which is minimized using the Levenberg-
Marquardt algorithm (Press et al. 1989) with simple bounds on variables
(0:1¡ta550¡0:7, 0frif1.0).
Figure 1. The scheme of the operational algorithm for retrieval of Tf (foliage temperature)and Ts (soil temperature) from ATSR multi-spectral and dual-angular measurements.Tb: brightness surface temperature at TOA measured by TIR channels of ATSR-2; r:reflectance at TOA measured by VIS/NIR/SWIR channels of ATSR-2; Trad : surfacetemperature at BOA.
4746 L. Jia et al.

4.4. Atmospheric corrections in the visible and near infrared channels
Knowing the water vapour content (W ) and aerosol loading (ta550) in the
atmosphere, the atmospheric correction is performed on a pixel by pixel basis to get
the land surface reflectances at the BOA for all visible and near infrared channels
and for all viewing angles. It should be noted that for pixels which are assessed as
cloud-free, but where water vapour and aerosol loading cannot be retrieved,
atmospheric correction is performed with the mean water vapour content and mean
aerosol loading over the whole image.
4.5. Estimation of fractional vegetation cover
Estimation of fractional vegetation cover is performed on a pixel-by-pixel basis
using either equation 3 or equation 4. Equation 3 is calculated using values of NDVImin
and NDVImax determined for each image, i.e., as the minimum and maximum
values of the atmospherically corrected NDVI image. The values obtained in this
way (which will be shown in the later section) were different from the values given
by Baret et al. (1995).
We used the functional form, i.e. the same value of K, of the relationship (see
equation 3) given by Baret et al (1995) but we did not use the theoretical limit
values of NDVI given by them for two reasons:
(1). The ATSR-2 spectral channels (see website at: http://www.atsr.rl.ac.uk/
documentation/docs/userguide/index.shtml) differ in position and band-
width from the spectral channels chosen by Baret et al (1995); this
difference has an impact on the NDVImin and NDVImax values;(2). The values given by Baret et al (1995) were obtained by model calculations
on the basis of assumed spectral reflectances for green leaves and soil which
may be different from those in the study areas. For the area with yellow
and brown leaves, for instance, fractional vegetation cover may be
relatively high while the values of NDVI remain relatively smaller.
4.6. Atmospheric corrections in thermal infrared channels-split window method
Given the water vapour content in the atmosphere, surface brightness tempera-
ture Trad is directly derived on a pixel-by-pixel basis with equation 5 for both nadir
and forward views. As in step 4.4, for clear pixels within the box in which water
vapour content is not available, the mean water vapour content in the whole image
is used in equation 5.
4.7. Smoothing
The bi-angular ATSR-2 observations may be affected by co-registration errors
and by the different footprint between nadir and forward views. To reduce the
impact on the soil and foliage temperature separation, a local moving window filter
of 565 pixels for the nadir image and of 363 pixels for the forward view image
were applied over the whole image. Window size was chosen taking into account
the different spatial resolution of nadir and forward views (1 km61 km for nadir
view, 1.5 km62 km for forward view).
An algorithm to infer soil and foliage component temperatures 4747
4.8. Separation of soil and foliage component temperatures
Soil and foliage component temperatures are derived from two surface
brightness temperatures Trad (equation 2), using the Levenberg-Marquardt algorithm
(Press et al. 1989) with simple bounds on variables. Cases with full vegetation cover
and bare soil are treated separately. Radiometric temperature of homogeneous
targets is retrieved in these cases.
Retrieval of soil and foliage temperatures is not performed in the following
abnormal situations: (a) the difference of surface brightness temperatures for nadir
and forward view, Trad(nadir)–Trad ( forward ) is too large (w7.5 K for instance); or
(b) the difference of surface brightness temperatures is inconsistent with the
difference of vegetation fraction covers.
Initial values of soil and foliage temperatures are taken from the approximate
solution of equation 2 with B(T)>sT4, the lower and upper bounds for Ts and Tf
are their initial values minus and plus 5 K, respectively. If the initial values given by
the approximate solution of equation 2 are too high for Ts and too low for Tf , Tf is
re-initialized by Trad (forward)25K and Ts is re-initialized by Trad (nadir)z10K.
Finally equation 2 is solved to obtain Ts and Tf .
5. Results and discussions
The procedures described above have been applied to six images of ATSR-2
over Spain (five images) and USA/SGP97 (one image of the South Great Plain,
1997) study areas.
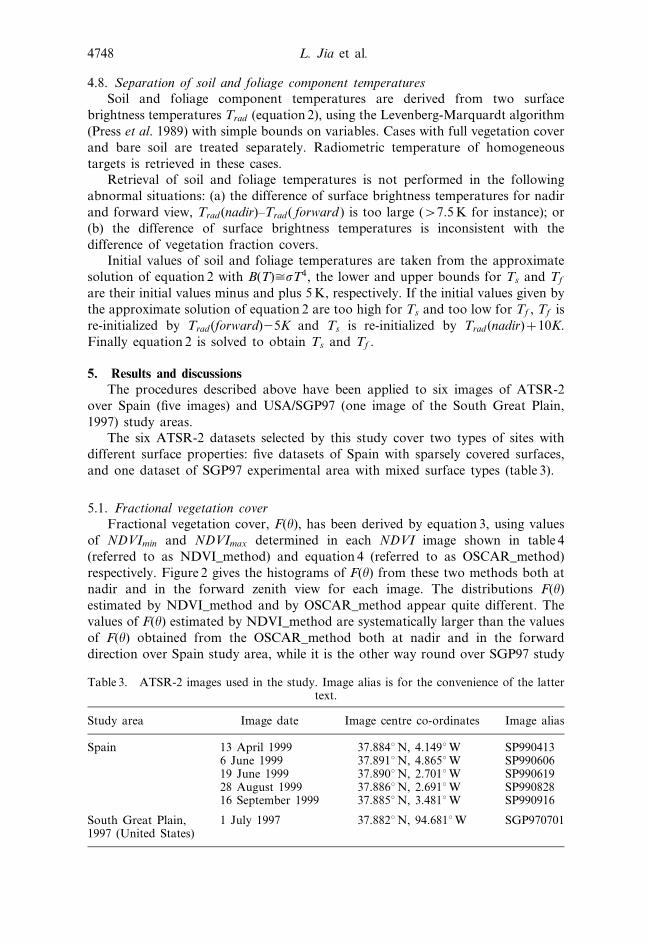
The six ATSR-2 datasets selected by this study cover two types of sites with
different surface properties: five datasets of Spain with sparsely covered surfaces,
and one dataset of SGP97 experimental area with mixed surface types (table 3).
5.1. Fractional vegetation cover
Fractional vegetation cover, F(h), has been derived by equation 3, using values
of NDVImin and NDVImax determined in each NDVI image shown in table 4
(referred to as NDVI_method) and equation 4 (referred to as OSCAR_method)
respectively. Figure 2 gives the histograms of F(h) from these two methods both at
nadir and in the forward zenith view for each image. The distributions F(h)
estimated by NDVI_method and by OSCAR_method appear quite different. The
values of F(h) estimated by NDVI_method are systematically larger than the values
of F(h) obtained from the OSCAR_method both at nadir and in the forward
direction over Spain study area, while it is the other way round over SGP97 study
Table 3. ATSR-2 images used in the study. Image alias is for the convenience of the lattertext.
Study area Image date Image centre co-ordinates Image alias
Spain 13 April 1999 37.884‡N, 4.149‡W SP9904136 June 1999 37.891‡N, 4.865‡W SP99060619 June 1999 37.890‡N, 2.701‡W SP99061928 August 1999 37.886‡N, 2.691‡W SP99082816 September 1999 37.885‡N, 3.481‡W SP990916
South Great Plain,1997 (United States)
1 July 1997 37.882‡N, 94.681‡W SGP970701
4748 L. Jia et al.

area (figure 3). Table 5 gives the root mean square difference (RMSD) in estimated
F(h) between the NDVI_method and the OSCAR_method for the six images listed
in table 3.
At the current stage, it is difficult to evaluate which method would give more
accurate values of F(h) without knowing precisely the surface characteristics in a
pixel. The NDVI_method (equation 3) is semi-empirical, may not be adequate to
the land surface where no bare soil (or no fully vegetated) patches corresponding to
the minimum (or maximum) value of NDVI occur. The OSCAR_method has a
robust physical basis. The regression coefficients determined with the OSCAR_
method (equation 4), however, are generated based on vegetation with green leaves,
which may not be appropriate to vegetation with yellow leaves, likely to occur in
most of the area in Spain, especially in the season with a large fraction of dry
yellow vegetation. The regression coefficients might have been more representative
if they had been produced from a specific database designed to be closer to the
actual situation.
5.2. Soil and foliage temperature
Soil and foliage component temperatures are derived from equation 2 with
vegetation cover, F(h), estimated using both equations 3 and 4 for comparison.
Effective soil and foliage emissivity are needed to solve Tf and Ts from equation 2.
According to Li et al. (2001a), these values are simply taken as es~0.97 and
ef~0.99. Variability of ef in the ATSR spectral bands used in this study is very
limited and our assumption does not lead to large errors. Changes in es are
somewhat larger, although still rather small and different values might be used if
available. Figure 4 shows the histograms of Tf and Ts retrieved with different
methods to estimate vegetation cover (equations 3 and 4).
Large differences exist both in the retrieved Tf and in Ts when F(h) are
determined using NDVI_method and OSCAR_method, respectively (figure 5). The
biases are significant for retrieval of Tf in Spain study area (figure 5a). Table 6 gives
the RMSD of retrieved Tf (and Ts) using different methods to estimate F(h).
As discussed by Li et al. (2001a), the inversion model, e.g. equation 1, is
sensitive to the accuracy of fractional vegetation cover, particularly to the dif-
ference in fractional vegetation cover between the nadir and the forward footprint.
The sensitivity of Tf and Ts to fractional vegetation cover can be expressed as
Table 4. Values of NDVI for infinite leaf area index (LAI) and for the bare soil (LAI~0)determined from surface reflectance obtained from ATSR measurements as describedin the text.
Images
Nadir Forward
NDVImax NDVImin NDVImax NDVImin
SP990413 0.74 0.08 0.83 0.17SP990606 0.76 0.08 0.82 0.15SP990619 0.64 0.09 0.79 0.14SP990828 0.65 0.07 0.77 0.09SP990916 0.64 0.07 0.79 0.10SGP970701 0.94 0.31 0.95 0.34Baret et al. 1995 0.886 0.015
An algorithm to infer soil and foliage component temperatures 4749

Figure 2. Histograms of fractional vegetation cover estimated using NDVI_method andOSCAR_method for six studied images: (a) for nadir view; (b) for forward view.
4750 L. Jia et al.

Figure 3. Histograms of the difference between F(h) estimated by NDVI_method(equation 3) and that by OSCAR_method (equation 4) for nadir and forward views.
An algorithm to infer soil and foliage component temperatures 4751

respectively:
LTf
LT nadirð Þ
��������~ Ts{Tf
� �: F forwardð Þ{1
F forwardð Þ{F nadirð Þ
�������� ð9aÞ
LTf
LF forwardð Þ
��������~ Ts{Tf
� �: 1{F nadirð ÞF forwardð Þ{F nadirð Þ
�������� ð9bÞ
LTs
LF nadirð Þ
��������~ Ts{Tf
� �: F forwardð ÞF forwardð Þ{F nadirð Þ
�������� ð9cÞ
LTs
LF forwardð Þ
��������~ Ts{Tf
� �: {F nadirð ÞF forwardð Þ{F nadirð Þ
��������: ð9dÞ
Therefore, under a certain difference of F at nadir and in the forward view, the
smaller the values of F( forward ) (or F (nadir)), the larger are errors of Tf due to the
errors of F (nadir) (or F( forward )) according to equation 9a and equation 9b. That
is to say, at lower fractional vegetation cover, larger errors may result in Tf
retrieval. Meanwhile, at higher fractional vegetation cover, larger errors may occur
in Ts retrieval according to equation 9b and equation 9d. Since the Spain study area
has lower F values, i.e. lower than 20% exist in most of the area, retrieval of Tf is
thus more sensitive to the error of F.
5.3 Averages of Tf and Ts over NWP model grid
We have previously explored (van den Hurk et al. 2002) the application of the
component temperatures as inputs of numerical weather prediction (NWP) models
such as the one developed at European Center for Medium-range Weather Forecast
(ECMWF), so that such models can be improved by taking into account grid
heterogeneity of land surface. Grid averaged values of Tf and Ts are needed to meet
such requirements.
Grid averaged values from the two methods have been analysed by averaging
F(h), Tf and Ts over each grid (25 km625 km) of the NWP model in the Spain
study area. Again, F(h) derived from NDVI empirical formulation is larger than the
one from the simulation method, OSCAR_method (figure 6). However, it is worth
noting that the retrievals of Tf and Ts show quite similar values when using either
one of the two methods to derive F(h) (figure 7). The values of RMSD for F(h), Tf
and Ts are given in table 7.
Compared with the values of RMSD of F(h), Tf and Ts at pixel level, the values
of RMSD of F(h), Tf and Ts averaged over a NWP grid become smaller. The errors
Table 5. The RMSD of the difference between F(h) estimated by NDVI_method(equation 3) and that by OSCAR_method (equation 4) for nadir and forward views.
Images RMSD of F(nadir) (%) RMSD of F( forward ) (%)
SP990413 6.3 9.1SP990606 5.5 6.7SP990619 5.9 6.6SP990828 7.5 7.9SP990916 6.9 7.2SGP970701 9.7 10.7
4752 L. Jia et al.

Figure 4. Histograms of (a) Tf and (b) Ts over each study area. F_NDVI denotesF(h) estimated by NDVI_method; while F_OSCAR means F(h) estimated byOSCAR_method.
An algorithm to infer soil and foliage component temperatures 4753

on Tf and Ts over a grid are reduced as much as about 1.5–2 times (see tables 6 and
7). This implies that uncertainty in determination of fractional vegetation cover at
ATSR-2 pixel scale may not greatly affect the statistics of Tf and Ts over a grid of
Figure 5. Histograms of the difference of (a) Tf and (b) Ts between using NDVI_methodand the OSCAR_method to determine F(h).
4754 L. Jia et al.

NWP. Although the accuracies of the retrieved Tf and Ts still need to be
investigated, the use of the component temperatures in NWP model is quite
promising. A preliminary case study has been done by employing these two
component temperatures in a newly developed multi-component land surface
Table 6. The RMSD of retrieved Tf and Ts when using NDVI_method and OSCAR_method,respectively, to estimate F(h).
Figure 6. Comparison of the average of fractional vegetation cover at nadir derived fromNDVI empirical method (equation 3) and the OSCAR simulation method (equation 4) overNWP sub-grid. F(nadir)_NDVI: F(nadir) derived using NDVI empirical method;F(nadir)_OSCAR: F(nadir) derived using the OSCAR model simulation method.
Images RMSD of Tf (K) RMSD of Ts (K)
SP990413 3.23 3.23SP990606 3.45 2.18SP990619 3.47 2.80SP990828 3.76 2.91SP990916 3.87 2.98
SGP970701 3.11 3.11
An algorithm to infer soil and foliage component temperatures 4755

parameterization scheme (van den Hurk et al. 2002), in which improvements in the
estimation of surface energy balance have been obtained.
5.4 Validation
The validation of the retrieved component temperatures is challenging due to
the difficulty of obtaining observations of temperatures of soil and foliage in situ at
Figure 7. Comparison of the average of Tf (Ts) over NWP sub-grid obtained using differentmethods to derive fractional vegetation cover. Tf _NDVI (Ts_NDVI ): F(h) fromNDVI semi-empirical formula; Tf _OSCAR (Ts_OSCAR): F(h) from the OSCARmodel simulation method.
Table 7. The RMSD of F(nadir), Tf and Ts over NWP grid due to different methods(equations 3 and 4) used to estimate F(h).
Imagery RMSD of F(nadir) (%) RMSD of Tf (K) RMSD of Ts (K)
SP990413 6.0 1.51 1.25SP990606 5.3 1.91 1.18SP990619 5.7 2.23 1.58SP990828 6.8 2.60 1.59SP990916 6.5 3.00 1.70
4756 L. Jia et al.

An algorithm to infer soil and foliage component temperatures 4757

ATSR-2 spatial resolution. Some authors have found through experiments that
leaves of most crops were essentially close to the air temperature (Miller and
Saunder 1923, Ehrler 1973). Following these conclusions, the results are roughly
validated by comparing the derived Tf with the air temperature in our study
(figure 8). In the Spain area, several meteorological stations which are located in the
images are selected as the reference sites. In SGP97 area, two sites (CF01 and
CF02) are chosen as the reference sites. The air temperatures at meteorological
stations were measured at a height of 2 m, while at the two SGP97 experimental
sites air temperature was measured at heights of 0.96 and 1.96 m at site CF01 and
3 m at site CF02, respectively. The reference air temperature for SGP97 area is
taken as the mean between two measurements before and after ATSR-2 passing
time over the two reference sites. In figure 8, the values of retrieved Tf and Ts are
the average over 565 pixels around each reference site. The error bars indicate the
standard deviations of Tf averaged over 565 pixels.
As shown in figure 8, the values of Tf are in agreement with the air temperatures
at most of the reference sites. Discrepancy is larger at few sites. It is not surprising
to observe some differences between Tf and air temperature. Several environmental
influence factors, such as radiation, convection and transpiration, affect Tf . Larger
differences between foliage and air temperature were noted both from measure-
ments and modelling results (see Jackson 1982).Measurements of directional TIR and component temperatures at higher spatial
resolution are needed to accomplish more accurate validation of the retrieved
component temperatures.
7. ConclusionsThis study developed a practical algorithm to derive component temperatures of
soil and foliage using multi-spectral and dual-view angle measurements made by
ATSR-2. The results appear to be encouraging. The fractional vegetation cover is a
crucial parameter in this algorithm. Our analysis does show, however, that the
impact on the retrieval of soil and foliage temperature is limited. For the purpose of
applying the derived component temperatures in a NWP model, the uncertainty in
the estimation of fractional vegetation cover becomes a minor problem. The
averages of soil and foliage over a grid of the NWP model show that similar values
of component temperatures are obtained even though the difference in fractional
vegetation cover obtained with two different methods is significant.
Validation was very preliminary made by comparing Tf to air temperature. In
most cases, Tf was comparable to air temperature, which implies that our simple
linear inversion model can be applied to separate the two components temperatures
based on the use of bi-angular TIR measurements. Angular measurements at higher
spatial resolution are necessary to obtain a more accurate validation of our
methods.
Figure 8. Comparison of foliage temperatures with the air temperatures at reference sites inSpain and SGP-97 study areas. The error bars indicate the standard deviations of Tf
over 565 pixels window. No Tf is shown if the number of pixels over which Tf andTs are derivable is too few to be representative for 565 pixels window.
4758 L. Jia et al.

Acknowledgments
The senior author is funded by the Netherlands Users Support Program
(SRON) under grant no. EO-049. This work was jointly funded by the Netherlands
Remote Sensing Board (BCRS), the Netherlands Ministry of Agriculture, Nature
Management and Fisheries (LNV), and the Royal Netherlands Academy of Science
(KNAW). Zhengming Wan was supported by NASA EOS Program contract
NAS5-31370. The meteorological air temperature data were kindly provided by
Dr B. J. J. M. van den Hurk of the Royal Netherlands Meteorological Institute
(KNMI).
References
BARET, F., CLEVERS, J. P. W., and STEVENS, M. D., 1995, The robustness of canopy gapfraction estimates from the red and near infrared reflectance. A comparison betweenapproaches for sugar beet canopies. Remote Sensing of Environment, 54, 141–151.
BECK, A., ANDERSON, G. P., ACHARYA, P. K., CHETWYND, J. H., BERNSTEIN, L. S., SHETTLE,
E. P., MATTHEW, M. W., and ADLER-GOLDEN, S. M., 1999, MODTRAN4 User’sManual. Air Force Research Laboratory, Hanscom AFB, MA.
BECKER, F., and LI, Z-L., 1995, Surface temperature and emissivity at various scales:definition, measurement and related problems. Remote Sensing Reviews, 12, 225–253.
EHRLER, W. L., 1973, Cotton leaf temperatures as related to soil water depletion andmeteorological factors. Agronomy Journal, 65, 404–409.
FLOWERDEW, R. J., and HAIGH, J. D., 1997, Retrieving land surface reflectances using theATSR-2: A theoretical study. Journal of Geophysical Research, 102, 17163–17171.
GAUSMAN, H. W., ESCOBAR, D. E., EVERITT, J. H., RICHARDSON, A. J., and RODRIQUEZ, R.R., 1978, The leaf mesophylls of twenty crops, their light spectra, and geometricalparameters. SWC Research Report 423, Rio Grande Soil and Water ResearchCenter, Weslaco, Texas.
HAPKE, B., 1981, Bidirectional reflectabce spectroscopy. 1. Theory. Journal of GeophysicalResearch, 86, 3039–3054.
JACKSON, R. D., 1982, Canopy temperature and crop water stress. Advances in Irrigation, 1,43–85.
JIA, L., MENENTI, M., SU, Z. B., DJEPA, V., LI, Z-L., and WANG, J., 2001, Modeling sensibleheat flux using estimates of soil and foliage temperatures: the HEIFE and IMGRASSexperiments. In Remote sensing and climate modeling: Synergies and Limitations,edited by M. Beniston and M. Verstraete (Dordrecht: Kluwer), pp. 23–49.
KIMES, D. S., 1980, Effects of vegetation canopy structure on remotely sensed canopytemperatures. Remote Sensing of Environment, 10, 165–174.
KIMES, D. S., 1983, Remote sensing of row crop structure and component temperatures usingdirectional radiometric temperatures and inversion techniques. Remote Sensing ofEnvironment, 13, 33–55.
KIMES, D. S., and KIRCHNER, J. A., 1983, Directional radiometric measurements of row-croptemperatures. International Journal of Remote Sensing, 4, 299–311.
KLESSPIES, T. J., and MCMILLIN, L. M., 1990, Retrieval of precipitable water fromobservations in the split-window over varying surface temperature. Journal of AppliedMeteorology, 29, 851–862.
KUUSK, A., 1985, The hot spot effect of a uniform vegetative cover. Soviet Journal of RemoteSensing, 3, 645–658.
LAGOUARDE, J. P., KERR, Y., and BRUNET, Y., 1995, An experimental study of angulareffects on surface temperature for various plant canopies and bare soils. Agriculturaland Forest Meteorology, 77, 167–190.
LI, Z-L., STOLL, M. P., ZHANG, R. H., JIA, L., and SU, Z., 2001a, On the separate retrievalof soil and vegetation temperatures from ATSR2 data. Science in China, Series D, 44,97–111.
LI, Z-L., JIA, L., and SU, Z., 2001b, Determination of atmospheric water vapor content fromATSR split-window channel data. In: ENVISAT-Land Surface Processes, National
An algorithm to infer soil and foliage component temperatures 4759

Remote Sensing Programs Series, edited by Z. Su and G. Roerink (Publications of theNational Remote Sensing Board (BCRS)). 2600 GA Delft, The Netherlands.
MACKAY, G., and STEVEN, M. D., 1998, An atmospheric correction procedure for the ATSR-2 visible and near infrared land surface data. International Journal of Remote Sensing,19, 2949–2968.
MENENTI, M., JIA, L., LI, Z-L., DJEPA, V., WANG, J., STOLL, M. P., SU, Z. B., and RAST, M.,2001, Estimation of soil and vegetation temperatures with multi-angular thermalinfrared observations: IMGRASS, HEFEI, SGP 1997 experiments. Journal ofGeophysical Research, 106, 11997–12010.
MILLER, E. C., and SAUNDERS, A. R., 1923, Some observations on the temperature of theleaves of crop plants. Journal of Agricultural Research, 26, 15–43.
NIELSEN, D. S., CLAWSON, K. L., and BLAD, B. L., 1984, Effect of solar azimuth and infraredthermometer view direction on measured soybean canopy temperature. AgronomyJournal, 76, 607–610.
NORMAN, J. M., KUSTAS, W. P., and HUMES, K. S., 1995, A two source approach forestimating soil and vegetation energy fluxes from observations of directionalradiometric surface temperature. Agricultural and Forest Meteorology, 77, 263–293.
NORTH, P. R. J., BRIGGS, S. A., PLUMMER, S. E., and SETTLE, J. J., 1999, Retrieval of landsurface bi-directional reflectance and aerosol opacity from ATSR-2 multiangleimagery. IEEE transactions on Geoscience and Remote Sensing, 37, 526–537.
PRESS, W. H., FLANNERY, B. P., TEUKOLSKY, S. A., and VETTERLING, W. T., 1989, Numericalrecipes (Cambridge, UK: Cambridge University Press).
PREVOT, L., BRUNET, Y., PAW, U. K. T., and SEGUIN, B., 1994, Canopy modelling forestimating sensible heat flux from thermal infrared measurements. Proceedings ofthe Workshop on Thermal Remote Sensing of the Energy and Water Balance overVegetation in Conjunction with other Sensors, 20–23 September, 1993, La Londe LesMauves, France, edited by T. Cowlson, O. Taconet, A. Vidal, S. Moran and R. Gilles,CEMAGREF, Cedex, France. pp. 17–22.
RAHMAN, H., and DEDIEU, G., 1994, SMAC: a simplified method for the atmosphericcorrection of satellite measurements in the solar spectrum. International Journal ofRemote Sensing, 15, 123–143.
SAUNDERS, R. W., and KRIEBEL, K. T., 1988, An improved method for detecting clear skyand cloudy radiances from AVHRR data. International Journal of Remote Sensing, 9,123–150.
SMITH, J. A., CHAUCHAN, N. S., and BALLARD, J., 1996, Remote sensing of land surfacetemperature: the directional viewing effect. IEEE Transactions on Geoscience andRemote Sensing, 13, 2146–2148.
SOBRINO, J. A., and CASELLES, V., 1990, Thermal infrared radiance model for interpretingthe directional radiometric temperature of a vegetative surface. Remote Sensing ofEnvironment, 33, 193–199.
SOBRINO, J., LI, Z-L., STOLL, M. P., and BECKER, F., 1994, Improvements in the split-windowtechnique for land surface temperature determination. IEEE Transactions onGeoscience and Remote Sensing, 32, 243–253.
VAN DEN HURK, B. J. J. M., JIA, L., JACOBS, C., MENENTI, M., and LI, Z-L., 2002, Assimila-tion of land surface temperature data from ATSR in an NWP environment—a casestudy. International Journal of Remote Sensing, 23, 5193–5209.
VERHOEF, W., 1998, Theory of radiative transfer models applied in optical remote sensing ofvegetation canopies. PhD thesis, Wageningen Agricultural University.
VERHOEF, W., 2001, Development of algorithms for estimation of atmospheric and surfacephysical parameters. In: Advanced Earth Observation – land surface climate, NationalRemote Sensing Programs Series, edited by Z. Su, and C. Jacobs (Publications of theNational Remote Sensing Board (BCRS)). 2600 GA Delft, The Netherlands.
VERHOEF, W., and MENENTI, M., 1998, Spatial and spectral scales of spaceborne imagingspectro-radiometers (SASSSIS), Final Report, NLR-CR-98213, National AerospaceLab. NLR, Amsterdam, the Netherlands.
VERMOTE, E. F., TANRE, D., DEUZE, J. L., HERMAN, M., and MORCRETTE, J-J., 1997, Secondsimulation of the satellite signal in the solar spectrum, 6S: An overview. IEEEtransactions on Geoscience and Remote Sensing, 35, 675–686.
4760 An algorithm to infer soil and foliage component temperatures
Copyright © 2022 FDOKUMEN