Indicators for monitoring chatter in milling based on instantaneous angular speeds
14
Indicators for monitoring chatter in milling based on instantaneous angular speeds M. Lamraoui a,b , M. Thomas a,n , M. El Badaoui b , F. Girardin c a DYNAMO Laboratory, École de Technologie Supérieure,1100 Notre Dame Ouest, Montréal, Québec, Canada H1C 1K3 b Université de Lyon, Université de Saint Etienne, Jean Monnet, F-42000 Saint-Etienne, France; LASPI, IUT de Roanne, F-42334 Roanne, France c Laboratoire Vibrations Acoustique, INSA-Lyon, 25 bis avenue Jean Capelle, F-69621 Villeurbanne Cedex, France article info Article history: Received 30 April 2012 Received in revised form 22 April 2013 Accepted 2 May 2013 Available online 15 June 2013 Keywords: Chatter indicators Milling Angular cutting force Instantaneous angular speed Spindle encoder abstract The detection of chatter is crucial in the machining process and its monitoring is a key issue to ensure a better surface quality, to increase productivity and to protect both the machine and the workpiece. An investigation of chatter monitoring in the high speed machining process on the basis of the analysis of cutting forces and instantaneous angular speeds (IAS) in the angular domain is presented in this paper. Experimental cutting tests were carried out on slot milling operation of aluminum alloy. Our experimental set-up allows for, on the one hand, the acquisition of the angular cutting force and, on the other hand, the measurement of IAS. The latter is computed from the signal delivered by the standard encoder mounted on the spindle motors. The same signal is used as a base for synchronous angular sampling. The acquisition methodology is described and discussed in this paper. Data analysis confirms the relevance of cutting forces for chatter monitoring and the good correlation between cutting forces and IAS of the spindle. Two chatter indicators are developed in the angular domain from the periodic and residual parts of angular speed and cutting force signals. They are used successfully for the detection of the chatter phenomenon. The indicator based on IAS is very convenient because it does not require additional sensors and can be realized without increasing the cost of the manufacturing system. & 2013 Elsevier Ltd. All rights reserved. 1. Introduction In manufacturing, current evolution towards productivity improvement and cost effectiveness require monitoring of machining to survey spindle bearing wear, tool wear and self-excited vibrations that produce chatter. Unfortunately, the issue of downtime continues to plague the industry. Unscheduled downtime is costly, not only in terms of time lost, but also in terms of damage to tools, machines or workpieces. Estimates state that the amount of downtime due to cutter breakage on an average machine tool is around 7%, while others estimate it is closer to 20% [1–3]. Even if the tool does not break during machining, the use of damaged cutters can stress the machine–tool system and cause a loss of quality in the finished workpiece. In fully automated or lightly staffed machining environments, the timely detection of the wear (bearing or tool) or chatter state of cutting tools and the recognition of their damage is seen as essential to the improvement of productivity Contents lists available at ScienceDirect journal homepage: www.elsevier.com/locate/ymssp Mechanical Systems and Signal Processing 0888-3270/$ - see front matter & 2013 Elsevier Ltd. All rights reserved. http://dx.doi.org/10.1016/j.ymssp.2013.05.002 n Corresponding author. Tel.: +1 5143968603; fax: +1 5143968530. E-mail addresses: [email protected] (M. Lamraoui), [email protected] (M. Thomas), [email protected] (M. El Badaoui), [email protected] (F. Girardin). Mechanical Systems and Signal Processing 44 (2014) 72–85
-
Upload
independent -
Category
Documents
-
view
4 -
download
0
Transcript of Indicators for monitoring chatter in milling based on instantaneous angular speeds

Indicators for monitoring chatter in milling basedon instantaneous angular speeds
M. Lamraoui a,b, M. Thomas a,n, M. El Badaoui b, F. Girardin c
a DYNAMO Laboratory, École de Technologie Supérieure, 1100 Notre Dame Ouest, Montréal, Québec, Canada H1C 1K3b Université de Lyon, Université de Saint Etienne, Jean Monnet, F-42000 Saint-Etienne, France; LASPI, IUT de Roanne, F-42334 Roanne,Francec Laboratoire Vibrations Acoustique, INSA-Lyon, 25 bis avenue Jean Capelle, F-69621 Villeurbanne Cedex, France
a r t i c l e i n f o
Article history:Received 30 April 2012
Received in revised form
22 April 2013
Accepted 2 May 2013Available online 15 June 2013
Keywords:Chatter indicators
Milling
Angular cutting force
Instantaneous angular speed
Spindle encoder
a b s t r a c t
The detection of chatter is crucial in the machining process and its monitoring is a key
issue to ensure a better surface quality, to increase productivity and to protect both the
machine and the workpiece. An investigation of chatter monitoring in the high speed
machining process on the basis of the analysis of cutting forces and instantaneous angular
speeds (IAS) in the angular domain is presented in this paper.
Experimental cutting tests were carried out on slot milling operation of aluminum
alloy. Our experimental set-up allows for, on the one hand, the acquisition of the angular
cutting force and, on the other hand, the measurement of IAS. The latter is computed from
the signal delivered by the standard encoder mounted on the spindle motors. The same
signal is used as a base for synchronous angular sampling.
The acquisition methodology is described and discussed in this paper. Data analysis
confirms the relevance of cutting forces for chatter monitoring and the good correlation
between cutting forces and IAS of the spindle. Two chatter indicators are developed in the
angular domain from the periodic and residual parts of angular speed and cutting force
signals. They are used successfully for the detection of the chatter phenomenon.
The indicator based on IAS is very convenient because it does not require additional
sensors and can be realized without increasing the cost of the manufacturing system.
& 2013 Elsevier Ltd. All rights reserved.
1. Introduction
In manufacturing, current evolution towards productivity improvement and cost effectiveness require monitoring of
machining to survey spindle bearing wear, tool wear and self-excited vibrations that produce chatter. Unfortunately, the
issue of downtime continues to plague the industry. Unscheduled downtime is costly, not only in terms of time lost, but also
in terms of damage to tools, machines or workpieces. Estimates state that the amount of downtime due to cutter breakage
on an average machine tool is around 7%, while others estimate it is closer to 20% [1–3]. Even if the tool does not break
during machining, the use of damaged cutters can stress the machine–tool system and cause a loss of quality in the finished
workpiece. In fully automated or lightly staffed machining environments, the timely detection of the wear (bearing or tool)
or chatter state of cutting tools and the recognition of their damage is seen as essential to the improvement of productivity
Contents lists available at ScienceDirect
journal homepage: www.elsevier.com/locate/ymssp
Mechanical Systems and Signal Processing
0888-3270/$ - see front matter & 2013 Elsevier Ltd. All rights reserved.
http://dx.doi.org/10.1016/j.ymssp.2013.05.002
n Corresponding author. Tel.: +1 5143968603; fax: +1 5143968530.
E-mail addresses: [email protected] (M. Lamraoui), [email protected] (M. Thomas), [email protected]
(M. El Badaoui), [email protected] (F. Girardin).
Mechanical Systems and Signal Processing 44 (2014) 72–85

and cost effectiveness. It has been predicted that an accurate and reliable tool condition monitoring system could result in a
cutting speed increase of 10–15%, reduction in downtime by allowing maintenance to be scheduled in advance, and an
overall increase in savings of 10–40% [4].
The detection of chatter and tool wear becomes crucial for maintaining efficient machining process. Chatter is a self-
excited type of vibration that can arise in the machining process for specific combinations of cutting parameters, depth of
cut and spindle speed. Various physical mechanisms can cause chatter; for example, the friction between the tool and
workpiece, the thermodynamics of the process or mode coupling [5]. Chatter due to these physical mechanisms is often
called primary chatter. Secondary chatter, which is considered to be one of the most important types of chatter, is due to the
regeneration of waviness of the workpiece surface [6]. This type of chatter has been investigated in several studies since the
late 1950s [7,8] and it will be considered in this paper.
Consequently, the online detection of these phenomena allows for determining suitable conditions to maintain a good
part quality in production, but it also requires methods for monitoring the machining centers. In machining, an efficient
monitoring system can maintain machine tools in stable condition without chatter and detect the occurrence of wear (tool
or spindle bearings). Several sensors (dynamometer, accelerometers, acoustic emission and/or electrical power sensors)
have been used for chatter detection in milling [9]. In many studies, researchers have investigated the application of the
dynamometer sensor for chatter detection in machining operation. Dimla reviewed some methods that employed the static
and dynamic cutting forces for tool wear monitoring [10]. Once the sensors have been chosen for monitoring and the signals
have been acquired, the problem to be surmounted would be to extract suitable features that are well correlated with the
anomaly in order to achieve a good detection of the defect [2]. Various methods have been developed in order to identify
chatter. Scalar time descriptors and spectral analysis are often employed to extract information on the state of the
cutting tools.
In the time domain, Nayfeh and Balachandran [11] analyzed the stability of milling operation by using a Poincaré section
and a so called bifurcation diagram is shown to identify the transition from stable cutting to chatter. Insperger [12] analyzed
system stability by modeling machine tool and developing differential equations. Bayly et al. [13] used the variance indicator
in time domain to determine stability boundary, and Smith and Tlusty [14] proposed the peak-to-peak force method to
identify the limits of stability. Advanced techniques have also been used, such as multilayer perceptrons or back propagation
neural networks [15] and Information Theory [16].
However, the most common methods of analysis of force signals have been conducted in the frequency domain. Li et al.
[17] proposed a frequency domain approach based on the cross-coherence of two perpendicular acceleration signals to
detect wear and chatter. Zaghbani et al. [18] used frequency descriptors to analyze the stability in robotic high speed
machining of aluminum alloys. Some of the earliest works used the Short Time Fourier Transform [19] or the wavelet
transform [20,21] for chatter detection.
Unfortunately, most rotating machinery undergoes nonstationary operations, while most of the usual chatter detection
methods are based on the assumption of stationarity. In fact, even under cutting conditions of pseudoconstant operations
(speed, torque, temperature etc.), repetitive shocks and friction due to action of the tool and the workpiece (nonheter-
ogeneity, etc.) during machining exhibit nonstationary phenomena during each cycle of the machine. The nonstationary
nature of the signals, the sensitivity of the features being measured in the process to changes in cutting condition, and the
nonlinear relationship of these features to the defect makes this a nontrivial task [22]. The study of cyclostationarity of the
vibratory signals for rotating machinery allows for taking into account the random effects that can be produced during each
tool revolution. The statistical properties of machine–tool vibratory signals are periodic with regard to the basic cycle.
This periodicity is inferred by the cyclic operation of the machine. Angular sampling techniques have widely evolved to
extract all relevant measurements information on several types of rotating machines (internal combustion engines, electric
motors, power transmission by gears, machine tools). The angular approach allows for characterizing the periodic
excitations of rotating machinery even for systems operating at variable speeds. The development of new formalisms
based on angular description constitutes also a real opportunity for modeling tools to describe and control the vibratory
behavior of rotating machines. Desbazeille et al. [23] used the crankshaft angular speed variation for diagnosis of large diesel
engines. Stander [24] used the fluctuations in instantaneous angular speed (IAS) for monitoring a gear shaft and detecting
deteriorating gear fault conditions, while introducing a distinction between cyclic stationary load modulation and noncyclic
stationary load modulation. Remond and Mahfoudh [25] started from multiple IAS measurements to compute gear
transmission errors and finally used specific and single angular sampling for detecting faults in a gear box transmission by
using different cyclic means in the angular domain.
Cyclostationarity has also been used successfully for observing defects in machining. For example, Takata et al. [26]
described a monitoring method of multiedge tools by means of fluctuation signals of spindle rotational speed. Girardin et al.
[27] developed an original approach based on the IAS measured from an encoder for tooth breakage detection and wear
monitoring in milling processes. New vectorial indicators based on the property of cyclostationarity for identifying the
angular position where a specific phenomenon occurs have been developed [1,28,29]. These angular indicators were used
for the detection of chatter and tool wear.
This paper aims to investigate the efficiency of Short Angular Fourier Transform (SAFT) methods in the angular-frequency
domain and the development of chatter indicators for diagnosing chatter in high speed milling process. The method is based
on the measurement of angular cutting force characteristics and IAS analysis. Since good correlation between cutting forces
and IAS of the spindle has been shown, the future aim is to only use the IAS measurement for industrial applications.
M. Lamraoui et al. / Mechanical Systems and Signal Processing 44 (2014) 72–85 73

The content of this paper covers the methodology, which describes the experimental set-up, the method of measurement of
the IAS and how to use this type of signal to develop some indicators for chatter detection. In the next part of this paper, an
analysis of angular force and IAS is performed with different test configurations. A SAFT analysis is conducted in the angular
domain and the results are compared with those coming from two chatter indicators.
2. Methodology
2.1. Experimental set-up
The Huron K2X10 milling machine, which is able to operate at a very high speed (28 000 rpm), has been used for the
experimental tests. Since the AC motor has an integrated rotational encoder (type GEL 244 KM Y 074, Lenord & Bauer) and
emitting 256 pulses per revolution (two sine wave signals, 901 out of phase, and their inverse signals with a reference
signal), the signals coming from the encoder were picked up directly from the machine, through a TTL converter. A multi-
component Kistler dynamometer 9255-B [30], coupled with charge amplifiers, was used to measure the cutting forces in
three orthogonal directions (Fx, Fy, Fz). A data acquisition system with angular sampling device was used. The signal
acquisition process is described in Fig. 1.
The angular acquisition system is composed of a sinusoidal to TTL-compatible square-wave output signals converter
(IBV 606 Heidenhain) supplied by 5 V and a specific acquisition card DT9836-6-0-BNC. The DT9836 board has a sampling
rate for each channel of 225 kHz, which gives a maximum frequency range up to 112.5 kHz. Sinusoidal signals of the
measuring systems are not only converted but also two-fold interpolated (P¼512 pulses per revolution). The sampling of the
acquisition card is driven by the generated TTL-signal. At each pulse edge of the encoder signal, cutting forces and the
number of pulses of a high frequency clock (Fcl¼36 MHz) are acquired. The data acquisition system included an anti-
aliasing filter for the force and vibration measurements, while this was not possible for the encoder signal.
2.2. Test configurations
In order to investigate the application of Angular Sampling System (ASS) for the detection of chatter and tool wear in
milling, several tests in slot milling were performed on a block of an aluminum A7075-T6 alloy of size
194 mm�133 mm�50 mm (#8 in Fig. 1). The workpiece was mounted on the dynamometer table. All the tests of milling
were achieved with a 2 tooth micrograin solid carbide square end mill. The characteristics of the tool are illustrated in
Table 1.
Three uniaxial accelerometers (PCB352C22) were used to record the vibrations. Two of them were attached to the free
end of the nonrotating part of the spindle (spindle support) and were oriented along the X and Y directions, parallel to the
machine axes. The third accelerometer was attached to the workpiece and oriented along the cutting direction and parallel
to the Y-axis of the machine center. This study is focused on the slot milling process and will only consider the analysis of
cutting force and encoder measurements, accelerometer signals were analyzed by authors in previous works [1,28,29].
A tap test was applied at the tool tip in the X and Y directions to obtain the modal parameters of the spindle (including
tool and tool holder) [18]. The frequency responses in these directions are shown in Fig. 2 (and in Fig. 11b). The modal
parameters were extracted by the real–imaginary method. The first major natural frequency was found at approximately
Fig. 1. Experimental set-up.
M. Lamraoui et al. / Mechanical Systems and Signal Processing 44 (2014) 72–8574

860 Hz with other higher resonances (1600, 2400, 3400 Hz), which originated from bending modes of tool, spindle and tool
holder.
2.3. Measurement of angular speed
It is well known that chatter vibrations lead to variations in cutting forces as per the fluctuations in cutting depth. Based
on the work of Girardin et al. [27], it was noticed that the IAS could provide a good picture of angular cutting forces. Indeed,
the equation of motion for a machine-tool spindle is given as follows [31,32]:
Tcut þ T f ric ¼ Tm−Jndw=dt ð1Þ
where Tcut (N m) is the cutting torque; Tfric (N m) is the friction torque that is maintained during the machining operations
because the machine-tool spindle rotates at a constant speed; Tm (N m) is the motor torque; Jn (kg/m2) is the inertia of the
spindle and w (rad/s) is the angular velocity.
It is thus suggested that the vibrations in cutting torque that are produced by chatter vibrations can be detected by
monitoring the IAS. The method based on IAS is very practical for industrial production since it does not need additional
sensors and can be achieved without increasing the cost of the manufacturing system. The IAS is obtained using the spindle
integrated rotational encoder. The angular acquisition system counts the number of pulses Ni between two pulses edges of a
rotary encoder/TTL-converter via a high frequency clock. The time lapse Δti necessary to cover the interval Δθi between two
pulses edges is defined by
Δti ¼Ni
FclðsÞ ð2Þ
Table 1
Geometry of the square end mill.
Symbols Terminology Values
B Tool cutting edge inclination
(helix angle )
30
Ap Maximum depth of cut (mm) 38.1
D Tool diameter (mm) 25.4
L Tool length (mm) 101.6
Z Number of teeth 2
Fig. 2. FRF of the system in X and Y directions: (a) tap test with PCB 086C04 hammer, steel tip, PCB accelerometer and (b) transfer functions:
real–imaginary parts, magnitude, coherence.
M. Lamraoui et al. / Mechanical Systems and Signal Processing 44 (2014) 72–85 75

Therefore, the angular velocity is estimated by
W i;j ¼Δθi;j
Δti;j¼
2π
pFclNi;j
ðrad=sÞ ð3Þ
where Fcl is the clock frequency of the counter board; Ni,j is the number of pulses/counts for each angle interval iof revolution j; P¼512 is the resolution of the rotational encoder (256 pulses/rev with an interpolation of 2).
Fig. 3 summarizes the angular velocity estimation. The angular velocity signal must be lowpass filtered to eliminate
measurement noise and the response characteristics of the rotational encoder. The characteristics of the encoder can be
estimated for a machining stage load and removed from the original signal. This operation is not imperative if the angular
speed signal is filtered enough [29].
2.4. Chatter tests
The data acquisition process was achieved by ASS, as shown in Fig. 1. In order to cause chatter, the depth of cut was
increased by increments of 1 mm or 2 mm from 1 mm at two different spindle speeds (3000 and 8000 rpm). As it is a
preliminary research in order to investigate the feasibility to use instantaneous angular speeds and to develop indicators for
detecting chatter, the total number of experimental tests has been limited to six: four inside the stable region, one at the
limit of stability and one inside the unstable region. The used parameters for machining are summarized in Table 2.
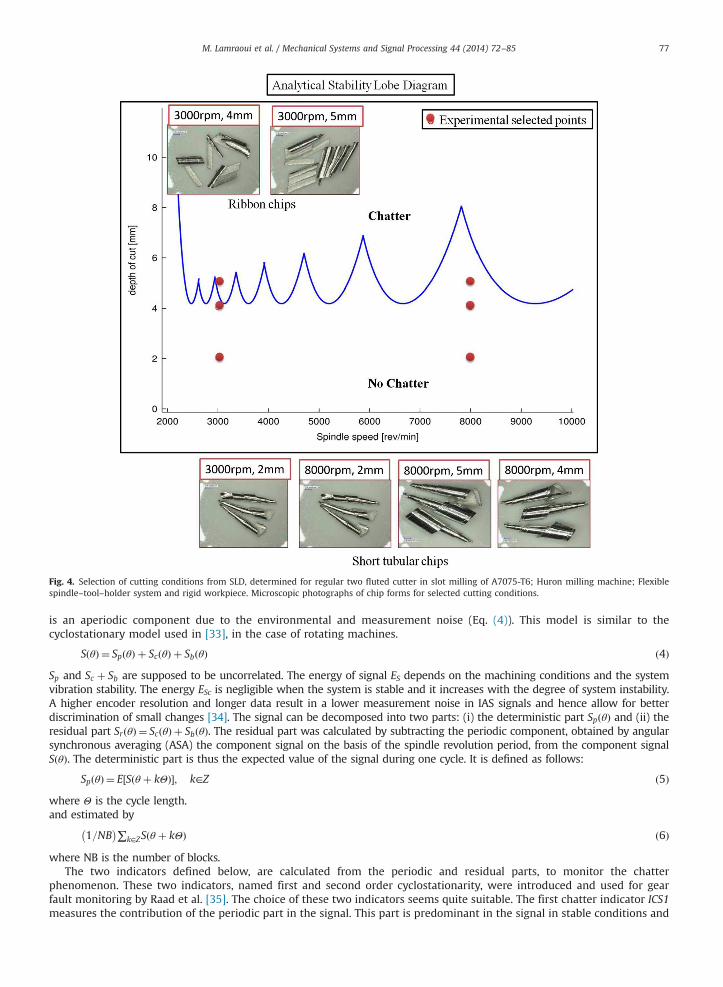
The cutting conditions (speed of rotation, depth of cut) were chosen from the simulated Stability Lobe Diagram (SLD).
To determine the SLD, we needed to know the cutting coefficients and the transfer functions (Fig. 2b) measured on the
Huron machine tool from a tap test (Fig. 2a). The algorithm can be found in this Ref. [8]. The SLD defines the stable and
unstable regions according to the spindle speed (frequency) and depth of cut for a certain width of cut. Fig. 4 shows the SLD
and selected cutting conditions. The point at the speed of 3000 rpm and depth of 4 mm was close to the limit of stability.
The chip forms indicate the nature of machining. Short tubular chips are produced in stable conditions, which are
acceptable in milling operation (see microscopic photographs in Fig. 4), while ribbon chips are produced for conditions of
3000 rpm and depths of 4 mm and 5 mm, which are representative of bad conditions of milling.
2.5. Chatter indicators
Chatter is well known to be a random and chaotic phenomenon, whereas the cutting process is periodic and
deterministic. Thus, cyclostationary theory can be used to define indicators for chatter/stable cases.
Every signal from the milling operation is composed of three components: SpðθÞ is the periodic component that contains
the harmonics of the spindle revolution frequencies; ScðθÞ is the aperiodic components due to the chatter phenomena; SbðθÞ
Fig. 3. Angular velocity estimation.
Table 2
Cutting conditions of chatter tests.
Tests Axial depth (mm) Radial depth (mm) Cutting speed (m/min) Feed (mm/tooth) Revolution speed (rpm) Note
1 2 25.4 239.4 0.03 3000 No chatter
2 4 25.4 239.4 0.03 3000 Limit to chatter
3 5 25.4 239.4 0.03 3000 Chatter
4 2 25.4 638.3 0.03 8000 No chatter
5 4 25.4 638.3 0.03 8000 No chatter
6 5 25.4 638.3 0.03 8000 No Chatter
M. Lamraoui et al. / Mechanical Systems and Signal Processing 44 (2014) 72–8576
is an aperiodic component due to the environmental and measurement noise (Eq. (4)). This model is similar to the
cyclostationary model used in [33], in the case of rotating machines.
SðθÞ ¼ SpðθÞ þ ScðθÞ þ SbðθÞ ð4Þ
Sp and Sc þ Sb are supposed to be uncorrelated. The energy of signal ES depends on the machining conditions and the system
vibration stability. The energy ESc is negligible when the system is stable and it increases with the degree of system instability.
A higher encoder resolution and longer data result in a lower measurement noise in IAS signals and hence allow for better
discrimination of small changes [34]. The signal can be decomposed into two parts: (i) the deterministic part SpðθÞ and (ii) the
residual part SrðθÞ ¼ ScðθÞ þ SbðθÞ. The residual part was calculated by subtracting the periodic component, obtained by angular
synchronous averaging (ASA) the component signal on the basis of the spindle revolution period, from the component signal
SðθÞ. The deterministic part is thus the expected value of the signal during one cycle. It is defined as follows:
SpðθÞ ¼ E½Sðθ þ kΘÞ�; k∈Z ð5Þ
where Θ is the cycle length.
and estimated by
1=NB� �
∑k∈ZSðθ þ kΘÞ ð6Þ
where NB is the number of blocks.
The two indicators defined below, are calculated from the periodic and residual parts, to monitor the chatter
phenomenon. These two indicators, named first and second order cyclostationarity, were introduced and used for gear
fault monitoring by Raad et al. [35]. The choice of these two indicators seems quite suitable. The first chatter indicator ICS1measures the contribution of the periodic part in the signal. This part is predominant in the signal in stable conditions and
Fig. 4. Selection of cutting conditions from SLD, determined for regular two fluted cutter in slot milling of A7075-T6; Huron milling machine; Flexible
spindle–tool–holder system and rigid workpiece. Microscopic photographs of chip forms for selected cutting conditions.
M. Lamraoui et al. / Mechanical Systems and Signal Processing 44 (2014) 72–85 77

decreases when the machine is operating in unstable conditions. The second chatter indicator ICS2 is linked to the
contribution of the aperiodic or random part coming from chatter and other noise sources. ICS2 is estimated from the
residual part and measures the cyclic energy of this part. The residual part is not periodic but its square is. The second
chatter indicator ICS2 measures the contribution of the random part in the signal. The frequency components of the squared
residual part correspond to modulation frequencies and to not additive ones (which have been removed by the synchronous
averaging). In fact, by Plancherel theory, the spectrum of the squared signal is the convolution of the spectrum of the
residual signal with itself.
It has been shown that the envelope analysis is linked with the cyclic spectral density and considered as a valuable tool
for the analysis of cyclostationary signals [36]. The ICS2 indicator could be seen as the normalized sum of the energy of the
cyclic spectrums of the residual part.
The two indicators are without dimension and are normalized by the power of the centered signal and its square
(v and v2) and calculated from a discrete signal S(k) of length N with the sampling period of Δθ. These two indicators
are defined by
ICS1¼ ∑f ¼ kα;f≠0
1
N∑N−1
k ¼ 0
SpðkÞe−j2πðkf ΔθÞ
" #20
@
1
A=v ð7Þ
ICS2¼ ∑f ¼ kα;f≠0
1
N∑N−1
k ¼ 0
SrðkÞ2e−j2πðkf ΔθÞ
" #20
@
1
A=v2 ð8Þ
where v¼ ð1=NÞ∑N−1k ¼ 0ðSðθÞ−mÞ2 such as, m¼ ð1=NÞ∑N−1
k ¼ 0SðθÞ. The cyclic frequency α corresponds to spindle speed frequency
and k∈Z.
3. Results and discussion
The analysis of data was carried out in two steps. First, analysis of angular forces and IAS was performed in the angular,
frequency and angular-frequency domains (SAFT), and then the chatter indicators were applied to all the test configurations.
3.1. Data analysis
All signals were acquired in the angular domain. All spectra were calculated by considering an average sampling rate,
which was estimated from the average speed of rotation, because we worked at constant speed.
3.1.1. Angular cutting forcesThe angular signal and Power Spectral Density (PSD) of the cutting forces as measured by the ASS in both stable and
unstable conditions are shown in Fig. 5, for feed perpendicular force direction. The parameter were recorded with a
sampling frequency of 25.6 kHz, a hamming window, a resolution of 1 Hz and 145 averages in logarithmic scale.
The analysis in the angular domain is useful for observing the behavior of cutting forces during each revolution.
The analysis of angular force provides information about the system stability. The average and root mean square of cutting
forces are effective features that have been tested in the past for both chatter and monitoring system. The system is very stiff
in the axial direction Fz and consequently the angular cutting force in this direction is noisy. The power spectra are
dominated by the chatter frequencies produced by the instability of system. This analysis in a stable case shows that the
signal is periodic and stationary; the passage of teeth is clearly noteworthy. However, some periodic anomalies were
detected when the system was unstable. These anomalies are due to the component added and nonlinearity produced by
the chatter. For instance, the amplitude of fluctuations is not constant in each revolution and it repeats itself in the same
way during the evolution of rotation angle (see Fig. 5c). It is seen that each tooth passage requires 0.01 s (π rad angular
interval); this corresponds to a frequency of 100 Hz, which is the tooth pass excitation. In Fig. 5a and c the dashed lines
denote the different spindle revolutions. Fig. 5b and d show the PSD in stable and unstable conditions. The analysis of the
angular cutting force signals in stable conditions (Fig. 5b) in the frequency domain confirmed that the peaks of the spectra
are located at the spindle revolution frequency and its harmonics. In the figures cited above, the frequencies were easily
identified and denoted by red points; the remaining anomalous peaks were denoted by arrows. The analysis of the angular
cutting force signals in unstable conditions (Fig. 5d) highlights dominant anomalous peaks that correspond to the self-
excited vibration frequencies or chatter frequencies. The majority of chatter frequencies are located near the resonance
frequencies of the tool–tool holder–spindle system; some of these chatter components modulate the natural frequencies
with the rotation frequency of spindle or its harmonics (Hopf bifurcation). This observation is in concordance with
Dombovari et al. [37].
The SAFT is a useful tool for characterizing the dynamics of a cutting process, such as milling in the time–frequency
domain. SAFT is applied to the instantaneous resultant angular cutting force (F) deducted from the X, Y and Z components. Fhas the ability to be independent of the tool path or the orientation of the cutter in reference to the workpiece. On the other
hand, the individual Fx, Fy and Fz components lack this ability [38]. This method has been employed to illustrate the benefits
M. Lamraoui et al. / Mechanical Systems and Signal Processing 44 (2014) 72–8578

given by the cutting force signals in detecting chatter frequency components in slot milling. The angular sampling allows for
having an accurate description of signals and permits to follow the evolution of frequency component over the analyzed
time or angle. Fig. 6 displays the SAFT of the resulting forces in both stable (Fig. 6a) and unstable conditions (Fig. 6b and c).
Fig. 6. SAFT of the resulting force F for both stable (a), and unstable conditions (b) and (c). Cutter configuration of test# (1–3) of Table 2 (depth¼2, 4 and
5 mm, spindle speed¼3000 rpm), slot milling operation. The entry region is described by two dashed lines in Figs. 8a, c and covers an interval equal to
θ¼1.24 rad. Figures in the first row show the Fx (blue solid line), Fy (red dashed line) and Fz (green dotted line) for each case. (For interpretation of the
references to color in this figure legend, the reader is referred to the web version of this article.)
Fig. 5. Angular signal and PSD of the feed perpendicular force FNf for both stable (a) and (b), and unstable conditions (c) and (d). Cutter configuration of
test# (1,3) of Table 2 (depth¼2 and 5 mm, spindle speed¼3000 rpm), slot milling operation. In panels (b) and (d) the red dots denote the spindle angular
frequency and its harmonics; the black arrows denote the self-excited frequencies, the black discs denote the resonances. (For interpretation of the
references to color in this figure legend, the reader is referred to the web version of this article.)
M. Lamraoui et al. / Mechanical Systems and Signal Processing 44 (2014) 72–85 79

In stable conditions (Fig. 6a), two main zones are observed on the angular scale. The first zone corresponds to the entry of
a tooth, while the second to its exit. The entry region is described by two dashed lines in Fig. 8a and covers an interval equal
to θ¼ 1:24 rad. The energy is distributed differently along the frequency axis, due to excitation of all natural frequencies by
shocks. These shocks are produced by the entry of the teeth into the workpiece. The frequencies corresponding to the
entrance and exit of teeth into the workpiece may be observed in two main regions:
� A red spectral region which manifests at low frequencies [0: 250 Hz], corresponds to the average curve of the
cutting force.� A yellow spectral region that is centered around 1600 Hz and corresponds to a natural frequency of the system spindle–
holder–tool or spindle–holder–tool–workpiece–dynamometer.
In the unstable conditions (Fig. 6b and c), the frequency components are different from the stable case. Additional peaks
occur due to the chatter phenomenon. The added components are located near the resonances of the system, which provide
darker red and green yellow areas and produce more energy.
Applying the SAFT to the angular forces in milling operations found to be useful to capture non-stationary
and multi-component signals generated by a dynamic process in different cut conditions. Any anomalous events are
expected to appear in the form of changes of patterns of frequency components. However, this method may not be used to
monitor the chatter phenomenon in an industrial process due to the use of an expensive dynamometer and another sensor
Fig. 7. Correlation between cutting forces and inversed IAS. This figure shows five periods of resulting cutting forces (blue dashed line) and inversed IAS
(green solid line); both signals are butter LPF with a cut-off frequency of 230 Hz. The black arrows show the increase of resulting cutting forces when a
tooth enters into the workpiece and the red dotted arrows show the corresponding decrease of IAS. (For interpretation of the references to color in this
figure legend, the reader is referred to the web version of this article.)
Fig. 8. PSD of the IAS for both stable (a) and unstable conditions (b). Cutter configuration of test# (1–3) of Table 2 (depth¼2, 4 and 5 mm, spindle
speed¼3000 rpm), slot milling operation. The red dots denote the spindle angular frequency and its harmonics, the black arrows denote the self-excited
frequencies, the black discs denote the resonances. (For interpretation of the references to color in this figure legend, the reader is referred to the web
version of this article.)
M. Lamraoui et al. / Mechanical Systems and Signal Processing 44 (2014) 72–8580
is required for industrial applications. In the following section, the analysis of IAS will be presented and analyzed by
different methods.
3.1.2. IAS of the spindleThe IAS is measured using the integrated rotational encoder and is calculated from Eq. (3). Based on Fig. 7, it is noted that
the IAS provides a good picture of angular cutting forces.
When the tooth engages to cut the workpiece, the resulting cutting force increases proportionally with the chip thickness
and the instantaneous speed decreases and vice versa. This observation is in concordance with Girardin et al. [27]. The black
and red dotted arrows in Fig. 7 denote the increase of cutting force and the decrease of IAS when tooth enters into the
material.
Fig. 8 describes the PSD for both stable (Fig. 8a) and unstable conditions (Fig. 8b and c) of the IAS.
For stable cases as shown in Fig. 8a, the most dominant peaks in the spectra domain show up at the spindle angular
frequency together with its harmonics (denoted by red dots in Fig. 8a), and the natural frequencies that arise for both stable
and unstable slot milling process. The black discs denote the natural frequencies. For the unstable case as shown in Fig. 8b
and c, dominant anomalies peaks that correspond to the self-excited vibration frequencies or chatter frequencies are
identified. The chatter frequencies are located near the resonance frequencies (860 Hz, 1600 Hz, and 2400 Hz) of the tool–
tool holder–spindle system. These results are in concordance with Dombovari et al. [37].
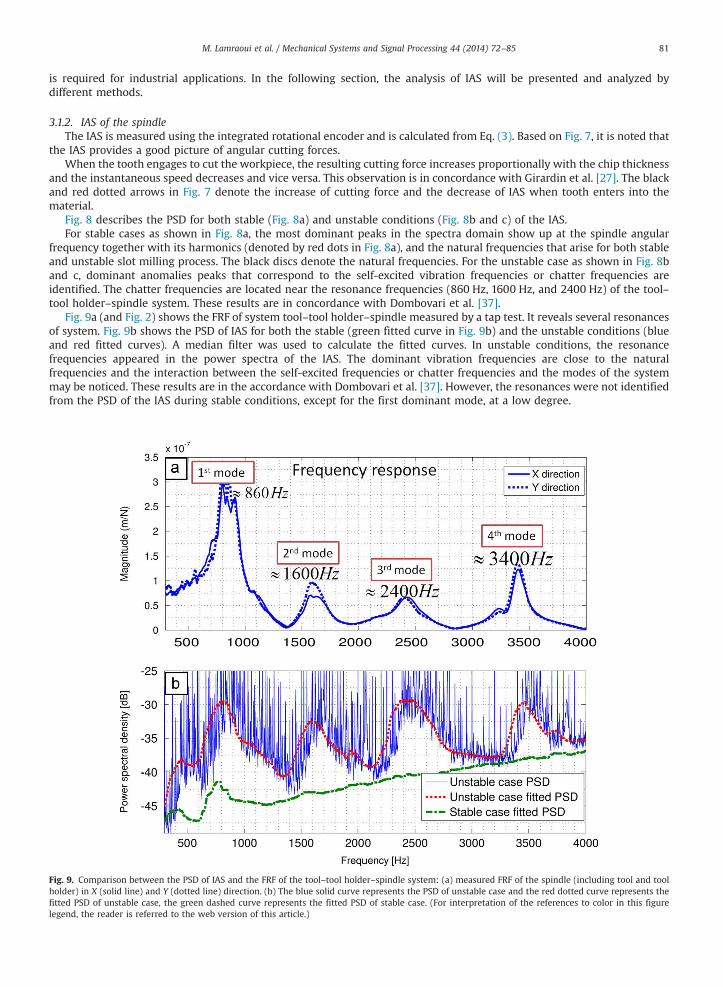
Fig. 9a (and Fig. 2) shows the FRF of system tool–tool holder–spindle measured by a tap test. It reveals several resonances
of system. Fig. 9b shows the PSD of IAS for both the stable (green fitted curve in Fig. 9b) and the unstable conditions (blue
and red fitted curves). A median filter was used to calculate the fitted curves. In unstable conditions, the resonance
frequencies appeared in the power spectra of the IAS. The dominant vibration frequencies are close to the natural
frequencies and the interaction between the self-excited frequencies or chatter frequencies and the modes of the system
may be noticed. These results are in the accordance with Dombovari et al. [37]. However, the resonances were not identified
from the PSD of the IAS during stable conditions, except for the first dominant mode, at a low degree.
Fig. 9. Comparison between the PSD of IAS and the FRF of the tool–tool holder–spindle system: (a) measured FRF of the spindle (including tool and tool
holder) in X (solid line) and Y (dotted line) direction. (b) The blue solid curve represents the PSD of unstable case and the red dotted curve represents the
fitted PSD of unstable case, the green dashed curve represents the fitted PSD of stable case. (For interpretation of the references to color in this figure
legend, the reader is referred to the web version of this article.)
M. Lamraoui et al. / Mechanical Systems and Signal Processing 44 (2014) 72–85 81

3.2. Chatter indicator analysis
In order to investigate the efficiency of chatter indicators presented at Section 2.5, the chatter indicators were computed
for each test configuration (Table 2). These indicators were calculated for both cutting force and IAS signals. All signals have
been filtered with a cut-off frequency of 3.5 kHz. Fig. 10 shows the different parts of cutting force signal after their
decomposition, in both stable (Fig. 10a) and unstable condition (Fig. 10b).
As expected, the amplitude is higher in the unstable case compared to the stable case for the three types of signal
(original, ASA and residual). However, it may be noticed that the residual part is predominant in the unstable case due to the
chaotic motion of tool and the strong anomalous fluctuations of cutting force, instead of periodic part. The residual part
increases more with increasing of instability.
Fig. 11 shows the different parts of decomposition of the IAS, in both stable (Fig. 11a) and unstable conditions (Fig. 11b).
Observations described in Fig. 10 are also seen in Fig. 11, which further confirm the good correlation between the cutting
force signal and the IAS, and opens the possibility of using this type of signal for chatter detection without the need of
additional sensors.
The chatter indicators calculated from Eqs. (7) and (8) and presented in Fig. 12 have been normalized (Eq. (9)) and
presented in percentage by cylindrical histogram in Fig. 13:
NICSi¼ ICSi=∑ICSi; i¼ 1;2 ð9Þ
Fig. 10. Decomposition of cutting force signal for both stable (a) and unstable condition (b): Cutter configuration of test# (1–3) of Table 2 (depth¼2 and
5 mm, spindle speed¼3000 rpm), slot milling operation. Force signal: blue solid line, Angular synchronous average (ASA): red dashed line, residual part:
green dotted line. (For interpretation of the references to color in this figure legend, the reader is referred to the web version of this article.)
Fig. 11. Decomposition of instantaneous angular speed (IAS) signal for both stable (a) and unstable condition (b): cutter configuration of test# (1–3) of
Table 2 (depth¼2 and 5 mm, spindle speed¼3000 rpm), slot milling operation. Centered IAS: blue solid line, angular synchronous average (ASA): red
dashed line, residual part: green dotted line. (For interpretation of the references to color in this figure legend, the reader is referred to the web version of
this article.)
M. Lamraoui et al. / Mechanical Systems and Signal Processing 44 (2014) 72–8582
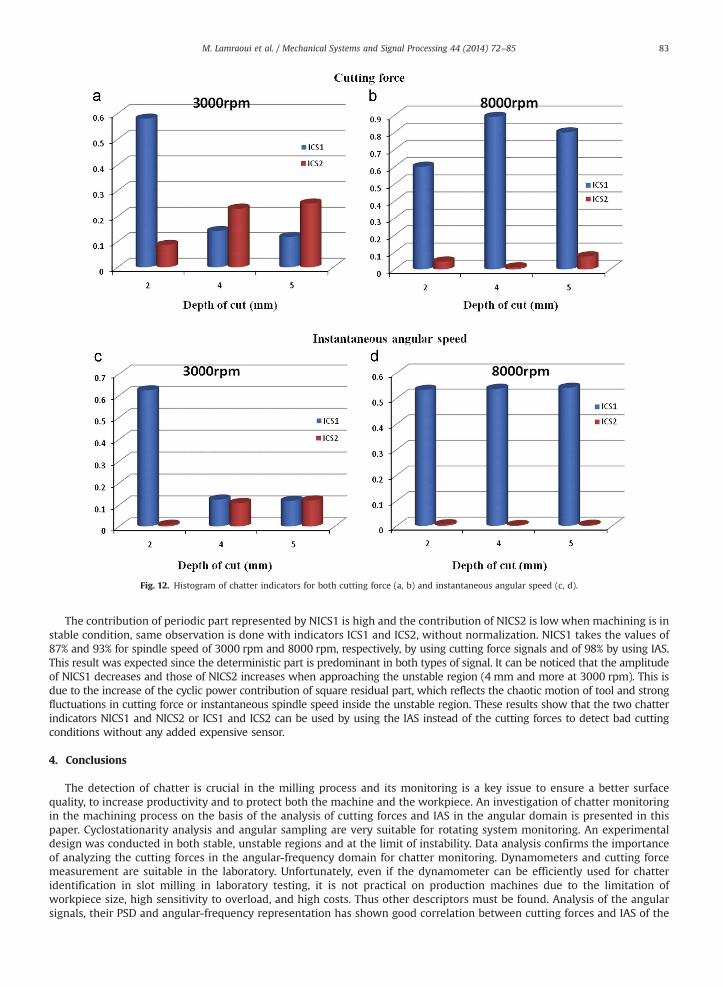
The contribution of periodic part represented by NICS1 is high and the contribution of NICS2 is low when machining is in
stable condition, same observation is done with indicators ICS1 and ICS2, without normalization. NICS1 takes the values of
87% and 93% for spindle speed of 3000 rpm and 8000 rpm, respectively, by using cutting force signals and of 98% by using IAS.
This result was expected since the deterministic part is predominant in both types of signal. It can be noticed that the amplitude
of NICS1 decreases and those of NICS2 increases when approaching the unstable region (4 mm and more at 3000 rpm). This is
due to the increase of the cyclic power contribution of square residual part, which reflects the chaotic motion of tool and strong
fluctuations in cutting force or instantaneous spindle speed inside the unstable region. These results show that the two chatter
indicators NICS1 and NICS2 or ICS1 and ICS2 can be used by using the IAS instead of the cutting forces to detect bad cutting
conditions without any added expensive sensor.
4. Conclusions
The detection of chatter is crucial in the milling process and its monitoring is a key issue to ensure a better surface
quality, to increase productivity and to protect both the machine and the workpiece. An investigation of chatter monitoring
in the machining process on the basis of the analysis of cutting forces and IAS in the angular domain is presented in this
paper. Cyclostationarity analysis and angular sampling are very suitable for rotating system monitoring. An experimental
design was conducted in both stable, unstable regions and at the limit of instability. Data analysis confirms the importance
of analyzing the cutting forces in the angular-frequency domain for chatter monitoring. Dynamometers and cutting force
measurement are suitable in the laboratory. Unfortunately, even if the dynamometer can be efficiently used for chatter
identification in slot milling in laboratory testing, it is not practical on production machines due to the limitation of
workpiece size, high sensitivity to overload, and high costs. Thus other descriptors must be found. Analysis of the angular
signals, their PSD and angular-frequency representation has shown good correlation between cutting forces and IAS of the
Fig. 12. Histogram of chatter indicators for both cutting force (a, b) and instantaneous angular speed (c, d).
M. Lamraoui et al. / Mechanical Systems and Signal Processing 44 (2014) 72–85 83

spindle. The method based on IAS is very practical because it does not require additional sensors and can be realized
without increasing the cost of the manufacturing system. It is thus proposed to use the IAS coming from the spindle encoder
instead of a dynamometer to detect chatter in industrial machining operations, without adding any expensive sensor.
The efficiency of two indicators for diagnosis chatter was investigated. These indicators are based on the division of the
energy between the periodic part and the residual part of a signal. A significant decrease was shown in the amplitude of the
indicator ISC1 representing the periodic part of signals and inversely a significant increase of the amplitude of the second
indicator ISC2 representing the random part of the signal when approaching the unstable region of machining. Since they
were successfully applied to cutting forces and IAS in a slot milling case, it is proposed to use these indicators combined with
IAS to monitor the chatter. These first results are thus very promising in order to develop a low cost monitoring system for
chatter detection in industrial machining operations. The work has now to be expanded to complex tool trajectory and other
tool overload problems.
Acknowledgments
This work was supported by the Region Rhône-Alpes. The authors also would like to thank the RDC program of the
Natural Sciences and Engineering Research Council of Canada for financial support. Acknowledgment also goes to
M. Zaghbani Imed and V. Songméné from the LIPPS laboratory and Bechir Badri from the Dynamo Laboratory from ETS
for their interesting comments and assistance with the experimentation.
References
[1] M. Lamraoui M.M. Thomas, M. El Badaoui, I. Zaghbani, V. Songméné, The angular Kurtosis and power: new features for machining monitoring, in: A.T.Fleury, P.R.G. Kurka (Eds.), Proceedings of the XIV International Symposium on Dynamic Problems of Mechanics (DINAME), ISSN 2179-9601, ABCM, SãoSebastião, Brazil, March 2011, pp. 494–511.
[2] J.V. Abellan-Nebot, F.R. Subirón., A review of machining monitoring systems based on artificial intelligence process models, Int. J. Adv. Manuf. Technol.47 (1–4) (2010) 1433–3015.
Fig. 13. Histogram of normalized chatter indicators for both cutting force (a, b) and instantaneous angular speed (c, d).
M. Lamraoui et al. / Mechanical Systems and Signal Processing 44 (2014) 72–8584

[3] S.Y. Liang, S.Y.,R.L. Hecker, R.G. Landers, Machining process monitoring and control: the state-of-the-art, ASME J. Manuf. Sci. Eng. 126 (2) (2004)297–310.
[4] B. Najafi, H. Hakim, A comparative study of non-parametric spectral estimators for application in machining vibration analysis, Mech. Syst. SignalProcess. 6 (1992) 551–574.
[5] J. Tlusty, Manufacturing Processes and Equipment, first ed, Prentice-Hall, Upper Saddle River, NJ, 2000.[6] R.P.H. Faassen, N. van de Wouw, J.A.J. Oosterling, H. Nijmeijer, Prediction of regenerative chatter by modelling and analysis of high-speed milling, Int. J.
Mach. Tools Manuf. 43 (2003) 1437–1446.[7] J. Tlusty, M. Polacek, The stability of machine tools against self-excited vibrations in machining, ASME Int. Res. Prod. 1 (1963) 465–474.[8] Y. Altintas, Manufacturing Automation—Metal Cutting Mechanics, Machine Tool Vibrations, and CNC Design, Cambridge University Press, Cambridge,
2000.[9] E. Kuljanic, M. Sortino, G. Totis, Multisensor approaches for chatter detection in milling, J. Sound Vib. 312 (4-5) (2008) 672–693.[10] E. Dimla, D.E. Sr, Sensor signals for tool wear monitoring in metal cutting operation-a review of methods, Int. J. Mach. Tools Manuf. 40 (8) (2000)
1073–1098.[11] A. Nayfeh, B. Balachandran, Applied Nonlinear Dynamics: Analytical Computational and Experimental Methods, John Wiley & Sons, Budapest,
Hungary, 1995.[12] T. Insperger, Stability analysis of periodic delay differential equation modeling machine tool chatter (Ph.D. thesis), Budapest University of Technology
and Economics, 2002.[13] Philip V. Bayly, Tony L. Schmitz, Gabor Stepan, Brian P. Mann, David A. Peters. Tamas Insperger, Effects of radial immersion and cutting direction on
chatter instability in end-milling, vol. 13, American Society of Mechanical Engineers, Manufacturing Engineering Division, MED, 2002; pp. 351–363.[14] S. Smith, J. Tlusty, Update on high-speed milling dynamics, J. Eng. Ind. 112 (1990) 142–149.[15] Y.S. Tarng, M.C. Chen, Intelligent sensor for detection of milling chatter, J. Intell. Manuf. 5 (3) (1994) 193–200.[16] J. Gradisek, E. Govekar, I. Grabec, Using coarse-grained entropy rate to detect chatter in cutting, J. Sound Vib. 214 (5) (1998) 941–952.[17] X.Q. Li, Y.S. Wong, A.Y.C. Nee, Tool wear and chatter detection using the coherence function of two crossed accelerations, Int. J. Mach. Tools Manuf. 37
(4) (1997) 425–435.[18] I. Zaghbani, M. Lamraoui, V. Songméné, M. Thomas, High speed machining of aluminum alloys with the robots, J. Adv. Mater. Res. 188 (2011) 584–588.[19] D. Shi, D.A. Axinte, N.N. Gindy, Development of an online machining process monitoring system: a case study of the broaching process, Int. J. Adv.
Manuf. Technol. 34 (1-2) (2007) 34–46.[20] C.S. Suh, P.P. Khurjekar, b. Yang, Characterisation and identification of dynamic instability in milling operation, Mech. Syst. Signal Process. 16 (5) (2002)
853–872.[21] M.K. Khraisheh, C. Pezeshki, A.E. Bayoumi, Time series based analysis for primary chatter in metal cutting, J. Sound Vib. 180 (1) (1995) 67–87.[22] D.R. Salgadoa, F.J. Alonso, Tool wear detection in turning operations using singular spectrum analysis, J. Mater. Process. Technol. 171 (3) (2006)
451–458.[23] M. Desbazeille, R.B. Randall, F. Guillet, M. El Badaoui, C. Hoisnard., Model-based diagnosis of large diesel engines based on angular speed variation of
the crankshaft, Mech. Syst. Signal Process. 24 (5) (2010) 1529–1541.[24] C. Stander, P. Heyns, Instantaneous angular speed monitoring of gearboxes under non-cyclic stationary load conditions, Mech. Syst. Signal Process. 19
(4) (2005) 817–835.[25] D. Rémond, J. Mahfoudh, From transmission error measurements to angular sampling in rotating machines with discrete geometry, Shock Vib. 12 (2)
(2005) 149–161.[26] S. Takata, T. Nakajimab, J.H. Ahnc, T. Satad, Tool breakage monitoring by means of fluctuations in spindle rotational speed, CIRP Ann.—Manuf. Technol.
36 (1) (1987) 49–52.[27] F. Girardin, D. Rémond, J.F. Rigal, Tool wear detection in milling An original approach with a non-dedicated sensor, Mech. Syst. Signal Process. 24 (6)
(2010) 1907–1920.[28] M. Lamraoui, M. Thomas, M. El Badaoui, I. Zaghbani, V. Songméné, New indicators based on cyclostationarity approach for machining monitoring, in:
Proceedings of the International Conference Surveillance, vol. 6, paper 29, Compiegne, France 2011, 27 pp.[29] M. Lamraoui, Thomas M., El Badaoui M., Zaghbani I., V. Songméné, The angular Kurtosis, a new diagnosis tool, in: Proceedings of the 28th Canadian
Machinery Vibration Association, Québec, Canada, vol. 2, 2010, pp. 217–240 (in French).[30] Kistler, 3-axes dynamometer type 9255, Operating and service instructions.[31] J.L. Stein, C.-H. Wang, Analysis of power monitoring on AC induction drive systems, J. Dyn. Syst. Meas. Control 112 (2) (1990) 239–249.[32] Y. Kakinuma, Y Sudo, T. Aoyama, Detection of chatter vibration in end milling applying disturbance observer, CIRP Ann. Manuf. Technol. 60 (1) (2011)
109–112.[33] J. Antoni, F. Bonnardot, A. Raad, M.E. Badaoui, Cyclostationary modelling of rotating machine vibration signals, Mech. Syst. Signal Process. 18 (2004)
1285–1314.[34] F. Gu, I. Yesilyurt, Y. Li, G. Harris, A. Ball, An investigation of the effects of measurement noise in the use of instantaneous angular speed for machine
diagnosis, Mech. Syst. Signal Process. 20 (6) (2006) 1444–1460.[35] A. Raad, J. Antoni, M. Sidahmed, Indicators of cyclostationarity: theory and application to gear fault monitoring, Mech. Syst. Signal Process. 22 (3)
(2008) 574–587.[36] R.B. Randall, J. Antoni, S. Chobsaard, The relationship between spectral correlation and envelope analysis in the diagnostics of bearing faults and other
cyclostationary machine signals, Mech. Syst. Signal Process. 15 (5) (2001) 945–962.[37] Z. Dombovari, A. Iglesias, M. Zatarain, T. Insperger, Prediction of multiple dominant chatter frequencies in milling processes, Int. J. Mach. Tools Manuf.
51 (6) (2011) 457–464.[38] I. Marinescu, D.A. Axinte., A critical analysis of effectiveness of acoustic emission signals to detect tool and workpiece malfunctions in milling
operations, Int. J. Mach. Tool 48 (10) (2008) 1148–1160.
M. Lamraoui et al. / Mechanical Systems and Signal Processing 44 (2014) 72–85 85