Instantaneous Normal Modes and the Protein Glass Transition
9
Instantaneous Normal Modes and the Protein Glass Transition Roland Schulz, † Marimuthu Krishnan, † * Isabella Daidone, ‡ and Jeremy C. Smith † † University of Tennessee/ORNL Center for Molecular Biophysics, Oak Ridge National Laboratory, Oak Ridge, Tennessee; and ‡ Interdisciplinary Center for Scientific Computing, Ruprecht Karls University-Heidelberg, Heidelberg, Germany ABSTRACT In the instantaneous normal mode method, normal mode analysis is performed at instantaneous configurations of a condensed-phase system, leading to modes with negative eigenvalues. These negative modes provide a means of character- izing local anharmonicities of the potential energy surface. Here, we apply instantaneous normal mode to analyze temperature- dependent diffusive dynamics in molecular dynamics simulations of a small protein (a scorpion toxin). Those characteristics of the negative modes are determined that correlate with the dynamical (or glass) transition behavior of the protein, as manifested as an increase in the gradient with T of the average atomic mean-square displacement at ~220 K. The number of negative eigen- values shows no transition with temperature. Further, although filtering the negative modes to retain only those with eigenvectors corresponding to double-well potentials does reveal a transition in the hydration water, again, no transition in the protein is seen. However, additional filtering of the protein double-well modes, so as to retain only those that, on energy minimization, escape to different regions of configurational space, finally leads to clear protein dynamical transition behavior. Partial minimization of instantaneous configurations is also found to remove nondiffusive imaginary modes. In summary, examination of the form of negative instantaneous normal modes is shown to furnish a physical picture of local diffusive dynamics accompanying the protein glass transition. INTRODUCTION The importance of internal dynamics in the function of proteins is widely recognized (1–3). Proteins exhibit a wide spectrum of dynamical processes ranging from localized femtosecond-timescale harmonic vibrations to collective diffusive movements with timescales up to the millisecond range or longer (4). Among the computational methods used to characterize protein dynamics are normal mode analysis (NMA) and molecular dynamics simulation (MD). NMA makes the harmonic approximation to the potential energy around an equilibrium configuration. In the realm of validity of this approximation, the dynamics is determined completely by the second-derivative (Hessian) matrix of the potential energy with respect to the mass-weighted atomic coordi- nates. The vibrational dynamics of the system around the local minimum is described by the eigenvectors and eigen- values of the Hessian matrix. Standard NMA cannot be used to characterize anharmonic dynamics. Instead, MD simulation, involving stepwise inte- gration of the equations of motion with the full, anharmonic potential, can be used. However, the analysis of MD trajec- tories to extract useful information on anharmonic motion is nontrivial. Here, we examine the application to proteins of the Instantaneous Normal Mode (INM) method, which has proven to be a useful analysis tool for diffusive dynamics in condensed phase systems (5–8). INM is a statistical mechanical theory connecting dynamic properties (e.g., diffusion constants) to equilibrium averages of the curva- tures of the potential energy surface at sample configura- tions. As in NMA, INM is based on the second derivative of the potential energy. However, unlike in NMA, the Hessian matrix is computed for snapshot configurations generated, for example, during MD or Monte Carlo simula- tion, instead of at fully energy-minimized configurations. Negative eigenvalues thus result. INM theory, which has been developed based on the concept of inherent structure (9–11) and on a random energy model (6,12–14), predicts that the self-diffusion constant and the configurational entropy are proportional to the average fraction of diffusive instantaneous normal modes (7,8,15–19). However, although much progress has been made, present theoretical derivations rely on significant approximations and still have open questions (6,8,20–28). It has therefore been necessary to employ computational techniques to examine the relation between diffusive modes and dynamical properties of liquids (15,28). Instantaneous normal modes with negative curvature are called unstable modes. To relate INM to diffusive properties filtering methods have been proposed for separating diffusive from nondiffusive unstable modes (see later) (19). Computational INM studies have been hitherto performed mainly on simple, supercooled liquids, with a focus on glass transition, mode-coupling, and crystallization behavior (6,15,23,25,27,29). These results have demonstrated that it is possible to calculate useful temperature-dependent dynam- ical properties, such as the self-diffusion constant, from INM on a small number of sampled configurations. For proteins, an integral equation connecting the fraction of unstable INM modes with the barrier height distribution has been derived and shown to aid in exploring the energy landscape Submitted August 15, 2008, and accepted for publication October 15, 2008. *Correspondence: [email protected] Editor: Nathan Andrew Baker. Ó 2009 by the Biophysical Society 0006-3495/09/01/0476/9 $2.00 doi: 10.1016/j.bpj.2008.10.007 476 Biophysical Journal Volume 96 January 2009 476–484
-
Upload
independent -
Category
Documents
-
view
0 -
download
0
Transcript of Instantaneous Normal Modes and the Protein Glass Transition

476 Biophysical Journal Volume 96 January 2009 476–484
Instantaneous Normal Modes and the Protein Glass Transition
Roland Schulz,† Marimuthu Krishnan,†* Isabella Daidone,‡ and Jeremy C. Smith†
†University of Tennessee/ORNL Center for Molecular Biophysics, Oak Ridge National Laboratory, Oak Ridge, Tennessee;and ‡Interdisciplinary Center for Scientific Computing, Ruprecht Karls University-Heidelberg, Heidelberg, Germany
ABSTRACT In the instantaneous normal mode method, normal mode analysis is performed at instantaneous configurations ofa condensed-phase system, leading to modes with negative eigenvalues. These negative modes provide a means of character-izing local anharmonicities of the potential energy surface. Here, we apply instantaneous normal mode to analyze temperature-dependent diffusive dynamics in molecular dynamics simulations of a small protein (a scorpion toxin). Those characteristics ofthe negative modes are determined that correlate with the dynamical (or glass) transition behavior of the protein, as manifestedas an increase in the gradient with T of the average atomic mean-square displacement at ~220 K. The number of negative eigen-values shows no transition with temperature. Further, although filtering the negative modes to retain only those with eigenvectorscorresponding to double-well potentials does reveal a transition in the hydration water, again, no transition in the protein is seen.However, additional filtering of the protein double-well modes, so as to retain only those that, on energy minimization, escapeto different regions of configurational space, finally leads to clear protein dynamical transition behavior. Partial minimization ofinstantaneous configurations is also found to remove nondiffusive imaginary modes. In summary, examination of the form ofnegative instantaneous normal modes is shown to furnish a physical picture of local diffusive dynamics accompanying the proteinglass transition.
INTRODUCTION
The importance of internal dynamics in the function of
proteins is widely recognized (1–3). Proteins exhibit
a wide spectrum of dynamical processes ranging from
localized femtosecond-timescale harmonic vibrations to
collective diffusive movements with timescales up to the
millisecond range or longer (4).
Among the computational methods used to characterize
protein dynamics are normal mode analysis (NMA) and
molecular dynamics simulation (MD). NMA makes the
harmonic approximation to the potential energy around an
equilibrium configuration. In the realm of validity of this
approximation, the dynamics is determined completely by
the second-derivative (Hessian) matrix of the potential
energy with respect to the mass-weighted atomic coordi-
nates. The vibrational dynamics of the system around the
local minimum is described by the eigenvectors and eigen-
values of the Hessian matrix.
Standard NMA cannot be used to characterize anharmonic
dynamics. Instead, MD simulation, involving stepwise inte-
gration of the equations of motion with the full, anharmonic
potential, can be used. However, the analysis of MD trajec-
tories to extract useful information on anharmonic motion is
nontrivial. Here, we examine the application to proteins of
the Instantaneous Normal Mode (INM) method, which has
proven to be a useful analysis tool for diffusive dynamics
in condensed phase systems (5–8). INM is a statistical
mechanical theory connecting dynamic properties (e.g.,
diffusion constants) to equilibrium averages of the curva-
Submitted August 15, 2008, and accepted for publication October 15, 2008.
*Correspondence: [email protected]
Editor: Nathan Andrew Baker.
� 2009 by the Biophysical Society
0006-3495/09/01/0476/9 $2.00
tures of the potential energy surface at sample configura-
tions. As in NMA, INM is based on the second derivative
of the potential energy. However, unlike in NMA, the
Hessian matrix is computed for snapshot configurations
generated, for example, during MD or Monte Carlo simula-
tion, instead of at fully energy-minimized configurations.
Negative eigenvalues thus result.
INM theory, which has been developed based on the
concept of inherent structure (9–11) and on a random energy
model (6,12–14), predicts that the self-diffusion constant
and the configurational entropy are proportional to the
average fraction of diffusive instantaneous normal modes
(7,8,15–19). However, although much progress has been
made, present theoretical derivations rely on significant
approximations and still have open questions (6,8,20–28).
It has therefore been necessary to employ computational
techniques to examine the relation between diffusive modes
and dynamical properties of liquids (15,28). Instantaneous
normal modes with negative curvature are called unstable
modes. To relate INM to diffusive properties filtering
methods have been proposed for separating diffusive from
nondiffusive unstable modes (see later) (19).
Computational INM studies have been hitherto performed
mainly on simple, supercooled liquids, with a focus on glass
transition, mode-coupling, and crystallization behavior
(6,15,23,25,27,29). These results have demonstrated that it
is possible to calculate useful temperature-dependent dynam-
ical properties, such as the self-diffusion constant, from INM
on a small number of sampled configurations. For proteins,
an integral equation connecting the fraction of unstable
INM modes with the barrier height distribution has been
derived and shown to aid in exploring the energy landscape
doi: 10.1016/j.bpj.2008.10.007

Instantaneous Normal Modes of Proteins 477
(30,31). Also, vibrational energy relaxation rates of selected
vibrational modes of proteins have been computed using
INM analysis (32). However, research connecting dynamical
properties to unstable INM modes has not been documented
for proteins. The goal in this work is to investigate this
connection, and we examine which INM properties are
related to diffusive dynamics in proteins.
We concentrate on the dynamical or glass transition in
internal protein dynamics. Many experiments and simula-
tions (33–39) have shown that, for proteins at 180–220 K,
the average mean-square displacement exhibits a change in
gradient with temperature, involving the excitation of anhar-
monic displacements (40,41). The role of hydration in the
dynamical transition is an area of active research (37,42,43).
Calculations are performed here for a small protein as a func-
tion of temperature to determine which INM properties are
related to the physical nature of the transition. As for liquids,
it is essential to accurately compute the subset of unstable
modes from the set of negative modes, and so the filtering
methods proposed for liquids are evaluated here for proteins.
It is found that the number of unfiltered negative-eigenvalue
modes does not correlate with dynamical transition behavior.
However, selection of double-well modes that escape to dis-
tinct regions of configurational space does mirror the behavior
of the temperature-dependent mean-square displacement.
METHODS
We first provide a brief overview of INM filtering methods. INM studies on
simple liquids have shown that some negative modes are not connected to
diffusion (26). Therefore, the nondiffusive negative modes should be filtered
out. In an early study on a Lennard-Jones liquid (6), the filtering was per-
formed by subtracting the number of negative modes observed for a crystal
(none of which are diffusive) from the number of negative modes for the
liquid. After this work, a cutoff-based filtering method was proposed in
which those unstable modes with frequency juj above a cutoff value were
considered to be diffusive (19). However, it was found that both of the above
filtering methods are material-specific. Subsequently, improved filtering
methods were developed, based on the topology of the potential energy land-
scape (16,22), and these will now be outlined.
In the double-well filtering method, one-dimensional potential energy
profiles along the negative modes are calculated and used to classify them
into double-well or shoulder modes (22,44). For the double-well modes,
the one-dimensional potential energy profiles consist of two minima sepa-
rated by a barrier, while the shoulder modes exhibit single wells with shoul-
ders. It has been suggested that double-well modes are diffusive whereas
shoulder modes are not, and therefore the diffusive dynamics should be
associated only with the former (27). The filtering was further refined by
classifying the double-well modes as extended or localized depending on
the fraction of atoms that participate in these modes (22), the extended
double-well modes being assumed to make the primary contribution to the
diffusive dynamics. However, it was later demonstrated that the double-
well filtering method failed to provide a satisfactory description of the diffu-
sive dynamics of various materials, particularly ionic melts (45). Moreover,
it was shown that, for some double-well modes, quenching from either side
of the barrier converged to the same inherent structure, thus suggesting that
these double-well modes do not play any special role in diffusion (26).
A further problem arises when the one-dimensional potential energy
profile is computed along a straight-line in the direction of the eigenvector
computed at the instantaneous configuration. Because of the anharmonicity
of the energy landscape, the frequency, and thus curvature, changes quickly
along this line, due to a fast increase of the potential energy arising from van
der Waals repulsion between neighboring atoms (16). This fast increase
prohibits finding more distant saddles, and hence the evaluated number of
double-well modes corresponds to only those double wells with close-by
saddles.
The finding that double-well modes do not always minimize to different
inherent structure basins led to the definition of escape modes (16,46). In
escape filtering, the configurations corresponding to the two one-
dimensional minima along the mode on either side of the saddle are mini-
mized. An inherent structure basin is defined as the region of the potential
energy surface that minimizes to the same point. By quenching the config-
urations corresponding to one-dimensional minima, it is possible to deter-
mine whether or not these minima belong to the same inherent structure
basin. Those modes for which the minima do not belong to the same basin
are escape or true double-well modes, the others being false double-well
modes. In an analysis of liquid water, the temperature dependence of the
number of escape modes was found to exhibit a behavior similar to that
of the self-diffusion constant (15,21).
As well as the energy landscape-based methods discussed above, two
minimization-based methods have been suggested: the saddle-order (SO)
and the partial quenching (PQ) methods. The SO method suggests that by
minimizing the squared gradient of the potential energy (jVUj2) the system
can be driven to the nearest stationary point (which can be a minimum or
a saddle). The number of imaginary frequency modes calculated at the
stationary point gives an estimate of the saddle order and thus the number
of diffusive modes (47).
In the PQ approach the instantaneous configuration is partially quenched
and the INM analysis performed at the partially quenched configuration so
as to remove spurious, nondiffusive, negative modes. It has been found
that the negative nondiffusive modes in a Lennard-Jones crystal vanish after
the first minimization steps, while only the diffusive modes persist in the
liquid state (47).
For all the filtering methods described above, linear proportionality to the
self-diffusion constant was found for at least some materials. The computa-
tional methods used here to examine the relation between the self-diffusion
constant and the number of diffusive modes for proteins will be discussed in
the next section.
Simulation details
MD simulations were performed on Toxin II from the Scorpion Androctonus
australis Hector (PDB (48) id: 1PTX), solved at 1.3 A resolution (49), in the
crystalline state. This protein was chosen for computational convenience, as it
is small enough (64 residues) to permit ready evaluation of a large number of
Hessian matrices for all atoms in a unit cell replicated with periodic boundary
conditions. Toxin II crystallizes in an orthorhombic unit cell with the
following lattice parameters: a ¼ 45.94 A, b ¼ 40.68 A, and c ¼ 29.93 A.
The unit cell consists of four proteins. Explicit water molecules that were
resolved in the crystallographic analysis were included, i.e., 107 water mole-
cules per protein molecule. This model of a partially hydrated protein in crys-
talline form, although experimentally unrealizable, provides an appropriate
model of a powder system as has been used in neutron scattering experiments
on the dynamical transition and corresponding simulations (50).
Calculations were performed with the CHARMM program (51) using
the CHARMM27 force field (52). Water molecules were represented by
the TIP3P model (53). Electrostatic interactions were computed using the
particle mesh Ewald method (54) for which the direct sum cutoff was
14 A and the reciprocal space interaction were computed on a 48 � 48 �32 grid using sixth-degree B-splines.
Simulations were carried out in the isothermal-isobaric (NPT) ensemble at
temperatures starting at 20 K and increasing to 300 K in steps of 20 K. The
system at each temperature was equilibrated for 1 ns followed by a produc-
tion run of 1 ns during which atomic coordinates were written out every
50 fs. The starting structure for each temperature was the final structure from
the preceding temperature.
Biophysical Journal 96(2) 476–484

478 Krishnan et al.
For each temperature, 40 equally spaced configurations (separated by
5 ps) were extracted from the last 200-ps segment of MD trajectory and
were used for the INM analysis. For mean-square displacement (MSD)
computations, the full production run was used. This procedure determines
whether the diffusion constant calculated using the INM analysis from a few
configurations over a short timescale can furnish information pertaining to
the diffusion constant computed from the MSD of a longer trajectory.
The computation of the Hessian matrix followed by its diagonalization is
computationally demanding for a complex system studied here (with long-
range electrostatic interactions treated with PME). In this investigation,
the Hessian matrices were computed with a finite difference method using
CHARMM on a single processor. The finite difference method computes
the first derivative of the energy function (the force) for a small displacement
to either side of the minimum for each of the 3N directions (where N is the
number of atoms). In total, ~660 Hessian matrices were calculated (with finite
difference method followed by diagonalization), each requiring ~6.5 CPU
hours for the system studied here. Compute times are summarized in Table 1.
The landscape-based filtering methods were implemented in the
CHARMM program as follows. The eigenvectors and the atomic coordi-
nates were read and one-dimensional energy profiles calculated by displac-
ing the atomic coordinates along the eigenvector directions. An energy
threshold of 0.6 kcal/mol was used for exploring the potential energy profile.
The energy profiles were used to classify the imaginary modes into shoulder
or double-well types. In total, there were ~400,000 negative modes (evalu-
ated at 600 instantaneous configurations) and all modes were thus classified.
To identify escape modes, the configurations corresponding to the two
one-dimensional minima along each double-well mode were energy-mini-
mized. The adopted basis Newton-Raphson (ABNR) method was used for
these minimizations. After the minimization, the RMS distance between
the pair of quenched configurations was computed. It was assumed that
the minimized structures converge to a single minimum if the RMS distance
is less than a threshold value. The number of minimization steps (1000 steps)
and the distance cutoff (0.01–0.02 A) were chosen after a few convergence
tests. The same procedure was applied to both the double-well and shoulder
modes so as to determine which of these types behave like escape modes.
For shoulder modes, the starting structures were chosen either with energy
or distance criteria.
The two minimization-based methods were implemented in CHARMM.
In the PQ method, instantaneous configurations were partially minimized
for 4–16 steps and the Hessian matrices computed and diagonalized so as
to determine the fraction of unstable modes.
The SO method uses generalized stationary points on the potential energy
landscape to describe the diffusive dynamics (47). In this method, the
squared gradient of the potential energy is minimized, leading to minima and
saddles around the instantaneous configurations. Here again the second-
derivative matrix was required, to minimize the squared gradient, thus
making this procedure computationally intensive.
RESULTS
The mean-square displacement (MSD) averaged over the
atoms as a function of temperature was calculated from the
MD trajectories, and the self-diffusion constant computed
TABLE 1 Approximate CPU times for the INM analysis of
scorpion toxin at 15 temperatures on an ~2 GHz CPU (see text
for number of configurations)
Computation CPU-time
Double-well filtering 300 days
Minimization for escape filtering 2 years
Escape filtering 3 years
Partial minimization (45 matrices) 10 days
Gradient minimization 10 days
Biophysical Journal 96(2) 476–484
from the long-time slope of the time-dependent MSD. In
Fig. 1 is shown the temperature dependence of the diffusion
constant for both the whole system (including the solvent)
and the protein. A significant change in the diffusion
constant at ~220 K is evident, originating from the dynam-
ical transition as observed in many biological systems
(1,2,33,37,42,55–67). The temperature dependence of the
diffusion constant in Fig. 1 was used as a benchmark with
which to compare the INM results.
As a first necessary step for the INM method, the Hessian
matrices were computed. This was performed from the simu-
lations of 15 temperatures, for 40 configurations each, taken
from the last 200 ps of the MD production runs in steps of
5 ps. In Fig. 2 is shown the number of imaginary frequency
modes (Fu) as a function of temperature. As expected, Fu
increases with temperature, as anharmonic regions of the
potential energy surface become explored. However, unlike
the diffusion constant, Fu does not exhibit any slope change
at ~220 K and instead shows an almost constant slope. Thus,
it is evident that Fu cannot be equated with D and does not
adequately describe internal diffusion in proteins.
In the landscape-based filtering methods the energy
profiles are explored by evaluating the potential energy along
the modes. Inspection of the profiles revealed that a small
FIGURE 1 Diffusion constant of the protein (squares, scaled by 10�) and
the full system (circles) as a function of temperature.
FIGURE 2 Number of negative modes (Fu) as a function of temperature.
The total number of modes (negative and positive) is 15,348.
Instantaneous Normal Modes of Proteins 479
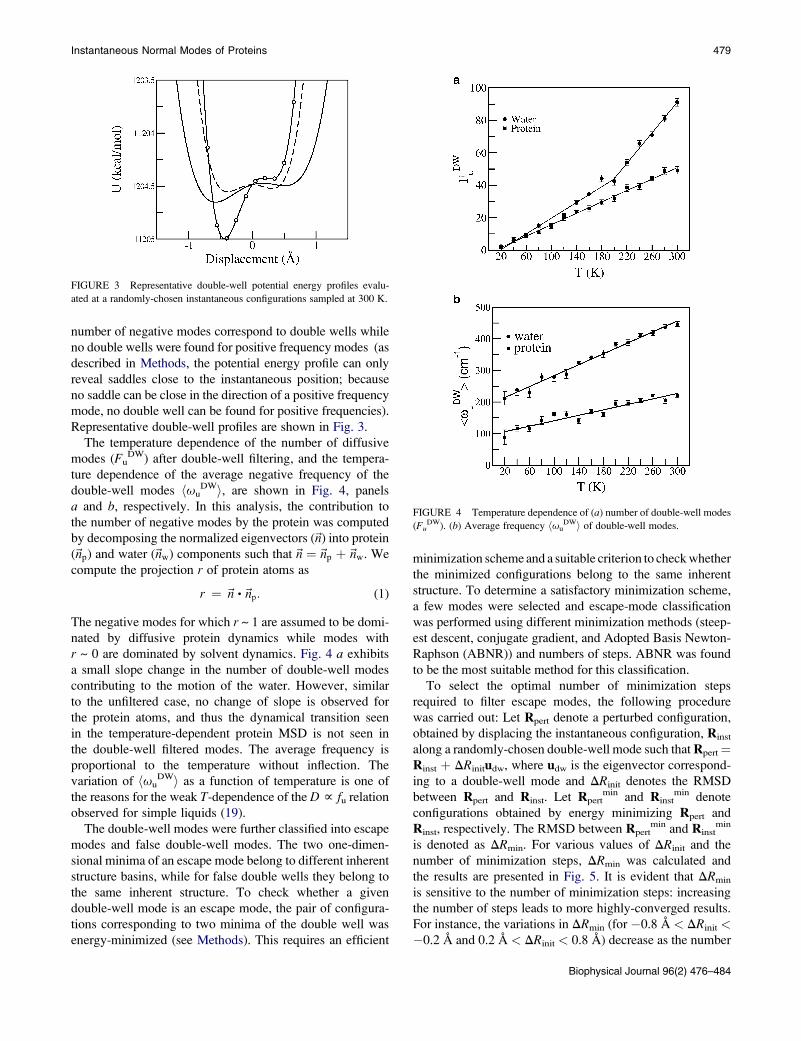
number of negative modes correspond to double wells while
no double wells were found for positive frequency modes (as
described in Methods, the potential energy profile can only
reveal saddles close to the instantaneous position; because
no saddle can be close in the direction of a positive frequency
mode, no double well can be found for positive frequencies).
Representative double-well profiles are shown in Fig. 3.
The temperature dependence of the number of diffusive
modes (FuDW) after double-well filtering, and the tempera-
ture dependence of the average negative frequency of the
double-well modes huuDWi, are shown in Fig. 4, panels
a and b, respectively. In this analysis, the contribution to
the number of negative modes by the protein was computed
by decomposing the normalized eigenvectors (~n) into protein
(~np) and water (~nw) components such that~n ¼~np þ~nw. We
compute the projection r of protein atoms as
r ¼ ~n ,~np: (1)
The negative modes for which r ~ 1 are assumed to be domi-
nated by diffusive protein dynamics while modes with
r ~ 0 are dominated by solvent dynamics. Fig. 4 a exhibits
a small slope change in the number of double-well modes
contributing to the motion of the water. However, similar
to the unfiltered case, no change of slope is observed for
the protein atoms, and thus the dynamical transition seen
in the temperature-dependent protein MSD is not seen in
the double-well filtered modes. The average frequency is
proportional to the temperature without inflection. The
variation of huuDWi as a function of temperature is one of
the reasons for the weak T-dependence of the D f fu relation
observed for simple liquids (19).
The double-well modes were further classified into escape
modes and false double-well modes. The two one-dimen-
sional minima of an escape mode belong to different inherent
structure basins, while for false double wells they belong to
the same inherent structure. To check whether a given
double-well mode is an escape mode, the pair of configura-
tions corresponding to two minima of the double well was
energy-minimized (see Methods). This requires an efficient
FIGURE 3 Representative double-well potential energy profiles evalu-
ated at a randomly-chosen instantaneous configurations sampled at 300 K.
minimization scheme and a suitable criterion to check whether
the minimized configurations belong to the same inherent
structure. To determine a satisfactory minimization scheme,
a few modes were selected and escape-mode classification
was performed using different minimization methods (steep-
est descent, conjugate gradient, and Adopted Basis Newton-
Raphson (ABNR)) and numbers of steps. ABNR was found
to be the most suitable method for this classification.
To select the optimal number of minimization steps
required to filter escape modes, the following procedure
was carried out: Let Rpert denote a perturbed configuration,
obtained by displacing the instantaneous configuration, Rinst
along a randomly-chosen double-well mode such that Rpert¼Rinst þ DRinitudw, where udw is the eigenvector correspond-
ing to a double-well mode and DRinit denotes the RMSD
between Rpert and Rinst. Let Rpertmin and Rinst
min denote
configurations obtained by energy minimizing Rpert and
Rinst, respectively. The RMSD between Rpertmin and Rinst
min
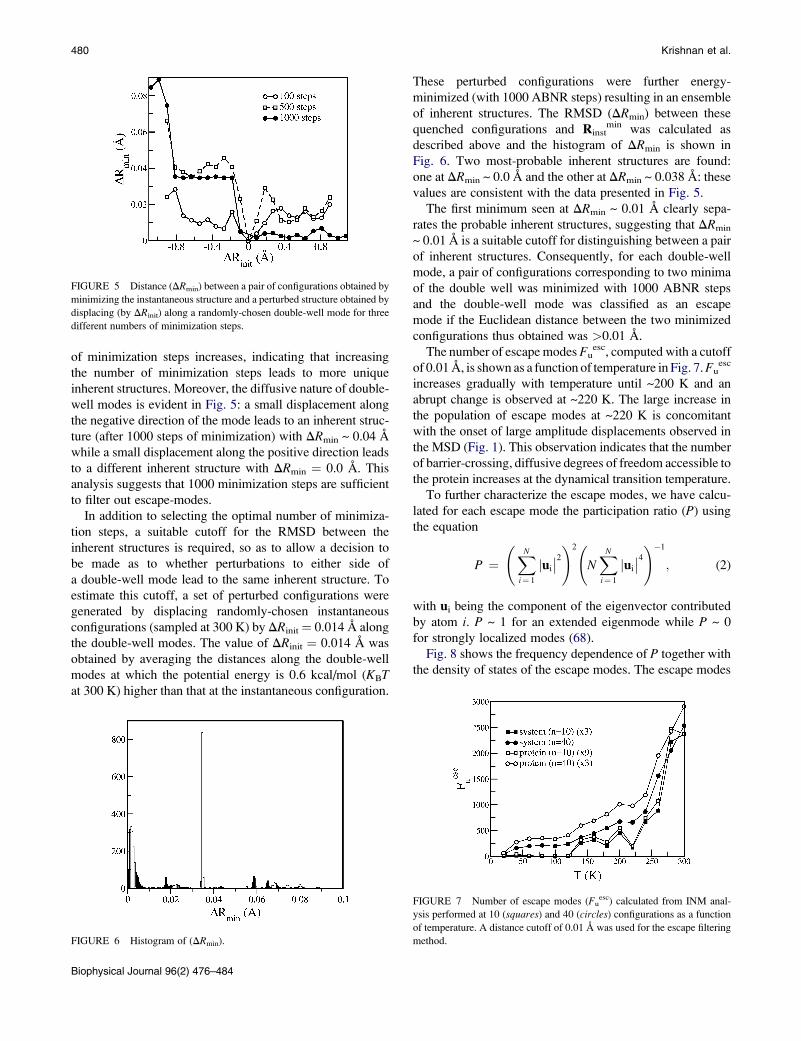
is denoted as DRmin. For various values of DRinit and the
number of minimization steps, DRmin was calculated and
the results are presented in Fig. 5. It is evident that DRmin
is sensitive to the number of minimization steps: increasing
the number of steps leads to more highly-converged results.
For instance, the variations in DRmin (for �0.8 A < DRinit <�0.2 A and 0.2 A < DRinit < 0.8 A) decrease as the number
FIGURE 4 Temperature dependence of (a) number of double-well modes
(FuDW). (b) Average frequency huu
DWi of double-well modes.
Biophysical Journal 96(2) 476–484
480 Krishnan et al.
of minimization steps increases, indicating that increasing
the number of minimization steps leads to more unique
inherent structures. Moreover, the diffusive nature of double-
well modes is evident in Fig. 5: a small displacement along
the negative direction of the mode leads to an inherent struc-
ture (after 1000 steps of minimization) with DRmin ~ 0.04 A
while a small displacement along the positive direction leads
to a different inherent structure with DRmin ¼ 0.0 A. This
analysis suggests that 1000 minimization steps are sufficient
to filter out escape-modes.
In addition to selecting the optimal number of minimiza-
tion steps, a suitable cutoff for the RMSD between the
inherent structures is required, so as to allow a decision to
be made as to whether perturbations to either side of
a double-well mode lead to the same inherent structure. To
estimate this cutoff, a set of perturbed configurations were
generated by displacing randomly-chosen instantaneous
configurations (sampled at 300 K) by DRinit¼ 0.014 A along
the double-well modes. The value of DRinit ¼ 0.014 A was
obtained by averaging the distances along the double-well
modes at which the potential energy is 0.6 kcal/mol (KBTat 300 K) higher than that at the instantaneous configuration.
FIGURE 5 Distance (DRmin) between a pair of configurations obtained by
minimizing the instantaneous structure and a perturbed structure obtained by
displacing (by DRinit) along a randomly-chosen double-well mode for three
different numbers of minimization steps.
FIGURE 6 Histogram of (DRmin).
Biophysical Journal 96(2) 476–484
These perturbed configurations were further energy-
minimized (with 1000 ABNR steps) resulting in an ensemble
of inherent structures. The RMSD (DRmin) between these
quenched configurations and Rinstmin was calculated as
described above and the histogram of DRmin is shown in
Fig. 6. Two most-probable inherent structures are found:
one at DRmin ~ 0.0 A and the other at DRmin ~ 0.038 A: these
values are consistent with the data presented in Fig. 5.
The first minimum seen at DRmin ~ 0.01 A clearly sepa-
rates the probable inherent structures, suggesting that DRmin
~ 0.01 A is a suitable cutoff for distinguishing between a pair
of inherent structures. Consequently, for each double-well
mode, a pair of configurations corresponding to two minima
of the double well was minimized with 1000 ABNR steps
and the double-well mode was classified as an escape
mode if the Euclidean distance between the two minimized
configurations thus obtained was >0.01 A.
The number of escape modes Fuesc, computed with a cutoff
of 0.01 A, is shown as a function of temperature in Fig. 7. Fuesc
increases gradually with temperature until ~200 K and an
abrupt change is observed at ~220 K. The large increase in
the population of escape modes at ~220 K is concomitant
with the onset of large amplitude displacements observed in
the MSD (Fig. 1). This observation indicates that the number
of barrier-crossing, diffusive degrees of freedom accessible to
the protein increases at the dynamical transition temperature.
To further characterize the escape modes, we have calcu-
lated for each escape mode the participation ratio (P) using
the equation
P ¼ XN
i¼ 1
jui
��2!2 NXN
i¼ 1
jui
��4!�1
; (2)
with ui being the component of the eigenvector contributed
by atom i. P ~ 1 for an extended eigenmode while P ~ 0
for strongly localized modes (68).
Fig. 8 shows the frequency dependence of P together with
the density of states of the escape modes. The escape modes
FIGURE 7 Number of escape modes (Fuesc) calculated from INM anal-
ysis performed at 10 (squares) and 40 (circles) configurations as a function
of temperature. A distance cutoff of 0.01 A was used for the escape filtering
method.
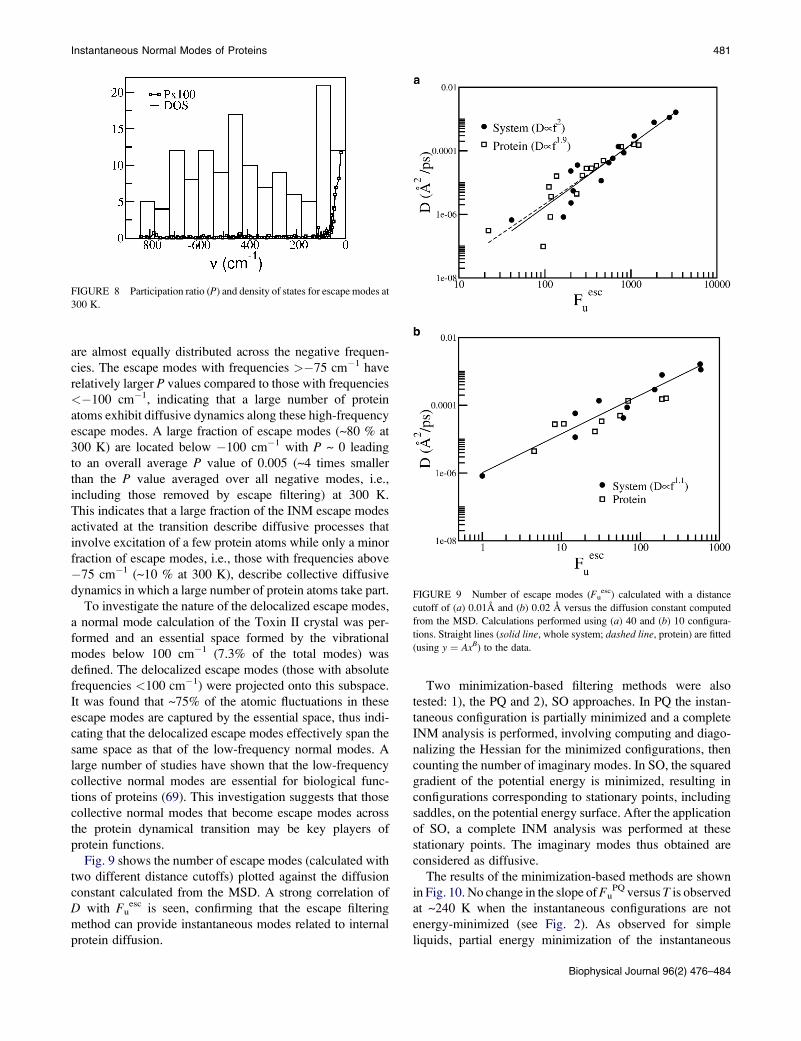
are almost equally distributed across the negative frequen-
cies. The escape modes with frequencies >�75 cm�1 have
relatively larger P values compared to those with frequencies
<�100 cm�1, indicating that a large number of protein
atoms exhibit diffusive dynamics along these high-frequency
escape modes. A large fraction of escape modes (~80 % at
300 K) are located below �100 cm�1 with P ~ 0 leading
to an overall average P value of 0.005 (~4 times smaller
than the P value averaged over all negative modes, i.e.,
including those removed by escape filtering) at 300 K.
This indicates that a large fraction of the INM escape modes
activated at the transition describe diffusive processes that
involve excitation of a few protein atoms while only a minor
fraction of escape modes, i.e., those with frequencies above
�75 cm�1 (~10 % at 300 K), describe collective diffusive
dynamics in which a large number of protein atoms take part.
To investigate the nature of the delocalized escape modes,
a normal mode calculation of the Toxin II crystal was per-
formed and an essential space formed by the vibrational
modes below 100 cm�1 (7.3% of the total modes) was
defined. The delocalized escape modes (those with absolute
frequencies <100 cm�1) were projected onto this subspace.
It was found that ~75% of the atomic fluctuations in these
escape modes are captured by the essential space, thus indi-
cating that the delocalized escape modes effectively span the
same space as that of the low-frequency normal modes. A
large number of studies have shown that the low-frequency
collective normal modes are essential for biological func-
tions of proteins (69). This investigation suggests that those
collective normal modes that become escape modes across
the protein dynamical transition may be key players of
protein functions.
Fig. 9 shows the number of escape modes (calculated with
two different distance cutoffs) plotted against the diffusion
constant calculated from the MSD. A strong correlation of
D with Fuesc is seen, confirming that the escape filtering
method can provide instantaneous modes related to internal
protein diffusion.
FIGURE 8 Participation ratio (P) and density of states for escape modes at
300 K.
Instantaneous Normal Modes of Proteins
Two minimization-based filtering methods were also
tested: 1), the PQ and 2), SO approaches. In PQ the instan-
taneous configuration is partially minimized and a complete
INM analysis is performed, involving computing and diago-
nalizing the Hessian for the minimized configurations, then
counting the number of imaginary modes. In SO, the squared
gradient of the potential energy is minimized, resulting in
configurations corresponding to stationary points, including
saddles, on the potential energy surface. After the application
of SO, a complete INM analysis was performed at these
stationary points. The imaginary modes thus obtained are
considered as diffusive.
The results of the minimization-based methods are shown
in Fig. 10. No change in the slope of FuPQ versus T is observed
at ~240 K when the instantaneous configurations are not
energy-minimized (see Fig. 2). As observed for simple
liquids, partial energy minimization of the instantaneous
FIGURE 9 Number of escape modes (Fuesc) calculated with a distance
cutoff of (a) 0.01A and (b) 0.02 A versus the diffusion constant computed
from the MSD. Calculations performed using (a) 40 and (b) 10 configura-
tions. Straight lines (solid line, whole system; dashed line, protein) are fitted
(using y ¼ AxB) to the data.
Biophysical Journal 96(2) 476–484
481
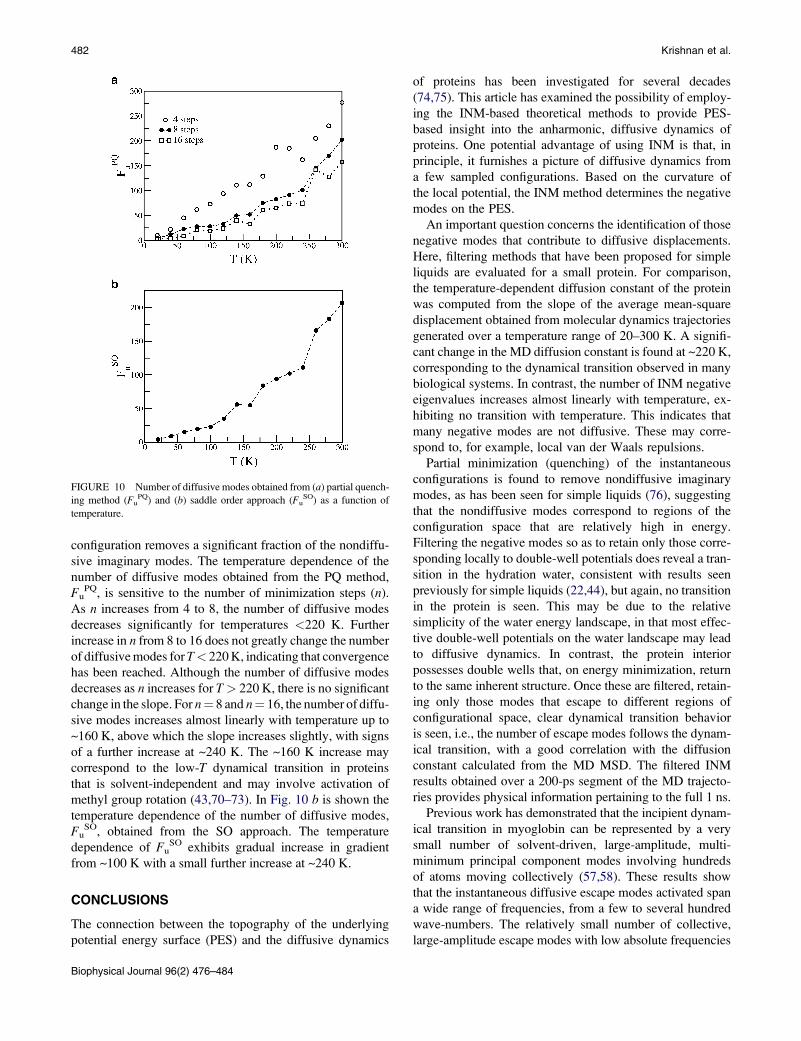
configuration removes a significant fraction of the nondiffu-
sive imaginary modes. The temperature dependence of the
number of diffusive modes obtained from the PQ method,
FuPQ, is sensitive to the number of minimization steps (n).
As n increases from 4 to 8, the number of diffusive modes
decreases significantly for temperatures <220 K. Further
increase in n from 8 to 16 does not greatly change the number
of diffusive modes for T< 220 K, indicating that convergence
has been reached. Although the number of diffusive modes
decreases as n increases for T> 220 K, there is no significant
change in the slope. For n¼ 8 and n¼ 16, the number of diffu-
sive modes increases almost linearly with temperature up to
~160 K, above which the slope increases slightly, with signs
of a further increase at ~240 K. The ~160 K increase may
correspond to the low-T dynamical transition in proteins
that is solvent-independent and may involve activation of
methyl group rotation (43,70–73). In Fig. 10 b is shown the
temperature dependence of the number of diffusive modes,
FuSO, obtained from the SO approach. The temperature
dependence of FuSO exhibits gradual increase in gradient
from ~100 K with a small further increase at ~240 K.
CONCLUSIONS
The connection between the topography of the underlying
potential energy surface (PES) and the diffusive dynamics
FIGURE 10 Number of diffusive modes obtained from (a) partial quench-
ing method (FuPQ) and (b) saddle order approach (Fu
SO) as a function of
temperature.
Biophysical Journal 96(2) 476–484
482
of proteins has been investigated for several decades
(74,75). This article has examined the possibility of employ-
ing the INM-based theoretical methods to provide PES-
based insight into the anharmonic, diffusive dynamics of
proteins. One potential advantage of using INM is that, in
principle, it furnishes a picture of diffusive dynamics from
a few sampled configurations. Based on the curvature of
the local potential, the INM method determines the negative
modes on the PES.
An important question concerns the identification of those
negative modes that contribute to diffusive displacements.
Here, filtering methods that have been proposed for simple
liquids are evaluated for a small protein. For comparison,
the temperature-dependent diffusion constant of the protein
was computed from the slope of the average mean-square
displacement obtained from molecular dynamics trajectories
generated over a temperature range of 20–300 K. A signifi-
cant change in the MD diffusion constant is found at ~220 K,
corresponding to the dynamical transition observed in many
biological systems. In contrast, the number of INM negative
eigenvalues increases almost linearly with temperature, ex-
hibiting no transition with temperature. This indicates that
many negative modes are not diffusive. These may corre-
spond to, for example, local van der Waals repulsions.
Partial minimization (quenching) of the instantaneous
configurations is found to remove nondiffusive imaginary
modes, as has been seen for simple liquids (76), suggesting
that the nondiffusive modes correspond to regions of the
configuration space that are relatively high in energy.
Filtering the negative modes so as to retain only those corre-
sponding locally to double-well potentials does reveal a tran-
sition in the hydration water, consistent with results seen
previously for simple liquids (22,44), but again, no transition
in the protein is seen. This may be due to the relative
simplicity of the water energy landscape, in that most effec-
tive double-well potentials on the water landscape may lead
to diffusive dynamics. In contrast, the protein interior
possesses double wells that, on energy minimization, return
to the same inherent structure. Once these are filtered, retain-
ing only those modes that escape to different regions of
configurational space, clear dynamical transition behavior
is seen, i.e., the number of escape modes follows the dynam-
ical transition, with a good correlation with the diffusion
constant calculated from the MD MSD. The filtered INM
results obtained over a 200-ps segment of the MD trajecto-
ries provides physical information pertaining to the full 1 ns.
Previous work has demonstrated that the incipient dynam-
ical transition in myoglobin can be represented by a very
small number of solvent-driven, large-amplitude, multi-
minimum principal component modes involving hundreds
of atoms moving collectively (57,58). These results show
that the instantaneous diffusive escape modes activated span
a wide range of frequencies, from a few to several hundred
wave-numbers. The relatively small number of collective,
large-amplitude escape modes with low absolute frequencies
Krishnan et al.
will make the largest contribution to the diffusive MSD and
are likely to bear similarities with the largest-amplitude prin-
cipal components. Interestingly, however, a number of rela-
tively localized, low-amplitude escape modes with high
absolute frequencies also exist.
This analysis demonstrates that the negative normal
modes derived from instantaneous protein configurations
furnish, after appropriate filtering, a physical picture of local
diffusive dynamics accompanying protein glass transition
behavior. It will be of interest in the future to understand
the environmental and functional relevance of the diffusive
and nondiffusive imaginary modes in biological macromo-
lecular systems, and to examine their relationship to
measurable quantities such as, for example, neutron spectro-
scopic intensities.
This research was supported by a Department of Energy Laboratory-
Directed Research and Development grant to J.C.S.
REFERENCES
1. Daniel, R. M., J. C. Smith, M. Ferrand, S. Hery, R. Dunn, et al. 1998.Enzyme activity below the dynamical transition at 220 K. Biophys. J.75:2504–2507.
2. Daniel, R. M., R. V. Dunn, J. L. Finney, and J. C. Smith. 2003. The roleof dynamics in enzyme activity. Annu. Rev. Biophys. Biomol. Struct.32:69–92.
3. Frauenfelder, H., F. Parak, and R. D. Young. 1988. Conformationalsubstates in proteins. Annu. Rev. Biophys. Biomol. Struct. 17:451–479.
4. Brooks III, C. L., M. Karplus, and B. M. Pettitt. 1988. Proteins: A Theo-retical Perspective of Dynamics. Structure, and Thermodynamics. JohnWiley & Sons, New York, NY.
5. Seeley, G., and T. Keyes. 1989. Normal-mode analysis of liquid-statedynamics. J. Chem. Phys. 91:5581–5586.
6. Madan, B., and T. Keyes. 1993. Unstable modes in liquids density ofstates, potential energy, and heat capacity. J. Chem. Phys. 98:3342–3350.
7. Keyes, T. 1994. Unstable modes in supercooled and normal liquids:density of states, energy barriers, and self-diffusion. J. Chem. Phys.101:5081–5092.
8. Keyes, T. 1997. Instantaneous normal mode approach to liquid statedynamics. J. Phys. Chem. A. 101:2921–2930.
9. Stillinger, F. H., and T. A. Weber. 1983. Dynamics of structural transi-tions in liquids. Phys. Rev. A. 28:2408–2416.
10. Stillinger, F. H., and T. A. Weber. 1983. Inherent structure in water. J.Phys. Chem. 87:2833–2840.
11. Elber, R., and M. Karplus. 1987. Multiple conformational states ofproteins: a molecular dynamics analysis of myoglobin. Science.235:318–321.
12. Derrida, B. 1981. Random-energy model: an exactly solvable model ofdisordered systems. Phys. Rev. B. 24:2613–2626.
13. Bryngleson, J. D., and P. G. Wolynes. 1989. Intermediates and barriercrossing in a random energy model(with applications to proteinfolding). J. Phys. Chem. 93:6902–6915.
14. Keyes, T., J. Chowdhary, and J. Kim. 2002. Random energy model fordynamics in supercooled liquids: N dependence. Phys. Rev. E.66:051110.
15. La Nave, E., A. Scala, F. W. Starr, F. Sciortino, and H. E. Stanley. 2000.Instantaneous normal mode analysis of supercooled water. Phys. Rev.Lett. 84:4605–4608.
16. La Nave, E., A. Scala, F. W. Starr, H. E. Stanley, and F. Sciortino. 2001.Dynamics of supercooled water in configuration space. Phys. Rev. E.64:036102.
Instantaneous Normal Modes of Proteins
17. La Nave, E., H. E. Stanley, and F. Sciortino. 2002. Configuration space
connectivity across the fragile-to-strong transition in silica. Phys. Rev.Lett. 88:035501.
18. Keyes, T. 2000. Entropy, dynamics, and instantaneous normal modes in
a random energy model. Phys. Rev. E. 62:7905–7908.
19. Keyes, T. 2006. Imaginary frequency, unstable modes, and relaxation
dynamics in liquids. In Normal Mode Analysis: Theory and Applica-
tions to Biological and Chemical Systems. Q. Cui and I. Bahar, editors.
Chapman and Hall/CRC, Boca Raton, FL. 253–279.
20. Moore, P., and T. Keyes. 1994. Normal mode analysis of liquid CS2:
velocity correlation functions and self-diffusion constants. J. Chem.Phys. 100:6709–6717.
21. Cho, M. 1994. Instantaneous normal mode analysis of liquid water.
J. Chem. Phys. 100:6672–6683.
22. Bembenek, S. D., and B. B. Laird. 1995. Instantaneous normal modes
and the glass transition. Phys. Rev. Lett. 74:936–939.
23. Keyes, T., G. V. Vijayadamodar, and U. Zurcher. 1997. An instanta-
neous normal mode description of relaxation in supercooled liquids.
J. Chem. Phys. 106:4651–4657.
24. Li, W. X., and T. Keyes. 1997. Pure translation instantaneous normal
modes: imaginary frequency contributions vanish at the glass transition
in CS2. J. Chem. Phys. 107:7275–7277.
25. Sciortino, F., and P. Tartaglia. 1997. Harmonic dynamics in super-
cooled liquids: the case of water. Phys. Rev. Lett. 78:2385–2388.
26. Gezelter, J. D., E. Rabani, and B. J. Berne. 1997. Can imaginary instan-
taneous normal mode frequencies predict barriers to self-diffusion? J.Chem. Phys. 107:4618–4627.
27. Li, W. X., T. Keyes, and F. Sciortino. 1998. Three-flavor instantaneous
normal mode formalism: diffusion, harmonicity, and the potential
energy landscape of liquid CS2. J. Chem. Phys. 108:252–260.
28. Li, W. X., and T. Keyes. 1999. Instantaneous normal mode theory of
diffusion and the potential energy landscape: application to supercooled
liquid. J. Chem. Phys. 111:5503–5513.
29. Keyes, T. 1995. Normal mode theory of diffusion in liquids for a broad
temperature range. J. Chem. Phys. 103:9810–9812.
30. Straub, J. E., and J. K. Choi. 1994. Extracting the energy barrier distri-
bution of a disordered system from the instantaneous normal mode
density of states: applications to peptides and proteins. J. Phys. Chem.98:10978–10987.
31. Straub, J. E., and D. Thirumalai. 1993. Exploring the energy landscape
in proteins. Proc. Natl. Acad. Sci. USA. 90:809–813.
32. Bu, L., and J. E. Straub. 2003. Vibrational frequency shifts and relaxa-
tion rates for a selected vibrational mode in cytochrome c. Biophys. J.85:1429–1439.
33. Doster, W., S. Cusack, and W. Petry. 1989. Dynamical transition
of myoglobin revealed by inelastic neutron scattering. Nature. 337:
754–756.
34. Parak, F., E. N. Frolov, R. L. Mossbauer, and V. I. Goldanskii. 1981.
Dynamics of metmyoglobin crystals investigated by nuclear gamma
resonance absorption. J. Mol. Biol. 145:825–833.
35. Tilton, R. F., Jr., J. C. Dewan, and G. A. Petsko. 1992. Effects of
temperature on protein structure and dynamics: x-ray crystallographic
studies of the protein ribonuclease-A at nine different temperatures
from 98 to 320K. Biochemistry. 31:2469–2481.
36. Dunn, R. V., V. Reat, J. L. Finney, M. Ferrand, J. C. Smith, et al. 2000.
Enzyme activity and dynamics: xylanase activity in the absence of fast
anharmonic dynamics. Biochem. J. 346:355–358.
37. Hayward, J. A., and J. C. Smith. 2002. Temperature dependence of
protein dynamics: computer simulation analysis of neutron scattering
properties. Biophys. J. 82:1216–1225.
38. Smith, J. C., K. Kuczera, and M. Karplus. 1990. Temperature-
dependence of myoglobin dynamics: neutron spectra calculated from
molecular dynamics simulations of myoglobin. Proc. Natl. Acad. Sci.USA. 87:1601–1605.
Biophysical Journal 96(2) 476–484
483

39. Bizzarri, A. R., A. Paciaroni, and S. Cannistraro. 2000. Glasslikedynamical behavior of the plastocyanin hydration water. Phys. Rev.E. 62:3991–3999.
40. Ferrand, M., A. J. Dianoux, W. Petry, and G. Zaccai. 1993. Thermalmotions and function of bacteriorhodopsin in purple membranes: effectsof temperature and hydration studied by neutron scattering. Proc. Natl.Acad. Sci. USA. 90:9668–9672.
41. Parak, F., E. N. Frolov, A. A. Kononenko, R. L. Mossbauer, V. I. Gold-anskii, et al. 1980. Evidence for a correlation between the photoinducedelectron transfer and dynamic properties of the chromatophoremembranes from Rhodospirillum rubrum. FEBS Lett. 117:368–372.
42. Reat, V., R. Dunn, M. Ferrand, J. L. Finney, R. M. Daniel, et al. 2000.Solvent dependence of dynamic transitions in protein solutions. Proc.Natl. Acad. Sci. USA. 97:9961–9966.
43. Kurkal, V., R. M. Daniel, J. L. Finney, M. Tehei, R. V. Dunn, et al.2005. Enzyme activity and flexibility at very low hydration. Biophys.J. 89:1282–1287.
44. Cotterill, R. M. J., and J. U. Madsen. 1986. Localized fluidity modesand the topology of the constant-potential-energy hypersurfaces ofLennard-Jones matter. Phys. Rev. B. 33:262–268.
45. Riberio, M. C. C., and P. A. Madden. 1998. Unstable modes in ionicmelts. J. Chem. Phys. 108:3256–3263.
46. Donati, C., F. Sciortino, and P. Tartaglia. 2000. Role of the unstabledirections in the equilibrium and aging dynamics of supercooled liquids.Phys. Rev. Lett. 85:1464–1467.
47. Angelani, L., R. Di Leonardo, G. Ruocco, A. Scala, and F. Sciortino.2000. Saddles in the energy landscape probed by supercooled liquids.Phys. Rev. Lett. 85:5356–5359.
48. Berman, H., K. Henrick, and H. Nakamura. 2003. Announcing theworldwide Protein Data Bank. Nat. Struct. Biol. 10:980.
49. Housset, D., C. Habersetzer-Rochat, J. P. Astier, and J. C. Fontecilla-Camps. 1994. Crystal structure of toxin II from the scorpionAndroctonus australis Hector refined at 1.3 A resolution. J. Mol. Biol.238:88–103.
50. Tarek, M., G. J. Martyna, and D. J. Tobias. 2000. Amplitudes andfrequencies of protein dynamics: Analysis of discrepancies betweenneutron scattering and molecular dynamics simulations. J. Am. Chem.Soc. 122:10450–10451.
51. Brooks, B. R., R. E. Bruccoleri, B. D. Olafson, D. J. States, S. Swami-nathan, et al. 1983. CHARMM: a program for macromolecular energy,minimization, and dynamics calculations. J. Comput. Chem. 4:187–217.
52. Foloppe, N., and A. MacKerell, Jr. 2000. All-atom empirical force fieldfor nucleic acids: I. Parameter optimization based on small moleculeand condensed phase macromolecular target data. J. Comput. Chem.21:86–104.
53. Jorgensen, W. L., J. Chandrasekhar, J. D. Madura, R. W. Impey, and M.L. Klein. 1983. Comparison of simple potential functions for simulatingliquid water. J. Chem. Phys. 79:926–935.
54. Darden, T., D. York, and L. Pedersen. 1993. Particle mesh Ewald: an Nlog(N) method for Ewald sums in large systems. J. Chem. Phys.98:10089–10092.
55. Knapp, E. W., S. F. Fischer, and F. Parak. 1982. Protein dynamics fromMossbauer spectra. The temperature dependence. J. Phys. Chem.86:5042–5047.
56. Hayward, J. A., J. L. Finney, R. M. Daniel, and J. C. Smith. 2003.Molecular dynamics decomposition of temperature-dependent elasticneutron scattering by a protein solution. Biophys. J. 85:679–685.
484
Biophysical Journal 96(2) 476–484
57. Tournier, A. L., and J. C. Smith. 2003. Principal components of theprotein dynamical transition. Phys. Rev. Lett. 91:208106.
58. Tournier, A. L., J. Xu, and J. C. Smith. 2003. Translational hydrationwater dynamics drives the protein glass transition. Biophys. J.85:1871–1875.
59. Brown, K. G., S. C. Erfurth, E. W. Small, and W. L. Peticolas. 1972.Conformationally dependent low-frequency motions of proteins bylaser Raman spectroscopy. Proc. Natl. Acad. Sci. USA. 69:1467–1469.
60. Daniel, R. M., J. L. Finney, V. Reat, R. Dunn, M. Ferrand, et al. 1999.Enzyme dynamics and activity: time-scale dependence of dynamicaltransitions in glutamate dehydrogenase solution. Biophys. J. 77:2184–2190.
61. Doster, W., and M. Settles. 2005. Protein-water displacement distribu-tions. Biochim. Biophys. Acta. 1749:173–186.
62. Doster, W., S. Cusack, and W. Petry. 1990. Dynamic instability ofliquidlike motions in a globular protein observed by inelastic neutronscattering. Phys. Rev. Lett. 65:1080–1083.
63. Ishima, R., and D. A. Torchia. 2000. Protein dynamics from NMR. Nat.Struct. Biol. 7:740–743.
64. Igumenova, T. I., K. K. Frederick, and A. J. Wand. 2006. Characteriza-tion of the fast dynamics of protein amino acid side chains using NMRrelaxation in solution. Chem. Rev. 106:1672–1699.
65. Reat, V., H. Patzelt, M. Ferrand, C. Pfister, D. Oesterhelt, et al. 1998.Dynamics of different functional parts of bacteriorhodopsin: H-2Hlabeling and neutron scattering. Proc. Natl. Acad. Sci. USA. 95:4970–4975.
66. Diehl, M., W. Doster, W. Petry, and H. Schober. 1997. Water-coupledlow-frequency modes of myoglobin and lysozyme observed by inelasticneutron scattering. Biophys. J. 73:2726–2732.
67. Knapp, E. W., S. F. Fischer, and F. Parak. 1983. The influence ofprotein dynamics on Mossbauer spectra. J. Chem. Phys. 78:4701–4711.
68. Taraskin, S. N., and S. R. Elliott. 1999. Anharmonicity and localizationof atomic vibrations in vitreous silica. Phys. Rev. B. 59:8572–8585.
69. Cui, Q., and I. Bahar. 2006. Normal Mode Analysis: Theory And Appli-cations to Biological and Chemical Systems. Chapman & Hall/CRC,Boca Raton, FL.
70. Roh, J. H., V. N. Novikov, R. B. Gregory, J. E. Curtis, Z. Chowdhuri,et al. 2005. Onsets of anharmonicity in protein dynamics. Phys. Rev.Lett. 95, 038101-1–038101-4.
71. Roh, J. H., J. E. Curtis, S. Azzam, V. N. Novikov, I. Peral, et al. 2006.Influence of hydration on the dynamics of lysozyme. Biophys. J.91:2573–2588.
72. Receveur, V., P. Calmettes, J. C. Smith, M. Desmadril, G. Coddens,et al. 1997. Picosecond dynamical changes on denaturation of yeastphosphoglycerate kinase revealed by quasielastic neutron scattering.Proteins Struct. Funct. Genet. 28:380–387.
73. Krishnan, M., V. Kurkal-Siebert, and J. C. Smith. 2008. Methyl groupdynamics and the onset of anharmonicity in myoglobin. J. Phys. Chem.B. 112:5522–5533.
74. Stillinger, F. H., and T. A. Weber. 1982. Hidden structure in liquids.Phys. Rev. A. 25:978–989.
75. Zwanzig, R. 1988. Diffusion in a rough potential. Proc. Natl. Acad. Sci.USA. 85:2029–2030.
76. Chowdhary, J., and T. Keyes. 2002. Finding diffusive directions insupercooled liquids by partial minimization of the potential energy.Physica A. 314:575–582.
Krishnan et al.