Intermediate phase, network demixing, boson and floppy modes, and compositional trends in glass...
55
1 Intermediate phase, network demixing, boson and floppy modes, and compositional trends in glass transition temperatures of binary As x S 1-x system Ping Chen, Chad Holbrook, P. Boolchand Department of Electrical and Computer Engineering, University of Cincinnati, Cincinnati, Ohio 45221-0030 D. G. Georgiev Department of Electrical Engineering and Computer Science, University of Toledo, Toledo, OH 43606 K. A. Jackson Department of Physics, Central Michigan University Mt Pleasant, MI M. Micoulaut Laboratoire de Physique Theorique de la Matiere Condensée, University Pierre et Marie Curie, Boite 121, 4, Place Jussieu, 75252 Paris, Cedex05, France. Abstract The structure of binary As x S 1-x glasses is elucidated using modulated- DSC, Raman scattering, IR reflectance and molar volume experiments over a wide range (8% < x < 41%) of compositions. We observe a reversibility window in the calorimetric experiments, which permits fixing the three elastic phases; flexible at x < 22.5%, intermediate in the 22.5% < x < 29.5% range, and stressed-rigid at x > 29.5%. Raman scattering supported by first principles cluster calculations reveal that the observed vibrational density of states has features of both pyramidal (PYR) (As(S 1/2 ) 3 ) and quasi-tetrahedral (QT) ( S=As(S 1/2 ) 3 ) local structures. The QT unit concentrations show a global maximum in the intermediate phase (IP), while the concentration of PYR units becomes comparable to those of QT units in that phase, suggesting that both these local structures contribute to the width of the IP. The IP centroid in the sulfides is significantly shifted to lower As content x than in corresponding selenides, a feature identified with excess chalcogen partially segregating from the backbone in the sulfides, but forming part of the backbone in selenides. These ideas are corroborated by the proportionately larger free volumes
-
Upload
sorbonne-fr -
Category
Documents
-
view
0 -
download
0
Transcript of Intermediate phase, network demixing, boson and floppy modes, and compositional trends in glass...
1
Intermediate phase, network demixing, boson and floppy modes, and compositional trends in glass transition temperatures of binary AsxS1-x system
Ping Chen, Chad Holbrook, P. Boolchand
Department of Electrical and Computer Engineering, University of Cincinnati, Cincinnati, Ohio 45221-0030
D. G. Georgiev
Department of Electrical Engineering and Computer Science, University of Toledo, Toledo, OH 43606
K. A. Jackson
Department of Physics, Central Michigan University Mt Pleasant, MI
M. Micoulaut
Laboratoire de Physique Theorique de la Matiere Condensée, University Pierre et Marie Curie, Boite 121, 4, Place Jussieu, 75252 Paris, Cedex05, France.
Abstract
The structure of binary AsxS1-x glasses is elucidated using modulated- DSC, Raman scattering,
IR reflectance and molar volume experiments over a wide range (8% < x < 41%) of
compositions. We observe a reversibility window in the calorimetric experiments, which permits
fixing the three elastic phases; flexible at x < 22.5%, intermediate in the 22.5% < x < 29.5%
range, and stressed-rigid at x > 29.5%. Raman scattering supported by first principles cluster
calculations reveal that the observed vibrational density of states has features of both pyramidal
(PYR) (As(S1/2)3) and quasi-tetrahedral (QT) ( S=As(S1/2)3) local structures. The QT unit
concentrations show a global maximum in the intermediate phase (IP), while the concentration of
PYR units becomes comparable to those of QT units in that phase, suggesting that both these
local structures contribute to the width of the IP. The IP centroid in the sulfides is significantly
shifted to lower As content x than in corresponding selenides, a feature identified with excess
chalcogen partially segregating from the backbone in the sulfides, but forming part of the
backbone in selenides. These ideas are corroborated by the proportionately larger free volumes
2
of sulfides than selenides, and the absence of chemical bond strength scaling of Tgs between As-
sulfides and As-selenides. Low-frequency Raman modes increase in scattering strength linearly
as As content x of glasses decreases from x = 20% to 8%, with a slope that is close to the floppy
mode fraction in flexible glasses predicted by rigidity theory. These results show that floppy
modes contribute to the excess vibrations observed at low frequency. In the intermediate and
stressed rigid elastic phases low-frequency Raman modes persist and are identified as boson
modes. Some consequences of the present findings on the optoelectronic properties of these
glasses are commented upon.
I. INTRODUCTION
Network glasses have traditionally been modeled as continuous random networks (CRNs).
The description has worked well for several stoichiometric oxides but less so for chalcogenides.
Some chalcogenides macroscopically phase separate displaying bimodal Tgs, as in the case of
the Ag-Ge-Se ternary1, 2, materials that serve as active media in programmable non-volatile
memories used for portable electronics3. In bulk glasses of the Ag-Ge-Se ternary, the nature of
the two glass phases has also been established by calorimetry4, 5 and electric force microscopy6.
Furthermore, even in chalcogenides that display a single Tg, demixing of networks can occur on
nanoscale as either monomers or even large clusters decouple from the backbone, and enrich
their functionality in remarkable ways. It is in this respect that the case of the binary AsxS1-x glass
system has received attention 7-12 over the years starting from the early work of Ward13 at Xerox,
who recognized S8 rings to decouple in S-rich glasses . It is generally believed that As serves
the role of cross-linking chains of sulfur to acquire a local 3-fold coordination as in a pyramidal
(PYR) unit, As(S1/2)3 , and at the stoichiometric composition, x = 40%, a CRN of S-bridging
pyramidal units is realized14. Close analogies in molecular structure of the stoichiometric glass
3
with the layered structure of c-As2S3 (orpiment) have been drawn. The molecular structure of
As2S3 glass has also been compared to that of As2Se3 glass. If these stoichiometric glasses were
to form CRNs, then their mean coordination number, r = 2.40, and following the ideas of
Phillips15 and Thorpe16, the count of Lagrangian bonding constraints/atom, nc = 3, for both these
glasses17. Their glass structures can then be expected to be optimally constrained, and to
possibly self-organize18 to produce rigid but unstressed structures. Such a picture appears to
largely describe the structure of As2Se3 glass19 , a composition that is almost in the reversibility
window of binary AsxSe1-x glasses19. On the other hand, the stoichiometric composition, As2S3, is
far from being in the reversibility window of binary AsxS1-x glasses, as will be shown in the
present work. The underlying differences of structure between As-sulfide- and selenide glasses
are not confined to the stoichiometric composition; in fact they extend to all other compositions
as well. Do these peculiarities of structure of As-S glasses occur in other group V and group IV
sulfides? We comment on the issue as well.
Glass transition temperatures (Tgs) provide a good measure20 of network connectivity. For
glass networks possessing the same connectivity, Tgs usually scale with strengths of chemical
bonds. For example, in comparing binary (GexX1-x ( X = S, or Se)), and ternary (PxGexX1-2x (X =
S, or Se)) glasses, one generally finds the ratio of Tgs of sulfides to selenides to scale as the ratio
of single chemical bond strengths21. However, such is not the case for the AsxX1-x binaries (X = S
or Se). For example, Tg of As2S322 (205 (2)°C) is almost the same as that of As2Se3 8, 19 (197(2)
°C ). If these glasses were to possess the same network connectivity, one would have expected
Tg of As2S3 to be 13% higher ( 255°C ) than of As2Se3, since single As-S covalent bonds23
(47.25 kcal/mole) are 13% stronger than single As-Se covalent bonds (41.73 kcal /mole ). The
absence of bond strength scaling of Tg is not restricted to the stoichiometric composition, x =
4
40%, but it occurs at other As concentrations x as well. These data suggest that there are intrinsic
differences of glass structure between As- sulfides and –selenides.
Differences of glass structure between As-sulfides and As-selenides have a bearing on
infrared optical24, 25 applications of these materials. Photodarkening in amorphous films of As2S3
and As2Se3 has been examined26 using near band gap light (500 nm for a- As2S3 film, and 650
nm for a-As2Se3 film). The results show that not only band gap reduction but also rate of
photodarkening is higher in the sulfide than in the selenide films. These glasses also display large
optical nonlinearities, low phonon energies and low nonlinear absorption27. Material properties
such as nonlinear changes in refractive index , electronic polarizability, molecular orientation,
electrostriction and thermal effects are of relevance in this context28. Amongst these, fast
electronic nonlinearity is of particular interest; it is determined by electron distribution in various
local structures, and can be expected to change with glass composition. Thus, introduction of Se
in As-S glasses increases the non-resonant refractive nonlinearity up to 400 that of fused silica29.
In ternary Ge-As-Se glasses, it has been shown that substitution of Ge by As promotes while
replacement of Se by As suppresses optical non-linearity30. Furthermore, refractive nonlinearity
is found to vary with composition in over connected (r >2.4) glasses with the nonlinearity being
highest for the lowest Ge concentration31. The microscopic origin of these non-linear effects
remains an open question in the field. It is likely that a basic understanding of glass structure
would help in addressing the underlying issues.
In the present work we focus on compositional dependence of glass structure; we have
examined the thermal (modulated-DSC) and optical ( Raman and IR reflectance) behavior of
bulk AsxS1-x glasses over a wide range of compositions, 8% < x < 41%. In Raman scattering
compositional trends in vibrational modes at low-frequency (0-100 cm-1), bond-bending (100-
5
250 cm-1) and bond-stretching (250-500 cm-1) regimes are analyzed. Results of first principles
cluster calculations32 are used to analyze the Raman and IR vibrational density of states. The
present data suggest that in addition to 3-fold coordinated As, quasi-4-fold coordinated As local
structures (with As having 3 bridging and one non-bridging S neighbor) are also present in the S-
rich glasses. Both these local structures are found in binary P-S 21, 33, 34 and P-Se glasses35, 36.
Our m-DSC experiments reveal the existence of a reversibility window37 in the 22% < x < 29%
range, an observation that fixes the three elastic phases- flexible, intermediate and stressed-rigid
in the present As-S binary. The window is found to be shifted to lower As content (x) in relation
to the one in corresponding selenides. We trace the observation to partial demixing of excess S
from networks of the present sulfides but the complete mixing of excess Se in the corresponding
selenides. The strongly excited low-frequency Raman modes, also called boson modes, are
analyzed in the present sulfide glasses. In the elastically flexible regime (x < 20%) these low
frequency vibrations are shown to come from floppy modes, while those in the intermediate and
elastically stressed-rigid glasses probably come from inter cluster soft modes.
In sections II we present some background considerations to understanding compositional
trends in Tg. Results of first principle cluster calculations to analyze the Raman vibrational
modes are presented in section III. Experimental results and their discussion in relation to issues
of glass molecular structure, floppy modes, boson modes, and the three elastic phases in the
present As-S binary appear in sections IV and V respectively. A summary of the present findings
appears in the conclusions.
II. COMPOSITIONAL TRENDS IN Tg AND GLASS STRUCTURE
A. Stochastic agglomeration and network connectivity.
6
A useful means to understanding Tg variation with glass chemical composition or network
structure is provided by a stochastic agglomeration theory (SAT). The theory allows a prediction
of Tg with modifier composition when agglomeration of atoms forming part of a glass-forming
liquid proceeds in a stochastic fashion. The central idea of the theory20, 38, 39 is to relate an
increase of viscosity to network formation as chemical bonds between well-defined local
structures are formed at random upon cooling. For a base glass composed of A-atoms, which is
modified by alloying B-atoms, i.e., an AxB1-x binary system, theory predicts20, 38, 39 a parameter-
free slope of Tg with glass composition x in the limit when x is low ,
⎥⎦
⎤⎢⎣
⎡=⎥
⎦
⎤⎢⎣
⎡
==
A
B
g
TTx
g
rr
Tdx
dT
gg ln
0
,0 0
(1)
In equation (1), rB and rA are the coordination numbers of the additive atom (B) and the atom (A)
comprising the base glass network, and Tg0 represents the glass transition temperature of the base
material. The denominator appearing in equation (1) gives an entropic measure of network
connectivity40, and the lower the entropy the higher the slope of Tg with x. For the case SiO2,
which has a large Tg0 ~ 1200°C, a large slope dTg/dx is expected and indeed found in sodium
silicate glasses in the low modified regime. For the case of AsxSe1-x, (rA=2) and if we take As
atoms to be 3-fold coordinated (rB=3), one expects the slope to be 6.17oC/mol.% of As. The
observed slope is found36 to be 4.1°C/mol.% of As. We have suggested in earlier work5 that
presence of 4-fold coordinated As as in a QT unit will increase the number of ways to connect
arsenic and selenium atoms together, and will thus decrease the slope dTg/dx, and permit one to
reconcile the observed slope dTg/dx if the concentration of such units is in the 20 to 30% range.
Elemental Se is a good glass former composed largely of polymeric chains of selenium. On
the other hand, elemental S melts upon cooling condense into a molecular solid composed of S8
7
rings. These considerations help us reconcile why binary (Ge or As)xSe1-x melts give rise to
homogeneous glasses extending all the way to pure Se, while corresponding sulfide melts, in
general, segregate into a glassy backbone and S8 crowns as x decreases to ~0.20. And as x
approaches 0, melts spontaneously crystallize. The present AsxS1-x binary glasses intrinsically
segregate on a molecular scale as x approaches 0, so that SAT as we know it cannot be directly
applied. Inferring aspects of glass structure at low x using SAT poses new challenges.
Fortunately, signature of S8 rings segregating from the backbone in sulfide glasses come
independently from Raman scattering and modulated DSC experiments as will be illustrated in
the present work. Many of these ideas were known more than 25 years ago. What is new,
however, is that use of m-DSC has now permitted establishing scan rate independent glass
transition temperatures (Tgs). At higher x when network formation is well developed, trends in Tg
can be understood in terms of SAT. These thermal data complemented by optical ones (Raman
and IR reflectance measurements), afford new insights into the molecular structure of the present
sulfide glasses as we shall illustrate in this work.
B. Chemical bond strength rescaling of glass Transition temperatures
The importance of network connectivity in determining the Tg of network glasses has
evolved elegantly from SAT. The importance of chemical bond strengths in determining Tg was
emphasized by Tichý and Tichá41 from empirical considerations. It is becoming transparent that
bond-strength scaling of Tgs does occur but only if the underlying network structures being
compared possess the same connectivity. An illustrative example is the case of the GexPxX1-2x
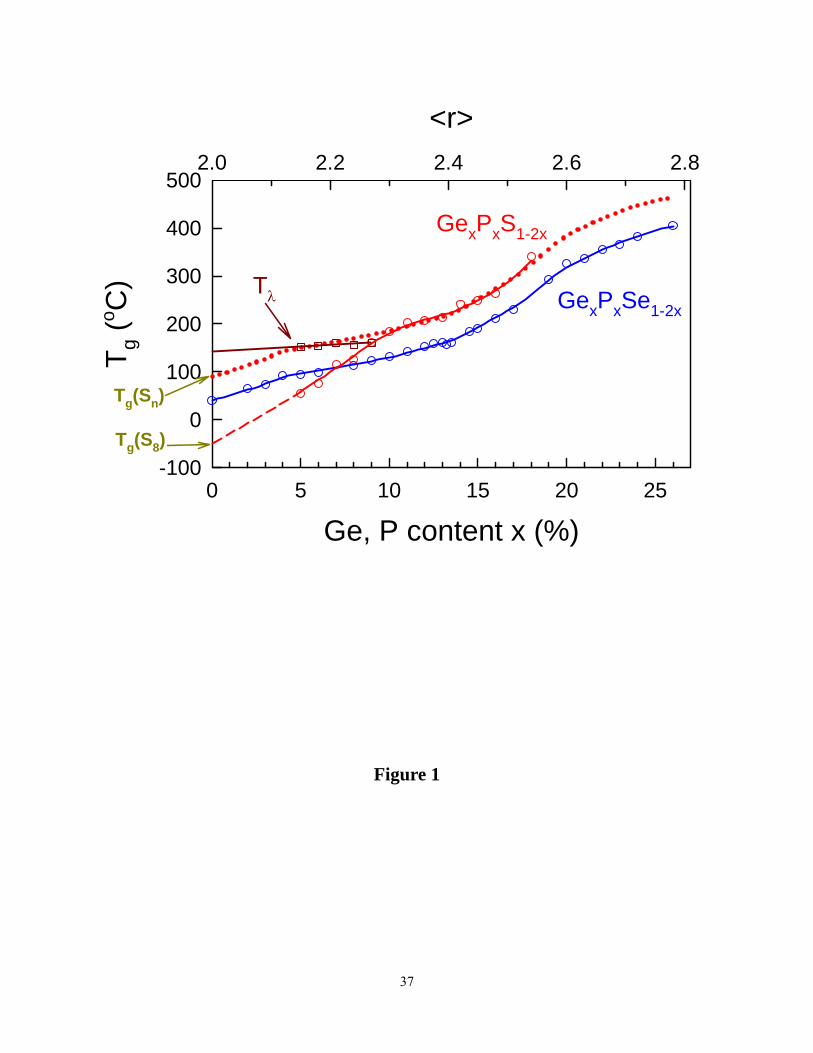
ternaries with X = Se or S (Figure 1). A perusal of the data42, 43 shows that in the 10% < x < 18%
range , Tg - ratio of sulfide to Selenide glasses is found to be 1.13, and the ratio is found to be
8
independent of x. The finding illustrates that connectivity of underlying backbones steadily
increases as the concentration x of the cross-linking atoms, P and Ge increases in both these
systems. We understand the scaling factor of 1.13 in terms of the higher chemical bond strength
of Ge-S, and P-S bonds in relation to Ge-Se and P-Se ones. The Pauling single bond strength
data23 on the underlying bonds is as follows: Ge-S bond: Eb= 55.52 kcal/mole , Ge-Se bond: Eb
= 49.08 kcal/mole, P-S bond: Eb = 54.78 kcal/mole, P-Se bond : Eb = 49.72 kcal/mole. These
data yield the ratio of chemical bond strengths of the P and Ge sulfide bonds to corresponding
selenide bonds of 1.12. These ideas on bond-strength rescaling of Tgs will be useful when we
visit results on the present As-S glasses and compare them to those on corresponding selenides.
At x < 10%, a re-scaling of Tgs no longer holds since in the sulfide glasses S8 rings steadily
decouple leading to loss of a network, while in the selenides a network structure continues to
persist even as x approaches 0. The signature of S8 ring decoupling is the appearance of the Tλ
transition (figure 1). Tgs in the 10% < x < 0% range decrease almost linearly to extrapolate to
a value of about -50°C as x approaches 0. We assign the extrapolated Tg = -50°C to that of a S-
ring glass. On the other hand, if one linearly extrapolates the Tg(x) data from x ~ 10% backwards
to x = 0, one obtains an extrapolated Tg of about 100°C. We assign the extrapolated Tg of 100°C
to that a Sn-chain glass .These extrapolated Tg values of a S-chain and a S-ring glass are
independently corroborated by results on several other binary and ternary sulfide glass systems.
III. FIRST PRINCIPLES CLUSTER CALCULATIONS OF VIBRATIONAL
DENSITY OF STATES.
To investigate the origin of key features in the Raman spectra of AsxS1-x glasses, we
conducted first-principles calculations based on density functional theory in the local density
9
approximation44 (LDA). The calculations were performed using the NRLMOL code.45, 46
Extensive Gaussian basis sets were used to represent the electronic orbitals. Pseudopotentials47
were used for the As and S atoms, while H atoms were treated32 in an all-electron format.
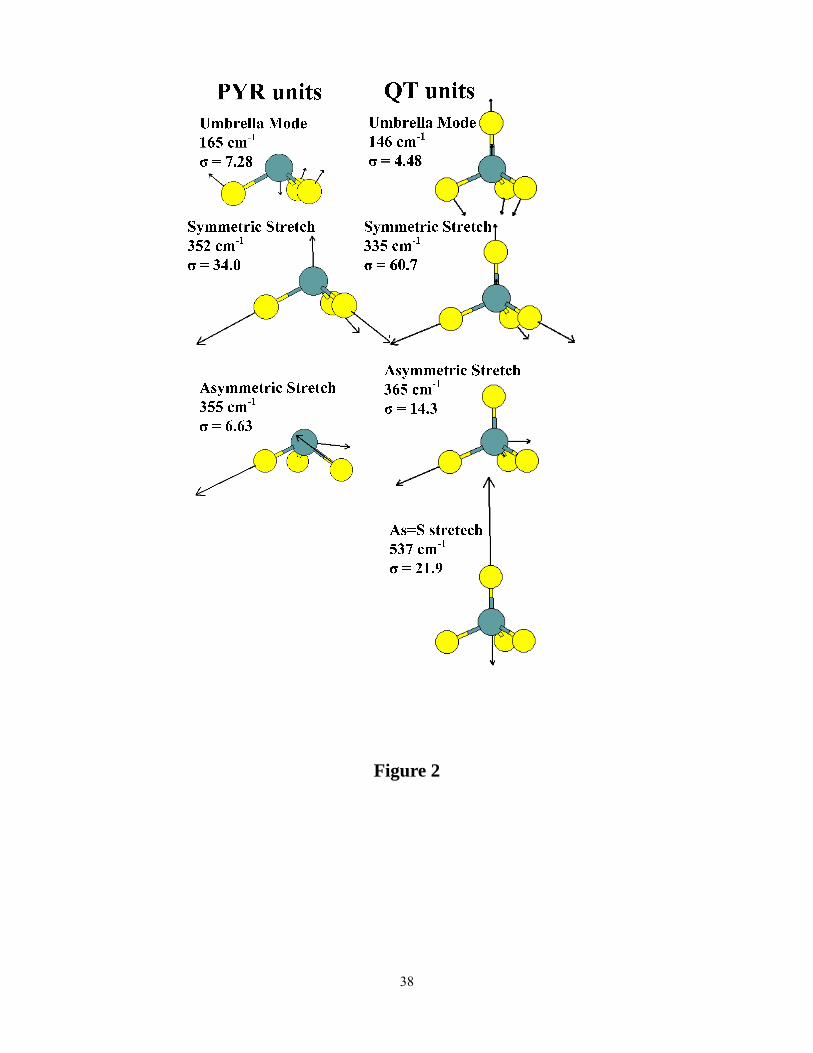
Attention was focused on two structural building blocks of the glasses, the As-S3 pyramid
(PYR) and the quasi-tetrahedral (QT) As-S4 unit, both shown in Fig. 2. Hydrogen atoms were
added to the three basal S atoms in each of these models to tie off dangling bonds so as to better
mimic the local chemistry of these units in the glass. The S-H bonds nominally represent S-As
bonds to the glass network. The Pauling electronegativities of As and H are 2.18 and 2.20,
respectively, so that one expects S-H and and S-As bonds have very similar polarities. The
cluster bond lengths and bond angles were relaxed to a minimum energy configuration and the
vibrational normal modes of the clusters were calculated using a standard technique.48 IR
intensities and Raman activities for the vibrational modes were then calculated within the LDA.
The method has been described fully elsewhere.48 Briefly, IR and intensities and Raman
activities can be related to changes in cluster dipole moments and polarizabilities caused by
atomic displacements in the vibrational modes. These changes can be computed directly within
the LDA, using no adjustable parameters or empirical input. Calculated results for a diverse set
molecules have been shown to be in good agreement with experimental measurements.48
The results for the PYR and QT units are given in Table I. Mode frequencies and total IR
intensities and Raman activities for key vibrational modes are listed. Normal mode eigenvectors
indicating the pattern of atomic displacements in each mode are shown in Fig. 2. It is interesting
to note that the symmetric and asymmetric modes associated with the PYR unit are nearly
degenerate, at 352 and 355 cm-1, respectively, while the analogous modes in the QT unit are split,
at 335 and 365 cm-1. (The asymmetric stretch modes in both models are doubly degenerate.
10
Only one set of eigenvectors is shown for each model in Fig. 2. The QT unit also features a
mode at 537 cm-1 that arises from a stretch of the bond between As and the one-fold coordinated
S atom. This mode clearly has no analogue in the PYR model and is well-separated from the
remaining As-S stretch modes. The results, presented in Table I and Fig. 2, are discussed further
below.
IV. EXPERIMENTAL
A. Sample synthesis
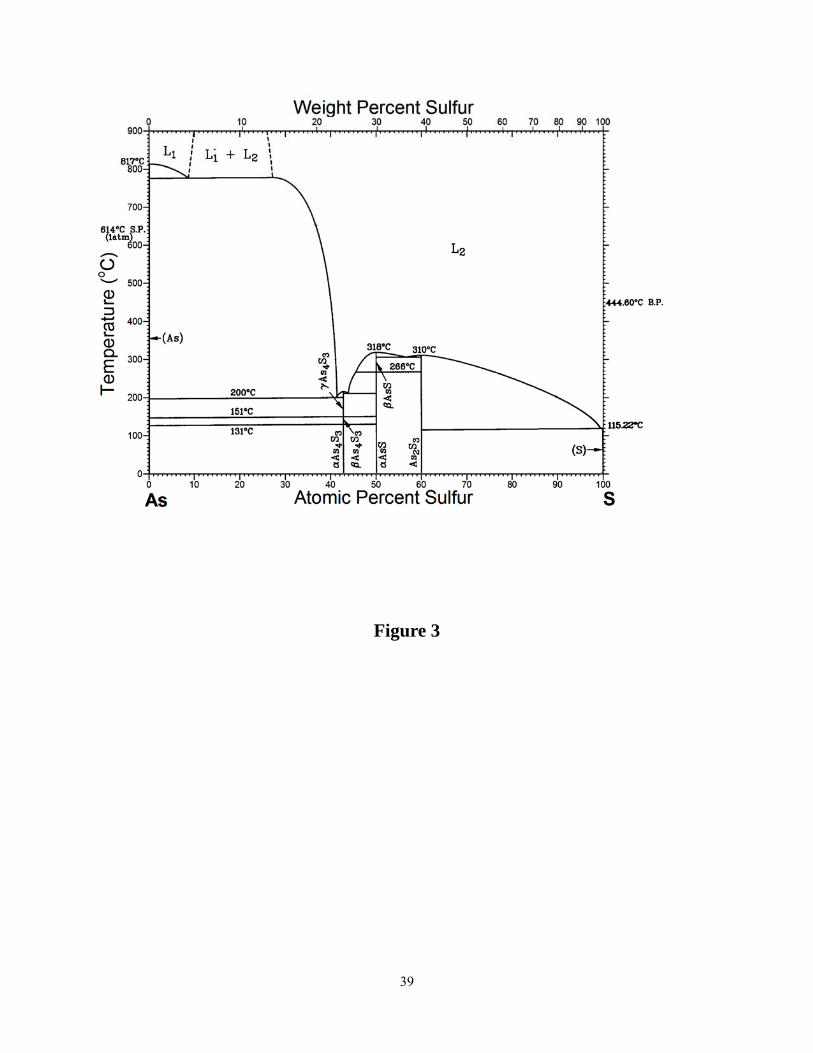
Figure 3 shows the phase diagram of the As-S binary system49, 50. In the phase diagram, the
crystalline phases shown are crystalline S8 that exist in three forms51 (α, β and γ), c-As2S3
(orpiment)52, c- As4S4 (realgar) that exists in two forms53 (α, β) and c-As4S3 (dimorphite) that
exists in three forms50 (α, β and γ). Both crystalline As4S4 and As4S3 are molecular crystals
composed of monomers. A perusal of the AsxS1-x phase diagram shows that there is a eutectic
near x ~ 1%. The glass forming range in the AsxS1-x binary extends from about 5% < x < 55%
range. At x < 5% melts are largely composed of S8 rings, while at x > 55% melts crystallize into
Realgar or As4S3 monomers. Other crystalline forms found in mineral data include As4S
(duranusite)54 and As4S5 (uzonite)55.
Glass samples of typically 2 grams in size were synthesized using 99.999% As2S3 and
elemental S pieces from Cerac Inc. The starting materials were weighed and mixed in a N2 gas
purged glove bag, and then sealed in evacuated (< 10-7 Torr) dry quartz tubings of 5.0 mm id and
1mm wall thickness. Temperature of quartz tubes was slowly increased to 650°C at a rate of
1°C/min. Melts were homogenized by mixing them at 600°C for 2 days or longer (see below).
Glass samples were realized by quenching melts from 50°C above the liquidus49 into cold water.
11
Once quenched, glass sample homogeneity was ascertained by FT-Raman scattering along the
length of sealed quartz tubes used to synthesize samples. Periodic evaluation of samples with
increasing reaction time of melts at 650°C revealed that Raman lineshapes became
indistinguishable only after melts were homogenized for typically 2 to 3 days. Once samples
were synthesized, these were stored in evacuated Pyrex ampoules to avoid hydrolysis.
B. Molar volumes
An 8 inch long quartz fiber suspended from a pan of digital balance (Mettler model B154) and
a hook to support a sample at the far end was used to measure mass densities using the
Archimedes principle. Glass samples of typically 100 mgs or larger in size were weighed in air
and in pure ethyl alcohol. The density of alcohol was calibrated using a single crystal bulk piece
of Si and Ge as density standards. With the arrangement, we could obtain the mass density of
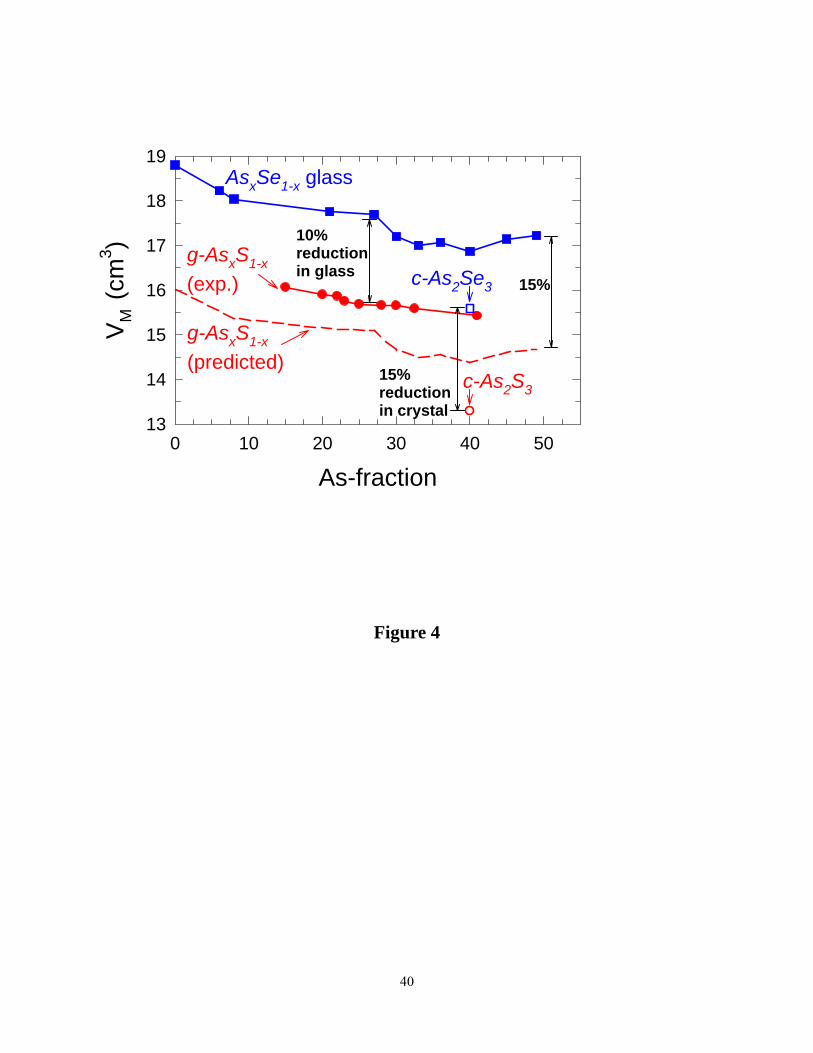
samples to an accuracy of 3/4% or less. Resulting molar volumes as a function of glass
composition are summarized in Figure.4 and show Vm(x) decreases with increasing x but with a
local minimum in the 20% < x < 28% range, the reversibility window (see below). For
comparison we have also included in Figure 4, molar volumes on corresponding AsxSe1-x glasses
taken from the work of Georgiev et al.19 We shall return to discuss these results later.
C. Modulated – Differential Scanning Calorimetry
Glass transition properties were examined using a modulated DSC, model 2920 from T.A.
Instruments. Typically about 30 mgs quantity of a sample, hermetically sealed in Al pans, was
heated at a scan rate of 3°C and a modulation rate of 1°C/100sec. A scan up in temperature
across Tg was then followed by a scan down in temperature. Scans of pure S and those of S-rich
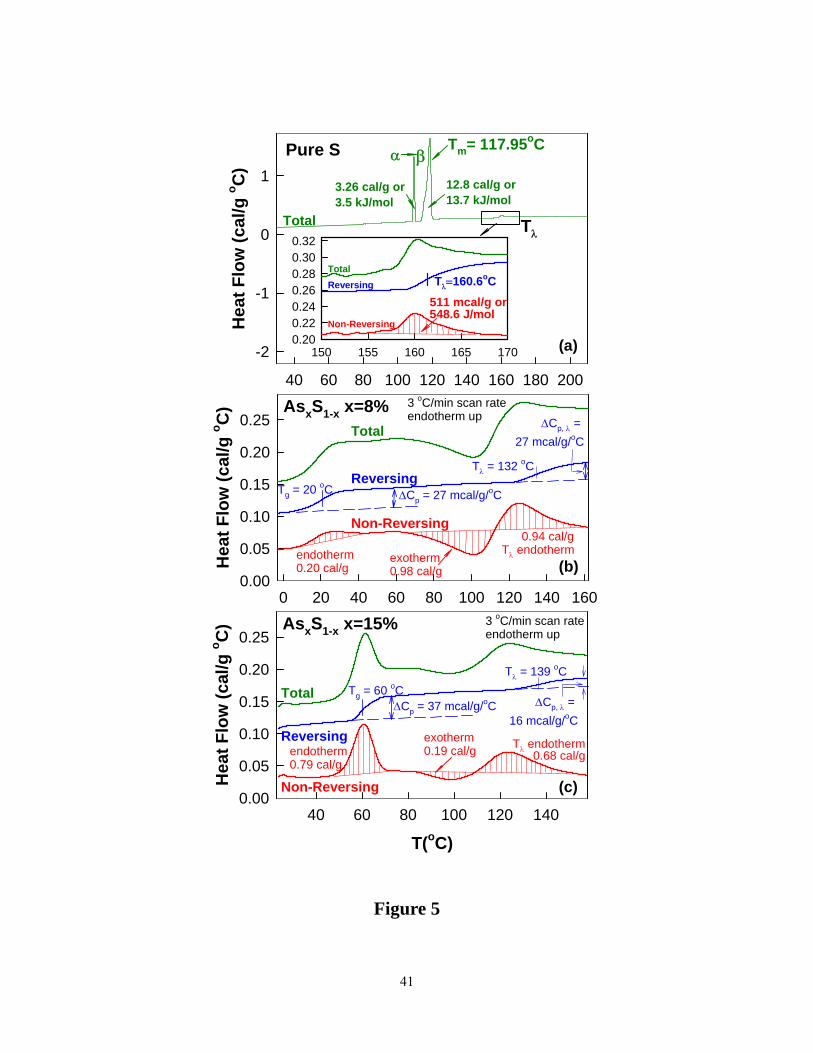
binary glasses at x = 8 and 15% are reproduced in Figure 5. In pure S (Figure 5a), we observe 3
endothermic events; (i) an α-β solid solid phase transformation near 108.6°C (ii) a melting of β –
12
S near 118°C and followed by (iii) a Tλ transition near 160.6°C. The Tλ transition is identified
with opening of S8 rings to form polymeric S-chains leading to the formation of viscous or
plastic S 56. In the inset of Figure 5a, the scan of pure S is enlarged, and it highlights the non-
reversing enthalpy associated with the Tλ transition, and one observes an endotherm exclusively.
In S-rich glasses, and particularly at low x (< 23%), one observes in general, the total heat flow
scan to reveal two thermal events; a glass transition endotherm in the 20° C < T < 125°C range,
followed by a complex heat flow profile associated with the Tλ transition. Help in understanding
the complicated total heat flow profile comes from examining the deconvoluted reversing and
non-reversing heat- flow profiles. In the reversing heat flow scan, one observes a glass transition
endotherm to display a rounded step in Cp, and one fixes the Tg value by the inflexion point of
the step. The Tλ transition also displays a rounded step in Cp, and one fixes the transition
temperature by the inflexion point of the step. The non-reversing heat flow, as expected, shows a
Gaussian like endotherm for the Tg event, but for the Tλ transition one observes an exotherm
followed by an endotherm as illustrated in Figures 5b and 5c. These data suggest that as T
increases, S8 rings first become mobile near about 100°C and coalesce to form nano-crystalline
fragments, a process that releases heat (exotherm). With a further increase of T, these fragments
next open and are incorporated in the backbone, events that contribute to the endotherm. And as
the As content of the glasses “ x” exceeds 15%, Tgs steadily increase while the strength of the
Tλ transitions steadily diminishes as both ΔCp and the non-reversing heat flow term ΔHnr
decreases ( Figure 6a and 6b). These data suggest that the process of alloying As in S leads to
growth of network backbone as concentration of S8 rings steadily decreases, and at x > 25%,
there is little or no evidence of S8 rings present in glasses. Even in the most S-rich glass
investigated here, we find no evidence of the α→ β transition as seen in pure S, suggesting that
13
S8 rings formed in our glass samples do not precipitate to form microcrystalline clusters of α –
sulfur. These S8 crowns, most likely, are randomly distributed with the network backbone.
Trends in Tg for present AsxS1-x glasses appear in Figure 7, where we show for comparison Tg s
in binary AsxSe1-x glasses. We shall discuss these results later.
In an m-DSC experiment, deconvolution of the heat flow into a reversing and a non-
reversing heat flow has profound consequences in understanding the nature of glass transition37.
The former heat flow relates to ergodic events such as changes in vibrational motion, while the
latter one relates to non-ergodic events such as changes in configurations accompanying
structural arrest near Tg as a glass softens. Data on chalcogenide glasses broadly reveals three
generic types57 of glass transitions based on connectivity of their backbones. Weakly cross-linked
backbones form elastically flexible networks, which display a non-reversing enthalpy term, ΔHnr
(T), that is Gaussian-like, symmetric and narrow (ΔT ~ 20°C) in width and the term ages. Highly
crosslinked backbones form elastically stressed-rigid networks, which display a ΔHnr (T) term
that is broad (ΔT ~ 40°C) and asymmetric with a high T tail and the term ages. On the other hand,
optimally crosslinked backbones form elastically rigid but unstressed networks (Intermediate
Phase) which display a ΔHnr (T) term that is not only minuscule but also does not age much. The
vanishing of the ΔHnr term for IP glass compositions suggests that such networks possess
liquidlike entropies, a feature that derives58 from the presence of at least two isostatic local
structures.
It is usual to make a frequency correction to the ΔHnr term by subtracting the ΔHnrcool term
measured in a cooling cycle from the ΔHnrheat term measured in the heating cycle.
ΔHnrfreq. corr. = ΔHnr
heat- ΔHnrcool (2)
14
The frequency corrected ΔHnrfreq. corr. term is independent of the scan rate employed. Thus, for
example, the ΔHnrheat and ΔHnr
cool terms for a sample at x = 28% are 0.86 cal/g and 0.73 cal/g
respectively, upon a frequency correction ΔHnrfreq. corr. is found to be 0.13 cal/g (Fig.8). The
observed trends in non-reversing enthalpy reveal a narrow, deep but sharp reversibility window
that onsets near x = 22.5%, and ends near x = 29%, (Figure 8). For convenience, the reversibility
window in As-Se glasses 22 is also included in Fig.8. We find the window in sulfide glasses is
shifted to lower x in relation to the window in selenide glasses.
D. Raman scattering
Raman scattering was studied using a dispersive T64000 triple monochromator system from
Horiba Jobin Yvon Inc, using 647 nm excitation. The dispersive system made use of a
microscope attachment with a 80X objective, bringing laser light to a fine focus (2 μm spot size)
and the scattered radiation detected using a CCD detector. Samples in a platelet form were
encapsulated in a MMR Joule-Thomson refrigerator to avoid photo-oxidation and heating.
Spectra could be recorded from 3 cm-1 to 600 cm-1 range permitting the boson peak to be
investigated. Typically 2 mW of laser power was brought on the microscope table over a 2 μm
spot size. Separately samples were also studied using a Thermo-Nicolet FT Raman system with
1.06µm excitation from a Nd-YAG laser. The observed lineshapes in either set looked very
similar. In the FT-Raman experiments samples were encapsulated in evacuated quartz tubing and
the laser beam typically 260 mW power was brought to a loose focus (150 μm spot size) onto the
samples. Figure 9 gives a summary of the observed lineshape using an FT Raman system for
glass compositions in the 8% < x < 41% range. These results are quite similar to those reported
15
earlier8, 11, 59, 60 by several groups. At low x (< 25%) one observes sharp modes that are readily
identified with sulfur rings and chains. In the mid-x range (25% < x < 40%), the lineshape is
dominated by a broad band in the 300 < υ < 400 cm-1 range. At high x (>40%), one begins to
observe again some sharp features labeled as R in the spectra (Figure 9). These R-modes were
identified earlier by Georgiev et al.22 as belonging to those of Realgar (As4S4) molecules that
demix from network structure once x approaches x> 38%.
Guided by first principles cluster calculations (section III), we are now able to better to
decode the vibrational density of states and understand the structure consequences. The mid-x
region is of interest, particularly since it is in this range one observes the RW. Examples of
Raman lineshape deconvolution for samples at x = 8%, 10% and 15% appear in Figure 10.
We concur with the earlier assignments61 of the narrow modes near 151 cm-1 (S8), 217 cm-1
(S8), 440 cm-1 (second order scattering from 217 cm-1), 461 cm-1 (Sn chains) and 474 cm-1 (S8 )
as belonging to modes of either S8 rings61 or Sn chains. The cluster calculations place the
symmetric (335cal cm-1) and asymmetric stretch ( 365cal cm-1) of quasi tetrahedral S=As(S1/2)3
units (Table 1). We thus assign the modes observed near 333 cm-1 and 380 cm-1 respectively to
these vibrational modes of QT units. The As=S stretch mode of such a unit, we believe
contributes to the mode near 500 cm-1 in the spectra (Table1). The cluster calculations place the
symmetric (352cal cm-1) and asymmetric (355cal cm-1 ) stretch of pyramidal As(S1/2)3 units quite
close to each other, and we assign the feature observed near 365 cm-1 to both these vibrational
modes.
The observed FT-Raman lineshapes in the 250 cm-1 to 550 cm-1 range were fitted using a
least squares routine to a superposition of above-mentioned peaks. Lorentzian or Gaussian-
Lorentzian sum functions are used for the sharper S8 ring modes at 474 cm-1 in S-rich samples
16
and Gaussian functions were used for all other peaks. Linear baseline was safely used as we
exclude the region below 250 cm-1 which involve complicated baseline due to boson peak and
holographic notch filter cutoff. Examples of lineshape fits at x= 8%, 10% and 15% appear in fig.
10.
From these fits, we have also extracted the normalized scattering strength (Aυ/A) of the
modes at υ1 = 333 cm-1 (QTss), υ 2 =365 cm-1 (PYR) and υ 3 =495 cm-1 (QT), and figure 11 gives
a plot of the compositional trends of mode scattering strengths. The total integrated area A under
the various modes was used to normalize the individual mode scattering strengths. As expected,
modes assigned to S-chains (461 cm-1) and rings (474 cm-1) monotonically decrease in scattering
strength to nearly vanish as x increases to 40%. On the other hand, modes assigned to QT units
(333 cm-1 and 495 cm-1) show a global maximum in the 22% to 29% range, compositions
belonging to the RW. The scattering strength of the mode near 365 cm-1 assigned to PYR units is
found to increase monotonically as x approaches 40% with a mild plateau in the RW range. We
consider these compositional trends in scattering strengths of Raman modes to be far more
diagnostic than the mode frequencies alone, and this is a point we shall return to discuss later.
Figure 12 summarizes the glass composition dependence of the Raman active bond-stretching
mode frequencies due to QT and PYR units. One finds that in the 10% < x < 30% range mode
frequencies steadily red-shift by nearly 15 cm-1. This is unusual, and we shall comment on the
behavior in the next section.
In the observed lineshapes, scattering in the low frequency range increases remarkably as the
As content of glasses x < 20% as illustrated in figure 13, which gives the Dispersive Raman
spectra. In making these plots we have normalized the observed spectra to the same laser power,
and find that compositional trends in scattering strength of modes in the bond-stretching regime
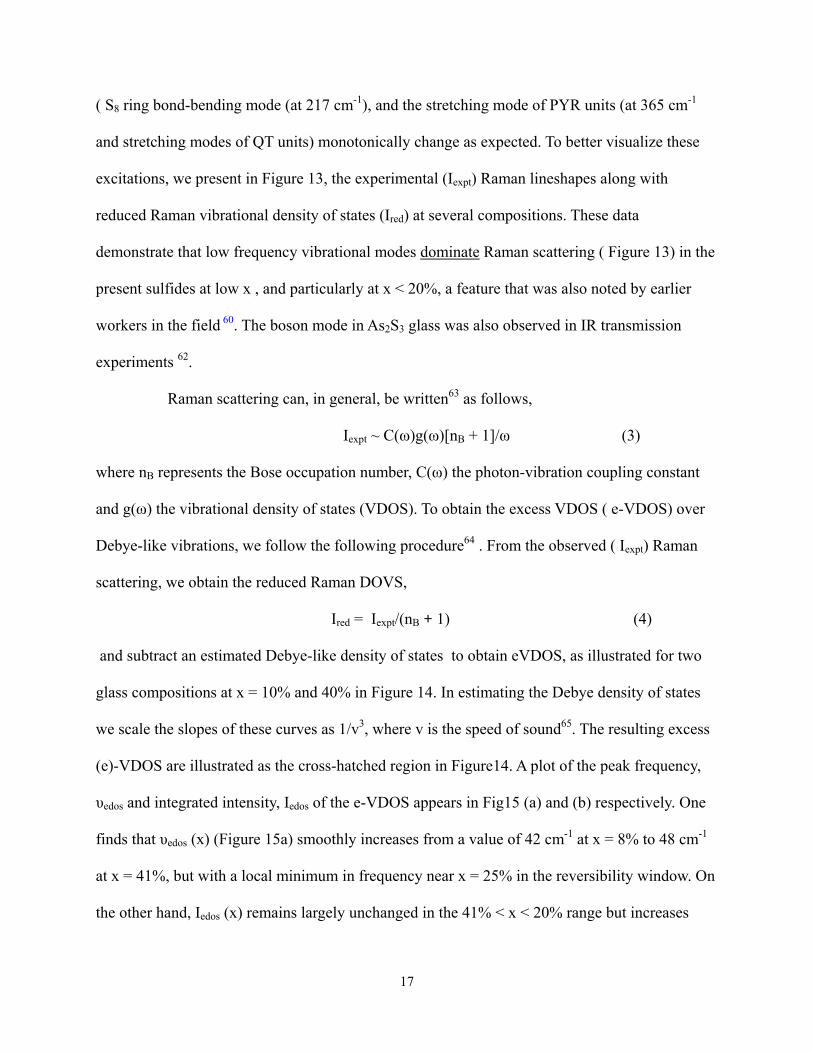
17
( S8 ring bond-bending mode (at 217 cm-1), and the stretching mode of PYR units (at 365 cm-1
and stretching modes of QT units) monotonically change as expected. To better visualize these
excitations, we present in Figure 13, the experimental (Iexpt) Raman lineshapes along with
reduced Raman vibrational density of states (Ired) at several compositions. These data
demonstrate that low frequency vibrational modes dominate Raman scattering ( Figure 13) in the
present sulfides at low x , and particularly at x < 20%, a feature that was also noted by earlier
workers in the field 60. The boson mode in As2S3 glass was also observed in IR transmission
experiments 62.
Raman scattering can, in general, be written63 as follows,
Iexpt ~ C(ω)g(ω)[nB + 1]/ω (3)
where nB represents the Bose occupation number, C(ω) the photon-vibration coupling constant
and g(ω) the vibrational density of states (VDOS). To obtain the excess VDOS ( e-VDOS) over
Debye-like vibrations, we follow the following procedure64 . From the observed ( Iexpt) Raman
scattering, we obtain the reduced Raman DOVS,
Ired = Iexpt/(nB + 1) (4)
and subtract an estimated Debye-like density of states to obtain eVDOS, as illustrated for two
glass compositions at x = 10% and 40% in Figure 14. In estimating the Debye density of states
we scale the slopes of these curves as 1/v3, where v is the speed of sound65. The resulting excess
(e)-VDOS are illustrated as the cross-hatched region in Figure14. A plot of the peak frequency,
υedos and integrated intensity, Iedos of the e-VDOS appears in Fig15 (a) and (b) respectively. One
finds that υedos (x) (Figure 15a) smoothly increases from a value of 42 cm-1 at x = 8% to 48 cm-1
at x = 41%, but with a local minimum in frequency near x = 25% in the reversibility window. On
the other hand, Iedos (x) remains largely unchanged in the 41% < x < 20% range but increases
18
almost linearly in the 20% < x < 8% range. We shall return to discuss these results in section V.
E. IR reflectance
A Thermo-Nicolet model FTIR model 870 with a smart collector accessory was used to
examine specular reflectance data from polished platelets of AsxS1-x glass samples. Typical
sample size used was 5mm in diameter and 2mm thick. Reflectivity was studied over the 50 cm-
1 to 600cm-1 range using solid state substrate beam splitter and DTGS detector with polyethylene
window. A typical measurement used 600 scans with a 12 minutes scan time to give 4 cm-1
resolution. A polished stainless steel surface was used as a reference for background. A Kramers
Kronig transformation of the reflectance signal was performed with GRAMS software to
generate the absorbance, the Transverse Optic (TO) and Longitudinal Optic (LO) IR response.
A summary of the reflectance signal data recorded at several glass compositions appears in
Figure 16(a). These data are quite similar to the ones reported earlier11. The ir TO ( ε2) response
for glasses is summarized in Figure 16(b), and is found to be quite similar to those reported
earlier11. We have summarized the TO as well as the LO response at select glass compositions
(20%, 30% and 40%) in Figure 17. The data for the stoichiometric composition, x = 40%, may
be compared to earlier reports 11, 12. In these data one can see vibrational features near 312 cm-1,
near 340 cm-1, identified earlier12 with the symmetric and asymmetric stretch of PYR units. In
addition there are other features present in these data, which make the IR response consistent
with the present and earlier22 Raman data .For example, network modes of PYR units22 must also
contribute to the ir response particularly in the 360 to 400 cm-1 range. In this range, presence of
Realgar units (As4S4) in the As2S3 glass, noted earlier in Raman scattering, will also contribute to
(features near 300 cm-1 and 370 cm-1) in the IR response. Mori et al.11 observed a small but
clearly resolved feature near 490 cm-1 in the IR absorption measurements of the stoichiometric
19
glass( x = 40%). The feature comes from the stretch of As=S double bonds of QT units. The
broad TO response observed in the 280 cm-1 to 500 cm-1 range ( Figure 17) , must then also
include features from the symmetric and asymmetric stretch of the QT units.
In a glass of composition x = 30%, Raman scattering reveals no evidence of Realgar units. In
the IR response one thus expects contributions from both PYR and QT units as shown in the
middle panel of Figure 17(b). At x = 20%, Raman scattering reveals significant contribution
from Sn chains and S8 rings. One thus expects, in addition to modes of QT and PYR units, those
of Sn chains and rings to contribute to the IR response near 480 cm-1. One can see evidence of
some IR response in the 440 to 500 cm-1 range in the data of Figure 17(c). Unlike Raman modes
that are reasonably sharp, the IR response from these glasses reveal modes that are quite broad,
and a unique deconvolution of the observed lineshape becomes more challenging. Finally, a
perusal of the data of Figure 17 illustrates the LO response to be shifted to higher frequency in
relation to the TO response. In polar semiconductors internal electric fields add to the external
one and blue shift the LO response to higher frequencies in relation to the TO response, as
expected.
V. DISCUSSION
A. Identification of the three elastic phases in binary AsxS1-x glasses.
Reversibility windows (RWs) have been observed in chalcogenides 18, 19, 43, 66, 67 and more
recently in oxide glasses68 as well. These windows are identified with glass compositions
belonging to an Intermediate Phase (IP), bordered on the low connectivity end by a flexible phase
and on the high connectivity end by a stressed-rigid phase. Glass compositions in these windows
form networks that are rigid but unstressed. Materials in the IP are functionally quite different
from flexible or stressed-rigid phases; they age minimally and display dynamic reversibility, and
20
have often been compared to proteins in the transition state that fold reversibly. These features of
the IP are reviewed as representing a self-organized69-72 phase of disordered matter.
In figure 15, we have assembled the compositional variation of Tg (x) , non-reversing
enthalpy ΔHnr(x), and molar volumes, Vm(x) in the present binary glasses. The minuscule
ΔHnr(x) , in the 22.5% < x < 29.5% range, serves to define the reversibility window (RW) in the
present glasses. In analogy to earlier work on chalcogenides, we identify the RW with the IP of
the present glasses. The variation of molar volumes reveals an almost linear decrease in the 10%
< x < 40% range, but with some evidence of a local minimum in the RW (figure 18), surely the
signature of space filling of the IP. Identification of the IP, thus permits fixing the three elastic
regimes in the present binary glasses, compositions at x < 22.5% belong to the elastically flexible
phase, while those on the high connectivity end at x > 29.5%, to the elastically stressed rigid
phase. The stoichiometric glass composition, As2S3 (x = 40%) is not found to be part of the IP.
In the flexible phase of the present sulfides networks rapidly segregate as the As
concentration decreases from 20% to 8% range. The almost linear reduction of Tg (x) at x < 22%
(Figure 15a), the increase in concentration of S8 rings as reflected in growth in scattering strength
of 217 cm-1 (bending mode of S8 rings) in Raman scattering (Figure 15a), and the appearance of
the Tλ transition in calorimetry, each data corroborates the general picture of S8 crowns demixing
from the backbone of glasses in the flexible phase. And even at the lowest As concentration
examined here, we could not detect S8 crowns segregating to form the crystalline orthorhombic S
phase; there is no evidence of the α→β transition in calorimetry (Figure 5). In the IP, and
particularly in 22.5% < x < 25% range, there is evidence of a small (2%) but decreasing
concentration of S8 rings present as x increases to about 25%.
In the stressed rigid phase, one finds Tg(x) to increase with x, which is consistent with PYR
21
and QT units serving to crosslink Sn chain segments and increasing connectivity of networks.
The concentration of both PYR units increases with x in the 29% < x < 40% range. In spite of
this trend, Raman vibrational mode frequencies of the two building blocks are found not to
increase. These data suggest that the PYR and QT units and Sn chains must not form part of the
same fully polymerized structure as has been traditionally assumed. In several binary66, 73 and
ternary67, 74 selenides that usually form fully polymerized networks, Raman scattering derived
optical elastic constants (or mode frequency squared) display an increase as a power-law with
glass composition x in the stressed-rigid phase. The absence of such a power-law variation
underscores that underlying networks of the present sulfides are not fully connected (see below).
B. Local structures of binary AsxS1-x glasses and the Intermediate Phase
Identification of the three elastic phases in the present binary begs the broader issue- what
aspects of glass molecular structure control their elastic behavior? In particular, can one
understand the width and centroid of the IP in the present binary sulfides? Several numerical
approaches to model IPs 69-72 in the selenides have been discussed recently. In the sulfides that
intrinsically segregate on nanoscale, experiments can however provide crucial insights on these
phase separation effects. And such effects are likely to serve as important bounds in modeling
IPs as well.
The IP in the present sulfides (22.5% < x < 29.5%) is shifted to a lower range of x in relation
to corresponding selenides (28% < x < 37%), as shown in Figure 8. To put these results in
perspective, we have assembled known IPs in group V sulfides and selenides 21. The IP in P-Se
and As-Se binary systems display close parallels; their centroids are nearly the same, although IP
width of the P-Se binary ( Δr = 0.12) exceeds that of the As-Se (Δr =0.08) one. We believe that
aspects of local structure, directly accessible from experiments, most likely play a role in
22
determining these widths. There are two local structures, PYR (r = 2.40) and QT units (r = 2.28)
in As-Se glasses that contribute to the width of the IP. On the other hand, there are three local
structures that contribute to the IP width in P-Se glasses; PYR (r = 2.40), QT(r = 2.28) and a
polymeric Ethylene-like, P4Se4 unit (ETY) (r = 2.5). The number appearing in parenthesis
describes the mean coordination number of these units or chemical stoichiometry. While the
PYR and QT units are isostatic, the ETY units are mildly stressed-rigid. The somewhat larger
width of the IP in P-Se glasses than in As-Se ones, most likely, derives from the wider range in r
spanned by the three local structures. On the other hand, the similarity of IP centroids comes
largely from the fact that both these group V selenides form polymerized network structures in
which Sen chains are part of the network backbone (Figure 17).
Moving next to the cases of the binary As- and the P- sulfides, one is struck by the shift of IP
centroids to lower x in relation to corresponding selenides (Figure 19). What aspect of glass
structure contributes to the shift? It is instructive to first consider the case of P-S binary, where
there is recognition 21 that the IP centroid shift to lower x results from a complete segregation of
the Sn chain fragments from the PYR and QT units bearing connective tissue (backbone). In
Raman scattering, vibrational modes of QT, PYR and Sn chains are completely resolved in binary
P-S glasses. The concentrations of these local structures can then be estimated, and one finds that
the chemical stoichiometry of the IP backbone equals P33S66 if all excess S is to completely
segregate from the backbone. On the other hand, in P-Se glasses IP centroid stoichiometry ,
[xc(1) + xc(2)]/2 = [29% + 37%]/2 is equal to 33%, the same as found in P-S glasses. We are
thus led to think that the IP centroid shift in P-S glasses is largely a manifestation of the excess S
(as Sn chain fragments) completely decoupling from the backbone.
A perusal of the data of Figure 19 shows that the IP centroid in binary As-S glasses is shifted
23
halfway between the case of P-Se (Sen chains fully coupled to network ) and that of P-S ( Sn
chains fully decoupled from the network) glasses. Thus, a plausible explanation is that about half
of the excess S forms part of the backbone while the other half is decoupled from the backbone
in binary As-S glasses. The demixed excess S cannot be present in short (< 8 atom long) Sn chain
fragments, otherwise one would have seen end effects. The demixed Sn chains are most likely at
least 15 atoms or longer. To put the number in perspective, Kozhevnikov et al.75 in their studies
of the depolymerization transition in elemental sulfur place the length of sulfur chains close to
100 nm long or about 600 atoms long. The excess S in the IP is viewed as present in chains and
not rings as suggested by Raman scattering (Figure 9).
What can we say about the width of the IPs in the sulfide glasses? For the companion binary
P-S glasses, an IP is observed in the 16% < x < 19% range (Δr = 0.03), and one finds QT units
and PYR units concentrations to show global maxima respectively at the lower end ( x = 16%)
and at the higher end (x = 19%) of that phase. We believe a parallel circumstance prevails in the
As-S binary with both PYR and QT units contributing to the width of the IP. We have already
noted that QT unit concentrations display a maximum in the IP (Figure 11). On the other hand,
PYR unit concentration increases monotonically with x to maximize near x = 40% in the As-S
binary (Figure 11). This particular feature of the data on As-S glasses differs from the case of the
P-S glasses, in large part because P-P bonds ( 51.3 kcal/mole) have a higher chemical bond
strength than As-As ( 32.1 kcal/mole) bonds, and these bonds readily are manifested in P4S10
molecules that decouple from the backbone just above the IP.21.
Nanoscale phase separation effects, such as formation of small molecules that demix from a
backbone, result in loss of network character , a structural feature that plays an important part in
determining IP widths in glasses. We have already noted21, 34 that segregation of S8 rings at low x
24
(< 14%) and of P4S10 molecules at high x (> 20%) serves to restrict the range of glass formation,
and the IP as well. Parallel considerations must also apply to the case of the present AsxS1-x
binary, wherein at x < 18% concentration of S8 rings proliferate while at x > 38% , As4S4
molecules decouple 22 from the network. In fact bulk glass formation in the As-S binary ceases at
x > 50%, largely because of the preponderance of As4S4 molecules in melts, which upon cooling
give rise to the crystalline phase, Realgar76. IPs in network forming systems require that there be
a significant fraction of the connective tissue present for a glass network to form an IP and self-
organize.
The broad picture of partial demixing of Sn chains in the IP of As-S glasses described above
is corroborated by molar volumes and Tg of glasses. Partial demixing of Sn chains from network
backbone contributes to the increased free volume of As-S glasses (Figure 4) as discussed earlier
in section IV. The almost complete absence of chemical bond strength scaling of Tg between As-
Se and As-S glasses, and also in the IP (Figure 7), is suggestive that network connectivity of
sulfide glasses is lower than of the counterpart selenides. In summary, the shift of the IP to lower
x, the increased molar volumes and the complete absence of bond-strength rescaling of Tgs in the
As-S glasses in relation to As-Se glasses, each point to the partial demixing of Sn chain
fragments from network backbone.
C. Low frequency vibrational modes; evidence of boson and floppy modes
An almost universal feature of disordered solids is the appearance of vibrational modes at
low frequency (5- 60 cm-1 range) in Raman scattering, inelastic neutron scattering and low
temperature specific heats broadly known as ‘boson modes”. These modes are identified with an
excess of vibrations over Debye-like ones (g(υ) ~ υ2 ), and probably come from some transfer of
strength from high to low frequencies as an ordered crystalline solid is rendered disordered-
25
amorphous. The nature of these excess vibrations has been a subject of ongoing debate over the
past two decades or more77-79. Most work on boson modes has been performed on stoichiometric
glasses and polymers, and in some cases the role of temperature and pressure80 has also been
investigated. In select cases compositional studies on glasses have also been performed81.
Recently, attention has been paid to analysis of low frequency Raman modes to extract
meaningful boson parameters from the excess vibrational density of states (e-VDOS) that could
be related to other probes of these vibrations.
In the present work we have paid particular attention to analyzing the low frequency
Raman scattering data in over a wide range of compositions (8 < x < 41%) encompassing the
flexible, intermediate and the stressed rigid phases of AsxS1-x glasses. Details of the analysis were
presented in section IV. Perusal of the data of figure 15b shows that the slope of the normalized
integrated intensity Iedos/Iedos(x = 0) with x yields a value of the slope, d(Iedos/Iedos(x = 0))/dx =
1.6(1). The result is reminiscent of the floppy mode fraction change with r in rigidity theory16. in
In a 3D network of chains or rings, wherein each atom has 2 near neighbors, or r = 2, there is
one floppy mode (f = 1) per atom. Upon alloying As with S, the resulting glass network becomes
increasingly cross-linked as the mean coordination number, r = 2 + x increases, and the floppy
mode count f(r) steadily decreases,
f = 6 – (5/2)r (5)
and as x approaches 40% , or r = 2.40 and networks becomes rigid. In such a mean-field
description of the onset of rigidity, one finds that the slope, df/dr = 2.50 (equation 5). Given that
r = 2+ x, the observed slope as a function of r, also represents the slope as a function of x, i.e.,
d(Iedos/Iedos(x=0))/dr = d(Iedos/Iedos(x = 0))/dx = 1.6(1). In other words, the observed variation in
the integrated intensity of the low-frequency modes as a function of r in our experiments of 1.6 is
26
somewhat lower than the rigidity theory prediction of the slope of 2.5.
The most natural interpretation of these data is that the low-frequency vibration modes in these
glasses has contributions arising from two sources, (i) floppy modes associated with the 2-fold
coordinated S atoms in rings and chains, and (ii) soft modes associated with a domain structure
of glasses ( Figure 15b) . The latter modes have been discussed by Duval et al.77 , who have
suggested that glasses may be visualized as composed of a domain structure, with domains
representing nanometer sized elastically stiff regions in which atoms are strongly bonded and
move together as a unit against other domains. The boson mode is viewed as an inter-domain soft
acoustic vibration, and its frequency given by
ω = vs/ 2cR (6)
where vs , c, and R represent respectively the velocity of sound, velocity of light and the mean
size of a domain. Taking velocity of sound in pure S to be 1250 m/s75 at 196°C and of As2S3
glass to be 2100 m/s82, we have interpolated the speed of sound for intermediate compositions.
The domain size, R, suggested from equation (5), is then found to increase monotonically from
0.55 nm near x = 5% to 0.75 nm near x = 45%. The trend of an increase in R with x appears quite
plausible given that binary glasses become more connected, although it is at present less clear if
the magnitude of R can be identified with characteristic clusters in these glasses.
The reversibility window in the present glasses shows that the rigidity transition in the
present glasses occurs near x = 22% (window onset composition xc(1)) and the stress transition
near 30% (window end composition, xc(2)). Within a mean-field description one expects the
floppy mode contribution f(x) to nearly vanish as x increases to 22%. Thus, a possible
description of the low-frequency vibrations in these glasses is that (Figure 15(b)) these are
dominated by floppy modes at low x, and soft modes at high x. The soft or boson mode
27
contribution most likely comes from the intrinsically heterogeneous character of the present
sulfide glasses resulting from the partially polymerized nature of the backbone structure.
Structural groupings such as S8 rings, Sn chain fragments that decouple from the network
backbone will contribute to the soft mode behavior.
The onset of the flexible phase at x < 22.5% signaled by the calorimetric measurements, and
the growth in low frequency vibrations in Raman scattering at x < 20%, is a striking result. These
findings illustrate that two completely independent probes, light scattering and calorimetry, come
together in quantitatively probing the flexible phase of the present glasses in a rather convincing
fashion. The Raman and calorimetric data on the present gasses, for the first time, quantitatively
connects boson modes and floppy modes to the low frequency vibrations observed in a network
glass.
CONCLUSIONS
Dry and homogeneous bulk AsxS1-x glasses, synthesized over the 8% < x < 41% range,
were investigated in modulated DSC, Raman scattering, Infrared reflectance and molar volume
measurements. The following conclusions emerge from this work. (a) Vibrational mode
assignments, assisted by first principles cluster calculations, have permitted decoding aspects of
local structures, and show that both pyramidal As(S1/2)3 and quasi-tetrahedral S=As(S1/2)3 local
structures are formed in these glasses. (b) Modulated DSC experiments reveal existence of a
reversibility window in the 22.5% < x < 29.5% range that is identified with Intermediate Phase
(IP), with glasses at x < 22.5% in the flexible phase and those at x > 29.5% in the stressed-rigid
phase of the present As-sulfides. (c) Molar volumes of the glasses decrease almost linearly with
increasing x displaying a local minimum in the IP. (d) The shift of the IP centroid in the present
28
As-sulfides to lower As concentration x compared to the IP in corresponding As-selenides is
identified with nearly half of the excess sulfur decoupling from the backbone in the present
sulfides in contrast to all excess Se forming part of the network backbone in corresponding As-
selenides. (e) Presence of both pyramidal As(S1/2)3 and quasi-tetrahedral S=As(S1/2)3 local
structures as building blocks of these glasses provide the structural variability to understand,
qualitatively, width of the IP, Δx = 7.0% in glass composition or Δr = 0.07 in mean coordination
space with the QT units contributing to the lower end and PYR units to the upper end of the
window. (f) Low-frequency Raman modes, generally identified as boson modes, increase in
scattering strength linearly as As content x of glasses decreases from x = 20% to 8%, with a
slope that is close to the floppy mode fraction in flexible glasses predicted by rigidity theory. The
result shows that floppy modes contribute to boson modes in flexible glasses. In the intermediate
and stressed rigid elastic phases, scattering strength of boson modes persist at a constant level, a
finding we attribute to the presence of soft modes associated with domain structure of glasses.
Both floppy modes and soft modes both contribute to boson modes in the present glasses.
Acknowledgements
It is a pleasure to acknowledge discussions with Professor Bernard Goodman, Professor Eugene
Duval and Professor Darl McDaniel during the course of this work. This work is supported by
NSF grant DMR 04- 56472 to University of Cincinnati.
29
REFERENCES
1 M. Mitkova, Y. Wang, and P. Boolchand, Phys. Rev. Lett. 83, 3848 (1999). 2 M. N. Kozicki and W. C. West, US Patent 5896312 (1999). 3 M. N. Kozicki, M. Park, and M. Mitkova, IEEE Transactions on Nanotechnology 4, 331 (2005). 4 P. Boolchand and W. J. Bresser, Nature 410, 1070 (2001). 5 C. Holbrook, P. Boolchand, P. Chen, A. Pradel, and A. Piarristeguy, March 2008 meeting of the American
Physical Society, Session W24.00010 (2008). 6 V. Balan, A. Piarristeguy, M. Ramonda, A. Pradel, and M. Ribes, J. Optoelectron. Adv. Mater. 8, 2112
(2006). 7 M. Kincl and L. Tichý, Mater. Chem. Phys. 103, 78 (2007). 8 T. Wagner, S. O. Kasap, M. Vlcek, A. Sklenar, and A. Stronski, J. Mater. Sci. 33, 5581 (1998). 9 K. Tanaka, Phys. Rev. B 36, 9746 (1987). 10 K. Shimakawa, A. Kolobov, and S. R. Elliott, Adv. Phys. 44, 475 (1995). 11 T. Mori, K. Matsuishi, and T. Arai, J. Non-Cryst. Solids 65, 269 (1984). 12 G. Lucovsky, Phys. Rev. B 6, 1480 (1972). 13 A. T. Ward, J. Phys. Chem. 72, 4133 (1968). 14 C. Y. Yang, M. A. Paesler, and D. E. Sayers, Phys. Rev. B 39, 10342 (1989). 15 J. C. Phillips, J. Non-Cryst. Solids 34, 153 (1979). 16 M. F. Thorpe, J. Non-Cryst. Solids 57, 355 (1983). 17 For an atom possessing a coordination of r, in 3D there are r/2 bond-stretching and (2r-3) bond bending
constraints per atom. For a pyramidal (PYR) unit, As(Se1/2)3, As is 3-fold ( r = 3) and Se is 2-fold ( r = 2) coordinated . The count of constraints for As is 4.5, and for Se is 2. The count of constraints/atom for a PYR unit then becomes nc = (4 + 3 x 2 x1/2)/ 2.5 = 7.5/2.5 = 3.
18 P. Boolchand, G. Lucovsky, J. C. Phillips, and M. F. Thorpe, Phil. Mag. 85, 3823 (2005). 19 D. G. Georgiev, P. Boolchand, and M. Micoulaut, Phys. Rev. B 62, R9228 (2000). 20 M. Micoulaut, European Physical Journal B 1, 277 (1998). 21 P. Boolchand, P. Chen, and U. Vempati, J. Non-Cryst. Solids, arXiv:0809.1469v2 (accepted). 22 D. G. Georgiev, P. Boolchand, and K. A. Jackson, Phil. Mag. 83, 2941 (2003). 23 L. Pauling, The Nature of the Chemical Bond (Cornell University, Ithaca, NY, 1960). 24 V. F. Kokorina, Glasses for infrared optics (CRC Press, Boca Raton, Fla., 1996). 25 M. Yamane and Y. Asahara, Glasses for photonics (Cambridge University Press, Cambridge, [England] ;
New York, 2000). 26 M. Munzar and L. Tichý, J. Mater. Sci. - Mater. Electron. 18, 251 (2007). 27 J. M. Harbold, F. Ilday, F. W. Wise, J. S. Sanghera, V. Q. Nguyen, L. B. Shaw, and I. D. Aggarwal, Opt. Lett.
27, 119 (2002). 28 R. W. Boyd, Nonlinear optics (Academic Press, Amsterdam ; Boston, 2008). 29 T. Cardinal, K. A. Richardson, H. Shim, A. Schulte, R. Beatty, K. Le Foulgoc, C. Meneghini, J. F. Viens,
and A. Villeneuve, J. Non-Cryst. Solids 256-257, 353 (1999). 30 F. Smektala, C. Quemard, V. Couderc, and A. Barthelemy, J. Non-Cryst. Solids 274, 232 (2000). 31 A. Prasad, C.-J. Zha, R.-P. Wang, A. Smith, S. Madden, and B. Luther-Davies, Opt. Express 16, 2804
(2008). 32 A. Briley, M. R. Pederson, K. A. Jackson, D. C. Patton, and D. V. Porezag, Phys. Rev. B 58, 1786 (1998). 33 H. Eckert, Angew. Chem. Int. Ed. 28, 1723 (1989). 34 U. K. Vempati, MS Thesis, University of Cincinnati (2003). 35 D. G. Georgiev, P. Boolchand, H. Eckert, M. Micoulaut, and K. Jackson, Europhys. Lett. 62, 49 (2003). 36 D. G. Georgiev, M. Mitkova, P. Boolchand, G. Brunklaus, H. Eckert, and M. Micoulaut, Phys. Rev. B 64,
134204 (2001). 37 P. Boolchand, D. G. Georgiev, and M. Micoulaut, J. Optoelectron. Adv. Mater. 4, 823 (2002). 38 R. Kerner and M. Micoulaut, J. Non-Cryst. Solids 210, 298 (1997). 39 M. Micoulaut, in Phase Transition and Self-organization in Electronic and Molecular Networks, edited by J.
C. Phillips and M. F. Thorpe (Kluwer Academic/Plenum Publishers, New York, 2001), p. 143. 40 M. Micoulaut, Comptes Rendus Chimie 5, 825 (2002). 41 L. Tichý and H. Tichá, J. Non-Cryst. Solids 189, 141 (1995). 42 U. Vempati and P. Boolchand, J. Phys. Condens. Matter 16, S5121 (2004).
30
43 S. Chakravarty, D. G. Georgiev, P. Boolchand, and M. Micoulaut, J. Phys. Condens. Matter 17, L1 (2005). 44 J. P. Perdew and A. Zunger, Phys. Rev. B 23, 5048 (1981). 45 M. R. Pederson and K. A. Jackson, Phys. Rev. B 41, 7453 (1990). 46 K. Jackson and M. R. Pederson, Phys. Rev. B 42, 3276 (1990). 47 G. B. Bachelet, D. R. Hamann, and M. Schlüter, Phys. Rev. B 26, 4199 (1982). 48 D. Porezag and M. R. Pederson, Phys. Rev. B 54, 7830 (1996). 49 T. B. Massalski and ASM International., Binary alloy phase diagrams (ASM International, Materials Park,
Ohio, 1990). 50 R. Blachnik, A. Hoppe, and U. Wickel, Z. Anorg. Allg. Chem. 463, 78 (1980). 51 R. Steudel and B. Eckert, in Elemental sulfur and sulfur-rich compounds I, edited by R. Steudel (Springer
Verlag, Berlin ; New York, 2003), p. 1. 52 R. Zallen, M. L. Slade, and A. T. Ward, Phys. Rev. B 3, 4257 (1971). 53 K. Trentelman, L. Stodulski, and M. Pavlosky, Anal. Chem. 68, 1755 (1996). 54 F. Marquez-Zavalia, J. R. Craig, and T. N. Solberg, Can. Mineral. 37, 1255 (1999). 55 L. Bindi, V. Popova, and P. Bonazzi, The Canadian Mineralogist 41, 1463 (2003). 56 R. Steudel, in Elemental Sulfur and Sulfur-Rich Compounds I, edited by R. Steudel (Springer Verlag,
Berlin ; New York, 2003), p. 81. 57 P. Boolchand, M. Micoulaut, and P. Chen, in Phase Change Materials: Science and Applications, edited by
S. Raoux and M. Wuttig (Springer, Heidelberg, 2008), p. 37. 58 P. Boolchand, P. Chen, D. I. Novita, and B. Goodman, in Rigidity and Boolchand Intermediate Phases in
nanomaterials, edited by M. Micoulaut and M. Popescu, 2009). 59 M. Frumar, Z. Polak, and Z. Cernosek, J. Non-Cryst. Solids 256-257, 105 (1999). 60 D. Arsova, Y. C. Boulmetis, C. Raptis, V. Pamukchieva, and E. Skordeva, Semiconductors 39, 960 (2005). 61 M. Becucci, R. Bini, E. Castellucci, B. Eckert, and H. J. Jodl, J. Phys. Chem. B 101, 2132 (1997). 62 T. Ohsaka and T. Ihara, Phys. Rev. B 50, 9569 (1994). 63 R. Shuker and R. W. Gammon, Phys. Rev. Lett. 25, 222 (1970). 64 S. N. Yannopoulos, K. S. Andrikopoulos, and G. Ruocco, J. Non-Cryst. Solids 352, 4541 (2006). 65 G. Burns, Solid state physics (Academic Press, Boston :, 1990). 66 D. Selvanathan, W. J. Bresser, and P. Boolchand, Phys. Rev. B 61, 15061 (2000). 67 T. Qu, D. G. Georgiev, P. Boolchand, and M. Micoulaut, in Supercooled Liquids, Glass Transition and Bulk
Metallic Glasses, edited by T. Egami, A. L. Greer, A. Inoue and S. Ranganathan (Materials Research Society, 2003), Vol. 754, p. 157.
68 K. Rompicharla, D. I. Novita, P. Chen, P. Boolchand, M. Micoulaut, and W. Huff, J. Phys.: Condens. Matter 20, 202101 (2008).
69 M. Micoulaut and J. C. Phillips, J. Non-Cryst. Solids 353, 1732 (2007). 70 M. A. Brière, M. V. Chubynsky, and N. Mousseau, Phys. Rev. E 75, 056108 (2007). 71 M. F. Thorpe, D. J. Jacobs, M. V. Chubynsky, and J. C. Phillips, J. Non-Cryst. Solids 266, 859 (2000). 72 D. N. Tafen and D. A. Drabold, Phys. Rev. B 71, 054206 (2005). 73 P. Boolchand, X. Feng, and W. J. Bresser, J. Non-Cryst. Solids 293, 348 (2001). 74 P. Boolchand, M. Jin, D. I. Novita, and S. Chakravarty, J. Raman Spectrosc. 38, 660 (2007). 75 V. F. Kozhevnikov, J. M. Viner, and P. C. Taylor, Phys. Rev. B 64, 214109 (2001). 76 P. Bonazzi, S. Menchetti, G. Pratesi, M. MunizMiranda, and G. Sbrana, Am. Mineral. 81, 874 (1996). 77 E. Duval, A. Mermet, and L. Saviot, Phys. Rev. B 75, 024201 (2007). 78 F. Leonforte, A. Tanguy, J. P. Wittmer, and J. L. Barrat, Phys. Rev. Lett. 97, 055501 (2006). 79 S. N. Taraskin, Y. L. Loh, G. Natarajan, and S. R. Elliott, Phys. Rev. Lett. 86, 1255 (2001). 80 K. S. Andrikopoulos, D. Christofilos, G. A. Kourouklis, and S. N. Yannopoulos, J. Non-Cryst. Solids 352,
4594 (2006). 81 A. Boukenter and E. Duval, Phil. Mag. B 77, 557 (1998). 82 Y. C. Boulmetis, A. Perakis, C. Raptis, D. Arsova, E. Vateva, D. Nesheva, and E. Skordeva, J. Non-Cryst.
Solids 347, 187 (2004). 83 J. R. Smyth and T. C. McCormick, in Mineral Physics and Crystallography: A Handbook of Physical
Constants, edited by T. J. Ahrens (AGU, Washington DC, 1995), p. 1. 84 A. L. Renninger and B. L. Averbach, Acta Crystallogr., Sect. B 29, 1583 (1973).
Figure captions
31
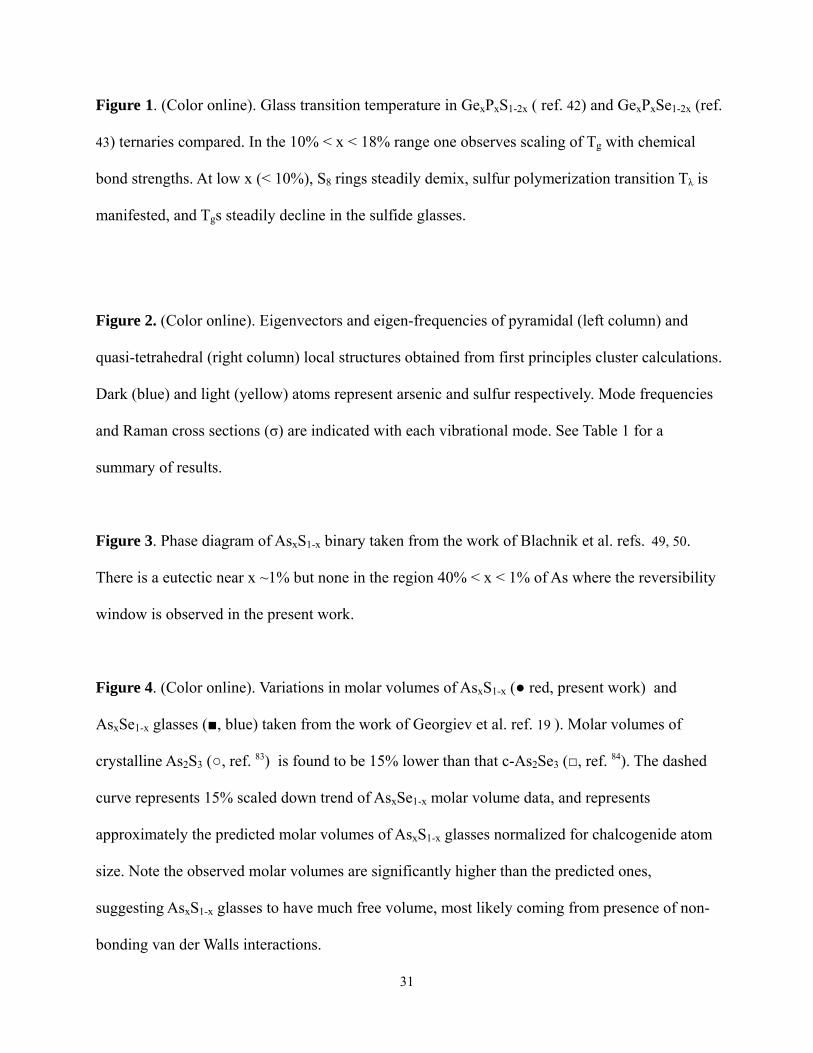
Figure 1. (Color online). Glass transition temperature in GexPxS1-2x ( ref. 42) and GexPxSe1-2x (ref.
43) ternaries compared. In the 10% < x < 18% range one observes scaling of Tg with chemical
bond strengths. At low x (< 10%), S8 rings steadily demix, sulfur polymerization transition Tλ is
manifested, and Tgs steadily decline in the sulfide glasses.
Figure 2. (Color online). Eigenvectors and eigen-frequencies of pyramidal (left column) and
quasi-tetrahedral (right column) local structures obtained from first principles cluster calculations.
Dark (blue) and light (yellow) atoms represent arsenic and sulfur respectively. Mode frequencies
and Raman cross sections (σ) are indicated with each vibrational mode. See Table 1 for a
summary of results.
Figure 3. Phase diagram of AsxS1-x binary taken from the work of Blachnik et al. refs. 49, 50.
There is a eutectic near x ~1% but none in the region 40% < x < 1% of As where the reversibility
window is observed in the present work.
Figure 4. (Color online). Variations in molar volumes of AsxS1-x (● red, present work) and
AsxSe1-x glasses (■, blue) taken from the work of Georgiev et al. ref. 19 ). Molar volumes of
crystalline As2S3 (○, ref. 83) is found to be 15% lower than that c-As2Se3 (□, ref. 84). The dashed
curve represents 15% scaled down trend of AsxSe1-x molar volume data, and represents
approximately the predicted molar volumes of AsxS1-x glasses normalized for chalcogenide atom
size. Note the observed molar volumes are significantly higher than the predicted ones,
suggesting AsxS1-x glasses to have much free volume, most likely coming from presence of non-
bonding van der Walls interactions.
32
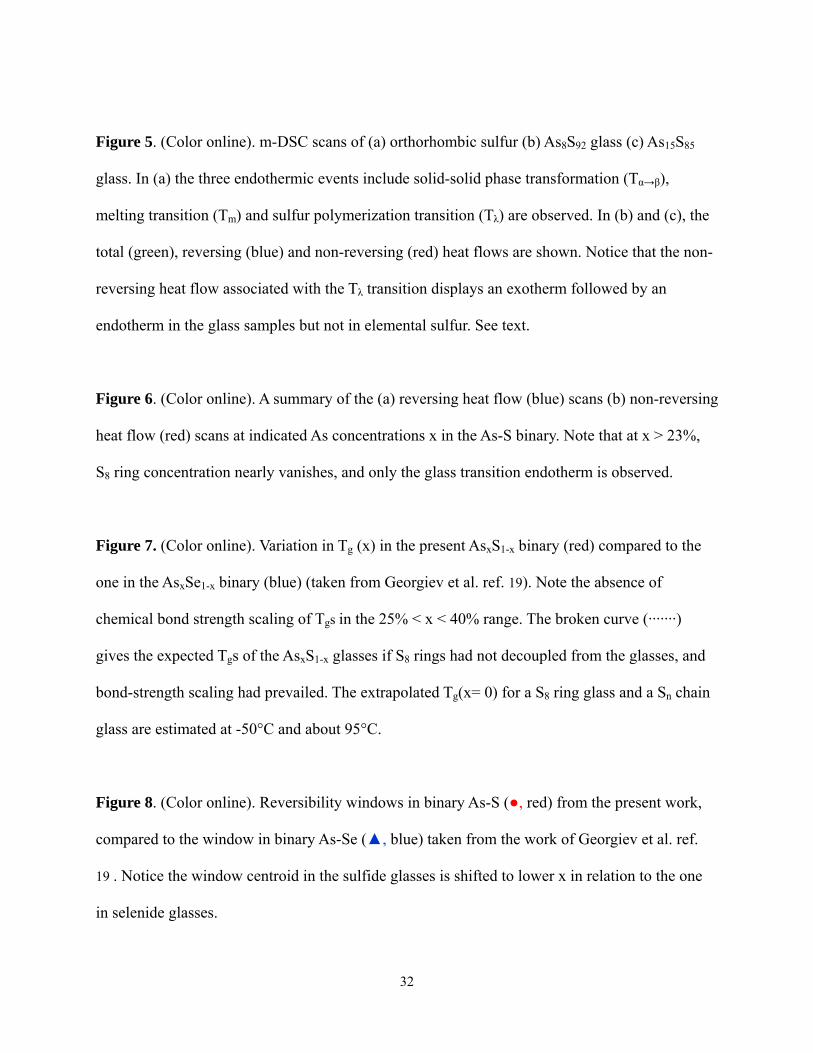
Figure 5. (Color online). m-DSC scans of (a) orthorhombic sulfur (b) As8S92 glass (c) As15S85
glass. In (a) the three endothermic events include solid-solid phase transformation (Tα→β),
melting transition (Tm) and sulfur polymerization transition (Tλ) are observed. In (b) and (c), the
total (green), reversing (blue) and non-reversing (red) heat flows are shown. Notice that the non-
reversing heat flow associated with the Tλ transition displays an exotherm followed by an
endotherm in the glass samples but not in elemental sulfur. See text.
Figure 6. (Color online). A summary of the (a) reversing heat flow (blue) scans (b) non-reversing
heat flow (red) scans at indicated As concentrations x in the As-S binary. Note that at x > 23%,
S8 ring concentration nearly vanishes, and only the glass transition endotherm is observed.
Figure 7. (Color online). Variation in Tg (x) in the present AsxS1-x binary (red) compared to the
one in the AsxSe1-x binary (blue) (taken from Georgiev et al. ref. 19). Note the absence of
chemical bond strength scaling of Tgs in the 25% < x < 40% range. The broken curve (·······)
gives the expected Tgs of the AsxS1-x glasses if S8 rings had not decoupled from the glasses, and
bond-strength scaling had prevailed. The extrapolated Tg(x= 0) for a S8 ring glass and a Sn chain
glass are estimated at -50°C and about 95°C.
Figure 8. (Color online). Reversibility windows in binary As-S (●, red) from the present work,
compared to the window in binary As-Se (▲, blue) taken from the work of Georgiev et al. ref.
19 . Notice the window centroid in the sulfide glasses is shifted to lower x in relation to the one
in selenide glasses.
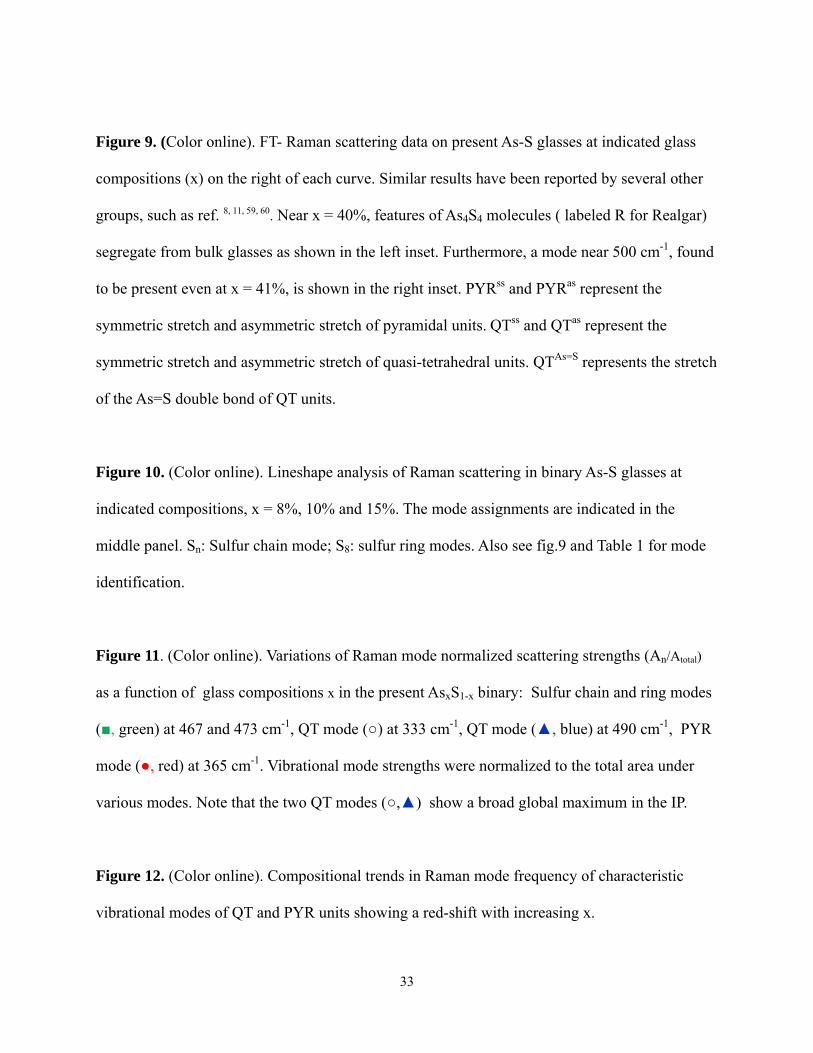
33
Figure 9. (Color online). FT- Raman scattering data on present As-S glasses at indicated glass
compositions (x) on the right of each curve. Similar results have been reported by several other
groups, such as ref. 8, 11, 59, 60. Near x = 40%, features of As4S4 molecules ( labeled R for Realgar)
segregate from bulk glasses as shown in the left inset. Furthermore, a mode near 500 cm-1, found
to be present even at x = 41%, is shown in the right inset. PYRss and PYRas represent the
symmetric stretch and asymmetric stretch of pyramidal units. QTss and QTas represent the
symmetric stretch and asymmetric stretch of quasi-tetrahedral units. QTAs=S represents the stretch
of the As=S double bond of QT units.
Figure 10. (Color online). Lineshape analysis of Raman scattering in binary As-S glasses at
indicated compositions, x = 8%, 10% and 15%. The mode assignments are indicated in the
middle panel. Sn: Sulfur chain mode; S8: sulfur ring modes. Also see fig.9 and Table 1 for mode
identification.
Figure 11. (Color online). Variations of Raman mode normalized scattering strengths (An/Atotal)
as a function of glass compositions x in the present AsxS1-x binary: Sulfur chain and ring modes
(■, green) at 467 and 473 cm-1, QT mode (○) at 333 cm-1, QT mode (▲, blue) at 490 cm-1, PYR
mode (●, red) at 365 cm-1. Vibrational mode strengths were normalized to the total area under
various modes. Note that the two QT modes (○,▲) show a broad global maximum in the IP.
Figure 12. (Color online). Compositional trends in Raman mode frequency of characteristic
vibrational modes of QT and PYR units showing a red-shift with increasing x.
34
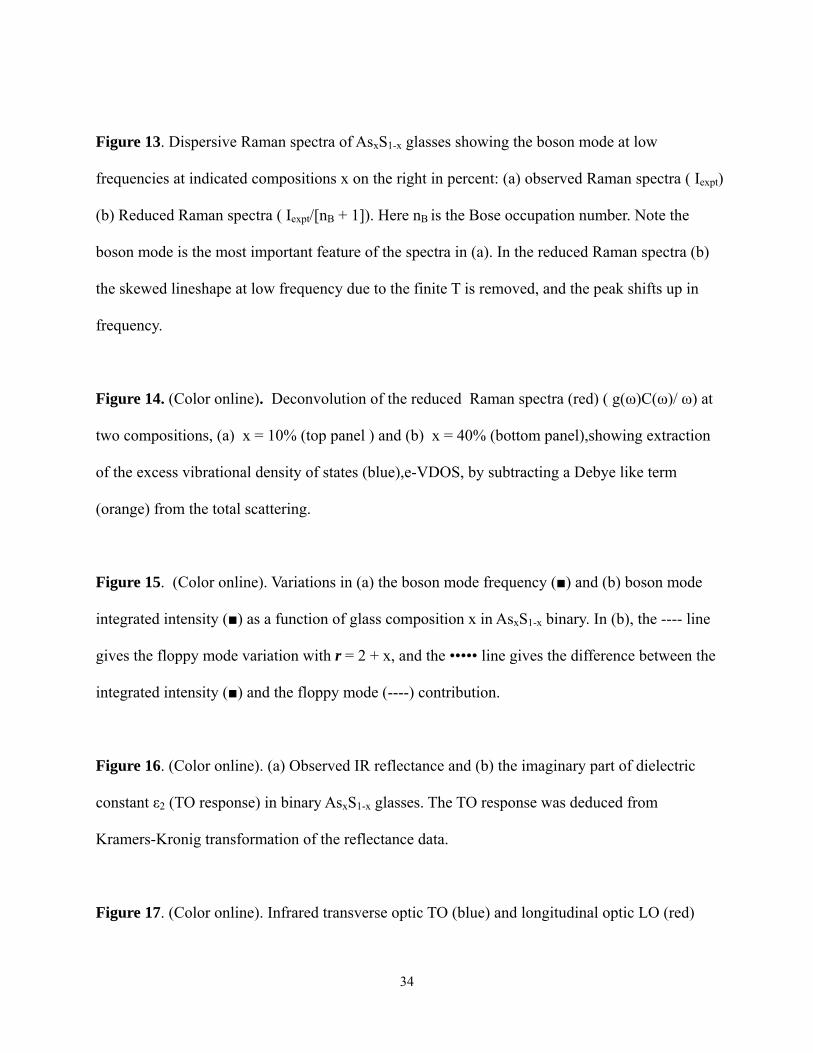
Figure 13. Dispersive Raman spectra of AsxS1-x glasses showing the boson mode at low
frequencies at indicated compositions x on the right in percent: (a) observed Raman spectra ( Iexpt)
(b) Reduced Raman spectra ( Iexpt/[nB + 1]). Here nB is the Bose occupation number. Note the
boson mode is the most important feature of the spectra in (a). In the reduced Raman spectra (b)
the skewed lineshape at low frequency due to the finite T is removed, and the peak shifts up in
frequency.
Figure 14. (Color online). Deconvolution of the reduced Raman spectra (red) ( g(ω)C(ω)/ ω) at
two compositions, (a) x = 10% (top panel ) and (b) x = 40% (bottom panel),showing extraction
of the excess vibrational density of states (blue),e-VDOS, by subtracting a Debye like term
(orange) from the total scattering.
Figure 15. (Color online). Variations in (a) the boson mode frequency (■) and (b) boson mode
integrated intensity (■) as a function of glass composition x in AsxS1-x binary. In (b), the ---- line
gives the floppy mode variation with r = 2 + x, and the ••••• line gives the difference between the
integrated intensity (■) and the floppy mode (----) contribution.
Figure 16. (Color online). (a) Observed IR reflectance and (b) the imaginary part of dielectric
constant ε2 (TO response) in binary AsxS1-x glasses. The TO response was deduced from
Kramers-Kronig transformation of the reflectance data.
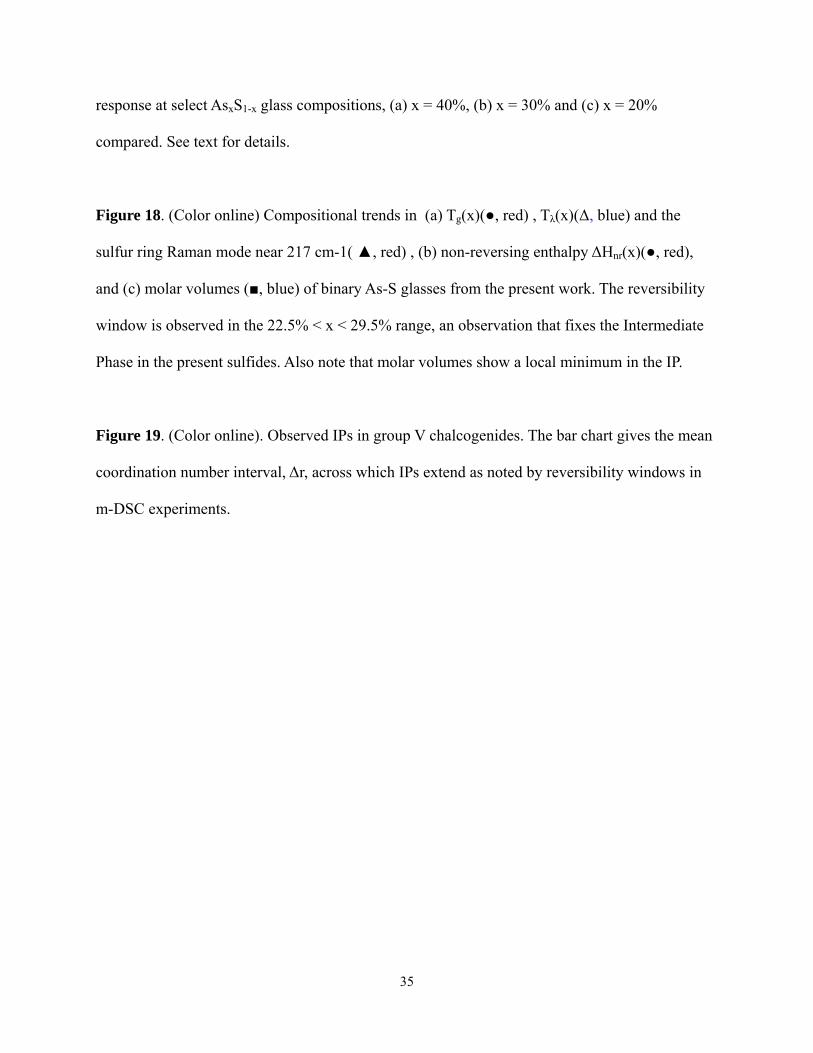
Figure 17. (Color online). Infrared transverse optic TO (blue) and longitudinal optic LO (red)
35
response at select AsxS1-x glass compositions, (a) x = 40%, (b) x = 30% and (c) x = 20%
compared. See text for details.
Figure 18. (Color online) Compositional trends in (a) Tg(x)(●, red) , Tλ(x)(Δ, blue) and the
sulfur ring Raman mode near 217 cm-1( ▲, red) , (b) non-reversing enthalpy ΔHnr(x)(●, red),
and (c) molar volumes (■, blue) of binary As-S glasses from the present work. The reversibility
window is observed in the 22.5% < x < 29.5% range, an observation that fixes the Intermediate
Phase in the present sulfides. Also note that molar volumes show a local minimum in the IP.
Figure 19. (Color online). Observed IPs in group V chalcogenides. The bar chart gives the mean
coordination number interval, Δr, across which IPs extend as noted by reversibility windows in
m-DSC experiments.
36
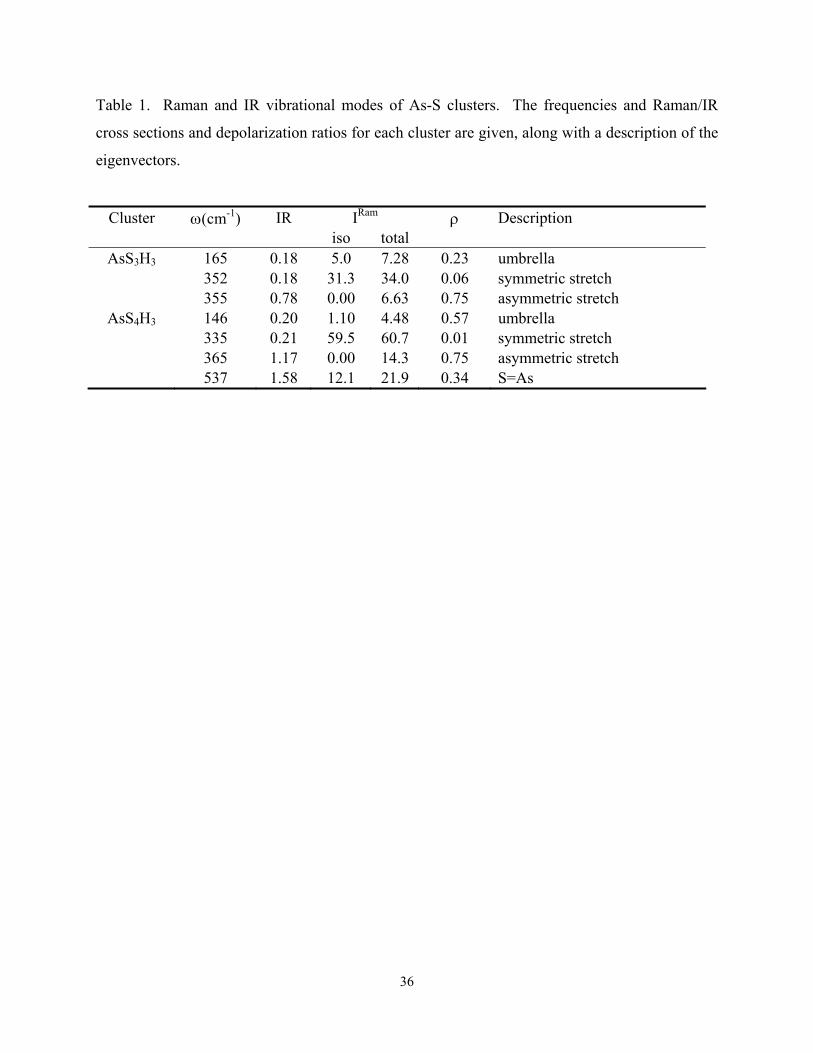
Table 1. Raman and IR vibrational modes of As-S clusters. The frequencies and Raman/IR
cross sections and depolarization ratios for each cluster are given, along with a description of the
eigenvectors.
Cluster ω(cm-1) IR IRam ρ Description iso total
AsS3H3 165 0.18 5.0 7.28 0.23 umbrella 352 0.18 31.3 34.0 0.06 symmetric stretch 355 0.78 0.00 6.63 0.75 asymmetric stretch
AsS4H3 146 0.20 1.10 4.48 0.57 umbrella 335 0.21 59.5 60.7 0.01 symmetric stretch 365 1.17 0.00 14.3 0.75 asymmetric stretch 537 1.58 12.1 21.9 0.34 S=As
37
<r>2.0 2.2 2.4 2.6 2.8
T g (o C
)
-100
0
100
200
300
400
500
Ge, P content x (%)0 5 10 15 20 25
GexPxS1-2x
GexPxSe1-2xTλ
Tg(S8)
Tg(Sn)
Figure 1
38
Figure 2
39
Figure 3
40
As-fraction0 10 20 30 40 50
VM
(cm
3 )
13
14
15
16
17
18
19AsxSe1-x glass
g-AsxS1-x (predicted)
c-As2S3
c-As2Se3
15%reductionin crystal
10%reductionin glass
15%
g-AsxS1-x (exp.)
Figure 4
41
40 60 80 100 120 140 160 180 200
Hea
t Flo
w (c
al/g
o C)
-2
-1
0
1
150 155 160 165 1700.200.220.240.260.280.300.32
Pure S βαTm= 117.95oC
Tλ
Tλ=160.6oC
Total
Total
Non-Reversing
Reversing
12.8 cal/g or13.7 kJ/mol
3.26 cal/g or3.5 kJ/mol
548.6 J/mol511 mcal/g or
T(oC)40 60 80 100 120 140
Hea
t Flo
w (c
al/g
o C)
0.00
0.05
0.10
0.15
0.20
0.25
0 20 40 60 80 100 120 140 160
Hea
t Flo
w (c
al/g
o C)
0.00
0.05
0.10
0.15
0.20
0.25Total
Non-Reversing
Reversing
AsxS1-x x=8% 3 oC/min scan rateendotherm up
Tg = 20 oC ΔCp = 27 mcal/g/oC
Tλ = 132 oC
ΔCp, λ = 27 mcal/g/oC
exotherm0.98 cal/g
Tλ endotherm0.94 cal/g
endotherm0.20 cal/g
Total
Non-Reversing
Reversing
AsxS1-x x=15% 3 oC/min scan rateendotherm up
Tg = 60 oCΔCp = 37 mcal/g/oC
Tλ = 139 oC
ΔCp, λ = 16 mcal/g/oC
exotherm0.19 cal/g Tλ endotherm
0.68 cal/gendotherm0.79 cal/g
(a)
(b)
(c)
Figure 5
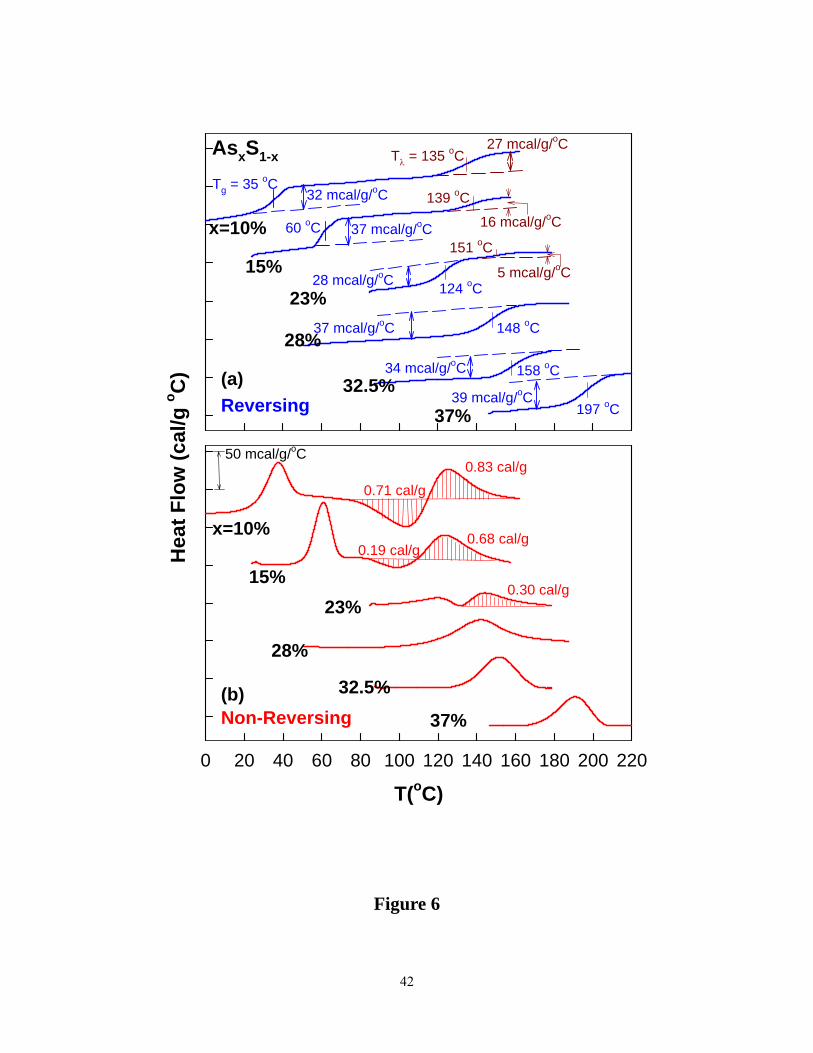
42
T(oC)0 20 40 60 80 100 120 140 160 180 200 220
Hea
t Flo
w (c
al/g
o C)
AsxS1-x
Non-Reversing
0.19 cal/g0.68 cal/g
0.71 cal/g0.83 cal/g
0.30 cal/g
Reversing
Tg = 35 oC
37 mcal/g/oC
Tλ = 135 oC
16 mcal/g/oC60 oC
139 oC32 mcal/g/oC
27 mcal/g/oC
124 oC28 mcal/g/oC
37 mcal/g/oC 148 oC
5 mcal/g/oC
151 oCx=10%
15%
23%
28%
x=10%
15%23%
28%
50 mcal/g/oC
34 mcal/g/oC 158 oC
197 oC39 mcal/g/oC
32.5%37%
(a)
(b) 32.5%
37%
Figure 6
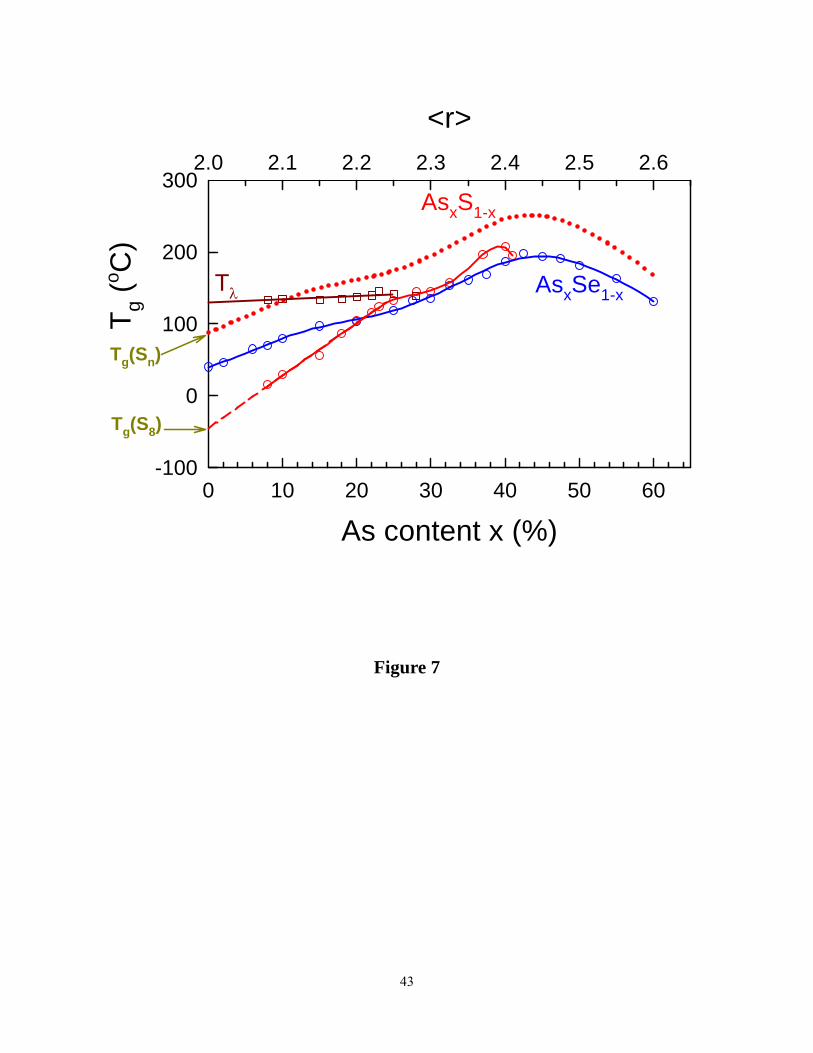
43
<r>2.0 2.1 2.2 2.3 2.4 2.5 2.6
T g (o C
)
-100
0
100
200
300
As content x (%)0 10 20 30 40 50 60
AsxS1-x
AsxSe1-xTλ
Tg(S8)
Tg(Sn)
Figure 7
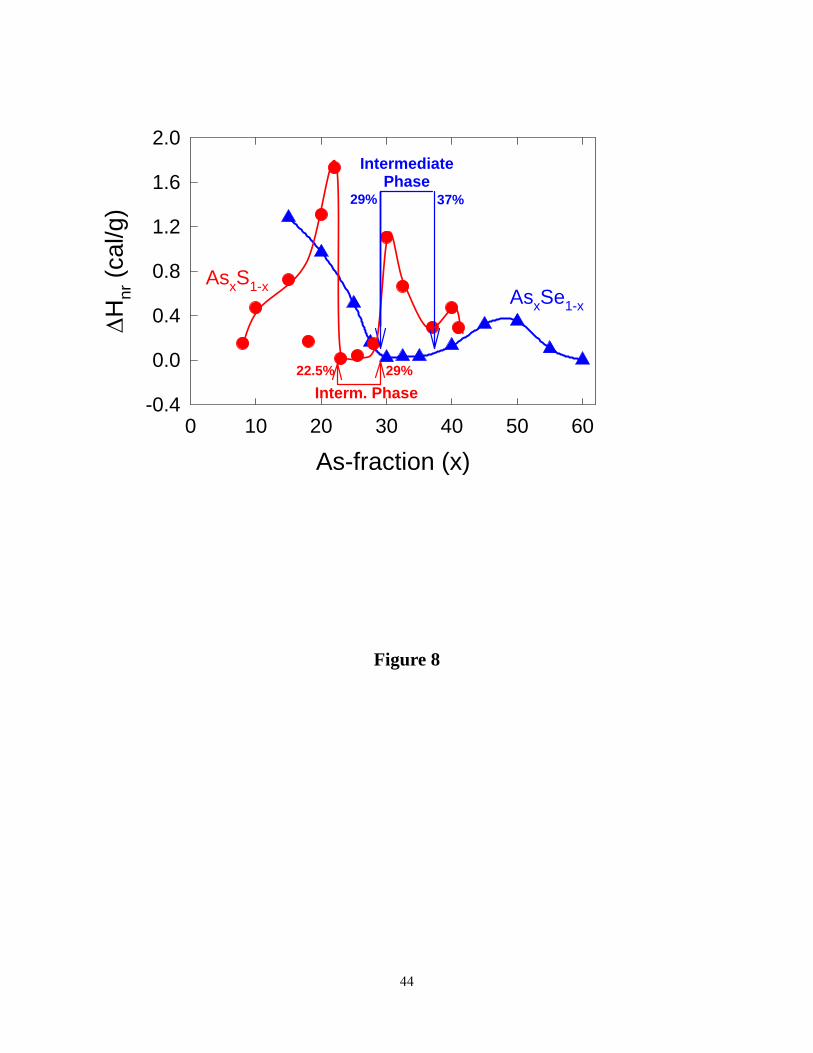
44
Figure 8
As-fraction (x)0 10 20 30 40 50 60
Δ Hnr
(cal
/g)
-0.4
0.0
0.4
0.8
1.2
1.6
2.0
AsxSe1-x
AsxS1-x
Interm. Phase22.5% 29%
IntermediatePhase
29% 37%
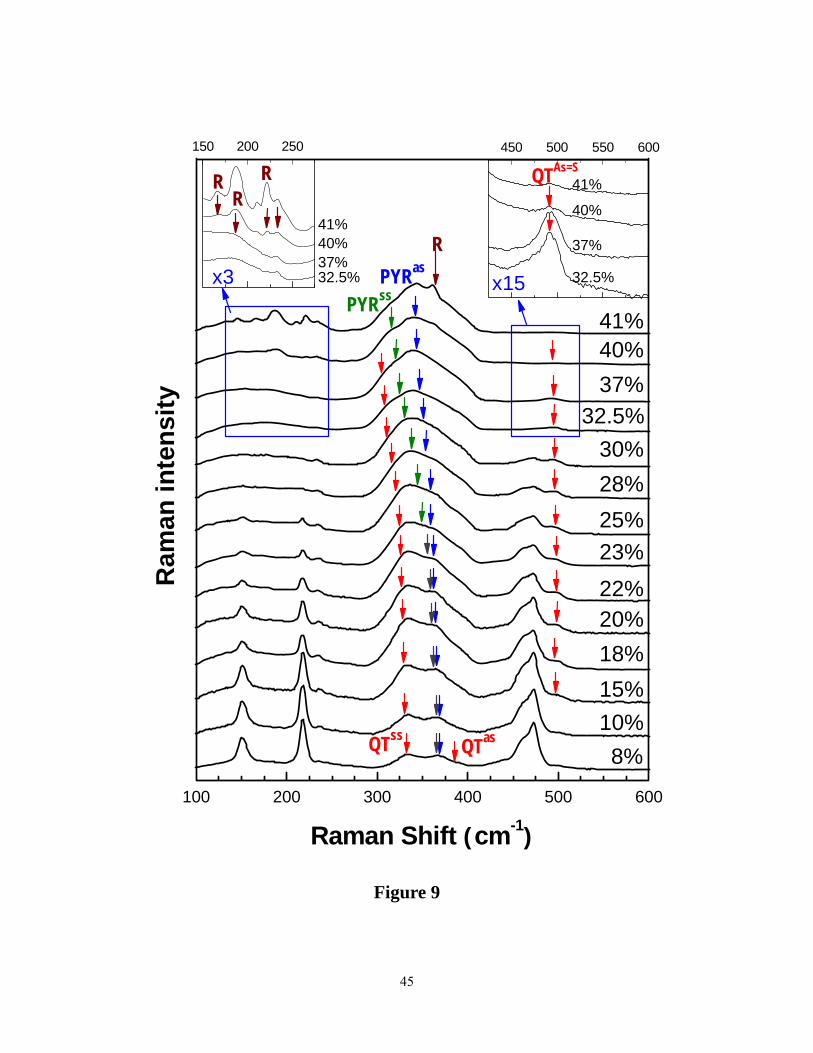
45
450 500 550 600150 200 250
100 200 300 400 500 600
R RR
R
QTasQTss
PYRasx3
8%10%
25%
18%
Ram
an in
tens
ity
Raman Shift (cm-1)
30%28%
23%22%
15%
20%
37%32.5%
41%40%
x15PYRss
QTAs=S
37%
32.5%
41%
40%
37%32.5%
41%40%
Figure 9
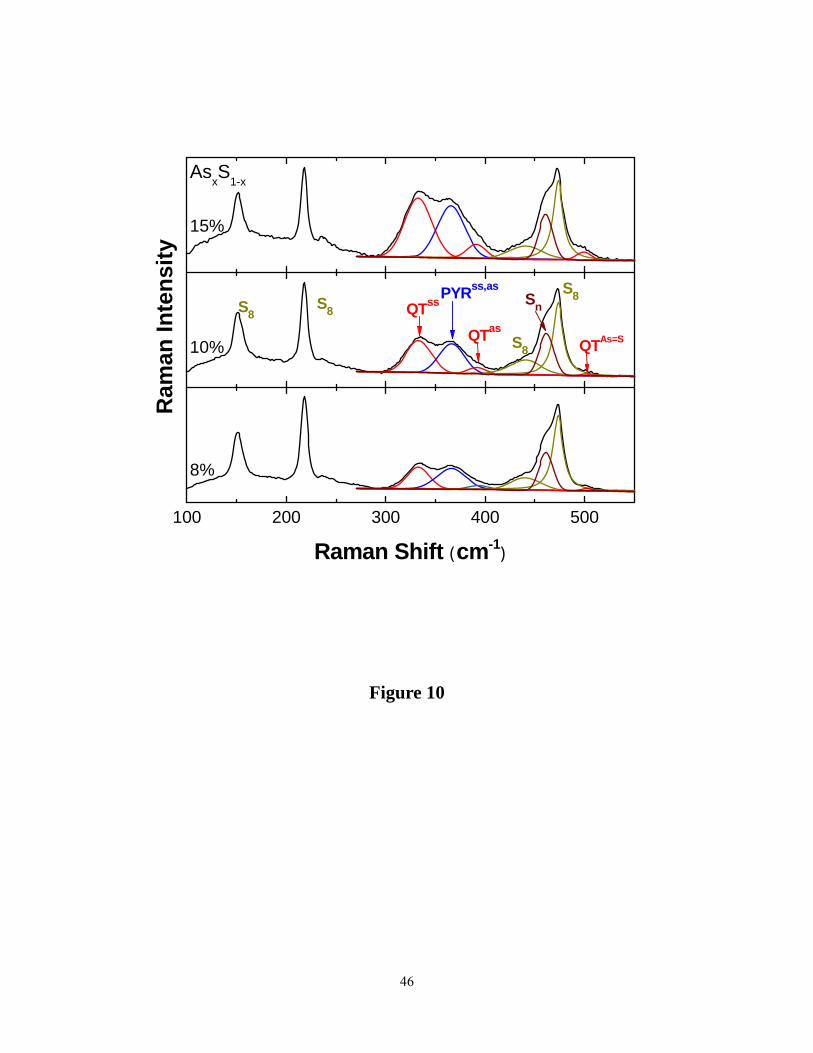
46
100 200 300 400 500
15%
AsxS1-x
10%
Raman Shift (cm-1)
8%
S8
SnS8S8
S8
QTAs=SQTasQTssPYRss,as
Ram
an In
tens
ity
Figure 10
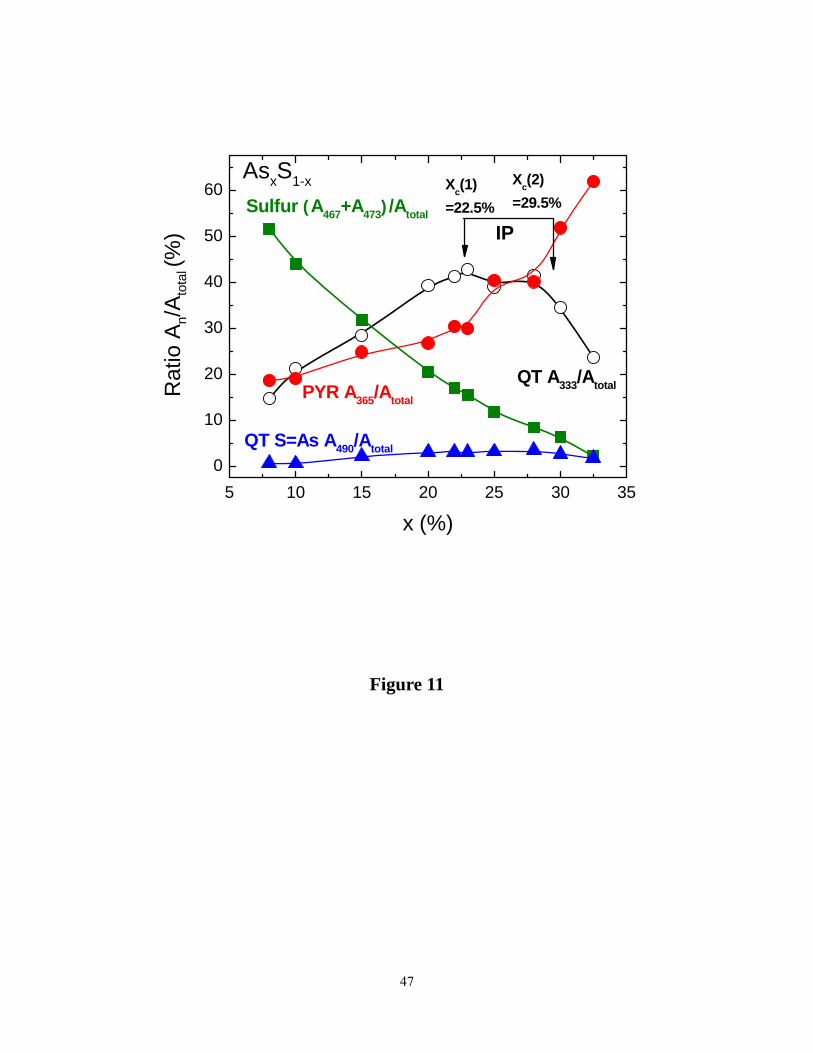
47
5 10 15 20 25 30 350
10
20
30
40
50
60
Rat
io A
n/Ato
tal (%
)
x (%)
Xc(2)=29.5%
Xc(1)=22.5%
QT S=As A490/Atotal
Sulfur (A467+A473)/Atotal
PYR A365/Atotal
QT A333/Atotal
AsxS1-x
IP
Figure 11
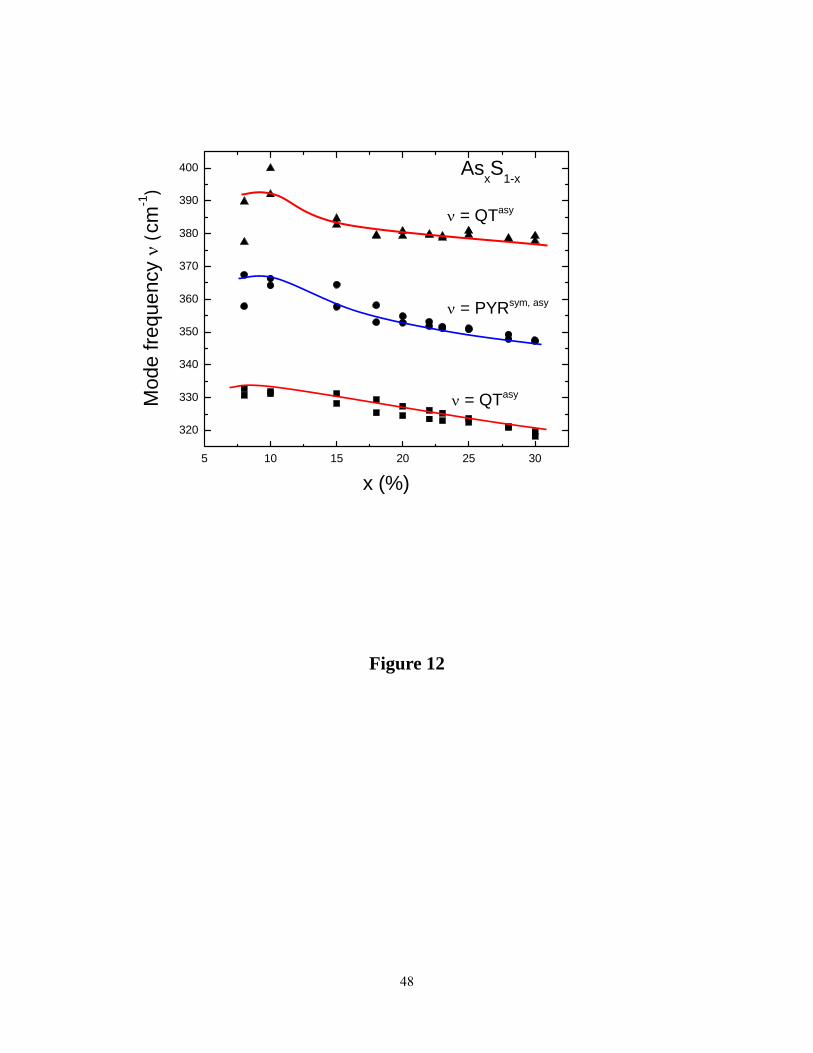
48
Figure 12
5 10 15 20 25 30
320
330
340
350
360
370
380
390
400
ν = QTasy
ν = PYRsym, asy
Mod
e fre
quen
cy ν
(cm
-1)
x (%)
AsxS1-x
ν = QTasy
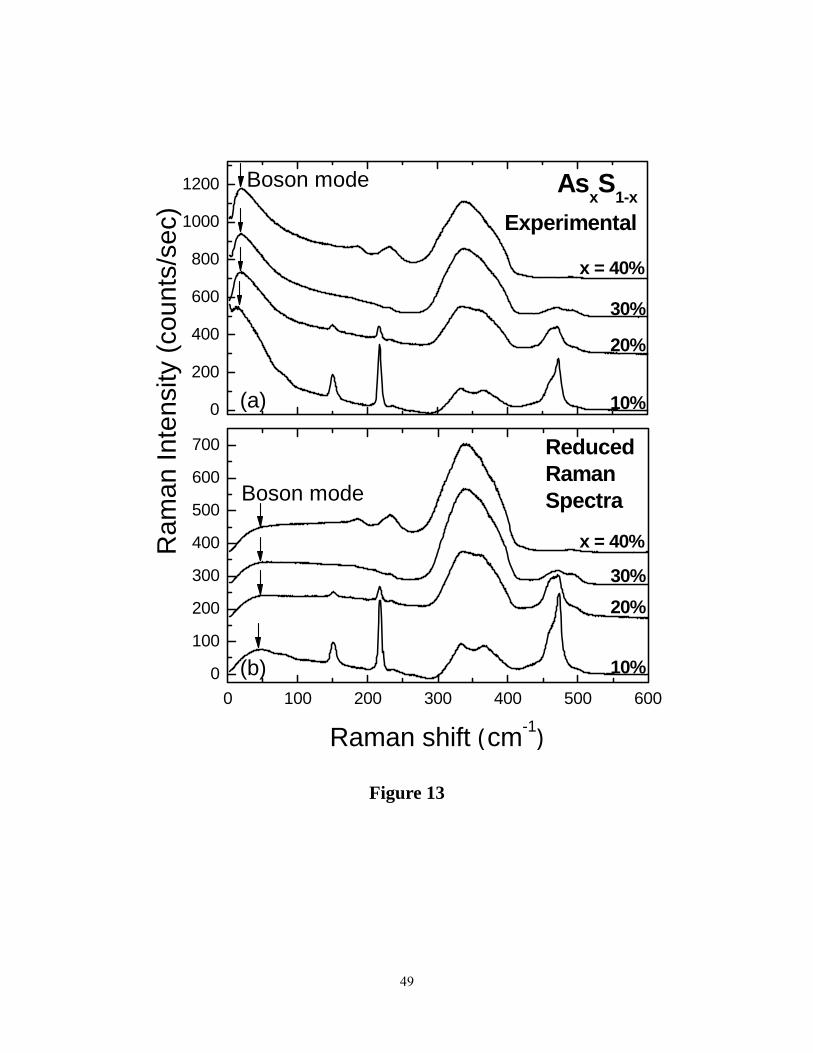
49
0
200
400
600
800
1000
1200
0 100 200 300 400 500 6000
100
200
300
400
500
600
700
Boson mode
Experimental
20%
30%
x = 40%
(a) 10%
AsxS1-x
Boson mode
(b)
Ram
an In
tens
ity (c
ount
s/se
c)
Raman shift (cm-1)
20%30%
x = 40%
10%
Reduced RamanSpectra
Figure 13
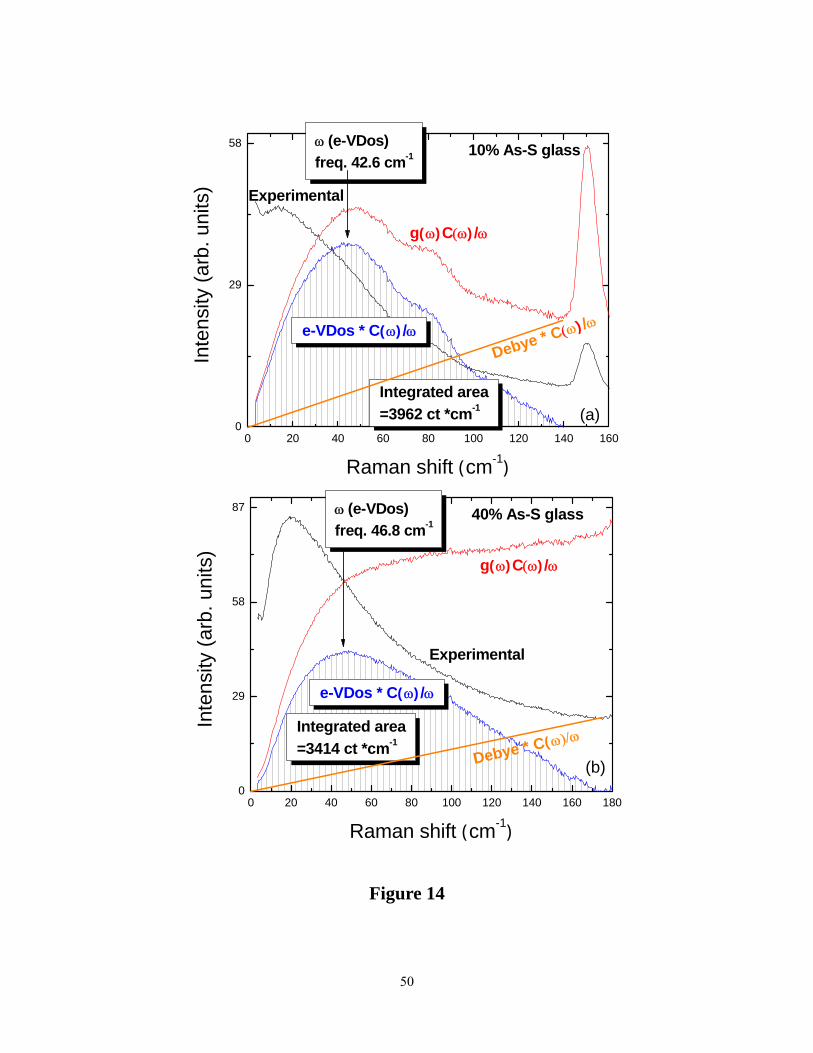
50
0 20 40 60 80 100 120 140 1600
29
58
Integrated area=3962 ct *cm-1
ω (e-VDos) freq. 42.6 cm-1
e-VDos * C(ω)/ω
10% As-S glass
Debye * C(ω)/ω
g(ω)C(ω)/ω
Inte
nsity
(arb
. uni
ts)
Raman shift (cm-1)
Experimental
(a)
0 20 40 60 80 100 120 140 160 1800
29
58
87
(b)
Integrated area=3414 ct *cm-1
ω (e-VDos) freq. 46.8 cm-1
e-VDos * C(ω)/ω
40% As-S glass
Debye * C(ω)/ω
g(ω)C(ω)/ω
Inte
nsity
(arb
. uni
ts)
Raman shift (cm-1)
Experimental
Figure 14
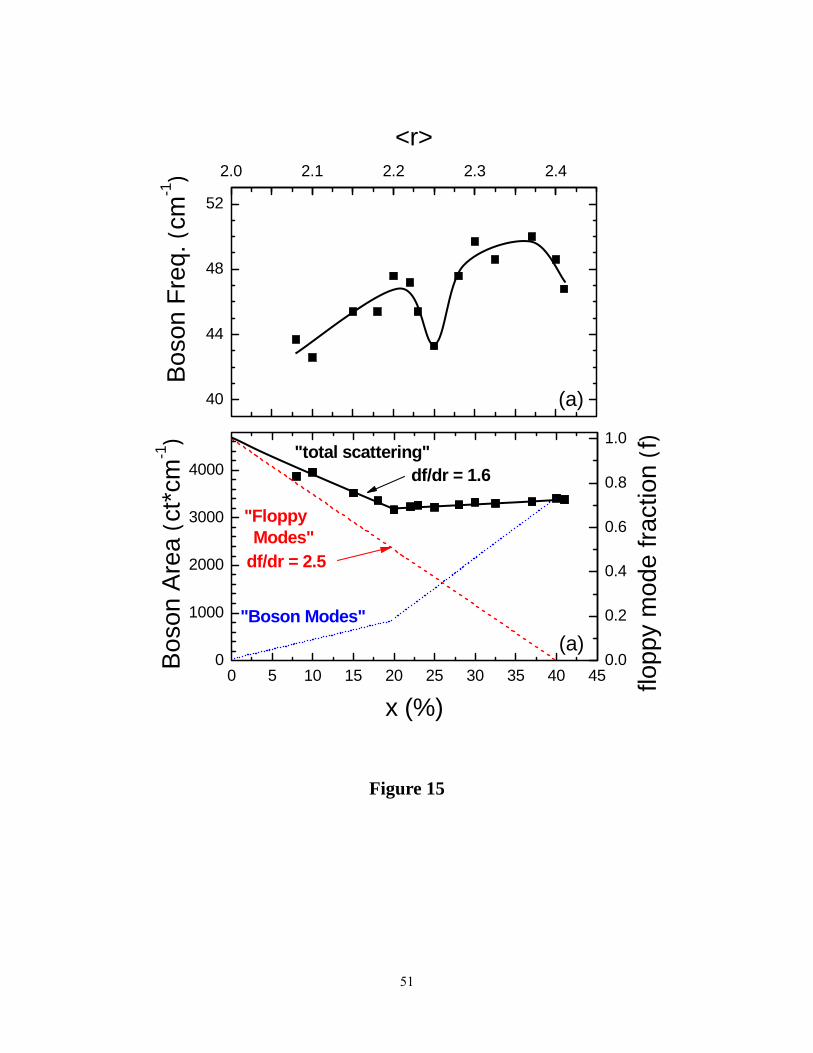
51
Figure 15
40
44
48
52
0 5 10 15 20 25 30 35 40 450
1000
2000
3000
4000
0.0
0.2
0.4
0.6
0.8
1.0
2.0 2.1 2.2 2.3 2.4
Bos
on F
req.
(cm
-1)
(a)
"total scattering"
"Floppy Modes"
Bos
on A
rea
(ct*
cm-1
)
x (%)
(a)"Boson Modes"
df/dr = 2.5
flopp
y m
ode
fract
ion
(f)
df/dr = 1.6
<r>
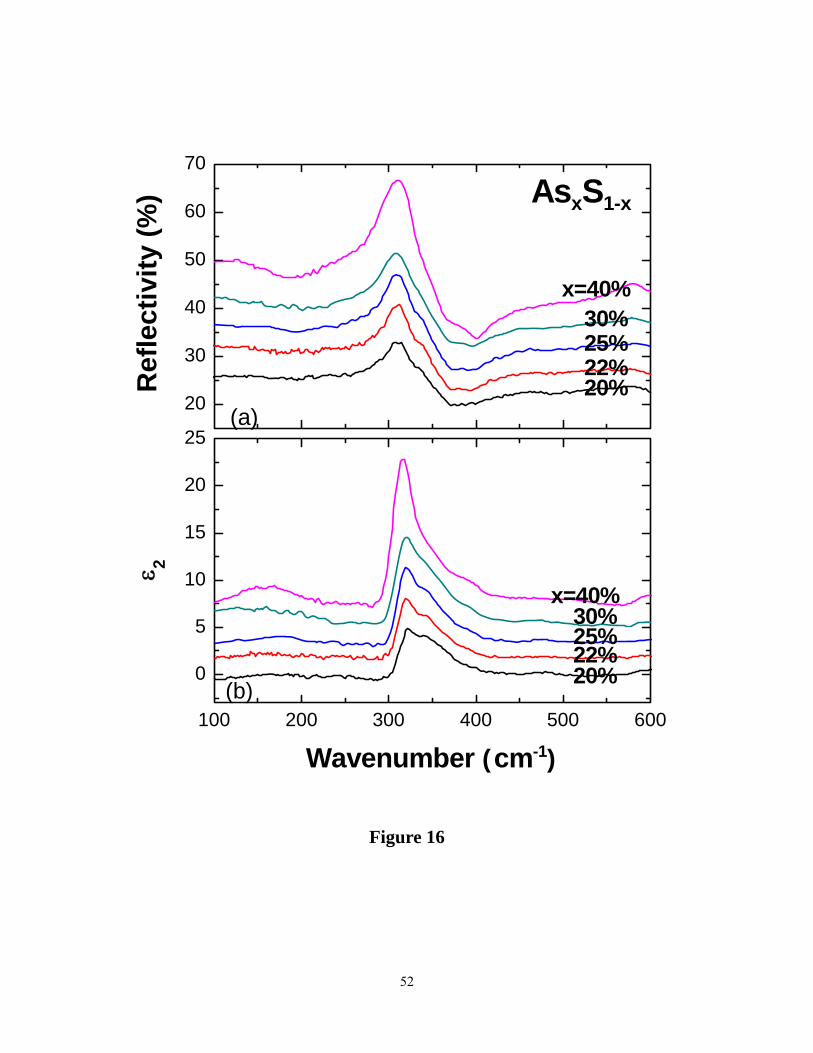
52
100 200 300 400 500 600
0
5
10
15
20
25
20
30
40
50
60
70
(b)
ε 2
Wavenumber (cm-1)
30%22%20%
x=40%
25%
R
efle
ctiv
ity (%
)
30%
22%20%
x=40%
25%
AsxS1-x
(a)
Figure 16
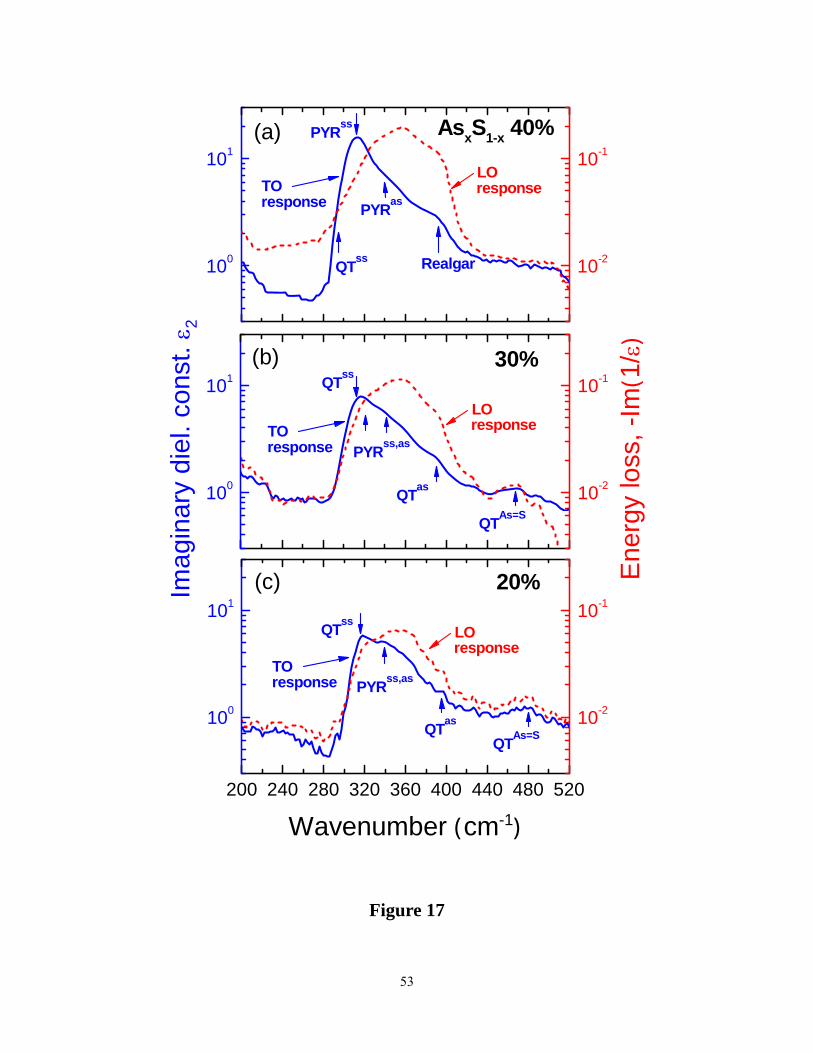
53
Figure 17
100
101
10-2
10-1PYRss
Realgar
(a)
PYRasTOresponse
QTss
AsxS1-x 40%
LOresponse
100
101
10-2
10-1
QTas
(b)
Imag
inar
y di
el. c
onst
. ε2
QTAs=S
PYRss,as
QTss30%
Ene
rgy
loss
, -Im
(1/ε
)
LOresponseTO
response
200 240 280 320 360 400 440 480 520
100
101
10-2
10-1
QTAs=S
Wavenumber (cm-1)
QTas
20%
PYRss,as
QTss
(c)
TOresponse
LOresponse
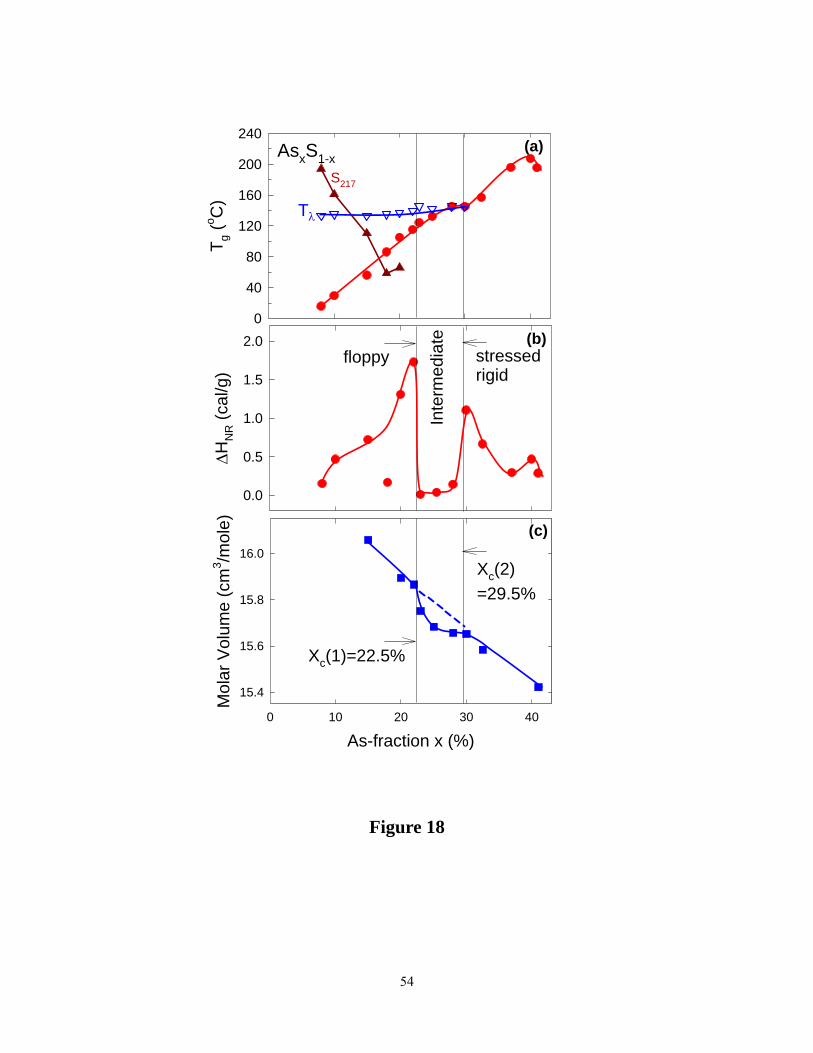
54
Figure 18
T g (o C
)
0
40
80
120
160
200
240AsxS1-x
(a)
ΔHN
R (c
al/g
)
0.0
0.5
1.0
1.5
2.0 (b)stressedrigid
floppy
As-fraction x (%)0 10 20 30 40
Mol
ar V
olum
e (c
m3 /m
ole)
15.4
15.6
15.8
16.0
(c)
Inte
rmed
iate
Tλ
Xc(1)=22.5%
Xc(2)=29.5%
S217
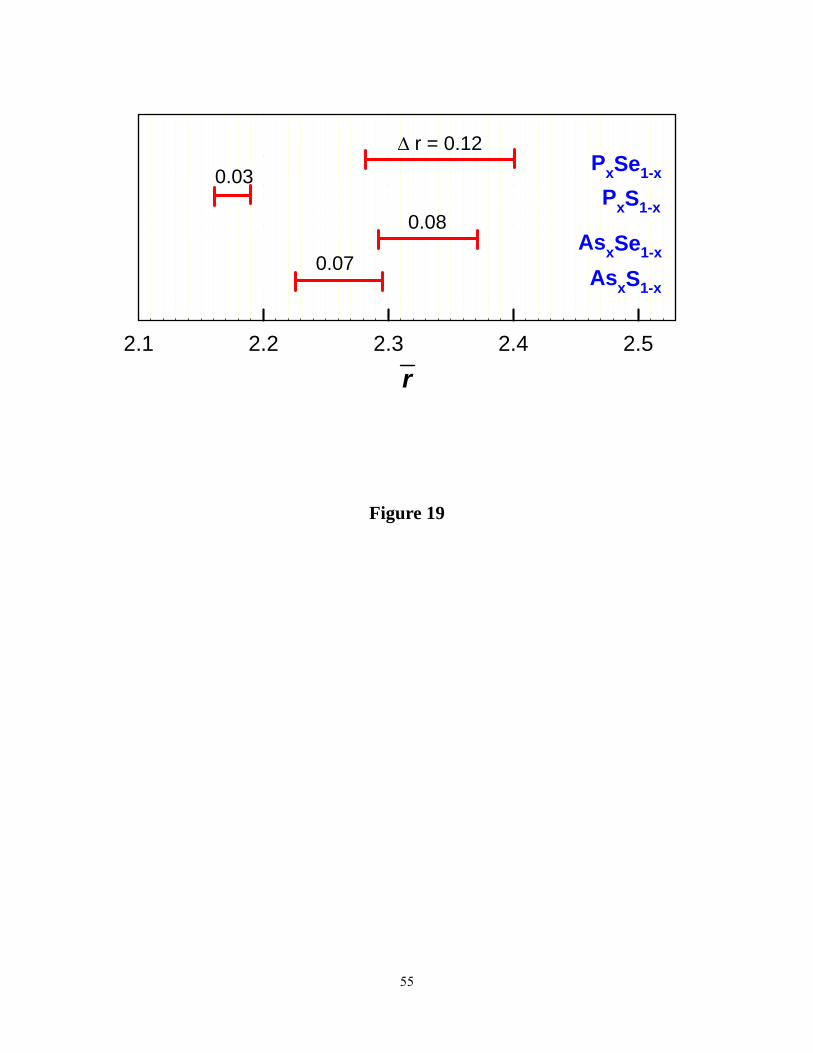
55
r2.1 2.2 2.3 2.4 2.5
AsxS1-x
PxSe1-x
AsxSe1-x
PxS1-x
Δ r = 0.12
0.08
0.03
0.07
Figure 19


![[hal-00256385, v1] Modelling improvisatory and compositional ...](https://static.fdokumen.com/doc/165x107/6324da46cedd78c2b50c4d83/hal-00256385-v1-modelling-improvisatory-and-compositional-.jpg)