A portable optical human sweat sensor
8
A portable optical human sweat sensor Mahmoud Al-omari, Gengchen Liu, Anja Mueller, Adam Mock, Ruby N. Ghosh, Kyle Smith, and Tolga Kaya Citation: Journal of Applied Physics 116, 183102 (2014); doi: 10.1063/1.4901332 View online: http://dx.doi.org/10.1063/1.4901332 View Table of Contents: http://scitation.aip.org/content/aip/journal/jap/116/18?ver=pdfcov Published by the AIP Publishing Articles you may be interested in Evaluation of efficiency of laser systems on removal of debris and smear layer in maxillary canine root canals J. Laser Appl. 26, 032005 (2014); 10.2351/1.4870878 Measurement of compressed breast thickness by optical stereoscopic photogrammetry Med. Phys. 36, 569 (2009); 10.1118/1.3065066 Assessing the future of diffuse optical imaging technologies for breast cancer management Med. Phys. 35, 2443 (2008); 10.1118/1.2919078 A portable, low coherence interferometry based instrument for fine needle aspiration biopsy guidance Rev. Sci. Instrum. 76, 064301 (2005); 10.1063/1.1921509 Optical instrument for measurement of vaginal coating thickness by drug delivery formulations Rev. Sci. Instrum. 76, 034302 (2005); 10.1063/1.1863832 [This article is copyrighted as indicated in the article. Reuse of AIP content is subject to the terms at: http://scitation.aip.org/termsconditions. Downloaded to ] IP: 141.209.167.154 On: Tue, 18 Nov 2014 20:20:35
Transcript of A portable optical human sweat sensor

A portable optical human sweat sensorMahmoud Al-omari, Gengchen Liu, Anja Mueller, Adam Mock, Ruby N. Ghosh, Kyle Smith, and Tolga Kaya Citation: Journal of Applied Physics 116, 183102 (2014); doi: 10.1063/1.4901332 View online: http://dx.doi.org/10.1063/1.4901332 View Table of Contents: http://scitation.aip.org/content/aip/journal/jap/116/18?ver=pdfcov Published by the AIP Publishing Articles you may be interested in Evaluation of efficiency of laser systems on removal of debris and smear layer in maxillary canine root canals J. Laser Appl. 26, 032005 (2014); 10.2351/1.4870878 Measurement of compressed breast thickness by optical stereoscopic photogrammetry Med. Phys. 36, 569 (2009); 10.1118/1.3065066 Assessing the future of diffuse optical imaging technologies for breast cancer management Med. Phys. 35, 2443 (2008); 10.1118/1.2919078 A portable, low coherence interferometry based instrument for fine needle aspiration biopsy guidance Rev. Sci. Instrum. 76, 064301 (2005); 10.1063/1.1921509 Optical instrument for measurement of vaginal coating thickness by drug delivery formulations Rev. Sci. Instrum. 76, 034302 (2005); 10.1063/1.1863832
[This article is copyrighted as indicated in the article. Reuse of AIP content is subject to the terms at: http://scitation.aip.org/termsconditions. Downloaded to ] IP:
141.209.167.154 On: Tue, 18 Nov 2014 20:20:35

A portable optical human sweat sensor
Mahmoud Al-omari,1 Gengchen Liu,2 Anja Mueller,3 Adam Mock,1,2 Ruby N. Ghosh,4
Kyle Smith,2 and Tolga Kaya1,2,a)
1Science of Advanced Materials Program, Central Michigan University, Mt. Pleasant, Michigan 48859, USA2School of Engineering and Technology, Central Michigan University, Mt. Pleasant, Michigan 48859, USA3Department of Chemistry, Central Michigan University, Mt. Pleasant, Michigan 48859, USA4Department of Physics and Astronomy, Michigan State University, East Lansing, Michigan 48824, USA
(Received 14 August 2014; accepted 29 October 2014; published online 10 November 2014)
We describe the use of HNQ (2-hydroxy-1,4-naphthoquinone or Lawsone) as a potential sweat
sensor material to detect the hydration levels of human beings. We have conducted optical
measurements using both artificial and human sweat to validate our approach. We have determined
that the dominant compound that affects HNQ absorbance in artificial sweat is sodium. The
presence of lactate decreases the reactivity of HNQ while urea promotes more interactions of
sodium and potassium ions with HNQ. The interactions between the hydroxyl group of HNQ and
the artificial sweat components (salts, lactic acid, and urea) were investigated comprehensively.
We have also proposed and developed a portable diode laser absorption sensor system that
converts the absorbance at a particular wavelength range (at 455 6 5 nm, where HNQ has an
absorbance peak) into light intensity measurements via a photocell. The absorbance intensity
values obtained from our portable sensor system agrees within 10.4% with measurements from a
laboratory based ultraviolet-visible spectrometer. Findings of this research will provide significant
information for researchers who are focusing on real-time, in-situ hydration level detection. VC 2014AIP Publishing LLC. [http://dx.doi.org/10.1063/1.4901332]
I. INTRODUCTION
As biosensors become ubiquitous and receive endorsement
from the general public, research and development on biologi-
cal sensing is experiencing a rapid rise.1,2 The persistent con-
sumer demand for wearable and portable devices has shifted
the research of biosensors toward more application-oriented
processes. This particular shift has resulted in the development
of biological sensors that are non-invasive and have thus
eclipsed the traditional blood analysis methods. To this point,
the development of portable, non-invasive, and biocompatible
sensors has focused mostly on temperature, relative humidity,
glucose, pH, and blood pressure.3–6 Recently, there has been a
growth in research involving the use of sweat as a sensor
analyte to measure certain body functions. Hydration status,
cystic fibrosis diagnosis, and kidney functions analyses are con-
sidered to be particularly enhanced by investigating an individ-
ual’s sweat content.7–9 HNQ (2-hydroxy-1,4-naphthoquinone
or Lawsone) has recently drawn attention in sensor research, as
it has been identified as a promising material for use in skin-
contact biological sensors. HNQ was used as a biological
marker to detect latent fingermarks on paper surfaces.10
Aqueous HNQ solutions were also used to detect pH changes.11
A cyanide and acetate sensor was implemented using HNQ
optical properties.12
It has been well established that sweat can be considered
the diluted version of blood in terms of constituents such as
electrolytes and minerals.13,14 Although contents in sweat
appear in lower concentration than in blood, the sensitivity
of current sensor technology has made it possible to detect
such changes. Sweat contains several hundred different
chemicals.13,14 A good representation of sweat, however, can
be standardized into four major constituents: sodium ions, po-
tassium ions, lactate, and urea.15,16 Combinations of these
compounds are used to create artificial sweat in order to inves-
tigate mainly corrosion and nanoparticle release effects on tex-
tiles and metal implants.16–20 In recent years, the electrolyte
content of sweat has been used to determine the physiological
status of a person, such as hydration or tiredness.8,21–23
In-situ sweat analysis has been centered mainly on pH
level detection and sodium ion concentration monitoring.
Diamond’s group, as a part of the BIOTEX project,24 devel-
oped textile sensors for sweat pH analysis using optical tech-
niques.25,26 The analysis of the sodium ion concentration of
sweat has been investigated using skin contact electrodes to
detect the real-time electrolyte-level changes.27,28 In other
research, the sweat lactate levels have been determined using
electrochemical tattoos.29 Sweat ethanol levels have been
monitored via an electrochemical transdermal alcohol con-
centration sensor.30
Besides electrochemical methods, the detection of opti-
cal property variation in response to changes in the concen-
tration of sweat content has shown great promise. We have
previously demonstrated that a natural dye known as HNQ
can be used as a sweat sensing material based on color
changes.31,32 Our previous work focused on the optical prop-
erties of HNQ under various hydration conditions where the
optical absorbance is linearly related to the amount of ions
that are present in a liquid media along with HNQ.32
In the current work, optical absorbance versus concen-
tration of sweat components is analyzed. The effects of
a)Author to whom correspondence should be addressed. Electronic mail:
0021-8979/2014/116(18)/183102/7/$30.00 VC 2014 AIP Publishing LLC116, 183102-1
JOURNAL OF APPLIED PHYSICS 116, 183102 (2014)
[This article is copyrighted as indicated in the article. Reuse of AIP content is subject to the terms at: http://scitation.aip.org/termsconditions. Downloaded to ] IP:
141.209.167.154 On: Tue, 18 Nov 2014 20:20:35

increasing the concentration of four primary chemical com-
ponents of sweat both in aggregate as well as individually
are presented and discussed. The sensitivity of the sensor
technique is presented and shown to be sufficient for the pro-
posed application. Finally, we have successfully imple-
mented a portable diode laser absorption sensor (PDLAS)
system that would eliminate the need for bulky laboratory
instruments in testing the optical properties of sweat. This is
a first step toward a deployable, wearable sweat sensor. Our
investigation of sweat chemistry sensing is particularly
groundbreaking as it will shed light on the effect of sweat
content on the real-time physical condition of subjects such
as athletes and soldiers.
II. ARTIFICIAL SWEAT
Artificial sweat is defined as a water solution with four
primary dissolved compounds: sodium chloride (NaCl), po-
tassium chloride (KCl), urea, and lactic acid. It is important
to note that human sweat contains additional compounds in
low concentrations besides the four compounds in artificial
sweat. However, for many applications and for the purposes
of this work, measuring these four compounds is sufficient.
The artificial sweat used in this study was prepared accord-
ing to the European Standard number EN1811: 2012 by
dissolving the following compounds in 1 liter of ultra-
purified deionized water (resistivity of 18.3 MX cm): 0.5%
of NaCl, 0.1% of KCl, 0.1% of lactic acid, and 0.1% of urea
(weight/volume ratio). NaCl, KCl, and lactic acid were
acquired from VWR International, Inc. Urea was acquired
from Fisher Scientific, Inc. The resulting constituent concen-
trations are 85 mM NaCl, 13 mM KCl, 17 mM lactic acid,
and 16 mM urea. In this study, these concentrations of artifi-
cial sweat represent “normal” human levels. The target
application of this work is dehydration sensing, which is
manifested as an increase in the concentration of these 4
principal sweat components from their base values.
It has been reported that the HNQ dye has redox proper-
ties allowing the binding of cations at pH values between 5
and 7.33 For this reason, pH was carefully controlled in these
experiments. The Eco Testr PH2 pH meter was used to deter-
mine the pH value for the samples; the pH of the artificial
sweat solutions was adjusted to 5.4 6 0.3 by drop-wise addi-
tion of 0.01 M ammonium hydroxide (NH4OH, Fischer
Scientific, Inc.).
III. SWEAT CHEMICAL ANALYSIS USING HNQ DYE
The main goal of this paper is to validate the use of
HNQ as a sweat sensor material to quantify the hydration
levels of human beings in-situ. One drop of real/artificial
human sweat solution into 15 ml HNQ solution causes a sig-
nificant change in the intensity of the absorbance peak cen-
tered at 455 nm as shown in Figure 1. We have previously
shown that the sweat itself does not have an absorbance in
the region of 400 nm and 500 nm.32 Sweat contains 98%
water, and the remaining is mainly electrolytes, urea, and
lactic acid. Figure 1 shows the UV-Vis spectrum of HNQ
dye by itself, with artificial sweat as described in Sec. II and
real human sweat collected from subjects (approved by
Central Michigan University’s Institutional Review Board).
The measurements were performed with a standard Varian
CARY 1 Ultraviolet absorbance spectrometer with 1 nm
resolution. The HNQ (Aldrich Chemical Company) is dis-
solved in a solution of 4:1 DI: Acetone (volumetric ratio).
In earlier research, we found that HNQ changes color
when it is doped with sodium or potassium ions.31 It turns
from pale orange to dark orange (see Figure 2(a) inset). The
main reason behind the color change is that the hydroxyl
group of HNQ (see Figure 1 inset) is deprotonated, and the
negatively charged oxygen atom is attached to positively
charged sodium or potassium ions, forming a doped HNQ
structure.31 This effect changes the electron density of the
FIG. 1. UV-Vis spectrum of HNQ solutions with and without real/artificial
sweat. Human/artificial sweat data were obtained by adding a drop of sweat
into 15 ml of HNQ solution. Our focus is on the absorbance peak centered
around 455 nm, which is not present in a pure sweat sample.32 The inset
shows the chemical scheme of the HNQ molecule.
FIG. 2. (a) UV-Vis spectra at 5 repre-
sentative artificial sweat constituent
concentrations. Inset shows photo-
graph of the 5 samples arranged from
lowest concentration (left) to highest
(right). (b) Average absorbance versus
concentration at center wavelengths
ðkcenterÞ 455 nm, 555 nm, and 655 nm.
The averaging was performed over a
10 nm bandwidth.
183102-2 Al-omari et al. J. Appl. Phys. 116, 183102 (2014)
[This article is copyrighted as indicated in the article. Reuse of AIP content is subject to the terms at: http://scitation.aip.org/termsconditions. Downloaded to ] IP:
141.209.167.154 On: Tue, 18 Nov 2014 20:20:35
benzene, which enhances the absorption peak at 455 nm. As
more blue/green light at 455 nm is absorbed, only the red/
orange regions of the spectrum pass through the sample giv-
ing its characteristic color.
Figure 2(a) shows the optical absorption spectra meas-
ured by conventional UV-Vis spectroscopy for 5 representa-
tive artificial sweat þ HNQ samples. Various concentrations
of artificial sweat were prepared by increasing the concentra-
tions of the 4 primary compounds while keeping the relative
ratios the same. The goal is to demonstrate the ability to
measure a wide range of hydration levels. The broad peak
centered at 455 nm grows in amplitude with increasing artifi-
cial sweat concentration, whereas in the wavelength region
500 nm–800 nm, the absorbance is relatively unchanged.
Figure 2(a) inset illustrates that the effect of absorption
due to large differences in concentration of artificial sweat is
visible to the naked eye. To ensure that the optical absorption
results from HNQ molecular absorption and not simply from
increasing conductivity of the liquid due to a higher concen-
tration of dissolved charged species, the average absorbance
centered at 455 nm, 555 nm, and 655 nm is plotted in Figure
2(b). These are absorbance values averaged over a 10 nm
region centered at the wavelength of interest. The wavelength
value at which the maximum near 455 nm occurs can shift by
as much as 65 nm due mostly to the breadth of the peak and
the limited spectrometer dynamic range. The 10 nm averaging
procedure removes any ambiguity in concentration measure-
ment due to small spectral shifting. In a deployed and/or wear-
able sweat sensor, a light source with a sufficiently broad
spectrum will automatically perform this averaging procedure.
In Figure 2(b), it is clear that the strongest absorbance
occurs at 455 nm, whereas the absorbance at 655 nm is barely
above the measurement noise floor. The continuous lines are
least squares fits of the formula ABSavg ¼ affiffiffiffiCpþ b, where
ABSavg is the average absorbance, C is the concentration, and
a and b are fit parameters. The values of the fit parameters
are (a, b)¼ (6.98, �0.57); (0.674, 0.059); (0.061, 0.005) for
455 nm, 555 nm, and 655 nm, respectively. The excellent
agreement between the trend lines and the experimental data
suggests that the dependence of ABSavg on C is indeed of the
form ABSavg ¼ affiffiffiffiCpþ b. On the other hand, Beer’s law
states that the absorbance is linearly related to the concentra-
tion of the media C, the attenuation coefficient or molar
absorptivity e, and the path length l:
ABS ¼ elC: (1)
However, the law is only valid for low concentration
samples, particularly for concentrations below 10 mM.34 As
the concentration increases, the spacing between ions or mol-
ecules in the medium are reduced so that neighboring par-
ticles contribute to the charge distribution, ultimately
altering the absorption.34 In other words, solutions that con-
tain electrolytes can alter the molar absorptivity due to elec-
trostatic interactions.34 This effect is apparent in Figure 2(b)
as the concentration range is from 10 mM to 250 mM. In
fact, derivation of Beer’s law excludes the interaction
between particles.35
Here, sensitivity is defined in terms of the minimum
measureable change in transmitted light intensity for a given
change in component concentration DCmin ¼ 1jdI=dCjDImin,
where I ¼ Ioe�ax (Beer-Lambert law36) and
dI
dC¼ Ioe�ax d �axð Þ
dC¼ �2:3I
d ABSavgð ÞdC
¼ �2:3Ia= 2ffiffiffiffiCp� �
:
(2)
Here, DCmin and DImin are defined as the minimum de-
tectable concentration and light intensity changes, respec-
tively, Io is the nominal intensity, a is the absorption
coefficient, and x is the distance that the light travels in the
medium (i.e., the size of the sample container). The factor 2.3
appears because ABS ¼ �log10ðI=I0Þ and ax ¼ �lnðI=I0Þ,and 2:3 � 1= log10e converts between natural log and log
base 10.
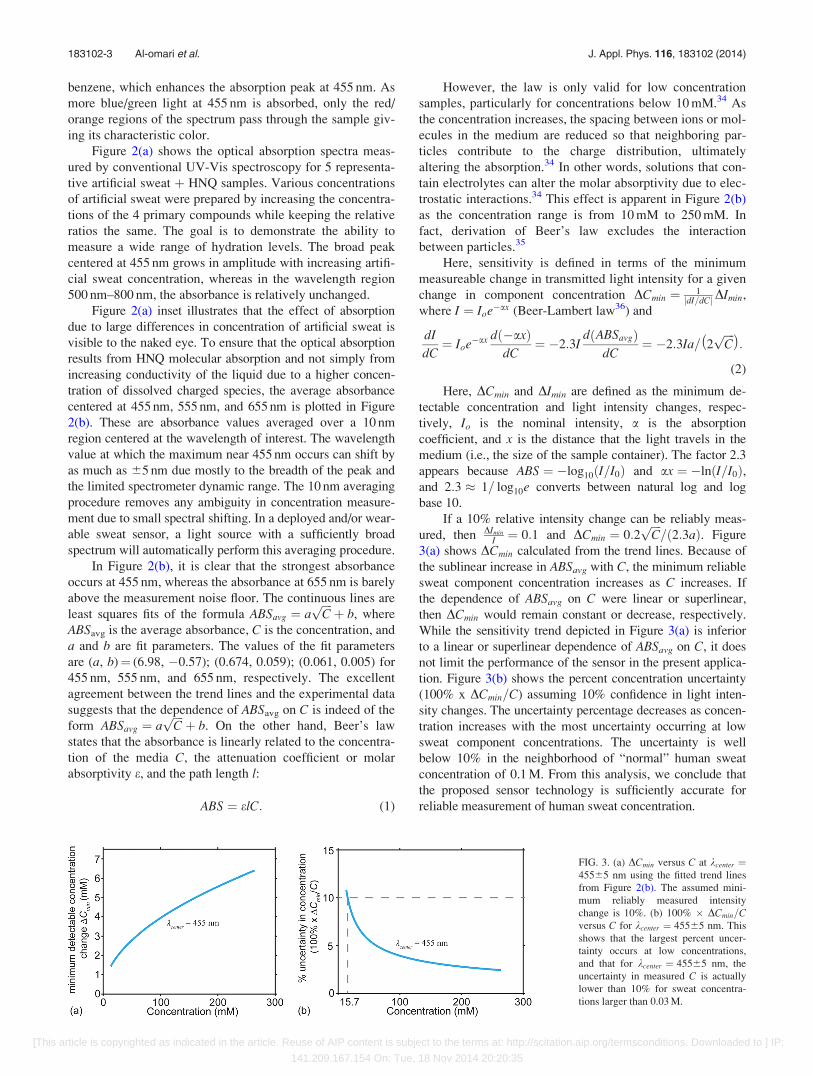
If a 10% relative intensity change can be reliably meas-
ured, then DImin
I ¼ 0:1 and DCmin ¼ 0:2ffiffiffiffiCp
=ð2:3aÞ. Figure
3(a) shows DCmin calculated from the trend lines. Because of
the sublinear increase in ABSavg with C, the minimum reliable
sweat component concentration increases as C increases. If
the dependence of ABSavg on C were linear or superlinear,
then DCmin would remain constant or decrease, respectively.
While the sensitivity trend depicted in Figure 3(a) is inferior
to a linear or superlinear dependence of ABSavg on C, it does
not limit the performance of the sensor in the present applica-
tion. Figure 3(b) shows the percent concentration uncertainty
(100% x DCmin=C) assuming 10% confidence in light inten-
sity changes. The uncertainty percentage decreases as concen-
tration increases with the most uncertainty occurring at low
sweat component concentrations. The uncertainty is well
below 10% in the neighborhood of “normal” human sweat
concentration of 0.1 M. From this analysis, we conclude that
the proposed sensor technology is sufficiently accurate for
reliable measurement of human sweat concentration.
FIG. 3. (a) DCmin versus C at kcenter ¼45565 nm using the fitted trend lines
from Figure 2(b). The assumed mini-
mum reliably measured intensity
change is 10%. (b) 100% � DCmin=Cversus C for kcenter ¼ 45565 nm. This
shows that the largest percent uncer-
tainty occurs at low concentrations,
and that for kcenter ¼ 45565 nm, the
uncertainty in measured C is actually
lower than 10% for sweat concentra-
tions larger than 0.03 M.
183102-3 Al-omari et al. J. Appl. Phys. 116, 183102 (2014)
[This article is copyrighted as indicated in the article. Reuse of AIP content is subject to the terms at: http://scitation.aip.org/termsconditions. Downloaded to ] IP:
141.209.167.154 On: Tue, 18 Nov 2014 20:20:35

IV. SWEAT CHEMISTRY
In order to understand the effect of individual compounds
in sweat, different combinations of urea, lactic acid, NaCl,
and KCl were added to HNQ and the resulting optical spectra
were analyzed. All possible combinations of the four artificial
sweat components were prepared as shown in Table I.
Because normal human sweat has a pH in the range 5 to 7, the
pH of all samples was set to 5.4 6 0.3. The standardized artifi-
cial sweat concentration values were used. The data are
arranged in a binary setting where “1” representing the exis-
tence of the compound in the solution, as shown in Table I.
“0000” means there is no compound added to the HNQ.
The main reason of the increase in the absorbance peak at
455 nm is that sodium and potassium ions are attached to the
deprotonated HNQ as illustrated in Figure 1. It is evident that
83% of HNQ will be in deprotonated (forming the HNQ ion,
HNQ�, as shown in Figure 4) since the pKa value of HNQ is
4.0 (percentage of deprotonation can be calculated using the
Henderson-Hasselbach equation; pH ¼ pKa � logn
HNQ½ �HNQ�½ �
o)
and the pH is 5.6. Positively charged sodium and potassium
ions in the artificial sweat solution can then be bonded to
HNQ�, forming either HNQ-Na or HNQ-K, which changes
the electron density and thus energy of the ring, as detailed in
Figure 4.
This molecular change is reflected in the optical absorb-
ance spectrum and clearly observed in the experiments pre-
sented in Table I. In the cases where only NaCl and/or KCl
(samples #4, #8, and #12) are present in the solution, ABS(maximum absorption intensity obtained from UV-Vis meas-
urements in the region of 450 nm–460 nm) significantly
increased compared to the HNQ sample alone (sample #0).
As shown in Figure 5, adding KCl increases absorption by
1.5 times, adding NaCl increases the absorption by 2.6 times
and adding both KCl and NaCl increase the absorption by
3.1 times.
On the other hand, the presence of lactic acid (lactate�)
lowers the absorbance (sample #2 vs. #3, #6 vs. #7, #8 vs.
#9, and #12 vs. #13) as shown in Figure 6(a). Lactate (Lactic
acid) will be 96% dissociated (pKa¼ 3.86) to form nega-
tively charged lactate ions (lactate� in Figure 4), which will
prevent the process of HNQ protonation. Therefore, lower
percentage of HNQ� will cause a reduced intensity absorb-
ance. In two specific cases (sample #4 vs. 5 and #10 vs.
#11), lactate has a different effect; we postulate that some of
the Naþ and Kþ ions are consumed by binding to lactate and
thus are unavailable to bind to HNQ. As every negative ion
needs a positive ion, and Naþ and Kþ bind a carboxylate ion
more strongly than NH4þ, the results of sample #4 vs. 5 and
#10 vs. #11 are actually expected.
Urea, on the other hand, has two NH2 groups, which are
capable of accepting protons to form protonated urea, as
illustrated in Figure 4. Due to its pKa (pKa¼ 0.2, i.e.,
pKb¼ 13.8), 98% of the available urea molecules can donate
electrons to form ammonia ions, which can further deproto-
nate the remaining HNQ (17% from the initial solution)
resulting in higher concentration of HNQ-Na and/or
HNQ-K. This theory is well observed in Table I comparing
samples #0 vs. #2, #1 vs. #3, #9 vs. #11, etc., as shown in
Figure 6(b). Finally, the pH of the solutions was adjusted
with NH4OH to 5.4 6 0.3. This compound can react with the
remaining unreacted HNQ and create further negatively
TABLE I. The optical absorbance measured for different combination of ar-
tificial sweat while adjusting pH using NH4OH. The binary representation
corresponds to the presence of the compound (represented as “1”).
Sample
number
NaCl
(85 mM)
KCl
(13 mM)
Urea
(16 mM)
Lactic acid
(17 mM) ABS
0 0 0 0 0 0.16
1 0 0 0 1 0.18
2 0 0 1 0 0.21
3 0 0 1 1 0.18
4 0 1 0 0 0.24
5 0 1 0 1 0.29
6 0 1 1 0 0.30
7 0 1 1 1 0.28
8 1 0 0 0 0.41
9 1 0 0 1 0.37
10 1 0 1 0 0.29
11 1 0 1 1 0.40
12 1 1 0 0 0.49
13 1 1 0 1 0.34
14 1 1 1 0 0.57
15 1 1 1 1 0.58
FIG. 4. HNQ reacts with sweat compo-
nents resulting in doped HNQ (HNQ-
Na and HNQ-K), charged urea (Ureaþ),
and charged lactate (Lactate�). A
by-product of ammonia ions is also
generated due to the pH adjustment
with NH4OH.
183102-4 Al-omari et al. J. Appl. Phys. 116, 183102 (2014)
[This article is copyrighted as indicated in the article. Reuse of AIP content is subject to the terms at: http://scitation.aip.org/termsconditions. Downloaded to ] IP:
141.209.167.154 On: Tue, 18 Nov 2014 20:20:35

charged HNQ ions (HNQ�), which ultimately results in
advance reaction of sodium and potassium ions.
As a result, the main mechanism behind the interaction
between sodium and potassium ions in sweat is the deproto-
nated HNQ. While urea promotes further deprotonation and
thus doping, lactic acid prevents the reaction. Although this
is the general trend, it must be noted that there are some
cases where this theory was not supported. We believe this is
mainly because some complex reactions we have yet to iden-
tify. A deeper study on the each compound’s interactions
with HNQ is needed.
V. PORTABLE SWEAT SENSOR
With a view toward a wearable, commercially available
diagnostic system, a size-scalable single wavelength optical
absorption measurement system (PDLAS) was built using
commercially available, off-the-shelf components. The light
source is an OSRAM PL450B blue-violet laser diode
(k0¼ 450 nm). This laser wavelength targets the maximum
of the HNQ absorbance peak. An Advanced Photonix
PDV-P9003 photoconductive photocell was used for detec-
tion. A schematic diagram and a photograph of the actual
setup are shown in Figure 7. A spherical lens with one-inch
focal length is used to collimate the laser beam. The beam
intensity is controlled by an optical attenuator that consists
of a stationary linear polarizer and a rotatable linear polar-
izer. Intensity outputted from the attenuator is I0 cos2(h),
where h is the angle of rotation between the two linear polar-
izers and I0 is the nominal laser intensity. Standard current
control circuitry was used as a buffer between the DC power
supply (BK Precision 1651 A) and the laser diode. The resist-
ance of the photocell was measured with a BK precision
5492B standard multimeter.
Characterization of the PDLAS is shown in Figure 8(a).
The relationship between the intensity and resistance of a
photocell is �log10ðI=I0Þ ¼ n log10ðR=R0Þ. I0 is the incident
intensity. Ro was experimentally measured to be 1.9 kX.
Figure 8(a) shows the experimental calibration used to deter-
mine n ¼ 1:85, which holds over a large dynamic range.
Figure 8(b) shows the comparison between the absorption
coefficient measured using a conventional UV-Vis spectro-
photometer and the PDLAS system. The absorption coeffi-
cient is related to ABS via ABS ¼ �log10ðI=I0Þ ¼ ax log10e,
so that a ¼ 2:3ABS=x where 2:3 � 1= log10e. The samples
size is x¼ 1.1 cm. The PDLAS system is able to reproduce
the UV-Vis measurements with an average disagreement of
10.4% (minimum and maximum errors are 1.2% and 25.2%,
respectively). While further iterations of the PDLAS imple-
mentation can potentially improve the average measurement
agreement to within 5%, even in its present form the PDLAS
can be used for reliable sweat concentration monitoring.
VI. CONCLUSION
The effect of hydration on the performance of athletes
has been studied over the years. There is a current trend
where non-invasive hydration detection systems are of inter-
est. Sweat analysis provides a viable alternative to blood
analysis towards this goal. However, current techniques of
sweat analysis require time consuming laboratory analysis
(results being obtained even in a longer time than a blood
analysis), hence are not applicable for frequent sampling.
This work has investigated HNQ dye and the role of
four primary sweat components (sodium chloride, potassium
chloride, lactate, and urea) in the ability to detect sweat com-
ponent detection optically. The sensing mechanism is shown
to be robust with sufficient accuracy for reliable detection.
Furthermore, the HNQ optical sensing approach is scalable
to a compact and potentially wearable form. As a step toward
a deployable sensor device, we have successfully imple-
mented a PDLAS that can be used to quantitatively
FIG. 5. Bar chart representation of samples 0, 4, 8, and 12 from Table I.
Adding salt into HNQ increases the absorbance significantly.
FIG. 6. The effect of urea and lactate on the optical absorbance: (a) Lactate
mostly decreases the absorbance; (b) Urea mostly increases the absorbance.
183102-5 Al-omari et al. J. Appl. Phys. 116, 183102 (2014)
[This article is copyrighted as indicated in the article. Reuse of AIP content is subject to the terms at: http://scitation.aip.org/termsconditions. Downloaded to ] IP:
141.209.167.154 On: Tue, 18 Nov 2014 20:20:35

determine the hydration levels of human sweat in-situ by
eliminating the need for a complicated laboratory based mea-
surement setup. We believe that our approach will help
researchers to investigate advanced materials including but
not limited to natural dyes for their physical and chemical
properties towards compact, wearable sweat analysis
systems.
ACKNOWLEDGMENTS
Dr. Kevin Miller and Dr. Jeff Edwards provided valuable
insights on the sweat composition and sweat collection
procedures. Dr. Kivanc Sel provided fruitful discussions. Dr.
Bunyamin Sahin helped with the final reviewing. Funding
was provided by the Science of Advanced Materials program
at Central Michigan University, Central Michigan University
Research Corporation, and National Science Foundation,
grant number EEC-1201095.
1J. R. Windmiller and J. Wang, Electroanal. 25, 29 (2013).2A. P. Turner, Chem. Soc. Rev. 42, 3184 (2013).3M. Z. Poh, N. C. Swenson, and R. W. Picard, IEEE Trans. Bio-Med. Eng.
57, 1243 (2010).4D. Diamond, S. Coyle, S. Scarmagnani, and J. Hayes, Chem. Rev. 108,
652 (2008).5Y. T. Liao, H. Yao, A. Lingley, B. Parviz, and P. B. Otis, IEEE J. Solid-
State Circ. 47, 335 (2012).
6M. Caldara, C. Colleoni, E. Guido, G. Rosace, and A. Vitali, Proc. Sens.
Microsyst. 268, 431 (2014).7A. Mishra, R. Greaves, and J. Massie, Clin. Biochem. 26, 135 (2005).8S. N. Cheuvront and R. W. Kenefick, Compr Physiol. 4, 257 (2014).9B. I. Freedman, D. W. Bowden, S. C. Smith, and J. Divers, J. Diabetes
Complicat. 28, 56 (2014).10R. Jelly, S. W. Lewis, C. Lennard, and J. Almog, Talanta 82, 1717
(2010).11R. Kavitha and T. Stalin, J. Lumin. 149, 12 (2014).12M. Hijji, B. Barare, and Y. Zhang, Sens. Actuators B 169, 106 (2012).13H. H. Mosher, J. Biol. Chem. 99, 781 (1933).14S. Robinson and A. H. Robinson, Physiol. Rev. 34, 202 (1954).15EN 1811:2011, “Reference test method for release of nickel from all post
assemblies which are inserted into pierced parts of the human body and
articles intended to come into direct and prolonged contact with the skin,”
German version EN 1811:2011.16K. Midander, J. Pan, I. O. Wallinder, K. Heim, and C. Leygraf, Contact
Dermatitis 56, 325 (2007).17M. I. Carretero, M. Pozo, J. A. Mart�ın-Rub�ı, E. Pozo, and F. Maraver,
Appl. Clay Sci. 48, 506 (2010).18R. J. Rathish, S. Rajendran, J. L. Christy, B. D. Shyamala, S. Johnmary,
M. Manivannan, and P. Rengan, T. O. Corr. J. 3, 38 (2010).19K. Kulthong, S. Srisung, K. Boonpavanitchakul, W. Kangwansupamonkon,
and R. Maniratanachote, Part Fibre Toxicol. 7, 8 (2010).20I. Milo�sev and T. Kosec, Appl. Surf. Sci. 254, 644 (2007).21B. Murray, J. Am. Coll. Nutrit. 26, 542S (2007).22M. N. Sawka, S. J. Montain, and W. A. Latzka, Comp. Biochem. Phys. A
128, 679 (2001).23E. K. Wujcik, N. J. Blasdel, D. Trowbridge, and C. N. Monty, IEEE Sens.
J. 13, 3430 (2013).24S. Coyle, K. T. Lau, N. Moyna, D. O’Gorman, D. Diamond, F. Di Francesco,
D. Costanzo, P. Salvo, M. G. Trivella, D. E. De Rossi, N. Taccini,
FIG. 8. (a) Characterization of the
PDLAS system. The function �log10
ðI=I0Þ ¼ n log10ðR=R0Þ is fit to the
data (linear in log-log scale). (b) The
absorbance coefficients for the UV-Vis
and PDLAS measurements form a
straight line with a slope of 1.1, which
corresponds to 10% error.
FIG. 7. PDLAS setup; (a) the photo of
the setup, (b) optical circuit schematic.
LP¼ linear polarizer, RLP¼ rotatable
linear polarizer.
183102-6 Al-omari et al. J. Appl. Phys. 116, 183102 (2014)
[This article is copyrighted as indicated in the article. Reuse of AIP content is subject to the terms at: http://scitation.aip.org/termsconditions. Downloaded to ] IP:
141.209.167.154 On: Tue, 18 Nov 2014 20:20:35

R. Paradiso, J.-A. Porchet, A. Ridolfi, J. Luprano, C. Chuzel, T. Lanier, F.
Revol-Cavalier, S. Schoumacker, V. Mourier, I. Chartier, R. Convert, H. De-
Moncuit, and C. Bini, IEEE Trans. Inf. Technol. Biomed. 14, 364 (2010).25C. Vincenzo, S. Coyle, R. Byrne, N. Angelov, D. Diamond, and F. Benito-
Lopez, Sens. Actuators B 175, 263 (2012).26V. F. Curto, C. Fay, S. Coyle, R. Byrne, C. O’Toole, C. Barry, and F.
Benito-Lopez, Sens. Actuators B 171, 1327 (2012).27B. Schazmann, D. Morris, C. Slater, S. Beirne, C. Fay, R. Reuveny, and D.
Diamond, Anal. Methods Instrum. 2, 342 (2010).28A. J. Bandodkar, D. Molinnus, O. Mirza, T. Guinovart, J. R. Windmiller,
G. Vald�es-Ram�ırez, and J. Wang, Biosens. Bioelectron. 54, 603 (2014).29W. Jia, A. J. Bandodkar, G. Valdes-Ramirez, J. R. Windmiller, Z. Yang, J.
Ramirez, and J. Wang, Anal. Chem. 85, 6553 (2013).
30M. Gamella, S. Campuzano, J. Manso, G. Rivera, F. L�opez-Colino, A. J.
Reviejo, and J. M. Pingarr�on, Anal. Chim. Acta 806, 1 (2014).31M. Al-Omari, K. Sel, A. Mueller, A. Mellinger, and T. Kaya, J. Appl.
Phys. 113, 204901 (2013).32M. Al-Omari, K. Sel, A. Mueller, J. Edwards, and T. Kaya, J. Appl. Phys.
115, 203107 (2014).33H. Greshon and L. Shanks, Can. J. Microbiol. 21, 1317 (1975).34D. A. Skoog, D. M. West, F. J. Holler, and S. R. Crouch,
Analytical Chemistry: An Introduction, 7th ed. (Thomson Learning,
2000).35H. A. Liebhafsky and H. G. Pfeiffer, J. Chem. Edu. 30, 450 (1953).36J. D. J. Ingle and S. R. Crouch, Spectrochemical Analysis (Prentice Hall,
New Jersey, 1988).
183102-7 Al-omari et al. J. Appl. Phys. 116, 183102 (2014)
[This article is copyrighted as indicated in the article. Reuse of AIP content is subject to the terms at: http://scitation.aip.org/termsconditions. Downloaded to ] IP:
141.209.167.154 On: Tue, 18 Nov 2014 20:20:35