A Population-Based Study of Hospital Care Costs During 5 Years After Transient Ischemic Attack and...
10
3343 C erebrovascular diseases are a leading cause of deaths worldwide, 1 and they are a principal cause of hospital and care–home resource utilization. 2 Therefore, there is much research interest in quantifying the cost of cerebrovascular diseases, particularly stroke. Although numerous studies have been published assessing the hospital care costs of stroke using patient-level data, few stud- ies have evaluated costs for >1 year after stroke onset, with an almost complete lack of long-term hospital cost data for transient ischemic attack (TIA). 2–6 This lack of evidence on the level and predictors of long-term hospital costs after TIA and stroke does not allow for formal comparisons of outcome and cost between these conditions and other diseases, hampering and limiting decisions about the relative funding requirements for service pro- vision and research. 7,8 In addition, estimates of long-term disease costs are valuable to other researchers, particularly as an input to decision-analytic models, which are becoming ever more popu- lar to assess the cost-effectiveness of health care interventions. To reliably determine the level and predictors of resource use and costs after TIA and stroke, population-based studies with full case ascertainment (ie, including minor events not admit- ted to the hospital and strokes resulting in death before, or soon after, hospital admission) are ideally required. 9 Therefore, we studied hospital care costs during the 5 years after any first incident or recurrent TIA or stroke in a population-based study. Materials and Methods The Oxford Vascular Study The Oxford Vascular (OXVASC) study population comprises >91 000 patients registered in 9 general practices across Oxfordshire, United Kingdom. The study methods have been described elsewhere. 10 Briefly, patient registration began on April 2002, and it is ongoing. Only consenting patients recruited from April 1, 2002 to March 31, 2007, were included in this analysis. Patients in whom TIA or stroke was suspected were ascertained using multiple overlapping methods of hot and cold pursuit and considered for inclusion, 11 including: 1. A daily (weekdays only), urgent open-access TIA clinic to which participating general practitioners and the local accident and emergency department send all individuals with suspected TIA or stroke whom they would not normally admit to hospital, with alternative on-call review provision during weekends. Background and Purpose—Few studies have evaluated long-term costs after stroke onset, with almost no cost data for transient ischemic attack (TIA). We studied hospital costs during the 5 years after TIA or stroke in a population-based study. Methods—Patients from a United Kingdom population-based cohort study (Oxford Vascular Study) were recruited from 2002 to 2007. Analysis was based on follow-up until 2010. Hospital resource usage was obtained from patient hospital records and valued using 2008/2009 unit costs. Because not all patients had full 5-year follow-up, we used nonparametric censoring techniques. Results—Among 485 TIA and 729 stroke patients ascertained and included, mean censor-adjusted 5-year hospital costs after index stroke were $25 741 (95% confidence interval, 23 659–27 914), with costs varying considerably by severity: $21 134 after minor stroke; $33 119 after moderate stroke; and $28 552 after severe stroke. For the 239 surviving stroke patients who had reached final follow-up, mean costs were $24 383 (95% confidence interval, 20 156–28 595), with more than half of costs ($12 972) being incurred in the first year after the event. After index TIA, the mean censor-adjusted 5-year costs were $18 091 (95% confidence interval, 15 947–20 258). A multivariate analysis showed that event severity, recurrent stroke, and coronary events after the index event were independent predictors of 5-year costs. Differences by stroke subtype were mostly explained by stroke severity and subsequent events. Conclusions—Long-term hospital costs after TIA and stroke are considerable, but they are mainly incurred during the first year after the index event. Event severity and experiencing subsequent stroke and coronary events after the index event accounted for much of the increase in costs. (Stroke. 2012;43:3343-3351.) Key Words: cost ◼ cost analysis ◼ stroke ◼ transient ischemic attack A Population-Based Study of Hospital Care Costs During 5 Years After Transient Ischemic Attack and Stroke Ramon Luengo-Fernandez, DPhil; Alastair M. Gray, PhD; Peter M. Rothwell, FMedSci; on behalf of the Oxford Vascular Study Received June 7, 2012; final revision received September 17, 2012; accepted September 18, 2012. From the Health Economics Research Center, Department of Public Health, University of Oxford, United Kingdom (R.L.-F., A.M.G.); and Stroke Prevention Research Unit, Nuffield Department of Clinical Neurosciences, University of Oxford, United Kingdom (P.M.R.). The online-only Data Supplement is available with this article at http://stroke.ahajournals.org/lookup/suppl/doi:10.1161/STROKEAHA.112.667204/-/DC1. Correspondence to Peter M. Rothwell, Stroke Prevention Research Unit, Nuffield Department of Clinical Neurosciences, Level 6, West Wing, John Radcliffe Hospital, Oxford OX3 9DU, United Kingdom. E-mail [email protected] © 2012 American Heart Association, Inc. Stroke is available at http://stroke.ahajournals.org DOI: 10.1161/STROKEAHA.112.667204 by guest on April 18, 2016 http://stroke.ahajournals.org/ Downloaded from
Transcript of A Population-Based Study of Hospital Care Costs During 5 Years After Transient Ischemic Attack and...

3343
Cerebrovascular diseases are a leading cause of deaths worldwide,1 and they are a principal cause of hospital
and care–home resource utilization.2 Therefore, there is much research interest in quantifying the cost of cerebrovascular diseases, particularly stroke.
Although numerous studies have been published assessing the hospital care costs of stroke using patient-level data, few stud-ies have evaluated costs for >1 year after stroke onset, with an almost complete lack of long-term hospital cost data for transient ischemic attack (TIA).2–6 This lack of evidence on the level and predictors of long-term hospital costs after TIA and stroke does not allow for formal comparisons of outcome and cost between these conditions and other diseases, hampering and limiting decisions about the relative funding requirements for service pro-vision and research.7,8 In addition, estimates of long-term disease costs are valuable to other researchers, particularly as an input to decision-analytic models, which are becoming ever more popu-lar to assess the cost-effectiveness of health care interventions.
To reliably determine the level and predictors of resource use and costs after TIA and stroke, population-based studies with
full case ascertainment (ie, including minor events not admit-ted to the hospital and strokes resulting in death before, or soon after, hospital admission) are ideally required.9 Therefore, we studied hospital care costs during the 5 years after any first incident or recurrent TIA or stroke in a population-based study.
Materials and MethodsThe Oxford Vascular StudyThe Oxford Vascular (OXVASC) study population comprises >91 000 patients registered in 9 general practices across Oxfordshire, United Kingdom. The study methods have been described elsewhere.10 Briefly, patient registration began on April 2002, and it is ongoing. Only consenting patients recruited from April 1, 2002 to March 31, 2007, were included in this analysis. Patients in whom TIA or stroke was suspected were ascertained using multiple overlapping methods of hot and cold pursuit and considered for inclusion,11 including:
1. A daily (weekdays only), urgent open-access TIA clinic to which participating general practitioners and the local accident and emergency department send all individuals with suspected TIA or stroke whom they would not normally admit to hospital, with alternative on-call review provision during weekends.
Background and Purpose—Few studies have evaluated long-term costs after stroke onset, with almost no cost data for transient ischemic attack (TIA). We studied hospital costs during the 5 years after TIA or stroke in a population-based study.
Methods—Patients from a United Kingdom population-based cohort study (Oxford Vascular Study) were recruited from 2002 to 2007. Analysis was based on follow-up until 2010. Hospital resource usage was obtained from patient hospital records and valued using 2008/2009 unit costs. Because not all patients had full 5-year follow-up, we used nonparametric censoring techniques.
Results—Among 485 TIA and 729 stroke patients ascertained and included, mean censor-adjusted 5-year hospital costs after index stroke were $25 741 (95% confidence interval, 23 659–27 914), with costs varying considerably by severity: $21 134 after minor stroke; $33 119 after moderate stroke; and $28 552 after severe stroke. For the 239 surviving stroke patients who had reached final follow-up, mean costs were $24 383 (95% confidence interval, 20 156–28 595), with more than half of costs ($12 972) being incurred in the first year after the event. After index TIA, the mean censor-adjusted 5-year costs were $18 091 (95% confidence interval, 15 947–20 258). A multivariate analysis showed that event severity, recurrent stroke, and coronary events after the index event were independent predictors of 5-year costs. Differences by stroke subtype were mostly explained by stroke severity and subsequent events.
Conclusions—Long-term hospital costs after TIA and stroke are considerable, but they are mainly incurred during the first year after the index event. Event severity and experiencing subsequent stroke and coronary events after the index event accounted for much of the increase in costs. (Stroke. 2012;43:3343-3351.)
Key Words: cost ◼ cost analysis ◼ stroke ◼ transient ischemic attack
A Population-Based Study of Hospital Care Costs During 5 Years After Transient Ischemic Attack and Stroke
Ramon Luengo-Fernandez, DPhil; Alastair M. Gray, PhD; Peter M. Rothwell, FMedSci; on behalf of the Oxford Vascular Study
Received June 7, 2012; final revision received September 17, 2012; accepted September 18, 2012.From the Health Economics Research Center, Department of Public Health, University of Oxford, United Kingdom (R.L.-F., A.M.G.); and Stroke
Prevention Research Unit, Nuffield Department of Clinical Neurosciences, University of Oxford, United Kingdom (P.M.R.).The online-only Data Supplement is available with this article at http://stroke.ahajournals.org/lookup/suppl/doi:10.1161/STROKEAHA.112.667204/-/DC1.Correspondence to Peter M. Rothwell, Stroke Prevention Research Unit, Nuffield Department of Clinical Neurosciences, Level 6, West Wing, John
Radcliffe Hospital, Oxford OX3 9DU, United Kingdom. E-mail [email protected]© 2012 American Heart Association, Inc.
Stroke is available at http://stroke.ahajournals.org DOI: 10.1161/STROKEAHA.112.667204
Archana
by guest on April 18, 2016http://stroke.ahajournals.org/Downloaded from

3344 Stroke December 2012
2. Daily searches of admissions to the medical, stroke, neurology, and other relevant wards.
3. Daily searches of the local accident and emergency attendance register.
4. Monthly computerized searches of general practitioner diag-nostic coding and hospital discharge codes.
5. Monthly searches of all cranial and carotid imaging studies per-formed in local hospitals.
6. Monthly reviews of all death certificates and coroners reports.
Suspected TIA/stroke patients were assessed urgently by a study clinician. Stroke was defined according to World Health Organization (WHO) definitions and included all ischemic events, intracerebral hemorrhage, subarachnoid hemorrhage, and strokes of uncertain type. Informed consent was sought, and assessments of neurologi-cal impairment, history of presentation, medical and social history, and risk factors were performed. Impairment was measured using the National Institutes of Health Stroke Scale (NIHSS), which was used to categorize event severity. Minor events were defined as NIHSS scores ≤ 3, moderate events were defined as scores from 4 to 10, and severe events were defined as scores >10. Although different study physicians were involved during the study, all cases were subsequent-ly reviewed by the study senior neurologist (P.M.R.) on a daily basis and imaging results were assessed by the same neuroradiologist, with the final classification as TIA, stroke, or other condition being made by the same senior neurologist and neuroradiologist in all cases.
Surviving patients were then followed-up face-to-face by a re-search nurse at 1, 6, 12, 24, and 60 months after the event. Patients were also followed-up via their general practitioners and hospital re-cords, recurrent vascular events were identified by ongoing ascertain-ment, and all patients had mortality follow-up.
Resource Use and Unit CostsResource use was obtained from patient hospital records from the date of first TIA or stroke within the OXVASC study period (ie, in-dex event) until March 31, 2010. In addition, resources used within the year before the index event were obtained. For those patients re-cruited before April 1, 2005, only resource use up to 5 years after the event was collected. Minimum follow-up in the study was 3 years.
Patient hospital records from the Oxford Radcliffe Hospitals National Health Service Trust (at the start of OXVASC, it comprised 1 tertiary hospital, 3 acute general hospitals, and 9 community hospi-tals) were reviewed for any accident and emergency visit, emergency transport, outpatient care visit, day case, or hospitalization. For each stay in hospital, information was recorded on the date of admission and discharge and the dates of transfers between different specialty wards. Hospitalizations during which patients were admitted and dis-charged on the same day were classified as day cases and the num-ber of days in hospital was set to 0. Inpatient stays were defined as those times during which the patient was admitted for at least 1 night. Although it would have been ideal to report hospitalizations, days in hospital, and costs separately for acute care and rehabilitation care, in most United Kingdom hospitals, acute care and rehabilitation are less separable than in the United States or other European models. In the United Kingdom, rehabilitation is generally initiated on the stroke unit, or general ward, with some patients staying for several weeks or admitted into specialist rehabilitation wards or community hospitals subsequently.
Regardless of when hospital resources were consumed by patients, all resource use was priced using 2008/2009 unit costs. When unit costs were obtained from sources detailing costs before 2008/2009, costs were updated using the Hospital and Community Health Services pay and price inflation index.12 Unit costs for outpatient (including any outpatient investigations performed) and accident and emergency visits were derived from the schedule of reference costs for National Health Service trusts.13 For each hospital ward, the unit costs per day case/day in hospital were derived from the schedule of National Health Service reference costs13 and National Health Service trust financial returns.14 The only exception was for the cost per day in a stroke unit, which was derived from published studies because of
lack of data in National Health Service published costs.15 The unit costs used to price inpatient resource use also included the costs of treatments, investigations, and interventions typically performed in each specialty ward. All costs were converted from United Kingdom pounds sterling (£) to United States dollars ($). The currency conver-sion was based on the rate of purchasing power parities in 2009 ($1 is equal to £0.64).16
Costs incurred by patients after the first year have not been dis-counted to present value terms in the main analysis. However, sen-sitivity analyses are presented in which costs incurred after the first year were discounted using 3.0%, 3.5%, and 5.0% annual rates to reflect the different discount rates used in different countries.
Statistical AnalysisResource use data up to March 31, 2010, were used; therefore, we did not have complete 5-year data for patients recruited after April 1, 2005. As a result, cost results are presented for those with full follow-up (including those dying within that time, complete case analysis), and for the whole patient sample after adjusting for censoring.
We examined the effect of censoring on our results using the meth-od developed by Lin et al.17 This method partitions the study period into smaller time periods (in this case, by day) within each of which the total cost incurred for all patients alive at the beginning of the period is calculated. The estimated costs of patients with complete data for each time period are then weighted by the Kaplan-Meier sample average estimator (ie, the probability of survival in a given time period, conditional on having survived the previous time pe-riod) and summed over all periods to obtain an estimate of the mean censor-adjusted costs. Costs are reported as means together with their 95% confidence intervals (CIs). The 95% CIs are reported around the mean censor-adjusted costs using 1000 bootstrap estimates.
Because TIA and stroke are associated with old age and generally occur in patients with other comorbidities,10 such patients are likely to use substantial hospital resources even if they had not experienced a TIA or stroke, making the impact of disease on costs difficult to determine. Therefore, we also compared the costs for each of the 5 years after the index event with the costs incurred before the event by undertaking 2 analyses: (1) surviving cases, in which annual costs before and after the index event were compared only for patients who survived past 5 years; and (2) available cases, in which annual costs before and after the index event were compared by estimating the mean annual cost for patients, including patients who died, with com-plete data for that year.
To assess whether the predictors of hospital care costs varied over time, 2 log-linear regression models, using robust standard errors, were used to assess the predictors of 1- and 5-year total hospital care costs after TIA or stroke.18 For the analysis of 5-year costs, only patients with complete 5-year follow-up were included, and to make results directly comparable the same patients were included in the analysis of costs incurred from index event to 1 year. Predictors of costs included were as follows: age; gender; history of each of myocardial infarction, angina, peripheral vascular disease, hypertension, stroke, atrial fibrillation, or diabetes mellitus; event type (TIA or stroke); event severity (NIHSS score); disability before the event; any subsequent vascular event at 1 and 5 years after index TIA or stroke; living arrangements before the index event; marital status; socioeconomic status; employment status; and deprivation as measured using the index of multiple deprivation. Because of observed nonlinear effects on costs,15 event severity was included in the model using the continuous NIHSS score and its quadratic term. Age was included as a categorical variable. To assess the impact of individual patient characteristics on costs, after covariate adjustment, we estimated the difference between mean predictions using appropriate smearing estimators.19 Similar regression models were undertaken only for stroke patients, including as an additional covariate stroke subtype using the Trial of Org 10172 in Acute Stroke Treatment classification.
Statistical significance was set at P<0.050. Model specification was tested using Ramsey reset test, a general specification test for the linear regression model used to test whether nonlinear combinations
by guest on April 18, 2016http://stroke.ahajournals.org/Downloaded from

Luengo-Fernandez et al 5-Year Hospital Costs After TIA 3345
of the fitted values helped explain 5-year costs. To assess whether the results from the linear regression were valid, we also assessed wheth-er the residuals were normally distributed and whether there were any patterns in the residuals when plotted against the predicted values.
ResultsPatient SampleBetween April 2002 and March 2007, 485 patients had a TIA and 729 patients had a stroke as their index OXVASC event. Mean age of the sample was 75 (SD, 13) years for stroke patients and 73 (SD, 13) years for TIA patients. Males accounted for 51% (n=369) of stroke cases and 44% (n=211) of TIA cases (Table 1). There was missing NIHSS information for 17 stroke cases because of late presentation or events occurring out of area. Of the 712 index strokes with available NIHSS scores, 413 (58%) were classified as minor, 166 (23%) were classified as moder-ate, and 133 (19%) were classified as severe.
Of the 729 patients experiencing an index stroke, 239 (33%) were alive at 5 years, 333 (46%) had died within that time, and 157 (22%) had not yet reached complete 5-year follow-up (Supplementary Table I). Two-hundred four (42%) index TIA patients were alive at 5 years, 25% (n=120) had died, and 161 (33%) patients had not yet reached complete 5-year follow-up. Mean censor-adjusted survival time was 4.32 years after TIA and 3.30 years after stroke. Of the 729 stroke patients, 144 (20%) experienced >1 recurrent strokes
and 60 (8%) experienced >1 subsequent coronary events during the 5-year follow-up. One-hundred seven (22%) TIA patients experienced >1 strokes and 51 (11%) experienced >1 coronary events after index TIA.
Details of hospital care resource use after index TIA and stroke are reported in the Online Supplementary Material (Supplementary Table II).
5-Year Hospital Costs After StrokeFor the 572 stroke patients with complete 5-year follow-up, or those dying within that period, the mean 5-year total hospital costs after stroke were $26 475 (95% CI, 23 723–29 227), of which $23 397 (88%) were because of inpatient stays in hospital (Table 2). Although minor stroke patients (NIHSS score ≤3) incurred average costs of $23 031 (95% CI, 19 616–26 448), moderate stroke patients (NIHSS score 4–10) incurred costs of $31 953 (95% CI, 25 784–38 120). Despite high mortality rates after severe stroke (NIHSS score >10), with mean survival time of 1.45 years, these patients still incurred average costs of $27 348 (95% CI, 21 085–33 617).
To obtain the 5-year average cost for all 729 strokes, we adjusted costs to account for censoring. The resulting mean 5-year costs were $25 741 (95% CI, 23 659–27 914), which were similar to those obtained in the complete case analysis (Table 2). Because of high case fatality rates soon after unknown stroke and primary intracerebral hemorrhage, censor-adjusted 5-year costs were lower than those for ischemic stroke ($15 069, $19 641, and $26 347, respectively), with those for subarachnoid hemorrhage being $33 708. More detailed cost results by Trial of Org 10172 in Acute Stroke Treatment classification are reported in Table 3. The Online Supplementary Material (Supplementary Table III) reports all hospital care costs in present value terms, in which costs incurred after the first year were discounted using annual rates of 3.0%, 3.5%, and 5.0%.
For the 239 stroke patients with complete follow-up and who survived the 5 years, the mean 5-year hospital costs were $24 383 (95% CI, 20 156–28 595). More than half of these costs ($12 972) were incurred during the first year after stroke, with costs then decreasing to $2303 in year 2, $3486 in year 3, $2527 in year 4, and $3088 in year 5. Mean annual costs for each follow-up year after index stroke were significantly higher than those incurred in the year before the event ($923; P<0.001; Figure 1). Mean costs in the year before the index stroke were significantly higher for patients dying within 5 years after stroke (n=333, $6205) than for those who sur-vived (n=239, $923; P<0.0001). For all stroke patients, mean annual costs before the index stroke were $3561, compared with $16 444 in the first year after the index stroke (P<0.001), $2311 in year 2 (P=0.018), $2 659 in year 3 (P=0.117), $2106 in year 4 (P=0.007), and $1 952 in year 5 (P=0.006).
5-Year Costs After TIAFor the 324 TIA patients with complete 5-year follow-up, or those dying within that period, the mean 5-year-total hospi-tal costs after TIA were $19 388 (95% CI, 16 244–22 531), of which $15 689 (81%) were because of inpatient stays in hospital (Table 2). Mean 5-year censor-adjusted costs were $18 091 (95% CI, 15 947–20 258).
Table 1. Baseline Characteristics
Stroke (n=729) TIA (n=485)
Mean age, (SD), y 75 (13) 73 (13)
Males 369 (51) 211 (44)
Previous myocardial infarction* 98 (14) 54 (11)
Previous angina* 118 (16) 77 (16)
Hypertension* 437 (61) 251 (52)
Previous stroke* 135 (19) 53 (11)
Diabetes mellitus* 76 (11) 65 (13)
Previous disability 151 (21) 70 (14)
NIHSS score†, median (IQR) 3 (1–7) 0
Minor stroke 413 (58)
Moderate stroke 166 (23)
Severe stroke 133 (19)
TOAST classification
Cardioembolism 182 (25)
Large artery atherosclerosis 53 (7)
Small vessel occlusion 109 (15)
Other determined cause 7 (1)
Undetermined/unknown cause 273 (37)
Multiple possible aetiologies 12 (2)
Primary intracerebral hemorrhage 54 (7)
Subarachnoid hemorrhage 39 (5)
IQR indicates Interquartile range; NIHSS, National Institutes of Health Stroke Scale; SD, standard deviation; TIA, transient ischemic attack; TOAST, Trial of Org 10172 in Acute Stroke Treatment.
Data expressed as n (%), except where specified.*Stroke: 7 missing; TIA: 2 missing.†Stroke: 17 missing; TIA: 5 missing.
by guest on April 18, 2016http://stroke.ahajournals.org/Downloaded from

3346 Stroke December 2012
For the 204 surviving TIA patients with complete follow-up, the mean 5-year hospital costs were $13 682 (95% CI, 10 558–16 809). For these patients, more than half of costs ($5719) were incurred during the first year after TIA, with costs then decreasing in subsequent years. Although mean annual costs were higher at each follow-up year than in the year before the index TIA, statistically significant differences were only identified for the first and second years after the event (Figure 2). For all TIA patients, mean annual costs before the index stroke were $2178, with costs remaining higher during the first year after TIA ($6909; P<0.001), year 2 ($4420; P<0.001), and year 3 ($2805; P=0.247).
Predictors of 1- and 5-Year Costs After TIA or StrokeLog-linear regressions were performed to assess the main independent predictors of 1- and 5-year hospital costs after
TIA or stroke. For both analyses, we only included patients with complete 5-year follow-up (n=896, including those who died within that period), of whom 140 (16%) were excluded because of missing socioeconomic characteristics, leaving a sample of 756 patients. Results are reported in Table 4. Mean predicted costs after covariate adjustment are presented here for significant variables. Year in which the patient was recruited into OXVASC was not included as a covariate in the regression because we found no statistically significant evi-dence that costs varied between years (ANOVA test for dif-ferences in costs by year of recruitment: P=0.444 for TIA and P=0.807 for stroke).
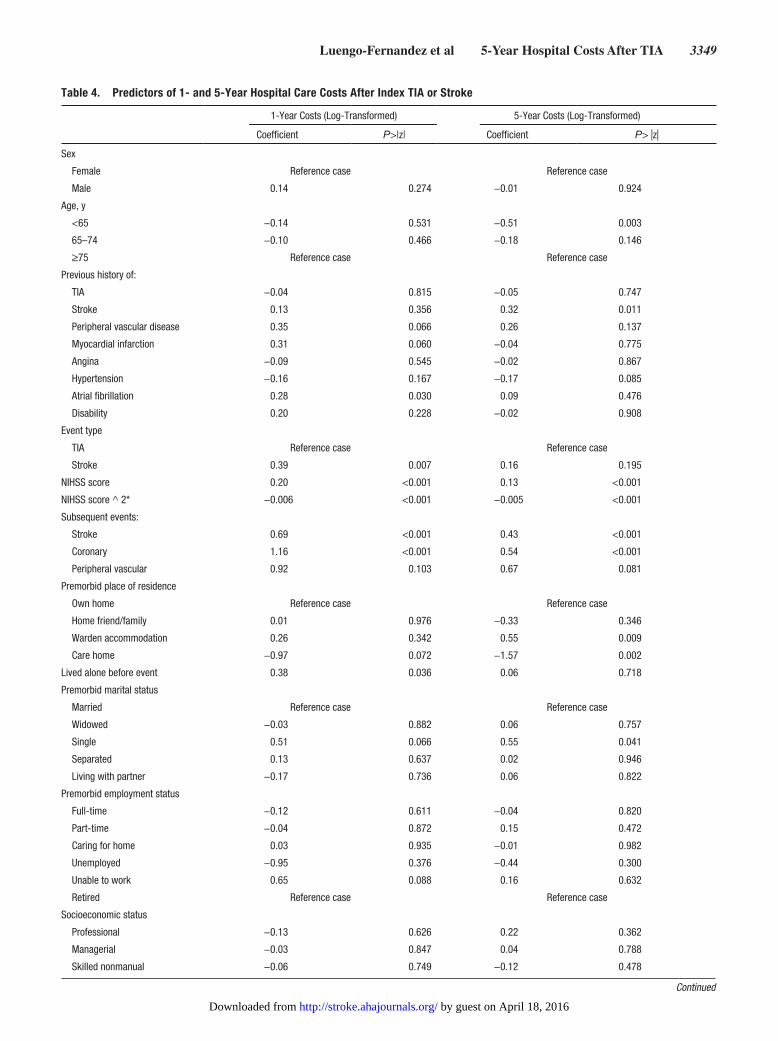
Event severity was a strong independent predictor of costs at 1 and 5 years after the index event, with a 1-point increase in NIHSS score increasing 1-year costs by 20% and 5-year costs by 13% (P<0.001; Table 4). The association between event severity and costs was nonlinear, because of the greatly
Table 2. 5-Year Mean Hospital Care Costs After Index Event
NEmergency Transport
Accident and Emergency Day Cases Inpatient Stays Outpatient Visits Total Costs
TIA
5 y, complete cases 324 417 (344–492) 205 (173–236) 947 (686–1208) 15,689 (12 658–18 722) 2128 (1931–2325) 19 388 (16 244–22 531)
5 y, censor-adjusted 485 400 (348–453) 200 (180–222) 1161 (928–1413) 14 105 (12 183–16 233) 2225 (2092–2373) 18 091 (15 947–20 258)
All stroke
5 y, complete cases 572 483 (430–536) 209 (188–231) 773 (630–919) 23 397 (20 728–26 067) 1611 (1420–1803) 26 475 (23 723–29 227)
5 y, censor-adjusted 729 483 (442–528) 214 (197–231) 842 (739–966) 22 511 (20 709–24 711) 1691 (1566–1830) 25 741 (23 659–27 914)
Mean costs by stroke severity
Minor stroke
5 y, complete cases 293 456 (381–531) 208 (178–239) 1025 (814–1236) 19 200 (15 905–22 495) 2142 (1848–2436) 23 031 (19 616–26 448)
5 y, censor-adjusted 413 442 (389–475) 206 (184–227) 1031 (889–1175) 17 381 (14 939–19 545) 2073 (1902–2270) 21 134 (18 692–24 697)
Moderate stroke
5 y, complete cases 139 555 (430–680) 236 (183–289) 722 (380–1066) 29 139 (23 183–35 095) 1302 (1005–1597) 31 953 (25 784–38 120)
5 y, censor-adjusted 166 580 (478–649) 250 (208–298) 841 (605–1133) 29 930 (25 342–34 759) 1519 (1297–1761) 33 119 (28 322–37 891)
Severe stroke
5 y, complete cases 127 494 (403–586) 194 (158–230) 164 (78–250) 25 738 (15 667–31 810) 758 (388–1130) 27 348 (21 085–33 617)
5 y, censor-adjusted 133 529 (436–589) 202 (173–233) 148 (88–225) 26 902 (22 066–31 983) 791 (513–1094) 28 552 (23 825–33 911)
Mean costs by stroke type
Ischemic stroke
5 y, complete cases 467 514 (450–577) 223 (198–250) 848 (681–1016) 24 780 (21 767–27 792) 1806 (1588–2027) 28 173 (25 081–31 267)
5 y, censor-adjusted 599 502 (459–552) 223 (206–242) 914 (797–1038) 22 848 (20 741–25 173) 1859 (1705–2019) 26 347 (24 345–28 602)
Primary intracerebral hemorrhage
5 y, complete cases 40 367 (266–470) 148 (109–186) 330 (111–548) 12 941 (5961–19 919) 477 (30–923) 14 263 (6983–21 541)
5 y, censor-adjusted 54 377 (297–467) 158 (125–191) 275 (141–428) 18 103 (12 603–24 428) 728 (455–1055) 19 641 (13 814–26 136)
Subarachnoid hemorrhage
5 y, complete cases 33 380 (261–500) 164 (116–213) 500 (141–861) 26 766 (13 622–39 911) 1248 (450–2047) 29 059 (15 417–42 702)
5 y, censor-adjusted 39 384 (302–475) 163 (130–200) 605 (341–917) 31 298 (23 325–42 314) 1259 (725–1850) 33 708 (23 833–44 661)
Unknown stroke
5 y, complete cases 32 284 (155–413) 117 (59–177) 519 (2–1231) 12,823 (3 656–21 989) 548 (123–973) 14 292 (4733–23 853)
5 y, censor-adjusted 37 414 (188–734) 178 (81–308) 709 (250–1289) 12 980 (6973–19 847) 786 (461–1130) 15 069 (8544–23 441)
ANOVA indicates analysis of variance; TIA, transient ischemic attack; TOAST, Trial of Org 10172 in Acute Stroke Treatment. ANOVA test for differences in total costs: (1) TIA vs stroke: P=0.001; (2) stroke severity groups:P=0.029; (3) stroke type: P=0.012.
Data are presented as $ (95% CI) unless otherwise indicated.
by guest on April 18, 2016http://stroke.ahajournals.org/Downloaded from

Luengo-Fernandez et al 5-Year Hospital Costs After TIA 3347
increased case fatality and corresponding reductions in health use observed at high NIHSS scores. This was further tested by including an interaction term between NIHSS score and case fatality (defined as mortality within 30 days of event) into the regression. We found this to be statistically significant, although the nonlinear relationship between cost and sever-ity still held. Although having a history of stroke before the index event was not a predictor of 1-year costs, patients with a history of stroke incurred significantly higher costs than those with no history 5 years after the event ($11 973; P=0.011).
One year after the index event, stroke patients incurred significantly higher costs of $7931, after covariate adjustment, when compared with TIA patients (P=0.007). However, 5 years after the index event, the difference in costs between stroke and TIA patients was considerably lower and nonsignificant ($5198; P=0.195). Results of the multivariate analysis also showed that, expecting whether the patient was living alone before the index event, only clinical factors were predictors of costs 1 year after the event, with age and premorbid place of residence, marital status, and education levels all found to be predictors of 5-year costs. Age was a predictor of 5-year costs, with patients aged younger than 65 years incurring $15 172 lower costs than those aged older than 75 years (P=0.003; Table 4). Place of residence
before the index event was also a predictor of 5-year costs after TIA or stroke. Compared with those living at home before the index event, patients living in nursing homes incurred lower hospital care costs (−$26 722; P=0.002) because of high fatality rates, and those living in warden/sheltered accommodation incurred significantly higher costs $24 461; P=0.009). Education levels also were an independent predictor of costs, with each additional year of education reducing costs by 4% (P=0.046). After controlling for patient characteristics, single patients incurred significantly higher costs ($23 459; P=0.041) than married patients.
Additional regression models, similar to those reported were undertaken only for stroke patients including as an addi-tional covariate stroke subtype using Trial of Org 10172 in Acute Stroke Treatment classification definitions. Results from this showed that stroke severity (as measured using NIHSS score), recurrent strokes and subsequent peripheral vascular events remained the strongest predictors of 5-year hospital care costs. Although significant differences in 5-year costs were identified, univariately, by stroke subtype (Table 3), much of these differences disappeared after controlling for severity, age, and other covariates in the regression analysis (Supplementary Table IV).
Table 3. 5-Year Hospital Care Costs After Index Stroke, by TOAST Classification
Complete Cases Censor-Adjusted
N Mean Costs, $ (95% CI) N Mean Costs, $ (95% CI)
Cardioembolism 158 30 086 (24 778–35 395) 182 30 175 (26 003–34 416)
Large artery atherosclerosis 39 25 708 (15 778–35 638) 53 24 941 (18 092–32 241)
Small vessel occlusion 88 28 084 (19 931–36 236) 109 26 872 (21 316–32 709)
Other determined cause 5 18 209 (4947–31 472) 7 16 725 (11 570–21 997)
Undetermined/unknown cause 200 25 000 (20 433–29 566) 273 22 570 (19 453–25 873)
Multiple possible aetiologies 9 32 883 (11 564–54 202) 12 28 863 (16 703–41 733)
Primary intracerebral hemorrhage 40 14 263 (6983–21 541) 54 19 641 (13 814–26 136)
Subarachnoid hemorrhage 33 29 059 (15 417–42 702) 39 33 708 (23 833–44 661)
ANOVA indicates analysis of variance; CI, confidence interval. ANOVA test for differences in costs by stroke subtype: P=0.0005
Figure 1. Costs before and after index stroke. *Annual costs before and after the index stroke were compared by estimating the mean annual cost for patients, including patients who died, with com-plete data for that year.
by guest on April 18, 2016http://stroke.ahajournals.org/Downloaded from

3348 Stroke December 2012
DiscussionA previous OXVASC study assessed the levels and predictors of acute hospital usage and costs after stroke onset.15 This study supplements the previous findings by evaluating hospital care costs after TIA and stroke over the longer-term and is the first population-based study to estimate such costs of TIA and stroke in the United Kingdom. To our knowledge, the only previous population-based study, using multiple ascertainment methods, of the long-term cost of adult stroke was performed in Melbourne, Australia, in a different health care system with higher rates of hospital admission and considered only the costs of stroke.3 A study conducted in Finland, based on 94 316 hospital-treated patients with incident stroke,5 also assessed 5-year costs after stroke and compared these with costs incurred 1 year before the incident stroke. Ours is also the first study to evaluate long-term hospital costs after TIA and to compare these with costs before the event.
Our study showed that costs after index stroke and TIA are considerable, with patients incurring 5-year hospital care costs of $25 741 and $18 091, respectively, with the long-term time perspective adopted in this study allowing us to compare the costs incurred at each follow-up year. For stroke patients, 64% ($16 444) of these 5-year costs were incurred during the year immediately after the stroke, whereas for TIA patients only 38% ($6 909) of 5-year costs were incurred during the first year. As a result, and partly through increased mortality rates in stroke patients, the significant difference in 1-year costs observed between stroke and TIA patients, after adjust-ment for other covariates, was no longer identified at 5 years.
Another important difference identified between the multi-variate analyses of 1- and 5-year costs was that at 1 year after the index event, the only predictors of costs were clinical in nature; however, at 5 years, age and social history (includ-ing education levels, marital status, and place of residence) were all found to be predictors of hospital care costs. The find-ing that educational attainment (measured by the age when patients ended their education) was associated with 5-year hospital costs could be explained (at least partly) by the
strong relationship between education, income, and health.20 However, because this finding verged on nonsignificance (P=0.046), this observed relationship in our study should be treated with caution.
The results of our multivariate analyses also showed that the main determinants of 1- and 5-year hospital costs were the severity of the neurologic deficit (NIHSS score) at initial assessment and the impact of subsequent strokes or coronary events after index TIA or stroke. Patients experiencing sub-sequent strokes or coronary events were found to incur addi-tional 5-year costs after controlling for other characteristics of $15 990 and $22 592, respectively.
Because TIA and stroke are associated with old age and often occur in patients with other comorbidities,10 such patients are likely to use substantial health care resources regardless of event onset. Therefore, to better-understand the impact of TIA and stroke on costs, we compared the costs for each of the 5 years after the index event with the costs incurred before the event. As identified in previous studies,21,22 both for TIA and stroke, costs gradually increased over the course of the year before the event because patients required more medical atten-tion, suggesting that health deteriorated in the months soon before the event in some patients.
Although our study shows that a great proportion of 5-year total costs was incurred soon after stroke, the long-term time perspective adopted in this study also allowed us to compare the costs incurred at each follow-up year with those incurred during the year before the stroke. For stroke patients surviv-ing the whole 5-year period, annual hospital costs after stroke were significantly higher than those before stroke, although costs incurred in the first year after stroke accounted for more than half of all 5-year costs. However, when all stroke patients were considered, only 1-year costs were significantly higher than those incurred before the event. This finding was because of average annual costs after stroke being decreased by death, and because the 333 stroke patients who died during the 5-year follow-up had significantly higher costs in the year before the event than those patients surviving past 5 years, increasing average annual costs before the stroke.
Figure 2. Costs before and after index transient ischemic attack (TIA). *Annual costs before and after the index event were compared by estimat-ing the mean annual cost for patients, including patients who died, with complete data for that year.
by guest on April 18, 2016http://stroke.ahajournals.org/Downloaded from
Luengo-Fernandez et al 5-Year Hospital Costs After TIA 3349
Table 4. Predictors of 1- and 5-Year Hospital Care Costs After Index TIA or Stroke
1-Year Costs (Log-Transformed) 5-Year Costs (Log-Transformed)
Coefficient P>|z| Coefficient P> |z|
Sex
Female Reference case Reference case
Male 0.14 0.274 −0.01 0.924
Age, y
<65 −0.14 0.531 −0.51 0.003
65–74 −0.10 0.466 −0.18 0.146
≥75 Reference case Reference case
Previous history of:
TIA −0.04 0.815 −0.05 0.747
Stroke 0.13 0.356 0.32 0.011
Peripheral vascular disease 0.35 0.066 0.26 0.137
Myocardial infarction 0.31 0.060 −0.04 0.775
Angina −0.09 0.545 −0.02 0.867
Hypertension −0.16 0.167 −0.17 0.085
Atrial fibrillation 0.28 0.030 0.09 0.476
Disability 0.20 0.228 −0.02 0.908
Event type
TIA Reference case Reference case
Stroke 0.39 0.007 0.16 0.195
NIHSS score 0.20 <0.001 0.13 <0.001
NIHSS score ^ 2* −0.006 <0.001 −0.005 <0.001
Subsequent events:
Stroke 0.69 <0.001 0.43 <0.001
Coronary 1.16 <0.001 0.54 <0.001
Peripheral vascular 0.92 0.103 0.67 0.081
Premorbid place of residence
Own home Reference case Reference case
Home friend/family 0.01 0.976 −0.33 0.346
Warden accommodation 0.26 0.342 0.55 0.009
Care home −0.97 0.072 −1.57 0.002
Lived alone before event 0.38 0.036 0.06 0.718
Premorbid marital status
Married Reference case Reference case
Widowed −0.03 0.882 0.06 0.757
Single 0.51 0.066 0.55 0.041
Separated 0.13 0.637 0.02 0.946
Living with partner −0.17 0.736 0.06 0.822
Premorbid employment status
Full-time −0.12 0.611 −0.04 0.820
Part-time −0.04 0.872 0.15 0.472
Caring for home 0.03 0.935 −0.01 0.982
Unemployed −0.95 0.376 −0.44 0.300
Unable to work 0.65 0.088 0.16 0.632
Retired Reference case Reference case
Socioeconomic status
Professional −0.13 0.626 0.22 0.362
Managerial −0.03 0.847 0.04 0.788
Skilled nonmanual −0.06 0.749 −0.12 0.478
Continued
by guest on April 18, 2016http://stroke.ahajournals.org/Downloaded from

3350 Stroke December 2012
Population-based cohort studies, such as OXVASC, are the gold-standard when evaluating outcomes after TIA and stroke.9 However, our study also had limitations. First, 33% and 22% of TIA and stroke patients, respectively, did not yet have full 5-year follow-up and therefore were treated as censored. However, we presented average long-term hospital costs for patients with complete data and after censor adjust-ment using recommended techniques. Second, the study omit-ted other relevant health care costs such as those relating to primary care visits or community care. However, previous studies have shown that the majority of health care costs after stroke are because of hospitalizations, with the impact of other cost categories having a relatively small impact on total costs.2 Related to this, we omitted the costs of long-term institution-alization in either nursing or residential home care. Although not a health care cost, long-term institutionalization has been shown to be a major component of overall costs after stroke.4 Third, our overall costs are only applicable to the United Kingdom and possibly to similar health care systems in which a high proportion of patients with TIA and minor stroke are investigated and treated in the outpatient setting. Our predic-tors of cost, however, are more likely to be generalizable to other health care settings.
In summary, our study reports estimates of the long-term levels and predictors of hospital care costs associated with stroke in the United Kingdom using data from a well-con-ducted population-based study. Our results highlight the importance of initial stroke severity as a predictor of costs. This study should be of use to analysts assessing the burden of TIA and stroke and the long-term cost-effectiveness of interventions for prevention and treatment of these 2 condi-tions, especially when extrapolating short-term results from clinical trial follow-up.
AcknowledgmentsThe authors are grateful to all patients who took part in the study. The authors thank all primary care practices and physicians who col-laborate with OXVASC. The authors thank 2 anonymous referees for their valuable comments.
Sources of FundingDr Luengo-Fernandez is funded by an Economic and Social Research Council/Medical Research Council/National Institute for Health Research (NIHR) early career fellowship in economics of health. Professor Gray is a NIHR senior investigator. Professor Rothwell is a NIHR senior investigator and a Wellcome Trust se-nior investigator. OXVASC is funded by the UK Medical Research Council, the Dunhill Medical Trust, the Stroke Association, and the NIHR Biomedical Research Center, Oxford. Health Economics Research Centre obtains part of its funding from the NIHR.
DisclosuresDr Luengo-Fernandez is funded by an Economic and Social Research Council/Medical Research Council/National Institute for Health Research (NIHR) early career fellowship in economics of health.
References 1. Lopez AD, Mathers CD, Ezzati M, Jamison DT, Murray CJ. Global and
regional burden of disease and risk factors, 2001: systematic analysis of population health data. Lancet. 2006;367:1747–1757.
2. Luengo-Fernandez R, Gray AM, Rothwell PM. Costs of stroke using patient-level data: a critical review of the literature. Stroke. 2009;40:e18–e23.
3. Cadilhac DA, Carter R, Thrift AG, Dewey HM. Estimating the long-term costs of ischemic and hemorrhagic stroke for Australia: new evi-dence derived from the North East Melbourne Stroke Incidence Study (NEMESIS). Stroke. 2009;40:915–921.
4. Gardner MA, Hills NK, Sidney S, Johnston SC, Fullerton HJ. The 5-year direct medical cost of neonatal and childhood stroke in a population-based cohort. Neurology. 2010;74:372–378.
5. Meretoja A, Kaste M, Roine RO, Juntunen M, Linna M, Hillbom M, Marttila R, Erilä T, Rissanen A, Sivenius J, Häkkinen U. Direct costs of patients with stroke can be continuously monitored on a national level: performance, effectiveness, and Costs of Treatment episodes in Stroke (PERFECT Stroke) Database in Finland. Stroke. 2011;42:2007–2012.
6. Winter Y, Wolfram C, Schöffski O, Dodel RC, Back T. [Long-term dis-ease-related costs 4 years after stroke or TIA in Germany]. Nervenarzt. 2008;79:918–920.
7. Rothwell PM. Incidence, risk factors and prognosis of stroke and TIA: the need for high-quality, large-scale epidemiological studies and meta-analyses. Cerebrovasc Dis. 2003;16 (Suppl 3):2–10.
8. Luengo-Fernandez R, Leal J, Gray AM. UK research expenditure on dementia, heart disease, stroke and cancer: are levels of spending related to disease burden? Eur J Neurol. 2012;19:149–154.
9. Feigin V, Hoorn SV. How to study stroke incidence. Lancet. 2004;363:1920. 10. Rothwell PM, Coull AJ, Silver LE, Fairhead JF, Giles MF, Lovelock
CE, Redgrave JN, Bull LM, Welch SJ, Cuthbertson FC, Binney LE,
Table 4. Continued
1-Year Costs (Log-Transformed) 5-Year Costs (Log-Transformed)
Coefficient P>|z| Coefficient P>|z|
Skilled manual Reference case Reference case
Partly skilled −0.17 0.411 −0.04 0.828
Nonskilled 0.03 0.881 0.29 0.082
Age when education ended −0.02 0.150 −0.04 0.046
Index of multiple deprivation 0.001 0.951 0.003 0.637
Constant 0.72 <0.001 9.02 <0.001
N 756 N 756
P>F <0.001 P>F <0.001
Adj R2 0.241 Adj R2 0.175
*The nonlinear association between event severity and costs was further tested by including an interaction term between severity and case fatality (defined as mor-tality within 30 days of event) into the regression. We found this to be statistically significant, although the nonlinear relationship between cost and severity was still the same.
Adj R 2 indicates Adjusted R2, which is a goodness-of-fit test; NIHSS, National Institutes of Health Stroke Scale; and TIA, transient ischemic attack.
by guest on April 18, 2016http://stroke.ahajournals.org/Downloaded from

Luengo-Fernandez et al 5-Year Hospital Costs After TIA 3351
Gutnikov SA, Anslow P, Banning AP, Mant D, Mehta Z; Oxford Vascular Study. Population-based study of event-rate, incidence, case fatality, and mortality for all acute vascular events in all arterial territories (Oxford Vascular Study). Lancet. 2005;366:1773–1783.
11. Coull AJ, Silver LE, Bull LM, Giles MF, Rothwell PM; Oxford Vascular (OXVASC) Study. Direct assessment of completeness of ascertainment in a stroke incidence study. Stroke. 2004;35:2041–2045.
12. Curtis L. Unit costs of health and social care 2009. Kent, CT: Personal Social Services Research Unit; 2009.
13. Department of Health. NHS reference costs 2008–09. Available at: http://www.dh.gov.uk/en/Publicationsandstatistics/Publications/PublicationsPolicyAndGuidance/DH_111591. Accessed June 8, 2011.
14. National Health Service. Annual financial returns of NHS trusts, 2003–2004. Leeds, United Kingdom: NHS Executive; 2005.
15. Luengo-Fernandez R, Gray AM, Rothwell PM. Population-based study of determinants of initial secondary care costs of acute stroke in the United Kingdom. Stroke. 2006;37:2579–2587.
16. Organisation for Economic Co-operation and Development (OECD). OECD Health Data 2010, version 06/29/2010. Paris, France: OECD, 2010.
17. Lin DY, Feuer EJ, Etzioni R, Wax Y. Estimating medical costs from incomplete follow-up. Biometrics 1997;56:775–778.
18. Manning WG, Mullahy J. Estimating log models: to transform or not to transform? J Health Econ. 2001;20:461–494.
19. Cameron AC, Trivedi PK. Microeconometrics Using Stata, revised ed. College Station, TX: Stata Press; 2010.
20. Ross CE, WU C-L. The links between education and health. Am Sociol Rev 1995;60:719–745.
21. Leibson CL, Hu T, Brown RD, Hass SL, O’Fallon WM, Whisnant JP. Utilization of acute care services in the year before and after first stroke: A population-based study. Neurology. 1996;46:861–869.
22. Ricci J-F, Martin BC. Resource utilizations of ischemic stroke patients: A population study of Georgia Medicaid recipients. J Res Pharmac Econ 1998;9:21–34.
by guest on April 18, 2016http://stroke.ahajournals.org/Downloaded from

on behalf of the Oxford Vascular StudyVascular Study
Ramon Luengo-Fernandez, Alastair M. Gray, Peter M. Rothwell and on behalf of the OxfordIschemic Attack and Stroke
A Population-Based Study of Hospital Care Costs During 5 Years After Transient
Print ISSN: 0039-2499. Online ISSN: 1524-4628 Copyright © 2012 American Heart Association, Inc. All rights reserved.
is published by the American Heart Association, 7272 Greenville Avenue, Dallas, TX 75231Stroke doi: 10.1161/STROKEAHA.112.667204
2012;43:3343-3351; originally published online November 15, 2012;Stroke.
http://stroke.ahajournals.org/content/43/12/3343World Wide Web at:
The online version of this article, along with updated information and services, is located on the
http://stroke.ahajournals.org//subscriptions/
is online at: Stroke Information about subscribing to Subscriptions:
http://www.lww.com/reprints Information about reprints can be found online at: Reprints:
document. Permissions and Rights Question and Answer process is available in the
Request Permissions in the middle column of the Web page under Services. Further information about thisOnce the online version of the published article for which permission is being requested is located, click
can be obtained via RightsLink, a service of the Copyright Clearance Center, not the Editorial Office.Strokein Requests for permissions to reproduce figures, tables, or portions of articles originally publishedPermissions:
by guest on April 18, 2016http://stroke.ahajournals.org/Downloaded from