Predicting Future Brain Tissue Loss From White Matter Connectivity Disruption in Ischemic Stroke
7
717 I n addition to primary neuronal death near the lesion site, ischemic stroke causes secondary remote degeneration. Remote degeneration consists of anterograde degeneration of axons and their myelin sheaths after proximal axonal injury or retrograde dying back of neurons. The causes and time course of remote degeneration have been studied in many diseases (including stroke) via experimental procedures, pathology studies, and neuroimaging. 1–6 Knowledge of how disconnection caused by remote degeneration affects distant brain regions may be important because losses in white matter (WM) integrity have been associated with functional deficits, including motor recovery after stroke. 3,7,8 Therefore, it may be helpful for clinicians to be able to predict which regions are susceptible to remote degeneration as it could enhance their prognostic abilities and enable more focused and individual- ized rehabilitative strategies. 9 Current MR imaging can only detect remote degeneration after it has occurred; structural brain MRI can detect it in the chronic phase, 10–13 whereas diffusion MRI can detect it within 4 weeks after the acute event. 14–16 To predict the progression of remote degeneration, the underlying WM fiber architecture on which the degenera- tion propagates must be estimated. One way to reconstruct underlying fiber architecture is with tractography, a process of computationally reconstructing probable WM pathways based on diffusion MRI. Tractography methods require exper- tise and are even more difficult to use in the case of a diseased or damaged brain factors, which limit its clinical use. It is also not known whether tractography methods that are sensitive to noise can yield physiologically meaningful connectivity information in abnormal brains, 14,17,18 although some tractog- raphy studies have been performed in patients with stroke, particularly in the visual and motor systems. 19–21 In addition, diffusion imaging acquired with sufficient quality to perform Background and Purpose—The Network Modification (NeMo) Tool uses a library of brain connectivity maps from normal subjects to quantify the amount of structural connectivity loss caused by focal brain lesions. We hypothesized that the Network Modification Tool could predict remote brain tissue loss caused by poststroke loss of connectivity. Methods—Baseline and follow-up MRIs (10.7±7.5 months apart) from 26 patients with acute ischemic stroke (age, 74.6±14.1 years, initial National Institutes of Health Stroke Scale, 3.1±3.1) were collected. Lesion masks derived from diffusion-weighted images were superimposed on the Network Modification Tool’s connectivity maps, and regional structural connectivity losses were estimated via the Change in Connectivity (ChaCo) score (ie, the percentage of tracks connecting to a given region that pass through the lesion mask). ChaCo scores were correlated with subsequent atrophy. Results—Stroke lesions’ size and location varied, but they were more frequent in the left hemisphere. ChaCo scores, generally higher in regions near stroke lesions, reflected this lateralization and heterogeneity. ChaCo scores were highest in the postcentral and precentral gyri, insula, middle cingulate, thalami, putamen, caudate nuclei, and pallidum. Moderate, significant partial correlations were found between baseline ChaCo scores and measures of subsequent tissue loss (r=0.43, P=4.6×10 –9 ; r=0.61, P=1.4×10 –18 ), correcting for the time between scans. Conclusions—ChaCo scores varied, but the most affected regions included those with sensorimotor, perception, learning, and memory functions. Correlations between baseline ChaCo and subsequent tissue loss suggest that the Network Modification Tool could be used to identify regions most susceptible to remote degeneration from acute infarcts. (Stroke. 2014;45:717-722.) Key Words: brain imaging ◼ brain infarction ◼ diffusion magnetic resonance imaging ◼ neural pathways ◼ stroke Predicting Future Brain Tissue Loss From White Matter Connectivity Disruption in Ischemic Stroke Amy Kuceyeski, PhD; Hooman Kamel, MD; Babak B. Navi, MD; Ashish Raj, PhD; Costantino Iadecola, MD Received September 26, 2013; final revision received November 7, 2013; accepted November 11, 2013. From the Department of Radiology (A.K., A.R.), Brain and Mind Research Institute (A.K., H.K., B.B.N., A.R., C.I.), and Department of Neurology (H.K., B.B.N., C.I.), Weill Cornell Medical College, New York, NY. Guest Editor for this article was Martin Dichgans, MD. Presented in part at the International Stroke Conference of the American Heart Association, San Diego, CA, February 12-14, 2014. The online-only Data Supplement is available with this article at http://stroke.ahajournals.org/lookup/suppl/doi:10.1161/STROKEAHA. 113.003645/-/DC1. Correspondence to Amy Kuceyeski, PhD, Department of Radiology, Weill Cornell Medical College, 515 E 71st St, New York, NY 10065. E-mail [email protected] © 2014 American Heart Association, Inc. Stroke is available at http://stroke.ahajournals.org DOI: 10.1161/STROKEAHA.113.003645 by guest on June 16, 2016 http://stroke.ahajournals.org/ Downloaded from
Transcript of Predicting Future Brain Tissue Loss From White Matter Connectivity Disruption in Ischemic Stroke

717
In addition to primary neuronal death near the lesion site, ischemic stroke causes secondary remote degeneration.
Remote degeneration consists of anterograde degeneration of axons and their myelin sheaths after proximal axonal injury or retrograde dying back of neurons. The causes and time course of remote degeneration have been studied in many diseases (including stroke) via experimental procedures, pathology studies, and neuroimaging.1–6 Knowledge of how disconnection caused by remote degeneration affects distant brain regions may be important because losses in white matter (WM) integrity have been associated with functional deficits, including motor recovery after stroke.3,7,8 Therefore, it may be helpful for clinicians to be able to predict which regions are susceptible to remote degeneration as it could enhance their prognostic abilities and enable more focused and individual-ized rehabilitative strategies.9 Current MR imaging can only detect remote degeneration after it has occurred; structural
brain MRI can detect it in the chronic phase,10–13 whereas diffusion MRI can detect it within 4 weeks after the acute event.14–16
To predict the progression of remote degeneration, the underlying WM fiber architecture on which the degenera-tion propagates must be estimated. One way to reconstruct underlying fiber architecture is with tractography, a process of computationally reconstructing probable WM pathways based on diffusion MRI. Tractography methods require exper-tise and are even more difficult to use in the case of a diseased or damaged brain factors, which limit its clinical use. It is also not known whether tractography methods that are sensitive to noise can yield physiologically meaningful connectivity information in abnormal brains,14,17,18 although some tractog-raphy studies have been performed in patients with stroke, particularly in the visual and motor systems.19–21 In addition, diffusion imaging acquired with sufficient quality to perform
Background and Purpose—The Network Modification (NeMo) Tool uses a library of brain connectivity maps from normal subjects to quantify the amount of structural connectivity loss caused by focal brain lesions. We hypothesized that the Network Modification Tool could predict remote brain tissue loss caused by poststroke loss of connectivity.
Methods—Baseline and follow-up MRIs (10.7±7.5 months apart) from 26 patients with acute ischemic stroke (age, 74.6±14.1 years, initial National Institutes of Health Stroke Scale, 3.1±3.1) were collected. Lesion masks derived from diffusion-weighted images were superimposed on the Network Modification Tool’s connectivity maps, and regional structural connectivity losses were estimated via the Change in Connectivity (ChaCo) score (ie, the percentage of tracks connecting to a given region that pass through the lesion mask). ChaCo scores were correlated with subsequent atrophy.
Results—Stroke lesions’ size and location varied, but they were more frequent in the left hemisphere. ChaCo scores, generally higher in regions near stroke lesions, reflected this lateralization and heterogeneity. ChaCo scores were highest in the postcentral and precentral gyri, insula, middle cingulate, thalami, putamen, caudate nuclei, and pallidum. Moderate, significant partial correlations were found between baseline ChaCo scores and measures of subsequent tissue loss (r=0.43, P=4.6×10⁻⁹; r=0.61, P=1.4×10⁻¹⁸), correcting for the time between scans.
Conclusions—ChaCo scores varied, but the most affected regions included those with sensorimotor, perception, learning, and memory functions. Correlations between baseline ChaCo and subsequent tissue loss suggest that the Network Modification Tool could be used to identify regions most susceptible to remote degeneration from acute infarcts. (Stroke. 2014;45:717-722.)
Key Words: brain imaging ◼ brain infarction ◼ diffusion magnetic resonance imaging ◼ neural pathways ◼ stroke
Predicting Future Brain Tissue Loss From White Matter Connectivity Disruption in Ischemic Stroke
Amy Kuceyeski, PhD; Hooman Kamel, MD; Babak B. Navi, MD; Ashish Raj, PhD; Costantino Iadecola, MD
Received September 26, 2013; final revision received November 7, 2013; accepted November 11, 2013.From the Department of Radiology (A.K., A.R.), Brain and Mind Research Institute (A.K., H.K., B.B.N., A.R., C.I.), and Department of Neurology
(H.K., B.B.N., C.I.), Weill Cornell Medical College, New York, NY.Guest Editor for this article was Martin Dichgans, MD.Presented in part at the International Stroke Conference of the American Heart Association, San Diego, CA, February 12-14, 2014.The online-only Data Supplement is available with this article at http://stroke.ahajournals.org/lookup/suppl/doi:10.1161/STROKEAHA.
113.003645/-/DC1.Correspondence to Amy Kuceyeski, PhD, Department of Radiology, Weill Cornell Medical College, 515 E 71st St, New York, NY 10065. E-mail
[email protected]© 2014 American Heart Association, Inc.
Stroke is available at http://stroke.ahajournals.org DOI: 10.1161/STROKEAHA.113.003645
by guest on June 16, 2016http://stroke.ahajournals.org/Downloaded from

718 Stroke March 2014
tractography is rarely feasible in the case of stroke because of the clinical acuity of this disorder.22 One particularly relevant study23 had longitudinal MRI scans in 9 subjects before and after a single incident infarct. The authors showed that areas with higher probability of connection to the lesioned area, as assessed with tractography in the subject’s diffusion scan before the infarct, had higher rates of atrophy compared with the rest of the brain. Although this type of data and experimen-tal design is certainly optimal, it may be challenging to obtain clinically; the Network Modification (NeMo) Tool allows similar assessment using routinely acquired images.
To overcome these limitations, we implemented a recently developed tool, called the NeMo Tool24 that quantifies losses in the brain connectivity network by mapping a specific patient’s lesions onto a large collection of healthy tractograms. This process avoids the aforementioned issues with perform-ing tractography in patients and may better represent actual connectivity changes. This tool uses MRI sequences that are routinely obtained in the acute clinical setting and does not require expertise in advanced diffusion image processing and tractography techniques. This allows for a clinically feasible method of quantitatively predicting from an MRI in the acute phase of stroke, which cortical and subcortical areas may sub-sequently be most affected by loss of connectivity.
MethodsStudy Design and PopulationWe identified all consecutive patients who presented to the New York Presbyterian Hospital-Weill Cornell Medical Center with an acute ischemic stroke in 2010 and had both a baseline MRI during the index hospitalization and a follow-up MRI performed ≥2 months after the initial event. Patients were identified by searching an ad-ministrative database that captures all admissions for acute ischemic stroke. Among 305 total patients diagnosed with ischemic stroke at our institution in 2010, 26 (17 women and 9 men; age, 74.6±14.1 years; and National Institutes of Health Stroke Scale, 3.1±3.1) ful-filled our eligibility criteria and were included in the final analysis. These data were collected at Weill Cornell Medical College under an Institutional Review Board–approved protocol.
Data and Image ProcessingNational Institutes of Health Stroke Scale and baseline and follow-up MR images (10.7±7.5 months between scans) were collected. T1, T2, and diffusion-weighted images (DWIs) were collected on 3.0 or 1.5 Tesla GE Signa EXCITE scanners (GE Healthcare, Waukesha, WI). The DWIs (on both 1.5 T and 3.0 T) were acquired axially via an echo-planar imaging sequence, with b=1000 s/mm2 and b=0 s/mm2 from 30 5-mm-thick slices and 128×128 matrix size, rep-etition time/echo time/inversion time=8000 or 10 000/100/0 ms. T1 scans (1.5 T) were acquired axially (repetition time/echo time/inver-sion time=600/12/0 ms) with a 288×192 matrix over 30 5.0-mm-thick slices. The T2 scan was an axial sequence (repetition time/echo time/inversion time=3500 or 6500/85/0 ms) with a 256×256 matrix (1.5 T) or a 416×256 matrix (3.0 T) over 30 5.0-mm contiguous partitions. About half of the scans were acquired at 1.5 T magnetic field strength (26/54 total). Lesion masks were created for each patient by manually identifying image hyperintensities in the DWI scan. Each patient’s T2 image was coregistered linearly to the corresponding DWI and then normalized to standard Montreal Neurological Institute space using the nonlinear normalization procedure within Statistical Parametric Mapping 8.25 If a subject’s T2 image was not available, which hap-pened in 3 of 52 cases, the corresponding T1 was used instead. The same transformation was then applied to the lesion masks to obtain the standard Montreal Neurological Institute space lesion mask. The
Individual Based Atlas26 toolbox in Statistical Parametric Mapping 8 (IBASPM) was used to segment WM and gray matter (GM) and further parcellate the GM into cortical and subcortical regions as de-fined with the 116-region Automated Anatomic Labeling atlas.27 The Individual Based Atlas toolbox in Statistical Parametric Mapping 8 is a commonly used toolbox that bases the GM segmentation and parcellation on the tissue probability maps that are provided by the Statistical Parametric Mapping 8 toolbox. Our primary outcomes were cortical atrophy and mean diffusivity changes on follow-up MRI. To determine atrophy, volumes were estimated by counting the number of voxels assigned to each region and atrophy was calculated by taking the difference of these values between the baseline and follow-up scans. Mean diffusivity changes on a regional basis were calculated by taking the difference of the average mean diffusivity over a given region at baseline and follow-up.
Our primary predictor variable was an output of the NeMo Tool, which uses a mask of WM alterations to estimate changes to the struc-tural connectivity network (Figure 1). It uses a database of 73 nor-mal control tractograms in a common space (Montreal Neurological Institute). Regional changes are estimated via the Change in Connectivity (ChaCo) score, defined for each GM region as the num-ber of tracks that go through the lesion mask out of the total number of tracks connecting to that region.
Statistical AnalysesRelationships between baseline WM disconnection measured by the ChaCo score and longitudinal changes in GM integrity (atrophy and change in mean diffusivity) were assessed by calculating Pearson’s partial correlation coefficient, controlling for the number of days be-tween scans. Because of the localized nature of stroke, the majority of the 116 GM regions were unaffected, including these regions in the correlation analysis would risk overwhelming the underlying signal with what is mostly noise. Furthermore, there may be other factors that influence GM integrity (ie, neurodegenerative disease, chronic microvascular ischemia, or other loss of vascular integrity). Because the focus of this article was on the WM connectivity disruption of an acute event on subsequent-related GM loss, correlations were as-sessed using only regions that had a ChaCo<–0.01 (ie, regions with ≥1% of the tracks affected by the stroke lesion). It has been shown previously that ChaCo of <1% disconnection may be susceptible to noise in the image and processing pipeline, so that value was the cho-sen threshold.24
The inter-rater agreement of the hand-drawn lesion masks was as-sessed by calculating the Pearson correlation of the lesion volumes as well as the Dice similarity index28 between 2 raters. The Dice similarity index quantifies the amount of overlap of 2 binary masks, where values between 0.6 and 0.8 are considered good or high.29 In a supplemental analysis (see online-only Data Supplement), the influ-ence of variability in image acquisition and processing on the results was also assessed.
ResultsThe Dice similarity index for inter-rater agreement was 0.70±0.12 (interquartile range, 0.64–0.83) and the correlation of lesion volumes was r=0.99 (P=1.5×10⁻²⁴). Lesion location and size varied greatly (Figure 1), but more network disrup-tion was observed in this population in the left hemisphere. Of the 45 left–right pairs of GM structures in the atlas, only 1 structure had larger median ChaCo in the right hemisphere. However, some of the largest ChaCo score outliers were found in the right hemisphere of a few patients. Individual ChaCo scores, which were generally higher in regions near the infarct, reflected the heterogeneity in this population’s lesion locations. The ChaCo scores across the population are sum-marized using barplots in Figure 2, where the color denotes the regional assignment of the given region. In general,
by guest on June 16, 2016http://stroke.ahajournals.org/Downloaded from

Kuceyeski et al Predicting Atrophy From Connectivity Disruption 719
ChaCo was higher in the left hemisphere than the right and was high in the postcentral and precentral gyri, insula, middle cingulate, thalami, putamen, caudate nuclei, and pallidum. Disconnection scores were lowest in the occipital and cerebel-lar regions.
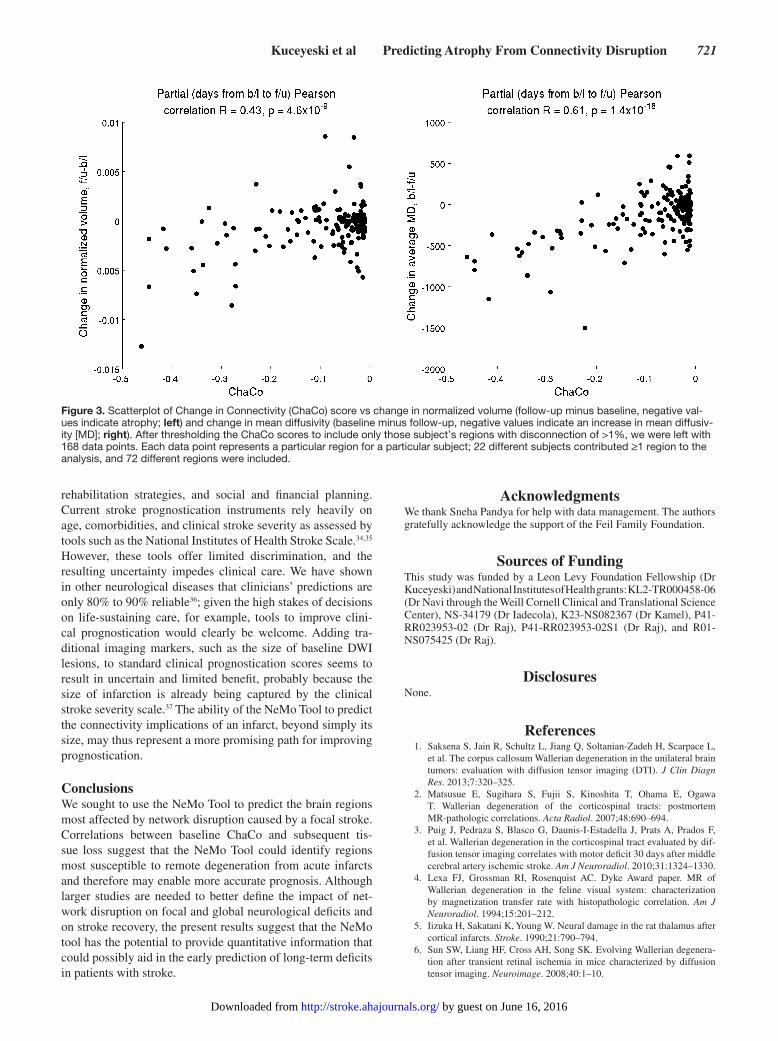
We began with 116 regions for each of the 26 subjects; after thresholding to include only subject’s regions with ChaCo<–0.01, we were left with 168 data points (Figure 3). Each data point represents a particular region for a particular subject; 22 differ-ent subjects contributed regions to the analysis and 72 different regions were included. Supporting our hypothesis that baseline connectivity disruption can be used to predict subsequent brain tissue loss, we found moderate and highly significant partial cor-relations between ChaCo scores at baseline and both regional atrophy (r=0.43; P=4.6×10⁻⁹) and change in average regional mean diffusivity (r=0.61; P=1.4×10⁻¹⁸; Figure 3).
DiscussionThe NeMo Tool was used to calculate the amount of con-nection loss for each GM region arising from DWI lesions in a cohort of 26 patients with ischemic stroke. Measures of disconnection varied greatly in the population, but the most affected regions included those with sensorimotor, perception, learning, and memory functions. Moderate, significant corre-lations were found between ChaCo scores that quantify this WM connection loss at baseline and measures of subsequent neuronal loss on follow-up MR images, in agreement with what was found by Duering et al.23
Regions closer to the stroke lesion tended to have higher disconnection than regions further away from the lesion. This is not surprising because proximity of the lesion to a region increases the chances that its connecting WM fibers will be disrupted. In addition, probabilistic tractography, which was
used to create the NeMo Tool, emphasizes shorter tracts and de-emphasizes long-range fibers.
Areas that had higher disconnection measures tended to have more atrophy and larger changes in mean diffusivity. Baseline WM connectivity losses were more correlated with change in mean diffusivity than change in volume, which may be because of increased sensitivity of diffusion imag-ing in discerning tissue integrity. There are factors other than remote degeneration that influence GM health, which may be why we found only moderate correlations. In fact, there were some regions that exhibited GM changes that did not have ChaCo<–0.01. These regions may have been subject to damage from a separate event or degeneration not related to the acute stroke. However, it is also possible that errors in the data and processing pipeline contributed to this appar-ent discrepancy. Care was taken to minimize the influence of pre-existing brain damage, including periventricular DWI hyperintensities from T2 shine-through by excluding these lesions from the brain mask. In addition, pre-existing GM damage would have been accounted for in the baseline GM metrics.
Acute stroke lesions are usually hyperintense on DWI, indicating restricted diffusion although the exact cause of this phenomenon is unclear. A common viewpoint is that this represents cytotoxic edema from ischemia-induced disruption of energy metabolism, causing failure of ionic pumps, a loss of ionic gradients, and eventually a net translocation of water into the intracellular space.30 However, additional factors, such as increased tortuosity of intra- and extracellular space pathways and changes in cell-membrane permeability, may also be involved. Therefore, it is unclear whether restricted diffusion changes directly cause remote brain degeneration or whether it results from a secondary process.
Figure 1. The image processing workflow for determining connectivity loss because of infarction in patients with acute ischemic stroke. Example lesion masks and their corresponding Change in Connectivity (ChaCo) scores are shown using the glass-brain plot for 3 representative subjects. The glassbrain plot contains a sphere drawn at the center of mass of each region in the atlas, with the radius proportional to the ChaCo score of that region (larger, more disconnection) and the color indicat-ing the regional assignment (blue, frontal; magenta, parietal; cyan, subcortical; green, occipital; yellow, cerebellar; and red, tem-poral). DWI indicates diffusion-weighted image; MNI, Montreal Neurological Insti-tute; NeMo, Network Modification; and WM, white matter.
by guest on June 16, 2016http://stroke.ahajournals.org/Downloaded from

720 Stroke March 2014
Regions had nonzero ChaCo scores if they had lesions in their connecting WM, regardless of whether the lesion was also partially inside that GM region. One cannot discern whether changes that occurred in the mean diffusivity were because of the primary lesion or the disruption of the connect-ing WM. However, this effect should be less prominent in the atrophy metric as the lesion’s effects on the GM volume mea-surement would also be present at baseline. The fact that we see similar correlation with the atrophy measures strengthens our confidence that the mean diffusivity results are not solely driven by a lesion’s presence within GM.
Diffusion images on which the lesion masks were based do have low resolution and are subject to distortion. The raters were careful to not include any distortion artifacts, especially in the areas of the temporal lobe. The Dice similarity index for inter-rater agreement of the hand-drawn lesion masks was at a level that is considered in the good or excellent range, simi-lar to what has been shown in other studies.31,32 In addition, analyses described in the online-only Data Supplement and summarized in Figure I in the online-only Data Supplement that variability in the processing pipeline and scanner strength did not influence the results.
LimitationsOur cohort was limited to those individuals in the database with ischemic stroke who (1) survived the initial event and (2) had a second scan. These tended to be subjects with relatively low National Institutes of Health Stroke Scale, so there is bias in this population toward milder strokes. We cannot formally extend these results to more severe strokes; however, there is no reason to think that more severe strokes would have vastly different mechanisms of remote degeneration.
Tractography is a complicated process subject to several sources of error, even in normal subjects. Specifically, proba-bilistic tractography used in the NeMo Tool deduces fibers that are not always reproducible and has difficulty construct-ing long-range connections. Another limitation of the NeMo Tool is that it uses sets of WM tracks derived from healthy subjects. Because WM connections vary across the population and may be affected by stroke risk factors and cerebrovascular disease33; the NeMo Tool results may not accurately represent a given stroke subject’s connectivity; however, this effect is minimized using a large number of normal tractograms and reporting the results as a distribution over the population (not shown). Because the stroke cohort structural images contain abnormalities, there may be some errors in the normalization process. Normalization was checked visually for acceptable accuracy, and in some cases, an extra hand alignment step was performed to improve accuracy. In addition, effects of any small misalignments are further mitigated by averaging disconnection scores over the large number of normal tracto-grams used in the NeMo Tool.
Despite these limitations, our findings, if validated, may have implications for prognostication in patients with isch-emic stroke. Providing patients and families with accurate predictions of long-term recovery are important because these predictions often inform decisions about life-sustaining care,
Figure 2. Bar plots of the Change in Connectivity (ChaCo) scores over the population for each region, color-coded by regional assignment (blue, frontal; magenta, parietal; cyan, subcortical; green, occipital; yellow, cerebellar; and red, temporal). Many indi-vidual regions were outside of the limits of the y-axis in this plot, but it was zoomed in to focus on the majority of the population.
by guest on June 16, 2016http://stroke.ahajournals.org/Downloaded from
Kuceyeski et al Predicting Atrophy From Connectivity Disruption 721
rehabilitation strategies, and social and financial planning. Current stroke prognostication instruments rely heavily on age, comorbidities, and clinical stroke severity as assessed by tools such as the National Institutes of Health Stroke Scale.34,35 However, these tools offer limited discrimination, and the resulting uncertainty impedes clinical care. We have shown in other neurological diseases that clinicians’ predictions are only 80% to 90% reliable36; given the high stakes of decisions on life-sustaining care, for example, tools to improve clini-cal prognostication would clearly be welcome. Adding tra-ditional imaging markers, such as the size of baseline DWI lesions, to standard clinical prognostication scores seems to result in uncertain and limited benefit, probably because the size of infarction is already being captured by the clinical stroke severity scale.37 The ability of the NeMo Tool to predict the connectivity implications of an infarct, beyond simply its size, may thus represent a more promising path for improving prognostication.
ConclusionsWe sought to use the NeMo Tool to predict the brain regions most affected by network disruption caused by a focal stroke. Correlations between baseline ChaCo and subsequent tis-sue loss suggest that the NeMo Tool could identify regions most susceptible to remote degeneration from acute infarcts and therefore may enable more accurate prognosis. Although larger studies are needed to better define the impact of net-work disruption on focal and global neurological deficits and on stroke recovery, the present results suggest that the NeMo tool has the potential to provide quantitative information that could possibly aid in the early prediction of long-term deficits in patients with stroke.
AcknowledgmentsWe thank Sneha Pandya for help with data management. The authors gratefully acknowledge the support of the Feil Family Foundation.
Sources of FundingThis study was funded by a Leon Levy Foundation Fellowship (Dr Kuceyeski) and National Institutes of Health grants: KL2-TR000458-06 (Dr Navi through the Weill Cornell Clinical and Translational Science Center), NS-34179 (Dr Iadecola), K23-NS082367 (Dr Kamel), P41-RR023953-02 (Dr Raj), P41-RR023953-02S1 (Dr Raj), and R01-NS075425 (Dr Raj).
DisclosuresNone.
References 1. Saksena S, Jain R, Schultz L, Jiang Q, Soltanian-Zadeh H, Scarpace L,
et al. The corpus callosum Wallerian degeneration in the unilateral brain tumors: evaluation with diffusion tensor imaging (DTI). J Clin Diagn Res. 2013;7:320–325.
2. Matsusue E, Sugihara S, Fujii S, Kinoshita T, Ohama E, Ogawa T. Wallerian degeneration of the corticospinal tracts: postmortem MR-pathologic correlations. Acta Radiol. 2007;48:690–694.
3. Puig J, Pedraza S, Blasco G, Daunis-I-Estadella J, Prats A, Prados F, et al. Wallerian degeneration in the corticospinal tract evaluated by dif-fusion tensor imaging correlates with motor deficit 30 days after middle cerebral artery ischemic stroke. Am J Neuroradiol. 2010;31:1324–1330.
4. Lexa FJ, Grossman RI, Rosenquist AC. Dyke Award paper. MR of Wallerian degeneration in the feline visual system: characterization by magnetization transfer rate with histopathologic correlation. Am J Neuroradiol. 1994;15:201–212.
5. Iizuka H, Sakatani K, Young W. Neural damage in the rat thalamus after cortical infarcts. Stroke. 1990;21:790–794.
6. Sun SW, Liang HF, Cross AH, Song SK. Evolving Wallerian degenera-tion after transient retinal ischemia in mice characterized by diffusion tensor imaging. Neuroimage. 2008;40:1–10.
Figure 3. Scatterplot of Change in Connectivity (ChaCo) score vs change in normalized volume (follow-up minus baseline, negative val-ues indicate atrophy; left) and change in mean diffusivity (baseline minus follow-up, negative values indicate an increase in mean diffusiv-ity [MD]; right). After thresholding the ChaCo scores to include only those subject’s regions with disconnection of >1%, we were left with 168 data points. Each data point represents a particular region for a particular subject; 22 different subjects contributed ≥1 region to the analysis, and 72 different regions were included.
by guest on June 16, 2016http://stroke.ahajournals.org/Downloaded from

722 Stroke March 2014
7. Yu C, Zhu C, Zhang Y, Chen H, Qin W, Wang M, et al. A longitudinal dif-fusion tensor imaging study on Wallerian degeneration of corticospinal tract after motor pathway stroke. Neuroimage. 2009;47:451–458.
8. Puig J, Blasco G, Daunis-I-Estadella J, Thomalla G, Castellanos M, Figueras J, et al. Decreased corticospinal tract fractional anisotropy pre-dicts long-term motor outcome after stroke. Stroke. 2013;44:2016–2018.
9. Venkatasubramanian C, Kleinman JT, Fischbein NJ, Olivot JM, Gean AD, Eyngorn I, et al. Natural history and prognostic value of corticospi-nal tract Wallerian degeneration in intracerebral hemorrhage. J Am Heart Assoc. 2013;2:e000090.
10. Orita T, Tsurutani T, Izumihara A, Kajiwara K. Early, evolving Wallerian degeneration of the pyramidal tract in cerebrovascular diseases: MR study. J Comput Assist Tomogr. 1994;18:943–946.
11. Orita T, Tsurutani T, Izumihara A, Kajiwara K, Matsunaga T. Pyramidal tract Wallerian degeneration and correlated symptoms in stroke. Eur J Radiol. 1994;18:26–29.
12. Sawlani V, Gupta RK, Singh MK, Kohli A. MRI demonstration of Wallerian degeneration in various intracranial lesions and its clinical implications. J Neurol Sci. 1997;146:103–108.
13. Fukui K, Iguchi I, Kito A, Watanabe Y, Sugita K. Extent of pontine pyramidal tract Wallerian degeneration and outcome after supratentorial hemorrhagic stroke. Stroke. 1994;25:1207–1210.
14. Pierpaoli C, Barnett A, Pajevic S, Chen R, Penix LR, Virta A, et al. Water diffusion changes in Wallerian degeneration and their dependence on white matter architecture. Neuroimage. 2001;13(6 pt 1):1174–1185.
15. Watanabe T, Honda Y, Fujii Y, Koyama M, Matsuzawa H, Tanaka R. Three-dimensional anisotropy contrast magnetic resonance axonography to predict the prognosis for motor function in patients suffering from stroke. J Neurosurg. 2001;94:955–960.
16. Thomalla G, Glauche V, Koch MA, Beaulieu C, Weiller C, Röther J. Diffusion tensor imaging detects early Wallerian degeneration of the pyramidal tract after ischemic stroke. Neuroimage. 2004;22:1767–1774.
17. Jones DK, Cercignani M. Twenty-five pitfalls in the analysis of diffusion MRI data. NMR Biomed. 2010;23:803–820.
18. Wheeler-Kingshott CA, Cercignani M. About “axial” and “radial” dif-fusivities. Magn Reson Med. 2009;61:1255–1260.
19. Urbanski M, Thiebaut de Schotten M, Rodrigo S, Oppenheim C, Touzé E, Méder JF, et al. DTI-MR tractography of white matter damage in stroke patients with neglect. Exp Brain Res. 2011;208:491–505.
20. Parmar H, Golay X, Lee KE, Hui F, Sitoh YY. Early experiences with diffusion tensor imaging and magnetic resonance tractography in stroke patients. Singapore Med J. 2006;47:198–203.
21. Kunimatsu A, Aoki S, Masutani Y, Abe O, Mori H, Ohtomo K. Three-dimensional white matter tractography by diffusion tensor imag-ing in ischaemic stroke involving the corticospinal tract. Neuroradiology. 2003;45:532–535.
22. Singer OC, Sitzer M, du Mesnil de Rochemont R, Neumann-Haefelin T. Practical limitations of acute stroke MRI due to patient-related problems. Neurology. 2004;62:1848–1849.
23. Duering M, Righart R, Csanadi E, Jouvent E, Hervé D, Chabriat H, et al. Incident subcortical infarcts induce focal thinning in connected cortical regions. Neurology. 2012;79:2025–2028.
24. Kuceyeski A, Maruta J, Relkin N, Raj A. The Network Modification (NeMo) Tool: elucidating the effect of white matter integrity changes on cortical and subcortical structural connectivity. Brain Connect. 2013;3:451–463.
25. Friston KJ, Ashburner JT, Kiebel SJ, Nichols TE, Penny WD. Statistical Parametric Mapping: The Analysis of Functional Brain Images. London: Academic Press; 2006.
26. Alemán-Gómez Y, Melie-García L, Valdés-Hernandez P. IBASPM: Toolbox for automatic parcellation of brain structures. Presented at the 12th Annual Meeting of the Organization for Human Brain Mapping; 2005; Florence, Italy.
27. Tzourio-Mazoyer N, Landeau B, Papathanassiou D, Crivello F, Etard O, Delcroix N, et al. Automated anatomical labeling of activations in SPM using a macroscopic anatomical parcellation of the MNI MRI single-subject brain. Neuroimage. 2002;15:273–289.
28. Dice LR. Measures of the amount of ecological association between spe-cies. Ecology. 1945;26:297–302.
29. Seghier ML, Ramlackhansingh A, Crinion J, Leff AP, Price CJ. Lesion identification using unified segmentation-normalisation models and fuzzy clustering. Neuroimage. 2008;41:1253–1266.
30. Schaefer PW, Grant PE, Gonzalez RG. Diffusion-weighted MR imaging of the brain. Radiology. 2000;217:331–345.
31. Mouridsen K, Nagenthiraja K, Jónsdóttir KY, Ribe LR, Neumann AB, Hjort N, et al. Acute stroke: automatic perfusion lesion outlining using level sets. Radiology. 2013;269:404–412.
32. Nagenthiraja K, Ribe L, Ostergaard L, Mouridsen K. A full-automatic penumbra segmentation tool for clinical settings. Int Stroke Conf. 2012;43:A2459.
33. Henry RG, Shieh M, Amirbekian B, Chung S, Okuda DT, Pelletier D. Connecting white matter injury and thalamic atrophy in clinically iso-lated syndromes. J Neurol Sci. 2009;282:61–66.
34. Flint AC, Kamel H, Rao VA, Cullen SP, Faigeles BS, Smith WS. Validation of the Totaled Heath Risks In Vascular Events (THRIVE) score for out-come prediction in endovascular stroke treatment. Int J Stroke. August 29, 2012. doi: 10.1111/j.1747-4949.2012.00872.x.:http://www.ncbi.nlm.nih.gov/pubmed/22928705. Accessed September 26, 2013.
35. Kamel H, Patel N, Rao VA, Cullen SP, Faigeles BS, Smith WS, et al. The Totaled Health Risks in Vascular Events (THRIVE) score predicts ischemic stroke outcomes independent of thrombolytic therapy in the NINDS tPA trial. J Stroke Cerebrovasc Dis. 2013;22:1111–1116.
36. Navi BB, Kamel H, McCulloch CE, Nakagawa K, Naravetla B, Moheet AM, et al. Accuracy of neurovascular fellows’ prognostication of out-come after subarachnoid hemorrhage. Stroke. 2012;43:702–707.
37. Hand PJ, Wardlaw JM, Rivers CS, Armitage PA, Bastin ME, Lindley RI, et al. MR diffusion-weighted imaging and outcome prediction after ischemic stroke. Neurology. 2006;66:1159–1163.
by guest on June 16, 2016http://stroke.ahajournals.org/Downloaded from

Amy Kuceyeski, Hooman Kamel, Babak B. Navi, Ashish Raj and Costantino IadecolaIschemic Stroke
Predicting Future Brain Tissue Loss From White Matter Connectivity Disruption in
Print ISSN: 0039-2499. Online ISSN: 1524-4628 Copyright © 2014 American Heart Association, Inc. All rights reserved.
is published by the American Heart Association, 7272 Greenville Avenue, Dallas, TX 75231Stroke doi: 10.1161/STROKEAHA.113.003645
2014;45:717-722; originally published online February 12, 2014;Stroke.
http://stroke.ahajournals.org/content/45/3/717World Wide Web at:
The online version of this article, along with updated information and services, is located on the
http://stroke.ahajournals.org//subscriptions/
is online at: Stroke Information about subscribing to Subscriptions:
http://www.lww.com/reprints Information about reprints can be found online at: Reprints:
document. Permissions and Rights Question and Answer process is available in the
Request Permissions in the middle column of the Web page under Services. Further information about thisOnce the online version of the published article for which permission is being requested is located, click
can be obtained via RightsLink, a service of the Copyright Clearance Center, not the Editorial Office.Strokein Requests for permissions to reproduce figures, tables, or portions of articles originally publishedPermissions:
by guest on June 16, 2016http://stroke.ahajournals.org/Downloaded from