
A PLS model based on dominant factor for coal analysis using laser-induced breakdown spectroscopy
11
ORIGINAL PAPER A PLS model based on dominant factor for coal analysis using laser-induced breakdown spectroscopy Jie Feng & Zhe Wang & Logan West & Zheng Li & Weidou Ni Received: 10 December 2010 / Revised: 24 February 2011 /Accepted: 1 March 2011 # Springer-Verlag 2011 Abstract Thirty-three bituminous coal samples were uti- lized to test the application of laser-induced breakdown spectroscopy technique for coal elemental concentration measurement in the air. The heterogeneity of the samples and the pyrolysis or combustion of coal during the laser– sample interaction processes were analyzed to be the main reason for large fluctuation of detected spectra and low calibration quality. Compared with the generally applied normalization with the whole spectral area, normalization with segmental spectral area was found to largely improve the measurement precision and accuracy. The concentra- tions of major element C in coal were determined by a novel partial least squares (PLS) model based on dominant factor. Dominant C concentration information was taken from the carbon characteristic line intensity since it contains the most-related information, even if not accurately. This dominant factor model was further improved by inducting non-linear relation by partially modeling the inter-element interference effect. The residuals were further corrected by PLS with the full spectrum information. With the physical- principle-based dominant factor to calculate the main quantitative information and to partially explicitly include the non-linear relation, the proposed PLS model avoids the overuse of unrelated noise to some extent and becomes more robust over a wider C concentration range. Results show that RMSEP in the proposed PLS model decreased to 4.47% from 5.52% for the conventional PLS with full spectrum input, while R 2 remained as high as 0.999, and RMSEC&P was reduced from 3.60% to 2.92%, showing the overall improvement of the proposed PLS model. Keywords Laser-induced breakdown spectroscopy . Bituminous coal . Dominant factor . Partial least squares Introduction Laser-induced breakdown spectroscopy (LIBS) is an atomic emission spectroscopy technique that employs laser- induced plasma as both the sample volume and the excitation source, dissociating all molecules and fine particulates within the highly energetic micro plasma. The resulting plasma emission can be associated with the elemental concentration in the sample. Because of LIBS’ advantages, such as not needing pretreatment of the material, the speed of analysis and the possibility of in situ analysis, LIBS is attractive for industrial applications in a variety of fields [1–10]. In recent years, more and more researchers have focused on LIBS application in field monitoring for coal analysis and related issues in the coal-fired power plants. On-line determination of coal chemical composition prior to combustion is vitally important for a power plant to obtain optimal boiler control. The coal constituents not only impact pollutant emissions, but also the boilers, affecting combustion stability, corrosion, ash deposition and disposal [11]. However, current commercially available on-line Published in the special issue Laser-Induced Breakdown Spectroscopy with Guest Editors Jagdish P. Singh, Jose Almirall, Mohamad Sabsabi, and Andrzej Miziolek. Electronic supplementary material The online version of this article (doi:10.1007/s00216-011-4865-y) contains supplementary material, which is available to authorized users. J. Feng : Z. Wang : L. West : Z. Li (*) : W. Ni State Key Lab of Power Systems, Department of Thermal Engineering, Tsinghua-BP Clean Energy Center, Tsinghua University, Beijing 100084, China e-mail: [email protected] Anal Bioanal Chem DOI 10.1007/s00216-011-4865-y
-
Upload
independent -
Category
Documents
-
view
1 -
download
0
Transcript of A PLS model based on dominant factor for coal analysis using laser-induced breakdown spectroscopy
ORIGINAL PAPER
A PLS model based on dominant factor for coalanalysis using laser-induced breakdown spectroscopy
Jie Feng & Zhe Wang & Logan West & Zheng Li &Weidou Ni
Received: 10 December 2010 /Revised: 24 February 2011 /Accepted: 1 March 2011# Springer-Verlag 2011
Abstract Thirty-three bituminous coal samples were uti-lized to test the application of laser-induced breakdownspectroscopy technique for coal elemental concentrationmeasurement in the air. The heterogeneity of the samplesand the pyrolysis or combustion of coal during the laser–sample interaction processes were analyzed to be the mainreason for large fluctuation of detected spectra and lowcalibration quality. Compared with the generally appliednormalization with the whole spectral area, normalizationwith segmental spectral area was found to largely improvethe measurement precision and accuracy. The concentra-tions of major element C in coal were determined by anovel partial least squares (PLS) model based on dominantfactor. Dominant C concentration information was takenfrom the carbon characteristic line intensity since it containsthe most-related information, even if not accurately. Thisdominant factor model was further improved by inductingnon-linear relation by partially modeling the inter-elementinterference effect. The residuals were further corrected byPLS with the full spectrum information. With the physical-principle-based dominant factor to calculate the mainquantitative information and to partially explicitly include
the non-linear relation, the proposed PLS model avoids theoveruse of unrelated noise to some extent and becomesmore robust over a wider C concentration range. Resultsshow that RMSEP in the proposed PLS model decreased to4.47% from 5.52% for the conventional PLS with fullspectrum input, while R2 remained as high as 0.999, andRMSEC&P was reduced from 3.60% to 2.92%, showingthe overall improvement of the proposed PLS model.
Keywords Laser-induced breakdown spectroscopy .
Bituminous coal . Dominant factor . Partial least squares
Introduction
Laser-induced breakdown spectroscopy (LIBS) is an atomicemission spectroscopy technique that employs laser-induced plasma as both the sample volume and theexcitation source, dissociating all molecules and fineparticulates within the highly energetic micro plasma. Theresulting plasma emission can be associated with theelemental concentration in the sample. Because of LIBS’advantages, such as not needing pretreatment of thematerial, the speed of analysis and the possibility of in situanalysis, LIBS is attractive for industrial applications in avariety of fields [1–10].
In recent years, more and more researchers have focusedon LIBS application in field monitoring for coal analysisand related issues in the coal-fired power plants. On-linedetermination of coal chemical composition prior tocombustion is vitally important for a power plant to obtainoptimal boiler control. The coal constituents not onlyimpact pollutant emissions, but also the boilers, affectingcombustion stability, corrosion, ash deposition and disposal[11]. However, current commercially available on-line
Published in the special issue Laser-Induced Breakdown Spectroscopywith Guest Editors Jagdish P. Singh, Jose Almirall, Mohamad Sabsabi,and Andrzej Miziolek.
Electronic supplementary material The online version of this article(doi:10.1007/s00216-011-4865-y) contains supplementary material,which is available to authorized users.
J. Feng : Z. Wang : L. West : Z. Li (*) :W. NiState Key Lab of Power Systems,Department of Thermal Engineering,Tsinghua-BP Clean Energy Center, Tsinghua University,Beijing 100084, Chinae-mail: [email protected]
Anal Bioanal ChemDOI 10.1007/s00216-011-4865-y

techniques such as X-ray fluorescence (XRF) and prompt-gamma neutron activation analysis have strict requirementsand difficulties in analyzing low atomic elements such as Cand O [12]. Therefore LIBS, which offers fast andsimultaneous multi-element analysis, has great potentialfor on-line coal measurement.
A number of studies have already probed the applica-bility of LIBS in coal analysis. Yin et al. [12] designed aLIBS system for quality analysis of pulverized coal and themeasurement errors were less than 10%. Wallis et al. [13]investigated lignite samples and obtained detection limits ofCa, Al, Na, Fe, Mg and Si. Body et al. [14] developed aLIBS instrument for analysis of pressed coal and themeasurement accuracy for inorganic components (e.g. Al,Si, and Mg) was typically within ±10%. Blevins et al. [15]applied LIBS to detect elements such as Na, K, Ca in theflue gas of a power generation boiler. Ctvrtnickova et al.[16, 17] demonstrated the capability of LIBS for character-ization of coal fly ash components and the regressioncoefficients of calibration curves for elements such as Ba,K, Mg were in the range of 0.86–0.99. Many otherapplications have also been reported [18–24]. However, asfar as we know, the extension of the quantitative method toa wide elemental concentration range still appears to beproblematic and few publications have focused on thedetermination of major elements, such as C, in coal—a taskwith important implications for coal quality.
The application of LIBS to accurately predict the majorelemental constituents in coal, though, faces many obstaclesthat currently restrict its use in on-line coal analysis. Afundamental difficulty is that coal is a relatively heteroge-neous sample containing minerals like carbonates, sulfidesand oxides, which cause a strong matrix effect includinginter-element interference. Due to the many sources ofuncertainty, more accurate coal analysis requires furtherimprovement of the calibration model. Multivariate tech-nique partial least squares (PLS) is such a useful method toutilize the abundant spectral information to compensate fordifferent deviations [25–30]. To our knowledge, there islittle work on coal analysis using LIBS with PLS. However,the fundamental flaw in PLS application directly to spectrais that the method neglects any underlying physicalprinciples, focusing purely on mathematical data correlationinstead. As a result, the predictions from a PLS model havelimited accuracy if the matrix of the measured samplesvaries away from that of the calibration sample set [25].Another limitation is that PLS may not satisfactorily modelthe non-linear relationship between the spectrum and thespecies concentration, such as the saturation effects of self-absorption [27].
The main philosophy of our approach is to induct non-linear factor to PLS thereby to partially overcome theintrinsic linear correlation deficiency of the PLS approach
in modeling non-linear relationship. Specifically, a PLSmodel with dominant factor based on the physical princi-ples is proposed for C concentration determination in coalsamples. The characteristic line intensities are applied toestablish the dominant factor reflecting the elementalconcentration in typical LIBS measurements, while PLS isused to minimize the residuals of the calibration model toeffectively utilize spectral information to compensate forfluctuations of plasma properties. The model combinesadvantages of the physical-principle-based univariate modeland PLS approach, reducing the possibility of overfittingand thus improving the accuracy.
The detailed model description is given in the nextsection. To prove the efficacy of the proposed PLS modelbased on dominant factor, an experiment was conducted totest the proposed model’s accuracy against the conventionalPLS model. Then, the paper discusses several major factorscontributing to the inaccuracy of the raw LIBS dataobtained from the experiment. The final sections presentand discuss the experiment results, highlighting the gains inprediction accuracy from using the newly proposed model.
Model descriptions
In LIBS measurement, under the conditions of stoichio-metric and local thermodynamic equilibrium, the relation-ship between the elemental concentration and intensityshould be linear when plasma properties are constant, as inthe traditional univariate model [31]. However, deviationsfrom different sources would deteriorate the theoreticalrelationship. Due to the intrinsic plasma characteristics andmechanisms, self-absorption is often unavoidable in LIBSmeasurement if the concentration of the measured species ishigh. The emission may be absorbed by cool atoms of thesame species in or around the plasma, which leads to apronounced non-linear relationship between the line inten-sity and elemental concentration. Furthermore, inter-element interference due to line overlap and matrix effectsis also very common, so that the intensity of one specialline might not only result from one specific element, butalso from other element number densities present in theplasma. Besides, many other factors and processes can alterthe measured characteristic line intensity, such as the spatialand temporal heterogeneity of the plasma. These distortingprocesses shift the line intensity simultaneously, indicatingthat it is difficult to separate them physically and the onlypractical way is to apply data processing technology topartially compensate for these deviations.
Due to the above deviations, the detected intensity of thecharacteristic line may not accurately reflect the elementalconcentration, but it still contains the basic information forelemental concentration. Considering this, a potential way
J. Feng et al.
is to extract the major concentration information from thesecharacteristic lines and further correct the model by takingthe full-range spectrum into account to compensate for theresidual errors. A dominant factor model, in which thecharacteristic lines of the measured or other elements areexplicitly extracted to explain the major part of elementalconcentration and PLS is further applied to correct themodel, is presented in the paper for carbon concentrationmeasurement in coal. The explicitly extracted expressionwhich takes a dominant portion of the final model results iscalled “the dominant factor”. The procedure of modelestablishment can be described as follows.
The first step is to extract the main relationship, f (Ii)between the characteristic intensity Ii of the measuredelement i and elemental concentration Ci, which could benon-linear under conditions that self-absorption effectcannot be neglected, as in Eq. 1.
Ci ¼ f Iið Þ ð1Þ
Inter-element interference may be a major source for thedifference, called as “residual”, between the real elementconcentration and the value calculated with Eq. 1. However,the mechanism of inter-element interference is complicatedand remains unclear. In the present work, the second step isto model the inter-element interference to further minimizethe residuals using best curve-fitting technology with non-linear equation. After this process, the expression of thedominant factor is as in Eq. 2,
C0i ¼ f Iið Þ þ g Ij
� � ð2Þ
where C0i is the calculated elemental concentration of the
dominant factor that considers self-absorption and inter-element interference, Ij is the characteristic line intensity ofthe influencing element j and g(Ij) is the function todescribe inter-element interference. After dominant factorextraction, the remaining difference may come from theimperfectness of the dominant factor, other unknowndeviation factors and even signal fluctuations, making itdifficult to explicitly model these effects. Considering theentire spectrum contains useful information of the deviationsources, it is logical to utilize the full spectrum to furtherminimize the deviations. Thus, the powerful multivariatePLS method is applied to compensate for the residual errorusing the entire spectrum information.
In essence, PLS is a technique for modeling a linearrelationship between input variables and output variables.The PLS approach first creates uncorrelated latent variableswhich are linear combinations of the original inputvariables. A least squares regression is then performed onthe subset of extracted latent variables [32]. Because PLSutilizes all spectral information to implicitly and partially
compensate for the signal deviation due to fluctuations ofplasma temperature, electron number density, inter-elementinterference and other factors using linear correlations, itnormally yields better calibration results than conventionalunivariate model.
The distinction in the present approach is that the generalPLS approach uses linear relation to directly model non-linear spectra-to-concentration relationships, whereas thenewly proposed model only uses linear PLS to fit the muchsmaller non-linear spectra-to-residual relationship, theoret-ically leading to better model results. In addition, the modelperformance is further improved by explicitly extractingpart of the non-linear relation between the spectra and theconcentration in the dominant factor since PLS correctiononly needs to handle less non-linear dependence. Pleaserefer to Wang et al. for details on the approach [33].Equation 3 shows the final expression of the model.
C0 0i ¼ f Iið Þ þ g Ij
� � þ b0 þ b1x1 þ ::: þ bnxn ð3Þ
where C0 0i represents the final calculated elemental concen-
tration of PLS model based on the dominant factor, x1, x2,…,xn are the spectral intensities at different wavelengths, and b0,b1, b2,…,bn are the regression coefficients. Compared withthe general PLS model, the PLS model based on dominantfactor should be more applicable for a wider matrix range asit is bound to the physical principles and capitalizes on theadvantages of the multivariate PLS approach to compensatefor residuals.
Experiment setup
Thirty-three standard powdery bituminous coal samples,which contain C over a wide range of concentration values,were certified by the China Coal Research Institute (CCRI)and used in the experiments. A list of samples is given inTable 1, including the element names and the concentrationvalues (in percentage of weight).
Spectrolaser 4000 from XRF in Australia was used in theexperiment. Feng et al. [10] described components of thedetection system in details. A Q-switched Nd:TAG lasersource with the wavelength of 532 nm was applied and laserrepetition rate was set to be 1 pulse/s, while the integrationtime was fixed at 1 ms. Four Czerny–Turner spectrometersand CCD detectors covered the spectral range from 190 to940 nm with a nominal resolution of about 0.09 nm. About3 g of powder of each coal sample were placed into a smallaluminum pellet die (30 mm diameter), and then pressedwith the pressure of 20 tons. The sample was placed on anauto-controlled X–Y translation stage and exposed to air. Itwas found that longer warm-up time greatly reduced signalfluctuations, so the warm-up time was set to be more than
A PLS model based on dominant factor for coal analysis

half an hour before analysis. The analysis laser energy anddelay time was optimized to be 120 mJ/pulse and 2 μs,respectively. Such parameters could produce spectra withnegligible Bremsstrahlung radiation and without saturatingline intensity to the spectrometer. A laser pulse of 150 mJwas applied to burn off any contaminants before eachanalysis pulse. For precision calculation, the spectra of 40replications at different locations on the sample surfacewere taken to calculate the relative standard error (RSD),while for accuracy modeling, an averaged spectrum of 40spectra after normalization was obtained for each sample inorder to partially average out the experimental parameterfluctuations and the sample heterogeneity.
For the purpose of reducing the influence of thebackground signal, the instrumental and environmental
noise was recorded with a long enough delay time and alaser pulse with much lower energy and subtracted from thespectra. Additionally, the spectra were corrected for theefficiency of the detection system to minimize the lineintensity distortion from the wavelength dependant effi-ciency of collecting optics, lenses and fiber optics, thespectrometer gating, the detector sensor and intensifier.
Following the experiment, the data were further adjustedto account for unique phenomena in LIBS coal analysis asdiscussed below in Special issues in coal analysis withLIBS section. Next, the data were analyzed using both thegeneral PLS method and the new PLS model based on thedominant factor.
Special issues in coal analysis with LIBS
Figure 1 shows the appearance of the sample surface afteranalysis. As the image displays, the color of the surfacearound the laser analysis craters changed, which might resultfrom tar or ash produced by the pyrolysis or combustion ofcoal. Because these products are chemically distinct from theoriginal coal contents, this might add to the matrix effect incoal analysis with LIBS. Additionally, the laser–sampleinteraction process will be altered when volatiles in the coalare evaporated after the laser strikes the target. Some of theevaporated volatiles may react with oxygen in the air toproduce a flame that can influence the emitted intensity ofelemental characteristic lines. This situation should beavoided in future work by optimizing the detection environ-ment, such as using inert gas protection.
Fig. 1 Appearance of the sample No. 1 surface after analysis (colored)
No. C (%) H (%)
1 81.45 3.52
2 81.54 3.70
3 78.98 4.95
4 79.80 3.80
5 47.12 2.48
6 67.28 3.68
7 58.12 3.40
8 55.14 2.79
9 54.21 2.53
10 72.94 4.46
11 79.22 3.28
12 75.96 4.52
13 60.03 3.73
14 78.78 5.01
15 74.70 4.47
16 76.69 4.42
17 77.28 4.42
18 78.58 4.59
19 52.61 3.45
20 53.42 3.50
21 59.91 3.90
22 67.77 4.25
23 55.67 3.22
24 70.45 3.40
25 77.03 4.70
26 44.60 2.78
27 50.83 3.00
28 59.18 3.07
29 36.90 2.27
30 45.88 3.20
31 39.58 2.05
32 39.53 1.96
33 36.67 2.68
Table 1 Element concentrationsof the coal samples from CCRI
J. Feng et al.

Further analysis revealed another imperfection in coalsampling that likely leads to greater spectral uncertainty.Local variation in the sample’s physical properties andmineralogical characteristics, such as surface texture,caused the morphology of craters formed by the pulse tovary from pulse to pulse. To closely observe the laserimpact, several photographs using the environmentalscanning electron microscope (ESEM) were taken (Table 2,see also Electronic Supplementary Material). The morphol-ogy of the craters shows significant variation, indicatingthat the ablation mass and the morphology of the plasmafluctuated greatly between each pulse. Such fluctuation inproperties can add to the intensity variations among pulses.
The special conditions for coal analysis by LIBS willlead to large discrepancies in the data. Generally, normal-ization with whole spectral area was applied to minimizethe spectrum uncertainty before establishing the calibrationmodel for LIBS measurement. However, the results showednot much improvement for the spectra obtained from coalsamples. As seen in Table 3, the RSD of the line intensitiesafter whole spectral area normalization are still very high.The lack of effects is likely a result of the manyimperfections discussed above that prevented accuraterepresentation of fluctuations in plasma properties usingthe whole spectral area.
Furthermore, in the typical resulting spectra from coalanalysis as shown in Fig. 2, only few atomic emission linesfree of overlap for the major element C were observed. Thisreduces the possibility of selecting an appropriate charac-teristic line for traditional univariate calibration model.Compared with LIBS analysis for standard metal samples,elemental measurement of coal definitely requires morestudy for accuracy.
Moreover, the calibration results of the traditionalunivariate model with the whole spectral area normalizationwere also not satisfactory. For instance, the data points ofintensity C(I) 247.856 nm line versus known C concentra-tion as shown in Fig. 3 are scattered, further indicating thenecessity in searching for a suitable data processing methodfor coal measurement using LIBS.
The whole spectral area represents the total speciesexcitation energy in the laser-induced plasma. Normally,larger whole spectral area usually indicates higher plasmatemperature and species concentration inside the plasmacaused by higher laser pulse energy and stronger laser–sample interaction processes. Therefore, normalization withthe whole spectral area can partly remove the fluctuationsof LIBS spectra due to the variations of laser pulse energy,total species, etc. However, as described above, this methoddoes not yield satisfying results for coal analysis, probably
Table 2 Photographs of ESEM for two laser analysis craters of sample No. 1
Magnification
Crater 100 500 2000
Crater 1
Crater 2
C(I) wavelength (nm) RSD (whole spectral areanormalization, unit: %)
RSD (segmental spectral areanormalization, unit: %)
193.092 28.0 12.6
247.856 27.8 11.5
Table 3 RSD of C(I) line in-tensity for sample No. 1 afterdifferent normalization methods
A PLS model based on dominant factor for coal analysis

because the matrix of coal is too complicated. A certainportion of the spectrum is not sensitive to the plasmatemperature or total species concentration variation possiblydue to the complicated interaction between differentelements, weakening the correlation between the wholespectral area and the plasma temperature and total speciesconcentration. That is, the information of spectra fluctua-tions due to the plasma temperature and total speciesconcentration variation contained in the whole spectral areais partly canceled out due to the non-sensitive segment.Therefore, applying only the area of sensitive segment ofthe spectra, which should be more correlated with thechange of laser power than the whole spectral area, fornormalization would possibly yield a good result.
In the present work, as the first choice, the whole spectrumwas divided into four segments since naturally our LIBSsystem used four Czerny–Turner spectrometers to measure thewhole spectrum with each spectrometers covering part of the
spectral range. The four segments were finally chosen to be190.048–310.228, 310.228–560.025, 560.025–769.991, and769.991–940 nm, respectively. The segmental spectral rangeutilized for the available characteristic lines 193.092 nm and247.856 nm was set to from 190.048 nm to 310.228 nm. Itwas found that segmental spectral area normalization wasmuch more effective to reduce the RSD than normalization bythe whole spectral area. After segmental spectral areanormalization, the RSD values decreased greatly to about10%, as seen in Table 3.
Furthermore, segmental spectral area normalization alsolargely increased the calibration accuracy. For instance, asshown in Fig. 4, R2 value of the calibration curve using C(I)line at 247.856 nm after segmental normalization is 0.880,which shows significant improvement in comparison withthe data points from normalization with the whole spectralarea in Fig. 3. The above results demonstrate that segmentalnormalization of the spectra is preferable for samples withcomplicated constituents, such as coal.
As shown by this experiment, a number of factorscontribute to the defects of coal analysis using LIBS. Whilefuture opportunities exist to refine the experimental designand procedures of analysis, uncertainties in raw LIBS datawill remain, requiring that the calibration and predictionmodel for the composition of coal samples be as accurate aspossible. In advancing towards this aim, the section belowdemonstrates the results from the new dominant factormodel with PLS correction.
Results and discussions
In the following sections, the proposed dominant factormodel was evaluated in terms of C concentration determi-nation. The conventional PLS model with the full spectral
Fig. 4 Calibration results of the C(I) 247.856 nm line after segmentalspectral area normalization
Fig. 3 Calibration results of the C(I) 247.856 nm line afternormalization with the whole spectral area
Fig. 2 A typical LIBS spectrum of coal samples
J. Feng et al.

range input was chosen as the baseline against which toclearly judge improvement in the new approach. Thesoftware Unscrambler 10.0 (CAMO, Woodbridge, NJ)was used to perform the PLS calculation. The calibrationand prediction performance of the model was assessed bythe coefficient of determination (R2) and root mean squareerror of prediction (RMSEP), respectively. For an idealmodel, R2 should be close to 1 while RMSEP is close to 0.Moreover, root mean square error of both calibration andprediction samples (RMSEC&P) was proposed for assess-ing the overall performance of the model. SmallerRMSEC&P value indicates a better model quality. Nineteensamples were selected to build the calibration model and 14samples (Nos. 2, 3, 5, 8, 13, 15, 24, 25, 26, 28, 30, 31, 32,and 33) were picked to test the model prediction. Since Cconcentrations of samples No. 2 and 33 are out of rangeof the calibration set and the C concentrations of otherprediction samples are within the calibration set, theprediction range was chosen purposely to test therobustness of the new PLS model based on dominantfactor across a broad range of sample matrixes. Inaddition, it has been noticed that since the coal matrix isvery complicated, C concentration can only partially standfor the matrix of coal. Therefore, the choice of the Nos. 2and 33 samples as the out-of-calibration samples may notbe accurate enough.
Baseline
PLS is one of the advanced analytical tools in chemo-metrics and has shown great potential in LIBS quantitativemeasurements, thus it was chosen as the baseline. In thebaseline PLS model, the intensities at different wavelengthsof all spectra after segmental spectral area normalizationand C concentration of samples were used as inputvariables and output variables, respectively. The intensityat each wavelength was normalized to the area of thesegment which included the intensity wavelength. Thenumber of principal components was chosen to have thesmallest RMSEP for the prediction sample set.
As shown in Fig. 5, for the baseline model, theRMSEC&P is 3.60% and R2 value is 0.999, but theRMSEP is as high as 5.52%. The probable reasons for thelarge prediction errors are that conventional PLS does notconsider the physical principles and the model is not robustover a wide range of C concentrations due to the intrinsicnon-linear correlation and overfitting of PLS. That is,conventional PLS application only maintains the accuracyfor the range of C concentrations contained in thematrixes of the measured samples within the calibrationset. Therefore, when the matrix of the measured sampleis out of the calibration sample set, the prediction maynot be satisfactory. The absolute relative errors for
sample No. 2, which has the highest C concentration,and sample No. 33, which has the lowest C concentra-tion, are as high as 5.69% and 3.29%, respectively,because they lie outside the range of C concentrationcontained in the samples used for calibration. Moreover,the widely present noise in the LIBS spectra might makethe PLS model less effective because of the excess ofunrelated noise input.
From the above results, it was found that for coalsamples with complicated constituents, the matrix effectwill greatly influence the PLS model accuracy. Accordingto the model description, the major concentration informa-tion contained in the characteristic line intensity of thespecific element should play a more prominent role andhave more weight in calculating model results. Establishinga model with a dominant factor based on the physicalprinciples is a potential way to avoid disadvantages ofconventional PLS, which is one of the basic philosophiesfor the proposed model.
Dominant factor extraction
The proposed PLS model is mainly determined by thedominant factor based on physical principles between thecharacteristic line intensity and the specific elementalconcentration. The simplest dominant factor was firstextracted only applying linear relation (as in the conven-tional univariate model) as follows.
Cc ¼ f Icð Þ ¼ kIc þ b ð4Þ
where Cc is the C concentration, k and b are coefficientsand Ic is the spectra area of C(I) line at 247.856 nm. Thisline was selected because it provided the best linearcalibration results among all applicable C(I) lines aftersegmental spectral area normalization. In addition, the non-
Fig. 5 Baseline model results
A PLS model based on dominant factor for coal analysis
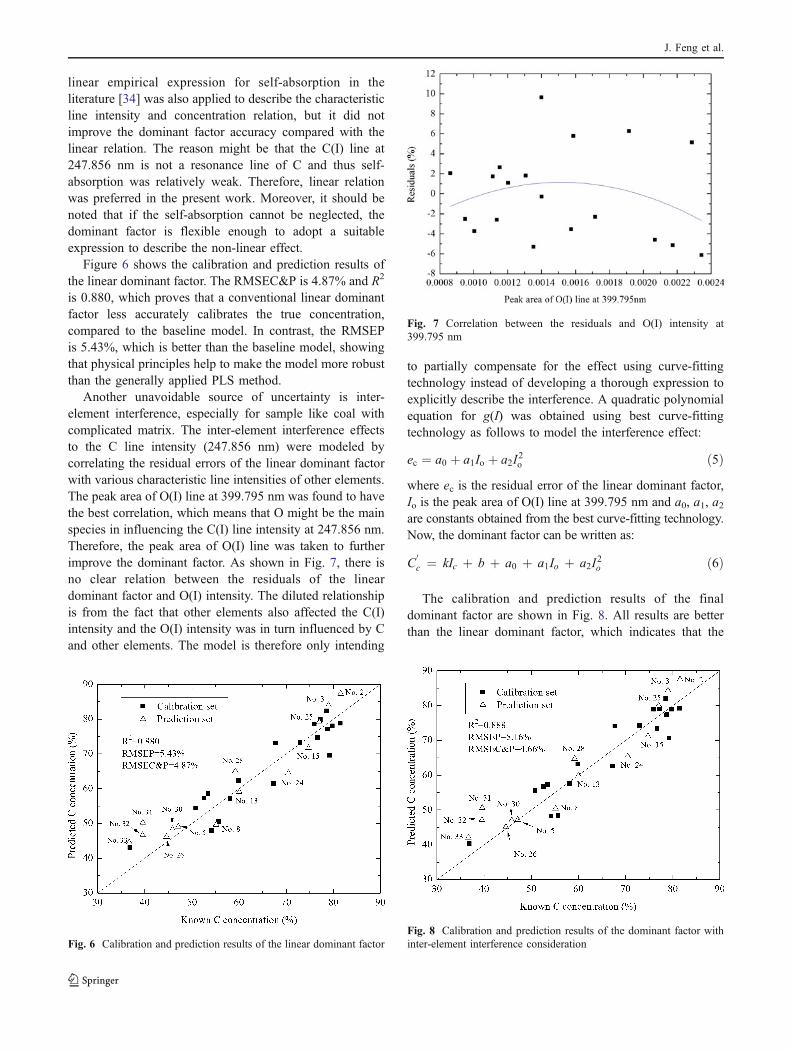
linear empirical expression for self-absorption in theliterature [34] was also applied to describe the characteristicline intensity and concentration relation, but it did notimprove the dominant factor accuracy compared with thelinear relation. The reason might be that the C(I) line at247.856 nm is not a resonance line of C and thus self-absorption was relatively weak. Therefore, linear relationwas preferred in the present work. Moreover, it should benoted that if the self-absorption cannot be neglected, thedominant factor is flexible enough to adopt a suitableexpression to describe the non-linear effect.
Figure 6 shows the calibration and prediction results ofthe linear dominant factor. The RMSEC&P is 4.87% and R2
is 0.880, which proves that a conventional linear dominantfactor less accurately calibrates the true concentration,compared to the baseline model. In contrast, the RMSEPis 5.43%, which is better than the baseline model, showingthat physical principles help to make the model more robustthan the generally applied PLS method.
Another unavoidable source of uncertainty is inter-element interference, especially for sample like coal withcomplicated matrix. The inter-element interference effectsto the C line intensity (247.856 nm) were modeled bycorrelating the residual errors of the linear dominant factorwith various characteristic line intensities of other elements.The peak area of O(I) line at 399.795 nm was found to havethe best correlation, which means that O might be the mainspecies in influencing the C(I) line intensity at 247.856 nm.Therefore, the peak area of O(I) line was taken to furtherimprove the dominant factor. As shown in Fig. 7, there isno clear relation between the residuals of the lineardominant factor and O(I) intensity. The diluted relationshipis from the fact that other elements also affected the C(I)intensity and the O(I) intensity was in turn influenced by Cand other elements. The model is therefore only intending
to partially compensate for the effect using curve-fittingtechnology instead of developing a thorough expression toexplicitly describe the interference. A quadratic polynomialequation for g(I) was obtained using best curve-fittingtechnology as follows to model the interference effect:
ec ¼ a0 þ a1Io þ a2I2o ð5Þ
where ec is the residual error of the linear dominant factor,Io is the peak area of O(I) line at 399.795 nm and a0, a1, a2are constants obtained from the best curve-fitting technology.Now, the dominant factor can be written as:
C0c ¼ kIc þ b þ a0 þ a1Io þ a2I
2o ð6Þ
The calibration and prediction results of the finaldominant factor are shown in Fig. 8. All results are betterthan the linear dominant factor, which indicates that the
Fig. 8 Calibration and prediction results of the dominant factor withinter-element interference consideration
Fig. 7 Correlation between the residuals and O(I) intensity at399.795 nm
Fig. 6 Calibration and prediction results of the linear dominant factor
J. Feng et al.

more the physical processes are considered, the more robustthe dominant factor model is. For instance, the absoluterelative error for sample No. 33 was reduced to 14.8% from21.5% as in the linear dominant factor alone.
As listed in Table 4, though RMSEC&P and R2 of thedominant factor are worse than that in the baseline model,RMSEP of the dominant factor is better than that in thebaseline PLS model, further confirming our conclusion thatthe physical principle makes the model robust for thesituations where the prediction matrix lies outside thecalibration set. Still, the R2 of the dominant factor is notclose to 1 because many other deviations are not yetcompensated for. PLS is thereafter applied to implicitlyminimize the residual errors of the dominant factor usingfull spectral information.
PLS approach based on the dominant factor
The residual errors of the dominant factor were furthercorrected with PLS. The number of principle componentswas also chosen to obtain the smallest RMSEP. After thewhole process, R2 is 0.999 and RMSEP is reduced to4.47% (Fig. 9). In comparison with the result of thedominant factor alone, the PLS residual correction greatlyimproves the quality of the calibration curve and theRMSEP. For the overall quality, RMSEC&P is 2.92%,which is also significantly better than the dominant factor
itself and the conventional PLS method, showing thecombination of the dominant factor with PLS correctionimproves the final results.
Table 5 summarizes results of all models presented in thepaper. Generally, the dominant-factor-based PLS model hasthe best calibration and prediction performance. RMSEC&Pin the new model is better than the baseline model, beingreduced to 2.92% from 3.60% in the baseline model. R2 ofcalibration is the same while RMSEP declines significantly.For example, the absolute relative error for sample No. 33(lowest C concentration) decreased to 2.17% from 3.29% inthe baseline model. For sample No. 2 (highest C concentra-tion), the absolute relative error reduced from 5.69% in thebaseline model to 3.99% in the dominant factor with PLScorrection model. The lower RMSEP indicates that theapplication of the physical background makes the new modelmore robust for complicated bituminous samples over awider C concentration range. Therefore, by combining theadvantages of the univariate model and PLS method, thedominant-factor-based PLS model is not only comparablewith PLS method for samples having compositions withinthe range of the calibration set, but is also more robust inmeasuring unknown samples out of the calibration rangecompared with the conventional PLS approach.
Conclusions
In the present work, experiments of applying LIBS tomeasurement of 33 bituminous coal samples with a widecarbon concentration range were carried out. Severalspecial issues for coal analysis with LIBS were discussed.The large RSD of the spectra should result from theheterogeneity of the samples and pyrolysis or combustionof coal during the laser–sample interaction processes.Normalization with segmental spectral area was found to
Fig. 9 Calibration and prediction results of PLS based on dominant factor
Table 4 List of dominant factor model results
Dominant factor R2 RMSEP (%) RMSEC&P (%)
C0c ¼ kIc þ b þ a0 þ a1Io þ a2I2o
a 0.888 5.16 4.66
a k=1.014×10³ , b=2.301×10, a0=−11.695, a1=1.693×10⁴ , a2=−5.583×10⁶
Table 5 Results of different models for C concentration determination
Models R2 RMSEP (%) RMSEC&P (%)
Baseline model 0.999 5.52 3.60
Dominant factor 0.888 5.16 4.66
PLS model based ondominant factor
0.999 4.47 2.92
A PLS model based on dominant factor for coal analysis

be more effective to reduce measurement uncertainty andimprove the calibration quality than generally appliednormalization with the whole spectral area.
Dominant-factor-based PLS method was applied for theC concentration measurement of bituminous coal. Resultsshow great improvement over conventional PLS approachmainly because the new approach inducts non-linearcorrelation to PLS model and partly reduces the noisedoverfitting by the dominant factor model.
Considering the physics of LIBS, although the intensityof the characteristic lines may not be accurate enough toreflect the measured element concentration, it still containsthe most-related information for concentration measure-ment. Thus, the characteristic line intensity was firstly takento extract the dominant C concentration. Then, thecorrelation between the residuals and other elementalemission lines were used to model the non-linear inter-element interference effect to further improve the dominantfactor. The residuals of the dominant factor were correctedby PLS using the abundant whole spectral information tocompensate for the imperfectness of the dominant factor andother left deviation factors that were not modeled. Comparedwith the baseline PLS model, RMSEP decreased from 5.52%to 4.47% while R2 remained as high as 0.999, andRMSEC&P was also reduced from 3.60% to 2.92%,showing that the proposed model is more robust in a widerC concentration range because of its physical principle basis.
Acknowledgement The authors acknowledge the financial supportfrom the governmental “863” project (NO. 20091860346) and “973”project (NO. 2010CB227006).
References
1. Bustamante MF, Rinaldi CA, Ferrero JC (2002) Laser inducedbreakdown spectroscopy characterization of Ca in a soil depthprofile. Spectrochim Acta B 57:303–309
2. Maravelaki-Kalaitzaki P, Anglos D, Kilikoglou V, Zafiropulos V(2001) Compositional characterization of encrustation on marblewith laser induced breakdown spectroscopy. Spectrochim Acta B56:887–903
3. Rials TG, Kelley SS, So CL (2002) Use of advanced spectro-scopic techniques for predicting the mechanical properties ofwood composites. Wood Fiber Sci 34:398–407
4. Pandhija S, Rai AK (2008) Laser-induced breakdown spectrosco-py: a versatile tool for monitoring traces in materials. Pramana JPhys 70:553–563
5. Gomba JM, D’Angelo C, Bertuccelli D, Bertuccelli G (2001)Spectroscopic characterization of laser-induced breakdown inaluminum-lithium alloy samples for quantitative determinationof traces. Spectrochim Acta B 56:695–705
6. Lee WB, Wu JY, Lee YI, Sneddon J (2004) Recent applications oflaser-induced breakdown spectrometry: a review of materialapproaches. Appl Spectrosc Rev 39:27–97
7. Li J, Lu J, Lin Z, Gong S, Xie C, Chang L, Yang L, Li P (2009) Effectsof experimental parameters on elemental analysis of coal by laser-induced breakdown spectroscopy. Opt Laser Technol 41:907–913
8. Taschuk MT, Tsui YY, Fedosejevs R (2006) Detection andmapping of latent fingerprints by laser-induced breakdownspectroscopy. Appl Spectrosc 60:1322–1327
9. Beldjilali S, Borivent D, Mercadier L, Mothe E, Clair G, HermannJ (2010) Evaluation of minor element concentrations in potatoesusing laser-induced breakdown spectroscopy. Spectrochim Acta B65:727–733
10. Feng J, Wang Z, Li Z, Ni W (2010) Study to reduce laser-inducedbreakdown spectroscopy measurement uncertainty using plasmacharacteristic parameters. Spectrochim Acta B 65:549–556
11. Zhang L, Dong L, Dou H, Yin W, Jia S (2008) Laser-inducedbreakdown spectroscopy for determination of the organic oxygencontent in anthracite coal under atmospheric conditions. ApplSpectrosc 62:458–463
12. Yin W, Zhang L, Dong L, Ma W, Jia S (2009) Design of a laser-induced breakdown spectroscopy system for on-line quality analysisof pulverized coal in power plants. Appl Spectrosc 63:865–872
13. Wallis FJ, Chadwick BL, Morrison RJS (2000) Analysis of ligniteusing laser-induced breakdown spectroscopy. Appl Spectrosc54:1231–1235
14. Body D, Chadwick BL (2001) Optimization of the spectral dataprocessing in a LIBS simultaneous elemental analysis system.Spectrochim Acta B 56:725–736
15. Blevins LG, Shaddix CR, Sickafoose SM, Walsh PM (2003)Laser-induced breakdown spectroscopy at high temperatures inindustrial boilers and furnaces. Appl Opt 42:6107–6118
16. Ctvrtnickova T, Mateo MP, Yanez A, Nicolas G (2010) Laserinduced breakdown spectroscopy application for ash characteriza-tion for a coal fired power plant. Spectrochim Acta B 65:734–737
17. Ctvrtnickova T, Mateo MP, Yanez A, Nicolas G (2009) Charac-terization of coal fly ash components by laser-induced breakdownspectroscopy. Spectrochim Acta B 64:1093–1097
18. Gaft M, Sapir-Sofer I, Modiano H, Stana R (2007) Laser inducedbreakdown spectroscopy for bulk minerals online analyses.Spectrochim Acta B 62:1496–1503
19. Gaft M, Dvir E, Modiano H, Schone U (2008) Laser inducedbreakdown spectroscopy machine for online ash analyses in coal.Spectrochim Acta B 63:1177–1182
20. Mateo MP, Nicolas G, Yanez A (2007) Characterization ofinorganic species in coal by laser-induced breakdown spectrosco-py using UV and IR radiations. Appl Surf Sci 254:868–872
21. Romero CE, De Saro R, Craparo J, Weisberg A, Moreno R, Yao Z(2010) Laser-induced breakdown spectroscopy for coal characteriza-tion and assessing slagging propensity. Energy Fuels 24:510–517
22. Noda M, Deguchi Y, Iwasaki S, Yoshikawa N (2002) Detection ofcarbon content in a high-temperature and high-pressure environ-ment using laser-induced breakdown spectroscopy. SpectrochimActa B 57:701–709
23. Burakov VS, Tarasenko NV, Nedelko MI, Kononov VA, VasilevNN, Isakov SN (2009) Analysis of lead and sulfur in environ-mental samples by double pulse laser induced breakdownspectroscopy. Spectrochim Acta B 64:141–146
24. Yu L, Lu J, Xie C, Chen W, Wu G, Shen K, Feng W (2005)Analysis of pulverized coal by laser-induced breakdown spectros-copy. Plasma Sci Technol 7:3041–3044
25. Clegg SM, Sklute E, Dyar MD, Barefield JE, Wiens RC (2009)Multivariate analysis of remote laser-induced breakdown spec-troscopy spectra using partial least squares, principal componentanalysis, and related techniques. Spectrochim Acta B 64:79–88
26. Fink H, Panne U, Niessner R (2002) Process analysis of recycledthermoplasts from consumer electronics by laser-induced plasmaspectroscopy. Anal Chem 74:4334–4342
27. Sirven JB, Bousquet B, Canioni L, Sarger L (2006) Laser-induced breakdown spectroscopy of composite samples: com-parison of advanced chemometrics methods. Anal Chem78:1462–1469
J. Feng et al.

28. Amador-Hernandez J, Garcia-Ayuso LE, Fernandez-Romero JM,Luque De Castro MD (2000) Partial least squares regression forproblem solving in precious metal analysis by laser inducedbreakdown spectrometry. J Anal At Spectrom 15:587–593
29. Freedman A, Iannarilli FJ, Wormhoudt JC (2005) Aluminum alloyanalysis using microchip-laser induced breakdown spectroscopy.Spectrochim Acta B 60:1076–1082
30. Braga JWB, Trevizan LC, Nunes LC, Rufini IA, Santos D, KrugFJ (2010) Comparison of univariate and multivariate calibrationfor the determination of micronutrients in pellets of plant materialsby laser induced breakdown spectrometry. Spectrochim Acta B65:66–74
31. Miziolek AW, Palleschi V, Schechter I (2006) Laser inducedbreakdown spectroscopy. Cambridge University Press, Cambridge,UK
32. Wold S, Sjostrom M, Eriksson L (2001) PLS-regression: a basictool of chemometrics. Chemom Intell Lab Syst 58:109–130
33. Wang Z, Feng J, Li L, Ni W, Li Z (2010) A novel multivariatemodel based on dominant factor for laser-induced breakdownspectroscopy measurements, arXiv:1012.2735v1 [physics.optics]
34. Aragon C, Aguilera JA, Penalba F (1999) Improvements inquantitative analysis of steel composition by laser-inducedbreakdown spectroscopy at atmospheric pressure using an infraredNd: YAG laser. Appl Spectrosc 53:1259–1267
A PLS model based on dominant factor for coal analysis