A physical, movable-bed model for non-uniform sediment transport, fluvial erosion and bank failure...
20
Research paper A physical, movable-bed model for non-uniform sediment transport, fluvial erosion and bank failure in rivers Kamal El Kadi Abderrezzak a,b, * , Andres Die Moran a,b , Erik Mosselman c,d , Jean-Pierre Bouchard b , Helmut Habersack e , Denis Aelbrecht f a Universite´Paris-Est, Saint-Venant Laboratory for Hydraulics, ENPC, EDF R&D, CETMEF, 6 quai Watier, 78401 Chatou, France b EDF-R&D, National Laboratory for Hydraulics and Environment, 6 quai Watier, 78401 Chatou, France c Deltares, Rotterdamseweg 185, 2629 HD Delft, The Netherlands d Delft University of Technology, P.O. Box 5, 2600 AA Delft, The Netherlands e University of Natural Resources and Life Sciences, Christian Doppler Laboratory for Advanced Methods in River Monitoring, Modelling and Engineering, Institute of Water Management, Hydrology and Hydraulic Engineering, Muthgasse 107, 1190 Vienna, Austria f EDF, Centre d’Inge´nierie Hydraulique, Savoie Technolac, 73373 Le Bourget du Lac, France Received 20 December 2012; revised 17 September 2013; accepted 18 September 2013 Abstract Sediment transport processes in rivers continue to pose a challenge when designing movable-bed physical models, particularly for reproducing the grain sorting and bank erosion (fluvial erosion and mass failure). This paper presents and discusses scale effects of a specific scaling approach for multi-grain size mixtures that preserves similarity of initial motion for each grain size class and of the bank stability coefficient between the model and the prototype, but relaxes strict similarity of the Shields and particle Reynolds numbers. This approach is appropriate when bed load transport near incipient motion conditions is being studied, and allows for larger grain size scales than when full Shields parameter similarity is enforced. As part of an environmental project to rehabilitate sediment transport through bank erosion, this method has been applied to scale a Froude number criterion physical model of a reach of the Old Rhine (France). This has resulted in an undistorted scale of 40, and the use of sand as the model bank material. Each grain size has a different geometrical scale. The time scale for sediment motion is grain size and flow discharge dependent. An average time scale of 6 has therefore been used (four model hours ¼ one prototype day). A strategy devised for the field case consists of two higher, larger island groynes that replace the three existing groynes, producing bank erosion for flow rates below the mean annual flow rate. Extrapolation of model behaviour to the prototype is not a major problem, but the volume of eroded bank material may be underestimated, mainly because of the relaxation of the Shields number similarity and the apparent cohesive properties of the model bank material. Ó 2013 International Association for Hydro-environment Engineering and Research, Asia Pacific Division. Published by Elsevier B.V. All rights reserved. Keywords: Bank failure; Old Rhine; Physical model; Sediment transport; Scale effects; Similarity 1. Introduction Several approaches can be used for studying fluvial morphology, including fieldwork; theoretical, conceptual and numerical modelling; or experimental and physical models, and each approach has its own advantages and limitations. Physical and numerical models are often combined to provide solutions to practical problems. Numerical models are widely used in engineering applications, especially for large-scale * Corresponding author. EDF-R&D, National Laboratory for Hydraulics and Environment, 6 quai Watier, 78401 Chatou, France. Tel.: þ33 130877911. E-mail addresses: [email protected], elkadi_kamal@ yahoo.fr (K. El Kadi Abderrezzak), [email protected] (A. Die Moran), [email protected] (E. Mosselman), helmut.habersack@ boku.ac.at (H. Habersack), [email protected] (D. Aelbrecht). Please cite this article in press as: El Kadi Abderrezzak, K., et al., A physical, movable-bed model for non-uniform sediment transport, fluvial erosion and bank failure in rivers, Journal of Hydro-environment Research (2013), http://dx.doi.org/10.1016/j.jher.2013.09.004 Available online at www.sciencedirect.com ScienceDirect Journal of Hydro-environment Research xx (2013) 1e20 www.elsevier.com/locate/jher + MODEL 1570-6443/$ - see front matter Ó 2013 International Association for Hydro-environment Engineering and Research, Asia Pacific Division. Published by Elsevier B.V. All rights reserved. http://dx.doi.org/10.1016/j.jher.2013.09.004
-
Upload
independent -
Category
Documents
-
view
3 -
download
0
Transcript of A physical, movable-bed model for non-uniform sediment transport, fluvial erosion and bank failure...
Available online at www.sciencedirect.com
+ MODEL
ScienceDirect
Journal of Hydro-environment Research xx (2013) 1e20www.elsevier.com/locate/jher
Research paper
A physical, movable-bed model for non-uniform sediment transport, fluvialerosion and bank failure in rivers
Kamal El Kadi Abderrezzak a,b,*, Andres Die Moran a,b, Erik Mosselman c,d,Jean-Pierre Bouchard b, Helmut Habersack e, Denis Aelbrecht f
aUniversite Paris-Est, Saint-Venant Laboratory for Hydraulics, ENPC, EDF R&D, CETMEF, 6 quai Watier, 78401 Chatou, FrancebEDF-R&D, National Laboratory for Hydraulics and Environment, 6 quai Watier, 78401 Chatou, France
cDeltares, Rotterdamseweg 185, 2629 HD Delft, The NetherlandsdDelft University of Technology, P.O. Box 5, 2600 AA Delft, The Netherlands
eUniversity of Natural Resources and Life Sciences, Christian Doppler Laboratory for Advanced Methods in River Monitoring, Modelling and Engineering,
Institute of Water Management, Hydrology and Hydraulic Engineering, Muthgasse 107, 1190 Vienna, AustriafEDF, Centre d’Ingenierie Hydraulique, Savoie Technolac, 73373 Le Bourget du Lac, France
Received 20 December 2012; revised 17 September 2013; accepted 18 September 2013
Abstract
Sediment transport processes in rivers continue to pose a challenge when designing movable-bed physical models, particularly for reproducingthe grain sorting and bank erosion (fluvial erosion andmass failure). This paper presents and discusses scale effects of a specific scaling approach formulti-grain size mixtures that preserves similarity of initial motion for each grain size class and of the bank stability coefficient between the modeland the prototype, but relaxes strict similarity of the Shields and particle Reynolds numbers. This approach is appropriate when bed load transportnear incipient motion conditions is being studied, and allows for larger grain size scales than when full Shields parameter similarity is enforced. Aspart of an environmental project to rehabilitate sediment transport through bank erosion, this method has been applied to scale a Froude numbercriterion physical model of a reach of the Old Rhine (France). This has resulted in an undistorted scale of 40, and the use of sand as the model bankmaterial. Each grain size has a different geometrical scale. The time scale for sediment motion is grain size and flow discharge dependent. Anaverage time scale of 6 has therefore been used (four model hours¼ one prototype day). A strategy devised for the field case consists of two higher,larger island groynes that replace the three existing groynes, producing bank erosion for flow rates below themean annual flow rate. Extrapolation ofmodel behaviour to the prototype is not a major problem, but the volume of eroded bank material may be underestimated, mainly because of therelaxation of the Shields number similarity and the apparent cohesive properties of the model bank material.� 2013 International Association for Hydro-environment Engineering and Research, Asia Pacific Division. Published by Elsevier B.V. All rightsreserved.
Keywords: Bank failure; Old Rhine; Physical model; Sediment transport; Scale effects; Similarity
* Corresponding author. EDF-R&D, National Laboratory for Hydraulics and
Environment, 6 quai Watier, 78401 Chatou, France. Tel.: þ33 130877911.
E-mail addresses: [email protected], elkadi_kamal@
yahoo.fr (K. El Kadi Abderrezzak), [email protected] (A. Die
Moran), [email protected] (E. Mosselman), helmut.habersack@
boku.ac.at (H. Habersack), [email protected] (D. Aelbrecht).
Please cite this article in press as: El Kadi Abderrezzak, K., et al., A physical, mov
failure in rivers, Journal of Hydro-environment Research (2013), http://dx.doi.org
1570-6443/$ - see front matter � 2013 International Association for Hydro-environment Engine
http://dx.doi.org/10.1016/j.jher.2013.09.004
1. Introduction
Several approaches can be used for studying fluvialmorphology, including fieldwork; theoretical, conceptual andnumerical modelling; or experimental and physical models,and each approach has its own advantages and limitations.Physical and numerical models are often combined to providesolutions to practical problems. Numerical models are widelyused in engineering applications, especially for large-scale
able-bed model for non-uniform sediment transport, fluvial erosion and bank
/10.1016/j.jher.2013.09.004
ering and Research, Asia Pacific Division. Published by Elsevier B.V. All rights reserved.
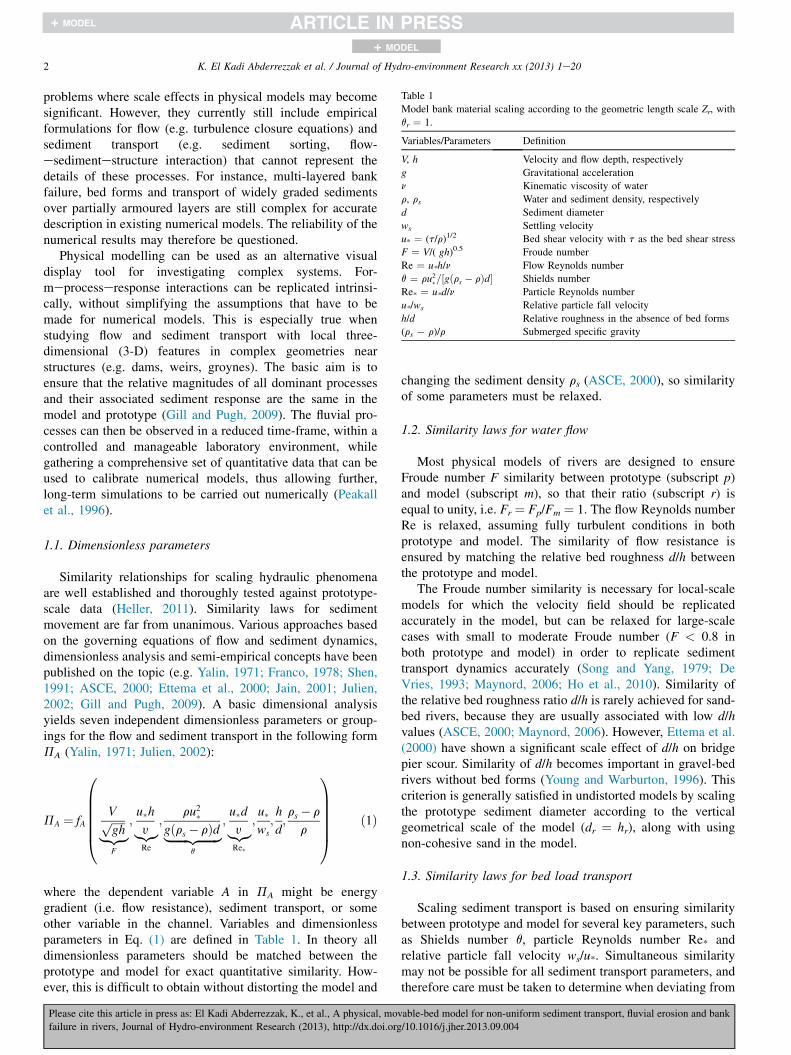
Table 1
Model bank material scaling according to the geometric length scale Zr, with
qr ¼ 1.
Variables/Parameters Definition
V, h Velocity and flow depth, respectively
g Gravitational acceleration
n Kinematic viscosity of water
r, rs Water and sediment density, respectively
d Sediment diameter
ws Settling velocity
u* ¼ (t/r)1/2 Bed shear velocity with t as the bed shear stress
F ¼ V/( gh)0.5 Froude number
Re ¼ u*h/n Flow Reynolds number
q ¼ ru2�=½gðrs � rÞd� Shields number
Re* ¼ u*d/n Particle Reynolds number
u*/ws Relative particle fall velocity
h/d Relative roughness in the absence of bed forms
(rs � r)/r Submerged specific gravity
2 K. El Kadi Abderrezzak et al. / Journal of Hydro-environment Research xx (2013) 1e20
+ MODEL
problems where scale effects in physical models may becomesignificant. However, they currently still include empiricalformulations for flow (e.g. turbulence closure equations) andsediment transport (e.g. sediment sorting, flow-esedimentestructure interaction) that cannot represent thedetails of these processes. For instance, multi-layered bankfailure, bed forms and transport of widely graded sedimentsover partially armoured layers are still complex for accuratedescription in existing numerical models. The reliability of thenumerical results may therefore be questioned.
Physical modelling can be used as an alternative visualdisplay tool for investigating complex systems. For-meprocesseresponse interactions can be replicated intrinsi-cally, without simplifying the assumptions that have to bemade for numerical models. This is especially true whenstudying flow and sediment transport with local three-dimensional (3-D) features in complex geometries nearstructures (e.g. dams, weirs, groynes). The basic aim is toensure that the relative magnitudes of all dominant processesand their associated sediment response are the same in themodel and prototype (Gill and Pugh, 2009). The fluvial pro-cesses can then be observed in a reduced time-frame, within acontrolled and manageable laboratory environment, whilegathering a comprehensive set of quantitative data that can beused to calibrate numerical models, thus allowing further,long-term simulations to be carried out numerically (Peakallet al., 1996).
1.1. Dimensionless parameters
Similarity relationships for scaling hydraulic phenomenaare well established and thoroughly tested against prototype-scale data (Heller, 2011). Similarity laws for sedimentmovement are far from unanimous. Various approaches basedon the governing equations of flow and sediment dynamics,dimensionless analysis and semi-empirical concepts have beenpublished on the topic (e.g. Yalin, 1971; Franco, 1978; Shen,1991; ASCE, 2000; Ettema et al., 2000; Jain, 2001; Julien,2002; Gill and Pugh, 2009). A basic dimensional analysisyields seven independent dimensionless parameters or group-ings for the flow and sediment transport in the following formPA (Yalin, 1971; Julien, 2002):
PA ¼ fA
0BBBBB@
Vffiffiffiffiffigh
p|ffl{zffl}F
;u�hy|{z}Re
;ru2�
gðrs � rÞd|fflfflfflfflfflfflffl{zfflfflfflfflfflfflffl}q
;u�dy|{z}Re�
;u�ws
;h
d;rs � r
r
1CCCCCA ð1Þ
where the dependent variable A in PA might be energygradient (i.e. flow resistance), sediment transport, or someother variable in the channel. Variables and dimensionlessparameters in Eq. (1) are defined in Table 1. In theory alldimensionless parameters should be matched between theprototype and model for exact quantitative similarity. How-ever, this is difficult to obtain without distorting the model and
Please cite this article in press as: El Kadi Abderrezzak, K., et al., A physical, mov
failure in rivers, Journal of Hydro-environment Research (2013), http://dx.doi.org
changing the sediment density rs (ASCE, 2000), so similarityof some parameters must be relaxed.
1.2. Similarity laws for water flow
Most physical models of rivers are designed to ensureFroude number F similarity between prototype (subscript p)and model (subscript m), so that their ratio (subscript r) isequal to unity, i.e. Fr ¼ Fp/Fm ¼ 1. The flow Reynolds numberRe is relaxed, assuming fully turbulent conditions in bothprototype and model. The similarity of flow resistance isensured by matching the relative bed roughness d/h betweenthe prototype and model.
The Froude number similarity is necessary for local-scalemodels for which the velocity field should be replicatedaccurately in the model, but can be relaxed for large-scalecases with small to moderate Froude number (F < 0.8 inboth prototype and model) in order to replicate sedimenttransport dynamics accurately (Song and Yang, 1979; DeVries, 1993; Maynord, 2006; Ho et al., 2010). Similarity ofthe relative bed roughness ratio d/h is rarely achieved for sand-bed rivers, because they are usually associated with low d/hvalues (ASCE, 2000; Maynord, 2006). However, Ettema et al.(2000) have shown a significant scale effect of d/h on bridgepier scour. Similarity of d/h becomes important in gravel-bedrivers without bed forms (Young and Warburton, 1996). Thiscriterion is generally satisfied in undistorted models by scalingthe prototype sediment diameter according to the verticalgeometrical scale of the model (dr ¼ hr), along with usingnon-cohesive sand in the model.
1.3. Similarity laws for bed load transport
Scaling sediment transport is based on ensuring similaritybetween prototype and model for several key parameters, suchas Shields number q, particle Reynolds number Re* andrelative particle fall velocity ws/u*. Simultaneous similaritymay not be possible for all sediment transport parameters, andtherefore care must be taken to determine when deviating from
able-bed model for non-uniform sediment transport, fluvial erosion and bank
/10.1016/j.jher.2013.09.004
3K. El Kadi Abderrezzak et al. / Journal of Hydro-environment Research xx (2013) 1e20
+ MODEL
similarity is acceptable. For instance, the particle Reynoldsnumber Re* can be relaxed when flow is hydrodynamicallyrough in both prototype and model, whereas similarity of ws/u*is generally ignored when the suspended load is notconsidered.
Table 2
Summary of selected studies employing movable-bed physical models. Studies are
Reference Scaling criteria Model charac
Satisfied Relaxed/ignored
Song and Yang (1979) V � S/ws F, d/h, q, qc, Re* Distorted. Un
number exagg
1.9
Parent (1988) F, q, qc d/h, Re* Undistorted. N
mixture (trun
formation)
Young and Warburton (1996) F, q, d/h qc, Re* Undistorted. N
is rough turbu
Healey (1997) F, q d/h, qc, Re* Undistorted. M
Bank failure
Davinroy et al. (1999),
Gaines and Maynord (2001),
Rodgers et al. (2003),
Maynord (2006)
F, d/h, q, qc, Re* Distorted. Lig
(plastic)
Wallerstein et al. (2001) F d/h, q, qc, Re* Distorted. Un
size)
Wei et al. (2001) F, q/qc, B � S/h d/h, q, qc, Re* Distorted and
tested. Unifor
particles (Lap
Woidt et al. (2001) F, q/qc d/h, Re* Undistorted. C
the bank. Fine
Waldron (2005) F, q, qc, Re* d/h Distorted. Lig
(synthetic pla
Marr et al. (2007) F, q d/h, Re*, qc Distorted. Mi
sand
Bennett et al. (2008) F d/h, q, qc, Re* Distorted. San
Bromley (2008) F, q Re*, qc Distorted. Mi
Supercritical
Mefford et al. (2008) F, (q � qc) d/h, q, qc, Re* Undistorted. M
Silt and clay
represented in
Pugh (2008) F, qs/(u*d ), ws d/h, Re*, q, qc Distorted. Un
Weitbrecht and Ruther (2009) F, qc d/h, q, Re* Undistorted. M
Finer fraction
sediments are
grain sizes <
Armanini et al. (2010) F, q, qc d/h, Re* Undistorted. L
(plastics), uni
fractions are
Ho et al. (2010) q, qc, Re* d/h, F Distorted. Lig
(crushed coal
Subcritical flo
Mefford and Gill (2010) F, qs/(u*d ), ws d/h, q, qc, Re* Distorted. Lig
(coal), unifor
Simonett and Weitbrecht (2011) F, q/qc d/h, q, qc, Re* Undistorted. T
of sand and g
are coarsened
<0.2 mm are
Bieri et al. (2012) F d/h, q, qc, Re* Undistorted. N
mixture
Please cite this article in press as: El Kadi Abderrezzak, K., et al., A physical, mov
failure in rivers, Journal of Hydro-environment Research (2013), http://dx.doi.org
The degree of sophistication for movable-bed scalemodelling depends on the particular objectives of the study, onthe experience and skill of the modeller who designs themodel and interprets the data, and on the availability of thespace within the laboratory. Table 2 lists selected studies ofbed load transport, highlighting the similarity criteria which
limited to the bed load process.
teristics Phenomena investigated Model-
prototype
comparison
iform sand. Froude
erated by a factor of
Maintaining of navigation conditions at a
river confluence
Yes
on-uniform sand
cated to avoid ripple
Morphology and sedimentology of pool-
riffle sequences
Yes
atural material. Flow
lent in the model
Morphology and sedimentology in
braided gravel-bed rivers
Yes
ix of sand and gravel.
not reproduced
Evaluation of methods for the mitigation
of embankment (bank) erosion
Yes
htweight particle Design of channel-control alternatives
(dikes, bendway weirs, bank line
changes)
Yes
iform sand (one grain Geomorphic and hydraulic impact of
large woody debris
No
undistorted models are
m sand and lightweight
ili) are tested
Evaluation of bed load and bar formation
following training works
No
ohesive loam soil for
silica sand for the bed
Sedimentation at a pump intake No
htweight particles
stics), uniform size
Efficiency of sediment diversions for
rehabilitating degraded wetlands
No
x of coarse and fine Rate and timing of remobilisation of
stored sediments following dam removal
No
d, uniform particle size Use of in-stream woody vegetation for
restoring meandering pattern
No
x of sand and gravel.
flow
Downstream morphology changes due to
dam removal
Yes
ix of sand and gravel.
material are not
the model
Performance of a high-flow bypass
spillway in improving bed load transport
at a diversion dam structure
No
iform sand Design of channel-control alternatives
for limiting sediment intake at a planned
diversion dam
No
ix of sand and gravel.
s of the model
coarsened, fractions of
0.2 mm are eliminated
Performance of a planned drift wood
retention concept in an expanding river
reach
No
ightweight particles
form particle size. Finer
not reproduced
Design of groynes to improve navigation
condition
No
htweight particles
). Uniform particle size.
w (F < 0.5)
Sediment exclusion at an intake structure No
htweight particles
m size
Evaluation of different restoration works
for creating shallow water habitat along
a stream bend diversion
No
ranscritical flow. Mix
ravel. Finer fractions
, fractions of grain sizes
eliminated
Design and optimisation of training
works for flood defence
No
on-uniform sand Design and optimisation process for
sediment flushing operation
Yes
able-bed model for non-uniform sediment transport, fluvial erosion and bank
/10.1016/j.jher.2013.09.004

4 K. El Kadi Abderrezzak et al. / Journal of Hydro-environment Research xx (2013) 1e20
+ MODEL
are satisfied, relaxed or ignored, the characteristics of thephysical model, the phenomena examined, and whether or notmodel-prototype comparison exists.
The most relevant requirement for physical model studiesof bed load is to preserve the similarity of the sedimentmobility expressed in terms of Shields number q, i.e. qr ¼ qp/qm ¼ 1. Preserving only q is suitable whether the criticalShields number qc is constant within the different stages offlow and sediment transport. This may be not the case undercertain conditions, such as non-uniform sediment transport,variable relative bed roughness ratio and flow regime (laminarand rough turbulent) (Buffington and Montgomery, 1997).
Einstein and Chien (1956) recommended preserving thesimilarity of both q and sediment transport intensity F ¼ qs/[d1.5( gD)1/2] (qs is the volumetric bed load transport per unitwidth and D ¼ (rs � r)/r is the sediment relative mass den-sity). Pugh (2008) recommended the similarity of the dimen-sionless unit sediment discharge qs* ¼ qs/(u*d ). However, forboth the Einstein and Chien (1956) and Pugh (2008) ap-proaches the appropriate sediment transport formula for thecase being modelled must be known.
Kishi et al. (1975) suggested B � S/h and u*/u*c ¼ (q/qc)1/2
similarity criteria (u*c ¼ (tc/r)1/2 is the critical shear velocity
with tc the critical shear stress for incipient sediment motion, Bthe channel width and S the overall bed slope). Wei et al. (2001)showed Kishi et al.’s (1975) approach is suitable whenever theformation of bars is the dominant process to investigate in thescale model. According to Song and Yang (1979), the similarityof the dimensionless unit stream power criterion Pw¼ V� S/ws
should be respected for studying bar formation.The methodology applied at the National Laboratory for
Hydraulics and Environment of EDF R&D (Chauvin, 1962)maintains the similarity of q but also considers the type ofexpected bed forms (plane bed, ripples or dunes) whenselecting the geometric scale. Assuming a unique relationshipbetween the sediment transport intensity F and q, movable-bed models have been designed at WLjDelftHydraulics(currently Deltares) by maintaining similarity of q and flowresistance and relaxing the Froude number criterion(Struiksma and Klaassen, 1986).
Pugh and Dodge (1991) recommended the difference(q � qc) should be the same in the model and prototype,instead of q. This similarity law has been widely used by theWater Resources Research Laboratory of the U.S. Bureau ofReclamation (Mefford, 2005; Mefford et al., 2008). Morerecently, the United States Army Corps of Engineers (USACE)proposed a paradigm justifying the use of extremely small-scale physical models to address river-training issues(Gaines and Maynord, 2001). However, these models ignoreboth Froude and Shields number similarity, and their resultsdeviate much from the reality in the prototype.
1.4. Limitations of the scaling approaches
Applying these principles should not mask the enormouscomplexity that results from scale effects induced by theincomplete fulfilment of a full set of similarity criteria
Please cite this article in press as: El Kadi Abderrezzak, K., et al., A physical, mov
failure in rivers, Journal of Hydro-environment Research (2013), http://dx.doi.org
associated with the problem under consideration. In fact, notall dimensionless parameters incorporating grain size can bemodelled correctly at the same time (Julien, 2002). Scalingeffects are reasonably understood for fixed-bed models(Heller, 2011). On the contrary, they are not so well under-stood for movable-bed physical model. Examples includescales effects due to the characteristics of the particles used toreproduce the prototype bed material, the distortion ofroughness due to eventual bed forms, the presence of sus-pension while the dominant transport mode in the prototype isbed load, and the incorrect estimate of the sediment time scale(Jaeggi, 1986; Ettema et al., 2000).
Most of the above methods have been developed for scalingphysical models under the implicit assumption that the pro-totype bed material is uniform. When this assumption is notjustified, the modelling becomes even more complicated, sincequestions arise concerning the reproduction of the sedimentmixture size distribution in the physical model. Moreover,these methods are not suitable when investigating bank erosionprocesses through fluvial erosion and mass failure. Comparedwith fluvial erosion, mass failure mechanisms are discontin-uous (Rinaldi and Darby, 2007). Bank stability analysis istherefore essential and the factor of stability, defined as theratio between resisting and driving forces, should be main-tained between prototype and model.
1.5. Objectives of the present work
The purpose of this research is to present and discuss aspecific approach for scaling physical models where non-uniform sediment transport and bank erosion (i.e. fluvialerosion and mass failure) are considered to be the dominantprocesses. This study is included in an environmental projectaiming at feeding sediments in the Old Rhine (France)downstream of the Kembs dam by initiating bank erosion. Apilot site has been selected to guide the rehabilitation work,and a movable-bed physical model is used as the primaryresearch tool to find the best way of promoting bank erosion.
The remainder of the paper is organised as follows. Section2 presents the case study, including a brief background to theproject and the selected pilot site. In Section 3, the scalingtheory is detailed. The model construction and data acquisitionare presented in Section 4. The best strategy to promote bankerosion is presented in Section 5. The discussion in Section 6is followed by conclusions in Section 7.
2. Case study: the Old Rhine
2.1. Background
The 50 km reach of the River Rhine between the towns ofVillage-Neuf (France) and Breisach (Germany) is divided intotwo watercourses: the Grand Canal d’Alsace (GCA) which is aconcrete-bed navigation canal, and the Old Rhine which is astable, cobble-bed river channel with protected banks (Fig. 1).This configuration is the result of engineering works carried outfrom the 19th century (e.g. channelisation, in-stream structures)
able-bed model for non-uniform sediment transport, fluvial erosion and bank
/10.1016/j.jher.2013.09.004
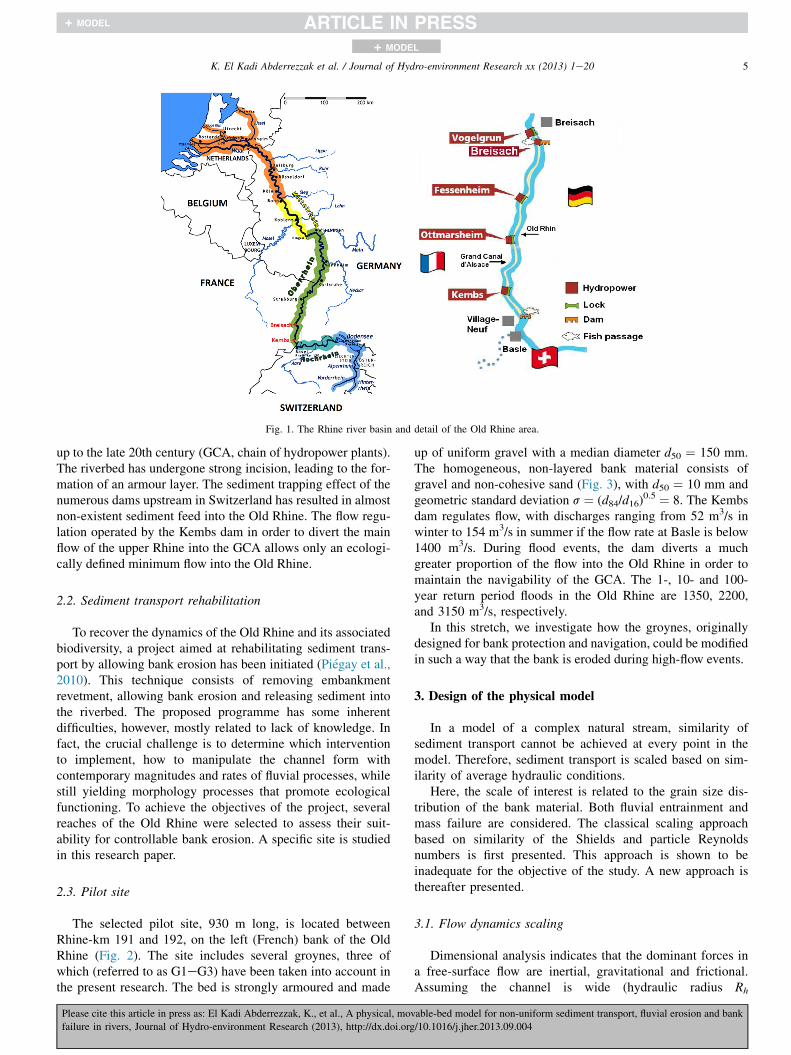
Fig. 1. The Rhine river basin and detail of the Old Rhine area.
5K. El Kadi Abderrezzak et al. / Journal of Hydro-environment Research xx (2013) 1e20
+ MODEL
up to the late 20th century (GCA, chain of hydropower plants).The riverbed has undergone strong incision, leading to the for-mation of an armour layer. The sediment trapping effect of thenumerous dams upstream in Switzerland has resulted in almostnon-existent sediment feed into the Old Rhine. The flow regu-lation operated by the Kembs dam in order to divert the mainflow of the upper Rhine into the GCA allows only an ecologi-cally defined minimum flow into the Old Rhine.
2.2. Sediment transport rehabilitation
To recover the dynamics of the Old Rhine and its associatedbiodiversity, a project aimed at rehabilitating sediment trans-port by allowing bank erosion has been initiated (Piegay et al.,2010). This technique consists of removing embankmentrevetment, allowing bank erosion and releasing sediment intothe riverbed. The proposed programme has some inherentdifficulties, however, mostly related to lack of knowledge. Infact, the crucial challenge is to determine which interventionto implement, how to manipulate the channel form withcontemporary magnitudes and rates of fluvial processes, whilestill yielding morphology processes that promote ecologicalfunctioning. To achieve the objectives of the project, severalreaches of the Old Rhine were selected to assess their suit-ability for controllable bank erosion. A specific site is studiedin this research paper.
2.3. Pilot site
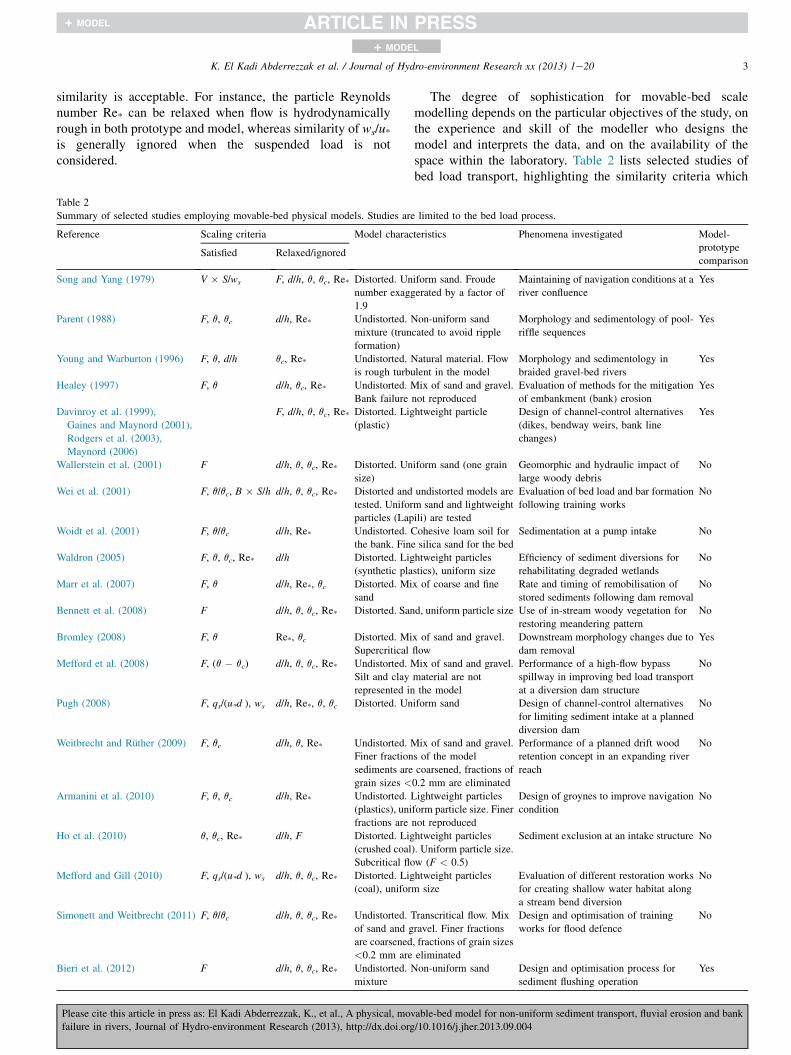
The selected pilot site, 930 m long, is located betweenRhine-km 191 and 192, on the left (French) bank of the OldRhine (Fig. 2). The site includes several groynes, three ofwhich (referred to as G1eG3) have been taken into account inthe present research. The bed is strongly armoured and made
Please cite this article in press as: El Kadi Abderrezzak, K., et al., A physical, mov
failure in rivers, Journal of Hydro-environment Research (2013), http://dx.doi.org
up of uniform gravel with a median diameter d50 ¼ 150 mm.The homogeneous, non-layered bank material consists ofgravel and non-cohesive sand (Fig. 3), with d50 ¼ 10 mm andgeometric standard deviation s ¼ (d84/d16)
0.5 ¼ 8. The Kembsdam regulates flow, with discharges ranging from 52 m3/s inwinter to 154 m3/s in summer if the flow rate at Basle is below1400 m3/s. During flood events, the dam diverts a muchgreater proportion of the flow into the Old Rhine in order tomaintain the navigability of the GCA. The 1-, 10- and 100-year return period floods in the Old Rhine are 1350, 2200,and 3150 m3/s, respectively.
In this stretch, we investigate how the groynes, originallydesigned for bank protection and navigation, could be modifiedin such a way that the bank is eroded during high-flow events.
3. Design of the physical model
In a model of a complex natural stream, similarity ofsediment transport cannot be achieved at every point in themodel. Therefore, sediment transport is scaled based on sim-ilarity of average hydraulic conditions.
Here, the scale of interest is related to the grain size dis-tribution of the bank material. Both fluvial entrainment andmass failure are considered. The classical scaling approachbased on similarity of the Shields and particle Reynoldsnumbers is first presented. This approach is shown to beinadequate for the objective of the study. A new approach isthereafter presented.
3.1. Flow dynamics scaling
Dimensional analysis indicates that the dominant forces ina free-surface flow are inertial, gravitational and frictional.Assuming the channel is wide (hydraulic radius Rh
able-bed model for non-uniform sediment transport, fluvial erosion and bank
/10.1016/j.jher.2013.09.004
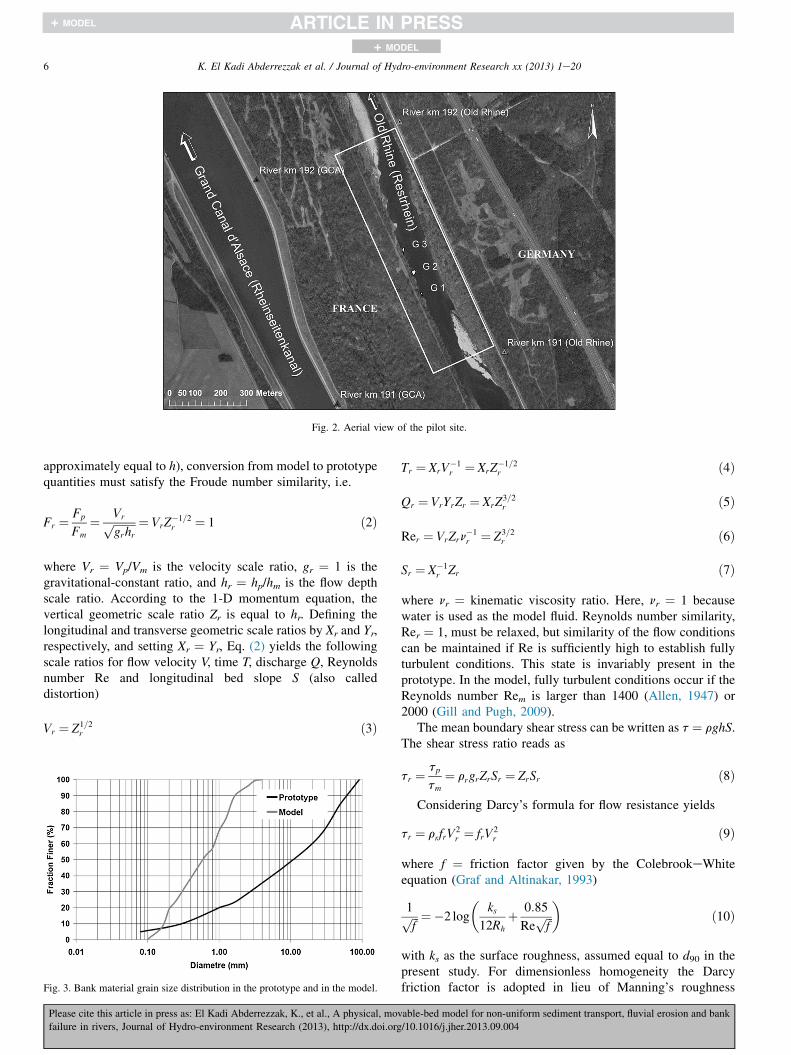
Fig. 2. Aerial view of the pilot site.
6 K. El Kadi Abderrezzak et al. / Journal of Hydro-environment Research xx (2013) 1e20
+ MODEL
approximately equal to h), conversion from model to prototypequantities must satisfy the Froude number similarity, i.e.
Fr ¼ Fp
Fm
¼ Vrffiffiffiffiffiffiffiffigrhr
p ¼ VrZ�1=2r ¼ 1 ð2Þ
where Vr ¼ Vp/Vm is the velocity scale ratio, gr ¼ 1 is thegravitational-constant ratio, and hr ¼ hp/hm is the flow depthscale ratio. According to the 1-D momentum equation, thevertical geometric scale ratio Zr is equal to hr. Defining thelongitudinal and transverse geometric scale ratios by Xr and Yr,respectively, and setting Xr ¼ Yr, Eq. (2) yields the followingscale ratios for flow velocity V, time T, discharge Q, Reynoldsnumber Re and longitudinal bed slope S (also calleddistortion)
Vr ¼ Z1=2r ð3Þ
Fig. 3. Bank material grain size distribution in the prototype and in the model.
Please cite this article in press as: El Kadi Abderrezzak, K., et al., A physical, mov
failure in rivers, Journal of Hydro-environment Research (2013), http://dx.doi.org
Tr ¼ XrV�1r ¼ XrZ
�1=2r ð4Þ
Qr ¼ VrYrZr ¼ XrZ3=2r ð5Þ
Rer ¼ VrZrn�1r ¼ Z3=2
r ð6Þ
Sr ¼ X�1r Zr ð7Þ
where nr ¼ kinematic viscosity ratio. Here, nr ¼ 1 becausewater is used as the model fluid. Reynolds number similarity,Rer ¼ 1, must be relaxed, but similarity of the flow conditionscan be maintained if Re is sufficiently high to establish fullyturbulent conditions. This state is invariably present in theprototype. In the model, fully turbulent conditions occur if theReynolds number Rem is larger than 1400 (Allen, 1947) or2000 (Gill and Pugh, 2009).
The mean boundary shear stress can be written as t ¼ rghS.The shear stress ratio reads as
tr ¼ tp
tm¼ rrgrZrSr ¼ ZrSr ð8Þ
Considering Darcy’s formula for flow resistance yields
tr ¼ rrfrV2r ¼ frV
2r ð9Þ
where f ¼ friction factor given by the ColebrookeWhiteequation (Graf and Altinakar, 1993)
1ffiffiffif
p ¼�2 log
�ks
12Rh
þ 0:85
Reffiffiffif
p�
ð10Þ
with ks as the surface roughness, assumed equal to d90 in thepresent study. For dimensionless homogeneity the Darcyfriction factor is adopted in lieu of Manning’s roughness
able-bed model for non-uniform sediment transport, fluvial erosion and bank
/10.1016/j.jher.2013.09.004
7K. El Kadi Abderrezzak et al. / Journal of Hydro-environment Research xx (2013) 1e20
+ MODEL
coefficient. Equation (10) is valid for laminar and turbulentflows in rivers without bed forms. Assuming fully turbulentflow conditions, f can be approximated as (Graf and Altinakar,1993)ffiffiffi
8
f
s¼ 26ffiffiffi
gp
�h
d90
�1=6
ð11Þ
The ratio for the friction coefficient takes the form
fr ¼�d90rZr
�1=3
ð12Þ
Substituting Eq. (12) into Eq. (9), equating Eqs. (8) and (9)and using Eq. (3) yields the grain size ratio
d90r ¼ ZrS3r ð13Þ
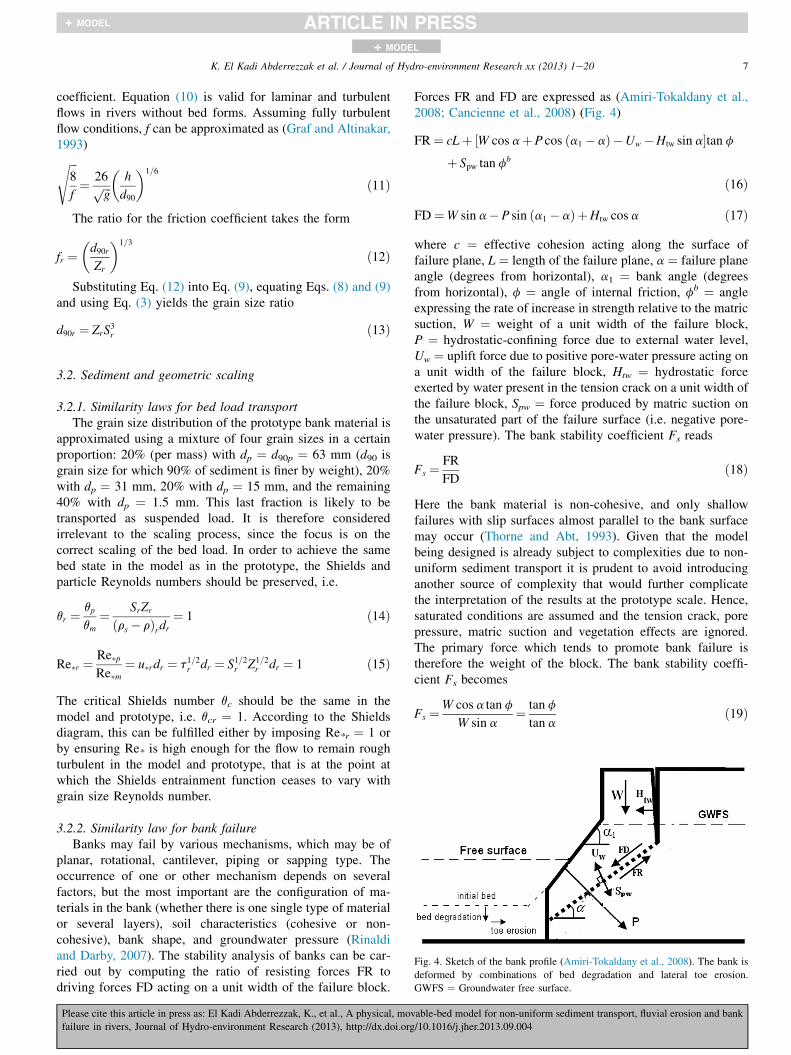
Fig. 4. Sketch of the bank profile (Amiri-Tokaldany et al., 2008). The bank is
deformed by combinations of bed degradation and lateral toe erosion.
GWFS ¼ Groundwater free surface.
3.2. Sediment and geometric scaling
3.2.1. Similarity laws for bed load transportThe grain size distribution of the prototype bank material is
approximated using a mixture of four grain sizes in a certainproportion: 20% (per mass) with dp ¼ d90p ¼ 63 mm (d90 isgrain size for which 90% of sediment is finer by weight), 20%with dp ¼ 31 mm, 20% with dp ¼ 15 mm, and the remaining40% with dp ¼ 1.5 mm. This last fraction is likely to betransported as suspended load. It is therefore consideredirrelevant to the scaling process, since the focus is on thecorrect scaling of the bed load. In order to achieve the samebed state in the model as in the prototype, the Shields andparticle Reynolds numbers should be preserved, i.e.
qr ¼ qp
qm¼ SrZr
ðrs � rÞrdr¼ 1 ð14Þ
Re�r ¼ Re�pRe�m
¼ u�rdr ¼ t1=2r dr ¼ S1=2r Z1=2r dr ¼ 1 ð15Þ
The critical Shields number qc should be the same in themodel and prototype, i.e. qcr ¼ 1. According to the Shieldsdiagram, this can be fulfilled either by imposing Re*r ¼ 1 orby ensuring Re* is high enough for the flow to remain roughturbulent in the model and prototype, that is at the point atwhich the Shields entrainment function ceases to vary withgrain size Reynolds number.
3.2.2. Similarity law for bank failureBanks may fail by various mechanisms, which may be of
planar, rotational, cantilever, piping or sapping type. Theoccurrence of one or other mechanism depends on severalfactors, but the most important are the configuration of ma-terials in the bank (whether there is one single type of materialor several layers), soil characteristics (cohesive or non-cohesive), bank shape, and groundwater pressure (Rinaldiand Darby, 2007). The stability analysis of banks can be car-ried out by computing the ratio of resisting forces FR todriving forces FD acting on a unit width of the failure block.
Please cite this article in press as: El Kadi Abderrezzak, K., et al., A physical, mov
failure in rivers, Journal of Hydro-environment Research (2013), http://dx.doi.org
Forces FR and FD are expressed as (Amiri-Tokaldany et al.,2008; Cancienne et al., 2008) (Fig. 4)
FR¼ cLþ ½W cos aþP cos ða1 � aÞ �Uw �Htw sin a�tan fþ Spw tan f
b
ð16Þ
FD¼W sin a�P sin ða1 � aÞ þHtw cos a ð17Þ
where c ¼ effective cohesion acting along the surface offailure plane, L ¼ length of the failure plane, a ¼ failure planeangle (degrees from horizontal), a1 ¼ bank angle (degreesfrom horizontal), f ¼ angle of internal friction, fb ¼ angleexpressing the rate of increase in strength relative to the matricsuction, W ¼ weight of a unit width of the failure block,P ¼ hydrostatic-confining force due to external water level,Uw ¼ uplift force due to positive pore-water pressure acting ona unit width of the failure block, Htw ¼ hydrostatic forceexerted by water present in the tension crack on a unit width ofthe failure block, Spw ¼ force produced by matric suction onthe unsaturated part of the failure surface (i.e. negative pore-water pressure). The bank stability coefficient Fs reads
Fs ¼ FR
FDð18Þ
Here the bank material is non-cohesive, and only shallowfailures with slip surfaces almost parallel to the bank surfacemay occur (Thorne and Abt, 1993). Given that the modelbeing designed is already subject to complexities due to non-uniform sediment transport it is prudent to avoid introducinganother source of complexity that would further complicatethe interpretation of the results at the prototype scale. Hence,saturated conditions are assumed and the tension crack, porepressure, matric suction and vegetation effects are ignored.The primary force which tends to promote bank failure istherefore the weight of the block. The bank stability coeffi-cient Fs becomes
Fs ¼W cos a tan f
W sin a¼ tan f
tan að19Þ
able-bed model for non-uniform sediment transport, fluvial erosion and bank
/10.1016/j.jher.2013.09.004
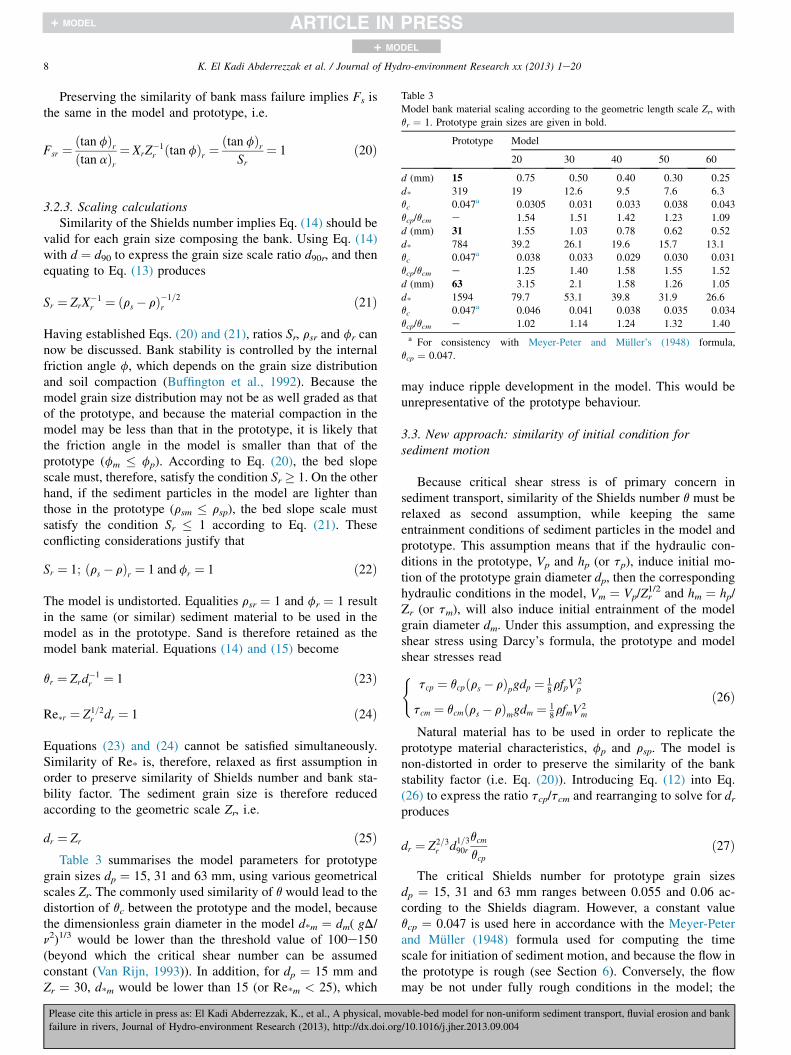
Table 3
Model bank material scaling according to the geometric length scale Zr, with
qr ¼ 1. Prototype grain sizes are given in bold.
Prototype Model
20 30 40 50 60
d (mm) 15 0.75 0.50 0.40 0.30 0.25
d* 319 19 12.6 9.5 7.6 6.3
qc 0.047a 0.0305 0.031 0.033 0.038 0.043
qcp/qcm e 1.54 1.51 1.42 1.23 1.09
d (mm) 31 1.55 1.03 0.78 0.62 0.52
d* 784 39.2 26.1 19.6 15.7 13.1
qc 0.047a 0.038 0.033 0.029 0.030 0.031
qcp/qcm e 1.25 1.40 1.58 1.55 1.52
d (mm) 63 3.15 2.1 1.58 1.26 1.05
d* 1594 79.7 53.1 39.8 31.9 26.6
qc 0.047a 0.046 0.041 0.038 0.035 0.034
qcp/qcm e 1.02 1.14 1.24 1.32 1.40
a For consistency with Meyer-Peter and Muller’s (1948) formula,
qcp ¼ 0.047.
8 K. El Kadi Abderrezzak et al. / Journal of Hydro-environment Research xx (2013) 1e20
+ MODEL
Preserving the similarity of bank mass failure implies Fs isthe same in the model and prototype, i.e.
Fsr ¼ ðtan fÞrðtan aÞr
¼ XrZ�1r ðtan fÞr ¼
ðtan fÞrSr
¼ 1 ð20Þ
3.2.3. Scaling calculationsSimilarity of the Shields number implies Eq. (14) should be
valid for each grain size composing the bank. Using Eq. (14)with d ¼ d90 to express the grain size scale ratio d90r, and thenequating to Eq. (13) produces
Sr ¼ ZrX�1r ¼ ðrs � rÞ�1=2
r ð21Þ
Having established Eqs. (20) and (21), ratios Sr, rsr and fr cannow be discussed. Bank stability is controlled by the internalfriction angle f, which depends on the grain size distributionand soil compaction (Buffington et al., 1992). Because themodel grain size distribution may not be as well graded as thatof the prototype, and because the material compaction in themodel may be less than that in the prototype, it is likely thatthe friction angle in the model is smaller than that of theprototype (fm � fp). According to Eq. (20), the bed slopescale must, therefore, satisfy the condition Sr � 1. On the otherhand, if the sediment particles in the model are lighter thanthose in the prototype (rsm � rsp), the bed slope scale mustsatisfy the condition Sr � 1 according to Eq. (21). Theseconflicting considerations justify that
Sr ¼ 1; ðrs � rÞr ¼ 1 and fr ¼ 1 ð22Þ
The model is undistorted. Equalities rsr ¼ 1 and fr ¼ 1 resultin the same (or similar) sediment material to be used in themodel as in the prototype. Sand is therefore retained as themodel bank material. Equations (14) and (15) become
qr ¼ Zrd�1r ¼ 1 ð23Þ
Re�r ¼ Z1=2r dr ¼ 1 ð24Þ
Equations (23) and (24) cannot be satisfied simultaneously.Similarity of Re* is, therefore, relaxed as first assumption inorder to preserve similarity of Shields number and bank sta-bility factor. The sediment grain size is therefore reducedaccording to the geometric scale Zr, i.e.
dr ¼ Zr ð25ÞTable 3 summarises the model parameters for prototype
grain sizes dp ¼ 15, 31 and 63 mm, using various geometricalscales Zr. The commonly used similarity of q would lead to thedistortion of qc between the prototype and the model, becausethe dimensionless grain diameter in the model d*m ¼ dm( gD/n2)1/3 would be lower than the threshold value of 100e150(beyond which the critical shear number can be assumedconstant (Van Rijn, 1993)). In addition, for dp ¼ 15 mm andZr ¼ 30, d*m would be lower than 15 (or Re*m < 25), which
Please cite this article in press as: El Kadi Abderrezzak, K., et al., A physical, mov
failure in rivers, Journal of Hydro-environment Research (2013), http://dx.doi.org
may induce ripple development in the model. This would beunrepresentative of the prototype behaviour.
3.3. New approach: similarity of initial condition forsediment motion
Because critical shear stress is of primary concern insediment transport, similarity of the Shields number q must berelaxed as second assumption, while keeping the sameentrainment conditions of sediment particles in the model andprototype. This assumption means that if the hydraulic con-ditions in the prototype, Vp and hp (or tp), induce initial mo-tion of the prototype grain diameter dp, then the correspondinghydraulic conditions in the model, Vm ¼ Vp/Zr
1/2 and hm ¼ hp/Zr (or tm), will also induce initial entrainment of the modelgrain diameter dm. Under this assumption, and expressing theshear stress using Darcy’s formula, the prototype and modelshear stresses read(
tcp ¼ qcpðrs � rÞpgdp ¼ 18rfpV
2p
tcm ¼ qcmðrs � rÞmgdm ¼ 18rfmV
2m
ð26Þ
Natural material has to be used in order to replicate theprototype material characteristics, fp and rsp. The model isnon-distorted in order to preserve the similarity of the bankstability factor (i.e. Eq. (20)). Introducing Eq. (12) into Eq.(26) to express the ratio tcp/tcm and rearranging to solve for drproduces
dr ¼ Z2=3r d
1=390r
qcm
qcpð27Þ
The critical Shields number for prototype grain sizesdp ¼ 15, 31 and 63 mm ranges between 0.055 and 0.06 ac-cording to the Shields diagram. However, a constant valueqcp ¼ 0.047 is used here in accordance with the Meyer-Peterand Muller (1948) formula used for computing the timescale for initiation of sediment motion, and because the flow inthe prototype is rough (see Section 6). Conversely, the flowmay be not under fully rough conditions in the model; the
able-bed model for non-uniform sediment transport, fluvial erosion and bank
/10.1016/j.jher.2013.09.004
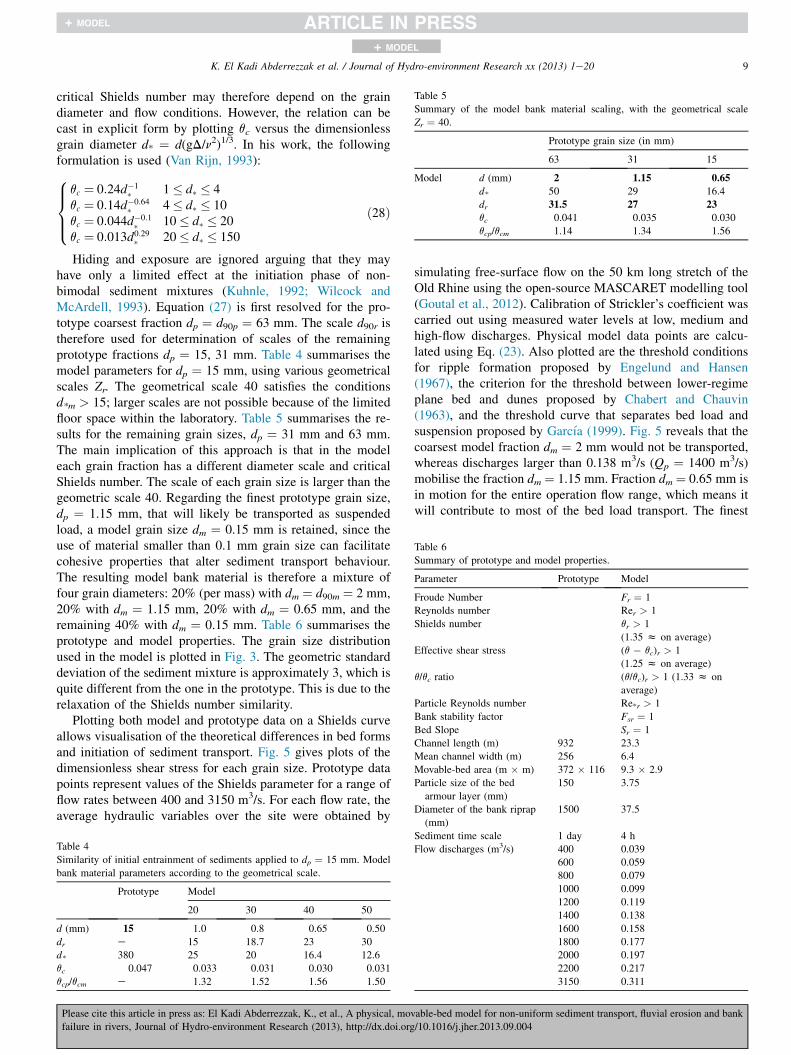
Table 5
Summary of the model bank material scaling, with the geometrical scale
Zr ¼ 40.
Prototype grain size (in mm)
63 31 15
Model d (mm) 2 1.15 0.65
d* 50 29 16.4
dr 31.5 27 23
qc 0.041 0.035 0.030
qcp/qcm 1.14 1.34 1.56
Table 6
Summary of prototype and model properties.
Parameter Prototype Model
Froude Number Fr ¼ 1
Reynolds number Rer > 1
Shields number qr > 1
(1.35 z on average)
Effective shear stress (q � qc)r > 1
(1.25 z on average)
q/qc ratio (q/qc)r > 1 (1.33 z on
average)
Particle Reynolds number Re*r > 1
Bank stability factor Fsr ¼ 1
Bed Slope Sr ¼ 1
Channel length (m) 932 23.3
Mean channel width (m) 256 6.4
Movable-bed area (m � m) 372 � 116 9.3 � 2.9
Particle size of the bed
armour layer (mm)
150 3.75
Diameter of the bank riprap
(mm)
1500 37.5
9K. El Kadi Abderrezzak et al. / Journal of Hydro-environment Research xx (2013) 1e20
+ MODEL
critical Shields number may therefore depend on the graindiameter and flow conditions. However, the relation can becast in explicit form by plotting qc versus the dimensionlessgrain diameter d* ¼ d(gD/n2)1/3. In his work, the followingformulation is used (Van Rijn, 1993):8>><>>:
qc ¼ 0:24d�1� 1� d� � 4
qc ¼ 0:14d�0:64� 4� d� � 10
qc ¼ 0:044d�0:1� 10� d� � 20
qc ¼ 0:013d0:29� 20� d� � 150
ð28Þ
Hiding and exposure are ignored arguing that they mayhave only a limited effect at the initiation phase of non-bimodal sediment mixtures (Kuhnle, 1992; Wilcock andMcArdell, 1993). Equation (27) is first resolved for the pro-totype coarsest fraction dp ¼ d90p ¼ 63 mm. The scale d90r istherefore used for determination of scales of the remainingprototype fractions dp ¼ 15, 31 mm. Table 4 summarises themodel parameters for dp ¼ 15 mm, using various geometricalscales Zr. The geometrical scale 40 satisfies the conditionsd*m > 15; larger scales are not possible because of the limitedfloor space within the laboratory. Table 5 summarises the re-sults for the remaining grain sizes, dp ¼ 31 mm and 63 mm.The main implication of this approach is that in the modeleach grain fraction has a different diameter scale and criticalShields number. The scale of each grain size is larger than thegeometric scale 40. Regarding the finest prototype grain size,dp ¼ 1.15 mm, that will likely be transported as suspendedload, a model grain size dm ¼ 0.15 mm is retained, since theuse of material smaller than 0.1 mm grain size can facilitatecohesive properties that alter sediment transport behaviour.The resulting model bank material is therefore a mixture offour grain diameters: 20% (per mass) with dm ¼ d90m ¼ 2 mm,20% with dm ¼ 1.15 mm, 20% with dm ¼ 0.65 mm, and theremaining 40% with dm ¼ 0.15 mm. Table 6 summarises theprototype and model properties. The grain size distributionused in the model is plotted in Fig. 3. The geometric standarddeviation of the sediment mixture is approximately 3, which isquite different from the one in the prototype. This is due to therelaxation of the Shields number similarity.
Plotting both model and prototype data on a Shields curveallows visualisation of the theoretical differences in bed formsand initiation of sediment transport. Fig. 5 gives plots of thedimensionless shear stress for each grain size. Prototype datapoints represent values of the Shields parameter for a range offlow rates between 400 and 3150 m3/s. For each flow rate, theaverage hydraulic variables over the site were obtained by
Table 4
Similarity of initial entrainment of sediments applied to dp ¼ 15 mm. Model
bank material parameters according to the geometrical scale.
Prototype Model
20 30 40 50
d (mm) 15 1.0 0.8 0.65 0.50
dr e 15 18.7 23 30
d* 380 25 20 16.4 12.6
qc 0.047 0.033 0.031 0.030 0.031
qcp/qcm e 1.32 1.52 1.56 1.50
Please cite this article in press as: El Kadi Abderrezzak, K., et al., A physical, mov
failure in rivers, Journal of Hydro-environment Research (2013), http://dx.doi.org
simulating free-surface flow on the 50 km long stretch of theOld Rhine using the open-source MASCARET modelling tool(Goutal et al., 2012). Calibration of Strickler’s coefficient wascarried out using measured water levels at low, medium andhigh-flow discharges. Physical model data points are calcu-lated using Eq. (23). Also plotted are the threshold conditionsfor ripple formation proposed by Engelund and Hansen(1967), the criterion for the threshold between lower-regimeplane bed and dunes proposed by Chabert and Chauvin(1963), and the threshold curve that separates bed load andsuspension proposed by Garcıa (1999). Fig. 5 reveals that thecoarsest model fraction dm ¼ 2 mm would not be transported,whereas discharges larger than 0.138 m3/s (Qp ¼ 1400 m3/s)mobilise the fraction dm ¼ 1.15 mm. Fraction dm ¼ 0.65 mm isin motion for the entire operation flow range, which means itwill contribute to most of the bed load transport. The finest
Sediment time scale 1 day 4 h
Flow discharges (m3/s) 400 0.039
600 0.059
800 0.079
1000 0.099
1200 0.119
1400 0.138
1600 0.158
1800 0.177
2000 0.197
2200 0.217
3150 0.311
able-bed model for non-uniform sediment transport, fluvial erosion and bank
/10.1016/j.jher.2013.09.004
Fig. 5. Prototype and model values of Shields parameter over a range of flow
discharges. Also shown are the threshold condition for ripple formation pro-
posed by Engelund and Hansen (1967) and that between plane bed and dunes
proposed by Chabert and Chauvin (1963). Curves proposed by Bagnold
(1966), Van Rijn (1984) and Garcıa (1999) are three different criteria for
the threshold between bed load and suspension.
10 K. El Kadi Abderrezzak et al. / Journal of Hydro-environment Research xx (2013) 1e20
+ MODEL
fraction dm ¼ 0.15 mm should be transported in suspension,although the Shields values for the corresponding prototypediameter dp ¼ 1.15 mm are under the suspension limit ac-cording to Garcıa’s (1999) criterion. Nevertheless, deter-mining the flow condition at which initiation of sedimentsuspension occurs is difficult (Cheng and Chiew, 1999). Somecriteria have been proposed assuming that suspension occurswhen the upward velocity is higher than the settling velocityof the sediment particle. Some authors consider transport assuspension when the saltation length is high enough for par-ticles to be often out of contact with the bottom. Two specificthreshold curves proposed by Bagnold (1966) and Van Rijn(1984), respectively, are plotted in Fig. 5, showing that theprototype fraction dp ¼ 1.15 mm would be transported insuspension, similarly to its corresponding model diameter.
3.4. Time scale for sediment transport
Fig. 6. Time scale for grain motion for a range of flow rates
0.0395 < Qm < 0.311 m3/s (400 < Qp < 3150 m3/s).
In general, the time scale for sediment transport Tsr shouldbe estimated during model calibration by comparing the timeneeded to obtain the same well-defined bed morphologicalfeatures in prototype and model. In the present study, no fieldmeasurements could be made. Therefore, Tsr is derived theo-retically from the Exner equation as
Tsr ¼ XrZr
qsr¼ Z2
r
qsrð29Þ
Shen (1971) recommended scaling bed load for sand- andgravel-dominated systems using Meyer-Peter and Muller(1948). The time scale for grain motion is calculated for arange of hydraulic conditions and for each grain size class. Forsake of comparison, Tsr is calculated assuming the sedimentmixture is represented by the arithmetic mean diameter. Theprototype and model material bed load have mean diametersof 25 mm and 0.94 mm, respectively. Results are shown inFig. 6. The coarsest fraction dm ¼ 2 mm (dp ¼ 63 mm) is not
Please cite this article in press as: El Kadi Abderrezzak, K., et al., A physical, mov
failure in rivers, Journal of Hydro-environment Research (2013), http://dx.doi.org
in motion under the selected flow rates. For dm ¼ 1.15 mm(dp ¼ 31 mm), Tsr changes by 45% when Qm changes from0.0395 m3/s to 0.311 m3/s (400 < Qp < 3150 m3/s). Fordm ¼ 0.65 mm (dp ¼ 15 mm), Tsr changes by 20% when Qm
changes from 0395 m3/s to 0.311 m3/s. However, Tsr varieslittle when the flow rate is sufficiently larger than the criticalflow for grain motion. In fact, ignoring the sediment time scalecorresponding to Qm ¼ 0.0395 m3/s (Qp ¼ 400 m3/s) anddm ¼ 0.65 mm as well as the sediment scale corresponding toQm ¼ 0.138 m3/s (Qp ¼ 1400 m3/s) and dm ¼ 1.15 mm, theaverage relative variation becomes lower than 5%. A globalsediment time scale is calculated as the average of the grainmotion time scales obtained for dm ¼ 0.65 mm and 1.15 mmand for Qm between 0.0395 and 0.311 m3/s(400 < Qp < 3150 m3/s). The average time scale is thus 6.22.This value is comparable to the one calculated using the meandiameter of the mixture (Tsr ¼ 6.29). It is of great importancethat Tsr is not much different from the time scale governing theflow Tr ¼ Zr
0.5 ¼ 6.32. For sake of simplicity, Tsr ¼ 6 isretained, i.e. 4 h of model testing would represent one proto-type day.
4. Model construction, operation and data collection
4.1. Model construction
The model is 23.3 m long and 6.4 m wide (Fig. 7, Table 6).A series of twelve cross-sections measured in 2009 was usedto reproduce the geometry of the pilot site. The elevations andtheir spacing along each cross-section were scaled, plotted,and transferred to steel sheets, which were then cut to createthe bed topography at the actual model size. The model wasfilled with a coarser material layer, except for a movable-bedarea 9.3 m long and 2.9 m wide (representing an area of372 m by 116 m at prototype scale) that included the threegroynes and surrounding bank and bed surfaces. A thin con-crete layer, with sediments of 3.75 mm in diameter (1/40 ofthe grain size of the armour layer) glued to it, was placed overthe rigid bed. The model bank sediment was a mixture of the
able-bed model for non-uniform sediment transport, fluvial erosion and bank
/10.1016/j.jher.2013.09.004
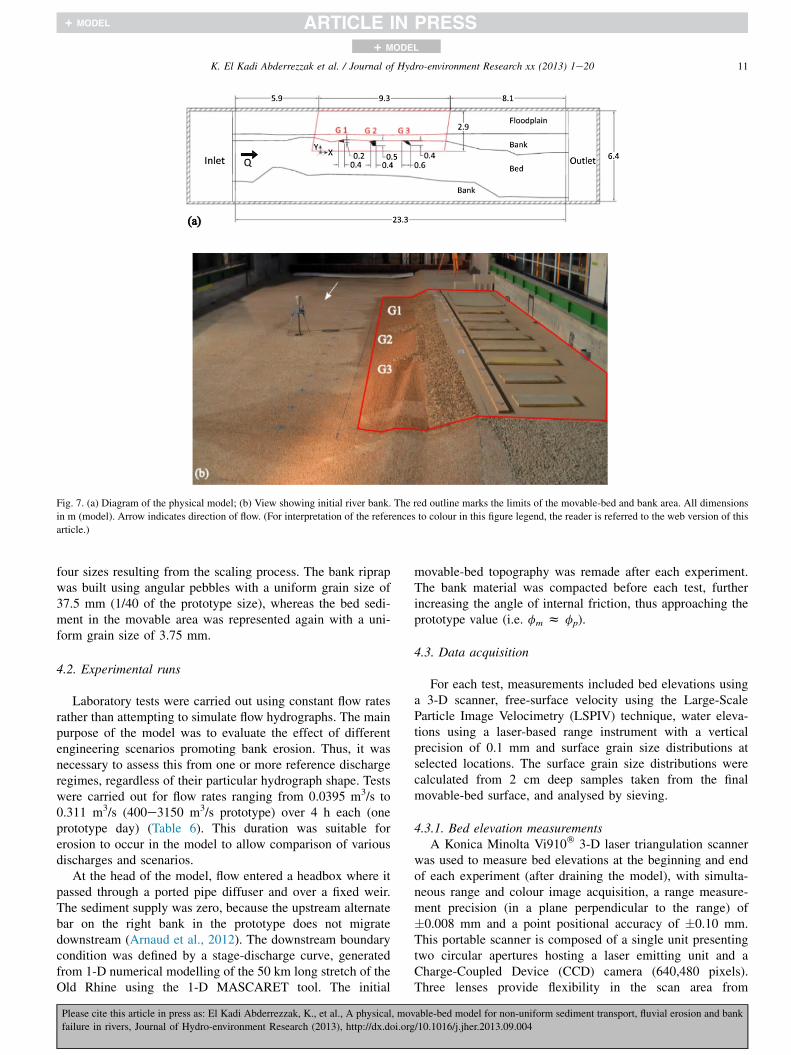
Fig. 7. (a) Diagram of the physical model; (b) View showing initial river bank. The red outline marks the limits of the movable-bed and bank area. All dimensions
in m (model). Arrow indicates direction of flow. (For interpretation of the references to colour in this figure legend, the reader is referred to the web version of this
article.)
11K. El Kadi Abderrezzak et al. / Journal of Hydro-environment Research xx (2013) 1e20
+ MODEL
four sizes resulting from the scaling process. The bank riprapwas built using angular pebbles with a uniform grain size of37.5 mm (1/40 of the prototype size), whereas the bed sedi-ment in the movable area was represented again with a uni-form grain size of 3.75 mm.
4.2. Experimental runs
Laboratory tests were carried out using constant flow ratesrather than attempting to simulate flow hydrographs. The mainpurpose of the model was to evaluate the effect of differentengineering scenarios promoting bank erosion. Thus, it wasnecessary to assess this from one or more reference dischargeregimes, regardless of their particular hydrograph shape. Testswere carried out for flow rates ranging from 0.0395 m3/s to0.311 m3/s (400e3150 m3/s prototype) over 4 h each (oneprototype day) (Table 6). This duration was suitable forerosion to occur in the model to allow comparison of variousdischarges and scenarios.
At the head of the model, flow entered a headbox where itpassed through a ported pipe diffuser and over a fixed weir.The sediment supply was zero, because the upstream alternatebar on the right bank in the prototype does not migratedownstream (Arnaud et al., 2012). The downstream boundarycondition was defined by a stage-discharge curve, generatedfrom 1-D numerical modelling of the 50 km long stretch of theOld Rhine using the 1-D MASCARET tool. The initial
Please cite this article in press as: El Kadi Abderrezzak, K., et al., A physical, mov
failure in rivers, Journal of Hydro-environment Research (2013), http://dx.doi.org
movable-bed topography was remade after each experiment.The bank material was compacted before each test, furtherincreasing the angle of internal friction, thus approaching theprototype value (i.e. fm z fp).
4.3. Data acquisition
For each test, measurements included bed elevations usinga 3-D scanner, free-surface velocity using the Large-ScaleParticle Image Velocimetry (LSPIV) technique, water eleva-tions using a laser-based range instrument with a verticalprecision of 0.1 mm and surface grain size distributions atselected locations. The surface grain size distributions werecalculated from 2 cm deep samples taken from the finalmovable-bed surface, and analysed by sieving.
4.3.1. Bed elevation measurementsA Konica Minolta Vi910� 3-D laser triangulation scanner
was used to measure bed elevations at the beginning and endof each experiment (after draining the model), with simulta-neous range and colour image acquisition, a range measure-ment precision (in a plane perpendicular to the range) of�0.008 mm and a point positional accuracy of �0.10 mm.This portable scanner is composed of a single unit presentingtwo circular apertures hosting a laser emitting unit and aCharge-Coupled Device (CCD) camera (640,480 pixels).Three lenses provide flexibility in the scan area from
able-bed model for non-uniform sediment transport, fluvial erosion and bank
/10.1016/j.jher.2013.09.004
12 K. El Kadi Abderrezzak et al. / Journal of Hydro-environment Research xx (2013) 1e20
+ MODEL
approximately 10�2 up to 1 m2. The scanner uses a light-stripemethod to acquire the surface geometry by emitting a red laserbeam and converting the reflected light into distance throughan active triangulation approach. The result is a dense set of640,480 3-D points outlining the part of the bed surface.
To transform the point clouds into an oriented DigitalElevation Model (DEM), the Geomagic Qualify12� softwarewas used. The measured point clouds were wrapped into aninitial mesh and subsequently cleaned of holes and otherspurious artefacts. Next, the meshed views were registered(aligned) with one another, first manually using sphericaltargets placed on the scanned surface, and then automatically.The resulting registered views were then merged into a singleunstructured tri-angular mesh. Finally, the merged mesh wasaligned to the common model coordinate system, creating aDEM of the bed surface. Geomagic Qualify12 was used tocompare initial and final bed elevation DEMs, to computeareas and volumes of eroded and deposited sediment and toscale the DEMs to prototype size.
4.3.2. Surface velocity measurementsThe time-averaged surface velocity field was measured
using the LSPIV technique. Measurements were performedfor a large spatial domain approximately 5.5 m long(streamwise) by 1.0 m wide. The free surface was seeded with5e10 mm diameter floating white cork spheres, coated tominimise agglomeration effects. Particles were uniformlyseeded using a dispenser located upstream of the imagingarea. It was not possible to measure velocity fields duringactive bed evolution, because tracer particles were prone tobeaching near the bank and interacting with the erosion pro-cess. Images were captured using a high-definition Pan-asonic� HDC-HS9 video camera with a 1920 � 1080 pixelimage size. Images were processed using the in-house LSPIVsoftware (El kadi Abderrezzak et al., 2012). The accuracy ofLSPIV measurements was evaluated by comparison withAcoustic Doppler Velocimetery (ADV) probe measurements,taken at certain locations of the model. Overall, similar resultswere obtained with deviations being less than 6%. Such ac-curacy can be qualified as acceptable for LSPIV measure-ments in laboratory flumes, according to the findings ofKantoush et al. (2011).
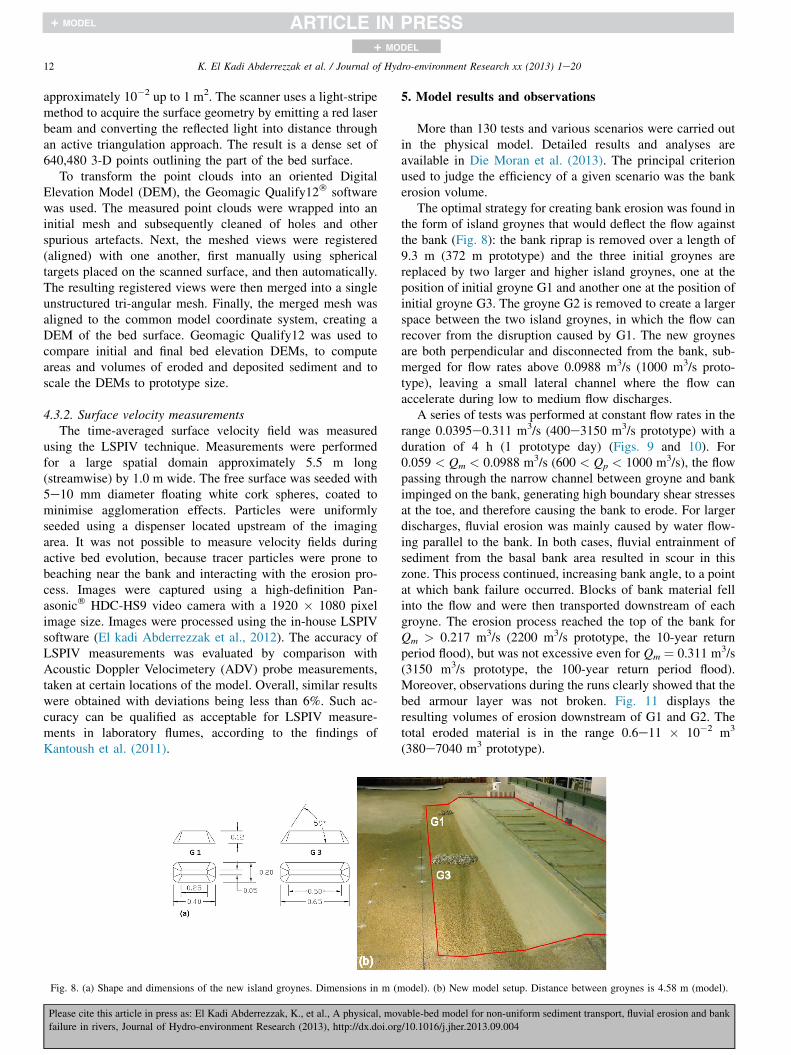
Fig. 8. (a) Shape and dimensions of the new island groynes. Dimensions in m (m
Please cite this article in press as: El Kadi Abderrezzak, K., et al., A physical, mov
failure in rivers, Journal of Hydro-environment Research (2013), http://dx.doi.org
5. Model results and observations
More than 130 tests and various scenarios were carried outin the physical model. Detailed results and analyses areavailable in Die Moran et al. (2013). The principal criterionused to judge the efficiency of a given scenario was the bankerosion volume.
The optimal strategy for creating bank erosion was found inthe form of island groynes that would deflect the flow againstthe bank (Fig. 8): the bank riprap is removed over a length of9.3 m (372 m prototype) and the three initial groynes arereplaced by two larger and higher island groynes, one at theposition of initial groyne G1 and another one at the position ofinitial groyne G3. The groyne G2 is removed to create a largerspace between the two island groynes, in which the flow canrecover from the disruption caused by G1. The new groynesare both perpendicular and disconnected from the bank, sub-merged for flow rates above 0.0988 m3/s (1000 m3/s proto-type), leaving a small lateral channel where the flow canaccelerate during low to medium flow discharges.
A series of tests was performed at constant flow rates in therange 0.0395e0.311 m3/s (400e3150 m3/s prototype) with aduration of 4 h (1 prototype day) (Figs. 9 and 10). For0.059 < Qm < 0.0988 m3/s (600 < Qp < 1000 m3/s), the flowpassing through the narrow channel between groyne and bankimpinged on the bank, generating high boundary shear stressesat the toe, and therefore causing the bank to erode. For largerdischarges, fluvial erosion was mainly caused by water flow-ing parallel to the bank. In both cases, fluvial entrainment ofsediment from the basal bank area resulted in scour in thiszone. This process continued, increasing bank angle, to a pointat which bank failure occurred. Blocks of bank material fellinto the flow and were then transported downstream of eachgroyne. The erosion process reached the top of the bank forQm > 0.217 m3/s (2200 m3/s prototype, the 10-year returnperiod flood), but was not excessive even for Qm ¼ 0.311 m3/s(3150 m3/s prototype, the 100-year return period flood).Moreover, observations during the runs clearly showed that thebed armour layer was not broken. Fig. 11 displays theresulting volumes of erosion downstream of G1 and G2. Thetotal eroded material is in the range 0.6e11 � 10�2 m3
(380e7040 m3 prototype).
odel). (b) New model setup. Distance between groynes is 4.58 m (model).
able-bed model for non-uniform sediment transport, fluvial erosion and bank
/10.1016/j.jher.2013.09.004
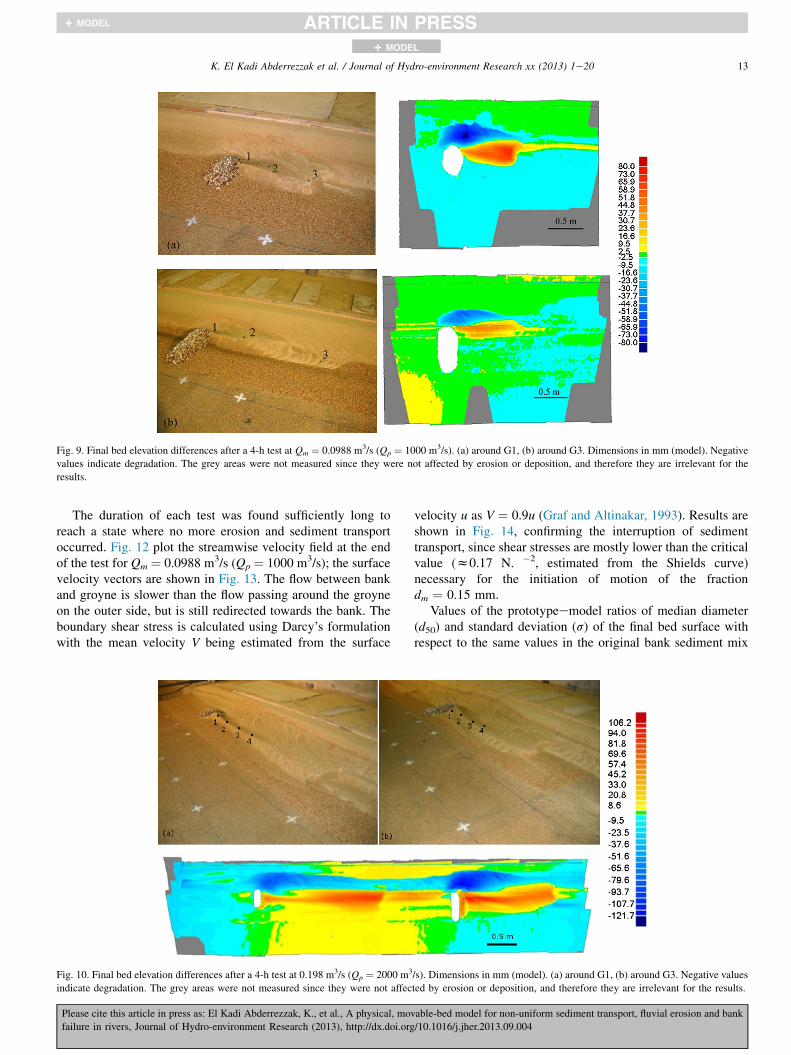
Fig. 9. Final bed elevation differences after a 4-h test at Qm ¼ 0.0988 m3/s (Qp ¼ 1000 m3/s). (a) around G1, (b) around G3. Dimensions in mm (model). Negative
values indicate degradation. The grey areas were not measured since they were not affected by erosion or deposition, and therefore they are irrelevant for the
results.
13K. El Kadi Abderrezzak et al. / Journal of Hydro-environment Research xx (2013) 1e20
+ MODEL
The duration of each test was found sufficiently long toreach a state where no more erosion and sediment transportoccurred. Fig. 12 plot the streamwise velocity field at the endof the test for Qm ¼ 0.0988 m3/s (Qp ¼ 1000 m3/s); the surfacevelocity vectors are shown in Fig. 13. The flow between bankand groyne is slower than the flow passing around the groyneon the outer side, but is still redirected towards the bank. Theboundary shear stress is calculated using Darcy’s formulationwith the mean velocity V being estimated from the surface
Fig. 10. Final bed elevation differences after a 4-h test at 0.198 m3/s (Qp ¼ 2000 m3
indicate degradation. The grey areas were not measured since they were not affec
Please cite this article in press as: El Kadi Abderrezzak, K., et al., A physical, mov
failure in rivers, Journal of Hydro-environment Research (2013), http://dx.doi.org
velocity u as V ¼ 0.9u (Graf and Altinakar, 1993). Results areshown in Fig. 14, confirming the interruption of sedimenttransport, since shear stresses are mostly lower than the criticalvalue (z0.17 N. �2, estimated from the Shields curve)necessary for the initiation of motion of the fractiondm ¼ 0.15 mm.
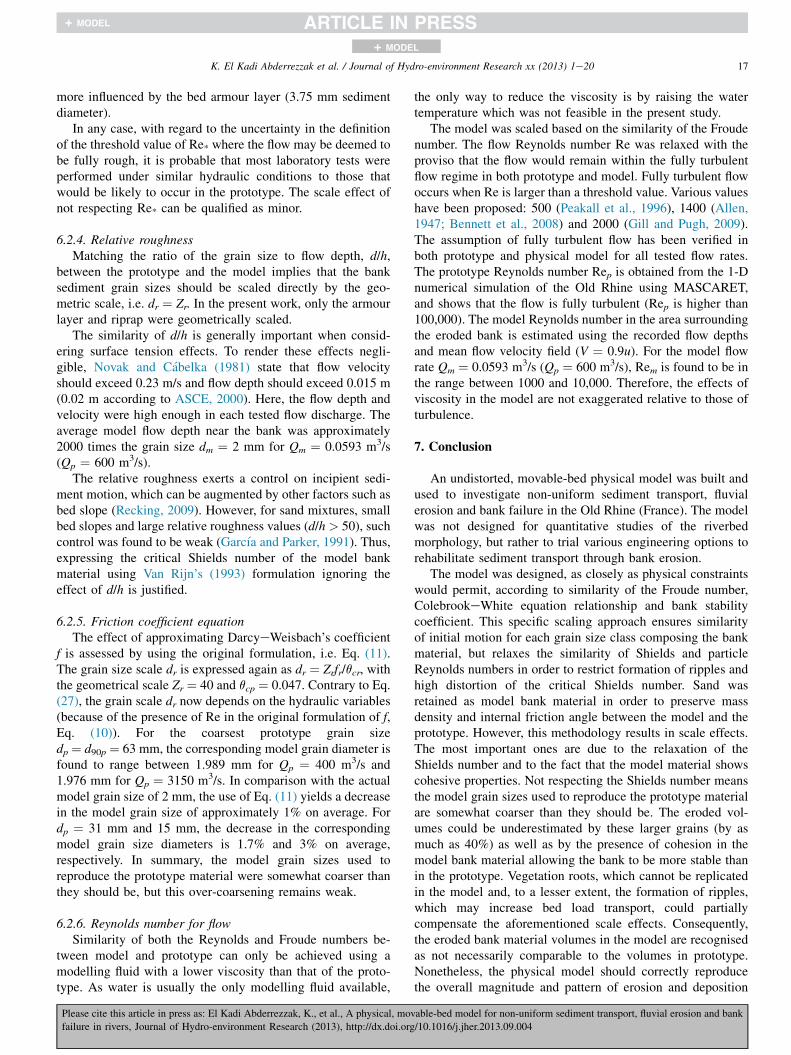
Values of the prototypeemodel ratios of median diameter(d50) and standard deviation (s) of the final bed surface withrespect to the same values in the original bank sediment mix
/s). Dimensions in mm (model). (a) around G1, (b) around G3. Negative values
ted by erosion or deposition, and therefore they are irrelevant for the results.
able-bed model for non-uniform sediment transport, fluvial erosion and bank
/10.1016/j.jher.2013.09.004
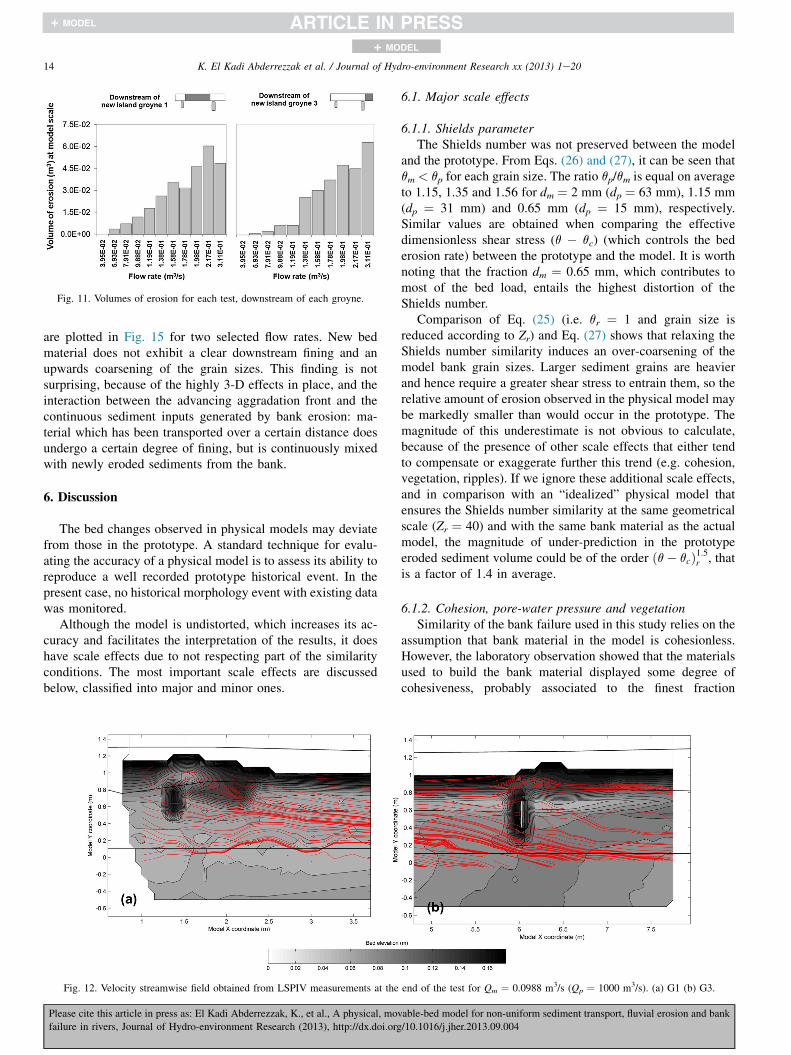
Fig. 11. Volumes of erosion for each test, downstream of each groyne.
14 K. El Kadi Abderrezzak et al. / Journal of Hydro-environment Research xx (2013) 1e20
+ MODEL
are plotted in Fig. 15 for two selected flow rates. New bedmaterial does not exhibit a clear downstream fining and anupwards coarsening of the grain sizes. This finding is notsurprising, because of the highly 3-D effects in place, and theinteraction between the advancing aggradation front and thecontinuous sediment inputs generated by bank erosion: ma-terial which has been transported over a certain distance doesundergo a certain degree of fining, but is continuously mixedwith newly eroded sediments from the bank.
6. Discussion
The bed changes observed in physical models may deviatefrom those in the prototype. A standard technique for evalu-ating the accuracy of a physical model is to assess its ability toreproduce a well recorded prototype historical event. In thepresent case, no historical morphology event with existing datawas monitored.
Although the model is undistorted, which increases its ac-curacy and facilitates the interpretation of the results, it doeshave scale effects due to not respecting part of the similarityconditions. The most important scale effects are discussedbelow, classified into major and minor ones.
Fig. 12. Velocity streamwise field obtained from LSPIV measurements at the
Please cite this article in press as: El Kadi Abderrezzak, K., et al., A physical, mov
failure in rivers, Journal of Hydro-environment Research (2013), http://dx.doi.org
6.1. Major scale effects
6.1.1. Shields parameterThe Shields number was not preserved between the model
and the prototype. From Eqs. (26) and (27), it can be seen thatqm < qp for each grain size. The ratio qp/qm is equal on averageto 1.15, 1.35 and 1.56 for dm ¼ 2 mm (dp ¼ 63 mm), 1.15 mm(dp ¼ 31 mm) and 0.65 mm (dp ¼ 15 mm), respectively.Similar values are obtained when comparing the effectivedimensionless shear stress (q � qc) (which controls the bederosion rate) between the prototype and the model. It is worthnoting that the fraction dm ¼ 0.65 mm, which contributes tomost of the bed load, entails the highest distortion of theShields number.
Comparison of Eq. (25) (i.e. qr ¼ 1 and grain size isreduced according to Zr) and Eq. (27) shows that relaxing theShields number similarity induces an over-coarsening of themodel bank grain sizes. Larger sediment grains are heavierand hence require a greater shear stress to entrain them, so therelative amount of erosion observed in the physical model maybe markedly smaller than would occur in the prototype. Themagnitude of this underestimate is not obvious to calculate,because of the presence of other scale effects that either tendto compensate or exaggerate further this trend (e.g. cohesion,vegetation, ripples). If we ignore these additional scale effects,and in comparison with an “idealized” physical model thatensures the Shields number similarity at the same geometricalscale (Zr ¼ 40) and with the same bank material as the actualmodel, the magnitude of under-prediction in the prototypeeroded sediment volume could be of the order ðq� qcÞ1:5r , thatis a factor of 1.4 in average.
6.1.2. Cohesion, pore-water pressure and vegetationSimilarity of the bank failure used in this study relies on the
assumption that bank material in the model is cohesionless.However, the laboratory observation showed that the materialsused to build the bank material displayed some degree ofcohesiveness, probably associated to the finest fraction
end of the test for Qm ¼ 0.0988 m3/s (Qp ¼ 1000 m3/s). (a) G1 (b) G3.
able-bed model for non-uniform sediment transport, fluvial erosion and bank
/10.1016/j.jher.2013.09.004
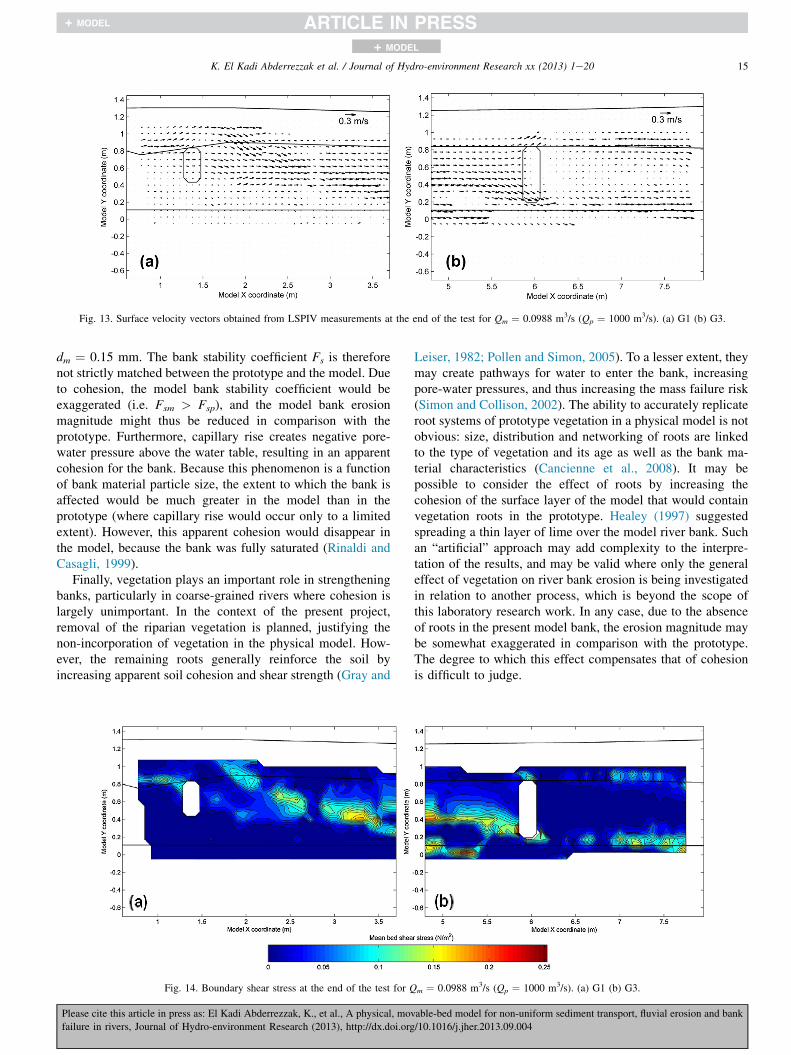
Fig. 13. Surface velocity vectors obtained from LSPIV measurements at the end of the test for Qm ¼ 0.0988 m3/s (Qp ¼ 1000 m3/s). (a) G1 (b) G3.
15K. El Kadi Abderrezzak et al. / Journal of Hydro-environment Research xx (2013) 1e20
+ MODEL
dm ¼ 0.15 mm. The bank stability coefficient Fs is thereforenot strictly matched between the prototype and the model. Dueto cohesion, the model bank stability coefficient would beexaggerated (i.e. Fsm > Fsp), and the model bank erosionmagnitude might thus be reduced in comparison with theprototype. Furthermore, capillary rise creates negative pore-water pressure above the water table, resulting in an apparentcohesion for the bank. Because this phenomenon is a functionof bank material particle size, the extent to which the bank isaffected would be much greater in the model than in theprototype (where capillary rise would occur only to a limitedextent). However, this apparent cohesion would disappear inthe model, because the bank was fully saturated (Rinaldi andCasagli, 1999).
Finally, vegetation plays an important role in strengtheningbanks, particularly in coarse-grained rivers where cohesion islargely unimportant. In the context of the present project,removal of the riparian vegetation is planned, justifying thenon-incorporation of vegetation in the physical model. How-ever, the remaining roots generally reinforce the soil byincreasing apparent soil cohesion and shear strength (Gray and
Fig. 14. Boundary shear stress at the end of the test for Q
Please cite this article in press as: El Kadi Abderrezzak, K., et al., A physical, mov
failure in rivers, Journal of Hydro-environment Research (2013), http://dx.doi.org
Leiser, 1982; Pollen and Simon, 2005). To a lesser extent, theymay create pathways for water to enter the bank, increasingpore-water pressures, and thus increasing the mass failure risk(Simon and Collison, 2002). The ability to accurately replicateroot systems of prototype vegetation in a physical model is notobvious: size, distribution and networking of roots are linkedto the type of vegetation and its age as well as the bank ma-terial characteristics (Cancienne et al., 2008). It may bepossible to consider the effect of roots by increasing thecohesion of the surface layer of the model that would containvegetation roots in the prototype. Healey (1997) suggestedspreading a thin layer of lime over the model river bank. Suchan “artificial” approach may add complexity to the interpre-tation of the results, and may be valid where only the generaleffect of vegetation on river bank erosion is being investigatedin relation to another process, which is beyond the scope ofthis laboratory research work. In any case, due to the absenceof roots in the present model bank, the erosion magnitude maybe somewhat exaggerated in comparison with the prototype.The degree to which this effect compensates that of cohesionis difficult to judge.
m ¼ 0.0988 m3/s (Qp ¼ 1000 m3/s). (a) G1 (b) G3.
able-bed model for non-uniform sediment transport, fluvial erosion and bank
/10.1016/j.jher.2013.09.004
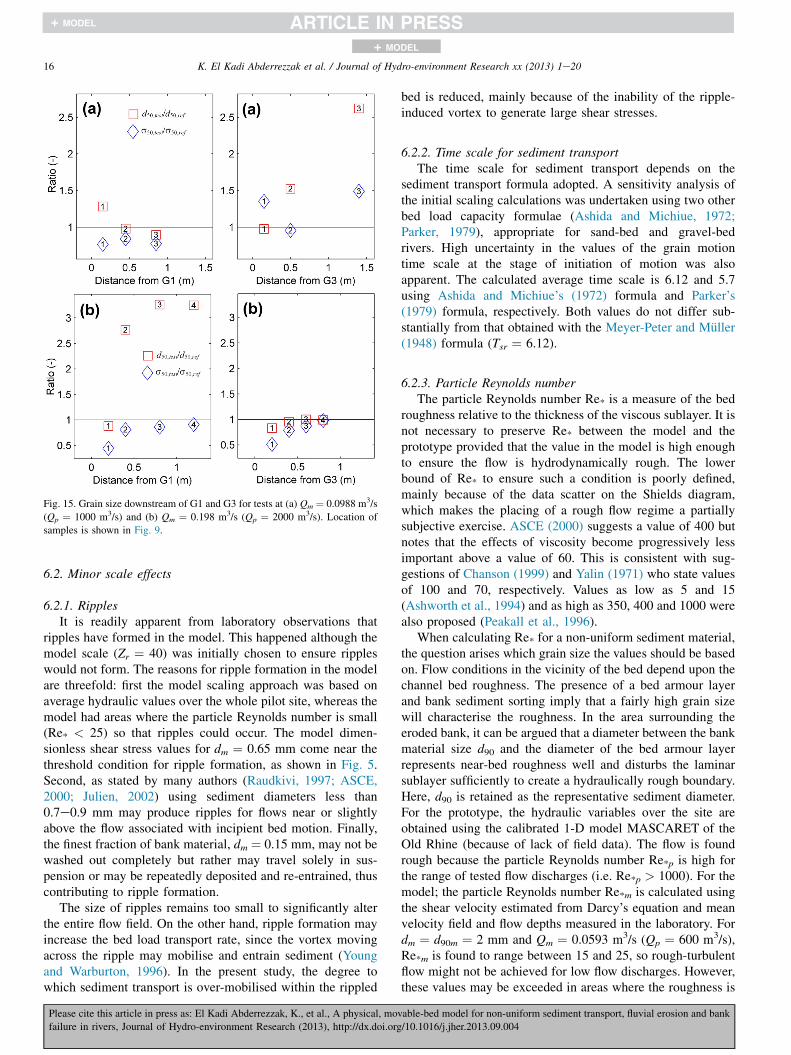
Fig. 15. Grain size downstream of G1 and G3 for tests at (a) Qm ¼ 0.0988 m3/s
(Qp ¼ 1000 m3/s) and (b) Qm ¼ 0.198 m3/s (Qp ¼ 2000 m3/s). Location of
samples is shown in Fig. 9.
16 K. El Kadi Abderrezzak et al. / Journal of Hydro-environment Research xx (2013) 1e20
+ MODEL
6.2. Minor scale effects
6.2.1. RipplesIt is readily apparent from laboratory observations that
ripples have formed in the model. This happened although themodel scale (Zr ¼ 40) was initially chosen to ensure rippleswould not form. The reasons for ripple formation in the modelare threefold: first the model scaling approach was based onaverage hydraulic values over the whole pilot site, whereas themodel had areas where the particle Reynolds number is small(Re* < 25) so that ripples could occur. The model dimen-sionless shear stress values for dm ¼ 0.65 mm come near thethreshold condition for ripple formation, as shown in Fig. 5.Second, as stated by many authors (Raudkivi, 1997; ASCE,2000; Julien, 2002) using sediment diameters less than0.7e0.9 mm may produce ripples for flows near or slightlyabove the flow associated with incipient bed motion. Finally,the finest fraction of bank material, dm ¼ 0.15 mm, may not bewashed out completely but rather may travel solely in sus-pension or may be repeatedly deposited and re-entrained, thuscontributing to ripple formation.
The size of ripples remains too small to significantly alterthe entire flow field. On the other hand, ripple formation mayincrease the bed load transport rate, since the vortex movingacross the ripple may mobilise and entrain sediment (Youngand Warburton, 1996). In the present study, the degree towhich sediment transport is over-mobilised within the rippled
Please cite this article in press as: El Kadi Abderrezzak, K., et al., A physical, mov
failure in rivers, Journal of Hydro-environment Research (2013), http://dx.doi.org
bed is reduced, mainly because of the inability of the ripple-induced vortex to generate large shear stresses.
6.2.2. Time scale for sediment transportThe time scale for sediment transport depends on the
sediment transport formula adopted. A sensitivity analysis ofthe initial scaling calculations was undertaken using two otherbed load capacity formulae (Ashida and Michiue, 1972;Parker, 1979), appropriate for sand-bed and gravel-bedrivers. High uncertainty in the values of the grain motiontime scale at the stage of initiation of motion was alsoapparent. The calculated average time scale is 6.12 and 5.7using Ashida and Michiue’s (1972) formula and Parker’s(1979) formula, respectively. Both values do not differ sub-stantially from that obtained with the Meyer-Peter and Muller(1948) formula (Tsr ¼ 6.12).
6.2.3. Particle Reynolds numberThe particle Reynolds number Re* is a measure of the bed
roughness relative to the thickness of the viscous sublayer. It isnot necessary to preserve Re* between the model and theprototype provided that the value in the model is high enoughto ensure the flow is hydrodynamically rough. The lowerbound of Re* to ensure such a condition is poorly defined,mainly because of the data scatter on the Shields diagram,which makes the placing of a rough flow regime a partiallysubjective exercise. ASCE (2000) suggests a value of 400 butnotes that the effects of viscosity become progressively lessimportant above a value of 60. This is consistent with sug-gestions of Chanson (1999) and Yalin (1971) who state valuesof 100 and 70, respectively. Values as low as 5 and 15(Ashworth et al., 1994) and as high as 350, 400 and 1000 werealso proposed (Peakall et al., 1996).
When calculating Re* for a non-uniform sediment material,the question arises which grain size the values should be basedon. Flow conditions in the vicinity of the bed depend upon thechannel bed roughness. The presence of a bed armour layerand bank sediment sorting imply that a fairly high grain sizewill characterise the roughness. In the area surrounding theeroded bank, it can be argued that a diameter between the bankmaterial size d90 and the diameter of the bed armour layerrepresents near-bed roughness well and disturbs the laminarsublayer sufficiently to create a hydraulically rough boundary.Here, d90 is retained as the representative sediment diameter.For the prototype, the hydraulic variables over the site areobtained using the calibrated 1-D model MASCARET of theOld Rhine (because of lack of field data). The flow is foundrough because the particle Reynolds number Re*p is high forthe range of tested flow discharges (i.e. Re*p > 1000). For themodel; the particle Reynolds number Re*m is calculated usingthe shear velocity estimated from Darcy’s equation and meanvelocity field and flow depths measured in the laboratory. Fordm ¼ d90m ¼ 2 mm and Qm ¼ 0.0593 m3/s (Qp ¼ 600 m3/s),Re*m is found to range between 15 and 25, so rough-turbulentflow might not be achieved for low flow discharges. However,these values may be exceeded in areas where the roughness is
able-bed model for non-uniform sediment transport, fluvial erosion and bank
/10.1016/j.jher.2013.09.004
17K. El Kadi Abderrezzak et al. / Journal of Hydro-environment Research xx (2013) 1e20
+ MODEL
more influenced by the bed armour layer (3.75 mm sedimentdiameter).
In any case, with regard to the uncertainty in the definitionof the threshold value of Re* where the flow may be deemed tobe fully rough, it is probable that most laboratory tests wereperformed under similar hydraulic conditions to those thatwould be likely to occur in the prototype. The scale effect ofnot respecting Re* can be qualified as minor.
6.2.4. Relative roughnessMatching the ratio of the grain size to flow depth, d/h,
between the prototype and the model implies that the banksediment grain sizes should be scaled directly by the geo-metric scale, i.e. dr ¼ Zr. In the present work, only the armourlayer and riprap were geometrically scaled.
The similarity of d/h is generally important when consid-ering surface tension effects. To render these effects negli-gible, Novak and Cabelka (1981) state that flow velocityshould exceed 0.23 m/s and flow depth should exceed 0.015 m(0.02 m according to ASCE, 2000). Here, the flow depth andvelocity were high enough in each tested flow discharge. Theaverage model flow depth near the bank was approximately2000 times the grain size dm ¼ 2 mm for Qm ¼ 0.0593 m3/s(Qp ¼ 600 m3/s).
The relative roughness exerts a control on incipient sedi-ment motion, which can be augmented by other factors such asbed slope (Recking, 2009). However, for sand mixtures, smallbed slopes and large relative roughness values (d/h > 50), suchcontrol was found to be weak (Garcıa and Parker, 1991). Thus,expressing the critical Shields number of the model bankmaterial using Van Rijn’s (1993) formulation ignoring theeffect of d/h is justified.
6.2.5. Friction coefficient equationThe effect of approximating DarcyeWeisbach’s coefficient
f is assessed by using the original formulation, i.e. Eq. (11).The grain size scale dr is expressed again as dr ¼ Zrfr/qcr, withthe geometrical scale Zr ¼ 40 and qcp ¼ 0.047. Contrary to Eq.(27), the grain scale dr now depends on the hydraulic variables(because of the presence of Re in the original formulation of f,Eq. (10)). For the coarsest prototype grain sizedp ¼ d90p ¼ 63 mm, the corresponding model grain diameter isfound to range between 1.989 mm for Qp ¼ 400 m3/s and1.976 mm for Qp ¼ 3150 m3/s. In comparison with the actualmodel grain size of 2 mm, the use of Eq. (11) yields a decreasein the model grain size of approximately 1% on average. Fordp ¼ 31 mm and 15 mm, the decrease in the correspondingmodel grain size diameters is 1.7% and 3% on average,respectively. In summary, the model grain sizes used toreproduce the prototype material were somewhat coarser thanthey should be, but this over-coarsening remains weak.
6.2.6. Reynolds number for flowSimilarity of both the Reynolds and Froude numbers be-
tween model and prototype can only be achieved using amodelling fluid with a lower viscosity than that of the proto-type. As water is usually the only modelling fluid available,
Please cite this article in press as: El Kadi Abderrezzak, K., et al., A physical, mov
failure in rivers, Journal of Hydro-environment Research (2013), http://dx.doi.org
the only way to reduce the viscosity is by raising the watertemperature which was not feasible in the present study.
The model was scaled based on the similarity of the Froudenumber. The flow Reynolds number Re was relaxed with theproviso that the flow would remain within the fully turbulentflow regime in both prototype and model. Fully turbulent flowoccurs when Re is larger than a threshold value. Various valueshave been proposed: 500 (Peakall et al., 1996), 1400 (Allen,1947; Bennett et al., 2008) and 2000 (Gill and Pugh, 2009).The assumption of fully turbulent flow has been verified inboth prototype and physical model for all tested flow rates.The prototype Reynolds number Rep is obtained from the 1-Dnumerical simulation of the Old Rhine using MASCARET,and shows that the flow is fully turbulent (Rep is higher than100,000). The model Reynolds number in the area surroundingthe eroded bank is estimated using the recorded flow depthsand mean flow velocity field (V ¼ 0.9u). For the model flowrate Qm ¼ 0.0593 m3/s (Qp ¼ 600 m3/s), Rem is found to be inthe range between 1000 and 10,000. Therefore, the effects ofviscosity in the model are not exaggerated relative to those ofturbulence.
7. Conclusion
An undistorted, movable-bed physical model was built andused to investigate non-uniform sediment transport, fluvialerosion and bank failure in the Old Rhine (France). The modelwas not designed for quantitative studies of the riverbedmorphology, but rather to trial various engineering options torehabilitate sediment transport through bank erosion.
The model was designed, as closely as physical constraintswould permit, according to similarity of the Froude number,ColebrookeWhite equation relationship and bank stabilitycoefficient. This specific scaling approach ensures similarityof initial motion for each grain size class composing the bankmaterial, but relaxes the similarity of Shields and particleReynolds numbers in order to restrict formation of ripples andhigh distortion of the critical Shields number. Sand wasretained as model bank material in order to preserve massdensity and internal friction angle between the model and theprototype. However, this methodology results in scale effects.The most important ones are due to the relaxation of theShields number and to the fact that the model material showscohesive properties. Not respecting the Shields number meansthe model grain sizes used to reproduce the prototype materialare somewhat coarser than they should be. The eroded vol-umes could be underestimated by these larger grains (by asmuch as 40%) as well as by the presence of cohesion in themodel bank material allowing the bank to be more stable thanin the prototype. Vegetation roots, which cannot be replicatedin the model and, to a lesser extent, the formation of ripples,which may increase bed load transport, could partiallycompensate the aforementioned scale effects. Consequently,the eroded bank material volumes in the model are recognisedas not necessarily comparable to the volumes in prototype.Nonetheless, the physical model should correctly reproducethe overall magnitude and pattern of erosion and deposition
able-bed model for non-uniform sediment transport, fluvial erosion and bank
/10.1016/j.jher.2013.09.004
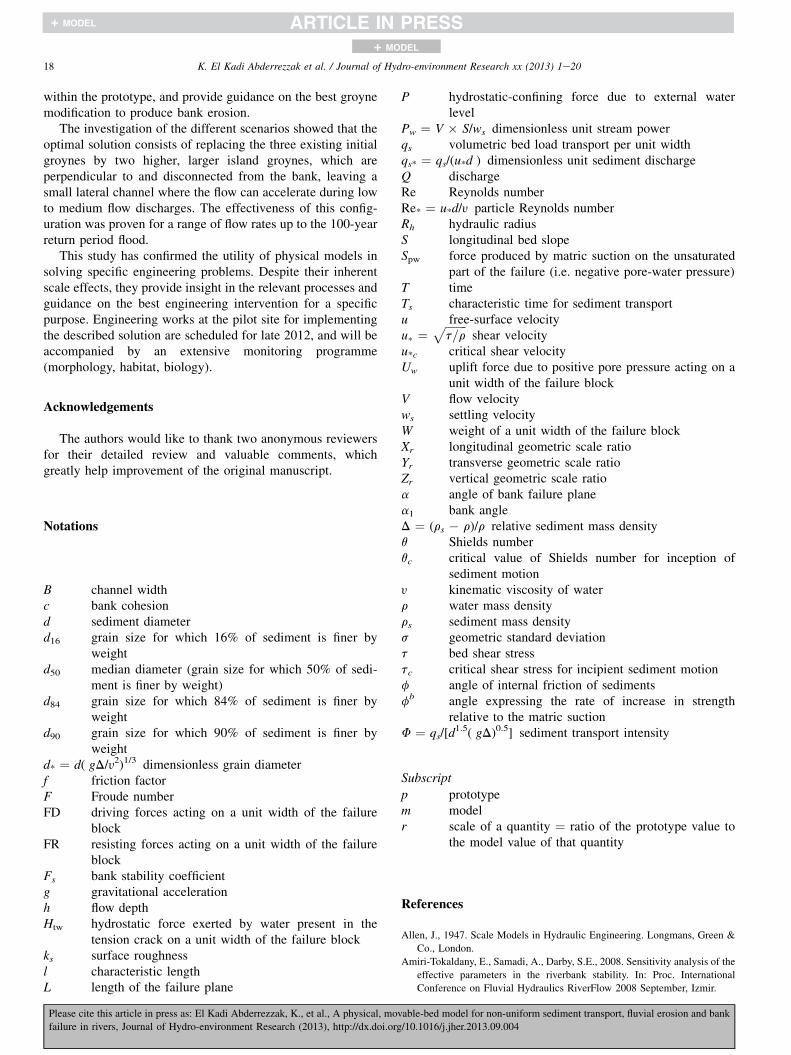
18 K. El Kadi Abderrezzak et al. / Journal of Hydro-environment Research xx (2013) 1e20
+ MODEL
within the prototype, and provide guidance on the best groynemodification to produce bank erosion.
The investigation of the different scenarios showed that theoptimal solution consists of replacing the three existing initialgroynes by two higher, larger island groynes, which areperpendicular to and disconnected from the bank, leaving asmall lateral channel where the flow can accelerate during lowto medium flow discharges. The effectiveness of this config-uration was proven for a range of flow rates up to the 100-yearreturn period flood.
This study has confirmed the utility of physical models insolving specific engineering problems. Despite their inherentscale effects, they provide insight in the relevant processes andguidance on the best engineering intervention for a specificpurpose. Engineering works at the pilot site for implementingthe described solution are scheduled for late 2012, and will beaccompanied by an extensive monitoring programme(morphology, habitat, biology).
Acknowledgements
The authors would like to thank two anonymous reviewersfor their detailed review and valuable comments, whichgreatly help improvement of the original manuscript.
Notations
B channel widthc bank cohesiond sediment diameterd16 grain size for which 16% of sediment is finer by
weightd50 median diameter (grain size for which 50% of sedi-
ment is finer by weight)d84 grain size for which 84% of sediment is finer by
weightd90 grain size for which 90% of sediment is finer by
weightd* ¼ d( gD/y2)1/3 dimensionless grain diameterf friction factorF Froude numberFD driving forces acting on a unit width of the failure
blockFR resisting forces acting on a unit width of the failure
blockFs bank stability coefficientg gravitational accelerationh flow depthHtw hydrostatic force exerted by water present in the
tension crack on a unit width of the failure blockks surface roughnessl characteristic lengthL length of the failure plane
Please cite this article in press as: El Kadi Abderrezzak, K., et al., A physical, mov
failure in rivers, Journal of Hydro-environment Research (2013), http://dx.doi.org
P hydrostatic-confining force due to external waterlevel
Pw ¼ V � S/ws dimensionless unit stream powerqs volumetric bed load transport per unit widthqs* ¼ qs/(u*d ) dimensionless unit sediment dischargeQ dischargeRe Reynolds numberRe* ¼ u*d/y particle Reynolds numberRh hydraulic radiusS longitudinal bed slopeSpw force produced by matric suction on the unsaturated
part of the failure (i.e. negative pore-water pressure)T timeTs characteristic time for sediment transportu free-surface velocityu� ¼ ffiffiffiffiffiffiffiffi
t=rp
shear velocityu*c critical shear velocityUw uplift force due to positive pore pressure acting on a
unit width of the failure blockV flow velocityws settling velocityW weight of a unit width of the failure blockXr longitudinal geometric scale ratioYr transverse geometric scale ratioZr vertical geometric scale ratioa angle of bank failure planea1 bank angleD ¼ (rs � r)/r relative sediment mass densityq Shields numberqc critical value of Shields number for inception of
sediment motiony kinematic viscosity of waterr water mass densityrs sediment mass densitys geometric standard deviationt bed shear stresstc critical shear stress for incipient sediment motionf angle of internal friction of sedimentsfb angle expressing the rate of increase in strength
relative to the matric suctionF ¼ qs/[d
1.5( gD)0.5] sediment transport intensity
Subscript
p prototypem modelr scale of a quantity ¼ ratio of the prototype value to
the model value of that quantity
References
Allen, J., 1947. Scale Models in Hydraulic Engineering. Longmans, Green &
Co., London.
Amiri-Tokaldany, E., Samadi, A., Darby, S.E., 2008. Sensitivity analysis of the
effective parameters in the riverbank stability. In: Proc. International
Conference on Fluvial Hydraulics RiverFlow 2008 September, Izmir.
able-bed model for non-uniform sediment transport, fluvial erosion and bank
/10.1016/j.jher.2013.09.004
19K. El Kadi Abderrezzak et al. / Journal of Hydro-environment Research xx (2013) 1e20
+ MODEL
Armanini, A., Sartori, F., Tomio, G., Cerchia, F., Vergnani, M., 2010. Analysis
of a fluvial groynes system on hydraulic scale model. In: Proc. Interna-
tional Conference on Fluvial Hydraulics RiverFlow 2010, Braunschweig.
Arnaud, F., Schmitt, L., Piegay, H., Beal, D., Rollet, A.J., 2012. Geomorphic
diagnosis (1880e2009) for the restoration of an altered river reach: the OldRhine between Kembs and Breisach (France, Germany). In: Proc. IS.Rivers
Integrative Sciences and Sustainable Development of Rivers, Lyon.
ASCE (American Society of Civil Engineers), 2000. Hydraulic Modeling:
Concepts and Practice. In: ASCE Manuals and Reports on Engineering
Practice, Manual, vol. 97. ASCE (American Society of Civil Engineers),
Reston, Virginia.
Ashida, K., Michiue, M., 1972. Study on hydraulic resistance and bed load
transport rate in alluvial streams. Trans. Jpn. Soc. Civil Eng. 26, 59e69.
Ashworth, P.J., Best, J.L., Leddy, J.O., Geehan, G.W., 1994. The physical
modelling of braided rivers and deposition of fine-grained sediment. In:
Kirkby, M.J. (Ed.), Process Models and Theoretical Geomorphology. John
Wiley and Sons Ltd, Chichester.
Bagnold, R.A., 1966. An Approach to the Sediment Transport Problem from
General Physics. U.S. Geological Survey. Professional Paper 422-I.
Bennett, S.J., Wu, W., Alonso, C.V., Wang, S.S.Y., 2008. Modeling fluvial
response to in-stream woody vegetation: implications for stream corridor
restoration. Earth Surf. Process. Land. 33, 890e909.
Bieri, M., Muller, M., Boillat, J., Schleiss, A., 2012. Modeling of sediment
management for the Lavey run-of-river HPP in Switzerland. J. Hydraulic
Eng. 138, 340e347.
Bromley, C., 2008. The Morphodynamics of Sediment Movement through a
Reservoir during Dam Removal. PhD Thesis. University of Nottingham,
Nottingham.
Buffington, J.M., Montgomery, D.R., 1997. A systematic analysis of eight
decades of incipient motion studies, with special reference to gravel-
bedded rivers. Water Resour. Res. 33, 1993e2029.
Buffington, J.M., Dietrich, W.E., Kirchner, J.W., 1992. Friction angle mea-
surements on a naturally formed gravel streambed: implications for critical
boundary shear stress. Water Resour. Res. 28, 411e425.Cancienne, R.M., Fox, G.A., Simon, A., 2008. Influence of seepage under-
cutting on the stability of root-reinforced streambanks. Earth Surf. Process.
Land. 33, 1769e1786.
Chabert, J., Chauvin, J.L., 1963. Formation des dunes et de rides dans les
modeles fluviaux. Bull. C.R.E.C. 4 (in French).
Chanson, H., 1999. The Hydraulics of Flow in Open Channels. Arnold, London.
Chauvin, J.L., 1962. Similitude des modeles de cours d’eau a fond mobile.
Bull. C.R.E.C. 1, 64e91 (in French).
Cheng, N.S., Chiew, Y.M., 1999. Analysis of initiation of sediment suspension
from bed load. J. Hydraulic Eng. 125, 855e861.
Davinroy, R.D., Gordon, D., Rhoads, A., Abbott, J., 1999. Sedimentation
Study of the Missouri River, Copeland Bend, Miles 569 to 564.5. Hy-
draulic Micro Model Investigation. Technical Report M10. US Army
Corps of Engineers.
De Vries, M., 1993. Use of Models for River Problems. In: Studies and Re-
ports in Hydrology Series, vol. 51. UNESCO.
Die Moran, A., El kadi Abderrezzak, K., Mosselman, E., Habersack, H.,
Lebert, F., Aelbrecht, D., Laperrousaz, E., 2013. Physical model experi-
ments for sediment transport restoration in the Old Rhine through induced
bank erosion. Int. J. Sediment Res. in press.
Einstein, H.A., Chien, N., 1956. Similarity of distorted river models with
movable beds. Trans. ASCE 121, 440e457.
El kadi Abderrezzak, K., Die Moran, A., Jodeau, M., 2012. Optical techniques
for surface velocity and bed elevation measurements in a fluvial physical
scale model. In: Proc. International Conference on Fluvial Hydraulics
RiverFlow 2012, San Jose.
Engelund, F., Hansen, E., 1967. A Monograph on Sediment Transport.
Technisk Forlag, Copenhagen, Denmark.
Ettema, R., Arndt, R., Roberts, P., Wahl, T., 2000. Hydraulic Modeling:
Concepts and Practice. ASCE Publications, Reston VA, USA.
Franco, J.J., 1978. Guidelines for the Design, Adjustment and Operation of
Models for the Study of River Sedimentation Problems. Department of the
Army, Waterways Experiment Station. Hydraulics Laboratory Report H-
78-1.
Please cite this article in press as: El Kadi Abderrezzak, K., et al., A physical, mov
failure in rivers, Journal of Hydro-environment Research (2013), http://dx.doi.org
Gaines, R.A., Maynord, S.T., 2001. Microscale loose-bed hydraulic models. J.
Hydraulic Eng. 127, 335e338.
Garcıa, M.H., 1999. Sedimentation and erosion hydraulics. In: Mays, Larry
(Ed.), Hydraulic Design Handbook.
Garcıa, M.H., Parker, G., 1991. Entrainment of bed sediment into suspension.
J. Hydraulic Eng. 117, 414e435.
Gill, T.W., Pugh, C.A., 2009. Sediment transport similitude for scaled physical
hydraulic modeling. In: Proc. 33rd IAHR Congress, Vancouver.
Goutal, N., Zaoui, F., Lacombe, J.M., El kadi Abderrezzak, K., 2012. Mas-
caret: a 1-D open-source software for flow hydrodynamic and water
quality in open channel net-works. In: Proc. International Conference on
Fluvial Hydraulics RiverFlow 2012, September 6e8, San Jose.
Graf, W.H., Altinakar, M.S., 1993. Hydraulique fluviale: ecoulement perma-
nent uniforme et non uniforme Tome 1. Traite de Genie Civil, Ecole
polytechnique federale de Lausanne, Presse polytechnique et universitaire
romanes (in French).
Gray, D.H., Leiser, A.T., 1982. Biotechnical Slope Protection and Erosion
Control. Van Nostrand Reinhold Company, New York.
Healey, M.O., 1997. Investigation of Flood Risk & Erosion Mitigation on the
Rangitata River at Klondyke. PhD Thesis. Lincoln University.
Heller, V., 2011. Scale effects in physical hydraulic engineering models. J.
Hydraulic Res. 49, 293e306.
Ho, J., Coonrod, J., Gill, T., Mefford, B., 2010. Case study: movable bed
model scaling for bed load sediment exclusion at intake structure on Rio
Grande. J. Hydraulic Eng. 136, 247e250.
Jaeggi, M.N.R., 1986. Non distorted models for research on river morphology.
In: Proc. IAHS Symposium on Scale Effects in Modelling Sediment
Transport Phenomena, Toronto.
Jain, S., 2001. Scaling laws for movable-bed river models. In: Proc. 29th
IAHR Congress, Beijing.
Julien, P.Y., 2002. River Mechanics, second ed. Cambridge University Press.
Kantoush, S.A., Schleiss, A., Tetsuya Sumi, T., Murasaki, M., 2011. LSPIV
implementation for environmental flow in various laboratory and field
cases. J. Hydro-environ. Res. 5, 263e276.Kishi, T., Kuroki, M., Imaizumi, S., 1975. An experimental study on the
meandering flow in straight channel with fixed side bank. In: Proc. 30th
Annual Conference of the Japan Society of Civil Engineers (in
Japanese).
Kuhnle, R.A., 1992. Fractional transport rates of bedload on Goodwin Creek.
In: Billi, P., Hey, R.D., Thorne, C.R., Tacconi, P. (Eds.), Dynamics of
Gravel-bed Rivers, pp. 141e155.
Marr, J.D.G., Hill, C., Johnson, S., Grant, G., Campbell, K., Mohseni, O.,
2007. Physical Model Study of Marmot Dam Removal: Cofferdam Notch
Location and Resulting Fluvial Responses. Report to Portland General
Electric, Portland, Oregon.
Maynord, S.T., 2006. Evaluation of the micromodel: an extremely small-scale
movable bed model. J. Hydraulic Eng. 132, 343e353.
Mefford, B., 2005. Elwha River Surface-water Intake Structure. U.S.
Department of the Interior, Bureau of Reclamation. Hydraulic Laboratory
Report HL-2004-03.
Mefford, B., Gill, T., 2010. Physical Hydraulic Model Proposal for US
Army Corps of Engineers Missouri River Bend Model. U.S. Department
of the Interior, Bureau of Reclamation. Hydraulic Laboratory Report
HL-2010-05.
Mefford, B., Stowell, H., Heinje, C., 2008. Robles Diversion Dam High Flow
and Sediment Bypass Structure, Ventura, CaliforniaePhysical Model
Study. U.S. Department of the Interior, Bureau of Reclamation. Hydraulic
Laboratory Report HL-2008-7.
Meyer-Peter, E., Muller, R., 1948. Formulas for bed-load transport. In: 2nd
IAHR Congress, Stockholm, Sweden.
Novak, P., Cabelka, J., 1981. Models in Hydraulic Engineering e Physical
Principles and Design Applications. Pitman, Boston.
Parent, A.P., 1988. Scale Models of Gravel Bed Rivers. PhD Dissertation.
University of British Columbia.
Parker, G., 1979. Hydraulic geometry of active gravel rivers. J. Hydraulic Div.
ASCE 105, 1185e1201.
Peakall, J., Ashworth, P., Best, J.L., 1996. Physical modelling in fluvial geo-
morphology: principles, applications and unresolved issues. In:
able-bed model for non-uniform sediment transport, fluvial erosion and bank
/10.1016/j.jher.2013.09.004
20 K. El Kadi Abderrezzak et al. / Journal of Hydro-environment Research xx (2013) 1e20
+ MODEL
Rhoads, L.B., Thorn, E.C. (Eds.), The Scientific Nature of Geo-
morphology. Wiley & Sons, Chichester, pp. 221e253.
Piegay, H., Aelbrecht, D., Beal, D., 2010. Restauration morphodynamique et
redynamisation de la section court-circuitee du Rhin a l’aval du barrage de
Kembs (Projets Interreg/EDF). Congres SHF: « Environnement et Hydro-
electricite », Lyon.
Pollen, N., Simon, A., 2005. Estimating the mechanical effects of riparian
vegetation on streambank stability using a fiber bundle model. Water
Resour. Res. 41, W07025. http://dx.doi.org/10.1029/2004WR003801.
Pugh, C.A., 2008. Appendix C: Sediment transport scaling for physical
models. In: Garcıa, M.H. (Ed.), Sedimentation Engineering: Processes,
Measurements, Modeling, and Practice, pp. 1057e1065.Pugh, C.A., Dodge, R.A., 1991. Design of sediment models. In: Proc. 5th
Federal Interagency Sedimentation, Federal Energy Regulatory Commis-
sion, Washington, DC.
Raudkivi, A.J., 1997. Ripples on stream bed. J. Hydraulic Eng. 123, 58e64.Recking, A., 2009. Theoretical development on the effects of changing flow
hydraulics on incipient bedload motion. Water Resour. Res. 45, W04401.
http://dx.doi.org/10.1029/2008WR006826.
Rinaldi, M., Casagli, N., 1999. Stability of stream banks formed in partially
saturated soils and effects of negative pore water pressures: the Sieve River
(Italy). Geomorphology 26, 253e277.
Rinaldi, M., Darby, S.E., 2007. Modelling river-bank erosion processes and
mass failure mechanisms: progress towards fully coupled simulations. In:
Habersack, H., Piegay, H., Rinaldi, M. (Eds.), Gravel-bed Rivers VI: From
Process Understanding to River Restoration. Elsevier, Amsterdam,
pp. 213e239.Rodgers, M.T., Lamm, D.M., Riiff, E.H., Davinroy, R.D., 2003. Sedimentation
Study of the Middle Mississippi River at Herculaneum, Missouri River
Miles 156.3 to 149.7-Hydraulic Micro Model Investigation. U.S. Army
Corps of Engineers (USACE). Technical Report MXX.
Shen, W.H., 1971. Modeling of fluvial processes. In: Shen, W.H. (Ed.), River
Mechanics, vol. II. Water Resources Publications, Colorado State Uni-
versity, Fort Collins, Colo.
Shen, H.W. (Ed.), 1991. Movable Bed Physical Models. Kluwer Academic,
Boston.
Simon, A., Collison, A.J.C., 2002. Quantifying the mechanical and hydrologic
effects of riparian vegetation on streambank stability. Earth Surf. Process.
Land. 27, 527e546.
Please cite this article in press as: El Kadi Abderrezzak, K., et al., A physical, mov
failure in rivers, Journal of Hydro-environment Research (2013), http://dx.doi.org
Simonett, S., Weitbrecht, V., 2011. Bed load transport in a physical scale
model of two merging mountain streams. In: Rowinski, Pawel, et al.
(Eds.), Experimental Methods in Hydraulic Research, Series: Geoplanet:
Earth and Planetary Sciences. Springer, Heidelberg, Berlin,
pp. 275e286.Song, C.C.S., Yang, C.T., 1979. Modeling of river with sediment transport. In:
Proc. Special Conference on Conservation and Utilization of Water and
Energy Resources, San Francisco.
Struiksma, N., Klaassen, G.J., 1986. Scale effects in the reproduction of the
overall bed topography in river models. In: IAHR Symposium on Scale
Effects in Modelling Sediment Transport Phenomena, Toronto.
Thorne, C.R., Abt, S.R., 1993. Analysis of riverbank instability due to toe
scour and lateral erosion. Earth Surf. Process. Land. 18, 835e843.
Van Rijn, L.C., 1984. Sediment transport, Part II: Suspended load transport. J.
Hydraulic Eng. 110, 1613e1641.
Van Rijn, L.C., 1993. Principles of Sediment Transport in Rivers, Estuaries
and Coastal Seas. Aqua Publications.
Waldron, R.L., 2005. Physical Modeling of Flow and Sediment Transport
using Distorted Scale Modeling. Master Thesis. Louisiana State
University.
Wallerstein, N.P., Alonso, C.V., Bennett, S.J., Thorne, C.R., 2001. Distorted
Froude scaled flume analysis of large woody debris. Earth Surf. Process.
Land. 26, 1265e1283.Wei, B-q., Uchijima, K., Hayakawa, H., 2001. A study on similarity laws of a
distorted river model with a movable bed. J. Hydrodyn. Ser. B 13 (1),
86e91.
Weitbrecht, V., Ruther, N., 2009. Laboratory and numerical model study on
sediment transfer processes in an expanding river reach. In: Proc. 33rd
IAHR Congress, Vancouver.
Wilcock, P.R., McArdell, B.W., 1993. Surface-based fractional transport rates:
mobilization thresholds and partial transport of sand-gravel sediment.
Water Resour. Res. 29, 1297e1312.
Woidt, J., Cox, A., Thornton, C., 2001. Evaluation of sedimentation and
erosion trends in the Sacramento river near the M&T/Llano seco pump
station. In: Proc. AGU Hydrology Days, April 2e5. Colorado State Uni-
versity, Fort Collins, CO.
Yalin, M.S., 1971. Theory of Hydraulic Models. Macmillan, London.
Young, W., Warburton, J., 1996. Principles and practice of hydraulic modelling
of braided gravel bed rivers. J. Hydrol. 35, 175e198.
able-bed model for non-uniform sediment transport, fluvial erosion and bank
/10.1016/j.jher.2013.09.004