A photoemission study of CoO-films on Au(1 1 1
10
A photoemission study of CoO-films on Au(1 1 1) S. Sindhu, M. Heiler, K.-M. Schindler * , H. Neddermeyer Fachbereich Physik, Martin-Luther-Universit€ at, Halle-Wittenberg, D-06099 Halle, Germany Received 30 April 2003; accepted for publication 2 July 2003 Abstract Angle-resolved ultraviolet photoemission spectroscopy has been used to study thin layers of Co and CoO on an Au(1 1 1) substrate. A bulk-like CoO layer was obtained for a nominal coverage of 7 ML Co, with Co evaporated in an oxygen atmosphere of 10 4 Pa and the Au(1 1 1) substrate at 350 K. Low-energy electron diffraction of this layer ex- hibits a (1 · 1) structure, indicating an unreconstructed CoO(1 1 1) surface. Considering the instability of a bulk-like terminated CoO surface, we assume stabilization by OH termination. At low coverage, the CoO layer is oxygen de- ficient and exhibits metallic character. For the bulk-like CoO layers we found band-like oxygen states and no detectable dispersion for the states near the Fermi edge, which is in agreement with previous investigations of single-crystalline CoO. Ó 2003 Elsevier B.V. All rights reserved. Keywords: Cobalt oxides; Angle resolved photoemission; Gold; Surface structure, morphology, roughness, and topography 1. Introduction The electronic structures of the late transition metal oxides-like NiO and CoO is essential for the understanding of their technical applications, such as lasers, sensors and catalysts [1–4]. The nature of their insulating character has been a highly con- troversial topic and has recently been related to a charge transfer process and strong correlation of the d electrons [5]. Previous experimental investi- gations on CoO were mainly performed on sur- faces of single crystals and cover X-ray and UV photoemission [6–13], electron energy loss studies of its electronic structure [14], and a low-energy electron diffraction (LEED) analysis of the geo- metric structure of the CoO(1 0 0) surface [15,16]. In most technical applications thin films of CoO are used. Therefore, there is considerable interest in the properties of CoO thin films and how they can be prepared. In addition, they have the ad- vantage that sample charging during measure- ments can be avoided and that polar surfaces such as the (1 1 1) surface can be prepared and studied. However, optimal preparation conditions such as the amount of Co, the substrate temperature and the oxygen pressure have to be determined. In order to study the electronic structure ex- perimentally, photoelectron spectroscopy (PES) is one of the most suited methods and has been used successfully in testing the electronic structure models of a wide variety of materials including oxides [17]. Since the electron correlation is high in * Corresponding author. Tel.: +49-345-552-5563; fax: +49- 345-552-7160. E-mail address: [email protected] (K.-M. Schindler). 0039-6028/$ - see front matter Ó 2003 Elsevier B.V. All rights reserved. doi:10.1016/S0039-6028(03)00917-8 Surface Science 541 (2003) 197–206 www.elsevier.com/locate/susc
Transcript of A photoemission study of CoO-films on Au(1 1 1

Surface Science 541 (2003) 197–206
www.elsevier.com/locate/susc
A photoemission study of CoO-films on Au(1 1 1)
S. Sindhu, M. Heiler, K.-M. Schindler *, H. Neddermeyer
Fachbereich Physik, Martin-Luther-Universit€aat, Halle-Wittenberg, D-06099 Halle, Germany
Received 30 April 2003; accepted for publication 2 July 2003
Abstract
Angle-resolved ultraviolet photoemission spectroscopy has been used to study thin layers of Co and CoO on an
Au(1 1 1) substrate. A bulk-like CoO layer was obtained for a nominal coverage of 7 ML Co, with Co evaporated in an
oxygen atmosphere of 10�4 Pa and the Au(1 1 1) substrate at 350 K. Low-energy electron diffraction of this layer ex-
hibits a (1 · 1) structure, indicating an unreconstructed CoO(1 1 1) surface. Considering the instability of a bulk-liketerminated CoO surface, we assume stabilization by OH termination. At low coverage, the CoO layer is oxygen de-
ficient and exhibits metallic character. For the bulk-like CoO layers we found band-like oxygen states and no detectable
dispersion for the states near the Fermi edge, which is in agreement with previous investigations of single-crystalline
CoO.
� 2003 Elsevier B.V. All rights reserved.
Keywords: Cobalt oxides; Angle resolved photoemission; Gold; Surface structure, morphology, roughness, and topography
1. Introduction
The electronic structures of the late transition
metal oxides-like NiO and CoO is essential for the
understanding of their technical applications, suchas lasers, sensors and catalysts [1–4]. The nature of
their insulating character has been a highly con-
troversial topic and has recently been related to a
charge transfer process and strong correlation of
the d electrons [5]. Previous experimental investi-
gations on CoO were mainly performed on sur-
faces of single crystals and cover X-ray and UV
photoemission [6–13], electron energy loss studies
* Corresponding author. Tel.: +49-345-552-5563; fax: +49-
345-552-7160.
E-mail address: [email protected] (K.-M.
Schindler).
0039-6028/$ - see front matter � 2003 Elsevier B.V. All rights reserv
doi:10.1016/S0039-6028(03)00917-8
of its electronic structure [14], and a low-energy
electron diffraction (LEED) analysis of the geo-
metric structure of the CoO(1 0 0) surface [15,16].
In most technical applications thin films of CoO
are used. Therefore, there is considerable interestin the properties of CoO thin films and how they
can be prepared. In addition, they have the ad-
vantage that sample charging during measure-
ments can be avoided and that polar surfaces such
as the (1 1 1) surface can be prepared and studied.
However, optimal preparation conditions such as
the amount of Co, the substrate temperature and
the oxygen pressure have to be determined.In order to study the electronic structure ex-
perimentally, photoelectron spectroscopy (PES) is
one of the most suited methods and has been used
successfully in testing the electronic structure
models of a wide variety of materials including
oxides [17]. Since the electron correlation is high in
ed.

198 S. Sindhu et al. / Surface Science 541 (2003) 197–206
CoO, readjustments occur after the emission of a
photoelectron and PES monitors an exited state of
the electron system. The configuration-interaction
(CI) model [18] can describe some features of the
photoemission spectra very accurately; in particu-
lar final state effects can properly be taken intoaccount. The most important result of the config-
uration-interaction model is that the first ioniza-
tion state of CoO involves ionization of O 2p
states. Consequently, the electronic structure of
CoO is considered a charge-transfer system [18].
Starting with an O 2p6 and Co 3d7 occupation in
the ground state, the electronic structure and the
photoemission spectra of CoO can be described asfollows: the Co 3d-band splits into localized sub-
bands through a repulsive two electron Coulomb
interaction associated with the energy U. The
lower band, situated below the Fermi edge, is fully
occupied and the upper band is above the Fermi
level and consequently empty. However, the mix-
ing and hybridization of the metal 3d-states with
the ligand (L) 2p-states has to be taken into ac-count as well and leads to the dnL notation. This
results in two final states in photoemission: (i) d6L
and (ii) d7L�1. The first one (d6L), the so-called
unscreened channel, has been assigned to the
�satellite� structure in the photoemission spectrumat about )10 eV by means of resonant photo-
emission spectroscopy. This technique uses the
phenomenon of enhancements or suppressions ofphotoemission features by opening a new emission
channel. Actually for CoO, this feature is reso-
nantly enhanced, when the photon energy reaches
the 3p to 3d absorption threshold (about 60 eV)
due to the following process: 3p63d7 + hm to 3p53d8
and further the decay 3p53d8 to 3p63d6 [19]. The
second channel (ii) involves the screening of the d-
band hole through a charge transfer from the li-gand to the localized metal ion, associated with the
charge transfer energy D. In experimental spectrathe resulting emission line is located near the
Fermi edge at )1.7 eV [19]. Consequently, the gapis formed between this d7L�1 state and the lowest
free state of the conduction band (d8). The mag-
nitude of the gap is given by the amount of the
charge transfer energy D and CoO should there-fore be considered as a charge transfer insula-
tor. Despite of this successful description of the
photoemission spectra, we have to keep in mind
that the configuration-interaction model is local-
ized in nature, hence it is not possible to describe
any kind of EðkÞ-dispersions of the bands, whichhas been found experimentally, in particular the
dispersion of the O 2p derived states.In this paper we have used angle-resolved
ultraviolet photoemission spectroscopy (ARUPS)
to investigate thin films of Co and CoO on an
Au(1 1 1) substrate following our work on NiO
layers on Au(1 1 1) [20,21]. In particular, the oxy-
gen partial pressure dependence while growth as
well as the influence of substrate temperature and
film thickness were studied. Finally, we present theangle-resolved UV photoemission spectra of a
bulk-like CoO(1 1 1) film.
2. Experimental
The angle-resolved ultraviolet photoemission
studies were performed using an ultra high vac-
uum (UHV) experimental setup consisting of two
chambers, one for sample preparation and the
other for photoemission experiments. The base
pressure was in the lower 10�8 Pa region. In orderto cut down the time for vacuum recovery after
elevated pressure conditions during preparation, a
valve allows to separate the chambers and a transfer
manipulator was used to move the sample between
the two chambers. The temperature of the sample
could be varied between room temperature (RT)
and 1000 K by radiative heating by a hot filament
close to the backside of the sample holder plate.The temperature of the sample was monitored by a
thermocouple. The Au(1 1 1) sample was cleaned
in-situ by Arþ ion bombardment and subsequent
heating up to 900 K. Its cleanliness was verified by
Auger electron spectroscopy and LEED. The
(23�p3) LEED pattern obtained is well docu-
mented for a clean Au(1 1 1) surface and stems
from the so called herringbone reconstruction [22].Co was evaporated from an effusion cell at a
rate of 1 ML/min. The amount deposited was
monitored using a quartz microbalance. All indi-
cated thicknesses in this paper correspond to the
nominal coverage of Co on Au(1 1 1), whereby we
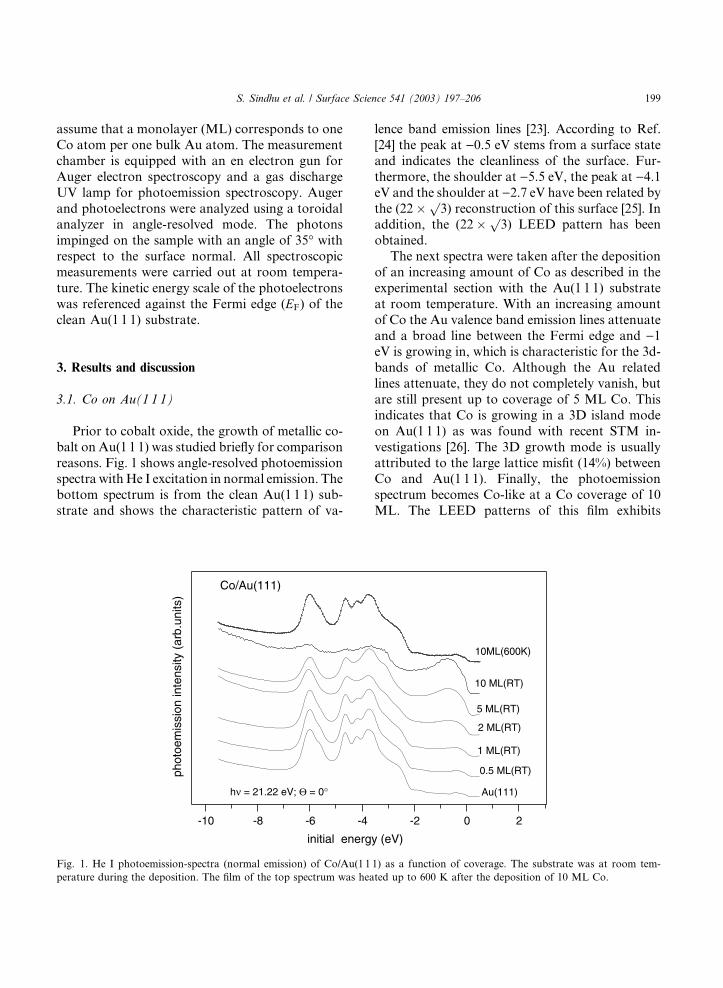
S. Sindhu et al. / Surface Science 541 (2003) 197–206 199
assume that a monolayer (ML) corresponds to one
Co atom per one bulk Au atom. The measurement
chamber is equipped with an en electron gun for
Auger electron spectroscopy and a gas discharge
UV lamp for photoemission spectroscopy. Auger
and photoelectrons were analyzed using a toroidalanalyzer in angle-resolved mode. The photons
impinged on the sample with an angle of 35� withrespect to the surface normal. All spectroscopic
measurements were carried out at room tempera-
ture. The kinetic energy scale of the photoelectrons
was referenced against the Fermi edge (EF) of theclean Au(1 1 1) substrate.
3. Results and discussion
3.1. Co on Au(1 1 1)
Prior to cobalt oxide, the growth of metallic co-
balt on Au(1 1 1) was studied briefly for comparison
reasons. Fig. 1 shows angle-resolved photoemissionspectra withHe I excitation in normal emission. The
bottom spectrum is from the clean Au(1 1 1) sub-
strate and shows the characteristic pattern of va-
phot
oem
issi
on in
tens
ity (
arb.
units
)
-10 -8 -6 -4
initial energ
Co/Au(111)
hν = 21.22 eV; Θ = 0°
Fig. 1. He I photoemission-spectra (normal emission) of Co/Au(1 1
perature during the deposition. The film of the top spectrum was hea
lence band emission lines [23]. According to Ref.
[24] the peak at )0.5 eV stems from a surface stateand indicates the cleanliness of the surface. Fur-
thermore, the shoulder at )5.5 eV, the peak at )4.1eV and the shoulder at )2.7 eV have been related bythe (22�p
3) reconstruction of this surface [25]. Inaddition, the (22�p
3) LEED pattern has been
obtained.
The next spectra were taken after the deposition
of an increasing amount of Co as described in the
experimental section with the Au(1 1 1) substrate
at room temperature. With an increasing amount
of Co the Au valence band emission lines attenuate
and a broad line between the Fermi edge and )1eV is growing in, which is characteristic for the 3d-
bands of metallic Co. Although the Au related
lines attenuate, they do not completely vanish, but
are still present up to coverage of 5 ML Co. This
indicates that Co is growing in a 3D island mode
on Au(1 1 1) as was found with recent STM in-
vestigations [26]. The 3D growth mode is usually
attributed to the large lattice misfit (14%) betweenCo and Au(1 1 1). Finally, the photoemission
spectrum becomes Co-like at a Co coverage of 10
ML. The LEED patterns of this film exhibits
-2 0 2
y (eV)
0.5 ML(RT)
Au(111)
1 ML(RT)
5 ML(RT)
2 ML(RT)
10 ML(RT)
10ML(600K)
1) as a function of coverage. The substrate was at room tem-
ted up to 600 K after the deposition of 10 ML Co.

200 S. Sindhu et al. / Surface Science 541 (2003) 197–206
rather broad (1 · 1) spots of a Co(1 1 1) surfacewith an increased diffuse background indicating a
large degree of disorder.
The top spectrum is taken after the deposition
of 10 ML Co with the Au(1 1 1) substrate at 600 K.
This spectrum clearly resembles the bottom spec-trum of the clean Au(1 1 1) surface, including all
details of surface states and lines typical for the
(22�p3) reconstruction. Obviously, Co diffused
into the bulk of the Au substrate during deposi-
tion. This appears to be in contrast to Mamy et al.
[27], who found the growth of a closed overlay at
this substrate temperature. However, we relate this
to the following difference between their work andour: their Au substrate consisted of a thin Au film
of 10 nm thickness deposited onto an MoS2 sub-
strate, whereas we used a bulk single crystal.
Mamy et al. [27] reported indications for some
intermixing of Co and Au. Their amount of Co
might be enough to saturate the Au thin film and
enough excess Co would be left over to form the
film even at 600 K. In our case, however, thesubstrate crystal would act as a quasi-infinite sink
for Co, which cannot be saturated by the amount
phot
oem
issi
on in
tens
ity (
arb.
uni
ts)
-10 -8 -6 -4
initial ene
5 ML Co/Au(111) + O2
hν = 21.22eV; Θ = 0˚
Fig. 2. He I photoemission-spectra (normal emission) of 5 ML Co/A
room temperature during the deposition. The film of the top spectrum
for 20 min).
of Co deposited. As a result of this, all Co de-
posited would diffuse into the bulk and none can
be observed on the surface.
3.2. CoO on Au(1 1 1) (oxygen partial pressure
dependence)
In order to determine the oxygen partial pres-
sure, which is necessary to form a cobalt oxide
layer, 5 ML Co were evaporated at different oxy-
gen partial pressures. He I photoemission spectra
in normal emission have been recorded in order to
characterize the resulting film as shown in Fig. 2.
Again, the bottom spectrum is from the bareAu(1 1 1) substrate and serves as a reference for the
Au emission lines. The next three spectra are from
Co films, which were deposited onto the Au(1 1 1)
substrate at room temperature with increasing
oxygen partial pressures. The top spectrum is from
a Co film, which was oxidized after the deposition.
After deposition in 10�6 Pa oxygen the spectrum
(second from bottom in Fig. 2) is composed ofslightly modified Au lines and a new line between
the Fermi edge and )1.0 eV. Comparison with Fig.
-2 0 2
rgy (eV)
Au(111)
10-6
Pa
10-5
Pa
10-4
Pa
600L O2
400K, 20'
u(1 1 1) as a function of oxygen pressure. The substrate was at
was oxidized after the deposition of a Co film (600 L O2 at 400 K

S. Sindhu et al. / Surface Science 541 (2003) 197–206 201
1 reveals that the spectrum is actually identical to
the one where the same amount (5 ML) of metallic
Co was deposited. Obviously, an oxygen partial
pressure of 10�6 Pa is not sufficient to oxidize Co
to any noticeable extend. Deposition in 10�5 Pa
oxygen leads to quite a different spectrum (centerin Fig. 2). The emission lines of Au and metallic
Co are strongly attenuated and the spectrum is
close to that of bulk CoO with a prominent
shoulder at )1.7 eV. However, a more detailedinspection reveals the existence of states close to
the Fermi edge, which might be due to metallic Co
or oxygen defects in CoO. Both cases indicate in-
complete oxidation of the Co, which is actuallyconfirmed by the next spectrum (second from top
in Fig. 2) obtained after deposition in 10�4 Pa O2,
which is CoO-like together with the states at the
Fermi edge completely vanishing. In summary, the
three spectra monitor the transition from a layer of
metallic Co to one of insulating CoO. This shows
that an O2 partial pressure of 10�4 Pa during de-
position is required to completely oxidize a Colayer of 5 ML on Au(1 1 1).
Finally, a metallic Co layer of 5 ML on
Au(1 1 1) was exposed to 600 mbar �O2 and sub-sequently annealed at 400 K for 10 min (post-ox-
idation). Besides the characteristic CoO state at
)1.7 eV the He I photoemission spectrum of this
phot
oem
issi
on in
tens
ity (
arb.
uni
ts)
-10 -8 -6 -4
initial ene
hν = 21.22eV; Θ = 0˚
7 ML CoO/Au(111)
Fig. 3. He I photoemission spectra (normal emission) of 7 ML CoO/A
(measured at room temperature).
layer (top one in Fig. 1) also shows Au states at
)6.0 and )4.6 eV. This indicates that parts of theAu(1 1 1) substrate are covered by much less than 5
CoO layers and that 3D islands of CoO are
formed. This shows that the co-evaporation tech-
nique is better suited to obtain CoO films, whichcompletely cover the substrate, in analogy to the
findings with NiO [28]. The 3D islands, once
formed during the deposition of the metallic Co,
cannot be transformed into a smooth layer of CoO
by post oxidation. Finally it is worth mentioning
that no charging of the sample was observed.
3.3. CoO on Au(1 1 1) (substrate temperature
dependence)
Supposedly, the structure of the CoO film
does not reflect its thermodynamic equilibrium but
is strongly determined by the growth process.
Therefore, the dependence of the film structures on
the substrate temperature needs to be investigated.
In order to do so, CoO films were prepared with theAu(1 1 1) substrate at four different temperatures,
i.e. room temperature (RT), 350, 500 and 600 K.
Again, the Co was deposited in 10�4 Pa O2. Fig. 3
presents the corresponding series of He I spectra in
normal emission of 7 ML CoO/Au(1 1 1). The
spectrum obtained after deposition at 600 K is very
-2 0 2
rgy (eV)
RT
350K500K
600K
TAu(111)
u(1 1 1) as a function of substrate temperature during deposition

202 S. Sindhu et al. / Surface Science 541 (2003) 197–206
different from all the others. It actually resembles
the spectrum of the clean, (22�p3) reconstructed
Au(1 1 1) surface (see Fig. 2) remarkably well. All
the Au related emission lines are present including
the characteristic ones for the (22�p3) recon-
struction of the surface. Only the shape of the lineclose to the Fermi edge is different. It is less struc-
tured and compares quite well with the one of
metallic Co. This indicates that the surface mainly
consists of the clean, (22�p3) reconstructed
Au(1 1 1) surface and only a small amount of sup-
posedly metallic Co is present on the surface. This
finding is confirmed by Auger electron spectros-
copy. (The spectra are not shown here.) The AuNOO Auger line at 65 eV becomes clearly evident
and the Co MVV Auger line at 47 eV strongly at-
tenuates. Two models are in accordance with these
results: (a) clustering of CoO islands so that the
visible Au surface area becomes larger than the
surface of the CoO islands or (b) surface segrega-
tion of Au occurs. Although the latter is known
from the Co/Au(1 1 1) system [33], further investi-gations with other methods are needed to answer
this question beyond any doubt.
The spectra from the films deposited at RT, 350
and 500 K are quite similar to each other. A closer
phot
oem
issi
on in
tens
ity (
arb.
uni
ts)
-10 -8 -6 -4initial energy
CoO/Au(111)
hν = 21.22 eV; Θ = 0°
Fig. 4. CoO/Au(1 1 1), grown at 300 K substrate temperature in an oxy
emission) as a function of film thickness.
inspection reveals, however, that the film deposited
at 500 K has more intensity at the Fermi edge than
the others and there is a small but clearly visible
contribution of the Au line at )6 eV. This indicatesthat the pronounced changes of the 600 K film are
starting already at 500 K. The spectrum of the RTfilm has a stronger contribution of the Au line at
)6 eV than the 350 K film. This indicates that thisfilm is rougher than the film grown at 350 K be-
cause a higher roughness results in a smaller
overall attenuation of the substrate emission lines.
In summary, the film deposited at 350 K ap-
pears to have the most expressed CoO spectrum
with the smallest contribution from the Au sub-strate. Furthermore, the film shows a clear (1 · 1)LEED pattern of a (1 1 1) surface with little
background, indicating a well-ordered film.
3.4. CoO on Au(1 1 1) (thickness dependence)
In order to study the thickness dependence of
the film growth, a series of oxidized Co films wasevaporated onto the Au(1 1 1) substrate at room
temperature in an oxygen atmosphere of 10�4 Pa.
Fig. 4 shows the corresponding He I photoemis-
sion spectra in normal emission.The spectra shown
-2 0 2 (eV)
Au(111)
2 ML
1 ML
5 ML
7 ML
3 ML
gen atmosphere of 10�4 Pa: He I photoemission spectra (normal

5.5
5.0
4.5
4.0
3.5
wor
k fu
nctio
n (e
V)
1086420
Co coverage (ML)
CoO/Au(111)
ΦAu(111)
ΦCoO
Fig. 6. CoO/Au(1 1 1), grown at 300 K substrate temperature in
an oxygen atmosphere of 10�4 Pa: work function as a function
of Co coverage.
S. Sindhu et al. / Surface Science 541 (2003) 197–206 203
in the figure are normalized to the maximum in-
tensity. With an increasing amount of oxidized Co
deposited the Au emission lines are attenuated and
the CoO related emission lines at )1.7 and )5 eVincrease. However, an additional line close to the
Fermi edge is present at coverages of 1, 2 and 3ML. This suggests, that at least the Co atoms of
the first layer do not form an oxide with insulating
properties. This is confirmed by the coverage de-
pendence of the intensity ratio of the Co LMM
and O KLL Auger emission lines (Fig. 5). It is
clearly revealed that the oxide is O deficient at low
coverage. This indicates that the reactivity of the
first layer Co atoms towards O is reduced, possiblyby the interaction of the Co with the Au substrate
or even some kind of alloy formation. Higher Co
coverages are required for the formation of CoO
with bulk-like, insulating properties. These find-
ings are further supported by work function
measurement as shown in Fig. 6. The bare sub-
strate surface exhibits the expected work function
for Au of 5.31 eV [29]. At a coverage of 1 ML thework function is reduced to 4.9 eV, which corre-
sponds much better to that of metallic Co than
that of CoO (3.7 eV) [30]). At least 2, maybe even 3
ML of CoO are required to reduce the work
function to that value.
The fact that there is Co excess at low coverages
gives some insight about the structure of the
3.0
2.5
2.0
1.5
1.0
0.5
0.0
I (O
-KLL
, 510
eV
) / I
(C
o-LM
M, 7
75 e
V)
1086420
Co coverage (ML)
CoO/Au(111)
Fig. 5. CoO/Au(1 1 1), grown at 300 K substrate temperature in
an oxygen atmosphere of 10�4 Pa: intensity ratio of Co MNN
and O KLL Auger electron lines as a function of Co coverage.
Au/CoO interface. Assuming bulk truncation of
the Au substrate and the CoO, there are two
possibilities for the interface structure. Either theCoO film starts with a densely packed layer of O
or with one of Co. As a starting point one can
consider the energetics of bonds between Au and
Co or O. The formation of Au/Co alloys and the
weak adsorption of O on Au and the fact that Au
oxide easily decomposes indicate that the ener-
getics favor the bonds between Co and Au com-
pared to bonds between O and Au. Therefore, onewould expect that the CoO film starts with a layer
of Co. In line with this expectation, the ratio of the
Auger emission lines of Co and O show a corre-
sponding excess of Co at low coverages. However,
more direct evidence about the interface structure
and more details is clearly desired.
Another interesting finding is revealed by
comparing the spectra of the metallic Co and theoxidized Co at a coverage of 1 ML. Whereas the
spectrum with metallic Co still shows the Au
emission lines (Fig. 1), which are related to the
(22�p3) reconstruction of the Au(1 1 1) surface,
these lines are absent in the spectra of the oxidized
Co (Fig. 4). This indicates that the oxidized Co
grows in a layer-by-layer mode to a larger extend
than the metallic Co and covers more of theAu(1 1 1) surface, whereby lifting a larger area with
the (22�p3) reconstruction of the Au surface.

204 S. Sindhu et al. / Surface Science 541 (2003) 197–206
3.5. Angle-resolved photoemission spectroscopy of
CoO on Au(1 1 1)
Finally, we discuss the angle-resolved photo-
emission spectra and the assignment of thephotoemission lines of a CoO film with a thickness
of 10 ML and grown at a substrate temperature of
350 K (Fig. 7). Five different emission lines can
clearly be identified, labeled A, B, C, D and E. As
discussed in the introduction, the line at the Fermi
edge ()1.7 eV), labeled A, is assigned to the chargetransfer d7L�1 final state. Within the detection
limits of our experiment we find no dispersion withrespect to kk for this state. This is the expectedbehavior because the corresponding initial states
are supposed to be localized. The assignment of
emission line B ()3.65 eV) is more complex. Ex-perimentally we do not find any dispersion with
respect to kk similar to emission line A. This linewas also found in the spectra of [1 0 0] surfaces of
bulk CoO by several groups [19,31,32]. Hence, weconclude that the emission line B is not a feature
specific to the CoO(1 1 1) surface but is a general
feature of CoO. However, the charge transfer
phot
oem
issi
on in
tens
ity (
arb
units
)
-12 -10 -8 -6
initial energ
CoO(111)
DEhν = 21.22 eV; Γ L K
Fig. 7. Angle-resolved photoemission spectra of 10 ML CoO/Au(1 1
sphere of 10�4 Pa.
model fails to predict this feature. One proposal is
that line A and B both relate to the same charge
transfer mechanism with a d7L�1 final state and
that their separation is due to a crystal or ligand
field splitting similar to that of the d8L�1 state of
NiO. The next lines to discuss are the emissionlines C and D. Emission line C clearly shows dis-
persion with respect to kk. Emission line D can
only be clearly distinguished in a limited range of
high emission angles. Within this range no dis-
persion can be observed. For an assignment of the
lines we again compare our spectra with the ones
from CoO(1 0 0) surfaces. There, two dispersing
emission lines were found in this energy range andassigned to delocalized O 2p bands. This clearly
suggests that the emission line C in our spectra
corresponds to the upper O 2p band. Unfortu-
nately, the assignment of line D is less clear. We
suggest that it corresponds to the lower O 2p band
although we cannot detect the expected dispersion.
The reason for this might be that the intensity of
this band becomes to small to be detected at otherangles or that it merges in a very narrow range of
angle with emission line C. Finally, we assign the
-4 -2 0
y (eV)
90°
0°
45°
AB
C
1), grown at 350 K substrate temperature in an oxygen atmo-

S. Sindhu et al. / Surface Science 541 (2003) 197–206 205
emission line E at )10.7 eV, which does not showany dispersion, to the unscreened emission from
Co 3d states in accordance to the interpretation of
the spectra of the CoO(1 0 0) surface in the litera-
ture.
An important topic of (1 1 1) surfaces of fcctransition metal oxides is the surface termination.
In this plane the bulk crystal lattice can be termi-
nated with a close packed layer of either Co atoms
or O atoms. Both terminations are polar due to
their excess charge of opposite sign and are ex-
pected to have high surface energies. The NiO(1 1 1)
surface, for example, avoids such an unfavorable
polar termination by the formation of an octopolar(2· 2) reconstruction [33,34]. Our investigations donot show any direct evidence for the preferred ter-
mination. Another possibility is the termination of
the surface with OH� groups, which we cannot rule
out complete because they could be formed via re-
actions of excess oxygen left over from the deposi-
tion with components of the residual gas, for
example the dissociative adsorption of water orthe reaction with hydrogen. According to the liter-
ature the presence of OH� groups leads to two
emission lines with binding energies somewhere
between 5 and 10 eV and a separation of 3–4 eV
[31,35]. Although there is no direct evidence for
such additional emission lines, they might be
masked by other emission lines, in particular
emission line D.
4. Summary
We obtained bulk-like CoO(1 1 1) layers by the
evaporation of at least 7 ML of Co in an oxygen
atmosphere of 10�4 Pa onto an Au(1 1 1) substrate
at 350 K. At coverages lower than 3 ML the oxi-
dation of Co appears to be incomplete. In agree-
ment with STM measurements [26], we suggestthat the CoO/Au(1 1 1) interface is Co terminated.
The Co atoms of the first layer are likely to be
stabilized by the Au surface, so that each of them
has only 3 neighboring oxygen atoms as compared
to six of the bulk CoO structure. This might result
in Co derived states at the Fermi edge. Further-
more, the polar CoO(1 1 1) surface is probably
stabilized by an OH termination. At higher sub-
strate temperatures the ARUP spectra become
Au(1 1 1)-like, which indicates either segregation of
Au to the surface or clustering of CoO, resulting in
a larger surface contribution of Au.
Acknowledgements
The authors are grateful to thank I. Sebastian
and K. Meinel for supporting discussions about
their STM investigations and to the members of
our group for the stimulating atmosphere. Special
thanks go to Ch. Jeckstiess for her valuable tech-
nical support. This work was financially supportedthrough the Forschergruppe FG 404 ‘‘Oxidische
Grenzfl€aachen’’.
References
[1] A.A. Kaminskii, Laser Crystals, Springer Verlag, Berlin,
1981.
[2] K. Nakamoto, Y. Kawato, Y. Suzuki, Y. Hamakawa, T.
Kawabe, K. Fujimoto, M. Fuyama, Y. Sugita, IEEE
Trans. Magn. 32 (1996) 3374.
[3] V.E. Henrich, P.A. Cox, The Surface Science of Metal
Oxides, Cambridge University Press, Cambridge, 1994.
[4] H.-J. Freund, H. Kuhlenbeck, V. Staemmler, Rep. Prog.
Phys. 59 (1996) 283.
[5] M.A. van Veenendaal, G.A. Sawatzky, Phys. Rev. Lett. 70
(1993) 2462.
[6] M. McKay, M.H. Mohamed, V.E. Henrich, Phys. Rev. B
35 (1987) 283.
[7] J.M. McKay, Ph.D. Thesis, Yale University, 1986.
[8] K.S. Kim, Phys. Rev. B 11 (1975) 2177.
[9] G.K. Wertheim, H.J. Guggenheim, S. H€uufner, Phys. Rev.
Lett. 30 (1973) 1050.
[10] G.K. Wertheim, S. H€uufner, Phys. Rev. Lett. 28 (1972)
1028.
[11] T.J. Chuang, C.R. Brundle, D.W. Rice, Surf. Sci. 59 (1976)
413.
[12] J. Haber, L. Ungier, J. Electron. Spectrosc. Relat. Phenom.
9 (1976) 459.
[13] J. Haber, L. Ungier, J. Electron. Spectrosc. Relat. Phenom.
12 (1977) 305.
[14] D.E. Eastman, J.L. Freeouf, Phys. Rev. Lett. 34 (1975)
395.
[15] R.C. Felton, M. Prutton, S.P. Tera, M.R. Welton-Cook,
Surf. Sci. 88 (1979) 474.
[16] M. Prutton, J.A. Walker, M.R. Welton-Cook, R.C.
Felton, J.A. Ramsey, Surf. Sci. 89 (1979) 95.
[17] N.B. Brookes, D.S.-L. Law, T.S. Padmore, D.R. Warbur-
ton, G. Thornton, Solid State Commun. 57 (1986) 473.

206 S. Sindhu et al. / Surface Science 541 (2003) 197–206
[18] A. Fujimori, F. Minami, Phys. Rev. B 30 (1984) 957.
[19] Z.-X. Shen, J.W. Allen, P.A.P. Lindberg, D.S. Dessau,
B.O. Wells, A. Borg, W. Ellis, J.S. Kang, S.-J. Oh, I.
Lindau, W.E. Spicer, Phys. Rev. B 42 (1990) 1817.
[20] K. Marre, H. Neddermeyer, Surf. Sci. 287/288 (1993)
995.
[21] Th. Bertrams, H. Neddermeyer, J. Vac. Sci. Technol. B 14
(1996) 1141.
[22] U. Harten, A.M. Lahee, J.P. Toennies, C. W€ooll, Phys. Rev.
Lett. 54 (1985) 2619.
[23] R. Courths, H.-G. Zimmer, A. Goldmann, H. Saalfeld,
Phys. Rev. B 34 (1986) 3577.
[24] P. Heimann, H. Neddermeyer, H. Roloff, J. Phys. C: Solid
State Phys. 10 (1977) L17.
[25] H.-G. Zimmer, A. Goldmann, R. Courths, Surf. Sci. 176
(1986) 115.
[26] I. Sebastian, M. Heiler, K. Meinel, H. Neddermeyer, Appl.
Phys. A 66 (1998) 525.
[27] R. Mamy, B. Carricaburu, J. Phys.: Condens. Matter 5
(1993) 6537.
[28] K. Marre, H. Neddermeyer, A. Chass�ee, P. Rennert, Surf.Sci. 357–358 (1996) 233.
[29] J. H€oolzl, F.K. Schulte (Eds.), Work Function in Modern
Physics in Solid Surface Physics, Springer Tracts in
Modern Physics, Springer, Berlin, 1970.
[30] B. Klingenberg, F. Grellner, D. Borgmann, G. Wedler,
Surf. Sci. 296 (1993) 374.
[31] J.L. Mackay, V.E. Henrich, Phys. Rev. B 39 (1989) 6156.
[32] G. Thornton, N.B. Brookes, D.S.-L. Law, D.R. Warbur-
ton, P.L. Wincott, Phys. Scr. 41 (1990) 625.
[33] C.A. Ventrice Jr., Th. Bertrams, H. Hannemann, A.
Brodde, H. Neddermeyer, Phys. Rev. B 49 (1994) 5773.
[34] A. Barbier, C. Mocuta, H. Kuhlenbeck, K.F. Peters,
B. Richter, G. Renaud, Phys. Rev. Lett. 84 (2000) 2897.
[35] F. Rohr, K. Wirth, J. Libuda, D. Cappus, M. B€aaumer,
H.J. Freund, Surf. Sci. 315 (1994) L977.