A novel method to capture the onset of dynamic electrocardiographic ischemic changes and its...
14
A Novel Method to Capture the Onset of Dynamic Electrocardiographic Ischemic Changes and its Implications to Arrhythmia Susceptibility Omid Sayadi, PhD; Dheeraj Puppala, MD; Nosheen Ishaque, MD; Rajiv Doddamani, MD; Faisal M. Merchant, MD; Conor Barrett, MD; Jagmeet P. Singh, MD, PhD; E. Kevin Heist, MD, PhD; Theofanie Mela, MD; Juan Pablo Mart ınez, PhD; Pablo Laguna, PhD; Antonis A. Armoundas, PhD Background-—This study investigates the hypothesis that morphologic analysis of intracardiac electrograms provides a sensitive approach to detect acute myocardial infarction or myocardial infarction-induced arrhythmia susceptibility. Large proportions of irreversible myocardial injury and fatal ventricular tachyarrhythmias occur in the first hour after coronary occlusion; therefore, early detection of acute myocardial infarction may improve clinical outcomes. Methods and Results- —We developed a method that uses the wavelet transform to delineate electrocardiographic signals, and we have devised an index to quantify the ischemia-induced changes in these signals. We recorded body-surface and intracardiac electrograms at baseline and following myocardial infarction in 24 swine. Statistically significant ischemia-induced changes after the initiation of occlusion compared with baseline were detectable within 30 seconds in intracardiac left ventricle (P<0.0016) and right ventricle–coronary sinus (P<0.0011) leads, 60 seconds in coronary sinus leads (P<0.0002), 90 seconds in right ventricle leads (P<0.0020), and 360 seconds in body-surface electrocardiographic signals (P<0.0022). Intracardiac leads exhibited a higher probability of detecting ischemia-induced changes than body-surface leads (P<0.0381), and the right ventricle–coronary sinus configuration provided the highest sensitivity (96%). The 24-hour ECG recordings showed that the ischemic index is statistically significantly increased compared with baseline in lead I, aVR, and all precordial leads (P<0.0388). Finally, we showed that the ischemic index in intracardiac electrograms is significantly increased preceding ventricular tachyarrhythmic events (P<0.0360). Conclusions-—We present a novel method that is capable of detecting ischemia-induced changes in intracardiac electrograms as early as 30 seconds following myocardial infarction or as early as 12 minutes preceding tachyarrhythmic events. ( J Am Heart Assoc. 2014;3:e001055 doi: 10.1161/JAHA.114.001055) Key Words: ECG delineation • intracardiac signals • ischemic index • myocardial infarction • wavelet transform M yocardial ischemia (MI) may establish the substrate for fatal ventricular tachyarrhythmic events (VTEs) both acutely and over the long term. 1,2 Early diagnosis and risk stratification of patients with acute MI is essential to guide prompt intervention and optimal clinical outcome. Electrocardiographic ST-segment monitoring has been used widely to detect acute MI. 3,4 In the standard 12-lead ECG, ST-segment deviation is the most common determinant of ongoing ischemia 5,6 and a strong predictor of associated mortality. 7 Sensitivity in detecting acute MI, however, remains inadequately low. 8–10 Whether it is due to the variability of the ischemia-induced changes in various ECG leads, as shown by body-surface potential mapping 11 or the inaccuracy in detecting the elevated J-points, 12 body-surface ECGs may not reveal subendocardial 13 and even severe transmural ischemia. 14 With the advent of the implantable cardioverter defibrilla- tor, defibrillation of ventricular tachyarrhythmias has resulted in significant improvements in survival. 15 Recent evidence From the Division of Cardiology, Massachusetts General Hospital, Harvard Medical School, Boston, MA (O.S., D.P., N.I., R.D., A.A.A); Cardiology Division, Emory University School of Medicine, Atlanta, GA (F.M.M); Division of Cardiology, Cardiac Arrhythmia Service, Massachusetts General Hospital, Boston, MA (C.B., J.P.S., E.K.H., T.M.); Biomedical Signal Interpretation & Computational Simulation (BSICoS) Group, Aragon Institute of Engineering Research, IIS Arag on, University of Zaragoza, Zaragoza, Aragon, Spain (J.P.M., P.L.); Centro de Investigaci on Biom edica en Red en Bioingenier ıa, Biomateriales y Nanomedicina (CIBER-BBN), Zaragoza, Aragon, Spain (J.P.M., P.L.). The content is solely the responsibility of the authors and does not necessarily represent the official views of Harvard Catalyst, Harvard University and its affiliated academic health care centers, or the National Institutes of Health. Correspondence to: Antonis A. Armoundas, PhD, Cardiovascular Research Center, Massachusetts General Hospital, 149 13th Street, Charlestown, MA 02129. E-mail: [email protected] Received May 5, 2014; accepted June 3, 2014. ª 2014 The Authors. Published on behalf of the American Heart Association, Inc., by Wiley Blackwell. This is an open access article under the terms of the Creative Commons Attribution-NonCommercial License, which permits use, distribution and reproduction in any medium, provided the original work is properly cited and is not used for commercial purposes. DOI: 10.1161/JAHA.114.001055 Journal of the American Heart Association 1 ORIGINAL RESEARCH by guest on June 7, 2016 http://jaha.ahajournals.org/ Downloaded from
-
Upload
independent -
Category
Documents
-
view
4 -
download
0
Transcript of A novel method to capture the onset of dynamic electrocardiographic ischemic changes and its...
A Novel Method to Capture the Onset of Dynamic ElectrocardiographicIschemic Changes and its Implications to Arrhythmia SusceptibilityOmid Sayadi, PhD; Dheeraj Puppala, MD; Nosheen Ishaque, MD; Rajiv Doddamani, MD; Faisal M. Merchant, MD; Conor Barrett, MD;Jagmeet P. Singh, MD, PhD; E. Kevin Heist, MD, PhD; Theofanie Mela, MD; Juan Pablo Mart�ınez, PhD; Pablo Laguna, PhD;Antonis A. Armoundas, PhD
Background-—This study investigates the hypothesis that morphologic analysis of intracardiac electrograms provides a sensitiveapproach to detect acute myocardial infarction or myocardial infarction-induced arrhythmia susceptibility. Large proportions ofirreversible myocardial injury and fatal ventricular tachyarrhythmias occur in the first hour after coronary occlusion; therefore, earlydetection of acute myocardial infarction may improve clinical outcomes.
Methods and Results-—We developed a method that uses the wavelet transform to delineate electrocardiographic signals, andwe have devised an index to quantify the ischemia-induced changes in these signals. We recorded body-surface and intracardiacelectrograms at baseline and following myocardial infarction in 24 swine. Statistically significant ischemia-induced changes afterthe initiation of occlusion compared with baseline were detectable within 30 seconds in intracardiac left ventricle (P<0.0016)and right ventricle–coronary sinus (P<0.0011) leads, 60 seconds in coronary sinus leads (P<0.0002), 90 seconds in rightventricle leads (P<0.0020), and 360 seconds in body-surface electrocardiographic signals (P<0.0022). Intracardiac leadsexhibited a higher probability of detecting ischemia-induced changes than body-surface leads (P<0.0381), and the rightventricle–coronary sinus configuration provided the highest sensitivity (96%). The 24-hour ECG recordings showed that theischemic index is statistically significantly increased compared with baseline in lead I, aVR, and all precordial leads (P<0.0388).Finally, we showed that the ischemic index in intracardiac electrograms is significantly increased preceding ventriculartachyarrhythmic events (P<0.0360).
Conclusions-—We present a novel method that is capable of detecting ischemia-induced changes in intracardiac electrograms asearly as 30 seconds following myocardial infarction or as early as 12 minutes preceding tachyarrhythmic events. ( J Am HeartAssoc. 2014;3:e001055 doi: 10.1161/JAHA.114.001055)
Key Words: ECG delineation • intracardiac signals • ischemic index • myocardial infarction • wavelet transform
M yocardial ischemia (MI) may establish the substrate forfatal ventricular tachyarrhythmic events (VTEs) both
acutely and over the long term.1,2 Early diagnosis and riskstratification of patients with acute MI is essential to guideprompt intervention and optimal clinical outcome.
Electrocardiographic ST-segment monitoring has beenused widely to detect acute MI.3,4 In the standard 12-leadECG, ST-segment deviation is the most common determinantof ongoing ischemia5,6 and a strong predictor of associatedmortality.7 Sensitivity in detecting acute MI, however,remains inadequately low.8–10 Whether it is due to thevariability of the ischemia-induced changes in various ECGleads, as shown by body-surface potential mapping11 or theinaccuracy in detecting the elevated J-points,12 body-surfaceECGs may not reveal subendocardial13 and even severetransmural ischemia.14
With the advent of the implantable cardioverter defibrilla-tor, defibrillation of ventricular tachyarrhythmias has resultedin significant improvements in survival.15 Recent evidence
From the Division of Cardiology, Massachusetts General Hospital, HarvardMedical School, Boston, MA (O.S., D.P., N.I., R.D., A.A.A); Cardiology Division,Emory University School of Medicine, Atlanta, GA (F.M.M); Division ofCardiology, Cardiac Arrhythmia Service, Massachusetts General Hospital,Boston, MA (C.B., J.P.S., E.K.H., T.M.); Biomedical Signal Interpretation &Computational Simulation (BSICoS) Group, Aragon Institute of EngineeringResearch, IIS Arag�on, University of Zaragoza, Zaragoza, Aragon, Spain (J.P.M.,P.L.); Centro de Investigaci�on Biom�edica en Red en Bioingenier�ıa, Biomaterialesy Nanomedicina (CIBER-BBN), Zaragoza, Aragon, Spain (J.P.M., P.L.).
The content is solely the responsibility of the authors and does notnecessarily represent the official views of Harvard Catalyst, Harvard Universityand its affiliated academic health care centers, or the National Institutes ofHealth.
Correspondence to: Antonis A. Armoundas, PhD, Cardiovascular ResearchCenter, Massachusetts General Hospital, 149 13th Street, Charlestown, MA02129. E-mail: [email protected]
Received May 5, 2014; accepted June 3, 2014.
ª 2014 The Authors. Published on behalf of the American Heart Association,Inc., by Wiley Blackwell. This is an open access article under the terms of theCreative Commons Attribution-NonCommercial License, which permits use,distribution and reproduction in any medium, provided the original work isproperly cited and is not used for commercial purposes.
DOI: 10.1161/JAHA.114.001055 Journal of the American Heart Association 1
ORIGINAL RESEARCH
by guest on June 7, 2016http://jaha.ahajournals.org/Downloaded from
also suggests that continuous monitoring of a patient’s ST-segment changes in intracardiac electrograms may allow animplanted device to detect acute closure of a coronary arterythat could lead to a reduction in symptom-to-door time andthereby potentially improve clinical outcomes.16 Furthermore,it has been shown recently that the high-risk period forsudden death of patients who survive acute MI extendsbeyond the hospitalization period, mostly due to recurrent MIor extension of the infarcted area.1,2
The preceding data provide strong evidence that earlydetection of MI, in either the ambulatory ECG or from animplantable device, is of significant therapeutic potential inhigh-risk patients. This study investigates the hypothesis thatearly onset of MI may be captured through a novel methodthat is based on a robust ECG delineator that accuratelyestimates the MI-induced depolarization and repolarizationchanges and that those changes are more prominent inintracardiac leads. We probed this hypothesis in a swinemodel of acute MI and developed an algorithm for body-surface and intracardiac electrograms to quantify changes ofthe depolarization phase as well as the ST segment beforeand after ischemia induction.
Methods
Animal PreparationThe animal studies were approved by the institutional reviewboard and the subcommittee on research animal care atMassachusetts General Hospital.
The total study population comprised 24 male Yorkshireswine (40 to 45 kg) that were anesthetized and instrumentedin the Animal Electrophysiology Laboratory at MassachusettsGeneral Hospital, as described previously.17 Each animalwas intubated and placed on a mechanical ventilator, andanesthesia was maintained with isoflurane (1.5% to 2.5%).
Standard ECG electrodes were placed on the animal’s limbsand chest. For intracardiac recording, percutaneous vascularaccess was obtained in the jugular veins and femoral arteriesand veins using standard Seldinger techniques.18 Decapolarcatheters were placed under fluoroscopic guidance in the rightatrium, right ventricle (RV), coronary sinus (CS), and leftventricle (LV). An inferior vena cava catheter was inserted as areference electrode for unipolar signals. An arterial line wasused to monitor invasive blood pressure. Regional MI wasinduced by balloon occlusion of the proximal left circumflexcoronary artery, using standard percutaneous cardiac cathe-terization techniques. Ischemia was validated and confirmedby hand injections of contrast into the coronary, in which caseno-flow as well as electrocardiographic changes were indica-tions of full occlusion. In 4 animals, 24-hour Holter ECGrecordings were performed before and immediately after MI.
Equipment and Data CollectionTwo standard body-surface signals (leads II and V4) and 12intracardiac unipolar electrocardiographic signals (from theCS, LV, and RV catheters) were recorded through a PruckaCardiolab (GE Healthcare) electrophysiology system anddigitized at a sampling rate of 1 kHz by a multichannel 16-bit data acquisition card (M-Series PCI-6255; National Instru-ments). The Prucka system provided 16 high-fidelity analogoutput signals with front-end signal conditioning as well asisolation protection of the signal-analysis system fromdefibrillation. Intracardiac electrograms were band-pass fil-tered 0.05 to 500 Hz, with 60-Hz notch filter and gain 250 V/V, and body surface signals were band-pass filtered 0.05 to100 Hz, with 60-Hz notch filter and gain 2500 V/V, asdescribed previously.17 Data analysis was performed usingcustom-written software in MATLAB (MathWorks Inc).
ECG Delineation Using Established MethodsWe have implemented 4 commonly used threshold-basedmethods to detect the onset and offset of ECG waveforms.Prior to application of each method, a linear baseline adjust-ment was performed for each beat. The methods are as follows:
1. Waveform: determines the onset and offset points at timescorresponding to 5% and 95% of the maximum normalizedamplitude.19
2. Power: identifies the onset and offset points at time binscorresponding to 5% and 95% of the cumulative sum of thesignal power.20
3. Absolute: is similar to the second approach except thethreshold is applied to the cumulative sum of the absolutevalue of the signal.19,21
4. Noise: estimates the standard deviation (SD) of a prede-fined window (the noise window) of the baseline adjustedwaveform and determines the onset and offset points attimes when the signal exceeds 3 times the SD of the signalin the noise window.22
ECG Delineation Using the Wavelet TransformTo overcome potential limitations of the established ECGdelineation methods, we sought to develop a method thatwould prove robust in determining the complex annotations ofintracardiac electrograms.
The wavelet transform (WT) offers simultaneous interpre-tation of the signal in both time and frequency using afrequency-dependent window that allows high localization intime for high-frequency signal components as well ashigh-frequency resolution for low-frequency patterns (multi-resolution analysis). The WT decomposes the signal as a
DOI: 10.1161/JAHA.114.001055 Journal of the American Heart Association 2
Method to Capture Myocardial Ischemia Sayadi et alORIG
INALRESEARCH
by guest on June 7, 2016http://jaha.ahajournals.org/Downloaded from
combination of a set of basis functions obtained by means ofdilation and translation of a single prototype wavelet. In thistime-resolution description of the signal, higher frequencycomponents are characterized by the coefficients correspond-ing to narrower basis functions resulting from lower scalefactors and vice versa.23
We have developed an intracardiac ECG delineationalgorithm based on a previously developed method forbody-surface ECG delineation using the WT.24 The algorithmstarts with obtaining R-wave annotations through a 2-stepprocess of first identifying the R wave using a QRS detectorand then refining the R-wave location using cross-correlation,as described previously.17 Then, for each beat, the dyadic WTof the signal is estimated for the first 5 scales, wherein mostof the energy of the signal lies. A quadratic spline is used asprototype wavelet that corresponds to a derivative of alow-pass smoothing function. This ensures that the waveletcoefficients are proportional to the derivative of the filteredversion of the signal with a smoothing impulse response ateach scale.23 This approach allows the identification ofsignificant points in the ECG signal using the information oflocal maxima, minima, and zero crossings of the WTcoefficients at different scales.
Once WT coefficients are estimated, a search windowrelative to the R wave and depending on the RR interval isdefined. The number and polarity of the maximum modulus ofWT within this window and across different scales reflects thecharacteristic points corresponding to ECG waveforms.24 Toaccommodate the delineation of intracardiac signals, thatalgorithm24 was modified to start with scale 23 for P-wave andT-wave delineation. Moreover, we devised reduced amplitudethresholds proportional to the root-mean-square value of theWT at the corresponding scales. To accommodate the loss oftime resolution in the growing scales, we devised a multiscaleapproach for P-wave, QRS, and T-wave delineation; therefore,if a waveform boundary is not found in a specific scale, werepeat the above process over higher scales.
Ischemic Marker of Intracardiac and BodySurface Electrocardiographic DataST-segment changes have been well established as strongpredictors of acute MI1,3–5 and VTEs.25 Also, several studieshave reported changes in the depolarization phase followingacute MI, in both animals26,27 and humans.28,29
We devised an index that reflects MI-induced changes ofboth ventricular depolarization and repolarization on a beat-to-beat basis. The ischemic index is estimated as the absolutevalue of the ratio of ST height to the amplitude of QR, where STheight is defined as the mean ST amplitude over all points fromQRS offset to T-wave onset that are greater (ST elevation) orsmaller (ST depression) than the isoelectric baseline.30 If the
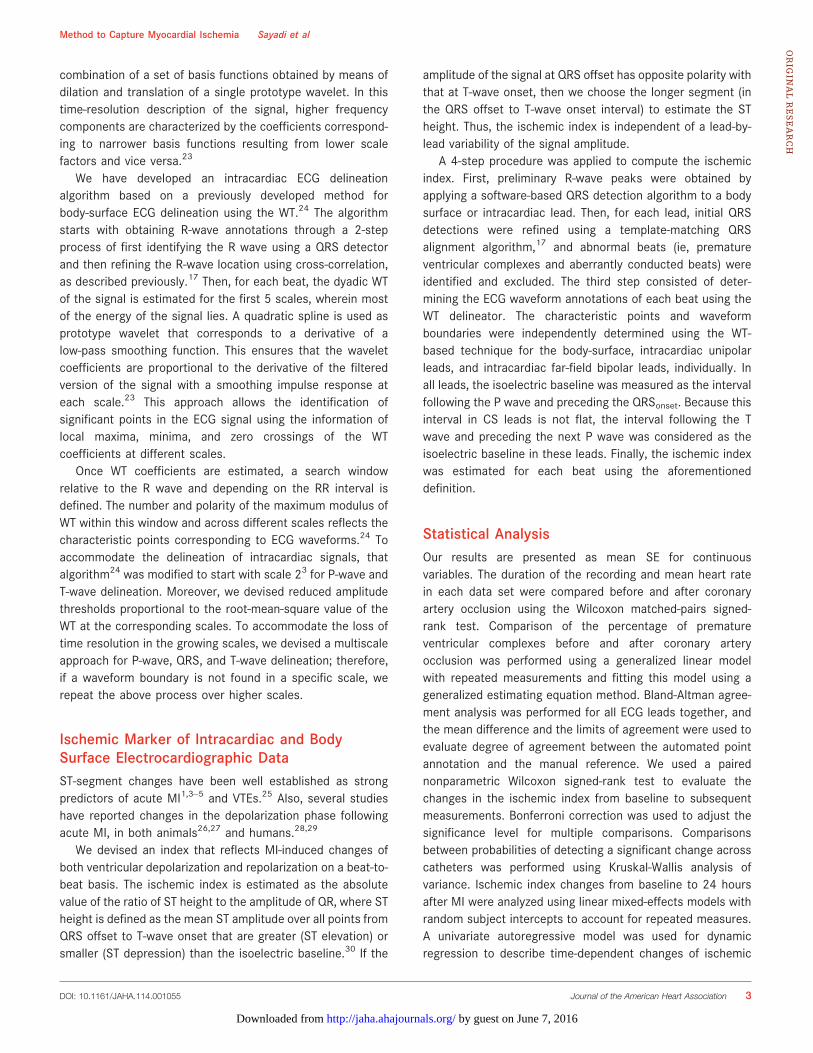
amplitude of the signal at QRS offset has opposite polarity withthat at T-wave onset, then we choose the longer segment (inthe QRS offset to T-wave onset interval) to estimate the STheight. Thus, the ischemic index is independent of a lead-by-lead variability of the signal amplitude.
A 4-step procedure was applied to compute the ischemicindex. First, preliminary R-wave peaks were obtained byapplying a software-based QRS detection algorithm to a bodysurface or intracardiac lead. Then, for each lead, initial QRSdetections were refined using a template-matching QRSalignment algorithm,17 and abnormal beats (ie, prematureventricular complexes and aberrantly conducted beats) wereidentified and excluded. The third step consisted of deter-mining the ECG waveform annotations of each beat using theWT delineator. The characteristic points and waveformboundaries were independently determined using the WT-based technique for the body-surface, intracardiac unipolarleads, and intracardiac far-field bipolar leads, individually. Inall leads, the isoelectric baseline was measured as the intervalfollowing the P wave and preceding the QRSonset. Because thisinterval in CS leads is not flat, the interval following the Twave and preceding the next P wave was considered as theisoelectric baseline in these leads. Finally, the ischemic indexwas estimated for each beat using the aforementioneddefinition.
Statistical AnalysisOur results are presented as mean�SE for continuousvariables. The duration of the recording and mean heart ratein each data set were compared before and after coronaryartery occlusion using the Wilcoxon matched-pairs signed-rank test. Comparison of the percentage of prematureventricular complexes before and after coronary arteryocclusion was performed using a generalized linear modelwith repeated measurements and fitting this model using ageneralized estimating equation method. Bland-Altman agree-ment analysis was performed for all ECG leads together, andthe mean difference and the limits of agreement were used toevaluate degree of agreement between the automated pointannotation and the manual reference. We used a pairednonparametric Wilcoxon signed-rank test to evaluate thechanges in the ischemic index from baseline to subsequentmeasurements. Bonferroni correction was used to adjust thesignificance level for multiple comparisons. Comparisonsbetween probabilities of detecting a significant change acrosscatheters was performed using Kruskal-Wallis analysis ofvariance. Ischemic index changes from baseline to 24 hoursafter MI were analyzed using linear mixed-effects models withrandom subject intercepts to account for repeated measures.A univariate autoregressive model was used for dynamicregression to describe time-dependent changes of ischemic
DOI: 10.1161/JAHA.114.001055 Journal of the American Heart Association 3
Method to Capture Myocardial Ischemia Sayadi et alORIG
INALRESEARCH
by guest on June 7, 2016http://jaha.ahajournals.org/Downloaded from
index at baseline and after MI until sudden cardiac death.Statistical analysis was performed using MATLAB and Stata(StataCorp LP).
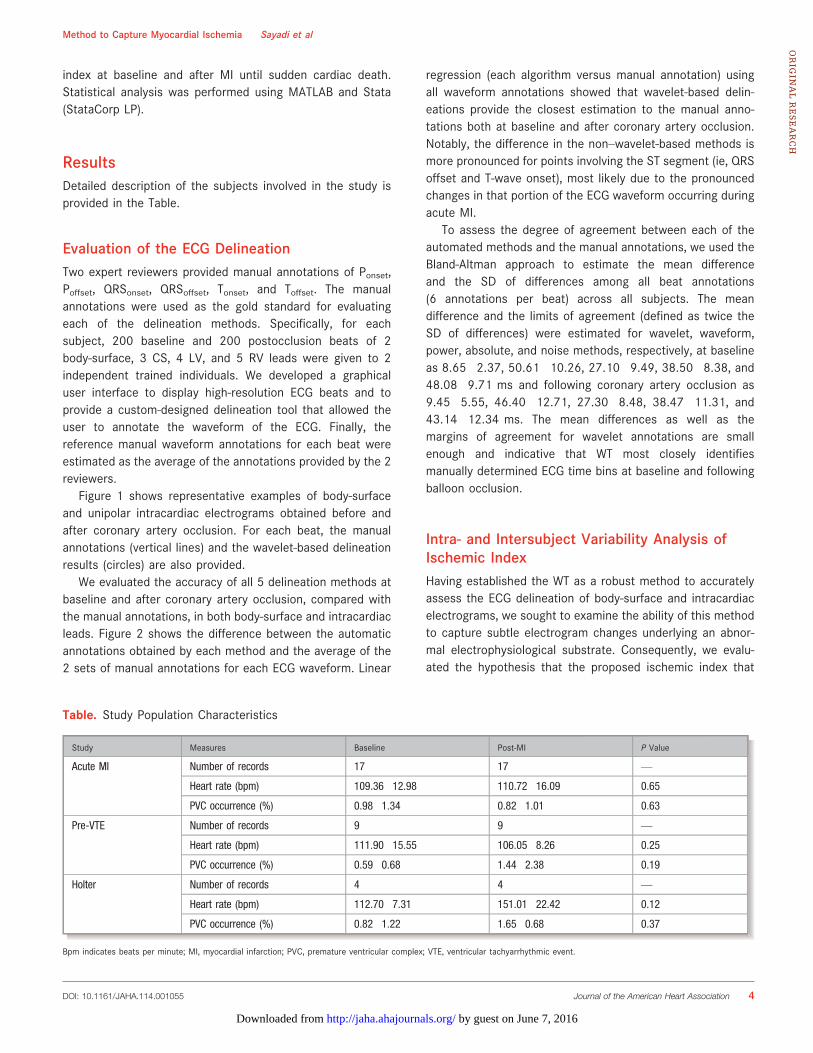
ResultsDetailed description of the subjects involved in the study isprovided in the Table.
Evaluation of the ECG DelineationTwo expert reviewers provided manual annotations of Ponset,Poffset, QRSonset, QRSoffset, Tonset, and Toffset. The manualannotations were used as the gold standard for evaluatingeach of the delineation methods. Specifically, for eachsubject, 200 baseline and 200 postocclusion beats of 2body-surface, 3 CS, 4 LV, and 5 RV leads were given to 2independent trained individuals. We developed a graphicaluser interface to display high-resolution ECG beats and toprovide a custom-designed delineation tool that allowed theuser to annotate the waveform of the ECG. Finally, thereference manual waveform annotations for each beat wereestimated as the average of the annotations provided by the 2reviewers.
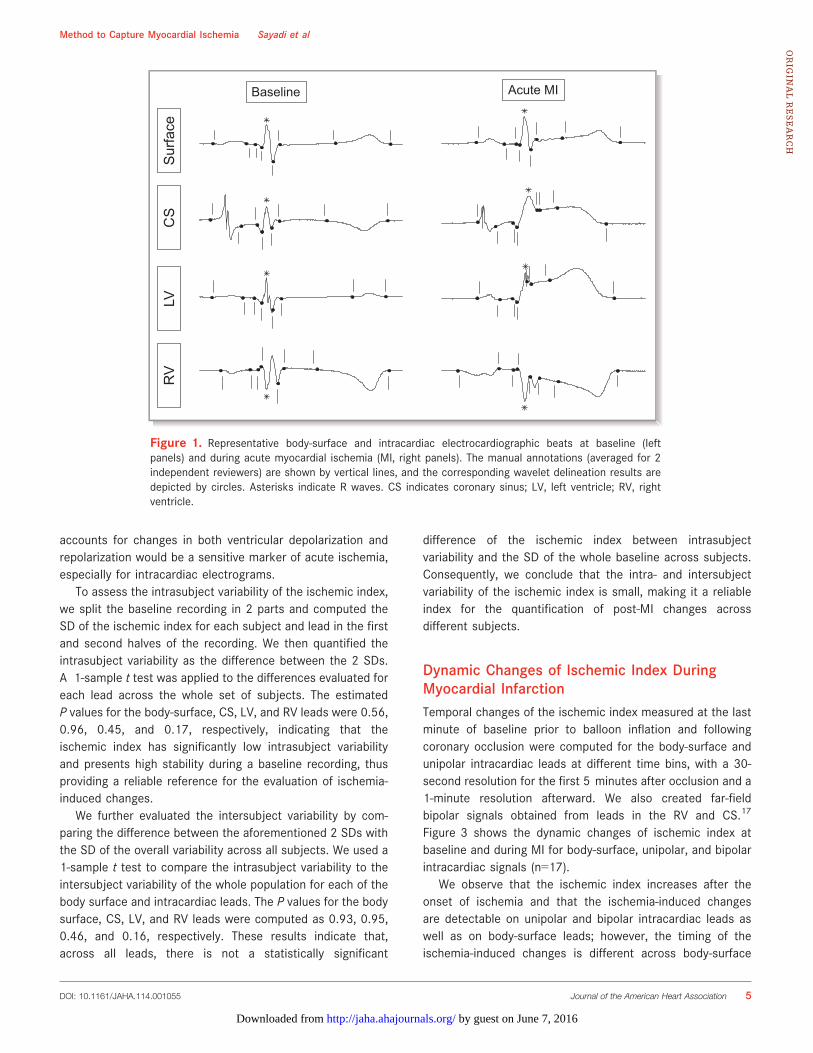
Figure 1 shows representative examples of body-surfaceand unipolar intracardiac electrograms obtained before andafter coronary artery occlusion. For each beat, the manualannotations (vertical lines) and the wavelet-based delineationresults (circles) are also provided.
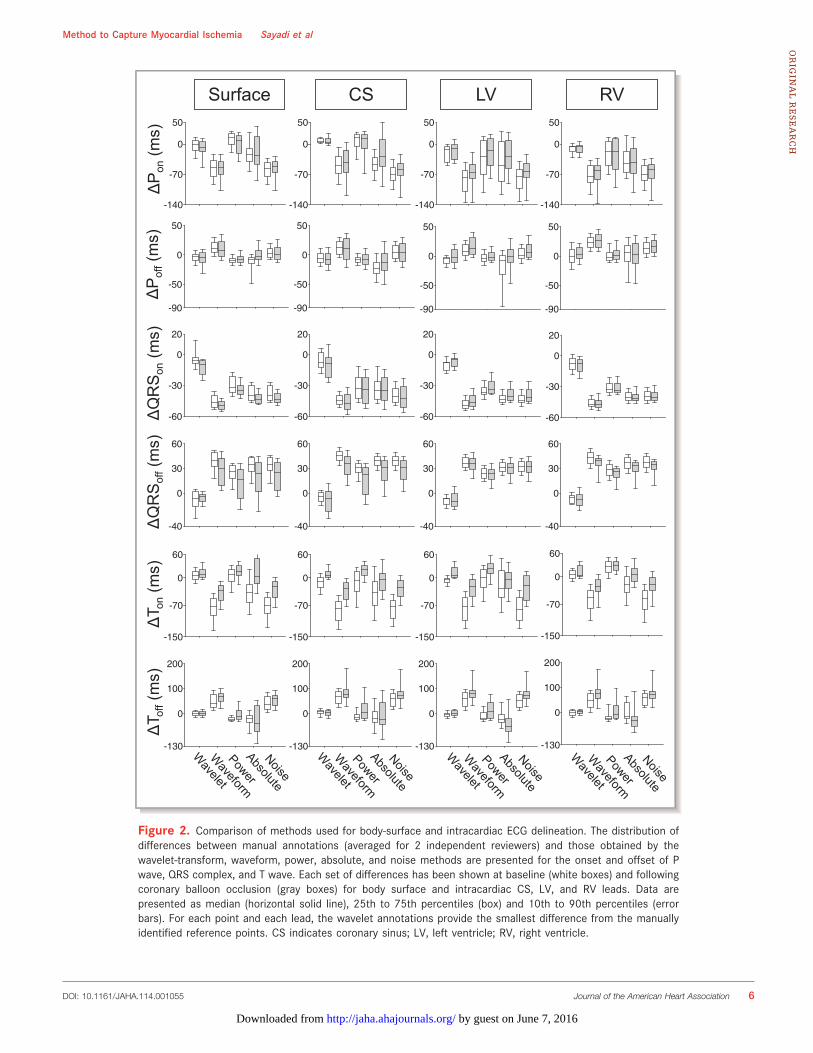
We evaluated the accuracy of all 5 delineation methods atbaseline and after coronary artery occlusion, compared withthe manual annotations, in both body-surface and intracardiacleads. Figure 2 shows the difference between the automaticannotations obtained by each method and the average of the2 sets of manual annotations for each ECG waveform. Linear
regression (each algorithm versus manual annotation) usingall waveform annotations showed that wavelet-based delin-eations provide the closest estimation to the manual anno-tations both at baseline and after coronary artery occlusion.Notably, the difference in the non–wavelet-based methods ismore pronounced for points involving the ST segment (ie, QRSoffset and T-wave onset), most likely due to the pronouncedchanges in that portion of the ECG waveform occurring duringacute MI.
To assess the degree of agreement between each of theautomated methods and the manual annotations, we used theBland-Altman approach to estimate the mean differenceand the SD of differences among all beat annotations(6 annotations per beat) across all subjects. The meandifference and the limits of agreement (defined as twice theSD of differences) were estimated for wavelet, waveform,power, absolute, and noise methods, respectively, at baselineas 8.65�2.37, 50.61�10.26, 27.10�9.49, 38.50�8.38, and48.08�9.71 ms and following coronary artery occlusion as9.45�5.55, 46.40�12.71, 27.30�8.48, 38.47�11.31, and43.14�12.34 ms. The mean differences as well as themargins of agreement for wavelet annotations are smallenough and indicative that WT most closely identifiesmanually determined ECG time bins at baseline and followingballoon occlusion.
Intra- and Intersubject Variability Analysis ofIschemic IndexHaving established the WT as a robust method to accuratelyassess the ECG delineation of body-surface and intracardiacelectrograms, we sought to examine the ability of this methodto capture subtle electrogram changes underlying an abnor-mal electrophysiological substrate. Consequently, we evalu-ated the hypothesis that the proposed ischemic index that
Table. Study Population Characteristics
Study Measures Baseline Post-MI P Value
Acute MI Number of records 17 17 —
Heart rate (bpm) 109.36�12.98 110.72�16.09 0.65
PVC occurrence (%) 0.98�1.34 0.82�1.01 0.63
Pre-VTE Number of records 9 9 —
Heart rate (bpm) 111.90�15.55 106.05�8.26 0.25
PVC occurrence (%) 0.59�0.68 1.44�2.38 0.19
Holter Number of records 4 4 —
Heart rate (bpm) 112.70�7.31 151.01�22.42 0.12
PVC occurrence (%) 0.82�1.22 1.65�0.68 0.37
Bpm indicates beats per minute; MI, myocardial infarction; PVC, premature ventricular complex; VTE, ventricular tachyarrhythmic event.
DOI: 10.1161/JAHA.114.001055 Journal of the American Heart Association 4
Method to Capture Myocardial Ischemia Sayadi et alORIG
INALRESEARCH
by guest on June 7, 2016http://jaha.ahajournals.org/Downloaded from
accounts for changes in both ventricular depolarization andrepolarization would be a sensitive marker of acute ischemia,especially for intracardiac electrograms.
To assess the intrasubject variability of the ischemic index,we split the baseline recording in 2 parts and computed theSD of the ischemic index for each subject and lead in the firstand second halves of the recording. We then quantified theintrasubject variability as the difference between the 2 SDs.A 1-sample t test was applied to the differences evaluated foreach lead across the whole set of subjects. The estimatedP values for the body-surface, CS, LV, and RV leads were 0.56,0.96, 0.45, and 0.17, respectively, indicating that theischemic index has significantly low intrasubject variabilityand presents high stability during a baseline recording, thusproviding a reliable reference for the evaluation of ischemia-induced changes.
We further evaluated the intersubject variability by com-paring the difference between the aforementioned 2 SDs withthe SD of the overall variability across all subjects. We used a1-sample t test to compare the intrasubject variability to theintersubject variability of the whole population for each of thebody surface and intracardiac leads. The P values for the bodysurface, CS, LV, and RV leads were computed as 0.93, 0.95,0.46, and 0.16, respectively. These results indicate that,across all leads, there is not a statistically significant
difference of the ischemic index between intrasubjectvariability and the SD of the whole baseline across subjects.Consequently, we conclude that the intra- and intersubjectvariability of the ischemic index is small, making it a reliableindex for the quantification of post-MI changes acrossdifferent subjects.
Dynamic Changes of Ischemic Index DuringMyocardial InfarctionTemporal changes of the ischemic index measured at the lastminute of baseline prior to balloon inflation and followingcoronary occlusion were computed for the body-surface andunipolar intracardiac leads at different time bins, with a 30-second resolution for the first 5 minutes after occlusion and a1-minute resolution afterward. We also created far-fieldbipolar signals obtained from leads in the RV and CS.17
Figure 3 shows the dynamic changes of ischemic index atbaseline and during MI for body-surface, unipolar, and bipolarintracardiac signals (n=17).
We observe that the ischemic index increases after theonset of ischemia and that the ischemia-induced changesare detectable on unipolar and bipolar intracardiac leads aswell as on body-surface leads; however, the timing of theischemia-induced changes is different across body-surface
Sur
face
CS
LVR
V
Baseline Acute MI
Figure 1. Representative body-surface and intracardiac electrocardiographic beats at baseline (leftpanels) and during acute myocardial ischemia (MI, right panels). The manual annotations (averaged for 2independent reviewers) are shown by vertical lines, and the corresponding wavelet delineation results aredepicted by circles. Asterisks indicate R waves. CS indicates coronary sinus; LV, left ventricle; RV, rightventricle.
DOI: 10.1161/JAHA.114.001055 Journal of the American Heart Association 5
Method to Capture Myocardial Ischemia Sayadi et alORIG
INALRESEARCH
by guest on June 7, 2016http://jaha.ahajournals.org/Downloaded from
Surface CS LV RV
-140
-70
0
50
-90
-50
0
50
-60
-30
0
20
-40
0
30
60
-150
-70
0
60
-130
0
100
200
-140
-70
0
50
-90
-50
0
50
-60
-30
0
20
-40
0
30
60
-150
-70
0
60
-130
0
100
200
-140
-70
0
50
-90
-50
0
50
-60
-30
0
20
-40
0
30
60
-150
-70
0
60
-130
0
100
200
-140
-70
0
50
-90
-50
0
50
-60
-30
0
20
-40
0
30
60
-150
-70
0
60
-130
0
100
200
ΔP
on(m
s)Δ
Pof
f(m
s)Δ
QR
Son
(ms)
ΔQ
RS
off(m
s)Δ
T on
(ms)
ΔT o
ff(m
s)
Figure 2. Comparison of methods used for body-surface and intracardiac ECG delineation. The distribution ofdifferences between manual annotations (averaged for 2 independent reviewers) and those obtained by thewavelet-transform, waveform, power, absolute, and noise methods are presented for the onset and offset of Pwave, QRS complex, and T wave. Each set of differences has been shown at baseline (white boxes) and followingcoronary balloon occlusion (gray boxes) for body surface and intracardiac CS, LV, and RV leads. Data arepresented as median (horizontal solid line), 25th to 75th percentiles (box) and 10th to 90th percentiles (errorbars). For each point and each lead, the wavelet annotations provide the smallest difference from the manuallyidentified reference points. CS indicates coronary sinus; LV, left ventricle; RV, right ventricle.
DOI: 10.1161/JAHA.114.001055 Journal of the American Heart Association 6
Method to Capture Myocardial Ischemia Sayadi et alORIG
INALRESEARCH
by guest on June 7, 2016http://jaha.ahajournals.org/Downloaded from
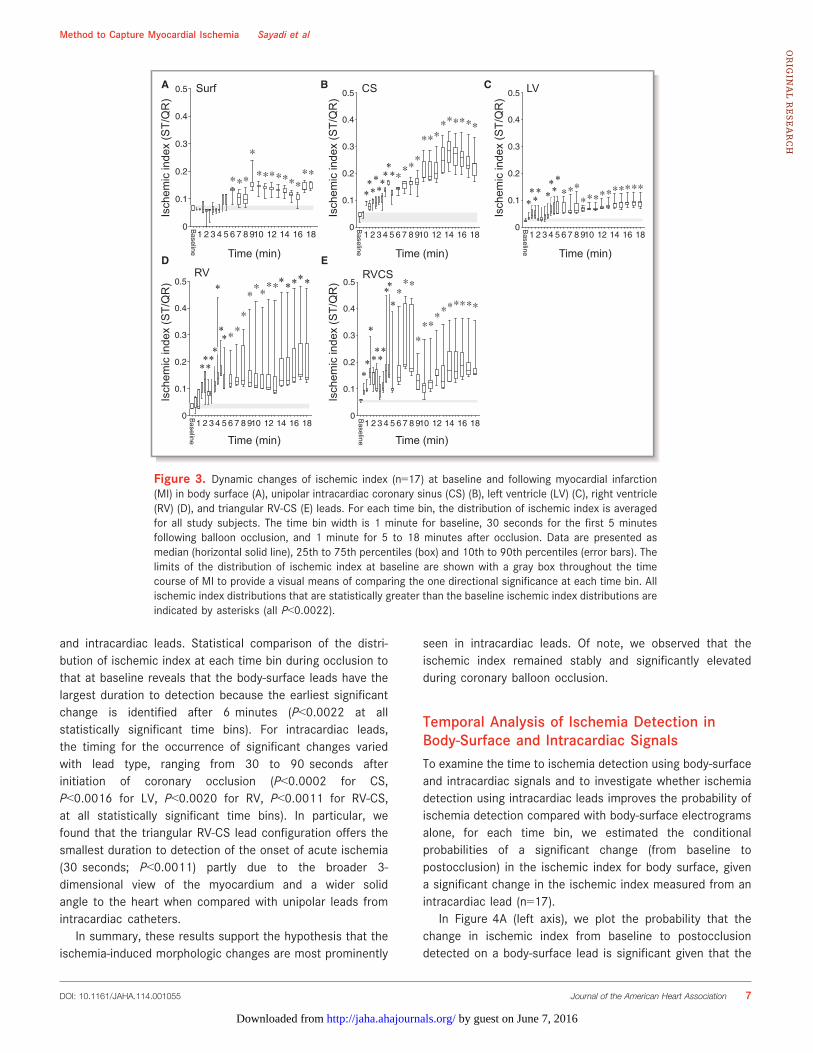
and intracardiac leads. Statistical comparison of the distri-bution of ischemic index at each time bin during occlusion tothat at baseline reveals that the body-surface leads have thelargest duration to detection because the earliest significantchange is identified after 6 minutes (P<0.0022 at allstatistically significant time bins). For intracardiac leads,the timing for the occurrence of significant changes variedwith lead type, ranging from 30 to 90 seconds afterinitiation of coronary occlusion (P<0.0002 for CS,P<0.0016 for LV, P<0.0020 for RV, P<0.0011 for RV-CS,at all statistically significant time bins). In particular, wefound that the triangular RV-CS lead configuration offers thesmallest duration to detection of the onset of acute ischemia(30 seconds; P<0.0011) partly due to the broader 3-dimensional view of the myocardium and a wider solidangle to the heart when compared with unipolar leads fromintracardiac catheters.
In summary, these results support the hypothesis that theischemia-induced morphologic changes are most prominently
seen in intracardiac leads. Of note, we observed that theischemic index remained stably and significantly elevatedduring coronary balloon occlusion.
Temporal Analysis of Ischemia Detection inBody-Surface and Intracardiac SignalsTo examine the time to ischemia detection using body-surfaceand intracardiac signals and to investigate whether ischemiadetection using intracardiac leads improves the probability ofischemia detection compared with body-surface electrogramsalone, for each time bin, we estimated the conditionalprobabilities of a significant change (from baseline topostocclusion) in the ischemic index for body surface, givena significant change in the ischemic index measured from anintracardiac lead (n=17).
In Figure 4A (left axis), we plot the probability that thechange in ischemic index from baseline to postocclusiondetected on a body-surface lead is significant given that the
A B C
D E
1 2 3 4 5 6 7 8 910 12 14 16 180
0.1
0.2
0.3
0.4
0.5
*****
*
*********
Bas
Isch
emic
inde
x (S
T/Q
R)
Time (min)
Surf
Baseline
1 2 3 4 5 6 7 8 910 12 14 16 180
0.1
0.2
0.3
0.4
0.5
*******
***
***
*********
Ba
Isch
emic
inde
x (S
T/Q
R)
Time (min)
CS
Baseline
*********
1 2 3 4 5 6 7 8 910 12 14 16 180
0.1
0.2
0.3
0.4
0.5
*******
****************
Base
Time (min)
Isch
emic
inde
x (S
T/Q
R)
LV
Baseline
**** ****
1 2 3 4 5 6 7 8 910 12 14 16 180
0.1
0.2
0.3
0.4
0.5
*****
*
*
****
*
***
*******
Ba
Isch
emic
inde
x (S
T/Q
R)
Time (min)
RV
Baseline
*****
*****
*
**
1 2 3 4 5 6 7 8 910 12 14 16 180
0.1
0.2
0.3
0.4
0.5
**
*
****
**
****
***
*******
Ba
Isch
emic
inde
x (S
T/Q
R)
Time (min)Baseline
RVCS
**
*
****
*
**
Figure 3. Dynamic changes of ischemic index (n=17) at baseline and following myocardial infarction(MI) in body surface (A), unipolar intracardiac coronary sinus (CS) (B), left ventricle (LV) (C), right ventricle(RV) (D), and triangular RV-CS (E) leads. For each time bin, the distribution of ischemic index is averagedfor all study subjects. The time bin width is 1 minute for baseline, 30 seconds for the first 5 minutesfollowing balloon occlusion, and 1 minute for 5 to 18 minutes after occlusion. Data are presented asmedian (horizontal solid line), 25th to 75th percentiles (box) and 10th to 90th percentiles (error bars). Thelimits of the distribution of ischemic index at baseline are shown with a gray box throughout the timecourse of MI to provide a visual means of comparing the one directional significance at each time bin. Allischemic index distributions that are statistically greater than the baseline ischemic index distributions areindicated by asterisks (all P<0.0022).
DOI: 10.1161/JAHA.114.001055 Journal of the American Heart Association 7
Method to Capture Myocardial Ischemia Sayadi et alORIG
INALRESEARCH
by guest on June 7, 2016http://jaha.ahajournals.org/Downloaded from
change in ischemic index following balloon inflation issignificantly higher in an intracardiac lead from each of theCS, LV, RV, and triangular RV-CS lead configurations (quan-tified across all time bins). The probability (across subjects)that the change measured from a body-surface lead issignificant is 0.81�0.27 when a CS lead shows a significantchange in the ischemic index, 0.80�0.28 when an LV leadindicates a significant change, 0.80�0.27 when an RV leadshows a significant change, and 0.80�0.27 when a lead fromthe triangular RV-CS configuration shows a significantincrease in the ischemic index from baseline to postocclusion.
To explore the probability of ischemia detection usingintracardiac signals, in Figure 4A (right axis), we plot theprobability that the change in ischemic index from baseline topostocclusion detected on an intracardiac lead configurationis significant given that the change in ischemic indexmeasured from the body surface is significantly higher afterocclusion than at baseline for each of the CS, LV, RV, andtriangular RV-CS lead configurations (quantified across alltime bins). When the change of the ischemic index frombaseline to postocclusion in a body-surface lead is significant,the probability that an intracardiac lead shows a significant
0
0.2
0.4
0.6
0.8
1
CS LV RV RV-CSP (In
traca
rdia
c+ |
Any
Intra
card
iac+
)
*A B
C
P (S
urfa
ce+
| Int
raca
rdia
c+) *
0
0.2
0.4
0.6
0.8
1
CS LV RV RV-CS
1
0.8
0.6
0.4
0.2
0
P (Intracardiac+ | Surface+)
0 2 4 6 8 16180.0
0.2
0.4
0.6
0.8
1.0
Surf CS LV RV RVCS
Occlusion Time (min)
P (L
ead+
| A
ny le
ad+)
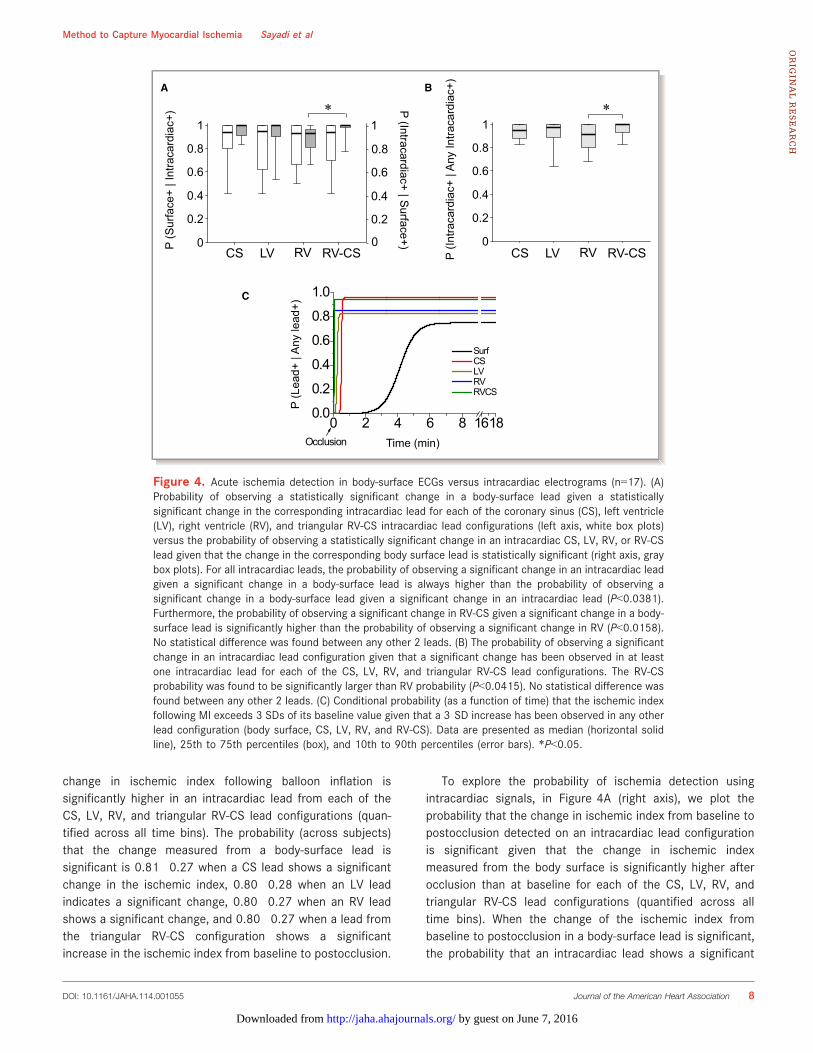
Figure 4. Acute ischemia detection in body-surface ECGs versus intracardiac electrograms (n=17). (A)Probability of observing a statistically significant change in a body-surface lead given a statisticallysignificant change in the corresponding intracardiac lead for each of the coronary sinus (CS), left ventricle(LV), right ventricle (RV), and triangular RV-CS intracardiac lead configurations (left axis, white box plots)versus the probability of observing a statistically significant change in an intracardiac CS, LV, RV, or RV-CSlead given that the change in the corresponding body surface lead is statistically significant (right axis, graybox plots). For all intracardiac leads, the probability of observing a significant change in an intracardiac leadgiven a significant change in a body-surface lead is always higher than the probability of observing asignificant change in a body-surface lead given a significant change in an intracardiac lead (P<0.0381).Furthermore, the probability of observing a significant change in RV-CS given a significant change in a body-surface lead is significantly higher than the probability of observing a significant change in RV (P<0.0158).No statistical difference was found between any other 2 leads. (B) The probability of observing a significantchange in an intracardiac lead configuration given that a significant change has been observed in at leastone intracardiac lead for each of the CS, LV, RV, and triangular RV-CS lead configurations. The RV-CSprobability was found to be significantly larger than RV probability (P<0.0415). No statistical difference wasfound between any other 2 leads. (C) Conditional probability (as a function of time) that the ischemic indexfollowing MI exceeds 3 SDs of its baseline value given that a 3 SD increase has been observed in any otherlead configuration (body surface, CS, LV, RV, and RV-CS). Data are presented as median (horizontal solidline), 25th to 75th percentiles (box), and 10th to 90th percentiles (error bars). *P<0.05.
DOI: 10.1161/JAHA.114.001055 Journal of the American Heart Association 8
Method to Capture Myocardial Ischemia Sayadi et alORIG
INALRESEARCH
by guest on June 7, 2016http://jaha.ahajournals.org/Downloaded from
change in the ischemic index is 0.95�0.07 for CS, 0.90�0.17for LV, 0.96�0.08 for RV, and 0.88�0.12 for the triangularRV-CS configuration.
Compared with the detection probabilities of body-surfaceleads, we observed average improvement of 14%, 10%, 16%,and 8% in the detection probabilities for CS, LV, RV, and RV-CS leads, respectively. The results demonstrate that for allintracardiac leads, the probability of observing a significantchange of the ischemic index in an intracardiac lead given asignificant change in a body surface lead is always higher thanthe probability of observing a significant change in a bodysurface lead given a significant change in an intracardiac lead(P<0.0381), suggesting that intracardiac leads have higherlikelihood to detect acute ischemia. We found that theprobability of observing a significant change in RV-CS given asignificant change in a body surface lead is significantly higherthan the probability of observing a significant change in RV(P<0.0158). No statistical difference was found between anyother 2 leads.
To examine which intracardiac-lead combination has ahigher probability of detecting ischemia-induced changes, inFigure 4B, we plot the probability of observing a significantchange in an intracardiac lead configuration given that asignificant change has been observed in at least 1 intracar-diac lead for each of the CS, LV, RV, and triangular RV-CS leadconfigurations. We notice that the average probability that atriangular RV-CS lead is positive is 0.96, that is, greater thanany other intracardiac lead configuration. Of note, the RV-CSprobability was significantly larger than the RV configuration(P<0.0415). No statistical difference was found between anyother 2 leads.
Finally, to assess the time-dependent likelihood of eachlead to detect ischemia-induced changes, in Figure 4C, weplot the conditional probability (as a function of time averagedover subjects) of observing an increase in the ischemic indexexceeding 3 SD from each subject’s ischemic index atbaseline16 given that a shift beyond 3 SD has been observedin any lead for each of the body-surface, CS, LV, RV, and RV-CS lead configurations. The data are presented as sigmoidalfit with the Boltzmann equation (y=A2+(A1�A2)/(1+exp((x�xo)/dx)), in which A1 and A2 represent the minimumand maximum probability, respectively; xo represents the timeto half maximum probability; and dx represents the slope ofthe exponential function). To fit the model to the postocclu-sion data only, we deployed a constrained nonlinear optimi-zation subject to xo�5dx>0 to force the sigmoid rise to beginafter the start of occlusion.
Using this method, we obtained transition times of 398,38, 25, 2, and 6 seconds and maximum probability of 0.75,0.96, 0.83, 0.86, and 0.95 for body-surface, CS, LV, RV, andRV-CS leads, respectively. Putting these results together, theRV-CS lead-configuration system provides the most accurate
and rapid detection of ischemia-induced changes comparedwith baseline than any other lead system.
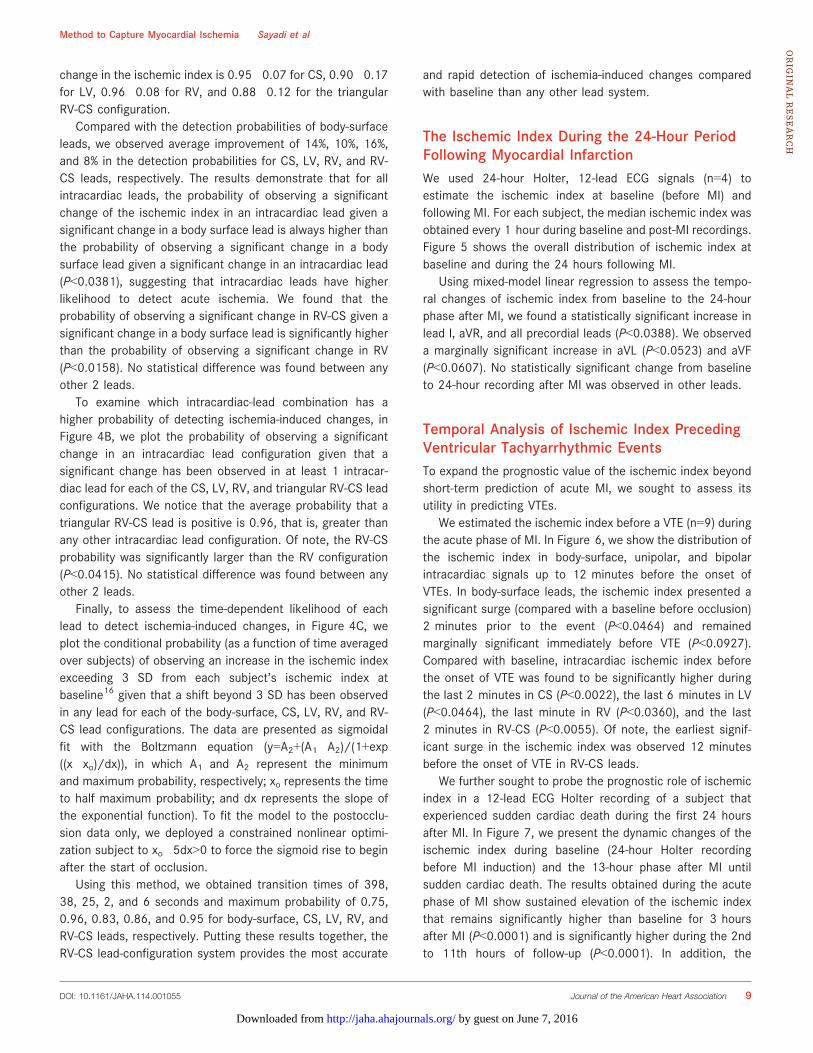
The Ischemic Index During the 24-Hour PeriodFollowing Myocardial InfarctionWe used 24-hour Holter, 12-lead ECG signals (n=4) toestimate the ischemic index at baseline (before MI) andfollowing MI. For each subject, the median ischemic index wasobtained every 1 hour during baseline and post-MI recordings.Figure 5 shows the overall distribution of ischemic index atbaseline and during the 24 hours following MI.
Using mixed-model linear regression to assess the tempo-ral changes of ischemic index from baseline to the 24-hourphase after MI, we found a statistically significant increase inlead I, aVR, and all precordial leads (P<0.0388). We observeda marginally significant increase in aVL (P<0.0523) and aVF(P<0.0607). No statistically significant change from baselineto 24-hour recording after MI was observed in other leads.
Temporal Analysis of Ischemic Index PrecedingVentricular Tachyarrhythmic EventsTo expand the prognostic value of the ischemic index beyondshort-term prediction of acute MI, we sought to assess itsutility in predicting VTEs.
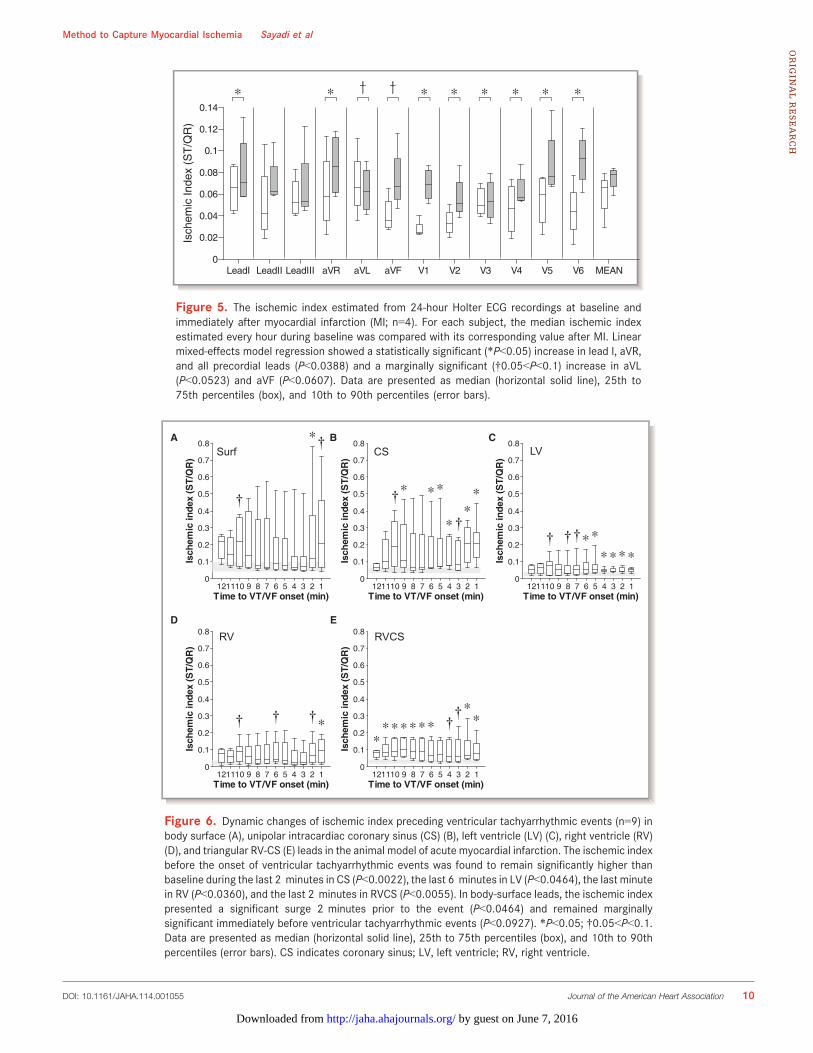
We estimated the ischemic index before a VTE (n=9) duringthe acute phase of MI. In Figure 6, we show the distribution ofthe ischemic index in body-surface, unipolar, and bipolarintracardiac signals up to 12 minutes before the onset ofVTEs. In body-surface leads, the ischemic index presented asignificant surge (compared with a baseline before occlusion)2 minutes prior to the event (P<0.0464) and remainedmarginally significant immediately before VTE (P<0.0927).Compared with baseline, intracardiac ischemic index beforethe onset of VTE was found to be significantly higher duringthe last 2 minutes in CS (P<0.0022), the last 6 minutes in LV(P<0.0464), the last minute in RV (P<0.0360), and the last2 minutes in RV-CS (P<0.0055). Of note, the earliest signif-icant surge in the ischemic index was observed 12 minutesbefore the onset of VTE in RV-CS leads.
We further sought to probe the prognostic role of ischemicindex in a 12-lead ECG Holter recording of a subject thatexperienced sudden cardiac death during the first 24 hoursafter MI. In Figure 7, we present the dynamic changes of theischemic index during baseline (24-hour Holter recordingbefore MI induction) and the 13-hour phase after MI untilsudden cardiac death. The results obtained during the acutephase of MI show sustained elevation of the ischemic indexthat remains significantly higher than baseline for 3 hoursafter MI (P<0.0001) and is significantly higher during the 2ndto 11th hours of follow-up (P<0.0001). In addition, the
DOI: 10.1161/JAHA.114.001055 Journal of the American Heart Association 9
Method to Capture Myocardial Ischemia Sayadi et alORIG
INALRESEARCH
by guest on June 7, 2016http://jaha.ahajournals.org/Downloaded from
Isch
emic
Inde
x (S
T/Q
R)
LeadI LeadII LeadIII aVR aVL aVF V1 V2 V3 V4 V5 V6 MEAN0
0.02
0.04
0.06
0.08
0.1
0.12
0.14* * * * * * * *† †
Figure 5. The ischemic index estimated from 24-hour Holter ECG recordings at baseline andimmediately after myocardial infarction (MI; n=4). For each subject, the median ischemic indexestimated every hour during baseline was compared with its corresponding value after MI. Linearmixed-effects model regression showed a statistically significant (*P<0.05) increase in lead I, aVR,and all precordial leads (P<0.0388) and a marginally significant (†0.05<P<0.1) increase in aVL(P<0.0523) and aVF (P<0.0607). Data are presented as median (horizontal solid line), 25th to75th percentiles (box), and 10th to 90th percentiles (error bars).
121110 9 8 7 6 5 4 3 2 10
0.1
0.2
0.3
0.4
0.5
0.6
0.7
0.8
Time to VT/VF onset (min)
Isch
emic
inde
x (S
T/Q
R)
*
121110 9 8 7 6 5 4 3 2 10
0.1
0.2
0.3
0.4
0.5
0.6
0.7
0.8
Time to VT/VF onset (min)
Isch
emic
inde
x (S
T/Q
R)
**
*
***
121110 9 8 7 6 5 4 3 2 10
0.1
0.2
0.3
0.4
0.5
0.6
0.7
0.8
Time to VT/VF onset (min)
Isch
emic
inde
x (S
T/Q
R)
****
**
121110 9 8 7 6 5 4 3 2 10
0.1
0.2
0.3
0.4
0.5
0.6
0.7
0.8
Time to VT/VF onset (min)
Isch
emic
inde
x (S
T/Q
R)
*
121110 9 8 7 6 5 4 3 2 10
0.1
0.2
0.3
0.4
0.5
0.6
0.7
0.8
Time to VT/VF onset (min)
Isch
emic
inde
x (S
T/Q
R)
**
*******
A B C
D E
Surf CS LV
RV RVCS
†††††
†
††
†
† ††
Figure 6. Dynamic changes of ischemic index preceding ventricular tachyarrhythmic events (n=9) inbody surface (A), unipolar intracardiac coronary sinus (CS) (B), left ventricle (LV) (C), right ventricle (RV)(D), and triangular RV-CS (E) leads in the animal model of acute myocardial infarction. The ischemic indexbefore the onset of ventricular tachyarrhythmic events was found to remain significantly higher thanbaseline during the last 2 minutes in CS (P<0.0022), the last 6 minutes in LV (P<0.0464), the last minutein RV (P<0.0360), and the last 2 minutes in RVCS (P<0.0055). In body-surface leads, the ischemic indexpresented a significant surge 2 minutes prior to the event (P<0.0464) and remained marginallysignificant immediately before ventricular tachyarrhythmic events (P<0.0927). *P<0.05; †0.05<P<0.1.Data are presented as median (horizontal solid line), 25th to 75th percentiles (box), and 10th to 90thpercentiles (error bars). CS indicates coronary sinus; LV, left ventricle; RV, right ventricle.
DOI: 10.1161/JAHA.114.001055 Journal of the American Heart Association 10
Method to Capture Myocardial Ischemia Sayadi et alORIG
INALRESEARCH
by guest on June 7, 2016http://jaha.ahajournals.org/Downloaded from
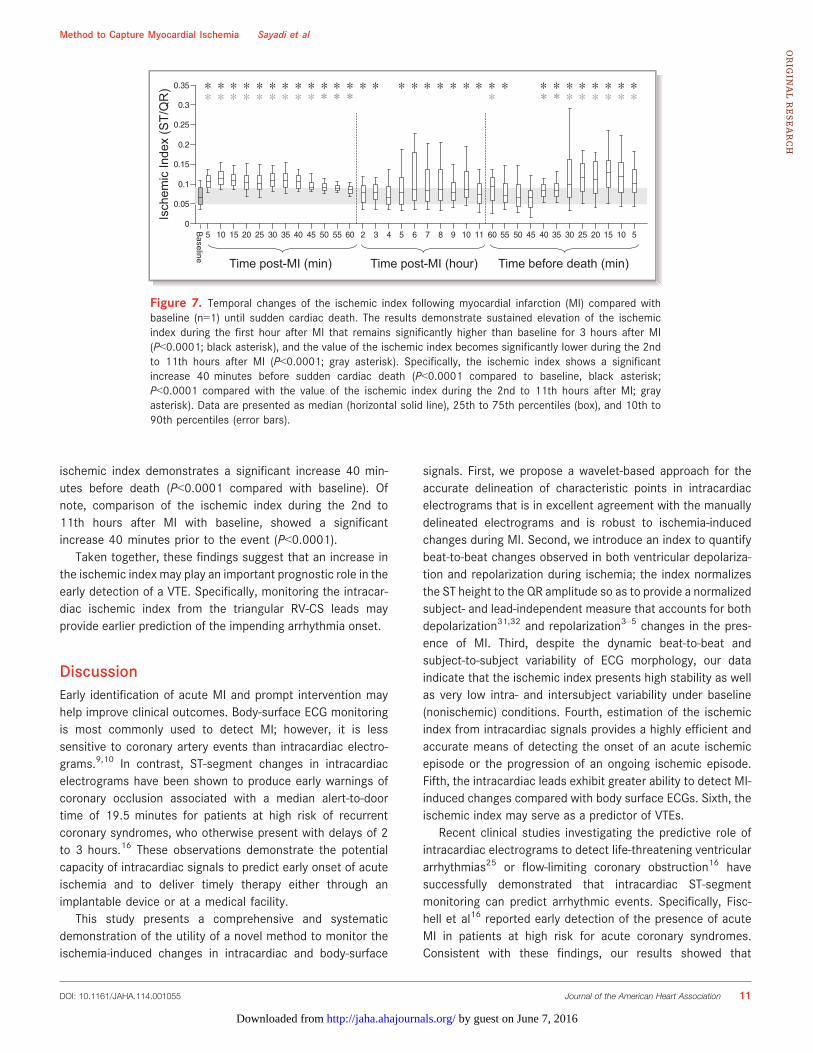
ischemic index demonstrates a significant increase 40 min-utes before death (P<0.0001 compared with baseline). Ofnote, comparison of the ischemic index during the 2nd to11th hours after MI with baseline, showed a significantincrease 40 minutes prior to the event (P<0.0001).
Taken together, these findings suggest that an increase inthe ischemic index may play an important prognostic role in theearly detection of a VTE. Specifically, monitoring the intracar-diac ischemic index from the triangular RV-CS leads mayprovide earlier prediction of the impending arrhythmia onset.
DiscussionEarly identification of acute MI and prompt intervention mayhelp improve clinical outcomes. Body-surface ECG monitoringis most commonly used to detect MI; however, it is lesssensitive to coronary artery events than intracardiac electro-grams.9,10 In contrast, ST-segment changes in intracardiacelectrograms have been shown to produce early warnings ofcoronary occlusion associated with a median alert-to-doortime of 19.5 minutes for patients at high risk of recurrentcoronary syndromes, who otherwise present with delays of 2to 3 hours.16 These observations demonstrate the potentialcapacity of intracardiac signals to predict early onset of acuteischemia and to deliver timely therapy either through animplantable device or at a medical facility.
This study presents a comprehensive and systematicdemonstration of the utility of a novel method to monitor theischemia-induced changes in intracardiac and body-surface
signals. First, we propose a wavelet-based approach for theaccurate delineation of characteristic points in intracardiacelectrograms that is in excellent agreement with the manuallydelineated electrograms and is robust to ischemia-inducedchanges during MI. Second, we introduce an index to quantifybeat-to-beat changes observed in both ventricular depolariza-tion and repolarization during ischemia; the index normalizesthe ST height to the QR amplitude so as to provide a normalizedsubject- and lead-independent measure that accounts for bothdepolarization31,32 and repolarization3–5 changes in the pres-ence of MI. Third, despite the dynamic beat-to-beat andsubject-to-subject variability of ECG morphology, our dataindicate that the ischemic index presents high stability as wellas very low intra- and intersubject variability under baseline(nonischemic) conditions. Fourth, estimation of the ischemicindex from intracardiac signals provides a highly efficient andaccurate means of detecting the onset of an acute ischemicepisode or the progression of an ongoing ischemic episode.Fifth, the intracardiac leads exhibit greater ability to detect MI-induced changes compared with body surface ECGs. Sixth, theischemic index may serve as a predictor of VTEs.
Recent clinical studies investigating the predictive role ofintracardiac electrograms to detect life-threatening ventriculararrhythmias25 or flow-limiting coronary obstruction16 havesuccessfully demonstrated that intracardiac ST-segmentmonitoring can predict arrhythmic events. Specifically, Fisc-hell et al16 reported early detection of the presence of acuteMI in patients at high risk for acute coronary syndromes.Consistent with these findings, our results showed that
Isch
emic
Inde
x (S
T/Q
R)
Time post-MI (min) Time before death (min) Time post-MI (hour)
Baseline
5 10 15 20 25 30 35 40 45 50 55 60 2 3 4 5 6 7 8 9 10 11 60 55 50 45 40 35 30 25 20 15 10 50
0.05
0.1
0.15
0.2
0.25
0.3
0.35 * * * * * * * * * * * * * * * * * * * * * * * * * * * * * * ** * * * * * * * * * * * * * * ** * * **
Figure 7. Temporal changes of the ischemic index following myocardial infarction (MI) compared withbaseline (n=1) until sudden cardiac death. The results demonstrate sustained elevation of the ischemicindex during the first hour after MI that remains significantly higher than baseline for 3 hours after MI(P<0.0001; black asterisk), and the value of the ischemic index becomes significantly lower during the 2ndto 11th hours after MI (P<0.0001; gray asterisk). Specifically, the ischemic index shows a significantincrease 40 minutes before sudden cardiac death (P<0.0001 compared to baseline, black asterisk;P<0.0001 compared with the value of the ischemic index during the 2nd to 11th hours after MI; grayasterisk). Data are presented as median (horizontal solid line), 25th to 75th percentiles (box), and 10th to90th percentiles (error bars).
DOI: 10.1161/JAHA.114.001055 Journal of the American Heart Association 11
Method to Capture Myocardial Ischemia Sayadi et alORIG
INALRESEARCH
by guest on June 7, 2016http://jaha.ahajournals.org/Downloaded from
monitoring the ischemic index can reliably predict the onsetof ischemia in intracardiac signals. In the whole studypopulation, the first statistically significant change of ischemicindex in body-surface leads was observed 6 minutes afterballoon inflation, whereas the unipolar intracardiac electro-grams offered a significant change as early as 30, 60, and90 seconds for LV, CS, and RV leads, respectively. Beyond thesetting of acute coronary syndromes, our data also suggestthat intracardiac detection of ischemia may play an importantrole in the diagnosis and treatment of patients with “silent”ischemia, which is likely underdiagnosed due to the lack ofeffective screening tools and has been associated withadverse clinical outcomes.33
We further observed that adopting the triangular intracar-diac lead configuration between the RV and CS cathetersprovided the smallest duration in detecting the onset of acuteischemia, that is, within 30 seconds after balloon occlusion ofthe coronary artery (P<0.0011). This improvement (mani-fested by a lower P value) may be due to the fact that RV-CSlead configuration provides a broader 3-dimensional view ofmyocardium and better localization of the ischemic event. Inaddition, our results showed that in the acute stage of MI, theprobability of observing a significant change in an intracardiaclead given a significant change in a body-surface lead isalways higher than the probability of observing a significantchange in a body-surface lead given a significant change in anintracardiac lead (P<0.0381).
Assessing the 24-hour changes of ischemic index duringthe chronic phase after MI showed a statistically significantincrease in lead I, aVR, and all precordial leads from baselineto ischemia (P<0.0388). Finally, we have been able todemonstrate that ischemic index presents a significant surgepreceding VTEs (P<0.0360).
In conclusion, our findings support the hypothesis thatanalysis of intracardiac signals provides early detection ofischemia-induced electrocardiographic changes that exhibithigher sensitivity than body-surface ECGs in determining theonset of ischemia. Furthermore, monitoring the ischemicindex may present a potentially useful method in predictingischemia-induced VTEs. In view of the options of currentlyavailable implantable cardioverter defibrillators, monitoring ofthe proposed intracardiac ischemic index may be a potentiallyclinically feasible means of alert regarding early onset of acuteischemia associated with thrombotic occlusion in patients athigh risk for recurrent coronary syndromes and may providean early trigger of appropriate medical therapy.
Study LimitationsA limitation of the presented methodology, which uses the WTto obtain ECG annotations to estimate the ischemic index, isthat it is defined for normal beats only; however, this
limitation is inherent to all methods that rely on processingthe morphology of ECG signals. Moreover, a completereceiver operating curve analysis should be performed in astudy with a sufficiently large number of subjects to ensureadequate power in establishing diagnostic ischemic indexthresholds and to assess the sensitivity and specificity of theproposed method.
Sources of FundingThis work was supported by a Scientist Development Grant(0635127N), a Founders Affiliate Postdoctoral Fellowship(12POST9310001) from the American Heart Association, theKenneth M. Rosen Fellowship in Cardiac Pacing and Electro-physiology (13-FA-32-HRS) from the Heart Rhythm Society,and by NIH grant 1R21AG035128. This work was alsosupported by a Fellowship and a Science Award from theCenter for Integration of Medicine and Innovative Technology(CIMIT), by the Spanish government (MINECO) and EuropeanUnion (FEDER) under projects TEC2010-21703-C03-02 andTEC2013-42140-R and by the European Social Fund and theAragon government under Grupo Consolidado BSICoS. Thiswork was conducted with support from Harvard Catalyst, TheHarvard Clinical and Translational Science Center (NationalCenter for Research Resources and the National Center forAdvancing Translational Sciences, National Institutes ofHealth Award 8UL1TR000170-05 and financial contributionsfrom Harvard University and its affiliated academic health carecenters).
DisclosuresNone.
References1. Myerburg RJ, Kessler KM, Castellanos A. Sudden cardiac death. Structure,
function, and time-dependence of risk. Circulation. 1992;85:I2–10.
2. Solomon SD, Zelenkofske S, McMurray JJ, Finn PV, Velazquez E, Ertl G,Harsanyi A, Rouleau JL, Maggioni A, Kober L, White H, Van de Werf F, Pieper K,Califf RM, Pfeffer MA. Sudden death in patients with myocardial infarction andleft ventricular dysfunction, heart failure, or both. N Engl J Med.2005;352:2581–2588.
3. Shah A, Wagner GS, Granger CB, O’Connor CM, Green CL, Trollinger KM, CaliffRM, Krucoff MW. Prognostic implications of TIMI flow grade in the infarctrelated artery compared with continuous 12-lead ST-segment resolutionanalysis. Reexamining the “gold standard” for myocardial reperfusion assess-ment. J Am Coll Cardiol. 2000;35:666–672.
4. Krucoff MW, Croll MA, Pope JE, Pieper KS, Kanani PM, Granger CB, VeldkampRF, Wagner BL, Sawchak ST, Califf RM. Continuously updated 12-lead ST-segment recovery analysis for myocardial infarct artery patency assessmentand its correlation with multiple simultaneous early angiographic observations.Am J Cardiol. 1993;71:145–151.
5. Holland RP, Brooks H. TQ-ST segment mapping: critical review and analysis ofcurrent concepts. Am J Cardiol. 1977;40:110–129.
6. Myocardial infarction redefined–a consensus document of The JointEuropean Society of Cardiology/American College of Cardiology Committeefor the redefinition of myocardial infarction. Eur Heart J. 2000; 21:1502–1513.
DOI: 10.1161/JAHA.114.001055 Journal of the American Heart Association 12
Method to Capture Myocardial Ischemia Sayadi et alORIG
INALRESEARCH
by guest on June 7, 2016http://jaha.ahajournals.org/Downloaded from
7. Schroder K, Wegscheider K, Zeymer U, Tebbe U, Schroder R. Extent of ST-segment deviation in a single electrocardiogram lead 90 min after thrombol-ysis as a predictor of medium-term mortality in acute myocardial infarction.Lancet. 2001;358:1479–1486.
8. Menown IB, Mackenzie G, Adgey AA. Optimizing the initial 12-lead electro-cardiographic diagnosis of acute myocardial infarction. Eur Heart J. 2000;21:275–283.
9. Fischell TA, Fischell DR, Fischell RE, Baskerville S, Hendrick S, Moshier C,Harwood JP, Krucoff MW. Potential of an intracardiac electrogram for the rapiddetection of coronary artery occlusion. Cardiovasc Revasc Med. 2005;6:14–20.
10. Siegel S, Brodman R, Fisher J, Matos J, Furman S. Intracardiac electrodedetection of early or subendocardial ischemia. Pacing Clin Electrophysiol.1982;5:892–902.
11. Shenasa M, Hamel D, Nasmith J, Nadeau R, Dutoy JL, Derome D, Savard P.Body surface potential mapping of ST-segment shift in patients undergoingpercutaneous transluminal coronary angioplasty. Correlations with the ECGand vectorcardiogram. J Electrocardiol. 1993;26:43–51.
12. Rautaharju PM, Surawicz B, Gettes LS, Bailey JJ, Childers R, Deal BJ, Gorgels A,Hancock EW, Josephson M, Kligfield P, Kors JA, Macfarlane P, Mason JW,Mirvis DM, Okin P, Pahlm O, van Herpen G, Wagner GS, Wellens H. AHA/ACCF/HRS recommendations for the standardization and interpretation of theelectrocardiogram: part IV: the ST segment, T and U waves, and the QTinterval: a scientific statement from the American Heart Association Electro-cardiography and Arrhythmias Committee, Council on Clinical Cardiology; theAmerican College of Cardiology Foundation; and the Heart Rhythm Society.Endorsed by the International Society for Computerized Electrocardiology.J Am Coll Cardiol. 2009;53:982–991.
13. Barnard RJ, Buckberg GD, Duncan HW. Limitations of the standard transtho-racic electrocardiogram in detecting subendocardial ischemia. Am Heart J.1980;99:476–482.
14. Chaitman BR, Bourassa MG, Wagniart P, Corbara F, Ferguson RJ. Improvedefficiency of treadmill exercise testing using a multiple lead ECG system andbasic hemodynamic exercise response. Circulation. 1978;57:71–79.
15. Myerburg RJ. Implantable cardioverter-defibrillators after myocardial infarc-tion. N Engl J Med. 2008;359:2245–2253.
16. Fischell TA, Fischell DR, Avezum A, John MS, Holmes D, Foster M III, Kovach R,Medeiros P, Piegas L, Guimaraes H, Gibson CM. Initial clinical results usingintracardiac electrogram monitoring to detect and alert patients duringcoronary plaque rupture and ischemia. J Am Coll Cardiol. 2010;56:1089–1098.
17. Weiss EH, Merchant FM, d’Avila A, Foley L, Reddy VY, Singh JP, Mela T, RuskinJN, Armoundas AA. A novel lead configuration for optimal spatio-temporaldetection of intracardiac repolarization alternans. Circ Arrhythm Electrophysiol.2011; 4:407–417.
18. Wilber DJ, Garan H, Ruskin JN. Electrophysiologic testing in survivors of cardiacarrest. Circulation. 1987; 75:III146–153.
19. Laguna P, Jane R, Caminal P. Automatic detection of wave boundaries inmultilead ECG signals: validation with the CSE database. Comput Biomed Res.1994;27:45–60.
20. Merri M, Alberti M, Benhorin J, Hall WJ, Locati E, Moss AJ, eds. Quantitation ofventricular repolarization: a new approach. In: Proc. Computers in Cardiology,1988: 85–87.
21. Laguna P, Thakor NV, Caminal P, Jane R, Yoon HR, Bayes de Luna A, Marti V,Guindo J. New algorithm for QT interval analysis in 24-hour Holter ECG:performance and applications. Med Biol Eng Comput. 1990;28:67–73.
22. de Chazal P, Celler BG. Automatic measurement of the QRS onset and offset inindividual ECG leads. in Proc. EMBS. 1996; 1399–1400.
23. Mallat S. A theory for multiresolution signal decomposition: the waveletrepresentation. IEEE, Trans Pattern Anal Mach Intell. 1989;11:674–693.
24. Mart�ınez JP, Almeida R, Olmos S, Rocha AP, Laguna P. A wavelet-based ECGdelineator: evaluation on standard databases. IEEE Trans Biomed.2004;51:570–581.
25. Tereshchenko LG, McCabe A, Han L, Sur S, Huang T, Marine JE, Cheng A,Spragg DD, Sinha S, Calkins H, Stein K, Tomaselli GF, Berger RD. IntracardiacJ-point elevation before the onset of polymorphic ventricular tachycardia andventricular fibrillation in patients with an implantable cardioverter-defibrillator.Heart Rhythm. 2012;9:1594–1602.
26. Abboud S, Smith JM, Shargorodsky B, Laniado S, Sadeh D, Cohen RJ.High frequency electrocardiography of three orthogonal leads in dogsduring a coronary artery occlusion. Pacing Clin Electrophysiol. 1989;12:574–581.
27. Abboud S, Cohen RJ, Sadeh D. A spectral analysis of the high frequency QRSpotentials observed during acute myocardial ischemia in dogs. Int J Cardiol.1990;26:285–290.
28. Abboud S, Cohen RJ, Selwyn A, Ganz P, Sadeh D, Friedman PL. Detection oftransient myocardial ischemia by computer analysis of standard andsignal-averaged high-frequency electrocardiograms in patients undergoingpercutaneous transluminal coronary angioplasty. Circulation. 1987;76:585–596.
29. Pettersson J, Pahlm O, Carro E, Edenbrandt L, Ringborn M, Sornmo L, WarrenSG, Wagner GS. Changes in high-frequency QRS components are moresensitive than ST-segment deviation for detecting acute coronary arteryocclusion. J Am Coll Cardiol. 2000;36:1827–1834.
30. Lee YZ, Belk PA, Mullen TJ, Rivers S, Zhang X, Armoundas AA, Osaka M, He B,Aldea G, Cohen RJ. Comparison of body surface potential and laplacianmapping with epicardial mapping for detection of cardiac ischemia in pigs. AnnNoninvasive Electrocardiol. 1998;3:244–251.
31. Ringborn M, Pettersson J, Persson E, Warren SG, Platonov P, Pahlm O, WagnerGS. Comparison of high-frequency QRS components and ST-segment elevationto detect and quantify acute myocardial ischemia. J Electrocardiol.2010;43:113–120.
32. Romero D, Ringborn M, Laguna P, Pahlm O, Pueyo E. Depolarization changesduring acute myocardial ischemia by evaluation of QRS slopes: standard leadand vectorial approach. IEEE Trans Biomed Eng. 2011;58:110–120.
33. Conti CR, Bavry AA, Petersen JW. Silent ischemia: clinical relevance. J Am CollCardiol. 2012;59:435–441.
DOI: 10.1161/JAHA.114.001055 Journal of the American Heart Association 13
Method to Capture Myocardial Ischemia Sayadi et alORIG
INALRESEARCH
by guest on June 7, 2016http://jaha.ahajournals.org/Downloaded from

Antonis A. ArmoundasBarrett, Jagmeet P. Singh, E. Kevin Heist, Theofanie Mela, Juan Pablo Martínez, Pablo Laguna and
Omid Sayadi, Dheeraj Puppala, Nosheen Ishaque, Rajiv Doddamani, Faisal M. Merchant, Conorits Implications to Arrhythmia Susceptibility
A Novel Method to Capture the Onset of Dynamic Electrocardiographic Ischemic Changes and
Online ISSN: 2047-9980 Dallas, TX 75231
is published by the American Heart Association, 7272 Greenville Avenue,Journal of the American Heart AssociationThe doi: 10.1161/JAHA.114.001055
2014;3:e001055; originally published September 3, 2014;J Am Heart Assoc.
http://jaha.ahajournals.org/content/3/5/e001055World Wide Web at:
The online version of this article, along with updated information and services, is located on the
for more information. http://jaha.ahajournals.orgAccess publication. Visit the Journal at
is an online only OpenJournal of the American Heart AssociationSubscriptions, Permissions, and Reprints: The
by guest on June 7, 2016http://jaha.ahajournals.org/Downloaded from