A novel comparative research platform designed to determine the functional significance of tree...
11
Perspectives in Plant Ecology, Evolution and Systematics 15 (2013) 281–291 Contents lists available at ScienceDirect Perspectives in Plant Ecology, Evolution and Systematics journal h om epage: www.elsevier.com/locate/ppees Forum A novel comparative research platform designed to determine the functional significance of tree species diversity in European forests Lander Baeten a , Kris Verheyen a , Christian Wirth b,c , Helge Bruelheide c,d , Filippo Bussotti e , Leena Finér f , Bogdan Jaroszewicz g , Federico Selvi e , Fernando Valladares h , Eric Allan i , Evy Ampoorter a , Harald Auge j , Daniel Av˘ ac˘ ariei k , Luc Barbaro l , Ionu B˘ arnoaiea k , Cristina C. Bastias h , Jürgen Bauhus m , Carsten Beinhoff d , Raquel Benavides h , Adam Benneter m , Sigrid Berger n , Felix Berthold d , Johanna Boberg o , Damien Bonal p , Wolfgang Brüggemann q , Monique Carnol r , Bastien Castagneyrol l , Yohan Charbonnier l , Ewa Che ´ cko g , David Coomes s , Andrea Coppi e , Eleftheria Dalmaris t , Gabriel D˘ anil˘ a k , Seid M. Dawud u , Wim de Vries v , Hans De Wandeler w , Marc Deconchat x , Timo Domisch f , Gabriel Duduman k , Markus Fischer i , Mariangela Fotelli t , Arthur Gessler y , Teresa E. Gimeno z , André Granier p , Charlotte Grossiord p , Virginie Guyot x , Lydia Hantsch d , Stephan Hättenschwiler aa , Andy Hector bb , Martin Hermy w , Vera Holland q , Hervé Jactel l , Franc ¸ ois-Xavier Joly aa , Tommaso Jucker s , Simon Kolb cc , Julia Koricheva dd , Manfred J. Lexer ee , Mario Liebergesell b , Harriet Milligan dd , Sandra Müller n , Bart Muys w , Diem Nguyen o , Liviu Nichiforel k , Martina Pollastrini e , Raphael Proulx ff , Sonia Rabasa h , Kalliopi Radoglou gg , Sophia Ratcliffe b , Karsten Raulund-Rasmussen u , Ian Seiferling ff , Jan Stenlid o , Lars Vesterdal u , Klaus von Wilpert cc , Miguel A. Zavala hh , Dawid Zielinski g , Michael Scherer-Lorenzen n,∗ a Department of Forest & Water Management, Ghent University, Belgium b Department for Systematic Botany and Functional Biodiversity, University of Leipzig, Germany c German Centre for Integrative Biodiversity Research (iDiv), Halle-Jena-Leipzig, Leipzig, Germany d Institute of Biology/Geobotany and Botanical Garden, Martin Luther University Halle Wittenberg, Germany e Department of Agricultural, Food and Environmental Sciences, University of Firenze, Italy f Joensuu Unit, Finnish Forest Research Institute, Finland g Białowie ˙ za Geobotanical Station, Faculty of Biology, University of Warsaw, Poland h Museo de Ciencias Naturales, MNCN, CSIC, Spain i Institute of Plant Sciences, Botanical Garden and Oeschger Centre, University of Bern, Switzerland j Department of Community Ecology, UFZ - Helmholtz Centre for Environmental Research, Germany k Forestry Faculty, University of Suceava, Romania l UMR BIOGECO, Community Ecology, INRA, France m Faculty of Forest and Environmental Sciences, Institute of Silviculture, University of Freiburg, Germany n Faculty of Biology, Geobotany, University of Freiburg, Germany o Department of Forest Mycology and Plant Pathology, Swedish University of Agricultural Sciences, Sweden p UMR EEF, INRA, France q Biodiversity & Climate Research Center and Goethe University, Frankfurt, Germany r Laboratory of Plant and Microbial Ecology, Department of Biology, Ecology, Evolution, University of Liège, Belgium s Forest Ecology and Conservation Group, Department of Plant Sciences, University of Cambridge, UK t Forest Research Institute of Thessaloniki, Greek Agricultural Organization-Dimitra, Greece u Department of Geosciences and Natural Resource Management, University of Copenhagen, Denmark v Environmental Systems Analysis Group, Wageningen University, Netherlands w Division of Forest, Nature and Landscape, University of Leuven, Belgium x UMR DYNAFOR, INRA, France y Institute for Landscape Biogeochemistry, Leibniz-Zentrum für Agrarlandschaftsforschung (ZALF), Germany z Hawkesbury Institute for the Environment, University of Western Sydney, Australia ∗ Corresponding author. E-mail address: [email protected] (M. Scherer-Lorenzen). 1433-8319/$ – see front matter © 2013 Elsevier GmbH. All rights reserved. http://dx.doi.org/10.1016/j.ppees.2013.07.002
Transcript of A novel comparative research platform designed to determine the functional significance of tree...

F
Af
LFFLRDYGTAVMSHMSLMa
b
c
d
e
f
g
h
i
j
k
l
m
n
o
p
q
r
s
t
u
v
w
x
y
z
1h
Perspectives in Plant Ecology, Evolution and Systematics 15 (2013) 281– 291
Contents lists available at ScienceDirect
Perspectives in Plant Ecology, Evolution and Systematics
journa l h om epage: www.elsev ier .com/ locate /ppees
orum
novel comparative research platform designed to determine theunctional significance of tree species diversity in European forests
ander Baetena, Kris Verheyena, Christian Wirthb,c, Helge Bruelheidec,d,ilippo Bussotti e, Leena Finér f, Bogdan Jaroszewiczg, Federico Selvie,ernando Valladaresh, Eric Allan i, Evy Ampoortera, Harald Augej, Daniel Avacarieik,uc Barbaro l, Ionu Barnoaieak, Cristina C. Bastiash, Jürgen Bauhusm, Carsten Beinhoffd,aquel Benavidesh, Adam Benneterm, Sigrid Bergern, Felix Bertholdd, Johanna Bobergo,amien Bonalp, Wolfgang Brüggemannq, Monique Carnol r, Bastien Castagneyrol l,ohan Charbonnier l, Ewa Checkog, David Coomess, Andrea Coppie, Eleftheria Dalmaris t,abriel Danila k, Seid M. Dawudu, Wim de Vriesv, Hans De Wandelerw, Marc Deconchatx,imo Domischf, Gabriel Dudumank, Markus Fischer i, Mariangela Fotelli t,rthur Gesslery, Teresa E. Gimenoz, André Granierp, Charlotte Grossiordp,irginie Guyotx, Lydia Hantschd, Stephan Hättenschwileraa, Andy Hectorbb,artin Hermyw, Vera Hollandq, Hervé Jactel l, Franc ois-Xavier Jolyaa, Tommaso Juckers,
imon Kolbcc, Julia Korichevadd, Manfred J. Lexeree, Mario Liebergesellb,arriet Milligandd, Sandra Müllern, Bart Muysw, Diem Nguyeno, Liviu Nichiforelk,artina Pollastrinie, Raphael Proulx ff, Sonia Rabasah, Kalliopi Radoglougg,
ophia Ratcliffeb, Karsten Raulund-Rasmussenu, Ian Seiferling ff, Jan Stenlido,ars Vesterdalu, Klaus von Wilpertcc, Miguel A. Zavalahh, Dawid Zielinskig,ichael Scherer-Lorenzenn,∗
Department of Forest & Water Management, Ghent University, BelgiumDepartment for Systematic Botany and Functional Biodiversity, University of Leipzig, GermanyGerman Centre for Integrative Biodiversity Research (iDiv), Halle-Jena-Leipzig, Leipzig, GermanyInstitute of Biology/Geobotany and Botanical Garden, Martin Luther University Halle Wittenberg, GermanyDepartment of Agricultural, Food and Environmental Sciences, University of Firenze, ItalyJoensuu Unit, Finnish Forest Research Institute, FinlandBiałowieza Geobotanical Station, Faculty of Biology, University of Warsaw, PolandMuseo de Ciencias Naturales, MNCN, CSIC, SpainInstitute of Plant Sciences, Botanical Garden and Oeschger Centre, University of Bern, SwitzerlandDepartment of Community Ecology, UFZ - Helmholtz Centre for Environmental Research, GermanyForestry Faculty, University of Suceava, RomaniaUMR BIOGECO, Community Ecology, INRA, FranceFaculty of Forest and Environmental Sciences, Institute of Silviculture, University of Freiburg, GermanyFaculty of Biology, Geobotany, University of Freiburg, GermanyDepartment of Forest Mycology and Plant Pathology, Swedish University of Agricultural Sciences, SwedenUMR EEF, INRA, FranceBiodiversity & Climate Research Center and Goethe University, Frankfurt, GermanyLaboratory of Plant and Microbial Ecology, Department of Biology, Ecology, Evolution, University of Liège, Belgium
Forest Ecology and Conservation Group, Department of Plant Sciences, University of Cambridge, UKece
Forest Research Institute of Thessaloniki, Greek Agricultural Organization-Dimitra, Gre Department of Geosciences and Natural Resource Management, University of Copenhagen, DEnvironmental Systems Analysis Group, Wageningen University, NetherlandsDivision of Forest, Nature and Landscape, University of Leuven, BelgiumUMR DYNAFOR, INRA, FranceInstitute for Landscape Biogeochemistry, Leibniz-Zentrum für Agrarlandschaftsforschung (ZAHawkesbury Institute for the Environment, University of Western Sydney, Australia∗ Corresponding author.E-mail address: [email protected] (M. Scherer-Lorenzen).
433-8319/$ – see front matter © 2013 Elsevier GmbH. All rights reserved.ttp://dx.doi.org/10.1016/j.ppees.2013.07.002
enmark
LF), Germany
2
a
b
c
d
e
f
g
h
a
ARRAA
KFBETMM
I
tpadiecraordMeeeforspsce
bldteidw
82 L. Baeten et al. / Perspectives in Plant Ecology, Evolution and Systematics 15 (2013) 281– 291
a Functional Ecology Department, CEFE/CNRS, Franceb Department of Plant Sciences, University of Oxford, UKc Department of Soil Science and Forest Nutrition, Forest Research Station Baden-Württemberg, Germanyd School of Biological Sciences, Royal Holloway, University of London, UKe Department of Forest- and Soil Sciences, University of Natural Resources and Life Sciences, Austriaf Department of Chemistry-Biology, Université de Québec à Trois-Rivières, Canadag Department of Forest and Management of Environment and Natural Resources, Democritus University of Thrace, Greeceh Department of Ecology, University of Alcala, Spain
r t i c l e i n f o
rticle history:eceived 6 March 2013eceived in revised form 4 July 2013ccepted 8 July 2013vailable online 6 August 2013
eywords:unDivEUROPEiodiversitycosystem functioningree species diversityultifunctionalityultidiversity
a b s t r a c t
One of the current advances in functional biodiversity research is the move away from short-lived testsystems towards the exploration of diversity-ecosystem functioning relationships in structurally morecomplex ecosystems. In forests, assumptions about the functional significance of tree species diversityhave only recently produced a new generation of research on ecosystem processes and services. Novelexperimental designs have now replaced traditional forestry trials, but these comparatively young exper-imental plots suffer from specific difficulties that are mainly related to the tree size and longevity. Treespecies diversity experiments therefore need to be complemented with comparative observational stud-ies in existing forests. Here we present the design and implementation of a new network of forest plotsalong tree species diversity gradients in six major European forest types: the FunDivEUROPE ExploratoryPlatform. Based on a review of the deficiencies of existing observational approaches and of unresolvedresearch questions and hypotheses, we discuss the fundamental criteria that shaped the design of ourplatform. Key features include the extent of the species diversity gradient with mixtures up to five species,strict avoidance of a dilution gradient, special attention to community evenness and minimal covariationwith other environmental factors. The new European research platform permits the most comprehen-sive assessment of tree species diversity effects on forest ecosystem functioning to date since it offers acommon set of research plots to groups of researchers from very different disciplines and uses the samemethodological approach in contrasting forest types along an extensive environmental gradient.
© 2013 Elsevier GmbH. All rights reserved.
ntroduction
The past two decades of research on biodiversity and ecosys-em functioning (BDEF) have shown that biodiversity is not only aassive consequence of the environmental conditions and inter-ctions between species (Naeem, 2002; Loreau, 2010), but thatifferences in biodiversity can largely affect ecosystem function-
ng. Several hundreds of published effects have provided amplevidence that plant biodiversity can influence key ecosystem pro-esses such as biomass production, nutrient cycling and pestegulation (Cardinale et al., 2012). While it is now generallyccepted that plant diversity can affect function, the importancef BDEF relationships in complex natural ecosystems and theirelevance to ecosystem management and conservation have beenebated (Srivastava and Vellend, 2005; Duffy, 2009; Hillebrand andatthiessen, 2009). Many of these concerns have arisen because
arly experiments and models on functional biodiversity lackednvironmental and biological complexity and did not considercosystem multifunctionality, i.e., the maintenance of multipleunctions (Hillebrand and Matthiessen, 2009). A new generationf studies therefore attempts to investigate BDEF relationships ineal-world settings (Solan et al., 2009). Short-lived test systemsuch as microcosms, mesocosms and grasslands have dominatedrevious research (Balvanera et al., 2006), but much greater empha-is is now being placed on structurally more complex systemsontaining long-lived plants, including forests (Scherer-Lorenzent al., 2005a).
Trees are text book examples of ecosystem engineers capa-le of modifying aspects of their environment, yet surprisingly
ittle is known about the functional significance of tree speciesiversity in forests (Nadrowski et al., 2010). Experimental forestryrials comparing monocultures with two-species mixtures have
far from maturity. While important diversity-functioning patternshave already been reported from these experiments (Vehviläinenand Koricheva, 2006; Potvin et al., 2011; Lei et al., 2012), the resultsmight differ considerably from those found in mature forests, whentrees are older and the species diversity affected the environmentfor several decades. Furthermore, experimental tree communitiesface several specific limitations including small plot size, simpli-fied age distributions and simplified stand structure compared withmature forest (reviews: Scherer-Lorenzen et al., 2005b; Leuschneret al., 2009). Studying existing, mature forests in real landscapeswould therefore complement the results from these experiments.To this end, two approaches seem to be promising. First, regionalor national forest inventory databases are ready-to-use and havenow also been explored to examine BDEF relationships in matureforest (Caspersen and Pacala, 2001; Vilà et al., 2005; Paquetteand Messier, 2011; Gamfeldt et al., 2013). However, they sufferfrom the disadvantages that tree diversity is generally confoundedwith many environmental variables and that usually only a fewfunctions are measured. The second approach, comparative obser-vational plots set up along tree diversity gradients in matureforests while maximally controlling other environmental factors,would allow to better isolate potential diversity effects fromconfounding environmental conditions. This approach would com-plement the existing networks of experimental research sites andinventories.
A first case study in a central European beech forest comparedforest patches on similar soils, in which past ownership and for-est use had created a small-scale mosaic of tree species diversity(Leuschner et al., 2009). However, this study used a complete dilu-tion design (Nadrowski et al., 2010; see Glossary) where the onlymonocultures were the ones of Fagus sylvatica and this tree specieswas present in all mixtures. This does not allow for separating
xisted for many decades (Pretzsch, 2005), but large-scale exper-ments with more species richness levels were only installeduring the past decade (e.g., Scherer-Lorenzen et al., 2005b;ww.treedivnet.ugent.be), meaning that these systems are still
eosf
ffects of increasing species diversity from the confounding effectsf decreasing dominance of F. sylvatica. At present few other local-cale comparative research platforms exist and most do not allowor disentangling the diversity signal from confounding factors such
y, Evo
aNwrftcstr
dmooppbsfuastedmcsatffEcisoAnttd
G
hrNhnc
(
(
(
(
(
pFhiiTiidi
R
sfs2tEip2cmwpinccanp
L. Baeten et al. / Perspectives in Plant Ecolog
s environmental gradients and species identity (see review byadrowski et al., 2010). A more extensive comparative approach,hich goes considerably beyond typical observational studies, was
ecently adopted in the German Biodiversity Exploratories, whichocus on the effects of land-use change on biodiversity and ecosys-em processes in forest and grassland (Fischer et al., 2010). A similaromparative approach could be used to allow for comparisons oftands of different tree species diversity in mature forest, in analogyo the land-use comparisons in the German Biodiversity Explorato-ies.
A comparative approach with study sites varying in tree speciesiversity and replicated at the continental scale would addressany of the deficiencies in forest functional biodiversity research
utlined above. Here we present the design and implementationf the FunDivEUROPE Exploratory Platform, a network of forestlots along tree species diversity gradients in six major Euro-ean forest types (FunDivEUROPE: Functional significance of forestiodiversity; www.fundiveurope.eu). With the additional asset oftudying forest types of very different European regions, the plat-orm will contribute to answering some of the most importantnsolved questions in BDEF research: does tree species diversityffect ecosystem functioning and the provisioning of ecosystemervices? Do the effects of differences in resource use and facilita-ion among species (i.e., complementarity effects) vary along broadnvironmental (climatic, soil) gradients? Using forest inventoryata bases, Paquette and Messier (2011) showed that comple-entarity may be more important for tree productivity in boreal
ompared with temperate forests, while Zhang et al. (2012) foundimilar complementarity effects across biomes. Furthermore, therere virtually no data available on ecosystem processes otherhan productivity. In the FunDivEUROPE project we will there-ore measure a large and comprehensive spectrum of differentunctions and related services in each plot of our platform. Thexploratory Platform provides further added value because it isombined with two complementary platforms that are studiedn parallel (Fig. 1): (i) a network of European tree species diver-ity experiments (Experimental Platform) and (ii) a compilationf national and regional forest inventories (Inventory Platform).s the Exploratory Platform was set up as a hypothesis-drivenetwork of plots, we begin this contribution with an overview ofhe specific research questions and hypotheses we are aiming toest. The rationale of the platform and the design are subsequentlyiscussed.
uiding research questions and hypotheses
The research platform was designed to test five generalypotheses that have been highlighted as unresolved in recenteview and opinion papers (e.g., Hillebrand and Matthiessen, 2009;adrowski et al., 2010; Cardinale et al., 2012). The first fourypotheses have been explored extensively in other systems buteed further attention in forest ecosystems, while the fifth is espe-ially relevant to trees and forests:
1) Tree species mixtures outperform ecosystem functioning ofmonocultures, including the stocks and fluxes of energy andmaterials and their stability over time (Pacala and Kinzig, 2002).Mixtures have a higher probability of containing key specieswith a large impact on ecosystem functioning (i.e., identityand sampling/selection effect) and resource partitioning and
positive interactions among heterospecific neighbouring treesfurther influence function (i.e., complementarity effect).2) The relative importance of species identity effects andcomplementarity effects is not consistent for forests at
dcpl
lution and Systematics 15 (2013) 281– 291 283
different positions along extensive environmental gradients.For instance, the strength of BDEF relationships is expectedto increase with environmental stress (Paquette and Messier,2011; Jucker and Coomes, 2012).
3) Mixtures of tree species enhance associational resistance topests and diseases via reduced host colonization and increasedtop down regulation by natural enemies. Likewise, their resis-tance and resilience towards abiotic environmental stressorsand disturbances such as drought are increased compared withmonocultures (the relative importance of the potential mech-anisms are debated; Griffin et al., 2009).
4) The number of species needed to support a single ecosystemfunction is lower than the number of species needed to supportmultiple functions simultaneously. The significance of foresttree species diversity for ecosystem functioning increases whenmultiple functions are considered.
5) Mixtures create larger environmental heterogeneity at thescale of several individual trees compared with monospecificstands because trees are autogenic ecosystem engineers andindividuals may modify their immediate environment (e.g., viaroot processes, litter input, light penetration and rain intercep-tion). Diversity effects are therefore not only expressed in termsof mean values, but also in terms of variability within foreststands.
A test of this set of hypotheses will provide the most com-rehensive assessment of BDEF relationships in forests to date.urthermore, interactions among coexisting species are at theeart of any diversity effect on ecosystem functioning. Testing the
mportance of species interactions therefore requires recognizingndividuals, not only species, as a relevant level of observation.he size of trees makes them preferred study objects to explic-tly explore the interactions between individuals. We are thus alsonterested in how tree performance and a tree’s impact on its imme-iate environment are influenced by the diversity and structure of
ts neighbourhood.
ationale: maximizing three fundamental design criteria
A research platform designed to answer the questions abovehould comprise a systematic network of research plots in existingorests that maximizes three fundamental criteria: comprehen-iveness, representativeness and orthogonality (Nadrowski et al.,010; see Glossary). First, comprehensiveness refers to the spec-rum of ecosystem functions and services that can be quantified.cosystems inherently exhibit a multitude of functions, so increas-ng the relevance of BDEF studies requires a multifunctionalerspective (Gamfeldt et al., 2008; Hillebrand and Matthiessen,009). Since functions are expressed at different spatial scales, thehallenge is to establish plots with a layout matching the particulareasurement requirements of a diverse set of functions, some ofhich need a certain number of trees while others need particularlot sizes. Low comprehensiveness is generally a limitation of exist-
ng observational (inventory) networks, which focus on a limitedumber of ecosystem processes such as productivity. The secondriterion, representativeness, is achieved for plots established inharacteristic forest types as we find them in landscapes, allowing
credible translation of results to the real world. Representative-ess thus relates to the relevance of the results for managers andolicy makers. This is an important design element and is the fun-
amental reason for complementing planned experiments withomparative studies in existing forest. Representativeness in ourlatform is maximized in three directions: (i) the forests are ateast historically managed for forestry and are currently in the
284 L. Baeten et al. / Perspectives in Plant Ecology, Evolution and Systematics 15 (2013) 281– 291
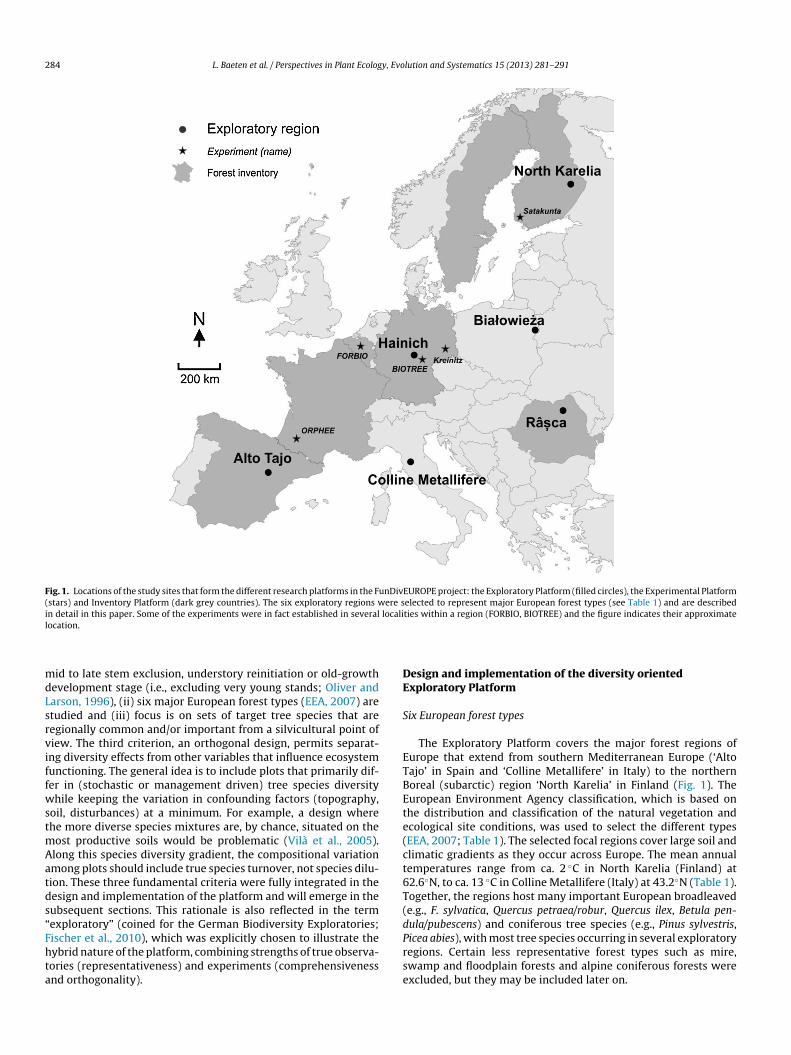
Fig. 1. Locations of the study sites that form the different research platforms in the FunDivEUROPE project: the Exploratory Platform (filled circles), the Experimental Platform(stars) and Inventory Platform (dark grey countries). The six exploratory regions were selected to represent major European forest types (see Table 1) and are describedin detail in this paper. Some of the experiments were in fact established in several localities within a region (FORBIO, BIOTREE) and the figure indicates their approximatel
mdLsrviffwstmAatds“Fhta
DE
S
ETBEte(ct6T(d
ocation.
id to late stem exclusion, understory reinitiation or old-growthevelopment stage (i.e., excluding very young stands; Oliver andarson, 1996), (ii) six major European forest types (EEA, 2007) aretudied and (iii) focus is on sets of target tree species that areegionally common and/or important from a silvicultural point ofiew. The third criterion, an orthogonal design, permits separat-ng diversity effects from other variables that influence ecosystemunctioning. The general idea is to include plots that primarily dif-er in (stochastic or management driven) tree species diversityhile keeping the variation in confounding factors (topography,
oil, disturbances) at a minimum. For example, a design wherehe more diverse species mixtures are, by chance, situated on the
ost productive soils would be problematic (Vilà et al., 2005).long this species diversity gradient, the compositional variationmong plots should include true species turnover, not species dilu-ion. These three fundamental criteria were fully integrated in theesign and implementation of the platform and will emerge in theubsequent sections. This rationale is also reflected in the termexploratory” (coined for the German Biodiversity Exploratories;
ischer et al., 2010), which was explicitly chosen to illustrate theybrid nature of the platform, combining strengths of true observa-ories (representativeness) and experiments (comprehensivenessnd orthogonality).Prse
esign and implementation of the diversity orientedxploratory Platform
ix European forest types
The Exploratory Platform covers the major forest regions ofurope that extend from southern Mediterranean Europe (‘Altoajo’ in Spain and ‘Colline Metallifere’ in Italy) to the northernoreal (subarctic) region ‘North Karelia’ in Finland (Fig. 1). Theuropean Environment Agency classification, which is based onhe distribution and classification of the natural vegetation andcological site conditions, was used to select the different typesEEA, 2007; Table 1). The selected focal regions cover large soil andlimatic gradients as they occur across Europe. The mean annualemperatures range from ca. 2 ◦C in North Karelia (Finland) at2.6◦N, to ca. 13 ◦C in Colline Metallifere (Italy) at 43.2◦N (Table 1).ogether, the regions host many important European broadleavede.g., F. sylvatica, Quercus petraea/robur, Quercus ilex, Betula pen-ula/pubescens) and coniferous tree species (e.g., Pinus sylvestris,
icea abies), with most tree species occurring in several exploratoryegions. Certain less representative forest types such as mire,wamp and floodplain forests and alpine coniferous forests werexcluded, but they may be included later on.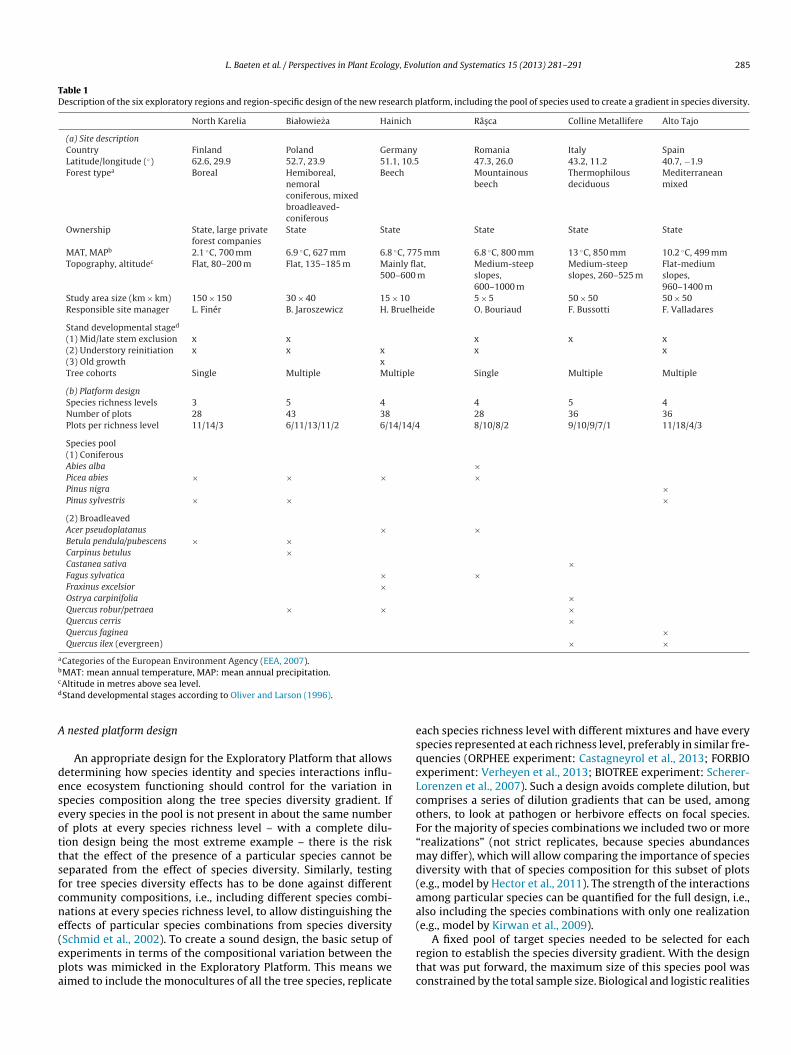
L. Baeten et al. / Perspectives in Plant Ecology, Evolution and Systematics 15 (2013) 281– 291 285
Table 1Description of the six exploratory regions and region-specific design of the new research platform, including the pool of species used to create a gradient in species diversity.
North Karelia Białowieza Hainich Râs ca Colline Metallifere Alto Tajo
(a) Site descriptionCountry Finland Poland Germany Romania Italy SpainLatitude/longitude (◦) 62.6, 29.9 52.7, 23.9 51.1, 10.5 47.3, 26.0 43.2, 11.2 40.7, −1.9Forest typea Boreal Hemiboreal,
nemoralconiferous, mixedbroadleaved-coniferous
Beech Mountainousbeech
Thermophilousdeciduous
Mediterraneanmixed
Ownership State, large privateforest companies
State State State State State
MAT, MAPb 2.1 ◦C, 700 mm 6.9 ◦C, 627 mm 6.8 ◦C, 775 mm 6.8 ◦C, 800 mm 13 ◦C, 850 mm 10.2 ◦C, 499 mmTopography, altitudec Flat, 80–200 m Flat, 135–185 m Mainly flat,
500–600 mMedium-steepslopes,600–1000 m
Medium-steepslopes, 260–525 m
Flat-mediumslopes,960–1400 m
Study area size (km × km) 150 × 150 30 × 40 15 × 10 5 × 5 50 × 50 50 × 50Responsible site manager L. Finér B. Jaroszewicz H. Bruelheide O. Bouriaud F. Bussotti F. Valladares
Stand developmental staged
(1) Mid/late stem exclusion x x x x x(2) Understory reinitiation x x x x x(3) Old growth xTree cohorts Single Multiple Multiple Single Multiple Multiple
(b) Platform designSpecies richness levels 3 5 4 4 5 4Number of plots 28 43 38 28 36 36Plots per richness level 11/14/3 6/11/13/11/2 6/14/14/4 8/10/8/2 9/10/9/7/1 11/18/4/3
Species pool(1) ConiferousAbies alba ×Picea abies × × × ×Pinus nigra ×Pinus sylvestris × × ×(2) BroadleavedAcer pseudoplatanus × ×Betula pendula/pubescens × ×Carpinus betulus ×Castanea sativa ×Fagus sylvatica × ×Fraxinus excelsior ×Ostrya carpinifolia ×Quercus robur/petraea × × ×Quercus cerris ×Quercus faginea ×Quercus ilex (evergreen) × ×
aCategories of the European Environment Agency (EEA, 2007).b
c
d
A
deseottsfcne(epa
esqeLcoF“md(aa(
MAT: mean annual temperature, MAP: mean annual precipitation.Altitude in metres above sea level.Stand developmental stages according to Oliver and Larson (1996).
nested platform design
An appropriate design for the Exploratory Platform that allowsetermining how species identity and species interactions influ-nce ecosystem functioning should control for the variation inpecies composition along the tree species diversity gradient. Ifvery species in the pool is not present in about the same numberf plots at every species richness level – with a complete dilu-ion design being the most extreme example – there is the riskhat the effect of the presence of a particular species cannot beeparated from the effect of species diversity. Similarly, testingor tree species diversity effects has to be done against differentommunity compositions, i.e., including different species combi-ations at every species richness level, to allow distinguishing theffects of particular species combinations from species diversity
Schmid et al., 2002). To create a sound design, the basic setup ofxperiments in terms of the compositional variation between thelots was mimicked in the Exploratory Platform. This means weimed to include the monocultures of all the tree species, replicatertc
ach species richness level with different mixtures and have everypecies represented at each richness level, preferably in similar fre-uencies (ORPHEE experiment: Castagneyrol et al., 2013; FORBIOxperiment: Verheyen et al., 2013; BIOTREE experiment: Scherer-orenzen et al., 2007). Such a design avoids complete dilution, butomprises a series of dilution gradients that can be used, amongthers, to look at pathogen or herbivore effects on focal species.or the majority of species combinations we included two or morerealizations” (not strict replicates, because species abundancesay differ), which will allow comparing the importance of species
iversity with that of species composition for this subset of plotse.g., model by Hector et al., 2011). The strength of the interactionsmong particular species can be quantified for the full design, i.e.,lso including the species combinations with only one realizatione.g., model by Kirwan et al., 2009).
A fixed pool of target species needed to be selected for eachegion to establish the species diversity gradient. With the designhat was put forward, the maximum size of this species pool wasonstrained by the total sample size. Biological and logistic realities
2 y, Evolution and Systematics 15 (2013) 281– 291
is(bpudsilid1Dspsmccb
iHsihiiabCsbwdntcopNtspmiri(ict2
S
amasAoi
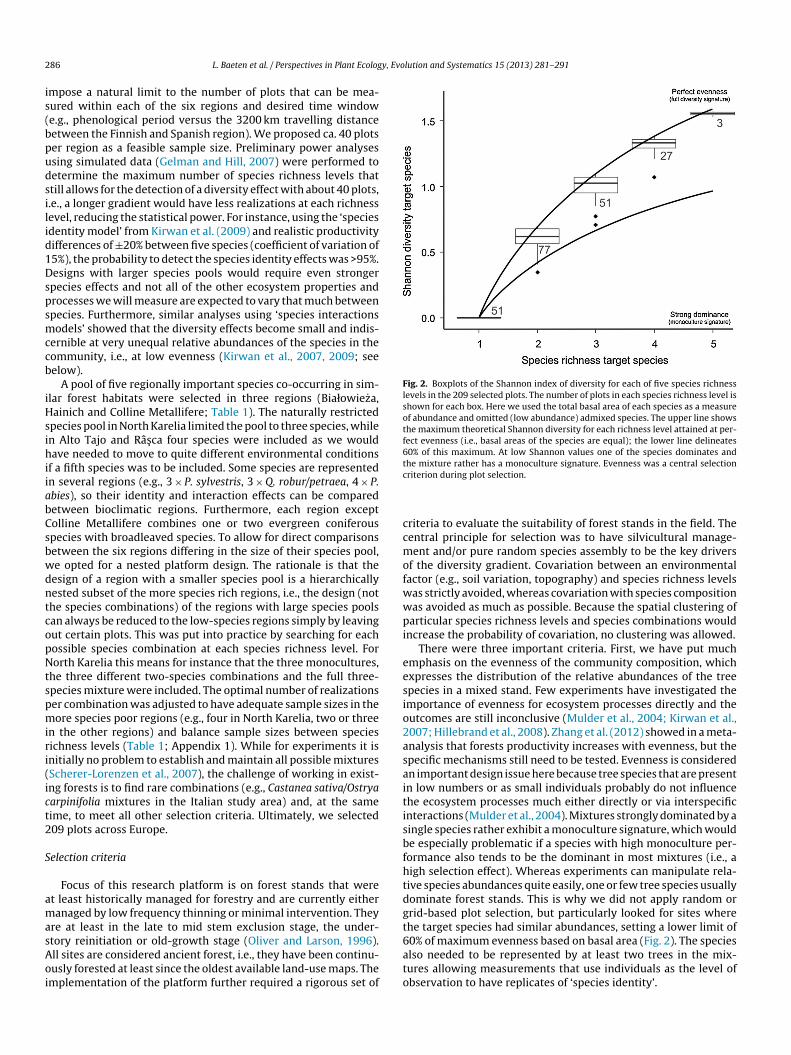
Fig. 2. Boxplots of the Shannon index of diversity for each of five species richnesslevels in the 209 selected plots. The number of plots in each species richness level isshown for each box. Here we used the total basal area of each species as a measureof abundance and omitted (low abundance) admixed species. The upper line showsthe maximum theoretical Shannon diversity for each richness level attained at per-fect evenness (i.e., basal areas of the species are equal); the lower line delineates60% of this maximum. At low Shannon values one of the species dominates andthe mixture rather has a monoculture signature. Evenness was a central selectionc
ccmofwwpi
eesio2asaitisbfhtdgt
86 L. Baeten et al. / Perspectives in Plant Ecolog
mpose a natural limit to the number of plots that can be mea-ured within each of the six regions and desired time windowe.g., phenological period versus the 3200 km travelling distanceetween the Finnish and Spanish region). We proposed ca. 40 plotser region as a feasible sample size. Preliminary power analysessing simulated data (Gelman and Hill, 2007) were performed toetermine the maximum number of species richness levels thattill allows for the detection of a diversity effect with about 40 plots,.e., a longer gradient would have less realizations at each richnessevel, reducing the statistical power. For instance, using the ‘speciesdentity model’ from Kirwan et al. (2009) and realistic productivityifferences of ±20% between five species (coefficient of variation of5%), the probability to detect the species identity effects was >95%.esigns with larger species pools would require even stronger
pecies effects and not all of the other ecosystem properties androcesses we will measure are expected to vary that much betweenpecies. Furthermore, similar analyses using ‘species interactionsodels’ showed that the diversity effects become small and indis-
ernible at very unequal relative abundances of the species in theommunity, i.e., at low evenness (Kirwan et al., 2007, 2009; seeelow).
A pool of five regionally important species co-occurring in sim-lar forest habitats were selected in three regions (Białowieza,ainich and Colline Metallifere; Table 1). The naturally restricted
pecies pool in North Karelia limited the pool to three species, whilen Alto Tajo and Râs ca four species were included as we wouldave needed to move to quite different environmental conditions
f a fifth species was to be included. Some species are representedn several regions (e.g., 3 × P. sylvestris, 3 × Q. robur/petraea, 4 × P.bies), so their identity and interaction effects can be comparedetween bioclimatic regions. Furthermore, each region exceptolline Metallifere combines one or two evergreen coniferouspecies with broadleaved species. To allow for direct comparisonsetween the six regions differing in the size of their species pool,e opted for a nested platform design. The rationale is that theesign of a region with a smaller species pool is a hierarchicallyested subset of the more species rich regions, i.e., the design (nothe species combinations) of the regions with large species poolsan always be reduced to the low-species regions simply by leavingut certain plots. This was put into practice by searching for eachossible species combination at each species richness level. Fororth Karelia this means for instance that the three monocultures,
he three different two-species combinations and the full three-pecies mixture were included. The optimal number of realizationser combination was adjusted to have adequate sample sizes in theore species poor regions (e.g., four in North Karelia, two or three
n the other regions) and balance sample sizes between speciesichness levels (Table 1; Appendix 1). While for experiments it isnitially no problem to establish and maintain all possible mixturesScherer-Lorenzen et al., 2007), the challenge of working in exist-ng forests is to find rare combinations (e.g., Castanea sativa/Ostryaarpinifolia mixtures in the Italian study area) and, at the sameime, to meet all other selection criteria. Ultimately, we selected09 plots across Europe.
election criteria
Focus of this research platform is on forest stands that weret least historically managed for forestry and are currently eitheranaged by low frequency thinning or minimal intervention. They
re at least in the late to mid stem exclusion stage, the under-
tory reinitiation or old-growth stage (Oliver and Larson, 1996).ll sites are considered ancient forest, i.e., they have been continu-usly forested at least since the oldest available land-use maps. Themplementation of the platform further required a rigorous set of6ato
riterion during plot selection.
riteria to evaluate the suitability of forest stands in the field. Theentral principle for selection was to have silvicultural manage-ent and/or pure random species assembly to be the key drivers
f the diversity gradient. Covariation between an environmentalactor (e.g., soil variation, topography) and species richness levelsas strictly avoided, whereas covariation with species compositionas avoided as much as possible. Because the spatial clustering ofarticular species richness levels and species combinations would
ncrease the probability of covariation, no clustering was allowed.There were three important criteria. First, we have put much
mphasis on the evenness of the community composition, whichxpresses the distribution of the relative abundances of the treepecies in a mixed stand. Few experiments have investigated themportance of evenness for ecosystem processes directly and theutcomes are still inconclusive (Mulder et al., 2004; Kirwan et al.,007; Hillebrand et al., 2008). Zhang et al. (2012) showed in a meta-nalysis that forests productivity increases with evenness, but thepecific mechanisms still need to be tested. Evenness is consideredn important design issue here because tree species that are presentn low numbers or as small individuals probably do not influencehe ecosystem processes much either directly or via interspecificnteractions (Mulder et al., 2004). Mixtures strongly dominated by aingle species rather exhibit a monoculture signature, which woulde especially problematic if a species with high monoculture per-ormance also tends to be the dominant in most mixtures (i.e., aigh selection effect). Whereas experiments can manipulate rela-ive species abundances quite easily, one or few tree species usuallyominate forest stands. This is why we did not apply random orrid-based plot selection, but particularly looked for sites wherehe target species had similar abundances, setting a lower limit of0% of maximum evenness based on basal area (Fig. 2). The species
lso needed to be represented by at least two trees in the mix-ures allowing measurements that use individuals as the level ofbservation to have replicates of ‘species identity’.
y, Evo
sttoc
dtw2wtsatlctd
S
ifsmlamtntGw1bppfdmwb(ct
wdsssdpTtissadsi
os(we
tsaboIiubiwwt
O
rvbiimticwrmoitmtme
tarVptmqgbqpmrmpa
L. Baeten et al. / Perspectives in Plant Ecolog
The second criterion related to the presence of non-targetpecies. Admixture of such species was unavoidable, but we aimedo keep the summed basal area of the admixed species below 5% ofhe total basal area (with a maximum of ca. 10%). Across the regions,nly 18 out of the 209 plots slightly exceeded the 10% admixtureriterion and 43 exceeded the 5% criterion.
The third criterion was to ensure that the effect of tree speciesiversity was not confounded with site-, soil- and stand-related fac-ors. These factors were operationalized in a list of basic descriptors,hich was used as a checklist during field exploration (Appendix
). Regarding the stand-related criteria, shrubs lower than 1.3 mere considered to be response variables, i.e., not contributing
o the desired mixtures, whereas larger individuals followed theame rules of admixed species outlined above. The age distributionnd forest structure were allowed to covary to some degree withhe species diversity gradient, e.g., more uneven-aged and multi-ayered sites at the higher species richness levels. We consider thisovariation as an integral part of the diversity effect. Yet, alonghe diversity gradient, the tree populations had to be in the sameevelopmental stage.
tepwise selection and establishment of research plots
An important issue in the implementation of a research platforms plot size. Relatively small plots (e.g., <2000 m2) are criticizedor containing few trees of each species at high levels of diver-ity, may represent atypical habitat islands in the larger forestatrix creating edge effects and may poorly represent particular
arger-scale ecosystem properties such as resilience after disturb-nce (Leuschner et al., 2009). Large plots are on the other handore likely to be environmentally heterogeneous and to contain
he dominant species in every plot. We performed a prelimi-ary test with a circular plot shifted at 10 m intervals over theree maps of two full forest inventories (Hainich National Park,ermany, 28 ha; Liedekerke, Belgium, 9 ha). The tested plot sizesere 500 m2, 1000 m2 and 2000 m2, corresponding to plot radii of
2.6 m, 17.8 m and 25.2 m. At a plot size of 2000 m2, it was impossi-le to avoid a complete dilution design, with the dominant speciesresent in every potential site (Hainich: F. sylvatica; Liedekerke: B.endula). We decided to use a 900 m2 core plot size (30 m × 30 m)or the Exploratory Platform, i.e., small enough to avoid a completeilution design and at least the minimum size for several measure-ents to be ecologically meaningful (e.g., herbivory, litter input,ater quality). To account for potential edge effects, a 10 m wide
uffer zone around each plot was requested during plot selectionselected zone 50 × 50 m). This buffer zone had to be similar to theore plot in terms of the forest type, structure and composition, buthe evenness and admixture criteria were less strict.
The selection of plots basically occurred in two steps, each ofhich also included part of the plot characterization. Once theesign and selection criteria were fixed, the species pool waselected for each exploratory region and the focal regions werecreened to delineate subareas with a good probability to find thosepecies in all the desired combinations (Fig. 3). This screening wasone using regionally available data such as forest managementlans and soil maps, complemented with exploratory field visits.hen, local teams searched several potentially suitable sites withinhese subareas for each of the desired species combinations dur-ng intensive field campaigns. The idea was to initially have moreites than actually needed in the final design (“oversample”) andelect the final set of sites randomly from this larger pool. This
pproach introduced an important randomization step into theesign. In some cases (e.g., rare species combinations) only oneite was ultimately available for selection, of course. The suitabil-ty of each site was checked in the field using a standardized listfciC
lution and Systematics 15 (2013) 281– 291 287
f quick descriptors of site conditions, soil properties and foresttand structure that could be estimated without establishing plotsAppendix 2). Actual dendrometric measurements were performedhere needed to verify the suitability of the mixture in terms of the
venness or the degree of admixture of non-target species.After this first selection phase, we analyzed the variation among
he selected sites based on the three groups of descriptors (site, soil,tand) to identify undesired covariation with species richness levelsnd to check for clearly deviating sites (e.g., one plot on calcareousedrock when all others were on sandstone) (Fig. 4). The final setf sites was selected after removing potentially problematic ones.n a second field campaign, 900 m2 plots (30 m × 30 m), subdividednto nine 100 m2 subplots, were established in the selected sitessing wooden poles (Fig. 5a). The position (±0.5 m) and diameter atreast height (dbh, ±0.5 cm) of each tree >7.5 cm dbh was measured
n these plots. Based on these tree position data, plot-specific plansere drawn allocating each measurement to particular locationsithin the plot, including strict no-go areas and preferred walking
racks (Fig. 5b).
utlook for scientists and managers
With this Exploratory Platform we move away from earlieresearch on the effects of environmental factors on forest biodi-ersity to a new research paradigm focussing on the effects ofiodiversity on ecosystem functioning. Together with the exper-
ments and inventory data, the Exploratory Platform provides anmportant new European research infrastructure for long-term
onitoring of the effects of tree species diversity on forest ecosys-em functions and the ecosystem services provided by forests. Withts diversity-oriented design, the Exploratory Platform definitelyomplements and provides added value to existing networks thatere based on a systematic sampling grid such as national and
egional forest inventories or the pan-European network of forestonitoring plots (ICP Forests Level I and II; www.icp-forests.org),
riginally designed to monitor air pollution effects on forest vital-ty. We focussed particularly on a design that allows separatingree species identity from complementarity effects, improving on
ore common dilution schemes. With mixtures up to five species,he species diversity gradient is longer than common two-species
ixture trials, and the special attention to community evennessnsures that no single species dominates the mixtures.
The platform uses the same methodological approach in con-rasting forest types along an extensive environmental gradientnd offers a common set of suitable research plots to groups ofesearchers from very different disciplines (cf. Fischer et al., 2010).arious measurements characterizing a wide array of ecosystemroperties, processes and functions will be performed and, inurn, related to the provisioning of ecosystem services. Measure-
ents related to supporting and provisioning services include theuantification of nutrient stocks and cycling, net above and below-round productivity, photosynthesis parameters and the wateralance. Measurements related to regulating services include theuantification of the load of insect pests, mammal herbivory, fungalathogens and invasive plants. Comprehensive syntheses acrossany response variables and modelling efforts to forecast BDEF
elationships under changing environmental conditions such as cli-ate change heavily rely on such data sets collected on common
lots. It is therefore the platform’s philosophy to make sure thatll measurements are performed on all plots. This philosophy calls
or indicators and proxies that can be measured quickly and at lowost, instead of relying on the monitoring of only few processesn great detail, which is the core activity of other networks (e.g.,arboEUROPE, ICP Forests Level II). Only few labour intensive and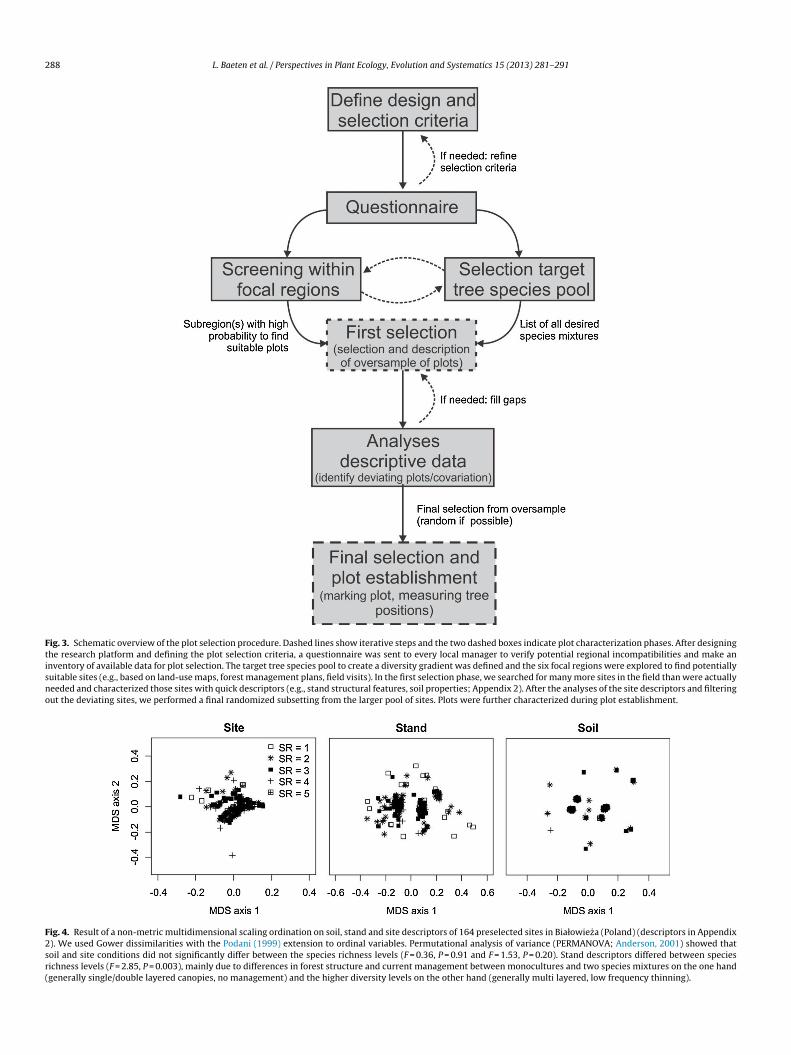
288 L. Baeten et al. / Perspectives in Plant Ecology, Evolution and Systematics 15 (2013) 281– 291
Fig. 3. Schematic overview of the plot selection procedure. Dashed lines show iterative steps and the two dashed boxes indicate plot characterization phases. After designingthe research platform and defining the plot selection criteria, a questionnaire was sent to every local manager to verify potential regional incompatibilities and make aninventory of available data for plot selection. The target tree species pool to create a diversity gradient was defined and the six focal regions were explored to find potentiallysuitable sites (e.g., based on land-use maps, forest management plans, field visits). In the first selection phase, we searched for many more sites in the field than were actuallyneeded and characterized those sites with quick descriptors (e.g., stand structural features, soil properties; Appendix 2). After the analyses of the site descriptors and filteringout the deviating sites, we performed a final randomized subsetting from the larger pool of sites. Plots were further characterized during plot establishment.
Fig. 4. Result of a non-metric multidimensional scaling ordination on soil, stand and site descriptors of 164 preselected sites in Białowieza (Poland) (descriptors in Appendix2). We used Gower dissimilarities with the Podani (1999) extension to ordinal variables. Permutational analysis of variance (PERMANOVA; Anderson, 2001) showed thatsoil and site conditions did not significantly differ between the species richness levels (F = 0.36, P = 0.91 and F = 1.53, P = 0.20). Stand descriptors differed between speciesrichness levels (F = 2.85, P = 0.003), mainly due to differences in forest structure and current management between monocultures and two species mixtures on the one hand(generally single/double layered canopies, no management) and the higher diversity levels on the other hand (generally multi layered, low frequency thinning).

L. Baeten et al. / Perspectives in Plant Ecology, Evolution and Systematics 15 (2013) 281– 291 289
Fig. 5. (a) Photograph of an established plot in North Karelia, Finland (two-species mixture with P. abies and B. pendula/pubescens). The photo was taken from a corner postand shows a plot border and a plot diagonal; the wooden poles are at every 10 m (Photograph by Timo Domisch). (b) Example of a detailed plot scheme for this 30 m × 30 mplot. Dots represent trees, with dot sizes proportional to the tree diameter at breast height. Shapes with different colours indicate the various locations for sampling ands ood sas ferent
eottrLcw
cns
cmktttps
etting up experiments. The large red circles are for instance the areas for dead wampling. The green shaded area left of the plot is used to plant small trees with dif
xpensive measurements (e.g., water quality, sapflow) are carriedut on a subset of Highly Instrumented Plots (HIPs). The lifetime ofhe platform is intended to be stretched far beyond the duration ofhe project funding (2014), e.g., by continuing and improving theesearch in close collaboration with the further development of theTER Europe network (www.lter-europe.net). In this way, it can beontinued as a long-term network open to other scientists ready toork within the same philosophy.
The knowledge generated within the Exploratory Platform willontribute to new views on sustainable forest management andature conservation. This input is coming at a critical time, whentrategies to adapt European forests to global changes, such as
Tstb
mpling and the small yellow squares indicate the sites for root biomass and soil provenances.
limate change (Kolström et al., 2011) and the transition towardsore biobased economies (Schulze et al., 2012), are required. It is
ey that these strategies are based on an in-depth understanding ofhe relationships between forest structure, composition and func-ion. Since most of the economically important European timberree species are represented in the Exploratory Platform, it has greatotential for translating the forest diversity-functioning relation-hips into guidelines that are of real interest for forest management.
hese guidelines will, among others, list which forest types, treepecies or tree species combinations will lead to the optimiza-ion of multiple ecosystem services or create important trade-offsetween services (Gamfeldt et al., 2013). Finally, knowledge on the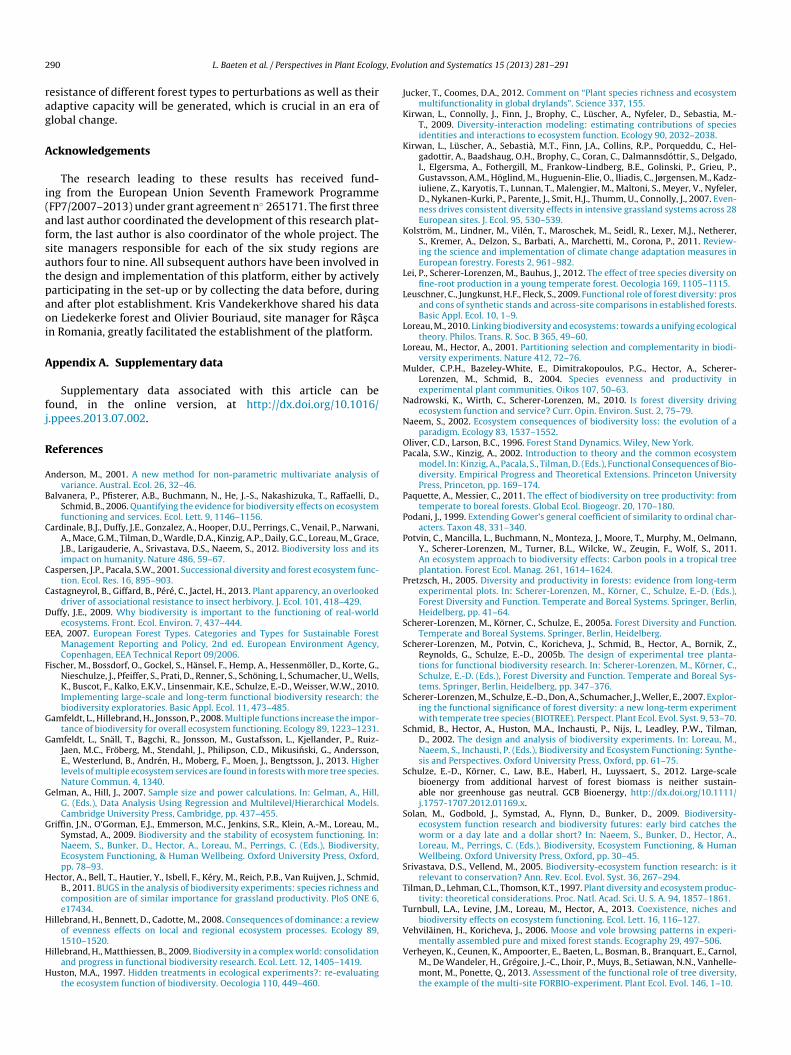
2 y, Evo
rag
A
i(afsatpaoi
A
fj
R
A
B
C
C
C
D
E
F
G
G
G
G
H
H
H
H
J
K
K
K
L
L
L
L
M
N
N
OP
P
P
P
P
S
S
S
S
S
S
S
T
T
V
90 L. Baeten et al. / Perspectives in Plant Ecolog
esistance of different forest types to perturbations as well as theirdaptive capacity will be generated, which is crucial in an era oflobal change.
cknowledgements
The research leading to these results has received fund-ng from the European Union Seventh Framework ProgrammeFP7/2007–2013) under grant agreement n◦ 265171. The first threend last author coordinated the development of this research plat-orm, the last author is also coordinator of the whole project. Theite managers responsible for each of the six study regions areuthors four to nine. All subsequent authors have been involved inhe design and implementation of this platform, either by activelyarticipating in the set-up or by collecting the data before, duringnd after plot establishment. Kris Vandekerkhove shared his datan Liedekerke forest and Olivier Bouriaud, site manager for Râs can Romania, greatly facilitated the establishment of the platform.
ppendix A. Supplementary data
Supplementary data associated with this article can beound, in the online version, at http://dx.doi.org/10.1016/.ppees.2013.07.002.
eferences
nderson, M., 2001. A new method for non-parametric multivariate analysis ofvariance. Austral. Ecol. 26, 32–46.
alvanera, P., Pfisterer, A.B., Buchmann, N., He, J.-S., Nakashizuka, T., Raffaelli, D.,Schmid, B., 2006. Quantifying the evidence for biodiversity effects on ecosystemfunctioning and services. Ecol. Lett. 9, 1146–1156.
ardinale, B.J., Duffy, J.E., Gonzalez, A., Hooper, D.U., Perrings, C., Venail, P., Narwani,A., Mace, G.M., Tilman, D., Wardle, D.A., Kinzig, A.P., Daily, G.C., Loreau, M., Grace,J.B., Larigauderie, A., Srivastava, D.S., Naeem, S., 2012. Biodiversity loss and itsimpact on humanity. Nature 486, 59–67.
aspersen, J.P., Pacala, S.W., 2001. Successional diversity and forest ecosystem func-tion. Ecol. Res. 16, 895–903.
astagneyrol, B., Giffard, B., Péré, C., Jactel, H., 2013. Plant apparency, an overlookeddriver of associational resistance to insect herbivory. J. Ecol. 101, 418–429.
uffy, J.E., 2009. Why biodiversity is important to the functioning of real-worldecosystems. Front. Ecol. Environ. 7, 437–444.
EA, 2007. European Forest Types. Categories and Types for Sustainable ForestManagement Reporting and Policy, 2nd ed. European Environment Agency,Copenhagen, EEA Technical Report 09/2006.
ischer, M., Bossdorf, O., Gockel, S., Hänsel, F., Hemp, A., Hessenmöller, D., Korte, G.,Nieschulze, J., Pfeiffer, S., Prati, D., Renner, S., Schöning, I., Schumacher, U., Wells,K., Buscot, F., Kalko, E.K.V., Linsenmair, K.E., Schulze, E.-D., Weisser, W.W., 2010.Implementing large-scale and long-term functional biodiversity research: thebiodiversity exploratories. Basic Appl. Ecol. 11, 473–485.
amfeldt, L., Hillebrand, H., Jonsson, P., 2008. Multiple functions increase the impor-tance of biodiversity for overall ecosystem functioning. Ecology 89, 1223–1231.
amfeldt, L., Snäll, T., Bagchi, R., Jonsson, M., Gustafsson, L., Kjellander, P., Ruiz-Jaen, M.C., Fröberg, M., Stendahl, J., Philipson, C.D., Mikusinski, G., Andersson,E., Westerlund, B., Andrén, H., Moberg, F., Moen, J., Bengtsson, J., 2013. Higherlevels of multiple ecosystem services are found in forests with more tree species.Nature Commun. 4, 1340.
elman, A., Hill, J., 2007. Sample size and power calculations. In: Gelman, A., Hill,G. (Eds.), Data Analysis Using Regression and Multilevel/Hierarchical Models.Cambridge University Press, Cambridge, pp. 437–455.
riffin, J.N., O’Gorman, E.J., Emmerson, M.C., Jenkins, S.R., Klein, A.-M., Loreau, M.,Symstad, A., 2009. Biodiversity and the stability of ecosystem functioning. In:Naeem, S., Bunker, D., Hector, A., Loreau, M., Perrings, C. (Eds.), Biodiversity,Ecosystem Functioning, & Human Wellbeing. Oxford University Press, Oxford,pp. 78–93.
ector, A., Bell, T., Hautier, Y., Isbell, F., Kéry, M., Reich, P.B., Van Ruijven, J., Schmid,B., 2011. BUGS in the analysis of biodiversity experiments: species richness andcomposition are of similar importance for grassland productivity. PloS ONE 6,e17434.
illebrand, H., Bennett, D., Cadotte, M., 2008. Consequences of dominance: a reviewof evenness effects on local and regional ecosystem processes. Ecology 89,
1510–1520.illebrand, H., Matthiessen, B., 2009. Biodiversity in a complex world: consolidationand progress in functional biodiversity research. Ecol. Lett. 12, 1405–1419.
uston, M.A., 1997. Hidden treatments in ecological experiments?: re-evaluatingthe ecosystem function of biodiversity. Oecologia 110, 449–460.
V
lution and Systematics 15 (2013) 281– 291
ucker, T., Coomes, D.A., 2012. Comment on “Plant species richness and ecosystemmultifunctionality in global drylands”. Science 337, 155.
irwan, L., Connolly, J., Finn, J., Brophy, C., Lüscher, A., Nyfeler, D., Sebastia, M.-T., 2009. Diversity-interaction modeling: estimating contributions of speciesidentities and interactions to ecosystem function. Ecology 90, 2032–2038.
irwan, L., Lüscher, A., Sebastià, M.T., Finn, J.A., Collins, R.P., Porqueddu, C., Hel-gadottir, A., Baadshaug, O.H., Brophy, C., Coran, C., Dalmannsdóttir, S., Delgado,I., Elgersma, A., Fothergill, M., Frankow-Lindberg, B.E., Golinski, P., Grieu, P.,Gustavsson, A.M., Höglind, M., Huguenin-Elie, O., Iliadis, C., Jørgensen, M., Kadz-iuliene, Z., Karyotis, T., Lunnan, T., Malengier, M., Maltoni, S., Meyer, V., Nyfeler,D., Nykanen-Kurki, P., Parente, J., Smit, H.J., Thumm, U., Connolly, J., 2007. Even-ness drives consistent diversity effects in intensive grassland systems across 28European sites. J. Ecol. 95, 530–539.
olström, M., Lindner, M., Vilén, T., Maroschek, M., Seidl, R., Lexer, M.J., Netherer,S., Kremer, A., Delzon, S., Barbati, A., Marchetti, M., Corona, P., 2011. Review-ing the science and implementation of climate change adaptation measures inEuropean forestry. Forests 2, 961–982.
ei, P., Scherer-Lorenzen, M., Bauhus, J., 2012. The effect of tree species diversity onfine-root production in a young temperate forest. Oecologia 169, 1105–1115.
euschner, C., Jungkunst, H.F., Fleck, S., 2009. Functional role of forest diversity: prosand cons of synthetic stands and across-site comparisons in established forests.Basic Appl. Ecol. 10, 1–9.
oreau, M., 2010. Linking biodiversity and ecosystems: towards a unifying ecologicaltheory. Philos. Trans. R. Soc. B 365, 49–60.
oreau, M., Hector, A., 2001. Partitioning selection and complementarity in biodi-versity experiments. Nature 412, 72–76.
ulder, C.P.H., Bazeley-White, E., Dimitrakopoulos, P.G., Hector, A., Scherer-Lorenzen, M., Schmid, B., 2004. Species evenness and productivity inexperimental plant communities. Oikos 107, 50–63.
adrowski, K., Wirth, C., Scherer-Lorenzen, M., 2010. Is forest diversity drivingecosystem function and service? Curr. Opin. Environ. Sust. 2, 75–79.
aeem, S., 2002. Ecosystem consequences of biodiversity loss: the evolution of aparadigm. Ecology 83, 1537–1552.
liver, C.D., Larson, B.C., 1996. Forest Stand Dynamics. Wiley, New York.acala, S.W., Kinzig, A., 2002. Introduction to theory and the common ecosystem
model. In: Kinzig, A., Pacala, S., Tilman, D. (Eds.), Functional Consequences of Bio-diversity. Empirical Progress and Theoretical Extensions. Princeton UniversityPress, Princeton, pp. 169–174.
aquette, A., Messier, C., 2011. The effect of biodiversity on tree productivity: fromtemperate to boreal forests. Global Ecol. Biogeogr. 20, 170–180.
odani, J., 1999. Extending Gower’s general coefficient of similarity to ordinal char-acters. Taxon 48, 331–340.
otvin, C., Mancilla, L., Buchmann, N., Monteza, J., Moore, T., Murphy, M., Oelmann,Y., Scherer-Lorenzen, M., Turner, B.L., Wilcke, W., Zeugin, F., Wolf, S., 2011.An ecosystem approach to biodiversity effects: Carbon pools in a tropical treeplantation. Forest Ecol. Manag. 261, 1614–1624.
retzsch, H., 2005. Diversity and productivity in forests: evidence from long-termexperimental plots. In: Scherer-Lorenzen, M., Körner, C., Schulze, E.-D. (Eds.),Forest Diversity and Function. Temperate and Boreal Systems. Springer, Berlin,Heidelberg, pp. 41–64.
cherer-Lorenzen, M., Körner, C., Schulze, E., 2005a. Forest Diversity and Function.Temperate and Boreal Systems. Springer, Berlin, Heidelberg.
cherer-Lorenzen, M., Potvin, C., Koricheva, J., Schmid, B., Hector, A., Bornik, Z.,Reynolds, G., Schulze, E.-D., 2005b. The design of experimental tree planta-tions for functional biodiversity research. In: Scherer-Lorenzen, M., Körner, C.,Schulze, E.-D. (Eds.), Forest Diversity and Function. Temperate and Boreal Sys-tems. Springer, Berlin, Heidelberg, pp. 347–376.
cherer-Lorenzen, M., Schulze, E.-D., Don, A., Schumacher, J., Weller, E., 2007. Explor-ing the functional significance of forest diversity: a new long-term experimentwith temperate tree species (BIOTREE). Perspect. Plant Ecol. Evol. Syst. 9, 53–70.
chmid, B., Hector, A., Huston, M.A., Inchausti, P., Nijs, I., Leadley, P.W., Tilman,D., 2002. The design and analysis of biodiversity experiments. In: Loreau, M.,Naeem, S., Inchausti, P. (Eds.), Biodiversity and Ecosystem Functioning: Synthe-sis and Perspectives. Oxford University Press, Oxford, pp. 61–75.
chulze, E.-D., Körner, C., Law, B.E., Haberl, H., Luyssaert, S., 2012. Large-scalebioenergy from additional harvest of forest biomass is neither sustain-able nor greenhouse gas neutral. GCB Bioenergy, http://dx.doi.org/10.1111/j.1757-1707.2012.01169.x.
olan, M., Godbold, J., Symstad, A., Flynn, D., Bunker, D., 2009. Biodiversity-ecosystem function research and biodiversity futures: early bird catches theworm or a day late and a dollar short? In: Naeem, S., Bunker, D., Hector, A.,Loreau, M., Perrings, C. (Eds.), Biodiversity, Ecosystem Functioning, & HumanWellbeing. Oxford University Press, Oxford, pp. 30–45.
rivastava, D.S., Vellend, M., 2005. Biodiversity-ecosystem function research: is itrelevant to conservation? Ann. Rev. Ecol. Evol. Syst. 36, 267–294.
ilman, D., Lehman, C.L., Thomson, K.T., 1997. Plant diversity and ecosystem produc-tivity: theoretical considerations. Proc. Natl. Acad. Sci. U. S. A. 94, 1857–1861.
urnbull, L.A., Levine, J.M., Loreau, M., Hector, A., 2013. Coexistence, niches andbiodiversity effects on ecosystem functioning. Ecol. Lett. 16, 116–127.
ehviläinen, H., Koricheva, J., 2006. Moose and vole browsing patterns in experi-
mentally assembled pure and mixed forest stands. Ecography 29, 497–506.erheyen, K., Ceunen, K., Ampoorter, E., Baeten, L., Bosman, B., Branquart, E., Carnol,M., De Wandeler, H., Grégoire, J.-C., Lhoir, P., Muys, B., Setiawan, N.N., Vanhelle-mont, M., Ponette, Q., 2013. Assessment of the functional role of tree diversity,the example of the multi-site FORBIO-experiment. Plant Ecol. Evol. 146, 1–10.
y, Evo
V
Z
G
C
C
D
S
O
R
S
L. Baeten et al. / Perspectives in Plant Ecolog
ilà, M., Inchausti, P., Vayreda, J., Barrantes, O., Gracia, C., Ibánez, J.J., Mata, T., 2005.Confounding factors in the observational productivity–diversity relationship inforests. In: Scherer-Lorenzen, M., Körner, C., Schulze, E.-D. (Eds.), Forest Diversityand Function. Temperate and Boreal Systems. Springer, Berlin, Heidelberg, pp.65–86.
hang, Y., Chen, H.Y.H., Reich, P.B., 2012. Forest productivity increases with even-ness, species richness and trait variation: a global meta-analysis. J. Ecol. 100,742–749.
lossary
omplementarity effect: The complementarity effect quantifies the combined effectsof species interactions on mixture performance after accounting for changesin the relative abundance of species (selection effect – see below). Positivevalues result when mixtures do better than expected based on the relative abun-dance of species and their monoculture performances and are consistent with‘niche differentiation’ in terms of resource partitioning, facilitation or diversity-dependent effects of natural enemies (although other explanations are possible– see Turnbull et al., 2013). Negative values are thought to equate to interferencecompetition.
omprehensiveness: The spectrum of ecosystem functions and services quantified ina study (Nadrowski et al., 2010).
ilution gradient: A design with monoculture stands of only one species, combined
with a species diversity gradient including this monoculture species in all mix-tures (Nadrowski et al., 2010). Increasing species diversity is confounded withdecreasing dominance of this species.pecies identity effect: The expected effect of a component species on mixture per-formance as derived from its monoculture performance, i.e., purely additive
lution and Systematics 15 (2013) 281– 291 291
effects as opposed to complementarity effects (Kirwan et al., 2009). A strongidentity effect may cause the sampling/selection effect if this species becomesdominant at the expense of others, although particular species may be associ-ated with positive complementarity too. Identity effects are due to the (binary)presence/absence of particular species across mixtures and are distinct fromspecies composition effects which distinguish the effects between differentspecies combinations (Hector et al., 2011).
rthogonality of species diversity: Orthogonality means the statistical independenceof species diversity from other factors. Only orthogonal designs allow the effectof species diversity to be completely uncorrelated with that of other variablesand covariates (e.g., species identity, environment, management) (Nadrowskiet al., 2010). Unfortunately, it is often not possible to design studies where diver-sity is completely orthogonal from other variables due to unavoidable biologicalcorrelations, which can be seen as either ‘hidden treatments’ (Huston, 1997), orthe mechanisms by which diversity has its effects.
epresentativeness: The degree to which the units of a study represent the largerpopulation, such as randomly drawn forest stands. High representativenessallows for generalization of results and increases the relevance of the results forthe study system as we find it in the real-world landscapes (Nadrowski et al.,2010).
ampling/selection effect: The sampling effect recognizes that more diverse commu-nities are more likely to contain high-performing species, which can generate apositive BDEF relationship if they then dominate the community (Huston, 1997;Tilman et al., 1997). The selection effect is similar, but allows for negative as wellas positive effects. Selection occurs when changes in the relative abundances of
species covary with their monoculture performances (Loreau and Hector, 2001).Dominance of species with high (or low) monoculture performance generatepositive (or negative) BDEF relationships.