
A Novel Approach for Blast-Induced Flyrock Prediction Based on Imperialist Competitive Algorithm and...
11
Research Article A Novel Approach for Blast-Induced Flyrock Prediction Based on Imperialist Competitive Algorithm and Artificial Neural Network Aminaton Marto, 1 Mohsen Hajihassani, 2 Danial Jahed Armaghani, 1 Edy Tonnizam Mohamad, 1 and Ahmad Mahir Makhtar 3 1 Department of Geotechnics and Transportation, Universiti Teknologi Malaysia (UTM), 81310 Skudai, Johor, Malaysia 2 Construction Research Alliance, Universiti Teknologi Malaysia (UTM), 81310 Skudai, Johor, Malaysia 3 Department of Structures and Materials, Universiti Teknologi Malaysia (UTM), 81310 Skudai, Johor, Malaysia Correspondence should be addressed to Mohsen Hajihassani; mohsen [email protected] Received 18 April 2014; Revised 9 June 2014; Accepted 30 June 2014; Published 22 July 2014 Academic Editor: Laszlo Koczy Copyright © 2014 Aminaton Marto et al. is is an open access article distributed under the Creative Commons Attribution License, which permits unrestricted use, distribution, and reproduction in any medium, provided the original work is properly cited. Flyrock is one of the major disturbances induced by blasting which may cause severe damage to nearby structures. is phenomenon has to be precisely predicted and subsequently controlled through the changing in the blast design to minimize potential risk of blasting. e scope of this study is to predict flyrock induced by blasting through a novel approach based on the combination of imperialist competitive algorithm (ICA) and artificial neural network (ANN). For this purpose, the parameters of 113 blasting operations were accurately recorded and flyrock distances were measured for each operation. By applying the sensitivity analysis, maximum charge per delay and powder factor were determined as the most influential parameters on flyrock. In the light of this analysis, two new empirical predictors were developed to predict flyrock distance. For a comparison purpose, a predeveloped backpropagation (BP) ANN was developed and the results were compared with those of the proposed ICA-ANN model and empirical predictors. e results clearly showed the superiority of the proposed ICA-ANN model in comparison with the proposed BP-ANN model and empirical approaches. 1. Introduction Blasting is the process of using explosives to excavate, break down, or remove the rock. It is the most frequently used method for fragmentation of rock mass in smining, quarrying, and civil engineering applications such as dam or road construction. Rock is fragmented into smaller pieces in different mining operations such as quarrying or into large blocks for some civil engineering applications [1]. In quarry blasting, only 20 to 30 percent of the produced energy is utilized to fragment and move the rock mass [2]. e remained energy is wasted to create unwanted environmental impacts, for example, air-overpressure, ground vibration, flyrock, dust, and back-break [3]. Flyrock is defined as the excessive random throw of rock fragments from a blast that can travel distances beyond the blast safety area [4, 5]. is phenomenon of the blasting operation can result in human injuries, fatalities, and structural damage [4, 6]. Various empirical relationships have been established to predict flyrock resulted from blasting [7–10]. Nevertheless, the existing empirical methods only consider limited num- bers of effective parameters on flyrock distance, whereas this phenomenon is also affected by other parameters such as blast geometry and geological conditions [11]. As a result, the empirical methods are not accurate enough in many cases, even though prediction of the exact values of the flyrock distance is crucial to estimate the blast safety area [12]. Apart from that, statistical methods such as multiple regression for flyrock prediction have drawn attention mainly due to their ease of use [13]. However, the implementation of the regression prediction methods is not reliable if new available data are different from the original ones as the form of Hindawi Publishing Corporation e Scientific World Journal Volume 2014, Article ID 643715, 11 pages http://dx.doi.org/10.1155/2014/643715
-
Upload
teknologimalaysia -
Category
Documents
-
view
1 -
download
0
Transcript of A Novel Approach for Blast-Induced Flyrock Prediction Based on Imperialist Competitive Algorithm and...
Research ArticleA Novel Approach for Blast-Induced FlyrockPrediction Based on Imperialist Competitive Algorithmand Artificial Neural Network
Aminaton Marto1 Mohsen Hajihassani2 Danial Jahed Armaghani1
Edy Tonnizam Mohamad1 and Ahmad Mahir Makhtar3
1 Department of Geotechnics and Transportation Universiti Teknologi Malaysia (UTM) 81310 Skudai Johor Malaysia2 Construction Research Alliance Universiti Teknologi Malaysia (UTM) 81310 Skudai Johor Malaysia3 Department of Structures and Materials Universiti Teknologi Malaysia (UTM) 81310 Skudai Johor Malaysia
Correspondence should be addressed to Mohsen Hajihassani mohsen hajihassaniyahoocom
Received 18 April 2014 Revised 9 June 2014 Accepted 30 June 2014 Published 22 July 2014
Academic Editor Laszlo Koczy
Copyright copy 2014 Aminaton Marto et al This is an open access article distributed under the Creative Commons AttributionLicense which permits unrestricted use distribution and reproduction in any medium provided the original work is properlycited
Flyrock is one of themajor disturbances induced by blastingwhichmay cause severe damage to nearby structuresThis phenomenonhas to be precisely predicted and subsequently controlled through the changing in the blast design to minimize potential risk ofblasting The scope of this study is to predict flyrock induced by blasting through a novel approach based on the combinationof imperialist competitive algorithm (ICA) and artificial neural network (ANN) For this purpose the parameters of 113 blastingoperations were accurately recorded and flyrock distances were measured for each operation By applying the sensitivity analysismaximum charge per delay and powder factor were determined as the most influential parameters on flyrock In the light of thisanalysis two new empirical predictors were developed to predict flyrock distance For a comparison purpose a predevelopedbackpropagation (BP) ANN was developed and the results were compared with those of the proposed ICA-ANN model andempirical predictorsThe results clearly showed the superiority of the proposed ICA-ANNmodel in comparison with the proposedBP-ANNmodel and empirical approaches
1 Introduction
Blasting is the process of using explosives to excavatebreak down or remove the rock It is the most frequentlyused method for fragmentation of rock mass in sminingquarrying and civil engineering applications such as dam orroad construction Rock is fragmented into smaller piecesin different mining operations such as quarrying or intolarge blocks for some civil engineering applications [1] Inquarry blasting only 20 to 30 percent of the produced energyis utilized to fragment and move the rock mass [2] Theremained energy is wasted to create unwanted environmentalimpacts for example air-overpressure ground vibrationflyrock dust and back-break [3] Flyrock is defined as theexcessive random throw of rock fragments from a blast thatcan travel distances beyond the blast safety area [4 5] This
phenomenon of the blasting operation can result in humaninjuries fatalities and structural damage [4 6]
Various empirical relationships have been established topredict flyrock resulted from blasting [7ndash10] Neverthelessthe existing empirical methods only consider limited num-bers of effective parameters on flyrock distance whereas thisphenomenon is also affected by other parameters such asblast geometry and geological conditions [11] As a result theempirical methods are not accurate enough in many caseseven though prediction of the exact values of the flyrockdistance is crucial to estimate the blast safety area [12] Apartfrom that statistical methods such as multiple regressionfor flyrock prediction have drawn attention mainly due totheir ease of use [13] However the implementation of theregression prediction methods is not reliable if new availabledata are different from the original ones as the form of
Hindawi Publishing Corporatione Scientific World JournalVolume 2014 Article ID 643715 11 pageshttpdxdoiorg1011552014643715
2 The Scientific World Journal
the obtained equation needs to be updated Meanwhile thefeasibility of artificial intelligence techniques such as artificialneural networks (ANNs) in predicting the flyrock distancehas been reported in many studies [14ndash16]
ANNs are one of the most dynamic areas of researchin advanced and diverse applications of science and engi-neering Although ANNs are able to directly map inputto output patterns and utilize all influential parameters inprediction of flyrock there are still some limitations theslow rate of learning and getting trapped in local minima[17 18] To overcome these shortcomings employing impe-rialist competitive algorithm (ICA) is of advantage ICA is apopulation-based evolutionary algorithm inspired by humanbeingrsquos sociopolitical evolution [19] This algorithm has beensuccessfully utilized in the various optimization engineeringproblems [20ndash24] This paper presents a hybrid ICA-ANNpredictive model for flyrock prediction in Putri Wangsaquarry in Johor Malaysia For the sake of comparison theresults of the developed model are compared to the results ofan empirical equation and multivariate regression analysis
2 Flyrock and Effective Parameters
Flyrock is unwanted rock fragments thrown during benchblasting inmines and civil constructions [5] Flyrockwhich ispropelled rock fragments by energy of explosive beyond theblast zone is one of the undesirable environmental impactsof blasting operations [25] In flyrock mechanism there isan affective relationship among explosive energy distributionrock mass mechanical strength and charge confinementAccording to Bajpayee et al [26] any mismatch betweenthese parameters can produce flyrock When this happensmuch of the explosive energy is used to throw the rock ratherthan produce fragmented rock [6]
There are numerous causes for flyrock occurrence rang-ing from abnormalities in blast pattern or their implemen-tation explosive use and known or unknown rock massconditions [27ndash29] There are several researches that reportthe effects of abovementioned factors on flyrock distanceFletcher and DrsquoAndrea [11] explained that excessive flyrockgets projected beyond the blast safety area and is created dueto much explosive energy for the amount of burden insuf-ficient stemming and venting of explosive energy througha weak plane According to Bhandari [1] and Hemphill [30]inadequate burden and spacing inadequate stemming inac-curate drilling overloaded holes excessive powder factorand unfavorable geological conditions are the main causes offlyrock
Several empirical equations have been established bysome researchers to predict flyrock distance Lundborg et al[7] suggested an empirical equation based on hole and rockdiameters to predict flyrock distance as follows
119871119898
= 260 times 11986323
119879119887= 01 times 119863
23
(1)
in which 119871119898is the maximum rock throw in meters 119863 is
hole diameter in inches and 119879119887is the size of rock fragment
in meters Gupta [10] proposed an empirical equation forprediction of flyrock based on stemming length and burdenas given below
119871 = 1552 times 119889minus137
(2)
where 119871 is the ratio of length of stemming column to burdenand 119889 is the distance travelled by the flying fragments inmeters McKenzie [31] suggested equations to predict themaximum range of flyrock and the particle size (achievingthe maximum range) for blasts of varying rock density holediameter explosive density and state of confinement Hedemonstrated that the flyrock travel range is based on holediameter shape factor and size of rock fragment that achievesmaximum projection distance in terms of rock density andshape factor This study was very significant in defining thedanger zone of blasting
Apart from empirical methods many researchers havebeen working on prediction of flyrock distance using softcomputing techniques Monjezi et al [32] used ANN topredict flyrock that resulted from blasting operations Theyemployed 192 datasets to train and evaluate ANN simulationsand showed the high performance of ANN model to predictflyrock Based on their results it was found that blast abilityindex charge per delay hole diameter stemming length andpowder factor are the most effective parameters on flyrockdistance Rezaei et al [13] applied a fuzzy interface system(FIS) to predict flyrock and compared the FIS results withconventional statistical approaches and indicated that theefficiency of the developed FIS model is much better thanthat of statistical models Ghasemi et al [16] developedtwo predictive models based on ANN and FIS models inpredicting flyrock distance and showed that both modelsare able to predict flyrock distance in which the FIS modelyielded higher performance compared to the ANN modelMonjezi et al [33] used neurogeneticmodel to predict flyrockand back-break and found that the stemming length andpowder factor are the most influential parameters on flyrockIn other study of flyrock prediction Jahed Armaghani et al[12] predicted flyrock distance using hybrid particle swarmoptimization (PSO) and ANN They used PSO to improvethe performance of ANN in predicting flyrock that resultedfrom blasting operations in granite quarry sites Finally theirresults indicated the applicability of the proposed model topredict flyrock distance
3 Case Study
The data used in this study was collected from the PutriWangsa quarry in Johor Malaysia The quarry lies geograph-ically in latitude 1∘3510158403210158401015840N and longitude 103∘481015840410158401015840E and islocated at north of Johor This quarry produces aggregatesfor various construction applications with capacity of 40000ndash50000 tonnes per month 10 to 12 blasting operations wereconducted monthly in the quarry depending on the weathercondition A complete range of mass weathering gradesfrom fresh to completely weathered rock was observed [34]Blasting parameters such as burden spacing stemminglength hole depth and number of holes were recorded for
The Scientific World Journal 3
each blasting Besides for each blasting rock density andSchmidt hammer rebound value were measured as strengthparameters of rock mass Diameter of blast-holes used in thisquarry was 115mm Ammonium nitrate and fuel oil (ANFO)and dynamite were used as the main explosive materialand initiation respectively The blast-holes were stemmedusing fine gravels To measure the flyrock distance in thePutri Wangsa the bench surface was colored and two videocameras were placed to record the flyrock projection Aftereach blasting the relevant videos were reviewed to find thelocations of the traveled rocks
4 Model Development for Flyrock Prediction
41 Artificial Neural Network An artificial neural network isamathematicalmodel whichworks on the basis of simulatingthe cortical configuration of the human brain In other wordsan ANN is a flexible nonlinear function approximationthat comprehends a relationship between desired input andoutput data ANNs require training to learn and consequentlymap a relationship from the dataThe ability of ANNs to learnfrom samples and to improve their performance throughlearning is the property that makes them different from othernetworks This ability comes from training algorithm Thedetails of different ANNmethods and training algorithm canbe found in Simpson [35] and Galushkin [36]
An interconnected group of artificial neurons forms theANN structure An artificial neuron is a simple processorwhich is connected to other neurons The artificial neuronsget the data and implement simple processing on the receiveddata Subsequently the artificial neurons pass the processedinformation to other neurons through an activation functionthat usually is a nonlinear function By this process acomputational model is created for the information pro-cessing According to Fausett [37] artificial neurons havebeen developed as generalizations of mathematical modelsof biological neurons on the foundation of the followingassumptions
(i) neurons which are simple elements conduct dataprocessing
(ii) connection links transfer the data between neurons(iii) a weight is assigned to each connection link which is
multiplied in transmitted signal(iv) an activation function is used by each neuron to
determine its output signal
McCulloch and Pitts [38] introduced the earliest neuroncalled ldquoThreshold Logic Unitrdquo which was a linear functionNevertheless the first ANN was developed by Rosenblatt[39] called the ldquoperceptronrdquo based on thework ofMcCullochand Pitts [38] A set of parallel interconnected processingunits named nodes or neurons forms the basis of an ANNAt the final step of data processing the network outputis verified with the actual values and error correction isperformed In feed-forward ANNs the neurons are usuallyclassified into several layers Using the connections a signalmoves throughout the input to the output layers Multilayer
perceptron (MLP) is the most well-known type of feed-forward ANN [32 33]
42 Imperialist Competitive Algorithm Imperialist compet-itive algorithm (ICA) is a computational method which isutilized to solve different types of optimization problems[19] ICA as a new sociopolitically motivated global searchalgorithm indicated great performance in the convergencerate [19 40ndash42] Similar to most of the methods in the area ofevolutionary computation ICA does not require the gradientof the function in its optimization process
Figure 1 shows the flowchart of the ICA According tothis figure the optimization process starts with producing thepopulation In this algorithm each particle of the populationis called a ldquocountryrdquo The countries are divided into twosections the best countries (countries with the minimumcost) are considered the ldquoimperialistsrdquo and the rest of thecountries form the ldquocoloniesrdquo All colonies are distributedamong the existing imperialists on the basis of their powerThe combination of each imperialist togetherwith its coloniesforms an empire Following the establishment of initialempires the colonies move toward their relevant imperialistsand simulate the assimilation policy of imperialist states Thefollowing steps describe the ICA optimization procedure
421 Establishment of Initial Empires The ICA optimizationprocedure starts with initializing the individuals which arecalled countries In a multivariate optimization problem acountry consists of 1 times 119873var array This array is defined asfollows
Country = [1198751 1198752 1198753 119875
119873variable] (3)
in which 119875119894s are the parameters which need to be optimized
In a country each parameter can be considered as a sociopo-litical characteristic such as culture and language in whichICA makes an attempt to find the best combination of thesecharacteristicsThe cost function of each country119891(Country)is determined as follows
119891 (Country) = [1198751 1198752 1198753 119875
119873variable] (4)
The procedure of ICA optimization starts with initializingof countries of size 119873country and selecting the most pow-erful countries as the imperialists (119873imperialist) The remain-ing countries are considered as the colonies (119873colony) Thecolonies are divided among imperialists based on their powerto generate the initial empiresTherefore the normalized costof an imperialist is defined as follows
119862119899= 119888119899minusmax119894
119888119894 (5)
in which 119888119899is the cost of the 119899th imperialist and 119862
119899is its
normalized cost The normalized power of each imperialistis defined as follows
119901119899=
10038161003816100381610038161003816100381610038161003816100381610038161003816
119862119899
sum119873imp119894=1
119862119894
10038161003816100381610038161003816100381610038161003816100381610038161003816
(6)
4 The Scientific World Journal
There is a colony in an empire with lower cost than its imperialist
Revolve some colonies
Assimilate colonies
Exchange the positions of that imperialist and the colony
Initialize the empires
Calculate the total cost of empires
Imperialistic competition
There is an empire with no colonies
Eliminate this empire
Start
Unite similar empires
Termination criteria satisfied
End
No
No
No
Figure 1 Flowchart of the ICA
The number of initial colonies for each empire is obtained by
NC119899= round 119901
119899sdot 119873col (7)
in which NCn is the initial number of colonies of the 119899thempire and119873col is the total number of initial colonies
To distribute the colonies among imperialists NCn ofthe colonies is accidentally selected and yielded to the 119899thimperialist and therefore generates the 119899th empire
422 Assimilation Revolution and Uniting In this stepassimilation and revolution are conducted Assimilation isthe movement of colonies toward the imperialists whereimperialists try to absorb their colonies and make them apart of themselves This process is simulated by moving allcolonies toward the imperialist along different optimizationaxis Figure 2(a) illustrates the movement of a colony towardits relevant imperialist by 119909 units The parameter 119909 isdetermined as follows
119909 sim 119880 (0 120573 times 119889) (8)
where119889 is the distance between the colony and the imperialistand 120573 is a number greater than 1 In assimilation processthe movement direction is not essentially a vector from thecolony to the imperialist Hence to increase the searchingability around the imperialist a random amount of devia-tion (120579) is added to the movement direction as shown inFigure 2(b) 120579 is a parameter with uniform distribution andis obtained as follows
120579 sim 119880 (minus120574 120574) (9)
in which 120574 is a parameter that adjusts the deviation from theoriginal direction
Following the assimilation revolution happens Revo-lution is defined as changes in the power and structurethat happen quickly In ICA optimization process revolutionmakes a sudden change in the sociopolitical characteristicsof a country This action increases the exploration of thealgorithm and impedes the quick convergence of countries tolocal minima Figure 3 illustrates the revolution in sociopo-litical characteristics of a country Throughout the movingof colonies toward the imperialist a colony may obtain aposition with lower cost compared to its imperialist In thiscase the positions of the colony and the imperialist are alteredand ICA procedure will be continued by the new imperialistin the new position
Uniting similar empires happens when the distancebetween two imperialists becomes lesser than thresholddistance On this occasion these imperialists are united anda new empire is formed The total power of an empire isobtained as follows
TC119899= Cost (imperialist
119899)
+ 120585mean cost (colonies of empire119899)
(10)
in which TCn is the total cost of the 119899th empire and 120585 is apositive small number The value of 01 for 120585 has shown goodresults in most of the implementations [19]
423 Imperialistic Competition In ICA optimization proce-dure all empires make an attempt to possess the coloniesof other empires In ICA terminology this action is calledldquoimperialistic competitionrdquo which is the final optimizationstep In this regard the power of the weaker empires isdecreased and the power of more powerful empire is grad-ually increased The imperialistic competition is shown inFigure 4
The Scientific World Journal 5
Language
Culture
Colony
New position of colony
Imperialist
x
d
(a)
New position of colony
Language
Culture
Colony
Imperialist
x
d120579
(b)
Figure 2 Movement of colonies (a) toward their relevant imperialist and (b) in a randomly deviated direction [19]
New position of colony
Language
Culture
Colony
Figure 3 Sudden changes in sociopolitical characteristics of acountry [19]
To start the imperialistic competition the weakest colonyof the weakest empire is selected and subsequently the pos-session probability of each empire is found The possessionprobability of an empire (119875
119875) is related to the total power of
the empireThenormalized total cost of an empire is obtainedas follows
NTC119899= TC
119899minusmax TC
119894 (11)
in which TCn and NTC119899are the total cost and the normal-
ized total cost of the 119899th empire respectively The possessionprobability of each empire is obtained as follows
119875119875119899
=
1003816100381610038161003816100381610038161003816100381610038161003816
NTC119899
sum119873
119894=1NTC
119894
1003816100381610038161003816100381610038161003816100381610038161003816
(12)
in which 119875119875119899
is the possession probability Vector 119875 is createdto distribute the colonies among empires as follows
119875 = [1198751198751
1198751198752
1198751198753
119875119875119873
] (13)
Subsequently vector 119877 with uniform distributed randomelements is created as follows
119877 = [1199031 1199032 1199033 119903
119873] 1199031 1199032 1199033 119903
119873sim 119880 (0 1) (14)
in which119877 is a chromatic vector with the same size as119875Thenvector 119863 is created by subtracting vector 119877 from vector 119875 asfollows
119863 = 119875 minus 119877 = [1198751198751
minus 1199031 1198751198752
minus 1199032 1198751198753
minus 1199033 119875
119875119873
minus 119903119873]
(15)
Referring to vector 119863 the colonies are handed to an empirewhose relevant index in 119863 is maximized Continuing theaforementioned steps may lead to finding the global mini-mum
43 Model Development Various optimization algorithmshave been utilized for training ANNs to achieve a set ofweights and biases that minimize the error functions HereICA was used to determine the optimum weights and biasesof a feed-forward MLP ANN in order to obtain the bestcorrelation in flyrock prediction Therefore a three-layeredANN that consisted of an input layer a hidden layer and oneoutput layer was employed The most influential parameterson flyrock were utilized as input parameters and flyrockdistance was set as the output parameter The input andoutput parameters used in the modelling are tabulated inTable 1
Determining the optimal weights and biases of ANN canbe formulated as a global search problem in ICA In thisregard a Matlab code was prepared to train ANN usingICA and the weights and biases of ANN were consideredas the variables of optimization problem A criterion isrequired to evaluate the modelling performance Thereforeroot mean square error (RMSE) was proposed as the costfunction of ICA optimization algorithm whereas the aim ofmodelling is to minimize the cost function In ICA optimiza-tion procedure the problemrsquos solution can be obtained bychoosing adequate amount of the number of countries andimperialists Therefore 20 models with different number ofcountries and imperialists were employed to determine theoptimum number of countries and imperialists The resultsof modelling are tabulated in Table 2 According to this tablewith 56 countries and 9 imperialists the best results wereobtained among all models and therefore this model wasselected to be used in flyrock prediction Figure 5 illustratesthe minimum and mean costs of all imperialists in theselected model
To obtain the best results of ANN trained by ICA it isessential to find the optimum network architecture which isthe placement of various components of a network ICA canonly adjust the weights and biases of anANN tominimize thelearning error and cannot determine the optimum networkarchitecture According to Hornik et al [43] a network
6 The Scientific World Journal
Weakest colony in weakest empire
Empire 1
Empire 2
Empire 3
Empire N
The weakest empire
P2
P3
PN
Imperialist 1
Imperialist 2
Imperialist 3
Imperialist N
Figure 4 Imperialistic competition [19]
Table 1 Input and output parameters used in the predictive model
Parameter Category Unit Symbol Minimum Maximum AverageHole depth Input (m) A 75 22 15434Burden to spacing Input mdash B 0410 0913 0763Stemming length Input (m) C 15 35 2632Maximum charge per delay Input (Kg) D 748 2343 1596Powder factor Input (Kgm3) E 031 096 07Rock density Input (gcm3) F 215 286 2574Schmidt hammer rebound number Input mdash G 15 44 32611Flyrock distance Output (m) H 437 2055 13575
Table 2 Mean and minimum cost of imperialists for different models
Modelnumber Countryimperialist Number of
countriesNumber ofimperialists
Mean cost ofimperialists
Minimumcost of
imperialists
Coefficient ofdetermination
Root meansquare error
1 27 8 3 0073 0073 0880 02412 40 16 4 0074 0074 0882 02403 48 24 5 0078 0078 0856 02504 53 32 6 0092 0092 0842 02555 57 40 7 0075 0073 0878 02416 60 48 8 0079 0070 0896 02357 62 56 9 0063 0063 0924 02248 64 64 10 0080 0073 0878 02419 65 72 11 0075 0069 0899 023310 67 80 12 0077 0071 0892 023611 68 88 13 0079 0074 0876 024212 69 96 14 0083 0063 0922 022413 69 104 15 0083 0064 0920 022514 70 112 16 0077 0070 0894 023515 71 120 17 0082 0072 0886 023816 71 128 18 0077 0065 0913 022817 72 136 19 0078 0063 0931 022518 72 144 20 0078 0068 0899 023419 72 152 21 0079 0067 0902 023220 73 160 22 0075 0067 0906 0231
The Scientific World Journal 7
0
005
01
015
02
025
03
0 100 200 300 400 500 600 700 800 900 1000
Cos
t
Iteration
Mean cost of imperialistsMinimum cost of imperialists
Figure 5 Mean and minimum cost of all imperialists in variousiterations for the selected model
with one hidden layer can approximate any continuousfunction Consequently several networks with one hiddenlayer with different number of nodes were trained and testedto determine the optimum network architecture Coefficientof determination (1198772) and RMSE (16) were considered thecriteria to evaluate the accuracy of each model Consider
1198772
= 1 minus
sum119873
119894=1(119910 minus 119910
1015840
)2
sum119873
119894=1(119910 minus 119910)
2
RMSR = radic1
119873
119873
sum
119894=1
(119910 minus 1199101015840)2
(16)
where 119910 and 1199101015840 are the measured and predicted values
respectively 119910 represents the mean of 119910 values and 119873 is thetotal number of data
In the modelling process 80 of data were used fortraining and the rest for testing The results of analyses fortraining and testing datasets for various models are shown inFigures 6 and 7 respectively As in these figures the modelwith seven nodes in the hidden layer shows the best resultsamong all models and therefore was selected to be used inpredicting flyrock distance
5 Multivariate Regression
Multivariate regression analysis (MRA) can be used to obtainthe best-fit equation when there is more than one inputparameter The MRA equation takes the form of 119910 = 119887
11199091+
11988721199092+ 119887119899119909119899
+ 119888 where 1198871 1198872 119887
119899 are the regression
coefficients The parameter 119888 is a constant value of 119910 param-eter when all the input variables are zero Ceryan et al[44] mentioned that as long as independent parameters haveacceptable correlation or determinationwith output they canbe selected as inputs in predictive models
In order to propose a new equation to predict flyrockdistance a MRA model was applied using the same inputsin ICA-ANN model (see Table 1) The statistical softwarepackage SPSS (180) was used for analysis The obtained
07
075
08
085
09
095
1
5 6 7 8 9 10 11 12 13 14 15 16 17 18 19 20Number of nodes in hidden layer
TrainTest
R2
Figure 6 1198772 of various models for training and testing datasets
014
018
022
026
03
034
038
5 6 7 8 9 10 11 12 13 14 15 16 17 18 19 20
RMSE
Number of nodes in hidden layer
TrainTest
Figure 7 RMSE of various models for training and testing datasets
Table 3 Statistical information for developed predictive model
Independentvariable Coefficients St error 119905-value 119875 value
Constant 9665 53718 0179 0857A minus11872 8993 minus1320 0189B minus10296 20550 minus0501 0617C 0 0 65535 mdashD 136127 14095 9657 mdashE minus14218 27777 minus0511 0609F 0282 0747 0377 0706G 1562 0812 1922 0057
equation using MVR analysis is shown in (17) More detailson the statistical information of the proposed equation forflyrock prediction can be found in Table 3 Consider
Flyrock = minus11873A minus 10296B + 136128D
minus 14218E + 0282F + 1562G + 9665
(17)
8 The Scientific World Journal
A B C D E F G0971 0929 0961 0972 0976 0944 0927
085
0875
09
0925
095
0975
1
Input parameters
r ij
Figure 8 Strengths of relation between inputs and flyrock distance
Table 4 Proposed equations and their performance
Model input Equation Model performance1198772 RMSE
Powder factor Flyrock = 19111 lowast 1198641059 0565 31935
Maximumcharge per delay Flyrock = 0883 lowast 119863
0986 0544 34095
6 Empirical Model Development
A sensitivity analysis was performed to establish empiricalequation for flyrock prediction For this purpose the cosineamplitude method was used To perform this technique alldata pairs were utilized to build a data array119883 as follows
119883 = 1199091 1199092 1199093 119909
119894 119909
119899 (18)
The variable 119909119894in the array119883 is a length vector of m as
119909119894= 1199091198941 1199091198942 1199091198943 119909
119894119898 (19)
The following equation presents the strength of the relation(119903119894119895) between the datasets119883
119894and119883
119895
119903119894119895=
sum119898
119896=1119909119894119896119909119895119896
radicsum119898
119896=11199092
119894119896sum119898
119896=11199092
119895119896
(20)
Figure 8 shows the strengths of the relations (119903119894119895values)
between flyrock distance and input parameters As shown inthis figure powder factor and maximum charge per delay arethe most influential parameters on flyrock
By using these parameters two power empirical equa-tions were developed 1198772 of these equations based on powderfactor and maximum charge per delay are shown in Figures9 and 10 respectively It should be mentioned that otherequation models such as linear exponential and logarithmicwere also examined and power equations which showed thehigher performance (in terms of 1198772 and RMSE) comparedto other models were selected Table 4 shows the proposedequations and their performance for flyrock prediction
Table 5 Performance indices of the predictive models
Predictive model Performance indices1198772 RMSE
ICA-ANN 0981 6582BP-ANN 0919 13478MRA 0743 23877Empirical 0118 109064
0
50
100
150
200
250
02 03 04 05 06 07 08 09 1
Mea
sure
d fly
rock
(m)
Predicted flyrock (m)
R2 = 0565
Figure 9 1198772 of proposed flyrock equation based on powder factor
7 Results and Discussion
In this study ICA-ANN and MRA models were developedto predict flyrock distance These models were constructedusing seven inputs (hole depth stemming burden to spacingmaximum charge per delay powder factor rock densityand Schmidt hammer rebound number) and one outputThe graphs of predicted flyrock using ICA-ANN and MRAtechniques against the measured flyrock are displayed inFigures 11 and 12 respectively
It is desirable to increase the accuracy and applicabilityof ANN for the prediction of flyrock induced by blastingby means of changing the learning process A predevelopedbackpropagation (BP) ANN was utilized to predict flyrock inorder tomake a comparisonwith the ICA-ANNperformanceSimilar to the ICA-ANN models several BP-ANN modelswith different architectures were constructed by using thesame input parameters The datasets were divided into twosubsets that is 80 of the datasets were set for trainingpurpose and 20 used for testing the network performanceFinally a BP-ANN model with one hidden layer and 8neurons in the hidden layer was selected as the best ANNmodel It should be noted that in the suggested ANN modelthemomentum coefficient and learning rate were set to be 09and 005 respectively The graph of predicted flyrock usingthe proposed BP-ANN model against the measured flyrockis shown in Figure 13 In addition to check the accuracy ofthe predeveloped empirical equations (2) was selected forprediction of flyrock using the data of Putri Wangsa quarryFigure 14 shows the predicted flyrock values using (2) versusthe measured one
For the sake of comparison the performance indices ofthe predictive models are tabulated in Table 5 The obtainedresults by ICA-ANN BP-ANN and MRA models as well
The Scientific World Journal 9
0
50
100
150
200
250
50 70 90 110 130 150 170 190 210 230 250
Mea
sure
d fly
rock
(m)
Predicted flyrock (m)
R2 = 0544
Figure 10 1198772 of proposed flyrock equation based on maximumcharge per delay
0
50
100
150
200
250
0 50 100 150 200 250
Mea
sure
d fly
rock
(m)
Predicted flyrock (m)
R2 = 0981
Figure 11 1198772 of ICA-ANNmodel in predicting flyrock distance
0
50
100
150
200
250
0 50 100 150 200 250
Mea
sure
d fly
rock
(m)
Predicted flyrock (m)
R2 = 0743
Figure 12 1198772 of MRA model in predicting flyrock distance
0
50
100
150
200
250
0 50 100 150 200 250
Mea
sure
d fly
rock
(m)
Predicted flyrock (m)
R2 = 0919
Figure 13 1198772 of BP-ANNmodel in predicting flyrock distance
0
10
20
30
40
50
60
70
0 50 100 150 200 250
Mea
sure
d fly
rock
(m)
Predicted flyrock (m)
R2 = 0118
Figure 14 1198772 of (2) in predicting flyrock distance
as empirical equations reveal that the proposed ICA-ANNmodel produced higher performance in predicting flyrockdistance among all methods
8 Conclusion
A novel approach based on the combination of ICA andANN was developed to predict flyrock induced by blastingIn this regard 113 blasting operations in Putri Wangsa quarrysite in Malaysia were precisely recorded and collected datawere utilized to train the ICA-ANN model The most influ-ential parameters on flyrock including hole depth burden tospacing ratio stemming length maximum charge per delaypowder factor rock density and Schmidt hammer reboundnumber were considered as input parameters whereas theflyrock distances were assigned as the output parameterSeveral models were examined using the collected data todetermine the optimum ICA-ANN model and finally anoptimum model was proposed to be used in flyrock predic-tion The results demonstrated that the proposed ICA-ANNmodel is able to predict flyrock distance with high degreeof accuracy For a comparison purpose a predeveloped BP-ANN model was developed and the results were comparedwith the obtained results of proposed ICA-ANN model Bymeans of sensitivity analysis powder factor and maximumcharge per delay were determined as the most influentialparameters on flyrock By utilizing these parameters as wellas MRA two empirical predictors were developed to predictflyrock distance These predictors provide very quick andsimple prediction whereas the proposed ICA-ANN modelexhibited higher prediction performance compared to othermethods
Conflict of Interests
The authors declare that there is no conflict of interestsregarding the publication of this paper
Acknowledgments
The authors would like to extend their appreciation to theMinistry of Science Technology and Innovation Malaysiathrough the provision of research Grant no 03-01-06-SF1185
10 The Scientific World Journal
(UTM 4S072) to undertake the research Acknowledgmentis also conveyed to the Universiti Teknologi Malaysia forproviding the required facilities which made this researchpossible
References
[1] S Bhandari Engineering Rock Blasting Operations Taylor ampFrancis Boca Raton Fla USA 1997
[2] T N Singh and V Singh ldquoAn intelligent approach to predictionand control ground vibration in minesrdquo Geotechnical andGeological Engineering vol 23 no 3 pp 249ndash262 2005
[3] U Ozer A Karadogan A Kahriman and M Aksoy ldquoBenchblasting design based on site-specific attenuation formula in aquarryrdquoArabian Journal of Geosciences vol 6 no 3 pp 711ndash7212013
[4] K Manoj and M Monjezi ldquoPrediction of flyrock in open pitblasting operation using machine learning methodrdquo Interna-tional Journal of Mining Science and Technology vol 23 no 3pp 313ndash316 2013
[5] A K Raina V M S R Murthy and A K Soni ldquoFlyrock inbench blasting a comprehensive reviewrdquo Bulletin of EngineeringGeology and Environment 2014
[6] P P Roy Rock Blasting Effects and Operations Taylor amp FrancisBoca Raton Fla USA 2005
[7] N Lundborg N Persson A Ladegaard-Pedersen and RHolmberg ldquoKeeping the lid on flyrock in open pit blastingrdquoEngineering andMining Journal vol 176 no 5 pp 95ndash100 1975
[8] J A Roth ldquoA model for the determination of flyrock range asa function of shot conditionrdquo NTIS Report PB81222358 USDepartment of Commerce 1979
[9] R F Chiapetta A Bauer P J Dailey and S L Burchell ldquoThe useof high-speed motion picture photography in blast evaluationand designrdquo in Proceedings of the 9th Conference on Explosivesand Blasting Techniques pp 31ndash40 Dallas Tex USA 1983
[10] R N Gupta ldquoSurface blasting and its impact on environmentrdquoin Impact of Mining on Environment N J Trivedy and B PSingh Eds pp 23ndash24 Ashish Publishing House New DelhiIndia 1990
[11] L R Fletcher and D V DrsquoAndrea ldquoReducing accident throughimproved blasting safetyrdquo in Proceedings of the Bureau of MinesTechnology Transfer Sem vol USBM IC 9135 pp 6ndash18 ChicagoIll USA 1987
[12] D Jahed Armaghani M Hajihassani E Tonnizam MohamadA Marto and S A Noorani ldquoBlasting-induced flyrock andground vibration prediction through an expert artificial neuralnetwork based on particle swarm optimizationrdquo Arabian Jour-nal of Geosciences 2013
[13] M Rezaei M Monjezi and A Yazdian Varjani ldquoDevelopmentof a fuzzy model to predict flyrock in surface miningrdquo SafetyScience vol 49 no 2 pp 298ndash305 2011
[14] MMonjezi A Bahrami andA YazdianVarjani ldquoSimultaneousprediction of fragmentation and flyrock in blasting operationusing artificial neural networksrdquo International Journal of RockMechanics andMining Sciences vol 47 no 3 pp 476ndash480 2010
[15] E T Mohamad D J Armaghani M Hajihassani K Faiziand A Marto ldquoA simulation approach to predict blasting-induced flyrock and size of thrown rocksrdquo Electronic Journal ofGeotechnical Engineering vol 18 pp 365ndash374 2013
[16] E Ghasemi H Amini M Ataei and R Khalokakaei ldquoAppli-cation of artificial intelligence techniques for predicting the
flyrock distance caused by blasting operationrdquo Arabian Journalof Geosciences vol 7 no 1 pp 193ndash202 2012
[17] R C Eberhart P K Simpson and R W Dobbins Computa-tional Intelligence PC Tools Academic Press Professional 1996
[18] M Hajihassani D Jahed Armaghani H Sohaei E TonnizamMohamad and A Marto ldquoPrediction of airblast-overpressureinduced by blasting using a hybrid artificial neural network andparticle swarm optimizationrdquoApplied Acoustics vol 80 pp 57ndash67 2014
[19] E Atashpaz-Gargari and C Lucas ldquoImperialist competitivealgorithm an algorithm for optimization inspired by impe-rialistic competitionrdquo in Proceedings of the IEEE Congress onEvolutionary Computation (CEC rsquo07) pp 4661ndash4667 SingaporeSeptember 2007
[20] A Kaveh and S Talatahari ldquoOptimum design of skeletalstructures using imperialist competitive algorithmrdquo Computersand Structures vol 88 no 21-22 pp 1220ndash1229 2010
[21] E Shokrollahpour M Zandieh and B Dorri ldquoA novel impe-rialist competitive algorithm for bi-criteria scheduling of theassembly flowshop problemrdquo International Journal of Produc-tion Research vol 49 no 11 pp 3087ndash3103 2011
[22] S Talatahari B F Azar R Sheikholeslami and A H GandomildquoImperialist competitive algorithm combined with chaos forglobal optimizationrdquo Communications in Nonlinear Science andNumerical Simulation vol 17 no 3 pp 1312ndash1319 2012
[23] H Taghavifar A Mardani and L Taghavifar ldquoA hybridizedartificial neural network and imperialist competitive algorithmoptimization approach for prediction of soil compaction in soilbin facilityrdquoMeasurement vol 46 no 8 pp 2288ndash2299 2013
[24] M A Ahmadi M Ebadi A Shokrollahi and S M J MajidildquoEvolving artificial neural network and imperialist competitivealgorithm for prediction oil flow rate of the reservoirrdquo AppliedSoft Computing Journal vol 13 no 2 pp 1085ndash1098 2013
[25] S Stojadinovic R Pantovic and M Zikic ldquoPrediction offlyrock trajectories for forensic applications using ballistic flightequationsrdquo International Journal of Rock Mechanics and MiningSciences vol 48 no 7 pp 1086ndash1094 2011
[26] T S Bajpayee T R Rehak G L Mowrey and D K IngramldquoBlasting injuries in surface mining with emphasis on flyrockand blast area securityrdquo Journal of Safety Research vol 35 no 1pp 47ndash57 2004
[27] R Kuberan and K K Prasad ldquoEnvironmental effects of blastingand their controlrdquo in Proceedings of the Workshop on BlastingTechnology for Civil Engineering Projects vol 2 pp 145ndash159ISRMTT Delhi India November 1992
[28] S K Mandal ldquoCauses of flyrock damages and its remedialmeasuresrdquo in Course on Recent Advances in Blasting Techniquesin Mining and Construction Projects pp 130ndash136 HRD-CMRIDhanbad India 1997
[29] G R Adhikari ldquoStudies on flyrock at limestone quarriesrdquo RockMechanics andRock Engineering vol 32 no 4 pp 291ndash301 1999
[30] G B Hemphill Blasting Operations McGraw-Hill New YorkNY USA 1981
[31] C K McKenzie ldquoFlyrock range and fragment size predictionrdquoin Proceedings of the 35th Annual Conference on Explosives andBlasting Technique vol 2 International Society of ExplosivesEngineers 2009
[32] M Monjezi A Bahrami A Y Varjani and A R SayadildquoPrediction and controlling of flyrock in blasting operationusing artificial neural networkrdquo Arabian Journal of Geosciencesvol 4 no 3-4 pp 421ndash425 2011
The Scientific World Journal 11
[33] MMonjezi H Amini Khoshalan andA YazdianVarjani ldquoPre-diction of flyrock and backbreak in open pit blasting operationa neuro-genetic approachrdquo Arabian Journal of Geosciences vol5 no 3 pp 441ndash448 2012
[34] S V Alavi Nezhad Khalil Abad E Tonnizam Mohamad EKomoo R Kalatehjari and R Kalatehjari ldquoA typical weatheringprofile of granitic rock in Johor Malaysia based on jointcharacterizationrdquo Arabian Journal of Geosciences 2014
[35] P K Simpson Artificial Neural System-Foundation ParadigmApplication and Implementations Pergamon Press New YorkNY USA 1990
[36] A I Galushkin Neural Networks Theory Springer BerlinGermany 2007
[37] L Fausett Fundamentals of Neural Networks ArchitecturesAlgorithms and Applications Prentice-Hall 1994
[38] W S McCulloch and W Pitts ldquoA logical calculus of the ideasimmanent in nervous activityrdquo The Bulletin of MathematicalBiophysics vol 5 no 4 pp 115ndash133 1943
[39] F Rosenblatt ldquoThe perceptron a probabilistic model for infor-mation storage and organization in the brainrdquo PsychologicalReview vol 65 no 6 pp 386ndash408 1958
[40] E Rajabioun E Atashpaz-Gargari and C Lucas ldquoColonialcompetitive algorithm as a tool for nash equilibrium pointachievementrdquo in Computational Science and Its ApplicationsmdashICCSA 2008 vol 5073 of Lecture Notes in Computer Science pp680ndash695 Springer Berlin Germany 2008
[41] H Sepehri Rad and C Lucas ldquoApplication of imperialistic com-petition algorithm in recommender systemsrdquo in Proceedings ofthe 13th International CSI Computer Conference Kish IslandIran 2008
[42] E Atashpaz Gargari F Hashemzadeh R Rajabioun and CLucas ldquoColonial competitive algorithm a novel approach forPID controller design in MIMO distillation column processrdquoInternational Journal of Intelligent Computing and Cyberneticsvol 1 no 3 pp 337ndash355 2008
[43] K Hornik M Stinchcombe and HWhite ldquoMultilayer feedfor-ward networks are universal approximatorsrdquo Neural Networksvol 2 no 5 pp 359ndash366 1989
[44] N Ceryan U Okkan and A Kesimal ldquoPrediction of uncon-fined compressive strength of carbonate rocks using artificialneural networksrdquo Environmental Earth Sciences vol 68 no 3pp 807ndash819 2013
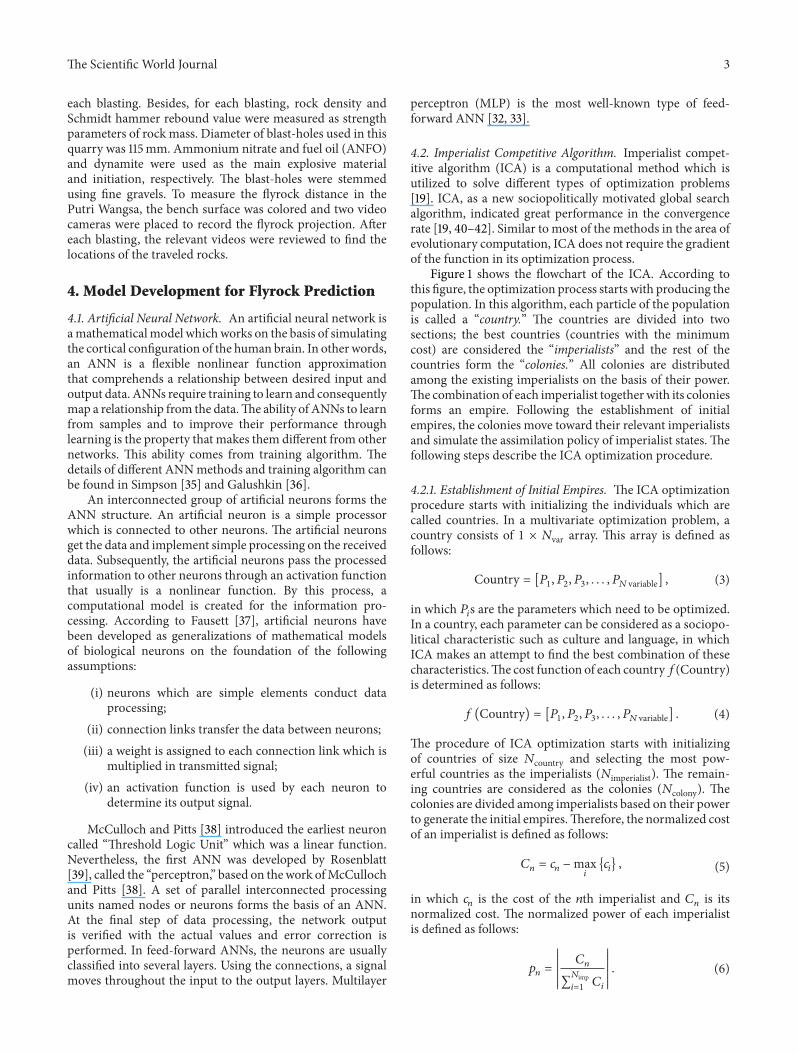
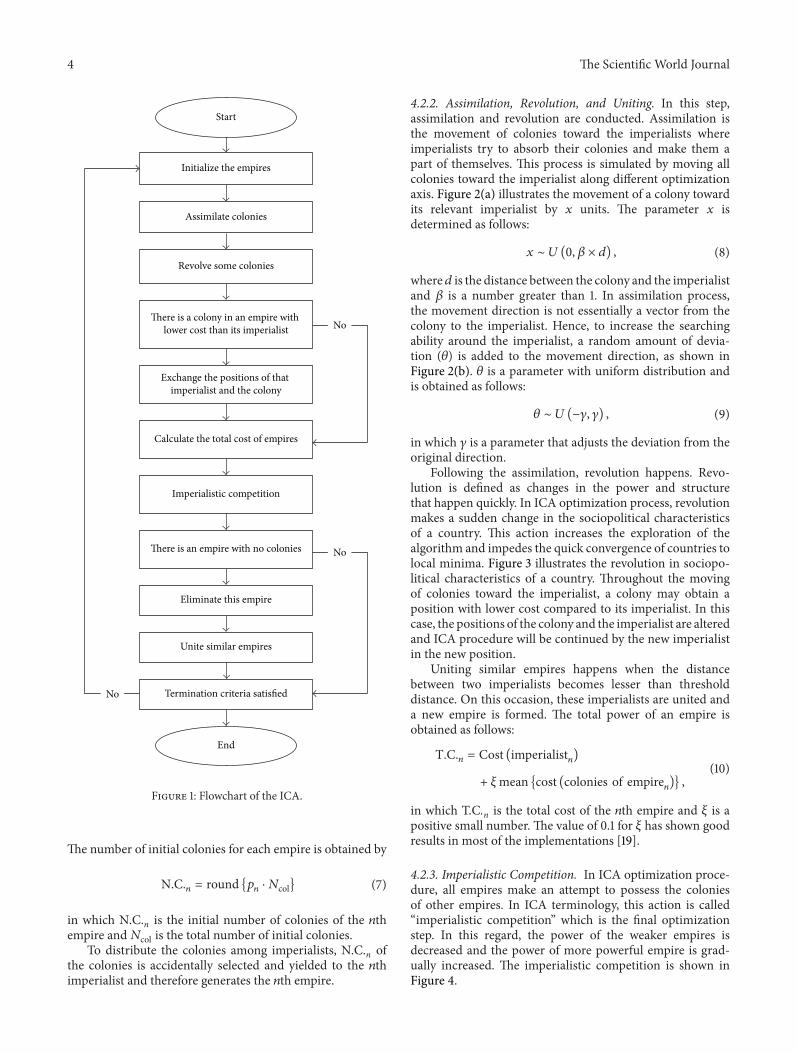
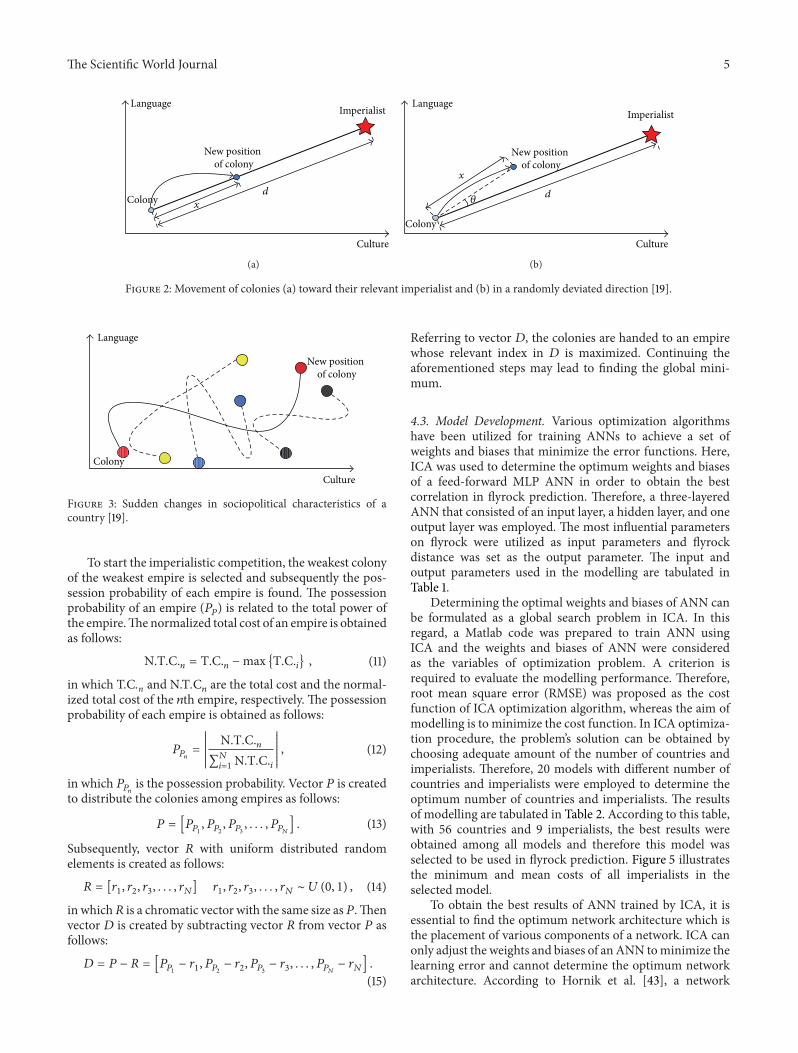
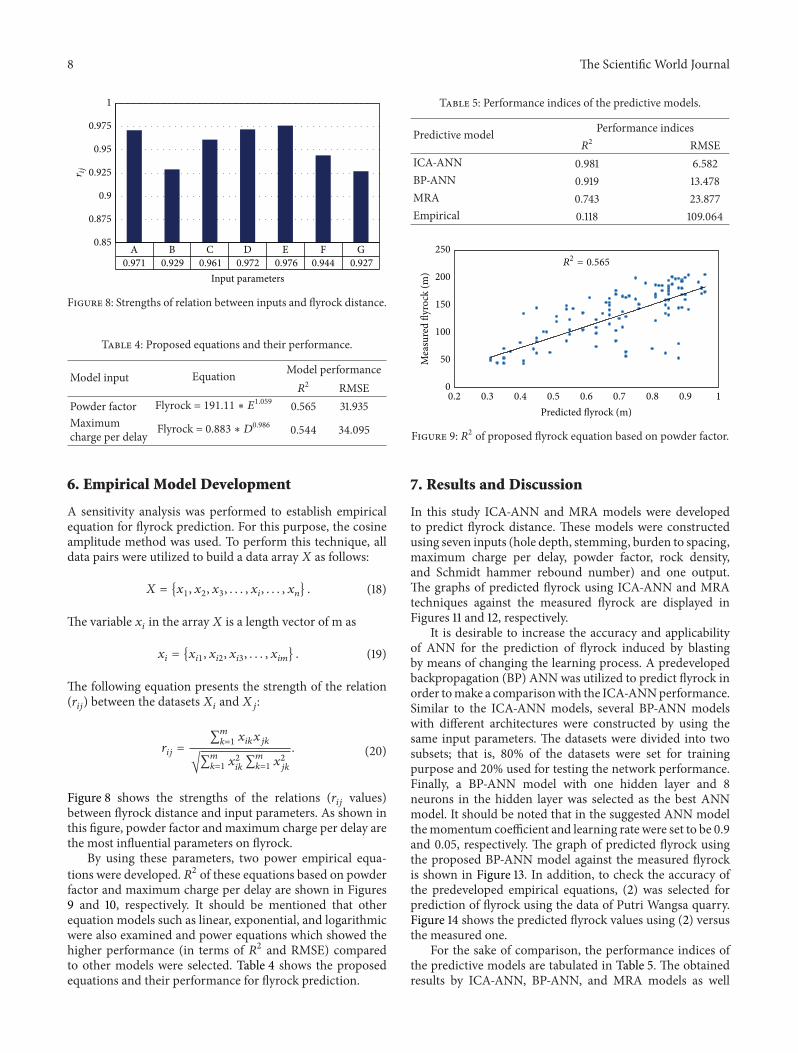
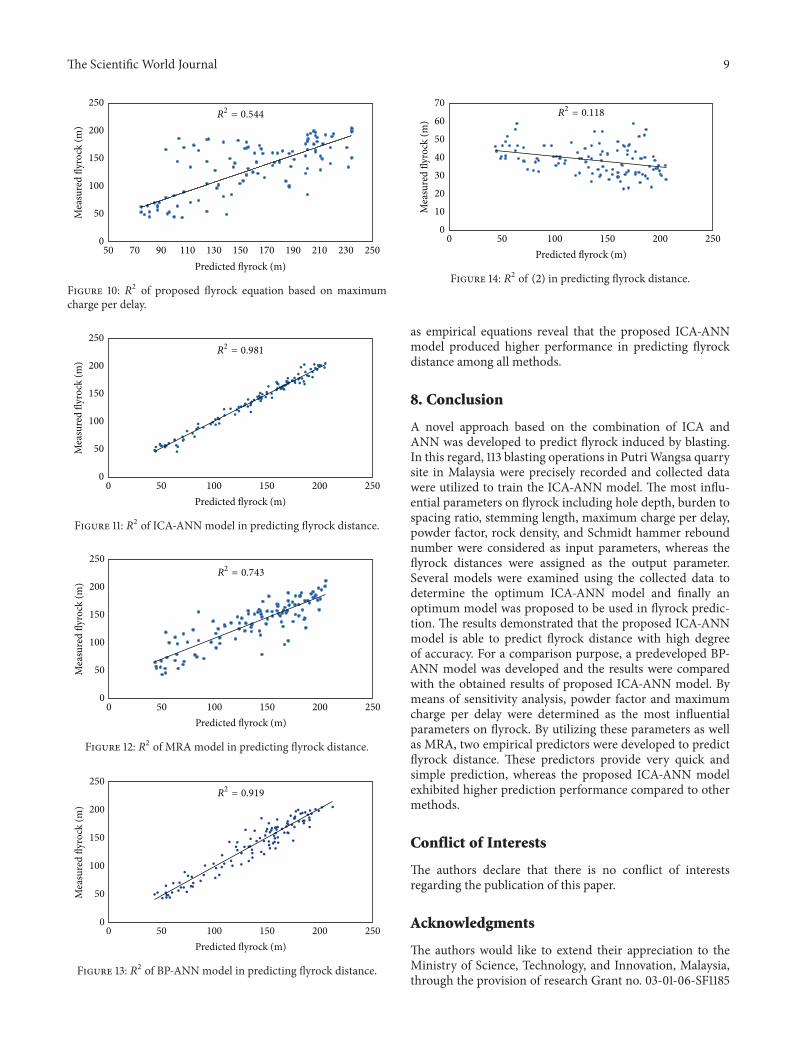