
Competitive Edge: The Evidence
155
Competitive Edge The Evidence Gary L Sturgess/Briony Smith Peter May/Alexis Sotiropoulos
Transcript of Competitive Edge: The Evidence

Competitive EdgeThe EvidenceGary L Sturgess/Briony Smith Peter May/Alexis Sotiropoulos

b
The Serco Institute22 Hand CourtLondon WC1V 6JFT +44 (0) 20 7421 6475F +44 (0) 20 7421 6471E [email protected]/institute
© 2007 The Serco Institute

Competitive EdgeThe EvidenceGary L Sturgess/Briony Smith Peter May/Alexis Sotiropoulos

Competitive Edge: The Evidence
Introduction 1
1. Defence Support 3
A. USA 3 B. UK 18 C. AUSTRALIA 26 D. NEW ZEALAND 31
2. Health Services 32
A. UK 32 B. DENMARK 46 C. AUSTRALIA 47 D. NEW ZEALAND 48
3. Prison Management 49
A. USA 49 B. UK 83 C. AUSTRALIA 88 D. FRANCE 92
4. Refuse Collection 93
A. USA 93 B. CANADA 98 C. UK 101 D. REPUBLIC OF IRELAND 107 E. THE NETHERLANDS 108 F. SPAIN 109 G. SWEDEN 110 H. SWITZERLAND 111
5. Municipal Services 112
A. USA 112 B. UK 126 C. DENMARK 136 D. AUSTRALIA 137
Endnotes 140
Contents
Competitive Edge: The Evidence
1
Introduction
This document is a companion to the Serco Institute report, ‘Competitive Edge: Does Contestability Work?’. It provides summaries of the most important of the source documents for that report – some 200 studies over 30 years from 12 different countries (although mostly from the United States and the United Kingdom).
The material is organised into five sections covering defence support, health services, prison management, refuse collection and municipal services. Within each section, the summarised references are organised geographically, and within those categories, by programme (in some cases) and then chronologically.
One of the principal reasons why governments contract with private firms for the delivery of public services is to be found in the belief that competition will deliver financial benefits. To some this seems self-evident, but others have questioned the scope of these savings, insisting that even where costs have been reduced, it has only been achieved at the expense of workers’ terms and conditions.
Competition and contracting have been widely used by governments for two or three decades now. With ‘Competitive Edge: Does Contestability Work?’ we set out to explore what the empirical evidence says about the financial impact of competition. Our concern was not with the relative merits of the public and private sectors, but rather with the benefits of competition and contestability (the threat of competition).
The studies summarised in this document are sourced from government, academia and audit bodies. In brief, this is what we found them to reveal:
In defence support, studies from Australia, New Zealand and the United States report savings in the • range of 20% to 30%, although in some cases they have been much higher. In the UK, reported savings have been in the region of 20-25%. The results from the use of PFI in the UK defence sector have been mixed, with savings varying from zero to as much as 20%.
In health support services, financial benefits in excess of 20% have been reported in England, in Australia • and in Denmark. However, in other jurisdictions, where competition has been pursued less vigorously, the savings do not appear to have been as great. The published results on PFI hospitals in the UK report cost differentials that are much lower, however there are significant methodological problems with these studies.
Of ten studies of US prison contracting, all but one found positive benefits associated with contract • management, and these were mostly in the range of 5-15%. The financial gains in the UK appear to have been much higher – more than 20% and over time, perhaps as much as 30%.
Competition and contracting in household refuse collection has been most extensively studied, with • the financial gains from the majority of the studies in North America, the United Kingdom and various European countries clustering around 20%.
The results from the study of municipal services are more mixed, in part because of the much wider • range of services involved. The range extends from 5% to 25%. Results from the use of compulsory competitive tendering in UK local government indicate that savings were towards the bottom end of this range.

Competitive Edge: The Evidence
2
Overwhelmingly the evidence makes it clear that it is competition that makes the difference rather than ownership. This was evident from studies in defence support, in hospital services, in refuse collection and in municipal services. From prison management and municipal services, there is also evidence of a contestability effect – public providers do not need to be exposed to actual competition in order to deliver significant productivity improvements. A credible threat of competition is often enough.
Service levels and service quality are important to these conclusions, since these savings cannot be regarded as real if they have been accompanied by a decline in standards. While not all of the studies addressed this question, the evidence generally concludes that these financial benefits have not been secured at the expense of quality.
We also explored these studies in an attempt to ascertain the sources of these financial savings. Most of the authors found it difficult to identify the specific contribution that individual changes had made, but it is clear that productivity improvements have delivered a large part of the benefits.
There is a significant body of evidence to suggest that the process of competition opens the way for a fundamental rethink of the way in which the service is delivered. Successful service managers develop a bespoke solution tailored to the problem in hand. This process has been little documented, but change appears to come from a multitude of micro-reforms rather than from major technological breakthroughs. This probably helps to explain the difficulty that researchers have had in identifying what contribution particular reforms have made.
Another part of the answer seems to lie in better people management – putting the right people in the right jobs, and using good people better. At its simplest, this is evident in the better management of sick leave and overtime. But successful contractors seem to pay more attention to appointing staff who are more appropriately qualified for the job in hand. There is also evidence that successful contract managers enjoy much greater autonomy than service managers working under a traditional public service regime.
There is no doubt that in some jurisdictions at some times, cost reductions have been delivered in part through lower wages and benefits. But this has by no means been universal, and it is clear that through careful design and good contract management, it is possible to ensure that these savings are secured through better service design and people management, and not through reductions in the conditions of front-line workers.

Competitive Edge: The Evidence
3
1. Defence Support
Competition in defence support has received less academic attention than it has in some other areas of defence activity, such as weapons acquisition and contracting with private military companies. However, it is an important area of government spending and the large-scale competition initiatives that have been pursued in some countries have attracted a degree of attention from audit bodies and other institutions interested in understanding their financial implications.
This section reviews some of the most significant literature on the financial impact of competition and contestability in defence support. It focuses on three countries where competition in defence support services has been widely applied: the USA, the UK and Australia, with one revealing case study from New Zealand. The literature is sourced from academia, government and independent research institutions, and offers analysis covering a period of some 33 years, from 1973 to 2006.
A. USA
Contracting out is more extensive in the US defence sector than in almost any other area of the federal government. Contrary to popular perception, defence contracting has not been exclusively about large weapons acquisition programmes. Many of the contracts tendered have been for services, ranging from basic support functions to higher-skilled activities including research, development and recruitment.
A-76 COMPETITIONS
Since 1955, US federal agencies have been encouraged to obtain commercially available goods and services from the private sector where possible. Initially, the policy was simply that the federal government would not provide any service or produce any product otherwise available through commercial channels. However, in 1966, the Bureau of Budget issued Circular A-76, which added an efficiency element, requiring federal agencies to transfer commercial activities to a contractor that could deliver the activity at a lower cost. The policy applied to those activities considered ‘commercial’ in nature – rather than ‘inherently governmental’.
The Bureau of Budget became the Office of Management and Budget (OMB) in 1970, and OMB Circular A-76 – ‘Performance of Commercial Activities’ has since been revised several times. In 1979, it became a requirement for agencies to undertake periodic reviews to determine whether in-house activities could be supplied more economically under contract. Under A-76 rules, if a contractor’s bid offers savings of more than 10% as compared with the in-house bid, the activity has to be contracted out. Bids from the private and in-house teams are compared on a cost basis only, without taking into account issues such as the contractor’s reputation or service quality expectations. The in-house bid is in practice a ‘proposal’ to reorganise the way that work is performed, using the most cost effective structure (usually, the lowest possible number of personnel) known as a ‘most efficient organisation’ or MEO.
A-76 competitions have been used across most, if not all US government departments. However, the A-76 policies have been applied most widely and consistently by the Department of Defense (DoD).
Although DoD had engaged private contractors to provide services prior to the 1979 revision of OMB Circular A-76, competition became much more extensive across defence support services following the change. DoD also undertakes non A-76 outsourcing i.e. competitions where the in-house team is not allowed to compete.

Competitive Edge: The Evidence
4
However, the Department has undertaken two extensive programmes focussed specifically on A-76 type competitions. The first was known as the Commercial Activities programme. The second was the Competitive Sourcing initiative.
Commercial Activities Program
1.1 Martin Binkin, Herschel Kanter and Rolf H. Clark, ‘Shaping the Defense Civilian Work Force: Economics, Politics and National Security’, 19781
Description: Against a background of Pentagon budget constraints, the authors explored the nature of the defence civilian workforce and examined options for achieving efficiencies. One of the options that they considered was the use of privately employed personnel to deliver certain services, examining the relative cost of in-house and private contractor operations.
Findings: The study did not attempt to offer a general conclusion about the relative costs of in-house and contractor provision, but did refer to analyses of specific services converted to contract during FY1974. Savings of 39% each resulted from contracting out of laundry and dry cleaning and of custodial services, whilst 47% savings occurred for refuse and waste disposal and 22% for food services.
Methodology: The authors did not access original data in their treatment of the question of relative cost savings from contracting-out or in-house operation, but reviewed secondary sources. The findings were probably derived from DoD cost comparison data, but this is not specified.
Sources of benefits: Lower personnel costs came as a result of using fewer employees and the use of civilian rather than military personnel. The analysis also suggested that the scope of the contracted operations made a difference – with more scope for savings from converting larger functions. This reflected the findings of a number of other studies.
1.2 GAO, ‘Review of DoD Contracts Awarded Under OMB Circular A-76’, 19812
Description: The GAO reviewed a representative sample of 18 contracts awarded by DoD under OMB Circular A-76 between April 1978 and October 1980. The 18 contracts accounted for around 39% of the civilian positions eliminated by contracting out over this period. The purpose of the study was to determine whether decisions to contract out the functions might have been different, had subsequent price increases and performance shortfalls been known when the awards were made, and to review any related findings from DoD audit agencies.
Findings: The majority of the cases did not result in price increases or performance shortfalls. When price increases occurred they were generally felt to be justified and, with one exception where performance shortfalls occurred, did not exceed the estimated savings through contracting out. However, unsatisfactory contractor performance occurred in five cases, and in one case a decision to contract out was based on incomplete information in the Statement of Work which was used as the basis of the cost comparison. GAO ultimately concluded that if the information available in retrospect had been known before the contract awards were made, in 6 of the 18 cases, it was possible, but not certain, that the original decision would have been different, but in 12 cases the original decision was fully validated.
Methodology: The sample drew from across 10 geographical regions, including many older cases which provided greater opportunity to observe the occurrence of price increases and performance shortfalls that might have arisen over time. GAO evaluated the contractors’ original price increases and performance shortfalls up to January 1981. They drew on information and documentation from the installations studied in the sample, including contract files, inspection and audit reports, quality assurance reports and related studies.
Competitive Edge: The Evidence
5
1.3 GAO, ‘Factors Influencing DoD Decisions to Convert Activities From In-House To Contractor Performance’, 19813
Description: For this study, GAO reviewed 12 DoD functions awarded to private contractors under the Commercial Activities Program between 1978 and 1980, to assess what were the drivers for DoD in deciding to contract out those activities. The report asked how much contracting out was driven by 1) the desire to circumvent civilian personnel ceilings, 2) wage differentials between federal blue-collar and contractor employees, and 3) other significant influences.
Findings: The GAO found that the most significant influence was lower cost projections for contractor performance from cost comparison exercises. The projected savings were usually linked to the contractors’ plans to reduce personnel numbers and to pay lower wages. However, there was no evidence that the decision to contract out was influenced by a desire to circumvent civilian personnel ceilings, although the GAO did state that the military services used A-76 to reduce their workforce.
Methodology: GAO reviewed documentation, guidance, audit reports and files relating to the programme and to the conversions, and gathered oral information from officials, but did not seek to evaluate the database or to verify calculations used in the cost comparisons relating to the conversions. They did not evaluate actual contractor costs or performance. The report made a number of recommendations aimed at improving the cost comparison process.
1.4 GAO, ‘Contracting of Various Functions Under OMB Circular A-76 at Selected Air Force Installations in San Antonio Texas’, 19844
Description: The GAO reviewed five commercial functions at two Air Force bases in San Antonio, Texas – food services, clothing alterations and hospital housekeeping at Lackland AFB, first contract-out in 1958, and the motor pool and Precision Measurement Equipment Laboratory at Kelly AFB, first contracted in 1974 – to examine whether savings from contracting were realised; the sources of any savings; the effect on personnel; and the level of competition for the contracts.
Findings: Cost comparison data was in fact only available for three of the five functions. For two of those functions, savings were realised from contracting out. All five contracts were awarded as a result of competitive bidding, in competitions involving multiple bids.
Methodology: The GAO analysed the available cost comparison data from the functions studied, and data on the disposition of displaced employees, where that was available for three of the five functions. The data from the remaining functions appeared to be unavailable to GAO at the time of the study, because of the long period of time since the functions were initially contracted out (10 and 26 years).
Sources of benefits: Savings mainly came through the use of fewer employees and the payment of lower wages than the government. Most of the displaced employees went on to obtain other government jobs, and were not employed by the contractors. The basic wages, fringe benefits and job security of the contracted employees were lower than for government employees (military trainees) doing similar work.
Critical analysis: For one of the functions for which GAO could not obtain data (food services at Lackland AFB), a 1974 letter from the Deputy Comptroller General of the GAO to a member of the House of Representatives (in response to his earlier enquiry) recorded figures from a GAO review conducted at the time of the decision to contract out the service. In 1971, the Air Training Command estimated that contracting out could save approximately $2.8m over three years. In their review, GAO used the average assigned military and civilian personnel in 1973 and DoD cost data from 1974 and calculated that the contract approach would cost $6m less over a three-year period than the previous method of providing food services.5

Competitive Edge: The Evidence
6
1.5 John B. Handy and Dennis J. O’Connor, ‘How Winners Win: Lessons Learned From Contract Competitions in Base Operations Support’, 19846
Description: One of the earliest independent reviews of the Commercial Activities Program was this 1984 study by Handy and O’Connor looking at competitions to provide Base Operations Support services. Handy and O’Connor used statistical analysis to examine 921 base support competitions that took place between February 1979 and December 1983, affecting 24,000 jobs, to determine how the winners realised the savings that they were able to offer.
Findings: The study concluded that substantial savings had resulted, regardless of whether or not an external supplier won the competition. In-house bids reduced costs by 15% on average in comparison with pre-competition costs, whilst contractors’ bids were 22% lower on average, even when supervision and administration costs were taken into account. A total annual cost reduction of 27% occurred across all 921 activities ($957m as compared with $1.3bn). However, the main thrust of the paper was an analysis of how competition winners realised savings.
Methodology: Handy and O’Connor used statistical analysis in a comparison of pre-competition operating costs with proposals submitted by in-house and external competitors.
Sources of benefits: Handy and O’Connor found that savings arose from productivity improvements including: simplification of organisational structures; consolidation of working locations; workforce flexibility (use of working supervisors who not only supervised but performed direct labour themselves, multi-skilled workers to reduce backlogs and lower-skilled workers if appropriate to reserve higher skilled workers for other tasks); provision of equipment and technology to maximise productivity; clarification of goals and accountability to motivate workers; and elimination or modification of non-essential tasks.
1.6 GAO, ‘DoD Functions Contracted Out Under OMB Circular A-76: Contract Cost Increases And The Effects On Federal Employees’, 19857
Description: This GAO study reviewed a sample of 20 DoD functions contracted out under A-76 competitions between October 1978 and February 1981, to determine 1) if cost increases had occurred which would result in greater costs to government than if the function had continued to be performed in-house; 2) the effects on government employees of contracting out; and 3) hidden costs of contracting out such as unemployment or welfare payments for displaced employees.
Findings: For each of the 20 functions reviewed, pre-tender cost comparisons had projected savings from contracting. All but one of the functions experienced cost increases in the 3 years after conversion to contracting, although savings were still realised in 17 of the 20 cases. Savings were not realised on two of the functions and the GAO were unable to make a determination on the other.
Methodology: The GAO’s conclusions were based on the results of the original cost comparisons, and data on subsequent cost increases resulting from post competition modifications to the contracts. GAO did not evaluate the original cost comparisons.
Sources of benefits: For five of the 17 cases where savings were realised, subsequent cost increases resulted primarily from additional work and authorised wage rises. GAO therefore concluded that the projected savings were not necessarily invalidated because the additional costs would have been incurred whether the work was contracted out or retained in-house. For 12 of the 17 functions, contract errors, ambiguities or the costs of re-competing contracts led to reduced savings. Of the 20 functions, contracts were re-competed in 7 cases after the initial contractor failed to perform. In 4 of the 7, some savings were still realised after re-competition.

Competitive Edge: The Evidence
7
1.7 Ross M. Stolzenberg and Sandra H. Berry, ‘A Pilot Study of the Impact of OMB Circular A-76 on Motor Vehicle Maintenance Cost and Quality in the U.S. Air Force’, 19858
Description: Stolzenberg and Berry undertook a pilot study between March 1982 and March 1983 to examine the effects of A-76 competitions on the cost and quality of motor vehicle maintenance services at Air Force bases. The study examined five bases where a competition had taken place: three where the work was won by a contractor and two where the work went to an in-house team employing civilian government employees to perform the vehicle maintenance. It further examined two bases where no competition had been performed and the maintenance was performed by a mixture of civilian and uniformed personnel.
Findings: The study concluded that the application of Circular A-76 led to very large reductions in the number of employees devoting their time to vehicle maintenance and to substantial differences in the cost per mile of operating Air Force base administrative fleets. The lowest cost per mile occurred where maintenance was carried out by government employees operating under A-76 terms.
Stolzenberg and Berry also used ‘interviews and limited administrative data available’ to attempt to examine quality, but they were unable to draw strong conclusions from the available data. The only quantitative data (on quality) at that time related to vehicle-out-of-commission (VOC) rates. The authors’ analysis of VOC rates suggested that higher maintenance expenditure brought higher quality maintenance (reduced VOC rates). However, fairly large expenditure increases produced only small improvements (reductions in VOC rates).
Methodology: This was a case study, drawing on existing cost comparison data, interviews and other relevant administrative information. Using the available data, Stolzenberg and Berry compared costs of motor vehicle maintenance before and after implementation of the A-76 procedures, and also across different sites at the same time.
Sources of benefits: Savings derived from a reduction in labour requirements with no apparent increase in the use of labour-saving capital equipment.
1.8 GAO, ‘DoD Functions Contracted Out Under OMB Circular A-76: Costs And Status of Certain Displaced Employees’, 19859
Description: In this report, the GAO examined, amongst other elements, the hidden costs – such as welfare payments – associated with the displacement of federal employees as a result of contracting out under A-76.
Findings: The total cost of public assistance for those individuals was $215,000. The GAO’s analysis concluded that this would have had little effect on DoD’s estimated savings of more than $65m.
Methodology: The GAO surveyed personnel from a sample of 31 of 140 DoD functions contracted out in the fiscal year 1983. 129 individuals across the 31 functions had been involuntarily separated, of whom 94 responded to the survey and of those 53 (56%) received welfare payments of some nature. GAO also surveyed 171 displaced employees who had subsequently gone to work for contractors. 130 of those individuals responded to the survey, of which 69 (53%) said that they received lower wages than they had as government employees. Most of the respondents reported that their benefits were not as generous as they had been in government employment. A further 1,881 employees affected by the contracting process who subsequently obtained positions elsewhere in government were not surveyed.
1.9 GAO, ‘Federal Productivity: DoD’s Experience in Contracting Out Commercially Available Activities’, 198810
Description: A broad review by the GAO of DoD’s studies of commercially available activities between 1978-86, during which 1,661 studies appear to have been completed. The studies mainly involved facilities, grounds and utilities maintenance, although a number of the DoD cost studies dealt with other services.
Findings: From financial year 1979 to December 1986, DoD completed 1,661 A-76 cost comparisons and the data indicated that the annual saving was around $613m.

Competitive Edge: The Evidence
8
Methodology: The savings were expressed in current dollar terms for each of the years during which the individual cost comparison studies were completed. No detailed information regarding the methodology was provided. Savings were also broken down in the report according to function type and whether the activities were contracted out (equating to $484m of the savings) or retained in-house ($128m of the savings).
Critical analysis: Although no detailed costing methodology for the individual cost comparison studies was provided for review by the GAO, the scale of the numbers represented made it a useful reference point, given DoD’s status as the federal department to have undertaken the most extensive and well-documented commercial activities study programme.
1.10 GAO, ‘Army Procurement: No Savings From Contracting for Support Services at Fort Eustis, Virginia’, 198811
Description: Case study of the experience of contracting out support services under OMB Circular A-76 at Fort Eustis Army Base, awarded in 1982.
Findings: The GAO found that if Fort Eustis had considered all the probable transaction costs of contracting out these functions, the estimated savings would have been $1.7m instead of $13.5m. However, the estimated savings were not in fact realised and the report concluded that in this case contracting-out probably cost the government about $600,000 more than it would have cost to deliver the service using the in-house option (as bid). The greater cost for contracting out was due to such factors as contract administration and contract fees. In addition, poor quality of data led the Fort Eustis officials to choose a cost-plus-award-fee contract rather than fixed price, and the contract experienced subsequent cost growth of 70%.
Methodology: GAO analysed original DoD cost comparison data relating to the case. They focused on labour costs as the most important element in managing these services.
1.11 Paul M. Carrick, ‘Evidence on Government Efficiency’, 198812
Description: Carrick examined the US Navy’s experience of Commercial Activities competitions between 1979 and 1985 and, using statistical analysis, demonstrated that cost savings resulted from both in-house retention under MEO (most efficient organisation), and from conversion to contract.
Findings: Total savings for the Navy during the period studied were $430.8m, of which $188.4m came from the shift to the MEO delivery approach and $242.4m from contracting. Carrick further concluded that the Commercial Activities competitions incurred spillover costs and made impositions upon management time, and suggested that it would be more economical to introduce appropriate internal incentives to encourage public sector managers to the make the efficiency savings that they are aspired to make under the competition process.
Methodology: The author carried out statistical analysis of Navy data relating to Commercial Activities competitions undertaken during the period studied, looking at both bid data and recorded savings from competitions.
Sources of benefits: Savings from the shift to MEO personnel levels clearly arose from the use of fewer personnel. In addition, due to the significant difference in many cases between the winning bid and the second best bid, Carrick suggested that the winner of these competitions usually acquired some unique insight into how to perform the contractual tasks in order to achieve that level of comparative efficiency.
Critical analysis: Trunkey et al, commented that Carrick’s analysis was largely descriptive, but said that it was the only such analysis other than their own of which they were aware.13
1.12 R. Derek Trunkey, Robert P. Trost and Christopher M. Snyder, ‘Analysis of DOD’s Commercial Activities Program’, 199614
Description: Trunkey, Trost and Snyder used statistical analysis to examine the results of all comprehensive A-76 competitions conducted by the DoD between 1978 and 1994. 2,195 competitions were completed in that period, from 4, 311 that had been initiated.

Competitive Edge: The Evidence
9
Findings: The authors noted that A-76 competitions had yielded significant benefits, amounting to total annual savings of $1.5bn, equivalent to around 30% of the baseline cost of performing the functions. The range across specific services and agencies extended from 22% to 36%). By competing all functions in the Commercial Activities 1995 inventory, DoD could save up to $6.2bn each year. They also believed that these savings could be even larger since the inventory only constituted as a minor part of DoD’s total workforce. However, savings could also shrink to $2.9bn if the existing level of competition cancellations remained constant, reducing the total value of competed functions from what had initially been intended. Trunkey et al also found that small competitions were more likely to fail to generate savings and large competitions were more likely to suffer cancellation, though large competitions usually produced the largest savings.
Methodology: Trunkey et al used statistical analysis to test the probability of different outcomes from the A-76 cost comparison exercises under different circumstances and to assess estimated savings under a number of scenarios and across different functions. They modelled the A-76 process as a sequential decision tree, with different expected savings depending on which branch a particular study follows. This flowed through from the decision to completed or cancel an initiated competition, to different scenarios where the in-house bid was equal to or less than the baseline cost, and then to contractor or in-house win scenarios.
1.13 Carla Tighe, Derek Trunkey and Samuel Kleinman, ‘Implementing A-76 Competitions: Lessons Learned from DoD Experiences’, 199615
Description: Tighe, Trunkey and Kleinman looked across the Services and DoD agencies to evaluate lessons learned from DoD experiences of implementing A-76 competitions. The authors drew on DoD CA Competition data from 1978-1994 and from CNA savings estimates over that period. The sample covered 2,138 competitions. The review was largely descriptive, with some statistical analysis to examine emerging trends.
Findings: The study found that the existing process had delivered large, permanent savings of 30% savings on average (drawing on DoD data from 1978). In-house teams won about half of all competitions. Larger competitions appeared to deliver slightly higher percentage savings.
Methodology: The study reviewed previous data, and the authors undertook some statistical analysis to draw lessons from emerging patterns and trends.
Sources of benefits: The savings seemed to come from using fewer people to do the same job, rather than from using less experienced personnel. This offered one possible explanation for the slightly higher percentage savings from larger competitions, which allowed greater scope for workforce flexibility (in the form of multi-skilling, etc). The authors also stated that where contracting failures occurred, they could be traced to badly written performance work statements or to using sealed-bid competitions that mandated the use of the lowest bidder. Such failures were ‘the exception, not the rule’.
1.14 Christopher M. Snyder, Robert P. Trost, and R. Derek Trunkey, ‘Bidding Behaviour in DoD’s Commercial Activities Competitions’, 199816
Description: Snyder, Trost and Trunkey used statistical analysis to develop models for estimating savings from future DoD Commercial Activities competitions.
Findings: The authors projected annual savings of $6bn if the entire 1995 DoD CA directory was competed under A-76 rules. They further predicted that even greater savings could be realised with a review of other functions not considered commercial (and thus not subjected to competition under the A-76 rules). If other services had the same percentage savings as the Navy, which had the largest percentage classified as commercial, the savings would roughly double.
Methodology: The analysis by Snyder et al allowed them to calculate whether the source of savings was from in-house or contractor bids, and to simulate the effect of various possible policy changes on savings, including increasing the number of military or civilian billets in a competition, constraining in-house teams to bid no more than baseline costs, changing the in-house bidding advantage in either direction and moving to the new OMB overhead rate.

Competitive Edge: The Evidence
10
They found that competition (not private sector cost advantages) was the main source of the savings (in terms of cost differentials between the predicted baseline cost compared with the predicted winning bid. Increasing the number of civilian billets in a competition would increase savings by 2%, and increasing the number of military billets increased savings by 5%. Constraining the in-house team to bid no more than baseline costs increased savings by 1.7%. Changing the in-house bidding advantage in either direction had little impact on savings. Moving to the new OMB overhead rate increased savings by 22% and should reduce the number of in-house wins (which was typically above 50% to date).
Snyder et al also tested two prevailing DoD positions ‘would the savings materialise?’ and ‘would the program produce 30% savings?’ The first position was assessed by testing whether the projected number of positions scheduled to be competed could actually be found in practice, to which the authors concluded that the required number of positions appeared to exist, and that it would be a difficult but achievable goal to achieve the target and test those positions. They found no evidence to suggest that the savings levels would be lower than the projected 30%.
1.15 Christopher M. Snyder, Robert P. Trost, and R. Derek Trunkey, ‘Reducing Government Spending with Privatization Competitions: A Study of the Department of Defense Experience’, 200117
Description: In this 2001 paper, Snyder, Trost and Trunkey analysed data from approx 3,500 DoD Commercial Activities competitions that took place between 1978 and 1994 to assess the level of potential cost savings if DoD achieved its full planned programme to open 13,000 functions to competition. The authors’ interest was specifically in analysing outcomes from competition, not testing public versus private supply.
Findings: DoD had achieved $1.46bn in annual savings from the completed A-76 competitions in the data set. The authors forecast that an additional $5.74bn in annual savings could be achieved if competitions were completed for DoD’s entire inventory of commercial activities.
Methodology: This study analysed DoD data to determine the difference between the baseline cost of the functions involved (the cost of in-house provision prior to the competition) and the winning bid. The authors adopted an approach that took into account premature cancellation of some competitions (40% were cancelled prior to competition) to determine how much savings were reduced as a result of cancellations. The model also took into account the fact that savings from completed competitions dropped no lower than zero at the time of the competitions (prior to any post competition adjustments), due to a rule constraining the in-house team to bid no more than its baseline costs, in order to preclude negative savings.
Competitive Sourcing
1.16 GAO, ‘Base Operations: Challenges Confronting DoD as it Renews Emphasis on Outsourcing’, 199718
Description: A 1997 study of the extent of DoD outsourcing, and the challenges facing the Department as it sought to renew its emphasis on this programme. It examined factors that influence savings in the outsourcing process and reviewed the findings of other studies that had looked at cost savings.
Findings: DoD expected savings from outsourcing and privatisation to grow to at least $2.5 billion annually by the end of fiscal year 2003. The Navy projected cost savings of 30%, the Air Force 20% (up to $1.26 billion), the Army 10%, and the Marine Corps $10 million.
Methodology: The GAO analysed DoD’s database of A-76 cost comparison studies conducted since 1978, but did not seek to validate the accuracy of the data, because of the size and complexity of the database. They also reviewed other DoD and industry studies on A-76, as well as previous GAO reports. To test DoD’s projected cost savings from outsourcing, GAO selectively analysed DoD’s database of A-76 cost comparison studies to determine average cost savings projected and savings trends.

Competitive Edge: The Evidence
11
Sources of benefits: The GAO found outsourcing to be cost effective, usually because of reductions in personnel, whether the function was actually contracted out or remained in-house. The study found that two areas offered the potential for significant savings – the conversion of military support positions to civilian or contractor positions, and the use of large ‘omnibus’ contracts, rather than multiple contracts.
1.17 GAO, ‘DoD Competitive Sourcing: Results of Recent Competitions’, 199919
Description: The GAO examined 53 competitions completed between October 1995 and March 1998.
Findings: The analysis of DoD data available on these 53 competitions suggested that they were projected to save $528m over the life of the multi-year awards, and would average 42% savings. Similar savings were projected regardless of whether competitions were won by private sector or in-house teams.
Methodology: The authors spoke with officials from the Office of the Secretary of Defense, Departments of the Army, the Navy, and the Air Force; the Marine Corps; the Defense Finance and Accounting Service and the Defense Commissary Agency to obtain information on these 53 A-76 competitions. It more fully assessed nine of these competitions to test whether they were conducted in accordance with OMB Circular A-76 guidelines and if DoD felt that the oversight of the contractor was adequate. The GAO contacted the contracting officials or officials in charge for each of the completed cases.
Sources of benefits: Most savings involved reduced personnel costs. The GAO observed that ‘the extent to which the work can be done with fewer personnel is most clearly shown when the in-house organizations win’ – because when activities transferred to the private sector, positions were eliminated as the work transferred to private sector employees under the contract, whereas in the case of the in-house team winning, it was clear exactly how many posts had been reduced.
1.18 GAO, ‘DoD Competitive Sourcing: Questions about Goals, Pace, and Risks of Key Reform Initiative’, 199920
Description: The GAO reviewed DoD’s Competitive Sourcing initiative two-years in. Between 1997 and 2003, DoD set itself the target of opening around 229,000 government positions to competition (using the A-76 methodology) and estimated cumulative savings of $6bn over that time, and $2.3bn in recurring savings each year thereafter. The GAO set out to review progress against the goals and to assess the accuracy of the cost estimations.
Findings: Projected savings from competitions for FY1998 appeared to be overstated, because they did not adequately consider investment costs relating to performing the cost comparison studies. However, it appeared that significant savings would still result from the programme. At the time of publication DoD was in the process of revising its projected annual savings as of FY2004. The figure had been revised down from $2.5bn to $2.3bn, but remained under review.
Methodology: The GAO obtained and analysed the planning assumptions used by each service and agency to assess how well investment costs were reflected in the savings estimates. The researchers obtained information on the numbers of positions planned for study that formed the basis for projected savings between 1997 and 2003. They also obtained data on unrecognised costs, such as separation costs. They did not determine the reliability of the cost information supplied.
1.19 GAO, ‘DoD Competitive Sourcing: Savings Are Occurring, but Actions Are Needed to Improve Accuracy of Savings Estimates’, 200021
Description: DoD expected to achieve about $9.2 billion in savings during FY1997-FY2005 and $2.8 billion in annual recurring savings thereafter. The GAO assessed the extent to which actual savings had been achieved or were expected as a result of the competitions, by reviewing a sample of nine competitions.

Competitive Edge: The Evidence
12
Findings: From the available data, GAO concluded that DoD realised savings from seven of the nine cases reviewed, albeit less than were initially projected for those activities. Neither GAO nor DoD could precisely quantify the extent of savings due to inadequacies in the data available.
Methodology: GAO adopted a case study approach, examining the results of 9 of the 53 A-76 studies completed by DoD between October 1995 and March 1998.
Critical analysis: The report expressed reservations about the high projected savings figure – although it was acknowledged that savings had and would occur, the precise scale of the savings could not be determined.
1.20 GAO, ‘Results of A-76 Studies Over the Past 5 Years’, 200022
Description: GAO examined data provided by DoD on 286 A-76 studies completed since 1995 for which the Department had complete data as of June 2000. The GAO analysed the results of the studies to assess DoD’s compliance with reporting requirements for the programme and the Department’s summary observations about savings and the results of the competitive process.
Findings: Based on this data, DoD had concluded that the 286 A-76 competitions generated savings of $290m in FY1999. Having analysed the data, GAO concluded that limitations in the baseline cost data from which to calculate savings, study costs and other factors made it difficult to reach precise savings estimates. Some of the estimated savings would therefore need to be offset and unaccounted for factors taken into consideration.
Methodology: DoD’s savings were calculated by comparing the estimated pre-study cost and the current cost of performing the function in FY1999.
Critical analysis: GAO pointed out that limitations in baseline cost data and other factors made it difficult to estimate savings as accurately as suggested by DoD. Further, GAO argued that DoD’s estimate was imprecise for a number of reasons. First, many A-76 studies were conducted without adhering to DoD’s official guidance. Second, DoD’s studies did not take into account the costs of conducting and implementing the results of A-76 studies. The database used by DoD did not always provide accurate and complete cost information.
1.21 Susan M. Gates, & Albert A. Robbert, ‘Personnel Savings in Competitively Sourced DoD Activities: Are They Real? Will They Last?’, 200023
Description: Gates and Robbert examined the implementation of six competitions to try to develop a better understanding of the sources of efficiency improvements under the A-76 process and how those improvements were achieved. The authors focused their analysis on the use of personnel before and after A-76 competitions, and attempted to isolate personnel and related costs.
Findings: The study found that both in-house and contractor teams could bring substantial projected personnel savings, ranging from 34% to 59% of baseline personnel costs, with the figures for contractor teams starting higher at 41% and both peaking at the same level. The savings were found to endure over time.
Methodology: Gates and Robbert based their analysis on six cases studies at four installations in three services (Army, Navy and Air Force). Three had been won by an in-house team, the other three by a contractor team. The authors collected detailed information (including cost data) about the projects and conducted widespread interviews with key stakeholders. By tracing the implementation of the projects over periods ranging from one to 10 years, using documentary sources and interviews, Gates and Robbert concluded that savings were achieved and that they were maintained over time.
Sources of benefits: The savings largely resulted from using fewer staff (achieved through various means, including restructuring, multi-skilling, reduced work scope and increased work intensity or labour availability), though other strategies such as civilianisation, downgrading positions, paying lower wages and benefits and capital-labour substitution also occurred.

Competitive Edge: The Evidence
13
Critical analysis: Some of the costs were not well accounted for due to limitations of data, which made it difficult to assess whether real savings occurred in some of the projects. In relation to the persistence of savings, where change in costs occurred over time, the authors found it difficult to evaluate whether the changes were appropriate given changes in circumstances.
1.22 Michael Hynes, ‘A Casebook Of Alternative Governance Structures And Organizational Forms’, 200024
Description: In a chapter dealing with ‘Competitive Sourcing’, the author offered case studies of five Air Force A-76 competitions and two case studies from the UK. One of the UK studies deals with a defence sector project, and that is summarised later in this document.
Findings: Cost comparison data was not available for all five of the US Air Force cases. However, in the three cases where it was available, the results were as follows: in one case the winning contractor bid was $8m cheaper than the in-house alternative, however, the contractor subsequently filed for bankruptcy and after a failed re-competition, the service was brought back in-house; in the second, oversights in drafting the contract led to subsequent cost increases that took the contractor price above the in-house price by 16%; however, in the third, after an initial bedding-in period where some performance glitches occurred, the contractor was able to meet or exceed previous in-house performance levels whilst operating with a 33% reduction in man-hours and resulting costs savings, which endured in subsequent contracts, even with a change of contractors.
Methodology: The studies drew on data from the cost comparison exercises and cited broad lessons from some of the GAO and CNA studies described in this document.
Sources of benefits: The only cited source of financial benefits was a reduction in man-hours to deliver an equivalent or better service, in a Navy contract to provide maintenance for TA-4J Skyhawk aircraft.25
1.23 David J. Kneisler, ‘Outsourcing the Helicopter Combat Support Mission Aboard Military Sealift Command Ships: A Cost Comparison Study’, 200026
Description: This was an approved thesis examining the relative costs and differences in services of contractor and in-house provision of Helicopter Combat Support functions aboard Military Sealift Command Ships. The first trial outsourcing occurred in 1997 and the paper examined experiences since that date.
Findings: Cost savings obtained when comparing the outsourcing contract with an in-house alternative using different numbers of detachments and under different circumstances were found to be $7.79m (when comparing the outsourcing cost with three military detachments); $2.9m (when comparing the outsourcing cost with two military detachments) or $1.1m (when comparing the outsourcing cost with two military detachments, rotating personnel and maintaining 3 helicopters in the workshop). The study concluded that although the contract did provide more savings, this was at the cost of increased risk in not meeting surge requirements for unplanned contingencies.
Methodology: The thesis evaluated the outsourcing contract and compared the total costs and service provision of the contract option with the in-house alternative. The analysis took into account capital expenses (depreciation, cost of capital, insurance), military personnel costs and operating costs.
Sources of benefits: The main sources of savings from contracting out were from the more efficient business practices and use of personnel.
1.24 GAO, ‘Effects of A-76 Studies on Federal Employees’ Employment, Pay, and Benefits Vary’, 200127
Description: By examining three A-76 case studies (one in-house win and two contractor wins), the GAO attempted to assess the impact of A-76 on federal workers.
Competitive Edge: The Evidence
14
Findings: In a civil engineering competition at Wright Patterson Air Force Base (which resulted in an in-house win), the Air Force expected a saving of $97m over 6 years. For Base operations support competitions at the same base, the saving was expected to be $58m for a 49-month contract. The estimated savings from a competition for aircraft maintenance and base operations support activities at Tyndall Air Force Base were $19m over 5 years.
The GAO’s analysis showed that across the three facilities studied, around half of the civilian government employees remained in federal service after the competitions, either in new or another government organisation, where they received similar pay and benefits as previously. A small number were involuntarily separated from government, and others received a cash incentive to retire or separate. Contractor benefit packages differed, but the types of benefits appeared similar to those offered by government.
Sources of benefits: GAO found that the costs reductions resulted mainly from reductions in the number of positions needed to perform the activities studied (the same was true for both in-house and contract wins). It was reported that the reductions in personnel numbers were achieved through multiple techniques ranging from designing new work processes to multi-skilling. Contractors used the least costly skill classification to perform tasks, and multi-rolled and multi-skilled employees to complete work. Contractors also had the flexibility to use temporary or seasonal workers to meet periodic work peaks, or to pay overtime or higher wages to low-classification workers to have them temporarily perform tasks in a higher classification. This was harder for government to achieve because it required the cooperation of employee groups and there might be a need to obtain personnel waivers to accommodate some such changes.
1.25 Frances Clark, Cheryl Rosenblum, Murrel Coast and Elaina Smallwood, ‘Long-Run Costs and Performance Effects of Competitive Sourcing’, 200128
Description: Between FY1997 and FY2005, DoD estimated that competitive sourcing could result in savings of about $9.2bn in operating cost and $2.8bn annually thereafter. In order to examine whether these targets were realistic, Clark et al. examined 16 A-76 competitions conducted between 1988 and 1996. These competitions accounted for $100m in annual pre-competition operating costs and more than 2,800 positions.
Of the 16 competitions, 14 were contract wins and 2 in-house wins – 11 conducted by the Air Force, 3 by the Army and 2 by the Navy. They represented about 15% of the positions competed during that period, and the major types of functions available for competitive sourcing, such as supply/logistics, facility and family housing maintenance, and aircraft maintenance.
Findings: The study found that expected savings were 35%, with an estimated effective savings rate of 34% (indicating virtually no degradation of savings over the period). Even with all changes of workload, scope and one-time costs included in the data, there were still 24% observed savings. These savings appeared to continue through subsequent periods. Further, they looked at whether performance deteriorated after competition by conducting interviews with key stakeholders. The result showed that overall performance was ranked between neutral and satisfied.
Methodology: The authors examined cost data and all available performance information from the time of competitions through to FY1999, looking at expected costs (the price of the winning bid, taking in all administrative costs to the government), observed costs (what DoD actually spent on the provision of services, taking in cost adjustments arising from changes in scope, workload and other factors) and estimated effective costs (cost to DoD of providing the same set of services identified in the original cost comparison).
1.26 Jacques S. Gansler and William Lucyshyn, ‘Competitive Sourcing: What Happens to Federal Employees?’, 200429
Description: Gansler and Lucyshyn examined all DoD A-76 competitions conducted between the first quarter of 1994 to the first quarter of 2004 (1,200 competitions) in order to assess impact of competitive sourcing on federal employees. They also evaluated the findings of previous research on the financial benefits of competitive sourcing.
Competitive Edge: The Evidence
15
Findings: The authors found that DoD’s data affirmed previous research on the benefits of competition, with estimated savings from the winning bids averaging 44% compared with the initial baseline cost of the functions studied (with either improved performance or no decrease). Moreover, they argued that the widely claimed negative impact on federal employees did not exist. They tracked 65,157 civilian positions since 1995 and found that only 5% of those positions were reduced through involuntary separation of employees.
Methodology: To reach these conclusions, Gansler and Lucyshyn examined data provided by the Commercial Activities Management Information System (CAMIS) database used by DoD to track competitive sourcing initiatives in the Department.
Sources of benefits: Most of the financial savings were due to increased personnel efficiency due to the fact that winning bids used on average 39% fewer civilian positions than initially expected.
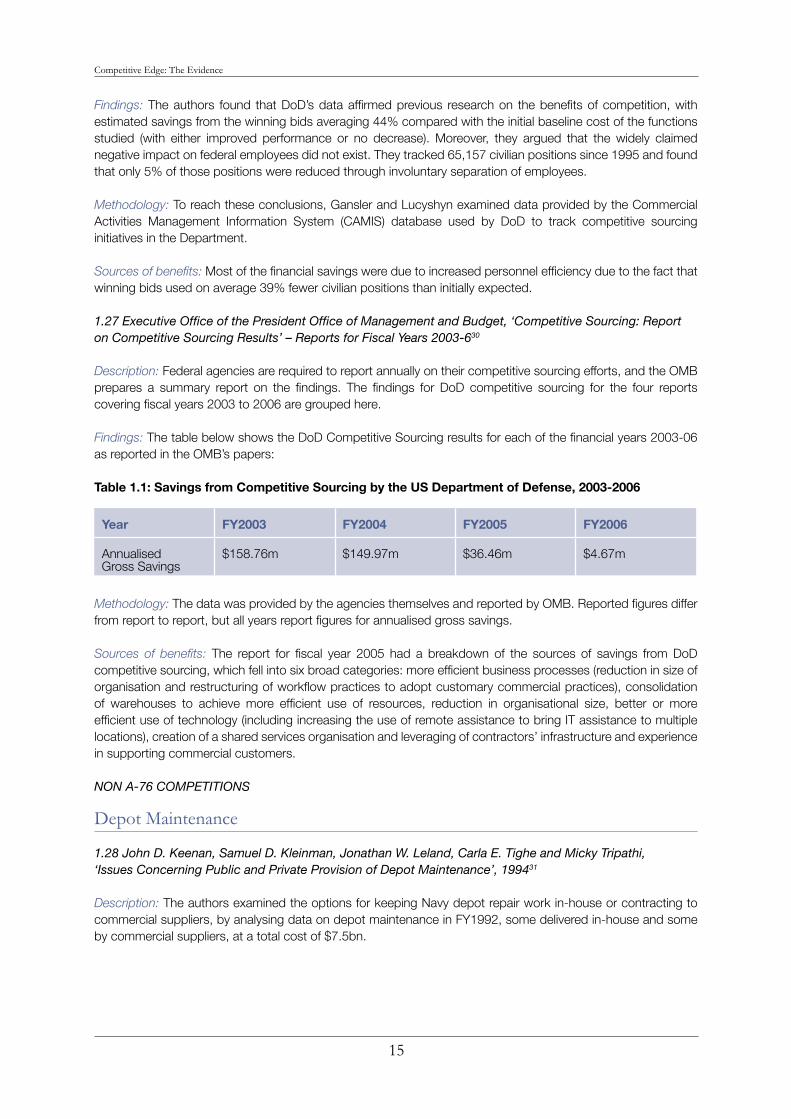
1.27 Executive Office of the President Office of Management and Budget, ‘Competitive Sourcing: Report on Competitive Sourcing Results’ – Reports for Fiscal Years 2003-630
Description: Federal agencies are required to report annually on their competitive sourcing efforts, and the OMB prepares a summary report on the findings. The findings for DoD competitive sourcing for the four reports covering fiscal years 2003 to 2006 are grouped here.
Findings: The table below shows the DoD Competitive Sourcing results for each of the financial years 2003-06 as reported in the OMB’s papers:
Table 1.1: Savings from Competitive Sourcing by the US Department of Defense, 2003-2006
Year FY2003 FY2004 FY2005 FY2006
Annualised Gross Savings
$158.76m $149.97m $36.46m $4.67m
Methodology: The data was provided by the agencies themselves and reported by OMB. Reported figures differ from report to report, but all years report figures for annualised gross savings.
Sources of benefits: The report for fiscal year 2005 had a breakdown of the sources of savings from DoD competitive sourcing, which fell into six broad categories: more efficient business processes (reduction in size of organisation and restructuring of workflow practices to adopt customary commercial practices), consolidation of warehouses to achieve more efficient use of resources, reduction in organisational size, better or more efficient use of technology (including increasing the use of remote assistance to bring IT assistance to multiple locations), creation of a shared services organisation and leveraging of contractors’ infrastructure and experience in supporting commercial customers.
NON A-76 COMPETITIONS
Depot Maintenance
1.28 John D. Keenan, Samuel D. Kleinman, Jonathan W. Leland, Carla E. Tighe and Micky Tripathi, ‘Issues Concerning Public and Private Provision of Depot Maintenance’, 199431
Description: The authors examined the options for keeping Navy depot repair work in-house or contracting to commercial suppliers, by analysing data on depot maintenance in FY1992, some delivered in-house and some by commercial suppliers, at a total cost of $7.5bn.
Competitive Edge: The Evidence
16
Findings: Competition with the private sector does save money, and frequently as much as 20-30%. In addition, initial cost savings persisted over time and few quality problems arose (when they did arise, better contract specification usually solved the problem).
Methodology: The analysis focused on a comparison of the costs of public and private sector delivery of depot repairs. The authors used data from the Navy’s public/private competition programme.
Critical analysis: As all depot scenarios were different, it was difficult to draw broad conclusions about the relative efficiency of in-house or contractor delivery. In addition, cost comparability was problematic because the two sectors used different accounting practices.
1.29 Christopher Reeger, ‘Outsourcing TA-4J Maintenance: Cost and Quality Experience’, 199732
Description: Reeger examined the financial impact of competition, outsourcing and privatisation, using as a case study the Navy’s experience of competing maintenance services for the TA-4J naval training aircraft. Since the service was opened to competition and up to the time of Reeger’s report, three successive contracts were let for delivery of the service to different contractors, in 1985, 1989 and 1993.
Findings: The study found that the government benefits from competition (and the associated cost visibility), regardless of whether the in-house or contractor team wins. No specific costs were quoted, but the author concluded that the contractors used far fewer resources to deliver the service, the equivalent of a 33% reduction in direct maintenance man-hours to deliver an equivalent flight-hour for the TA-4Js, which would result in obvious resource and cost savings. The study also found that over the long term contractors performed at least as well, if not better than the in-house teams in almost every case, delivering similar mission capable rates and better full mission capable rates than the Navy teams in fewer man-hours. At the beginning of the first contract however, performance declined, taking another two years to improve and four years to reach the previous mean levels. However, the decline only happened when the contract was first let from Navy to contractor, and was not repeated subsequently with a change of contractor, so it appeared that the decline somehow related to that first transition from in-house to contractor delivery.
Methodology: The author used statistical analysis to study a long series of Navy performance and cost data, for both in-house and contractor maintenance. In addition, the time series data covered three different contractors, making it possible to study the effect of changing contractors. To compare performance, he examined full mission capable rates (percentage of time the aircraft is fully ready), mission capable rates (percentage of time the aircraft can fly and complete a mission and direct maintenance man-hours per flight (the amount of maintenance completed for each flight-hour flown). Cost data was not broken down, instead the comparative resource requirement of in-house and contractor provision is assessed in terms of the number of direct maintenance man-hours required to deliver an equivalent flight-hour for the TA-4Js.
Sources of benefits: The private sector made more efficient use of resources in order to deliver the same service with less required direct maintenance man-hours. One possible explanation for this was that the incentives for private firms to cover costs probably encouraged contractors to make investments in the purchase of better machinery. By comparison, the Navy teams may have been content to operate with outdated equipment and facilities, as long as they could meet minimum requirements.
LOGCAP Contracts
A more recent form of contracting that has received a great deal of public attention due to its use in providing logistics support for deployed military forces in Iraq, Afghanistan and elsewhere in Southwest Asia, is the Logistics Civil Augmentation Program (LOGCAP). The LOGCAP contracts are structured as a permanent retainer, with the contractor on call at all times to provide logistics support as and when required by the Army throughout peacetime and in the wartime theatre. While the LOGCAP contracts have been much scrutinised, we are aware of only one published report that provides an in-depth cost analysis of the arrangement, which is summarised below.
Competitive Edge: The Evidence
17
1.30 Congressional Budget Office, ‘Logistics Support for Deployed Military Forces’, 200533
Description: The Congressional Budget Office examined the US Army LOGCAP contract for the provision of logistics support to deployed military personnel and assessed the relative cost over a 20-year period of using the contract, compared to the cost of the Army providing the same services.
Findings: The study quoted the CBO’s own estimates that the total projected cost for the contract over the 20-year period would be $37bn less than the cost for Army units delivering the same services ($41bn as opposed to $78bn, or roughly 47% lower). However, it went on to question some of the CBO’s assumptions in arriving at those figures. Changes to these assumptions could affect the estimated savings rates significantly.
Methodology: A 20-year projection was used to determine the cost implications of approaches that used different contractor-Army ratios, and to assess relative costs under various wartime and peacetime scenarios. This projection was possible because there were very few ongoing transaction costs associated with the contract, due to the way that it was structured, with the contractor held on a retainer (which reduces uncertainty in the calculations). However, no final conclusions were drawn about the relative costs of the various Army or LOGCAP approaches.
Sources of benefits: The report did not specifically discuss the sources of the cost differences, but on testing the various alternative scenarios, it emerged that personnel mix had a big impact on cost. The CBO also reported that there were non-financial benefits associated with the LOGCAP approach. One of the key advantages of the model was the flexibility that it offered – the CBO noted that the contractor could deploy to a wartime theatre more quickly than would have been possible for Army Guard and Reserve units. In addition, personnel flexibilities would be available under the contract model that would not exist within Army units. On the other hand, it was suggested that the contract model might also impose its own inflexibilities.

Competitive Edge: The Evidence
18
B. UK
SUPPORT SERVICES
Competition and contracting are not new in the UK defence sector. However, from 1979 onwards, there was more emphasis in the Ministry of Defence (MOD) on contracting-out support services as a route to potential efficiency savings. In 1983, the Department introduced a competition policy under which support functions were contracted-out on the basis of cost and operational criteria. A number of academic studies have reviewed evidence on the broad MOD experience of contracting out.
1.31 Keith Hartley, ‘Defence’, 199334
Description: Hartley examined the nature and achievements of MOD contracting throughout the 1980s and up until 1991, looking at where and how contracting had been applied, and its achievements in terms of efficiency benefits.
Findings: The report quoted various Departmental figures on savings from competition in defence support. 1984 MOD estimates suggested that average savings of over 30% were expected following the introduction of competition in the supply of defence equipment, including support, supply and maintenance services. Figures from 1989 suggested that even when work remained in-house savings of 20-30% were achieved from market testing. Hartley also referred to specific reported results from one of the first examples of contracting out in the 1980s, where cleaning contracts for military hospitals delivered savings of some 40%, providing the impetus for extending contracting out to NHS hospitals. The author concluded that, as contracting had affected only a small element of the defence budget, there were considerable opportunities to increase savings if the existing initiatives were applied more widely.
Methodology: The author reviewed MOD estimates and reported achievements, but does not test them further.
Sources of benefits: The benefits were achieved through manpower economies derived through efficiency improvements, curtailing or abandoning functions, privatisation and contracting out. The author noted that until about 1986 much of the emphasis in contracting-out was on manpower efficiencies, after which value-for-money came to the fore.
1.32 Matthew Uttley, ‘Contracting-Out and Market-Testing in the UK Defence Sector: Theory, Evidence and Issues’, 199335
Description: Uttley reviewed the economic consequences of MOD contracting and market testing initiatives between 1979 and the time of writing in 1993.
Findings: The author found that MOD cost reductions from the initiatives were comparable with those obtained throughout the public sector, citing the savings levels of 20-25% put forward by a number of the 1980s studies covered in the health, local government and refuse collection sections of this report.
Methodology: A review of MOD data and the findings of a number of academic and departmental/governmental reports.
Sources of benefits: Cost savings appeared to stem from both improvements in technical efficiency and changes in employment practices and patterns.
1.33 Matthew Uttley, ‘Competition in the provision of Defence Support Services: the UK Experience’, 199336
Description: This study reviewed the UK experience of competition in defence support services up to the time of writing, including a full discussion of the contracting-out and market testing debate.

Competitive Edge: The Evidence
19
Findings: The article referenced the same government figures used by Hartley (1993), from the 1989 Statement of Defence Estimates, which suggested that market testing had delivered savings of 20-30%. It also examined figures reported by the NAO (1992) which suggested that savings for mandatory activities (those for which market-testing was compulsory) and non-mandatory activities differed, with non-mandatory yielding comparatively higher savings (they accounted for only a fifth of all market tests but over 50% of savings). Variations also occurred by function, with the highest for ‘other non-mandatory’ (44.5%) and ‘Engineering and supply’ (41.7%), and the lowest for ‘tank cleaning lighters’ (7.9%). The number of in-house wins from market tested activities was proportionately lower than in other government sectors, leading the author to conclude that the threat of competition did not seem to have improved in-house tenders. Ultimately, limitations in the available data about the costs associated with the tender process led Uttley to conclude that whilst market testing appeared to have delivered net savings, without this information it was difficult to make a precise financial assessment.
Methodology: Published MOD figures were examined, as well as data from the NAO’s 1992 report on the defence market-testing programme. To extract more information, the author also surveyed 23 MOD top-level budget holders with questions about activities contracted-out and market tested in fiscal years 1991-92. Ten responses were received, five of which were from ‘support’ categories and the other five from ‘other MOD’ categories. Due to limitations on the available MOD data, Uttley also looked at the findings of studies on competition and contracting in local government, whilst acknowledging that those were not strictly comparable.
Sources of benefits: Survey respondents identified the primary source of savings as reduced labour costs resulting from the substitution of in-house military and civilian manpower with cheaper contract personnel.
Critical analysis: Uttley noted that to assess the net financial effects of market testing tendering costs should be subtracted from gross savings. He reported that questionnaire respondents were ‘unable or unwilling’ to estimate administrative expenses because of existing accounting procedures which meant that different elements of the contracting process fell under different budget headings. Data on the costs to MOD of monitoring in-house teams under pre-tendering arrangements were also unavailable.
1.34 Michael Hynes, ‘A Casebook Of Alternative Governance Structures And Organizational Forms’, 200037
Description: In discussing ‘Competitive Sourcing’, the author included case studies of five US Air Force A-76 competitions as well as two case studies from the UK, including one of the British Army Logistics Information Systems Agency (LISA) contract, a five-year arrangement with EDS to provide a complete range of IT services. (The other British case study was of a non-defence sector activity.)
Findings: The case study found that the partnership had resulted in $30m of documented savings, with further savings expected from planned improvements. There had been no drop in service standards as a result of EDS taking over the strategic logistics system, and some improvements and innovations delivered.
Methodology: There was no original analysis – most data had been provided by EDS.
‘Competing for Quality’
Following the publication in 1991 of the ‘Competing for Quality’ White Paper, which sought to increase the extent of private sector involvement in the provision of public services, a number of studies were produced that looked at the MOD experience, being the largest proposed market testing programme in Whitehall.
1.35 NAO, ‘Ministry of Defence: Competition in the Provision of Support Services’, 199238
Description: In 1992, the NAO reported on the MOD’s experience of market testing support services since 1979. The report was released following the publication in 1991 of the ‘Competing for Quality’ White Paper, which set out to expand the use of the private sector to deliver public services.
Competitive Edge: The Evidence
20
Findings: The Department had estimated cumulative savings of some £64m a year between 1979 and 1991-92, and the estimated savings on activities market tested since 1987 totalled 24%, roughly in line with the 25% reported by other government departments.
Methodology: NAO reported on MOD’s own estimated savings figures and analysed six specific sites where market testing had been carried out.
Critical analysis: A full validation of the cost comparisons that had taken place at the 6 sites could not be completed, because no records of the investment appraisal had been kept. MOD’s overall savings estimates could not be confirmed because they were based on average annual savings when contracts were first let, and did not take into account the costs of subsequent amendments or re-lets. In addition, it was felt that errors and omissions in the investment appraisal process and in the recording of savings were indicative of further possible inaccuracy in the Department’s figures. (Estimated savings in 4 of the cases had been overstated by £1.6m, equivalent to 40%.)
An internal audit of contract cleaning found that there were instances of substantial price increases on re-letting, however, the Department pointed out that in other cases keener prices were being obtained at re-let.
1.36 House of Commons Committee of Public Accounts, ‘Ministry of Defence: Competition in the Provision of Support Services’, 199339
Description: The PAC issued a report in 1993 in follow-up to the 1992 NAO study of competition in the provision of MOD support services.
Findings: MOD had estimated cumulative savings of around £68 million (a slightly larger figure from that quoted by the NAO in its 1992 report, due to the longer time span covered by this report) from competition for support services between 1979 and the time of the report in 1993.
Methodology: The PAC’s report again referred to the MOD’s own estimated savings figures at the time of writing, which differ slightly from the figures reported in the earlier 1992 NAO report because more competitions had taken place in the interim period. The PAC also noted the NAO’s finding that savings estimates had been overstated in 4 of the cases that it examined.
Sources of benefits: The estimated savings figure of £68m derived from the saving of about 18,000 posts during the period since 1979.
Critical Analysis: The PAC reported that the estimated savings could have been over- or understated: the figure was based on average annual savings at the time when the contracts were first let, and many were subsequently re-let at different prices. Furthermore, it was not a requirement to include one-off redundancy costs in the calculation of savings, and other associated costs such as contractual monitoring and staffing/management costs had not been calculated.
1.37 House of Commons Defence Committee, ‘Market Testing and Contracting out of Defence Support Functions’, 199540
Description: In 1995, the Defence Committee reviewed the MOD’s progress against the ‘Competing for Quality’ Initiative. The Department aimed to market test activities with a value of £1.2bn in the four years from April 1992, the biggest such programme in Whitehall.
Of £831m worth of activities initially examined by MOD, activities worth £486m (comprising 63 activities) proceeded to market testing. Twenty-three of these competitions (worth £77m) included an in-house bid, of which 13 were awarded to a commercial contractor and ten to the in-house team. The remaining 36 activities (worth £339m), which were examined but not subsequently market tested, were instead subject to ‘internal efficiency measures’.
Competitive Edge: The Evidence
21
Findings: Between April 1992 and March 1995, MOD examined activities with annual operating costs of £831m, which resulted in anticipated annual savings of £157m. After a review of available information, the Defence Committee revised the figure down to the nevertheless substantial figure of £57m from activities worth £211m. The revision took into account a number of activities that should not have been included in the total, either because they were not exposed to competition, or because they were competed under a separate initiative.
Methodology: The Defence Committee reviewed figures presented by the Department to form its conclusions. The Committee found that the MOD’s total projected savings figure of £157m included a number of elements that should not have been counted as part of the programme. This included the 36 activities that were not exposed to competition. In addition, the £486m worth of activities that proceeded to market testing included the contractorisation of the Atomic Weapons Establishment, which arose from separate proposals, and which had a value of £257m. This left activities worth £211m, from which the final figure of £57m in anticipated savings was extracted.
1.38 Matthew Uttley, ‘The Management of UK Defence’, 200141
Description: Uttley discussed the management of UK defence, covering both the post-war trend towards integration of the armed forces and the rise of ‘managerialism’ throughout the 1980s and 90s, including the introduction of market-based reforms.
Findings: Drawing on government data, the author reported that following market testing, contracts won by the private sector provided reductions in operating costs of 20% for the MOD. Government statistics suggested that competitions won by in-house teams and other internal efficiencies delivered savings of around 27%. However, he also argued that the absence of systematic data on the financial impact of the reform process posed a problem for defence policy analysts.
Methodology: The study accessed and reported governmental data.
Sources of benefits: The managerial reforms were expected to deliver savings derived from manpower economies, increased financial delegation, cost awareness and flexibility. However, the paper did not analyse the extent to which these predictions were reflected in practice.
THE PRIVATE FINANCE INITIATIVE
A number of studies have been carried out to examine the value for money of defence sector projects procured under the UK government’s Private Finance Initiative (PFI). The figures quoted in such studies are usually based on a public sector comparator (PSC) – a comparison between the price of the contract when let and the estimated cost of delivering equivalent outcomes if a traditional procurement method was used. In some of the studies below a detailed breakdown of the PSC calculation is included, whilst others feature only the headline figures.
Whilst the value of the PSC as a point of comparison is limited, being based on estimates, often this is the only option for testing the cost of such projects, which (certainly in the defence sector) are usually one-off transactions.
1.39 HM Treasury Taskforce, ‘Medium Support Helicopter Aircrew Training Facility: PFI Case Study’, 199842
Description: A 1998 Treasury Taskforce case study examined the PFI contract for the provision of aircrew training for the RAF Support Helicopter force. The project was felt to offer valuable lessons, being the first PFI contract involving defence-specific assets that had been awarded by the Defence Procurement Agency (DPA). The case study was prepared by the MOD Medium Support Aircrew Training Facility project team and its advisers.
Findings: The resulting report concluded that the costs to the MOD of the PFI project, in net present value terms and using a 6% discount rate (based on Treasury guidance) over the 20-year contract term was 15-20% lower than the PSC. Few details were given in the report about the specific methods of calculation used to establish the benchmark, but there was some discussion about this and the data used in the analysis.

Competitive Edge: The Evidence
22
Methodology: A PSC was used as a benchmark against particular bids and as part of the project appraisal process. The traditional method of procurement for defence equipment of this nature would have been to purchase and run the facility as a GOCO (Government Owned, Contractor Operated), therefore the PSC was constructed along GOCO lines. Thus the financial benefits of competing support services had already been taken into account.
The PSC included values attached to key transferred risks, the most significant being construction overruns and performance failures. Risks relating to variations in operating and maintenance costs, and staff salaries over time were also evaluated, but were found to have little overall impact. A sensitivity analysis was carried out to test the key assumptions in the PSC.
Sources of benefits: A key feature of the arrangement with the contractor was the ability to generate third party revenue from the equipment at the facility. The contractor assumed a significant level of third party usage, thus reducing the price to be paid by the MOD. Revenue from third party utilisation was also shared with the MOD.
Critical analysis: It was noted that because the project involved the development of a new facility, many assumptions had to be made as to the likely construction and running costs of a conventionally procured facility. The assumption was that the Department would follow its normal current practice for conventional procurements in the field.
1.40 NAO, ‘The Private Finance Initiative: The Procurement of Non-Combat Vehicles for the Royal Air Force’, 199943
Description: In 1999, the NAO carried out a value for money study of the PFI project for the supply of non-combat vehicles for the Royal Air Force. The contract was notable as one of the first fleet management contracts procured by the MOD through the PFI route and included five years of fleet management, including full maintenance accident repair and replacement of vehicles.
Findings: The MOD’s advance investment appraisal (value for money assessment) of the deal compared the proposed cost of the PFI option with that of continuing with in-house provision, concluding that the PFI route offered an estimated saving of £5.8 million over the life of the contract. The £5.8m figure represented the net present value of the savings at that time, allowing for the residual value of the MOD’s fleet at the end of the period in the public sector alternative (NPV £11m).1
The NAO did not disagree with the MOD’s estimates that the PFI route offered better value for money than the PSC, however, it did refer to a number of technical reservations about the Department’s evaluation methodology. Specifically: the use of a five-year appraisal period, rather than ten years, as recommended by the Treasury; the fact that the residual value of the fleet was calculated by estimating the disposal value at the end of the contract period, rather than the residual value in use to the Royal Air Force; and MOD’s assumption that there would be insufficient capital fully to replace the vehicles during the period. The NAO also expressed doubts about the figures for maintenance and operational costs used in the public sector comparator, which they suggested were possibly over-stated through assuming higher maintenance standards than the contractor was required to provide, possibly inaccurate due to unreliable data about MOD’s actual costs, and possibly inconsistent with the assumed size of the fleet.
Methodology: NAO analysed and critiqued data produced by the MOD in its project evaluation. The MOD had used a baseline PSC, based on an alternative scenario where the military continued to own and manage the RAF non-combat vehicle fleet. MOD drew benchmark data from in-house experience of delivering the service.
* The NAO noted in its report that although the MOD announcement of the award of the contract in 1996 stated that the Department expected some £17m in savings from the contract over 5 years, that figure had been calculated in cash terms, whereas it is standard practice to quote figures in terms of net present value – the figure of £5.8m used in the MOD’s value for money assessment.
Competitive Edge: The Evidence
23
Sources of Benefits: The MOD further reported to the NAO that the contract was performing well and that the deal had brought some additional benefits: some efficiency improvements had been made; the contractor was building up a database of information that might help improve service delivery in the future; the contractor was also providing many new vehicles, which exceeded contractual requirements as it increased the resale value of the vehicles, as well as improving the quality and reliability of the service.
1.41 NAO, ‘The Private Finance Initiative: The Contract for the Defence Fixed Telecommunications System’, 2004
Description: In 2000, the NAO analysed the MOD PFI contract for the provision of a Defence Fixed Communications System for the Department and the three Armed Services, which was let as a ten-year contract in July 1997.
Findings: The MOD had estimated cost reductions from the deal of around £30m (20%) against a public sector comparator. The NAO was unable to test this figure fully, since the ten-year project had another 5 years to run. However, following a detailed analysis of the bid evaluation criteria, and several cost factors not included in the original estimate, the study concluded that the Department had secured the contracted services at a ‘generally reasonable’ price: the MOD were paying around the same price for two high security services as before the contract, despite the use of cheaper civilian staff to deliver the services; however, the contractor (BT) had taken responsibility for the maintenance risks and the replacement of obsolescent equipment.
Methodology: The MOD’s PSC calculation included amalgamated savings from the contract and from cost reductions that the Department had already made prior to contracting. The NAO pointed out that in order to demonstrate whether the price paid was value for money, the MOD should have quantified the value of transferring to the contractor the risk associated with maintenance and replacing obsolescent equipment. NAO’s analysis built in several additional costs, including: cost increases post contract award (largely relating to the provision of additional services); cost reductions resulting from the contractor agreeing to advance the date of project commencement, resulting in a saving of direct costs that the Department would otherwise have borne; savings from the Department’s other cost reduction activities; and additional savings resulting from MOD’s negotiations with the contractor during the preferred bidder stage.
1.42 House of Commons Public Accounts Committee, ‘The Private Finance Initiative: The Contract for the Defence Fixed Telecommunications System’, 200045
Description: Following from the NAO’s report, the Public Accounts Committee examined evidence from the MOD and BT, and published its findings.
Findings: The PAC’s report concluded that the Department had maintained an effective competition and obtained a good price for the final contract. The PAC reported that, using a 6% discount rate (to calculate the present value of all PFI capital payments over the full contract period, the Treasury advised that a 6% discount rate should be applied to the total), MOD had expected savings of £44m over ten years compared with Departmental budget provision. The estimated savings levels of the total PFI cost compared with the PSC broadly held if different discount rates were applied to the PFI option (ranging from £38m using an 8% discount and £51m using a 4% discount rate).
Methodology: The PAC examined the MOD’s PSC data, and further tested the estimated savings levels using different discount rates. The PAC also examined specific aspects of the contractual terms, as well as issues such as price changes during negotiations and the risk of prices falling out of line with market prices during the 10-year contract period (the Department described some of the arrangements available to help prevent that).
1.43 NAO, ‘Ministry of Defence: The Joint Services Command and Staff College’, 200246
Description: The NAO’s analysis of the PFI contract for the Joint Services Command and Staff College, which was awarded in June 1998 for a 30-year period.
Competitive Edge: The Evidence
24
Findings: The study concluded that the deal was ‘good value for money’. Before signing the contract, the MOD had calculated the bid price of £200m to be £23m (around 10%) cheaper than the public sector capital option. The NAO found no significant errors in those calculations. In addition to the £23m projected saving, the MOD added £26m to the PSC option to reflect risks transferred to the contractor under the PFI, which would have been retained by the Department under the PSC option. At 13% of the PSC base cost, NAO found that this risk allowance was at the low end of the scale (between 10-40%) for similar accommodation projects.
Methodology: The MOD used a PSC to compare the various options. The NAO assessed MOD’s calculations, then further tested the outcome by using a hypothetical PSC that took into account delays that occurred when the due date for completion of the facility was moved back following the decision to switch to the PFI option, and again following delays in negotiating the deal.
When comparing the predicted costs of the PSC and PFI options, the MOD correctly did not include costs already incurred in establishing interim facilities. However, NAO further tested the cost implications of the PFI approach by comparing the cost of the signed PFI deal with a hypothetical public sector capital option that met the original start date proposed for the new facility. In this calculation, the cost of interim facilities was included – for the PFI option, the cost of interim facilities used until the completion of the new building at the agreed due date, and for the PSC option, the cost of temporary accommodation that would have been required to house the Army Staff College had the on-site redevelopment proposed as the preferred PSC option been adopted. On the basis of this analysis, NAO concluded that it was ‘still likely’ that the PFI route offered the best value for money.
Sources of benefits: In addition to its findings on the value for money component of the deal, the NAO also commented on the non-financial benefits of the PFI option. The solution proposed by the contractor met the project requirements more effectively than either one of the two solutions proffered under the PSC option; moreover, one of those solutions offered greater risk retention by the Department, whilst the other would have been more expensive and difficult to implement, and offered fewer operational benefits. In addition, the PFI option was affordable, whereas the Department would have found it more difficult to meet the upfront capital needs of the PSC option. Construction risks were effectively transferred under the PFI model, with the result that extra costs incurred as a result of unforeseen problems at the construction site were borne by the private sector, and not passed on to the MOD (there was no hard data available on these extra costs in the public domain, but press speculation suggested that the construction contractor sustained losses of up to £20m). The problems at the site were resolved so that the facilities were still ready on the due date. The building subsequently won a number of construction awards and at the time of its report, the NAO reported that feedback from students on the site had been positive.
1.44 NAO, ‘Ministry of Defence: Redevelopment of the MOD Main Building’, 200247
Description: The NAO’s analysis of the redevelopment project for the MOD Main Building. The PFI contract was let in May 2000 for a 30-year period.
Findings: The study concluded that the financial benefits of the deal would be similar to that of conventional procurement, but that other factors (in particular, risk transfer) tipped the balance in favour of PFI.
Methodology: A comparison was made between the cost of the PFI deal as contracted and the likely cost estimate for a conventional procurement alternative (a public sector comparator): the PFI route contracted at £746.1m, whilst MOD’s estimate of the average expected cost of a conventionally procured project was £746.2m within a range of £690m to £807m. The NAO concluded that, given the uncertainty of the latter figures, MOD’s conclusion that the PFI deal would cost a similar amount to a conventional procurement was appropriate.
Sources of benefits: Although the comparison with the PSC suggested a decline in savings from the £25m projected at the point when the contractor was awarded preferred bidder status, an examination of the other important comparative factors suggests that the PFI option offered other benefits which also had potential cost implications. The risk transfer arrangement incentivised the contractor to complete the project on time, saving on potential overrun costs which would have been borne by the public sector under a conventional procurement – if the building could not be occupied on the agreed date, the contractor would lose £1m in revenue per calendar

Competitive Edge: The Evidence
25
month and would be responsible for the meeting the costs of housing staff in alternative accommodation; and the MOD would not be required to pay the contractor for accommodation that did not meet the specified availability standards. Over the longer term, the facilities management fee was also at risk if service standards fell below requirements.
1.45 NAO, ‘Ministry of Defence – Building an Air Manoeuvre Capability: The Introduction of the Apache Helicopter’, 200248
Description: The NAO’s report on the introduction of the Apache Helicopter, which includes some analysis of the separate PFI contract to provide training services. The training services contract was let in July 1998, after a late decision to select a PFI route on grounds of affordability.
Findings: Measurement against a PSC suggested estimated savings from the PFI proposal of £23m in net present value terms over 20 years.
Methodology: The value for money of the deal was tested against a Public Sector Comparator based on a fixed-price procurement of the equipment from Westland and delivery of training services over a 20-year period. No details of the methodology used to calculate the PSC were included.
1.46 NAO, ‘Ministry of Defence: Major Projects Report’, 200249
Description: The NAO briefly dealt with Skynet 5 in its on the Ministry of Defence, published in December 2002.
Findings: The NAO concluded that innovation and the use of PFI had resulted in a 6% saving worth £80 million (net present value) against the public sector comparator.
Methodology: No details of how the PSC was calculated were included.

Competitive Edge: The Evidence
26
C. AUSTRALIA
THE COMMERCIAL SUPPORT PROGRAM
The Commercial Support Program (CSP) was introduced by the Department of Defence in 1991, following proposals that a range of support services could be performed more efficiently and cost effectively by contracting them to make better use of civilian infrastructure and national resources.50 It had been estimated that the Department could save A$396m per annum through effective implementation of a programme of market testing of support services. An interdepartmental committee set up to review the report revised this estimate down to A$350m per annum.
Under the CSP, external suppliers were invited to compete against in-house teams to supply the services included in the programme (in-house tenders were a mandatory element of the programme). Services were transferred to the civil sector when it was considered operationally feasible, practicable and better value for money than an in-house solution.
1.47 Ernst & Young Consulting, ‘Report to the Department of Defence: A Review of the Commercial Support Program and its Performance’, 199351
Description: The Department of Defence commissioned Ernst and Young Consulting to undertake a review of the CSP, to determine to what extent the program was meeting its central aim and objectives of ensuring that Defence support services were provided in the most cost-effective manner and transferring appropriate activities to the civilian sector.
Findings: Ernst & Young concluded that estimated savings from a sample of 23 activities market-tested under the CSP amounted to A$42m per annum, or A$38m per annum after taking into account annualised transition costs. 15 of the contracts went to external suppliers and eight to in-house teams. Overall savings (net of annualised transition costs) averaged around 30%. Overall transition costs averaged 13.2% of the final contract value, although considerable variation was evident. Ernst & Young concluded that these costs were relatively small in the context. The reviewers also examined recurrent annual savings as a percentage of baseline cost estimates, finding marked variations within and between functions (from 16-70%).
Methodology: The authors evaluated data provided by the Department from the Decision Briefs used in testing the 23 activities, comparing contract costs with baseline cost estimates for delivering the service in-house. The authors took into account transition costs (‘up front’ capital payments required to undertake the cost comparison exercise – the nature of these was not defined in the report) to arrive at the net savings figures.
Sources of benefits: Use of non-military personnel accounted for a significant proportion of the savings (civilians were reported to be 20-25% cheaper once specific military overheads were taken into account). Improvements in work practices, organisation and productivity were also mentioned. Ernst & Young concluded that the CSP process had helped stimulate a more disciplined approach and encouraged thinking about more efficient ways of delivering core activities, and that in some cases, best practice lessons from efficiencies prompted by CSP competitions were being transferred to other locations. An unintended consequence of the programme was the way in which the in-house teams had responded to external competition to put forward efficient solutions.
Critical analysis: Ernst & Young reported that in the evaluation stage, assessing different bids, ‘savings’ were estimated as ‘the difference between the estimated baseline cost and the quoted contract price (which is the most reliable estimate) or the estimated cost of the PIHO’ (preferred in-house option). If the baseline cost was reasonably accurate, that gave a reasonable gross figure, but the authors noted that baseline cost could only be as accurate as the physical inputs identified and as the average costings were good proxies for the resources used. To arrive at a net savings figure it was necessary to include transition costs. Ernst & Young suggested that the Department needed to improve its financial and tracking systems to better identify costings and savings from the CSP.

Competitive Edge: The Evidence
27
1.48 Allan Shephard, ‘The Defence Commercial Support Program: Saving $200 Million a Year for Defence Procurement?’, 199352
Description: Shephard studied projected cost savings from Commercial Support Program competitions published by the Department of Defence in 1993 for Tier One of the initiative.
Findings: The Department’s figures (reported by Shephard) for the level of projected long-run recurring savings from Tier One of the CSP were revised twice, between August and October 1993, from A$30.5m in August, to A$40.5m and subsequently to A$43.4m in October. The CSP Office reported in its August 1993 update that the costs of awarded contracts were 14% to almost 70% cheaper than when those functions were previously supplied by the Department of Defence (the CSP was introduced in 1991), with a median saving of more than 30%. The Office expected the full extent of the savings to emerge after initial transition costs of around A$50m had been met. Projected combined savings for Tier One & those contracts let so far under Tier Two were A$79m, an annual saving of 32%.
Methodology: Shephard accessed reports, speeches articles and the Department’s figures, but his report dealt largely with non-financial impacts of the CSP. Departmental figures referred to contract cost versus the public sector in-house benchmark. The Department intended to build in transaction costs incurred during the cost comparison process in their calculation of the final savings levels. However, it is not clear whether those costs were already included in the projected savings figures reported by Shephard.
Sources of benefits: The author referred to a report by the interdepartmental committee established to test the proposals for market-testing, which had predicted that many of the savings from the CSP would come from the use of civilian personnel, at 20-25% cheaper than military personnel. Shephard noted that this estimate appeared to be accurate and was supported by UK and US experience.
Critical analysis: Data on the savings produced by individual CSP contracts were not made available, making it difficult to verify the accuracy of Defence’s savings projections. The author also referred to a report made to the Senate Estimates Committee (it is not clear by whom) claiming that only 400 civilian staff had been affected by the CSP decisions as at the end of August 1993, significantly less than the number necessary to have produced savings of more than A$30m. However, he added that additional and substantial CSP savings were bound to issue from improved work practices introduced by contractors and from reductions in support facilities needed for uniformed personnel.
1.49 Industry Commission, ‘Defence Procurement’, 199453
Description: A study by the Industry Commission, a research institution established and funded by the national government, examined the efficiency and effectiveness of Defence Procurement. One chapter was dedicated to the achievements of the Commercial Support Program and an appendix contained a breakdown of CSP outcomes from individual projects, as at August 1994.
Findings: The Department of Defence had projected savings of A$87m per annum across 51 CSP evaluation decisions (equivalent to 31% as a percentage of current costs). The Industry Commission found that the reported figures compared favourably with expectations and with experience elsewhere, citing an analysis by the Australian Electrical and Electronic Manufacturers’ Association (AEEMA) which reported that overseas studies had demonstrated savings of approximately 20-25%.
However, the Commission went on to say that the Department’s figures for the CSP did not take into account transaction costs incurred by the administration of the programme, such as the cost of CSP policy and management, and the cost of preparing in-house bids.
The Commission also looked at a number of case studies, including a contract for the Army Training Area at Puckapunyal in Victoria, where recurring annual savings of A$1.3m (7%) would first have to be applied to cover transition costs of A$6.3m.

Competitive Edge: The Evidence
28
1.50 Commonwealth Department of Finance, ‘Case Study: Defence’s Commercial Support Program (CSP), Examining Contestability Within the APS: Initial Information - Concepts, Case Studies and Lessons Learned’, 199554
Description: The Commonwealth Department of Finance examined the results of the CSP from inception in 1991 to the date of publication in November 1995, in terms of efficiency gains, as part of a wider study of contestability in the Australian Public Service.
Findings: The report referenced the projected annual savings from the beginning of the CSP initiative to the time of writing in 1995: approximately A$102m across the program. The total estimated value of commercial contracts and in-house directives (the equivalent arrangement when the in-house tender wins under the CSP process) was cited as A$776m.
Methodology: The report drew on data from interviews with departmental representatives, as well as a paper by Michael McNamara, which he had presented at a conference in 1994. The author(s) did not provide further analysis of the cost changes, and it is not made clear whether the quoted savings figures take transaction costs into account.
Sources of benefits: Defence personnel were quoted as saying that ‘the competitive environment from the CSP ha[d] clarified program outcomes and encouraged the program managers to work smarter’. One senior manager said ‘What the CSP program has done is greatly clarified the work that people are expected to do… perhaps in the past staff and managers haven’t understood the notion of outcomes and how best to manage their resources’.
1.51 Michael McNamara, ‘The Commercial Support Program in the Department of Defence’, 199555
Description: McNamara’s paper examined the implementation of the CSP from its inception to the time of writing in November 1995. Including the contribution of the programme to more efficient and effective management in Defence.
Findings: The author reported that the Department’s projected recurring annual savings from the CSP as at July 1995 were A$102m, equivalent to 33% mean annual savings as a percentage of current costs. He further reported savings relating to individual services ranging from 10% to almost 70%, a finding which compared favourably with Defence’s original Tier One projection for the CSP of 20% long-run annual recurring savings. The Department also quoted the same figures in its submission to the Industry Commission Inquiry into contracting out,56 and the figures were also reported in the Commonwealth Department of Finance paper.57
Methodology: Defence estimates, based on projections from the results of completed CSP cost comparison exercises, where ‘savings’ referred to the cost differential between baseline cost and contract price. It is not clear whether any transaction costs were taken into account.
Sources of benefits: Whilst the figures quoted are necessarily consistent with other papers featured here that draw on original Department of Defence data, McNamara’s paper did add some additional insights on the CSP. Firstly, functions competed under the CSP were let on an outcome-based model, with a focus on performance and deliberate room for flexibility of solution, with the purpose of freeing suppliers (in-house or external) to consider innovative ways to deliver a more efficient, effective service. Secondly, we can draw some reassurance that performance was largely held as a constant or improved in CSP competitions, as significant emphasis was placed on performance – the Statement of Requirement issued to tenders was expected to include performance targets, constraints, production, management and product quality standards and flexibility considerations.

Competitive Edge: The Evidence
29
1.52 Industry Commission, ‘Cost Case Study – Amberly RAAF Base’, 199658
Description: This case study appeared as an appendix to a cross-sectoral Industry Commission study of competitive tendering and contracting (CTC) by public sector agencies. The case study examined the change in cost to the Royal Australian Air Force and the Department of Defence resulting from the contracting out of several aircraft maintenance and repair services at RAAF Base Amberly as part of the CSP, and the sources of any changes.
Findings: The Commission estimated that cost savings of nearly A$8m per annum (around 38%) were achieved, before taking into account an increase in the scale of work carried out and a probable rise in the level of performance.
Methodology: The Commission estimated that gross annual savings of A$9.5m would derive from efficiencies relating to staffing, productivity and the ratio of military to civilian staff. This figure was adjusted in the analysis to a final total of A$8m, to take into account transaction costs of A$1.5m associated with the competitive tendering of some of the services included in the study.
Sources of benefits: The vast majority of the savings were attributed to reduced staffing and related costs, derived from productivity improvements and a decrease in the ratio of military to civilian staff.
At the time of the study, a number of skilled personnel had accepted redundancy packages during a period of uncertainty prior to the contract award, which had had some impact on capabilities, although Defence considered that this would rectify over time. The capacity of the streamlined service to manage unexpected workload surges remained to be tested, however, the RAAF considered that workloads already experienced had been equal to any likely peak.
1.53 Department of Defence, ‘Submission to the Industry Commission Inquiry into Contracting Out’, 199659
Description: The Department’s submission to the 1996 Industry Commission inquiry into the nature, scope and extent of contracting out included a section on the cost impact of the CSP from its 1991 inception to the time of the Commission inquiry in1995.
Findings: The Department of Defence reported that contracting out decisions under the CSP had realised estimated mature annual savings in 1995 of around A$52m, representing average savings of around 36% compared with previously incurred costs. When efficiencies from contracted out services were combined with the efficiencies generated through competition with industry in services retained by in-house teams, the level of savings increased to around A$102m (equivalent to approximately 33% of previous costs).
Methodology: The reported figures derived from the detailed cost comparisons and savings data that were maintained for the CSP, which were based on previous costs on delivery versus contract price.
Sources of benefits: A higher level of savings accrued under performance-based contracting, as compared with more prescriptive forms of contract specification; where there was scope for innovation in the Statement of Requirement; where there was a high level of competition; and where the scoping of functions to be tested included an aggregation of activities. Savings were also attributed to workforce management: it was cheaper to employ civilian personnel than military staff, and the employment by contractors of part time and casual staff for peak workload periods generally helped to reduce costs; it was reported that commercial contractors often provided greater flexibility in the way that an output was achieved through multi-skilling. Better organisational management was another source of cost reductions (both more efficient ways of working and more effective organisational structures).
The Department also reported that in addition to cost savings there were wider gains from the CSP process, including an organisational culture that was less constrained by traditional work practices, more resource conscious and more open to innovation.
Competitive Edge: The Evidence
30
1.54 Australian National Audit Office, ‘Commercial Support Program –Department of Defence’, 199860
Description: In a 1998 study, the ANAO examined the overall success of CSP. At the time of the study, 94 activities had been market tested under CSP, with a total value of A$1.5bn.
Findings: The ANAO reported that the Department’s own estimates of the programme were projected annual savings to date at A$155m. The limitations of such estimates were noted, but the Audit Office nevertheless concluded that, whether the winning bid came from an in-house or an external supplier, the competition process under the CSP increased the cost-effectiveness of supplying Defence support services – in all cases examined, the activities concerned were being delivered at a lower comparative cost. However, the ANAO found exact savings hard to quantify, because of difficulties in tracking before and after costs and changes in task allocations.
One of the explicit objectives of the CSP had been to increase private sector participation in defence support. The ANAO study noted that 70% of all CSP competitions were won by the private sector, compared to 50% of similar US programmes and 30% in the UK.
Methodology: The ANAO analysed a number of specific cases to test the success of the CSP in meeting its core objectives of achieving value for money in the provision of defence support services and increasing private sector involvement in the field. The overall figures published in the report were the Department’s. Those reported savings were an accumulation of the savings that were estimated at the time of finalising each CSP activity. They were for the most part based on comparisons between the estimated baseline costs for the activities examined, and the quoted contract price of the most effective bid. It can be assumed that Defence’s figure, released shortly prior to the ANAO’s report, covered estimated savings from CSP competitions between 1991 and the first half of 1998.
Competitive Edge: The Evidence
31
D. NEW ZEALAND
1.55 Simon Domberger, Paul H. Jensen and Robin E. Stonecash, ‘Examining the Magnitude and Sources of Cost Savings Associated with Outsourcing’, 200261
Description: Working on the basis that earlier empirical work indicated average cost reductions for government from outsourcing of around 20% per year, Domberger, Jensen and Stonecash tested the claim by examining the case of Trentham, New Zealand’s largest army base, where the Army outsourced maintenance and warehousing services in 1997, following a competition process. They used detailed data from this case to examine whether cost savings existed if all transition and transaction costs associated with the outsourcing exercise were taken into account, and if so, what were the sources of those savings. Therefore, the comparison was the cost to government of delivering the service in house versus the cost to government of outsourcing the service, once transition and transaction costs were incorporated.
Findings: Domberger et al concluded that if all the associated costs are taken into account, the outsourcing achieved savings of between 24% and 37%, under two different costing scenarios: the first scenario assumed no variation in contract; the second took contract variation into account.
Methodology: The authors used the same approach to test both scenarios. They analysed detailed cost and output data from a 1996 benchmarking study commissioned by the army to assess costs prior to outsourcing, whilst costs sourced from the incoming contractor were used to assess post-contracting costs. Present values of pre- and post-contractual costs were calculated over the life of the contract, in order to take into account changes in the volume of work performed and ongoing contract management costs. Quality was held as a constant – the authors took as a measure of quality the fact that the incoming contractor maintained the ISO 9002 accreditation won by the army workshop prior to contracting out, even though there was no contractual obligation to do so. In addition, the contractor was contractually obliged to produce and implement a quality plan, and to provide indications of the maintenance of equivalent standards of service.
Sources of benefits: As to the sources of these savings, the authors concluded that approximately 58% were attributable to labour shedding (primarily reductions in labour slack in middle-management and administration), 23% to technical change (including reductions in capital slack – the contractor reduced the number of owned assets; purchase of labour saving equipment and introduction of a more efficient work-floor layout and better working practices) and 19% to reduction in wages (contractor employees worked slightly longer weeks and therefore received a lower hourly wage rate). There was also greater variance in contractor salaries, from the highest to the lowest.
Critical analysis: Because the Trentham contract had been operational for only two years at the time of the study, the cost data was not complete. Therefore, a number of assumptions had to be made in the costing analysis – for example, that the service level would be maintained throughout the contract lifetime. However, this remains one of the most comprehensive studies of the benefits of contracting in terms of cost savings and the sources of such savings.
Competitive Edge: The Evidence
32
2. Health Services
The academic literature across the health sector is vast, with commensurate differences between the subjects under investigation. There is a wealth of literature on the relationship between competition and quality, as well as theoretical and empirical analysis of choice, equity and responsiveness. With regard to the financial consequences of contestability, there is a growing literature around hospital ownership and management, as well as comparative efficiency of payment systems.
Against such a backdrop, this review aspires to a modest aim, namely the measurement of efficiency effects following the introduction of competition into support services. In doing so we examine the financial impact of contestability in two non-clinical fields: (1) hospital support services; (2) the construction of new hospitals and the supply of facilities management services through the UK Government’s Private Finance Initiative (PFI).
The support services literature mainly covers the United Kingdom, where tendering was, at least in theory, compulsory after September 1983, when the departments of health in England, Scotland and Wales published guidance asking health authorities to test cost-effectiveness by subjecting the award of contracts for provision to competitive tender. District Health Authorities (DHAs) were instructed that, unless there were exceptional circumstances, all competitive tendering programmes were to be completed by September 1986.
Elsewhere the use of tendering has been more ad hoc, and rarely compulsory. While the majority of published cost-benefit analyses on contestability in health support services has come from the UK, there have also been interesting studies elsewhere, notably Denmark and Australia.
A. UK
SUPPORT SERVICES
2.1 Health and Social Service Journal, ‘Can In-House Caterers Cope?’, 198362
Description: This article from a public sector journal blended statistics and stakeholder interviews to argue that an increasing number of catering contracts were being awarded in-house due to increased NHS efficiency in the face of private competition.
Findings: It reported that in the period 1974-83 catering expenditure fell from 7.3% of NHS expenditure to 5.6%, while the cost of in-house provision of patient meals fell 7% in real terms.
Methodology: The statistics were unsourced, but the interviewees – public sector employees across various levels of management in different regions - were clearly identified.
Sources of benefits: Competitive pressures. Public sector managers claimed that productivity had increased because “We see [privatisation] as a challenge”.
Critical analysis: The statistics were unsourced and it was clear that the authors had an agenda. However, perhaps unwittingly, the analysis made a case not for in-house provision per se but the power of competition to improve that provision.

Competitive Edge: The Evidence
33
2.2 Keith Hartley and Meg Huby, ‘Contracting Out in Health and Local Authorities: prospects, progress and pitfalls’, 198563
Description: A before-and-after study of voluntary competitive tendering based on questionnaires sent to all local and health authorities in England in 1984-85. Only 10 of the 85 responses concerned health.
Findings: Expected annual savings were found to average 26%, ranging from savings of 68% to additional costs of 28%. The results were not broken down by local or health authority or by service.
Methodology: Questionnaires were sent to all 410 local and 192 health authorities in England in 1984-85. Eighty-five responses were received, and of those, only 10 concerned health. The local authority services covered 32 examples of building maintenance and repair, 22 of cleaning, 9 of refuse collection and waste disposal, 7 of pest control, and the rest were for security services, management services and horticultural supply.
Each respondent authority was allowed to select the contract for which it provided data. The contract value per year was compared with the cost of providing the same level of service in the previous year. Authorities provided some data on the cost of organisation and administration of competitive tendering which included man-hours spent organising competition, preparing specifications, site visits and analysing tenders. Firms were also surveyed about the size and source of any savings. Twenty-six out of 81 questionnaires were returned, mostly by members of trade associations involved in domestic and school cleaning.
Sources of benefits: Reduced employment, greater use of part-time staff, lower rates of pay, fewer fringe benefits, modern equipment, better management and organisation. Out of 40 local authority contracts won by private firms, none re-employed all the council’s staff on a full-time basis, in 33 contracts less than 10% were re-employed on a full-time basis and in 26 less than 10% were re-employed on part-time basis. In 14 out of the 26 surveys returned by firms, the contractors reported that they paid lower wages than in-house units.
Critical analysis: It is not clear whether the costs took account of all preparation, monitoring and redundancy costs. Also in 14 cases out of 75 local authorities it was reported that there was no in-house bid, which could mean that there was a low level of competition.
2.3 National Audit Office, ‘Competitive Tendering for Support Services in the National Health Service’, 198764
Description: In September 1983 the UK departments of health published guidance asking health authorities to test the cost effectiveness of three support services – domestic, catering and laundry – by subjecting the award of contracts for these services to competitive tender. This report presented the results of a NAO examination of the progress made in meeting the target of completing all competitive tendering programmes by 1986, comparing costs before and after tendering.
Findings: English health authorities had sought tenders for around two-thirds of contracts with progress slower than expected due to a widespread underestimation of the demands of the tendering process. Of those tendered, savings were estimated at around 20%. Savings varied by type: 26% for domestic services, 14% for cleaning, and 10% for laundry. The proportion of contracts awarded to private-sector bidders fell from 55% in the five quarters to March 1985 to 8% in the September 1986 quarter. Reductions generated by private contractors were initially significantly higher than in-house winners but fell from 34% in 1984 and 1985 to 21% in 1986; this 21% was comparable to in-house figures. Comparative progress in Scotland and Wales had been negligible, with only tiny proportions of contracts tendered.
Methodology: Straightforward accountancy of raw figures from the Department for Health and Social Security (DHSS). Expenditure on service before and after tendering was taken to measure savings as a result of compulsory competitive tendering (CCT).
Sources of benefits: The overall cost reductions were identified as coming through rationalisation of existing operations, less favourable conditions of employment, greater use of part-time staff, changes in working practices and increased productivity. The differences between public and private sector expenditure were thought to have

Competitive Edge: The Evidence
34
dwindled over time due to initial cherry-picking and under-bidding by the private sector and increased efficiency by in-house teams. Only two-thirds of tenders had been contested due to an alleged lack of private sector capacity, dwindling private sector interest, increased public sector efficiency in the face of competition, and political opposition.
Critical analysis: Only in 1991 did the government introduce the concept of value for money in the HM Treasury White Paper Competing for Quality. As such, the value for money savings claimed by the NAO would not have met a post-1991 burden of proof. Additionally the costs of tendering and inflation were excluded from the calculations. Although the net effect of these ought not have been large, inclusion of both would be essential to any precise application of the savings.
2.4 Simon Domberger, Shirley Meadowcroft and David Thompson, ‘The Impact of Competitive Tendering on the Costs of Hospital Domestic Services’, 198765
Description: Statistical analysis of CCT in hospital domestic services to measure relationship between cost of service provision and whether or not the service had been subject to competitive tender.
Findings: The study found that cost savings of around 20% were likely in tendering out domestic services in hospitals, though there had been various teething problems. Early bids were implausibly low meaning that cost-savings were skewed; this was partly attributable to asymmetries of information since successful in-house bidders, though able to offer substantial savings, did not offer savings of the same magnitude. Over time as the contracting process evolved, the proportional incidence of contract failure began to decline and savings from tendering, while lower than initially, remained substantial.
Methodology: The authors took a cost function approach, comparing the costs of service provision in NHS hospitals that had submitted services to tender with those hospitals that had not, after taking account of all other factors that might have influenced the cost of provision. They used a cross-section method – a one-time snapshot of costs across various services was taken from Health Service data during the period 1984-86. Holding constant for important variables such as size of areas to be cleaned, bed occupancy and local labour market costs, the authors were able to assess the significance of tendering on total service costs.
Critical analysis: Milne and Wright (2004) used a five-year data set to examine multiple contracts across multiple years, rather than the Domberger et al approach of examining multiple observations at the same point in time. This methodology reported savings much lower than those estimated elsewhere: CCT reduced costs by 5.9%, and Milne and Wright claimed that these results were substantially more robust than those of Domberger et al, and thus that the cost reductions associated with CCT must be revised.
2.5 Robin G. Milne, ‘Competitive Tendering in the NHS: An Economic Analysis of the Early Implementation of HC(83)18’, 198766
Description: This study examined six of the earliest contracts put out to tender following a 1983 circular by the Department for Health and Social Security requiring the submission of hospital support services to competitive bidding. The contracted services included two catering, three domestic and one laundry. The study reported the costs before and after tender to specify a magnitude of cost savings and subsequently explored the sources of those savings so as to compare economic theory with the empirical process.
Findings: Competition brought a savings of one-third to two-thirds in service expenditure. In raw figures, average savings were 44% with higher savings among in-house service (c. 48%) than outsourced (c. 40%).
Methodology: First, the author examined pre-tender factors – the extent of competition and the tender evaluation process. Secondly, he examined the outcomes – the total reduction in expenditure (i.e. before-and-after measure) and the changes in service specification, labour productivity, wage rates and employer costs which had led to those reductions. There followed a discussion on the costs and outcomes of redundancies, as well as a comparison of in-house and outsourced teams, but the data did not afford expansive verdicts in either case.

Competitive Edge: The Evidence
35
Sources of benefits: A proportion of reductions were realised through rationalisation of services. This was achieved by in-house teams and private contractors alike: NHS managers used the situation to implement change that had previously faced opposition. Other sources identified were reduced wage rates and overall earnings among staff.
Critical analysis: There were many differences between contracts – contrasting nature of cleaning, catering and laundry; contract size (£5,000 to £1.5million), length (two to four years), specification (whole or part hospital); level of competition (zero to four outside submissions). The paper therefore has to be used carefully in the context of cost magnitudes – it is a case study on process and sources rather than a generalisable estimation of competition’s expenditure implications.
2.6 Confederation of British Industry, ‘The Competitive Advantage’, 198867
Description: The CBI examined a decade of competition in the provision of UK public services, and draw on the experience of that time to lay out future strategy in government. It looked across central and local government with a focus on health sector.
Findings: The authors claimed that competition had brought, and would continue to bring, major advantages and opportunities for consumers, taxpayers, businesses and public sector managers through financial savings. Cost reductions have varied in the health sector, with 23% in cleaning the highest available. Competition should therefore be extended to import greater private sector expertise and capital into areas such as estate management and maintenance, ambulances, pharmacy, pathology, portering and security.
Methodology: Review of public accounts data, summarised and interpreted to competition’s best advantage. In the health sector specifically, figures from the National Audit Office (1987) as well as the Department for Health and Social Services were the primary foundation of the argument.
Sources of benefits: Financial benefits had been drawn from three principle sources: better management and organisational approaches, fewer people employed to produce the same level of service, and reduced terms and conditions for workers in comparison to public monopoly provision.
2.7 Stephen Bach, ‘Too High A Price To Pay? A Study of Competitive Tendering for Domestic Services in the NHS’, 198968
Description: This case study examined the costs and quality of provision in domestic services for a single district hospital after the contract for providing these services had been subjected to competitive tender.
Findings: The winning firm failed to meet its obligations, producing an inadequate service with substandard equipment and inadequately trained staff. Following high levels of MRSA infection the contract was terminated and service returned in-house. The in-house tender on re-bid was 37% higher than the winning firm. The in-house service quality improved but employment morale and working conditions did not return to pre-tender levels. The winning firm had submitted an opportunistic, non-profit-winning bid.
Methodology: Financial data was taken from the tender documents and the district health authority. Substantial parts of the supporting text were drawn from case-study interviews with various stakeholders as well as general background information on the political and policy climate.
Critical analysis: It is a matter of record that there was initially a high number of contract failures in compulsory competitive tendering in the National Health Service (NHS) and this case study examined one such failure.
The lack of incumbent staff in certain roles was presented as an advantage since it avoided industrial relations issues, although it also exacerbated the information asymmetries that are a problem in this sector. (The knowledge and expertise required of new entrants to this market was higher than initially assumed, and thus the introduction of new staff to a new hospital would not be straightforward; the costs associated with introducing new staff had to be weighed against the benefit of reduced industrial relations problems.)
Competitive Edge: The Evidence
36
The author did not ask whether any of the other 21 firms that initially expressed interest in the contract might have fulfilled the contract for less than the in-house team on re-tender. The contract was poorly specified, offering hospital managers too few sanctions – this did not prove contracting an invalid route.
2.8 Joint NHS Privatisation Research Unit, ‘The NHS Privatisation Experience: Competitive Tendering for NHS Services’, 199069
Description: A research unit representing five major trade unions reviewed third-party costs imposed by competitive tendering – the cost of arranging and evaluating bids; of monitoring services, of redundancy and reduced pay; of increased staff turnover. Allegations of explicit racism and sexism in private contractors’ methods were also made.
Findings: The central plank of the argument was that expenditure reductions had not been so large as the 20% reported by the National Audit Office in 1987. Moreover, where expenditure reductions had been made these had come at costs not taken into account (monitoring and tendering as well as social welfare). However, detailed numbers on the magnitude of such savings were not given.
Methodology: There was no structured approach to issues involved in contracting NHS hotel services, with statistics and case studies being raised in an ad hoc and anecdotal way.
Critical analysis: There are valid points to be made with regard to both the costs of tendering and the social costs of workforce reductions but no serious attempt was made to address either these complex issues or counter arguments. There was an extensive list of contract failures, many recycled from previous reports. And arguments were couched in highly emotive terms: it was claimed that patients now had to run the risk of finding “blood and bone left in uncleaned operating theatres and splattered on the walls”, while elsewhere it is asserted that racial and sexual discrimination were synonymous with contracting.
2.9 Contract Cleaning and Maintenance Association, ‘The Facts on the NHS Privatisation Experience: A Response to The NHS Privatisation Experience by the Joint NHS Privatisation Research Unit’, 199070
Description: This document from a trade association was published in direct response to Joint NHS Privatisation Research Unit (1990).
Findings: The authors argued that the methodology and presentation of JPRU was disingenuous and misleading. After early problems, tendering had delivered substantial savings for the NHS and would continue to do so in the future with government backing.
Methodology: DHSS statistics on savings were backed by an in-house examination of 41 of the JPRU’s 63 cases of contractor problems. The reports on those specific cases were very brief, but apparently drawn from internal communications since all contractors were members of the CCMA.
Critical analysis: This response did not fully engage with all of the points raised in the JPRU document. The document responded carefully to claimed contract failures. It also asserted that nationally agreed rates of basic pay had been pledged by contractors, but there was no acknowledgment of possible reductions in broader terms and conditions. Twenty-two of the JPRU’s cases remained unanswered.
2.10 Robin Milne and Magnus McGee, ‘Compulsory Competitive Tendering in the NHS: A New Look at Some Old Estimates’, 199271
Description: This paper followed in the footsteps of Domberger et al (1987) to estimate the effect of CCT on service expenditure in support services. It used a similar statistical approach for domestic and catering services in 216 hospitals over two years, to measure expenditure reductions, and then asked whether these reductions might be offset by the costs of CCT implementation.

Competitive Edge: The Evidence
37
Findings: CCT was found to reduce costs in both domestic and catering, by 17% and 5% respectively. However, the small sample meant that there was a big margin of error in these estimates so neither is statistically significant. The difference between these reductions is also not found to be significant, though the respective magnitudes (domestic expenditure reductions greater than catering) reiterate findings elsewhere. See NAO (1987) and Domberger et al (1987).
Methodology: The data were taken from a population of 216 hospitals across one regional health authority during the financial years 1984-85 and 1985-86. The numbers were provided from unpublished accounts by the regional authority’s treasurer’s department. These were then applied to an estimated cost function, comparing the costs of service provision in NHS hospitals that had submitted services to tender with those hospitals that had not, after taking account of all other factors that might have influenced the cost of provision.
Sources of benefits: NHS managers had used the threat of CCT to implement changes; these largely produced one-off productivity gains. For in-house and outsourced contracts, a significant driver of reductions was cuts in earnings and conditions of service.
2.11 Robin Milne, ‘Contractors’ Experience of Compulsory Competitive Tendering: A Case Study of Contract Cleaners in the NHS’, 199372
Description: This paper attempted to redress a perceived imbalance in the CCT literature. While there was an extensive literature on the experience of government in implementing CCT (costs and outcomes, quality, and so on), little had been written on the supply side of the market. The author therefore reported on the extent of competition and experience of outcomes for contractors in the market for NHS domestic cleaning contracts
Findings: CCT was initially an area of great interest to contracting firms with more than 50 expressing a firm interest over the period 1984 to 1990. However, despite some initial successes there were also often large losses and no more than a few firms ended that seven-year period in profit. Those conducting CCT favoured firms with a track record, something that persisted throughout the period. As such, by the second half of the period under study, the market had stabilised with a smaller number of firms but a higher level of experience.
Methodology: Milne began with a review of the economics of outsourcing – desirable conditions for economies of scale and scope, the requirement for competition for the market, and the roles of uncertainty, opportunism and monitoring. There then followed a history of the market before CCT as a prelude to examining the make-up of supply-side competition following its introduction. Data supplied by company reports and surveys, and the Contract Cleaning and Maintenance Association was used to outline the market features such as entry costs, turnover, profit and geographical distribution of participants over the period 1984-90.
2.12 Robert McMaster, ‘Competitive Tendering in UK Health and Local Authorities: What Happens to the Quality of Services?’, 199573
Description: A study which sought to empirically test the impact of compulsory competitive tendering on service quality in 21 UK health and local authorities from 1989-90. It was hypothesised that governance changes in public services designed to generate cost savings were characterised by low levels of trust and poor knowledge transfer which would affect service quality.
Findings: The significant findings of the study were that quality decreased as cost savings rose, whereas quality increased with longer contract duration and higher levels of monitoring. Average savings for the services studied were calculated at 11%. However, it was also suggested that the link between quality and cost savings was indirect as further analysis showed that savings were more likely to inhibit quality improvement than to cause deterioration. There was no significant difference in results between external and internal service providers or between local and health authorities. Furthermore, it was found that authorities had experienced relatively few disruptions to services under the CCT regime although this was explained through the fairly strong link between service plasticity and quality whilst high levels of re-employment were not found to affect quality.
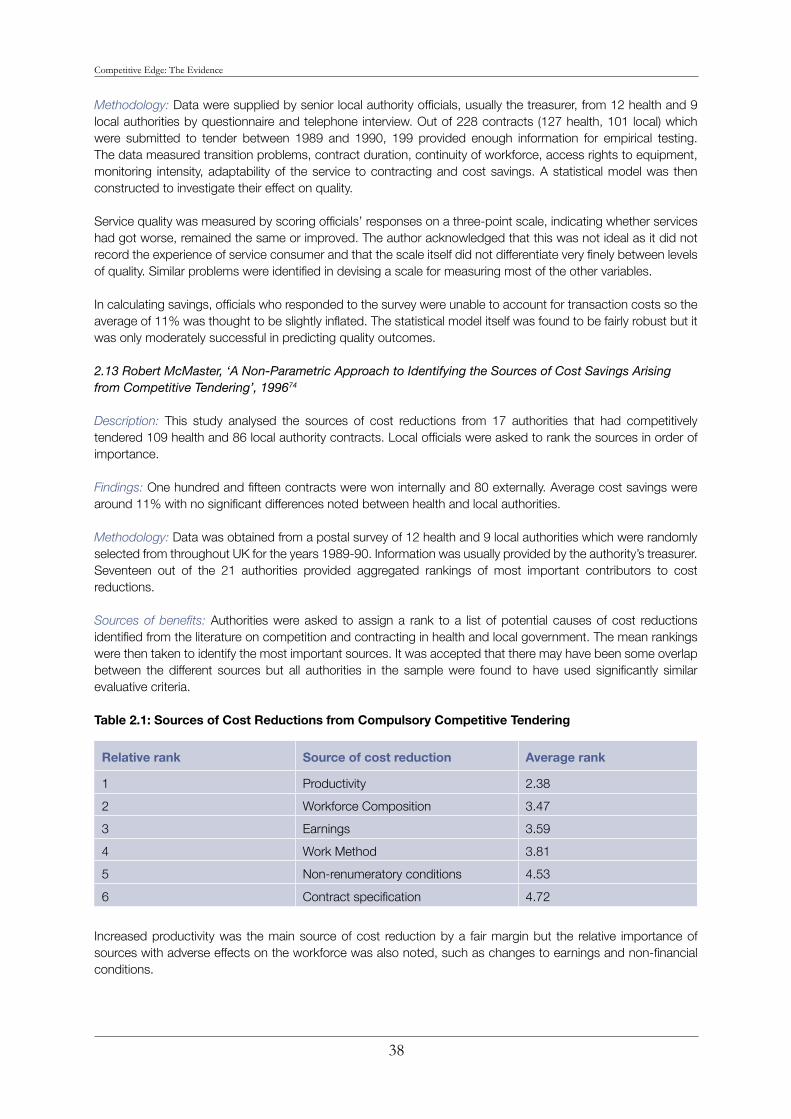
Competitive Edge: The Evidence
38
Methodology: Data were supplied by senior local authority officials, usually the treasurer, from 12 health and 9 local authorities by questionnaire and telephone interview. Out of 228 contracts (127 health, 101 local) which were submitted to tender between 1989 and 1990, 199 provided enough information for empirical testing. The data measured transition problems, contract duration, continuity of workforce, access rights to equipment, monitoring intensity, adaptability of the service to contracting and cost savings. A statistical model was then constructed to investigate their effect on quality.
Service quality was measured by scoring officials’ responses on a three-point scale, indicating whether services had got worse, remained the same or improved. The author acknowledged that this was not ideal as it did not record the experience of service consumer and that the scale itself did not differentiate very finely between levels of quality. Similar problems were identified in devising a scale for measuring most of the other variables.
In calculating savings, officials who responded to the survey were unable to account for transaction costs so the average of 11% was thought to be slightly inflated. The statistical model itself was found to be fairly robust but it was only moderately successful in predicting quality outcomes.
2.13 Robert McMaster, ‘A Non-Parametric Approach to Identifying the Sources of Cost Savings Arising from Competitive Tendering’, 199674
Description: This study analysed the sources of cost reductions from 17 authorities that had competitively tendered 109 health and 86 local authority contracts. Local officials were asked to rank the sources in order of importance.
Findings: One hundred and fifteen contracts were won internally and 80 externally. Average cost savings were around 11% with no significant differences noted between health and local authorities.
Methodology: Data was obtained from a postal survey of 12 health and 9 local authorities which were randomly selected from throughout UK for the years 1989-90. Information was usually provided by the authority’s treasurer. Seventeen out of the 21 authorities provided aggregated rankings of most important contributors to cost reductions.
Sources of benefits: Authorities were asked to assign a rank to a list of potential causes of cost reductions identified from the literature on competition and contracting in health and local government. The mean rankings were then taken to identify the most important sources. It was accepted that there may have been some overlap between the different sources but all authorities in the sample were found to have used significantly similar evaluative criteria.
Table 2.1: Sources of Cost Reductions from Compulsory Competitive Tendering
Relative rank Source of cost reduction Average rank
1 Productivity 2.38
2 Workforce Composition 3.47
3 Earnings 3.59
4 Work Method 3.81
5 Non-renumeratory conditions 4.53
6 Contract specification 4.72
Increased productivity was the main source of cost reduction by a fair margin but the relative importance of sources with adverse effects on the workforce was also noted, such as changes to earnings and non-financial conditions.

Competitive Edge: The Evidence
39
2.14 Robin G. Milne and Robert E. Wright, ‘Competitive Tendering in the Scottish National Health Service: Was It Compulsory, and Did It Make A Difference?’, 200075
Description: This paper explored whether CCT was compulsory in the Scottish NHS, given the slow take-up rate following the 1983 DHSS advice. It also estimated cost savings as a consequence of competitive tendering where it took place.
Findings: Two key influences drove the late but ultimately widespread take-up of CCT practice in the Scottish NHS. First, Michael Forsyth MP’s arrival in the Scottish Office instigated political will and drive to displace political road blocks to reform. Secondly, by 1987 the English market had been subject to widespread tendering which meant that firms were forced to look elsewhere for business. The private sector capacity that had previously been absent in the Scottish market was therefore provided. Cost savings were between 15% and 23% bearing in mind that an efficiency drive had already reduced expenditure by 10% in the period 1985-86.
Methodology: Scottish Office Department of Health statistics were used to calculate cost savings where these were the difference between the tender price and previous cost. Qualitative work was performed through reference to NAO and DHSS documents as well as previous work by Milne.
Sources of benefits: Contractors were found to have a higher effect on expenditure reductions than if the tender was won in-house. The mean savings for contractor and in-house provision were 29% and 13% respectively. Competition per se was therefore a driver of significant reductions in public and private provision, but these results also appeared to support the authors’ expectation that the superior efficiency of private over public organisations offered the scope for further savings.
2.15 Robin Milne and Robert E. Wright, ‘Competition and Costs: Evidence from Competitive Tendering in the Scottish National Health Service’, 200476
Description: This paper estimated the impact of competitive tendering on cleaning costs in Scottish National Health Service hospitals between 1986-87 and 1991-92.
Findings: The study supported the contention that competitive tendering led to a cost-reduction for support services, but for a much lower order than that previously identified – around 4-6%. The authors conceded that some of the differences from other studies may have been due to differences between political jurisdictions – but they also claimed that their approach ironed out a number of methodological problems encountered elsewhere. Significantly, this report confirmed findings elsewhere that it was the presence of competition, rather than any intrinsically superior efficiency in the private sector, which drove costs down.
Methodology: Five-year panel data from 176 hospitals to estimate statistical models of service costs, tracking the temporal effects over the entire period. That is, they applied these data to examine multiple observations (contracts tendered) across multiple years, rather than the approach elsewhere (e.g. Domberger et al 1987) of examining multiple observations at the same point in time.
Sources of benefits: Effects were singularly attributable to CCT, so by implication it was competitive pressures rather than any intrinsic superior efficiency in the private sector. The differences between the English and Scottish markets were substantial, so it was not sure that these findings could be applied equally to other environments. Failure to investigate sources of savings and impact on quality restrict the implications of findings.
THE PRIVATE FINANCE INITIATIVE
2.16 Declan Gaffney and Allyson Pollock, ‘Downsizing for the 21st Century’, 199977
Description: The authors analysed the business case for the new Dryburn Hospital at Durham, one of the earliest major PFI schemes in the National Health Service.

Competitive Edge: The Evidence
40
Findings: After reconstructing the estimates for the project, costed on a 30-year life, the authors concluded that the public sector option had been around 2.5% cheaper than the PFI option, when adjusted for risk. Indeed, the NHS Trust had acknowledged that the project ‘does not achieve value for money over the initial 30-year period’. When calculated over a lifespan of 60 years, the present value of the two options was identical.
Methodology: The authors relied on data published by the NHS Trust in its Full Business Case, although the detailed methodology adopted in that document was not spelled out. They challenged the decision to extend the lifespan of the project to 60 years, and questioned the assumptions on which the risk factors were based.
2.17 David Price, Declan Gaffney and Allyson Pollock, ‘The Only Game in Town’, 199978
Description: A study of the Full Business Case for the new Cumberland Infirmary in Carlisle, one of the earliest PFI projects in the National Health Service.
Findings: The Trust claimed that the present cost of the PFI scheme was £173.1m, compared with £174.3m for the public sector comparator, a difference of less than one percent. Using detailed information provided in the documents, the authors tested the assumptions behind the value for money comparison.
They demonstrated that the financial viability of the scheme was highly sensitive to the discount rate. While the NHS Trust had used the 6% discount rate mandated by HM Treasury in such cases, the authors explained that a reduction of only 0.5% rendered the PFI option at Carlisle uneconomic.
Price et al also challenged the assumptions underlying the risk adjustment, pointing to data published by the National Audit Office indicating that the average increase in cost over approved tender sums for NHS capital projects was 6.3-8.4% throughout the 1990s.
Methodology: The authors accepted the detailed assumptions and calculations on which the public sector comparator had been constructed.
2.18 Declan Gaffney, Allyson M. Pollock, David Prince, Jean Shaoul, ‘PFI in the NHS – Is There an Economic Case?’, 199979
Description: The authors challenged some of the assumptions on which the business case for PFI schemes in the NHS were based. In particular, they demonstrated the sensitivity of cost comparisons to different discount rates and assumptions about the risks associated with public sector comparators.
Findings: (i) The discount rate: ‘The level at which the discount rate is set determines whether or not private finance option shows value for money. . . at 6% the Carlisle private finance initiative scheme is slightly cheaper than its public sector equivalent and is thus held to be better value for money. When the discount rate is reduced by only 0.5%, the outcome of the appraisal is reversed. . .’
(ii) Risk adjustment: ‘. . . the 6% discount rate already takes account of an element of risk, as it is set by the Treasury to be higher than a risk-free interest rate.’ Moreover, risk estimates for the public sector comparators had been set too high. ‘The average increase in cost over approved tender sums for NHS capital projects has been between 6.3% and 8.4% in the 1990s. Public finance initiative business cases have in most cases assumed that public sector projects overrun by 1.25% or more. In costing its public sector comparator, the Norfolk and Norwich Trust assumed overruns of 34%.’
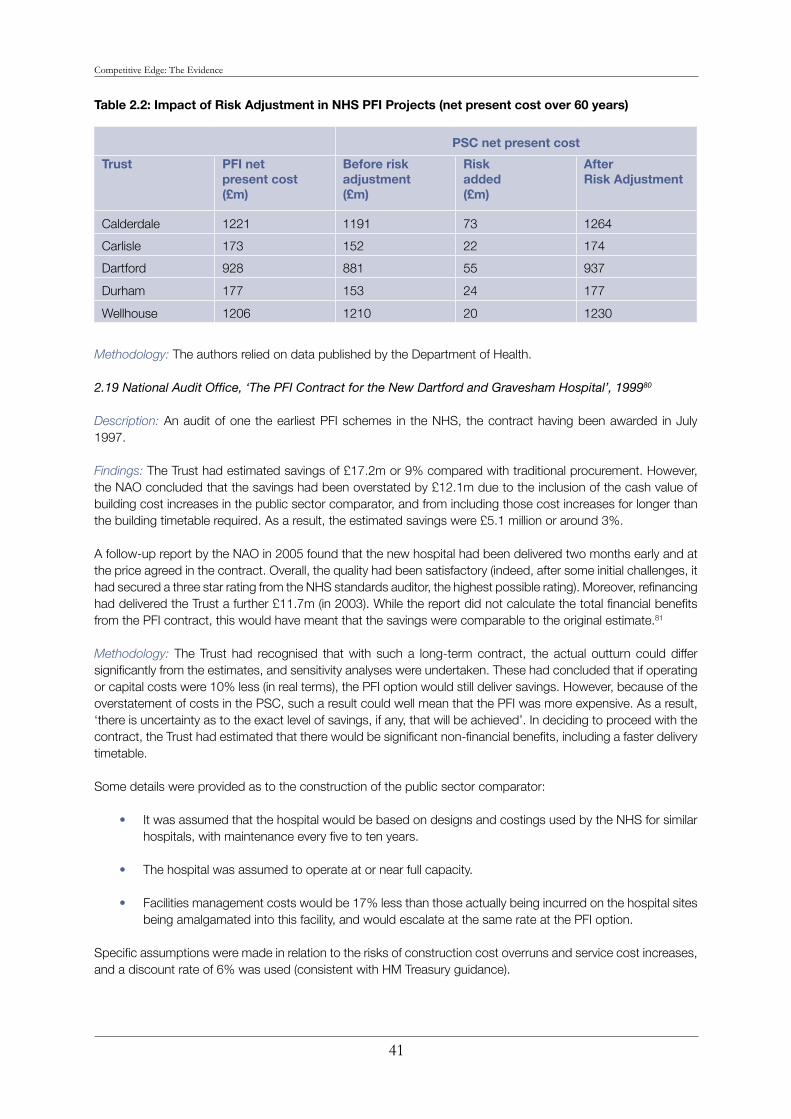
Competitive Edge: The Evidence
41
Table 2.2: Impact of Risk Adjustment in NHS PFI Projects (net present cost over 60 years)
PSC net present cost
Trust PFI net present cost(£m)
Before risk adjustment(£m)
Risk added (£m)
AfterRisk Adjustment
Calderdale 1221 1191 73 1264
Carlisle 173 152 22 174
Dartford 928 881 55 937
Durham 177 153 24 177
Wellhouse 1206 1210 20 1230
Methodology: The authors relied on data published by the Department of Health.
2.19 National Audit Office, ‘The PFI Contract for the New Dartford and Gravesham Hospital’, 199980
Description: An audit of one the earliest PFI schemes in the NHS, the contract having been awarded in July 1997.
Findings: The Trust had estimated savings of £17.2m or 9% compared with traditional procurement. However, the NAO concluded that the savings had been overstated by £12.1m due to the inclusion of the cash value of building cost increases in the public sector comparator, and from including those cost increases for longer than the building timetable required. As a result, the estimated savings were £5.1 million or around 3%.
A follow-up report by the NAO in 2005 found that the new hospital had been delivered two months early and at the price agreed in the contract. Overall, the quality had been satisfactory (indeed, after some initial challenges, it had secured a three star rating from the NHS standards auditor, the highest possible rating). Moreover, refinancing had delivered the Trust a further £11.7m (in 2003). While the report did not calculate the total financial benefits from the PFI contract, this would have meant that the savings were comparable to the original estimate.81
Methodology: The Trust had recognised that with such a long-term contract, the actual outturn could differ significantly from the estimates, and sensitivity analyses were undertaken. These had concluded that if operating or capital costs were 10% less (in real terms), the PFI option would still deliver savings. However, because of the overstatement of costs in the PSC, such a result could well mean that the PFI was more expensive. As a result, ‘there is uncertainty as to the exact level of savings, if any, that will be achieved’. In deciding to proceed with the contract, the Trust had estimated that there would be significant non-financial benefits, including a faster delivery timetable.
Some details were provided as to the construction of the public sector comparator:
It was assumed that the hospital would be based on designs and costings used by the NHS for similar • hospitals, with maintenance every five to ten years.
The hospital was assumed to operate at or near full capacity.•
Facilities management costs would be 17% less than those actually being incurred on the hospital sites • being amalgamated into this facility, and would escalate at the same rate at the PFI option.
Specific assumptions were made in relation to the risks of construction cost overruns and service cost increases, and a discount rate of 6% was used (consistent with HM Treasury guidance).

Competitive Edge: The Evidence
42
Critical analysis: It appears that pension liabilities were omitted from these early PSCs. Moreover, there is no evidence that private sector tax revenues were taken into account, and later guidance from Treasury advised departments that they should take account of taxation difference between the alternative options.82
One explanation for the low margin may have been that ‘the final stages of the procurement. . . were not fully competitive because the Trust received only one bid from their shortlist of two bidders’. The final bid was 33% higher in real terms than the indicative bid from the same consortium, although this partly reflected the cost of additional facilities that the Trust had specified. This was negotiated down following benchmarking of cost elements, and the final contract price was 17% above the indicative bid.83
2.20 National Audit Office, ‘The PFI Contract for the Redevelopment of West Middlesex University Hospital’, 200284
Description: A study by the Auditor-General of the likelihood of the government securing value for money from the PFI contract for the West Middlesex University Hospital, awarded in January 2001.
Findings: The PFI contract was worth £125 million over 35 years, which was 3.8% less than the cost of the risk-adjusted alternative by conventional procurement. Discounted over 60 years, the cost differential was 7.1%.
Factors other than financial ones had influenced the decision to proceed with a PFI: certainty on price and timing of delivery, transfer of responsibility for maintenance, and better design and innovation.
Methodology: The final adjustment for risk was around 15% of the construction costs. The Department of Health justified this figure before the Public Accounts Committee on the basis that ‘some projects had previously experienced 20 or 30% overruns’.85
A discount rate of 6% had been used, in line with Treasury policy at the time. Since that date (from January 2003), departments were required to use a discount rate of 3.5% in real terms. ‘The Department acknowledged that, other things being equal, it would not have gone ahead with this PFI project based on an evaluation using a discount rate of 3.5% in real terms.’86 It appears that public sector pensions and private sector tax payments were not taken into account in undertaking the original comparison.
Critical analysis: The Department explained the narrow cost differential ‘as reflecting the fact that construction costs had been driven down very significantly as a result of the PFI process compared to the extensive cost overruns in building projects it had previously experienced. The Department considered this to be the biggest benefit from using the PFI.’
2.21 Allyson M. Pollock, Jean Shaoul, Neil Vickers, ‘Private Finance and “Value for Money” in NHS Hospi-tals: A Policy in Search of a Rationale?’, 200287
Description: This article undertook yet another comparison of the discounted costs of public hospitals under public and private finance, highlighting sensitivity to risk transfer.
Findings: ‘. . . for six hospitals. . . the net present value of the public sector comparator was lower than that of the PFI option, even after applying a 6% discount rate. . . Only after risk transfer was included was the net present value of PFI less than the public sector comparator. Also, after risk transfer, the difference between the PFI and the public sector comparator in all cases was marginal. . .’
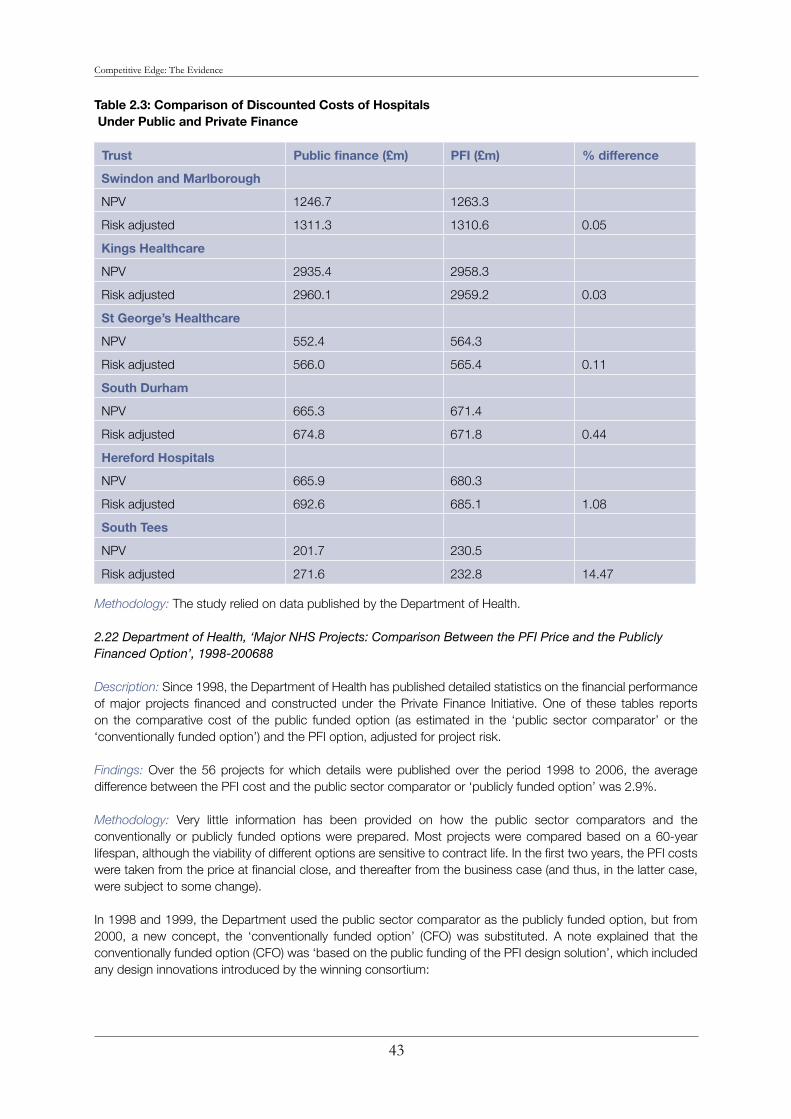
Competitive Edge: The Evidence
43
Table 2.3: Comparison of Discounted Costs of Hospitals Under Public and Private Finance
Trust Public finance (£m) PFI (£m) % difference
Swindon and Marlborough
NPV 1246.7 1263.3
Risk adjusted 1311.3 1310.6 0.05
Kings Healthcare
NPV 2935.4 2958.3
Risk adjusted 2960.1 2959.2 0.03
St George’s Healthcare
NPV 552.4 564.3
Risk adjusted 566.0 565.4 0.11
South Durham
NPV 665.3 671.4
Risk adjusted 674.8 671.8 0.44
Hereford Hospitals
NPV 665.9 680.3
Risk adjusted 692.6 685.1 1.08
South Tees
NPV 201.7 230.5
Risk adjusted 271.6 232.8 14.47
Methodology: The study relied on data published by the Department of Health.
2.22 Department of Health, ‘Major NHS Projects: Comparison Between the PFI Price and the Publicly Financed Option’, 1998-200688
Description: Since 1998, the Department of Health has published detailed statistics on the financial performance of major projects financed and constructed under the Private Finance Initiative. One of these tables reports on the comparative cost of the public funded option (as estimated in the ‘public sector comparator’ or the ‘conventionally funded option’) and the PFI option, adjusted for project risk.
Findings: Over the 56 projects for which details were published over the period 1998 to 2006, the average difference between the PFI cost and the public sector comparator or ‘publicly funded option’ was 2.9%.
Methodology: Very little information has been provided on how the public sector comparators and the conventionally or publicly funded options were prepared. Most projects were compared based on a 60-year lifespan, although the viability of different options are sensitive to contract life. In the first two years, the PFI costs were taken from the price at financial close, and thereafter from the business case (and thus, in the latter case, were subject to some change).
In 1998 and 1999, the Department used the public sector comparator as the publicly funded option, but from 2000, a new concept, the ‘conventionally funded option’ (CFO) was substituted. A note explained that the conventionally funded option (CFO) was ‘based on the public funding of the PFI design solution’, which included any design innovations introduced by the winning consortium:
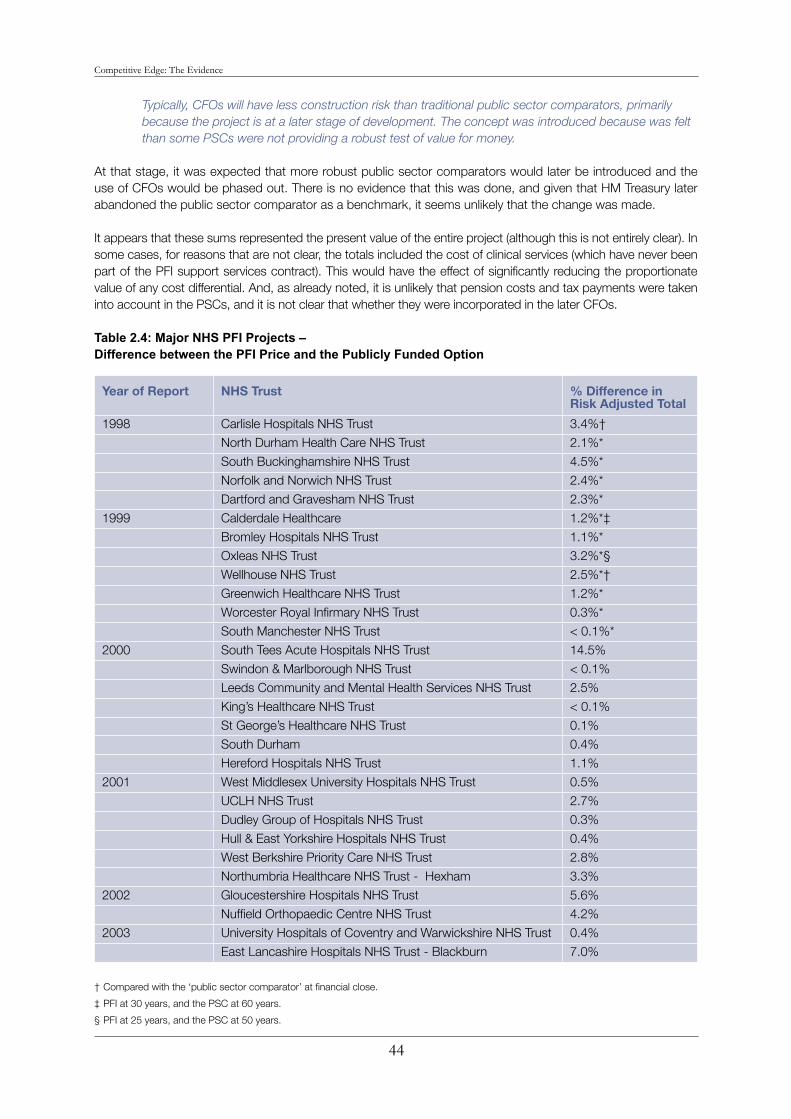
Competitive Edge: The Evidence
44
Typically, CFOs will have less construction risk than traditional public sector comparators, primarily because the project is at a later stage of development. The concept was introduced because was felt than some PSCs were not providing a robust test of value for money.
At that stage, it was expected that more robust public sector comparators would later be introduced and the use of CFOs would be phased out. There is no evidence that this was done, and given that HM Treasury later abandoned the public sector comparator as a benchmark, it seems unlikely that the change was made.
It appears that these sums represented the present value of the entire project (although this is not entirely clear). In some cases, for reasons that are not clear, the totals included the cost of clinical services (which have never been part of the PFI support services contract). This would have the effect of significantly reducing the proportionate value of any cost differential. And, as already noted, it is unlikely that pension costs and tax payments were taken into account in the PSCs, and it is not clear that whether they were incorporated in the later CFOs.
Table 2.4: Major NHS PFI Projects – Difference between the PFI Price and the Publicly Funded Option
Year of Report NHS Trust % Difference in Risk Adjusted Total
1998 Carlisle Hospitals NHS Trust 3.4%†
North Durham Health Care NHS Trust 2.1%*
South Buckinghamshire NHS Trust 4.5%*
Norfolk and Norwich NHS Trust 2.4%*
Dartford and Gravesham NHS Trust 2.3%*
1999 Calderdale Healthcare 1.2%*‡
Bromley Hospitals NHS Trust 1.1%*
Oxleas NHS Trust 3.2%*§
Wellhouse NHS Trust 2.5%*†
Greenwich Healthcare NHS Trust 1.2%*
Worcester Royal Infirmary NHS Trust 0.3%*
South Manchester NHS Trust < 0.1%*
2000 South Tees Acute Hospitals NHS Trust 14.5%
Swindon & Marlborough NHS Trust < 0.1%
Leeds Community and Mental Health Services NHS Trust 2.5%
King’s Healthcare NHS Trust < 0.1%
St George’s Healthcare NHS Trust 0.1%
South Durham 0.4%
Hereford Hospitals NHS Trust 1.1%
2001 West Middlesex University Hospitals NHS Trust 0.5%
UCLH NHS Trust 2.7%
Dudley Group of Hospitals NHS Trust 0.3%
Hull & East Yorkshire Hospitals NHS Trust 0.4%
West Berkshire Priority Care NHS Trust 2.8%
Northumbria Healthcare NHS Trust - Hexham 3.3%
2002 Gloucestershire Hospitals NHS Trust 5.6%
Nuffield Orthopaedic Centre NHS Trust 4.2%
2003 University Hospitals of Coventry and Warwickshire NHS Trust 0.4%
East Lancashire Hospitals NHS Trust - Blackburn 7.0%
† Compared with the ‘public sector comparator’ at financial close.
‡ PFI at 30 years, and the PSC at 60 years.
§ PFI at 25 years, and the PSC at 50 years.
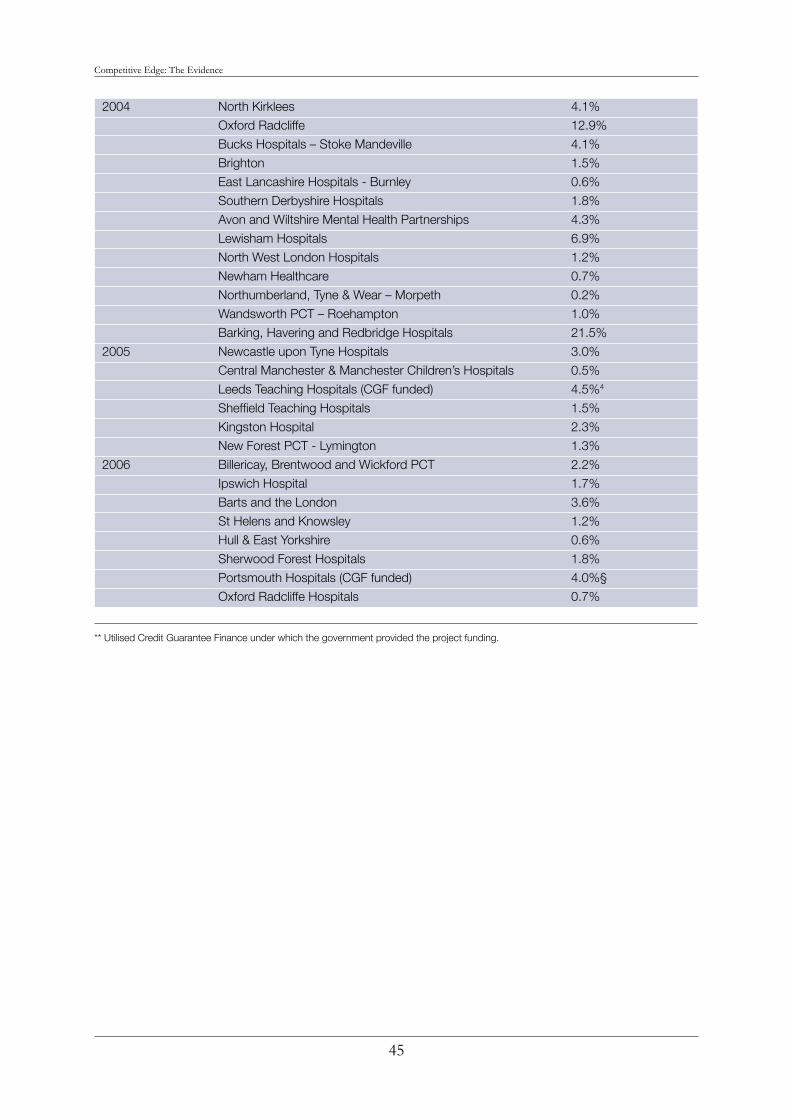
Competitive Edge: The Evidence
45
2004 North Kirklees 4.1%
Oxford Radcliffe 12.9%
Bucks Hospitals – Stoke Mandeville 4.1%
Brighton 1.5%
East Lancashire Hospitals - Burnley 0.6%
Southern Derbyshire Hospitals 1.8%
Avon and Wiltshire Mental Health Partnerships 4.3%
Lewisham Hospitals 6.9%
North West London Hospitals 1.2%
Newham Healthcare 0.7%
Northumberland, Tyne & Wear – Morpeth 0.2%
Wandsworth PCT – Roehampton 1.0%
Barking, Havering and Redbridge Hospitals 21.5%
2005 Newcastle upon Tyne Hospitals 3.0%
Central Manchester & Manchester Children’s Hospitals 0.5%
Leeds Teaching Hospitals (CGF funded) 4.5%4
Sheffield Teaching Hospitals 1.5%
Kingston Hospital 2.3%
New Forest PCT - Lymington 1.3%
2006 Billericay, Brentwood and Wickford PCT 2.2%
Ipswich Hospital 1.7%
Barts and the London 3.6%
St Helens and Knowsley 1.2%
Hull & East Yorkshire 0.6%
Sherwood Forest Hospitals 1.8%
Portsmouth Hospitals (CGF funded) 4.0%§
Oxford Radcliffe Hospitals 0.7%
** Utilised Credit Guarantee Finance under which the government provided the project funding.

Competitive Edge: The Evidence
46
B. DENMARK
2.23 Wayne Jensen, ‘Contracting Out Building Cleaning Services at the National Hospital of Denmark’, 199789
Description: This four-page paper outlined the contracting out of cleaning services in Denmark’s National Hospital in 1992. It was primarily a policy brief, outlining the government policy, contract history and contractual details, but also offered specifics on bid levels and cost-savings.
Findings: The winning bid for the four-year contract was that of a private company, over 43% cheaper than the in-house bid from the team that had previously been providing the service. During the contract life, monitoring showed that quality of service had improved.
Methodology: This involved straightforward reporting of respective bids from winning and in-house teams. A before-and-after study would therefore likely show considerably higher savings than 43%, but no details were provided. There was no explicit mention of the source of financial data, but the author worked for the Ministry of Finance so they were most likely official government figures. Quality control and contract specification reported in general but the paper was deliberately short leaving little room for extensive analysis.
Sources of benefits: The sources of savings were not investigated in depth but two stood out: a reorganised, streamlined workforce and a highly detailed contract arrangement extracting the best possible outcomes for the hospital from the private provider. Furthermore it was noted that ‘Denmark has a very competitive private sector market for building cleaning activities’. This heightened competitiveness, experience and capacity offers a possible explanation for the huge expenditure reduction with improved quality.
Critical analysis: This paper is not an exhaustive cost-benefit analysis of the switch from public to private provision, and nor was it intended to be. There was little investigation into the sources and sustainability of savings, or the costs arising from new employment practices.

Competitive Edge: The Evidence
47
C. AUSTRALIA
2.24 Christine Hall and Simon Domberger, ‘Competitive Tendering for Domestic Services: A Comparative Study of Three Hospitals in NSW’, 199290
Description: The period 1989-92 saw a 13.2% reduction in expenditure on hotel services in New South Wales public hospitals overall. This study examined three case studies of cleaning services in NSW hospitals following the introduction of competitive tendering pilot projects in 1989-90. The tendering process, winning bid and contract outcome were examined in each case.
Findings: In Hospital A, the in-house team won the bid and provided an improved service 20.8% cheaper than previously. There were job losses but morale among the new team actually increased. In Hospital B, an outside firm won but also provided an improved service at significantly lower cost – 29.7% in this case. In Hospital C, however, the results were not so impressive – an outside contractor won with the lowest bid, promising large cost-savings, but the quality of service deteriorated to such an extent that the contract was terminated.
Methodology: The authors took a case study approach based on public finance data for before-and-after costing, and interviews for building a narrative on the tendering processes and outcomes for each hospital.
Sources of benefits: A significant issue was the similarity of approach between successful public and private contractors – a bipartisan approach, delineated management, and open dialogue with the parties. As such it was the presence of competition, rather than private-sector ownership, which drove down costs. Problems at Hospital C could be traced, inter alia, to confrontational management approaches on both sides and a poorly specified contract. The 13.2% savings were largely attributed to increased public-sector efficiency, which would not have occurred ‘without the clear prospect of contracting’.
2.25 Simon Domberger, Christine Hall and Eric Ah Lik Li, ‘The Determinants of Price and Quality in Competitively Tendered Contracts’, 199591
Description: This study used statistical analysis to measure the effect of competitive tendering on the price and ex-post quality of 61 cleaning contracts (22 office, 7 hospital and 32 school) in the Sydney Metropolitan region.
Findings: It was found that, in general, tendering led to lower prices and higher quality, although not all results were found to be significant. In schools, private contractors delivered savings of around 50% with attendant increases in quality both of which were found to be statistically significant. Equally in offices, prices were 35.7% cheaper for contracted services but with a small drop in quality, though, neither of these was found to be significant. In hospitals where both public and private bodies had tendered for contracts, the public sector was found to be 13% cheaper with quality almost identical between the two, and again neither of these differences was found to be significant. Taking into account the hospital results it was tentatively suggested that competition not ownership is important in reducing prices. More importantly the quality-shading hypothesis was rejected on the basis of lower prices provided by competitively tendered contracts with generally higher levels of cleaning performance.
Methodology: The contracts were broken down by sector (i.e. hospitals, special schools, other schools and offices) and were studied simultaneously. Price per square metre cleaned was the main measurement for the price variable and for quality a number of inspectors were trained to visit all the different sites and rate several different aspects of the cleaning job as a pass or fail with the total number forming a score at the end. Each contract was visited six times, the inspectors were rotated between different contracts to even out variation in scoring and the inspected areas were chosen randomly to avoid special preparation for inspections. Contract costs were used, not total costs and thus did not include cost of monitoring. It is believed that monitoring costs rarely exceeded 3-4% of the contract and thus had little impact on expected savings of 20% and above from competitive tendering. Whether competed contracts require more monitoring was left as an open question for further study.

Competitive Edge: The Evidence
48
D. NEW ZEALAND
2.26 Toni Ashton, Jacqueline Cumming and Janet McLean, ‘Contracting for health services in a public health system: the New Zealand experience’, 200492
Description: This article examined the processes and outcomes from contracting in New Zealand health services between 1993 and 2000.
Findings: No quantitative data are presented on the outcomes of contracting but there are still insightful lessons on the nature of the process. The introduction of contracting into public health services over time improved clarity and flexibility of service provision in comparison to public ownership. Initially, however, information asymmetries increased tendering costs and hindered monitoring and accountability. Key factors to influence contracting environment were legal framework, funding constraints, and the cultural and professional norms of contracting personnel.
Methodology: The study discussed various aspects of contracting environment based on three separate sets of interviews with personnel from the Ministry of Health, purchasers and providers.
Sources of benefits: The contracting process was allowed to evolve, becoming simpler and less costly. Good relationships between purchasers and providers were essential to successful contracting in health.
Competitive Edge: The Evidence
49
3. Prison ManagementIn North America, private and not-for-profit organisations were extensively involved in providing support services in the custodial sector from the late 1970s. By the early 1980s, the private sector was providing food and laundry services as well as drug treatment, counselling and education services. Early studies reported that agencies were making savings through the use of contracting, but the scale of the benefits in these studies is difficult to gauge.93
The US Immigration and Naturalization Service (INS) awarded its first contract for the management of an immigration holding facility in 1980, although the birth of modern prison contracting is usually dated to 1984, when Corrections Corporation of America opened the Houston Processing Center, a facility commissioned by the INS and the Federal Bureau of Prisons. State and county governments quickly followed, driven by soaring prison populations and federal court orders mandating reductions in overcrowding. Most of the studies that have been undertaken into prison contracting relate to the North American market.
Australia became the first country outside of the United States to open a privately managed prison in the northern state of Queensland, in 1990, with four other states following soon thereafter. In the United Kingdom, competition and contracting had been under discussion for some time, and the private sector was already involved in managing an immigration detention facility at Heathrow Airport, but it was not until 1992 that the first of the privately managed prisons was opened. A relatively small number of studies have been undertaken into the UK and Australian markets.
The French government attempted to move down this same path in 1987, but faced major political opposition when it attempted to contract full custodial services. As a result, when the first contracts were let in 1990, the service element extended only to support functions. In the collection that follows, there is only one study of this particular model of prison contracting.
A. USA
3.1 Keon S. Chi, ‘Private Contractor Work Release Centers: The Illinois Experience’, 198294
Description: A study of work release facilities in Illinois, 11 public and 7 contracted, in 1982.
Findings: The study relied on data from the Illinois Department of Corrections, which reported in 1982 that contracted correctional centres averaged a cost of $25 per inmate day, compared with $39.81 for public facilities.
Methodology: The author recognised the difficulty of comparing state-run and private community correctional centres ‘because of the large number of variables involved’: ‘No single CCC can be rated as superior or inferior to another because of differences in location, facility, program, and resident characteristics.’
However, Chi reported that there was a consensus among community corrections staffers within the Illinois Department of Corrections that the private contractors had done as good a job as state-run centres. Recent IDOC data showed no discernible difference in employment rates or in percentages of residents returned to prison for disciplinary reasons.

Competitive Edge: The Evidence
50
Sources of benefits: Chi argued that labour costs accounted for the majority of the difference: (i) the contractors were mostly non-profit organisations and relied to some extent on volunteers; and (ii) contracted centres paid staff 40-60% less than state facilities.
Critical analysis: This survey was conducted over a single year and the facilities in question were not comparable. McDonald contended that there were also difficulties with the quality of the data:
. . . no attempt was made to determine the private centers’ true costs, including the value of the subsidies of volunteered money and time. Nor was there any attempt to examine what was counted (or not counted) as a cost by the Illinois Department of Corrections and the private organizations.95
3.2 National Institute of Corrections, ‘Private Sector Operation of a Correctional Institution: A Study of the Jack and Ruth Eckerd Youth Development Center, Okeechobee’, Florida, 198596
Description: A study of the Jack & Ruth Eckerd Youth Development Center in Okeechobee, Florida in its first year and a half of operation under contract. Two approaches were adopted – (i) a before-and-after comparison; and (ii) comparability with a similar state-run institution, the Arthur G. Dozier School for Boys.
Transfer of the management of the Florida School for Boys to the Jack & Ruth Eckerd Foundation in 1982 was a landmark in the modern contracting of correctional facilities. While the private and voluntary sectors had managed small group homes for juveniles prior to this date (i.e. less than 40 residents), this was the first time that a large secure institution had been contracted (more than 400 inmates).
Findings: (i) Operation costs per capita increased by 35% between 1981-82 (under state management) and 1983-84 (the first full year of foundation management), however operating costs at Dozier increased more over that period, and the management regimes differed in a number of important ways. On the face of it, however, there was no evidence that the Eckerd Foundation was managing the facility at a lower cost.
(ii) In 1983-84, the operation costs per capita at Okeechobee were 15% lower than the operation costs at Dozier. However, in that year the Eckerd Foundation had agreed to inject additional funds into the facility to pay for extra staff. Since this expenditure was non-sustainable, an estimate was made of the cost per inmate if that subsidy had not been paid. On this basis, Okeechobee was costing 11.3% less per capita than Dozier. However, in 1981-82, when Okeechobee was managed by the state, the operation costs were already 10.7% lower than at Dozier.
The study concluded that ‘the Eckerd Foundation has achieved no significant reduction in cost of operation of the Florida School for Boys at Okeechobee.’ In a separate report, one of the authors of the study concluded:
Prior to the transfer. . . Florida spent 4 percent less to manage Okeechobee than Dozier; after the shift to Eckerd. . . the total cost to manage Okeechobee was 3 percent less than Dozier. Okeechobee’s per capita costs under Eckerd Foundation management increased less than Dozier’s during this time span – to the credit of the Foundation. However, the dramatic decrease anticipated (and promised – variously stated at the outset as a 10% or 5% reduction) has not been realized.97
Methodology: This study looked at the cost of operating these facilities in some detail, and sought to clarify the comparability of the populations at the two schools. The scale of the two institutions was broadly comparable (350-400 residents); the clients at the two schools were of equal age. However, Okeechobee had more black students, and a higher percentage with more serious offences, and a closer analysis was done of the personality and behavioural profiles of students in both schools. This concluded that the differences in the distribution of clients at the two schools were not statistically significant across four classifications. Education programs at the two schools were similar, although the use of different test regimes made comparison of outcomes difficult to compare.
Quality at the two schools was also compared, looking at escape rates (where the number of escapes was so small that no statistically meaningful comparison could be made); assault rates (where the data was not recorded consistently); and placement in detention (where Okeechobee was less successful than Dozier at handling one

Competitive Edge: The Evidence
51
of the most difficult-to-handle sub-groups). In summary, the researchers concluded that ‘the Eckerd Foundation appears to have delivered a program of equal quality to that conducted by the State.’ Staff surveys, however, showed that personnel at Okeechobee were significantly less satisfied with the performance of their institution on a number of measures. And a site visit by a corrections professional also reported significant problems at the contracted facility. However, much of this was the result of a period of turmoil immediately following the introduction of a new regime, and a second visit by the corrections professional a year later found the management at Okeechobee much improved. The diet at Okeechobee appears to have been better in certain respects than at Dozier: for example, the Eckerd Foundation was providing its residents with better quality meat.
There was no explicit discussion of the profile of the population at Okeechobee before and after contracting, but it appears to have remained broadly comparable. Prior to being contracted, the physical plant at Okeechobee had been allowed to run down, staff turnover was high and the facility had been cited in a federal court case. One of the differences after contracting was that spending on plant and equipment was 62% higher in the first full year. At first this was financed through reduced staff:client ratios and more demanding working conditions, however, within the first year, this position was rectified and (in effect) equipment renewal was financed through an injection of funds from the Eckerd Foundation.
The methodology used for costing these alternatives was not directly comparable. The cost of Dozier failed to take into account office overheads or the benefits of relying on the state’s system of self-insurance. It is unclear whether the costs of monitoring Okeechobee were included. The Eckerd Foundation spent a significantly higher amount on equipment (37% more in 1983-84 than at Dozier), reflecting the run-down nature of the Okeechobee facility prior to transfer.
Sources of benefits: The Eckerd Foundation experimented with increasing the number of clients per staff member (based on a very different supervision model) but quickly returned to the levels employed prior to contracting. By contrast, Dozier significantly reduced the numbers of clients per staff member over this period (1981-82 to 1983-84).
Managers operating under Florida’s Department of Health and Rehabilitative Services were faced with more complex personnel procedures. By contrast, the superintendent at Okeechobee had the freedom to hire, fire and exceed the minimum salary as long as he stayed within budget. However, at Okeechobee, Eckert Foundation counsellors were expected to work with their clients for much longer hours (whilst also having somewhat more generous terms and conditions). As a result, the Foundation had extremely high turnover rates. In the second full year of operation, this situation had largely normalised, although the impact of this on personnel costs was not reported.
The report acknowledged that management at Okeechobee had much greater flexibility in the purchase of commodities, with little delay in receiving goods. They were also able to take advantage of the purchasing power of the Eckerd Drug Corporation. In particular, the Eckert Foundation organised weekly delivery of food products, while the state had a three-month purchasing cycle. The state was buying its food more cheaply, but the quality was not as high.
The Eckert Foundation was also able to allocate significantly more staff to education. In part, this was because it was able to build its educational programme into the operation of the facility. By contrast, at Dozier, education was provided by the county school board, which did not allow as much flexibility, and the supervisors had less control over funding.
Critical analysis: Logan noted that Jack Eckerd had not promised that costs would decrease over time, but that he could run the school for less than the state could. An early claim of 10% lower costs was reduced to 5% before bids were solicited. Logan contended that the evidence showed that Eckerd achieved a lower rate of increase than at Dozier.98

Competitive Edge: The Evidence
52
Table 3.1: Florida – Operating Costs per capita, at Okeechobee and Dozier Schools for Boys, 1982-1984
1981-82 (Before) 1982-83 (Transition) 1983-84 (After)
Dozier $12,155 $13,604 (+10.7%) $17,215 (+41.6%)
Okeechobee $10,853 $11,310 (+4.2%) $14,617 (+34.7%)
Differential 6.5% 6.9%
Salary costs per capita at Dozier rose by 45% over the period 1981-82 to 1983-84, compared with 24% at Okeechobee, so that in 1983-84, they amounted to 75% of net cost at Dozier, and only 64% at Okeechobee.
McDonald argued that the evaluation team had failed to treat capital spending correctly, resulting in an inaccurate picture of operating costs.99 Moreover, the cost comparison of the two facilities failed to take into account the investment in plant and equipment that the Foundation was making in this period.
3.3 Pennsylvania Legislature, ‘Report on a Study of Issues Related to the Potential Operation of Private Prisons in Pennsylvania’, 1985100
Description: Staff of the Legislative Budget and Finance Committee compared the per diem costs of six publicly operated federal immigration detention facilities with five privately managed facilities in 1985.
Findings: The average per diem cost of the six publicly managed facilities was $31.89, compared with $37.26 for the five privately managed ones, a 17% difference.
Methodology: Staff had obtained information from the Immigration and Naturalization Service as of July 1985. The authors recognised that these raw numbers failed to take account of such factors as facility location, population, type of security and type of facility.
Critical analysis: McDonald questioned the comparability of the accounting methodology used between public and private sectors: ‘Public accounting procedures usually ignore costs that are carried by other agencies or by more general government accounts, which results in undercounting the actual direct costs of government services.’101
The authors admitted that these two groups of facilities were not comparable. The study covered a single year. And the results were sensitive to the sample: in both groups, there was one facility in both groups with substantially higher costs – when these outriders were omitted, the average costs were virtually identical.
3.4 John D. Donahue, ‘Prisons for Profit: Public Justice, Private Interests’, 1988102
Description: Donahue compared 1,040 public and 1,996 private custodial centres for juveniles across the United States, using data from 1982 and 1985.
Findings: Total costs were marginally higher for the private facilities, although Donahue recognised that this would have been affected by higher capital spending ratios in the private sector. Operating costs were lower for the private sector centres, but only by 3%.
Methodology: Data were drawn from published and unpublished sources in the Statistical Abstract 1987. Public and private facilities were not directly comparable – the private facilities were much smaller (averaging 17 residents per facility, compared to 48 for the public sector), but overcrowding levels were higher in the public sector, as were turnover rates (reflected in the lower average length of stay – 33 days compared with 120 for the private sector). On average, the residents of public facilities were slightly older, and thus (perhaps) more difficult to manage. Donahue reported that the private sector had also been investing more in new facilities.
Sources of benefits: Average staff-to-resident ratios were similar in the two groups of facilities.

Competitive Edge: The Evidence
53
Critical analysis: As the author acknowledged, the two groups of facilities were not directly comparable, and it does not seem that regression analysis was undertaken. McDonald criticised the lack of common accounting rules for both sectors.103
3.5 Charles Logan and Bill W. McGriff, ‘Comparing Costs of Public and Private Prisons: A Case Study’, 1989104
Description: A study of Silverdale Detention Centre, a 350-bed minimum to medium security facility in Hamilton County, Tennessee, over three years from 1985 to 1988, comparing the actual costs involved in contract management, with the estimated costs of county management.
Findings: Contract management, including monitoring, cost 3.8%, 3% and 8.1% less than the estimate for county management, across the three years under study.
Methodology: The study compared costs for the three years 1985-86 to 1987-88, based on an ongoing comparison undertaken by the county auditor. It was assumed that if the county resumed the operation of the facility, it would retain the same staffing levels, a conservative assumption, since it neglected what staffing levels would have been if the facility had remained under county management. Salaries were adjusted in line with the rates paid to county employees, and non-salary costs according to the Consumer Price Index.
This study was careful in seeking to include all of the costs associated with operating such a facility under public management, including fringe benefits, property and liability insurance, county hospital care and depreciation, as well as the indirect costs such as the use of the county’s finance and human resources administrators, as well as its auditor, attorney and physician. The county auditor had repeatedly emphasised the conservative nature of these estimates.
The cost of operation under contract included ongoing monitoring and management costs, although this failed to take into account the additional benefits to the public of independent monitoring and oversight. The contract was renegotiated every year, so that it is likely that the price was a sustainable one.
No comparison was made of the quality of services under the two arrangements, although other studies have pointed out that the contractual standards are more stringent, and guards were given more training.105
Sources of benefits: The study pointed to labour costs as the source of most of the differences. Other differences were consciously ignored by virtue of the design of the study.
Critical analysis: Logan argued that given the conservatism of these estimates, the true savings could be in the order of 5-15%.106 McDonald described it as one of the most rigorous studies conducted to date. He concluded that the authors had sought to maximise comparability and the county auditor had attempted to treat public and private costs in the same way.107
3.6 Harry P. Hatry et al, ‘Comparison of Privately and Publicly Operated Corrections Facilities in Kentucky and Massachusetts’, 1989108
a. Kentucky
Description: (i) This study compared two adult minimum-security facilities for the year 1987-88: the Blackburn Correctional Complex (public) and the Marion Adjustment Center (private). The latter facility was designed, built and operated by a for-profit company that had won the contract through competitive bidding; it had been in operation for two years at the time of the study. (ii) The authors also compared the actual cost of operating the private prison with the estimated cost if the state had constructed and operated an identical facility.
Findings: (i) The total cost of the private facility was 10% higher per inmate day, but this was not an apples-for-apples comparison.

Competitive Edge: The Evidence
54
(ii) Assuming that the state had built, financed and operated its own facility, the authors concluded that the public facility would have been 20% to 28% higher than the private one.
Methodology: (i) The authors were concerned that the populations of the two existing institutions might not be directly comparable, since inmates for the private prison were assigned based on their risk to society if they were to escape. However, a study of inmate characteristics led them to conclude that they were similar populations.
In other respects, the two facilities were not alike. In this part of the study, the figures for the private prison included capital costs in the contract price, but not those for the public prison. In terms of prisoner numbers, Blackburn was also much larger than Marion (around 75%), so that there was the likelihood of scale economies associated with the former.
(ii) A further study was undertaken, estimating the additional capital costs if the state had erected and operated its own facility on a similar basis as the Marion Adjustment Center. The methodology upon which this comparison was made was not available for analysis, the authors simply stating: ‘we also estimated the additional capital construction cost had the state chosen to build its own facility and subsequently operate and manage it’.
The authors used surveys, physical observation, interviews and agency data to compare the qualitative performance of the two facilities, concluding that ‘for a substantial majority of these performance indicators, the privately operated facilities had at least a small advantage’.
Sources of benefits: Salaries were somewhat higher in the publicly managed facility, and the workforce was older and more experienced.
Critical analysis: Gaes et al took the view that common methodological procedures were employed in the collection of data. In spite of the authors’ reassurance that they were satisfied in the broad similarity of the inmate populations, Gaes et al were concerned about the differences in the inmate profiles. Moreover, there were some weaknesses in the qualitative comparisons.109 On the other hand, it was likely that the public facility enjoyed the advantages of greater scale.
b. Massachusetts
Description: In this case, the authors considered two pairs of small juvenile secure treatment facilities for the year 1987-88. The two private operators were not-for-profit organisations, and the services provided were confined to educational and welfare programmes. Facilities maintenance and utility costs were provided by the state.
Findings: The average cost of the publicly operated facilities was around one percent lower than that of the privately managed ones, although the public sector figures did not include capital costs.
Methodology: The authors worked with officials from the Department of Youth Services to select two pairs of comparable facilities. In this case, the assignment of prisoners to public and private facilities was essentially random.
As noted above, the authors paid significant attention to the quality of service at the various facilities, concluding that standards were at least slightly better in the private facilities: ‘By and large, staff in the privately operated [facilities] appeared to be more enthusiastic about their work, more involved in their work, and more interested in working with the inmates than their public counterparts.’
The authors used surveys, physical observation, interviews and agency data to compare the performance of the two facilities, concluding that ‘for a substantial majority of these performance indicators, the privately operated facilities had at least a small advantage’.

Competitive Edge: The Evidence
55
Sources of benefits: Salaries were somewhat higher in the public facilities, and the workforce was older and more experienced. Management-wise, the privately-operated facilities appeared to be more flexible and less regimented, with staff subject to less stringent controls.’
Critical analysis: Contracting was confined to front-line services – the management of programmes – and did not include support services – utilities and facilities – thus limiting the scope for reform. There was also some evidence to suggest that this was a mature market, with secure care for juveniles having been contracted for around twenty years. Competition had primarily been limited to two or three principal contractors.
Gaes et al considered that common methodologies had been used in the collection of data, but in this case argued that the private facilities housed a more difficult population. They also pointed to deficiencies in the qualitative comparisons. Among other things, they mentioned a heavy reliance on staff responses, arguing that the responses from inmates were virtually indistinguishable between these facilities.110 Segal and Moore thought this was one of the weaker studies.111
3.7 Martin P. Sellers, ‘Private and Public Prisons: A Comparison of Costs, Programs and Facilities’, 1989112
Description: Three pairs of publicly and privately managed prisons in Pennsylvania, Tennessee and New Jersey were compared: (i) a private maximum security juvenile detention centre, Weaversville Intensive Treatment Unit, with the publicly managed North Central Secure Treatment Unit, both located in Pennsylvania; (ii) a privately managed county prison in Pennsylvania with a publicly managed county facility in New Jersey; and (iii) two maximum security prisons, Silverdale Detention Center (private) in Tennessee, and the Warren County Prison (public) in New Jersey.
Findings: (i) Weaversville (private) and North Central (public) were both small maximum-security juvenile detention centres. Costs were averaged over three years, 1985 to 1987, and weighted according to the number of programmes available. Data from the Pennsylvania Department of State Department indicated that the weighted average costs per inmate per day were 13% lower in the privately managed facility. However, the data collected from operators during the survey reported weighted costs, averaged over the three years, that were 35% lower.
(ii) Comparison of Butler County Prison (private) with the Salem County Prison (public), both maximum-security institutions, for FY1987. The weighted cost per prisoner per day was 12% lower in the privately managed prison. These two facilities were not directly comparable, although overcrowding in the public facility would have reduced its costs relative to the private provider. Some information was available on the range of programmes offered, but not on other qualitative measures. Salem County Prison was 94% overcrowded, so that the gymnasium had been converted to cell blocks, while Butler was operating at 90% of capacity. The impact of overcrowding should have reduced the cost per prisoner, suggesting a bias in favour of the public prison.
(iii) Silverdale Prison (private) and Warren County Correctional Center (public), for FY1986 and FY1987. The weighted costs per inmate per diem (averaged over two years) were 60% less in the privately managed prison. Again, the range of services was compared, but not other qualitative differences. The private facility was four times the size of the public comparator.
Methodology: With the assistance of local government officials, the authors selected three pairs of facilities that were closely comparable on size, location, structure, age, type, capacity, and average daily occupancy. The study drew on structured interviews with senior prison officials and staff during on-site visits conducted in 1987. The researcher compared the range of available programmes (such as health and education), but no information was available on a wide range of other qualitative factors such as security.
Cost data were obtained from the operators, although in one set of comparisons, cost information for the public and private facilities was also supplied by state officials. The details of the accounting methodology were not spelled out, and the author acknowledged the possibility of unreported expenditures on both sides, but for reasons that were not explained, he expected that they would cancel each other out.

Competitive Edge: The Evidence
56
Sources of benefits: In the small high security juvenile detention centres, there was no significant difference in teacher-to-inmate ratios, although there was a difference in the administrative staff-to-inmate ratios – in the private facility this was nearly 1:1, while at the public institution it was 1.25:1.
Looking at the county prisons, the cost differential could not be explained by staff ratios: the private facility had a slightly higher guard-to-inmate ratios (with somewhat fewer inmates for each guard), while the number of administrative staff compared to inmates was much higher in the private prison (a ratio of 1:10 in the private facility compared to 1:23).
In the other two prisons, administration-to-inmate ratios were comparable, but guard-to-inmate ratios were much lower in the private facility (1:6.25 compared with 1:2).
Critical analysis: While the author may have pursued comparability, the facilities were not similar in a number of respects, and important dimensions of comparability were not addressed. Austin and Coventry criticised the failure to control for facility design and inmate characteristics.113 Segal and Moore listed this among the weaker studies, based on methodology.114
3.8 Douglas C. McDonald, ‘The Costs of Operating Public and Private Correctional Facilities’, 1990115
Description: A comparison of twelve immigration detention centres, seven facilities operated by the United States Immigration and Naturalization Service, and up to five facilities managed for the INS by private companies, covering the period 1984 to 1989.
Findings: The average cost per contracted bed in the privately managed facilities was lower than the average cost per bed in the INS-operated centres in five of the six years, 1984-89 (by 4.5% to 18.7%), and higher in the other.
However, these results were sensitive to the characteristics of the facilities selected for the sample and to occupancy rates. A sudden change from 1988 (where the contract average was 15% lower than the INS average) to 1989 (where the contract average was 14% higher) was largely explained by a sudden increase in the number of detainees in the public facilities.
Methodology: The two groups were not directly comparable, since both public and private facilities differed significantly according to location, size and utilisation. The various private facilities also operated under quite different contractual arrangements, resulting in them having varying levels of management autonomy.
The daily costs per capita for the INS facilities were as reported by the INS, and no information was provided on the methodology employed. Likewise, the costs for the contracted facilities were estimates, since data on actual billing for all years was lacking. However, based on one year’s comparison with the amounts actually billed, McDonald concluded that the estimates were ‘probably good indicators of the actual amounts charged’.
The author argued that INS expenditures undercounted what it really cost to operate the facilities in public hands:
Costs not counted in the INS agency budget include the value of all capital assets consumed, legal services, insurance and other liability costs, administrative overhead, external oversight, and other interagency costs. Moreover, the reported costs of the government-operated detention facilities do not include spending by the higher levels of INS administration. . . Including these categories of direct expenditure increases the actual cost of the government operations by about 4 or 5 percent. . . No
attempt is made here to estimate the value of the capital assets owned by the INS in its facilities.116
On the other hand, there were some costs not counted on the private sector’s side: in particular, transaction costs associated with developing and negotiating contracts, and ongoing monitoring costs. McDonald concluded that in relation to the INS contracts, the transaction costs were negligible, and monitoring costs would add around 1% to the per diem costs. If all the uncounted costs were included, the author felt that the cost difference between the public and private facilities would probably widen by something in excess of 4 or 5%.

Competitive Edge: The Evidence
57
On the other hand, the results were sensitive to occupancy levels and given that the private detention centres had significantly higher occupancy rates than the public ones (91% compared to 79%), the cost differential was not as great as it had appeared: ‘Had the public facilities operated at 91 percent occupancy, the average cost per head would have been quite close to the private facilities’ costs – perhaps $34.50 or less.’
A direct comparison of the qualitative performance of these various facilities was not undertaken, the INS contracting office told the author of the study that the services provided by the private firms were generally comparable with, and no worse than, those provided by the public sector.
The results were also sensitive to variations in the sample of comparators used. If the two most expensive facilities – both operated by the public sector – were excluded from the study, the average per capita cost of the INS-operated facilities fell below that private sector average.
Sources of benefits: There was some evidence to suggest that salaries and benefits accounted for some of the difference. A private facility based in Denver paid a total benefits package in the range of $8.17, which compared with an average for all of the public facilities of $10.71. However, this was probably due to a locational advantage, since a private facility in New York City was paying higher salaries than the INS generally paid in order to attract and maintain staff.
Critical analysis: As the author acknowledged, the results were sensitive to the facilities included in the sample, and to occupancy rates. In terms of data quality, there was probably a bias in favour of the INS centres, but firm conclusions were not possible based on this study.
3.9 Texas Sunset Advisory Commission, ‘Contracts for Correctional Facilities and Services’, 1990; Texas Performance Review, ‘Breaking the Mold: New Ways to Govern Texas’, 1991117
Description: (i) The Sunset Advisory Commission compared the actual cost of managing four pre-release facilities in Texas, operated by two prison management companies, with the estimated cost if the state had operated equivalent facilities. The estimate was made as at August 1990 when the facilities had been open for one year.
(ii) The following year, as part of the Texas Performance Review, the Comptroller of Public Accounts published average costs per prisoner day for FY1991 for state, new ‘prototype’ prisons and privately-managed facilities.
(iii) Using the Sunset Advisory Commission’s methodology, the Comptroller also compared the cost of public and private operation of 500-, 1,000- and 2,250-bed units.
Findings: (i) According to the Sunset Advisory Commission, in 1990, the cost per day for the private facilities was 9-10% less than the equivalent cost of equivalent facilities managed by the state, however this did not take the prison companies’ tax payments into account. When taxes were incorporated in the calculations, the difference was in excess of 14%.
(ii) The Texas Comptroller of Public Accounts used cost per prisoner day for the fiscal year 1991. The weighted average for the state’s prisons was $42.47, with a wide variation depending on the individual unit (£32.35 for a 1,225-bed unit to $62.08 for a female unit). The average cost of the 1,000-bed prototype prisons was $33.55. Private prisons cost $35.35 per prisoner day, however when debt service costs were excluded, this fell to £29.25.
(iii) The Comptroller also compared the cost of the public and private sectors operating 500-bed and 1,000-bed units. In the former case, the privately managed prisons were around 17% less costly; in the latter case, around 9%.
Methodology: (i) The Texas Sunset Advisory Commission requested the Texas Department of Criminal Justice (TDCJ) to prepare two estimates, which were reviewed by the state auditor’s office.
The first was the total cost incurred by the state from the prison contracts, including total contract payments (an actual amount), monitoring costs and the cost of other services provided by the TDCJ (mostly inmate classification and medical services), and a reasonable allocation of TDCJ ‘central administration’ costs (or overheads).
Competitive Edge: The Evidence
58
This calculation did not include the contribution made by the companies in state and local taxes, although a report by the Comptroller of Public Accounts the following year did include these in the calculation of benefits.
The second was an estimate of the cost if the TDCJ were to operate equivalent facilities, including all direct and indirect costs. The TDCJ did not operate comparable facilities, and the Commission concluded that a comparison of quality of service was not possible. A TDCJ audit of performance was not available at the time of publication. However, a survey was also conducted by the Texas Performance Review the following year at three of the private prisons, which among other things, asked inmates to compare these facilities to the performance of state institutions. While the detailed results were not published, the private prisons were rated as substantially better in some respects and the same in others. The state prison facilities rated substantially better only on the quantity of food.
(ii) The Comptroller of Public Accounts published the 1991 averages for the state prisons, the 1,000-bed prototype prisons (constructed after 1996) and the contract prisons. Other than recognising the wide variety that existed across the state system, this report did not address the comparability of these classes of facility. Among other differences, private companies were statutorily forbidden from operating a facility larger than 500 beds.
(iii) However, an attempt was made to compare apples and apples by assessing the hypothetical costs of the public and private sectors operating 500, 1,000 and 2,250-bed facilities. The methodology was the same as that adopted by the Sunset Advisory Commission. Contract costs included oversight and overhead costs and the reduction in overall cost based on taxes paid.
The Comptroller recognised that the quality of services had not been assessed in Texas, although the Texas Performance Review conducted a prisoner survey (referred to above) which suggested that private prisons were superior in some respects and inferior in others.
Critical analysis: The General Accounting Office noted that since the state did not actually operate facilities with pre-release components, the cost estimates for the state-run facilities were not based on actual experience. The method adopted assumed no unexpected changes in expenses, and a different assumption could have resulted in different cost estimates.118 Given the quality of other studies and the conservatism of these estimates, these caveats seem unfair.
The GAO also noted that because of an absence of comparable state facilities, an empirical assessment of service quality had not been conducted. It was recognised that two of the four private facilities had ACA accreditation and that all four were in general compliance with most of the court mandates.119 The GAO neglected to mention the prisoner survey conducted by the Texas Performance Review, which found that the contract prisons were superior in some ways and inferior in others.
Nelson argued that the results were sensitive to assumptions about tax benefits and the allocation of overheads. Excluding these items, the estimated differences between the private and the hypothetical public facilities were 5% and 6.2%.120 Since there were sound reasons for including these costs, Nelson’s approach is not better than that of the authors.
3.10 Dale K. Sechrest & David Schichor, ‘Comparing Public and Private Correctional Facilities in California: An Exploratory Study’, 1993121
Description: Preliminary reports of a study of two public and one private community correctional facilities (CCFs) in California for the year 1991-92, with comparison of their performance against prisons operated by the California Department of Corrections (CDC).
Three different CCFs were studied: (i) a public institution operated by a local police department (Public CCF1); (ii) a public facility by the city administration of a small community (Public CCF2); and (iii) a private community correctional facility operated by a company under contract to the California Department of Corrections.
Findings: (i) The authors compared the costs of managing departmental institutions with the costs of maintaining an inmate in the three community correctional facilities. They recognised that there were significant differences in
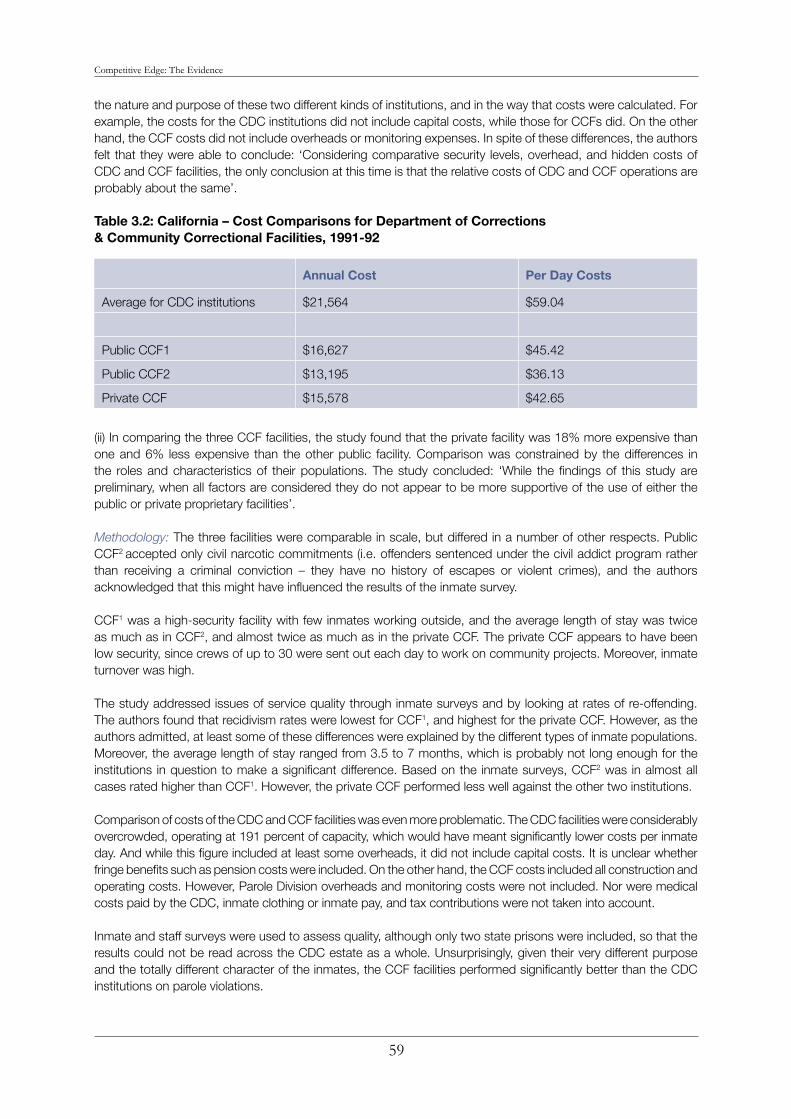
Competitive Edge: The Evidence
59
the nature and purpose of these two different kinds of institutions, and in the way that costs were calculated. For example, the costs for the CDC institutions did not include capital costs, while those for CCFs did. On the other hand, the CCF costs did not include overheads or monitoring expenses. In spite of these differences, the authors felt that they were able to conclude: ‘Considering comparative security levels, overhead, and hidden costs of CDC and CCF facilities, the only conclusion at this time is that the relative costs of CDC and CCF operations are probably about the same’.
Table 3.2: California – Cost Comparisons for Department of Corrections & Community Correctional Facilities, 1991-92
Annual Cost Per Day Costs
Average for CDC institutions $21,564 $59.04
Public CCF1 $16,627 $45.42
Public CCF2 $13,195 $36.13
Private CCF $15,578 $42.65
(ii) In comparing the three CCF facilities, the study found that the private facility was 18% more expensive than one and 6% less expensive than the other public facility. Comparison was constrained by the differences in the roles and characteristics of their populations. The study concluded: ‘While the findings of this study are preliminary, when all factors are considered they do not appear to be more supportive of the use of either the public or private proprietary facilities’.
Methodology: The three facilities were comparable in scale, but differed in a number of other respects. Public CCF2 accepted only civil narcotic commitments (i.e. offenders sentenced under the civil addict program rather than receiving a criminal conviction – they have no history of escapes or violent crimes), and the authors acknowledged that this might have influenced the results of the inmate survey.
CCF1 was a high-security facility with few inmates working outside, and the average length of stay was twice as much as in CCF2, and almost twice as much as in the private CCF. The private CCF appears to have been low security, since crews of up to 30 were sent out each day to work on community projects. Moreover, inmate turnover was high.
The study addressed issues of service quality through inmate surveys and by looking at rates of re-offending. The authors found that recidivism rates were lowest for CCF1, and highest for the private CCF. However, as the authors admitted, at least some of these differences were explained by the different types of inmate populations. Moreover, the average length of stay ranged from 3.5 to 7 months, which is probably not long enough for the institutions in question to make a significant difference. Based on the inmate surveys, CCF2 was in almost all cases rated higher than CCF1. However, the private CCF performed less well against the other two institutions.
Comparison of costs of the CDC and CCF facilities was even more problematic. The CDC facilities were considerably overcrowded, operating at 191 percent of capacity, which would have meant significantly lower costs per inmate day. And while this figure included at least some overheads, it did not include capital costs. It is unclear whether fringe benefits such as pension costs were included. On the other hand, the CCF costs included all construction and operating costs. However, Parole Division overheads and monitoring costs were not included. Nor were medical costs paid by the CDC, inmate clothing or inmate pay, and tax contributions were not taken into account.
Inmate and staff surveys were used to assess quality, although only two state prisons were included, so that the results could not be read across the CDC estate as a whole. Unsurprisingly, given their very different purpose and the totally different character of the inmates, the CCF facilities performed significantly better than the CDC institutions on parole violations.
Competitive Edge: The Evidence
60
Critical analysis: The GAO argued that ‘due to methodological limitations, conclusions could not be reached by comparing the three for-profit community correctional facilities with other state correctional facilities’.122 This study was also described as methodologically weak by Segal and Moore.123 Gaes et al argued that methodological limitations made it difficult to draw any overall conclusions about the comparative quality of service.124
The public proprietary facilities considered in this study were established by small municipalities with a view to local job creation and profit-making (with the intention of supplementing local budgets). As such, they were competing against private companies in a loosely-structured market for community correctional places. This means that the three CCFs were operating in a climate of contestability, and the meaningful comparison, if one could be made, was that between these facilities and those operated by the CDC. However, as noted, the authors did not have sufficient information to make a meaningful comparison.
3.11 Tennessee Legislative Fiscal Review Committee, ‘Cost Comparison of Correctional Centers’, 1995125
Description: Comparison of the operating cost of the South Central Correctional Center, a privately managed prison in the first full year of operation, with the average cost to the state of operating the Northeast Correctional Center and the Northwest Correctional Center, for 1993-94. This study looked at the cost to the company of operating South Central, and thus attempted to measure the comparative efficiency of the two enterprises.
Findings: The average operating cost per prisoner day for the two state prisons was $35.76, compared with $35.38 for the privately managed facility, a difference of around 1%. The Fiscal Review Committee (FRC) concluded: ‘the contractor did provide at least the same quality of services as the state at a lower cost’, although this was a formal finding as required under its terms of reference.
Methodology: The three facilities were not directly comparable. Both the state facilities had higher average daily populations, but the comparators were adjusted to take account of this. No information was provided on the other dimensions of comparability.
The study was based on detailed quarterly financial statements for the facilities submitted by the Department of Correction and by the contractor. Costs and adjustments used by the contractor were reviewed by the public accounting firm that audited its records, while the Comptroller of the Treasury reviewed the state’s costs and adjustments.
Monitoring costs were added to the cost of contracting and overheads were allocated on the basis of prisoner numbers. Medical and mental health costs were omitted from both. However, no adjustment was made to take into account the private operator’s tax payments.
A separate investigation was conducted by the Select Oversight Committee on Corrections, which evaluated safety, security and programmes and activities across the three institutions, arriving at the conclusion that they operated at essentially the same standard.126
Sources of benefits: Nelson showed that personnel costs were significantly lower at South Central – up to 20% when compared with one of the state prisons, and as much as 32% in the case of custodial staff. This was partly compensated by much higher corporate overheads, including profits.127
Critical analysis: The study conducted by the Washington State Legislative Budget Committee (LBC), published the following year, disagreed with the FRC’s approach in comparing the cost of the public prisons to the state with the cost of the contract prison to the company. For them, the relevant comparator was the cost to the state of all three facilities. On this basis, and adjusting for the larger capacity of the public institutions, South Central was 5.5% less costly than the average of the two state prisons (on this, see below).
Nelson regarded this as her ideal study, ‘unique in its attention to detail’ in allocating line item cost data to specific management functions. However, she argued it still suffered from limitations: it covered a single year, it excluded medical expenses incurred by the private contractor, and it addressed comparable costs and not whether contracting out had saved the taxpayers of Tennessee money.

Competitive Edge: The Evidence
61
She was not able to overcome the first of these deficiencies, so her conclusions had to be similarly qualified. The FRC had omitted medical costs from both the state and the privately managed prisons, and this was an issue for Nelson because she was attempting a different kind of analysis. Nelson’s third concern was a difference of opinion over what should be measured: she agreed with the FRC that the relative efficiency of the two institutions should be studied, while the Washington LBC thought that relative cost to the state was what mattered.
Nelson estimated that, adjusting for differences in the scale of the facilities, medical costs and overheads, South Central was around 4% more efficient than the state prisons. When she compared the costs to the state, South Central was around 6.3% less costly.
The GAO also described this as the most systematic attempt to assess both the cost and quality of service. The facilities were regarded as generally comparable and the inmates were similar according to most measures. Similar criteria were used to compare operating costs.128 However, other studies have argued that, in spite of this being one of the better comparisons, ‘there were wide discrepancies in the average age and racial composition of inmates among the three comparison prisons’. This analysis insisted that some attempt should be made to control for such variables, rather than simply assuming that such differences were unimportant.129
A 2005 report prepared by a consultant to the Tennessee Select Oversight Committee on Corrections, compared the South Central Correctional Facility with these same two state prisons, the Northeast Correctional Complex and the Northwest Correctional Complex, looking at security and control, inmate care, institutional safety and administration, and developed a score that showed that the contracted facility was performing to a slightly higher standard.130
3.12 OPPAGA, ‘Florida, Review of Correctional Privatization’, 1995131
Description: The first privately managed prison in Florida, for housing adult females, was let by the Florida Department of Corrections and opened in March 1995. Shortly thereafter, contracts were awarded for three adult male facilities by the Correctional Privatization Commission, under a law which required the Commission to determine that a contract would result in cost savings to the state of at least 7% over similar public facility costs prior to entering into a contract. This was a preliminary review by the state auditor of the projected savings of these four contracts.
Findings: Adjustments were made to the costs of the comparators. The Office of Program Policy Analysis and Government Accountability (OPPGA) reported that, based on these adjustments, the Commission had determined that each of the three facilities it had contracted had projected savings of 10%. Using this same methodology, the facility contracted by the Department of Corrections had projected cost savings of around 14%.
Methodology: The Correctional Privatization Commission had adjusted state costs for operating comparable facilities to take into account the fact that the private facilities operated under a much higher standard of education and substance abuse programs.
OPPAGA was critical of this approach: ‘differences in programs provided by the Department and private prisons limit the reliability of these cost comparisons’. Moreover, differences in the scale and mission of prisons could affect comparison of costs in future.
Critical analysis: As noted, OPPAGA was concerned that the public and private facilities were not directly comparable. It was regarded as methodologically weak by Segal and Moore.132
There are questions as to the extent of competition in these examples. OPPAGA reported that the Department of Corrections generally required contractors to mirror its own operations, and the Request for Proposals was seen as highly prescriptive. In the case of the Correctional Privatization Commission, OPPAGA found that the statute required the Commission to select the ‘most qualified’ vendor, so that for four of six contracts that it had awarded, the ‘most qualified’ was also the highest bidder, even though lower bids were submitted by highly qualified vendors.

Competitive Edge: The Evidence
62
3.13 OPPAGA, Florida, ‘Performance Audit of the Gadsden Correctional Institution’, 1996133
Description: A review of the Gadsden Correctional Institution, Florida’s first contract prison. The review looked at the contract to construct and manage the Institution in its first year of operation (March 1995 to February 1996). The contract was let by the Florida Department of Corrections, and shortly before it opened, it was re-roled from an adult male facility to an adult female facility. A state institution (Jefferson Correctional Institution) was selected as the comparator.
Findings: OPPAGA reported that the bid was 5% less than the Department of Corrections’ comparable cost for construction, and 11.6% less than the comparable per diem operating costs.
Based on the unaudited accounts for the first eight months, OPPAGA estimated the per diem cost of managing Jefferson, including indirect costs, at $50.05, compared with $42.30 for Gadsden, a difference of 15.5%. Gadsden was also significantly below the state-wide average for female institutions (at $53.68).
Methodology: The Department had identified Jefferson as the comparator based on proximity, security levels, size and mission, but the profiles of the inmate populations diverged after opening and the review noted that as at February 1996, the Department still had not developed procedures to compare cost and quality. OPPAGA suggested that the following factors needed to be considered: size, custody levels, medical needs, gender, security levels, geographic location, type and capacity of programmes offered.
Some portion of administrative overheads could justifiably have been allocated to the private facility, but the lack of detailed cost analysis procedures made this impossible at this time. OPPAGA noted that Jefferson’s per diem rate had fluctuated significantly since 1992-93, from $36.70 to $57.42.
Sources of benefits: OPPAGA undertook a comparison of wages and benefits at the two facilities. The contractor generally paid lower wages than the department, except for administrative staff. In the case of security staff, the difference ranged from 4% more to 40% less than at Jefferson, and in the case of programme staff, it ranged from 2% to 29% less. Fringe benefits were also less generous.
Critical analysis: As noted, the two facilities were not comparable and the per diem of the state prison was understated due to the exclusion of external administrative and support costs.
3.14 State of Washington Legislative Budget Committee, ‘Department of Corrections Privatization Feasibility Study’, 1996134
Description: As part of a policy investigation in to the feasibility of contracting prison management, the Legislative Budget Committee conducted its own brief case studies in two other states: (a) three prototypical facilities in Tennessee, two public (Northeast and Northwest) and one private (South Central) for the fiscal year, 1993-94; and (b) two private (Allen and Winn) and one public (Avoyelles) prototypical facilities in Louisiana in 1995-96.
a. Tennessee
Findings: The authors concluded that Tennessee had probably achieved cost savings through competition and contracting. During 1993-94, the effective per diem rate for the private facility was around 2% less than the average for the two state-run facilities – higher than one and lower than the other. However, both state-run facilities had higher average daily populations, and when these were taken into account, the per diem cost per prisoner was 5.5% lower at the privately-managed facility.
Methodology: The Legislative Budget Committee based its cost comparison on data supplied by the Tennessee Fiscal Review Committee, making adjustments of its own. The major difference between the two studies was that the Washington study compared the costs to the state (looking at the actual payments made by the state to the company, adjusted to take account of monitoring etc), while the Tennessee study had compared the cost of the privately managed prisons to the company with the cost of the state managed prisons to the state. In the Washington study, some maintenance costs were added to the state-run facilities. Medical costs were eliminated from each of the calculations in this study and tax payments were credited to the contracted facility. Study of the

Competitive Edge: The Evidence
63
quality of services at the three institutions concluded that the standards were broadly comparable.
Sources of benefits: In both Tennessee and Louisiana, personnel and supplies accounted for 85-90% of operating costs, with personnel costs making up around 70% of this figure.
For the three private facilities considered in this study, staff numbers were 88-97% of the staffing in the state facilities, and average salaries were 69-83% of comparable staff salaries. The authors explained the implications:
If a private facility can operate at 90 percent of state staffing, and at 85 percent of average state salaries, this translates into a personnel savings of 24 percent. Since personnel costs comprise about 70 percent of all operating costs, this results in a savings to the total budget of approximately 16 percent.135
In the contract prisons they had studied, there was a greater tendency for management and staff to have responsibilities in more than one area, and there was more flexibility in the use of staff, meaning that fewer staff (and/or less overtime) were needed to cover mandatory posts.
As far as supplies were concerned, the study concluded that it appeared that the companies were making savings, although there was not sufficient information to estimate a percentage. ‘State and company officials in both states agreed that the private companies save money by not having to follow the state procurement rules.’ They could buy at competitive prices and were able to keep a smaller inventory.
State officials in Tennessee believed that competition from the private facility had contributed to keeping down costs in the state system.
As evidence of this, we observed during our site visits that the private facility’s estimate of additional staff needed for a proposed capacity expansion of 170 beds was less than half of the estimate made by one of the state-run facilities. We were told that this difference was causing closer scrutiny of the state prison’s request than might otherwise have occurred.136
Critical analysis: The GAO accepted that these facilities were of comparable size and there was little difference in the inmate populations.137 For Nelson’s comments on this study, see the note above on the report by the Tennessee Legislative Fiscal Review Committee.
b. Louisiana
Findings: In 1995-96, one of the privately managed facilities was costing 1% more than the state facility, and the other was costing 1% less. However, in 1993-94, the two privately run facilities were costing the state about 4% less, even though they were less densely populated.
Methodology: Adjustment to the costs of the state-run facility were made to reflect allocations made for past under-funding of the pension scheme, a cost that would exist regardless of whether the two contracted facilities were operated by the public or private sectors. Overheads such as records management and insurance costs paid by the state were added to the cost of the contracted facilities. No additional costs were added for monitoring the contract prisons on the basis that no additional monitoring was involved. Tax benefits were credited to the private facilities. The authors also conducted a qualitative comparison of the three institutions and concluded that they were broadly similar.
Sources of benefits: State correctional officials told the authors of the study that one explanation for the convergence of costs over time might be the effect of competition, combined with lean budget years. As noted above, the study concluded that contractors were saving on personnel costs and the cost of purchasing supplies. However, the authors noted that in Louisiana, the state spent less on benefits for current employees than the private sector, since the state government did not participate in the federal social security system. The state did have a retirement system, but the employer contribution was less than social security contributions.

Competitive Edge: The Evidence
64
Critical analysis: According to the GAO, these facilities and the inmate populations were broadly comparable.138 A more detailed study of these three facilities conducted at around the same time concluded that the authors of the Washington study had been provided with erroneous data. As noted below, Archambeault et al reported that, based on the averages for the five years 1991-92 to 1995-96, the two privately managed institutions were 11.7% and 13.8% more cost effective than the public facility.
3.15 George Mitchell, ‘Controlling Prison Costs in Wisconsin’, 1996139
Description: Comparison of two prisons – Jackson Correctional Institution in Wisconsin (public) and Prairie Correctional Facility in Minnesota (private) – in 1995.
Findings: The cost per prisoner day at Prairie in 1995 was $38.23, compared with $49.59 at Jackson, a difference of 23%.
Methodology: The two prisons were of similar age, with similar levels of crowding; the public facility had a somewhat larger population. No other information was provided as to comparability, such as security classifications, programmes and quality of service. The data for the two prisons were from different years, with one discounted to arrive at constant dollars. Both costings excluded overheads, although the author argued that it was likely that the overheads in the public prison were higher.
Sources of benefits: The author identified several explanations for the apparent lower cost: (i) The ratio of staff to inmates at Prairie was 22% lower than at Jackson (although Jackson had a high ratio compared to other Wisconsin prisons), and (ii) the total cost of salaries and fringe benefits was around 30% less. The author concluded that one of the reasons for the lower staff-to-inmate ratios at Prairie was the centralisation of programme and treatment staff, whereas Jackson used unit management which decentralised these functions to individual housing units. It appears that Prairie had created semi-autonomous management units, and had thus been able to achieve accreditation with the American Correctional Association, which otherwise insisted on unit management in prisons with more than 500 inmates.
Critical analysis: Segal and Moore included this among the more rigorous studies.140 In our view, there is not sufficient information to arrive at a conclusion as to comparability and data quality.
3.16 William G. Archambeault and Donald R. Deis Jr, ‘Cost Effectiveness Comparison of Private vs Public Prisons in Louisiana: A Comprehensive Analysis of Allen, Avoyelles, and Winn Correctional Centers’, 1996141
Description: A comparison of three medium-maximum security prisons in Louisiana, opened in 1989 and 1990. Two of these – the Winn and Allen Correctional Centers – were managed by private companies under contract to the Louisiana Department of Corrections, while the third – the Avoyelles Correctional Center – was operated by the state directly. Data were collected in 1995 and 1996.
Findings: Based on the averages for the five years 1991-92 to 1995-96, the two privately managed institutions were 11.7% and 13.8% more cost effective than the public facility.
Methodology: Data quality was high – information was checked with the respective reporting prisons and the authors detected clerical errors in the previous Washington State study. The authors reported that all three institutions were of comparable design and construction and had similar expansion histories and similar populations (in terms of numbers, types of offences, gender and ethnicity).
From a qualitative perspective, the prisons were different, but it was difficult to conclude whether services were better or worse in the private facilities. All three institutions were certified by the American Correctional Association, but the state prison offered a broader range of treatment, recreation and rehabilitation services. It offered a wider range of training courses, but the contract prisons had higher completion rates. The level of critical incidents (serious assaults) was much lower in the contract prisons, and they provided safer work environments for their staff and safer living environments for inmates. However, the state facility had no escapes over a 36-month period, while the two private facilities experienced 4 and 5 escapes respectively over a slightly longer period. The contract prisons also had higher rates of reported substance abuse.
Competitive Edge: The Evidence
65
Critical analysis: Segal and Moore regarded this as one of the more rigorous studies.142 Nelson had concerns about the accuracy of the data, questioning the allocation of some detailed cost elements. She also noted that in most years, Avoyelles did not spend its full budget allocation, and that in the final year of the study, 1995-96, the authors of this study had used the full budget allocation rather than the likely expenditure based on previous years. She also argued for an ‘avoidable cost’ approach to the treatment of overheads and pointed to inter-temporal accounting issues such as the treatment of pre-paid fees and inflation. The failure to account for the inflation was seen as compromising the authors’ statistical analyses. Taking into account all of her adjustments, Nelson found that, for the fiscal year 1995-96, Allen and Winn were less costly by 3.9% and 4.4% respectively. (She did not recalculate the five-year average.)143
Lappin et al acknowledged that these facilities were of a similar design, but pointed to differences in racial composition. While the authors had acknowledged these, they had not made adjustments. ‘Instead, their research design treated the prisons as though they differed in only random ways when this was clearly not the case.’ They also placed greater emphasis on escapes.144 Others have argued that the authors controlled for design, age and level of security, but not for the many other variables that can influence comparative cost.145
3.17 Charles W. Thomas, ‘Comparing the Costs and Performance of Public and Private Prisons in Arizona’, 1997146
Description: A study commissioned by the Arizona Department of Corrections, of the Marana Community Correctional Treatment Facility, a privately operated low risk institution, for the financial year 1995-96. The operating costs at Marana were compared with the average operating costs for all state-operated Level 2 prisons.
Findings: During 1995-96, the average operating costs per prisoner day for state-operated Level 2 (low risk) prisons was $43.08. The comparable figure for Marana, excluding property taxes paid by the company, was $37.13, a cost difference of 13.8%. When property taxes were included, the cost was $35.90, a difference of 16.7%. However, some individual state prisons were achieving greater cost economies and/or delivering better performance than Marana.
Methodology: The author issued a number of caveats in relation to this study – there was no state-operated prison in Arizona that housed a similar population to Marana or had similar programmes. A performance comparison was undertaken, concluding that in the areas of public safety, protecting staff and prisoners and compliance with professional standards, Marana was superior to the standards of state-operated Level Two prisons. The programmes delivered were so dissimilar that no fair comparisons could be made. ‘A balanced consideration of the entire set of several dozen individual performance indicators revealed that the overall performance record of the Marana Community Correctional Treatment Facility was superior to that of the state-operated Level Two prisons.’
Critical analysis: Segal and Moore listed this as one of the more rigorous studies.147 However, most critical analyses of the Thomas study have pointed to the lack of comparability (that was fully acknowledged). Gaes et al recognised that Thomas did not have many options, but the solution chosen – comparing Marana with the average for all minimum security institutions under public management – was still not satisfactory. This also suffered from being a one-point-in-time comparison. Marana was still in the activation stage when this study was conducted, which may have accounted for some of the comparatively less favourable performance.148
Austin and Coventry argued that it was not clear whether the lower costs at Marana were due to physical design and inmate population or other factors (although given that design was a feature that the state had commissioned from the private provider, this might be regarded as a relevant factor).149 Others have shared this criticism over comparability, arguing that Thomas controlled only for the level of physical security.150 Some questioned Thomas’s objectivity on account of these methodological weaknesses. Harding disagreed, arguing there was no sleight of hand. The data were there for all to see and other researchers could interpret them for themselves.151
Thomas later came under attack from a variety of sources when it was revealed that he and his ‘Private Corrections Project’ had financial ties to private prison companies, including a $3 million consulting fee from a prison management company. His research institute was closed and he was obliged by the Florida Commission on Ethics to pay a substantial fine. However, none of these criticisms went to the methodology or even the language adopted in this study.152
Competitive Edge: The Evidence
66
3.18 OPPAGA, Florida, ‘Review of Bay Correctional Facility and Moore Haven Correctional Facility’, 1998153
Description: A review of the first two prison contracts let by the Correctional Privatization Commission, for the Bay Correctional Facility and Moore Haven Correctional Facility, opened in March 1995. When these contracts were awarded, the Commission projected savings in excess of 7%, the minimum required by state law before a facility could be contracted.
This study compared the construction and operating costs of these two institutions with the adjusted costs of the most comparable public facilities for the fiscal year 1996-97.
Findings: (i) Construction – Bay Correctional Facility was around 30% more expensive to construct than the most comparable public sector prisons, and the cost of Moore Haven was broadly comparable.
Site acquisition and preparation costs were significantly lower for the private prisons, in spite of the fact that the land for the public facilities was donated by the state. Acquisition and preparation costs (per bed) for contract prisons were, respectively, 32% and 61% of the lowest cost public facility (and 15% and 29% of the cost of the most expensive). However, construction costs were higher at the private facilities: at Bay they were 45-83% higher, and at Moore Haven, 13-43%.
(ii) Operations – The cost of operating Bay Correctional Institution was similar to the most comparable public facility, while Moore Haven was around 4% less.
Methodology: (i) Construction – OPPAGA identified three public prisons that were also opened in 1995 as the public sector comparators. Other than the date of construction, no attempt seems to have been made to adjust the public sector’s construction costs based on comparability.
OPPAGA did not identify all of the reasons for the higher construction costs, but at least some of the difference was explained by the fact that the state prisons had access to inmate labour, a benefit not available to the prison contractors. Bay was somewhat more expensive than Moore Haven because it chose to house inmates in two-person cells rather than dormitories, but OPPAGA did not report whether the three public sector comparators also relied largely on dormitories. The authors of the study took the view that the tenders had not required prison contractors to provide a higher quality of accommodation, so the fact that Bay Correctional Facility provided cells was irrelevant from a costing perspective. However, it is relevant to an understanding of why its construction costs were so higher.
(ii) Operations – There were no public prisons that were directly comparable to the two private facilities, partly because the legislature specified that the latter were to provide more programmes.
So OPPAGA selected the most comparable public facility based on size and security levels, and then adjusted the costs (based on data from other public prisons) to take account of a range of other differences, such as: population, major maintenance works, medical costs, education programmes and substance abuse programmes, geographic location, treatment of indirect costs and taxation payments. Administrative overheads were a significant addition for both the public and the private prisons.
One of the main reasons why the two prisons did not meet the 7% threshold was that the Correctional Privatization Commission had failed to include indirect state costs (associated with administration and monitoring). When these costs were omitted, both facilities came close to the statutory limit. In the case of Bay (but not at Moore Haven), the structure of the remuneration system meant additional prisoners over a defined threshold were paid for at a rate much higher than the marginal cost. This meant that the relative costs were sensitive to the assumptions built into in the model about prisoner numbers. OPPAGA concluded that the performance of the contractors was generally consistent with the performance reported by public prisons.
Sources of benefits: (i) Construction – One of the major reasons for the private sector’s lower site acquisition and preparation costs was the use of a more compact prison design: ‘The private prisons are constructed with all facilities under a single roof, while department prisons typically include several buildings spread out in a “campus” design. The compact design requires less acreage to be acquired and prepared for construction.’

Competitive Edge: The Evidence
67
(ii) Operations – OPPAGA identified a number of initiatives in the contract prisons that reduced the need for additional correctional officers – the use of civilian staff to perform administrative tasks such as that of mailroom attendant, and the use of technology, including cameras and electronic locks.
Critical analysis: In spite of having made a considered attempt to create meaningful public sector comparators, this study still generated an intense methodological debate between OPPAGA, the Correctional Privatization Commission and the Department of Corrections. Nelson argued the case for ‘avoidable cost’.154
3.19 Travis C. Pratt and Melissa R. Winston, ‘The Search for the Frugal Grail: An Empirical Assessment of the Cost-Effectiveness of Public Versus Private Correctional Facilities’, 1999155
Description: Statistical analysis of data collected by the United States Department of Justice from the 1992-93 census of juvenile facilities across the United States. The census included detention centres, shelters, reception and diagnostic centres, training schools, ranches, camps, farms and halfway houses. The sample consisted of 635 public and 2126 private institutions, although some cases were omitted due to incomplete data.
Findings: The mean cost per inmate day of the private facilities was $111.59, compared with $105.09 for the public ones, a difference that was not statistically significant. However, the two sectors operated very different kinds of facilities under very different models of care.
In comparing public and private management of particular types of facility, the study found that low security facilities – shelters, training schools, ranches, camps and farms, halfway houses and facilities for female offenders – were significantly more cost-effective when run by a private entity. On the other hand, there was no evidence that private management of juvenile detention centres was more cost-effective.
Methodology: The study was concerned with the average daily cost of housing a youth, constructed through combining the annual expenditures for each facility (personnel, service, maintenance and operations costs), and dividing by the average daily population and then by 365.
A number of variables were controlled, including the type of facility, the level of security, gender, physical setting, proportion of full-time staff, average length of stay, and average daily population (as a measure of scale).
The two groups differed in the type of facilities that they operated: ‘private facilities tend to be overwhelmingly halfway houses and/or minimum security institutions, whereas public facilities tend to be disproportionately detention centers with varied security levels.’ For this reason, private facilities are on average smaller than public ones, although carrying a much higher proportion of full-time staff. The authors concluded that this finding was ‘contrary to the claims of certain critics of correctional privatization that private facilities will cut costs through staffing practices that limit the number of full-time payroll staff’. However, this may reflect a totally different model of care under halfway houses and detention centres.
3.20 Travis C. Pratt and Jeff Maahs, ‘Are Private Prisons More Cost-Effective Than Public Prisons?’, 1999156
Description: A ‘meta-analysis’ of 33 public and private prisons analysed in 24 studies, using statistical methods to control for prison size, age and security level, in order to ascertain the significance of ownership for inmate cost per day.
Findings: The authors concluded that ownership was an insignificant predictor of inmate cost per day. The other variable – size, age and security level – were statistically much more significant.
Methodology: In an attempt to move beyond the simple cost comparisons of a small number of prisons, the approach that has been adopted in most studies, the authors sought to use a statistical methodology known as ‘meta-analysis’ to analyse a sample of 33 facilities drawn from a number of these studies.
Critical analysis: The methodology adopted in this study was strongly criticised by Gaes et al, and the finding that higher security levels were associated with lower costs is contrary to real world experience. Given the uneven quality of the data in prison studies, the reliability of meta-analysis at this stage in the research is questionable.157

Competitive Edge: The Evidence
68
Moreover, while the authors reported that they relied on 33 cost-effectiveness evaluations from 24 independent studies, they listed only four studies in their references, covering 17 evaluations.
3.21 Julianne Nelson, ‘Taft Prison Facility: Cost Scenarios’, 1999158
Description: The author asked whether contracting the Taft Correctional Institution to a private company would save the taxpayer money. She addressed this question by analysing the payments the government expected to make to the contractor and the costs to the federal government avoided through contracting. The study compared Taft with three virtually identical prisons recently-opened and operated by the Bureau of Prisons (BOP).
Findings: The anticipated cost to the Bureau of Prisons of contract management exceeded the expected cost of the Bureau operating a federal facility comparable to Taft, by 7%.
Methodology: The author regarded the three benchmark prisons as the best source of information about what the BOP’s costs would have been if it had operated Taft. All four prisons were costed on an assumed population of 1,946. It was assumed that the contractor suffered no financial penalties and was paid no bonuses for its performance at Taft.
The contract cost was based on payments to the contractor plus monitoring costs. The author argued that the appropriate methodology for costing prison contracts was avoidable cost – ‘the additional costs that the BOP has avoided by outsourcing the operation of the Taft facility’. Unavoidable costs included regional and central office support, since contracting Taft did not change BOP staff numbers at this level. BOP accounting practice allocated support costs to individual institutions in proportion to operating expenditures. Nelson omitted those costs that she regarded as avoidable (such as training), and allocated a proportion of the remainder to the contractor.
She also included an estimate for ‘avoidable activation costs’ – ‘start-up expenditures the BOP would have had to incur over an above the amounts actually spent on the Taft facility’. Construction costs and the BOP’s share of supplying the facility were omitted. This estimate was made by taking the average of the activation budgets for the three comparators, less the value of the inventory left for contractor use, less payments to the contractor during the activation period. (The inventory was purchased by the BOP when it was going to operate the prison and then left behind. Using Nelson’s approach, this was not an expense that could be avoided.) The difference represented the start-up costs and this was then amortised over ten years.
Sources of benefits: Nelson reported that a key factor in the cost differential lay in the decision by the contractor to assign more staff to the facility than the Bureau of Prisons then used. If the BOP had operated the Taft facility using the contractor’s staffing model, it would have been 13% more expensive than if it had operated the same facility using its own staffing model.
Critical analysis: In their later study of Taft, McDonald et al used the formula adopted by the A76 federal outsourcing programme for the allocation of overheads – 12% of total labour costs are assigned to publicly-operated facilities, while it is assumed that all relevant government overheads are captured in the cost of contract administration and monitoring. They acknowledged that this approach had been criticised, and identified Nelson’s study as one that had adopted ‘avoidable cost’ in looking at Taft.
McDonald et al adopted what they called an ‘activity-based’ cost accounting methodology, which seeks to assign overhead costs as accurately as possible. In their argument:
By contracting, the Bureau avoided providing the broad range of support and oversight functions it affords federal prisons. As a matter of policy, the Bureau [was] providing minimal support to the contractor during this period. . .
They acknowledged that Bureau of Prisons officials ‘and their consulting economist, Julianne Nelson’ strenuously objected to the adoption of this approach. McDonald et al argued that the difference related to what was being tested. Whereas Dr Nelson was concerned with costs avoided by contracting for Taft, their study asked: ‘what are the costs to the government of contracting for TCI, compared to the cost of direct government operation’.159
Competitive Edge: The Evidence
69
3.22 OPPAGA, Florida, ‘Lake City Correctional Facility Experienced Start-Up Problems, But It Has Improved’, 2000a160
Description: A study of the Lake City Correctional Facility, a 350-bed young offender institution operated under contract since 1997. The costs of this facility were compared with the per diem rates of the state’s major young offender prisons over two years – 1997-98 and 1998-99.
Findings: OPPAGA concluded that Lake City’s per diem costs were consistent with the costs for similar publicly-operated young offender institutions. Larger public prisons operated at much lower costs, but Lake City’s costs were virtually identical to those from one similar-sized public prison, and 19% below those of a second.
Methodology: OPPAGA compared Lake City with four public young offender institutions, concluding: ‘Differences in the number and age of assigned inmates prevented the direct comparison of the private facility with any single public youthful offender facility.’ However, comparing its performance to all four public facilities was thought to provide a reasonable basis for comparison.
While the contract facility experienced some difficulties in the first full year of operation, by the second year, Lake City was comparing very favourably with the public facilities in terms of inmates enrolled in academic and vocational programmes, and in terms of programme completion rates.
3.23 OPPAGA, Florida, ‘South Bay Correctional Facility Provides Savings and Success; Room for Improvement’, 2000b161
Description: An OPPAGA study of the South Bay Correctional Facility, a privately managed prison opened in 1997, and contracted through the Correctional Privatization Commission. The study compared construction costs and operation costs in 1997-98 and 1998-99.
Findings: (i) Construction – South Bay was 24% less costly to build than the Okeechobee public prison. Site preparation costs accounted for most of this difference, although when adjusted for the greater acreage at Okeechobee, the site preparation costs at South Bay were actually higher. The construction cost per square foot was almost 6% lower at South Bay. However, construction cost per inmate bed was 38% lower given the approved capacity at Okeechobee – this was partly the result of a change in policy following construction, but South Bay still cost 23% per inmate bed less Okeechobee’s planned capacity.
(ii) Operations – After adjustments to improve comparability, operating costs at South Bay were 10.6% lower than Okeechobee in 1998-99, and 3.5% in 1997-98.
Methodology: (i) Construction – Okeechobee was opened about sixteen months ahead of South Bay, but they were constructed to roughly the same size, with the intention of housing similar populations and they were located in the same part of the state.
The official inmate capacity for Okeechobee was reduced following construction, but these differences were reflected in the comparative data above. This policy had been adopted because the state then had excess capacity. The state prison was also constructed on a larger site (500 acres, compared to 100 acres for South Bay), and Okeechobee included on-site staff housing, which was taken into account in the calculations.
Okeechobee was financed through construction bonds, but they were sold a year earlier than the instruments used to finance South Bay, and interest rates were not comparable. OPPAGA omitted financing costs from the comparison.
(ii) Operations – When they were first opened, the two facilities were broadly comparable, however a number of developments over the first two years introduced important differences. OPPAGA made adjustments to take into account prison capacity, educational and drug abuse programmes, the cost of health services, the use of work squads and fringe benefits such as pension costs.
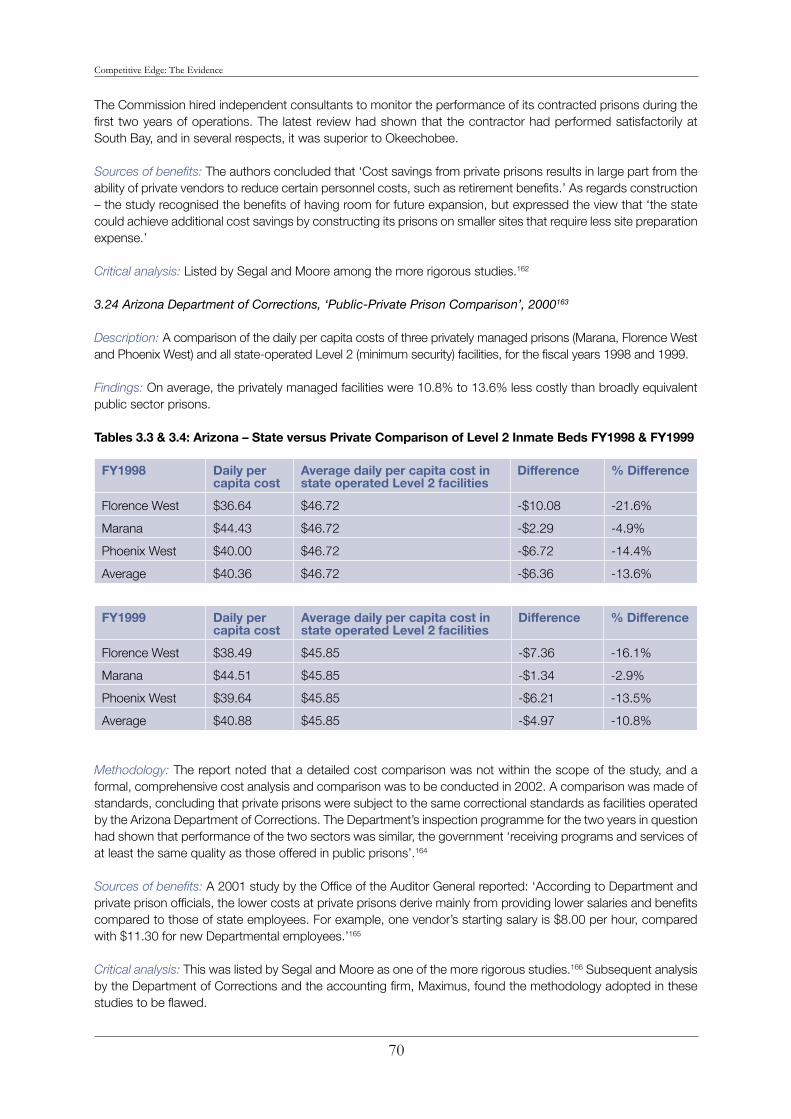
Competitive Edge: The Evidence
70
The Commission hired independent consultants to monitor the performance of its contracted prisons during the first two years of operations. The latest review had shown that the contractor had performed satisfactorily at South Bay, and in several respects, it was superior to Okeechobee.
Sources of benefits: The authors concluded that ‘Cost savings from private prisons results in large part from the ability of private vendors to reduce certain personnel costs, such as retirement benefits.’ As regards construction – the study recognised the benefits of having room for future expansion, but expressed the view that ‘the state could achieve additional cost savings by constructing its prisons on smaller sites that require less site preparation expense.’
Critical analysis: Listed by Segal and Moore among the more rigorous studies.162
3.24 Arizona Department of Corrections, ‘Public-Private Prison Comparison’, 2000163
Description: A comparison of the daily per capita costs of three privately managed prisons (Marana, Florence West and Phoenix West) and all state-operated Level 2 (minimum security) facilities, for the fiscal years 1998 and 1999.
Findings: On average, the privately managed facilities were 10.8% to 13.6% less costly than broadly equivalent public sector prisons.
Tables 3.3 & 3.4: Arizona – State versus Private Comparison of Level 2 Inmate Beds FY1998 & FY1999
FY1998 Daily per capita cost
Average daily per capita cost in state operated Level 2 facilities
Difference % Difference
Florence West $36.64 $46.72 -$10.08 -21.6%
Marana $44.43 $46.72 -$2.29 -4.9%
Phoenix West $40.00 $46.72 -$6.72 -14.4%
Average $40.36 $46.72 -$6.36 -13.6%
FY1999 Daily per capita cost
Average daily per capita cost in state operated Level 2 facilities
Difference % Difference
Florence West $38.49 $45.85 -$7.36 -16.1%
Marana $44.51 $45.85 -$1.34 -2.9%
Phoenix West $39.64 $45.85 -$6.21 -13.5%
Average $40.88 $45.85 -$4.97 -10.8%
Methodology: The report noted that a detailed cost comparison was not within the scope of the study, and a formal, comprehensive cost analysis and comparison was to be conducted in 2002. A comparison was made of standards, concluding that private prisons were subject to the same correctional standards as facilities operated by the Arizona Department of Corrections. The Department’s inspection programme for the two years in question had shown that performance of the two sectors was similar, the government ‘receiving programs and services of at least the same quality as those offered in public prisons’.164
Sources of benefits: A 2001 study by the Office of the Auditor General reported: ‘According to Department and private prison officials, the lower costs at private prisons derive mainly from providing lower salaries and benefits compared to those of state employees. For example, one vendor’s starting salary is $8.00 per hour, compared with $11.30 for new Departmental employees.’165
Critical analysis: This was listed by Segal and Moore as one of the more rigorous studies.166 Subsequent analysis by the Department of Corrections and the accounting firm, Maximus, found the methodology adopted in these studies to be flawed.
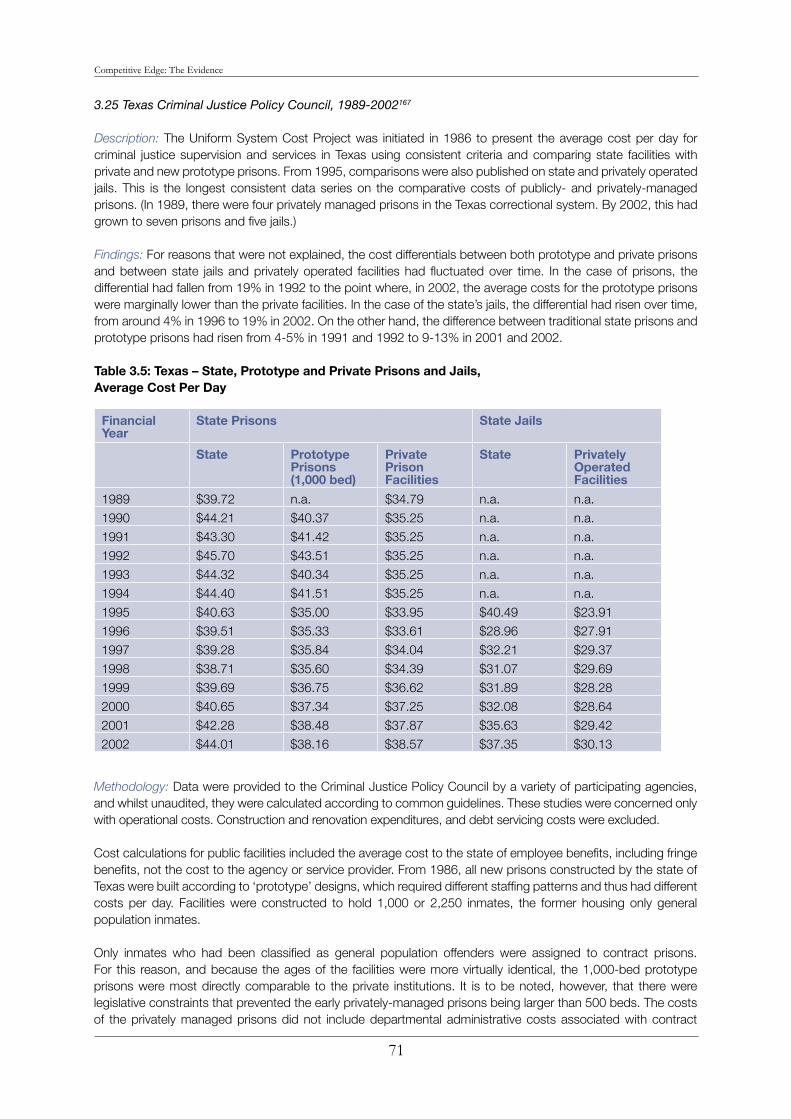
Competitive Edge: The Evidence
71
3.25 Texas Criminal Justice Policy Council, 1989-2002167
Description: The Uniform System Cost Project was initiated in 1986 to present the average cost per day for criminal justice supervision and services in Texas using consistent criteria and comparing state facilities with private and new prototype prisons. From 1995, comparisons were also published on state and privately operated jails. This is the longest consistent data series on the comparative costs of publicly- and privately-managed prisons. (In 1989, there were four privately managed prisons in the Texas correctional system. By 2002, this had grown to seven prisons and five jails.)
Findings: For reasons that were not explained, the cost differentials between both prototype and private prisons and between state jails and privately operated facilities had fluctuated over time. In the case of prisons, the differential had fallen from 19% in 1992 to the point where, in 2002, the average costs for the prototype prisons were marginally lower than the private facilities. In the case of the state’s jails, the differential had risen over time, from around 4% in 1996 to 19% in 2002. On the other hand, the difference between traditional state prisons and prototype prisons had risen from 4-5% in 1991 and 1992 to 9-13% in 2001 and 2002.
Table 3.5: Texas – State, Prototype and Private Prisons and Jails, Average Cost Per Day
Financial Year
State Prisons State Jails
State Prototype Prisons (1,000 bed)
Private Prison Facilities
State Privately Operated Facilities
1989 $39.72 n.a. $34.79 n.a. n.a.
1990 $44.21 $40.37 $35.25 n.a. n.a.
1991 $43.30 $41.42 $35.25 n.a. n.a.
1992 $45.70 $43.51 $35.25 n.a. n.a.
1993 $44.32 $40.34 $35.25 n.a. n.a.
1994 $44.40 $41.51 $35.25 n.a. n.a.
1995 $40.63 $35.00 $33.95 $40.49 $23.91
1996 $39.51 $35.33 $33.61 $28.96 $27.91
1997 $39.28 $35.84 $34.04 $32.21 $29.37
1998 $38.71 $35.60 $34.39 $31.07 $29.69
1999 $39.69 $36.75 $36.62 $31.89 $28.28
2000 $40.65 $37.34 $37.25 $32.08 $28.64
2001 $42.28 $38.48 $37.87 $35.63 $29.42
2002 $44.01 $38.16 $38.57 $37.35 $30.13
Methodology: Data were provided to the Criminal Justice Policy Council by a variety of participating agencies, and whilst unaudited, they were calculated according to common guidelines. These studies were concerned only with operational costs. Construction and renovation expenditures, and debt servicing costs were excluded.
Cost calculations for public facilities included the average cost to the state of employee benefits, including fringe benefits, not the cost to the agency or service provider. From 1986, all new prisons constructed by the state of Texas were built according to ‘prototype’ designs, which required different staffing patterns and thus had different costs per day. Facilities were constructed to hold 1,000 or 2,250 inmates, the former housing only general population inmates.
Only inmates who had been classified as general population offenders were assigned to contract prisons. For this reason, and because the ages of the facilities were more virtually identical, the 1,000-bed prototype prisons were most directly comparable to the private institutions. It is to be noted, however, that there were legislative constraints that prevented the early privately-managed prisons being larger than 500 beds. The costs of the privately managed prisons did not include departmental administrative costs associated with contract

Competitive Edge: The Evidence
72
management. The estimates for the privately managed facilities included debt service costs, and neither did they take into account tax revenues paid to state and local agencies.
The Council argued that the decline in the average cost per day for the state’s prisons after 1992 was the result of an increase in the prison population and the construction of facilities that were less expensive to operate.168
From 1995, the Criminal Justice Policy Council also provided data for state jails. Prisons house persons convicted of capital, 1st, 2nd and 3rd degree felonies; the state’s jails maintain offenders convicted of ‘state jail felony offences’ and sentenced to incarceration or who are awaiting transfer to prison. No information was available on the comparability of these facilities.
No information has been published on the quality of service provided by state and privately managed prisons and jails in Texas.
Critical analysis: The estimates for the privately-managed facilities included debt service costs, and in 1991, these were around $6 per prisoner per day, causing the average cost of the private prisons in that year to be higher by some 17%. Moreover, the private prison averages also left out tax revenues paid to state and local agencies, and in 1990, the inclusion of these would have widened the financial differential by another four percentage points.169
No information is available on the context with which the prototype prisons were established and have since operated. It is unknown, for example, whether they were operating in a contestable environment. If so, then the appropriate comparison for ascertaining the impact of contestability would be between traditional facilities on the one hand and prototype and private facilities on the other.
Since no attempt was made to address comparability, and given the accounting differences mentioned above, these data can be regarded as nothing more than indicative.
3.26 Lattimore Black Morgan & Cain, 2003170
Description: A firm of certified public accounts collected and analysed national data on state expenditures on prisons in order to test a hypothesis that the presence of competition in government corrections (in the form of private management companies) would serve to reduce the rate of growth of states’ operational expenditures on corrections. The data covered the twelve-year period 1 July 1989 to 30 June 2001.
Findings: States were divided into three groups –
Group One covered nine states with at least 20% of their inmates in private prisons in 2001;•
Group Two covered twenty-four states with none of their inmates in private prisons in 2001; and•
Group Three covered seventeen states with from 1% to 20% of their inmates in private prisons • in 2001.
The study concluded that for the period 1989-90 to 2000-01, for states in Group One, the average increase in total state per capita expenditure was around 71%, compared with an increase of around 17% in spending per inmate day by state departments of corrections. The corresponding increases for states in Group Two were 59% and 40%. And the increases for states in Group 3 were 59% and 46%.
‘Based on these observations, Group One had a significantly smaller percentage increase in operating per diem compared to expenditures per capita than either Group Two or Group Three.’
Methodology: Information on state prison populations was drawn from data published by the US Bureau of Justice Statistics, and state expenditures were obtained from the National Association of State Budget Offices. The groupings of states was based on a report, ‘Prisoners in 2001’ published by the Bureau of Justice Statistics. Two states – Nevada and Wyoming – did not have sufficient data to be included in the calculations.

Competitive Edge: The Evidence
73
Critical analysis: This study suggests that it was not that states with a higher proportion of their prisoners under contract management were more fiscally conservative; to the contrary, the average increase in total state spending over this period was much higher in these states.
However, this study did not establish that there was a causal relationship between competition in prison management and lower spending on corrections. It was possible, for example, that the states in Group One were more conservative in their policies on corrections and that this underlying attitude had driven both lower spending and a greater willingness to contract prison operations.
3.27 Matthew Mitchell, ‘The Pros of Privately-Housed Cons: New Evidence on the Cost Savings of Private Prisons’, 2003171
Description: Using data published by the US Bureau of Justice Statistics, the author compared state-wide, per-prisoner costs of incarceration for the year 2001. He used statistical analysis to test a number of hypotheses, including the expectation that there would be a negative relationship between per-prisoner costs and the percentage of prisoners in private custody.
Findings: When other factors were held constant, a state with five percent of its prisoners under private management could expect to save an additional $423 per prisoner per year for every one percentage increase in the number of prisoners in private care. As expected, there were diminishing marginal returns as more and more prisoners were placed under contract management, but a state with 45% of its prisoners in private custody would spend about $10,000 less per prisoner per year than a state which declined to use the private sector.
Methodology: The study relied on data published the US Bureau of Justice Statistics, and coded by Lattimore, Black, Morgan and Cain. Statistical analysis was used to test a number of variables, including salary costs (as measured by pay for state police officers, since prison salaries were not published), extent of union power (as measured by the presence of state ‘right to work laws), overcrowding and the percentage of prisoners in private custody.
Sources of benefits: Other things being equal, the presence of state ‘right to work’ laws was associated with a reduction in annual per-prisoner costs of more than $9,000. The author concluded: ‘This is strong evidence of the costly nature of union power.’ Using entry-level state police pay as an indicator of the market wage for prison guards, the study found that every extra dollar earned was associated with an increase of 92 cents in the annual cost of maintaining a prisoner.
Crowding also tended to reduce costs – a one percent increase in a state’s ratio of prison population to capacity was associated with a reduction in annual per-prisoner costs of $147. (However, the association with crowding was statistically less significant than the other variables.)
Critical analysis: Lacking sufficient data, this study was unable to test for a causal relationship between prison contracting and lower costs.
3.28 James F. Blumstein and Mark A. Cohen, ‘The Inter-relationship Between Public and Private Prisons’, 2003172
Description: The authors used statistical analysis to look at data relating to US prisons covering the period 1990 to 2001. The hypothesis was that competition in part of a prison system would have beneficial effects on the whole system through a ‘yardstick’ or ‘benchmarking’ effect. It was contended that ‘the existence of private prisons to manage a portion of a state’s prison population has the effect of moderating the growth in costs per prisoner in the public sector’.
Findings: Over the two-year period, 1999-2001, states that had some of their prisoners in privately owned and/or operated prisons experienced significantly lower growth in per diem expenditures on publicly-held prisoners (4.5% per year). In those states without any prisoners under private management, the growth in the cost per public prisoner was 18.9%, compared to 10.8% in states with some prison contracting. Moreover, states with 20% or more of their prison population under private management experienced expenditure growth averaging around 6%, while states with none of their prisoners under private management, averaged growth of 18.9%.
Competitive Edge: The Evidence
74
The authors also looked at a longer time series (1990-2001), where the data were not as comprehensive (since systematic data on the number of private prisoners were not available prior to 1999) and the findings, while not as robust, were broadly confirmatory – the existence of private prisoners in a jurisdiction reduced total spending on corrections by 4.6%.
Methodology: The core study was based on data published by the Bureau of Justice Statistics for the years 1999-2001. The total cost of operating privately-managed facilities was calculated by multiplying the average cost per prisoner in these institutions by the total number of prisons. This was then subtracted from the total amount spent on prisons in each jurisdiction, to arrive at the amount spent on public prisons.
The authors recognised that there were other possible explanations for the statistical association between the number of prisoners under private management and the spending on public prisoners, than simple causation. One explanation might be that contracting states were already fiscally more conservative. The study did confirm that ‘states that have higher growth in overall per capita government spending are also likely to have higher growth in spending on publicly managed corrections’. This might have been because of a political preference for greater spending on social services, or because of higher rates of revenue, less fiscal stress and thus a willingness to tolerate more spending. Measures such as the level of overcrowding and the percentage of prisoners kept in maximum security, which might affect prison costs, did not better explain these differences.
Some data were available for 1990-2001, but there was no reliable information available on the private population prior to 1999. Over this longer time period, the authors compared the gross expenditure on corrections in jurisdictions with privately managed prisons and without. Of course, if privately managed prisons are less costly than their public counterparts, this will understate the differences. The authors controlled for inflation over this longer time period.
Sources of benefits: One hypothesis of the study was that the introduction of privately managed prisons into a jurisdiction might introduction a contestability effect, or benchmark competition, leading to lower costs in the public prison estate. The authors also hypothesised that there might be a learning effect, pointing to a 1997 study that suggested that when private prison operators in Virginia abolished the practice of storing 30 days of food in warehouses, state officials followed suit, reducing public prison costs as a result.
Critical analysis: Lappin et al criticised the omission of three states from the analysis for the reason that expenditures did not grow, and for the failure to demonstrate a causal relationship between the introduction of private prisons and lower spending.173
3.29 Douglas C. McDonald and Carl Patten Jr, ‘Governments’ Management of Private Prisons’, 2003174
Description: This study was based on a mail survey of 53 correctional agencies in 28 jurisdictions in 1997, and was concerned not with the difference between public and private provision, or between competition and monopoly, but between two different kinds of markets.
This is the only study known to compare contracted prisons with ‘spec’ prisons (that is, facilities constructed by the private sector on a speculative basis, with prison places sold into a ‘spot market’). In effect, this was a comparison of facilities contracted within individual states, and facilities offered on a national market, where states transfer prisoners to facilities in another state.
Findings: The study concluded that the per diem rates for out-of-state contracts were higher than for in-state contracts. ‘All agreements between state governments and out-of-state facilities that sold services on the national market specified payment rates in excess of $35 a day, whereas 55 percent of the contracts between states and in-state facilities specified lower per diem rates.’175
Methodology: Agencies were asked for details about each contract and its administration. Of the 55 agencies surveyed, all but two responded. In all, these 28 jurisdictions had a total of 91 facilities under contract, with 84 different private facilities. 15 of these 84 facilities were operating in the national market. Of course, the facilities in this study are not directly comparable, and only a little information was available on service quality.

Competitive Edge: The Evidence
75
Sources of benefits: The authors identified a number of important differences between the two markets:
Two-thirds of the agreements under the national spot market were non-competitive. By comparison, • 70% of the in-state agreements had been signed after competitive bidding;
‘Spec’ prisons were smaller on average than contract prisons – more than half of the former held fewer • than 200 inmates, and there were none that held more than 600. Only 20% of the contract prisons held less than 200 prisoners, and a third held more than 600;
Most of the agreements in the national market were for terms of two years or less, whereas most of the • in-state agreements were of 2-5 years, and in some cases longer;
90% of ‘spec’ prisons were monitored for fewer than 20 hours per month, and the remainder were • 20-80 hours a month. By contrast, 52% of in-state contracts were monitored for more than 80 hours per month. 48% of contract prisons had full-time public sector monitors, compared with 10% of the ‘national’ facilities.
Critical analysis: This study addressed a single year, and with fluctuations in the spot market, it is possible that the same study conducted in another year might have yielded very different results. Nevertheless, it is unlikely that the underlying characteristics of this market would change over that period.
From one perspective, this was a comparison between two different kinds of market, and thus two different kinds of competition – competitive procurement versus competition in spot markets. However, given the massive overcrowding problem in the United States in 1997, there was little effective competition in the spot market, and this might be regarded as a comparison between a highly competitive market and one with low levels of competition.
3.30 Patrick Bayer and David E. Pozen, ‘The Effectiveness of Juvenile Correctional Facilities: Public versus Private Management’, 2005176
Description: The authors used statistical analysis to compare costs and recidivism rates for juvenile correctional facilities in Florida over the period 1997 to 1999. Since higher recidivism rates will result in higher costs of detention in future years, the authors also undertook a cost-benefit analysis of the different classes of facility – state, county, for-profit and not-for-profit.
Findings: For-profit facilities were assigned more serious offenders (and thus offenders more likely to reoffend), but the mean annual cost to the Department of Juvenile Justice for each inmate released was the lowest of all four kinds of facility – 18.3% less than state facilities and 10.9% less than county facilities. On the other hand, recidivism rates were higher for the for-profit facilities and the mean survival time (between release and re-adjudication) was shorter.
After controlling for the differences between the different inmate populations – individual characteristics, socio-economic background and similar factors – the study found that comparable youths from state facilities were 5.3 percentage points less likely to be readjudicated within a year, and youths from non-profit and county facilities, 6 and 7.1 percentage points less likely to be readjudicated, respectively.
However, once the characteristics of the facilities and their inmates were taken into account, for-profit facilities required smaller outlays. The Department paid around 50% more for each release for a comparable individual from a state facility and 30% more from a non-profit facility.
There were, however, significant differences in the kind of programmes administered by these different classes of institution – for example, all boot camps in the state were operated by the counties. This made no significant difference to the relative costs of private, non-profit and state facilities, but in the case of county facilities, the results changed significantly, so that the costs were now more than 100% less than for a comparable release from a private facility.

Competitive Edge: The Evidence
76
From an economic perspective, it is possible that a higher recidivism rate at a lower short-term cost might represent better value-for-money. The authors attempted a cost-benefit analysis based on certain assumptions about readjudication rates, mean survival times, sentence lengths and cost. The wider social benefits of a reduction in crime were not included in these calculations. On this basis, county facilities emerged strongly as the preferable form of detention, followed by non-profit facilities. However, the evidence in relation to state facilities was not as positive.
Methodology: Florida holds more juvenile offenders under correctional supervision than any other American state, save California. It is the only state with a significant number of facilities managed by different kinds of provider, and the Department of Juvenile Justice appears to maintain by far the most comprehensive database on offenders, their background and post-release criminal behaviour.
The authors studied 5,322 youths released from 111 moderate and high-risk institutions between 1 July 1997 and 30 June 1999. Half of these were released from non-profit facilities, 19% from for-profit and another 19% from state facilities, and 12% from county facilities.
The study controlled for observable individual characteristics, criminal history, home neighbourhood and correctional environment, and regional differences in law enforcement. However, the authors only had available to them the annual amount spent on these facilities by the Florida Department of Juvenile Justice.
Critical analysis: The only source of costing data for this study was the funds spent on each facility by the Florida Department of Juvenile Justice. The authors acknowledged that this left out external sources of government funding, but justified this methodological weakness by arguing that it also omitted external sources of private funding, such as investment income and allocations from the parent organisation.
The study did not address the difficulties of costing total spending on publicly-managed facilities, including the treatment of overheads, pensions, and support from external agencies. Neither did it include monitoring costs for county, private and non-profit facilities nor, in the case of private facilities, tax payments. The comparability of the costing data was thus open to criticism.
3.31 Douglas C. McDonald and Kenneth Carlson, ‘Contracting for Imprisonment in the Federal Prison Sys-tem: Cost and Performance of the Privately Operated Taft Correctional Institution’, 2005177
Description: A detailed study of a federal low-security correctional facility at Taft, California, managed by a contractor from 1997. The authors compared the estimated costs of managing the facility under contract with an estimate of what it would have cost if the government had managed that same facility, and they benchmarked it against other low-security federal prisons.
Findings: (i) Compared with the estimated cost of managing the same facility under the Bureau of Prisons, there were savings over the five years from 1998 to 2002 of 6% to 10%.
(ii) Looking at three federal facilities that were architecturally similar to Taft, the study found that the actual costs were close to the estimates for the management of Taft by the Bureau. In fact, the net cost per prisoner day for managing Taft under contract (after the start-up year) was 13-17% lower.
(iii) The actual costs of the Taft Correctional Institution were lower (by 28% or more) than those experienced by the Bureau of Prisons at fourteen low-security federal prisons for which costs could be assigned. Taking the four prisons opened in 1997 (including Taft) as a group, they were (on average) around 30% less costly than the other eleven low-security federal prisons.
Methodology: The authors provided three different kinds of benchmark analysis: (i) they estimated the total cost to the government of operating the Taft facility under contract, and compared that to an estimate of what the government would have spent if the Bureau of Prisons had operated the same facility; (ii) they compared the cost for operating Taft under contract with the actual costs for operating three comparable publicly managed facilities (also opened in 1997); and (iii) they compared the cost for operating Taft under contract with fourteen low security federal prisons (whilst recognising that these facilities were not directly comparable).
Competitive Edge: The Evidence
77
(i) The authors calculated what they called the ‘total cost of contracting’, which included the price paid by the government under the contract (as adjusted for any contract modifications and after deducting any penalties and including any bonuses), plus the cost of administering the contract, and any additional costs to the government that would have been avoided if the facility had not been contracted. Overheads associated with the operation of the Bureau of Prisons were not included in the cost of contracting. On the other hand, tax revenues paid to the federal government by the contractor were offset against these costs, to derive a ‘total net cost of contracting’.
In estimating the costs of managing the Taft facility by the Bureau of Prisons, the authors included personnel costs, such as wages, fringe benefits and retirement fund contributions, materials and supplies, casualty and personnel liability costs and overheads associated with the Bureau of Prisons’ system as a whole. Assumptions were based on practices in other low security federal prisons: for example, staffing levels were based on one of the other three 1997 prisons, and vacancy rates were based on those observed at all low security prisons. Key assumptions were also tested by calculating the impact of a range of alternatives, resulting in low and high estimates.
(ii) Taft was one of four low security federal facilities opened around the same time (in 1997), using a similar design. Three of these were operated by the Federal Bureau of Prisons, while the other was competitively tendered and managed under contract. While there were some differences, all house low-security prisoners, all buildings were of the same age and design, and all were of comparable size.
(iii) On the other hand, these three 1997 facilities were not typical of prisons being managed by the Bureau of Prisons at that time. The authors reported that these prisons were opened in the full knowledge that they were in competition with Taft. One of the consequences of this (the authors claimed) was that staffing ratios were significantly different – an average of 1:6.7 for these establishments, compared with an average of 1:4.6 for the other eleven low security federal prisons. As a result, while the average cost per employee was roughly the same, the cost per inmate was 28% lower in the 1997 establishments.
The other eleven low security federal prisons were not directly comparable to Taft and the other 1997 establishments. They were older and with a different design, so that it is to be expected that they would not be as efficient.
Qualitative performance was taken into account, with the Bureau of Prisons’ monitors ranking the company’s performance as ‘good’ for all but one of the six month periods, meaning that performance had been more than simple compliance with contractual requirements. Comparisons were also made with twenty other low-security federal prisons based on the Bureau of Prisons’ performance monitoring system. Regression analysis was undertaken, accounting for variables such as inmates’ ages, the seriousness of offences and the extent of overcrowding. Assault rates at Taft were significantly lower than the average. The escape rate was higher (although these were exceptional events). There were significantly higher rates of failed drug tests, and reported grievances among prisoners were also somewhat higher. Health services are comparable to other federal facilities.
Sources of benefits: In this case, the difference in the cost of management was not explained by lower staff/inmate ratios. The company staffed the facility with a greater number than the Bureau would have employed. As required under the Service Contract Act of 1965, wage levels were comparable to what would have been paid in that region under public management. Indeed, the contractor was paying its correctional officers about 7% more than the Bureau of Prisons. However, fringe benefits were significantly lower (a rate of 20% of permanent salaries compared to 46.5%). Retirement benefits accounted for most of this difference.
Another significant difference lay in the much higher overheads in the public sector, and over these first five years, an average of 1.7 percentage points of the cost difference were explained by tax revenues.
As noted, the staffing ratios in the four prisons opened in 1997 were significantly lower than other low-security federal prisons and this contributed in a major way to average costs per inmate being lower by some 30%.
Critical analysis: The Bureau of Prisons and Julianne Nelson, their consulting economist, disagreed with the methodology used in this report, arguing that ‘avoidable cost’ was the appropriate way of assessing the federal government’s savings.178 The authors’ response was to argue that they were addressing comparative cost and not savings.
Competitive Edge: The Evidence
78
3.32 Julianne Nelson, ‘Competition in Corrections: Comparing Public and Private Sector Operations’, 2005179
Description: This study analysed the performance of the Taft Correction Institution over the period 1998-2002, comparing it with (i) the hypothetical cost for Bureau of Prisons (BOP) management of the same facility, (ii) the actual costs of managing three similar low security institutions of similar age, and (iii) 11 other low security institutions operated by the BOP.
Findings: (i) The author revisited the estimates for FY1998 used in her 1999 study, and extended them based on the reported results over the subsequent years. As before, this study was concerned with savings and thus used an ‘avoidable cost’ approach. After estimating activation costs for 1998 for hypothetical BOP management of Taft, the author compared the present value of the two alternatives, concluding that administration of Taft under contract produced savings of 2.6% over the five years compared to Bureau management. Comparing total costs (that is, in partially stepping away from the avoidable cost model), contract administration was 3% less expensive.
(ii) In revisiting her assumptions for hypothetical in-house provision, the author compared the reported costs at Taft with the reported costs at the three comparators. The avoidable per diem costs (including avoidable support costs as part of the cost of operating the BOP facilities) were somewhat smaller at Taft – 3.8% and 5.1% in 1999 and 2000, declining to less than 1% in 2001 and 2002.
(iii) Nelson also contrasted Taft and the three comparator prisons with 11 low security institutions operated by the Bureau of Prisons, from FY1999 to FY2002. Facility-level costs at the three comparator prisons were, on average, 27% to 34% less than the other 11 facilities (and by slightly smaller percentages at Taft). Moreover, in FY2002:
none of the low security institutions had lower per diem security costs than the comparison facilities;•
none had lower unit management costs, though two were similar;•
none had lower administration costs, although two were similar;•
only one reported lower maintenance costs; and•
only one reported lower medical costs.•
Methodology: The primary study compared the actual costs of operating Taft under contract with the hypothetical costs of operating Taft under BOP management, with the hypothetical solution informed by the actual experience of the BOP in managing three similar low security facilities. Facility-level costs for the contract option included monitoring expenses and deducted a sum for taxes paid. As noted, the author used an ‘avoidable cost’ approach to overheads and activation costs, with the objective of establishing savings to government (or the taxpayer).
No attempt was made to undertake a qualitative comparison of the facilities. However, in 2005, a group of researchers at the Bureau of Prisons published the findings of the relative performance of the Taft Correctional Institution from 1999 to 2001. The authors of this study looked at a range of performance measures associated with misconduct: Taft consistently demonstrated higher levels of inmate misconduct and illegal drug use when compared with the three comparison prisons and the other low security BOP prisons.180
Sources of Benefits: The author identified several reasons for the small cost difference between the actual cost of Taft under contract management and the hypothetical cost under BOP management:
Reductions in centralized support costs;•
Reductions in the cost of facility activation;•
The general discipline – for both private and public sector managers – attributable to the on-going • competition among service-providers.181
Competitive Edge: The Evidence
79
In comparing the four new generation prisons – Taft and the three comparator facilities – the author noted that per diem costs had grown by less than the increases in Civil Service pay rates, and suggested that there may have been an increasing effort to hold down spending. Given the size, design and age of the three comparison sites, lower per diem costs were not unexpected. Most noticeable, however, were the much lower staffing ratios at the comparator prisons – as much as 31%. Indeed, the comparator prisons also had lower staffing ratios than Taft. Nelson suggested that since unit labour costs are higher at federal facilities, ‘this leaner staffing policy is a necessary component of any effort to compete with private sector providers of corrections services’.182
Critical analysis: As noted, there was disagreement between Nelson and her colleagues in the Bureau of Prisons, on the one hand, and McDonald and Carlson, on the other, about the more appropriate measure of effectiveness.
3.33 Auditor of Public Accounts, ‘Assessment of Kentucky’s Privatization Efforts: Performance Audit’, 2006183
Description: (i) Comparison of the average cost of the state’s public and private facilities for the financial years 2004 and 2005; (ii) Comparison of one of the state’s three privately-managed prisons (the Lee Adjustment Center) with three public sector comparators, for the years 2002-04; (iii) Comparison of the cost of contracting a 400-bed female correctional facility (Otter Creek) with the public sector comparator.
Findings: (i) Comparison of the average cost of incarceration per prisoner per day for the financial years 2004 and 2005, revealed that, based on the raw data, the private prisons were costing less than the publicly-managed facilities, but not by the 10% required by law.
Table 3.6: Kentucky – Average Cost of Per Prisoner Day 2004 & 2005
All $46.99
Maximum security $64.18
Medium security – state only $47.60
Medium security – state and private $47.20
Minimum security – state only $41.28
Minimum security – state and private $37.28
Private institutions $34.36
(ii) A comparison prepared by the Auditor of Public Accounts (APA) based on data provided by the Department of Corrections, found that the privately-managed facility was more expensive than the weighted average of three public sector benchmarks for two years, and then less expensive for the two years following contract renegotiation.
(iii) The tender for Otter Creek closed in June 2005, with only one response. The tender documentation had disclosed the public sector comparator, and the bid was 10% less than the comparator (as winning bids are required to be under Kentucky law), less a small amount for overheads that would be included in the calculation of the cost of contracting.
However, the Auditor found that the Department had under-estimated the costs for monitoring and administration, and when a more reasonable estimate for overheads was included, the Otter Creek bid was only 7.5% less than the public sector comparator, rather than the 10% required by law.
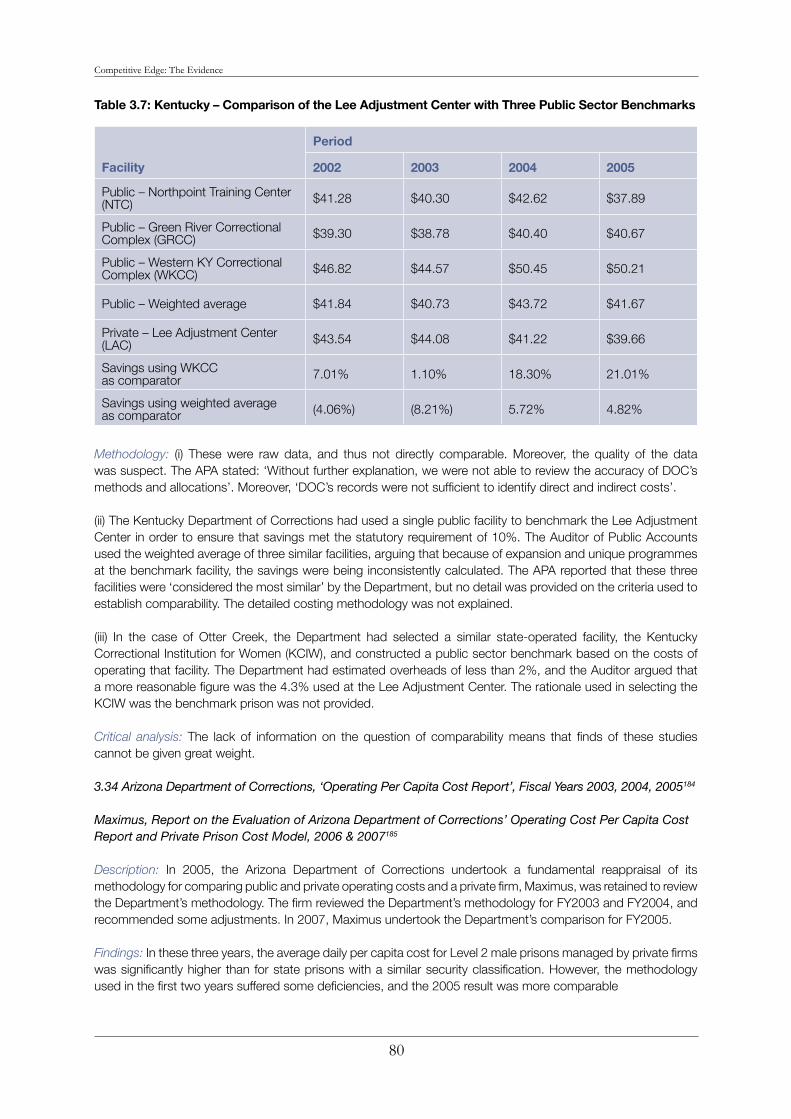
Competitive Edge: The Evidence
80
Table 3.7: Kentucky – Comparison of the Lee Adjustment Center with Three Public Sector Benchmarks
Period
Facility 2002 2003 2004 2005
Public – Northpoint Training Center (NTC) $41.28 $40.30 $42.62 $37.89
Public – Green River Correctional Complex (GRCC) $39.30 $38.78 $40.40 $40.67
Public – Western KY Correctional Complex (WKCC) $46.82 $44.57 $50.45 $50.21
Public – Weighted average $41.84 $40.73 $43.72 $41.67
Private – Lee Adjustment Center (LAC) $43.54 $44.08 $41.22 $39.66
Savings using WKCC as comparator 7.01% 1.10% 18.30% 21.01%
Savings using weighted average as comparator (4.06%) (8.21%) 5.72% 4.82%
Methodology: (i) These were raw data, and thus not directly comparable. Moreover, the quality of the data was suspect. The APA stated: ‘Without further explanation, we were not able to review the accuracy of DOC’s methods and allocations’. Moreover, ‘DOC’s records were not sufficient to identify direct and indirect costs’.
(ii) The Kentucky Department of Corrections had used a single public facility to benchmark the Lee Adjustment Center in order to ensure that savings met the statutory requirement of 10%. The Auditor of Public Accounts used the weighted average of three similar facilities, arguing that because of expansion and unique programmes at the benchmark facility, the savings were being inconsistently calculated. The APA reported that these three facilities were ‘considered the most similar’ by the Department, but no detail was provided on the criteria used to establish comparability. The detailed costing methodology was not explained.
(iii) In the case of Otter Creek, the Department had selected a similar state-operated facility, the Kentucky Correctional Institution for Women (KCIW), and constructed a public sector benchmark based on the costs of operating that facility. The Department had estimated overheads of less than 2%, and the Auditor argued that a more reasonable figure was the 4.3% used at the Lee Adjustment Center. The rationale used in selecting the KCIW was the benchmark prison was not provided.
Critical analysis: The lack of information on the question of comparability means that finds of these studies cannot be given great weight.
3.34 Arizona Department of Corrections, ‘Operating Per Capita Cost Report’, Fiscal Years 2003, 2004, 2005184
Maximus, Report on the Evaluation of Arizona Department of Corrections’ Operating Cost Per Capita Cost Report and Private Prison Cost Model, 2006 & 2007185
Description: In 2005, the Arizona Department of Corrections undertook a fundamental reappraisal of its methodology for comparing public and private operating costs and a private firm, Maximus, was retained to review the Department’s methodology. The firm reviewed the Department’s methodology for FY2003 and FY2004, and recommended some adjustments. In 2007, Maximus undertook the Department’s comparison for FY2005.
Findings: In these three years, the average daily per capita cost for Level 2 male prisons managed by private firms was significantly higher than for state prisons with a similar security classification. However, the methodology used in the first two years suffered some deficiencies, and the 2005 result was more comparable
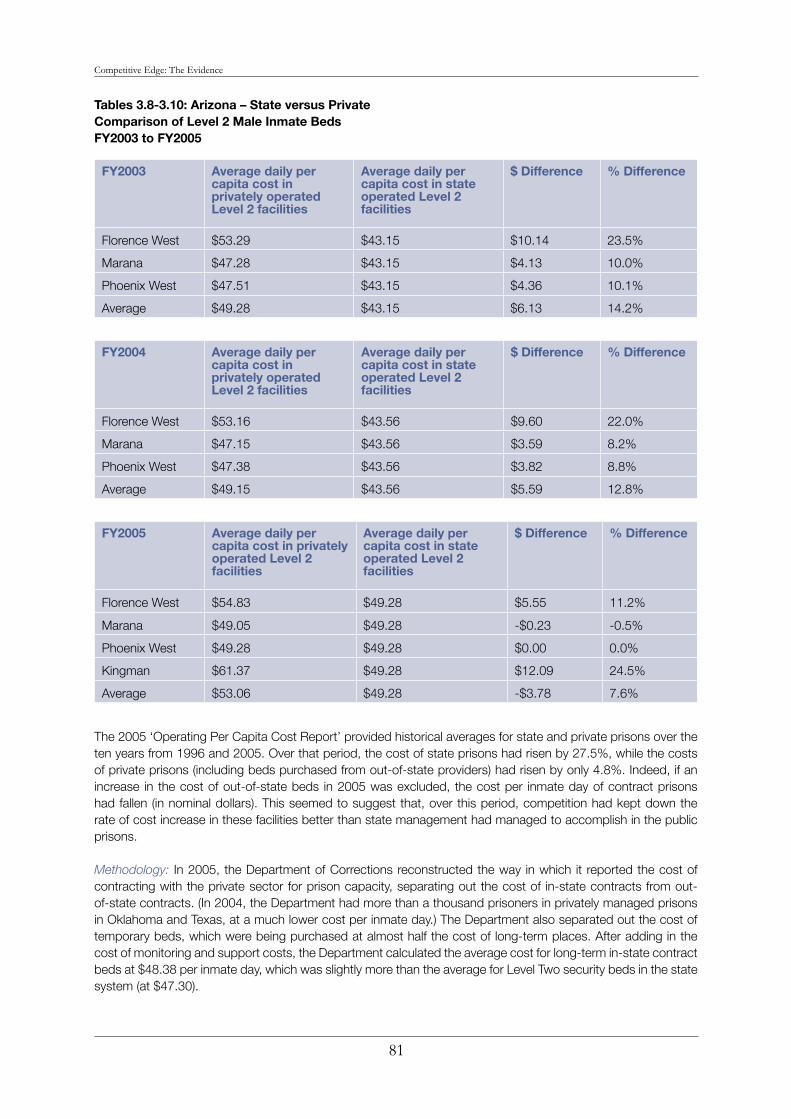
Competitive Edge: The Evidence
81
Tables 3.8-3.10: Arizona – State versus Private Comparison of Level 2 Male Inmate Beds FY2003 to FY2005
FY2003 Average daily per capita cost in privately operated Level 2 facilities
Average daily per capita cost in state operated Level 2 facilities
$ Difference % Difference
Florence West $53.29 $43.15 $10.14 23.5%
Marana $47.28 $43.15 $4.13 10.0%
Phoenix West $47.51 $43.15 $4.36 10.1%
Average $49.28 $43.15 $6.13 14.2%
FY2004 Average daily per capita cost in privately operated Level 2 facilities
Average daily per capita cost in state operated Level 2 facilities
$ Difference % Difference
Florence West $53.16 $43.56 $9.60 22.0%
Marana $47.15 $43.56 $3.59 8.2%
Phoenix West $47.38 $43.56 $3.82 8.8%
Average $49.15 $43.56 $5.59 12.8%
FY2005 Average daily per capita cost in privately operated Level 2 facilities
Average daily per capita cost in state operated Level 2 facilities
$ Difference % Difference
Florence West $54.83 $49.28 $5.55 11.2%
Marana $49.05 $49.28 -$0.23 -0.5%
Phoenix West $49.28 $49.28 $0.00 0.0%
Kingman $61.37 $49.28 $12.09 24.5%
Average $53.06 $49.28 -$3.78 7.6%
The 2005 ‘Operating Per Capita Cost Report’ provided historical averages for state and private prisons over the ten years from 1996 and 2005. Over that period, the cost of state prisons had risen by 27.5%, while the costs of private prisons (including beds purchased from out-of-state providers) had risen by only 4.8%. Indeed, if an increase in the cost of out-of-state beds in 2005 was excluded, the cost per inmate day of contract prisons had fallen (in nominal dollars). This seemed to suggest that, over this period, competition had kept down the rate of cost increase in these facilities better than state management had managed to accomplish in the public prisons.
Methodology: In 2005, the Department of Corrections reconstructed the way in which it reported the cost of contracting with the private sector for prison capacity, separating out the cost of in-state contracts from out-of-state contracts. (In 2004, the Department had more than a thousand prisoners in privately managed prisons in Oklahoma and Texas, at a much lower cost per inmate day.) The Department also separated out the cost of temporary beds, which were being purchased at almost half the cost of long-term places. After adding in the cost of monitoring and support costs, the Department calculated the average cost for long-term in-state contract beds at $48.38 per inmate day, which was slightly more than the average for Level Two security beds in the state system (at $47.30).

Competitive Edge: The Evidence
82
The Department asked the accounting firm, Maximus to review its methodology. Maximus endorsed this broad approach, although it also chose to omit female inmates from the public sector totals and ‘return-to-custody’ beds from the private sector totals, to arrive at a comparison of Level 2 male inmate beds in the public and private sectors.
Maximus also identified a number of costs that had been incorrectly classified or allocated to the public and the private sector facilities (such as inmate intake and transportation costs that had been charged exclusively to the public prisons and labour relations and IT costs that had been wrongly allocated to the private facilities). Adjustments were made to correct for these errors. The result of these changes was to further widen the gap between the public and the private sectors.
However, Maximus identified several other public sector costs that were not included in the calculations:
the calculations for the state prisons did not include the costs of central support services provided by • other state government agencies (and in this regard, the treatment of pensions was not explained);
nor did they include a sum for the depreciation of the physical assets. Maximus provided no estimate as • to the value of services provided by external agencies, but because of the age of the state’s prisons, they estimated that depreciation might be as low as $2 per inmate per day. However, no rigorous analysis was done on this question. (The cost of contracting for private prisons does include capital costs.)
In 2005, Maximus undertook this analysis on behalf of the Department (instead of reviewing the Department’s analysis as it had in previous years), finding a much narrower public sector cost advantage of 7.5%. Part of the explanation for the increase in the average cost of state prisons lay in the inclusion of estimates for building and equipment depreciation and state central services (a total of $1.55 per inmate day). Maximus had also included a newly-opened private facility – Arizona State Prison – Kingman, which had much higher costs than the other private facilities. No explanation was given for these higher costs. No comparison was undertaken of the qualitative performance of the two groups of prisons.
Critical analysis: The ADC methodology for FY2003 and FY2004 was open to criticism because of its failure to incorporate the cost of depreciation and external agency services. In its report for FY2005, Maximus reported that it had relied on depreciation schedules maintained by the Arizona Department of Administration. In the result, depreciation accounted for only 2.5% of the total cost per inmate day. None of the ADC or Maximus studies discussed treatment of other significant issues such as pensions and insurance costs. Nor did these studies take into account the taxes paid by the private contractors.
But questions also arise about the methodology adopted in costing the Level 2 private sector beds. While there is good reason to exclude out-of-state places, on the basis that they are part of a different market, the approach adopted in excluding temporary and return-to-custody beds in the in-state contracted facilities is open to challenge. It is possible that the results were highly sensitive to the departmental policy for allocating ‘permanent’ prisoners as between public and private prisons: for example, why was it that some of the private in-state facilities that were contracting for temporary beds were apparently operating under-capacity at a time when Arizona’s prison system was considerably over-crowded?
The decision to include Kingman in the private sector sample in 2005, and its abnormally high costs, was not explained. Leaving Kingman out of the calculations, the difference between the public and private sectors in 2005 was as little as 3.5%.
Given the high cost of monitoring allocated to the private prisons ($1.69 per inmate day in 2005 – higher than the cost of capital infrastructure), the treatment of these costs is also in issue. (Some critics have argued that in installing independent on-site monitors, the public sector is buying a higher level of accountability than exists in the public sector, and this needs to be taken into account in public-private comparisons.186)
In short, the debate over the methodology used by the Arizona Department of Corrections and Maximus to compare the financial performance of public and private prisons will continue.
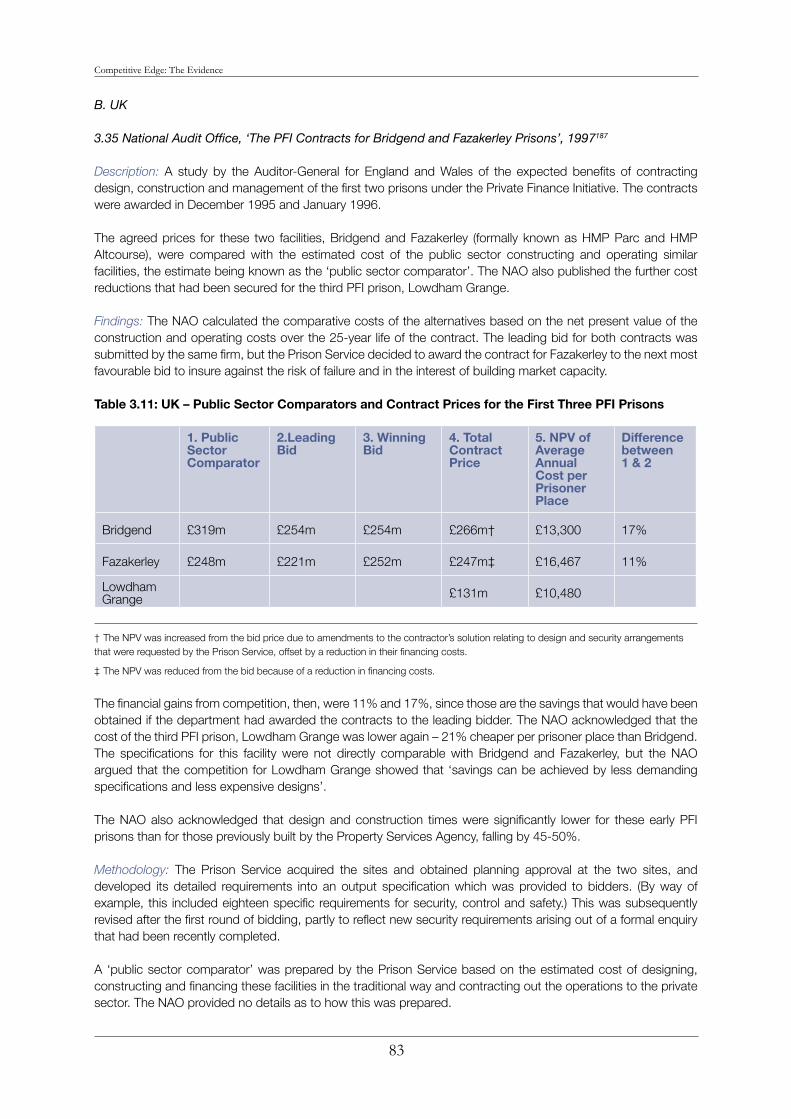
Competitive Edge: The Evidence
83
B. UK
3.35 National Audit Office, ‘The PFI Contracts for Bridgend and Fazakerley Prisons’, 1997187
Description: A study by the Auditor-General for England and Wales of the expected benefits of contracting design, construction and management of the first two prisons under the Private Finance Initiative. The contracts were awarded in December 1995 and January 1996.
The agreed prices for these two facilities, Bridgend and Fazakerley (formally known as HMP Parc and HMP Altcourse), were compared with the estimated cost of the public sector constructing and operating similar facilities, the estimate being known as the ‘public sector comparator’. The NAO also published the further cost reductions that had been secured for the third PFI prison, Lowdham Grange.
Findings: The NAO calculated the comparative costs of the alternatives based on the net present value of the construction and operating costs over the 25-year life of the contract. The leading bid for both contracts was submitted by the same firm, but the Prison Service decided to award the contract for Fazakerley to the next most favourable bid to insure against the risk of failure and in the interest of building market capacity.
Table 3.11: UK – Public Sector Comparators and Contract Prices for the First Three PFI Prisons
1. Public Sector Comparator
2.Leading Bid
3. Winning Bid
4. Total Contract Price
5. NPV of Average Annual Cost per Prisoner Place
Difference between 1 & 2
Bridgend £319m £254m £254m £266m† £13,300 17%
Fazakerley £248m £221m £252m £247m‡ £16,467 11%
Lowdham Grange £131m £10,480
† The NPV was increased from the bid price due to amendments to the contractor’s solution relating to design and security arrangements that were requested by the Prison Service, offset by a reduction in their financing costs.
‡ The NPV was reduced from the bid because of a reduction in financing costs.
The financial gains from competition, then, were 11% and 17%, since those are the savings that would have been obtained if the department had awarded the contracts to the leading bidder. The NAO acknowledged that the cost of the third PFI prison, Lowdham Grange was lower again – 21% cheaper per prisoner place than Bridgend. The specifications for this facility were not directly comparable with Bridgend and Fazakerley, but the NAO argued that the competition for Lowdham Grange showed that ‘savings can be achieved by less demanding specifications and less expensive designs’.
The NAO also acknowledged that design and construction times were significantly lower for these early PFI prisons than for those previously built by the Property Services Agency, falling by 45-50%.
Methodology: The Prison Service acquired the sites and obtained planning approval at the two sites, and developed its detailed requirements into an output specification which was provided to bidders. (By way of example, this included eighteen specific requirements for security, control and safety.) This was subsequently revised after the first round of bidding, partly to reflect new security requirements arising out of a formal enquiry that had been recently completed.
A ‘public sector comparator’ was prepared by the Prison Service based on the estimated cost of designing, constructing and financing these facilities in the traditional way and contracting out the operations to the private sector. The NAO provided no details as to how this was prepared.

Competitive Edge: The Evidence
84
Subsequent studies have shown that, while there are differences, the performance of the PFI prisons is comparable to that of publicly-managed prisons. These first three PFI prisons – now known as Parc, Altcourse and Lowdham Grange – were listed being among some of the best prisons in the public estate.188
Sources of benefits: (i) Construction – The leading bidder developed a design that used much less space, with fewer buildings and a smaller perimeter than the other companies (and, by implication, the Prison Service, had it commissioned the prison itself). This was possible because of a number of changes to the way in which services were delivered: an appointment system was introduced for prison visits (reducing the space needed to house visitors); and kitchen facilities were eliminated by using a catering service). These initiatives had been used overseas but to that time, not in any British prison, and the Prison Service estimated that these design initiatives may have reduced the cost of the bid by as much as 30%.
The other contractor introduced a modular cell system of construction that resulted in much faster construction times. One of the reasons why design and construction times had fallen was that the PFI consortia overlapped design and construction and accepted the first prisoners as soon as construction was complete, rather than having a separate commissioning period.
(ii) Operations – There was external evidence of innovation in the service solutions, but this was not addressed in the NAO report.
Critical analysis: A 1994 study by the NAO showed that of the seven previous prison construction projects, undertaken by the Prison Service under more traditional models, showed that outturn costs were, on average 18% higher than the estimated costs at tender stage. All PFI prisons came in on-budget.189
The outturn costs of these early PFI projects were actually lower than the initial contract price. In 1999, the owners of the prison at Fazakerley refinanced the project, increasing their expected returns by £10.7m (or 61%). In addition, since the project was completed ahead of schedule and savings had been achieved on construction and commissioning costs, the increase in the shareholders’ expected returns was £14.1m (or 81%). The Prison Service received only £1m from this refinancing.
This was one of the earliest occasions on which a PFI project had been refinanced, and the NAO warned that there would be further refinancing of PFI prisons as the early risks associated with the market vested. It is more likely, however, that any such gains were built into the prices offered by competing companies in the subsequent bids.190
3.36 Home Office, ‘Review of Comparative Costs and Performance of Privately and Publicly Operated Prisons’, 1996-2000191
Description: Between 1995 and 2000, the Home Office studied the performance of four privately managed prisons (originally three), and benchmarked them against ten publicly managed facilities (originally eight). The four prisons had been designed and build by the public sector, so that this was a comparison of operational performance only.
Findings: The average cost per prisoner for the four contract prisons was 11% to 15% lower than the average for the public sector comparators. However, reflecting a shift in overcrowding, the difference in cost per in-use place declined from 22% in 1994-95 to 1% in 1998-99.
Methodology: The choice of comparators was the subject of a detailed analysis by Coopers & Lybrand at the outset of the study. The Prison Service had advised that the most important cost drivers were prison size and prisoner mix (in particular, the number of unsentenced and Category A prisoners). Location was also thought to be relevant, although it was recognised that accounting for its impact would be difficult. The high cost of living in London was dealt with by only using prisons from outside the capital.
Other factors were more difficult to take into account because of lack of data: prison design, state of repair, use of technology and prison regime. In some cases, Coopers & Lybrand reported that the comparator prisons were similar in terms of age and design, while in other cases they advised on the need for caution in interpreting the results. As the profiles of some of the contract prisons shifted over time, the comparators were also changed.

Competitive Edge: The Evidence
85
Analysis indicated that the results were sensitive to overcrowding and refurbishment. Overcrowding was addressed by comparing cost per prisoner and cost per place; refurbishment was taken into account through comparing cost per baseline place and cost per in-use place.
The costs of monitoring the contract prisons were included, as well as a proportion of the overheads associated with the provision of supplies and transport services for the contract prisons. Value-added tax was excluded from both the private and public prisons; however, it seems that the study neglected to offset the revenue received by the UK government in corporate income tax from the privately managed prisons.
In the case of the comparator prisons, central services such as IT maintenance, personnel and training were allocated according to a variety of formulae. From the available information, it does not appear that pension costs were incorporated in the adjustments to the comparator prisons. Procurement costs were excluded on the basis that the study was considering ongoing operating costs.
Comparison of service levels also resulted in mixed results, but in general, it could be said that the privately-managed facilities were comparable. Inmates in the contract prisons spent more hours out of cell and they were engaged in more hours of purposeful activity per week. Assault rates were generally higher in three of the privately managed prisons, and the comparative results from positive drug tests were also mixed, with two of the contract prisons being consistently lower than their comparators.
Sources of benefits: Separate studies undertaken by the Prison Service looked at staff costs in the contract and benchmark prisons, covering the years 1995-96, 1996-97 and 1997-98.192 Staff costs per prisoner at the contract prisons were 33-39% lower than the publicly managed prisons.
Around half of this was achieved through fewer staff per prisoner – the privately managed prisons had around 20% fewer staff, and the ratio of total employees per prisoner were even lower, at 24-29%. The private prisons also had a higher level of sub-contracted staff (13% compared to 5% in the public sector).
The other half was explained by lower average staff unit costs. Employee unit costs were 21-24% lower in the privately managed facilities. Salary costs were up to 17% less, and pensions up to 86% (the latter because the Civil Service scheme was non-contributory and offered more generous benefits). It seems likely that pension costs were not included in the Coopers & Lybrand study of the comparator prisons, which probably explains why the cost differences in this study were so much greater.
Overtime costs were 33-65% less than the public prisons. The working week was slightly longer (3%), but planned time off was originally 20% less (falling to 13% in the third year of the study). Sick leave was 43-53% less and overtime up to 50% less than the public sector. On the other hand, a significantly higher proportion of time was spent in training (17-28%), presumably because of higher turnover rates.
Critical analysis: Harding argued that these studies were based on a robust methodology. He also accepted the Home Office interpretation that the improvement in costs per place reflected an improvement in the performance of the benchmark prisons, recognising that if this were happening, then it would be evidence of the benefits of contestability.193
We disagree. Given the sensitivity of the results to overcrowding, the treatment of this variable is particularly important. In the first year of the study (1994-95), the comparator prisons were 13% overcrowded while the private facilities were under capacity. By the fifth year, this position has been reversed – overcrowding in the contract prisons had risen to 26% (overall), while that of the comparator prisons had fallen to 7%.
The primary effect of overcrowding is to increase the cost per place relative to cost per prisoner (since the number of prisoners and their associated costs both increase relative to the number of prison places which remain fixed). This will be offset to some extent by economies of scale, but given that this study excluded capital costs and that labour costs account for around 70% of prison operating costs, it seems likely that the impact of scale economies will not have been major. (Unfortunately, the statistical analyses undertaken for these studies were not published.)

Competitive Edge: The Evidence
86
With the reversal in the extent of overcrowding in the two groups of prisons over the study period, it is unsurprising that costs per place in contract prisons rose and that they fell in the comparator prisons (and, as a result, that the differential between private and public prisons fell dramatically). Given such a major change in the characteristics of the two groups, there seems little doubt that cost per prisoner is the better indicator.
We do not have the data to incorporate these additional factors into the calculation of cost differentials, but given that personnel costs make up around 70% of prison operating costs, we can get some idea by looking at the differences in staff costs. On this basis, the privately managed prisons were roundly one-third less costly (per prisoner) than the comparator prisons, although there would have been additional costs associated with training due to higher turnover rates. This also understates the differential since it doesn’t include the tax revenue paid by the contractors.
3.37 HM Prison Service, ‘Supplementary Memorandum’, 2001194
PricewaterhouseCoopers, ‘Financial Review of Scottish Prison Service Estates Review’, 2002195
Description: In 2001, the Prison Service provided the House of Commons Public Accounts Committee with the contract prices for all prisons negotiated under the Private Finance Initiative to that point in time.
Findings: The cost of PFI prisons continued to fall over the next five projects that followed Lowdham Grange. In 2001, the Prison Service published the comparative costs of all of the PFI prisons to that point in time. Based on actual costs, there was a reduction of as much as 26% per prisoner place since Bridgend had been bid and won. This suggests that by 1998, when Rye Hill was signed, competition using the PFI model had reduced the total costs of building and operating an 800 bed prison by as much as 38%.
A study by PricewaterhouseCoopers undertaken for the Scottish Prison Service in 2002, published comparable data on costs per prisoner place per year, and included the one Scottish PFI prison to that point in time.
Methodology: The data are based on the contract price finally negotiated between the government and the contractor. Since none of the PFI prisons had gone over budget, this can be regarded as the outturn cost.
If we are looking at the contribution that PFI competition made to the cost of an 800-bed prison over this period, then the appropriate comparator is the one used for Bridgend, and not the one that was prepared for Forest Bank, which should have taken into account the lessons learned from the previous PFIs.
Critical analysis: While these prisons can be regarded as comparable in terms of scale and age, there may have been other differences between Bridgend and Forest Bank that this comparison does not take into account. On the other hand, this underestimates the impact that competition had on the cost of new prisons in the UK over the period since 1992, since the public sector comparator incorporated the efficiencies delivered in the first four non-PFI contract prisons.
There is reason for having some confidence in the cost estimates prepared for the public sector comparator for Bridgend (Parc). At the time it was prepared in 1994, the Prison Service had recently completed a major programme of building seven public sector prisons.
Not all of the cost reduction can be attributed to operating cost efficiencies. The contract price incorporates capital and operating costs, and it is known that there were significant reductions in the cost of building in the early PFI prisons due to innovations in design and construction. On the other hand, operating costs account for around 60% of the PFI contract price, which suggests that there could well have been further operating cost efficiencies.

Competitive Edge: The Evidence
87
Table 3.12: UK – Average Annual Cost Per Prisoner Place for PFI Prisons (HMPS)
Public Sector Comparator for Bridgend§
Parc(Bridgend)
Altcourse (Fazakerley)
Lowdham Grange
Ashfield Forest Bank
Rye Hill
Dovegate
NPV of total contract price £319m £266m £247m £137m £121m £197m £154m £241m
No. of prisoner places 800 800 600 500 400 800 600 800
NPV of average annual cost per prisoner place
£13,300 £16,467 £10,480 £12,100 £9,850 £12,267 £12,050
Table 3.13: UK - Average Annual Cost Per Prisoner Place for PFI Prisons (PWC)
Parc(Bridgend)
Altcourse (Fazakerley)
Lowdham Grange
Kilmarnock Ashfield Forest Bank
Rye Hill Dovegate
NPV of total contract price £266m £247m £137m £132m £121m £197m £154m £241m
No. of prisoner places 800 600 500 500 400 800 600 800
NPV of average annual cost per prisoner place***
£16,068 £19,540 £12,982 £11,749 £12,908 £10,412 £10,457 £12,293
§ This column was not in the data tabled by the Prison Service, but has been drawn from the NAO report above.
*** Updated to reflect price inflation from each contract date to 31 March 2001

Competitive Edge: The Evidence
88
C. AUSTRALIA
3.38 Monte Wynder, ‘The Pros of Private Prisons’, 1993196
Description: A comparison of the operating costs of a privately managed facility, Borallon, with a publicly managed prison, Lotus Glen, for the year 1991-92.
Findings: Without considering overheads, the unit cost per offender per annum at Borallon was 4.3% lower than at Lotus Glen. When central office overheads were allocated to Lotus Glen (but not to Borallon), the differential rose to 23%.
Methodology: The comparison was based on data supplied by the Queensland Corrective Services Commission (QCSC). The question of comparability was only lightly addressed in the article, but later research comparing the same two prisons was based on a claim of broad comparability by the QCSC.
Sources of benefits: Staffing ratios for custodial officers (inmates to guards) was 2.7 at Borallon, compared to 1.5 at Lotus Glen. On the other hand, the ratio of inmates to other employees was 5.19 at Borallon and 8.48 at Lotus Glen. The author of the study observed: ‘The private facility at Borallon. . . employs more program staff (e.g. industry supervisors and educational tutors) and fewer custodial staff (guards) than a public facility with a similar security rating.’
There were also significant differences in overtime and sick leave. Borallon had paid out ‘little or no overtime’ in the year in question, while at Lotus Glen, in the first six months, Lotus Glen paid out nearly $4m in overtime and $3m in penalty rates, the total representing 27% of salaries and wages. Over the previous four years, absenteeism at Borallon had averaged 2.8 days per person per annum. By comparison, the average for all public prisons in Queensland was 7 days.
Critical analysis: As noted below, the two facilities were not directly comparable and the approach adopted in allocating overheads in this study was not sound.
3.39 Stan Macionis, ‘Contract Management in Corrections in Corrections: The Queensland Experience’, 1994197
Description: A comparison by the Queensland Corrective Services Commission of Borallon (private) and Lotus Glen (public) for the year 1992-93.
Findings: The QCSC estimated that in 1992-93, Borallon cost 11.4% less than Lotus Glen.
Methodology: The QCSC regarded the differences in infrastructure at the two facilities as minimal. However, the inmate classification mix was different: Borallon was 80% medium security prisoners, with the remainder low and open, while Lotus Glen was 20% high security, 40% medium and 40% low and open. It was expected that the large numbers of low and open security prisoners at Lotus Glen would partially offset the additional costs associated with a small number of high security inmates. Lotus Glen performed a wider range of functions, although the Commission found it difficult to quantify what impact this would have on costs.
Macionis recognised that qualitative comparisons were the most problematic. However, Borallon had the highest programme content of any prison in the state, evident from the fact that it had twice as many management, administrative and programmes staff as Lotus Glen.
In this study, overheads were addressed. Since Borallon operated as a ‘stand-alone’ facility with little support from central office, the Commission took the view that overheads were substantially less. Some audit, prisoner welfare, transport and escort, police and operations costs were allocated to the contract facility. By comparison, Lotus Glen received heavy assistance from head office.
Critical analysis: As noted below, Brown and the Queensland Public Sector Management Commission questioned the methodology used for allocating overheads.
Competitive Edge: The Evidence
89
3.40 Allan Brown, ‘Economic Aspects of Prison Privatization: The Queensland Experience’, 1994198
Description: Comparison of a privately managed prison at Borallon and a publicly managed facility, Lotus Glen Correctional Centre, in the Australian state of Queensland in 1991-92 and 1992-93.
Findings: In 1991-92, Borallon was 8.5% less costly than Lotus Glen, based on the net annual cost per prisoner. However, when head office overheads were allocated to Lotus Glen, there was a 39% cost advantage for the privately managed facility.
There had been academic criticism of the decision to allocate extensive overheads to Lotus Glen and none to Borallon, and in 1992-93, the Queensland Corrective Services Commission (QCSC) allocated $1,300 per inmate to Borallon, while the comparable figure for Lotus Glen was reduced by $870. In 1992-93, the net annual cost per prisoner at Lotus Glen was 9% less than at Borallon, but with overheads, Borallon still enjoyed a 12.9% cost advantage.
Methodology: Data were supplied by the Queensland Corrective Services Commission, which maintained that the two facilities were broadly comparable. The mix of security classifications was different at both facilities, but the QCSC said that it expected that ‘the large numbers of low and open security prisoners at Lotus Glen Correctional Centre would more than offset the additional costs associated with the small number of high security inmates.’ Borallon had the highest programme content of any correctional centre in the state and employed a much greater number of staff on programmes than did Lotus Glen.
The author accepted that there were sufficient similarities between the two institutions for the comparison to be meaningful and worthwhile, however he was critical of the Commission’s practice of publishing figures without providing the underlying methodology. A study by the Queensland Public Sector Management Commission in 1993 was critical of the methodology used in allocating overheads to the contract prisons. No data were published by the QCSC after 1993. A comparison of qualitative performance at the two institutions was not available.
Sources of benefits: The author was not able to ascertain the reason for the sudden reversal in the comparative operating efficiency of the two prisons, and given the short time period involved, he argued that it could not be assumed that this would be maintained.
3.41 NSW Department of Corrective Services, 1998-2003199
Description: Comparison of the average cost per inmate day for prisoners managed by the New South Wales Department of Corrective Services and a privately managed facility, Junee Correctional Centre, from 1997-98 to 2003-04.
Findings: Junee Correctional Centre was a medium/minimum security institution, and the following table, based on data supplied by the Department and published annually by the Auditor-General, compared the cost per prisoner day at Junee, with the average cost per prisoner day for minimum security institutions in the state of New South Wales. The Department of Corrective Services and the Auditor-General acknowledged that these numbers were not directly comparable – for example, state facilities were generally older than Junee.
However, the growing disparity between the cost of managing prisoners at Junee and the average cost of the state maintaining them in minimum security institutions was striking, and this was consistently noted in annual reports by the Auditor-General. In 2004, the NSW Department of Corrective Services stopped publishing comparative statistics.
The Public Accounts Committee of the NSW Legislative Assembly noted in 2005 that these data did not take into account the fact that Junee was paying for its own health costs. After deducting an estimate from the costs for Junee, the costs for the contract prison in 2003 were half of the average for minimum security prisons managed by the state.
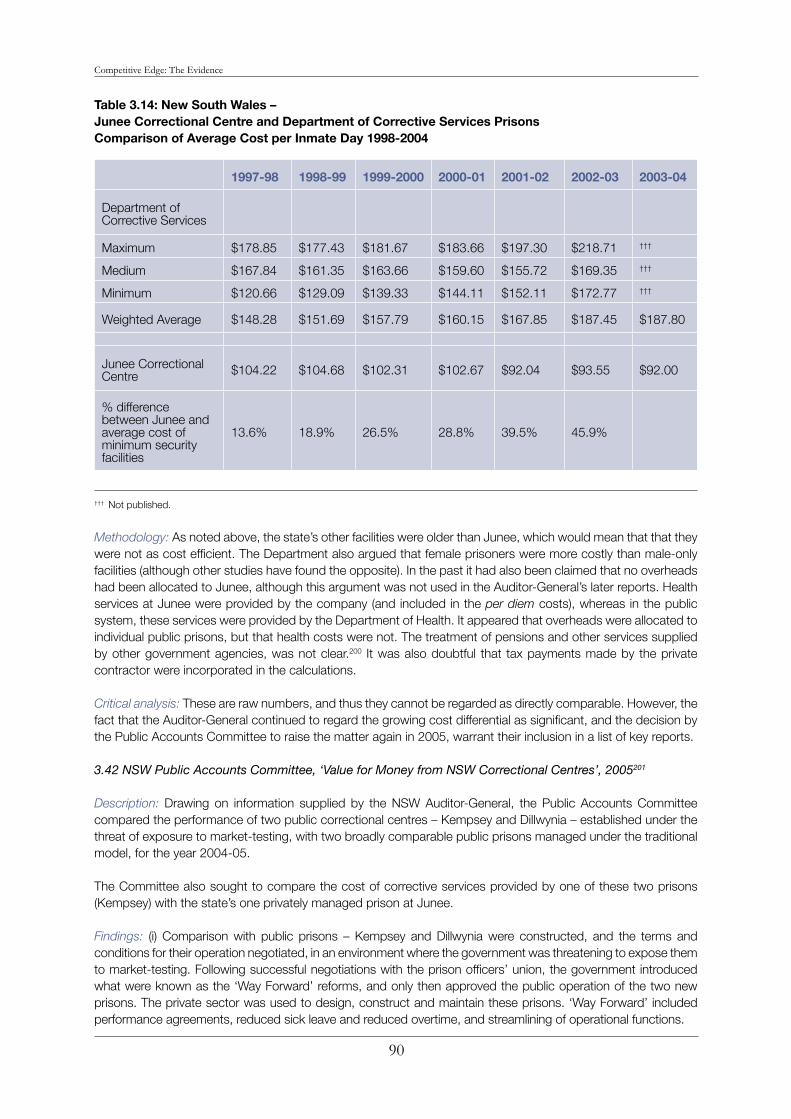
Competitive Edge: The Evidence
90
Table 3.14: New South Wales – Junee Correctional Centre and Department of Corrective Services Prisons Comparison of Average Cost per Inmate Day 1998-2004
1997-98 1998-99 1999-2000 2000-01 2001-02 2002-03 2003-04
Department of Corrective Services
Maximum $178.85 $177.43 $181.67 $183.66 $197.30 $218.71 †††
Medium $167.84 $161.35 $163.66 $159.60 $155.72 $169.35 †††
Minimum $120.66 $129.09 $139.33 $144.11 $152.11 $172.77 †††
Weighted Average $148.28 $151.69 $157.79 $160.15 $167.85 $187.45 $187.80
Junee Correctional Centre $104.22 $104.68 $102.31 $102.67 $92.04 $93.55 $92.00
% difference between Junee and average cost of minimum security facilities
13.6% 18.9% 26.5% 28.8% 39.5% 45.9%
††† Not published.
Methodology: As noted above, the state’s other facilities were older than Junee, which would mean that that they were not as cost efficient. The Department also argued that female prisoners were more costly than male-only facilities (although other studies have found the opposite). In the past it had also been claimed that no overheads had been allocated to Junee, although this argument was not used in the Auditor-General’s later reports. Health services at Junee were provided by the company (and included in the per diem costs), whereas in the public system, these services were provided by the Department of Health. It appeared that overheads were allocated to individual public prisons, but that health costs were not. The treatment of pensions and other services supplied by other government agencies, was not clear.200 It was also doubtful that tax payments made by the private contractor were incorporated in the calculations.
Critical analysis: These are raw numbers, and thus they cannot be regarded as directly comparable. However, the fact that the Auditor-General continued to regard the growing cost differential as significant, and the decision by the Public Accounts Committee to raise the matter again in 2005, warrant their inclusion in a list of key reports.
3.42 NSW Public Accounts Committee, ‘Value for Money from NSW Correctional Centres’, 2005201
Description: Drawing on information supplied by the NSW Auditor-General, the Public Accounts Committee compared the performance of two public correctional centres – Kempsey and Dillwynia – established under the threat of exposure to market-testing, with two broadly comparable public prisons managed under the traditional model, for the year 2004-05.
The Committee also sought to compare the cost of corrective services provided by one of these two prisons (Kempsey) with the state’s one privately managed prison at Junee.
Findings: (i) Comparison with public prisons – Kempsey and Dillwynia were constructed, and the terms and conditions for their operation negotiated, in an environment where the government was threatening to expose them to market-testing. Following successful negotiations with the prison officers’ union, the government introduced what were known as the ‘Way Forward’ reforms, and only then approved the public operation of the two new prisons. The private sector was used to design, construct and maintain these prisons. ‘Way Forward’ included performance agreements, reduced sick leave and reduced overtime, and streamlining of operational functions.

Competitive Edge: The Evidence
91
The Committee concluded that ‘Way Forward’ had ‘resulted in significant cost savings when compared to correctional centres operating under the traditional model’. In the first year of operation, the two ‘Way Forward’ prisons had significantly lower levels of overtime and sick leave compared with two other publicly managed prisons operating under the traditional industrial award. This had resulted in a direct cost per inmate day that was more in line with the performance of Junee.
Table 3.15: New South Wales – Comparison of Overtime and Sick Leave at Two Traditional and Two ‘Way Forward’ Prisons
Kempsey Bathurst Dillwynia Mulawa
Overtime
% of total employee related expenses
1% 6% 2% 11%
$ per inmate per day 0.84 5.93 1.67 25.52
Sick leaveAverage sick days per staff member
6.37 9.89 5.96 13.81
$ per inmate per day 65.55 103.99 101.33 230.00
(ii) Comparison with a privately managed facility – The Committee reported the average cost per inmate day for public prisons in 2003-04 as $187.80. In 2004-05, the cost per inmate day at Junee was $82.59, although this included the cost of healthcare, and when this was removed, the cost was around $73.59. By comparison, the Mid North Coast Correctional Centre at Kemsey cost $87.76, although it housed male and female prisoners of all classifications, so that its costs were expected to be higher than at Junee. Moreover, Kempsey had also faced some start-up costs. The Committee concluded: ‘This result shows that the ‘Way Forward’ initiative is improving the cost effectiveness of correctional centres in NSW’. Overtime costs at Kempsey were one percent of total employee-related expenses, and at Junee, the company estimated they were less than two percent.
Methodology: (i) Comparison with other public prisons – The Committee compared each of the ‘Way Forward’ prisons with one other similar prison, with comparability based mainly on size and demographics. In June 2005, Kempsey had a population of 462, three-quarters of whom were maximum security and the remainder minimum security. Bathurst Correctional Centre was a medium/minimum security with a population of 441. Dillwynia was a purpose-built minimum security women’s facility, with a population of 166. Mulawa Correctional Centre housed 142 female inmates of all classifications, and had a high percentage of prisoners on remand. The Committee acknowledged that Mulawa could be expected to have slightly higher costs, but pointed out that in 2004-05, its total employee-related expenses exceeded budget by 40%.
(ii) Comparison with a privately managed facility – The two facilities were not directly comparable. Junee had a capacity of 750, compared with 500 at Kempsey. Junee took mostly male prisoners with medium and minimum security classifications, while Kempsey took both male and female prisoners of all classifications. The percentage of prisoners on methadone programs was similar. Junee provided its own health services (although these were taken into account in the costings). Qualitative comparisons were not made, although it was reported that inmates at Junee were out of cell for 11 hours a day, compared with 8 hours at Kempsey, and officers at Junee also performed more case management than most officers in the public system.
Sources of benefits: This is useful in that it focused on several key aspects of personnel management – overtime and sick leave – which appear to have accounted for a significant proportion of the difference between the ‘Way Forward’ prisons and the traditional public prisons, and thus between the state’s only privately-managed prison and the public system.
Critical analysis: While the prisons are not directly comparable, the differentials are so large that the comparison warrants serious attention. This is the only study that we have been able to locate which directly addresses the impact of contestability on public prisons.

Competitive Edge: The Evidence
92
D. FRANCE
3.43 Ministère de la Justice, ‘Rapport Annuel sur le fonctionnement des établissements du Programme 13000, Année 1996’, 1998202
Description: In 1987, the French government entered into contracts for the construction and the management of support services in 25 new prisons across four regions. These have been described as ‘semi-private’ prisons since correctional services were still provided by the public sector. In each region, one prison was retained entirely under public management as a way of benchmarking private sector performance. A study was undertaken of financial and qualitative performance during 1995 and 1996.
Benefits: The report did not distinguish between the public and the ‘semi-private’ prisons, however, since the four public prisons were established in order to serve as benchmarks, it could be argued that they were also subject to the pressures of contestability.
Nevertheless, there was no strong evidence that competition and contestability had reduced spending. In two of the four regions, operating costs per prisoner day fell by somewhat more than the prison system as a whole – 2.02% and 2.1%, compared with 0.59%. In another of the zones, costs fell by roughly the same amount as the national system, while in the fourth, they rose by 1.59%.
Methodology: No details were provided as to the costing methodologies employed. The report emphasised that the correctional institutions in the study were different individually and across regions, so that direct comparison was not possible. Staff surveys showed that satisfaction levels in the ‘semi-private’ institutions were slightly higher than in the four public facilities.
Critical analysis: Without more information, it is difficult to draw conclusions from this study. France does not contract custodial services, and it is possible that one of the explanations for the failure to produce significant savings may lie in the lack of significant economies of scope.
Competitive Edge: The Evidence
93
4. Refuse CollectionAmong traditional government services, only water lends itself more easily to quantification than refuse collection. As such the refuse collection (or solid waste management) sector has provided fertile ground for researchers analysing the financial impact of competition.
There are two different kinds of markets under which services have been organised: periodic and continuous competition. Under periodic competition (or competition for the market), the local authority conducts a competitive tender and contracts exclusively with a single firm to deliver a refuse collection service for a specified duration; this firm can be either a private firm or a public entity, and will usually be paid by the local authority out of public funds collected through taxes and charges, rather than by end users.
In continuous competition (or competition in the market), a number of firms compete for consumers from the residential population by offering their services at market-driven prices with direct payment by individual consumers to their preferred providers; typically these will be private-sector firms, although the local authority may compete if it wishes.
The earliest studies were conducted in North America, where private provision has been commonplace for over fifty years. Werner Hirsch laid the methodological foundation in 1965 by analysing production in the sector to better understand the provision of this and more complicated government services203. Although his work did not explore the effects of competition or compare public and private production, much subsequent work listed below was strongly informed by it.
In the UK, the use of competition in refuse collection services began on a significant scale following the implementation of compulsory competitive tendering (CCT) throughout the 1980s and the first empirical studies followed shortly thereafter. A more prosaic approach has prevailed elsewhere in Europe, ‘where local authorities have been encouraged rather than compelled to make use of competitive tendering and contracting as a means of organising service delivery’. This review also brings together a number of studies of these European pragmatists, drawing upon studies from Switzerland, Sweden, Spain, the Netherlands and the Republic of Ireland.
A. USA
4.1 William Pier, Robert Vernon and John Wicks, ‘An Empirical Comparison of Government and Private Production Efficiency’, 1974204
Description: This study compared production functions of refuse collection services across municipalities in Montana, measuring the productive and labour efficiencies of public and private service providers.
Findings: Unusually among North American studies, public production was found to be more efficient than private. The market was typical in terms of a balance of public and private providers, although the sample included many large, urban areas so generalisation to other areas would require more study.
Methodology: Using information from the Montana Railroad and Public Service Commission and various Montana municipalities there were 34 public and 29 private firms providing a refuse collection service. Questionnaires were sent and 20 public and 12 private respondents replied. These data were then used to estimate input-output functions for various levels of labour, capital and output.

Competitive Edge: The Evidence
94
Critical analysis: Methodological objections were subsequently raised with regard to this paper. Some were straightforward, e.g. quantity was measured in pick-up places rather than number of households or weight collected. Others were more complicated, for example – the contractual solution and the counterfactual were not directly comparable; this study did not compare apples with apples.205
4.2 E.S. Savas, ‘Policy Analysis for Local Government: Public vs. Private Refuse Collection’, 1977206
Description: This paper used a cross-nation survey to compare the efficiency (where efficiency was defined as cost to the household) of various market organisation methods – municipal, contract, franchise or private – used in refuse collection in the United States.
Findings: Collection by private firms under contract was significantly more efficient (cost-effective) than municipal provision where the population was greater than 50,000. Contracting was the least costly service arrangement, then franchise, municipal and private collection. Frequency of collection was slightly higher under municipal provision.
Methodology: Data were drawn from a survey of 1,377 metropolitan communities with populations between 2,500 and 750,000 population. Respondents identified the cost of their refuse collection service in 1975. These data were then analysed for relationships between costs and market organisation type. Econometric analysis was performed in a follow-up by Stevens (1978).
Sources of benefits: According to the author, benefits arose as they had been predicted by rudimentary economic theory – private firms produce goods more cost-effectively than public bureaucracies. There was little attempt to substantiate these assumptions with empirical analysis of explanatory variables; as Savas acknowledged these savings could therefore have come at the expense of service quality or wider welfare losses, but there was no evidence that either had occurred.
4.3 E. S. Savas, ‘An Empirical Study of Competition in Municipal Service Delivery’, 1977207
Description: A case study of Minneapolis, a city that was remarkable for the relatively even distribution of public and private sector providers of refuse collection service. Historically public and private providers had worked in collaboration, each operating separate functions of the solid waste management process. Whereas these two had previously cooperated in performing different tasks, they were then placed in direct competition allowing the author to track comparative costs of each provision in the period 1971-75 to assess the effect of competition on service delivery costs.
Findings: The cost of collection per ton was lower for contract collection than municipal collection. Until 1975 the cost per household was also lower for contract collection; thereafter the city had responded to competitive pressures to match their rivals. There was no obvious difference in customer satisfaction (and therefore quality) between the two methods.
Methodology: The author made use of the ‘excellent’ records kept by the city to examine cost per ton and cost per household (economic performance); tons collected per unit per shift (productivity), and telephone calls per year per household (an admittedly unsatisfactory measure of quality).
Sources of benefits: Simply, the implementation of a competitive system. The introduction of competitive pressures produced downward trends in the cost of production for both public and private provision.
Critical analysis: Non-visible factors rather than the mode of production may have been influencing costs: there were certain to be differences between cities – geography and topography of location, technologies used, number of competing firms and maturity of market - that bias the data. Second, conclusions on the source of any cost-savings were not evidenced in the study, with conclusions relying heavily on organisational theory. However, a follow-up some 14 years later suggested that the Savas findings had stood the test of time, finding in the same cities ‘no evidence that would suggest that public-private systems cannot retain long-term viability’208.

Competitive Edge: The Evidence
95
4.4 William M. Petrovic and Bruce L. Jaffee, ‘The Use of Contracts and Alternative Financing Methods in the Collection of Household Refuse in Urban Areas’, 1978209
Description: A study of 25 cities (pop. 25,000-180,000) in four states in the United States Midwest: Illinois, Indiana, Michigan and Ohio. The authors distinguished between municipal, contract and competitive regimes to examine the contract model in particular as a means of providing household refuse collection.
Findings: In 1978 there was a minority of private contractor arrangements but they were earmarked for increased popularity in future as it was deemed likely that private involvement (and user-charging) would improve productivity and deliver lower costs. However, this finding was contingent on properly incentivised contracts and user charges.
Methodology: Data were collected through questionnaires, contract visits and published government figures. The geography of the sample meant that climate and environmental factors were relatively constant.
4.5 Barbara J. Stevens, ‘Scale, Market Structure and the Cost of Refuse Collection’, 1978210
Description: This statistical analysis explored how the cost of refuse collection service provision varied in relation to the sector in which the collector operated, the level of competition in the market, and the size of the market.
Findings: In cities with a population of under 50,000, contract provision (‘private monopoly’) provision was insignificantly less expensive than public production. This difference became statistically significant for populations over 50,000. But a continuously competitive market system was significantly more expensive than contracting for cities of all sizes.
Methodology: Data were taken from nationwide person-to-person interviews with local government officials and private operators in 1974-75; these were conducted by trained interviewers. In both cases results were checked against households’ payment obligations. The total database was 340 observations from public and private firms across the United States. Figures on city size, frequency of collection, location of collection, population density, capital and labour inputs were used to estimate their respective statistical influence on cost of production.
Sources of benefits: Management and production techniques were credited with the cost effectiveness of private provision. Private monopolists used smaller crews and larger vehicles than their public counterparts: heightened labour-capital intensity and improved labour productivity. These benefits did not come at the expense of service quality since these results hold even when held constant. The costliness of competitive markets was attributed to a lack of economics of contiguity and the responsibility for billing services.
4.6 Franklin R. Edwards and Barbara J. Stevens, ‘The Provision of Municipal Sanitation Services by Private Firms: An Empirical Analysis of the Efficiency of Alternative Market Structures and Institutional Arrangements’, 1978211
Description: Empirical analysis of the alternative market structures and regulatory regimes using private refuse collection firms in 77 US cities in 1975. The six schemes examined were contract following competitive bid; contract with no competitive bid but authority-to-firm negotiation; continuous competition with licensing regulation; continuous competition without regulation; franchise where subscription is mandatory for citizens; franchise where subscription is not mandatory (a franchise in this case is a contract-style periodic monopoly with two key distinctions: (i) payment transaction is directly between citizen and service provider; (ii) subscription to a refuse collection service was not always mandatory under a franchise regime).
Findings: Contract arrangement was the most efficient arrangement: prices in non-contract cities were found to be 41% higher than in contract cities. Under contracting, competitive bidding (as opposed to authority-to-firm negotiation) had no significant effect on expenditure. Governments were able to reap cost savings through economies of contiguity and economies of scale. Economies of contiguity were significant – at least 10% irrespective of city size.

Competitive Edge: The Evidence
96
Methodology: The price households paid for refuse collection service was taken as measure of efficiency. The price paid under each of six market schemes was calculated and compared.
Critical analysis: As with other US studies around this time, the authors’ preoccupation was with total costs and public/private distinction, rather than understanding sources of savings and future service delivery.
4.7 James T. Bennett and Manuel H. Johnson, ‘Public versus Private Provision of Collective Goods and Services: Garbage Collection Revisited’, 1979212
Description: A case study examination of refuse collection service provision in Fairfax County, Virginia using statistical analysis to compare the cost to households of public and private production.
Findings: The odds were less than 1% that the municipal production charge would be lower than a private production charge. Moreover, in ‘virtually all’ cases, private collection was twice as frequent as public collection and private firms had to pay licensing and disposal fees which the public works did not. Cost differentials could therefore have been considerably larger than indicated.
Methodology: The authors recorded the charging demands of the county public works’ solid waste division and compared these with the various charging levels of the 29 private providers in the state. A simple statistical analysis calculating the relationship between public or private and cost of provision was then performed.
Sources of benefits: These are not examined. The authors, writing from a leading institution for public choice (the branch of political economy which recommends privatisation of virtually all government operations), appeared to take as read that economic and organisational theory on public and private institutions explained any differences.
4.8 E.S. Savas, ‘Intracity Competition Between Public and Private Service Delivery’, 1981213
Description: Case studies of six competitive systems in Kansas City, Missouri; Akron; Minneapolis; New Orleans; Oklahoma City; and Montreal. The cities were examined for public-private balance in the market, service area characteristics, and costs and productivities, and then compared to explore cross-city patterns.
Findings: Measuring efficiency as a straightforward cost to the consuming household, contracting was the most efficient means, then municipal ownership and then outright privatisation. Costs were found to be significantly lower for populations over 50,000.
Methodology: One-year snapshots were reported for the public-private balance in the market as well as local service area characteristics, and these are then taken alongside relative cost to each household and total cost of collection per tonne to estimate the relative efficiencies of different systems.
Sources of benefits: Lower costs were attributed to private production’s heightened efficiency, reduced vulnerability to strikes, reduced vulnerability to contract failures, protection against monopolistic behaviour, heightened accountability, heightened knowledge and understanding of service delivery. However, rarely had any of these been fully maximised; there was scope in all cities to better understand and thus exploit the advantages on offer from competitive systems with public and private participation.
Critical analysis: The study measured only cost and neither effectiveness nor total social welfare: that is, there was no measure of whether the contractor provides an adequate service at this lower cost, and nor was there a consideration for the wider implications of wage cuts and job losses. Sources of savings were identified on the basis of theory rather than evidence.

Competitive Edge: The Evidence
97
4.9 Jeffrey A. Dubin and Peter Navarro, ‘How Markets for Impure Public Goods Organize: The Case of Household Refuse Collection’, 1988214
Description: This study examined two apparent paradoxes in previous literature: (i) that other reports had found contracting the most efficient market organisation, yet only 43% of 6,000 communities surveyed usde this method. If contracting is the most efficient method, why was it not more widely adopted?; (ii) theory recommends contracting over the free market on the basis of economies of density – yet these have been sparsely reported in empirical studies. Why has empirical experience not born out economic theory with regards to economies of density?
Findings: The choice of market factors depended not only on economic factors but also political factors including interest groups and ideological preferences. Market organisation choices in both Democratic and Republican communities were likely to diverge from the cost-minimising alternative, and this divergence imposed real costs on the individual community. Policy implications were ambiguous as they are dependent on the question: ‘what is the role of ideology in shaping the role of the community?’
Methodology: The authors first developed a theoretical model of how public authorities choose to organise the markets for impure public goods: first, whether they choose to regulate the market or opt for laissez-faire; secondly, if regulation is chosen then which form of provision – municipal, contract or franchise – is chosen? This theoretical model was then used to estimate an empirical model using cost data from a survey of 1,377 metropolitan communities with populations between 2,500 and 750,000 population215. Statistical analysis held all other variables constant except the political preferences of the locality (these were taken from electoral results) to estimate the significance of ideology in decision-making.
4.10 David N. Ammons and Debra J. Hill, ‘The Viability of Public-Private Competition as a Long-Term Service Delivery Strategy’, 1995216
Description: This article provided an update on an earlier study by Savas (1981, see above). It returned to five of the six cities studies in Savas’ original study to explore whether his findings – that public-private partnerships demanded a more active role in public policy making – had stood the test of time; one criticism to which Savas (1981) had been vulnerable was that a number of the cities were not yet mature markets.
Findings: Competitive systems had delivered as Savas had predicted they would. Price levels in cities using a competitive service model had stayed below the consumer price indexes and the national average for per capita spending on refuse collection. Competition had proven a two-way street with municipal and contract systems each adopting practices of the other.
Methodology: The authors examined comparable data from 1986 and 1993 to alongside that used by Savas to ascertain whether lower cost levels had been maintained over time. Their subjects of examination were the same as Savas: public-private balance in the market, service area characteristics, and costs and productivities. These were then compared to explore patterns between costs and production methods across different cities.
Sources of benefits: As with Savas’ earlier study, the primary focus was the costs of service production and delivery under public and private auspices rather than the sources of any differences. Competitive systems were found to be more cost-effective than those systems where competition had not been employed; therefore the introduction and operation of competitive systems was the source of financial benefits.

Competitive Edge: The Evidence
98
B. CANADA
4.11 James C. Mc David, ‘The Canadian Experience with Privatizing Residential Solid Waste Collection Services’, 1985217
Description: This was the first published article on the author’s ongoing long-term study of private sector involvement in the Canadian solid waste collection industry. It compared the costs of provision under public monopoly and contracting-out across 126 municipalities. There was also a two-region case study of collection comparing service production in Richmond and West Vancouver.
Findings: Contracted private companies tended to be more efficient than municipal services. Public provision tended to be significantly more expensive, with municipal workers less productive and their equipment less efficient than their private sector counterparts. In both Richmond and West Vancouver, service costs fell while quality either held constant or even improved. Overall, unit cost savings are found to be larger than comparable studies in the United States218. The role of competition, rather than the public-private dichotomy, is said to be fundamental.
Methodology: A survey of 126 municipalities in 1981-82 used a questionnaire to identify costs of production across Canada. Costs were separated so as to ensure a high level of comparability and where there were gaps in survey answers statistical modelling was used to estimate the magnitude of the missing figure.
Sources of benefits: Contractor workers were significantly more efficient than municipal workers, and although that difference became smaller where provision in one district was shared between the two sectors it was still large. Private firms also tended to use larger vehicles and smaller average crew sizes to substantially reduce the average cost of a journey. Private sector workers earned 90% of the average wage of a public sector worker, but this magnitude was insufficient to explain the overall productivity differentials.
4.12 James C. McDavid and Gregory K. Schick, ‘Privatisation versus Union-Management Co-operation: The Effects of Competition on Service Efficiency in Municipalities’, 1987219
Description: This case study examined residential solid waste collection in two neighbouring Vancouver municipalities, one operating a government monopoly and the other periodic competition via private contract.
Findings: Privatisation did not equate to efficiency. The threat of private sector competition incentivised North Vancouver’s public-sector provider to innovate and eliminate waste such that by 1984 there was no significant difference in efficiency between the public provider and the private contractor.
Methodology: Before-and-after comparison of costs and productivity levels in each district. Using data from households and public finances, the study reported the number of households served and tonnes collected to calculate costs per household and costs per tonne; and productivity through the number of tonnes collected per man per day. The results in each district were then compared to explore comparative efficiency and productivity.
Sources of benefits: Competitive pressure. In 1981 the state-operated North Vancouver service was threatened by the success of private contractors in West Vancouver as well as unsolicited private bids for their own municipality’s services. These threats incentivised innovation and waste elimination. Previously public production in North Vancouver had been costly but the experience of West Vancouver gave public managers both incentive and mandate to innovate and improve their delivery.
4.13 Douglas K. Adie and James C. McDavid, ‘The Cost and Production of a Solid Waste Disposal Service’, 1999220
Description: This chapter analysed cost and production conditions for public and private solid waste collection organisations in British Columbia, Canada in 1989.

Competitive Edge: The Evidence
99
Findings: Private production was found to be 25% to 40% more cost-effective than public production using a model limited by the data to just a few independent variables. The authors also estimated the optimal volume or refuse and/or number of households visited.
Methodology: Data was collected on behalf of the City of Victoria’s Engineering Department as part of a study of department efficiency. Data on production method, crew size, households served, tonnes per year and location of collection were used as the independent variables which explained the average and total costs of refuse collection across 28 municipalities.
Critical analysis: The authors conceded their simple approach was unreliable with regard to production analysis. They compared only total and average costs of production under public and private firms without holding for any of the other factors which might influence those costs, such as frequency of collection, population density or quality of service. As such, as a stand-alone study, results must be used cautiously.
4.14 James McDavid, ‘Alternative Service Delivery in Canadian Local Governments: The Costs of Produc-ing Solid Waste Management Services’, 2000221
Description: This paper reported the key findings of three complementary surveys conducted between 1995 and 1999 on the solid waste management sector in Canada: residential collection, recycling and landfills. With regards to refuse collection, data were collected via survey from 279 residential solid waste collection service providers (private firms and local municipalities).
Findings: There were significant differences by producer type, population size and region. In particular, public producers were found to be 20.3% more costly than private producers. Only in Quebec were public producers more cost-effective than the private sector.
Methodology: The refuse collection data came from a survey of private providers and all local governments across Canada with population over 1000, conducted by the Local Government Institute at the University of Victoria. Costs were separated so as to ensure a high level of comparability and where there were gaps in survey answers statistical modelling was used to estimate the magnitude of the missing figure.
Sources of benefits: These were not examined. Subsequent attention was instead devoted to local government provision of landfills and recycling, and their interaction with the refuse collection sector.
4.15 James C. McDavid, ‘Solid-Waste Contracting-Out, Competition and Bidding Practices Among Cana-dian Local Governments’, 2001222
Description: This article compared public and contracted-out private production for 327 local governments across Canada in 1996. It used national survey data to explore three hypotheses: (1) contracting out production reduced unit costs; (2) where there was intra-municipality competition between public and private, private firms had lower unit costs; (3) bidding process competitiveness reduced unit costs.
Findings: All three hypotheses were confirmed. Contracting out reduced unit costs, though historically large differences between public and private production were found to be shrinking; differences in unit costs only became statistically significant for populations under 10,000. Intra-municipality competition suggested that private firms have lower unit costs than public firms with increased vehicle capacity and lower union membership among crews afforded fewer vacation days. Re-bidding a service rather than renewing a contract with the same private provider yielded significant savings.
Methodology: A total of 976 local governments received the survey nationally with 327 replying (a response rate of 33.5%). The survey requested details of production arrangements, revenues and expenditures, equipment and technology, personnel and contract management practices. Extensive follow-up work was performed to maximise size and completeness of data sample.

Competitive Edge: The Evidence
100
Sources of benefits: The presence of competition appears the key factor in dictating lower unit costs. Certainly, where services had been subject to competition the expenditure on these services was lower. Where private firms and public firms were compared in intra-municipality competition, private firms used larger vehicles and a younger, less unionized workforce than their public counterparts. Regular, diligent monitoring and benchmarking maintained high level of competition that produced lower costs.

Competitive Edge: The Evidence
101
C. UK
4.16 Audit Commission, ‘Securing Further Improvements in Refuse Collection’, 1984223
Description: Comprehensive audit of 400 districts in England and Wales to identify service collection costs 1983-84 and thus explore potential for further value-for-money improvements in future.
Findings: Although estimates had suggested that productivity since 1978 had increased by 25%, there were still significant savings to be made in many districts. Private sector involvement was deemed unnecessary where the local authority was well managed and the labour force well motivated.
Methodology: Bespoke software estimated cost of service for different permutations of inputs across five fields – method and frequency of collection, physical and geographical factors, technical aspects of transport and disposal, labour hours, and finance of capital and labour costs. These variables were then used to identify lowest cost production methods for each authority’s individual circumstances. More broadly, the software was used as a tool for informing authorities on their own performance and those of others.
Sources of benefits: Rationalisation of service delivery to extract best value for money from authority’s specific circumstances. These typically included changing collection methods, using different vehicles and adopting appropriate crewing levels.
Critical analysis: Explicitly cost-centric in approach, the report failed to address the social and economic costs of exclusively pursuing the lowest cost route. Scant consideration was given to the impact on service quality.
4.17 Mitch Gears, ‘Efficient Refuse Collection, Contract Services’, 1984224
Description: This informal article was based on the script of a speech made by Mitch Gears, Marketing & Development Director, Biffa Ltd. to the Institute of Waste Management. It recounted Biffa’s experience as a private firm collecting refuse for North Norfolk District Council, outlining the pre-contract history and broader political context as well as contract-specific problems with environment, custom, adverse publicity and employee relations.
Findings: Surveys of customer feedback suggested that quality was at least maintained if not improved, since complaints to the contrary are negligible. At the same time Biffa made a profit for far less resources expended than by the council. However, the author reported that these profits did not represent an outstanding return on capital. There was therefore a question mark over the profitability of such contracts.
Methodology: Narrative threading together various North Norfolk District Council data on volume collected, annual demand fluctuations, respective resources employed, and customer satisfaction surveys.
Sources of benefits: Improved efficiency of service as well as relationship-building with stakeholders including crew, customers and the local authority.
4.18 Simon Domberger, Shirley Meadowcroft and David Thompson, ‘Competitive Tendering and Efficiency: The Case of Refuse Collection’, 1986225
Description: This paper applied statistical analysis to public accounts data from 403 authorities in England and Wales in the years 1983-84 and 1984-85 to compare the cost of refuse collection services that had been subjected to competitive tender with the cost of those services that had not. It sought to determine (i) whether significant cost savings resulted as a consequence of contracting out refuse collection to a private provider; and (ii) whether local authorities that had subjected their service to tender and awarded the bid in-house had achieved comparable savings.
Findings: Contracting out refuse collection services had resulted in savings of the order of 20%. These savings had not been achieved at the expense of service quality. Moreover there was no significant difference in service costs between public and private provision where competition existed. Conversely, where services had not

Competitive Edge: The Evidence
102
been subjected to tender only a handful of public authorities produced the service as cost-effectively as the private sector.
Methodology: Data were drawn from Chartered Institute of Public Finance and Accountancy statistics. Statistical analysis estimated a cost function for service production based on cost-influencing variables including frequency and method of collection, population density and distance travelled to disposal site. Holding these variables constant the authors identified a 20% cost differential between those services that had been subjected to tender and those that had not.
Sources of benefits: Cost savings had been realised by public and private collectors alike where competition existed and with no evidence of any negative impact on service quality. At the same time, in the absence of competition few public authorities were cost-effective. As such, benefits are attributed to competitive pressures driving efficiency with which the service was provided. However, there was no way to identify the sources brought to bear by competitive pressures.
Critical analysis: Ganley and Grahl (1988, see below) sparked a lively debate in contesting these findings, disputing both the magnitude and sources of cost savings measured by Domberger et al. They argued that a number of variables might explain the differences; these included reduced wages and worker conditions, inferior service quality, authority-specific factors upwardly biasing the estimates (so-called ‘superstar’ districts), and loss-leading behaviour by bidding firms. This article in turn generated a response: Domberger et al (1988, see below).
4.19 John Cubbin, Simon Domberger and Shirley Meadowcroft, ‘Competitive Tendering and Refuse Collection: Identifying the Sources of Efficiency Gains’, 1987226
Description: This article is a follow-up to an earlier paper from the same research group227. Whereas the previous article had shown that tendering services produced 20% cost savings without impacting on quality, and that these savings were attributable to the presence of competition, their approach had not permitted separation and identification of the sources of these savings. This article aimed to remedy that shortcoming using the same public accounts data from 403 authorities in England and Wales in the years 1983-84 and 1984-85.
Findings: There is no evidence that expenditure reductions come from reduced terms and conditions. Rather, savings could be attributed to improvements in technical efficiency, i.e. greater productivity of labour (workforce) and capital (trucks). This might have required more flexible working practices but increased flexibility does not necessarily equate to a deterioration in conditions.
Methodology: Data were drawn from Chartered Institute of Public Finance and Accountancy statistics. Their statistical method measured productive efficiency of different combinations of labour and capital and these efficiency ratings were then separated into those authorities that had tendered the service and those that had not to provide an efficiency differential between competitive and non-competitive regimes.
4.20 Joe Ganley and John Grahl, ‘Competition and Efficiency in Refuse Collection: A Critical Comment’, 1988228
Description: This article outlined a critical appraisal of Domberger et al (1986, see above), who had identified 20% cost savings in the UK as a consequence of subjecting refuse collection services to tender. It outlined two key lines of enquiry: (i) cost savings were not so big as indicated; (ii) where cost savings had been made these were not necessarily a consequence of competition.
Findings: They claimed cost reductions identified by Domberger et al were not so large as indicated because a handful of ‘superstar’ districts with outsized savings skewed the data. Furthermore, where there had been genuine reductions these could be traced to ‘losers’ among the workforce and were devalued by the potential for loss-leading and service quality reductions.
Methodology: Discussion of cost magnitude was rooted in the breakdown and examination of Domberger et al data (1983-85) supplemented with cost comparisons from before CCT implementation (1979/80) and 1984/5. Their discussion of sources was rooted in anecdotal evidence: Ganley and Grahl refuted Domberger et al’s

Competitive Edge: The Evidence
103
econometrics by drawing selectively on newspaper reports and two trade union journals to make claims on reduced worker conditions and service quality, and loss-leader behaviour from private contractors.
Critical analysis: Domberger et al replied, addressing each criticism and robustly defending their original findings in Domberger et al (1988, see below). Where Ganley and Grahl argued cost-savings to be overestimated because of a few ‘superstar’ districts skewing the data, Domberger et al showed that even if these districts were discounted (and it was not clear that they ought to be) then cost savings were still a substantial 15%. Additionally, they reiterated the finding by Cubbin et al (1987, see above) on the lack of evidence of falling service quality. They were less robust in responding to the claim that cost-savings ‘can be traced to “losers” among the workforce’, not denying the possibility of reduced worker conditions but pointing out that no evidence existed on this either.
4.21 Simon Domberger, Shirley Meadowcroft and David Thompson, ‘Competition and Efficiency in Refuse Collection: A Reply’, 1988229
Description: This article was a response to Ganley and Grahl (1988, see above), who had levelled the following criticisms at Domberger at al (1986, see above): (i) magnitude of cost savings had been overestimated due to ‘superstar’ districts skewing the data and (ii) where savings had been made, the sources of these were a cause for concern.
Findings: Savings from tendering out services were still substantial (around 15%) even when ‘superstars’ were omitted (and it is not clear that they ought to be). Ganley and Grahl’s comparator was invalid as it failed to control for any production factors that had changed since 1979, e.g. frequency or method of production. Ganley and Grahl’s suggested sources of savings were not substantiated and their assumption that savings had come at the expense of labour force was shown to be flawed. Deregulation had prompted significant increases in productive efficiency and this remained the most likely source of savings unless opponents could demonstrate otherwise.
Methodology: The magnitude of cost savings was examined through a re-estimation of the Domberger et al tendering coefficient with the disputed ‘superstar’ observations omitted. (This is not a concession that ‘superstars’ are inadmissible). Examinations of further Ganley and Grahl criticism were made through examination of methodology and evidence used to mount their critique.
4.22 Stefan Szymanski and Sean Wilkins, ‘Cheap Rubbish? Competitive Tendering and Contracting Out in Refuse Collection 1981-88’, 1993230
Description: This article aimed to clarify questions from savings measured by Domberger et al (1986, see above). In particular: (1) following tender was there a significant cost-effect between in-house and outsourced award?; (2) what factors caused the cost savings from contracting out?; (3) had the apparent cost savings persisted over time or did they disappear?; (4) could the savings be directly attributed to CCT?
Findings: Those authorities to hold a competitive tender had costs 20% lower than those who did not in the period 1984-86. However, there was no conclusive answer across all estimations for 1987-8 data. Cost per employee was not significantly different in authorities to have tendered but the number of employees was significantly lower, so savings were down to efficiency gains. The data set was too small to conclusively answer on longevity of savings but thus far were consistent with underbidding. The savings were directly attributable to CCT.
Methodology: Data were sourced from public accounting data 1984-88. The statistical models of service costs used panel data, tracking the temporal effects over the entire period. That is, they applied these data to examine multiple observations (contracts tendered) across multiple years, rather than the approach elsewhere (e.g. Domberger et al 1986, see above) of examining multiple observations at the same point in time.
Sources of benefits: Cost per employee was not significantly different in authorities to have tendered but the number of employees was significantly lower. While it appears that pay-reductions were therefore not a direct source of savings, it was possible that the productivity increase was partly accounted for by staff working longer hours for the same total wage. A further concern was that whilst “the savings from contracting initially appear to rise, we found evidence that the trend is reversed four years after the award of the initial contract”. They attributed this to the impending end of a contract life, and posited underbidding as a potential source.
Competitive Edge: The Evidence
104
4.23 David Chaundy and Matthew Uttley, ‘The Economics of Compulsory Competitive Tendering: Issues, Evidence and the Case of Municipal Refuse Collection’, 1993231
Description: This article introduced new survey data to critically assess the economic performance of CCT. The data were drawn from a 1992 survey of all 403 local authorities in England and Wales, but only 37 completed questionnaires were returned to the authors; this poor response rate (9.2%) necessarily limited any findings. In addition, by no means all responses included suitable answers for all questions. The five questions addressed were: (i) had competitive tendering resulted in cost savings?; (ii) had tendering and monitoring costs detracted from cost savings?; (iii) did public and private owned firms produce markedly different results?; (iv) had service quality fallen following tendering?: (v) what were the sources of any cost-savings?
Findings: Competitive tendering had resulted in average savings of 22% in the switch from municipal provision to CCT. Tendering costs were 3.6% (giving an 18.4% net saving in nominal terms) for the seven authorities to return all relevant data. The public-private distinction appeared not to matter: competition rather than ownership was the primary variable affecting performance for the ten replies with relevant data to test for ownership effects. Superficially, service quality had improved but the self-reporting data collection, negligible consistency in measurement and benchmarking, and limited sample precluded in-depth use of these figures. Greater productivity of labour and capital appeared to be the source of cost savings, but the authors conceded that more precise and in-depth information was required for these findings to be considered robust.
Methodology: Based on new data, 37 responses to a 1992 survey of all 403 local authorities in England and Wales. Question (i) was a straightforward before-and-after comparison for those 14 authorities to return cost comparable data; (ii) was a before-and-after comparison of administration costs as a % of tender and of previous costs; (iii) was based on so-called ‘Competition Effect’ (=the difference between public authority bids before and after tender) and ‘Ownership Effect’ (=difference between public authority bid and lowest private sector tender) for the ten authorities to return appropriate data. The two were then compared; (iv) was answered via survey: councils were asked to estimate whether service quality had improved, deteriorated or remained the same following CCT. Thirty-six responded; (v) the manpower/vehicles ratio fell on a before-and-after measure, suggesting increased productivity of labour and equipment but only 17 responses were valid for inclusion and this method evidently crude.
Sources of benefits: As per question (v), increased capital-intensity in mix between capital and labour. Competition rather than ownership was the primary variable affecting performance. There was no sustained evidence of diminished service quality – responses were for fixed levels of service - but reduced terms and conditions and some job losses were recorded.
Critical analysis: Though not untypical of such surveys around this time, the response rate (9.2%) was very low for data to be considered a representative sample. Where there was no evidence of uncompetitive practice, this might simply have been attributable to anti-competitive authorities not returning their forms. Key finding was therefore perhaps that administrative costs do not outweigh savings from competition.
4.24 Stefan Szymanski, ‘Competitive Tendering and Refuse Collection – The 20% Solution’, 1994232
Description: This article analysed changes in the cost of refuse collection for 280 out of 365 English authorities between 1988 and 1992 using data supplied by Department of Environment.
Findings: Local authority expenditure on refuse collection fell by 18-19% over the four-year period. These savings were specifically identified with CCT. Cost reductions were significantly greater for authorities awarding to a private firm than in-house. Tendering process was biased towards in-house bidder. Largest savings arose in largest authorities, suggesting economies of scale.
Methodology: Comparison of average net expenditure (total expenditure minus total income) at 1992-adjusted prices for all authorities to have complete a five-year profile of net expenditure. Cost-savings of 18.8% on average were measured. To demonstrate that these were attributable to CCT and not technology or budget cuts, expenditure was also measured for the three-year period spanning the signing of contracts and savings of 18.4% were returned. Respective savings under in-house and outsourced provision were then compared.

Competitive Edge: The Evidence
105
Despite greater savings under private production, 70% of tenders were awarded to DSOs. Anecdotal evidence was used to theorise that this was due to inherent bias in tendering process.
Sources of benefits: CCT was the driver of financial benefits, but little empirical investigation of underlying factors. The study only measures expenditure on services, and not their underlying causes. See other papers by the author (Szymanski (1996) and Bello and Szymanski (1996), see below) for this sector for further examination of these issues.
4.25 Stefan Szymanski, ‘The Impact of Compulsory Competitive Tendering on Refuse Collection Services’, 1996233
Description: This article examined a 1984-94 data set for 365 English authorities to ascertain the size and distribution of cost savings attributable to CCT, and the nature of the interaction between competitive pressures and mode of production (i.e. public or private ownership).
Findings: Total cost reductions of around 19.5% resulted following CCT’s implementation. Evidence on the quality of service post-tendering is more limited but there is no proof of deterioration. After tendering, private firms achieved significantly greater cost savings than in-house winners. Savings also diminished quicker over time with in-house winners. Proportions of contracts awarded in-house remained high, suggesting either (i) innate political bias to public sector and/or (ii) cherry-picking of best contracts by private sector.
Methodology: First, average changes in refuse collection costs before and after CCT are summarised. There then follows a more detailed examination using statistical analysis to hold variables influencing costs constant and thus measure the impact of introducing CCT.
Sources of benefits: No evidence to support claims of diminished service quality was found though this evidence was limited. The author reported insufficient data to examine impact on worker wages and conditions. Savings were therefore attributed to private production and competition without identification of sources.
4.26 Hakeem Bello and Stefan Szymanski, ‘Compulsory Competitive Tendering for Public Services in the UK: The Case of Refuse Collection’, 1996234
Description: A series of articles in this sector addressed the public accounts data on the impact of CCT on refuse collection (see above). This article supplemented that 1984-88 data with a survey of all refuse collection client managers in England to establish a set of comparable data for the post-CCT era. It investigated changes in costs and service characteristics either side off CCT using statistical analysis.
Findings: Service costs fell by an average of 22% between the last full year prior to tender and the first full year after tender. Where tender was awarded in-house, CCT resulted in a significantly lower cost reduction – DSO contracts proved on average 10% more expensive than private firms. While costs had changed, the basic characteristics of the service in the majority of areas had not.
Methodology: For the pre-CCT calculation, CIPFA data for 365 local authorities was collected and statistical analysis were used to estimate the effects of authority and service characteristics on net expenditure. For the post-CCT calculation, data from Bello’s bespoke 1994 survey were used to estimate the effects of authority and service characteristics on net expenditure. The two were then compared.
Sources of benefits: There was no evidence that CCT had prompted a change in the specification of services, or that lower costs had resulted from any specific change to services. However, the authors themselves explicitly avoided speculation on the possible source of savings.
Critical analysis: The authors did it themselves in the final paragraph. It could be true that the public/private differences were due to market ‘cherry picking’; equally it could be attributed to public sector bias in the bidding process. They concluded: “The fact is that there is little more than anecdotal evidence available on any of these assertions, and a more systematic study of private and public sector behaviour in services covered by CCT is called for to explain the striking variations which this paper has presented.”235

Competitive Edge: The Evidence
106
4.27 Andrés Gómez-Lobo and Stefan Szymanski, ‘A Law of Large Numbers: Bidding and Compulsory Competitive Tendering for Refuse Collection Contracts’, 2001236
Description: This article used statistical analysis to observe the “natural experiment” created by the ongoing implementation of CCT between 1989 and 1993, examining the net expenditure on refuse collection in the first year after the contract had been tendered for a sample of 174 English local authorities.
Findings: A higher number of bids was associated with a lower cost of service. In addition to confirming this standard proposition in auction theory, the authors claimed important policy implications. Specifically, they argued that the abolition of CCT had been a mistake since it would increase local authorities’ expenditure on refuse collection.
Methodology: The authors identified a series of variables which might explain net expenditure on refuse collection in the first year after the contract had been tendered. They held all such variables - including real wage rate, ruling political party, the number of domestic and non-domestic units in the region, and the size of the local authority – constant to isolate and estimate the significance of the number of bidders.
Sources of benefits: The greater the level of competition, the lower the winning bid – this was entirely intuitive and empirical evidence of a standard proposition in auction theory. However, there was no investigation of service quality or the sources of benefits and these would have to be counter-balanced before the authors’ policy implications could be accepted.

Competitive Edge: The Evidence
107
D. REPUBLIC OF IRELAND
4.28 Eoin Reeves and Michael Barrow, ‘The Impact of Contracting Out on the Costs of Refuse Collection Services: The Case of Ireland’, 2000237
Description: This article examined the impact of contracting out refuse collection services in Ireland. It was informed by a survey covering the years 1993-95 for all 88 authorities. The authors then applied these data to before-and-after and statistical comparisons to estimate the cost effects of periodic competition.
Findings: Before-and-after cost comparators showed savings of between 34 and 45% as a result of contracting out. Comparative statistical analysis controlling for service characteristics indicated savings of 45%. These were mostly attributed to contracting out. Overall efficiency gains were considered more likely where there was strong and rigorous tendering process with consideration beyond lowest price.
Methodology: Data were collected by questionnaire of all 88 local authorities covering the years 1993-5; by keeping the survey brief and following up enquiries with phone calls, the authors were able to claim a 100% response rate. Additionally, contracting authorities that agreed to be interviewed supplied cost of service data for the years directly before and after putting the service out to tender and detail on how production of the service changed. Once all results were in, the 24% of authorities to have fully privatised services were excluded: the focus was entirely on those districts where authorities had contracted out. Three calculations were then made: before-and-after comparators in those seven districts that agreed to be interviewed on those relevant data; average unit cost comparison between those authorities that in 1995 were contracting out and those persisting with public provision; comparative statistical analysis controlling for host of service characteristics to estimate the significance statistically of contracting out.
Source of benefits: Survey data did not permit public-private comparison but structured interviews with contracting authorities suggest flexible work practices. In some cases these gains were offset by the reduced labour conditions. The authors make an important wider point on the importance of managing the tendering process appropriately: rigourous evaluation of tenders, strong competition, and procurement criteria beyond lowest-price were all considered essential to realising benefits.

Competitive Edge: The Evidence
108
E. THE NETHERLANDS
4.29 E. Dijkgraaf and R.H.J.M. Gradus, ‘Cost-Savings of Contracting Out Refuse Collection’, 2003238
Description: This statistical analysis of 85 municipalities in the Netherlands in 1996 explicitly followed on from a number earlier studies, seeking to supply a Netherlands analysis to complement work performed in other geographical regions.
Findings: The authors confirmed findings elsewhere that contracting-out yields cost-savings of 15-20%, noting that competition was more important than ownership: municipal services faced with competition could also provide a low-cost service. They also moved beyond that previous body of literature in two important ways. First, they identified an important methodological issue concerning the viability of pooling data from service providers with different production technologies: where public and private producers used different production technologies, comparison of public and private production was no longer apples-and-apples. Secondly, they highlighted a competitive neutrality issue: private refuse firms had to pay VAT while public bodies were exempted. Reform of the Dutch fiscal system was therefore necessary for efficiency gains to be maximised.
Methodology: Statistical comparison of 85 municipalities, 44 of which produced the service in-house, in one time period (1996). They estimated the cost of production with standard explanatory variables - number of pick-up points, number of inhabitants per pick-up point, geographical proximity of pick-up points, frequency of collection, and the % of recyclable materials collected – and held these constant to estimate the influence of contracting-out.
Sources of benefits: Competition was more important than ownership - municipal services faced with competition could also provide a low-cost service – but how competition differed from monopoly was not explored. The treatment identified those variables which have significant explanatory power – frequency of collection, inhabitants per pick-up point, and % of recyclables – as well as the significance of mode of production and contestability. However the authors did not discuss the interplay of dummy and explanatory variables to explore, for example, how services awarded under contestability differ from in-house monopoly in matters of service quality and production efficiency to explain the source of cost savings.
Competitive Edge: The Evidence
109
F. SPAIN
4.30 Núria Bosch, Francisco Pedraja and Javier Suárez-Pandiello, ‘Measuring the Efficiency of Spanish Municipal Refuse Collection Services’, 2000239
Description: This article provided an analysis of the technical efficiency of the refuse collection services in 75 Catalonian municipalities in 1994, including some consideration of private production.
Findings: Results differed according to measurement technique, though they were nevertheless consistent in ranking the units under examination. The database was limited so findings were not generalised into cost savings. No substantial evidence of differing efficiencies between public and private production was demonstrated; the framework for competition in which the service is provided appeared more influential than the public-private dichotomy.
Methodology: Data was collected using a questionnaire sent to all municipalities with a population over 5,000. It requested details on features of productive efficiency: the number of containers and their geographical distribution; the number of workers; the number of vehicles and their capacity; and the number of hours worked. These factors were then applied to statistical analysis to isolate and estimate the respective efficiency of different authorities under different market conditions.
Sources of benefits: This paper addressed questions of economic modelling rather than public policy so provided few policy insights beyond the significance of competition framework. There was no detailed investigation of the benefits themselves, much less the sources.
4.31 Germà Bel and Antón Costas, ‘Do Public Sector Reforms Get Rusty? Local Privatisation in Spain’, 2006240
Description: This article explored the apparent problem of privatisation’s diminishing benefits (i.e. post-tender, original savings levels often prove unsustainable) by studying the relationship between the cost and mode of production for refuse collection in 186 Catalonian comarca (county-level service districts) in the year 2000.
Findings: Mode of production (public or private sector provision) was not significant in determining cost of production. They put forward two hypotheses in explanation: (i) that over time competition drove public managers’ costs down to the same level as their private-sector counterparts; and (ii) progressive market concentration and decreased competition outweighed initial gains from privatisation, and thus it was essential that governments strive to maintain healthily competitive market conditions.
Methodology: The authors began with a meticulous literature review to identify those variables which influence the cost of refuse collection. These included wage levels, frequency of collection, population density, and distance to transport waste to landfill. These observations were used to apply statistical analysis to their survey data (taken from Catalan government sources) to explore the phenomenon of diminishing savings following competitive tender.

Competitive Edge: The Evidence
110
G. SWEDEN
4.32 Henry Ohlsson, ‘Ownership and Production Costs: Choosing between Public Production and Cotracting Out in the Case of Swedish Refuse Collection’, 2003241
Description: This study used statistical analysis to compare the cost of refuse collection provision under public and private organisations in Sweden. The data came from a 1989 survey of 115 (out of a total 284) municipalities in Sweden by the Swedish competition authority.
Findings: Public production costs were 6% lower than private production costs. Public managers had responded to competitive pressures in adopting commercial criteria and thus remained competitive against the private sector. However, cost differences did not always reflect producer choice: public policymakers did not always select the least-cost alternative.
Methodology: This paper proposed a different methodological approach to others that seek to differentiate between the cost difference of public and private firms. This was necessary due to concern over the comparability of public and private sector data: if different sectors used different technologies of production or the bidding process under periodic competition was not neutral then these are not apples and apples and statistical analysis will be biased.
Sources of benefits: Insofar as these were relevant to the study, the findings on cost savings were consistent with the theory that the presence or threat of competition compels public-sector managers to adopt private sector techniques. Perhaps more importantly, if benefits in refuse collection are to be maximised then it is policymakers rather than managers who must minimise costs.
Competitive Edge: The Evidence
111
H. SWITZERLAND
4.33 Werner W. Pommerehne and Bruno S. Frey, ‘Public versus Private Production Efficiency in Switzerland: A Theoretical and Empirical Comparison’, 1977242
Description: A comparison of residential refuse collection costs under public and private production in 103 Swiss cities – 55 with a municipal and 48 with a private production in 1970.
Findings: Private production was significantly more efficient than public production, although not necessarily where imperfect market conditions exist. Economies of scale and density also made monopoly preferable when the municipality reached a certain size. The role of government did not end with the decision to harness private productive efficiency through competition: public bodies must monitor and moderate competition to ensure that contract design is adequate to yield the theoretical benefits on offer. The public/private distinction was found to be significant in all cases, but no magnitude of savings was generalised.
Methodology: Statistical analysis determined the costs of production under public and private regimes having held the quality of service and technical conditions of production constant. The two were then measured to assess comparative efficiency.
Sources of benefits: These were not examined. The early part of the paper outlined the economic theoretical basis for expecting greater private sector efficiency – property rights and inefficient organisation size - and results were taken as confirmation of this. As such it was not altogether clear whether any proportion of public firms had acquired contracts through competition and the focus was very much public/private rather than contested/uncontested.

Competitive Edge: The Evidence
112
5. Municipal ServicesThe literature summarised in this section looks at core local services such as street cleaning, recreation services and road, grounds and building maintenance. This is not to overlook other important responsibilities that local governments assume, such as emergency services, education and public utilities, but this often vary from country to country depending on their constitutional arrangements. It should be noted, however that some of the broader studies included here encompass corporate support services or ‘back-office’ functions, such as payroll and human resources.
In the English speaking world, evidence from the US has, in the main focused on the systemic effects of contracting through cross-sectional studies of American cities. This was made possible through large-scale surveys of service delivery arrangements conducted by the International County/City Management Association every five years beginning in 1982 based on questionnaires returned by municipalities. However, because of their size and generality, these studies were unable to account for quality.
The UK studies examined the impact of the government’s compulsory competitive tendering policy in the late 1980’s to mid 1990’s by comparing service costs before and after its implementation. With the exception of refuse collection (discussed in the previous chapter), the main studies in this field were commissioned by the Department of the Environment and used less sophisticated statistical techniques than the US studies. They did however, survey a wide range of local officials on a number of themes, including quality and workforce issues which helped to create an overall picture of how local services were affected.
Evidence from Australia is scarcer and more mixed both in its methodology and its results. Recent research from Denmark on road maintenance and school cleaning has provided useful insights into the efficiencies that the private sector can bring when allowed to compete with public delivery.
A. USA
5.1 Robert T. Deacon, ‘The Expenditure Effects of Alternative Public Supply Institutions’, 1979243
Description: Deacon used statistical analysis to compare data from 1970 on the expenditures of 64 cities in Los Angeles County. The study looked at all city services, and street maintenance and policing in particular. Forty-one cities provided almost all of their services through conventional in-house means whilst 23 were required to purchase the majority of services from other local governments (notably Los Angeles County) or private providers.
Findings: On average, purchaser cities spent significantly less on services than provider cities. For police services and street maintenance they spent 58% and 70% (respectively) of what provider cities spent, whilst for overall they spent 86% of what provider cities spent.
Methodology: The study was based on data from the US Census Bureau in 1970, and California state sources on municipal expenditures. Local population characteristics such as size, density, tax share, income, level of retail sales and social background (which might affect the demand for and cost of services) were taken into account.

Competitive Edge: The Evidence
113
Sources of benefits: In street maintenance, the potential for competition between suppliers had contributed to lower costs. In police services, Deacon pointed to the use of fewer officers and sharing of expensive forensic laboratories. Deacon also suggested that purchasing cities exhibited a lower demand for services than other equivalent conventional cities.
Critical analysis: There was no control for quality of service in this study. It has been suggested that the lower costs for police services were to some extent due to subsidies by the LA County police department which undercharged so as to maintain a wider reach for its services. 244
5.2 Barbara Stevens (ed.), ‘Delivering Municipal Services Efficiently: A Comparison of Municipal and Private Service Delivery’, 1984245
Description: A study commissioned by the U.S. Department of Housing and Urban Development using statistical analysis of data collected in 1983, which compared the relative efficiency of eight services (refuse collection, asphalt overlay, street cleaning, traffic signal maintenance, street tree maintenance, turf maintenance, janitorial, payroll) in 20 cities. Half of the cities used private for-profit contractors whilst the other half used municipal employees. It also examined management initiatives associated with more efficient service delivery.
Findings: Municipal delivery was found to be significantly more expensive in all cases with the exception of payroll preparation. Cities delivering services via public means paid on average 54% more when they delivered those services with municipal employees. This ranged from 37% more expensive for street tree maintenance to 96% for asphalt overlay.
Methodology: From a sample of 121 cities in the Los Angeles Standard Consolidated Statistical Area, 10 cities were chosen which delivered the eight services through in-house means and 10 which delivered these services via private for-profit firms. By limiting observations to a smaller geographic area the authors felt climate, local labour markets and state regulations on public service delivery could be kept constant. Cities from the contract sample were randomly selected and matched with cities randomly selected from the municipal sample based on similar populations and median household incomes.
Cost data were then collected by trained field personnel directly from city records. This included salaries, fringe benefits, operating expenses for equipment, utilities, and offices, general government overheads and depreciation of equipment. For contract cities, costs included contract letting, monitoring and payments. Information was also gathered on technology and management practices.
The data were statistically controlled for the scale, level and the quality of the service output. Quality was generally checked through direct observation by field personnel and recorded in a number of different forms. For example, street cleaning was rated using a four-point scale (1-clean, 4-dirty) based on observation of four curb faces from 25 randomly selected blocks. All asphalt overlay projects during the year for which costs were obtained were ranked for cracking and distortion on a scale from 0-100 (100 being defect free)
A further analysis was also carried out to compare the differences between those cities with unit costs below the median with those above it, regardless of the mode of delivery, so as to better understand the sources of efficiency.
Sources of benefits: Labour management was identified as the main source of savings. Compared to municipal employers, contractors on average provided a slightly more generous salary (though the difference was not significant), and equivalent fringe benefits, although this varied from service to service. Average monthly wages for asphalt overlay were higher in contract cities whilst for janitorial services they were less. Contractors suffered less absenteeism but offered on average one week less holiday a year. They used the least qualified personnel necessary to do a job and used part-time staff where appropriate, put line-managers in charge of equipment, and gave them responsibility over hiring and firing, and made production processes less labour intensive. Contractor workforces were leaner, younger, with a higher staff turnover. On average, they worked 11 more days a year than municipal employees, and this alone accounted for 5% of the cost difference.
Fewer factors were found to be significant in increasing service efficiency, when the delivery method was controlled. Absenteeism, number of holidays, making the service deliverer responsible for equipment maintenance, use of
Competitive Edge: The Evidence
114
informal reprimands, and the use of younger, non-unionised workforces were all found to have contributed strongly to lower costs whereas wage rates, degree of capital intensity, worker to supervisor ratios and authority of line managers did not.
In general, technology did not account for a great deal of difference in the cost of service delivery. For payroll management, street maintenance, turf maintenance and janitorial services there were insignificant differences in the use of technology. In refuse collection, the use of front and side loading vehicles and trucks of the same brand by contractors were considered important factors, as was less vehicle downtime. These made collection simpler and safer, and maintenance more efficient. Contract cities used wider, heavier pavers to reduce asphalt overlay times, greater uniformity in vehicles used for street cleaning and more computerised up-to-date traffic signalling systems.
5.3 James M. Ferris, ‘The Public Spending and Employment Effects of Local Service Contracting’, 1988246
Description: This study examined the effects of service contracting on total city expenditures and employment from a sample of 500 cities with populations of more than 25,000. It was based on data from a national survey conducted in 1982.
Findings: The extent of contracting had a negative and statistically significant effect on the level of public spending – for a 1% increase in the percentage of services contracted, spending decreased by 0.06-0.1%. Public employment declined at a faster rate than expenditure of 0.12% for every 1% contracted. Ferris suggested, however, that greater savings could be made where a service took up a larger portion of the municipal budget.
Methodology: The study was based on data from the International City Management Association (ICMA) survey 1982 which held details on the degree of contracting for 64 local services and from various other official sources from 1981-83 on local expenditure and local population characteristics. Ferris focused on 44 of those services, excluding intermediate services such as payroll, legal services and billing. He measured the proportion of service responsibilities contracted out. If a service was only partially contracted, this was given a weight of a 0.5 in estimating the proportion of services contracted out.
The study also controlled for a number of variables that could affect consumers’ preference for service level such as income, number of households and tax share. There was also adjustment for a range of other variables including: municipal salaries, form of government, population density, proportion of the services that the city offered, geographical factors, home ownership, the amount of state and federal grants received and racial mix. When looking at public employment and public wages additional variables for private salary pay and degree of unionisation were used.
The analysis proceeded in two stages. Firstly, the analysis looked at the impact of contracting on the general expenditure (‘current operating budgets for general purpose activities’) and on the total expenditure (‘includes capital expenditures and off-budget or special activities’). Secondly it looked at the impact on public employment.
Critical Analysis: Although contracting was significantly associated with lower expenditure, the association was found to be fairly modest in size. In 1990, using the same dataset but a larger sample, Stein found an even weaker association. However in 1994, Miranda reanalysed the same dataset, but using a sample similar in size to that of Ferris, and found a much stronger relationship.
The main difference between the studies was in the way they measured the proportion of contracting which could therefore have affected their finding. Ferris looked at 44 municipal services whilst Stein and Miranda both looked at 64. Ferris, weighted any partially contracted services (i.e. those services which were delivered via contract and public employees) as 0.5 when determining the proportion of services contracted whereas Stein used two variables to measure ‘complete’ and ‘joint’ contracting, whilst Miranda neither weighted nor distinguished for partial/joint contracted. However, Ferris did test whether the 0.5 weighting system affected the results and reported that there were no appreciable differences in magnitude using different systems. In addition, Ferris only measured expenditure and not expenditure per capita as Stein did (Miranda did not make this point clear) and Ferris controlled for the number of households, whereas the other two controlled for city population.
Competitive Edge: The Evidence
115
As with studies of a similar size, service quality is not measured. In addition, there was no indication of the extent of competition for contracts or whether competition had led to in-house improvements.
5.4 Janet R. Pack, ‘Privatization and Cost Reduction’, 1989247
Description: The author reported results from 15 case studies conducted by the ICMA in 1983, which described specific purchase of service arrangements in 15 municipalities around the United States. All except three used competitive bidding. The author then carried out follow-up interviews on the progress of the contracts four years later, although of the 15 cases only nine provided financial information relating to savings for both years. These covered custodial services, fleet management and vehicle maintenance, street sweeping, emergency services, recreation, building inspection, landscape maintenance, refuse collection and data processing.
Findings: (i) All nine contracts for which there was financial information reported savings in 1983. The greatest savings (20-50%) were made in services that were relatively common and labour intensive (custodial, fire and landscaping) and where there were a greater number of bids. Larger municipalities attracted more bids although this correlation seemed to cease for populations above 100,000. Smaller savings (4-15%) were reported for more complex processes or outputs (residential solid waste collection, fleet management, vehicle maintenance).
(ii) There was less evidence for the persistence of savings over time after the follow-up interviews were completed. Out of the nine cases that provided relevant data, five showed savings, though all were reduced from the 1983 levels. Those contracts that had claimed the largest savings in 1983 were those where savings were most persistent. Three contracts showed savings of between 17% and 22% whilst the other two could not provide definite figures. Two other contracts were reported to be about the same price as the in-house equivalent. In two further cases, production had been switched to an in-house team (in one case for data processing, due to dissatisfaction with the external provider, and in the other for refuse collection following a re-competition which the in-house team won). More bids had been received for the services where competition persisted for services and the services in question were mostly labour intensive.
(iii) Seven out of 14 cases experienced disruptions due to output shortfalls or cost overruns. In about half of these, higher than anticipated costs led to renegotiation or reneging whilst in the other half poor quality led to termination. There was no observed association between disruption and the complexity of the production process. Outputs were rarely specified in disrupted services whereas out of those services that did not suffer disruption all bar one had detailed outputs specified. Underbidding was briefly investigated as a source of disruption by looking at the correlation between the level of savings claimed initially and poor performance. Some of the disruptions occurred in those contracts that had claimed the highest savings, although savings were found to continue, as mentioned above, although they declined. On the other hand, services that had claimed low savings initially also suffered disruptions. There were also three cases where public production was resumed but only in one case was this because of unsatisfactory service delivery.
Methodology: The author used results from 15 case studies of contracting arrangements for specific services in 15 different counties and cities around the US, with populations ranging from 10,000 – 800,000, based on data collected by the ICMA in 1983 and published in 1984. She then conducted follow-up interviews with local officials from the same cities in 1987 to obtain financial information on the progress of the contracts. As the sample size was small, it was not claimed that any of the results could be extrapolated, but the author argued that it was useful nonetheless to better understand the contracting process. No formal statistical analysis was undertaken, and correlations were simply observed from the collected data.
Only nine of the case studies provided any financial information for both 1983 and 1987. However this was not always consistently recorded. Some contracts reported dollar amounts, some merely confirmed or denied there were any savings and some used a mixture of both.
The author also looked at information supplied by 14 of the 15 municipalities relating to contract disruptions. She looked at the type of monitoring arrangements used and the cost as a percentage of the total contract costs. In addition, the type of contract specifications used were recorded, depending on whether they related to processes, inputs or outputs.

Competitive Edge: The Evidence
116
Sources of benefits: The main reported source of cost differences between public and private production was labour costs. In about half the cases, in both years, this was due to lower wages and fringe benefits paid by the contractor and in the other half due to the use of a smaller workforce.
The correct specification of outputs and the promotion of interaction between the contractor and the public agency were important for avoiding disruptions. Simple monitoring had the potential to be significantly more costly, taken as a percentage of the contract price, compared with more interactive monitoring, which involved both parties. Those municipalities that encouraged a partnership-based approach and relied more on open dialogue between the contracting parties (perhaps through stipulating the need to attend meetings and fostering closer management ties), suffered less from contract disruption.
Critical analysis: It was not clear how the savings were calculated both in 1984 and 1987 and whether they represented actual or predicted savings. The author also made an unsatisfactory distinction between ‘simple’ labour intensive services, such as custodial services and landscape maintenance, and ‘complex’ capital-intensive services such as residential waste collection, fleet management, and data processing. In the case of refuse collection, this seems to fly in the face of other research suggesting that it is relatively easy to specify outputs in this service. On the other hand, custodial services are generally thought of as relatively complex and more difficult to manage under contract.
5.5 Robert M. Stein, ‘The Budgetary Effects of Municipal Service Contracting: A Principal-Agent Explanation’, 1990248
Description: This study examined the effect of contracting on public spending, employment and wages both at the agency (service) and aggregate (total municipal) level. It employed statistical analysis of data from 1982, which covered 1,433 cities with populations of above 10,000, and 64 services grouped into 17 functional areas (designated as agencies).
Stein also distinguished between ‘complete contracting’, where a government outsourced the entirety of a service to external providers (private firms, non-profits or other governments), and ‘joint contracting’, where the government contracted part of the service and delivered the rest in-house.
Findings: Stein found that cities seemed to make savings at the aggregate level, but not at the agency level.
(i) Agency level effects
a. Expenditure: Neither complete nor joint contracting was strongly associated with higher or lower per capita municipal spending at the agency level except for a handful of services. Of those, complete service contracting was associated with higher spending in highways and electricity, but for parks, general government (e.g. payroll, human resources, property/legal services) and cultural services it was strongly associated with lower spending. Joint contracting only had a strong association with lower spending for one service (airports).
b. Employment: Contracting was consistently associated with lower public employment for 12 completely contracted services and 10 jointly contracted services. Of these results, five showed significant associations for complete contracting (highways, sanitation, sewerage, police and parks) and six were significant for joint contracting (sewerage, hospitals, airport, transit, water, parks).
c. Wages: Lower public agency pay was only significantly related to complete contracting for one service (health) whilst joint contracting was associated with significantly higher wages in four services (highways, parks, water and general government).
(ii) Aggregate level effects
a. Expenditure: Complete service contracting was significantly related to lower spending at municipality level, although joint service contracting was not.
b. Employment: Both types of contracting were also strongly related to lower public employment at this level.

Competitive Edge: The Evidence
117
c. Wages: Both types of contracting were associated with higher pay, although only joint contracting was found to have a significant association.
(iii) Effect of sector choice
a. Complete contracting with for-profit firms was associated with significant reductions in spending and employment but insignificant increases in wages. Non-profits and other governments were weakly linked to lower spending, although, complete contracting with other governments was strongly linked with lower employment and higher wages whereas non-profits exhibited similar but less significant results.
b. Joint contracting with for-profits was weakly related to lower spending but significantly related to higher wages without a significant diminution in the size of the labour force. However, joint contracting with other governments significantly reduced spending, employment and wages whereas non-profits produced no significant effects.
Methodology: Stein used data from the ICMA’s 1982 survey on alternative service delivery methods and official data sources on local expenditures and other population characteristics. He employed a three-stage analysis. Firstly, he looked at the effects of complete and joint contracting at the agency level, secondly, at the aggregate level and finally he looked at the effects of sector choice by contracting with public, non-profit and private sectors. At each stage the study also controlled for a number of geographic, socio-economic and political/institutional factors similar to those used by Ferris in 1988.
Stein used different methods to measure the extent of contracting at the agency and aggregate levels. At the agency level he only noted if one or more services were contracted and did not measure the proportion of services contracted. However, at the aggregate level he measured the proportion of services offered by the city that were contracted.
Sources of benefits: Stein suggested that the reason for the differences at aggregate and agency levels may have been that municipal chiefs allowed agency officials to retain savings within their agency as a reward and an incentive to make further savings. Thus savings would subsequently emerge as total municipal savings as agency officials curbed their annual budget requests over time.
Stein also claimed that the difference between the effects of complete and joint contracting was not attributable to lower wages paid by private contractors, but to the fact that joint contracting could not take advantage of the flexibility of a fully contracted labour force whilst still having to employ higher waged monitoring staff.
Critical analysis: Stein argued that the distinction between joint and complete contracting may have led to a reduction in the magnitude of the findings and that the definition of contracting at the agency level based on whether one or more services are contracted may have diluted their significance. These criticisms were taken up later, firstly in Miranda (1994), where the author suggested that contracting had a much greater effect on reducing expenditures, and then in Miranda & Lerner (1995), where joint contracting was found to perform more cost effectively than complete contracting.

Competitive Edge: The Evidence
118
5.6 Dolores T. Martin and Robert M. Stein, ‘An Empirical Analysis of Contracting Out Local Government Services’, 1992249
Description: A study of the effects of contracting on public spending and employment at the agency and aggregate level using statistical analysis of data from1982 on 877 cities. The study covered 34 services, collected under seven functional categories (health and welfare, public safety, public works, transportation, general government, parks and recreation, education and culture)
Findings: In general, contracting had an insignificant effect on spending at the agency level whilst tending to reduce employment, whereas expenditure reductions were found at the aggregate level, in the early stages at least.
(i) Expenditure
a. Agency level: Contracting was neither significantly nor consistently associated with lower spending except for public works. Contracting in parks and recreation services was found to be significantly associated with higher spending, although this was partly explained by the greater capital investment for the acquisition of land in contracting municipalities.
b. Aggregate level: The use of any contracting was consistent with lower total municipal expenditures, but the association ceased to be significant once more than 25% of service responsibilities were contracted. Fiscal pressure in the form of high tax burdens increased the effect of contracting on spending although the significance of the effect waned once above the 25% contracting level.
(ii) Public employment
a. Agency level: In six out of seven functional service areas, employment was found to be significantly lower where any contracting was used. The exception was health and welfare, where it was felt contracting was probably not used purely for cost saving purposes but to improve quality. Health and welfare services also involve the use of interpersonal services whose value can be hard to measure.
b. Aggregate level: Only when more than 25% of services were contracted was employment significantly lower. There was no significant association between contracting and employment below this level. However, the addition of fiscal pressure to the use of contracting produced a significant reduction both below and above this level of contracting, although the reduction in employment was now greater below the 25% level rather than above it.
Methodology: A sample of 877 cities with populations of more than 10,000 was obtained from a 1982 ICMA survey. The study used similar variables to Ferris (1988) and Stein (1990) to control for various geographical, socio-economic and political/institutional factors and analysed spending at the agency (service) and aggregate (total) levels. At the agency level Martin & Stein merely differentiated between those cities which contracted for one or more services and those which did not but at the aggregate level he also examined those cities that contracted for 25% or more of their services. In addition, they tested whether contracting had a greater effect in fiscally stressed municipalities by measuring the interaction between average tax burden and the level of contracting.
Sources of benefits: The authors suggested that city chiefs allowed agencies to retain savings from contracting so as to avoid raising taxes. The existence of high rates of taxation provided a further incentive to use contracting as a way of generating cost savings. These conclusions were based on the evidence of savings at the total spending level but not at the agency level and the magnitude of the interaction between contracting and the tax burden.
Critical analysis: Miranda (1994) reanalysed data from the same source and found that using a dichotomous measure of contracting (i.e. dividing the sample into those with no contracts or one or more contracts) could dilute the impact of contracting on municipal spending and lead to less significant findings.

Competitive Edge: The Evidence
119
5.7 Rowan Miranda, ‘Privatization and the Budget Maximizing Bureaucrat’, 1994250
Description: A statistical analysis of data from 1982 and 1984 on the effect of contracting on municipal spending and employment in 528 cities. This study challenged some of the conclusions made by Stein (1990) based on a flaw in his methodology. It sought to show that cost savings from contracting were not retained within local service agencies as Stein had suggested, but that they were identifiable at both agency and municipal levels and persisted over time.
The key element for the author was the presence of centralised budget control which prevented agency chiefs from gaining an informational advantage over their municipal bosses and thus retaining their savings.
Findings: There was strong evidence of both lower public spending and employment when contracting was used.
(i) Expenditure
a. Agency level: In 1982 contracting had a statistically significant impact on lower spending in eight out of 14 agencies, in 1984, this was in nine out of 14.
b. Aggregate level: A 10% increase in contracting led approximately to a 4% decrease in total expenditures for 1982 and 1984.
(ii) Employment
a. Agency level: Contracting was significantly associated with lower employment in nine of 14 agencies.
b. Aggregate level: Contracting significantly reduced overall city employment.
Methodology: The author pointed firstly to the distinction Stein (1990) had made between joint service contracting and complete service contracting which failed to isolate the effect of all types of contracting on municipal expenditure. It was believed that this would have diluted the impact of contracting leading to a greater chance of producing insignificant findings. Secondly, Stein’s measure of contracting at the agency level was fairly crude as it only recorded whether one or more services were contracted and not the proportion of services contracted, an approach that he had adopted at the aggregate expenditure level. This second criticism applied equally to Stein & Martin (1992).
Miranda re-examined the data from the same years using the percentage of service responsibilities contracted out as the measure of contracting at both agency and aggregate levels. Data for 1984 expenditures were also used, which Stein (1990) had included. Miranda’s sample of 528 cities with populations of over 25,000 was, however, smaller than Stein’s sample although derived from the same 1982 survey. Miranda’s study only covered 14 functional service areas instead of 17, as utilities were collapsed into one category and airport services were not included.
The study also analysed the effect of centralised budgetary control by comparing the effects of council-manager and mayoral forms of government on agency and total expenditures and employment. Council (or city) managers are professional administrators and thus were expected to have more control than in cities where elected mayors allocated budgets.
Sources of benefits: The study explored institutional differences between cities that used the council-manager form of government and those that used the mayoral system. In 10 out of 14 service areas and at the aggregate budget level, council manager systems were significantly associated with declining expenditure, whereas mayoral systems were associated with lower spending in 4 out of 14 services areas (or agencies) and on the total expenditure they had a positive but insignificant effect. A similar pattern emerged for employment, whereby the council-manager system led to lower employment in 9 agencies but only four for the mayoral system. It was argued that council managers had more direct control over agencies’ budgets, and that they were marked by a greater professionalism and use of monitoring which avoided the extraction of ‘rents’ by contractors and reduced budget maximisation by bureau chiefs, whilst mayoral systems were based more on patronage and decentralisation. However, it was accepted that in reality there may have been a wider variation of types of government than this distinction could capture.
Competitive Edge: The Evidence
120
Critical analysis: The study did not control for quality of service and only examined the effect of contracting on public employment and therefore excluded implications for the contracted workforce.
5.8 Jeffrey, D. Greene, ‘Does Privatization Make a Difference? The Impact of Private Contracting on Municipal Efficiency’, 1994251
Description: Twelve cities were compared over the years 1985 and 1986 for their delivery of police, fire, sanitation, street, parks and recreation, and general government services. Half provided most of these services through public employees (i.e. less than 10% of services were handled by contractors) and the other half used contracting to a much greater extent (i.e. more than 35% were contracted).
Findings: Average expenditure was found to be lower for the contractual group in all services, except for general government services. Parks and recreation represented the largest difference by some way, where full-service cities spent almost 75% more than contracting cities. Costs for street and sanitation services showed modest savings with full-service cities being around 5% and 8% more expensive. On the other hand, general government costs were 27% higher in contracting cities. At the aggregate level, general expenditures for full service cities were 9% higher and their expenditures per capita were almost 16% higher. However, apart from parks and recreation services, none of the other expenditure differences were found to be significant (although this may have been due in part to the small sample size).
When the cities were ranked according to their productivity, no clear pattern was evident. Although the most productive city was found to be contractual, no clear picture emerged, with full-service cities possibly ranked slightly higher overall.
Methodology: The cities were matched for service levels and financial data were collected for 1985 and 1986 to provide a two-year average to protect against single year anomalies. Also, cities were selected on the basis that they provided a comparable quality of service, although this was not statistically controlled. The cities were divided into a ‘full-service’ group, which provided most services through public employees and less than 10% of services through contractors and a contractual group, which provided over 35% of services via contract. Expenditure, employment and payroll costs were then compared both at the service and municipality levels.
A second stage in the analysis involved ranking the cities in order of their relative productivity. This was based on how much actual expenditures per capita deviated from a calculated norm, which was adjusted for workload, labour costs and regional variations.
Sources of benefits: Employment and payroll followed a similar pattern of expenditure with contractual cities demonstrating consistently lower employee to population ratios and lower payroll costs per capita. The exception again was general government where payroll costs were 12.5% higher. The author also suggested that the extra costs of administration and monitoring may have caused the difference in expenditure. Payroll per capita costs were estimated to be 31% higher in full-service cities. Yet again the only difference found to be statistically significant was for parks and recreation payroll costs, which were around 75% higher in full-service cities, mirroring the difference in expenditure.
Critical analysis: The text of this study contained certain inconsistencies in the presentation of some of the data. The author himself has suggested that some errors might have crept into the report during the typesetting of the transcript after it was submitted for publication. He confirmed, however, that this should not have affected the significance of the results. In addition the author acknowledged that due to the small sample size, his findings remain open to interpretation, but the most significant finding from his point of view was that contractual cities spent less, disregarding the results of the statistical significance testing. It is also important to note that payroll and employment data also referred only to public employees, and thus the productivity rankings did not provide a clear basis for comparing public and contractor employees.III
III We are grateful to Prof. Greene, of the University of Montana, for his time and assistance in explaining his results through correspondence with the Serco Institute in September 2007
Competitive Edge: The Evidence
121
5.9 Rowan Miranda, and Allan Lerner, ‘Bureaucracy, Organizational Redundancy and the Privatization of Public Services’, 1995252
Description: This study investigated whether the delivery of municipal services by public and private providers, referred to here as joint contracting or ‘benchmarking’, was cheaper for local governments than using private delivery alone, referred to as complete contracting. It employed statistical analysis of 1982 data from 539 cities on municipal expenditures, employment and wages.
Findings: The percentage of services that were jointly contracted was found to be strongly related to lower expenditure whereas complete contracting of services was found to be weakly related to lower spending. Transferring a service in its entirety to external providers reduced employment, but both types of contracting were associated with higher average wages. This suggested that contracting led to a smaller yet better paid municipal workforce.
Methodology: The study compared the effect of joint and complete service contracting on aggregate (total) expenditure, public employment and average public employee wages of 539 cities. The data were gathered from the 1982 ICMA survey which recorded delivery arrangements for 64 services. All arrangements with private, non-profit and other governmental bodies were treated as private/external for the purposes of the study.
The extent of contracting was measured as the percentage of services out of those offered by a city which were contracted. As with previous studies (Ferris 1988, Stein 1990, Martin & Stein 1992, and Miranda 1994), the authors took into account a standard set of geographical, socio-economic and political/institutional factors.
5.10 Robert Jay Dilger et al, ‘Privatization of Municipal Services in America’s Largest Cities’, 1997253
Description: A study based on a survey conducted in 1995, which reported on the experiences of contracting with the private sector in 66 of America’s largest cities including estimated cost savings, service improvement and monitoring techniques.
Findings: On average, city officials estimated savings of 20.7% in public works, 16.3% in public safety, 17.3% in health and human safety, 16.6% in parks and recreation, and 16.1% in support functions. Service delivery was generally found to have improved by around 25%. Officials were generally satisfied with contracted services, although few were very satisfied. Levels of dissatisfaction were only recorded in seven instances out of 456 contracted services.
Methodology: One hundred questionnaires were sent out to the 100 largest US cities. Out of these, 66 were returned, completed mostly by chief financial officers or city managers. This survey sought to go beyond those conducted by the International City Management Association in 1982, 1988 and 1992 which only covered the extent of contracting out, although in this case the survey was restricted to the largest cities.
Officials were asked to estimate in percentage terms the savings and service improvements made from privatising 47 services which were grouped under five categories of public works/transportation, public safety, health and human services, parks, recreation/culture and support functions. However, the empirical basis for these estimates was not reported and the survey relied solely on the estimates of senior officials.
Cities on average contracted out 6.9 services, ranging from three cities that did not contract out any, to twenty that contracted 10 or more services. Public works was the most frequently contracted out category, and out of this vehicle-towing and solid waste collection were the two most contracted out services.
Sources of benefits: The survey asked officials to compare the total compensation package (salary plus benefits) received by public employees and contractors’ employees. Sixteen cities reported that public employees had a significantly better package, 26 reported a somewhat better package, eight said it was about the same and only two reported the private package was somewhat better, with none rating it significantly better.

Competitive Edge: The Evidence
122
5.11 Robert T. Kleiman, and Anandi T. Sahu, ‘Privatization as a Viable Alternative for Local Governments: The Case Study of a Failed Michigan Town’, 1999254
Description: A case study of the city of Ecorse, Michigan, (pop. 12,000) which went into receivership in 1986. The court-appointed receiver carried out a comprehensive restructuring of city services through privatisation, contracting, competition and renegotiation of employment contracts, which turned around a budget deficit of $6m in 1986 to a surplus of $95,000 in 1990.
The receiver sold the Department of Public Works including its property and equipment to a private firm, with which he then contracted to deliver services for road, water facilities, sewer maintenance, vehicle maintenance, tree trimming, water meter reading, street sidewalk repairs and weed cutting. The contract was subject to renegotiation and/or re-competition.
Findings: There were savings of approximately 40% from the sale and contract for public works and the renegotiation of the refuse collection contract.
Contracting public works produced savings of $1,236,560 between 1989 and 1991, as compared to costs of $2,856,420 incurred between 1986 and 1988. Refuse collection, which had already been contracted out, was re-competed and led to estimated savings of $568,033 from 1988 to 1991 out of the $1,400,000 that would have been paid had there been no new competition. Monthly prices for collection fell from $29,000 to $13,400. Overall annual savings, when other privatisation and asset sales were included, added up to almost $1m which, when adjusted for inflation, amounted to 63% less than previous years’ annual costs. There were also said to be ‘significant’ savings from contracting with a neighbouring city for an animal control officer, but no figure was included.
The authors claimed that quality of service was maintained throughout the receiver’s tenure. They pointed to the initiation of several infrastructure renewal projects as evidence of interest in wider social goals. These projects included $650,000 on street paving and drainage projects, $25,000 on repairing a police garage and new street lighting on the city’s major road and elsewhere. New equipment was procured for fire and police departments and a new centre for senior citizens was opened. The city ambulance service was, however, stopped completely and citizens had to use private services.
Quality of life was also compared with two neighbouring cities on the basis of local fire reports and crime rates over the years covered by the case study. The indices for Ecorse generally rose whilst fires and crime in the other two cities either dropped or remained steady, but the authors claimed that the study could not account for these trends as a result of the restructuring that took place. In addition, contracting of fire and police services had not been permitted.
Methodology: The authors presented figures from city sources that were adjusted for one-off costs such as severance payments and recurring costs and benefits such as health and life insurance and property taxes. However, none of the variables on service quality or quality of life were incorporated into a statistical analysis.
Sources of benefits: The city workforce was reduced by over 60%. Much of this came as a result of outsourcing public works and cuts in police and fire services, which the receiver had unsuccessfully tried to contract to the county government. Instead he offered strong incentives for early retirement and replaced older officers with younger less highly paid recruits. The union which represented most city workers approved the new employment contract and voted to cut its payroll by a third. Unions were also persuaded to drop overtime which was responsible for a large proportion of the city’s overspending. Accumulated leave was cut for all of the city’s workforce and sick notes were required for anyone absent for more than three consecutive days. Savings of more than $0.5m per year were achieved through use of a health maintenance organisation plan.

Competitive Edge: The Evidence
123
5.12 Jack Sterling, ‘Competition Between Public Agencies and Private Vendors: Vehicle Maintenance Services in Greeley’, 1999255
Description: A case study by the Director of Public Works for Greeley, Colorado on the competition for two vehicle maintenance contracts. The city had both a central and transit fleet which were maintained from 1991 to 1993 by a private contractor that was shared with Weld County via an intergovernmental agreement. In late 1993, a competition was begun and proposals were solicited from other contractors and from an in-house team.
Findings
a. Central Fleet: A private contractor was chosen despite the in-house team’s proposal being 3% lower. (However, the in-house savings were based on economies of scale it could only make if it won both contracts and if the $12,500 charge that the private firm would have to pay the county government for using its workshop facilities was taken into account.)
There were a number of reasons why the in-house team was unsuccessful for this contract. Firstly, the proposals were initially based on the prices unadjusted for the county workshop charge. Secondly, due to the previous intergovernmental agreement, it was accepted that the city would choose the same contractor as the county to manage both their central fleets. Thirdly, the Citizens’ Budget Advisory Committee, which reviewed the proposals, had been advised to consider a 10% difference as the trigger for changing the method of service delivery and this was not activated. Finally, the county eventually agreed to pass back their savings from entering into a joint contract with the city, which came to $27,595 and thus made the city a saving of $18,437 over the lowest in-house price.
b. Transit Fleet: The Transit fleet contract was not part of the intergovernmental agreement and the in-house team was chosen with a price $49,000 less than the nearest private bidder. Over the first nine months of the contract they cost 13% less than the private contractor over the same period in the previous year and achieved a 2% surplus on their expected costs.
Methodology: The authors reported relevant figures from city records and provided breakdowns of the bid prices. The in-house team used the avoidable cost method to calculate its transit fleet bid as the city would still have to maintain its own workshop facility and monitor the fleet maintenance operations if a private contractor won. It was not clear whether this was also used for the central fleet contract.
Sources of benefits: The in-house team was more productive than the previous contractor in the transit fleet contract. This was reflected in lower costs per work order and less down time. The city team could not compete fully with other firms for the central contract, as it could not provide services to the county through the intergovernmental agreement. However, it was estimated that had there been no agreement the city could have still saved 1% over the cheapest private sector combination of bids.
Critical analysis: The study compared different ownership structures under a competitive arrangement rather than comparing the effects of competition against those of an uncontested monopoly.
5.13 Mildred Warner and Amir Hefetz, ‘Applying Market Solutions to Public Services: An Assessment of Efficiency, Equity and Voice’, 2002256
Description: A study which compared the effects of private contracting and inter-municipal cooperation on the efficiency, equity and accountability of over 1000 urban governments between 1992 and 1997.
Findings
(i) Efficiency: In both 1992 and 1997 governments that used both public and private market alternatives had lower expenditures although suburbs benefited most from these whilst the results for core areas were not significant in 1992. Higher efficiency, measured via an index, was only found to be strongly associated with private contracting.

Competitive Edge: The Evidence
124
(ii) Equity: Private contracting was used more by higher-income areas whereas poorer areas favoured cooperation, although in 1992 there was also significant use of cooperation amongst the wealthier areas.
(iii) Accountability: In 1992, citizen voice was only significantly related to the use of private markets amongst core governments. However, by 1997 inter-municipal cooperation showed much more responsiveness to citizen voice whilst this had declined in cities contracting privately.
Methodology: Data on alternative service delivery arrangements was obtained from the ICMA surveys for 1992 and 1997. Analysis focused on metropolitan areas and also differentiated between core areas and outlying suburbs. In 1992 there were 306 core areas and 750 suburbs whilst in 1992 there were 303 and 722. Forty-six percent of the municipalities were the same in both years. The samples from both years were found to be generally similar by population, poverty and income.
Efficiency was measured in two ways. First, the attitude of local government managers was tested using an index based on five questions which asked whether they were attempting to decrease costs, if they monitored quality and compliance, whether they trialled market alternatives and if in-house workers were allowed to compete in bidding. The second method was based on total per capita expenditure.
Equity was measured through per capita income and the percentage of poverty. Accountability was tested through a citizen voice index based on a survey about the involvement of citizens in the service delivery decision-making process and their satisfaction after implementation. The voice index score was on average half that of the efficiency score, which suggested that efficiency was a higher priority.
5.14 Hee Soun Jang, ‘Contracting out Local Government Services to Non-Profit Organizations’, 2006a257
Description: This study tested the effect of contracting across different sectors (public, private for-profit and non-profit) on the costs of six services (electricity, fire protection, police, parks, libraries and public health). The first three were characterised as ‘hard’ mundane government services and the last three, ‘soft’ human services. The study employed statistical analysis of data from 1997 and 2002 based on a sample of 390 cities.
Findings: In-house provision was the least cost-efficient mode of production with strong associations to higher expenditure in all services. It was found that contracting with the private sector was significantly associated with lower spending on electricity and fire services. However, the existence of private sector competition was not significant in lowering costs.
Contracting with non-profits was significantly related to the reduction of service costs for libraries but only weakly related to lower spending on park and library services. Private providers were associated with higher spending in both these services whilst other government providers were strongly associated with less spending.
Methodology: Data was obtained for 390 cities from the International City Management Association surveys in 1997 and 2002 on alternative forms of service delivery. The study took account of a variety of geographical, political/institutional, socio-economic and local market factors to measure competition (such as the number of other private, governmental, non-profit providers).
The empirical analysis proceeded in two stages. Firstly, the factors that contributed to local government choices over contracting and its fiscal impacts were identified using data from a 2002 survey. Although very large, this survey did not distinguish between private for-profit firms and non-profit firms. Secondly, the effect of contracting with non-profits was estimated on service costs, looking only at ‘human’ services (parks, libraries and public health).

Competitive Edge: The Evidence
125
5.15 Hee Soun Jang, ‘Contracting Out Parks and Recreation Services: Correcting for Selection Bias Using a Heckman Selection Model’, 2006b258
Description: This study looked at the impact of choice of contractor sector on service expenditures, similar to Jang (2006a), but focused on two services i.e. parks landscaping and recreation facilities with a dataset drawn from 1997.
Findings: Non-profit contracting was found to be weakly correlated with lower spending on recreation facilities but weakly related to higher spending for parks landscaping. Contracting with private firms was associated with higher spending for both services but only significantly in the case of parks. Contracting with other governments had a larger and significant effect on reducing spending on parks but not a significant effect on reducing spending on recreation.
Methodology: The data was drawn from 1055 observations from the 1997 International City Management Association survey. Expenditure data was drawn from the Census of Government Finance 1997. In the first stage of the analysis, the impact of contracting on per capita expenditure was examined. At the second stage, the analysis controlled for the possibility of selection bias by testing whether the decision to contract out or not was independent of the level of service expenditure.
The study took account of a variety of geographical, political/institutional, socio-economic and local market factors to measure competition (such as the number of other private, governmental, non-profit providers).
Competitive Edge: The Evidence
126
B. UK
COMPETITIVE TENDERING IN LOCAL AUTHORITIES
UK studies have focused on the results of the government’s competitive tendering policy. Compulsory competitive tendering (CCT) for construction, building repair and maintenance and highways construction was introduced by the Local Government Planning and Land Act 1980 under the newly elected Conservative Government to increase the efficiency of councils, and required a 5% rate of return on capital and equipment. Until 1988, the Government promoted voluntary competitive tendering for all other services and a small number of councils, such as Southend and Wandsworth, reported substantial savings by competing a wide range of local services. However, in general, there was resistance among local authorities to the award of contracts to the private sector.
As a result, the Local Government Act 1988 was passed requiring councils to submit their in-house teams to external competition by inviting at least three companies to tender from those which had expressed interest. Although there was no requirement to accept the lowest price, the Act prohibited the use of ‘non-commercial considerations’ in selecting the successful bidder. The services covered were: refuse collection, street cleaning, building cleaning, schools and welfare catering, other catering (e.g. town halls), ground maintenance and vehicle maintenance. Sports and leisure maintenance was added in 1989. Authorities were required to keep separate accounts for each activity and in-house teams were required to break even after achieving a 6% rate of return on any capital equipment.
The Local Government Act 1992 extended CCT to other manual and cultural services as well as to professional services such as legal, architectural, financial and engineering. It also allowed the Secretary of State to define and direct what constituted anti-competitive behaviour. The Local Government Act 1994 further included on-street parking, fleet management and security services. CCT was extended to Northern Ireland councils between 1994-96 for refuse collection, street cleaning and grounds maintenance.
5.16 Keith Hartley and Meg Huby, ‘Contracting-Out in Health and Local Authorities: Prospects, Progress and Pitfalls’, 1985259
Description: A before-and-after study of voluntary competitive tendering based on questionnaires sent to all 410 local and 192 health authorities in England in 1984-85. Eighty-five responses were received, and of those, only 10 concerned health. The local authority services covered 32 examples of building maintenance and repair, 22 of cleaning, 9 of refuse collection and waste disposal, 7 of pest control, and the rest were for security services, management services and horticultural supply.
Findings: Expected annual savings were found to average 26%, ranging from savings of 68% to additional costs of 28%. The results were not broken down by local or health authority or by service.
Methodology: Each respondent authority was allowed to select the contract for which it provided data. The contract value per year was compared with the cost of providing the same level of service in the previous year. Authorities provided some data on the cost of organisation and administration of competitive tendering which included hours spent organising competition, preparing specifications, site visits and analysing tenders.
Firms were also surveyed about the size and source of any savings. Twenty-six out of 81 questionnaires were returned, mostly by members of trade associations involved in domestic and school cleaning.
Sources of benefits: The report pointed to reduced employment, greater use of part-time staff, lower rates of pay, fewer fringe benefits, modern equipment, better management and organisation. There was evidence that private firms reduced staff numbers and paid less. Out of 40 local authority contracts won by private firms, none re-employed all the council’s staff on a full-time basis: in 33 contracts, less than 10% were re-employed on a full-time basis and in 26, less than 10% were re-employed on part-time basis. In 14 out of the 26 surveys returned by firms, the contractors reported that they paid lower wages than in-house teams.

Competitive Edge: The Evidence
127
Critical analysis: It is not clear whether the costs took account of all preparation, monitoring and redundancy costs. In 14 cases out of 75 local authorities, it was reported that there was no in-house bid, which could mean that there was limited competition.260
5.17 Audit Commission, ‘Competitiveness and Contracting Out of Local Authorities’ Services’, 1987261
Description: A report by the UK local government watchdog on the potential for improving the efficiency of three local government services through the introduction of competition.
Findings: The study found potential savings of 20% for housing maintenance, 25% for vehicle management and 15% for refuse collection if all councils matched the performance of the most successful 25% of authorities. Contracting was not put forward as a permanent solution, but the report made clear that although the most competitive in-house providers had lower prices than average suppliers, average Direct Labour Organisations (DLOs) still cost the taxpayer more.
Methodology: Specific performance indicators and unit costs for each service for a sample of local authorities were estimated and then benchmarked against the performance of the top performing quartile of local authorities. This was then used to compare competed/contracted services with non-competed services.
For housing maintenance, the study compared 40 schedules of rates on the costs of jobbing repairs and found that the cost of re-wiring was £218-£396 for private contractors and averaged about £600 for non-competed in-house services.
For refuse collection, the actual costs of services were compared with calculated target costs and staffing levels for 336 Local Authorities based on a desired standard of service and other relevant local factors, using an audit package known as the Recreational Open Space Strategy (ROSS). Contracted services cost, on average, 5% below the ROSS standard and £30 million a year worth of service improvements were anticipated if every authority matched the top 20% authorities.
For vehicle maintenance, the authors compared costs per weighted vehicle for 226 authorities. Costs per vehicle for services open to competition were in the region of £450-500 compared to the ‘target’ cost of £700 set in a previous Audit Commission report.
5.18 Kate Ascher, ‘The Politics of Privatisation: Contracting Out Public Services’, 1987262
Description: In a book analysing the early years of Conservative policy on competitive tendering in public services, Ascher presented three narrative case studies of Gloucester City, Wandsworth Borough and Bath City Councils which outlined contrasting experiences.
a. Gloucester
Findings: An in-house bid for refuse collection and street cleaning services beat five private firms by offering a £150,000 (15%) saving on the previous service budget. Although it was not the lowest bid, the lowest was deemed to be dubious and rejected.
Sources of benefits: The number of staff was reduced from 69 to 55 through early retirement and redeployment. Refuse rounds were expanded and the number of mechanics and vehicles were reduced. Individual workloads increased and penalty clauses were introduced to deduct from bonuses if standards were not maintained. The penalty clauses were accepted at the tendering stage as part of a concession by the unions so as to restrict the competitive advantages of private contractors.
b. Wandsworth
Findings: Figures provided by the council finance department showed there was an average saving of 28% over five years ranging from 9% to 45% for all competed services. The case study itself looked more in-depth at refuse collection, street cleaning and grass-cutting which saved 44%, 23% and 26% respectively. It also

Competitive Edge: The Evidence
128
outlined certain problems that were faced in the management of those contracts, but in spite of these, by 1984, five other services had been outsourced: cleaning community centres and public halls, park cleansing, vehicle maintenance, housing caretaking and public convenience cleaning.
Methodology: Savings from competitive tendering over a five-year period were calculated using figures provided by Wandsworth Council to show the largest saving for each service measured against the higher of current expenditure, current budget or proposed expenditure. They reflected cost levels at different points in time. Savings included sales and receipts from equipment and vehicles and were adjusted for severance payments.
Sources of benefits: There is evidence that terms and conditions for refuse collection workers were cut as it was reported that the contractor lost an arbitration tribunal and was ordered to raise wages by £6-8 a week and to reduce the working week to 39hrs. However, the contractor was never forced to implement the change. The council also began negotiations to delete a fair wages clause, which led to a strike in November 1983.
The other two contracts experienced substantial penalty payments. Street cleaning contractors experienced problems and incurred £8,000 of fines in the first six months. They were forced to add 22 staff to perform the contract, which was calculated to have added £500,000 to costs. Mobile gardening was the most troublesome contract, with fines of £35,000 in the first three months and £73,000 in the following three. The contractor was forced to increase the number of workers from 38 to 51, 40% above the previous in-house service levels. There was also some industrial action after the new payment scheme was introduced to increase productivity. The contract was therefore terminated and a new tender was arranged with two previous firms returning with significantly lower bids, one almost 30% lower. The council had problems in recovering costs from the original contractor after the firm took out an injunction to prevent the council from recouping the losses from a £70,000 performance bond.
c. Bath
Findings: There were estimated savings of at least £1m over 5 years (around 36%) for refuse collection, street cleaning and public toilet cleaning,
Methodology: This was based on the winning bid of £350,000 p.a. from a private firm in December 1982 compared to the original budget of £550,000. However, the city engineer had also put forward a tender based on a 15% saving of £80,000 on the original budget.
Source of benefits: The city engineer’s plan involved cutting 16 out 73 staff and one vehicle. Following the tendering process, staff were cut to 32 initially, but then had to be increased by somewhere between 30% and 70% to iron out delivery problems. Most of these problems were sorted out in the first six weeks, after which complaints returned to an ‘acceptable’ level and the council reported general satisfaction. The council did not however, extend the experiment to other services.
5.19 Kieron Walsh, ‘Competitive Tendering for Local Authority Services: Initial Experiences’, 1991263
Description: A government-commissioned study which reported on the results of the first year of the first round of compulsory competitive tendering from 1989-90 in 40 local authorities for building cleaning, refuse collection, catering, school/welfare catering, grounds maintenance, street cleaning, and vehicle maintenance.
Findings: On average, estimated annual costs for services were 5.7% lower after competition was introduced. This ranged from 48.9% lower for one authority’s building cleaning service to 25.9% higher for street cleaning in another authority. When local officials were asked to estimate average savings taking into account all costs and reductions they thought relevant, they reported a saving of 7%.
Building cleaning showed the greatest reduction followed by catering, vehicle maintenance, grounds maintenance and refuse collection. Street cleaning costs rose due to the imposition of improved environmental standards by central government and school/welfare catering made few savings as a result of efficiency improvements earlier in the 1980s.
Competitive Edge: The Evidence
129
Preparation costs for contracts in preparing specifications, measuring work and letting contracts were found to average 10.7% of the annual contract size and 2.5% of total costs with about 50-60% of this made up of one-off costs. Client-side costs for the council as a proportion of total costs tended to rise whilst they fell for the contractors.
Methodology: Forty councils were selected to compare costs before and after competition was introduced. The authorities were not statistically representative but were chosen to ensure certain characteristics were represented such as Type of Authority (i.e. London Borough, Metropolitan District, Shire County/District), Political Control, Geographical Location, Population Density and Competition Group for the purposes of Local Government Act 1988. It was felt that urban authorities were over-represented whilst shire counties and districts tended to report most savings.
Between May 1989 and May 1990, questionnaires were sent out to the selected local authorities and interviews were conducted with key officials. Twenty-four local authorities provided completed questionnaires covering 59 service areas and 129 contracts, as more than one contract was let for certain services. Estimated costs, based on the tender price for 1989-90 after the introduction of competition, were compared with the previous year costs for 1988-89. Costs of services included employee costs, premises, transport, supplies and service expenses, central departmental and technical support costs. However, redundancy payments or the sale of any equipment were not included as they were not deemed to be part of the costs of the service after competition. All figures were adjusted for inflation. Where an authority had already contracted out a service prior to the CCT legislation, the authority was not considered for this service. Preparation and client and contractor costs were hard to separate out for most authorities and led to even smaller sample sizes
To make up for some of the limitations of the research data, estimates were also requested from local authorities on the annual additional costs or savings in each service as a result of competition. These may have differed by taking into account costs of leasing agreements, capital disposal or other changes that were not surveyed. Out of the 24 authorities, 21 supplied estimates covering 47 services.
Sources of benefits: The most commonly cited reason was improved productivity. This included both increases in costs accompanied by higher standards (most notably in street cleaning and school catering), and reductions in costs (most evident in refuse collection, building cleaning and grounds maintenance). Reduction in pay levels was most often mentioned in regard to building cleaning. Some of the authorities provided productivity figures, which showed an increase in 14 out of 17 comparisons, with an average increase of 18.3% (although the small number of observations makes the results of limited value). In 19 out of 22 authorities there was a reduction in unit costs.
Reduction in employee costs as a proportion of total service costs was seen to be a major result of competition. On average, employee costs fell by 4-5% whilst premises and capital costs rose by 5-6% and central costs rose by 1-2%. Costs were found to rise more on the client side than on the contractor side which suggested that in-house direct service organisations were carefully examining their expenses and that authorities were retaining ownership of plants and equipment which were also major contributors to total costs.
5.20 Kieron Walsh and Howard Davis, ‘Competition and Service: The Impact of the Local Government Act 1988’, 1993264
Description: A report on the impact of the first round of compulsory competitive tendering in 40 local authorities from 1989 to 1992, continuing the work begun by Walsh and published in 1991. As before, it covered building cleaning, refuse collection, catering, school/welfare catering, grounds maintenance, street cleaning, vehicle maintenance with the addition of leisure management, which was brought under the CCT scheme in 1991-92.
Findings: The average change in costs over the three-year period was a 6.5% reduction. The median outcome was a reduction of 6.1% and the most common result was a saving of 0-20%. The data showed a range of results from a reduction in costs of 49.7% to increased costs of 62.4%. The reductions achieved in each of the three years of the first round were also studied separately, though not as cumulative results. In 1989-90 costs were 5.8% lower on average, 7.1% in 1990-91 and 6.8% in 1991-92. The slight fall was attributed to the introduction of leisure as a CCT service in this year which had a lower average saving of 5%. Quality was found

Competitive Edge: The Evidence
130
to have generally been maintained or raised, except in the case of building cleaning where it was reported by officials more frequently that lower standards had been adopted as a result of competition and where there was a higher proportion of complaints regarding failure to perform. However, overall quality was found to have come under greater focus as a result of increased competition. The average cost of preparation for competition was 7.5% for first year costs and 1.8% of the total contract value based on the average length of contracts. Client monitoring costs were found to be 6.2% of contract value. Monitoring costs rose by 32% following competition with an overall rise of 21% in monitoring staff. Client side costs in general also rose as a proportion of the total costs as a result of competition.
Methodology: Questionnaires requesting similar information to the 1991 study were sent to the same 40 local authorities as before which had by 1992 submitted 290 services to tender. Financial information was returned from 35 authorities for 213 services. The authors noted that financial information was difficult to obtain and that supplementary information had to be gathered via interviews with local officials and other documents. In contrast to Walsh (1991), capital costs were distributed between the client and contractor sides where these could be broken down, rather than including them just on the contractor side. In addition, districts and counties reported a ‘significantly lower average reduction than other types of authority’, although it was felt that the figures from metropolitan districts which reported the highest savings might be less reliable given a lower response rate.
Sources of benefits: An increase in productivity was cited as the main reason for changes to costs, which were largely based on staff reduction, averaging 12.2% (and ranging from 4.9% in leisure to 16% in building cleaning and refuse collection). Only 86 services provided productivity data, which was found to rise on average by 24.8% with a reduction in unit costs by 10.4%. Out of 32 comparisons of productivity, 31 showed an increase.
The second most cited reason was the rearrangement of work hours, especially in leisure. Reduced wages were not cited often although bonus systems were often cut back, sick pay and absenteeism was dealt with more strictly and holiday pay adjusted. However, apart from surveying what kind of changes were made to staff conditions, there was quantitative analysis of wages and other benefits.
5.21 Austin Mayhead & Co. Ltd, ‘CCT and Local Authority Blue-Collar Services’, 1997265
Description: A report prepared for the UK Government which examined the impact of the second round of compulsory competitive tendering in 38 local authorities from 1993 to 1996, which was applied to building cleaning, refuse collection, catering, school/welfare catering, grounds maintenance, street cleaning, vehicle maintenance and leisure management. This report followed on from Walsh (1991) and Walsh & Davis (1993), above.
Findings: Average annual costs were reduced by 9.1% in the second round as compared to the first round. This ranged from an average of 2.4% average higher costs for vehicle maintenance and repair to average savings of 25% for leisure. Areas such as building cleaning, refuse collection and grounds maintenance which had showed the greatest savings in 1991 and 1993 declined whilst areas such as street cleaning and school and welfare catering which had increased costs when studied previously, now recorded the greatest savings. Out-turn costs of most first round contracts were found to be on average only 6% above original cost estimates. Most authorities believed that quality had improved since the first round of CCT although this is based on indirect assessments and uneven performance measurement. Changes in standards for the second round were found to be insignificant for 72% of services studied. Where specifications had changed, 53% found an increase in standards, 9% found a decrease and 38% found no overall alteration in standards. There had also been a fall in the incidence of penalty payments, falling from 46% to 33% of external contractors and 20% to 17% for in-house teams.
Preparation costs were much lower for the second round. On average the councils’ client side spent 1.6% of the annual contract value on this whilst in-house teams spent 1.8% of the annual value preparing their bid. Client side costs were on average 4.8% of annual contract value, which was found to be 4% lower than before the second round.

Competitive Edge: The Evidence
131
Methodology: Thirty-eight authorities participated in this study, thirty-two of which had taken part in the previous two. Twenty-eight returned financial information, which covered 89 services and 194 contracts. In contrast to the previous two studies financial information in this study was based on actual annual out-turn costs “i.e. figures from Authorities’ accounts rather than estimates at the time of contract commencement” and compared costs before and after second round tendering. Actual out-turn costs for first round contract prices were found to be 6% higher than original estimates which suggested that they had been contained within inflationary effects. The figures in the report were not adjusted for inflation but it was suggested that the effect of this would be to slightly increase savings given an inflation rate of 3% p.a. Otherwise the methodology was consistent with the 1991 and 1993 studies.
Sources of benefits: This study was unable to obtain accurate information to calculate staffing effects as at 1993, but it was found that most authorities reduced staffing levels and altered job descriptions to meet the requirements of competition. Productivity targets were generally raised. The proportion of authorities using part-time staff had increased slightly since the first round although interviews revealed that this was mostly in building cleaning.
5.22 Robert McMaster, ‘Competitive Tendering in UK Health and Local Authorities: What Happens to the Quality of Services?’, 1995266
Description: A study that sought to test the impact of compulsory competitive tendering on service quality in 21 UK health and local authorities between 1989-90 using statistical analysis. The author claimed that governance changes in public services designed to generate cost savings were characterised by low levels of trust and poor knowledge transfer, which affected service quality.
Findings: The significant findings of the study were that quality decreased as cost savings rose, whereas quality increased with longer contract duration and higher levels of monitoring. Average savings for the services studied were calculated at 11%.
However, it was also suggested that the link between quality and cost savings was indirect as closer analysis showed that savings were more likely to inhibit quality improvement than to cause deterioration. There was no significant difference in results between external and internal service providers or between local and health authorities. Furthermore, it was found that authorities had experienced relatively few disruptions to services under the CCT regime although this was explained through the fairly strong link between service plasticity and quality whilst high levels of re-employment were not found to affect quality.
Methodology: Data were supplied by senior local authority officials, usually the treasurer, from 12 health and 9 local authorities by questionnaire and telephone interview. Out of 228 contracts (127 health, 101 local) that were submitted to tender between 1989 and 1990, 199 provided enough information for empirical testing. The data measured transition problems, contract duration, continuity of workforce, access rights to equipment, monitoring intensity, adaptability of the service to contracting and cost savings. A statistical model was then constructed to investigate their effect on quality.
Service quality was measured by scoring officials’ responses on a three-point scale, indicating whether services had got worse, remained the same or improved. The author acknowledged that this was not ideal as it did not record the experience of service consumer and that the scale itself did not differentiate very finely between levels of quality. Similar problems were identified in devising a scale for measuring most of the other variables.
In calculating savings, officials who responded to the survey were unable to account for transaction costs, so the average of 11% was thought to be slightly inflated. The statistical model itself was found to be fairly robust but it was only moderately successful in predicting quality outcomes.

Competitive Edge: The Evidence
132
5.23 Robert McMaster, ‘A Non-Parametric Approach to Identifying the Sources of Cost Savings Arising from Competitive Tendering’, 1996267
Description: This study analysed the sources of cost reductions from 17 councils that had competitively tendered 109 health and 86 local authority contracts. Local officials were asked to rank the sources in order of importance.
Findings: One hundred and fifteen contracts were won internally and 80 externally. Average cost savings were around 11% with no significant differences noted between health and local authorities. No differences were noted in the ranking of sources.
Increased productivity was the main source of cost reduction by a fair margin, but the relative importance of sources with adverse effects on the workforce was also noted, such as changes to its composition, earnings and non-remuneratory conditions.
Methodology: Data were obtained from a postal survey of 12 health and 9 local authorities randomly selected from throughout UK, for the years 1989-90. Information was usually provided by the authority’s treasurer. Seventeen out of the 21 councils provided aggregated rankings of most important contributors to cost reductions.
Authorities were asked to assign a rank of one to eight for the potential causes of cost reductions identified from the literature on competition and contracting in health and local government:
changes in the managerial method • (e.g. greater budgetary awareness);
changes in the composition of the workforce • (e.g. a shift from full to part-time employment and redundancies);
changes in the method of working;•
contract specification;•
deterioration in non-financial employment conditions;•
use of new, or more specialised technology;•
productivity improvements;•
reduction in earnings.•
The mean rankings were then taken to identify the most important sources. It was accepted that there may have been some overlap between the different sources but all authorities in the sample were found to use significantly similar evaluative criteria.
5.24 Colin Knox and William Young, ‘Compulsory Competitive Tendering in Northern Ireland Local Government: The End of Round One’, 1995268
Description: A study on the roll out of compulsory competitive tendering in Northern Ireland for refuse collection and street cleaning in 1994-95. Out of 26 councils, all 26 awarded the contract to the in-house Direct Service Organisation based on the lowest bid.
Findings: An average saving of 25% on the previous year was found ranging from 13% to 55%, except for one contract, which incurred an additional cost of 3%. Private sector bids ranged from 15% to 62% higher for joint service contracts and 5% to 68% higher for single service contract bids. The median difference between the lowest and second lowest tender prices was 19% for refuse-only contracts and 29.5% for joint service contracts. It was suggested that there were not sufficient economies of scale and scope for the private sector to compete properly and that the transposition of CCT to Northern Ireland in its mainland form was not well thought out.

Competitive Edge: The Evidence
133
Methodology: Twenty-three of the 26 councils returned questionnaires, but only 15 returned financial information which allowed comparison of the previous year’s gross total running costs for the services including overheads with the winning tender figure for the contract. The costs that could and could not be included such as redundancy, use of buildings, plant and machinery were defined in the relevant legislation.
Sources of benefits: In 23 councils, there was an overall loss of only 55 jobs out of a total of 7514 pre-CCT. Fifty-eight blue-collar jobs were lost out of 4714 whilst three white-collar jobs were gained in total. During interviews with council chief executives it was revealed that in the run-up to CCT some councils had already begun to streamline processes and make efficiency savings by employing new technology.
Critical analysis: The authors cautioned that there could be further job shedding in the future due to over-ambitious winning bids by in-house teams and CCT’s effectiveness in lowering costs remained to be proved in the long term. In addition there were questions around the efficiency of the procurement process, which was constrained to inviting bids either for single or joint service contracts thereby limiting the attractiveness of the competition to private sector firms.
5.25 Chartered Institute of Public Finance and Accountancy, ‘Achieving Value for Money Through Competition: CCT/Market Testing in Northern Ireland – Case Studies and Survey Analysis’, 1996269
Description: A report on the introduction of compulsory competitive tendering in Northern Ireland for refuse collection and street cleaning. It was based on a survey of local councils between July and December 1995 and case studies of three councils. All contracts were won by in-house teams.
Findings: The survey found that on average refuse collection costs fell by 8.5% in the year following competition for 11 contracts ranging from a decrease of 32.8% to an increase of 7.2%. Street cleaning costs all rose between 4.2% and 29% for nine contracts. Four combined contracts ranged from an increase of 8% to a decrease of 18.6%. The case studies showed savings of 2-5%. Quality was reported to be higher in most cases, but it was not possible to compare the standards used before and after competition.
Methodology: Questionnaires were sent to all 26 Northern Irish councils, 16 responded but of those only 13 provided financial details related to savings. Each council was requested to complete a separate questionnaire for every service tendered. In addition, three case studies were undertaken to look deeper into the financial issues and produce more reliable comparisons. CIPFA compared the total cost of the service in 1993-94 and 1994-95, including monitoring costs. In one case where refuse collection and street cleaning were tendered, initial comparison of pre- and post-tender costs showed savings of 18.6%. But since post-CCT figures did not include leasing or monitoring costs they had to be ‘grossed up’, which showed an overall saving of 4.6%.
CIPFA also recalculated central support costs in two of the case studies based on number of staff on the in-house team and service expenditure and found that the costs submitted by the council were far below their estimates. In one case the council justified their submission on the basis that the refuse collection service in question used up much less of the council’s central support functions. However, it was also conceded that service managers were putting pressure on councils to lower their prices so as to more closely resemble private sector prices.
Sources of benefits: The majority of savings were achieved in the preparation for CCT by in-house teams during negotiations with their workforce. These led to the removal of overtime, more flexible working times, and the introduction of surplus share agreements, which tied bonuses to financial performance and staff attendance which in turn caused absenteeism to decline. In one case study absenteeism fell from 8% to 2.5% per year post-CCT and in another study the average level of sickness dropped from 9.7% to 5% per year. The surplus share agreements were also observed to motivate staff and thus improve morale and productivity and allow acceptance of new ideas.
A great deal of restructuring as well as the introduction of new technology, notably wheeled bins in refuse collection, had taken place in anticipation of CCT in the years before tendering became compulsory. Thus the policy itself led to earlier savings that were not achieved as a direct result of competition. However, it was not possible to measure this effect.

Competitive Edge: The Evidence
134
5.26 Stephen Cope, ‘Contracting-Out in Local Government: Cutting by Privatising’, 1995270
Description: A case study on the contracting out of cleaning services in more than 500 Kent schools undertaken by the county from 1984-87.
Findings: The County Education Officer estimated savings of £2.73m over a three-year period, after taking into account supervision costs and the repayment of a loan from the council to underwrite redundancy payments, although there was no indication of the previous costs. The total costs were not specified. Quality was found to have deteriorated very slightly. The council defined the standards in the contract so as to maintain the previous levels and employed a fortnightly reporting system by head teachers and monitoring system overseen by council officers.
Methodology: The author reproduced the Education Officer’s estimates that were made in 1984 for each year of the contract. They were based on the savings from tender prices less the supervision costs. The first year estimate (1984-85) took account of a £1m loan from Kent County Council’s Efficiency Fund to cover redundancies. This led to an estimated £250,000 deficit in the first year but was more than recouped in the following two years by surpluses amounting to £2.98m.
Cope quoted a range of other estimates made at the same time by the council, the unions and industry groups, from a loss of £425,000 to a saving of £1,389,760. The latter figure seems to have been derived from an annual estimate of tender price savings before accounting for supervision and redundancy costs whilst the former was based on the largest difference between savings estimated between £1.3m and £1.6m and redundancy payments of £1.265m and 1.725m.
The study discussed a number of additional methodological problems in estimating savings. Firstly, reliance on estimated and not actual savings figures meant that the expected savings may not have materialised, although the contractor would have to stick to the tender price unless there were exceptional circumstances. Secondly, the contracts, whilst designed to maintain previous standards of quality, did apply those standards more evenly and rigorously throughout the county than before.
Sources of benefits: There was a net loss of jobs and an overall drop in wages largely as a result of reducing the number of cleaners. It is reported that the council incorporated a fair wages clause into the contract but this had no statutory force and pay was effectively regulated by the contract cleaning industry which could take advantage of high unemployment at the time in the area and not the local authorities who negotiated wages at a national level. According to the County Cleaning Services officer, rates of pay deviated from the nationally agreed rate of £1.96 per hour, to between £1.60 and £2.00 per hour. However, no further evidence was presented on the number or proportion of jobs lost or on the drop in average wages. Many of the cleaners made redundant were later hired by contractors.
5.27 Ian Kavanagh and David Parker, ‘Contracting Out of Local Government Services in the UK: A Case Study in Transaction Costs’, 2000271
Description: A study on the externalisation of the London Borough of Ealing’s Technical Services Group for engineering, environmental and property services (highways and grounds maintenance, refuse collection, street cleansing, architecture and design services) in 1994-99.
Findings: The council reported total savings of £10m over the five year period although the contractor insisted that they had met their original commitment to deliver savings of £20m. The contractor had committed to carry out the above services for payment based on the annual costs for 1993-94 (£30m) whilst also delivering continuous year on year savings. By the final year, annual savings were expected to amount to 25% of the annual cost.
Financial problems arose very soon after the contract began, when the Labour Party was returned with a large majority in local council elections. Subsequently, when costs amounting to an extra £3m per year came to light, the council refused to pay, partly due to the new ruling party’s opposition to the contract that a Conservative council had previously negotiated, and partly due to disagreement over costings. It appeared that the Technical Services Group had been unknowingly cross-subsidised by other departments for a number of years.

Competitive Edge: The Evidence
135
Questionnaires suggested that customer satisfaction had risen from 44% to 71% between 1994 and 1998. Quality accreditation was also achieved whilst accident figures showed a progressive decline. However, there was also a fall in investment in training and IT.
Methodology: The study was based on structured interviews with senior managers in the contracting firm, union officials and Ealing council employees. The council’s estimate of actual savings was obtained from an interview with an official whilst the contractor’s claim was derived from an article by a senior manager in the contractor’s in-house magazine from July 1998.
Sources of benefits: According to the contractor’s accounts, worker productivity based on turnover per employee more than doubled between 1994 and 1999, and reached an annual increase of 58.2% in 1998. Local authority workers transferred from Ealing Council under the Transfer of Undertakings (Protection of Employment) regulations, but once the additional costs came to light there was a cut in both employment numbers and terms and conditions. Blue-collar workers suffered a cut in pay and benefits amounting to around £1,500 per worker per annum. This included removal of sick pay for the first three days, the reduction of sickness benefit from 26 weeks to eight weeks in any year and a reduction in industrial injury entitlement. Hours were increased and wages reduced, which led to strike action. Out of 416 white-collar employees 66 were made redundant, working weeks were increased from 35 to 37.5 hours, and there was a reduction in leave (by five days) and overtime rates. By 1998, staff numbers had declined from around 1500 to 1000. This also included 300 cleaning staff who had been subcontracted.

Competitive Edge: The Evidence
136
C. DENMARK
5.28 Jens Blom Hansen, ‘Is Private Delivery of Public Services Really Cheaper? Evidence from Public Road Maintenance in Denmark’, 2003272
Description: A statistical analysis of the effect of private sector involvement on road maintenance expenditure was analysed in 273 out of 275 Danish municipalities over the period 1988-99.
Findings: The use of the private sector was significantly associated with lower road maintenance costs. This amounted to a reduction of DKK 1.11 per metre of road for every 10% of services purchased from the private sector. This was equivalent to a 2% reduction on the average road expenditure of DKK 73 per metre road. When the data were adjusted for quality, a significant association between private delivery and lower expenditure remained, although it was found that improving quality incurred considerable additional expense (at the rate of approximately DKK 10 per metre of road to raise quality by one point on the official municipal 1-10 grading system).
Methodology: Danish municipalities provided a useful dataset as they were largely autonomous in their management of local roads, including spending and revenue raising decisions, and thus were not much affected by institutional factors imposed by central or provincial government. They also used a standardised accounting system. Since most municipalities used some kind of private provider, private sector involvement was measured as the proportion of road maintenance spent on purchasing services from an external provider and expenditure was based on Danish Kroners per metre of road. Time series data was also used from 1988 to 1999 to improve the breadth of the study data. However, municipalities did not record whether contracts were allocated through competitive tendering, negotiation or retained in-house for whatever reason although the authors suggested that most external suppliers were chosen through competition.
The data used to control for quality was derived from a smaller subset of 42 municipalities from 1999. It was based on a standardised municipal grading system measuring observed road conditions on a scale from 1-10.
5.29 Henrik Christoffersen, Martin Paldam, and Allan Wurtz, ‘Public Versus Private Production and Economies of Scale’, 2007273
Description: A statistical analysis of the costs of school cleaning in 189 out of 275 Danish municipalities, covering 1,081 schools. It compared the effect of three forms of service provision on cleaning costs: private, municipal central and municipal decentral (at individual school level).
Findings: Central municipal provision was 6.4% cheaper than decentralised provision, whilst private provision was 28.9% cheaper than decentral and 24% cheaper than central municipal. Based on government figures that 66.5% of municipalities used decentral provision whilst 19.1% used central, it was calculated that if those remaining municipalities adopted private provision, savings would amount to 25% of present cleaning costs.
Methodology: The study was based on returns of questionnaires sent to municipal governments. It controlled for differences in quality standards (pre-specified not observed), school size, local population, wealth and local political support for the public sector. In the report it was noted that for decentral contracts, the municipal governments only set the budget but the school employed and monitored the staff which meant that the figure supplied via the questionnaires might not be the actual figure spent.
Source of benefits: Municipal governments tended to apply pressures to cut cleaning costs equally to schools of all sizes, whereas it was found that the greatest savings could be made in larger schools where differences between public and private sector costs were largest. This was attributed to incomplete information held by authorities on the costs of local school cleaning which could be better uncovered if the service was submitted to competition.

Competitive Edge: The Evidence
137
D. AUSTRALIA
5.30 Evatt Research Centre, ‘Breach of Contract: Privatisation and the Management of Australian Government’, 1990274
Description: A survey of all 831 Australian local governments on their experience of contracting by a union-sponsored think-tank. There were 460 responses (55%).
Findings: The survey suggested mixed experiences with contracting. Lower costs were mentioned three times more often than higher costs. Sanitary and recreation services were most associated with lower costs whilst public works were most associated with higher costs. However, quality was reported to have deteriorated more often than it improved, especially for recreation facilities and public works. There were 170 instances of contracted services that had been returned to public delivery, amongst which public works featured in 81 cases.
Methodology: The questionnaire sought the opinions of council officials on the advantages and disadvantages of contracting out for recreational facilities, public works and services, sanitation services and welfare and health services separately. Officials were allowed to respond in free text, which was then ‘key-phrased’ according to the most frequently mentioned advantages and disadvantages.
Sources of benefits: Higher productivity, lower labour costs and overheads and more flexible hours were frequently mentioned as advantages whilst the local loss of employment was a disadvantage.
5.31 Stephen J. Rimmer, ‘A Case Study in Competitive Tendering and its Implementation: Australia’, 1990275
Description: An overview of the experience of competitive tendering undertaken in the 1980’s in Glenorchy, a small municipality in the Tasmanian capital of Hobart. The study looked at contracting for road sealing, mechanical street sweeping and municipal tipping facilities.
Findings: Savings of 10% and 15% were reported for road sealing and street sweeping respectively, but the tipping facility was not contracted out after only one firm submitted a bid. Competition was deemed to produce a more flexible demand-led service, which could not be achieved merely by imposing a new management structure.
Critical analysis: The study did not provide information about the methodology used to establish the extent of the savings and their sources.
5.32 Stephen Rimmer, ‘Aspects of Competitive Tendering and Contracting in Local Government Administration’, 1993276
Description: A statistical analysis of 327 local councils in New South Wales and Victoria investigating the differences in costs for five services (household refuse collection, sanitation, provision of halls and civic centres, pools and beaches infrastructure, construction and maintenance of roads) between those governments which used contracting and those that did not, based on a 1988-89 survey.
Findings: Contracting councils had lower mean and median expenditures for their services but the difference was not found to be statistically significant once the data was adjusted for population, geography and service specific factors. Mean service costs were found to be 23.7% lower in NSW and 20% lower in Victoria for contracting councils and median service costs were found to be 5.4% and 13.6% in those states respectively. When more complex statistical analysis was used, no significant difference was found between contracting and non-contracting councils except for refuse collection in Victoria where contracting was associated with higher costs.
Methodology: Data were collected via a questionnaire sent to 175 councils in New South Wales, of which 156 responded, and 210 councils in Victoria, of which 171 responded. The questionnaire asked whether contracting was used for each of the different services. Further financial data were obtained from the Australian Bureau of Statistics.

Competitive Edge: The Evidence
138
The first two estimates were based on a simple cross-sectional comparison of average expenditures for each service in the two states. The third used more complex statistical analysis to control for population, geography and several service specific factors.
In order to try to explain the variation, a further analysis was carried out to test the impact of geographic location (i.e. city, provincial or rural) on service expenditure. To do this, Rimmer analysed separately the results for city, provincial and rural councils. Amongst the cities, contracting only had a moderately significant effect on lowering spending in Victoria’s sanitation services. However, there was a consistent finding that cities using contracting for services consistently spent less. Contracting had a less consistent effect on provincial spending, with half of service expenditures declining and the other half increasing, whilst in rural areas contracting was associated with higher expenditures.
This suggested that city councils, which also had larger budgets, were more likely to achieve savings from contracting (possibly due to the influence of greater competition). But being fewer in number they were less likely to affect the significance of the findings. On the other hand, rural councils had the smallest budgets and were less likely to make savings as a result of contracting but were greater in number so more likely to affect the significance of the results. In addition, the central municipality of Sydney was excluded from the analysis of refuse collection and sanitation because the City of Sydney supplied both itself and the City of South Sydney, which increased its spending and caused outlier data problems.
5.33 Paul Jensen and Patrick Fernandez, ‘Cultural Change: Competitive Tendering and Contracting in Local Government’, 1995277
Description: Case studies of three Australian councils, which described the impact of competitive tendering on local services in Clare, Manly and Mosman.
a. Clare District Council, South Australia
Findings: The council was $0.75m in debt in 1987. By 1993 the council had become debt free and assets had doubled in value. A 12-month road-grading contract was tendered after the council CEO calculated that equipment was underutilised and that the output of the workforce could be improved through more efficient work practices. When the contract grader’s performance was compared with that of the in-house grader, the results indicated that the in-house team were doing half the work at twice the cost per kilometre.
Sources of benefits: The in-house team complained that the contractors’ higher productivity was due to longer working hours, which would result in penalty rates if council employees worked similar hours.
As a result of the tendering the number of council employees in the road maintenance department was reduced from 21 to 10. Of the 11 who left, three went to work for contractors, two moved to other councils, three were re-deployed and three took early retirement. It was also found that equipment would be more effectively utilised if it was sold to local operators and then hired back by the council when required.
b. Manly Council, New South Wales
Findings: Sydney-based Manly Council had a projected deficit of $2.6m in 1991; this was transformed into a $1.2m surplus by 1992. The council introduced competitive tendering for toilet cleaning, beach cleaning, street and gutter cleaning, emptying public bins, lawn mowing, road side grass cutting and refuse collection along with other workplace reforms although competition through contracting was seen as the most significant factor. Lawn mowing cost savings amounted to $100,000 per year with no fall in quality.
Sources of benefits: Productivity was reported to have risen and staff numbers fell by 17%. However, the unions complained that the toilet-cleaning contractor could not meet the required specifications and that supervision was poor. Following investigation of these claims the contract was terminated after 18 months and handed back to the in-house team. As a result the unions recommended that the services should be bundled together when tendering to encourage larger, more reputable firms to come forward with similar overheads to the in-house team. Unions also claimed that their bids for the lawn-mowing contract had been inflated by 68% to account for

Competitive Edge: The Evidence
139
wages and 42% to account for council overheads whereas management claimed that only direct labour-related overheads and limited general overheads were included.
c. Mosman Council, New South Wales
Findings: Mosman Council (in Sydney) introduced competitive tendering, and the in-house team won the contract for street cleaning, worth $0.5m, $50,000 less than the closest bidder. This represented a 14% reduction over previous costs. The external bidder was allowed to examine the in-house bid after expressing some suspicion.
Sources of benefits: The in-house team ran an operating surplus of $40,000 in the first six months and awarded bonuses of A$800 to the seven employees involved. They worked overtime and took on extra duties without claiming extra pay. They also averaged only 2.1 sick days per year, compared to the council average of 4.1 for salaried employees and 8 for wage employees. Over four years, the in-house labour staff for the whole council was reduced from 62 to 25. (This was not broken down by specific departments nor was it shown how the staff reduction was managed.)
5.34 Ivan Kwan, ‘Tender Business: Contracting of Grounds Maintenance in the City of Bendigo’, 1995278
Description: A case study examining the contracting of grass cutting in parks in a city of 31,000 in rural Victoria following introduction of Compulsory Competitive Tendering in 1992.
Findings: The contractor’s bid was estimated at about $14,000 less than the in-house bid (a cost reduction of around 18%).
Methodology: The study reported the Competitive Tendering manager’s estimates of annual expenditure based on prices given in tenders. However, it only compared the winning contractor’s bid with the in-house bid, not with the prior cost of operating the service.
Sources of benefits: The company was small and the bid was very leanly priced. However, the company made a $5,000 loss due to a drought in 1994. As this was a work-based contract the council stuck to the conditions and did not have to pay for idle workers so that the contractor was forced to accept the risk. The quality delivered was found to be outstanding by the parks section manager, but the winning contractor was shown to be quite commercially naïve.
Competitive Edge: The Evidence
140
Endnotes
1 Martin Binkin, Herschel Kanter and Rolf H Clark, Shaping the Defense Civilian Work Force: Economics, Politics and National Security, Studies in Defense Policy, The Brookings Institution, 1978.2 GAO, Review of DoD Contracts Awarded Under OMB Circular A-76, 1981.3 GAO, Factors Influencing DoD Decisions to Convert Activities From In-House To Contractor Performance, 1981.4 GAO, Contracting of Various Functions Under OMB Circular A-76 at Selected Air Force Installations in San Antonio Texas, 1984.5 Letter from the Deputy Controller General of the United States to The Honorable Henry B Gonzalez, House of Representatives, October 1974.6 John B Handy and Dennis J O’Connor, How Winners Win: Lessons Learned From Contract Competitions in Base Operations Support, Logistics Management Institute, 1984.7 GAO, DOD Functions Contracted Out Under OMB Circular A-76: Contract Cost Increases And The Effects On Federal Employees, 1985.8 Ross M Stolzenberg and Sandra H Berry, A Pilot Study of the Impact of OMB Circular A-76 on Motor Vehicle Maintenance Cost and Quality in the U.S. Air Force, Rand, 1985.9 GAO, DOD Functions Contracted Out Under OMB Circular A-76: Costs And Status of Certain Displaced Employees, 1985.10 GAO, Federal Productivity: DOD’s Experience in Contracting Out Commercially Available Activities, 1988.11 GAO, Army Procurement: No Savings From Contracting for Support Services at Fort Eustis, Virginia, 1988.12 Paul M Carrick, ‘Evidence on Government Efficiency’, Journal of Policy Analysis and Management, (1988) 7:3, pp518-528.13 Christopher M Snyder, Robert P Trost, and R Derek Trunkey, ‘Reducing Government Spending with Privatization Competitions: A Study of the Department of Defense Experience’, The Review of Economics and Statistics, (2001) 83:1, pp108-117.14 R Derek Trunkey, Robert P Trost and Christopher M Snyder, Analysis of DOD’s Commercial Activities Program, Center for Naval Analyses, 1996.15 Carla Tighe, Derek Trunkey and Samuel Kleinman, Implementing A-76 Competitions: Lessons Learned from DoD Experiences, Center for Naval Analyses, 1996.16 Christopher M Snyder, Robert P Trost, and R Derek Trunkey, Bidding Behaviour in DoD’s Commercial Activities Competitions, Center for Naval Analyses, 1998.17 Christopher M Snyder, Robert P Trost, and R Derek Trunkey, ‘Reducing Government Spending with Privatization Competitions: A Study of the Department of Defense Experience’, The Review of Economics and Statistics (2001) 83:1, pp108-117.18 GAO, Base Operations: Challenges Confronting DoD as it Renews Emphasis on Outsourcing, 1997.19 GAO, DOD Competitive Sourcing: Results of Recent Competitions, 1999.20 GAO, DOD Competitive Sourcing: Questions about Goals, Pace, and Risks of Key Reform Initiative, 1999.21 GAO, DOD Competitive Sourcing: Savings Are Occurring, but Actions Are Needed to Improve Accuracy of Savings Estimates, 2000.22 GAO, Results of A-76 Studies Over the Past 5 Years, 2000.23 Susan M Gates & Albert A Robbert, Personnel Savings in Competitively Sourced DoD Activities: Are They Real? Will They Last?, RAND, 2000.24 Michael Hynes, A Casebook Of Alternative Governance Structures And Organizational Forms, RAND, 2000.25 See Christopher Reeger, Outsourcing TA-4J Maintenance: Cost and Quality Experience, Center for Naval Analyses, 1997, for an analysis of this case.26 David J Kneisler, Outsourcing the Helicopter Combat Support Mission Aboard Military Sealift Command Ships: A Cost Comparison Study, Naval Postgraduate School, Monterey, California, Thesis, June 2000.27 GAO, Effects of A-76 Studies on Federal Employees’ Employment, Pay, and Benefits Vary, 2001.28 Frances Clark, Cheryl Rosenblum, Murrel Coast and Elaina Smallwood, Long-Run Costs and Performance Effects of Competitive Sourcing, Center for Naval Analyses, 2001.29 Jacques S Gansler and William Lucyshyn, Competitive Sourcing: What Happens to Federal Employees?, IBM Center for the Business of Government, Market Based Government Series, 2004.30 Executive Office of the President Office of Management and Budget, Competitive Sourcing: Report on Competitive Sourcing Results, Reports for Fiscal Years 2003 to 2006.31 John D Keenan, Samuel D Kleinman, Jonathan W Leland, Carla E Tighe and Micky Tripathi, Issues Concerning Public and Private Provision of Depot Maintenance, Center for Naval Analyses, 1994.
Competitive Edge: The Evidence
141
32 Christopher Reeger, Outsourcing TA-4J Maintenance: Cost and Quality Experience, Center for Naval Analyses, 1997.33 Congressional Budget Office, Logistics Support for Deployed Military Forces, 2005.34 Keith Hartley, ‘Defence’, in A Harrison (ed), From Hierarchy to Contract, London: Policy Journals, 1993, p56.35 Matthew Uttley, ‘Contracting-Out and Market-Testing in the UK Defence Sector: Theory, Evidence and Issues’, Public Money & Management, January-March 1993, pp55-60.36 Matthew Uttley, ‘Competition in the provision of Defence Support Services: the UK Experience’, Defence Analysis (1993) 9:3, pp271-288.37 35. Michael Hynes, A Casebook Of Alternative Governance Structures And Organizational Forms, RAND, 2000.38 NAO, Ministry of Defence: Competition in the Provision of Support Services, 1992.39 House of Commons Committee of Public Accounts, Ministry of Defence: Competition in the Provision of Support Services, 1993.40 House of Commons Defence Committee, Market Testing and Contracting out of Defence Support Functions, 1995.41 Matthew Uttley, ‘The Management of UK Defence’, in S Croft, A Dorman, W Rees and MRH Uttley, Britain and Defence 1945-2000: A Policy Re-Evaluation, London: Longman, 2001, pp88-102.42 HM Treasury Taskforce, Medium Support Helicopter Aircrew Training Facility: PFI Case Study, 1998.43 NAO, The Private Finance Initiative: The Procurement of Non-Combat Vehicles for the Royal Air Force, 1999.44 NAO, The Private Finance Initiative: The Contract for the Defence Fixed Telecommunications System, 2000.45 House of Commons Public Accounts Committee: The Private Finance Initiative: The Contract for the Defence Fixed Telecommunications System, 2000.46 NAO, Ministry of Defence: The Joint Services Command and Staff College, 2002.47 NAO, Ministry of Defence: Redevelopment of the MOD Main Building, 2002.48 NAO, Ministry of Defence – Building an Air Manoeuvre Capability: The Introduction of the Apache Helicopter, 2002.49 NAO, Ministry of Defence: Major Projects Report, 2002.50 DOD, The Defence Force and the Community – A Partnership in Australian Defence, 1990.51 Ernst & Young Consulting, Report to the Department of Defence: A Review of the Commercial Support Program and its Performance, 1993.52 Allan Shephard, The Defence Commercial Support Program: Saving $200 Million a Year for Defence Procurement? Parliamentary Research Service, Paper No 2, 1993.53 Industry Commission, Defence Procurement, Report No 41, Australian Government Publishing Service, 1994.54 Commonwealth Department of Finance, Resource Management Improvement Branch: ‘Case Study: Defence’s Commercial Support Program (CSP)’, Examining Contestability Within the APS: Initial Information - Concepts, Case Studies and Lessons Learned, RMI Management Improvement Discussion Series Paper No 3, Appendix D: Case Study Experiences Relating to Contestability, 1995.55 Michael McNamara, The Commercial Support Program in the Department of Defence, Paper for the RIPAA National Conference, 1995.56 Department of Defence, Submission to the Industry Commission Inquiry into Contracting Out, 1996.57 Commonwealth Department of Finance, Resource Management Improvement Branch: ‘Case Study: Defence’s Commercial Support Program (CSP)’, Examining Contestability Within the APS: Initial Information - Concepts, Case Studies and Lessons Learned, RMI Management Improvement Discussion Series Paper No 3, Appendix D: Case Study Experiences Relating to Contestability, 1995.58 Industry Commission, ‘Cost Case Study – Amberly RAAF Base’, Competitive Tendering and Contracting by Public Sector Agencies, Appendix F, Report No 48, 24 January 1996.59 Department of Defence, Submission to the Industry Commission Inquiry into Contracting Out, 1996.60 Australian National Audit Office, Commercial Support Program –Department of Defence, Audit Report No 2, Performance Audit, 1998.61 Simon Domberger, Paul H Jensen and Robin E Stonecash, ‘Examining the Magnitude and Sources of Cost Savings Associated with Outsourcing’, Public Performance & Management Review (2002) 26:2, pp148-168.62 Jill Sherman, ‘Can in-house caterers cope?’, Health and Social Service Journal (6 October 1983) 93, p1188.63 Keith Hartley and Meg Huby, ‘Contracting Out in Health and Local Authorities: prospects, progress and pitfalls’, Public Money, September 1985, pp23-6.64 National Audit Office, ‘Competitive Tendering for Support Services in the National Health Service’, 1987.65 Simon Domberger, Shirley Meadowcroft and David Thompson, ‘The Impact of Competitive Tendering on the Costs of Hospital Domestic Services’, Fiscal Studies (1987) 8:4, pp39-54.66 Robin Milne, ‘Competitive Tendering in the NHS: An Economic Analysis of the Early Implementation of HC(83)18’, Public Administration (1987) 65, pp145-160.67 CBI Public Expenditure Task Force, ‘The Competitive Advantage’, CBI, 1988.68 Stephen Bach, ‘Too High A Price To Pay? A Study of Competitive Tendering for Domestic Services in the NHS’, Industrial Relations Research Unit, University of Warwick, 1989.69 Joint NHS Privatisation Research Unit, ‘The NHS Privatisation Experience: Competitive Tendering for NHS Services’, 1990.70 Contract Cleaning and Maintenance Association, ‘The Facts on the NHS Privatisation Experience: A response to The NHS Privatisation Experience by the Joint NHS Privatisation Research Unit’, 1990.71 Robin Milne and Magnus McGee, ‘Compulsory Competitive Tendering in the NHS: A New Look at Some Old Estimates’, Fiscal Studies (1992) 13:3, pp96-111.72 Robin Milne, ‘Contractors’ Experience of Compulsory Competitive Tendering: A Case Study of Contract Cleaners in the NHS’, Public Administration (1993) 71, pp301-321.73 Robert McMaster, ‘Competitive Tendering in UK Health and Local Authorities: What Happens to the Quality of Services?’,

Competitive Edge: The Evidence
142
Scottish Journal of Political Economy (1985) 42:4, pp409-427.74 Robert McMaster, ‘A Non-Parametric Approach to Identifying the Sources of Cost Savings Arising from Competitive Tendering’, Applied Economics Letters (1996) 3, pp463-466.75 Robin Milne and Robert Wright, ‘Competitive tendering in the Scottish National Health Service: was it compulsory, and did it make a difference?’, Scottish Affairs, (2000) 31, pp133-152.76 Robin Milne and Robert Wright, ‘Competition and costs: evidence from competitive tendering in the Scottish National Health Service’, Scottish Journal of Political Economy (2004) 51:1, pp1-23.77 Declan Gaffney and Allyson Pollock, ‘Downsizing for the 21st Century: A Report to UNISON Northern Region on the North Durham Acute Hospitals PFI Scheme’,, 2nd ed, London: UNISON, 1999.78 David Price, Declan Gaffney and Allyson Pollock, ‘”The Only Game in Town?” A Report on the Cumberland Infirmary Carlisle PFI by UNISON Northern Region’, London: UNISON, December 1999.79 Declan Gaffney, Allyson M Pollock, David Price, Jean Shaoul, ‘PFI in the NHS – Is There an Economic Case?’, British Medical Journal (10 July 1999) 319, pp116-119.80 NAO, ‘The PFI Contract for the new Dartford and Gravesham Hospital’, HC 423 Session 1998-99, London: The Stationery Office, 19 May 1999; House of Commons Committee of Public Accounts, ‘The PFI Contract for the New Dartford and Gravesham Hospital’, HC 131, 12th Report 1999-2000, at http://www.publications.parliament.uk/pa/cm199900/cmselect/cmpubacc/131/13103.htm81 NAO, ‘Darent Valley Hospital: The PFI Contract in Action’, HC 209 Session 2004-2005, London: The Stationery Office, 10 February 2005.82 Discussed at House of Commons Committee of Public Accounts, ‘The PFI Contract for the Redevelopment of West Middlesex University Hospital’, HC 155, 19th Report 2002-03, 6 June 2003, p7, at http://www.publications.parliament.uk/pa/cm200203/cmselect/cmpubacc/155/155.pdf83 NAO, ‘The PFI Contract for the new Dartford and Gravesham Hospital’, HC 423 Session 1998-99, London: The Stationery Office, 19 May 1999, pp5, 31 & 35.84 NAO, ‘The PFI Contract for the Redevelopment of West Middlesex University Hospital’, HC 49 Session 2002-2003, London: The Stationery Office, 21 November 2002; House of Commons Committee of Public Accounts, ‘The PFI Contract for the Redevelopment of West Middlesex University Hospital’, HC 155, 19th Report 2002-03, 6 June 2003, at http://www.publications.parliament.uk/pa/cm200203/cmselect/cmpubacc/155/155.pdf85 House of Commons Committee of Public Accounts, ‘The PFI Contract for the Redevelopment of West Middlesex University Hospital’, HC 155, 19th Report 2002-03, 6 June 2003, p6, at http://www.publications.parliament.uk/pa/cm200203/cmselect/cmpubacc/155/155.pdf 86 House of Commons Committee of Public Accounts, ‘The PFI Contract for the Redevelopment of West Middlesex University Hospital’, HC 155, 19th Report 2002-03, 6 June 2003, p7, at http://www.publications.parliament.uk/pa/cm200203/cmselect/cmpubacc/155/155.pdf 87 Allyson M. Pollock, Jean Shaoul, Neil Vickers, ‘Private Finance and “Value for Money” in NHS Hospitals: A Policy in Search of a Rationale?’, British Medical Journal, (18 May 2002) 324, pp1205-1209.88 ‘Table 4.8f: Net Present Value Calculations Upon Which Decisions About the Private Finance Options Are Based’, in ‘Public Expenditure on Health and Personal Social Services 1998, Memorandum Received from the Department of Health containing Replies to a Written Questionnaire from the Committee’, 2 November 1998, located at http://www.publications.parliament.uk/pa/cm199798/cmselect/cmhealth/959/959m56.htm & http://www.publications.parliament.uk/pa/cm199798/cmselect/cmhealth/959/959m57.htm; ‘Table 4.8f: Net Present Value Calculations Upon Which Decisions About the Private Finance Options Are Based’, in ‘Public Expenditure on Health and Personal Social Services 1999, Memorandum Received from the Department of Health containing Replies to a Written Questionnaire from the Committee’, 18 October 1999, located at http://www.publications.parliament.uk/pa/cm199899/cmselect/cmhealth/629/62926.htm; ‘Table 4.8.6 Long Term Capital Projects and PFI’, in Select Committee on Health, ‘Public Expenditure on Health and Personal Social Services 2000, Memorandum Received from the Department of Health containing Replies to a Written Questionnaire from the Committee’, 27 October 2000, located at http://www.publications.parliament.uk/pa/cm199900/cmselect/cmhealth/882/88244.htm; ‘Table 4.8f: Major Projects – Comparison Between PFI Price and the Publicly Funded Option’, in Select Committee on Health, ‘Public Expenditure on Health and Personal Social Services 2001, Memorandum Received from the Department of Health containing Replies to a Written Questionnaire from the Committee’, 28 January 2002, located at http://www.publications.parliament.uk/pa/cm200102/cmselect/cmhealth/242/242m22.htm#a60; Table ‘5.4.7: Major Projects – Comparison Between PFI Price and the Publicly Funded Option’, in ‘Public Expenditure on Health and Personal Social Services 2002, Memorandum Received from the Department of Health containing Replies to a Written Questionnaire from the Committee’, 17 February 2003, located at http://www.publications.parliament.uk/pa/cm200102/cmselect/cmhealth/1210/1210m56.htm#a124; ‘Table 5.3.5: Major Projects – Comparison Between PFI Price and the Publicly Funded Option’, in ‘Public Expenditure on Health and Personal Social Services 2003, Memorandum Received from the Department of Health containing Replies to a Written Questionnaire from the Committee’, 5 January 2004, located at http://www.publications.parliament.uk/pa/cm200203/cmselect/cmhealth/1108/1108m66.htm; ‘Table 5.3.5: Major Projects – Comparison Between PFI Price and the Publicly Funded Option’, in ‘Public Expenditure on Health and Personal Social Services 2004, Memorandum Received from the Department of Health containing Replies to a Written Questionnaire from the Committee’, 13 October 2004, located at http://www.publications.parliament.uk/pa/cm200304/cmselect/cmhealth/1113/111333.htm; ‘Table 5.3.5: Major Projects – Comparison Between PFI Price and the Publicly Funded Option’, in ‘Public Expenditure on Health and Personal Social Services 2005’, 5 December 2005, located at http://www.publications.parliament.uk/pa/cm200506/cmselect/cmhealth/736/736we39.htm; ‘Table 2.3.3: Major Projects – Comparison Between the PFI Price and the Public Financed Option’, in ‘Public Expenditure on Health and Personal Social Services 2006, Memorandum Received from the Department of Health’, 26 October 2006, located at http://www.publications.parliament.uk/pa/cm200506/cmselect/cmhealth/1692-i/169210.htm. 89 Wayne Jensen, ‘Contracting Out Building Cleaning Services at the National Hospital of Denmark’ in Contracting Out Government Services, OECD Public Management Occasional Papers No 20, 1997.

Competitive Edge: The Evidence
143
90 Christine Hall and Simon Domberger, ‘Competitive Tendering for Domestic Services: A Comparative Study of Three Hospitals in NSW’, Graduate School of Business, University of Sydney, 1992.91 Simon Domberger, Christine Hall, Eric Ah Lik Li, ‘The Determinants of Price and Quality in Competitively Tendered Contracts’, The Economic Journal (1995) 105:433, pp1454-1470.92 Toni Ashton, Jacqueline Cumming and Janet McLean, Health Policy (2004) 69:1, pp21-31.93 Joan W Allen, ‘Use of the Private Sector in Corrections Service Delivery’, in Joan W Allen et al, The Private Sector in State Service Delivery: Examples of Innovative Practices, Washington, DC: The Urban Institute Press, 1989, pp13-44; Camile G Camp and George M Camp, ‘Private Sector Involvement in Prison Services and Operations’, Washington DC: National Institute of Corrections, 1984.94 Keon S. Chi, ‘Private Contractor Work Release Centers: The Illinois Experience’, Innovations, Lexington, KY: Council of State Governments, 1982.95 Douglas C McDonald, ‘The Costs of Operating Public and Private Correctional Facilities’, in Douglas C McDonald (ed), Private Prisons and the Public Interest, New Brunswick: Rutgers University Press, 1990, p88.96 US Department of Justice, National Institute of Corrections, ‘Private Sector Operation of a Correctional Institution: A Study of the Jack and Ruth Eckerd Youth Development Center, Okeechobee, Florida ‘ Washington DC: National Institute of Corrections, 1985.97 Robert B Levinson, ‘Okeechobee: An Evaluation of Privatization in Corrections’, The Prison Journal, (1985) 65, pp75-93, at p81.98 Charles H. Logan, Private Prisons: Cons & Pros, New York: Oxford University Press, 1990, pp90-92.99 Douglas C McDonald, ‘The Costs of Operating Public and Private Correctional Facilities’, in Douglas C McDonald (ed), Private Prisons and the Public Interest, New Brunswick: Rutgers University Press, 1990, p88.100 ‘Report on a Study of Issues Related to the Potential Operation of Private Prisons in Pennsylvania’, Pennsylvania Legislative Budget and Finance Committee, October 1985.101 Douglas C McDonald, ‘The Costs of Operating Public and Private Correctional Facilities’, in Douglas C McDonald (ed), Private Prisons and the Public Interest, New Brunswick: Rutgers University Press, 1990, p89.102 John D Donahue, ‘Prisons for Profit: Public Justice, Private Interests’, Washington, DC: Economic Policy Institute, 1988, located at http://www.epinet...org/studies/prisons-1988.pdf103 Douglas C McDonald, ‘The Costs of Operating Public and Private Correctional Facilities’, in Douglas C McDonald (ed), Private Prisons and the Public Interest, New Brunswick: Rutgers University Press, 1990, p89.104 Charles Logan and Bill W. McGriff, ‘Comparing Costs of Public and Private Prisons: A Case Study’, National Institute of Justice Reports, 216 (1989); Charles H. Logan, Private Prisons: Cons & Pros, New York: Oxford University Press, 1990, pp105-117. 105 Douglas C McDonald, ‘The Costs of Operating Public and Private Correctional Facilities’, in Douglas C McDonald (ed), Private Prisons and the Public Interest, New Brunswick: Rutgers University Press, 1990, pp86-106 at p91.106 Charles H Logan, Private Prisons: Cons and Pros, New York: Oxford University Press, 1990, pp105-117.107 Douglas C McDonald, ‘The Costs of Operating Public and Private Correctional Facilities’, in Douglas C McDonald (ed), Private Prisons and the Public Interest, New Brunswick: Rutgers University Press, 1990, pp89-91.108 Harry P Hatry, Paul J Brounstein and Robert B Levinson, ‘Comparison of Privately and Publicly Operated Corrections Facilities in Kentucky and Massachusetts’, in Gary W Bowman, Simon Hakim, and Paul Seidenstat, Privatizing Correctional Institutions, New Brunswick: Transaction Publishers, 1993, pp193-212. The original study is HP Hatry, PJ Brounstein, R Levinson, DM Altschuler, K Chi and P Rosenberg, ‘Comparison of Privately and Publicly Operated Corrections Facilities in Kentucky and Massachusetts’, Washington, DC: The Urban Institute, August 1989.109 Gerald G Gaes, Scott D Camp and William G Saylor, ‘The Performance of Privately Operated Prisons: A Review of Research’, 10 June 1998, p3, in Douglas McDonald et al, ‘Private Prisons in the United States: An Assessment of Current Practice’, Cambridge, Massachusetts: Abt Associates Inc, 16 July 1998.110 Gerald G Gaes, Scott D Camp and William G Saylor, ‘The Performance of Privately Operated Prisons: A Review of Research’, 10 June 1998, pp3-4, in Douglas McDonald et al, ‘Private Prisons in the United States: An Assessment of Current Practice’, Cambridge, Massachusetts: Abt Associates Inc, 16 July 1998.111 Geoffrey F Segal and Adrian T Moore, ‘Weighing the Watchmen: Evaluating the Costs and Benefits of Outsourcing Correctional Services. Part II: Reviewing the Literature on Cost and Quality Comparisons’, Los Angeles: Reason Public Policy Institute, January 2002.112 Martin P Sellers, ‘Private and Public Prisons: A Comparison of Costs, Programs and Facilities’, International Journal of Offender Therapy and Comparative Criminology, (1989) 33, pp241-256; Martin P Sellers, The History and Politics of Private Prisons: A Comparative Analysis, Rutherford: Fairleagh Dickinson University Press, 1993, Chapter 4.113 James Austin and Garry Coventry, ‘Emerging Issues on Privatized Prisons’, Washington: Bureau of Justice Assistance, NCJ 181249, February 2001, p25.114 Geoffrey F Segal and Adrian T Moore, ‘Weighing the Watchmen: Evaluating the Costs and Benefits of Outsourcing Correctional Services. Part II: Reviewing the Literature on Cost and Quality Comparisons’, Los Angeles: Reason Public Policy Institute, January 2002.115 Douglas C McDonald, ‘The Costs of Operating Public and Private Correctional Facilities’, in Douglas C McDonald (ed), Private Prisons and the Public Interest, New Brunswick: Rutgers University Press, 1990, pp86-106 at pp92-96.116 Douglas C McDonald, ‘The Costs of Operating Public and Private Correctional Facilities’, in Douglas C McDonald (eD), Private Prisons and the Public Interest, New Brunswick: Rutgers University Press, 1990, p98.117 Texas Sunset Advisory Commission, ‘Contracts for Correctional Facilities and Services’, A Staff Report to the Sunset Advisory Commission, December 1990; John Sharp, Texas Comptroller of Public Accounts, ‘Breaking the Mold: New Ways to Govern Texas’, Texas Performance Review, July 1991, Volume 2, PS4, located at http://www.window.state.tx.us/tpr/btm/btm/btmhome.html118 United States General Accounting Office, ‘Private and Public Prisons: Studies Comparing Operational Costs and/or Quality of Service’, GAO/GGD-96-158, August 1996, p27.119 GAO, ‘Private and Public Prisons: Studies Comparing Operational Costs and/or Quality of Service’, 1996, p27.

Competitive Edge: The Evidence
144
120 Julianne Nelson, ‘Comparing Public and Private Prison Costs’, p16, Appendix 1 in Douglas McDonald et al, ‘Private Prisons in the United States: An Assessment of Current Practice’, Cambridge, Massachusetts: Abt Associates Inc, 16 July 1998; Douglas McDonald et al, ‘Private Prisons in the United States: Tables’, Cambridge, Massachusetts: Abt Associates Inc, 16 July 1998.121 Dale K Sechrest and David Shichor, ‘Comparing public and private correctional facilities in California: an exploratory study’, in G Mays, Larry, and T Gray (eds), Privatization and the Provision of Correctional Services: Context and Consequences. Anderson Publishing Company, 1996. See also Dale K Sechrest and David Schichor, ‘Corrections Goes Public (and Private) in California’, Federal Probation (1993) 57:3, pp3-8.122 United States General Accounting Office, ‘Private and Public Prisons: Studies Comparing Operational Costs and/or Quality of Service’, GAO/GGD-96-158, August 1996, pp24 & 30.123 Geoffrey F Segal and Adrian T Moore, ‘Weighing the Watchmen: Evaluating the Costs and Benefits of Outsourcing Correctional Services. Part II: Reviewing the Literature on Cost and Quality Comparisons’, Los Angeles: Reason Public Policy Institute, January 2002.124 Gerald G Gaes, Scott D Camp and William G Saylor, ‘The Performance of Privately Operated Prisons: A Review of Research’, 10 June 1998, p6, in Douglas McDonald et al, ‘Private Prisons in the United States: An Assessment of Current Practice’, Cambridge, Massachusetts: Abt Associates Inc, 16 July 1998.125 State of Tennessee Legislative Fiscal Review Committee, ‘Cost Comparison of Correctional Centers’, Nashville, TN, 1995.126 Select Oversight Committee on Corrections, ‘Comparative Evaluation of Privately-managed CCA Prison and State-managed Prototypical Prisons’, State of Tennessee, 1 February 1995.127 Julianne Nelson, ‘Comparing Public and Private Prison Costs’, pp5-8, Appendix 1 in Douglas McDonald et al, ‘Private Prisons in the United States: An Assessment of Current Practice’, Cambridge, Massachusetts: Abt Associates Inc, 16 July 1998; Douglas McDonald et al, ‘Private Prisons in the United States: Tables’, Cambridge, Massachusetts: Abt Associates Inc, 16 July 1998.128 United States General Accounting Office, ‘Private and Public Prisons: Studies Comparing Operational Costs and/or Quality of Service’, GAO/GGD-96-158, August 1996, pp31-32.129 Scott D Camp and Gerald G Gaes, ‘Private Adult prisons: What Do We Really Know and Why Don’t We Know More?’, in David Shichor and Michael J Gilbert (eds), Privatization in Criminal Justice, Cincinnati, OH: Anderson Publishing Co, 2001, pp283-298, at p285.130 Simon T Tidd, ‘Comparative Evaluation of the Performance of Institutions Managed by Corrections Corporation of America & Tennessee Department of Corrections’, Staff Report to the Select Oversight Committee on Corrections, 14 January 2005.131 Office of Program Policy Analysis and Government Accountability, ‘Review of Correctional Privatization’, Report No 95-12, State of Florida, 13 November 1995, located at http://www.oppaga.state.fl.us/reports/pdf/9512rpt.pdf.132 Geoffrey F Segal and Adrian T Moore, ‘Weighing the Watchmen: Evaluating the Costs and Benefits of Outsourcing Correctional Services. Part II: Reviewing the Literature on Cost and Quality Comparisons’, Los Angeles: Reason Public Policy Institute, January 2002.133 Office of Program Policy Analysis and Government Accountability, ‘Performance Audit of the Gadsden Correctional Institution’, Report No 95-48, The Florida Legislature, 1 April 1996, located at http://www.oppaga.state.fl.us/reports/pdf/9548rpt.pdf 134 Legislative Budget Committee, ‘Department of Corrections Privatization Feasibility Study’, Report 96-2, State of Washington, 19 January 1996, located at http://www1.leg.wa.gov/reports/96-2.pdf 135 Legislative Budget Committee, ‘Department of Corrections Privatization Feasibility Study’, Report 96-2, State of Washington, 19 January 1996, pp16-17.136 Legislative Budget Committee, ‘Department of Corrections Privatization Feasibility Study’, Report 96-2, State of Washington, 19 January 1996, p13.137 United States General Accounting Office, ‘Private and Public Prisons: Studies Comparing Operational Costs and/or Quality of Service’, GAO/GGD-96-158, August 1996, p33.138 United States General Accounting Office, ‘Private and Public Prisons: Studies Comparing Operational Costs and/or Quality of Service’, GAO/GGD-96-158, August 1996, p33.139 George Mitchell, ‘Controlling Prison Costs in Wisconsin’, Wisconsin Policy Research Institute Report (1996) 9:10, pp24-28 located at http://www.wpri.org/Reports/Volume9/Vol9no10.pdf 140 Geoffrey F Segal and Adrian T Moore, ‘Weighing the Watchmen: Evaluating the Costs and Benefits of Outsourcing Correctional Services. Part II: Reviewing the Literature on Cost and Quality Comparisons’, Los Angeles: Reason Public Policy Institute, January 2002.141 William G Archambeault, and Donald R Deis, Jr, ‘Cost Effectiveness Comparison of Private vs Public Prisons in Louisiana: A Comprehensive Analysis of Allen, Avoyelles, and Winn Correctional Centers’, Baton Rouge: Department of Accounting, Louisiana State University, 15 October 1996; William G Archambeault and Donald R Deis, Jr, ‘Cost Effectiveness Comparisons of Private versus Public Prisons in Louisiana: A Comprehensive Analysis of Allen, Avoyelles, and Winn Correctional Centers’, Journal of the Oklahoma Criminal Justice Research Consortium, (1997-98) 4.142 Geoffrey F Segal and Adrian T Moore, ‘Weighing the Watchmen: Evaluating the Costs and Benefits of Outsourcing Correctional Services. Part II: Reviewing the Literature on Cost and Quality Comparisons’, Los Angeles: Reason Public Policy Institute, January 2002.143 Julianne Nelson, ‘Comparing Public and Private Prison Costs’, pp8-13, Appendix 1 in Douglas McDonald et al, ‘Private Prisons in the United States: An Assessment of Current Practice’, Cambridge, Massachusetts: Abt Associates Inc, 16 July 1998; Douglas McDonald et al, ‘Private Prisons in the United States: Tables’, Cambridge, Massachusetts: Abt Associates Inc, 16 July 1998.144 Harley G Lappin et al, ‘Evaluation of the Taft Demonstration Project: Performance of a Private-Sector Prison and the BOP’, Washington, DC: Federal Bureau of Prisons, 7 October 2005, p14.145 Scott D Camp and Gerald G Gaes, ‘Private Adult prisons: What Do We Really Know and Why Don’t We Know More?’, in David Shichor and Michael J Gilbert (eds), Privatization in Criminal Justice, Cincinnati, OH: Anderson Publishing Co, 2001,

Competitive Edge: The Evidence
145
pp283-298, at p287.146 Charles W Thomas, ‘Comparing the Costs and Performance of Public and Private Prisons in Arizona’, Arizona Joint Legislative Committee, August 1997. The full study is no longer available through the University of Florida, the Arizona Legislature or the Arizona Department of Corrections, and we have been forced to rely on Thomas’s overview and various summaries.147 Geoffrey F Segal and Adrian T Moore, ‘Weighing the Watchmen: Evaluating the Costs and Benefits of Outsourcing Correctional Services. Part II: Reviewing the Literature on Cost and Quality Comparisons’, Los Angeles: Reason Public Policy Institute, January 2002.148 Gerald G Gaes, Scott D Camp and William G Saylor, ‘The Performance of Privately Operated Prisons: A Review of Research’, 10 June 1998, pp14 & 17, in Douglas McDonald et al, ‘Private Prisons in the United States: An Assessment of Current Practice’, Cambridge, Massachusetts: Abt Associates Inc, 16 July 1998.149 James Austin and Garry Coventry, ‘Emerging Issues on Privatized Prisons’, Washington: Bureau of Justice Assistance, NCJ 181249, February 2001, p28.150 Scott D Camp and Gerald G Gaes, ‘Private Adult prisons: What Do We Really Know and Why Don’t We Know More?’, in David Shichor and Michael J Gilbert (eds.), Privatization in Criminal Justice, Cincinnati, OH: Anderson Publishing Co, 2001, pp283-298, at p287.151 Richard Harding, ‘Private Prisons’, Crime and Justice (2001) 28, pp265-346 at p326.152 On the furore over Thomas and its relevance to a different study, see Gilbert Geis, Alan Mobley and David Shichor, ‘Private Prisons, Criminological Research, and Conflict of Interest: A Case Study’, Crime & Delinquency (1999) 45:3, pp372-388. On the rather vigorous rebuttal which called into question the critics’ own professionalism, see Lonn Lanza-Kaduce, Karen F Parker and Charles W Thomas, ‘The Devil in the Details: The Case Against the Case Study of Private Prisons, Criminological Research, and Conflict of Interest’, Crime & Delinquency (2000) 46:1, pp92-136.153 Office of Program Policy Analysis and Government Accountability, ‘Review of Bay Correctional Facility and Moore Haven Correctional Facility’, Report No 97-68, The Florida Legislature, April 1998, located at http://www.oppaga.state.fl.us/reports/pdf/9768rpt.pdf 154 Julianne Nelson, ‘Comparing Public and Private Prison Costs’, pp13-15, Appendix 1 in Douglas McDonald et al, ‘Private Prisons in the United States: An Assessment of Current Practice’, Cambridge, Massachusetts: Abt Associates Inc, 16 July 1998.155 Travis C Pratt and Melissa R Winston, ‘The Search for the Frugal Grail: An Empirical Assessment of the Cost-Effectiveness of Public Versus Private Correctional Facilities’, Criminal Justice Policy Review (1999) 10, pp447-471.156 Travis C Pratt and Jeff Maahs, ‘Are Private Prisons More Cost-Effective Than Public Prisons? A Meta-Analysis of Evaluation Research Studies’, Crime & Delinquency, (1999) 43:3, pp358-371.157 Gerald G Gaes et al, Measuring Prison Performance, Walnut Creek: AltaMira Press, 2004, pp103-104.158 Julianne Nelson, ‘Taft Prison Facility: Cost Scenarios’, 9 November 1999, located at www.nicic.org/pubs/1999/015712.pdf 159 Douglas C McDonald and Kenneth Carlson, ‘Contracting for Imprisonment in the Federal Prison System: Cost and Performance of the Privately Operated Taft Correctional Institution’, Cambridge, MA: Abt Associates Inc, 1 October 2005, pp18-20.160 Office of Program Policy Analysis and Government Accountability, ‘Lake City Correctional Facility Experienced Start-Up Problems, But It Has Improved’, Report No 99-33, OPPAGA Private Prison Review, February 2000, located at http://www.oppaga.state.fl.us/reports/pdf/9933rpt.pdf 161 Office of Program Policy Analysis and Government Accountability, ‘South Bay Correctional Facility Provides Savings and Success; Room for Improvement’, Report No 99-39, OPPAGA Private Prison Review, March 2000 located at http://www.oppaga.state.fl.us/reports/pdf/9939rpt.pdf 162 Geoffrey F Segal and Adrian T Moore, ‘Weighing the Watchmen: Evaluating the Costs and Benefits of Outsourcing Correctional Services. Part II: Reviewing the Literature on Cost and Quality Comparisons’, Los Angeles: Reason Public Policy Institute, January 2002.163 Arizona Department of Corrections, ‘Public-Private Prison Comparison’, Phoenix, AZ, October 2000.164 Arizona Department of Corrections, ‘Public-Private Prison Comparison’, 12 September 2000.165 Office of the Auditor General, ‘Performance Audit: Arizona Department of Corrections. Private Prisons’, Report No 01-13, State of Arizona, July 2001, p12.166 Geoffrey F Segal and Adrian T Moore, ‘Weighing the Watchmen: Evaluating the Costs and Benefits of Outsourcing Correctional Services. Part II: Reviewing the Literature on Cost and Quality Comparisons’, Los Angeles: Reason Public Policy Institute, January 2002.167 Criminal Justice Policy Council, ‘Texas Correctional Costs, 1987-1988’, Austin, Texas: October 1988; ‘Texas Correctional Costs, 1989-1990’, Austin, Texas: January 1991; ‘Texas Correctional Costs Per Day, 1991-1992, Austin, Texas: n.D; ‘Texas Correctional Costs Per Day, 1993-1994’, Austin, Texas: February 1995; ‘Apples to Apples: Comparing the Operational Costs of Juvenile and Adult Correctional Programs in Texas’, Austin, Texas: January 1997; ‘Oranges to Oranges: Comparing the Operational Costs of Juvenile and Adult Correctional Programs in Texas’, Austin, Texas: n.d. (c.January 1999); ‘Limes to Limes: Comparing the Operational Costs of Juvenile and Adult Correctional Programs in Texas’, Austin, Texas: n.d. (c.2001); ‘Mangos to Mangos: Comparing the Operational Costs of Juvenile and Adult Correctional Programs in Texas’, Austin, Texas: n.d., (c.2003).168 Criminal Justice Policy Council, ‘Apples to Apples: Comparing the Operational Costs of Juvenile and Adult Correctional Programs in Texas’, Austin, Texas: January 1997, p53.169 See John Sharp, Texas Comptroller of Public Accounts, ‘Breaking the Mold: New Ways to Govern Texas’, Texas Performance Review, July 1991, Volume 2, PS4, located at http://www.window.state.tx.us/tpr/btm/btm/btmhome.html.170 Lattimore Black Morgan & Cain, Brentwood, TN ‘To Management, Corrections Corporation of America’, 1 March 2003.171 Matthew Mitchell, ‘The Pros of Privately-Housed Cons: New Evidence on the Cost Savings of Private Prisons’, Tijeras: New Mexico: Rio Grande Foundation, March 2003 located at http://www.correctionscorp.com/overview/prison_study_march18.pdf 172 James F Blumstein and Mark A Cohen, ‘The Interrelationship Between Public and Private Prisons’, Washington, DC:
Competitive Edge: The Evidence
146
Association of Private Correctional and Treatment Organizations, April 2003, located at http://www.apcto.org/logos/Study.pdf 173 Harley G Lappin et al, ‘Evaluation of the Taft Demonstration Project: Performance of a Private-Sector Prison and the BOP’, Washington, DC: Federal Bureau of Prisons, 7 October 2005, p8.174 Douglas McDonald and Carl Patten, Jr, ‘Governments’ Management of Private Prisons’, Cambridge, MA: Abt Associates, Inc, 15 September 2003, located at http://www.ncjrs.gov/pdffiles1/nij/grants/203968.pdf 175 Douglas McDonald and Carl Patten, Jr, ‘Governments’ Management of Private Prisons’, Cambridge, MA: Abt Associates, Inc, 15 September 2003, pp7 & 9.176 Patrick Bayer and David E Pozen, ‘The Effectiveness of Juvenile Correctional Facilities: Public versus Private Management’, Journal of Law and Economics (2005) 48, pp549-589 [Final Draft (September 2004): http://www.econ.duke.edu/~pb29/JuvCorrFac-Final.pdf ]177 Douglas C McDonald and Kenneth Carlson, ‘Contracting for Imprisonment in the Federal Prison System: Cost and Performance of the Privately Operated Taft Correctional Institution’, Cambridge, MA: Abt Associates Inc, 1 October 2005, located at http://www.ncjrs.gov/pdffiles1/nij/grants/211990.pdf 178 Harley G Lappin et al, ‘Evaluation of the Taft Demonstration Project: Performance of a Private-Sector Prison and the BOP’, Washington, DC: Federal Bureau of Prisons, 7 October 2005, pp9-12.179 Julianne Nelson, ‘Competition in Corrections: Comparing Public and Private Sector Operations’, Revised Version, Alexandria, VA: The CNA Corporation, December 2005, located at http://www.bop.gov/news/research_projects/published_reports/pub_vs_priv/cnanelson.pdf 180 Harley G Lappin et al, ‘Evaluation of the Taft Demonstration Project: Performance of a Private-Sector Prison and the BOP’, Washington, DC: Federal Bureau of Prisons, 7 October 2005.181 Julianne Nelson, ‘Competition in Corrections: Comparing Public and Private Sector Operations’, Revised Version, Alexandria, VA: The CNA Corporation, December 2005, p8.182 Julianne Nelson, ‘Competition in Corrections: Comparing Public and Private Sector Operations’, Revised Version, Alexandria, VA: The CNA Corporation, December 2005, p63.183 Auditor of Public Accounts, ‘Assessment of Kentucky’s Privatization Efforts: Performance Audit’, Frankfort, KY, October 2006.184 Arizona Department of Corrections, ‘Operating Per Capita Cost Report for Appropriated Funds, Fiscal Year 2003’, 17 March 2005; Arizona Department of Corrections, ‘Operating Per Capita Cost Report for Appropriated Funds, Fiscal Year 2004’, 1 April 2005; Maximus, ‘Arizona Department of Corrections, Operating Per Capita Cost Report, Fiscal Year 2005’, Phoenix, AZ, 2007.185 Maximus Inc, ‘Report on the Evaluation of Arizona Department of Corrections’ Operating Cost Per Capita Cost Report and Private Prison Cost Model’, Phoenix, AZ, February 2006; Maximus Inc, ‘Arizona Department of Corrections State versus Private Prison FY 2005 Cost Comparison’, Phoenix, AZ, 2007. 186 See, for example, Geoffrey Segal, ‘Comparing the Performance pf Private and Public Prisons: If you can’t win, change the rules’, Reason Foundation, 4 April 2006, at http://www.reason.org/corrections/index.shtml 187 National Audit Office, ‘The PFI Contracts for Bridgend and Fazakerley Prisons’, HC253 Session 1997-98, London: The Stationery Office, 31 October 1997.188 National Audit Office, ‘The Operational Performance of PFI Prisons’, HC700 Session 2002-2003, London: The Stationery Office, 18 June 2003.189 National Audit Office, ‘Control of Prison Building Projects’, HC 595, London: HMSO, 20 July 1994, p12.190 National Audit Office, ‘The Refinancing of the Fazakerley PFI Prison Contract’, HC584 Session 1999-2000, London: The Stationery Office, 29 June 2000.191 Coopers and Lybrand, ‘Review of Comparative Costs and Performance of Privately and Publicly Operated Prisons’, London: HM Prison Service, June 1996; Isabelle Park, ‘Review of Comparative Costs and Performance of Privately and Publicly Operated Prisons, 1998-99’, Home Office Statistical Bulletin, Issue 6/00, London: Home Office, 23 March 2000, located at http://www.homeoffice.gov.uk/rds/pdfs/hosb600.pdf 192 Isabelle Park, ‘Review of Comparative Costs and Performance of Privately and Publicly Operated Prisons 1998-99’, Home Office Statistical Bulletin 6/00, London: Home Office, 23 March 2000, Annexes C & E. 193 Richard Harding, ‘Private Prisons’, Crime and Justice (2001) 28, pp265-346 at p285.194 Public Accounts Committee, ‘The Refinancing of the Fazakerley PFI Prison Contract’, Thirteenth Report Session 2000-01, House of Commons, 26 March 2001, Appendix 1: Supplementary Memorandum by HM Prison Service, Annex 1, Table A.195 PricewaterhouseCoopers, ‘Financial Review of Scottish Prison Service Estates Review’, MS Copy, 2002, pp26-27.196 Monte Wynder, ‘The Pros of Private Prisons’, Australian Accountant (1993) 63:10, pp19-22. See also Monte B Wynder, ‘Privatising Prisons: An Economic Perspective’, Thesis submitted to the Department of Commerce, University of Queensland, in partial fulfilment of the requirements for the Degree of Bachelor of Commerce with Honours, 15 November 1992.197 Stan Macionis, ‘Contract Management in Corrections: The Queensland Experience’, in Paul Moyle (ed), Private Prisons and Police: Recent Australian Trends, Leichhardt, NSW: Pluto Press, 1994, pp179-193.198 Allan Brown, ‘Economic Aspects of Prison Privatization: The Queensland Experience’, in David Biles and Julia Vernon (eds), Private Sector and Community Involvement in the Criminal Justice System’, Canberra: Australian Institute of Criminology, 1994, pp103-117; Allan Brown, ‘Economic and Quantitative Aspects of Prison Privatisation in Queensland’, in Paul Moyle (ed), Private Prisons and Police: Recent Australian Trends, Leichhardt, NSW: Pluto Press, 1994, pp194-218. 199 Auditor-General, Auditor-General’s Annual Report to Parliament 1999, Sydney: Legislative Assembly of New South Wales, Volume 2, p101; Auditor-General, Auditor-General’s Annual Report to Parliament 2000, Sydney: Legislative Assembly of New South Wales, Volume 5, pp95-96; Auditor-General, Auditor-General’s Annual Report to Parliament 2001, Sydney: Legislative Assembly of New South Wales, Volume 7, p134; Auditor-General, Auditor-General’s Annual Report to Parliament 2002, Sydney: Legislative Assembly of New South Wales, Volume 6, p125; Auditor-General, Auditor-General’s Annual Report to Parliament 2003, Sydney: Legislative Assembly of New South Wales, Volume 6, pp340-341; Auditor-General, Auditor-General’s Annual Report to Parliament 2004, Sydney: Legislative Assembly of New South Wales, Volume 4, p240.

Competitive Edge: The Evidence
147
200 On the inclusion of overheads and the likelihood that health costs were not included in the costing of public prisons, see Public Accounts Committee, ‘Value for Money from NSW Correctional Centres’, Report No 13/53 (No 156), Sydney: Legislative Assembly of New South Wales, September 2005, pp24-25.201 Public Accounts Committee, ‘Value for Money from NSW Correctional Centres’, Report No 13/53 (No 156), Sydney: Legislative Assembly of New South Wales, September 2005, located at http://www.parliament.nsw.gov.au/prod/parlment/committee.nsf/0/80f365e089726b75ca25708300191671/$FILE/Value%20for%20Money%20from%20NSW%20Correctional%20Centres%20Report.pdf 202 Ministère de la Justice, ‘Rapport Annuel sur le fonctionnement des établissements du Programme 13000, Année 1996’, Paris, August 1998, located at http://lesrapports.ladocumentationfrancaise.fr/BRP/004001262/0000.pdf 203 Werner Z. Hirsch, ‘Cost functions of an Urban Government Service: Refuse Collection’, The Review of Economics and Statistics (1965) 47:1, pp87-92204 William Pier, Robert Vernon and John Wicks, ‘An Empirical Comparison of Government and Private Production Efficiency’, National Tax Journal (1974) 27, pp653-656.205 For a detailed explanation of these critiques, see: Werner W. Pommerehne and Bruno S. Frey, ‘Public versus Private Production Efficiency in Switzerland: A Theoretical and Empirical Comparison’, Urban Affairs Annual Review (1977) 12, pp228-229.206 ES Savas, ‘Policy Analysis for Local Government: Public vs. Private Refuse Collection’, Policy Analysis (1977) 3:1, pp49-74.207 ES Savas, ‘An empirical study of competition in municipal service delivery’, Public Administration Review (1977) 36:6, pp717-724.208 See David N Ammons and Debra J. Hill, ‘The Viability of Public-Private Competition as a Long-Term Service Delivery Strategy’, Public Productivity and Management Review (1995) 19:1, pp12-24.209 William M Petrovic and Bruce L Jaffee, ‘The Use of Contracts and Alternative Financing Methods in the Collection of Household Refuse in Urban Areas’, Public Productivity Review (1978) 3:2, pp48-60.210 Barbara J Stevens, ‘Scale, Market Structure and the Cost of Refuse Collection’, Review of Economics and Statistics (1978) 60, pp438-448.211 Franklin R Edwards and Barbara J Stevens, ‘The Provision of Municipal Sanitation Services by Private Firms: An Empirical Analysis of the Efficiency of Alternative Market Structures and Institutional Arrangements’, The Journal of Industrial Economics (1978) 27:2, pp133-147.212 James T Bennett and Manuel H Johnson, ‘Public versus private provision of collective goods and services: garbage collection revisited’, Public Choice (1979) 34, pp55-63.213 ES Savas, ‘Intracity Competition between Public and Private Service Delivery’, Public Administration Review (1981) 41:1pp46-52.214 Jeffrey A Dubin and Peter Navarro, ‘How Markets for Impure Public Goods Organize: The Case of Household Refuse Collection’, Journal of Law, Economics and Organization (1988) 4:2, pp217-241.215 These data were first collected and analysed in ES Savas, ‘Policy Analysis for Local Government: Public vs. Private Refuse Collection’, Policy Analysis (1777) 3:1, pp49-74.216 David N Ammons and Debra J. Hill, ‘The Viability of Public-Private Competition as a Long-Term Service Delivery Strategy’, Public Productivity and Management Review (1995) 19:1, pp12-24.217 James C Mc David, ‘The Canadian Experience with Privatizing Residential Solid Waste Collection Services’, Public Administration Review (1985) 45:5, pp602-608.218 The studies used as informal US comparators were E.S. Savas, ‘An empirical study of competition in municipal service delivery’, Public Administration Review, (1977) 36:6, pp717-724; and ES Savas, ‘Intracity Competition between Public and Private Service Delivery’, Public Administration Review (1981) 41:1, pp46-52.219 James C McDavid and Gregory K Schick, ‘Privatisation versus union-management co-operation: the effects of competition on service efficiency in municipalities’, Canadian Public Administration (1987) 30:3, pp472-488.220 Douglas K. Adie and James C McDavid, ‘The Cost and Production of a Solid Waste Disposal Service’, in Paul Seidenstat (ed), Contracting Out Government Services, Westport: Greenwood, 1999, Chapter 11.221 James C McDavid, ‘Alternative Service Delivery in Canadian Local Governments: The Costs of Producing Solid Waste Management Services’, Canadian Journal of Regional Science, Spring 2000, pp157-174.222 James C McDavid, ‘Solid-waste contracting-out, competition and bidding practices among Canadian local governments’, Canadian Public Administration, (2001) 44:1, pp1-25.223 Audit Commission, Securing Further Improvements in Refuse Collection, London: HMSO, 1984.224 Mitch Gears, ‘Efficient Refuse Collection’, Contract Services, November/December 1984, pp13-16.225 Simon Domberger, Shirley Meadowcroft and David Thompson, ‘Competitive Tendering and Efficiency: The Case of Refuse Collection’, Fiscal Studies (1986) 7:4, pp69-87.226 John Cubbin, Simon Domberger and Shirley Meadowcroft, ‘Competitive Tendering and Refuse Collection: Identifying the Sources of Efficiency Gains’, Fiscal Studies (1987) 8:3, pp49-58.227 Simon Domberger, Shirley Meadowcroft and David Thompson, ‘Competitive Tendering and Efficiency: The Case of Refuse Collection’, Fiscal Studies (1986) 7:4 pp69-87.228 Joe Ganley and John Grahl, ‘Competition and Efficiency in Refuse Collection: A Critical Comment’, Fiscal Studies (1988) 9:1 pp80-85.229 Simon Domberger, Shirley Meadowcroft and David Thompson, ‘Competition and Efficiency in Refuse Collection: A Reply’ Fiscal Studies (1988) 9:1, pp86-90.230 Stefan Szymanski and Sean Wilkins, ‘Cheap Rubbish? Competitive Tendering and Contracting Out in Refuse Collection 1981-8’, Fiscal Studies, (1993) 14:3, pp109-130.231 David Chaundy and Matthew Uttley, ‘The Economics of Compulsory Competitive Tendering: Issues, Evidence and the Case of Municipal Refuse Collection’, Public Policy and Administration (1993) 8:2, pp25-41.232 Stefan Szymanski, ‘Competitive Tendering and Refuse Collection – the 20% solution’, CDC Research, 1994.

Competitive Edge: The Evidence
148
233 Stefan Szymanski, ‘The Impact of Compulsory Competitive Tendering on Refuse Collection Services’, Fiscal Studies (1996) 17:3, pp1-19.234 Hakeem Bello and Stefan Szymanski, ‘Compulsory Competitive Tendering for Public Services in the UK: The Case of Refuse Collection’, Journal of Business Finance and Accounting (1996) 23:5-6, pp881-903.235 Bello and Szymanski (1996), p 898.236 Andrés Gómez-Lobo and Stefan Szymanski, ‘A Law of Large Numbers: Bidding and Compulsory Competitive Tendering for Refuse Collection Contracts’, Review of Industrial Organisation (2001) 18, pp105-113.237 Eoin Reeves and Michael Barrow, ‘The Impact of Contracting Out on the Costs of Refuse Collection Services: The Case of Ireland’, Economic and Social Review (2000) 31:2, pp129-150.238 E Dijkgraaf and RHJM Gradus, ‘Cost-Savings of Contracting Out Refuse Collection’, Empirica (2003) 30, pp149-161.239 Núria Bosch, Francisco Pedraja and Javier Suárez-Pandiello, ‘Measuring the Efficiency of Spanish Municipal Refuse Collection Services’, Local Government Studies (2000) 26:3, pp71-90.240 Germà Bel and Antón Costas, ‘Do Public Sector Reforms Get Rusty? Local Privatisation in Spain’, Journal of Policy Reform (2006) 9:1, pp1-24.241 Henry Ohlsson, ‘Ownership and Production Costs: Choosing between Public Production and Contracting Out in the Case of Swedish Refuse Collection’, Fiscal Studies (2003) 24:4, pp451-476.242 Werner W Pommerehne and Bruno S Frey, ‘Public versus Private Production Efficiency in Switzerland: A Theoretical and Empirical Comparison’, Urban Affairs Annual Review (1977) 12, pp221-241.243 Robert T Deacon, ‘The Expenditure Effects of Alternative Public Supply Institutions’, Public Choice (1979) 34, pp381-397.244 See Gary Miller, Cities by Contract: The Politics of Municipal Incorporation, Cambridge, Massachusetts: MIT Press, 1981, pp22-26.245 Barbara Stevens (ed), Delivering Municipal Services Efficiently: A Comparison of Municipal and Private Service Delivery, 1984, report prepared by Ecodata Inc for US Department of Housing and Urban Development. These results were also reported in Eileen Berenyi and Barbara Stevens, ‘Does Privatization Work? A Study of the Delivery of Eight Local Services’, State and Local Government Review (1988) 20:1, pp11-20.246 James M Ferris, ‘The Public Spending and Employment Effects of Local Service Contracting’, National Tax Journal (1988) 41:2, pp209-217, can be found at: http://ntj.tax.org/wwtax/ntjrec.nsf/254EF27BC68EE3498525686C00686D92/$FILE/v41n2209.pdf 247 Janet R Pack, ‘Privatization and Cost Reduction’, Policy Sciences (1989) 22, pp1-25.248 Robert M Stein, ‘The Budgetary Effects of Municipal Service Contracting: A Principal-Agent Explanation’, American Journal of Political Science (1990) 34: 2, pp471-502.249 Dolores T Martin, Robert M and Stein, ‘An Empirical Analysis of Contracting Out Local Government Services’, in G Bowman, S Hakim and P Seidenstat (eds), Privatizing the United States Justice System, Jefferson, N.C: McFarland Publishing, 1992, Chapter 7.250 Rowan Miranda, ‘Privatization and the Budget Maximizing Bureaucrat’, Public Productivity & Management Review (1994), 17:4, pp355-369.251 Jeffrey, D Greene, ‘Does Privatization Make A Difference? The Impact of Private Contracting on Municipal Efficiency’, International Journal of Public Administration (1994) 17(7), pp1299-1325.252 Rowan Miranda, and Allan Lerner, ‘Bureaucracy, Organizational Redundancy and the Privatization of Public Services’, Public Administration Review (1995), 55:2, pp193-200.253 Robert Jay Dilger, Randolph R Moffett and Linda Struyk, Privatization of Municipal Services in America’s Largest Cities, Public Administration Review (1997), 57:1, pp21-26254 Robert T Kleiman, and Anandi T Sahu, ‘Privatization as a Viable Alternative for Local Governments: The Case Study of a Failed Michigan Town’, in Paul Seidenstat (ed), Contracting Out Government Services, Westport: Praeger Publishers, 1999, Chapter 10.255 Jack Sterling, ‘Competition Between Public Agencies and Private Vendors: Vehicle Maintenance Services in Greeley’, in Paul Seidenstat (ed), Contracting Out Government Services, Westport: Praeger Publishers, 1999, Chapter 16.256 Mildred Warner and Amir Hefetz, ‘Applying Market Solutions to Public Services: An Assessment of Efficiency, Equity and Voice’, Urban Affairs Review (2002), 38:1, pp70-89, located at: http://government.cce.cornell.edu/doc/pdf/WarnerHefetz2002UrbanAffairsReview.pdf.257 Hee Soun Jang, ‘Contracting out Local Government Services to Non-Profit Organizations’, 2006, PhD Thesis, Askew School of Public Administration and Public Policy, Florida State University, located at: http://etd.lib.fsu.edu/theses/available/etd-03282006-154304/unrestricted/HeeSounJangdissertation_new.pdf 258 Hee Soun Jang, ‘Contracting Out Parks and Reacreation Services: Correcting for Selection Bias Using a Heckman Selection Model’, International Journal of Public Administration (2006) 29, pp799-818, located at: http://www.fsu.edu/~localgov/publication_files/Jang_IJPA.pdf 259 K Hartley, and M Huby, ‘Contracting-Out in Health and Local Authorities: Prospects, Progress and Pitfalls’, 1985, Public Money, September issue, pp23-26. A slightly different version of the report is available as: ‘Contracting-Out Policy: Theory and Evidence’, Oxford University Press, David ch15 of Privatisation and Regulation - The UK Experience, John Kay, Colin Mayer and David Thompson (eds).260 George Boyne, Public Choice Theory and Local Government: A Comparative Analysis of the UK and USA, London: Macmillan, 1998, p139.261 Audit Commission, ‘Competitiveness and Contracting Out of Local Authorities’ Services’, 1987, Occasional Papers No 3.262 Kate Ascher, ‘Contracting Out in Local Authorities,’ The Politics of Privatisation: Contracting Out Public Services, Basingstoke: Macmillan Education, 1987, chapter 7. 263 Kieron Walsh, Competitive Tendering for Local Authority Services: Initial Experiences, report prepared by Institute of Local Government Studies, University of Birmingham, for Department of the Environment, London: HMSO, 1991.264 Kieron Walsh and Howard Davis, Competition and Service: The Impact of the Local Government Act 1988, report prepared by Institute of Local Government Studies, University of Birmingham, for Department of the Environment, London: HMSO, 1993.
Competitive Edge: The Evidence
149
265 Austin Mayhead & Co Ltd, CCT and Local Authority Blue-Collar Services, report prepared for Local Government Research Programme, Department of the Environment, London: HMSO, 1997266 Robert McMaster, ‘Competitive Tendering in UK Health and Local Authorities: What Happens to the Quality of Services?’, Scottish Journal of Political Economy, (1985), 42:4, pp409-427267 Robert McMaster, ‘A Non-Parametric Approach to Identifying the Sources of Cost Savings Arising from Competitive Tendering’, Applied Economics Letters (1996) 3, pp463-466.268 Colin Knox and William Young, ‘Compulsory Competitive Tendering in Northern Ireland Local Government: The End of Round One’, Local Government Studies (1995), 21:4, pp591-606. 269 Chartered Institute of Public Finance and Accountancy, ‘Achieving Value for Money Through Competition: CCT/Market Testing in Northern Ireland – Case Studies and Survey Analysis’, 1996270 Stephen Cope, ‘Contracting-Out in Local Government: Cutting by Privatising’,Public Policy and Administration (1995), 10:3, pp29-44. 271 Ian Kavanagh and David Parker, ‘Contracting Out of Local Government Services in the UK: A Case Study in Transaction Costs’, Aston Business School, Aston University, Birmingham, (April 2000), Research Paper No 9. 272 Jens Blom-Hansen, ‘Is Private Delivery of Public Services Really Cheaper? Evidence from Public Road Maintenance in Denmark’, Public Choice (2003) 115, pp419-438.273 Henrik Christoffersen, Martin Paldam, and Allan Wurtz, ‘Public Versus Private Production and Economies of Scale’, Public Choice (2007) 130, pp311-328.274 Evatt Research Centre, Breach of Contract: Privatisation and the Management of Australian Government, Leichardt: Pluto Press, 1990.275 Stephen J Rimmer, ‘A Case Study in Competitive Tendering and its Implementation: Australia’, in G Gouri (ed), Privatisation and Public Enterprise: The Asia Pacific Experience, Hyderabad: Asian and Pacific Development Centre and the Institute of Public Enterprise, 1991, Chapter 22276 Stephen Rimmer, ‘Aspects of Competitive Tendering and Contracting in Local Government Administration’, PhD Thesis, University of New England, New South Wales, 1993.277 Paul Jensen and Patrick Fernandez, ‘Cultural Change: Competitive Tendering and Contracting in Local Government’, in Simon Domberger and Christine Hall (eds), The Contracting Casebook: Competitive Tendering in Action, Canberra: Australian Government Publishing Service, 1995, Chapter 8.278 Ivan Kwan, ‘Tender Business: Contracting of Grounds Maintenance in the City of Bendigo’, 1995 in Simon Domberger and Christine Hall (eds), The Contracting Casebook: Competitive Tendering in Action, Canberra: Australian Government Publishing Service, 1995, Chapter 10.

Competitive Edge: The Evidence
Publications
Research Papers
Emma Reddington, Good People, Good Systems, December 2004.
Megan Mathias & Emma Reddington, Good People, Good Systems: What Public Service Managers Say, January 2006.
Briony Smith, Built to Serve: The Benefits of Service-Led PPPs, December 2006.
Briony Smith, What Gets Measured — Contracting for Delivery, July 2007.
Gary L Sturgess, Briony Smith, Peter May & Alexis Sotiropoulos, Competitive Edge: Does Contestability Work?, November 2007.
Policy Studies
Gary L Sturgess, A Fair Field and No Favours: Competitive Neutrality in UK Public Service Markets, Policy Study 1, Serco Institute & CBI, January 2006.
Gary L Sturgess & Briony Smith, Designing Public Service Markets: The Custodial Sector as a Case Study, Policy Study 2, September 2006.
Case Studies
Gerald Cranley & Megan Mathias, Education Walsall, Case Study 1, April 2006.
Megan Mathias & Briony Smith, HMYOI Ashfield — the Health Service, Case Study 2, April 2007.
Discussion Papers
Gary L Sturgess, Bound for Botany Bay: Contracting for Quality in Public Services, Discussion Paper 1, October 2005.
Gary L Sturgess, To Gladden the Heart of Miss Nightingale: Contracting for Complexity, Discussion Paper 2, September 2006.
The Serco Institute was established in 1994 by the international services company SercoGroup plc, to undertake practical research into public service contracting and the designand management of public service markets.
What is the key to achieving better value for money frompublic services? There has long been agreement that the answer lies in service redesign, increased workforce flexibility and better people management. But it is equally important to understand what it takes to motivate public service managers to deliver those changes.
Part of the answer lies at the competitive edge. Competitiongives managers a mandate to innovate and an incentive toimplement change. And it encourages the spread of new ideas across the public service sector as a whole. Covering five sectors – defence support, health services, prison management, refuse collection and municipal services – this document analyses the key published evidence on the value-for-money benefits of competition and contestability, and the sources of those benefits. It is a companion piece to the Serco Institute’s research report ‘Competitive Edge: Does Contestability Work?’.