A NEW SDM CLASSIFIER USING JACCARD MINING PROCEDURE CASE STUDY: RHEUMATIC FEVER DATA
11
International Journal on Bioinformatics & Biosciences (IJBB) Vol.4, No.1, March 2014 DOI: 10.5121/ijbb.2014.4101 1 A NEW SDM CLASSIFIER USING JACCARD MINING PROCEDURE CASE STUDY: RHEUMATIC FEVER DATA 1 M.E. Abd El-Monsef, 2 E. A. Rady, 3 A. M. Kozea, 4 W. A. Hassanein, 5 S. Abd El-Badie 1,3,4,5 Mathematics Department, Faculty of Science, Tanta University, Tanta, Egypt 2 Institute of Statistical Studies & Research (ISSR), Cairo University, Cairo, Egypt ABSTRACT In this paper, a new Statistical Data Mining (SDM) technique is proposed using Jaccard Mining Procedure (JMP) contributing a novel classifier & predictor by applying very effective stages on the training data depending on Jaccard (J) distance matrix Linked with the Gini Index Measure as precision measure for initiating a new classifier and a new predictor, The proposed SDM technique using JMP is applied and examined on a Rheumatic Fever Data to demonstrate its applicability. KEYWORDS Jaccard, Classifier, Mining, Gini, Rheumatic Fever, Data 1.INTRODUCTION Classification [3, 4, 5, 7], is a data mining function that assigns items in a collection to target categories or classes. The goal of classification is to accurately predict the target class for each case in the data. For example, a classification model could be used to identify loan applicants as low, medium, or high credit risks. A classification task begins with a data set in which the class assignments are known. For example, a classification model that predicts credit risk could be developed based on observed data for many loan applicants over a period of time. In addition to the historical credit rating, the data might track employment history, home ownership or rental, years of residence, number and type of investments, and so on. Credit rating would be the target, the other attributes would be the predictors, and the data for each customer would constitute a case. The simplest type of classification problem is binary classification. In binary classification, the target attribute has only two possible values: for example, high credit rating or low credit rating. Multiclass targets have more than two values: for example, low, medium, high, or unknown credit rating. Different classification algorithms [7] use different techniques for finding relationships. These relationships are summarized in a model, which can then be applied to a different data set in which the class assignments are unknown. Classification has many applications in customer segmentation, business modeling, marketing, credit analysis, and biomedical and drug response modeling.
-
Upload
independent -
Category
Documents
-
view
0 -
download
0
Transcript of A NEW SDM CLASSIFIER USING JACCARD MINING PROCEDURE CASE STUDY: RHEUMATIC FEVER DATA

International Journal on Bioinformatics & Biosciences (IJBB) Vol.4, No.1, March 2014
DOI: 10.5121/ijbb.2014.4101 1
A NEW SDM CLASSIFIER USING JACCARD MINING PROCEDURE
CASE STUDY: RHEUMATIC FEVER DATA
1M.E. Abd El-Monsef,
2E. A. Rady,
3A. M. Kozea,
4W. A. Hassanein,
5S. Abd El-Badie
1,3,4,5Mathematics Department, Faculty of Science, Tanta University, Tanta, Egypt
2Institute of Statistical Studies & Research (ISSR), Cairo University, Cairo, Egypt
ABSTRACT
In this paper, a new Statistical Data Mining (SDM) technique is proposed using Jaccard Mining Procedure
(JMP) contributing a novel classifier & predictor by applying very effective stages on the training data
depending on Jaccard (J) distance matrix Linked with the Gini Index Measure as precision measure for
initiating a new classifier and a new predictor, The proposed SDM technique using JMP is applied and
examined on a Rheumatic Fever Data to demonstrate its applicability.
KEYWORDS
Jaccard, Classifier, Mining, Gini, Rheumatic Fever, Data
1.INTRODUCTION
Classification [3, 4, 5, 7], is a data mining function that assigns items in a collection to target
categories or classes. The goal of classification is to accurately predict the target class for each
case in the data. For example, a classification model could be used to identify loan applicants as
low, medium, or high credit risks.
A classification task begins with a data set in which the class assignments are known. For
example, a classification model that predicts credit risk could be developed based on observed
data for many loan applicants over a period of time. In addition to the historical credit rating, the
data might track employment history, home ownership or rental, years of residence, number and
type of investments, and so on. Credit rating would be the target, the other attributes would be the
predictors, and the data for each customer would constitute a case.
The simplest type of classification problem is binary classification. In binary classification, the
target attribute has only two possible values: for example, high credit rating or low credit rating.
Multiclass targets have more than two values: for example, low, medium, high, or unknown credit
rating.
Different classification algorithms [7] use different techniques for finding relationships. These
relationships are summarized in a model, which can then be applied to a different data set in
which the class assignments are unknown. Classification has many applications in customer segmentation, business modeling, marketing, credit analysis, and biomedical and drug response
modeling.

International Journal on Bioinformatics & Biosciences (IJBB) Vol.4, No.1, March 2014
2
There is a difference between the definition of the algorithm and the flowchart [6], an algorithm is
just a detailed sequence of simple steps that are needed to solve a problem, from the other side; a
flowchart is a graphical representation of an algorithm. So we will introduce the flowchart and the
algorithm o our paper.
The sequence of this paper is organized as follows; Section 2 represents the materials & methods
which are subtitled into, Rheumatic Fever Data Characteristics, Jaccard distance (J) & Gini Index.
Section 3 presents the JMP algorithm, JMP flow chart and JMP systematic structure stages using
Jaccard distance, Jaccard classes, Jaccard classifiers linking the previous stages with the Gini
Index as precision measures for initiating a new classifier and concluding a new predictor.
Finally, the conclusion and the future work are introduced in Section 4.
2. JMP MATERIALS & METHODS
2.1 Rheumatic Fever Data: Characteristic No doubt that the Rheumatic Fever is a very common disease [2] and it has many symptoms
differs from patient to another though the diagnosis is the same. So, we obtained the following
example on seven rheumatic fever patients from Tanta University Hospital, Egypt. All patients
are between 9-12 years old with history of Arthritis began from age 3-5 years. This disease has
many symptoms and it is usually started in young age and still with the patient along his life.
Table (1) introduced seven patients characterized by 8 symptoms (attributes) [1] using them to
decide the diagnosis for each patient (decision attribute). Table (2) introduces the training coded
data. Where, {S, F, A, R, K, E, P, H} are the conditional attributes, {P1, P2, P3,…, P7} in Table
(2) are the Rheumatic Fever training data objects and the diagnosis attribute (D) as the decision
attribute.
Table (1): Rheumatic Fever Data Description
At. Name ِ◌At. Symbol At. Code At. Description
Sex S 1 Male
2 Female
Pharyngitis F 1 No
2 Yes
Arthritis A 1 No Arthritis
2 Arthritis
Carditis R 1 Not Affected
2 Affected
Chorea K 1 No
2 Yes
ESR E 1 Normal
2 High
Abdominal
Pain P
1 No
2 Yes
Headache H 1 No
2 Yes
Diagnosis D
1 Rheumatic Arthritis
2 Rheumatic Carditis
3 Rheumatic Arthritis &Carditis

International Journal on Bioinformatics & Biosciences (IJBB) Vol.4, No.1, March 2014
3
S F A R K E P H D
P1 2 2 2 2 2 1 1 1 3
P2 1 2 2 2 2 2 1 2 3
P3 2 2 2 2 1 1 1 1 3
P4 1 2 2 1 1 1 1 1 1
P5 1 1 1 2 1 1 2 1 2
P6 2 2 2 2 1 2 1 1 3
P7 1 2 2 2 1 1 1 2 3
Table (2): Coded Rheumatic Fever Data
2.2 Jaccard Distance (JDist.)
It is very important to note that, Jaccard coefficient is a measure for similarity between two
variables and Jaccard distance [3] is a measure of dissimilarity and both of them are measurement
of asymmetric information on binary and non-binary variables. The definition of the Jaccard
similarity coefficient and the Jaccard distance are as follows;
Def.1: Jaccard similarity between binary variables A and B
������, � =���∩�
���∪� Eq. (1)
Def.2: Jaccard Distance between binary variables A and B
�����.��, � = � − ������, � Eq. (2)
Example: (Jaccard Distance Calculations)
S F
P1 2 2
P2 1 2
P3 2 2
P4 1 2
P5 1 1
P6 2 2
P7 1 2
JSim (S, F) = 4/7 → JDist (S, F) = 3/7= 0.43
Similarly for the entire conditional attributes as in Table (3)

International Journal on Bioinformatics & Biosciences (IJBB) Vol.4, No.1, March 2014
4
2.3 Gini Index The Gini index [3], measures the impurity of the target attribute, so we will use it as a precision
method in our paper. The Gini index of a data partition or set of training tuples, as
������ = � − ∑ ����
��� Eq. (3)
Where pj is the relative frequency of class j in A.
The Gini index considers a binary split for each attribute. Let’s first consider the case where B is
a discrete-valued attribute having v distinct values, {b1, b2… bv}, occurring in A. When
considering a binary split, we compute a weighted sum of the impurity of each resulting partition.
For example, if a binary split on B partitions the attribute A into A1 and A2, the Gini index of the
attribute A given that partitioning is,
������� =|��|
|�|������� +
|��|
|�|������� Eq. (4)
In General the Gini of the split formula is,
������ = � −∑ [��� ]⁄�
� Eq. (5)
The most important characteristics of the Gini Index that,
1) It varies between 0 and 1.
2) If Gini = 0 → Complete Equality
3) If Gini = 1 → Complete Inequality
4) If 0 < Gini < 1 → the higher the Gini index, the greater the inequality.
5) Biased to multivalued attributes.
6) Has difficulty when number of classes is large.
7) Tends to favor tests that result in equal-sized partitions and purity in both partitions.
Example: (Gini Index Calculations)
Calculating the Gini of the diagnosis attribute (D) using Eq. (3),
( ) ( ) ( ) 45.0]7/57/17/1[1)(222
=++−=DGINI
& calculating the Gini of the attribute (S) using Eq. (4),
Similarly for the entire conditional attributes as in Table (6).
( ) ( ) ( ) 625.0]4/24/14/1[1)(222
1 =++−=sGINI
& ( ) ( ) ( ) 0]3/33/03/0[1)(222
2 =++−=sGINI
→ )(SGINI = [(4/7) (0.6) + (3/7) (0)] = 0.35

International Journal on Bioinformatics & Biosciences (IJBB) Vol.4, No.1, March 2014
5
3. JMP Systematic Structure Stages
3.1 JMP Algorithm
In this section the JMP algorithm steps will be introduced in the following.
Input
Training Data = ),( DAU U
Processing
1. {}←J
2. Do
3. JClassesJ ←
4. ClassesJrsClasssifieJ ←
5. {}←IndexGini
5. IndexGinirsClasssifieJ ←
6. IndexGiniAveragesIndexGini ←
7. AveragesIndexGiniClassifierJMPBest ←
Output
Best JMP Classifier & JMP Predictor
Where,
• U is the universe of all attributes, A are the conditional attributes & D is the decision
attribute
• J is the Jaccard Matrix
3.2 JMP Flow Chart In this section the flow chart of the JMP Systematic Structure Stages flowchart Figure (1).

International Journal on Bioinformatics & Biosciences (IJBB) Vol.4, No.1, March 2014
6
Figure (1): JMP Flow Chart
3.3 Jaccard Matrix The 1
st stage in our JMP, Calculating Jaccard matrix of the Rheumatic Fever Data conditional
attributes of Table (2).The results are given below in Table (3) Approximated to 2 decimals.
S F A R K E P H
S 0.00 0.43 0.43 0.43 0.43 0.43 0.57 0.71
F 0.43 0.00 0.00 0.29 0.57 0.57 1.00 0.57
A 0.43 0.00 0.00 0.29 0.57 0.57 1.00 0.57
R 0.43 0.29 0.29 0.00 0.57 0.57 0.71 0.57
K 0.43 0.57 0.57 0.57 0.00 0.29 0.43 0.29
E 0.43 0.57 0.57 0.57 0.29 0.00 0.43 0.29
P 0.57 1.00 1.00 0.71 0.43 0.43 0.00 0.43
H 0.71 0.57 0.57 0.57 0.29 0.29 0.43 0.00
Table (3): Rheumatic Fever Conditional Attributes Jaccard Matrix
3.4 Jaccard Classes
The next stage in our classifier to divide the values of the Jaccard matrix of Table (3) into three
classes; (J = 0, 0 < J ≤ 0.5, 0.5 < J ≤ 1) and obtaining the conditional attributes classes introducing
the output of this stage in Table (4) of the conditional attributes Jaccard classes.

International Journal on Bioinformatics & Biosciences (IJBB) Vol.4, No.1, March 2014
7
J= 0 0 < J ≤ 0.5 0.5 < J ≤ 1
S {$} {&, ', (, ), *} {+, ,}
F {&, '} {$, (} {), *, +, ,}
A {&, '} {$, (} {), *, +, ,}
R {(} {$, &, '} {), *, +, ,}
K {)} {$, *, +, ,} {&, ', (}
E {*} {$, ), +, ,} {&, ', (}
P {+} {), *, ,} {$, &, ', (}
H {,} {), *, +} {$, &, ', (}
Table (4): Conditional Attributes Jaccard Classes
3.5 JMP Classifiers
Comparing the conditional attributes row classes of Table (4) to get the Jaccard classifiers in
Table (5).
J= 0 0 < J ≤ 0.5 0.5 < J ≤ 1
{$} {$} {$}
{&, '} {&, '} {&, ', (}
{(} {(} {), *}
{)} {)} {+, ,}
{*} {*}
{+} {+}
{,} {,}
Table (5): Conditional Attributes Jaccard Classifier
One can note that the mining Jaccard classifier is, 0.5 < J ≤ 1 classifier which has the least
number of sets and the division of the attribute sets are very appropriate with the medical sight.
Deciding which the best classifier is depends on the following calculations.
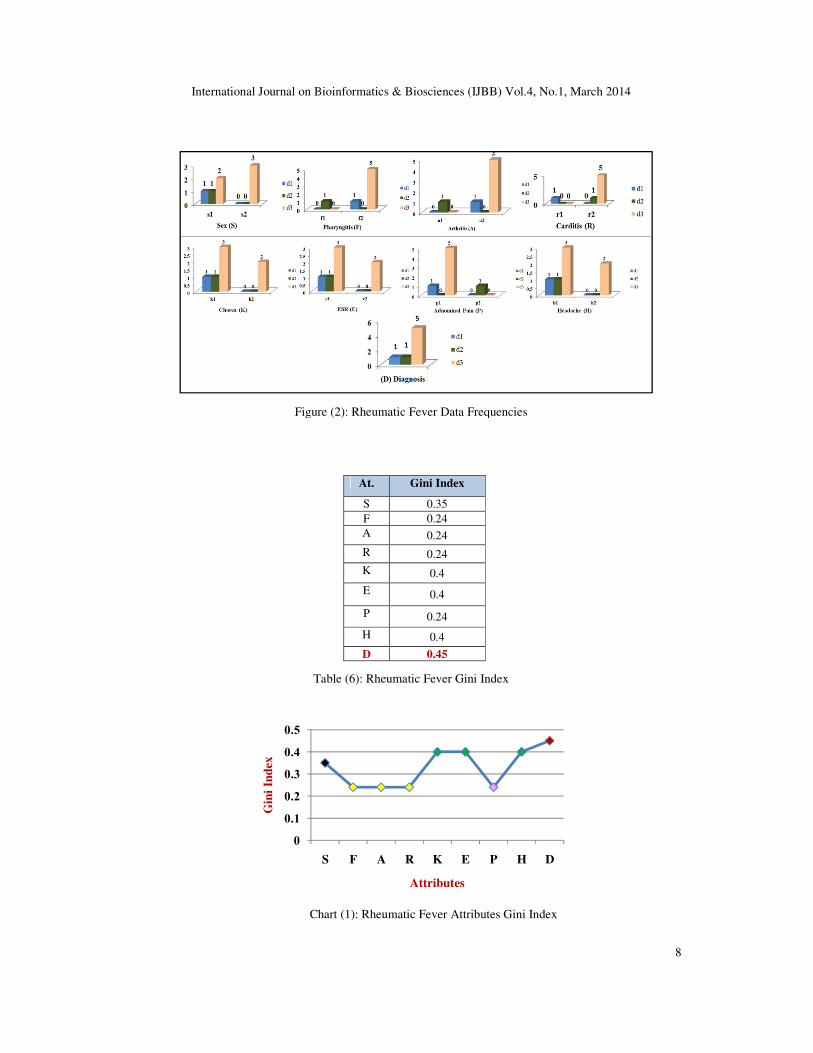
3.6 Rheumatic Fever Data Gini Index
Applying the Gini index rules in Section (2.3) on the data in Table (2), the values of the Gini
Index of each attribute is calculated and the results are summarized and approximated to two
decimal spaces in Table (6) and Chart (1) using the frequencies of all attributes which are
represented in Figure (2) respectively.
International Journal on Bioinformatics & Biosciences (IJBB) Vol.4, No.1, March 2014
Figure (2): Rheumatic Fever Data Frequencies
Table (6): Rheumatic Fever Gini Index
Chart (1): Rheumatic Fever Attributes Gini Index
0
0.1
0.2
0.3
0.4
0.5
Gin
i In
dex
International Journal on Bioinformatics & Biosciences (IJBB) Vol.4, No.1, March 2014
Figure (2): Rheumatic Fever Data Frequencies
Table (6): Rheumatic Fever Gini Index
Chart (1): Rheumatic Fever Attributes Gini Index
S F A R K E P H D
Attributes
Gini Index At.
0.35 S
0.24 F
0.24 A
0.24 R
0.4 K
0.4 E
0.24 P
0.4 H
0.45 D
International Journal on Bioinformatics & Biosciences (IJBB) Vol.4, No.1, March 2014
8

International Journal on Bioinformatics & Biosciences (IJBB) Vol.4, No.1, March 2014
3.7 Best JMP Classifier Deciding the best Jaccard classifier of Table (5) depends on the conditional attributes Gini Index
of Table (6). So, the JMP classifier will be 0.5 < J
3.8 JMP Predictor
This stage to determine which set of the best JMP classifier sets to be the JMP predictor which we
can use it with any prediction technique for predicting the diagnosis for any test
calculating the Gini index averges for each set of the best JMP classifier of Table (7)
in Table (8) and Chart (2).
Table (8): Best JMP Classifier Gini Averages
Chart (2): Best JMP Classifier Gini Averages
0
0.05
0.1
0.15
0.2
0.25
0.3
0.35
0.4
0.45
0.5
}S{
Gin
i In
dex
A
ver
ges
International Journal on Bioinformatics & Biosciences (IJBB) Vol.4, No.1, March 2014
classifier of Table (5) depends on the conditional attributes Gini Index
of Table (6). So, the JMP classifier will be 0.5 < J ≤ 1 the best JMP classifier as in Table (7).
0.5< J ≤ 1
{$}
{&, ', (%
#), *%
#+,,%
Table (7): Best JMP Classifier
This stage to determine which set of the best JMP classifier sets to be the JMP predictor which we
can use it with any prediction technique for predicting the diagnosis for any test
calculating the Gini index averges for each set of the best JMP classifier of Table (7)
Gini Average 0.5< J ≤ 1
0.35 #$%
0.24 #&, ', (%
0.4 #), *%
0.3 #+, ,%
0.45 D
Table (8): Best JMP Classifier Gini Averages
Best JMP Classifier
Chart (2): Best JMP Classifier Gini Averages
}F,A,R{ }K,E{ }P,H{ D
JMP Classifier
International Journal on Bioinformatics & Biosciences (IJBB) Vol.4, No.1, March 2014
9
classifier of Table (5) depends on the conditional attributes Gini Index
1 the best JMP classifier as in Table (7).
This stage to determine which set of the best JMP classifier sets to be the JMP predictor which we
can use it with any prediction technique for predicting the diagnosis for any test data, by
calculating the Gini index averges for each set of the best JMP classifier of Table (7) represented

International Journal on Bioinformatics & Biosciences (IJBB) Vol.4, No.1, March 2014
10
From Chart (2) we can find that the value of the Gini average of {K,E}is the closest value to the
diagnosis Gini and this indicates that {K,E}will be the JMP predictor attributes.
JMP Predictor = #-, .} Eq. (6)
4.CONCLUSION
A new Statistical Data Mining (SDM) technique is initiated in this paper using Jaccard Mining
Procedure (JMP) contributing a novel classifier & predictor depending on Jaccard (J) distance
matrix and Gini Index Measure. Applying JMP on real life application of Rheumatic Fever data
diagnosis to see the accuracy of its applicability and the result was very accurate for the diagnosis
of the data specialist. JMP opens the way for other new SDM techniques using an alternative
distance measures and other accuracy measures according to the data type.
REFERENCES [1] A.M. Kozae, M.M.E. Abd El-Monsef, and S. Abd El-Badie, New Approaches for Data Reduction in
Generalized Multi-valued Decision Information System (GMDIS): Case Study of Rheumatic Fever
Patients, The 2nd International Conference on MATHEMATICS: TRENDS AND
DEVELOPMENTS, Egyptian Mathematical Society (ETMS), December 27–30, 232-BM, 2007,
Cairo – EGYPT.
[2] Chun LT, Reddy DV, Yamamoto LG. Rheumatic fever in children and adolescents in Hawaii.
Pediatrics. 1987; 79: 549–552.
[3] Han J. and Kamber M. Data Mining: Concepts and Technique, 2nd ed., the Morgan Kaufmann Series
in Data Management Systems, Jim Gray, Series Editor Morgan Kaufmann Publishers, 2006. ISBN 1-
55860-901-6.
[4] M.E. Abd El-Monsef, E. A. Rady, A. M. Kozea, W. A. Hassanein and S. Abd El-Badie What is the
Major Power Linking Statistics & Data Mining?, International Journal of Data Mining & Knowledge
Management Process , 2013, Volume 3, Number 6, ISSN 2230-9608, AIRCC Co.
[5] Oracle, Database Online Documentation Library Master Index, Copyright © 2014, Oracle and/or its
affiliates. All rights reserved. http://docs.oracle.com/cd/E11882_01/nav/mindx.html
[6] Paul E. Black, "algorithm", in Dictionary of Algorithms and Data Structures [online], Vreda Pieterse
and Paul E. Black, eds. 10 January 2007. (accessed TODAY) Available from:
http://www.nist.gov/dads/HTML/algorithm.html
[7] Thair Nu Phyu, Survey of Classification Techniques in Data Mining, International Multi Conference
of Engineers and Computer Scientists (IMECS), 2009, Hong Kong, Vol I.

International Journal on Bioinformatics & Biosciences (IJBB) Vol.4, No.1, March 2014
11
Authors
Mohamed Ezzat Abd El- Monsef, Professor of Pure Mathematics, Mathematics
Department, Faculty of Science, Tanta university, Egypt. He was the former dean of the
faculty. He is a member in many mathematical societies. He got the membership of the
National Committee for Mathematics. He is a supervisor on many MS. C. and Ph. D.
Thesis in many universities in and out of Egypt. He is a member in, ERS Group,
http://www.cba.edu.kw/abo/rough-sets-working-group.html and the Egyptian
Mathematical Society http://etms-eg.org Homepage: http://at.yorku.ca/h/a/a/a/48.html
El-Houssainy Abd El-Bar Rady, Professor of Applied Statistics Applied Statistics
Department, I.S.S.R, Cairo, Egypt. His Ph.D. in Statistics, from Oregon State University
(OSU), USA. He was the Director of the Statistical and Econometrical Consultation
Center. He got many awards, Sarhan Award of the Scientific research Academy, Egypt,
Lee Award, OSU, USA, Member of the Honor Society of Phi Kappa Phi, USA and Thabet
El-Sherief Award, ISSR, Cairo University.
Homepage: http://issr.cu.edu.eg/web_people_faculty_det.aspx?fac_id=31
Abd El-Monem Mohamed Kozae, Professor of Pure Mathematics, Mathematics
Department, Faculty of Science, Tanta university, Egypt He is a supervisor on many MS.
in C. and Ph. D. Thesis in and many universities out of Egypt. He is a member in many
mathematical societies, ERS Group, http://www.cba.edu.kw/abo/rough-sets-working-
group.html, IRSS http://roughsets.home.pl/www/ and Egyptian Mathematical
Societyhttp://etmseg.org Homepage:http://telc.tanta.edu.eg/hosting/pro6/pro6_index.html
Wafaa Anwar Abd El-Latif, Lecturer of Mathematical Statistics, Mathematics
Department, Faculty of Science, Tanta University, Egypt. She got her BS. C., 2000, by
excellence with honors degree, Her Ms. C. degree, 2004. And she got her Ph.D. degree,
2007, Titled “Uncertainty in Statistics”, 2007, Faculty of Science, Tanta University,
Egypt. She is a member in, ERS Group, http://www.cba.edu.kw/abo/rough-sets-working-
group.html and Egyptian Mathematical Society http://etms-eg.org Homepage:
http://tdb.tanta.edu.eg/staff_data/Staff%20Detailed%20Data-ar.aspx?MemberID=847
Soaad Abd El-Badie Attia El-Afefy, Ph. D. Student, Mathematics Department, Tanta
University, Egypt. She got her Ms. C. Titled ”A New Data Reduction Approach”, 2006,
Faculty of Science, Tanta University, Egypt. She got the Best Student Presentation and
Best Student Paper Awards. She worked as teaching assistant at GUC, She is a member
in, ERS Group http://www.cba.edu.kw/abo/rough-sets-working-group.html,IRSS
http://roughsets.home.pl/www/, and Egyptian Mathematical Society http://etms-eg.org
Homepage: http://www.savvymore.mysite.com


![[Guidelines] | Rheumatic Fever New Zealand - RHD Action |](https://static.fdokumen.com/doc/165x107/6328f1eb2dd4b030ca0c5afa/guidelines-rheumatic-fever-new-zealand-rhd-action-.jpg)