A new integrated system for three-dimensional echocardiographic reconstruction: Development and...
11
With Applicati~an in MARK D. HANDSCHUMACHER, BS. JEAN-PAUL LETHOR. MD, SAMUEL C. SIU, MD, DONATO MELE, MD, J. MIGUEL RIVERA. ,MD. MICHAEL H. FICARD, MD, FACC, ARTHUR E. WEYMAN. MD, FACC. ROBERT A Boston, Mo+socl~r,serrs OBjectives. The purpose of this study was to improve threp dimeosianal echocardiographic reconstruction by developing an automated mechanism for integrating spark gap locating data with corresponding images in real time and to validate use of this mechanism for the measurement of left ventricular volume. Bockground. Initial approaches to three-dimensional ahocar- diogmphic recowtructlott were oRen lint&d by iw&icient remn- slructive processes requiring manual coordination of two- dimensional images and corresponding spatial lwating data. Metlwo!~ In this system, a single computer overlays the binary-encoded positional data on the two-dimensional eehocar- diogrnphic image, which is then recorded on videotape. The some system allows inages to be digitized, Irace& anmlyzed and dis- played in thrw dimensions. This system was validated by using it to reeonstrurt 11 ventricular phantoms (19 to 271 ml) and II gel-tilled excised ve&icle~ (21 to 2X ml) imaged in intewcling long. and short& views and by apical rotation. To measure cavity volume, B surface was geoerakd by an algorithm that takes advantage of the full threedin~ensional data set. Uesttlts. Reconstructed cavity volumes agreed well with actual vaIues: y = 0.%x + 2.2 for the ventricular phantoms in long-and Current echocardiographic devices provide only two- dimensional tomographic views of the heart; to appreciate three-dimensional structural relations requires mental recon- v Robal A Levrnc. MD. Cardiac Uhnwnd Laboratory. Founders House 8. Meswhusetrs General Hospital. Bonon. Massachusdk. 02 I 14. *IS93 by the American Coilege 0fCdiilugy LEVINE. MD, FACC struction of these views by an experienced observer. While this process may be satisfactory for structures of known and regular shape. it limits the ability to analyze structures of unknown or complex shape. In additir?. quantitative mea- sures of cardiac chamber size and performance. such as ejection fraction, must be derived from tw~dimensional data subject to geometric assumptions. Three-dimensional reconstruction could eliminate the need for such assump- tions and thereby facilitate accurate evaluation of chamber size and shape. ventricular function and complex congen- ital heart defects. It would also allow quantit%ive descrlp- tion of structures whose surfaces do not form enclosed volumes (such as valve leaflets), structures for which simple geometric models are less applicable (such as the right ventricle and ischemic left ventricle) and intracardiac Row fields from Doppler color flow images. However. to achieve these goals requires a method for registering the spatial tocation of multiple two-dimensional images and combining
-
Upload
independent -
Category
Documents
-
view
1 -
download
0
Transcript of A new integrated system for three-dimensional echocardiographic reconstruction: Development and...
With Applicati~an in
MARK D. HANDSCHUMACHER, BS. JEAN-PAUL LETHOR. MD, SAMUEL C. SIU, MD,
DONATO MELE, MD, J. MIGUEL RIVERA. ,MD. MICHAEL H. FICARD, MD, FACC,
ARTHUR E. WEYMAN. MD, FACC. ROBERT A
Boston, Mo+socl~r,serrs
OBjectives. The purpose of this study was to improve threp dimeosianal echocardiographic reconstruction by developing an automated mechanism for integrating spark gap locating data with corresponding images in real time and to validate use of this mechanism for the measurement of left ventricular volume.
Bockground. Initial approaches to three-dimensional ahocar- diogmphic recowtructlott were oRen lint&d by iw&icient remn- slructive processes requiring manual coordination of two- dimensional images and corresponding spatial lwating data.
Metlwo!~ In this system, a single computer overlays the binary-encoded positional data on the two-dimensional eehocar- diogrnphic image, which is then recorded on videotape. The some system allows inages to be digitized, Irace& anmlyzed and dis- played in thrw dimensions. This system was validated by using it to reeonstrurt 11 ventricular phantoms (19 to 271 ml) and II gel-tilled excised ve&icle~ (21 to 2X ml) imaged in intewcling long. and short& views and by apical rotation. To measure cavity volume, B surface was geoerakd by an algorithm that takes advantage of the full threedin~ensional data set.
Uesttlts. Reconstructed cavity volumes agreed well with actual vaIues: y = 0.%x + 2.2 for the ventricular phantoms in long-and
Current echocardiographic devices provide only two- dimensional tomographic views of the heart; to appreciate three-dimensional structural relations requires mental recon-
v Robal A Levrnc. MD. Cardiac Uhnwnd Laboratory. Founders House 8. Meswhusetrs General Hospital. Bonon. Massachusdk. 02 I 14.
*IS93 by the American Coilege 0fCdiilugy
LEVINE. MD, FACC
struction of these views by an experienced observer. While this process may be satisfactory for structures of known and regular shape. it limits the ability to analyze structures of unknown or complex shape. In additir?. quantitative mea- sures of cardiac chamber size and performance. such as ejection fraction, must be derived from tw~dimensional data subject to geometric assumptions. Three-dimensional reconstruction could eliminate the need for such assump- tions and thereby facilitate accurate evaluation of chamber size and shape. ventricular function and complex congen- ital heart defects. It would also allow quantit%ive descrlp- tion of structures whose surfaces do not form enclosed volumes (such as valve leaflets), structures for which simple geometric models are less applicable (such as the right ventricle and ischemic left ventricle) and intracardiac Row fields from Doppler color flow images. However. to achieve these goals requires a method for registering the spatial tocation of multiple two-dimensional images and combining

them in three dimensions at one or more points in the Ezrdiac
cycle. Although the feasibility of initial reconstructive ap
proaches has been demonsttatcd in the research cnviron- ment (l-14), their application to larger populatians has been restricted by the time-consuming process of coordinating images with their spatial locations. Most techniques slowly acquire individual images and their three-dimensional locations at discrete, sequential points in time and are therefore subject to potential inaccuracies caused by pa- tient motion and respiration between images. In a previous study (IS), a system was developed that could minimize these inaccuracies by continuously acquiring multiple views within a short period of time. However, such a system generates large numbers of images that must then be coor- dinated with their corresponding positions. As initially im-
plemented. this requires manual coordination of images digitized by one computer with spatial locations from a separate computer based on their acquisition time during the scanning sequence. A third computer is then required to reconstruct and display the images in a three-dimensional format (Fig. LA). This process is prohibitively long, partic- ularly for dynamic reconstructions throughout the cardiac cycle. The data sets, once integrated, also require consider- able computer storage.
The purpose of this study, therefore, was to develop and validate a fully integrated system for three-dimensional reconstruction towards the ultimate goal of applying this technique more readily and widely to evaluate cardiac structure and function. in partimtlar, this system re- quired the development of a mechanism for automated integration of images and positional data in real time, with recording of the combined data sets on videotape IO provide convenient, high ca.pacity data storage and re- trioval. Real time data integration was achieved by interfac- ing both the two-dimensional imaging system and the spatial locating dcvict to a single computer that overlays the positional data in binary format on an unused portion of the imaging signal and records the composite on videotape (Fig. fB). This mechanism allows acquisition of spatially registered data during the routine echocardiogrdphic exam- ination, with time and storage requirements no greater than those for the component two-dimensional scans. This inte- grated system includes mechanisms for tracing, display and analysis of structures of interest in a three-dimensional format. It also uses a new algorithm developed to recon- struct surfaces from intersecting, nonparallel images to take full advantage of the ability to acquire multiple overlapping views from any tomographic orientation. This system was validated by demonstrating its ability to provide accurate volumetric reconstructions of objects and ventricles of known size and shape in vitro. This validation also lays the foundation for further applications. Initial feasibility in hu- man studies was explored by applying this technique in 14 normal subjects to demonstrate its ability to reconstruct the left ventricle and to provide a quantitative medsurc of stroke
30 locatlon 2D lmaacs EC0
Figure I. A, Initial system requiring manual coordination of imaaes and soatial locadons. Dtnina the scan. two-dimensional (2D) images and’e!cctrocardiogram (ECG) wduld be recorded’ on videotape along wifh a trigger signal that indicates the beginning of threodimensional (SD) positional data collection by one per- sonal Computer W-I). Selected images were later digitized by another computer WC-Z). To coordinate each image with its corresponding spatial location, it was necessary tc read the value of the frame counter from the image itself and manually enter it into a Computer gle. The offset of each frame fmm the trigger signal was then used to Calculate the time in the positional data colleclion and to select the correct transducer position. Because of the systems used. the images and positional data had to be manaally transferred by floppy disks to a third Computer (K-3) that was connected by a high-speed ethernet link to a mainframe VAX workstation used for data integratior and processing. B, Real-time data integration. A single Computer (WORKSTATION PC) is inter- faced to bath the locating system and ultrasound machine by way of a data port and video processing board. Tlte video board overlays the posilional data on the imaging signal and records the composite on videotape, The same computer system is used for data retrieval and analysis.
volume that agrees well with an independent noninvasive measure by Doppler echocardiography. By increasing the efficiency of reconstruction, this system now provides a practically useful mechanism that should enhance our ability lo address clinical and research questions with this tech- nique.
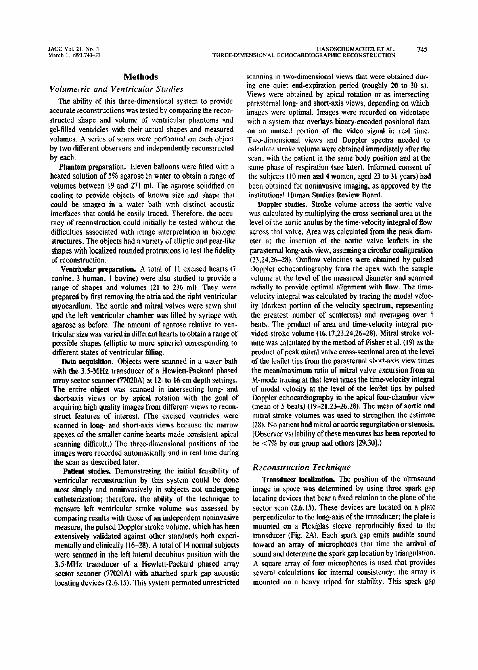
Methods
Vulumerric and Venrricrdar 5hdies
The ability of this three-dimensional system to provide accurate reconstructions was tested by comparing the recon- structed shape and volume of ventricular phantoms and gel-filled ventricles with their actual shapes and measured
volumes. A series of scans were performed on each object by two different observers and independently reconstructed by each.
Phaatom preparation. Eleven balloons were filled with a heated solution of 5% agarose in water to obtain a range of volumes between 19 and 271 ml. The aprose solidified on cooling to provide objects of known size and shape that could be imaged in a water bath with distinct acoustic interfaces that could be easily traced. Therefore. the accu- racy of reconstruction could initially be tested without the difficulties associated with image interpretation in biologic sttuctttres. The objects had a variety of ellip!ic and pear-like shapes with localized rounded protrusions 10 test the fidelity of reconstruction.
Vemricular prqwatian. X total of I I excised hearts (7 canine, 3 human, I bovine) were also studied to provide a range of shapes and volumes (21 to 236 ml). They were prepared by first removing the atria and the right ventricular
myocardium. The aortic and mitral valves were sewn shut and the left ventricular chamber was filled by syringe with agarose as before. The amount of agarose relative to ven- tricular size was varied in different hearts to obtain a range of possible shapes (elliptic to more spheric) corresponding to different states of ventricular hlling.
Data acquisition. Objects were scanned in a water bath with the 3.J-MHz transducer of a Hewictt-Packard phased array sector scanner (7702OA) at IZ- to &cm depth settings. The entire object was scanned in intersecting long- and short-axis views or by apical rotation with the goal of acquiring high quality images from differen: views to recon- struct features of interest. (The excised ventricles were scanned in long- and short-axis views because the narrow apexes of the smaller canine hearts made consistent apical scanning difficult.) The three-dimsnsional positions of the images were recorded automatically and in real time during Ihc scan as described later.
P&nt studies. Demonstrating the initial feasibility of ventricular reconstruction by this system could be done moat simply and noninvasively in subjects not undergoing catheterization; therefore, the ability of the technique to measure left ventricular stroke volume was assessed by comparing results with those of an independent noninvasive measure, the pulsed Doppler stroke volume, which has been extensively validated against other standards both cxpcri- mentally and clinically (K-28). A total of I4 normal subjects were scanned in the left lateral decubitus posilion with the 3.5-MHz transducer of a Hewlett-Packard phased array sector scanner (7702OA3 with attached spark gap acoustic locating devices (2.6,15). This system permitted unrestricted
scanning in two-dimensional views that were obtained dur- ing one quiet end-expiration period (roughly 20 to 30 s). Views were obtained by apical rotation or as imersecting parastemal long- and short-axis views, depending on which images were optimal. Images were recorded on videotape with a system that overlays binary-encoded positional data on an unused portion of the video signal ir: real time. Twvdimensional views and Doppler spectra needed to calculate stroke volume were obtained immediately after the scan. with the patient in the same body position and at the same phase of respiration (see later). Informed consent of the subjects (10 men and 4 women, aged 23 to 31 years) had been obtained for noninvasive imaging, as approved by the institutional Human studies Review Board.
Doppler studies. Stroke volume across the sonic valve was calculated by multiplying the cross-sectional area at the level of the aortic anulus by the time-velocity integral of flow across that valve. Area was calculated from the peak diam- eter at the insertion of the aortic valve Ieallets in the parastemal long-axis view, assuming a circularconliguration (23.24.26-28). Outflow velocities were obtained by pulsed i)oppler echocardiography f;om the apex with the sample volume at the level of the measured diameter and scanned
radially to provide optima) alignment with flow. The time- velocity integral was calculated by tracing the modal vcloc- ity (darkest portion of the velocity spectrum, representing the greatest number of scatterers) and avemging over 5 heats. The product of area and time-velucity integral prc- vidcd stroke volume (16.17.23.24.26-28). Mitral stroke vol- ume was calculated by the method of Fisher et al. (19) as the product of peak mitral valve cross-sectional area at the level of the leaflet tips from the pamsternal sh&-axis view times the mean/maximum ratio of mitral valve excursion from an M-mode tracing at that level times the time-velocity integral of modal velocity at the level of the leailet tips by pulsed Doppler echocardiography in the apical four-chamber view (mean of 5 beats) (19~21,2>26.28). The mean of aortic and
mitral stroke volumes was used to strengthen the estimate (28). No patient had mitml oraortic regurgitation orstenosis. (Observer variability of these measures has been reported to be <7C by our group aud others 129.301.)
Raxwtstvuction Techniqrrc
Transducer lucrdizption. The position of the ultrasound image in space was determined by using three spark gap locating devices that bear a fixed relation to the plane of the sector scan (2.6.15). These devices are located on a ptatc perpendicular to the long-axis of the transducer: the plate is mounted on a Plexiglas sleeve repruducibiy fixed to the transducer (Fig. 2A). Each spark gap emits audible sound loward an array of microphones that time the arrival of sound and determine the sparkgap location by triangulation. A square array of four microphones is used that provides several calculations for internal consistency; the array is mounted on a heavy tripod for stability. This spark gap
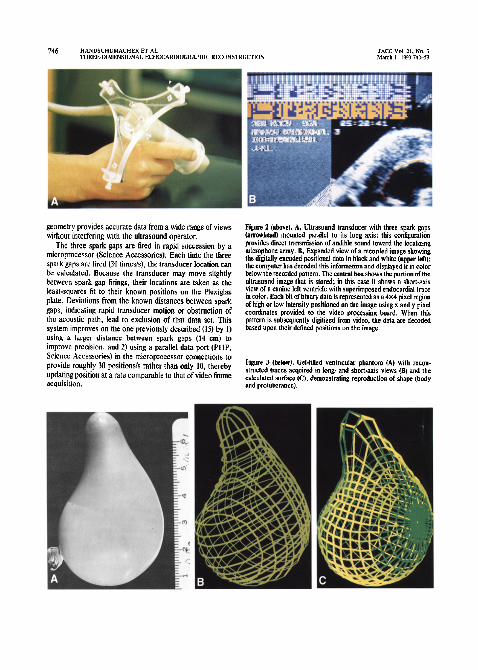
geometry provides accurate data from a wide range of views without interfering with the ultrasound operator.
The three spark gaps are fired in rapid succession by a microprocessor (Science Accessories). Each lime the three spark gaps are tired (30 times/s), the transducer location can be calculated. Because the transducer may move slightly between spark gap firings, their locations are taken as the least-squares fit to their known positions on the Plexiglas plate. Deviations from the known distances between spark gaps, indicating rapid transducer motion or obstruction of the acoustic path. lead to exclusion of that data set. This system improves on the one previously described (15) by 1) using a larger distance between spark gaps (14 cm) to improve precision, and 2) using a parallel data port (PI IP. Science Accessories) in the microprocessor connections to provide roughly 30 positions/s rather than only 10, thereby updating position at a rate comparable to that of video frame acquisition.
Figure 2 (above). A, Ultrasound transducer with three spark gaps fat~owhcad) mounted parallel to its long axis; this configuration provides direct transmission of audible saund toward the localizing microphone array. B, Expanded view of a recoiled image showing the digitally encoded positional data in black and white (apper MI); the computer has decoded this infermatinn and displayed it in color below the recorded pettera. The ezatnl box shows the portion of the ultrasound image that is stored: in this case it shows a short-axis view of a canine left ventricle with superimposed endncardial trace in color. Each bit of binary data is represented as a 4x4 pixel region of high or low intenrily pnsitioned on the image using x and y pixel coordinates provided to the video processing board. When this patlem is subsequently digitized from video, the data arc decoded based upon their defined posilions on the image.
Figure 3 @elan). Gel-filled ventricular phantom (A) with recoa- structed lraces acquired in Iong- and sbmt-axis views (It) and the calculated surface (4% demonstrating reproduction of shape (body and protuberance).
System description. A single 386-series persona! com- puter (SUN 386i, Sun Microsystems) is intcrfdced !o both the transducer-locating system and the ultrasound machme by means of a high speed data port (PlO-I2 Mc~raBy~ci and a special purpose video processing hoard (AT Vista. True- Vision) that arc added to expansion slots on rhe computer bus (Fig. 13). At any dcsircd point within an ultrasound scan, this computer can initiate continuous Tpark gap firing and receive positional data by way of the data port. Each time positional data is received from the locating system. it is sent to the video board and encoded as a binary pattern that is overlaid on an unused portion of the video signat that comes dire& fmm the ultrasound machine. The comoosile video sigaa! is then recorded in real time on videotape (Fig. 2B). The digital overlay consists of six data lines that correspond to the two most recent positions of each of the three spark gaps. Recording the two most rcceni locations with each image allows the magnitude of transducer morion to be calculated from that image alone. so what frames acquired during rapid motion can bc cxcludcd to improve the accuracy of the reconstruction. The software was optimized so that the overlay on each vidcoframe included two or three new spark gap positions obtained within the video frame time (33 ms). Every frame then contains all the raw datr required for three-dimensional reconshuction (images. ECG and spatial information) so that manual alignment or coordi- nation of these data is not required.
Dara Analysis
Data rekieval from videotape. After scanning. the same system is used for data retrieval. Up to 30 different tomo- graphic images/study could be selected from video playback by digitizing the video signal to product I) an nnagc digitized with 486 x 756 spatial rcsolurion and 8 bits of intensity reiolutionlpixel (only the central portion of the frame. WC- rc;ponding to the echocsrdiographic data, w&3 saved): and 2) decoded positional data from which the spark gap loca- tions were calcuIated to derive a trimsformation matrix that positions each pixel correctly in three-dimensional space. Data decoding and matrix calculation required <I s/image.
Border definilion. To reconstruct a ventricular surface, the digitized images were traced on a graphics screen by using a digital pointing device incorporated into the same system. The reconstruction and surfacing algorithms were specifically designed to tolerate incomplete traces so that portions of images that are difficult to interpret (because of partial view or lateral dropout) can remain untraced and can be filled in from intersecting views and other windows. At any point during tracing, the consistency of border identifi- cation could be checked by quickly paging through the iwodimcnsional images with overlaid trilccs and simulla- neously displaying the current trace in its spatial relation to all the others. Appreciating three-dimensional rclatioor -oa!d 0:: improved by dynamically rotating the composite .vith depth cuing and optional stereo visualizaGon. Any
ielecred trace could then be retraced for best alignment with intersecling borders. The central portion of the two- dimensional echocardiographic border reflections were tmced because I) this would. in principle. correspond to the border of the object intersected by the cenrrul p/nne of the ultrasound sector. where the tracing is positioned by the three-dunenslonal system (the .hickness of the reflection being produced by d beam of Cnite out of plane width inter- secting a generally curved surface): and 21 in a series of pilot stud&. this provided the closest correspondence with actual volumes Wthin ‘3% of actual volumes in three initial hems. ah opposed to consistent under- or overestimation of up to 10% by tracing I he inner or outer bordc~s of the reflection). Tracing
typically required I0 IO 30 min depending on obsciver experi- ence. the number of images (I5 to 30) and their c~mplexhy.
Surfacing algorithm. Previous surfacing algorithms have often 6::id dita :o curves in a Wies of parz!le! !!,W chreu~icd planes and then simply extrapolated beraeen these slices to create an enclosed surface. To include the full s~rengt h of irttrrsucfi~g rhr~e-dirr~ensionoi dotn in the basic
fitting process. a new approach was devised. An initially spheric temptatc. positioned at the geometric center of the cavity. was deformed to provide thr best fit to surrounding traces. It US divided into cven!y spaced lines oflatitude and longitude IO provide 400 grid points. Rays were then extended from the center of the sphere through rhcse grid points toxvard the h-aced borders to calculate a correspond- ing prod point on the ventricular surface. The position of this point was obtained as a best fit to all tnced line segm:nts within a small conical sector (10.6”) around each my. weighted hy their proximity to the my. Values for rays withou: adjacent traces were filled in by interpolating be- twecn nearest neighbors. The grid points were then con- nected and the surface displayed.
Vohnne calcslattian. Cavity volume was calculated by treating the surface as a series of contiguous triangular patches of grid points. each forming (with its attached rays) a trtrahedron with its apex at the center of the cavily. The volumes of these figures were summed and compared with the acrual volumes of the agarose casts determined by waler displacemenl in a graduated beaker. For the excised vcntri- cles, the myocardium was incised and carefully peeled off the agnrosc cast. which was then measured.
Analysis of patient studies. For each view. end-diastolic and end-systolic images (large9 and smallest cavity size) were selected by two independent observers. and endocar- dial borders traced using a digital pointing device. End- diastolic and end-systolic cavity volumes were then calcu- lated by applying the surfacing algorithm, and stroke volume calcula:ed as their diffcrcnce.
Statistical analysis. The accuracy of the reconstructed volume was examined by I) linear regression of calculated versus actual volumes for each observer: and 2; calculation of the absolute difference bcrween calculated and acrual volumes for each observer. Observer variability was ex- pressed as the standard deviation of the differences between

the measurements of the two observers for both the in vitro 2nd the in viva studies.
Results
Ventricular phantoms. The reconstructed traces and de- rived surfaces reproduced the shape of the scanned objects (Fig. 3). Reconstructed cavity volumes agreed well with actual values. For recon&uctions in long- and shorr-axis views. linear reeression ea’qe v = 0.96x + 2.2 for the oaaled data if both observers (r= 0.99, SEE = 2.7 ml) (Fig. i, top). (Individual results were y = 0.97x t I.5 for one observer [r = 0.99, SEE = 2.7 ml; and y = 0.95x t 2.9 for the other [r = 0.99, SEE = 2.4 ml].) For the apical romrions, linear regression gave y = 0.95x + 2.9 for both observers (I = 0.99. SEE = 2.7 ml) (Fig. 4, middle). (Individual results were y = 0.97x + 2.3 for one observer [r = 0.99, SEE = 2.3 ml] and y = 0.94x t 3.5 for the other [r = 0.99. SEE = 2.0 ml].) The mean difference between three-dimensional and actual volumes was 2.5% of the mean (3.0 ml], and observer variability was 2.3% of the mean (2.6 ml) (similar for both scan techniques).
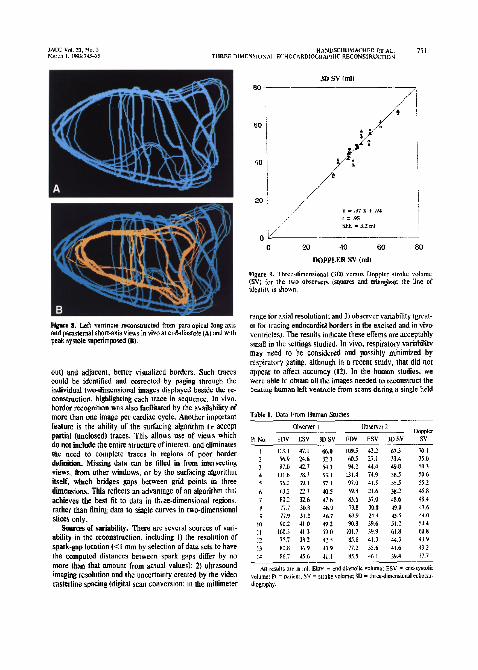
Excised ven~Ws. The reconstructions reproduced the shapes and important morphologic features of the actual ventricles. Figure 5 shows a reconstructed canine heart, with evident outflow tract, apex and papillary muscle indenta- tions. Figure 6 shows how the reconstruction reproduced an apical aneurysm in a human heart compared with the agarose cast of that heart. Calculated volumes agreed well with actual values: y = 099x + 0.1 I for the poied dam 05 bath observers (r = 0.99, SEE = 5.9 ml) (Fig. 4. bottom). (Individual results were y = 0.98x - I.2 for one observer [r = 0.99, SEE = 4.4 ml] and y = 1.0x + 1.4 for the other [r = 0.99, SEE - 6.7 ml].) Even if the largest two ventricles were excluded, leaving ventricles of <IO0 ml, correlations were virtually unchanged: y = 0.99x + 0.02 (r = 0.98. SEE = 4.4 ml) for the two observers, with r = 0.98 - 0.99 for each observer alone. The mean difference between three-dimensional and actual volumes was 6% of the mean (4.6 ml). Observer variability was 5.6% of the mean (4.3 ml).
In viva ventricular reconstruction. In all 14 subjects. coherent cndocardial surfaces could be generated from the views obtained. Figure 7A, for example. shows one of these ventricles reconstructed from a serks of apical views in systole. illustrating the relation of the ventricle to adjacent atrial and aortic structures, a papillary muscle indentation along its inferior surface, and Ihe curvature of the mitral anulus region at the atrioventricular junction. Systolic and diastolic traces can also be superimposed, as ir! R:ure ?B. Figure 8 shows how intersecting apical (in this case, para- apical long-axis) and parastemal views can be combined to provide a three-dimensional reconstruction in another subject.
Stroke volume. Three-dimensional and Doppler stroke volume values agreed well (Fig. 9, Table I, y = 0.97x + 0.94; r = 0.95, SEE = 3.2 ml by linear regression). The mean diirerence between the two values was 2. I ml, or 4.3% of the
VENTRICULAR PHANTOMS
mr ACPIEIIL RDTATIDN *
EXCISED VENTRICLES
Joor ,,-’
Figure 4. Reconsrructed three-dimensional echocardiogmphic (3D Echo1 volumes versus acmal volumes ploued for two observers and compared wiih the line of idenlhy. Linear regression results are aven for the pooled data of both observers.
mean. ObsePer variability was 4.1 ml. or 6.4% of the mean value, for volume (end-diastolic and end-systolic) and 2.4 ml, or 4.9% of Ihe mean, for stroke volume.
Three-dimensional reconstruction: limitations of existing methods. Noninvasive three-dimensional rcconstrnEtion of cardiac stmctnres has been a long-standing but prac-
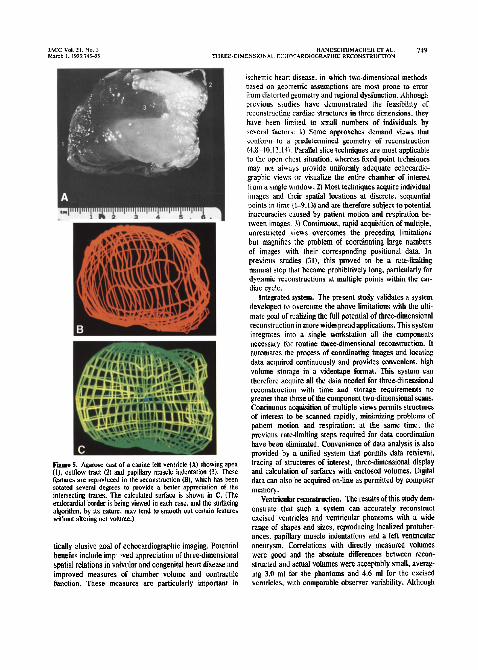
Fire 5. &arose cast of a canine left ventricle IN showing apex (I), oulflow tract (2) and papillary ax& indentaiion (3). These features are rcpwiuced in the reconstruction (B), which has ken rotated sweml degrees to provide a better appreciation of the intetsecling Itaces. The calculated surface is shown ;n C. (The endocardial border is being viewed in each case, and the surfacing algorithm, by 11s nature, may lend IO smooth out certain features without altering net volume.)
tic&y elusive goal of echocardiographic imaging. Polenlial benefits include imp >ved appreciation of three-dimensional spatial relations in valvular and congenilal heart disease and improved measures of chamber volume and contracti!e function. These measures are particularly important in
whrmic heart disease, in which two-dimensional methods based on geometric assumptions are most prone to error kom distorted geometry and regional dysfunction. Alrhough previous studies have demonstrated the feasibility of reconstructing cardiac structures in three dimensions, they have been limited to small numbers of individuals by several facmrs: L) Some approaches demand vkws that conform to a predetermined geometry of reconstruction 14.8-10.12.141. Parallel slice techniques are most applicable to the open chest situation. whereas fixed point techniques may nor aka)rs provide uniforrnIy adequate echocardiw graphic views or visualize the entire chamber of interest from a Gngle window. 2) Most techniques acquire individual images and their spatial localions at discrete, sequential points m time (l-9,13) and are therefore subject to potential inaccuracies caused by patient motion and respiration he- tween images. 3) Continuous, rapid acquisition of multiple. unrestricted views overcomes the preceding limitations but magnifies the problem of cc&inating huge numbers of images with their corresponding positional data. In previous studies (II), this proved to be a rate-limiting manual step that hecame prohibitively long, particularly for dynamic reconstructions at multiple points within the car- diac cycle.
integrated systetn. The present study validates a system developed to overcome the above limitations with the ulti- mate goal of realizing the full potential of three-dimensional reconstruction in more widespread applications. This syslem integrates into a single workstation all the components necessary for routine three-dimensional reconstruction. It automates the process of coordinating images and locating data acquired continuously and provides convenient. high volume storage in a videotape format. This system can therefore acquire all the J&a needed for three-dimensional reconstruction with time and storage requirements no greater than those of the component two-dimensional scans. Continuous acquisition of multiple views permits struCturcs of interest to be scanned rapidly, minidzing problems of patient motion and respiration: at the same time. the previous rate-limiting steps required for data courdination have been eliminated. Convenience of data analysis is also provided by a unilied system that pertnits data rettievat. tracing of structures of interest, three-dimensional display and calculation of surfaces with enclosed volumes. Digital data can also be acquired on-line as permitted by computer memory.
~entt-kttlar txonskttciion. The results of this study dcm- onstrate that such a system can accurately reconstruct excised ventricles and ventricular phantoms with a wide range of shapes and sizes, reproducing localized protuber- ances. papillary muscle indentations and a left ventricular aneurysm. Correlations with directly measured volumes were good and the absolute differences between recon- structed and actual volumes were acceptably small, aver%- ing 3.0 ml for the phantoms and 4.6 ml for the excised ventricles, with comparable observer variability. Although

750 HANWCHUMACHER ET AL. JACC Vol. 21. No. 3 T,,R,=-o,MENStONAL ECHOCARDIOGRAPHIC RECONSTRUCTION MLKh 1. 1993:74>53
Figure 6. A, Agarase cast of a human left ventricle showing apex (I). outflow tract (2) and large anteroapicsl aneurysm (3). demar- cated by arrows. These fealures are repmduced in the reconsirucled traces(B). The calculated surfare is shown in C.
in vitro volumes can be calculated by other methods (2,6,10,14), these results validate the system described, which increases the efiiciency ofdata acquisition and recon- struction; they serve as a foundation for its application to clinical and research questions. The results also show the
Plguuro 7. A, Normal human left vcnlricle reCOnS~NCiCd From apical views in viva at peak systolic contraction. The euduwdial border is shown in yellow with the apex to the left. The left atrium is traced in blue ar,: the aortic mnt in green. A papillary muscle indentation can be seen along the inferior surface of the venuicle, and the curvature of Ihe mitral ring is evident at the ahioventricutarjun tion. B, Superimposed cnducardial borders in systote (yellow) and diaslole in another subject. (The centers of the systolic and diastolic ventricular traces are superimposed.)
initial feasibility of applying this system in human subjects and its ability to provide a quantitative measure of lefi ventricular strllke volume that agrees well with an it-depen- dent method based on tlow. Data from multiple unrestricted imaging planes could, in fact, be rapidly acquired during one breath-holding period and reconstructed to provide a coher-
ent surface. Freedom oftransducer motion permitted acqui- lition to be adapted in the person being examined in order to optimize images, which could include both parastetnal and apical or para-apical views.
Features promoting accuracy. One feature of the system contributing to this accuracy is the ability to review traces in three dimensions, using adjacent and intersecting images to improve border detection. This was particularly helpful for the excised ventricles, in which endocardial border definition was more difficult. Review of the reconstructed traces could readily dexct misalignment between a poor!y visualized border (affected. for example, by lateral drop-
JACC “0,. 2,. No. 3 HAN”scHtJYACHER FT AL. 751 March I. 1993:74l-51 THREE-DIMENS,[,XAI E(‘HOCARBtOGRAPHIC RECONSfRUCTIO~
Figure 8. Letl venn~c~ reconstructed from pamapical longais and pwaslemal short-axis view in viw at end-diastole (A) and with peak systole superimposed (8).
out) and adjacent, better visualized borders. Such traces could be identified and corrected by paging through the
individual two-dimensional images displayed beside the re- construction, highlighting each trace in sequence. In viva. border recognition was also facilitated by the availability of more than one image per cardiac cycle. Another important feature is the ability of the surfacing algorithm ti accept partial (unclosed) traces. This allows use of views which do not include the entire structure of inkresr, and eliminates me need to complete traces in regions of poor border definition. Missing data can be filled in from intersecting views. from other windows, or by the surfacing algorilhm itseif, which bridges gaps between grid points in three dimensions. This reflects an advantage of an algorithm tha: achieves the best fd to data in th,ce-dimensional regions, rather than fitting data to single curves in two-dimensional slices only.
Sources of variabilily. There are scvcral sources of vari- ability in the reconstruction, including I) the resolution of spark-gap location (<I mm by selection of data sets to have
the computed distances between spark gaps differ by no more than that amount from actual values): 2) ultrasound imaging resolution and the uncertainty created by the video rasterline spacing (digital scan conversion; in the millimeter
0 20 40 60 80
DWPtER SV (ml)
Flg~urr 9. Three-dimensional (XX venus Doppler m&e volume WI for the two observers (squarer and trim&s): Ihe line of idenri!y is show.
rmge for a.4 resolution): and 3) observer variability (great- cr for tracing endocsrdial borders in the excised and in viva venb-icles). The results indicate these effecrs are acceptably small in the settings studied. In vivo. respiratory variability may need to be considered and possibly minimized by respiratory gating, alrhougb in a recer study. that did not appear to zffea accuracy (12). In rhe human studies, we were able to obtain all the images needed to reconstruct the
beating human left ventricle from scans during a single held
Table I. Data From Human Studies
Obrerver l Observer 2 Doppler
PI No. EDV ESV 3DSV EDV ESV 3DSV SV
I 113.1 47.1 66.0 109.5 42.2 67.3 70 I 2 56.9 24.6 32.3 60.5 27.1 33.4 35.0 1 Y7.U 42.7 54.3 94.2 44.4 49.8 50.3 4 131.8 la.7 53. I 131.4 74.9 56.5 SO.6 5 96.2 39. I 57 I 97.0 41.5 55.5 SS.2 b bl.? 22.1 40.5 59.8 21.6 38.2 45.8 7 110.2 32.6 47.b 85.6 37.0 48.6 1.4 8 77 7 N.8 46.9 79.8 10.8 49.0 47.6 9 77.9 31.1 467 69.9 24.4 IS .5 44.0
IO w.2 JI.0 49.2 90.8 39.6 51.2 544 II loo.3 41.3 59.0 101.7 39.9 61.8 bt.8 12 75.7 33.2 42.5 X5.6 41.3 44.3 43.9 13 U1.R G.9 43.9 77.2 35.6 41.6 43.2 14 86.7 45.h 41.1 85.5 J6.1 39.4 37.7
Ml resuks ar in ml. EDV = end-dianolic volume: ESV = end-ssrtulic wlunte: h = p&jtl: SV = awake voluine: 3D = rhrcedimcnsional echocw- dtognphy.

expiration (roughly 20 to 30 s) (Fig. 7 and 8). This takes advantage of the ability of the system to acquire views rapidly and continuously with automated spatial registration, thereby Gminating the effect of respiratory motion.
Future work. Transducers provi&ng two simultaneous orthogowd view (32) or multiple riews by phased-array parallel processing (33) should make image acquisition even faster. With improved efficiency of ocyuisirion in this sys- tem, endocardial border detection has become the most time-consuming step. particularly in reconstructing more than one point in the cardiac cycle; this could affect imple- merlation and clinical acceptance. This concern could po- tentbdly be werwme by defining the minimal number of views required (4) and by using new systems for on-line or off-tine border driection based on signal amplitude or the presence of flow to automate or semi-automate border ex*raction with the option of manual editing. Such systems could be particularly strengthened by the availability of a three-dimensional data set that can bridge over gaps in individual two-dimensional images using minimal-cost ftntc- tions tbar optimize the detection of a spatial border (34). Regarding dynamic reconstructions, tracing a second time point (for example, diasmlc) in a given view takes consider- ably less time than tracing the initial image (for example, systole) because of increasing familiarity with the view, In addition, analyzing multiple time points can be facilitated by techniques that, given one ini!ial trace, apply optical flow tracking and simulated annealing techniques of matching corresponding contours lo define borders automatically throughout the rest of the cardiac cycle (35-39). (Although decreased noise in many magnetic resonance images favors automated border extraction, the differentiation ofrelatively stagnant blood pool from myocxdium on standard images can be most difficult in patients with ischemic or myopathic dysfunction. in whom functional evaluation is of greatest importance. Respiration and patient motion must also be considered in reconstruction by nuclear magnetic resonance imaging, which, in its conventianal form, acquires images over multiple (cardiac cycles. Echocardiographic systems, including the current one, have the added advantages of portability acd lower equipment cost.)
Summary. We have developed a system that allows us to integrate images as: positional dafa automatically. with time and storage requirements that are no more than t: ?se for an ordinary two-dimensional cchocardiographic study. Data for three-dimensional reconstruction can ther*;fore he obtained during a routine xhocardiographic examination. This mech- anism greatly simplifies the process of subsequent tracing and reconstruction. The system also integrates the capahil- ities for tracing features and deriving continuous surfaces from them to permit quantita!ive analysis using the full strength of the three-dimensional data set. We have shown that such a system can accurately reconstruct simple objects as well as ventricles of known size and shape. In addition, rapid acquisition of threr-dimensixtal echocardiographic data and quantitative volumetric reconstruction of the left
ventricle in human subjects are both feasible and provide a stroke volume that agrees well with independently measured values. The increased efficiency of data acquisition and reconstruclioi: provided by tbi> sysirm should enhance the applicability of three-dimensional reconstruction to clinical and research questions at this time: the validation studies lay the foundation for such applications.
References
I. Geirer EA. Anet M. Conetla DA. Lupkiewicr SM. Christie LG. Conri CR. Dynamic Ihreedimensional echueanllogti+ic recunz&utlian of Ihr intact human left venlricle: technique and initial observations in padeats. Am Heart J 1981;103:1056-65.
2. hlorilr WE. Pearlman AS. McCabe DH, M&ma DK. *inworth ME. Boles MS. An ukraonic technique for imaging the ventricle in rhret dimensions and calculating ils volume. IEEE Tram Biomcd Eng 1983; RMF-xI1RZ-91.
3. Nixon IV. Saffer St. Liprcomb K. Blomqvisl CG. Threc&r~ennonat cchwentriculamaahv. Am Heart J 1983:106:435-43.
5. Saw& H, Fujii 1. Kam K. Onw M. Kuno K. Three dimensional reconstrucdon of lhs lafl ventricle from multiple cross sectional echocar- diagrams: value for mracuring Irfl ventricular volume. Br Hean J 1983;50:438-42.
6. Linker DT. Morilz WE, Pearlman AS. A new threedimensional echoEar- diognphic method of right ver~lricular volume mearuremrn:: in ~drn validation. J Am Colt Cardmt tYS6z8:tOt-6.
7. RaichIen IS. Trivedi SS. Herman CT. St. John Sutton MC. Reichek N. Dynamic three.dimensional reconstruction of the letl ventricle from two.dimrnsional echasrdiograms. J Am Coil Cardial tY%83361-70.
8. Sapmdkov D, Fim LX% Mars& M. Go&man MS. Left ventricular shape. wall Ihicknesr. and function based an ~hreedimensionat recan- slnlclia” echocardiography. cornput Carda 1%7:495-8.
9. McCann HA. Chandnrrkaran K. Ho&an EA. Sin& Lt. Kinter TM. Greenleaf JF. A melhod for tImedimensional ulwawnic imaging of lhe heat in viva. Dynam Cardiiraac lmagin~ 19+X1:97-109.
10. Buckey JC. Beattie JM, Nixon JV, Ca5wy FA. Blomqvi~l CC. Right and kh venuicular volumes in-vilm by B new nongeometric methat. Am J Card lmaSinS 1%17;1:227-13.
II. Collins SM. Chandran KE, Skarton DJ. Thre~dimenrional cardiac im- aging. EchocardioSraQhy 1988:5:31 l-9.
12. Zoghbi WA. Buckey JC. Massey MA. Blomqvisl CG. DexmIinalion of leh vwri~ulnr volumes with use of a new nongeometric echowdiu graphic melhh.: clinical validation and paleaial application. J Am Coil Cardiol 1%%12:610-7.
II. King DL, King DL Jr. Shao MY. Three-dimcnriorutl @ial regbtndon and interaCtive display of wition and orientation OF real-time ultmmd images. J Ullmsaund Med 1990;9:52S-12.
II. Mcnti GA. Pini R, Monnini E. et al. Three-dimensional rchocardia graphic reconstmction: exwrimentat validation of volume mea~unment tabrlr). J Am Cdl Cardiol 1991~17:29lA.
15. Levine RA, Handrchumachcr MD. Saufihppo A.!. c1 al. Thwc- dimensional echocardiagraphie reconruuction of the r&al valve. with i$g!gs for the diagnosis of mkral valve prolapse. Circulaian 198%
16. Stein&art RM. M&r J, E&wick J, Pattenon R, Herman MV, Teichholz LE. Pulsed Doppler echacardingraphic rneil~urem~~ of bwro-beam changes in woke volume in 3~. Circulation tYSObZ;S42-8.
17. Magnin PA. Stewart JA. Myers S. Kisslo IA. Combined Doppler and
24. Lo;& CP. Goldberg 5). Allen HD. Doppler echwardiographtc compar- ison of Rows dial 10 Ihe four cardiac vali’cs. I Am Coil Cardiui 1984;4:2b?.-72.
regurgllation by Doppler echocurdiognphy. Crc&tion 1986.7Uoh-IJ. 28. Labovitl AJ. Buckingham TA. Habermshl K. N&on J. Kenoedv HL.