A comprehensive echocardiographic method for risk ...
40
Early View Original article A comprehensive echocardiographic method for risk stratification in pulmonary arterial hypertension Stefano Ghio, Valentina Mercurio, Federico Fortuni, Paul R. Forfia, Henning Gall, Ardeschir Ghofrani, Stephen C. Mathai, Jeremy A. Mazurek, Monica Mukherjee, Manuel Richter, Laura Scelsi, Paul M. Hassoun, Khodr Tello, Please cite this article as: Ghio S, Mercurio V, Fortuni F, et al. A comprehensive echocardiographic method for risk stratification in pulmonary arterial hypertension. Eur Respir J 2020; in press (https://doi.org/10.1183/13993003.00513-2020). This manuscript has recently been accepted for publication in the European Respiratory Journal . It is published here in its accepted form prior to copyediting and typesetting by our production team. After these production processes are complete and the authors have approved the resulting proofs, the article will move to the latest issue of the ERJ online. Copyright ©ERS 2020
-
Upload
khangminh22 -
Category
Documents
-
view
0 -
download
0
Transcript of A comprehensive echocardiographic method for risk ...

Early View
Original article
A comprehensive echocardiographic method for
risk stratification in pulmonary arterial
hypertension
Stefano Ghio, Valentina Mercurio, Federico Fortuni, Paul R. Forfia, Henning Gall, Ardeschir Ghofrani,
Stephen C. Mathai, Jeremy A. Mazurek, Monica Mukherjee, Manuel Richter, Laura Scelsi, Paul M.
Hassoun, Khodr Tello,
Please cite this article as: Ghio S, Mercurio V, Fortuni F, et al. A comprehensive
echocardiographic method for risk stratification in pulmonary arterial hypertension. Eur Respir
J 2020; in press (https://doi.org/10.1183/13993003.00513-2020).
This manuscript has recently been accepted for publication in the European Respiratory Journal. It is
published here in its accepted form prior to copyediting and typesetting by our production team. After
these production processes are complete and the authors have approved the resulting proofs, the article
will move to the latest issue of the ERJ online.
Copyright ©ERS 2020
A comprehensive echocardiographic method for risk stratification in pulmonary arterial
hypertension.
Short title: echocardiography-based risk stratification in PAH
Stefano Ghio1*, Valentina Mercurio2,3*, Federico Fortuni1,4*, Paul R. Forfia5, Henning Gall6,
Ardeschir Ghofrani6, Stephen C. Mathai2, Jeremy A. Mazurek7, Monica Mukherjee8, Manuel
Richter6, Laura Scelsi1, Paul M. Hassoun2§, Khodr Tello6§ and TAPSE in PAH investigators (full list in
appendix).
Affiliations:
1Division of Cardiology, Fondazione IRCCS Policlinico San Matteo, Pavia,
2Division of Pulmonary and Critical Care Medicine, Johns Hopkins University School of Medicine,
Baltimore, USA,
3Department of Translational Medical Sciences, Federico II University, Naples, Italy,
4Department of Molecular Medicine, Unit of Cardiology, University of Pavia, Pavia, Italy,
5Pulmonary Hypertension, Right Heart Failure and Pulmonary Thromboendarterectomy Program,
Temple University Hospital, Philadelphia, PA, USA,
6University Hospital Giessen und Marburg GmbH, Pulmonary Hypertension Division, Medical Clinic
II, Giessen, Germany,
7Department of Medicine, Perelman School of Medicine at the University of Pennsylvania,
Philadelphia, PA, USA,
8Division of Cardiology, Johns Hopkins University School of Medicine, Baltimore, USA.
*Drs Ghio, Mercurio and Fortuni contributed equally as co-first authors.
§Drs Hassoun and Tello contributed equally as co-last authors.
Corresponding Author: Stefano Ghio, Divisione di Cardiologia, Fondazione IRCCS Policlinico San
Matteo, Piazza Golgi 19, 27100 Pavia, Italy. E-mail: [email protected]
Funding Information:
VM received a research fellowship grant from the European Respiratory Society.
PMH was funded by NIH/NHLBI R01 HL114910.
Conflict of interest: the authors have no conflict of interest to disclose.
Word count: 2576
Take home message:
The proposed comprehensive echocardiographic approach reflecting both RV pump function and
systemic venous congestion is highly effective in risk stratification of PAH patients, outperforming
the prognostic parameters suggested by current guidelines.
ABSTRACT
Question addressed. Echocardiography is not currently considered as providing sufficient
prognostic information to serve as an integral part of treatment goals in pulmonary arterial
hypertension (PAH). We tested the hypothesis that incorporation of multiple parameters
reflecting right heart function would improve the prognostic value of this imaging modality.
Methods and Main Results. We pooled individual patient data from a total of 517 patients (mean
age 52 ± 15 years, 64.8% females) included in seven observational studies conducted at five
European and United States academic centers. Patients were subdivided into three groups
representing progressive degrees of RV dysfunction based on a combination of echocardiographic
measurements: group 1 (low-risk): normal tricuspid annular plane systolic excursion (TAPSE) and
non-significant tricuspid regurgitation (TR) (n=129); group 2 (intermediate-risk): normal TAPSE and
significant TR or impaired TAPSE and non-dilated inferior vena cava (IVC) (n=256); group 3 (high-
risk): impaired TAPSE and dilated IVC (n=132). The 5-year cumulative survival rate was 82% in
group 1, 63% in group 2, and 43% in group 3. Low-risk patients had better survival rates than
intermediate-risk patients (log-rank χ2: 12.25 p<0.001) and intermediate-risk patients had better
survival rates than high-risk patients (log-rank χ2: 26.25 p<0.001). Inclusion of other parameters
such as right atrial area and pericardial effusion did not provide added prognostic value.
Answer to the question. The proposed echocardiographic approach integrating the evaluation of
TAPSE, TR grade and IVC is effective in stratifying the risk for all-cause mortality in PAH patients,
outperforming the prognostic parameters suggested by current guidelines.
Key words: Pulmonary arterial hypertension; risk stratification; echocardiography

Introduction
The importance of risk stratification has gained significant momentum in the field of pulmonary
arterial hypertension (PAH). In 2015, the European Society of Cardiology/European Respiratory
Society (ESC/ERS) guidelines recommended the use of a broad range of invasive and non-invasive
parameters to assess the mortality risk of PAH patients (1). In 2017, abbreviated versions of this
model were evaluated retrospectively in newly diagnosed PAH cohorts, and further validated in
systemic sclerosis-associated PAH, demonstrating that stratifying patients into low, intermediate
and high-risk groups based upon select measurements predicted mortality (2-6). As suggested in
the most recent recommendations from the 6th World Symposium on Pulmonary Hypertension,
currently approved PAH therapies should be initiated based on risk stratification. Furthermore,
achievement of a low-risk status should be the goal of therapy during follow-up assessment (7).
The National Institutes of Health (NIH) Registry on Primary Pulmonary Hypertension first
demonstrated that mortality best correlates with hemodynamic indices of right ventricular (RV)
function, specifically right atrial pressure (RAP) and cardiac index (CI) (8). Since then, two
hemodynamic variables, i.e. one indicator of pump function (CI or stroke volume index) and one of
systemic congestion (RAP), proved to have pivotal roles in the multidimensional assessment of
prognosis and treatment response in PAH, in association with demographic, clinical, functional,
and biochemical variables (2-6, 9-12).
However, despite extensive literature reporting that a number of echocardiographic variables may
provide significant prognostic information, this imaging modality remains of limited application in
risk stratification and guidance of treatment goals as it is felt to provide insufficient prognostic
information (1). It is noteworthy that a recent statement of the American Thoracic Society
recommends that deriving and validating imaging biomarkers for an accurate evaluation of right
ventricular (RV) function is a major research priority to be addressed in the next 5 years (13). We
surmised that the present limited role of echocardiography might be, at least in part, related to
the use of single best prognostic indicators rather than on the identification of a combination of
parameters which could provide a comprehensive assessment of right heart pump function and of
systemic venous congestion, similar to the established hemodynamic approach.
Accordingly, to test the hypothesis that a comprehensive echocardiographic assessment of RV
function would be highly valuable in the risk stratification of PAH patients, we performed a
patient-level pooled analysis of published studies conducted at our centers, focusing on RV systolic
function, the degree of tricuspid regurgitation and the presence or absence of systemic venous
congestion.
Methods
Study selection
We pooled individual patient data (IPD) from observational studies conducted at our centers that
assessed the prognostic value of echocardiography in patients with PAH. To be eligible for
inclusion, patients had to be characterized with the following echocardiographic parameters: an
index of RV systolic function represented by the tricuspid annular plane systolic excursion (TAPSE),
the degree of tricuspid regurgitation (TR) and a marker of systemic venous congestion represented
by inferior vena cava (IVC) diameter (14-20). The primary outcome of the study was all-cause
mortality. This analysis is part of a study that was registered on PROSPERO (registration number:
CRD42019141216). Two authors (FF, VM) extracted IPD from the selected studies including: study
design, sample size, patient characteristics, World Health Organization/New York Heart
Association (WHO/NYHA) functional class, functional capacity expressed as 6-minute walking
distance, PAH etiology, PAH specific therapy, echocardiographic assessment, follow-up and all-
cause mortality. Data on scheduled lung transplantation were reported only in one study (15)
where 2 patients underwent lung transplantation and their follow-up was censored at the time of
surgery. Data on overlapping population between the studies were excluded.
Statistical analysis
Continuous variables are presented as mean ± standard deviation in case of Gaussian distribution,
and as median (interquartile range) if not normally distributed. Categorical variables are presented
as frequencies and percentages. To assess the hazard ratio (HR) change for all-cause mortality
across a range of TAPSE at baseline, a spline curve analysis was performed. The cut-off value of
TAPSE associated with excess mortality according to the literature was used to define RV systolic
dysfunction (21). According to the pathophysiological aim of the study, three echocardiographic
variables were “a priori” selected: TAPSE, defined as abnormal when 17 mm; TR, defined as
significant if moderate or severe (22); IVC diameter, defined as dilated when >20 mm (21). Based
on the combination of these variables, four echocardiographic risk groups of patients were
identified representing progressive degrees of right heart dysfunction based upon the
presence/absence of RV dysfunction by TAPSE and degree of TR, and presence/absence of
systemic venous congestion by IVC dilatation:
- group 1: normal TAPSE and non-significant TR,
- group 2: normal TAPSE in the presence of significant TR,
- group 3: impaired TAPSE without systemic congestion,
- group 4: impaired TAPSE associated with systemic congestion.
Differences among the groups were analyzed using the one-way analysis of variance (ANOVA) for
continuous variables with Gaussian distribution, the Kruskal-Wallis test for non-normally
distributed continuous variables and the Pearson’s chi-square test for categorical variables. The
Kaplan-Meier curves were used to estimate the 1-, 3- and 5-year survival rates and differences
between groups were analyzed using the Mantel-Cox log-rank test. A multivariable Cox
proportional hazards regression analysis was performed to assess the clinical and
echocardiographic factors that were independently associated with all-cause mortality. Possible
confounders with a significant p-value (p<0.05) in the univariable analysis were selected (taking
into account data availability and collinearity between variables) and included in the multivariable
regression analysis. The proportional-hazards assumption was confirmed using statistics and
graphs on the basis of the Schoenfeld residuals. P values <0.05 were considered significant. All
data were analyzed with SPSS for Windows, version 21 (SPSS Inc, Armonk, NY:IBM Corp) and R
environment 3.4.3 (R Foundation for Statistical Computing) using the “stats” and “survival”
packages.
Results
Studies’ characteristics
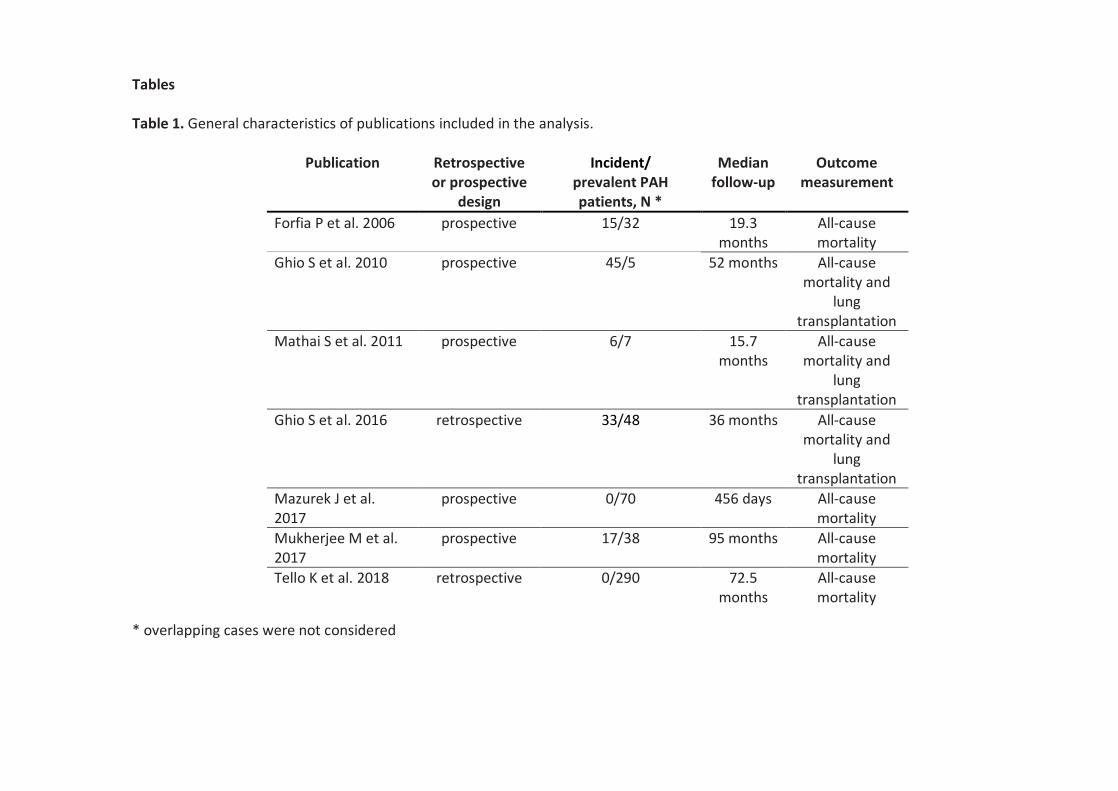
Data from 7 original articles were included in this study. Characteristics of the publications
included in the analysis are presented in Table 1. With the exception of two retrospective studies,
all other studies had a prospective design. The median follow-up ranged from 15 to 95 months.
The outcome measure defined as all-cause mortality was available in all studies.
Patient population
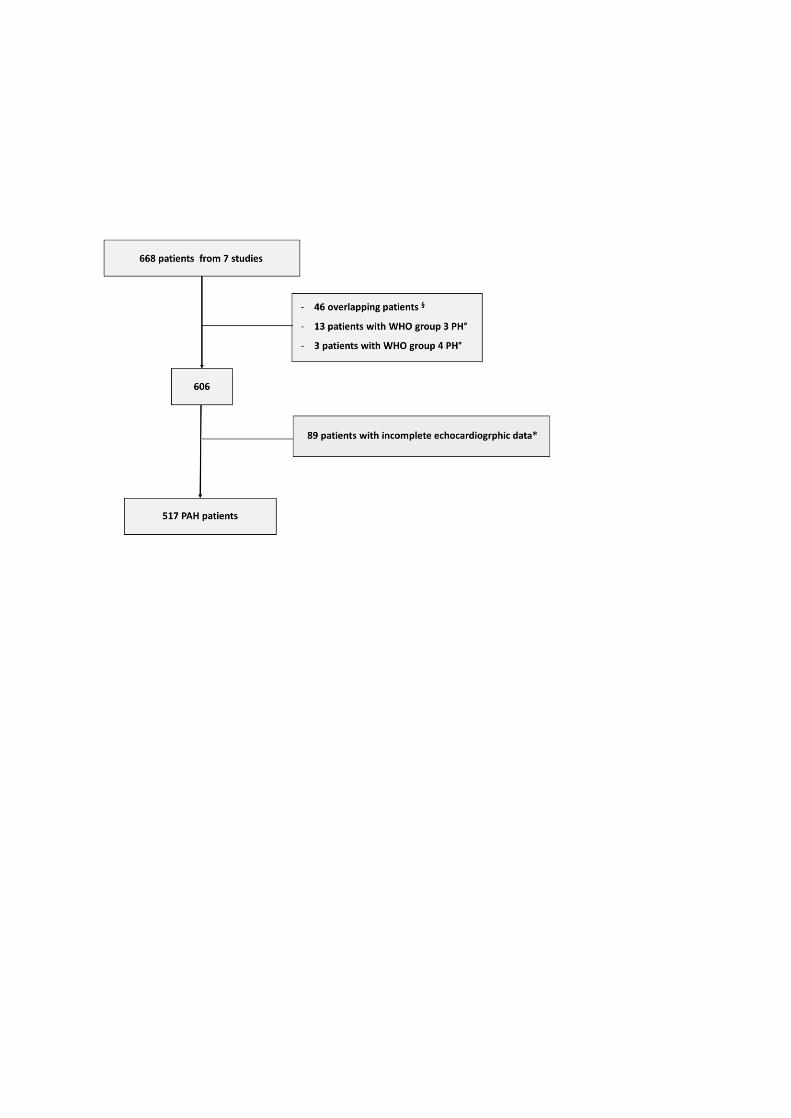
After excluding overlapping patients between studies, patients with no PAH, and with incomplete
echocardiographic data to be classified in one of the 4 echocardiographic groups, a total of 517
patients (mean age 52 ± 15 years, 64.8% females) was included in the analysis (Figure 1): 253
patients from Giessen University, Germany (20); 123 from IRCCS Policlinico San Matteo, Pavia,
Italy (15-16); 71 from the Johns Hopkins Hospital, Baltimore, USA (14,17,19); 70 from the
University of Pennsylvania Hospital and Temple University Hospital, Philadelphia, USA (18). The
main characteristics of the patients included in the study were similar to those excluded due to
missing echocardiographic data (Supplementary Table 1). Clinical and demographic characteristics
of the study population are reported in Table 1. Concerning the aetiology, 64.8% had idiopathic
PAH, 8.9% had scleroderma-associated PAH, and 8.4% had congenital heart disease-associated
PAH. 375 patients (72.5%) were on treatment with PAH-specific drugs (42.7% on monotherapy
and 57.3% on combination therapy) at the time of echocardiographic assessment. Most patients
(66.1%) were in WHO/NYHA functional class III-IV. To investigate the association between TAPSE
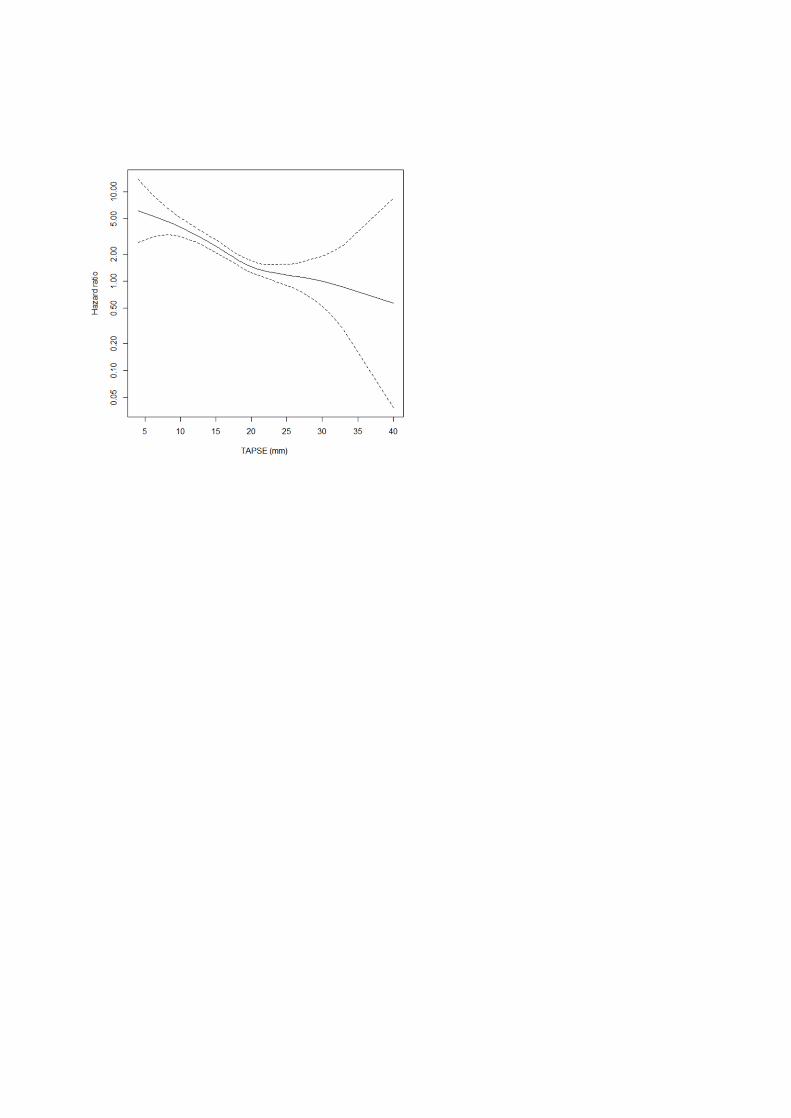
and all-cause mortality, a spline curve analysis was performed. The assumption of linearity for all-
cause mortality, predicted from the baseline TAPSE, was not violated (χ2=2.56, P=0.29), i.e.
demonstrating a nonlinear relation of TAPSE vs. all-cause mortality. The spline curve analysis
showed, after a slow rise in HR, a steady increase in the hazard ratio for all-cause mortality for a
TAPSE of 17 mm and lower (Figure 2). Therefore, based on previous (21) and current findings, we
considered appropriate to identify RV systolic dysfunction as TAPSE ≤17 mm. A total of 129
patients (25%) were in the echocardiographic group 1, 155 patients (30%) in group 2, 101 patients
(19.5%) in group 3, and 132 patients (25.5%) in group 4. There was a statistically significant
difference in WHO functional class and in 6MWD across groups, with the highest percentage of
patients in WHO/NYHA functional class III-IV (p<0.001) as well as the lowest values of 6MWD in
group 4 (p=0.007). Heart rate was the lowest in patients in group 1 (p=0.004).
Echocardiographic data
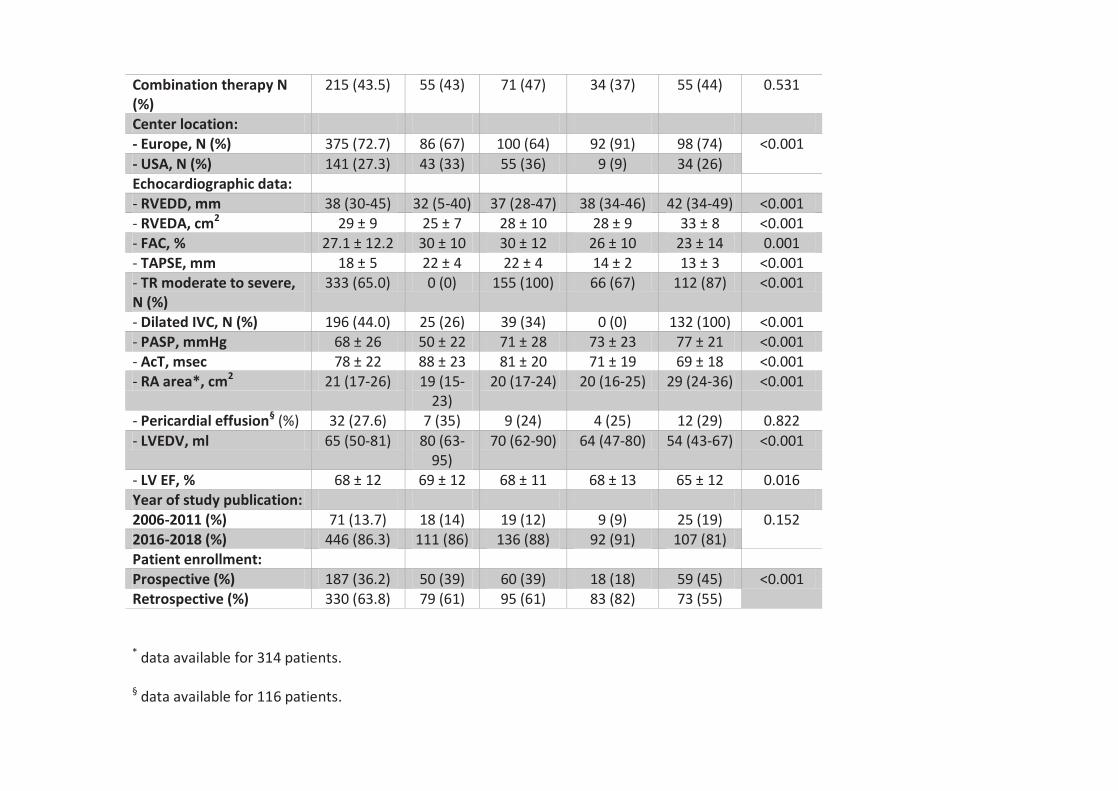
Clinical and echocardiographic characteristics are presented in Table 2. Overall, the study
population had normal left ventricular size and function, while right heart chambers were
increased in dimensions, with a median right atrial area of 21 cm2 (17-26) and a RV end-diastolic
diameter of 38 mm (30-45). TAPSE was impaired (≤17 mm) in 45.1% of patients, with an overall
mean value of 18 ± 5 mm for the entire cohort. Fractional area change was also impaired (≤35%) in
76.6% of patients, with an overall mean value of 27.1 ± 12.2.%. 333 patients (65%) had a
significant TR (TR grade ≥ moderate). Estimated pulmonary artery systolic pressure was 68 ± 26
mmHg, and pulmonary flow acceleration time was 78 ± 22 msec; pericardial effusion was only
present in 27.6% of patients. Clinical and echocardiographic characteristics of the four
echocardiographic risk groups are shown in Table 2. All indices of right heart function and
morphology were increasingly worse from group 1 to group 4.
Outcome data
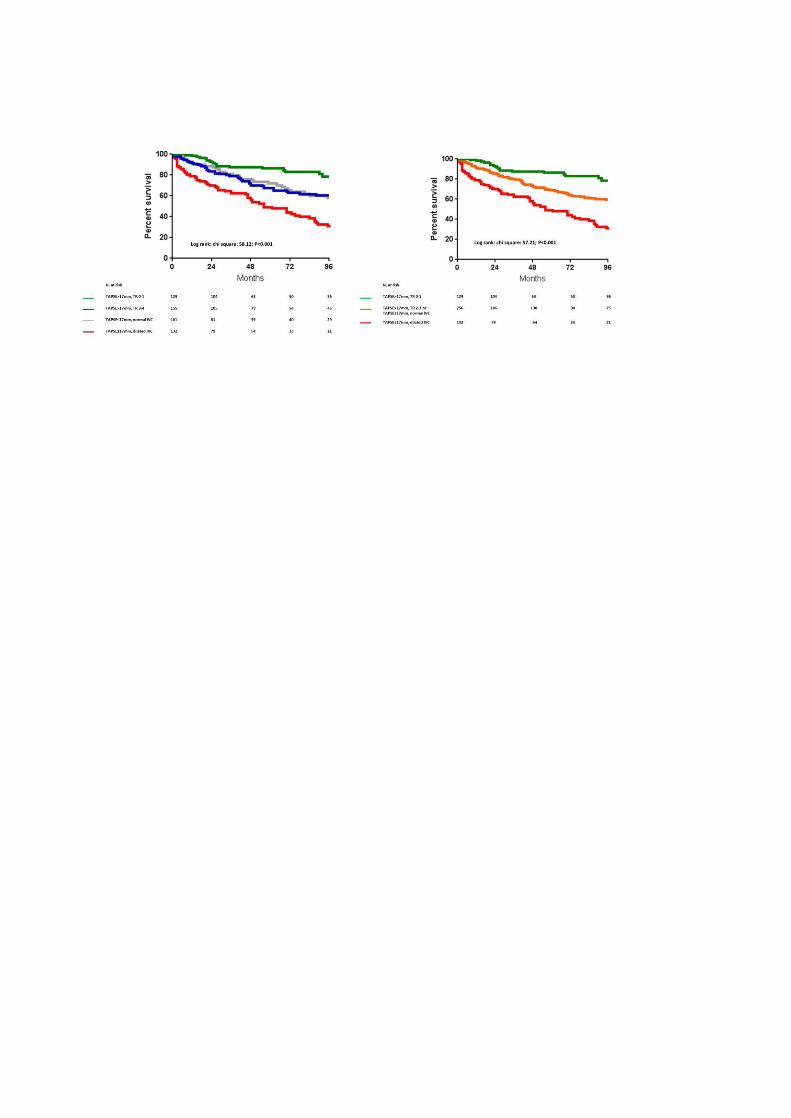
During a median follow-up of 46 (21-99) months, 206 (39.8%) patients died. The Kaplan-Meier
analysis showed lower survival rates in patients with more impaired RV systolic function and with
systemic congestion (group 4) (log-rank χ2 :58.12; p<0.001; Figure 3 - left panel). The survival
rates between groups 2 and 3 did not differ significantly (log-rank chi-square 1.68 p=0.195).
Therefore, we considered appropriate to merge patients belonging to these two groups into one,
thus identifying three echo-derived risk categories which had significantly different survival rates
at follow-up (Figure 3 right panel): low-risk (group 1), intermediate-risk (group 2 and 3) and high-
risk (group 4). The cumulative 1-, 3-, and 5-year survival were: 92%, 87%, and 82% for low-risk;
85%, 73%, and 63% for intermediate-risk; and 68%, 57%, and 43% for high-risk patients. Low-risk
patients had better survival rates than intermediate-risk patients (log-rank χ2: 12.25 p<0.001) and
the latter had better survival rates than high-risk patients (log-rank χ2: 26.25 p<0.001).

At univariable Cox regression analysis the following parameters were associated with all-cause
mortality: older age, male sex, higher heart rate, PAH associated with pulmonary veno-occlusive
disease, connective tissue disease etiology, being an incident patient, being treated before 2011,
WHO/NYHA functional class III/IV, lower 6MWD, impaired RV systolic function, RV dilation, shorter
pulmonary flow acceleration time, higher pulmonary systolic pressure, greater right atrial (RA)
area, systemic congestion, significant TR, and lower left ventricular volume and ejection fraction
(Table 3). In the multivariable analysis after adjusting for potential confounders, intermediate- and
high-risk categories were independently associated with 2.5- and 4.4- fold increased risk of all-
cause mortality compared with low-risk patients. Moreover, these echocardiographically defined
risk categories retained an independent association with all-cause mortality in several
multivariable Cox regression models (Supplementary Table 2S). As shown in Supplementary Figure
1S, the chi-squared of a Cox regression model including a single echocardiographic parameter of
RV systolic dysfunction (TAPSE≤17 mm), systemic congestion (dilated IVC), or significant TR (TR
grade 2-3), significantly increased when these parameters were combined (χ2 change: 15.54
[p<0.001], 41.06 [p<0.001], and 47.96 [p<0.001], respectively). This analysis thus supports the
echocardiographic-group risk stratification based on the combination of these three variables.
Importantly, the presence of pericardial effusion was not associated with all-cause mortality at
univariate analysis; in addition, although RA area showed an independent association with the
primary outcome (Supplementary Table 3S), its additive value was outperformed by the proposed
echocardiographic risk stratification model (Supplementary Figure 2S).
Discussion
The main finding of the present study is the demonstration that a comprehensive assessment of
right heart function, easily obtainable through the combination of an echocardiographic indicator
of the systolic function of the right ventricle associated with the degree of tricuspid regurgitation
and an estimate of systemic venous congestion, can provide an accurate prognostic stratification
of PAH patients, outperforming the prognostic value of the parameters suggested by current
guidelines.
There is a sound physiological rationale for the proposed combination of echocardiographic
parameters. First, it is important to acknowledge that the assessment of ventricular function using
imaging methodologies is limited by the load-dependency of all parameters assessing cardiac
motion, whether they are volume-based as in ejection fraction, or area-based as in fractional area
change, or single plane-based such as TAPSE. Indeed, the presence of significant atrio-ventricular
valve regurgitation inevitably leads to an overestimation of the systolic function of the left/right
ventricle if this is based only on the analysis of ventricular motion. As a matter of fact, patients
with normal TAPSE with absent or trivial TR had a significantly better prognosis than those with
normal TAPSE associated with moderate to severe TR.
Patients with reduced TAPSE were further sub-grouped according to the absence or presence of
dilated IVC. The rationale for this subdivision is simply based on the fact that the presence of
reduced TAPSE and dilated IVC identifies PAH patients having impaired RV systolic function
associated with systemic venous congestion. This is consistent with the observation in heart
failure from left heart disease where patients with severe left ventricular dysfunction have a
better exercise tolerance and improved prognosis if their pulmonary artery wedge pressure is
normal (i.e. if there is no pulmonary congestion) (23). Our results clearly indicate that patients
with reduced TAPSE without dilated IVC had a significantly better prognosis compared to patients
with reduced TAPSE and dilated IVC.
The major strength of the present study is that the proposed methodology uses a combination of
simply and widely available echocardiographic parameters that reflect a comprehensive
assessment of right heart function, thus conforming with the results of multiple seminal invasive
hemodynamic studies that have demonstrated the association of an indicator of pump function
and one of systemic venous congestion is the best prognostic predictor in PAH (2-4, 7-12).
Importantly, the results of this study might pave the way for testing future, potentially more
sensitive, parameters mirroring RV systolic function or the degree of TR or systemic venous
congestion. In particular, three-dimensional analysis of RV volumes and ejection fraction, or two-
or three-dimensional assessment of RV strain or indices of ventriculo-arterial coupling might be
tested to replace TAPSE (24). The quantification of TR regurgitation is known to be a challenging
task for echocardiographists, and a most recent position statement specifies that new parameters
should be identified and validated in prospective outcome studies (25). Finally, the best modality
to assess the prognostic relevance of right atrial function needs to be further clarified (26).
Importantly, this proposed comprehensive risk stratification model was superior to single
echocardiographic parameters recommended by current PAH Guidelines. Pericardial effusion was
not associated with all-cause mortality in our study. In addition, while RA area was associated with
all-cause mortality, this finding provided no added value to the comprehensive echocardiographic
assessment.
Limitations
A major limitation of the present study is its retrospective nature with the inclusion of a limited
amount of studies on the topic. As a matter of fact, this is a pooled analysis of 7 studies conducted
at 5 institutions which may represent a source of selection bias. However, this limitation is
partially overcome by the large number of patients enrolled in referral centers with great
expertise in the echocardiographic evaluation of PAH, including prevalent and incident patients
with different forms of PAH. In addition, we have included several variables in Cox regression
analysis (i.e. study design, year of publication, incident/prevalent patients, site of
enrollment) that partially allow taking into account between-studies heterogeneity. Another
important limitation of the present study is the lack of integration of the proposed
echocardiographic assessment, in a multidimensional tool including all the hemodynamic, clinical,
functional, and biochemical variables suggested by international guidelines. This should be
addressed in future prospective studies. Similarly, since some studies suggest that treatment with
PAH-specific drugs have beneficial effects on various echocardiographic parameters of RV
morphology and function (24), the relevance of follow-up assessment using the proposed
echocardiographic approach should be further explored. Echocardiographic variables are clearly
preferable for serial evaluations compared to risk assessment tools incorporating invasive
hemodynamic variables. They are also more practical and less costly, albeit less accurate,
compared to other imaging techniques, such as cardiac magnetic resonance, that recently
demonstrated to be useful in improving risk stratification of PAH patients (27).
Conclusion
Our study underlines the prognostic importance in PAH patients of combining individual
echocardiographic parameters into a comprehensive physiological approach reflecting both RV
pump function and systemic venous congestion. If validated in prospective studies and in cohorts
of patients with different types of PAH, this approach could refine the current guideline
recommendations related to echocardiography in assessing prognosis and stratification of PAH,
which are currently limited to the assessment of the right atrial area and the presence of
pericardial effusion.
Funding Sources
The study was not funded
Disclosures
VM received a research fellowship grant from European Respiratory Society. All authors declare no
conflict of interests.
References
1) Galiè N, Humbert M, Vachiery JL, Gibbs S, Lang I, Torbicki A, Simonneau G, Peacock A, Vonk
Noordegraaf A, Beghetti M, Ghofrani A, Gomez Sanchez MA, Hansmann G, Klepetko W, Lancellotti
P, Matucci M, McDonagh T, Pierard LA, Trindade PT, Zompatori M, Hoeper M. 2015 ESC/ERS
Guidelines for the diagnosis and treatment of pulmonary hypertension. The Joint Task Force for
the Diagnosis and Treatment of Pulmonary Hypertension of the European Society of Cardiology
(ESC) and the European Respiratory Society (ERS). Eur Respir J 2015; 46: 903–975.
2) Kylhammar D, Kjellström B, Hjalmarsson C, Jansson K, Nisell M, Söderberg S, Wikström G,
Rådegran G. A comprehensive risk stratification at early follow-up determines prognosis in
pulmonary arterial hypertension. Eur Heart J 2018; 39: 4175-4181.
3) Boucly A, Weatherald J, Savale L, Jaïs X, Cottin V, Prevot G, Picard F, de Groote P, Jevnikar M,
Bergot E, Chaouat A, Chabanne C, Bourdin A, Parent F, Montani D, Simonneau G, Humbert M,
Sitbon O. Risk assessment, prognosis and guideline implementation in pulmonary arterial
hypertension. Eur Respir J 2017; Aug 3;50(2).
4) Hoeper MM, Kramer T, Pan Z, Eichstaedt CA, Spiesshoefer J, Benjamin N, Olsson KM, Meyer K,
Vizza CD, Vonk-Noordegraaf A, Distler O, Opitz C, Gibbs JSR, Delcroix M, Ghofrani HA, Huscher D,
Pittrow D, Rosenkranz S, Grünig E. Mortality in pulmonary arterial hypertension: prediction by the
2015 European pulmonary hypertension guidelines risk stratification model. Eur Respir J 2017; Aug
3;50(2).
5) Weatherald J, Boucly A, Launay D, Cottin V, Prévot G, Bourlier D, Dauphin C, Chaouat A, Savale
L, Jaïs X, Jevnikar M, Traclet J, De Groote P, Simonneau G, Hachulla E, Mouthon L, Montani D,
Humbert M, Sitbon O. Haemodynamics and serial risk assessment in systemic sclerosis associated
pulmonary arterial hypertension. Eur Respir J 2018; 52. pii: 1800678.
6) Mercurio V, Diab N, Peloquin G, Housten-Harris T, Damico R, Kolb TM, Mathai SC, Hassoun PM.
Risk assessment in scleroderma patients with newly diagnosed pulmonary arterial hypertension:
application of the ESC/ERS risk prediction model. Eur Respir J 2018; 52. pii: 1800497.
7) Galiè N, Channick RN, Frantz RP, Grünig E, Jing ZC, Moiseeva O, Preston IR, Pulido T, Safdar Z,
Tamura Y, McLaughlin VV. Risk stratification and medical therapy of pulmonary arterial
hypertension. Eur Respir J 2019; Jan24;53(1).
8) D'Alonzo GE, Barst RJ, Ayres SM, Bergofsky EH, Brundage BH, Detre KM, Fishman AP, Goldring
RM, Groves BM, Kernis JT, et al. Survival in patients with primary pulmonary hypertension. Results
from a national prospective registry. Ann Intern Med 1991; 115: 343–349.
9) McLaughlin VV, Shillington A, Rich S. Survival in primary hypertension - The impact of
Epoprostenol therapy. Circulation 2002; 106: 1477-1482.
10) Sitbon O, Humbert M, Nunes H, Parent F, Garcia G, Herve P, Rainisio M, Simonneau G. Long-
term intravenous epoprostenol infusion in primary pulmonary hypertension: prognostic factors
and survival. J Am Coll Cardiol 2002; 40: 780-788.
11) Campo A, Mathai SC, Le Pavec J, Zaiman AL, Hummers LK, Boyce D, Housten T, Champion HC,
Lechtzin N, Wigley FM, Girgis RE, Hassoun PM. Hemodynamic predictors of survival in
scleroderma-related pulmonary arterial hypertension. Am J Respir Crit Care Med 2010; 182: 252-
260.
12) Weatherald J, Boucly A, Chemla D, Savale L, Peng M, Jevnikar M, Jaïs X, Taniguchi Y, O'Connell
C, Parent F, Sattler C, Hervé P, Simonneau G, Montani D, Humbert M, Adir Y, Sitbon O. Prognostic
Value of Follow-Up Hemodynamic Variables After Initial Management in Pulmonary Arterial
Hypertension. Circulation 2018; 137: 693-704.
13) Lahm T, Douglas IS, Archer SL, Bogaard HJ, Chesler NC, Haddad F, Hemnes AR, Kawut SM, Kline
JA, Kolb TM, Mathai SC, Mercier O, Michelakis ED, Naeije R, Tuder RM, Ventetuolo CE, Vieillard-
Baron A, Voelkel NF, Vonk-Noordegraaf A, Hassoun PM; American Thoracic Society Assembly on
Pulmonary Circulation. Assessment of Right Ventricular Function in the Research Setting:
Knowledge Gaps and Pathways Forward. An Official American Thoracic Society Research
Statement. Am J Respir Crit Care Med 2018; 198:e15-e43.
14) Forfia PR, Fisher MR, Mathai SC, Housten-Harris T, Hemnes AR, Borlaug BA, Chamera E,
Corretti MC, Champion HC, Abraham TP, Girgis RE, Hassoun PM. Tricuspid annular displacement
predicts survival in pulmonary hypertension. Am J Respir Crit Care Med 2006; 174: 1034-1041.
15) Ghio S, Klersy C, Magrini G, D'Armini AM, Scelsi L, Raineri C, Pasotti M, Serio A, Campana C,
Viganò M. Prognostic relevance of the echocardiographic assessment of right ventricular function
in patients with idiopathic pulmonary arterial hypertension. Int J Cardiol 2010; 140: 272-278.
16) Ghio S, Pica S, Klersy C, Guzzafame E, Scelsi L, Raineri C, Turco A, Schirinzi S, Visconti LO.
Prognostic value of TAPSE after therapy optimisation in patients with pulmonary arterial
hypertension is independent of the haemodynamic effects of therapy. Open Heart 2016; 3(1).
17) Mathai SC, Sibley CT, Forfia PR, Mudd JO, Fisher MR, Tedford RJ, Lechtzin N, Boyce D,
Hummers LK, Housten T, Zaiman AL, Girgis RE, Hassoun PM. Tricuspid annular plane systolic
excursion is a robust outcome measure in systemic sclerosis-associated pulmonary arterial
hypertension. J Rheumatol 2011; 38: 2410-2418.
18) Mazurek JA, Vaidya A, Mathai SC, Roberts JD, Forfia PR. Follow-up tricuspid annular plane
systolic excursion predicts survival in pulmonary arterial hypertension. Pulm Circ 2017; 7: 361-371.
19) Mukherjee M, Mercurio V, Tedford RJ, Shah AA, Hsu S, Mullin CJ, Sato T, Damico R, Kolb TM,
Mathai SC, Hassoun PM. Right ventricular longitudinal strain is diminished in systemic sclerosis
compared with idiopathic pulmonary arterial hypertension. Eur Respir J 2017 Nov 22; 50(5).
20) Tello K, Axmann J, Ghofrani HA, Naeije R, Narcin N, Rieth A, Seeger W, Gall H, Richter MJ.
Relevance of the TAPSE/PASP ratio in pulmonary arterial hypertension. Int J Cardiol 2018; 266:
229-235.
21) Lang RM, Badano LP, Mor-Avi V, Afilalo J, Armstrong A, Ernande L, Flachskampf FA, Foster E,
Goldstein SA, Kuznetsova T, Lancellotti P, Muraru D, Picard MH, Rietzschel ER, Rudski L, Spencer
KT, Tsang W, Voigt JU. Recommendations for cardiac chamber quantification by echocardiography
in adults: an update from the American Society of Echocardiography and the European Association
of Cardiovascular Imaging. J Am Soc Echocardiogr 2015; 28: 1-39.
22) Zoghbi WA, Adams D, Bonow RO, Enriquez-Sarano M, Foster E, Grayburn PA, Hahn RT, Han Y,
Hung J, Lang RM, Little SH, Shah DJ, Shernan S, Thavendiranathan P, Thomas JD, Weissman NJ.
Recommendations for Noninvasive Evaluation of Native Valvular Regurgitation: A Report from the
American Society of Echocardiography Developed in Collaboration with the Society for
Cardiovascular Magnetic Resonance. J Am Soc Echocardiogr 2017; 30: 303-371.
23) Meta-analysis Research Group in Echocardiography (MeRGE) Heart Failure Collaborators.
Independence of restrictive filling pattern and LV ejection fraction with mortality in heart failure:
An individual patient meta-analysis. Eur J Heart Fail 2008; 10: 786-792.
24) Mercurio V, Mukherjee M, Tedford RJ, Zamanian RT, Khair RM, Sato T, Minai OA, Torres F,
Girgis RE, Chin K, Damico R, Kolb TM, Mathai SC, Hassoun PM. Improvement in Right Ventricular
Strain with Ambrisentan and Tadalafil Upfront Therapy in Scleroderma-associated Pulmonary
Arterial Hypertension. Am J Respir Crit Care Med 2018; 197: 388-391.
25) Badano LP, Hahn R, Rodríguez-Zanella H, Araiza Garaygordobil D, Ochoa-Jimenez RC, Muraru
D. Morphological Assessment of the Tricuspid Apparatus and Grading Regurgitation Severity in
Patients With Functional Tricuspid Regurgitation: Thinking Outside the Box. JACC Cardiovasc
Imaging 2019; 12: 652-664.
26) Richter MJ, Fortuni F, Wieganda MA, Dalmera A, Vanderpool R, Ghofrani HA MD; Naeije R,
Rollerg F, Seeger W, Sommer N, Gall H, Ghio S, Tello K. Association of Right Atrial Conduit Phase
with Right Ventricular Lusitropic Function in Pulmonary Hypertension. Int J Cardiovasc Imaging.
2020; 36: 633-642.
27) Lewis RA, Johns CS, Cogliano M, Capener D, Tubman E, Elliot CA, Charalampopoulos A, Sabroe
I, Thompson AAR, Billings CG, Hamilton N, Baster K, Laud PJ, Hickey PM, Middleton J, Armstrong IJ,
Hurdman JA, Lawrie A, Rothman AMK, Wild JM, Condliffe R, Swift AJ, Kiely DG. Identification of
Cardiac Magnetic Resonance Imaging Thresholds for Risk Stratification in Pulmonary Arterial
Hypertension. Am J Respir Crit Care Med 2020; 201: 458-468.
Tables
Table 1. General characteristics of publications included in the analysis.
* overlapping cases were not considered
Publication Retrospective or prospective
design
Incident/ prevalent PAH patients, N *
Median follow-up
Outcome measurement
Forfia P et al. 2006 prospective 15/32 19.3 months
All-cause mortality
Ghio S et al. 2010 prospective 45/5 52 months All-cause mortality and
lung transplantation
Mathai S et al. 2011 prospective 6/7 15.7 months
All-cause mortality and
lung transplantation
Ghio S et al. 2016 retrospective 33/48 36 months All-cause mortality and
lung transplantation
Mazurek J et al. 2017
prospective 0/70 456 days All-cause mortality
Mukherjee M et al. 2017
prospective 17/38 95 months All-cause mortality
Tello K et al. 2018 retrospective 0/290 72.5 months
All-cause mortality
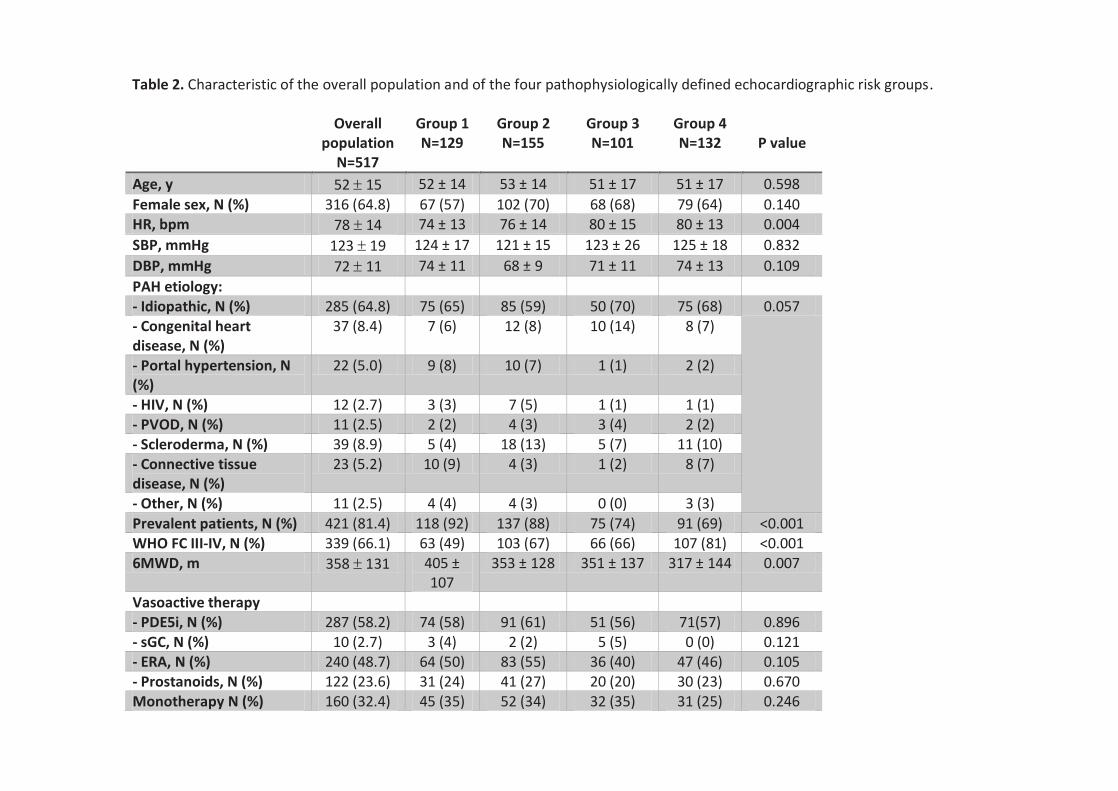
Table 2. Characteristic of the overall population and of the four pathophysiologically defined echocardiographic risk groups.
Overall population
N=517
Group 1 N=129
Group 2 N=155
Group 3 N=101
Group 4 N=132
P value
Age, y 52 15 52 ± 14 53 ± 14 51 ± 17 51 ± 17 0.598
Female sex, N (%) 316 (64.8) 67 (57) 102 (70) 68 (68) 79 (64) 0.140 HR, bpm 78 14 74 ± 13 76 ± 14 80 ± 15 80 ± 13 0.004
SBP, mmHg 123 19 124 ± 17 121 ± 15 123 ± 26 125 ± 18 0.832
DBP, mmHg 72 11 74 ± 11 68 ± 9 71 ± 11 74 ± 13 0.109
PAH etiology: - Idiopathic, N (%) 285 (64.8) 75 (65) 85 (59) 50 (70) 75 (68) 0.057 - Congenital heart disease, N (%)
37 (8.4) 7 (6) 12 (8) 10 (14) 8 (7)
- Portal hypertension, N (%)
22 (5.0) 9 (8) 10 (7) 1 (1) 2 (2)
- HIV, N (%) 12 (2.7) 3 (3) 7 (5) 1 (1) 1 (1) - PVOD, N (%) 11 (2.5) 2 (2) 4 (3) 3 (4) 2 (2) - Scleroderma, N (%) 39 (8.9) 5 (4) 18 (13) 5 (7) 11 (10) - Connective tissue disease, N (%)
23 (5.2) 10 (9) 4 (3) 1 (2) 8 (7)
- Other, N (%) 11 (2.5) 4 (4) 4 (3) 0 (0) 3 (3)
Prevalent patients, N (%) 421 (81.4) 118 (92) 137 (88) 75 (74) 91 (69) <0.001 WHO FC III-IV, N (%) 339 (66.1) 63 (49) 103 (67) 66 (66) 107 (81) <0.001 6MWD, m 358 131 405 ±
107 353 ± 128 351 ± 137 317 ± 144 0.007
Vasoactive therapy - PDE5i, N (%) 287 (58.2) 74 (58) 91 (61) 51 (56) 71(57) 0.896 - sGC, N (%) 10 (2.7) 3 (4) 2 (2) 5 (5) 0 (0) 0.121 - ERA, N (%) 240 (48.7) 64 (50) 83 (55) 36 (40) 47 (46) 0.105 - Prostanoids, N (%) 122 (23.6) 31 (24) 41 (27) 20 (20) 30 (23) 0.670 Monotherapy N (%) 160 (32.4) 45 (35) 52 (34) 32 (35) 31 (25) 0.246
Combination therapy N (%)
215 (43.5) 55 (43) 71 (47) 34 (37) 55 (44) 0.531
Center location: - Europe, N (%) 375 (72.7) 86 (67) 100 (64) 92 (91) 98 (74) <0.001
- USA, N (%) 141 (27.3) 43 (33) 55 (36) 9 (9) 34 (26) Echocardiographic data: - RVEDD, mm 38 (30-45) 32 (5-40) 37 (28-47) 38 (34-46) 42 (34-49) <0.001 - RVEDA, cm2 29 ± 9 25 ± 7 28 ± 10 28 ± 9 33 ± 8 <0.001 - FAC, % 27.1 ± 12.2 30 ± 10 30 ± 12 26 ± 10 23 ± 14 0.001 - TAPSE, mm 18 ± 5 22 ± 4 22 ± 4 14 ± 2 13 ± 3 <0.001 - TR moderate to severe, N (%)
333 (65.0) 0 (0) 155 (100) 66 (67) 112 (87) <0.001
- Dilated IVC, N (%) 196 (44.0) 25 (26) 39 (34) 0 (0) 132 (100) <0.001 - PASP, mmHg 68 ± 26 50 ± 22 71 ± 28 73 ± 23 77 ± 21 <0.001 - AcT, msec 78 ± 22 88 ± 23 81 ± 20 71 ± 19 69 ± 18 <0.001 - RA area*, cm2 21 (17-26) 19 (15-
23) 20 (17-24) 20 (16-25) 29 (24-36) <0.001
- Pericardial effusion§ (%) 32 (27.6) 7 (35) 9 (24) 4 (25) 12 (29) 0.822
- LVEDV, ml 65 (50-81) 80 (63-95)
70 (62-90) 64 (47-80) 54 (43-67) <0.001
- LV EF, % 68 ± 12 69 ± 12 68 ± 11 68 ± 13 65 ± 12 0.016 Year of study publication: 2006-2011 (%) 71 (13.7) 18 (14) 19 (12) 9 (9) 25 (19) 0.152 2016-2018 (%) 446 (86.3) 111 (86) 136 (88) 92 (91) 107 (81) Patient enrollment: Prospective (%) 187 (36.2) 50 (39) 60 (39) 18 (18) 59 (45) <0.001 Retrospective (%) 330 (63.8) 79 (61) 95 (61) 83 (82) 73 (55)
* data available for 314 patients.
§ data available for 116 patients.
All percentages are calculated based on data availability for each parameter.
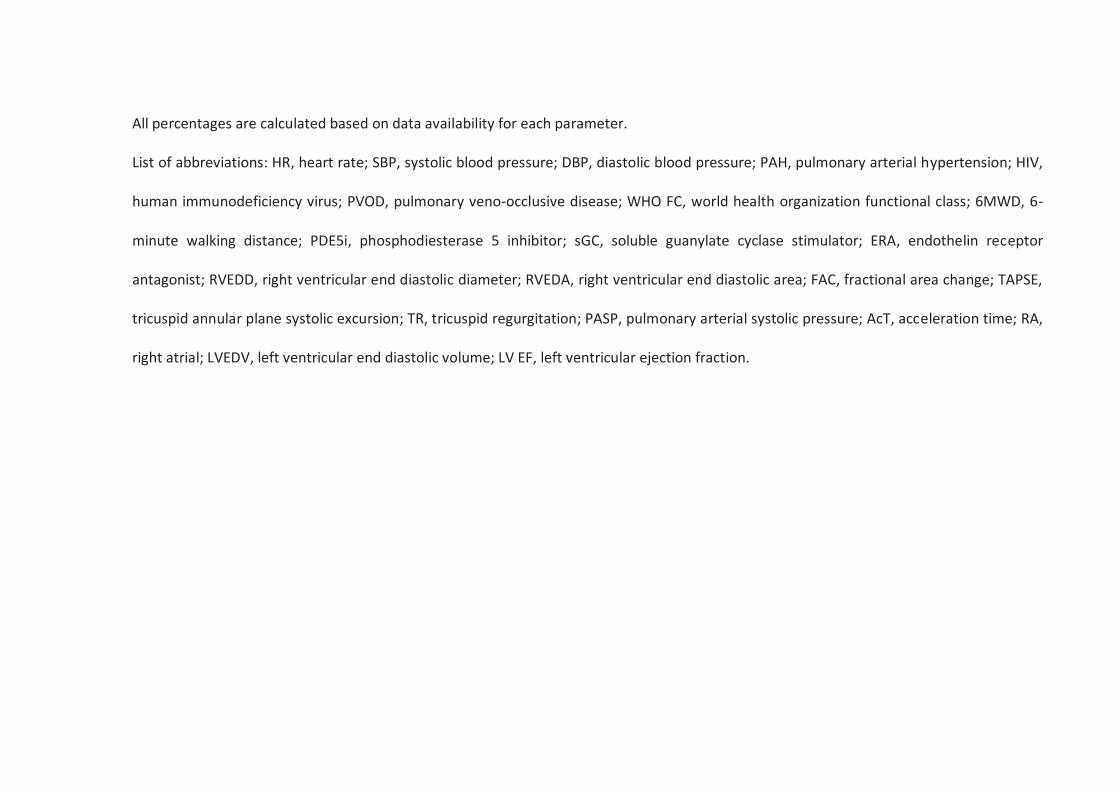
List of abbreviations: HR, heart rate; SBP, systolic blood pressure; DBP, diastolic blood pressure; PAH, pulmonary arterial hypertension; HIV,
human immunodeficiency virus; PVOD, pulmonary veno-occlusive disease; WHO FC, world health organization functional class; 6MWD, 6-
minute walking distance; PDE5i, phosphodiesterase 5 inhibitor; sGC, soluble guanylate cyclase stimulator; ERA, endothelin receptor
antagonist; RVEDD, right ventricular end diastolic diameter; RVEDA, right ventricular end diastolic area; FAC, fractional area change; TAPSE,
tricuspid annular plane systolic excursion; TR, tricuspid regurgitation; PASP, pulmonary arterial systolic pressure; AcT, acceleration time; RA,
right atrial; LVEDV, left ventricular end diastolic volume; LV EF, left ventricular ejection fraction.
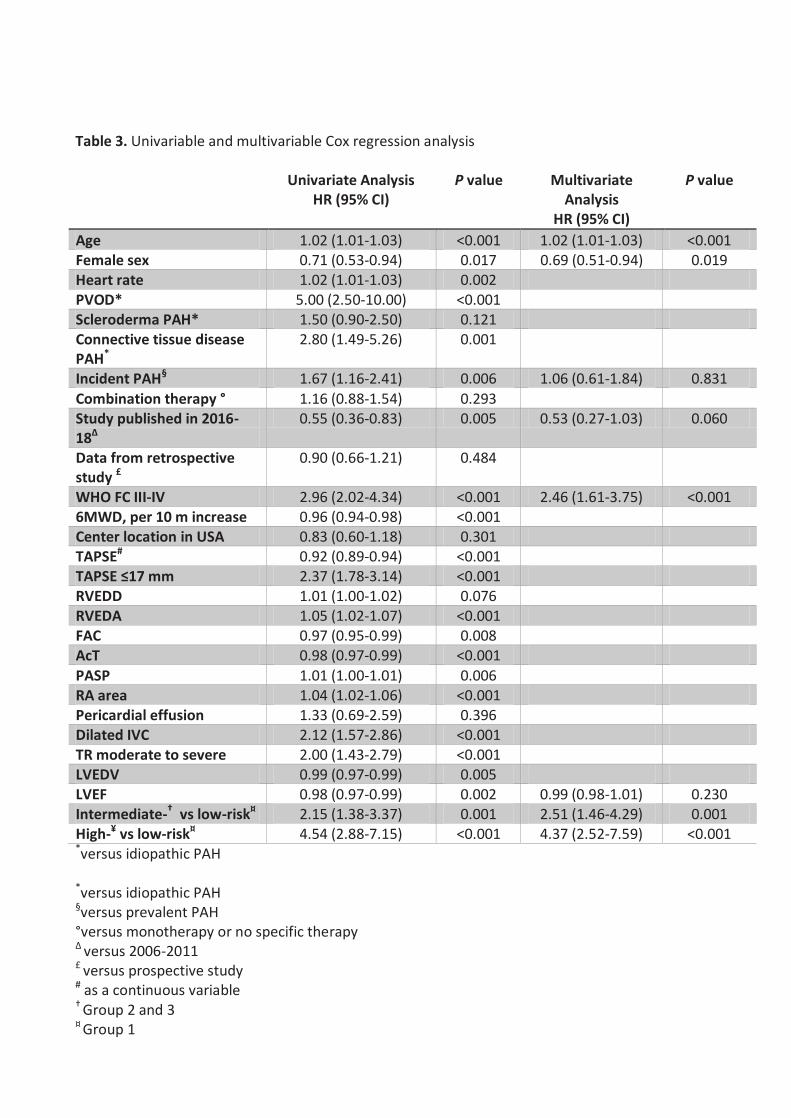
Table 3. Univariable and multivariable Cox regression analysis
Univariate Analysis HR (95% CI)
P value Multivariate Analysis
HR (95% CI)
P value
Age 1.02 (1.01-1.03) <0.001 1.02 (1.01-1.03) <0.001 Female sex 0.71 (0.53-0.94) 0.017 0.69 (0.51-0.94) 0.019 Heart rate 1.02 (1.01-1.03) 0.002 PVOD* 5.00 (2.50-10.00) <0.001 Scleroderma PAH* 1.50 (0.90-2.50) 0.121 Connective tissue disease PAH*
2.80 (1.49-5.26) 0.001
Incident PAH§ 1.67 (1.16-2.41) 0.006 1.06 (0.61-1.84) 0.831
Combination therapy ° 1.16 (0.88-1.54) 0.293 Study published in 2016-18Δ
0.55 (0.36-0.83) 0.005 0.53 (0.27-1.03) 0.060
Data from retrospective study £
0.90 (0.66-1.21) 0.484
WHO FC III-IV 2.96 (2.02-4.34) <0.001 2.46 (1.61-3.75) <0.001 6MWD, per 10 m increase 0.96 (0.94-0.98) <0.001 Center location in USA 0.83 (0.60-1.18) 0.301 TAPSE# 0.92 (0.89-0.94) <0.001 TAPSE ≤17 mm 2.37 (1.78-3.14) <0.001 RVEDD 1.01 (1.00-1.02) 0.076 RVEDA 1.05 (1.02-1.07) <0.001 FAC 0.97 (0.95-0.99) 0.008 AcT 0.98 (0.97-0.99) <0.001
PASP 1.01 (1.00-1.01) 0.006 RA area 1.04 (1.02-1.06) <0.001 Pericardial effusion 1.33 (0.69-2.59) 0.396 Dilated IVC 2.12 (1.57-2.86) <0.001 TR moderate to severe 2.00 (1.43-2.79) <0.001 LVEDV 0.99 (0.97-0.99) 0.005 LVEF 0.98 (0.97-0.99) 0.002 0.99 (0.98-1.01) 0.230 Intermediate-† vs low-risk¤ 2.15 (1.38-3.37) 0.001 2.51 (1.46-4.29) 0.001 High-¥ vs low-risk¤ 4.54 (2.88-7.15) <0.001 4.37 (2.52-7.59) <0.001 *versus idiopathic PAH
*versus idiopathic PAH §versus prevalent PAH °versus monotherapy or no specific therapy Δ versus 2006-2011 £ versus prospective study # as a continuous variable † Group 2 and 3 ¤ Group 1
¥ Group 4
List of abbreviations: HR, hazard ratio; CI, confidence interval; PAH, pulmonary arterial
hypertension; WHO FC, world health organization functional class; 6MWD, six-minute walking
distance; TAPSE, tricuspid annular plane systolic excursion; RVEDD, right ventricular end diastolic
diameter; RVEDA, right ventricular end diastolic area; FAC, fractional area change; AcT,
acceleration time; PASP, pulmonary arterial systolic pressure; RA, right atrial; ICV, inferior vena
cava; TR, tricuspid regurgitation; LVEDV, left ventricular end diastolic volume; LV EF, left
ventricular ejection fraction.
Figures Legends
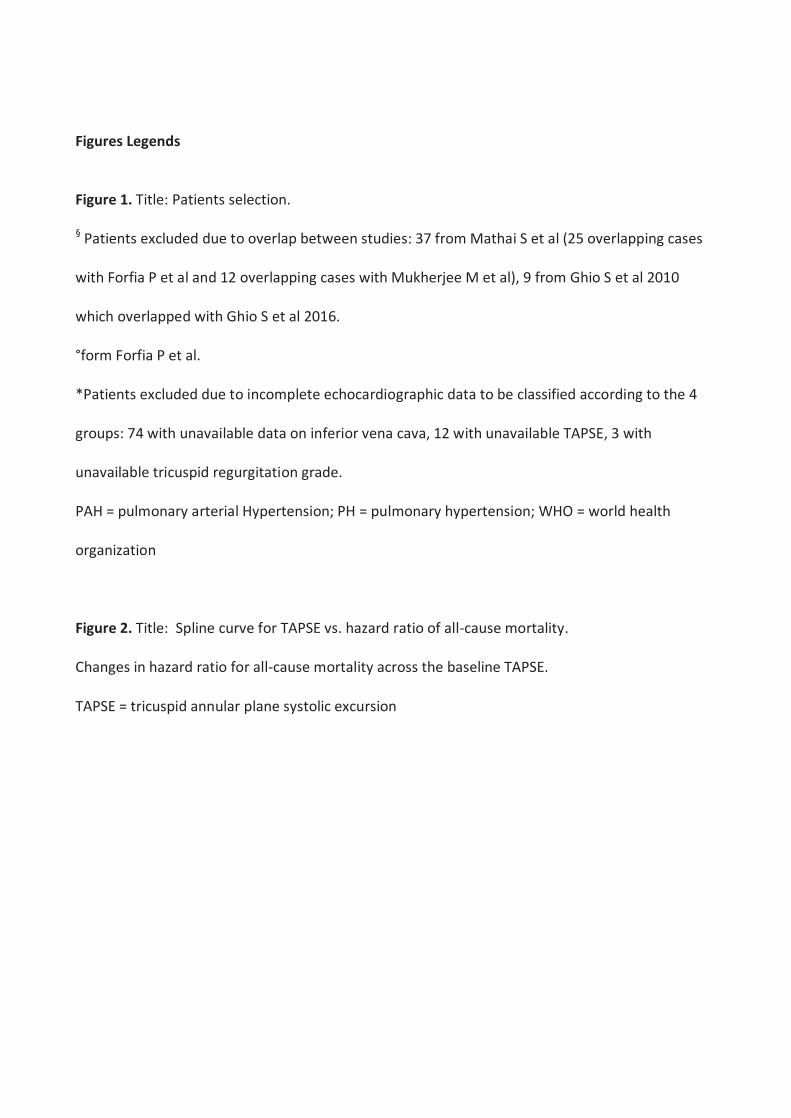
Figure 1. Title: Patients selection.
§ Patients excluded due to overlap between studies: 37 from Mathai S et al (25 overlapping cases
with Forfia P et al and 12 overlapping cases with Mukherjee M et al), 9 from Ghio S et al 2010
which overlapped with Ghio S et al 2016.
°form Forfia P et al.
*Patients excluded due to incomplete echocardiographic data to be classified according to the 4
groups: 74 with unavailable data on inferior vena cava, 12 with unavailable TAPSE, 3 with
unavailable tricuspid regurgitation grade.
PAH = pulmonary arterial Hypertension; PH = pulmonary hypertension; WHO = world health
organization
Figure 2. Title: Spline curve for TAPSE vs. hazard ratio of all-cause mortality.
Changes in hazard ratio for all-cause mortality across the baseline TAPSE.
TAPSE = tricuspid annular plane systolic excursion
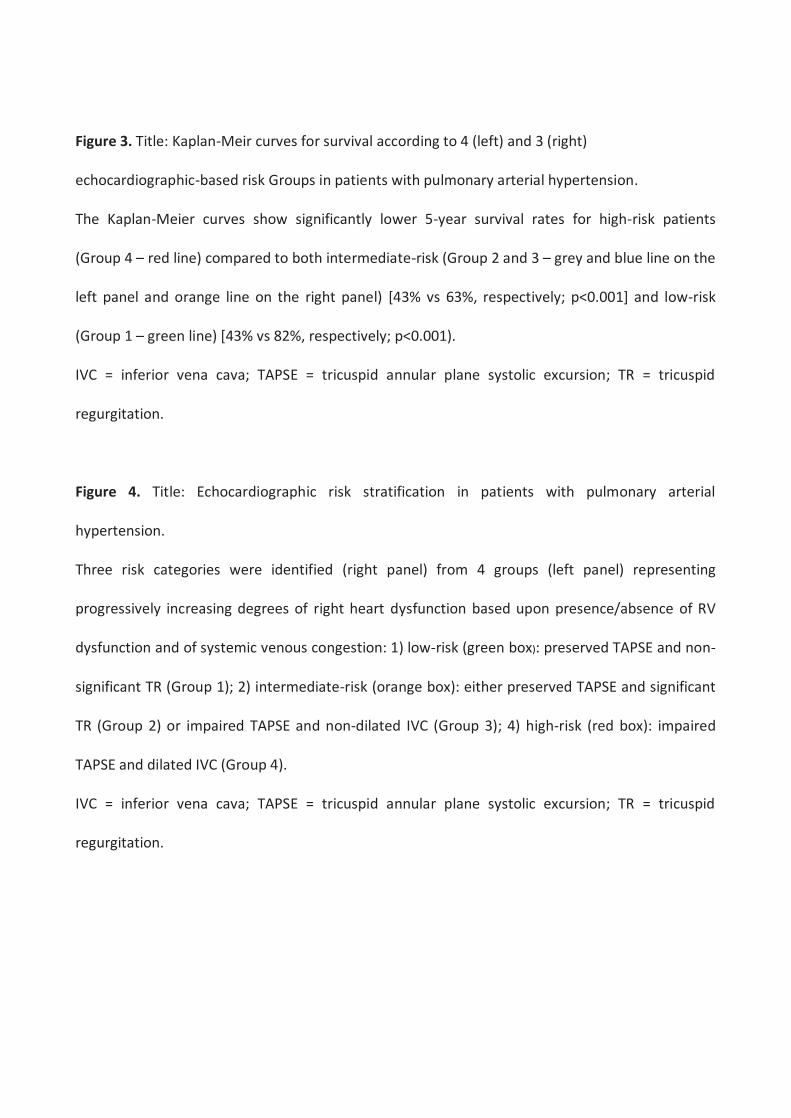
Figure 3. Title: Kaplan-Meir curves for survival according to 4 (left) and 3 (right)
echocardiographic-based risk Groups in patients with pulmonary arterial hypertension.
The Kaplan-Meier curves show significantly lower 5-year survival rates for high-risk patients
(Group 4 – red line) compared to both intermediate-risk (Group 2 and 3 – grey and blue line on the
left panel and orange line on the right panel) [43% vs 63%, respectively; p<0.001] and low-risk
(Group 1 – green line) [43% vs 82%, respectively; p<0.001).
IVC = inferior vena cava; TAPSE = tricuspid annular plane systolic excursion; TR = tricuspid
regurgitation.
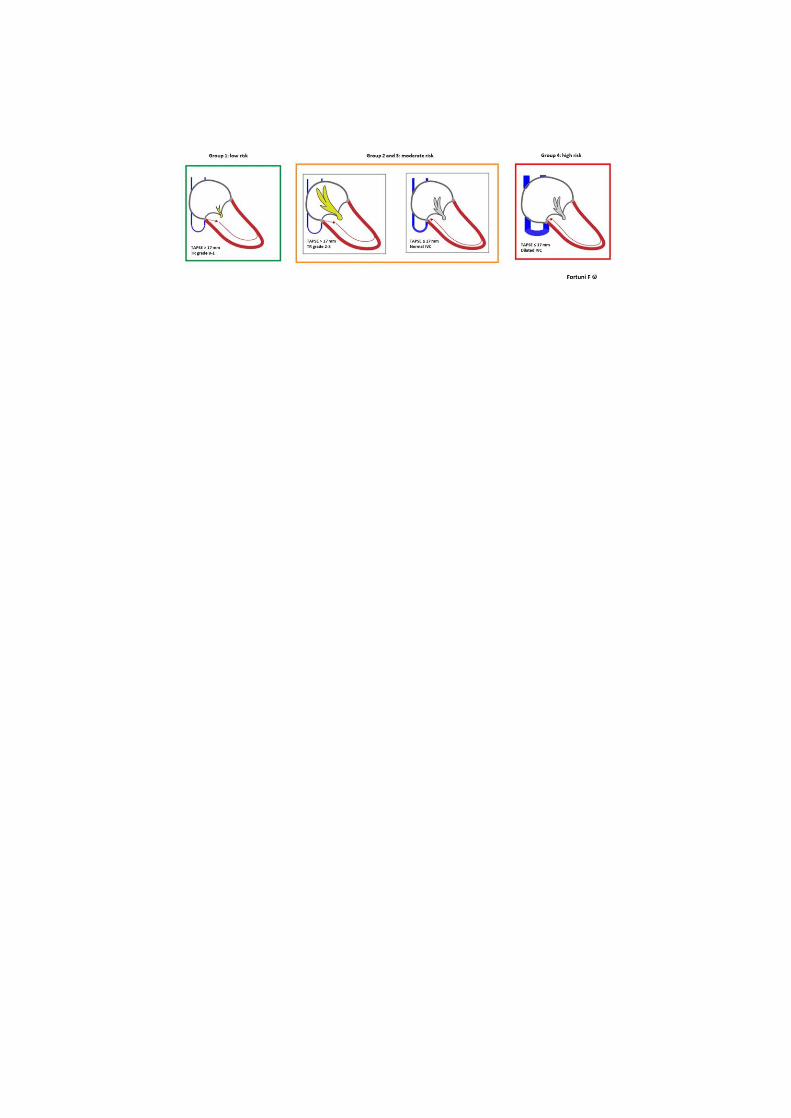
Figure 4. Title: Echocardiographic risk stratification in patients with pulmonary arterial
hypertension.
Three risk categories were identified (right panel) from 4 groups (left panel) representing
progressively increasing degrees of right heart dysfunction based upon presence/absence of RV
dysfunction and of systemic venous congestion: 1) low-risk (green box): preserved TAPSE and non-
significant TR (Group 1); 2) intermediate-risk (orange box): either preserved TAPSE and significant
TR (Group 2) or impaired TAPSE and non-dilated IVC (Group 3); 4) high-risk (red box): impaired
TAPSE and dilated IVC (Group 4).
IVC = inferior vena cava; TAPSE = tricuspid annular plane systolic excursion; TR = tricuspid
regurgitation.
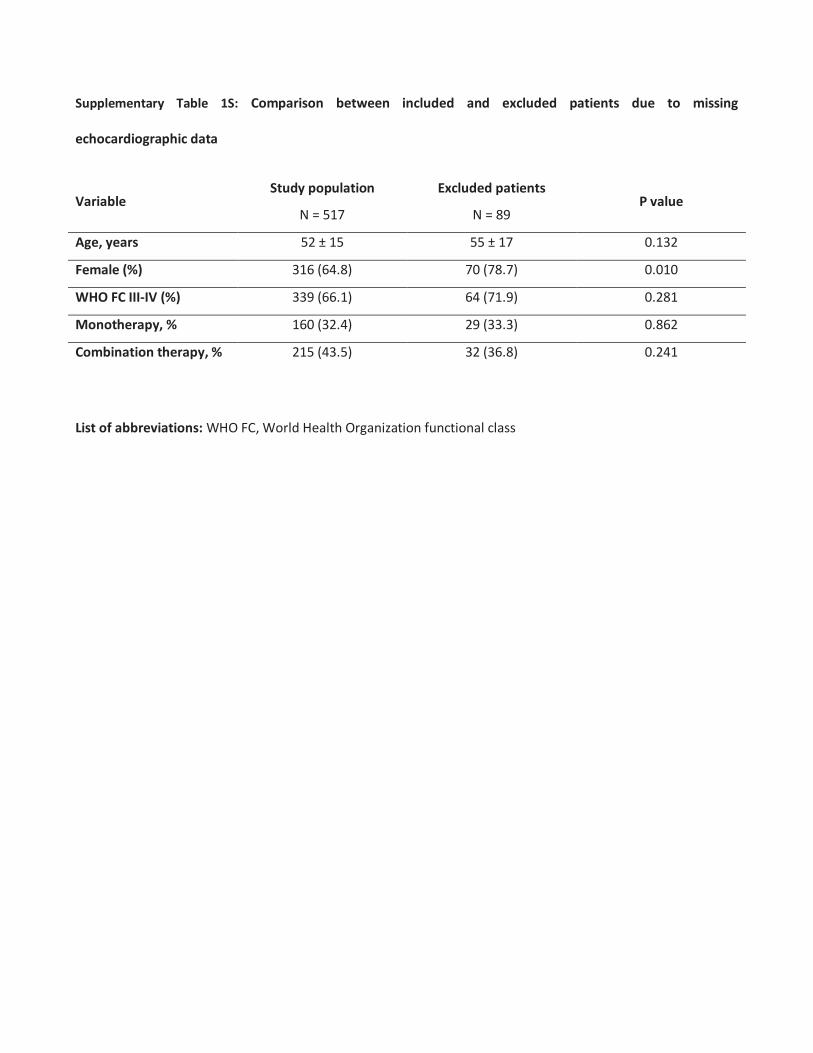
Supplementary Table 1S: Comparison between included and excluded patients due to missing
echocardiographic data
Variable Study population
N = 517
Excluded patients
N = 89 P value
Age, years 52 ± 15 55 ± 17 0.132
Female (%) 316 (64.8) 70 (78.7) 0.010
WHO FC III-IV (%) 339 (66.1) 64 (71.9) 0.281
Monotherapy, % 160 (32.4) 29 (33.3) 0.862
Combination therapy, % 215 (43.5) 32 (36.8) 0.241
List of abbreviations: WHO FC, World Health Organization functional class

Supplementary Table 2S: Adjusted HRs for all-cause mortality per 1 increase in echocardiographic risk
category
Adjusted for
HR per 1 echocardiographic risk category increase (95% CI) P value
1) Age, gender, incident/prevalent, year of publication, WHO FC, LVEF
1.96 (1.55-2.46) <0.001
2) Age, gender, incident/prevalent, year of publication, WHO FC, heart rate, LVEF
1.86 (1.46-2.37) <0.001
3) Age, gender, incident/prevalent, year of publication, WHO FC, LVEF, PAH etiology
2.11 (1.65-2.71) <0.001
4) Age, gender, incident/prevalent, year of publication, 6MWD, LVEF
2.38 (1.45-3.91) 0.001
5) Age, gender, incident/prevalent, year of publication, WHO FC, LVEF, AcT
1.96 (1.50-2.55) <0.001
6) Age, gender, incident/prevalent, year of publication, WHO FC, LVEF, RVEDA
2.01 (1.31-3.08) 0.001
7) Age, gender, incident/prevalent, year of publication, WHO FC, LVEF, RA area
1.92 (1.32-2.80) 0.001
8) Age, gender, incident/prevalent, year of publication, WHO FC, LVEF, PASP
1.94 (1.49-2.53) <0.001
These analyses were conducted based on data availability, multivariable Cox regression model 1 included 444
patients, model 2 405 patients, model 3 367 patients, model 4 135 patients, model 5 385 patients, model 6 194
patients, model 7 277 patients, and model 8 352 patients.
List of abbreviations: AcT, acceleration time; HR, hazard ratio; LVEF, left ventricular ejection fraction; PAH,
pulmonary arterial hypertension; RA, right atrial; RV EDA, right ventricular end diastolic area; 6MWD, 6-minute
walking distance; WHO FC, World Health Organization functional class
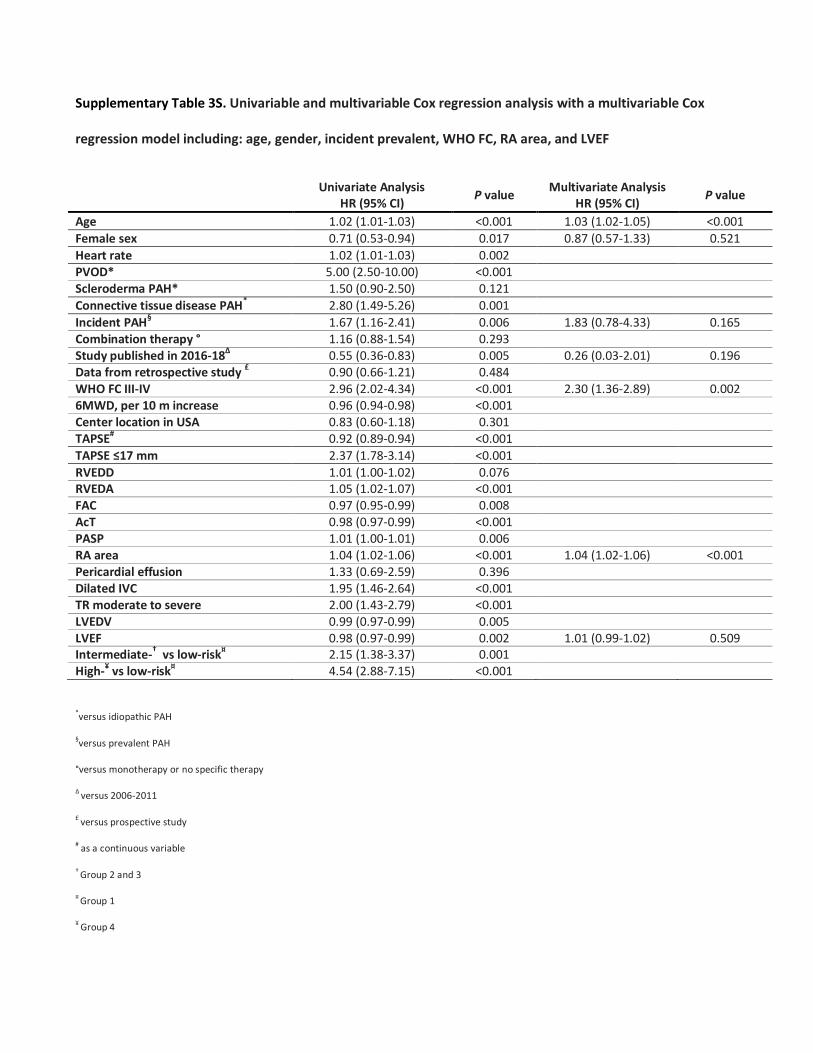
Supplementary Table 3S. Univariable and multivariable Cox regression analysis with a multivariable Cox
regression model including: age, gender, incident prevalent, WHO FC, RA area, and LVEF
Univariate Analysis
HR (95% CI) P value
Multivariate Analysis HR (95% CI)
P value
Age 1.02 (1.01-1.03) <0.001 1.03 (1.02-1.05) <0.001
Female sex 0.71 (0.53-0.94) 0.017 0.87 (0.57-1.33) 0.521
Heart rate 1.02 (1.01-1.03) 0.002 PVOD* 5.00 (2.50-10.00) <0.001 Scleroderma PAH* 1.50 (0.90-2.50) 0.121
Connective tissue disease PAH* 2.80 (1.49-5.26) 0.001
Incident PAH§ 1.67 (1.16-2.41) 0.006 1.83 (0.78-4.33) 0.165
Combination therapy ° 1.16 (0.88-1.54) 0.293 Study published in 2016-18Δ 0.55 (0.36-0.83) 0.005 0.26 (0.03-2.01) 0.196 Data from retrospective study £ 0.90 (0.66-1.21) 0.484 WHO FC III-IV 2.96 (2.02-4.34) <0.001 2.30 (1.36-2.89) 0.002 6MWD, per 10 m increase 0.96 (0.94-0.98) <0.001 Center location in USA 0.83 (0.60-1.18) 0.301 TAPSE# 0.92 (0.89-0.94) <0.001
TAPSE ≤17 mm 2.37 (1.78-3.14) <0.001
RVEDD 1.01 (1.00-1.02) 0.076 RVEDA 1.05 (1.02-1.07) <0.001 FAC 0.97 (0.95-0.99) 0.008 AcT 0.98 (0.97-0.99) <0.001 PASP 1.01 (1.00-1.01) 0.006 RA area 1.04 (1.02-1.06) <0.001 1.04 (1.02-1.06) <0.001 Pericardial effusion 1.33 (0.69-2.59) 0.396 Dilated IVC 1.95 (1.46-2.64) <0.001 TR moderate to severe 2.00 (1.43-2.79) <0.001 LVEDV 0.99 (0.97-0.99) 0.005 LVEF 0.98 (0.97-0.99) 0.002 1.01 (0.99-1.02) 0.509 Intermediate-† vs low-risk¤ 2.15 (1.38-3.37) 0.001 High-¥ vs low-risk¤ 4.54 (2.88-7.15) <0.001
*versus idiopathic PAH
§versus prevalent PAH
°versus monotherapy or no specific therapy
Δ versus 2006-2011
£ versus prospective study
# as a continuous variable
† Group 2 and 3
¤ Group 1
¥ Group 4
List of abbreviations: HR, hazard ratio; CI, confidence interval; PAH, pulmonary arterial hypertension; WHO FC, world
health organization functional class; 6MWD, six-minute walking distance; TAPSE, tricuspid annular plane systolic
excursion; RVEDD, right ventricular end diastolic diameter; RVEDA, right ventricular end diastolic area; FAC,
fractional area change; AcT, acceleration time; PASP, pulmonary arterial systolic pressure; RA, right atrial; ICV,
inferior vena cava; TR, tricuspid regurgitation; LVEDV, left ventricular end diastolic volume; LV EF, left ventricular
ejection fraction.
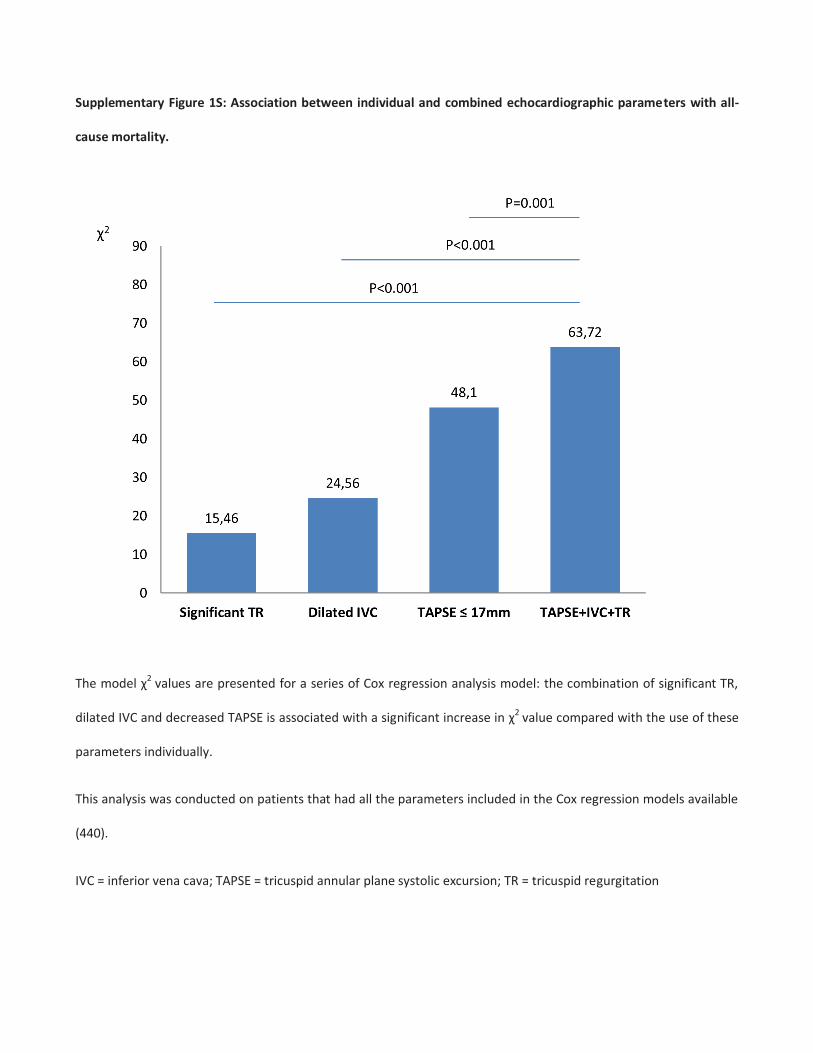
Supplementary Figure 1S: Association between individual and combined echocardiographic parameters with all-
cause mortality.
The model χ2 values are presented for a series of Cox regression analysis model: the combination of significant TR,
dilated IVC and decreased TAPSE is associated with a significant increase in χ2 value compared with the use of these
parameters individually.
This analysis was conducted on patients that had all the parameters included in the Cox regression models available
(440).
IVC = inferior vena cava; TAPSE = tricuspid annular plane systolic excursion; TR = tricuspid regurgitation
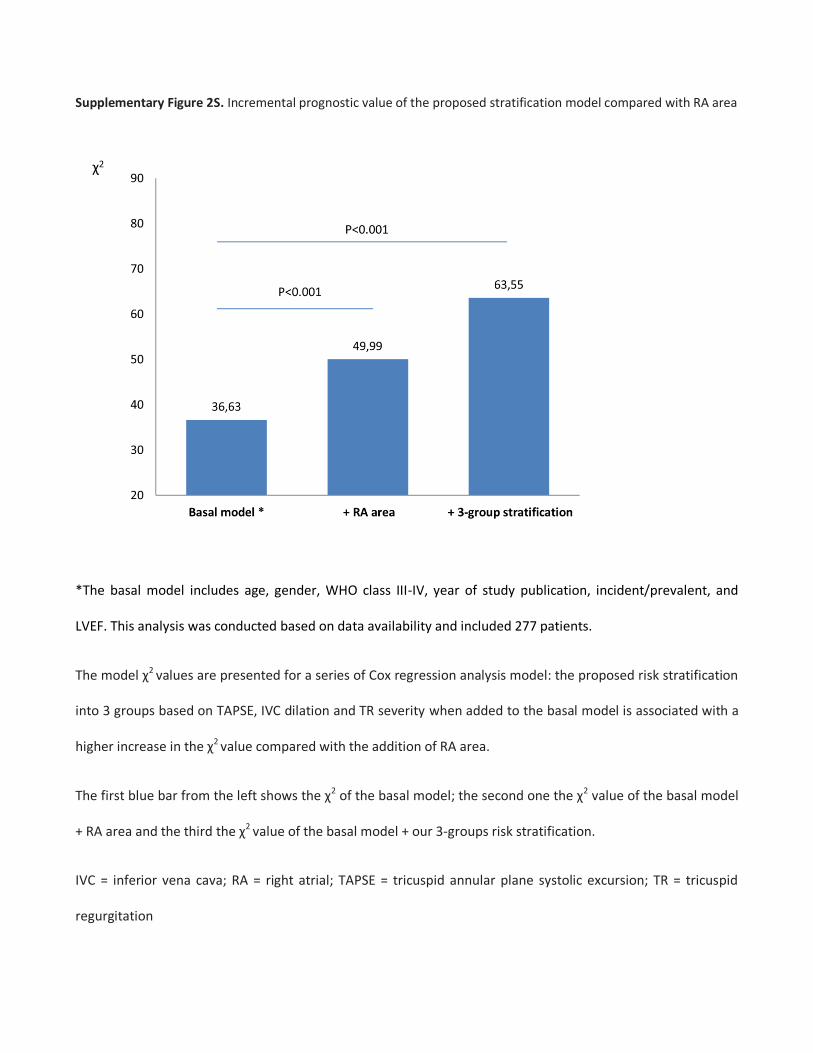
Supplementary Figure 2S. Incremental prognostic value of the proposed stratification model compared with RA area
*The basal model includes age, gender, WHO class III-IV, year of study publication, incident/prevalent, and
LVEF. This analysis was conducted based on data availability and included 277 patients.
The model χ2 values are presented for a series of Cox regression analysis model: the proposed risk stratification
into 3 groups based on TAPSE, IVC dilation and TR severity when added to the basal model is associated with a
higher increase in the χ2 value compared with the addition of RA area.
The first blue bar from the left shows the χ2 of the basal model; the second one the χ2 value of the basal model
+ RA area and the third the χ2 value of the basal model + our 3-groups risk stratification.
IVC = inferior vena cava; RA = right atrial; TAPSE = tricuspid annular plane systolic excursion; TR = tricuspid
regurgitation

Appendix 1
List of all contributors:
Pavia: Michela Coccia, Federico Fortuni, Stefano Ghio, Alessandra Greco, Arianna Grelli, Letizia Mannucci,
Claudia Raineri, Laura Scelsi.
Baltimora: Rachel L Damico, Todd M Kolb, Paul M Hassoun, Stephen C Mathai, Valentina Mercurio, Monica
Mukherjee.
Philadelphia: Paul R. Forfia, Jeremy A. Mazurek.
Giessen: Henning Gall, Ardeschir Ghofrani, Manuel Richter, Andreas Rieth, Werner Seeger, Khodr Tello.
Naples: Valentina Mercurio, Alessandra Cuomo.