A new approach for calculating the true stress response from large amplitude oscillatory shear...
9
Rheol Acta (2014) 53:75–83 DOI 10.1007/s00397-013-0738-y ORIGINAL CONTRIBUTION A new approach for calculating the true stress response from large amplitude oscillatory shear (LAOS) measurements using parallel plates Zahra Fahimi · Chase P. Broedersz · Thomas H. S. van Kempen · Daniel Florea · Gerrit W. M. Peters · Hans M. Wyss Received: 8 July 2013 / Revised: 25 September 2013 / Accepted: 2 October 2013 / Published online: 8 November 2013 © Springer-Verlag Berlin Heidelberg 2013 Abstract The parallel plates geometry is often deemed unsuitable for nonlinear viscoelasticity measurements because the strain field, and thus the nonlinear response, varies across the sample. Although cone–plate and Couette geometries are designed to circumvent this prob- lem by ensuring a uniform strain field, it is not always easy to shape the material to the complex shapes that is required for these geometries. This has motivated the devel- opment of techniques to accurately determine the nonlinear stress response using the more convenient plate–plate geom- etry. Here, we introduce a new approach to obtain this true material response in large amplitude oscillatory shear (LAOS) experiments using the plate–plate geometry. By tracing the Fourier components of the torque response and their derivatives with respect to the maximum applied defor- mation, we accurately obtain the material’s true stress–strain response from parallel plate measurements. The approach does not require any assumptions about the material’s vis- coelastic behavior. We test our approach experimentally Z. Fahimi · D. Florea · G. W. M. Peters · H. M. Wyss () Department of Mechanical Engineering, Eindhoven University of Technology, 5612AZ Eindhoven, the Netherlands e-mail: [email protected] Z. Fahimi · D. Florea · H. M. Wyss Institute for Complex Molecular Systems, Eindhoven University of Technology, 5612AZ Eindhoven, the Netherlands T. H. S. van Kempen Department of Biomedical Engineering, Eindhoven University of Technology, 5612AZ Eindhoven, the Netherlands C. P. Broedersz Lewis-Sigler Institute for Integrative Genomics and the Department of Physics, Princeton University, Princeton, NJ 08544, USA on fibrin biopolymer gels, as well as numerically on a Giesekus model. We confirm in both cases that our approach captures the detailed shape of the true stress response in LAOS measurements. Moreover, we also show that our method is less sensitive to experimental noise present in the data than the previous standard method. Our approach for obtaining the true stress response from parallel plate mea- surements is directly applicable to measurements on a wide range of solid-like nonlinear materials, including biological networks, tissues, or hydrogels. Keywords Large amplitude oscillatory shear · Biopolymer · Fourier transform rheology · Stress–strain curve · Viscoelasticity · Nonlinear viscoelasticity Introduction One main advantage of the simple parallel plates geom- etry often used in rotational rheometers is that the gap size can be freely chosen for each experiment, provid- ing access to a wide range of shear rates. Moreover, flat, solid-like samples can be measured without the need for creating complex sample shapes; the gap can readily be adjusted to fit the sample of interest. A range of com- monly investigated solid-like materials, including hydro- gel materials, biofilms, or biological tissues, are difficult to shape into the geometries required for cone–plate or Couette measurements (Lopez-Suevos and Frazier 2006). However, these materials can often be shaped readily into a flat film shape, making the parallel plates geom- etry the best available option for performing rheological measurements. A major drawback of parallel plates, however, is that this geometry results in a strain field that is not uniform across
Transcript of A new approach for calculating the true stress response from large amplitude oscillatory shear...
Rheol Acta (2014) 53:75–83DOI 10.1007/s00397-013-0738-y
ORIGINAL CONTRIBUTION
A new approach for calculating the true stress responsefrom large amplitude oscillatory shear (LAOS)measurements using parallel plates
Zahra Fahimi · Chase P. Broedersz ·Thomas H. S. van Kempen · Daniel Florea ·Gerrit W. M. Peters · Hans M. Wyss
Received: 8 July 2013 / Revised: 25 September 2013 / Accepted: 2 October 2013 / Published online: 8 November 2013© Springer-Verlag Berlin Heidelberg 2013
Abstract The parallel plates geometry is often deemedunsuitable for nonlinear viscoelasticity measurementsbecause the strain field, and thus the nonlinear response,varies across the sample. Although cone–plate andCouette geometries are designed to circumvent this prob-lem by ensuring a uniform strain field, it is not alwayseasy to shape the material to the complex shapes that isrequired for these geometries. This has motivated the devel-opment of techniques to accurately determine the nonlinearstress response using the more convenient plate–plate geom-etry. Here, we introduce a new approach to obtain thistrue material response in large amplitude oscillatory shear(LAOS) experiments using the plate–plate geometry. Bytracing the Fourier components of the torque response andtheir derivatives with respect to the maximum applied defor-mation, we accurately obtain the material’s true stress–strainresponse from parallel plate measurements. The approachdoes not require any assumptions about the material’s vis-coelastic behavior. We test our approach experimentally
Z. Fahimi · D. Florea · G. W. M. Peters · H. M. Wyss (!)Department of Mechanical Engineering, EindhovenUniversity of Technology, 5612AZ Eindhoven, the Netherlandse-mail: [email protected]
Z. Fahimi · D. Florea · H. M. WyssInstitute for Complex Molecular Systems, Eindhoven Universityof Technology, 5612AZ Eindhoven, the Netherlands
T. H. S. van KempenDepartment of Biomedical Engineering, Eindhoven Universityof Technology, 5612AZ Eindhoven, the Netherlands
C. P. BroederszLewis-Sigler Institute for Integrative Genomics and theDepartment of Physics, Princeton University, Princeton, NJ 08544,USA
on fibrin biopolymer gels, as well as numerically on aGiesekus model. We confirm in both cases that our approachcaptures the detailed shape of the true stress response inLAOS measurements. Moreover, we also show that ourmethod is less sensitive to experimental noise present in thedata than the previous standard method. Our approach forobtaining the true stress response from parallel plate mea-surements is directly applicable to measurements on a widerange of solid-like nonlinear materials, including biologicalnetworks, tissues, or hydrogels.
Keywords Large amplitude oscillatory shear ·Biopolymer · Fourier transform rheology · Stress–straincurve · Viscoelasticity · Nonlinear viscoelasticity
Introduction
One main advantage of the simple parallel plates geom-etry often used in rotational rheometers is that the gapsize can be freely chosen for each experiment, provid-ing access to a wide range of shear rates. Moreover, flat,solid-like samples can be measured without the need forcreating complex sample shapes; the gap can readily beadjusted to fit the sample of interest. A range of com-monly investigated solid-like materials, including hydro-gel materials, biofilms, or biological tissues, are difficultto shape into the geometries required for cone–plate orCouette measurements (Lopez-Suevos and Frazier 2006).However, these materials can often be shaped readilyinto a flat film shape, making the parallel plates geom-etry the best available option for performing rheologicalmeasurements.
A major drawback of parallel plates, however, is that thisgeometry results in a strain field that is not uniform across
76 Rheol Acta (2014) 53:75–83
the sample; both the shear strain, γ , and the shear rate, γ̇ ,decrease linearly to zero towards the center of the geome-try; as a result the shear stress, σ (γ ) is not constant acrossthe sample geometry. The total torque on the tool can beexpressed as (Macosko 1994)
T = 2πR3
γ 3R
! γR
0σ (γ )γ 2dγ , (1)
where R is the radius of the plates, γR is the strain at theedges of the plates, γ = γRr/R is the local strain at a dis-tance r from the center, and σ (γ ) is the stress as a functionof the local strain. At small deformations, in the linear vis-coelastic regime, the stress is proportional to the appliedstrain and thus σ (γ (r)) depends linearly on the distance rfrom the center as σ (γ (r)) = σ ( r
R γR) = rR σ (γR). As
a result, in this case, the true stress–strain relation can bederived from the measured torque as (Macosko 1994)
σ (γ ) = 2T
πR3
γ
γR. (2)
However, at larger strain deformations, outside the lin-ear viscoelastic regime, the local stress no longer dependslinearly on strain, and thus, Eq. 2 breaks down. Therefore,the accurate determination of the true nonlinear viscoelas-tic response using the parallel plate geometry poses animportant challenge. This challenge has been addressed byconsidering the derivative of the torque (Eq. 1) with respectto the time-dependent edge strain, as (Soskey and Winter1984; Phan-Thien et al. 2000)
∂T
∂γR= −3T
γR+ 2πR3
γ 3R
∂
∂γR
"! γR
0σ (γ )γ 2dγ
#, (3)
which can be solved for σ (γR), as (Phan-Thien et al. 2000)
σ (γ ) = 12πR3
$γ
∂T
∂γ+ 3T
%. (4)
Thus, by tracking the torque and its derivative withrespect to the applied strain amplitude, for unidirec-tional measurements such as strain ramp measurementsthe true stress–strain relation of the material can directlybe determined from parallel plate measurements. Similarapproaches have been formulated for steady shear experi-ments, where torque derivatives with respect to the instan-taneous edge strain rate γ̇ (t) are used instead of derivativeswith respect to the time-dependent edge strain (Macosko1994; Yoshimura and Prudhomme 1988; Carvalho et al.1994; Graeme et al. 2005; Soskey and Winter 1984). Forsuch unidirectional measurements, it is straightforward toextract the true stress from the data obtained using a parallelplates geometry.
Given the recent interest in nonlinear, large amplitudeoscillatory shear (LAOS) measurements (Ewoldt et al. 2008;Rogers and Lettinga 2012; Cho et al. 2005; Wilhelm 2002;Wilhelm et al. 1998), a method for obtaining the true stressresponse that is readily applicable to LAOS measurementand is compatible with frequently used data processingand analysis schemes, such as Fourier transform rheology,would be highly useful. While the interpretation of dataobtained in LAOS measurements is still a topic of researchand debate (Rogers and Lettinga 2012; Hyun et al. 2011;Vananroye et al. 2011), there is no doubt that these datacontain valuable information on the nonlinear mechanicalbehavior of the material; the ability to extract the true stressresponse from LAOS measurements performed with parallelplates would therefore be highly desirable.
The most straightforward method for extracting the truestress response from parallel plate measurements also foroscillatory measurements was introduced by Phan-Thienet al. (2000) as
σ (t) = 12πR3
$γR
∂T (γR)
∂γR+ 3T (γR)
%, (5)
where T (γR) represents the total torque at time t, γR(t)
the edge strain at time t, and ∂T (γ )∂γ is the derivative of
the total torque with respect to the edge strain at time t.Thus the method relies on a series of measurements per-formed with equal frequency but at different strain ampli-tudes, as the derivatives with respect to the edge strainγR(ω, γ0, t) reflect the strain dependence at a fixed time t.This method has been successfully applied to LAOS dataand validated by comparing to the response obtained incone–plate measurements by Ng et al. (2011). This exten-sion of LAOS to parallel plates measurements is important,as LAOS measurements are increasingly being used to studythe mechanics of nonlinear viscoelastic materials, yield-ing useful information on their response beyond the linearregime.
Recent LAOS studies succeed to give an adequate quanti-tative description of the measured stress–strain response andalso present interpretations of the stress–strain response ofthe material by measuring the raw in-cycle torque response,which is anharmonic in the nonlinear regime. One of theconvenient ways to describe the shape of such a anharmonicresponse is Fourier transform rheology (Wilhelm 2002;Wilhelm et al. 1998), which describes the response in termsof a Fourier series, thus quantifying the amplitudes of higherharmonics contained in the stress response. The Fouriercoefficients of the stress response also serve as a basis fora range of recently proposed approaches for the interpre-tation and analysis of LAOS measurements, including thedefinition of generalizations of the concepts of storage andloss modulus to the nonlinear regime (Ewoldt et al. 2008;
Rheol Acta (2014) 53:75–83 77
Cho et al. 2005). The interpretation of the LAOS responsehas also recently been explained in terms of a series ofbasic underlying physical deformation mechanisms (Rogersand Lettinga 2012). While no direct physical meaning isattributed to all Fourier coefficients so far, a Fourier series isstill a useful approach for describing the shape of the, inher-ently time-periodic, equilibrium in-cycle stress response.Therefore a new, simple method to analyze LAOS resultsfrom a parallel plate geometry measurements in a meaning-ful way, that is compatible to these recent developments,would be highly beneficial.
In this paper, we describe in detail how the true stressresponse can be obtained from LAOS measurements per-formed in a parallel plates geometry. We introduce a newmethod for obtaining this true stress response and compareit to the existing method by Phan-Thien et al. To illustrateand test our approach, we use a nonlinear biological mate-rial reconstituted from purified fibrin, a major constituentof blood clots. Such fibrin gels exhibit a pronounced strain-stiffening behavior (Broedersz et al. 2010; Piechocka et al.2010; Janmey et al. 1983; Shah and Janmey 1997).
Our new method for correcting this data is directly com-patible with Fourier transform rheology and other recentlyintroduced approaches for analyzing and interpreting LAOSdata. Using fibrin as an experimental model system, wecompare this approach to the most prevalent existingmethod and show that our method recovers the correct stressresponse of the material, as measured with a cone–platetool. An important advantage of the method is that it inher-ently limits the amplification of experimental noise, sinceit does not rely on separate strain derivatives of the torquefor each point in time. To illustrate and quantify this, weuse simulated LAOS data based on the Giesekus model withwell-defined levels of noise. The method does not requireprior knowledge on the form of the constitutive equationof the material; it should thus be generally applicable to awide range of soft and biological materials. Moreover, themethod can be readily implemented in methods commonlyemployed in the analysis of LAOS data.
Results and discussion
Theory
The existing method for calculating the true stress responsefrom data obtained in a parallel plates geometry (Phan-Thien et al. 2000), given by Eq. 5, relies on separate strainderivatives of the torque response for each point in time.This poses a problem when the approach is applied to exper-imental data, as the experimental noise in the data frompoint to point is inherently amplified. To circumvent theseproblems, instead of analyzing the torque response at fixed
time, we focus on the shape of the torque response that isobtained in a LAOS measurement in the torque-strain plane:Generally, in LAOS rheology, the applied strain is sinu-soidal in time, γ = γ0 sin(ωt) with an amplitude γ0 and anangular frequency ω. A nonlinear response implies that thestress response will be anharmonic; linear response theorycan thus no longer by applied. In this case, the momen-tary stress response σ (t) is no longer linearly related to theapplied strain amplitude γ0, but depends in a nonlinear fash-ion on both ω and γ0 (Rogers and Lettinga 2012; Ewoldtet al. 2008; Cho et al. 2005; Wilhelm 2002).
To highlight these nonlinearities, LAOS measurementsare often displayed in so-called Lissajous–Bowditch plots,where σ (γ0, ω, t) is displayed as a function of γ (γ0, ω, t)
or as a function of γ̇ (γ0, ω, t) (Ewoldt et al. 2008; Cho et al.2005). When the in-cycle response has reached a steadystate, reached after several oscillations in practice, the stressresponse is periodic. In this case, the Lissajous plots areclosed curves that overlap from cycle to cycle. The shapesof these curves can be seen as a ’rheological fingerprint’of the nonlinear response of the material (Ewoldt et al.2007). To properly account for the nonlinear stress response,we should study its dependence on both the applied strainamplitude and the oscillation frequency. To do so, we needa quantitative description of the shape of the associated Lis-sajous curves that represents the periodicity of the stressresponse as well as the time dependence of the stress. Thiscan be conveniently accomplished by describing the time-dependent stress as a Fourier series (Hyun and Kim 2011;Wilhelm et al. 1998)
σ (t,ω, γ0) =&
n odd
S′n(ω, γ0) sin(nωt)+S′′
n(ω, γ0) cos(nωt),
(6)
where the sign and values of the Fourier coefficients dependon the phase of the input strain wave; generally γR(t) =γ0 sin(ωt). However, any other series such as Chebyshevpolynomials that can represent the full Lissajous curve mayalso be used.
In the linear regime, the first-order coefficients fullydescribe the viscoelastic response; in this case, the stor-age and the loss modulus are directly determined by thein-phase and out-of-phase coefficients as G′ = S′
n/γ0 andG′′ = S′′
n/γ0, respectively. In contrast, when entering thenonlinear regime, the higher order coefficients also start tocontribute considerably to the response; for symmetry rea-sons, if the input wave is sinusoidal, γ (t) = γ0 sin(ωt), evenharmonics will not contribute to the response in the steadystate. We thus neglect both even harmonics as well as non-integer harmonics in describing the response as a Fourierseries; nonzero values of these components in the data canbe attributed to experimental noise (Ewoldt et al. 2008).
78 Rheol Acta (2014) 53:75–83
Using an analogous Fourier series for the total torque,with torque Fourier coefficient T ′
n(ω, γ0) and T ′′n (ω, γ0), the
acquired torque response with respect to γ0 can be relatedto the response of the material at different strain ampli-tudes. As the torque in each cycle is defined completelyby the Fourier coefficients, the coefficients themselves arefunctions of γ0, which through linear superposition fullydetermine the shape of the torque response. Thus, instead ofcorrecting the total torque response, we individually correctthe torque Fourier coefficients T ′
n(γ0) and T ′′n (γ0), in anal-
ogy to Eq. 4, resulting in expressions for the in-phase stressFourier coefficients,
S′n(γ0, ω) = 1
2πR3
$γ0
∂T ′n(γ0)
∂γ0+ 3T ′
n(γ0)
%, (7)
and for the out-of-phase coefficients,
S′′n(γ0, ω) = 1
2πR3
$γ0
∂T ′′n (γ0)
∂γ0+ 3T ′′
n (γ0)
%. (8)
Using these forms to obtain the correct Fourier coeffi-cients for the stress response together with Eq. 6, we canreconstruct the true nonlinear stress response. The Fouriercoefficients as a function of strain amplitude, T ′
n(γ0), gen-erally are well approximated as simple functions such asa power-law or polynomial, from which the derivativeswith respect to γ0 are readily obtained. Application ofthe method works for any number of Fourier coefficientstaken into account and does not rely on neglecting forinstance the even harmonics in the response. The steadystate Lissajous curves can now be readily obtained for eachγ0 from the coefficients S′,′′
n (γ0, ω) and their γ0-derivativesusing Eq. 6.
Experiments
To illustrate the application of Eq. 4, we apply it to exper-iments on fibrin, a biopolymer that exhibits a pronouncedstrain-stiffening behavior (Gardel et al. 2004; Broederszet al. 2010; Piechocka et al. 2010; Janmey et al. 1983; Shahand Janmey 1997; Storm et al. 2005). The fibrin networkis prepared by mixing a solution of human fibrinogen (Cal-biochem, Merck KgaA, Darmstadt, Germany) dissolved ina buffer solution (0.1 M HEPES, 135 mM NaCl, 5 mMCaCl2, pH 7.4) at a final concentration of 3 mg/ml withhuman thrombin at a final concentration of 0.1 U/ml. Sam-ples are subsequently polymerized under the application ofa mild oscillatory shear (γR = 1 %, frequency ω = 1 rad/s)at 37 ◦C to track the effects of this polymerization inside astress-controlled rheometer (Physica MCR501, Anton Paar,Austria) in a cone–plate (25 mm diameter, 2◦) or a par-allel plate (25 mm diameter) geometry, respectively, for30 min.
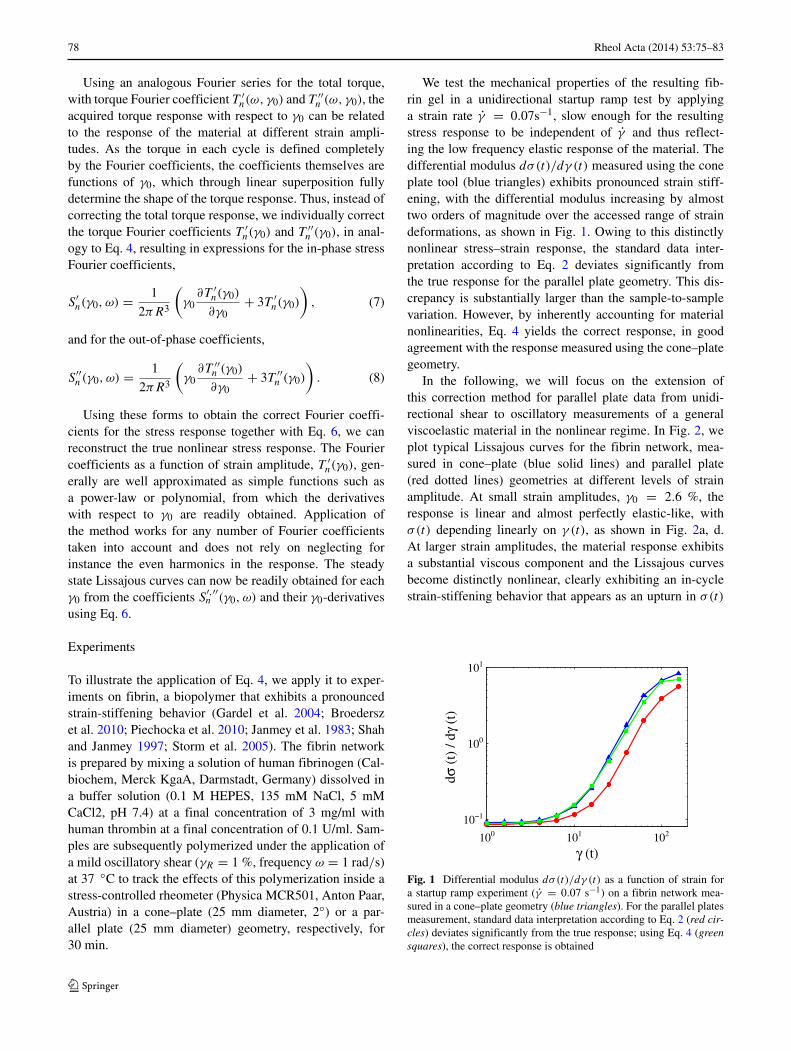
We test the mechanical properties of the resulting fib-rin gel in a unidirectional startup ramp test by applyinga strain rate γ̇ = 0.07s−1, slow enough for the resultingstress response to be independent of γ̇ and thus reflect-ing the low frequency elastic response of the material. Thedifferential modulus dσ (t)/dγ (t) measured using the coneplate tool (blue triangles) exhibits pronounced strain stiff-ening, with the differential modulus increasing by almosttwo orders of magnitude over the accessed range of straindeformations, as shown in Fig. 1. Owing to this distinctlynonlinear stress–strain response, the standard data inter-pretation according to Eq. 2 deviates significantly fromthe true response for the parallel plate geometry. This dis-crepancy is substantially larger than the sample-to-samplevariation. However, by inherently accounting for materialnonlinearities, Eq. 4 yields the correct response, in goodagreement with the response measured using the cone–plategeometry.
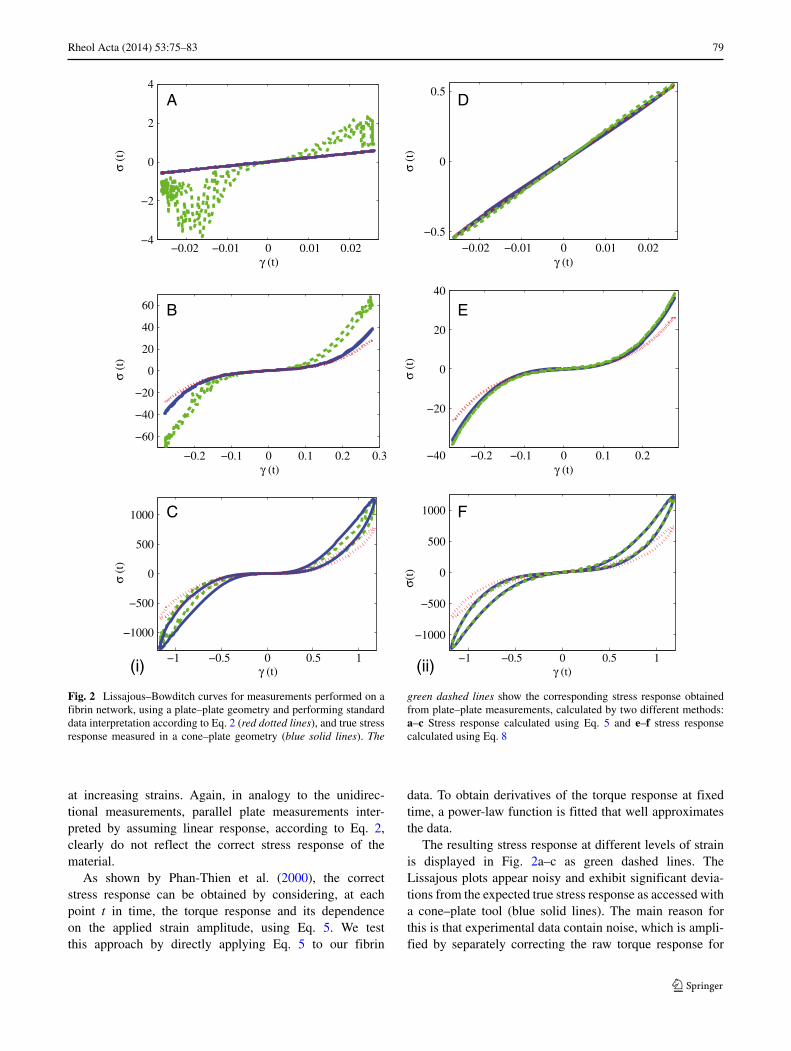
In the following, we will focus on the extension ofthis correction method for parallel plate data from unidi-rectional shear to oscillatory measurements of a generalviscoelastic material in the nonlinear regime. In Fig. 2, weplot typical Lissajous curves for the fibrin network, mea-sured in cone–plate (blue solid lines) and parallel plate(red dotted lines) geometries at different levels of strainamplitude. At small strain amplitudes, γ0 = 2.6 %, theresponse is linear and almost perfectly elastic-like, withσ (t) depending linearly on γ (t), as shown in Fig. 2a, d.At larger strain amplitudes, the material response exhibitsa substantial viscous component and the Lissajous curvesbecome distinctly nonlinear, clearly exhibiting an in-cyclestrain-stiffening behavior that appears as an upturn in σ (t)
100 101 102
10−1
100
101
γ (t)
dσ (t
) / d
γ (t)
Fig. 1 Differential modulus dσ (t)/dγ (t) as a function of strain fora startup ramp experiment (γ̇ = 0.07 s−1) on a fibrin network mea-sured in a cone–plate geometry (blue triangles). For the parallel platesmeasurement, standard data interpretation according to Eq. 2 (red cir-cles) deviates significantly from the true response; using Eq. 4 (greensquares), the correct response is obtained
Rheol Acta (2014) 53:75–83 79
−1 −0.5 0 0.5 1
−1000
−500
0
500
1000
γ (t)
σ (t
)
−0.2 −0.1 0 0.1 0.2 0.3
−60
−40
−20
0
20
40
60
γ (t)
σ (t
)
−0.02 −0.01 0 0.01 0.02−4
−2
0
2
4
γ (t)
σ (t
)
−1 −0.5 0 0.5 1
−1000
−500
0
500
1000
γ (t)
σ(t)
−0.2 −0.1 0 0.1 0.2−40
−20
0
20
40
γ (t)
σ (t
)
−0.02 −0.01 0 0.01 0.02−0.5
0
0.5
γ (t)
σ (t
)
A D
B E
C F
(i) (ii)
Fig. 2 Lissajous–Bowditch curves for measurements performed on afibrin network, using a plate–plate geometry and performing standarddata interpretation according to Eq. 2 (red dotted lines), and true stressresponse measured in a cone–plate geometry (blue solid lines). The
green dashed lines show the corresponding stress response obtainedfrom plate–plate measurements, calculated by two different methods:a–c Stress response calculated using Eq. 5 and e–f stress responsecalculated using Eq. 8
at increasing strains. Again, in analogy to the unidirec-tional measurements, parallel plate measurements inter-preted by assuming linear response, according to Eq. 2,clearly do not reflect the correct stress response of thematerial.
As shown by Phan-Thien et al. (2000), the correctstress response can be obtained by considering, at eachpoint t in time, the torque response and its dependenceon the applied strain amplitude, using Eq. 5. We testthis approach by directly applying Eq. 5 to our fibrin
data. To obtain derivatives of the torque response at fixedtime, a power-law function is fitted that well approximatesthe data.
The resulting stress response at different levels of strainis displayed in Fig. 2a–c as green dashed lines. TheLissajous plots appear noisy and exhibit significant devia-tions from the expected true stress response as accessed witha cone–plate tool (blue solid lines). The main reason forthis is that experimental data contain noise, which is ampli-fied by separately correcting the raw torque response for
80 Rheol Acta (2014) 53:75–83
each point in time. Although this method does in principleprovide the correct result, it has to be used in conjunctionwith data smoothing filters such as a band pass filter. How-ever, such filtering depends on arbitrary parameters and candistort the data; it would thus be preferable to devise amore robust scheme that naturally limits the amplificationof experimental noise.
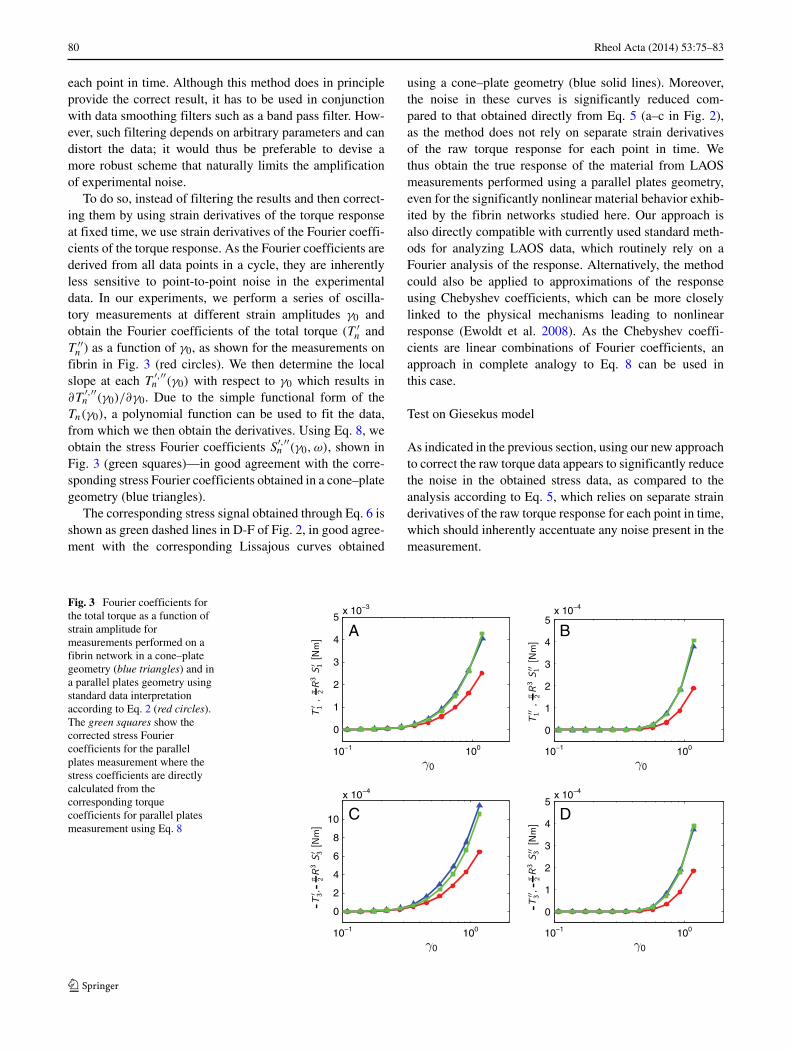
To do so, instead of filtering the results and then correct-ing them by using strain derivatives of the torque responseat fixed time, we use strain derivatives of the Fourier coeffi-cients of the torque response. As the Fourier coefficients arederived from all data points in a cycle, they are inherentlyless sensitive to point-to-point noise in the experimentaldata. In our experiments, we perform a series of oscilla-tory measurements at different strain amplitudes γ0 andobtain the Fourier coefficients of the total torque (T ′
n andT ′′
n ) as a function of γ0, as shown for the measurements onfibrin in Fig. 3 (red circles). We then determine the localslope at each T ′,′′
n (γ0) with respect to γ0 which results in∂T ′,′′
n (γ0)/∂γ0. Due to the simple functional form of theTn(γ0), a polynomial function can be used to fit the data,from which we then obtain the derivatives. Using Eq. 8, weobtain the stress Fourier coefficients S′,′′
n (γ0, ω), shown inFig. 3 (green squares)—in good agreement with the corre-sponding stress Fourier coefficients obtained in a cone–plategeometry (blue triangles).
The corresponding stress signal obtained through Eq. 6 isshown as green dashed lines in D-F of Fig. 2, in good agree-ment with the corresponding Lissajous curves obtained
using a cone–plate geometry (blue solid lines). Moreover,the noise in these curves is significantly reduced com-pared to that obtained directly from Eq. 5 (a–c in Fig. 2),as the method does not rely on separate strain derivativesof the raw torque response for each point in time. Wethus obtain the true response of the material from LAOSmeasurements performed using a parallel plates geometry,even for the significantly nonlinear material behavior exhib-ited by the fibrin networks studied here. Our approach isalso directly compatible with currently used standard meth-ods for analyzing LAOS data, which routinely rely on aFourier analysis of the response. Alternatively, the methodcould also be applied to approximations of the responseusing Chebyshev coefficients, which can be more closelylinked to the physical mechanisms leading to nonlinearresponse (Ewoldt et al. 2008). As the Chebyshev coeffi-cients are linear combinations of Fourier coefficients, anapproach in complete analogy to Eq. 8 can be used inthis case.
Test on Giesekus model
As indicated in the previous section, using our new approachto correct the raw torque data appears to significantly reducethe noise in the obtained stress data, as compared to theanalysis according to Eq. 5, which relies on separate strainderivatives of the raw torque response for each point in time,which should inherently accentuate any noise present in themeasurement.
Fig. 3 Fourier coefficients forthe total torque as a function ofstrain amplitude formeasurements performed on afibrin network in a cone–plategeometry (blue triangles) and ina parallel plates geometry usingstandard data interpretationaccording to Eq. 2 (red circles).The green squares show thecorrected stress Fouriercoefficients for the parallelplates measurement where thestress coefficients are directlycalculated from thecorresponding torquecoefficients for parallel platesmeasurement using Eq. 8
10−1 100
0
1
2
3
4
5x 10⁻⁴
10−1 100
0
1
2
3
4
5x 10⁻³
A B
10−1 100
0
2
4
6
8
10
x 10−4
C
10−1 100
0
1
2
3
4
5x 10⁻⁴
D
--
--
Rheol Acta (2014) 53:75–83 81
−10 −8 −6 −4 −2 0 2 4 6 8 10−100
−80
−60
−40
−20
0
20
40
60
80
100
γ (t)
σ (t
)
−10 −8 −6 −4 −2 0 2 4 6 8 10−100
−80
−60
−40
−20
0
20
40
60
80
100
γ (t)
σ (t
)
−10 −8 −6 −4 −2 0 2 4 6 8 10−100
−80
−60
−40
−20
0
20
40
60
80
100
γ (t)
σ (t
)
−10 −8 −6 −4 −2 0 2 4 6 8 10−100
−80
−60
−40
−20
0
20
40
60
80
100
γ (t)
σ (t
)
−10 −8 −6 −4 −2 0 2 4 6 8 10−100
−80
−60
−40
−20
0
20
40
60
80
100
γ (t)
σ (t
)
−10 −8 −6 −4 −2 0 2 4 6 8 10−100
−80
−60
−40
−20
0
20
40
60
80
100
γ (t)
σ (t
)
A
B
C
D
E
F
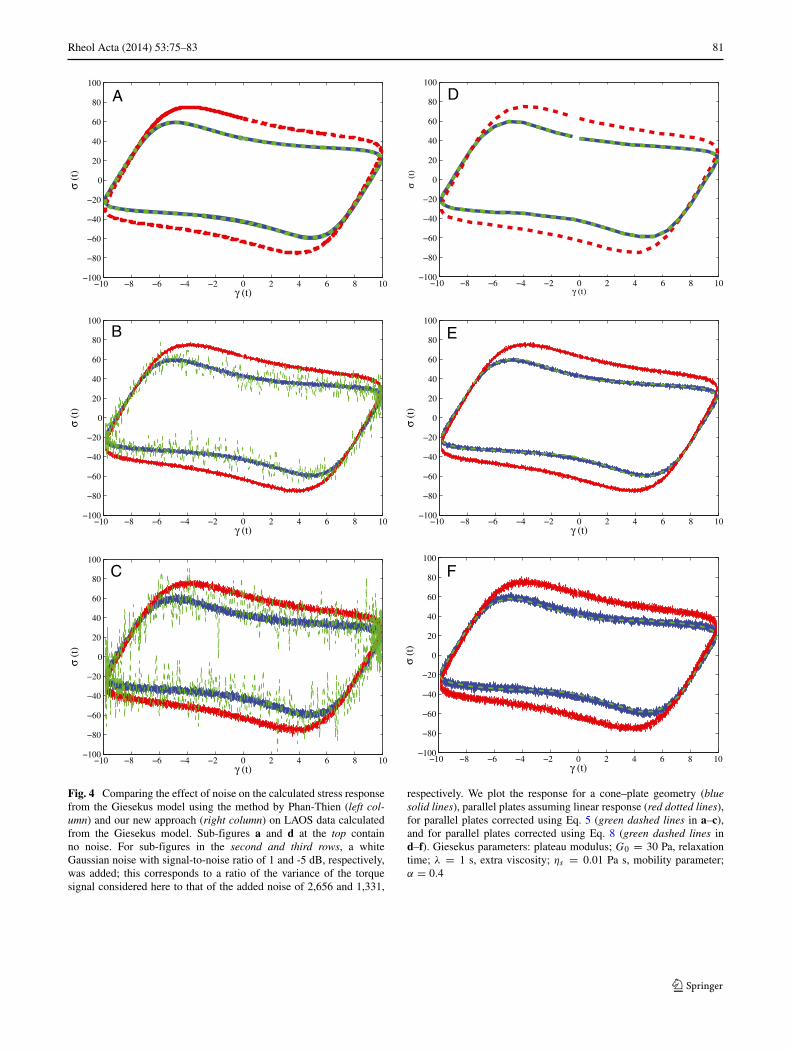
Fig. 4 Comparing the effect of noise on the calculated stress responsefrom the Giesekus model using the method by Phan-Thien (left col-umn) and our new approach (right column) on LAOS data calculatedfrom the Giesekus model. Sub-figures a and d at the top containno noise. For sub-figures in the second and third rows, a whiteGaussian noise with signal-to-noise ratio of 1 and -5 dB, respectively,was added; this corresponds to a ratio of the variance of the torquesignal considered here to that of the added noise of 2,656 and 1,331,
respectively. We plot the response for a cone–plate geometry (bluesolid lines), parallel plates assuming linear response (red dotted lines),for parallel plates corrected using Eq. 5 (green dashed lines in a–c),and for parallel plates corrected using Eq. 8 (green dashed lines ind–f). Giesekus parameters: plateau modulus; G0 = 30 Pa, relaxationtime; λ = 1 s, extra viscosity; ηs = 0.01 Pa s, mobility parameter;α = 0.4
82 Rheol Acta (2014) 53:75–83
To systematically investigate this effect, we use theGiesekus model (Giesekus 1982) to create a series of theo-retical test data-sets with well-defined added signal-to-noiseratio Gaussian white noise and apply both our new methodand the method by Phan-Thien to these data sets. Thisallows us to investigate in detail the influence of the noiseadded to the time-dependent torque on the calculated stressresponse. We reconstruct the shapes of the Lissajous curvesas they would be measured in a parallel plates tool fromEq. 2 by numerical integration of the response simulated atdifferent strain amplitudes, as illustrated by red dotted linesin Fig. 4. The true stress response obtained from the modelassuming cone–plate geometry is shown as blue lines in allsub-figures with the level of noise increasing from top tobottom.
The stress calculated from the torque data is plottedas green dashed lines for the Phan-Thien method and ourmethod, as shown respectively in the left (a–c) and right(d–f) column of Fig. 4. Without any added noise (sub-figures a and d), both methods perform equally well andaccurately capture the true stress response. However, asthe level of noise increases, clear difference between thetwo methods become apparent. Using the method of Phan-Thien et al., (a–c), the noise in the calculated stress responseincreases dramatically by increasing the level of addednoise. Conversely, for our method (sub-figures d–f), thecalculated response is only weakly affected by the addednoise and naturally limits the noise in the calculated stressresponse.
Conclusion
In summary, we have developed an alternative method forobtaining correct data from LAOS measurements whichenables us to access the true nonlinear response of amaterial based solely on the apparent response obtainedusing a parallel plates geometry. We have demonstratedthe application of this new approach on experimental dataand compared its results with the most prevalent pre-vious method. We have further elucidated the issue ofexperimental noise and shown that our method naturallyavoids the amplification of noise by performing the anal-ysis on the components of a Fourier series representationof the response. The method should be particularly use-ful for solid-like materials that can be produced or cut intoflat films, but cannot be readily formed into the shapesrequired by a cone–plate or Couette geometry. Importantly,no assumptions on the constitutive behavior of the mate-rial are required. Compared to the most prevalent existingmethod, the proposed approach reduces the noise in the dataand gives better empirical results. Our approach is directlyapplicable to a wide range of soft materials, including
yield stress fluids, elastomers, hydrogels, organogels, col-loidal systems, and biological tissues.
References
Broedersz CP, Kasza KE, Jawerth LM, Muenster S, WeitzDA, MacKintosh FC (2010) Measurement of nonlinear rheol-ogy of crosslinked biopolymer gels. Soft Matter 6(17):4120–4127
Carvalho MS, Padmanabhan M, Macosko CW (1994) Single pointcorrection for parallel disks geometry. J Rheol 38(6):1925–1936
Cho KS, Hyun K, Ahn KH, Lee SJ (2005) A geometrical interpretationof large amplitude oscillatory shear response. J Rheol 49(3):747–758
Ewoldt RH, Clasen C, Hosoi AE, McKinley GH (2007) Rheologi-cal fingerprinting of gastropod pedal mucus and synthetic com-plex fluids for biomimicking adhesive locomotion. Soft Matter3(5):634–643
Ewoldt RH, Hosoi AE, McKinley GH (2008) New measurementsfor characterizing nonlinear viscoelasticity in large amplitudeoscillatory shear. J Rheol 52(6):1427–1458
Gardel ML, Shin JH, MacKintosh FC, Mahadevan L, Matsudaira P,Weitz DA (2004) Elastic behavior of cross-linked and bundledactin networks. Science 304(5675):1301–1305
Giesekus H (1982) A simple constitutive equation for polymer fluidsbased on the concept of deformation-dependent tensorial mobility.J Non-Newtonian Fluid Mech 11(1):69–109
Graeme RC, Yee-Kwong L, Yeow YL (2005) Obtaining the shearstress shear rate relationship and yield stress of liquid foods fromparallel disk data. J Food Sci 70(1):50–55
Hyun K, Kim W (2011) A new non-linear parameter Q from FT-rheology under nonlinear dynamic oscillatory shear for polymermelts system. Korea-Australia Rheol J 23(4):227–235
Hyun K, Wilhelm M, Klein CO, Cho KS, Nam JG, Ahn KH, LeeSJ, Ewoldt RH, McKinley GH (2011) A review of nonlinearoscillatory shear tests: analysis and application of large ampli-tude oscillatory shear (LAOS). Prog Polym Sci 36(12):1697–1753
Janmey PA, Amis EJ, Ferry JD (1983) Rheology of fibrin clotsVI. Stress-relaxation, creep, and differential dynamic modulusof fine clots in large shearing deformations. J Rheol 27(2):135–153
Lopez-Suevos F, Frazier CE (2006) Parallel plate rheology of latexfilms bonded to wood. Holzforschung 60(1):47–52
Macosko CW (1994) Rheology principles, measurement and applica-tion. Wiley, New York
Ng TSK, McKinley GH, Ewoldt RH (2011) Large amplitude oscilla-tory shear flow of gluten dough: a model power-law gel. J Rheol55(3):627–654
Phan-Thien N, Newberrys M, Tanner RI (2000) Nonlinear oscillatoryflow of a soft solid-like viscoelastic material. J Non-NewtonianFluid Mech 92(1):67–80
Piechocka IK, Bacabac M, Potters M, MacKintosh FC, KoenderinkGH (2010) Structural hierarchy governs fibrin gel mechanics.Biophys J 98(10):2281–2289
Rogers SA, Lettinga MP (2012) A sequence of physical processesdetermined and quantified in large amplitude oscillatory shear(LAOS): application to theoretical nonlinear models. J Rheol56(1):1–25
Shah JV, Janmey PA (1997) Strain hardening of fibrin gels and plasmaclots. Rheol Acta 36(3):262–268
Rheol Acta (2014) 53:75–83 83
Soskey PR, Winter HH (1984) Large step shear strain experimentswith parallel disk rotational rheometers. J Rheol 28(28):625–645
Storm C, Pastore JJ, MacKintosh FC, Lubensky TC, Janmey PA (2005)Nonlinear elasticity in biological gels. Nature 435(7039):191–194
Vananroye A, Leen P, Van Puyvelde P, Clasen C (2011) TTSis LAOS: validation of time-temperature superposition under
large amplitude oscillatory shear. Rheol Acta 50(9–10):795–807
Wilhelm M (2002) Fourier transform rheology. Macromol Mater Eng287(2):83–105
Wilhelm M, Maring D, Spiess HW (1998) Fourier transform rheology.Rheol Acta 37(4):399–405
Yoshimura A, Prudhomme RK (1988) Wall slip corrections for Cuetteand parallel disk viscometers. J Rheol 32(1):53–67