A New Algorithm to Classify the Homogeneity of ERS-2 Wave Mode SAR Imagette
9
RESEARCH ARTICLE A New Algorithm to Classify the Homogeneity of ERS-2 Wave Mode SAR Imagette Guiting Song & Jagabandhu Panda & Yanhui Zhang & Haoliang Chen & K. Muni Krishna Received: 17 April 2013 / Accepted: 3 June 2013 # Indian Society of Remote Sensing 2013 Abstract A new classification parameter is developed using 1535 ERS-2 wave mode synthetic aperture radar (SAR) test imagettes to better differentiate homoge- neous and inhomogeneous imagettes. The comparison between the new parameter (Min) and the previous one (Inhomo) (Schulz-Stellenfleth and Lehner, 2004) was done under varied threshold values of Inhomo. It is concluded that the performance of ‘Min’ is much better than ‘Inhomo’ when applying to the 1535 test imagettes. Furthermore, both Min and Inhomo are applied to nearly 1 million imagettes collected for the period from 1 September 1998 to 30 November 2000. The compari- sons of the global inhomogeneous distribution between ‘Min’ and ‘Inhomo’ reveal that both the areas and percentage of inhomogeneity calculated by ‘Min’ are larger than that calculated by ‘Inhomo’. By analyzing the low wind speed distribution of HOAPS data, we found that low wind speed over the ocean is one of the key reasons for the inhomogeneity of SAR imagettes. Keywords Synthetic aperture radar imagette . Homogeneity . Classification algorithm J Indian Soc Remote Sens DOI 10.1007/s12524-013-0302-3 G. Song (*) Department of Marine Science, Zhejiang Ocean University, 18 Haiyuan Rd, Zhoushan 316000, China e-mail: [email protected] J. Panda School of Physical and Mathematical Sciences, Nanyang Technological University, Singapore, Singapore e-mail: [email protected] Y. Zhang College of Resources and Environment, Shandong Agricultural University, Tai’an, China e-mail: [email protected] Y. Zhang Key Laboratory of Agricultural Environment, Universities of Shandong, Jinan, China H. Chen Singapore-MIT Alliance for Research and Technology, Singapore, Singapore e-mail: [email protected] K. M. Krishna Department of Meteorology and Oceanography, Andhra University, Visakhapatnam, India e-mail: [email protected]
Transcript of A New Algorithm to Classify the Homogeneity of ERS-2 Wave Mode SAR Imagette
RESEARCH ARTICLE
A New Algorithm to Classify the Homogeneity of ERS-2Wave Mode SAR Imagette
Guiting Song & Jagabandhu Panda & Yanhui Zhang &
Haoliang Chen & K. Muni Krishna
Received: 17 April 2013 /Accepted: 3 June 2013# Indian Society of Remote Sensing 2013
Abstract A new classification parameter is developedusing 1535 ERS-2 wave mode synthetic aperture radar(SAR) test imagettes to better differentiate homoge-neous and inhomogeneous imagettes. The comparisonbetween the new parameter (Min) and the previous one(Inhomo) (Schulz-Stellenfleth and Lehner, 2004) wasdone under varied threshold values of Inhomo. It isconcluded that the performance of ‘Min’ is much betterthan ‘Inhomo’when applying to the 1535 test imagettes.Furthermore, bothMin and Inhomo are applied to nearly1 million imagettes collected for the period from 1
September 1998 to 30 November 2000. The compari-sons of the global inhomogeneous distribution between‘Min’ and ‘Inhomo’ reveal that both the areas andpercentage of inhomogeneity calculated by ‘Min’ arelarger than that calculated by ‘Inhomo’. By analyzingthe low wind speed distribution of HOAPS data, wefound that low wind speed over the ocean is one of thekey reasons for the inhomogeneity of SAR imagettes.
Keywords Synthetic aperture radar imagette .
Homogeneity . Classification algorithm
J Indian Soc Remote SensDOI 10.1007/s12524-013-0302-3
G. Song (*)Department of Marine Science, Zhejiang Ocean University,18 Haiyuan Rd,Zhoushan 316000, Chinae-mail: [email protected]
J. PandaSchool of Physical and Mathematical Sciences,Nanyang Technological University,Singapore, Singaporee-mail: [email protected]
Y. ZhangCollege of Resources and Environment,Shandong Agricultural University,Tai’an, Chinae-mail: [email protected]
Y. ZhangKey Laboratory of Agricultural Environment,Universities of Shandong,Jinan, China
H. ChenSingapore-MIT Alliance for Research and Technology,Singapore, Singaporee-mail: [email protected]
K. M. KrishnaDepartment of Meteorology and Oceanography,Andhra University,Visakhapatnam, Indiae-mail: [email protected]
Introduction
During the last three decades, several satellite mis-sions have provided meteorological and oceanic datasets for research and operational purposes to theweather, ocean and climate communities. In future, itis expected that the planned satellite missions willresult in a five order of magnitude increase in thevolume of data available for use by the operationalscientists and researchers all over the world (Marshallet al. 2009). These data sets would provide accuraciesin predicting the weather events and is expected toimprove the environmental prediction capability.Analyzing the satellite data for any weather event isnot so simple, since it involves various technicalities.However, the scientists are continuously trying tomake use of the satellite products in weather, oceanand climate studies (e. g. Mitra et al. 2013). Forexample, the satellite derived data sets have been usedfor the study of surface and upper-air characteristics(Panda and Giri 2012), near-surface wind driven fea-tures over ocean surface (Deb et al. 2009), heavyrainfall events (Deb et al. 2008), and also for thestudies related to tropical cyclones (Panda et al.2011; Deb et al. 2011; Jaishwal et al. 2012, 2013).
In view of the utility of satellite products, appropri-ate techniques need to be developed (e. g. Jaishwal etal. 2012) for deriving the environmental parameters(both ocean and atmosphere) from remotely sensedmeasurements by the environmental satellites. For ex-ample, it has been demonstrated earlier that the syn-thetic aperture radar (SAR) imagette can be used toderive wave parameters like significant wave height,wind speed and mean wave period (Schulz-Stellenflethet al. 2007). The empirical algorithm developed bySchulz-Stellenfleth et al. (2007) was called CWAVEand the imagette is the only input data for CWAVE, sothe homogeneity feature of the imagette has importanteffect on the result of the CWAVE. Several studies inpast have also analyzed the feature of SAR imagettes(Hasselmann et al. 1985; Lyzenga et al. 1985; Alpersand Bruemmer 1994; Horstmann et al. 2003; Schulz-Stellenfleth and Lehner 2004). These studies revealthat several factors such as ice, atmospheric featureslike rain or biogenic surface film, oil slick, or ship wakecould make the imagettes inhomogeneous and suchinhomogeneous imagettes could not be applied intoCWAVE to retrieve wave parameters. Therefore, ahomogeneity test must be performed beforehand. In
view of this, an effort is made in the current study toimprove the performance of CWAVE by developing anew classification parameter of the imagette forCWAVE. Further, significance of this new classifica-tion parameter is discussed over several regions of theworld. The study mainly uses the European satellite(ERS-2) products for the classification of imagettes anddeveloping the new algorithm for this purpose.
Data Used
Two types of data sets are used in this study. One is thewave mode ERS-2 SAR imagettes and the other one isthe HOAPS (Hamburg Ocean Atmosphere Parametersand Fluxes from Satellite) wind speed data. The detailsof these data sets are described in this section alongwith their utility in relating to the present study.
Wave Mode ERS-2 Imagette
The imagettes used in this study is wave mode ERS-2imagettes which is 10 by 5 km size acquired every200 km along the satellite track. The C-band radaroperates with vertical polarization in transmit and re-ceives and provides a spatial resolution of about 10 min azimuth direction and 20 m in range direction. Therequired SAR wave mode single look complex (SLC)imagettes, which are not available as standard products,were reprocessed at German Aerospace Center (DLR)(Lehner et al. 2000) from raw data provided by theEuropean Space Agency (ESA). 1535 test imagettesclassified by eye including four types of imagettes i. e.water, slick, ice and undefined inhomogeneous imagetteswere applied to develop new classification parametersand are shown in Fig. 1. The newly-developed parame-ters are validated by nearly 1 million ERS-2 wave modeimagettes from 1 September 1998 to 30November 2000.
HOAPS Wind Speed Data
The HOAPS wind speed data used in this study has aresolution of 0.25º×0.25º latitude-longitude grid. It isconsidered twice a day (0 UTC (0–12 UTC over-passes) and 12 UTC (12–24 UTC overpasses)). Eachgrid-cell contains the average of data from the satellitethat passed this grid box closest to 12 and 24 UTC,respectively. The time range of HOAPS data used inthis article is also from 1 September 1998 to 30
J Indian Soc Remote Sens
November 2000. The HOAPS data have been used tounderstand the underlying reasons of inhomogeneityin the SAR imagettes. Many natural or artificial factorscould contaminate the SAR imagette over the oceansuch as low wind speed, precipitation, oil spill, atmo-spheric fronts, bottom topographic effect, currents andsea ice above 50 º N and 50 º S etc. However, the lowwind speed, precipitation and oil spill are usually themost likely reasons to contaminate the SAR imagetteover open ocean (Brekke and Solberg 2005). TheHOAPS wind data is derived from special sensormicrowave/imager (SSM/I) passive microwave radi-ometers and it was considered as the long time series(1987–2008) and high spatial resolution’s wind satel-lite observations. It will be used to statistically calcu-late the percentage of the low wind speed over every3°×3° longitude/latitude grid boxes. Its high spatialresolution could provide more samples over 3°×3°longitude/latitude grid boxes than other lower spatialresolution datasets.
New Classification and Parameter Developing
The homogeneity test (called Inhomo) used byCWAVE is based on the standard spectral estimation
theory developed by Schulz-Stellenfleth and Lehner(2004). For Inhomo test, every imagette has beendivided into 32 subimagettes of about 1×1 km size,which were used to estimate the mean and variance ofthe periodograms. The expectation value of the homo-geneity parameter θ (Inhomo) is defined as
θ ¼
X
k
var���
Pkð Þmean����
Pkð ÞX
k
mean����
Pkð Þ; ð1Þ
wheremean����
and var���
are the standard estimators for theperiodograms mean and variances. Pk is thesubimagette’s periodogram. For a perfectly homoge-neous imagette, the homogeneity parameter θ shouldbe 1.
When Inhomo test is applied to 804,300 ERS-2wave mode imagette data sets in order to filter theinhomogeneous ones, 741,264 imagettes were correct-ly classified. However, the remaining 63,036 imagetteswere incorrectly classified as homogeneous ones. Oneapparent reason of this miscalculation could be becauseof the retrieved parameters (such as wind speed, sig-nificant wave height or mean wave period) from these63,036 imagettes, which were negative. For CWAVE,
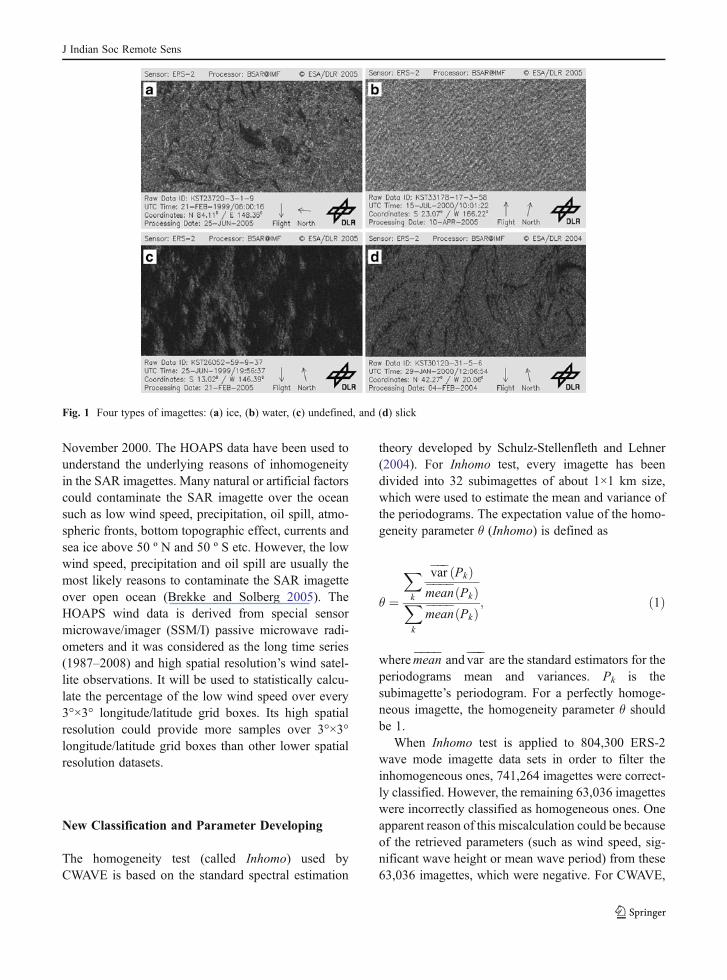
Fig. 1 Four types of imagettes: (a) ice, (b) water, (c) undefined, and (d) slick
J Indian Soc Remote Sens
if the input imagette is homogeneous, the retrievedparameters should not be negative. The percentage ofmisclassification is found to be approximately 7.84 %.Figure 1 shows three examples among these 63,036imagettes which were not correctly classified.Figures 1(a), (c) and (d) were classified by Inhomo testas homogeneous imagettes. However, all of these threeimagettes are inhomogeneous in nature, which repre-sent ice and undefined reasons caused the inhomoge-neity and slickness. In view of the above analysis, it isessential to develop a new parameter for better classi-fication of imagettes.
The Scheme of Division of Imagette
In every wave mode imagette, there are 512 pixels inthe range direction with the resolution of 20 m and1024 pixels in the azimuth direction with the resolu-tion of 10 m. In this scheme, 5 pixels are selected inthe range direction and 10 pixels are selected in theazimuth direction in every sub-imagette; thus the sizeof sub-imagette is about 100 m×100 m, and there are10404 sub-imagettes in one wave mode imagette.
Definition of New Parameters
Several new classification parameters were investigatedin this article. The definitions of them are as following:
(a) CoVar: the variance of the intensity of every sub-imagette divided by the mean value of intensityas ordinate versus the mean NRCS of the wholeimagette as abscissa; a separation function todistinguish the homogeneous imagettes from in-homogeneous ones will be derived using the leastsquares fitting method.
(b) Min: The Minimum normalized radar cross sec-tion (NRCS) of sub-imagette as ordinate versusthe mean NRCS of the whole imagette as abscis-sa; a separation function to distinguish the homo-geneous imagettes from inhomogeneous oneswill be derived using the least squares fittingmethod.
(c) Max: The Maximum NRCS of sub-imagette asordinate versus the mean NRCS of the wholeimagette as abscissa; a separation function alsowill be derived using the least squares fittingmethod.
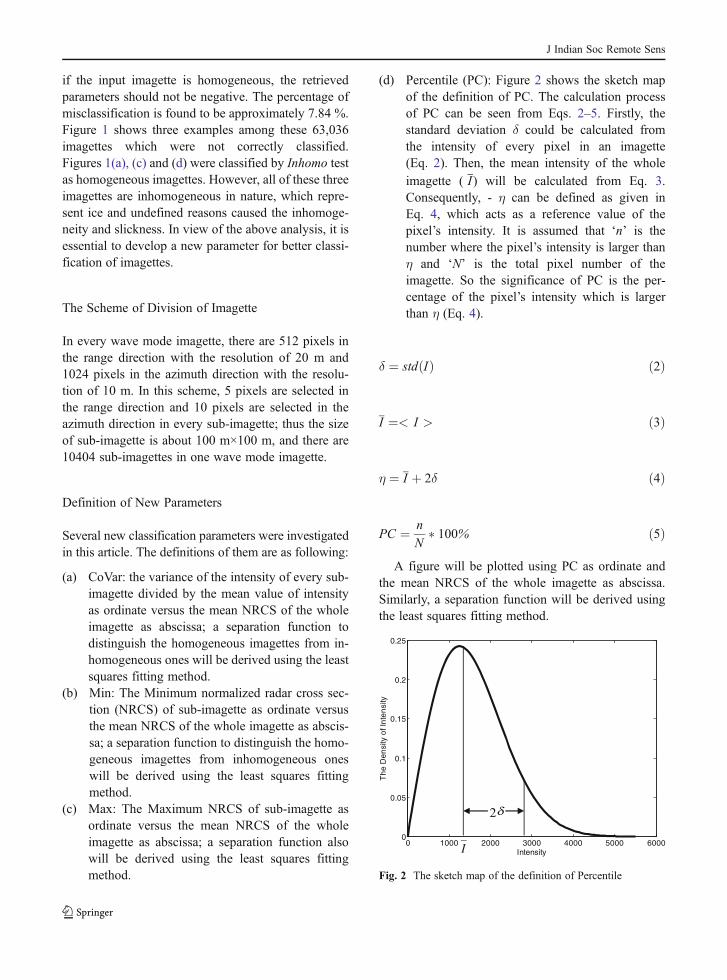
(d) Percentile (PC): Figure 2 shows the sketch mapof the definition of PC. The calculation processof PC can be seen from Eqs. 2–5. Firstly, thestandard deviation δ could be calculated fromthe intensity of every pixel in an imagette(Eq. 2). Then, the mean intensity of the whole
imagette ( I) will be calculated from Eq. 3.Consequently, - η can be defined as given inEq. 4, which acts as a reference value of thepixel’s intensity. It is assumed that ‘n’ is thenumber where the pixel’s intensity is larger thanη and ‘N’ is the total pixel number of theimagette. So the significance of PC is the per-centage of the pixel’s intensity which is largerthan η (Eq. 4).
δ ¼ std Ið Þ ð2Þ
I ¼< I > ð3Þ
η ¼ I þ 2δ ð4Þ
PC ¼ n
N� 100% ð5Þ
A figure will be plotted using PC as ordinate andthe mean NRCS of the whole imagette as abscissa.Similarly, a separation function will be derived usingthe least squares fitting method.
0 1000 2000 3000 4000 5000 60000
0.05
0.1
0.15
0.2
0.25
Intensity
The
Den
sity
of I
nten
sity
I
2
Fig. 2 The sketch map of the definition of Percentile
J Indian Soc Remote Sens
Results and Discussion
The new parameters defined in Definition of newparameters sub-section are applied to the 1535 test
imagettes and the best one, which is the parameter ofthe least number of misclassifications, is chosen forfurther application and analysis.
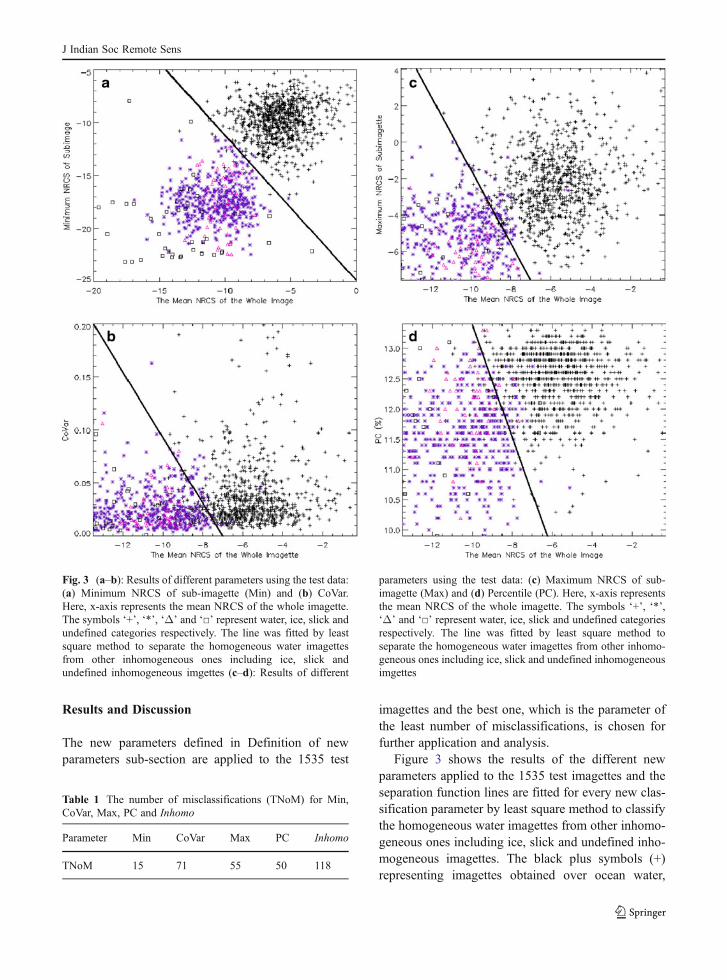
Figure 3 shows the results of the different newparameters applied to the 1535 test imagettes and theseparation function lines are fitted for every new clas-sification parameter by least square method to classifythe homogeneous water imagettes from other inhomo-geneous ones including ice, slick and undefined inho-mogeneous imagettes. The black plus symbols (+)representing imagettes obtained over ocean water,
Fig. 3 (a–b): Results of different parameters using the test data:(a) Minimum NRCS of sub-imagette (Min) and (b) CoVar.Here, x-axis represents the mean NRCS of the whole imagette.The symbols ‘+’, ‘*’, ‘Δ’ and ‘□’ represent water, ice, slick andundefined categories respectively. The line was fitted by leastsquare method to separate the homogeneous water imagettesfrom other inhomogeneous ones including ice, slick andundefined inhomogeneous imgettes (c–d): Results of different
parameters using the test data: (c) Maximum NRCS of sub-imagette (Max) and (d) Percentile (PC). Here, x-axis representsthe mean NRCS of the whole imagette. The symbols ‘+’, ‘*’,‘Δ’ and ‘□’ represent water, ice, slick and undefined categoriesrespectively. The line was fitted by least square method toseparate the homogeneous water imagettes from other inhomo-geneous ones including ice, slick and undefined inhomogeneousimgettes
Table 1 The number of misclassifications (TNoM) for Min,CoVar, Max, PC and Inhomo
Parameter Min CoVar Max PC Inhomo
TNoM 15 71 55 50 118
J Indian Soc Remote Sens
which indicate the homogeneous ones, could be usedfor CWAVE. The purple star symbols (*) representingimagettes obtained over ice, the pink triangle symbols(Δ) for imagettes with slick and the black square ones(□) for undefined inhomogeneous imagettes indicatethat the unclear reason causes the inhomogeneity. Thenumber of misclassifications (TNoM) for every pa-rameter including Min, CoVar, Max, PC and Inhomois listed in Table 1. The TNoM for Min, CoVar, Maxand PC are calculated from Fig. 3, and the TNoM forInhomo was calculated by eye when the test imagettesdatasets are prepared. It can be seen that the TNoM ofMin is the least, which is only 15. The TNoMs of thefour new parameters are much less than that ofInhomo. We also give a list of the TNoMs of Inhomo
under varied threshold values in Table 2. Currently,the threshold value of Inhomo used in CWAVE is 1.07(Schulz-Stellenfleth et al. 2007), which is proved herethat the threshold value of 1.07 is the best becauseboth increase and decrease of the threshold value from1.07 lead to a larger number of TNoM. When increas-ing the threshold value from 1.07, more inhomoge-neous imagettes were misclassified into homogeneousones, and when decreasing the threshold value from1.07, more homogeneous imagettes were misclassifiedinto inhomogeneous ones. Therefore, based on thestatistical analysis and comparisons above, ‘Min’should be chosen as the new standard classificationparameter for further applications. After least squaresfitting, the function for ‘Min’ y=tan(126°)x−24.9,which approximates y=−1.376x−24.9, can be obtainedto separate the homogeneous and inhomogeneousimagettes, where y is the minimum NRCS of sub-imagttes and x is the mean NRCS of the wholeimagette. This separation function will be applied tothe 2 years imagettes to distinguish the homogeneous
Table 2 The number of misclassifications (TNoM) for Inhomounder varied threshold values
Inhomo 1.03 1.04 1.05 1.06 1.07 1.08 1.09 1.10 1.11
TNoM 128 125 123 121 118 122 123 125 126
Northwestern Arabian Sea
Western Arabian Sea
Indonesian and Papua New Guinea islands region
Northwest Africa coastal area
West coastal area of North and Middle America
the Galápagos Islands area
a
b
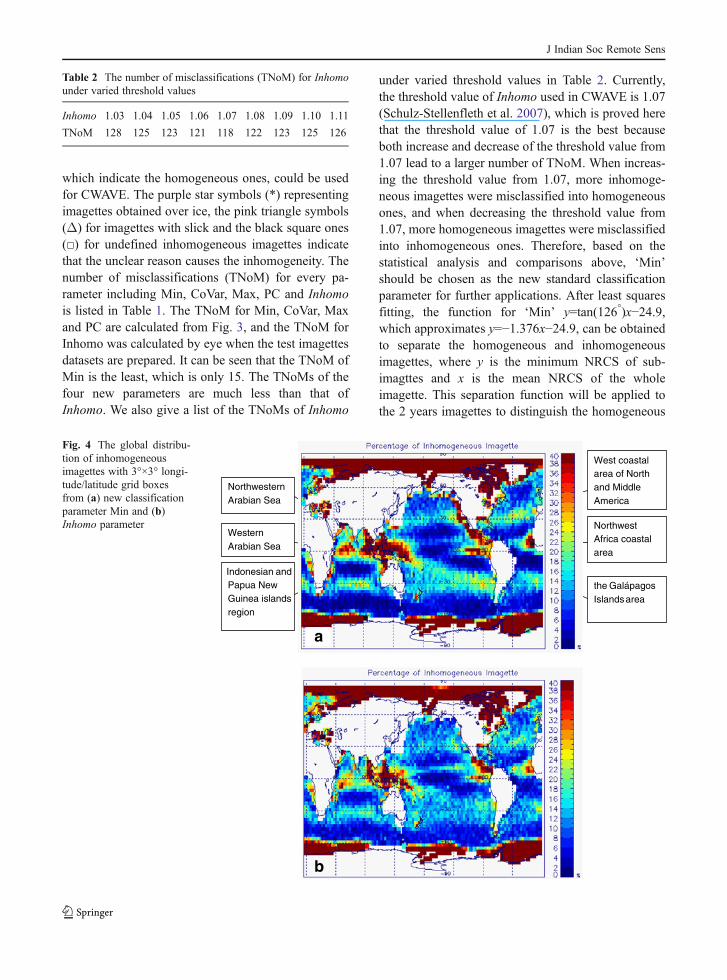
Fig. 4 The global distribu-tion of inhomogeneousimagettes with 3°×3° longi-tude/latitude grid boxesfrom (a) new classificationparameter Min and (b)Inhomo parameter
J Indian Soc Remote Sens
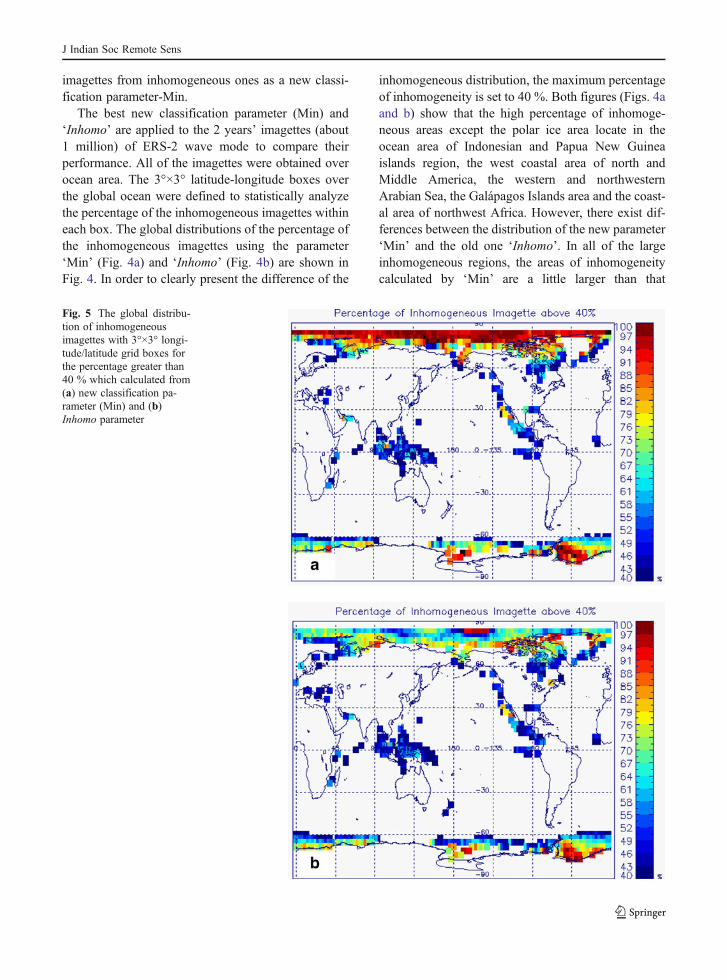
imagettes from inhomogeneous ones as a new classi-fication parameter-Min.
The best new classification parameter (Min) and‘Inhomo’ are applied to the 2 years’ imagettes (about1 million) of ERS-2 wave mode to compare theirperformance. All of the imagettes were obtained overocean area. The 3°×3° latitude-longitude boxes overthe global ocean were defined to statistically analyzethe percentage of the inhomogeneous imagettes withineach box. The global distributions of the percentage ofthe inhomogeneous imagettes using the parameter‘Min’ (Fig. 4a) and ‘Inhomo’ (Fig. 4b) are shown inFig. 4. In order to clearly present the difference of the
inhomogeneous distribution, the maximum percentageof inhomogeneity is set to 40 %. Both figures (Figs. 4aand b) show that the high percentage of inhomoge-neous areas except the polar ice area locate in theocean area of Indonesian and Papua New Guineaislands region, the west coastal area of north andMiddle America, the western and northwesternArabian Sea, the Galápagos Islands area and the coast-al area of northwest Africa. However, there exist dif-ferences between the distribution of the new parameter‘Min’ and the old one ‘Inhomo’. In all of the largeinhomogeneous regions, the areas of inhomogeneitycalculated by ‘Min’ are a little larger than that
Fig. 5 The global distribu-tion of inhomogeneousimagettes with 3°×3° longi-tude/latitude grid boxes forthe percentage greater than40 % which calculated from(a) new classification pa-rameter (Min) and (b)Inhomo parameter
J Indian Soc Remote Sens

calculated by ‘Inhomo’. Also the color in the samearea of inhomogeneity of ‘Min’ shows much redderthan that of ‘Inhomo’. These two features also exist inFig. 5, which shows the global distribution of inho-mogeneity greater than 40 %. Both of the Figs. 4 and 5indicate that the parameter ‘Min’ could filter moreinhomogeneous imagettes than ‘Inhomo’, whichmeans that even when the ‘Inhomo’ parameter’s re-sults are homogeneous, the parameter ‘Min’ still couldgive the opposite judgment. Therefore, the parameter‘Min’ might be more powerful to filter the inhomoge-neous imagettes than ‘Inhomo’.
The main reason of such strong inhomogeneousdistribution in Figs. 4 and 5 is possibly due to thelow wind speed as seen from Fig. 6. The high percent-age HOAPS low wind speed (lower than 3 m/s) dis-tributions in Fig. 6 agrees well with the inhomoge-neous imagette distributions of Figs. 4 and 5. But theareas of the low wind speed are a little smaller than theinhomogeneous imagette areas. Under low wind speedcondition, the SAR backscatter signal gets reduced;thus dark regions or spots will appear in the SARimages and the speckle level of the SAR image willbe increased. This probably is the main reason of theconsistent distribution of inhomogeneity of SARimagette and low wind speed.
Conclusions
Synthetic aperture radar is one of the most applicablespace-borne sensors for retrievals of ocean surfacewind, ocean surface wave and internal wave, currentfronts and ocean eddies. SAR images are also widely
used to detect man-made illegal or accidental spillsand natural seepage from oil deposits. In shallowwaters, SAR imagery allows to infer the ocean bottomtopography. All of these applications need to firstdistinguish the homogeneity property of the SAR im-age. In this study four new parameters are tested tobetter separate homogeneous imagettes from inhomo-geneous ones. The ‘Min’ parameter was chosen be-cause of its best performance of separating the homog-enous imagettes from inhomogeneous ones. The sep-aration function of ‘Min’ was fitted as y=−1.376x−24.9, where ‘y’ is the minimum NRCS of sub-imagettes and ‘x’ is the mean NRCS of the wholeimagette. Comparisons between the new parameter‘Min’ and previous parameter ‘Inhomo’ were doneusing both 1535 test imagettes and nearly 1 millionimagettes collected for the period from September1998 to November 2000. The comparisons imply thatthe new parameter ‘Min’ classifies the property of thetest imagettes much better than ‘Inhomo’ and it is alsomore capable to filter inhomogeneous imagettes as com-pared to ‘Inhomo’. The new parameter ‘Min’ can pos-sibly be applied to CWAVE and is expected to betterdistinguish the homogeneity of the SAR imagette.
The inhomogeneous imagettes distribution agreeswell with the low wind speed distribution fromHOAPS datasets because low wind speed causes morespeckle noise and nonlinear intensity inhomogeneityduring SAR imaging. Under low wind speed the radarbackscatter signal will be reduced and then dark re-gions or spots will appear in the SAR image, that isspeckle noise.
A number of SAR missions are crucial for contin-uous SAR research. European radar satellites ERS-1,
West coastal area of Middle America area
NorthwestAfrica coastal area
Galápagos Islands area
Northwestern Arabian Sea
Western Arabian Sea
Indonesian and Papua New Guinea islands region
Fig. 6 The global distribution of low wind speed (lower than 3 m/s) with 3°×3° longitude/latitude grid boxes from HOAPS datasets
J Indian Soc Remote Sens
ERS-2, Envisat, TerraSAR-X and TanDEM-X provid-ed valuable SAR images for this study. All of the SARsatellites provide wave mode SAR imagettes similar tothe ones used in this paper. There is also a number ofSAR missions planned. The new separation function(Min) can possibly be helpful in a wide range ofapplications in order to distinguish the homogeneityand inhomogeneity of SAR image.
Acknowledgments The authors are thankful to the anony-mous reviewers for their valuable comments in order to improvethis paper.
References
Alpers, W., & Bruemmer, B. (1994). Atmospheric boundarylayer rolls observed by the synthetic aperture radar aboardthe ERS-1 satellite. Journal of Geophysical Research, 99,12613–12621.
Brekke, C., & Solberg, A. H. S. (2005). Oil spill detection bysatellite remote sensing. Remote Sensing of Environment,95, 1–13.
Deb, S. K., Kishtawal, C. M., Pal, P. K., & Joshi, P. C. (2008).Impact of TMI SST on the simulation of heavy rainfallepisode over Mumbai on 26th July 2005. Monthly WeatherReview, 136(10), 3714–3741.
Deb, S. K., Bhowmick, S. A., Kumar, R., & Sarkar, A. (2009).Inter-comparison of numerical model generated surfacewinds with QuikSCAT winds over Indian Ocean. MarineGeodesy, 32(4), 391–408.
Deb, S. K., Kumar, P., Pal, P. K., & Joshi, P. C. (2011).Assimilation of INSAT data in simulation of recent tropicalcyclone AILA. International Journal of Remote Sensing,32(18), 5135–5155.
Hasselmann, K., Raney, R. K., Plant, W. J., Alpers, W.,Shuchman, R. A., Lyzenga, D. R., Rufenach, C. L., &Tucker, M. J. (1985). Theory of synthetic aperture radarocean imaging: a MARSEN view. Journal of GeophysicalResearch, 90, 4659–4686.
Horstmann, J., Schiller, H., Schulz-Stellenfleth, J., & Lehner, S.(2003). Global wind speed retrieval from SAR. IEEETransactions on Geoscience and Remote Sensing, 41,2277–2286.
Jaishwal, N., Kishtawal, C. M., & Pal, P. K. (2012). Cycloneintensity estimation using similarity of satellite IR imagesbased on histogram matching approach. AtmosphericResearch, 118, 215–221.
Jaishwal, N., Kishtawal, C. M., & Pal, P. K. (2013). Predictionof tropical cyclogenesis in North Indian Ocean usingOceansat-2 scatterometer (OSCAT) winds. Meteorologyand Atmospheric Physics, 119, 137–149.
Lehner, S., Schulz-Stellenfleth, J., Schaettler, B., Breit, H., &Horstmann, J. (2000). Wind and wave measurements usingcomplex ERS-2 SAR wave mode data. IEEE Transactionson Geoscience and Remote Sensing, 38(9), 2246–2257.
Lyzenga, D. R., Schuchman, R. A., & Lyden, J. D. (1985). SARimaging of wave in water and ice: evidence for velocitybunching. Journal of Geophysical Research, 90, 1031–1036.
Marshall, J. L., Jung, J., Riishojgaard, L.-P., Lord, S., Derber, J.,& Xiao, Y., et al. (2009). Satellite data assimilation, 5thWMO Workshop, 5–9 October, 2009 held at Melbourne,Australia.
Mitra, A. K., Kundu, P. K., & Giri, R. K. (2013). A quantitativeanalysis of KALPANA-1 derived water vapor winds and itsimpact on NWP model. Meteorology and AtmosphericPhysics, 120, 29–44.
Panda, J., & Giri, R. K. (2012). A comprehensive study ofsurface and upper air characteristics over two stations onthe west coast of India during the occurrence of a cyclonicstorm. Natural Hazards, 64, 1055–1078.
Panda, J., Giri, R. K., Patel, K. H., Sharma, A. K., & Sharma, R.K. (2011). Impact of satellite derived winds and cumulusphysics during the occurrence of the tropical cyclonePhyan. Indian Journal of Science and Technology, 04,859–875.
Schulz-Stellenfleth, J., & Lehner, S. (2004). Measurement of 2-d sea surface elevation fields using complex syntheticaperture radar data. IEEE Transactions on Geoscienceand Remote Sensing, 42, 1149–1160.
Schulz-Stellenfleth, J., Koenig, T., & Lehner, S. (2007). Anempirical approach for the retrieval of integral ocean waveparameters from synthetic aperture radar data. Journal ofGeophysical Research, 112, 3019–3033.
J Indian Soc Remote Sens