Soil moisture mapping over the Chinese Loess Plateau using ENVISAT/ASAR data
Upload
khangminh22Category
view
0download
0
ERS-Envisat Symposium“Looking down to Earth in the New Millennium”
FOREWORD
The ESA ERS-ENVISAT Symposium entitled “Looking down to Earth in the NewMillennium” was organized jointly by ESA and Chalmers University of Technology andwas held at Svenska Mässan, the Swedish Exhibition & Congress Centre, in Gothenburg,Sweden from 16th to 20th October 2000. This was the fourth ERS Earth Observationsymposium, following those in Cannes (1992), Hamburg (1993) and Florence (1997) andwas the first ENVISAT symposium. This symposium was open to all interested parties,from scientists to operational commercial users and service providers and was attendedby 540 participants from 34 different countries. Some 451 abstracts were submitted to thesymposium and a Scientific Committee of 70 members composed of scientists and ESAexperts supported the programme preparation.
Following the themes of the ENVISAT Announcement of Opportunity the 296 oralpresentations were grouped into 42 sessions. Each session was chaired by leadingscientists and co-chaired by an ESA expert. In the conference exhibit area some 150posters were displayed and 5 demonstrations were organized. The conference standsallowed some 25 companies involved in earth observation to present their work.
The symposium gave participants the opportunity to review the current status of ERSscience and application developments after nearly ten years of ERS data exploitation andto present the launch preparations for ENVISAT, as well as the plans for calibration andvalidation of the different data products that will be supplied. The ERS-ENVISATsymposium demonstrated the ERS-1 and 2 missions’ contribution to the monitoring ofour environment, and the continuous development of Earth Observation (E.O.)applications. The presentations given ranged from pure research, to demonstration ofapplications and development of services and markets. Several new applications of E.O.data were presented and an increased emphasis on atmospheric disciplines was apparent.In addition, ESA distributed to all participants two questionnaires aimed at collectingtheir feedback on data exploitation and user services.
The enclosed proceedings contain the results presented at the symposium in the form offull-length papers, summary reports of the 42 sessions and recommendations brought upat the symposium. A web site was also prepared for the conference and submitted papersare now available on-line at URL: http://www.esa.int/sympo2000/
We would like to acknowledge Chalmers University of Technology and the City ofGothenburg for hosting the symposium .We also thank the symposium ScientificCommittee, the appointed chairs and co-chairs for their work in supporting theprogramme and running the symposium sessions. Special thanks to the OrganizingCommittee for setting up a unique infrastructure which facilitated information exchangeas well as to all those who contributed daily to the successful running of the symposium.We also acknowledge all attendees and exhibitors of the symposium for theirpresentations and feedback.
We look forward to seeing all of you at the next ESA ERS-ENVISAT Symposium.
Dr. Stephen BRIGGS Prof. Jan ASKNEHead Earth Observation Applications Department Chalmers University of Technology,ESA-ESRIN Gothenburg, Sweden
A welcome to Sweden and Chalmers University of Technologyby J. Askne
It is an honour to have this symposium arranged in Gothenburg, particularly becausespace technology is important for Gothenburg and Chalmers University of Technology.Recently we have created a Centre for Astrophysics and Space Techniques to strengthenthe activities related to Onsala Space Observatory and ongoing research related to radiowaves (microwaves and sub millimetre waves). The historic roots were in ionosphericresearch and wave propagation, moving later to include radio astronomy and, morerecently, remote sensing.
The Odin satellite, a collaborative project between Canada, Finland, France, and Sweden,is due to be launched early next year. Odin will be used both for radio astronomy and, ina limb-sounding mode, for studies related to the ozone chemistry in the upperatmosphere. The development work for Odin’s sub-millimetre receiver has beenperformed at Chalmers, and both radio astronomical and aeronomy observations will bevery important for future work as well as work related to other satellites. In Gothenburgwe also have one of the major Swedish space related industries, Saab Ericsson Space.
Remote sensing at Chalmers using microwaves goes back to the 70s. The first remotesensing conference in Gothenburg was in 1987, when the URSI “Microwave Signaturesin Remote Sensing” was arranged. In 1994, the EARSeL General Assembly “Sensors andEnvironmental Applications of Remote Sensing” and the workshop on “Topography fromSpace”, were arranged here. Now the ESA ERS-Envisat conference “Looking Down toEarth in the New Millennium” means a further step in the development towards theusefulness of remote sensing.
The Swedish remote sensing program has always been focused on applications. Apreparatory program for ERS was initiated by the Swedish National Space Board in themid 80s. The Swedish Meteorological and Hydrological Institute (SMHI) together withkey remote sensing and technical groups such as Chalmers, the National DefenceResearch Institute, and the Swedish Space Corporation set the goals. The goal was tosupport the icebreaker operations in the Baltic with near real-time SAR imagery. Animportant part of the project was collaboration with similar interests in Finland, and thiswas quickly established enabling joint airborne campaigns and in-situ observations to becarried out in 1986 and 1987. The 3-day orbit of ERS-1 in 1992 and 1994 was related tothe needs of the sea ice community as represented by the ESA initiated PIPOR group.The final choice of the orbit was very much influenced by the needs to cover the Baltic.Today support by means of synthetic aperture radar images is established as anoperational service in the sense that each winter season a large number of SAR images isused (and paid for…).
Sea ice remote sensing is of great interest for the northern countries, and the cloudindependence of radar is rather important. In 1991, the first Swedish Arctic expeditionwas arranged. With the strong support of ESA, some of the very first ERS-1 images(from August 1991) were delivered for covering part of the expedition area. A group
onboard the icebreaker Oden made observations of ice properties and used measurementswith scatterometers to establish our understanding of scattering processes. In 1996, asecond expedition to the central Arctic was carried out with Oden, again carrying a groupstudying ice properties and comparing with simultaneous ERS and Radarsat SAR images.Arctic sea ice is a sensitive indicator to global change and properties such as ice extent,concentration, polynyas, etc. are important to follow up over long periods of time. FromSSM/I we have long term and global data sets, but with low resolution and accuracyproblems. SAR is an important complement for accurate information on ice properties,concentration, polynyas etc.
Although sea ice has been an important area for microwave remote sensing, the landapplications have always been of interest. 52% of Sweden is covered by forests, and playa key role in the country’s economy and environment. Remote sensing for changedetection and stem volume retrieval is very important. Radar backscatter from forests ishighly variable, but interferometry offers the extra information necessary to estimate stemvolume and biomass. The 3-day ice orbit suddenly offered the short repeat period, whichis necessary for forest applications, and the “tandem” mission offered still shorter repeattimes. The “experimental” aspects of ERS-1/2 (different orbits), together with the veryhigh stability of the satellite, provided the basis for developing the interferometricapplications. The Kyoto Protocol allows carbon emission to be balanced by carbon sinksrepresented by vegetation. For this purpose, aboveground vegetation biomass needs to bequantified. For boreal forests, InSAR seems to be an extremely interesting possibility forobservations during wintertime with stable ground conditions.
ERS-1/2 have offered opportunities for major remote sensing applications for a countrylike Sweden, with large coverage of sea ice and forest. Envisat is a major step ahead,offering important developments for e.g. sea ice, where the SAR wide swath, the globalmode and the alternating polarisation mode will be very important. The forestryapplications of interferometry for forestry were based on the short repeat period availableduring periods of the ERS-1/2 missions and are not expected to be possible with Envisat.Instead the SAR alternating polarisation and the use of MERIS are expected to giveinteresting information.
With each ERS symposium, the focus moves a step further from the technical issues, andmore towards the applications — in particular environmental applications. The need forglobal data sets with high accuracy, and stability over long time periods, is crucial toanswer many questions concerning global change. For those of us doing research in thefield of microwave remote sensing the ESA satellites have been a fascinating andinteresting development. Let me hope this symposium will be useful and effective, andlay the ground for observations in the new Millennium.

COMMITTEES

Scientific Committee
W. Alpers Univ. of Hamburg, GermanyJ. Askne Technical Univ. of Chalmers, SwedenP. Berry De Monfort Univ., UKC. Brockmann Brockmann Consult, GermanyJ. Burrows Univ. of Bremen, GermanyJ. L. Casanova Univ. Valladolid, SpainK. Chance Harvard-Smithsonian Center for Astrophysics, USAR. Cordey GEC Marconi, UKC. Doake British Antarctic Survey, UKM. Edwards Univ. of Leicester, UKH. Fischer Univ. of Karlsruhe, GermanyA. Goede SRON, NetherlandsM. Hallikainen Helsinki Univ. of Technology, FinlandE-A. Herland VTT, FinlandJ. Johannessen Nansen RS Center, NorwayT. Le Toan CESBIO, FranceS. Lehner DLR, GermanyJ. Lillibridge NOAA, USAD. Massonnet CNES, FranceW. Mauser Univ. of Munich, GermanyP. Pampaloni CNR/IROE, ItalyC. Prati POLIMI, ItalyP. Puyou-Lascassier SCOT, FranceS. Quegan SCEOS, UKF. Remy LEGOS, FranceF. Rocca POLIMI, ItalyH. Rott Univ. of Innsbruck, AustriaJ.P. Rudant Univ. Marne La Vallee, FranceR. Scharroo Delft Univ. of Technology, NetherlandsP.C. Simon IASB, BelgiumP. Stammes KNMI, NetherlandsP. Vachon CCRS, CanadaU. Wegmuller Gamma RS, SwitzerlandM. Wooding RSAC, UK

ESA Technical and Review Committee
P. BallyA. BelliniJ. BenvenisteJ. BequignonM. BorgeaudA. BuongiornoG. CalabresiJ. CalliesG. CampbellS. CasadioJ. ClosaY.L. DesnosM. DrinkwaterB. DuesmannM. EisingerP. FemeniasJ. FrerickP. GorylH. JacksonR. KoopmanH. LaurP. LecomteJ. LichteneggerE. MonjouxH. NettF. PalazzoA. PetrocchiP. RegnerS. RemondiereM. RocaB. Rosich TellF.M. SeifertH. TaitE. VoldenC. Zehner
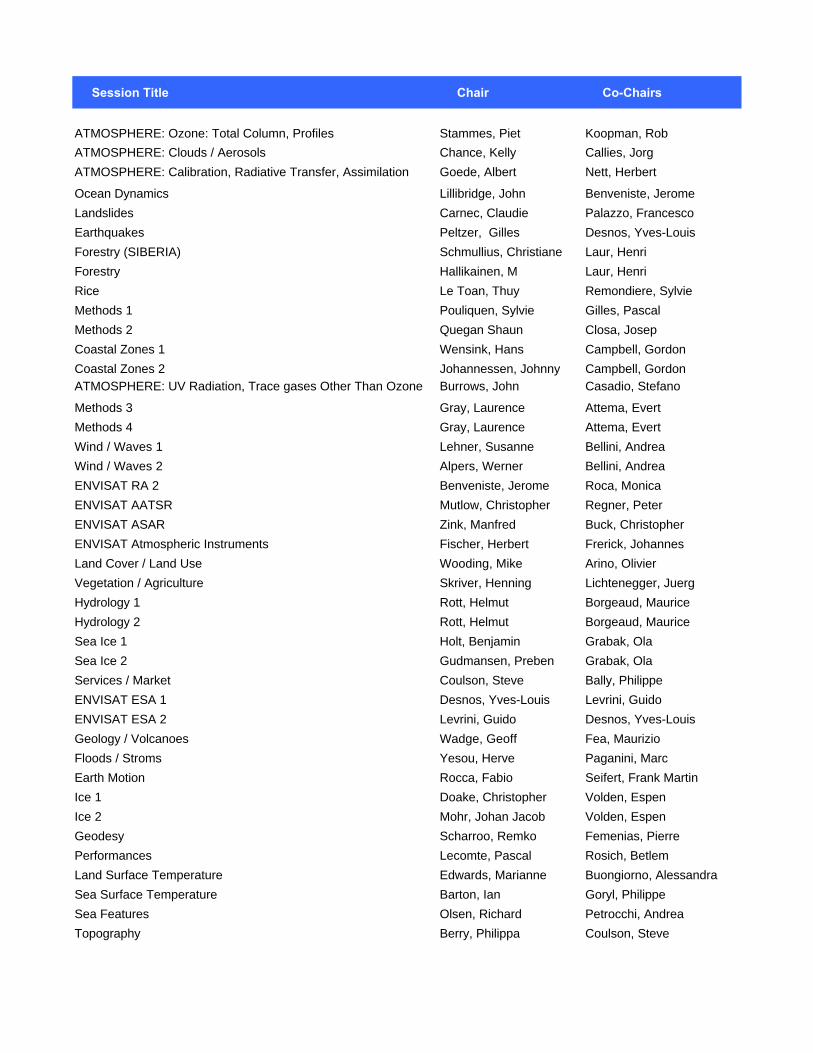
Session Title Chair Co-Chairs
ATMOSPHERE: Ozone: Total Column, Profiles Stammes, Piet Koopman, Rob
ATMOSPHERE: Clouds / Aerosols Chance, Kelly Callies, Jorg
ATMOSPHERE: Calibration, Radiative Transfer, Assimilation Goede, Albert Nett, Herbert
Ocean Dynamics Lillibridge, John Benveniste, Jerome
Landslides Carnec, Claudie Palazzo, Francesco
Earthquakes Peltzer, Gilles Desnos, Yves-Louis
Forestry (SIBERIA) Schmullius, Christiane Laur, Henri
Forestry Hallikainen, M Laur, Henri
Rice Le Toan, Thuy Remondiere, Sylvie
Methods 1 Pouliquen, Sylvie Gilles, Pascal
Methods 2 Quegan Shaun Closa, Josep
Coastal Zones 1 Wensink, Hans Campbell, Gordon
Coastal Zones 2 Johannessen, Johnny Campbell, Gordon
ATMOSPHERE: UV Radiation, Trace gases Other Than Ozone Burrows, John Casadio, Stefano
Methods 3 Gray, Laurence Attema, Evert
Methods 4 Gray, Laurence Attema, Evert
Wind / Waves 1 Lehner, Susanne Bellini, Andrea
Wind / Waves 2 Alpers, Werner Bellini, Andrea
ENVISAT RA 2 Benveniste, Jerome Roca, Monica
ENVISAT AATSR Mutlow, Christopher Regner, Peter
ENVISAT ASAR Zink, Manfred Buck, Christopher
ENVISAT Atmospheric Instruments Fischer, Herbert Frerick, Johannes
Land Cover / Land Use Wooding, Mike Arino, Olivier
Vegetation / Agriculture Skriver, Henning Lichtenegger, Juerg
Hydrology 1 Rott, Helmut Borgeaud, Maurice
Hydrology 2 Rott, Helmut Borgeaud, Maurice
Sea Ice 1 Holt, Benjamin Grabak, Ola
Sea Ice 2 Gudmansen, Preben Grabak, Ola
Services / Market Coulson, Steve Bally, Philippe
ENVISAT ESA 1 Desnos, Yves-Louis Levrini, Guido
ENVISAT ESA 2 Levrini, Guido Desnos, Yves-Louis
Geology / Volcanoes Wadge, Geoff Fea, Maurizio
Floods / Stroms Yesou, Herve Paganini, Marc
Earth Motion Rocca, Fabio Seifert, Frank Martin
Ice 1 Doake, Christopher Volden, Espen
Ice 2 Mohr, Johan Jacob Volden, Espen
Geodesy Scharroo, Remko Femenias, Pierre
Performances Lecomte, Pascal Rosich, Betlem
Land Surface Temperature Edwards, Marianne Buongiorno, Alessandra
Sea Surface Temperature Barton, Ian Goryl, Philippe
Sea Features Olsen, Richard Petrocchi, Andrea
Topography Berry, Philippa Coulson, Steve

SESSIONS SUMMARIESOMMITTEES

ATMOSPHERE: CALIBRATION, RADIATIVE TRANSFER, AND ASSIMILATION _____ 2
ATMOSPHERE: CLOUDS AND AEROSOLS ______________________________________ 4
ATMOSPHERE: OZONE, TOTAL COLUMN, AND PROFILES_______________________ 5
ATMOSPHERE: UV RADIATION, TRACE GASES OTHER THAN OZONE ____________ 6
COASTAL ZONES ____________________________________________________________ 8
EARTH MOTION ____________________________________________________________ 10
EARTHQUAKES ____________________________________________________________ 11
ENVISAT AATSR ____________________________________________________________ 13
ENVISAT ASAR _____________________________________________________________ 14
ENVISAT ATMOSPHERIC INSTRUMENTS _____________________________________ 14
ENVISAT ESA ______________________________________________________________ 16
ENVISAT RA2_______________________________________________________________ 17
FLOODS AND STORMS ______________________________________________________ 18
FORESTRY _________________________________________________________________ 19
FORESTRY: SIBERIA________________________________________________________ 20
GEODESY __________________________________________________________________ 21
GEOLOGY AND VOLCANOES_________________________________________________ 22
HYDROLOGY _______________________________________________________________ 23
ICE ________________________________________________________________________ 24
LAND COVER / LAND USE ___________________________________________________ 25
LAND SURFACE TEMPERATURE _____________________________________________ 26
LANDSLIDES _______________________________________________________________ 27
METHODS 1 ________________________________________________________________ 29
METHODS 2 ________________________________________________________________ 31
METHODS 3 ________________________________________________________________ 32
METHODS 4 ________________________________________________________________ 33
OCEAN DYNAMICS _________________________________________________________ 34
PERFORMANCE ____________________________________________________________ 35
RICE ______________________________________________________________________ 36
SEA SURFACE TEMPERATURE ______________________________________________ 37
SEA FEATURES_____________________________________________________________ 38
SEA ICE____________________________________________________________________ 38
SERVICES AND MARKET ____________________________________________________ 40
TOPOGRAPHY ______________________________________________________________ 41
VEGETATION AND AGRICULTURE ___________________________________________ 42
WIND AND WAVES__________________________________________________________ 42
SESSIONS SUMMARIESTABLE OF CONTENTS
ATMOSPHERE: CALIBRATION, RADIATIVE TRANSFER, ANDASSIMILATION
Chairman: Albert GoedeCo-Chairman: Herbert Nett
This session covered a large number of papers concerned with instrument calibration and the production ofgood quality level 1 data from the atmospheric chemistry instrument GOME on board the ERS-2 satellite.Some papers concerned data assimilation techniques applied to space borne atmospheric measurements andone paper was devoted to the development of a new radiative transfer model for use in data retrieval ofinstruments like GOME and SCIAMACHY.
Calibration is at the basis of the generation of good quality geophysical data products and is an essentialstep in establishing GOME as a reliable ozone-monitoring instrument for the decades to come. This refersto GOME-2 on the EUMETSAT Metop 1, 2 and 3 satellite series scheduled for operation in the 2006 to2020 time frame. Several papers addressed the issue of instrument degradation in the UV and the influenceof polarisation on the accuracy of the measured radiances. Notably, the GOME scan mirror was identifiedas a source of degradation in the UV (240 nm to 400 nm) and it was found that this degradation is differentfor the various calibration modes, employing the sun, the moon and the Earth as light sources. After fiveyears of operation, the UV (260 nm) sensitivity of the GOME instrument has dropped by more than a factorof two. The visible (400 – 600 nm) and infrared (600 – 800 nm) channels are not affected. The UVpolarisation measurement device (300 – 400 nm) was found to degrade by approximately 6 % per year.This will affect the accuracy of the radiance measurements by more than 5 % after five years of operation.
Corrections can and have been defined in the GOME data processor (GDP) version 1.06, to account forinstrument degradation. However, at around the end of the year 1998 a new UV degradation phenomenonseems to have arisen causing different degradation rates for the solar irradiance and Earth reflectivitymeasurements to occur. At present, this phenomenon is subject to further investigation. Onerecommendation is to analyse diffuser degradation at 260 nm rather than taking the averaged value over thechannel 1 wavelength range as it is presently done.
A better correction for polarisation of the incident radiance in the spectral range 300 to 350 nm wasproposed, for the benefit of obtaining better quality ozone profile retrievals. Several other features in theGOME measured radiances were identified, including the etalon effect (thin ice layer formation on cooleddetector surface), the spectral features caused by the dichroic mirror outgassing, and the spectral structurein the diffuser measurements of channels 3 and 4. Improvements in the GDP to cover the varying etaloneffect have been proposed and further work is needed to correct for the other known artifacts in GOMEspectral radiances.
An important source of error directly propagating into the data retrieval is the error contained in themolecular absorption cross-sections. New measurements are presented using the SCIAMACHYspectrometer in on-ground White cell configuration covering most of the SCIAMACHY (and GOME)target species. At the same time these measurements have been used to obtain better instrumentcharacterisation of stray-light, slit function and wavelength calibration. Temperature parameterisationprecision of the cross-sections is expected to be better than 2 %.
A new radiative transfer model based on the discrete ordinate method, named LIDORT, has beendeveloped for use in GOME, SCIAMACHY, OMI and other UV – visible – near infrared instruments foratmospheric spectroscopy. It aims at providing a faster algorithm that is still accurate enough to describenadir (and limb) measurements over the entire wavelength range. This has been achieved by using a novellinearisation scheme, capable of generating both intensities and weighting functions. The model is genericin nature and requires user specific input such as BSDF, albedo and extinction coefficients. It includes amultiple scattering and pseudo-spherical approximation. The model has been validated against existingmodels of known accuracy. Future developments may include polarised light.
Data assimilation is a powerful technique to bring satellite measurements into a consistent time / spacesynoptic form. This will be valuable, in particular, for future ENVISAT atmospheric chemistry data takensequentially in limb and nadir view from different instruments. The potential of data assimilationtechniques was demonstrated using data from the GOME and CRISTA space instruments. The Kalmanfilter approach quantifies the effect of model errors and instrument noise, in addition to calculation of newstate parameters. The feasibility of assimilating Near Real Time ozone profiles from GOME in the

atmospheric chemistry transport model TM3 was studied. Accuracy was demonstrated to be satisfactory inthe stratosphere.
For the future, continuous monitoring of GOME instrument degradation is necessary, making use of allavailable calibration sources including sun, moon, Earth reflectivity and spectral lamp information. Thesedata need to feed theoretical instrument models, in order to extend parameter space and to understandinstrument behaviour. To improve the correction of polarisation effects, radiative transfer calculations willbe needed to supplement the polarisation measurements. This should be an ongoing activity, necessary inorder to maintain and to improve level 1 data accuracy of the GOME instrument, which is at the basis ofthe subsequent geophysical data production. The knowledge gained on GOME level 1 data accuracy willalso benefit the development of (in-flight) calibration schemes for GOME-2 on the Metop satellite seriesand will provide valuable input for the specification of calibration of proposed future atmosphericchemistry satellite instruments, such as GeoSCIA.
ATMOSPHERE: CLOUDS AND AEROSOLS
Chairman: Kelly ChanceCo-Chairman: Jorg Callies
This session and the associated posters were characterised by the increasing use of synergy amongmeasurements from different instruments to retrieve the various cloud and aerosol products. Thepresentations also emphasised the effort that is going into the development of advanced algorithms inpreparation for Envisat. These algorithms sometimes use multiple instruments from Envisat, for example,AATSR together with SCIAMACHY and MERIS.
New cloud algorithms were presented for the retrieval of cloud parameters including cloud fraction andcloud-top height for GOME, SCIAMACHY, and ATSR. In the case of GOME, the information from thespatial variance of the PMD detectors and the reflectance inside and outside of the oxygen A band isexploited. First validation results from the retrievals and comparisons among instruments were reported,showing encouraging results. A method for discriminating between water and ice clouds was tested usingAVIRIS aircraft-based measurements, and proposed for SCIAMACHY. The possibility to assess theGOME radiometric calibration using reflectivity statistics was discussed. Improvements on the use ofstereo photogrammetry with ATSR-2 data were reported. Example products have been evaluated bymeteorological institutes. Future cloud investigations and comparisons among various instruments andtechniques will require refinement of the definitions of cloud parameters and how their apparentmeasurement varies with technique and with wavelength, so that better consistency in the comparisons isachieved.
Ocean aerosols were determined by combining ATSR-2 visible and infrared measurements withAERONET measurements, which were advected in the retrieval scenes using Kalman filtering. Retrievedaerosol classes and amounts were satisfactorily validated against AERONET observations. The GOMEmultispectral capability was exploited to determine aerosol size distribution, refractive index, and opticalthickness. Synergy of GOME and METEOSAT provides improvements, which will be exploited bycombining SCIAMACHY, MERIS, and AATSR measurements from Envisat. Techniques have beendeveloped to use GOME and ATSR-2 together, taking advantage of the GOME spectral coverage, the PMDspatial resolution and the ATSR-2 dual-view capability, to determine aerosol optical thickness, type, andthe Angstrom parameter. This will provide the basis for algorithms used on OMI andSCIAMACHY/AATSR. Aerosol measurements have been validated against a number of satellite andground-based measurements, with generally satisfactory results. There are currently a number of librariesof aerosol classes, with associated optical properties. This complicates comparisons among instrument andtechniques. The libraries may need to be consolidated or otherwise rationalised for future use.
ATMOSPHERE: OZONE, TOTAL COLUMN, AND PROFILES
Chairman: Piet StammesCo-Chairman: Rob Koopman
In this session new results of GOME including new algorithm developments for ozone column and profileretrieval were presented. The conclusions and highlights are discussed in this session summary.
An overview of 5 years of operational GOME column data product generation for ozone and NO2 has beenpresented by DLR. The evolution of the GOME Data Processor and its auxiliary information wasdiscussed, but also exemplary applications of GOME data were presented. In particular the observationsover Antarctica in the third quarter of 2000, where historic record values have been reached for thedepletion of ozone, leaving the deepest ever ozone hole. Another example is the experimental retrievals ofSO2 down to the troposphere, which allowed detection of pollution and monitoring of emissions due tovolcanic events.
In successive presentations, a number of alternative algorithms for retrieval of the total ozone column werepresented. In addition to the GDP there is the fast-delivery service at KNMI (GOFAP) which producesozone data within three hours, the TIDAS algorithm for Quality Assurance at ESRIN, and finally a NeuralNetwork technique developed at ZSW in Stuttgart.
Another focal point of the presentations was the retrieval of vertical profiles of ozone concentration. Teamsfrom RAL, KNMI and ZSW presented different profile retrieval schemes. This work on ozone profileretrieval has shown the need for improvement of GOME Level 1b data quality, as presented by KNMI,NASA and RAL. This is supported by findings in the GDAQI project (SRON, DLR, IFE, University ofHeidelberg).
It has been shown that data assimilation of ozone is a powerful tool to overcome limitations in geographicalsampling imposed by the satellite viewing geometry. Its use has been demonstrated in the study of theozone mini hole above North-Western Europe in November 1999.
Neural Network techniques have been presented, which have the advantage of extremely shortenedprocessing times. However these techniques have some limitations in retrieval of data from unique eventssince their results are dependent on recognition of patterns that are similar to those detected in historicobservations during a learning phase.
Most authors have presented results of validation of their algorithms with independent observations,notably Brewer and TOMS observations for ozone columns, and ozone soundings and lidars for ozoneconcentration profiles. The typical error of the operational total ozone column retrievals at DLR and KNMIis about 3% at low and mid latitudes, degrading at higher latitudes. Ozone profile retrievals have largerinaccuracies that strongly vary as a function of altitude.
Based on the presentations of this session, improvements in both speed and accuracy of total columnretrievals can be expected for the near future. This holds also true for ozone profile retrieval, butimprovement of the quality of GOME level 1 data is the most important requirement for achieving betteraccuracy values for ozone concentration profiles. This recommendation was independently formulated byeach of the teams performing profile retrieval algorithm development.
The detailed concept and designs of two future satellite instruments for ozone monitoring were presentednamely GOME-2 on METOP and OMI on EOS-Aura. These instruments will be launched after Envisat.The three instruments on Envisat that are capable of retrieving total columns and/or vertical concentrationsof ozone were subject of dedicated presentations during other sessions of the symposium.

ATMOSPHERE: UV RADIATION, TRACE GASES OTHER THAN OZONE
Chairman: John P. BurrowsCo-Chairman: Stefano Casadio
This session was dedicated to the retrieval of information about atmospheric constituents and parametersfrom space based atmospheric remote sensing instrumentation. The focus of the meeting was the use ofdata from the GOME (Global Ozone Monitoring Experiment) instrument aboard ERS-2 and in the futurefrom the instruments aboard ENVISAT mainly SCIAMACHY. In addition some studies used data fromATSR (Along Track Scanning Radiometer) and the MW (Microwave) instruments aboard ERS-2 and twopresentations were relevant for ENVISAT.
Three presentations were concerned with the determination of water vapour, H2O, column amounts fromGOME. It was demonstrated by Stefan Noel (IUP-UB) that global maps of H2O column above the ocean,land or cloud could be retrieved. This necessitated the development of an appropriate forward radiativetransport model SCIATRAN. In the future a tropospheric profile having limited spatial resolution will beavailable. The additional H2O bands available from SCIAMACHY would improve such nadir profilingcapability. Stefano Casadio (ESRIN) presented a simpler fast H2O retrieval algorithm appropriate forquality assurance of GOME data. Paola Colagrande (ESRIN) presented investigations of H2O retrievalfrom GOME, ATSR and MW data.
The presentation of Albert Goede (SRON) discussed the work of the GODIVAERS consortium (SRON,IUP-UB, IUP-UH, UL, BIRA, NILU, KNMI, and FMI) on GOME data. This European consortium of datausers have worked on the improvement of GOME Level 1 and Level 2 data products. Systematic problemswith the GOME calibration were identified and characterised using the solar and lunar observation modesof GOME and a thermal vacuum study of the GOME Breadboard Model. The expected in-flightdegradation of the GOME performance could be well characterised. This work facilitates the generation ofan accurate long term GOME data record, when its conclusions are implemented in the GOME dataprocessor, GDP. Validation of the GDP level 2 data products, the ozone, O3, and Nitrogen Dioxide, NO2,total column amounts was supported within this project. Several new scientific Level 2 data products weredeveloped by the participants from GODIVAERS. For example data products for minor but very significantatmospheric trace gases Bromine Monoxide, BrO, Sulphur Dioxide SO2, Formaldehyde, HCHO andchlorine dioxide, OClO were developed. BrO and OClO are important free radicals involved in the catalyticdestruction of stratospheric ozone. Enhanced HCHO and SO2 tropospheric mixing ratios result frompollution and volcanic eruptions.
The ozone vertical profiles obtained using the FURM (FUll Retrieval Method) Algorithm (IUP-UB) werevalidated within GODIVAERS. This group had established with the assistance of ESA and the DLR, aNear Real Time GOME service, which has been used extensively by the large European Union ResearchCampaigns to investigate stratospheric Ozone at mid and high latitudes in the Northern hemisphere inspring, THESEO and THESEO 2000, the NASA SOLVE and the ALERT2000/TOPSE campaigns. Inaddition data assimilation techniques combining GOME data and atmospheric models have been developedfor a variety of applications.
Michel van Roozandael (BIRA) summarised both the work of the BIRA group and other participants froman EU supported study of the atmospheric significance of BrO. GOME BrO measurements have revealedlarge clouds of tropospheric BrO at high latitudes in spring. In addition they indicate that BrO is present atlow levels in significance amounts throughout the troposphere.
Two presentations were focussed on tropospheric HCHO from GOME. K. Chance (SAO) presented a studyof HCHO observed from GOME primarily above the USA. F.Wittrock et al (IUP-UB) have retrievedglobal maps of HCHO indicating the importance of biogenic emissions, biomass and biofuel burning,convection of pollution and possibly snow chemistry as sources of HCHO or its precursors.
Andreas Richter (IUP-UB) described the methods for retrieving the tropospheric amount of NO2 fromGOME data. He presented a new method utilising the multispectral advantage of GOME measurements.This exploits the simultaneous measurements of absorption features at different wavelengths in theultraviolet and visible spectral regions. This important new algorithm yields good agreement with the so-called residual techniques. Provided the performance of GOME is adequate, this approach may yield somelimited but significant profile information about tropospheric NO2, which is a precursor of tropospheric O3.

Giorgio Giovanelli (ISAO-CNR) discussed the use of GOME data and ground based measurements duringa period of volcanic eruptions from Mount Etna. Lars Hild (IUP-UB) presented a synergistic studycombing GOME and TRRM data and quantifying lightning as a source of tropospheric NO2. Renata DeWinter-Sorkina (IMAU) used GOME observations and related data to estimate the tropospheric fields ofOH. Melanie Coldewey (IUP-UB) provided improved surface UV fluxes from GOME data taking bothclouds and the spectral dependence of the surface spectral reflectivity into account.
The Swiss Network within the framework of the WMO GAW (Global Atmospheric Watch) was discussedby Dominique Jeker (EMPA), which will be used for ENVISAT data product validation and related studies.Finally Peter Borrel presented the EUREKA-EUROTRAC-2 project called TROPOSAT. This new projectaims to use satellite data for tropospheric research and promote the development of satellite instrumentationaimed at exploiting satellite data. It will focus initially on GOME and ENVISAT (SCIAMACHY andMIPAS) data but has the broader objective of using all relevant data.
In summary this session demonstrated that
• great progress has been made by the scientific groups in developing scientific data products to exploitthe inherently large information content of the GOME data,
• important scientific results, concerned with both stratospheric ozone depletion and tropospheric ozoneand its precursors were presented,
• Atmospheric research and the assessment of global atmospheric change for policymakers require thehighest quality data products from the satellite data. Further studies are being and need to be initiatedto meet this need.
COASTAL ZONES
Chairmen: Hans Wensink, Johnny JohannessonCo-Chairman: Gordon Campbell
The presentation covered current status of development in the retrieval of ocean current features, progressin the use of ocean colour data for water quality measurements and current business development initiativesrelating to operational systems based on SAR.
Present status:
• Spatial resolution of models is at present a limitation – some physics is not included which meansphenomena are not fully captured. This mainly impacts on understanding second order effects in SAR-ocean surface interactions (eg the impact of wave-wave and wave-current interactions on RCS) and onthe capability to follow the occurrence of new algal bloom events or to predict the intensity of a bloom.
• There has been extensive analysis to improve the understanding of SAR Ocean current signatures.Work has been undertaken in the Norwegian Sea, the Californian Bight and the Sea of Japan. Themotivation for this is the expected availability of 3 SAR systems in the near future, representing thepossibility for operational data assimilation into coastal ocean models.
• In SHOM there is strong support for the use of ERS SAR data to update coastal maps for areas whereSHOM have mapping responsibility. As an example, a 1:50000 map of the coastal region around thearea of Cayenne has already been issued by SHOM and further work is ongoing, including an analysisof the legal implications inherent in the use of EO data for chart and map updating.
• ARGOSS have undertaken an extensive validation activity of the bathymetry assessment system foruse in Indonesia. Average measurement error was found to be around 10-11cm. Discussions withbusiness partners are underway and it is expected to start full operations in 2001.
• TSS have an operational oil spill detection service for customers from both government and offshoreoil companies. This was developed using ERS and is based on joint use of Radarsat and ERS SAR.The availability of Envisat is expected to make a significant contribution to the service capability interms of both update times and service area covered. A change in legislation, which requires oilcompanies to undertake environmental monitoring activity, is expected to add to demand for thisservice.
• NOAA is presently demonstrating near real time services to a range of government users in Alaska,including the Department of Fisheries and the National Weather Service. Present services are coastalwind field data and fishing vessel surveillance based on Radarsat. It is planned to use ASAR Data onceEnvisat is launched and to expand the service provision to include sea/river ice monitoring and oil spillsurveillance. About one year will be required to investigate the capabilities of ASAR before jointexploitation of ASAR and Radarsat is possible.
• Extensive cross validation of multiple satellites has been undertaken within the EU Clean Seas projectusing ocean colour, multi-spectral, IR and SAR data to analyse algal blooms and water qualitysignatures in 3 test sites in Europe. In some cases it has been possible to acquire more than 80 scenesfrom 10 different instruments over an area of interest covering a period of 7 days. Cross validation ofthe surface signatures over such a range of instruments represents an important step forward inimproving the possibility to use satellite sensors to monitor such phenomena.
• Nansen Centre has shown that ocean colour data can be used to extend the effectiveness ofconventional measurement techniques in the monitoring of algal bloom events. This is an importantissue for Norway given the risk such phenomena pose to the aquaculture industry and the importanceof this industry to the Norwegian economy.
Fundamental issues to be addressed
• Work is presently underway to further improve the understanding of SAR-ocean surface interactions.However, more and better quality in-situ data are required. It is hoped that the Envisat Cal-Val effort

can represent a major contribution to this issue. In addition, an EU fifth framework project has juststarted to investigate complex signatures (wave-wave/wave-current).
• Better models are required to support an improved understanding of the SAR Ocean surface signatures.
• Better models are also required for algal bloom applications to ensure all relevant physics is captured.
Conclusions
• Further systematic analysis will require more data, both archived and new acquisitions
• Envisat Cal-Val should be used to acquire a greater amount of high quality in-situ data to supportvalidation of fine scale models and SAR/ocean color imaging models.
• EO data definitely have a contribution to make to the areas discussed and in some cases represents theonly viable source of data. Systematic progress in understanding the issues is being made.

EARTH MOTION
Chairman: Fabio RoccaCo-Chairman: Frank Martin Seifert
The Earth motion session consisted of seven contributions and two posters. Six out of seven weresuccessful obtaining high quality results whereas the seventh will try again with a new data set. Most of thecontributors presented more than one case and validated the achieved results by optical levelling, GPSnetwork, and thermal dilation, or applied some complex mathematical models, which were supporting theresults. The discretion of DInSAR technique was underlined by clients. Overall, different subsidence rateswere analysed which ranged from millimetres to more than 1 meter per year.
Highlights
Richard Stow talked about moraine bursting by lake pressure in Bhutan.
Claudie Carnec presented DInSAR application in mining areas (active and dismissed inflating for waterfilling of tunnels), geothermal and water pumping and compaction in urban and periurban areas.
Chao Wang showed urban subsidence due to water pumping and achieved 0.943 correlation with opticallevelling.
Urs Wegmueller presented four cases: mining area (subsidence correlated to mining activity), urbansubsidence due to water pumping and geothermal effects, interferogram stacking to improve the quality.
Fabio Rocca presented four applications of permanent scatters technique (PS): an histogram of stable andnon stable RCSs and PS density in urban areas, building collapse, tectonic motion and geological effects.All applications showed good correlation with temperature, optical inspection or GPS network.
Mario Costantini discussed punctual coherence in areas of sparse coherence and applied the technique tomonitor tectonic motion, water pumping, metro construction and geothermal effects.
Julie Boyle indicated the use of rain radar for atmospheric phase screen removal. Shrink and swell of clayarea and DEM creation from multiple tandem pairs were discussed.
Recommendations
The ASAR instrument on Envisat should be operated as often as possible in one mode to allow differentialSAR interferometry.
Conclusions
The high interest and expectations by the audience resulted in lively discussions. A general consensus wasreached on the quality and consistency of the results revealing that differential InSAR has reached a maturestatus with a high potential for the market. The permanent scatterers’ technique has a good potential tobridge from ERS archives to Envisat.
EARTHQUAKES
Chairman: Gilles PeltzerCo-Chairman: Yves Louis Desnos
Nine papers on the study of earthquakes and two papers describing new studies of interseismicdeformations were presented.
Earthquake studies:
• The papers dedicated to earthquakes showed that spatially continuous surface displacement mapsobtained by SAR interferometry InSAR allow scientists to construct complex fault models that couldnot be constrained by seismological data and conventional geodetic techniques only. The example ofthe Shadad thrust that experienced triggered slip after a magnitude 6.6 earthquake on a nearby faultillustrates the importance of InSAR maps to observe the effects of fault interaction and of aseismicdeformation.
• InSAR maps are particularly important for earthquakes occurring in remote places with little or no insitu information such as Western China, Iran and Tibet.
• One of the main limitations of InSAR in the study of earthquakes is the loss of coherence in thevicinity of the surface rupture. Two papers presented results obtained with a technique using thegeometric distortion between the images (SAR or optical) acquired before and after the event,providing surface displacement deformation in the near field of the fault. The example of the Landerssurface break obtained with airborne high-resolution optical images (1m) illustrates the potential of thisapproach.
Interseimsic studies:
• Two papers presented results of InSAR applications to the study of interseismic surface deformation.These studies showed that errors in the radar data due to tropospheric phase propagation delay couldsignificantly be reduced by averaging several interferograms allowing a level of detection of betterthan 1 mm/yr in line of sight change rate. This improvement opens the range of applications of InSARto the measurement of surface movement occurring at slow rates, characteristics of interseismicdeformations.
Issues and recommendations:
• The examples presented in the session showed that C-band data performed very well over deserticregions such as Southern California and Tibet, but that interferometric coherence was low in areascovered with vegetation. This point was illustrated by the comparison of vegetation index images(AVHRR) and coherence images of a study area along the North Anatolian fault. A longer wavelength(L-band) would be preferable for a dedicated mission to improve the coherence over vegetated areas.
• Single (line of sight) component of measurement of ERS InSAR data is a limiting factor for modeldevelopment. Multiple incidence angles available on ENVISAT combined with ascending anddescending path acquisitions will improve InSAR measurement three-dimensional resolution.
• One of the limiting factors of InSAR application using the ERS archived data is the scatter inperpendicular baselines that covers a range of ~ +/- 1000 m. A better orbit control of ERS and of futuresatellites orbits would increase the opportunities of matching interferometric pairs.
• Redundant acquisitions of SAR data are important to average interferograms in order to reduce theerrors due to phase propagation delays through the troposphere.
• Given the number of different operating modes of the SAR on board of ENVISAT, it is recommendedthat a default mode, optimised for InSAR applications, should be defined for a background data

acquisition mission. This is particularly important at the beginning of the ENVISAT mission, until thecompletion of a first coverage of “active” regions in InSAR default mode.
• As for any geodetic data set, the continuity in time is of prime importance. It has been recommendedthat the ERS mission overlap with the ENVISAT mission for approximately ten cycles of successfulacquisitions (at least one year).
ENVISAT AATSR
Chairman: Christopher MutlowCo-Chairman: Peter Regner
The presentations addressed important aspects related to the pre-launch calibration of the instrument, thedevelopment of an accurate algorithm for providing global LSTs, and the need for high accuracy ship-board devices for the proper validation of AATSR sea surface temperatures.
The results from the laboratory calibration of the AATSR were presented including the characterisation ofthe absolute radiometric response, the radiometric noise, the polarisation sensitivity, and the instrument’soptical alignment. It was demonstrated that the instrument meets the strict performance criteria required tomeet its scientific goals: the global measurement of sea-surface temperatures to an accuracy of 0.3 K, themonitoring of global vegetation coverage, and the retrieval of cloud properties. The results of the pre-launch calibration were compared against those obtained from the calibration of the previous ATSRinstruments. The traceability of the measurements to standards was emphasised.
The scientific basis for a computationally fast and accurate algorithm for deriving global LSTs with a(simulated) accuracy of around 2 K from the AATSR was presented and the important process of validatingthe product was discussed.
Finally, the problem of the conventional approach to validating satellite-derived skin temperatures of theocean with buoy measurements of the temperature in the bulk of the ocean was presented. It wasdemonstrated that, with instruments capable of radiometric measurements of the skin temperature of theocean from ships, a partition of the error sources into those from unresolved atmospherically variability andnear-surface oceanic gradients, could be achieved. The results of a comparison with AVHRR sea-surfacetemperatures has shown that the residual uncertainties are less than half of those derived by conventionalcomparisons within situ data from buoys. The use of such high precision shipboard instrumentation isindispensable for the proper validation of Envisat SST products.

ENVISAT ASAR
Chairman: Manfred ZinkCo-Chairman: Christopher Buck
• ScanSAR Interferometric Monitoring using the Permanent Scatterers (PS) Technique, Andrea Monti-Guarnieri. The paper proposed first of all the possibility of performing interferometry using WideSwath mode data which is made feasible by means of the permanent scatterer (PS) technique. Thanksto the heritage of ERS SAR data at least for VV polarisation many permanent scatterers all over theworld have already been located in the SS1 sub-swath.
• Alternative Large-Scale Distributed Targets for SAR Elevation Beam Pattern Characterisation,Christopher Buck. The desire to find a suitable distributed target at latitudes other than the tropics wasdescribed and using ERS scatterometer data possible sites were identified in northern Greenland andcentral Antarctica. The results for Greenland look promising although some differences need still to beexplained. One of the Antarctica sites was less suitable. The discussion concentrated on the techniquefor eliminating unwanted pixels, the stability of the ERS SAR and arrays of calibration targets todetermine the antenna pattern.
• PHARUS ASAR Demonstrator: Simulation and Application of ASAR Data, Arthur Smith. The fullypolarimetric C-band PHARUS instrument was briefly presented and selected datasets over the BlackForest (D) and Olst (NL) were analysed. By means of land-use classification over these areas, it wasshown that one co-polar and one cross-polar channel are sufficient in most cases. There was somediscussion on the difference between medium and low vegetation and it was pointed out that there is nouseful phase information between polarisations in AP mode.
• ERS-ENVISAT Combination for Interferometry and Super-resolution, Andrea Monti-Guarnieri. It wasshown how it will be possible to perform interferometry between ASAR and ERS. Depending on thebaseline and the ground slope one could either derive highly accurate DEMs or generate superresolution images due to the effective increased spatial bandwidth. The question of differentialinterferometry between the two instruments was raised although this is problematic due to the veryhigh fringe rate that can be expected. Provided the permanent scatterers found by ERS are stillcoherent in ASAR images they could improve cross instrument interferometry.
• External Radiometric Calibration Activity on Italian Test Sites for the ENVISAT Mission, FrancescoPosa. The Italian calibration site in southern Italy was presented showing the use of trihedral corner-reflectors and active radar calibrators placed in desalination pools and agricultural fields. Thediscussion concentrated on the accuracy and stability of these calibration devices.
Three posters were also presented on:
• The Geometric Properties of ENVISAT ASAR Products, Achim Roth. DLR/DFD plans to use itsgeocoding system and the recently developed interferometric processing chain for analysis of thegeometric properties of the ENVISAT products. This activity will be performed within the ENVISATCal/Val-Team.
• The Development of an Advanced Calibration Transponder for Quad-Pol SAR and ScanSAR, PeterCooper. The design of an advanced calibration transponder including pulse encoding and digital pulsereplication has been presented. This features are of particular benefit for calibrating quad-pol and low-resolution SARs. A prototype transponder is being developed and will be used for ASAR calibration.
• Passive Calibration Targets with a Large, Stable and Controllable RCS for Spaceborne SAR,Alexander Zakharov. Large parabolic reflector antennas are interesting calibration targets because oftheir high RCS and stability. Results from measurements with ERS-1/2 have been presented. Suchtargets could be useful for calibrating ASAR’s Global Monitoring Mode.
The session was opened by Bojan Bojkov, giving an overview about the COSE project, which stands forCompilation of atmospheric Observations in support of Satellite measurements of Europe. More detailedactivities along the NADIR/NILU project was outlined, being the core database for the validation ofENVISAT atmospheric chemistry sensors.
Thomas Wagner then gave a summary of the German SCIAMACHY validation program. To be pointed outis a concept to validate SCIAMACHY’s tropospheric column product, which is from a scientific point ofview, highly desirable (see also talk of S. Noel). Asked for the first products to be validated, the UV-VISnear real time (NRT) products are expected to be validated first explained by the heritage from GOMEvalidation. This will be followed by the IR NRT products as well as so called off-line products, whichcomprise profiles from nadir, limb and occultation measurements as well as tropospheric columns.
The talk given by Sander Slijkhuis described in detail the current knowledge of SCIAMACHY’spolarisation sensitivity, which is based on an extended mathematical analysis of on-ground calibration data.Asked for the impact on radiometric accuracy, this is still under investigation. The same holds for potentialimpact on trace gas retrieval, as it was suggested by the abstract title. Due to the rather high complexity ofcorrectly characterising an instrument for its polarisation sensitivity and – even more – to correctlycompensate for this in the radiometric calibration, discussion went in a direction whether polarisationinsensitive instruments should be the future baseline. No conclusion could be drawn within the ratherlimited time reserved for discussion. But the question should seriously be considered when planning fornew mission instrumentation.
Stefan Noel then gave an overview over the concept of SCIAMACHY nominal operations. Emphasis waslaid on two aspects, the limb nadir matching as well as the so-called clustering concept, both being ratherunique features of the SCIAMACHY instrument. The limb nadir matching will probably allow todetermine tropospheric column information of various trace gases, although the analysis of correspondingmeasurements would have to assume horizontal homogeneity in the stratosphere, as brought forward duringthe discussion. The clustering concept allows to optimise signal to noise, geometrical resolution as well asoverall data rate aspects against each other. Depending on pixel respectively spectral interval (which is infact the cluster) geometrical resolution will vary from 30 by 60 km in tropical regions to 30 by 240 km inpolar regions.
Next Herman Oelhof presented validation activities with large balloon payloads, which are necessary forgetting vertical profiles of atmospheric parameter for inter-comparison. Well-characterised in situ andremote sensing instruments are available for that purpose. They have already been used to validate othersatellite experiments like ILAS. Finally accuracy estimates were given for profiles of different traceconstituents. These are taking into account the measurement accuracy of the instruments and the differencebetween satellite and correlative measurement as caused by mismatch and different measurementtechniques. It was also mentioned that the funding situation for the commissioning phase has to be clarifiedsoon.
Complementing the previous talk, Cornelis Blom showed up the possibilities of validating ENVISATatmospheric chemistry sensors by means of the high altitude aircraft “Geophysica”. Scientific payload hasbeen expanded by additional but also well-known instruments, in order to enlarge the number and qualityof validation products, which are in case of remote sensing instruments highly informative atmosphericcross sections of various trace gases. Latest results of the APE/GAIA campaign have been presented,showing e.g. subsidence, denitrification and ozone depletion in the Antarctic vortex. Associated accuracyanalysis is still on going.
The session was completed by a talk of Marco Ridolfi, who presented an optimised forward model as wellas a retrieval scheme for MIPAS real time data processing. This is based on a global fit approach, yieldingsufficient accuracy and computational performance. A new method called “Geofit” was mentioned. Bysimultaneous analysis of full orbit data horizontal inhomogeneity of the atmosphere could then be takeninto account. Data as recorded with the different MIPAS observation modes may be processed in NRTretrieval code.
ENVISAT ATMOSPHERIC INSTRUMENTS
Chairman: Herbert FischerCo-Chairman: Johannes Frerick
ENVISAT ESA
Chairmen: Yves Louis Desnos, Guido Levrini
The presentations in these two sessions have been devoted to the Calibration and Validation Approach ofthe Envisat Instruments and Products.
The number of instruments to be calibrated and the wide range of geophysical products to be validatedmake this task an unprecedented challenge.
The Agency is committed to deliver products to the Users starting from 6 months after the launch, which isscheduled for June 2001. Within the first 6 months in orbit (‘Commissioning Phase’) and after a first fewweeks dedicated to the Switch-On and Data Acquisition (so called ‘SODAP’ Phase), a number of teams ofexperts, PI’s, etc will carry out the core Calibration and Validation program, under ESA responsibility andoverall coordination. The target is to achieve release of good quality products starting from the end of theCommissioning Phase.
A Validation Workshop will follow – 9 months after the launch- the Commissioning Phase Workshop. TheValidation Workshop is focused on the reporting of the status of Validation of the level 2 geophysicalproducts.
The Envisat Calibration and Validation Plan is available and can be downloaded from the Envisat Web site:http://envisat.estec.esa.nl/.
The detailed plan of action and the techniques and strategies that will be used to implement it have beenpresented in detailed by the various speakers, one per Cal/Val team. The all presentations were given byESA staff with the exception of the three presentations devoted to the AO instruments (SCIAMACHY,DORIS, and AATSR) which have been given by representatives of the AO providers. In all cases, a soundapproach has been shown, which has been received positively by the audience. The sessions have beencharacterised by an extremely large participation, which clearly demonstrates the interest of the usercommunity in the Envisat products, to their quality and to the ESA product release strategy.
The ASAR calibration approach is based on the successful ERS approach, where the further challenge liesin the increased amount of instrument modes and products that the instrument will deliver.
RA-2 will be inter-calibrated with respect to several other altimeter systems, in particular ERS-2 and Jason-1.In addition, the absolute calibration of the range will be carried out to the level of 1 cm residualinaccuracies, using the north-west Mediterranean basin as a reference surface. For the first time, the sigmazero absolute calibration will be attempted.
The MERIS and AATSR Cal/Val effort are coordinated respecting the different responsibilities of ESA andthe AO Providers.
SCIAMACHY: each geophysical product will be validated by a combination of at least 2 instrument typesand 2 techniques (pointlike versus global methodology). A similar approach also applies to GOMOS andMIPAS validation, carried out through a combination of balloon campaigns, high-altitude aircraftcampaigns, model assimilation (both Numerical Weather Prediction model and Chemical TransportModels), satellite inter-comparison and ground-based measurements. The Validation of the GOMOS,MIPAS and SCIAMACHY products is coordinated within a single group, the Atmospheric ChemistryValidation Team.
ENVISAT RA2
Chairman: Jérome BenvenisteCo-Chairman: Monica Roca
The ENVISAT RA-2 Session focused mainly on the calibration and validation aspects of the ENVISATAltimetry mission. Many results shown in this session are derived from work initiated during ERSCalibration campaigns, which has been continued all throughout the missions to support long termcalibration and drift monitoring. In fact, in this ENVISAT pre-Launch period, the ERS-2 data are used toenhance the methodology and to get prepared for the ENVISAT Cal/Val activities. Other results presentedstem from novel activities. There was a unique talk on added value services to users, enhancing the ESAproducts with a variety of geophysical correction selectable by users, but there was another session hostingothers talks on this topic.
The first talk reported a new application of Altimetry, exploring the potential of the ENVISAT RA-2 Sband nadir sounding for studying forest canopy, providing a vertical profile of the vegetation. In situ datawill be collected from helicopter-based S band radar over an homogenous pine forest and compared withRA-2 to validate the inverse method to extract the vegetation structural parameters.
A proposal for absolute calibration of the altimeter range was reported using a transponder, as it was donefor ERS. Ideas for several improvements in both the transponder hardware and the data processing weregiven. A tentative to use the transponder for Sigma-0 absolute calibration was also reported.
For Radar backscatter drift monitoring, stable and homogenous natural targets on land world-wide weresearched for, using the high-resolution geodetic phase data. A few regions have been found and one inparticular has been demonstrated to be stable enough to monitor short (daily) and long term (yearly)stability of RA-2 sigma nought with an accuracy of 0.3 dB (in Ku band). The radar echoes backscatteredfrom land targets are very complex compared to the well modeled oceanic or ice sheet echoes. This hashindered the development of land Altimetry applications. It was underlined that with the novel features ofthe ENVISAT altimeter the applications in this field are bound to develop including climatic change in soilcharacteristics.
Theoretical work on ocean backscatter modeling, in support to the validation of the backscatter absolutecalibration campaign, was reported. Since the beginning of Altimetry the backscatter has never beencalibrated; it will be attempted for the first time for the ENVISAT altimeter. The notable lack of microwavenadir backscatter in-situ data does not yet permit to estimate the parameters of the theory.
Furthermore altimeter range was calibrated against tide gauges. The experiment has been maintained allthroughout ERS-2 mission, precisely estimating any drift of the altimeter system. Tide gauge networkswere shown to be an essential source of in-situ data in support to altimetric missions. The ESA plans forENVISAT RA-2 absolute range calibration are in fact based on the methodology presented here, wellvalidated during the ERS-2 calibration phase and beyond.
A complete set of methods and tools to cross-calibrate all geophysical parameters retrieved from altimeterdata were presented, as well a results from cross-calibrating ERS-2 and Topex-Poseidon. Another groupinvolved in the absolute calibration campaign presented an indirect approach using tide gauges togetherwith a direct approach using GPS buoys. GPS buoys are also used for altimeter drift monitoring. Takingadvantage of the two frequencies on RA-2, a new parameter is estimated: the Ku band backscatterattenuation. Its definition and validation were presented.
All these effort are federated into Calibration and Validation Teams co-ordinated by ESA in support of thecommissioning of ENVISAT Altimetry.
ESA presented the significant improvement of the Envisat RA-2 capabilities over previous altimetricmission and the major conceptual evolution of the ground processing strategy. This evolution leads tohighly enhanced data product, particularly in the quality of the near real time data, in support tointernational climate study programmes such as GODAE and GOOS.
FLOODS AND STORMS
Chairman: Hervé YésouCo-Chairman: Marc Paganini
FLOODSAll presentations addressed plain floods. Flash Flooding has not been considered by any of the speakers.
Flood presentations have demonstrated the maturity of EO derived products and the contribution they canbring to the development of an operational flood management information system. The synergy of SAR-based flood extend maps with Very High Resolution (VHR) optical data (e.g. IKONOS), including derivedLand Use Maps, brings a significant improvement to the damage assessment and provides valuableinformation for the visualisation of the flood damage by the Civil Protection Authorities. The onlylimitations highlighted by the presenters are the wind condition, which affects the backscattering of waterareas and the layover in presence of high topography.
Historical archived data provides a Memory of the Flood Risk, essential for Flood prevention andconstitutes the reference data for the elaboration of Flood Prevention Plans.
Within the poster session, the use of SAR data to assess the efficiency of dams to isolate radioactivepolluted areas has been presented. This is of first importance to protect local population from dam overflowand radioactivity carried over.
The importance to map the flood dynamics with the vegetation types in wetlands (e.g. nature parks) hasalso been put in evidence.
SAR derived products, as for example Digital Elevation Models (DEM) and Soil Moisture Maps, are nowintegrated within Flood Forecast models but further research analysis to overcome their current limitations(e.g. lack of high accuracy DEM) are required before their utilisation in an operational environment.
Furthermore it has been highlighted the necessity to have precise Land Cover Maps as a mean to assessFlood Damage but also as input to the hydrological structure of Runoff models to better characterise thewatershed. In particular SAR PRI data reveals to be a valuable way to estimate the Soil Moisture. Theintegration of SAR-based soil moisture within hydrological models has shown promising results and willbe further improved by the synergistic use of MERIS and AATSR data.
For the Flood Monitoring and Soil Moisture assessment, a higher revisiting time, compared to the 35-daysERS repeat cycle, is needed. It is expected, by all presenters, that the wide-swath mode of the ENVISATASAR will provide the necessary temporal resolution.
STORMSMulti-temporal Tandem Coherence products have demonstrated to be the optimum EO derived products tomap forest damage after a storm. Different experiences following the two storms which devastated Frenchand Swiss forests have shown reliable results of high quality, in a short time response, and have been fullyappreciated by local authorities.
The coherence technique reveals to be efficient for short-term actions in the crisis phase but is also to betaken into consideration for long-term activities of re-forestation.
The interruption of the ERS-1 mission, and the related ERS tandem data, does not allow Value AddingCompanies (e.g. SERTIT and GAMMA) to ensure the continuity of this service.
FORESTRY
Chairman: Martti HallikainenCo-Chairman: Henri Laur
The Forestry session was essentially dedicated to the boreal forests (Scandinavia, Russia, China, Canada)and confirmed most of the SIBERIA project results.
ERS SAR intensity, even used on a multi-temporal basis, does not provide suitable results for boreal forestclassification. Instead, ERS coherence (tandem 1-day) is of primary use for forest/non-forest delineation. Itwas found that the ERS coherence is also correlated to the boreal forest stem volume, although scientistsseem to disagree on the level of saturation (100 m3/ha or 300 m3/ha?).
Multi-temporal study indicates that the ERS coherence (1-day) is affected by meteorological factors, drysnow on ground providing the most stable results. The coherence is also affected by the forest fill factor(i.e. level of forest coverage) and the vegetation cycle.
ERS coherence revealed to be an excellent tool to map burned areas (Canada), not only in boreal areas, butalso in tropical areas (Madagascar). Furthermore an attempt to use 35-day coherence gave interestingresults in terms of forest delineation (70% versus 95% for 1-day coherence).
Finally, the use of ATSR to map burned forests at a global scale was presented and is in phase of pre-operationalization to provide services to civil protections. The mapping of forest fires and burned areas isalso of primary importance for providing biomass burning estimates to the scientists studying the globalchange effects.

FORESTRY: SIBERIA
Chairman: Christiane SchmulliusCo-Chairman: Henri Laur
The SIBERIA project (SAR Imaging for Boreal Ecology and Radar Interferometry Applications) aims toimage an area of global ecological importance, the central-Siberian forest, using three Earth Observationradar satellites. It was an unprecedented fast and joint effort of the German Aerospace Centre (DLR), theEuropean Space Agency (ESA), and the Japanese Space Agency (NASDA) to collect ERS-1 and -2 andJERS-1 data via a transportable station located in Mongolia.
These data (550 ERS-scenes plus 890 JERS-1 scenes) were used in one of the most area-extensive remotesensing projects (1.2 Mio sqkm), to prove the operational use of radar remote sensing for very large-areaforest mapping.
The main source of information came from the ERS tandem coherence. It was clearly confirmed that thecoherence channel (1-day tandem) was the primary parameter for forest/non-forest delineation. The ERSintensity, even multitemporal, did not provide suitable results for the classification. The final results,derived from ERS coherence and JERS intensity, include classified maps with 3 forest classes of differenttimber volume. The areas of high relief could not be classified.
The Siberia forest map will help the Russian forest institutions to update obsolete forest inventory data andto monitor reforestation e.g. after fire events.
The session was organised in a logical way, from the data processing description to the presentation of thefinal classified maps, including the rationale for the applied classification methods. The posters allowed tosee various steps of the SIBERIA project and to appreciate some of the final forest maps.
The SIBERIA project was funded by the European Commission within the 4th European FrameworkProgramme.
GEODESY
Chairman: Remko ScharrooCo-Chairman: Pierre Femenias
ERS altimeter data, especially from the geodetic mission, are used to compute highly detailed gravityanomaly maps. Recent developments have shown improvements in coastal regions and extension towardsthe pole. A near global gravity anomaly field is now available at 2'x2' resolution. Cross-validation againstin-situ data indicates that the accuracy of the field is around 6 mgal even in shallow oceans and aroundtopographic features. Work is ongoing to improve resolution and accuracy, especially in areas with strongmeandering currents.
At the same time mean sea surface models are produced and compared.
Also on regional scales, ERS altimetry has shown to be beneficial in geodetic research. A new geoid modelfrom the Black Sea was derived, demonstrating the correlation between sea surface topography and seabottom topography. This correlation is clearly less in areas where the sea floor is covered by a thick layerof lighter sedimentation.
Time tag bias is a key element in the radar altimeter equation. Through the analyses of altimeter crossoversa mean and seasonally varying time tag bias was discovered a while ago. Attempts have been made toidentify the sources of the timing errors. Although no conclusive causes were identified, progress has beenmade in the sense that new features in the temporal behaviour of this timing error are discovered. This mayultimately lead to the modeling of a correction if not the explanation of the cause of the timing error.
In the same line of auxiliary information for the enhancement of the ERS radar altimeter data products liesthe SPTR correction. Although this correction removes some of the observed jumps in the altimeter range,it was not yet sufficiently accurate for specific applications, such as monitoring of sea level rise. Newtechniques have been employed to characterise the jumps out of an engineering perspective. A combinationof clock asymmetry, shape of the PTR and the chirp slope was found to be responsible for the jumps. Theseparameters are now all being considered in the computation of a new SPTR correction table to be used bythe user community. Further validation is on going.
ERS-1 OPR altimeter data are produced in two different formats applying different retracking algorithmsand different geophysical corrections. An extensive recipe is presented to attempt to upgrade the olderversion 3 OPR data to the level of OPR version 6. Nevertheless, full advantage of ERS-1 altimeter data canonly be taken when all the altimeter data of Phases A through F are retracked with the current retracker.
GEOLOGY AND VOLCANOES
Chairman: Geoff WadgeCo-Chairman: Maurizio Fea
The first presentation was a general study of the geology northeast of Ankara, Turkey using SARbackscatter data together with a variety of other data sources. Tamer Ozalp showed how the combinedeffect of topography and roughness differences in four separate rock types could be used to distinguishbetween them, particularly when merged with optical data. The analysis allowed the author to identify forthe first time a geological feature not known yet, the Ankara Cankiri tecto-morphological zone.
The other three presentations concerned the use of InSAR for monitoring processes at volcanoes. Zhong Ludisplayed a remarkable series of differential interferograms showing deformation on the surface of fourvolcanoes in Alaska as measured over several multi-year intervals in the 1990s. Each case study required adifferent interpretation and illustrated the great variety of styles and processes related to the dynamics ofvolcanoes that InSAR is revealing.
People are now starting to consider InSAR as an “operational” technique for volcano observatories. DanielCarrasco described the Spanish programme to monitor the volcanoes of the Canary Islands. This industry-academic partnership is now well developed and processing of the ERS archive has revealed areas of goodlong-term coherence on the islands. Tenerife is of particular interest because of the explosive Teidevolcano. Although the volcano as a whole is not deforming, new areas of anomalous movement have beenidentified, which has resulted in a change of the strategy of ground geodesy using GPS.
When a volcano is erupting, the operational requirements become more stringent. In particular, timelyaccess to data is needed. In an experiment in local reception at just such a volcano observatory onMontserrat, Goeff Wadge showed that InSAR products could be derived at the observatory within a fewhours of the ERS overpass. During a 3-month period 5 scenes were captured including 3 descending passimages that could not be acquired by the regional receiving station.
HYDROLOGY
Chairman: Helmut RottCo-Chairman: Maurice Borgeaud
The papers dealt with several applications of ERS SAR data to retrieve either soil moisture or soilroughness, to extract plant variables, to generate pedologic maps, to monitor floods, to estimate snowwetness, and to predict snow melt runoff.
The retrieval of topsoil moisture with ERS SAR data has been studied by several authors. The limitationsof using only a single-frequency, single-polarisation system have been addressed. In addition the fact thatsoil roughness and vegetation effects have a major impact on the backscattering coefficient hinders thedevelopment of a general algorithm to retrieve soil moisture. The use of spatial models of soil-vegetation-atmosphere (SVAT) processes, based on realistic vegetation growth models, has been successfully appliedto retrieve soil moisture under vegetation. ATSR-2 data have been used to map and monitor wetlands in thelake Chad-basin in Africa using a sub-pixel technique.
The need for detailed in-situ data for algorithm development has been emphasised due to the fact that veryoften a good description of the area or the process to be studied is still missing. Precise soil roughness andsoil moisture measurements have been collected to help the understanding of the electromagnetic scatteringfrom bare soil surfaces. For soil roughness, the use of multi-polarisation SAR data has been presented and apromising technique has been introduced to retrieve roughness from ASAR data. An algorithm based onmaximum a-posteriori probability (MAP) inversion approach has been introduced to retrieve soil roughnessfrom SAR data.
The authors are more and more favouring a model-based approach to interpret their data rather than usingsimple empirical relationships. In addition, the need of ancillary data (e.g. meteorological, soil properties)has been stressed in order to retrieve quantitative information from remote sensing data. Furthermore theneed for multi-temporal well-calibrated SAR data, as introduced by the ERS-1/2 satellites, has beenemphasised by several authors.
Time sequences of ERS SAR data have been incorporated in an automatic classification algorithm togenerate precise snow maps. These maps have then been applied successfully for accurate real-timeforecasting of snowmelt runoff in mountainous areas, confirming the high operational potential of thistechnique. An algorithm to retrieve the liquid water content of snow from multi-polarisation SAR data hasbeen described. However, a problem for applying this algorithm to ASAR data is the low level of thebackscattering coefficient of wet snow at cross-polarisation.
ICE
Chairmen: Christopher Doake, Johan Jacob MohrCo-Chairman: Espen Volden
ParametersThe majority of the presented studies aimed at estimating the position of the grounding line of glaciers andmapping the ice topography and ice velocity. Many of them have also investigated the changes over time ofthese parameters. Furthermore, some of them have estimated the ice flux and the derived contribution to theincrease of the sea level. A few projects have investigated other subjects, like the possibility of estimatingmean wind by measuring its effect on the snow cover by SAR coherence, estimating the equilibrium andfirn line with multipolarisation SAR in preparation for ENVISAT, or studying the height bias betweenERS-1 and -2 radar altimeters. An assessment of the Arctic sea ice cover by using passive microwave dataand model studies has also been performed. The VECTRA project was presented and promoted.
One area receiving a lot of attention was West Antarctica. Three presentations confirmed the ongoingchanges there detected with SAR interferometry and altimetry. These results demonstrate the advancesmade in our ability to monitor remote regions since ERS-1 was launched.
A sequence of interferograms over a glacier in Svalbard covering a period from 1992 to 1998 showed thecomplete cycle of a glacier surge, from initiation through fast flow to quiescence. This should be aninvaluable data set for helping understand the physical mechanisms of surging glaciers. An analysis of SARinterferometry and altimetry data around Dome C in Antarctica, a site for a deep ice core being drilled bythe European EPICA project, suggested an area of basal sliding close to the summit, possibly over asubglacial lake. This has implications for the interpretation and dating of the ice core.
MethodologyThe methodology used for deriving topography is mixed between ERS-1/2 SAR interferometry and ERSaltimetry; some presentations compared the two methodologies. Differential SAR interferometry is also themost used technique for deriving ice velocity, although some have additionally used feature matching. Anew strip processing technique has been applied with the aim of mapping Greenland from coast to coast.
ConclusionsAs a conclusion, the sessions demonstrated the strength and success of SAR interferometry in this domain.There is need for accurate and updated information and this can be provided by SAR interferometry. Somevery interesting results are now coming after several years of work on glaciers in West Antarctica. Thebenefit of reliable time series of parameters for monitoring the subtle changes occurring in the polar icesheets has been amply demonstrated.
RecommendationsIt was recommended to have as much interferometric coverage as possible to be able to study seasonalvariations and annual changes. The massive increase in our understanding of the flow and changes in icesheets that has come from SAR interferometry implies that every effort should be made to continue theability to collect suitable SAR data from ENVISAT.

LAND COVER / LAND USE
Chairman: Mike WoodingCo-Chairman: Olivier Arino
The majority of the papers presented in this session were concerned with urban applications of ERS SARdata. Urban applications have been relatively slow to develop, but the large number of papers directedtowards this topic suggests that it has now become an important research topic.
The techniques presented for urban mapping included those based on the use of multi-temporal backscatterintensity data, as well as interferometric coherence data. Some success was demonstrated using ERS datafor baseline mapping of urban areas in developing countries, but overall ERS data seem to be more suitedto identify urban change using a baseline map generated from a higher resolution data source, or justsimply by identifying new bright targets from temporal sequences of images. Examples of descending andascending images were presented, which showed major differences, related to the orientation of streets. Thesimultaneous use of backscatter intensity, tandem coherence and long term coherence were found toprovide information at different levels. The fusion with medium resolution optical data proved useful todiscriminate vegetation from other build up areas. Examples of fusion with Landsat, SPOT and IRS wereshown. One paper based on the use of airborne AIRSAR data showed how the higher resolution greatlyimproved the discrimination of streets and urban structures. Techniques for extracting street patterns werepresented.
The possibility to retrieve building height was subject to critical discussion. Information on building heightis important for planning, telecom, aerosol turbulence and land use classification. However, while thepaper presented on this topic showed that it was possible to identify urban areas of different building sizeand density using ERS data, there were no results presented directly on the derivation of building heights.
The use of recognised nomenclature for classifying urban areas, such as those used in CORINE andMURBANDY projects was brought to the attention of the audience. The IEEE International workshop onRS and data fusion over urban areas to be held in Rome in 2001 was announced.
Other papers in the session addressed a number of different land uses mapping topics. A study in Icelanddescribed how a DEM generated from ERS Tandem data was being used for hydrological modelingpurposes. The use of ERS data for mapping and environmental monitoring in French Guiana waspresented, and later followed-up by a CD demonstration on the ESA stand: themes such as deforestation,urbanism, topography and marine map update were highlighted, and the use of SAR data in cartographywas shown to be very cost effective. A paper describing the results of a study in the Karakum Desert/AralSea area, Central Asia, showed how SAR data were being used to identify elements of the hydrologicalnetwork and ancient settlements which were unable to be seen on optical satellite imagery. Next, a systemdeveloped for mapping surface water pollution was presented by Alcatel, and the end-to-end applicationused SAR data to produce land cover and a DEM integrated into their decision support system build aroundthe ADAGE EU concept. Finally, the use of SAR in humanitarian relief operation was discussed, with anumber of different types of remote sensing imagery being compared for identifying refugee camps andcounting the number of tents present within these camps. The use of ERS data for identifying these campscompared quite favourably with the use of medium resolution optical data from Landsat, but very highresolution optical data, such as IKONOS data, were shown to be necessary for mapping individual tentswithin the camps.

LAND SURFACE TEMPERATURE
Chairman: Marianne EdwardsCo-Chairman: Alessandra Buongiorno
Li Jia opened the session with a paper describing the synergistic use of ATSR-2 multispectral and dual-angle for modeling 3 dimensional land surfaces. An atmospheric correction was performed on the visibleand near infrared channels, which were then used to determine fractional vegetation cover. An inversionmodel allowed the comparison of soil to vegetation temperature. Conclusions of the paper indicated goodagreement of the retrieval for homogenous surfaces.
Fred Prata presented the work of Jose Sobrino comparing different retrieval techniques based on split-window and dual view multispectral methods. Several different atmospheric conditions and emissivitieswere simulated to provide the user with the most appropriate method for their input data. The errorsassociated with the various retrievals were also quantified. The conclusions of the paper were that dualangle methods give a better accuracy than split-window ones, and split-window for nadir only view givesbetter results than for the forward view. The use of the 3.7 micron channel at night improves the accuracyof the estimation of surface temperature. These results were confirmed by validation campaigns performedin Australia.
In the final paper of the session, Guangjian Yan described work on a non-linear model that retrieves thethermal component of the vegetation canopy. The analysis was performed on a single ATSR-2 image, butfuture work hopes to provide a more extensive validation of this preliminary result.
Recommendations and conclusions from the session:
• The ATSR instrument provides great potential for improving land surface temperature retrieval fromspace.
• The capability of the ATSR dual view and multi-spectral characteristics for modeling the effects of theatmosphere and for the retrieval of the various land surface components has been highlighted.
• There is a need for more extensive validation including dedicated field campaigns to assess theaccuracy of land surface temperature retrieval.
• The future AATSR instrument will provide the opportunity to continue and improve the exploitation ofthis technique.
LANDSLIDES
Chairman: Claudie CarnecCo-Chairman: Francesco Palazzo
Highlights
• Application of distributed neural networks to landslide hazard. Features extracted from SAR Tandemdata (intensity, coherence, texture, and backscatter change) were used as input to compare differentclassification techniques and the creation of thematic maps for landslide hazard assessment.Distributed classifiers trained on different features showed an improvement in overall accuracy byusing the product combination; an increase of overall accuracy was noticed also when using RadialBasis functions.
• Use of InSAR data to derive maps for civil protection applications (natural hazard susceptibility maps).
• Operational uses of InSAR techniques were demonstrated to monitor slow mass movements in alpineareas.
• Main limitation in landslide mapping with interferometric techniques is due to land cover andatmospheric artifacts: combinations of ascending and descending orbits have been used in the AustrianAlps to increment the detectable area above the tree-line and below perennial icefrom 30 to 70% prevented from obtaining sensible results.
• The use of the Permanent Scatterers (PS) technique over built-up areas has been pinpointed as apossible solution to overcome decorrelation problems.
• DInSAR techniques applied to yearly data (snow-free season) permittedto quantify average in-range deformation rate (-0.77 cm/35 days) of a creeping rock glacier.Available geodetic measurements of the vertical flow guaranteed result validation.
• Interferometry based on Tandem data, together with ice-models was used to monitor ice movementsand was demonstrated as a useful, low-cost complementary information to ground surveys.
RecommendationsYearly detection and monitoring of in-range slope movements is feasible in alpine areas above the tree-line(coherence is preserved over long time intervals) for slow and large mass movements; unsuitableorientation of slopes relatively to the radar illumination can be partially solved by combining ascending anddescending orbits. Steep foreslopes are not suitable for SAR-based landslide monitoring, data should beacquired during snow-free periods. At lower elevations severe constraints result from decorrelation due todense vegetation therefore application of interferometry over long time spans appears feasible only in built-up areas by means of the PS technique.
Applications related to ice movements need tandem data (1-day interval) and must be coupled with icemodels and flow directions.
ConclusionsThe symposium illustrated the state of art of SAR applications for landslide mapping and monitoring,focussing particularly on surface characterisation (2 presentations) and measurement of slow slopemovements by means of SAR interferometry (3 presentations).
Encouraging results were shown to identify landslides through the integration of SAR features in neuralnetworks.
Known interferometric limitations related to temporal decorrelation, ground resolution, topographic effectsand atmospheric artifacts were stressed, but several techniques (application of PS to built-up areas and useof ascending/descending passes to map areas above the tree line) were presented as a potential solution to

some of these problems. Further testing and standardisation of these techniques should give an essentialcontribution to the development of operational landslide mapping and monitoring.
Further works should include systematic validation and error estimation of identified movements.
SAR interferometry was demonstrated to be a highly complementary tool with field observation.
METHODS 1
Chairman: Sylvie PouliquenCo-Chairman: Pascal Gilles
Presentations:
• Sylvie Pouliquen: A new collocation system for satellite data
• Valerie Harscoat: CERSAT value added products
• Detlev Kosmann: Value added Geocoded SAR products from the German Envisat PAC
• Andrew Birks: Development in AATSR and ATSR Product Algorithms and Data Products
These four presentations were all different in nature. They however all focused on data manipulationmethods set-up and used within the frame of the ERS mission, and indicated, whenever applicable, the wayforward to apply similar method for other missions and in particular the Envisat one.
The first presentation addressed a service put in place at the CERSAT, allowing cross-sensor data queryingand retrieval. The presentation started by illustrating the need for such a tool for both geophysical andcross-calibration applications. It followed by presenting the system today implemented at CERSAT andhandling ERS AMI-WIND, ADEOS NSCATT and QuikSCATdata, and is foreseen to host SeaWinds andASCAT data whenever available.
This has led to the definition of new products and services, allowing the user to retrieve a set of individualmeasurements from different sensors to analyse the attached parameters, or to extract all the available datafrom a specified collocation zone.
The presentation concluded by illustrating monitoring application for cross calibration of scatterometersensors from different platforms.
All those products and services are available to users and accessible through a WWW server at CERSAT.
The second presentation complemented the first one by presenting specific products generated at CERSATand derived from ERS AMI-WIND instrument, complemented by data of similar sensors on non-ESAplatforms. In particular a global wind atlas and a sea-ice atlas have been produced and distributed worldwide as a major contribution to climatology studies. In particular, the wind atlas, distributed to 1500 users,has been included in the WOCE dataset as a reference for wind measurement.
The third presentation focused on the SAR products generated and distributed by the German AerospaceCenter, both for ESA products and genuine higher level value added products implemented under nationalresponsibility. In particular, the presentation concentrated on those geolocated SAR products generated andthe future Envisat GEOcoding system (EGEO) that will produce geocoded and geolocated products basedon ASAR data.
Foreseen characteristics of this system and related products were described, with help of numerousexamples generated with ERS SAR data, illustrating the targeted applications.
This system is foreseen to be ready at Envisat launch and fully operational at the end of the commissioningphase.
The fourth presentation provided a short but comprehensive description of the major differences betweenthe ERS ATSR and Envisat AATSR instruments, and the impact on subsequent data processing on ground.
After having listed the changes in the instrument itself and on the data transmission capacity, thepresentation focused on the implications for the setting up of the ground segment architecture, and theinduced impacts on the data processing algorithms were outlined.

The presentation concluded by presenting the AATSR products and highlighting the heritage carried overfrom its ATSR predecessors.
METHODS 2
Chairman: Shaun QueganCo-Chairman: Josep Closa
ScanSAR data processing and radiometric calibration, by Andy Smith: Presentation based on Radarsatbut also relevant to Envisat ASAR ScanSAR modes. Processing algorithms based on Specan modified toaccomplish full range migration correction and its radiometric normalisation were developed which workedwell on Radarsat data. A complete processing chain was presented. The calibration results obtained were‘reasonable’ showing an error of ~1 dB on the IRF targets from transponders and corner reflectors deployedin the UK and a variation of the calibration constant of ~0.5 dB along time. Some problems wereexperienced with the AGC for Radarsat data. This should not be a problem for ASAR. Overall outlook isgood for the ScanSAR modes of ASAR.
Speckle filtering and classification of ERS SAR images using GAMMA distribution, by YoucefSmara: First part based on qualitative assessment of single image filter techniques for speckle reduction,inferring Gamma Map gave the best results but there was no rigorous testing. Second part of thepresentation showed assessment of Frost based maximum likelihood classifier (on a single image) appliedover urban areas (Algiers) using 3x3 windows on ERS data. Performance seemed reasonable but withmisclassification errors at edges due to mixed classes. After the presentation the suitability of gammafiltering for ERS data was discussed as data models were not really appropriate for the properties of ERSdata, either in terms of data distributions or correlation properties.
Isolation of atmospheric artifacts in differential interferometry for ground displacement detection:different methods comparison, by Francesco Sarti: Assessment of various methods to the damagingeffects of atmospheric structures on extraction of ground subsidence and displacement information usingdifferential interferometry was presented. The most promising approach appeared to be the correlation ofinterferograms which main advantage is that only four acquisitions are needed. The technique wascompared with the use of permanent scatters, which seems to be especially suitable in urban areas. Goodresults were shown over Paris with localisation of deformations and a quite detailed temporal tracking ofdisplacements. Another study using the correlation approach was presented on the south of Portugal area,although results were not yet validated. Limitations of the correlation method are found if the atmosphericeffects are themselves correlated. This appeared to be the case in the earthquake example located inCalifornia.
An efficient low-memory implementation of 2-D phase unwrapping based on minimum cost flowalgorithm, by Luca Galli: A new efficient algorithm for phase unwrapping was presented. Its mainadvantage is the significant saving in time and memory, with performances effectively equivalent to theRELAX-4 using an optimal network topology.
Multitemporal InSAR coherence from urban type objects by Dan Johan Weydahl: Essentially thepresentation was just a statement of the work to be done over Oslo area on deformation using the existing60 ERS scenes and the existence of earthquake information (but no current ground deformation data wasyet available). A full processing chain from raw data was presented using the ‘Extended Exact TransferFunction’ algorithm. Only multitemporal coherence preliminary results were shown the presenterexperienced some problems with the Doppler centroid estimation from February 2000, which later wereconfirmed to be due to the monogyro operation of ERS-2. Also the importance of the baseline informationavailability was stressed.
Iterated multitemporal filtering and its use in land applications by Shaun Quegan: A generic approachto reduce speckle for multi-channel intensity data and particularly relevant to multitemporal data wasintroduced. The efficient, resolution preserving, recursive algorithm with known theoretical limits waspresented. The filter is also sensor independent, being able to process ERS tandem and JERS data as inputs.It can also recursively be updated with the introduction of new data arrival. It is an essential component ofapplications based on multitemporal data analysis such as for agriculture, forestry, land use or hydrology;specially recommended as the archive required does not need to be too large. Results were shown from theSiberia project
METHODS 3
Chairman: Laurence GrayCo-Chairman: Evert Attema
Highlights
ModelingIncoherent and coherent radar backscattering models were presented for leafy vegetation. The modelpredictions were verified with ERS data. A fundamental theoretical problem was highlighted during thediscussion related to properly accounting for vegetation attenuation in radiative transfer models. For thiscurrently only semi-empirical solutions are available
Image ProcessingFiltered principal component analysis using wavelet transforms was shown to be very successful inrevealing hydrological patterns in ERS SAR images based on the sensitivity of SAR image intensity to soilmoisture variations. Multi-temporal SAR classification of land targets and coastal zones were presentedwith special application to rice mapping, and oil slick detection on the ocean. Wavelet transform methodswere shown to be efficient for cloud masking of ATSR imagery.
Atmospheric EffectsUnexpected azimuth shifts in C-band SAR imagery was shown to originate from path length variations inthe ionosphere in Polar Regions. As expected the effects are worse at L-band. An algorithm for correctingthe corresponding phase shifts in interferometric applications was developed.
The ATSR cloud-clearing algorithm was demonstrated. Plans for AATSR were presented. Closercollaboration with the GOME/SCIAMACHY scientists working on cloud parameter retrieval wasrecommended.
ConclusionsDuring the session a number of achievements were presented spanning a broad range of methodologicaltopics including signature modeling, image processing and atmospheric effects on earth observation.
METHODS 4
Chairman: Laurence GrayCo-Chairman: Evert Attema
Highlights
Oceanographic and Atmospheric Features in SAR ImageryIt is anticipated that dual polarisation radar observations of the ocean surface will facilitate discriminatingsurface expressions of oceanographic and atmospheric phenomena. This was demonstrated with ERS andSIR-C data. Collaboration of scientists to analyse data and develop theoretical interaction models in theframework of an approved Envisat AO project was solicited.
Multi-sensor SynergyThe benefits of multi-sensor near-coincident observation of ocean study sites for identifying a range ofoceanic features was clearly demonstrated with ERS SAR, ATSR, Scatterometer and Altimeter data. Theneed for ocean colour data was stressed and plans for coincident observations with ASAR/MERIS werepresented.
SAR Interferometry made EasyA new methodology was proposed for non-radar expert use of interferometric data based on resampledcomplex imagery, and the necessary software tools have been developed.
ASAR Data QualityThe conclusions and recommendations of a study of the optimisation of the ASAR instrument parametersetting and the ASAR processing parameters were presented. The study was carried by one of theENVISAT Expert Support Laboratories and the study results will be implemented.
ConclusionsDuring the session a number of plans were presented for ENVISAT data exploitation. These included theinvestigation of oceanographic and atmospheric features in SAR imagery using the ASAR alternatingpolarisation mode, the utilisation of multi-sensor synergy opportunities with ENVISAT, a new tool forSAR interferometry work and the optimisation of ASAR data quality.
OCEAN DYNAMICS
Chairman: John LillibridgeCo-Chairman: Jérome Benveniste
More than in previous ERS Symposia, the layout of sessions at the Gothenburg meeting was less dividedalong instrument lines, and more truly thematic in nature. This was clearly evidenced in the OceanDynamics session, where results were presented from a variety of missions (ERS, T/P, GFO) as well asinstruments on-board ERS-2 (RA, ATSR, SAR), dealing with oceanographic phenomena at different spatialand temporal scales.
One of the overall highlights of the oral session was the demonstration of continuing improvement in theERS altimetry data, both in terms of operational timeliness and ability to identify processes that would nothave been possible in the recent past. A novel usage of processing the Doppler returns from the SARsystem showed the potential for estimating ocean surface currents with high reliability from SAR scenes.Two other presentations utilising SAR data illustrated the myriad phenomena that can be observed, andadvances in quantifying them.
Many of the posters exhibited high quality both in terms of their scientific results as well as their visualgraphical appeal. Two companion posters on Rossby wave propagation showed novel uses of altimetry,SST, and ocean colour in their identification and means of automated phase speed calculation.
PERFORMANCE
Chairman: Pascal LecomteCo-Chairman: Betlem Rosich Tell
Many activities are carried out by ESA and scientists to continuously assess and measure the quality of theERS mission, not only in relation to the products but also in terms of instrument performance and orbitaccuracy.
This activity does not stop with the assessment but aims at putting in place everything required to maintainthe best possible quality both for the mission and for the products and to exploit at the best the systemcapabilities. A good example of exploiting the system capabilities is the high precision orbit control carriedout after the Izmit earthquake by ESOC in order to provide users with a 35-days InSAR pair (including onepre and one post-seismic image) with a very small baseline.
The most recent example of the activities carried out in order to maintain the best mission quality is thedevelopment, installation and validation of the ERS-2 mono-gyro configuration which, after an importanteffort from all partners within and outside ESA, succeed in maintaining the good quality of the ERS-2mission.
The concerns of users, both scientists and market oriented companies, is linked to the continuity of theproducts. The ESA answer to these concerns is that the maximum effort is put in place to ensure thisquality continuity even under non-nominal mission conditions, taking advantage of very good spacecraftdesign, of the overall system flexibility and of the experience gathered during 10 years of ERS mission.
RICE
Chairman: Thuy Le ToanCo-Chairman: Sylvie Rémondière
Potential of SAR data for rice mapping and monitoring has already been demonstrated in the past. Theprojects presented in the rice session reported results obtained applying already known methods to newsites and focused particularly on the development of analysis techniques and the development of user tools.
Retrieval of essential parameters for rice mapping is based on temporal backscatter behaviour analysis(ratio image method, multi-temporal combination of SAR images). Examples were presented for bothtemperate area (Camargue, France) and tropical areas (Indonesia, China, Sri Lanka and Vietnam). Allpresentations concluded that a good agreement is found for rice acreage extracted from ERS SAR dataversus conventional agricultural statistics. The choice of optimum image acquisition dates versus ricegrowth is a condition for a successful mapping. Discrepancies are due to:
• Small field size
• Errors in field boundaries determination
The extraction of the crop sowing date and the biomass has been experimented from the ERS SARbackscatter analysis. Both parameters are introduced in a rice growth model for yield estimation.Experimentation is on going.
A major step toward operational monitoring has been the development of user tools and the transfer ofknowledge to users. Algorithms and processing chains has been set up and validated for rice mapping andyield prediction. It is possible to achieve a fast mapping within few days of satellite acquisition.
Future developments will focus on methodology refinement for large-scale mapping and refinement of cropgrowth model.
SEA SURFACE TEMPERATURE
Chairman: Ian BartonCo-Chairman: Philippe Goryl
The first objective of ATSR-1/ 2 and AATSR is to provide Sea Surface Temperature with a high precision(0.3 K). SST is a key parameter for numerous applications such as climate and oceanographic studies,global warming, tourism, fisheries applications, etc.
The SST session clearly shows that ATSR/SST can provide useful data for diverse applications.
The coral bleaching on Australian’s Great Barrier Reef is an important phenomenon, which occur when theSST is above a certain threshold (around 29.5 deg). For the detection of coral bleaching very high preciseSST measurements are needed. ATSR appears to be much more appropriate than AVHRR for suchapplication. ATSR gives a much better result than AVHRR, especially in areas of upwelling. Thisapplication seems quite mature enough to provide an operational service and the use of NRT data wouldenhance this application.
Responding to the primary objective of the ATSR mission, ATSR/SST is used with success to evaluate thechange in the long term (1991-2000) Sea Surface Temperature at global scale. Results show a goodagreement with AVHRR analyses. Moreover a good correlation is found with Radar Altimeter providingthe Sea Surface Level. A clear warming is observed in the West Pacific when a cooling down is observedin the East Pacific. The Atlantic is warming up a little bit. According to the results, we observe a globalSST warming of about 0.1 degrees per year and a sea level rise of about 0.1 cm per year.
The satellite data are a very important contribution for the EO programme. The CAL/VAL is a key issuefor such application. There is a clear for a long-term series of data, processed with similar algorithms inorder to ensure good continuity.
Another issue addressed in the session was the skin/bulk temperature conversion. Bulk Sea SurfaceTemperature measurements are widely available from buoys and ships. For validation purpose it is easier tocompare satellite bulk SST with buoys and ships SST. ATSR products provide a skin SST. A method hasbeen developed to convert the ATSR skin SST to bulk SST. So far, the results show a cool bias withrespect to in situ measurements. The bias is higher in the daytime. UK-Meteo Office is now improving thequality of the skin/bulk conversion coefficient. These studies could lead to the definition of an ’operational’ATSR bulk SST.
Another application presented showed the correlation between AVHRR SST and SeaWiFS ocean colourdata in an area of upwelling off the coast of Spain. This application, which has potential application forfisheries, may be further developed using ENVISAT AATSR SST and MERIS ocean colour products.
SEA FEATURES
Chairman: Richard OlsenCo-Chairman: Andrea Petrocchi
HighlightsAuthors presenting their work in this session have used mostly SAR in combination with other sensors anddata sources (as SeaWiFS, AVHRR, NOAA, ECMWF), as well as in-situ measurements. In some casescomparison with models were made.
- The first paper describes internal solitary waves in the Central Bay of Biscay and demonstrate that theyare generated locally where the beam of internal tidal energy reaches the ocean surface. These phenomenaare in strong correlation with other effects as surface cooling, water mixing, phytoplankton blooms. This isthe reason why in this kind of studies the SAR observations are matched and compared with data fromother sensors. In the case of this work SeaWiFS and AVHRR image data were used in addition to SARimages.
-The second presentation is a study of the Russian Foundation for Basic Research about ocean processesoccurring in the Bering Strait. Phenomena like meandering fronts, eddy activity, vortexes, strong jet-likecurrents and intrusions of cold water are investigated using SAR images.
- The School of Ocean and Earth Science, University of Southampton UK, performed experiments over theSouth Andaman Sea. Also in this case several data sources are used in order to investigate the local oceanicphenomena in strong relation with atmospheric ones. In-situ observations are analysed in addition toECMWF winds, Topex-Poseidon SSH and ATSR SST data. This work highlights the special role that SARimage data have for synoptic understanding of the environment of internal wave generation and evolutionthrough different depth and stratification regimes.
- The Norwegian Defence research Establishment has acquired images along the coast of Northern Norwaysince the early part of the ERS-1 mission. The continuous and long term SAR image analysis of thecontinental shelf gives now the possibility to synthetise observations, and comment on signatures andobservability of various features throughout the various seasons of the year.
- SAR Imagery has been studied to estimate the depth of internal waves in South China Sea. Observationand measurements of internal wave dynamics from SAR images are used as input for model. Results showreasonably good agreement with in situ measurements.
RecommendationsMost of the work presented in this session shows that SAR observations can provide qualitativeinformation about significant ocean circulation features. To progress further in retrieving quantitativegeophysical data from SAR observations, more work is required in developing and combining imagingmodels and appropriate hydrodynamic ocean models. Some innovative multi-sensor approaches were alsopresented. This work should continue to be emphasised. Ocean circulation features are highly dynamic.Their signatures in SAR imagery are strongly influenced by changing meteorological conditions. Frequentcoverage of selected sites should be pursued to learn more about the variability of the features and theirsignatures in SAR images.
ConclusionsSAR images have been used successfully to gain more insight into local and meso-scale ocean dynamics.Significant progress has been made in the ERS era to classify different types of features commonlyobserved in SAR images. Quantitative information extraction is often dependent on multi-sensorapproaches and/or combinations of SAR data with ocean models. Beyond spatial extent and geographiclocation, SAR observations alone provide limited quantitative information. Significant progress has beenmade with ERS data, however, with observations of internal waves. Internal waves have been observed inmany different ocean regimes, and can be used to estimate important parameters of internal wave fields andconditions in the mixed upper layer of the ocean.
The presentations were covering techniques and applications such as sea ice characterisation, sea icethickness, navigation through sea ice, sea ice motion and polynyas.
The major findings and results are presented below:
• Arctic sea ice thickness can be derived with an accuracy of 0.5 meters from ERS altimetermeasurements. Overall trend shows that average sea ice thickness for the area is decreasing by 0-1 cmper year (1993-1999). It is important to note that there are strong regional variations, which means thatsea ice thickness is increasing in some areas, but decreasing in others.
• Sea ice thickness has also been derived using deformation of Lagrangian cells. The time dependentdeformation of these cells is computed from the motion of the vertices obtained by tracking thesepoints in SAR imagery. The technique is suitable for polar investigation as well as operationalapplications.
• The ERS wave mode imagettes data set is ideal for the observation of the sea ice cover south of 84degrees
• Changes in SAR image tone and texture can provide the spatial extent of areas having similar icethickness. This has been shown comparing SAR and video images acquired by helicopter.
• Polynyas can be detected and characterised using a numerical model, ERS SAR and SSM/I images
• ERS and Radarsat SAR images have been used to provide navigation support through the Kara Sea foran icebreaker. The provision of this service increased the speed of the icebreaker by a factor of 2.
• The Canadian Sea Ice Service using ERS and Radarsat has demonstrated the importance of an end toend fully operational ice information system. ASAR from Envisat will provide a complementarysource of data and bridge the gap to Radarsat 2.
• Using ERS SAR and ATSR in combination has shown successful in detecting sea ice freeze-up,melting, evolution, kinematics.
Most presenters report that the techniques and applications exploiting SAR data are expected to showimproved results when Envisat ASAR data is available.
SEA ICE
Chairmen: Preben Gudmandsen, Benjamin HoltCo-Chairman: Ola Grabak
SERVICES AND MARKET
Chairman: Steve CoulsonCo-Chairman: Philippe Bally
Highlights
• Both newly appointed ERS & Envisat Distributing entities (EMMA – led by Eurimage, & SARCOMled by SpotImage) presented their consortia & activities to increase commercial use of EO missionsdata.
• A number of commercial AO projects were presented, covering the thematic areas of TopographicMapping Agriculture, Forestry, Oil spill detection & Marine information services.
• Good short-term prospects exist for commercial services in the Marine sector. The cost of serviceprovision has decreased, the customer interest is increasing, and global wave information services arebeing sold on-line today.
• ERS Tandem data has been used to successfully produce a wide-area DEM for the Telecoms sector inSwitzerland. The customer has validated the product provided.
• In addition to continuing the focused activities of the first phase of the ESA Data User Program, it isplanned to start new sizeable projects in the areas of Disaster Management, Environmental Services &Natural Resources Management in the next phase (DUP-2).
• A new ESA activity of Support to the Development of Markets for EO products & services is startingnow, and will initially last for 3 years. This is defined in close consultation with Industry & includes 10– 30 short-term activities geared to specific opportunities, together with a few consolidated longer-termactions to bring key EO product & services to full market maturity.
Conclusions
• Activity geared to operational & commercial exploitation of EO data is increasing. New Value-Addingcompanies are being set-up and a few EO services are being provided today on a commercial basis.The newly appointed Distributing Entities will provide easier commercial access to ERS & Envisatdata.
• The timescales associated with the development of EO services require that sustained support isavailable for a number of years. The ESA DUP program is providing this type of support & will furtherenable collaborative projects to be started at a European level, which demonstrate EO services to bothInstitutional & Industrial users.
• Value Adding Industry has expressed a very high interest in the ESA support to market developmentprogram. This industry cannot handle the financial risks associated with this type of activity alone.
TOPOGRAPHY
Chairman: Philippa BerryCo-Chairman: Steve Coulson
HighlightsERS RA Ice Mode data over land provides accurate information on terrain height (70% of cross-overmeasurements agree to < 5m). In addition, it provides valuable information on the type of land cover.
A DEM has been generated for the total area of the British Isles, using ERS Tandem interferometry. TheDEM generation process is fully automatic. This DEM has been validated with a typical accuracy of 8-14m rms. It can be used to derive fully connected hydrographic networks and catchment areas.
RecommendationsFurther work should be done on the optimum methods for deriving DEM's from a variety of EarthObservation data sources (i.e. optical stereo, SAR radargrammetry, SAR interferometry). The initial resultsfor fused DEM's are encouraging and demonstrate increased coverage and quality of the final DEM.
ENVISAT RA2 should provide better measurements of height over land, but further testing of resolutionmode switching algorithm is required.
ConclusionsThe generation of accurate height measurements from both the RA and SAR continues to be demonstratedfor large areas. The resulting DEM's are being used successfully in hydrological and geologicalapplications.
VEGETATION AND AGRICULTURE
Chairman: Henning SkriverCo-Chairman: Juerg Lichtenegger
HighlightsThere have been 8 papers in this session, 3 dealing with SSM/I and ERS Scatterometer land application, 3with multitemporal SAR crop mapping, one with detailed backscatter modelling and finally there was apaper calling for help to assist in the protection of a still untouched region in the Amazon. The relevantPoster Session included a proposal for a P-band low-cost satellite and the demonstration of a crop-monitoring system in Spain.As already reported in previous papers, the ERS Scatterometer data has been very useful for regional toglobal vegetation and soil moisture monitoring. The combination of using simultaneously SSM/I andSCATT adds a further promising piece of information, especially to differentiate more surface types. Thecomparison of typical soil land cover such as desert, deciduous and coniferous forest as well as largeagricultural ground (Po-Valley) vegetation cover show characteristic behaviour when analysing for SSM/Iindexes of frequency, polarisation and slope against time.
For SCATT at 45 degrees incidence angle a high correlation with heavy rainfalls could be detected and thecombined frequency/polarisation index allowed an estimation of the snow depth. While SCATT is muchmore sensible to rainfall, the NDVI would not indicate small vegetation coverage subsequently. Modellingand inversion of backscatter for grassland has been undertaken using a new approach. Global sets ofSCATT data, monthly averaged were produced and compared with world coverage of 5x5 km of LAI (LeafArea Index). Typical seasonal pattern could be derived for a variety of land covers, but interpretation has tobe cautiously performed, because change could also be related to the azimuth angle (e.g. over desertedarea). When plotted on a yearly base the SCATT backscatter values have a good agreement with the LAI.
The studies also confirm the sharp drop during freeze/thaw, which is linked either to wet snow or waterlogged soil.
The session included also a paper on a very detailed tree shape description for backscatter modelling, whichallowed deriving parameters to distinguish between spruce and pines. The modelling using several millionsof 3D-points turned out to be very computing-intensive. The first few orders of parameters show just acone-like model and only from the 10th order onwards the shape of the tree can be recognised.
A new approach for crop classification of optical/radar data has been proposed, using logic decision trees.It is based simply on logical inclusion or exclusion in a temporal series of data. Despite the results in earlierstudies, it was reported that the EU project MARS will not use RS data in the near future. The reason ismanifold but also includes the data availability and especially the data cost. Good success in crop typerecognition was demonstrated with the polarimetric C-band airborne EMISAR. The dual-polarisation wasstudied in preparation for ENVISAT.
RecommendationsThe good success of SCATT applications on land calls for a continuation of the mission and for a moreinsisting promotion of its practical application for regional monitoring of soil moisture (e.g. Sahel) and fordetermination of the thawing moment in spring (start of vegetation period).
ConclusionsThe ERS Scatterometer has been further exploited and its use for regional monitoring was confirmed.TheEU MARS programme will phase-out the use of remote sensing data, mainly also because of the cost-effectiveness.
Airborne C-Band, dual-polarisation adds to the information content in crop type classification, paving theway for a potentially successful application for ENVISAT.
e llini
HighlightsPresentations show significant scientific progress and focussed on the use of the three main sensors forwind and wave field retrieval: altimeter, scatterometer and SAR both in image and wave mode. In view ofthe ENVISAT mission, an increasing interest has been shown by the ocean community for high-resolutionSAR data.
• AltimeterAltimeters provide estimates of the wind speed and the significant wave height that need to be calibratedproperly for possible operational services. ERS and the other altimeter missions are compared with eitherin-situ data or models simulations. Wind speed retrieval techniques show insufficient accuracy whenapplied to coastal regions. For the wave fields, comparisons with ERS data performed in the North Seaindicate 10% underestimation for values larger than 1m and a slight overestimation for values below. Forwind speed, it was shown that numerical models (i.e. ARPEGE or ECMWF) are in better agreement withthe measurements for high wind speeds (examples in the Black Sea and in the Mediterranean).
• ScatterometerThe Ocean and Sea Ice Satellite Application Facility (OSI SAF supported by EUMETSAT and hosted byMeteo-France) is preparing a pre-operational wind product based on ERS-2 scatterometer data. Preparatorywork is in progress for the wind product of the ASCAT scatterometer to be flown on METOP. ECMWFhas presented an analysis on the impact of scatterometer wind data on cyclones tracking. Problems arerelated to rain contamination of the Ku band data (QuikScat) and cross-comparisons with ERS data allowsto discuss quality control aspects. Difficulties of ECMWF wave model to model Mistral conditions at shortfetch in Gulf of Lions were reported. The Product Control Service (PCS) at ESRIN has developed a postprocessing procedure for ERS fast delivery products aimed at detecting tropical cyclones (74% of cyclonesretrieved with an average of two alarms per day). A report and the corresponding reprocessed SCATTproducts are available in near real time on a web site. Interest in this product was shown by ECMWF,which pointed out that this product is very helpful for them.
• SARDifferent methodologies are applied in extracting wind and wave fields either from image and wave modedata. Amplitude images are used (local gradient of wind induced features) or spectra (with 180 degreesambiguity removable in coastal areas if shadowing effects are present). Possibilities for successfulextraction of wind fields are shown for a grid of about 1x1 km for wind direction and 0.1 km for windspeed. Operational use of ScanSAR RADARSAT wind maps is in place at the Danish meteorologicalinstitute. Some results are shown for the marginal ice zone, where SAR (CMOD4) estimated wind fieldsare usually too low, probably due to sea ice on the water surface. It is however still a valuable informationfor model validation. Furthermore, preliminary results show that open water areas must be relatively large(about 5x5 km2) in order to retrieve wind speed comparable with numerical models.
A lot of work is done in preparation to ENVISAT, preliminary validation of ASAR wave mode level 1band level 2 products has been presented using ERS wave and image mode SLC data collocated with in-situmeasurements. It has been demonstrated that the cross spectra product of the ENVISAT wave mode issuperior to the corresponding ERS product in terms of signal to noise ratio (20 dB) and retrieval of thewave direction. For the level 1 product, main results show that when ocean swell systems are detected, thepropagation ambiguity is resolved in the majority of the cases. Statistical figures are also provided as aresult of a good number of data processed: spectral peak wavelength and propagation direction RMS were50m and 40 degrees respectively; mean peak wavelength is approx. 250m, the average azimuth cutoff valueof the order of 250m. For wind fields retrieval, the level 2 product gives wind speed with rms error below 2m/s and wind direction with rms error from below 20 degrees to 35 degrees.
An interesting field experiment using new airborne polarimetric radar will take place during the ENVISATcommissioning phase. The measurements foreseen will help to validate current inversion methods andappear very promising to further progress in the inversion of radar data in wind and wave products. Inaddition, the analysis of full polarimetric data is still to be exploited and may bring new insight in theanalysis of the ocean surface.
WIND AND WAVES
Chairmen: Susanne Lehner, Werner AlpersCo-Chairman: Andrea Bellini

TABLE OF CONTENTS for FINAL PAPERSOMMITTEES

ERS-ENVISAT SYMPOSIUMGöteborg, 16-20 October 2000
ATMOSPHERE: UV RADIATION, TRACE GASES OTHER THAN OZONE
Chair: John BurrowsCo-Chair: Stefano Casadio
From - To Abst.ID
Title of the Presentation Speaker
9.00 – 9.20 47 Water vapour retrieval from GOME data including cloudy scenes Stefan Noel9.20 – 9.40 399 Empirical Retrieval of the Atmospheric air mass factor (ERA) for
the measurement of water vapour vertical content using GOMEdata. Comparison with independent measurements.
Stefano Casadio
9.40 – 10.00 419 ATSR Total Atmospheric Water Vapour Content Retrieval andComparison with GOME and Radar Altimeter Data
Paola Colagrande
10.00 – 10.20 124 GODIVAERS - GOME Data Interpretation, Validation andApplication - ERS AO3-132
Albert Goede
10.20 – 10.40 22 The Pollution Tracing Technique and application within theGlobal Atmospheric Watch (GAW) network
Dominique Jeker
10.40 – 11.00 Coffee Break
11.00 – 11.20 511 Evidences for a background of BrO in the free troposphere: statusand implications for the global observing system
M. Van Roozendael
11.20 – 11.40 33 Remote-sensed Formaldehyde Observations from the ESAGOME Instrument
Kelly Chance
11.40 – 12.00 244 A multi wavelength approach to the retrieval of tropospheric NO2from GOME
Andreas Richter
Posters
Abst.ID
Title of the Poster Presenter
349 Measurements of lightning-produced NO2 by GOME and LIS Lars Hild 520 GOME data analysis and ground-based in the Mediterranean area
during Etna volcano activityGiorgio Giovanelli
132 Tropospheric OH Primary Production from ERS-2 Data. R. De Winter-Sorkina 177 Surface UV flux estimation from GOME : Impact of clouds and
wavelength dependent effective albedoMelanie Coldewey
184 TROPOSAT: The use and usability of satellite data fortropospheric research
Peter Borrell
238 GOME observations of Formaldehyde Folkard Wittrock

ERS-ENVISAT SYMPOSIUMGöteborg, 16-20 October 2000
ATMOSPHERE: CALIBRATION, RADIATIVE TRANSFER, ASSIMILATION
Chair: Albert GoedeCo-Chair: Herbert Nett
From - To Abst.ID
Title of the Presentation Speaker
16.20 – 16.40 149 Degradation of GOME observations in the UV : summary of theGDAQI project
Ilse Aben
16.40 – 17.00 358 GOME degradation correction at solar activity maximum Ernst Hegels17.00 – 17.20 421 Improving the polarisation correction of GOME N.A.J. Schutgens17.20 – 17.40 120 Comparisons between GOME and modelled backscattered
radiances using in-situ measured aerosol data from the ACE-2campaign
Johan Jansson
17.40 – 18.00 98 The LIDORT package - a generic forward-model radiativetransfer tool for the simultaneous generation of intensities andweighting functions for atmospheric retrieval
Robert Spurr
18.00 – 18.20 297 Analysis of global synoptic chemical constituent maps by 4Dvariational assimilation of satellite data
Hendrik Elbern
18.20 – 18.40 1403 Assimilation of 3D ozone field in global chemistry-transportmodels
G. El Serafy
18.40 – 19.00 99 Temperature dependent absorption cross section of O3, NO2, andother atmospheric trace gases measured with the SCIAMACHYspectrometer
Konstanze Bogumil
19.00 – 19.20 316 In-orbit optical path degradation: GOME experience andSCIAMACHY prediction
Ralph Snel
Posters
Abst.ID
Title of the Poster Presenter
109 SCIAMACHY Optical Performance Characteristics H. Bovensmann
422 A parametrisation of the earthshine polarisation in the UV N.A.J. Schutgens
187 Degradation of UV Earth Radiance Observations by GOME Cristina P. Tanzi
321 Ring Effect studies for a cloudy atmosphere using GOME data Rüdiger de Beek
377 Retrieving spectral reflectivities from Extracted GOMEInstrument header data
Ankie Piters
167 Precision Estimates for Trace Gas Profile Retrievals fromSCIAMACHY Limb Measurements
Johannes W. Kaiser
90 A new radiative transfer model for a spherical planetaryatmosphere
Vladimir Rozanov

ERS-ENVISAT SYMPOSIUMGöteborg, 16-20 October 2000
ATMOSPHERE: CLOUDS / AEROSOLS
Chair: Kelly ChanceCo-Chair: Jorg Callies
From - To Abst.ID
Title of the Presentation Speaker
12.00 – 12.20 111 Radiation and cloud studies with GOME in preparation for futurespectrometer missions
Piet Stammes
12.20 – 12.40 481 CRAG - Cloud Retrieval Algorithm for GOME Albrecht Von Bargen12.40 – 13.00 282 Cloud Retrieval for SCIAMACHY Diego Loyola
13.00 – 14.00 Lunch Time
14.00 – 14.20 367 Automated cloud-top height, amount and winds from ATSR2 inEU-CLOUDMAP project
Jan-Peter Muller
14.20 – 14.40 468 Remote Sensing of Aerosol over oceans using visible and infraredmeasurements from ATSR-2 and AATSR
Philip Watts
14.40 – 15.00 131 Tropospheric aerosol characterisation: from GOME towards anEnvisat perspective
Maria João Costa
15.00 – 15.20 100 Synergetic retrieval of aerosol properties: from ERS to ENVISAT Marion Schroedter
15.20 – 15.40 437 Aerosol retrieval over land and over sea Gerrit De Leeuw
15.40 – 16.00 162 Validation of Aerosol Properties Retrieved from GOMEMeasurements
Marco Cervino
Posters
Abst.ID
Title of the Poster Presenter
385 Retrieval of Cloud Properties from Oxygen A-Band Spectrameasured by the Global Ozone Monitoring Experiment
Robert Koelemeijer
420 Discrimination between water and ice clouds using near-IRAVIRIS measurements
Wouter Knap
151 Detection of cloud cover fractions by GOME PolarisationMeasurement Devices and validation by surface observations andMeteosat data.
Olaf Tuinder
1057 Cloud properties derived from ATSR-2 and aerosol opticalthicknesses derived from GOME in co-located cloud-free scenes
Richard Siddans

ERS-ENVISAT SYMPOSIUMGöteborg, 16-20 October 2000
ATMOSPHERE: OZONE: TOTAL COLUMN, PROFILES
Chair: Piet StammesCo-Chair: Rob Koopman
From - To Abst.ID
Title of the Presentation Speaker
9.00 – 9.20 146 Review of Five Years GOME/ERS-2 Operational Trace GasRetrieval
Werner Thomas
9.20 – 9.40 376 Improved GOME ozone column retrieval Pieter Valks
9.40 – 10.00 457 Temperature Independent Differential Absorption Spectroscopy(TIDAS) and Simplified Atmospheric air Mass Factor (SAMF)techniques for the measurement of total ozone using GOME data
Claus Zehner
10.00 – 10.20 185 Ozone from GOME data using neural network technique Martin Mueller10.20 – 10.40 366 Observation and theoretical analysis of the record ozone mini-
hole of 30 November 1999Henk Eskes
10.40 – 11.00 Coffee Break 11.00 – 11.20 1058 Derivation of an extensive height-resolved ozone data-set
spanning the troposphere and stratosphere from GOMERichard Siddans
11.20 – 11.40 373 Near-real time delivery of GOME ozone profiles. Ronald van der A
11.40 – 12.00 400 Ozone profiles estimates by using GOME measurements and aneural network algorithm
Stefano Casadio
Posters
Abst.ID
Title of the Poster Presenter
52 Expectations for GOME-2 on the METOP satellites Rosemary Munro
121 On the variability of total column ozone derived from ERS-2GOME and TOMS
Thilo Erbertseder
375 Validation of ozone profile retrieval at KNMI Ronald van der A 501 Science Objectives of EOS-CHEM's Ozone Monitoring
Instrument (OMI)P. Stammes / G.W.Leppelmeier
175 GOME satellite detection of ozone vertical column over asnow/ice covered surface in the presence of broken clouds
Silvia Tellmann
356 Fast and accurate ozone profile retrieval for GOME-2 using 4-stream LIDORT.
Roeland Van Oss
345 Intercomparison of GOME Ozone Profiles James Gleason
374 GOME Fast delivery and value-added Products (GOFAP). Ronald van der A 478 Software for Extraction of GOME Data from Level-2 to -3 for
Total Column Ozone and other ParametersM.V.R. Murti

ERS-ENVISAT SYMPOSIUMGöteborg, 16-20 October 2000
COASTAL ZONES 1
Chair: Hans WensinkCo-Chair: Gordon Campbell
From - To Abst.ID
Title of the Presentation Speaker
14.00 – 14.20 336 Coastal Current Observation using Imaging SAR Johnny Johannessen
14.20 – 14.40 406 Problèmes posés par la mise à jour cartographique en zonelittorale. Exemples en Mauritanie autour de la ville de Nouakchottet au Cameroun autour de la ville de Douala.
Herve Trebossen
14.40 – 15.00 1105 Mapping of Indonesian coastal waters by Synthetic ApertureRadar: an Indonesian-Netherlands initiative for starting newbusiness
Han Wensink
15.00 – 15.20 209 The Alaska SAR Demonstration: RADARSAT-1 Experience andENVISAT Plans
William Pichel
15.20 – 15.40 318 The ERS contribution to Oil Spill Monitoring- From R&Dtowards an operational service -
Jan Petter Pedersen
15.40 – 16.00 Coffee Break
16.00 – 16.20 355 Multisensor studies of Oceanic Phaenomena in EuropeanMarginal Waters: Algae Blooms in the Baltic Sea and a RiverPlume in the Mediterranean
Martin Gade
16.20 – 16.40 306 Satellite Observations and Model Predictions of Harmful AlgaeBlooms in Coastal Waters
Lasse H. Pettersson
ERS-ENVISAT SYMPOSIUMGöteborg, 16-20 October 2000
COASTAL ZONES 1
Chair: Hans WensinkCo-Chair: Gordon Campbell
Posters
Abst.ID
Title of the Poster Presenter
261 ERS SAR Imaging over the Brazil-Malvinas Confluence andArgentine Coastal Waters; its Usefulness for different Oceanactivities
D. A. Gagliardini
299 Observation of seasonal variations of the north Caspian coastvegetation covers based on ERS-2 SAR multitemporal datareceived in 1999 year
Irina Kucheryavenkova
307 On the use of ERS INSAR data for classification of coastal covertypes and detection of fast variations of water level.
Irina Kucheryavenkova
200 Coastal changes and the role of mangrove and morphologicalfeatures on the dynamics and productivity of the NE-Brazilianoceanic waters
J.J. Martínez-Benjamin
388 Clean Seas: A North Sea Test Site Helen Snaith
325 Topographic mapping of the German tidal flat areas using ERS-SAR images
Stefan Voss
191 Monitoring Blue-fin tuna habits with the help of satelliteenvironmental data: ERS experience waiting for Envisat.
Mariangela Cataldo
404 Numerical Model of Wave Spectra Refraction By TOPSARPolarised Data
Marghany Maged
403 Wave Refraction Pattern and Coastal Erosion Marghany Maged
405 Residual Currents Movements and Oil Spills Transport Marghany Maged
432 Preliminary Studies for ENVISAT Proposal (AO-ID-542):determining Offisheries and Coastal Management Plan by usingRemote Sensing Techniques in Lake Van, Eastern Turkey
Mustafa Sari
289 Environmental remote sensing system for coastal watermonitoring (Envisat AO 560)
A. V. Caramizoiu
35 Oil Spill Monitoring in the Mediterranean Sea using ERS SARData
Francesco Nirchio
456 Water dynamics in the Kuril straits area: study with ERS SAR Leonid Mitnik

ERS-ENVISAT SYMPOSIUMGöteborg, 16-20 October 2000
COASTAL ZONES 2
Chair: Johnny JohannessenCo-Chair: Gordon Campbell
From - To Abst.ID
Title of the Presentation Speaker
16.40 – 17.00 186 Cold season features of the Japan Sea coastal zone revealed byERS SAR
Leonid Mitnik
17.00 – 17.20 277 Monitoring of water quality in lake and coastal regions usingENVISAT MERIS observations
Jouni Pulliainen
17.20 – 17.40 438 Coastal and Estuarine Water Monitoring by Sea Truth, SatelliteOcean Colour, and SPOT Data
I-I Lin
17.40 – 18.00 378 Coastal processes and features from ERS-2 data: two case studiesat NE Brazilian continental shelf
Alexandre Cabral
18.00 – 18.20 517 Satellite Observations of the Southern California Bight: SurfaceCirculation, Oil Seepage, Storm Water Runoff and BiologicalImplications
Benjamin Holt
18.20 – 18.40 363 Fisheries monitoring in the CaboVerde Region using ERS data Joana Fernandes
18.40 – 19.00 402 Coastal Engineering Construction Monitoring, Control andPrediction System
Marghany Maged

ERS-ENVISAT SYMPOSIUMGöteborg, 16-20 October 2000
EARTH MOTION
Chair: Fabio RoccaCo-Chair: Frank Martin Seifert
From - To Abst.ID
Title of the Presentation Speaker
15.20 – 15.40 294 Climate Change - Himalayan Peri-Glacial Lake, Moraine DamBurst Surveillance.
Richard Stow
15.40 – 16.00 532 Assessment of SAR interferometry within operationalapplications: mapping and modelling of peri-urban subsidence
Claudie Carnec
16.00 – 16.20 Coffee Break
16.20 – 16.40 426 ERS-1/2 SAR Interferometry for Urban Subsidence Detection inChina
Chao Wang
16.40 – 17.00 50 ERS and ENVISAT Differential SAR Interferometry forSubsidence Monitoring
Urs Wegmuller
17.00 – 17.20 143 Validation of the Permanent Scatterers technique in urban areas Claudio Prati
17.20 – 17.40 362 Temporal Analysis of Terrain Movements by Means of SARDifferential Interferometric Measurements on Sparse CoherentAreas
Mario Costantini
17.40 – 18.00 381 InSAR imaging of London surface movement for structuraldamage management and water resource conservation.
Julie Boyle
Posters
Abst.ID
Title of the Poster Presenter
361 Study of surface displacements in urban context with SARinterferometry : application to the cities of Paris (France), andTainan (Taiwan)
Benedicte Fruneau
519 Subsidence Monitoring Using Sparse SAR DifferentialInterferometric Measurements: The Bologna Case Study
Mario Costantini

ERS-ENVISAT SYMPOSIUMGöteborg, 16-20 October 2000
EARTHQUAKES
Chair: Gilles PeltzerCo-Chair: Yves Louis Desnos
From - To Abst.ID
Title of the Presentation Speaker
16.00 – 16.20 43 Merging seismotectonic displacement maps measured from SARinterferometry and optical satellite images.
Rémi Michel
16.20 – 16.40 265 Eight years of crustal deformation in Southern Californiaobserved with ERS SAR interferometry
Gilles Peltzer
16.40 – 17.00 84 The Coseismic Deformation Field of M=7.5 Mani Earthquake inTibet Mapped by ERS Interferometric SAR Data
Guo Huadong
17.00 – 17.20 499 Applications of SAR Interferometry to Surface Deformation inCentral and Southwest Asia
Eric Fielding
17.20 – 17.40 485 Triggered slip on a shallow low-angle thrust imaged by SARinterferometry: the Shahdad thrust, SE Iran
Barry Parsons
17.40 – 18.00 484 Crustal deformation of the North Anatolian Fault Zone measuredwith radar interferometry
Tim Wright
18.00 – 18.20 535 Coherence tracking measurements of the Agust 1999 Izmitearthquake
Dominique Derauw
18.20 – 18.40 54 Study of the September 7, 1999 Athens earthquake using ERS-2SAR interferometry
Charalabos Kontoes
18.40 – 19.00 462 The coseismic displacement field of the Baotou earthquakemapped by differential radar interferometry
Zhang Hong
Posters
Abst.ID
Title of the Poster Presenter
298 Mining Induced Seismic Events - Imaging Surface Deformationof Deep Mine Rock Bursts and Fault Movements.
Richard Stow
533 Survey of large deformation in the Chile-Peru seismic gap (SouthAmerica) using SAR interferometry: the loading and triggering ofgiant earthquake
J.B. De Chabalier

ERS-ENVISAT SYMPOSIUMGöteborg, 16-20 October 2000
ENVISAT ASAR
Chair: Manfred ZinkCo-Chair: Christopher Buck
From - To Abst.ID
Title of the Presentation Speaker
14.20 – 14.40 386 ScanSAR interferometric monitoring using the PS technique Andrea MontiGuarnieri
14.40 – 15.00 150 Alternative Large-Scale Distributed Targets for SAR ElevationBeam Pattern Characterization
Christopher Buck
15.00 – 15.20 45 PHARUS ASAR Demonstrator: simulation and application ofASAR data
Arthur Smith
15.20 – 15.40 423 ERS - ENVISAT combination for interferometry and super-resolution
Andrea MontiGuarnieri
15.40 – 16.00 494 External radiometric calibration activity on Italian test-sites forthe ENVISAT mission
Francesco Posa
16.00 – 16.20 Coffee Break
Posters
Abst.ID
Title of the Poster Presenter
161 The EnviSat Exploitation Programme Andy Zmuda
371 Study of the Geometric Properties of ENVISAT ASAR Products Achim Roth
273 The Development of An Advanced Calibration Transponder forQuad-Pol SAR and SCANSAR
Peter Cooper
264 Passive calibration targets with a large, stable and controllableRCS for spaceborne SAR
Alexander Zakharov

ERS-ENVISAT SYMPOSIUMGöteborg, 16-20 October 2000
ENVISAT AATSR
Chair: Christopher MutlowCo-Chair: Peter Regner
From - To Abst.ID
Title of the Presentation Speaker
12.20 – 12.40 514 The proposed Global Land Surface Temperature Products forENVISAT's AATSR: Scientific basis, algorithm description andvalidation protocol
Fred Prata
12.40 – 13.00 170 Laboratory Calibration of AATSR David Smith
13.00 – 14.00 Lunch Time
14.00 – 14.20 503 Near-surface ocean temperature variability - consequences for thevalidation of AATSR on Envisat.
Peter Minnett
Posters
Abst.ID
Title of the Poster Presenter
490 In-situ validation of the AATSR skin SST products with theSISTeR radiometer
Chris Mutlow /Marianne Edwards

ERS-ENVISAT SYMPOSIUMGöteborg, 16-20 October 2000
ENVISAT ATMOSPHERIC INSTRUMENTS
Chair: Herbert FischerCo-Chair: Johannes Frerick
From - To Abst.ID
Title of the Presentation Speaker
16.20 – 16.40 392 Acquisitions of the COSE project in the perspective ofENVISAT.
Martine De Maziere
16.40 – 17.00 38 German SCIAMACHY Validation Activities Thomas Wagner
17.00 – 17.20 344 SCIAMACHY polarisation sensitivity and impact on trace gasretrieval
Sander Slijkhuis
17.20 – 17.40 439 SCIAMACHY Nominal Operations and Special Features Stefan Noel17.40 – 18.00 472 Validation of trace gas measurements of the ENVISAT
instruments MIPAS, GOMOS and SCIAMACHY using in-situand remote sensing balloon borne techniques
Hermann Oelhaf
18.00 – 18.20 497 Geophysical validation of level-2 products of MIPAS, GOMOS,and SCIAMACHY by dedicated campaigns of the high-altitudeaircraft M-55 Geophysica
Cornelis Blom
18.20 – 18.40 446 An optimized forward model and retrieval scheme for MIPASnear real time data processing
Marco Ridolfi
Posters
Abst.ID
Title of the Poster Presenter
87 Advanced MIPAS-Level-2 Data Analysis (AMIL2DA) Thomas v. Clarmann 286 Operational Long Term Monitoring of the SCIAMACHY
Instrument on ENVISATManfred Wuttke
330 German Contribution to SCIAMACHY Validation with Ground-based FTIR Observations from the NDSC Network: PreparationPhase
Ralf Sussmann
11 Calibration and evaluation of Envisat temperature and ozone datausing statistics from the UK Met Office NWP system
William Lahoz
413 Comparison of Ground Based FTIR measurements at Harestua tospaceborne measurements
Johan Mellqvist
470 SAFIRE-A measurements during the APE-GAIA campaign Giovanni Bianchini 285 Tools for the Analysis of Residual Spectra Affecting MIPAS
Level 2 ProductsSiegfried Hilgers
339 Ground Based High Resolution FTIR Measurements ofStratospheric Molecules above Harestua, Norway, during 1995 to2000.
Bo Galle
2 Upper atmospheric NO from SCIAMACHY : simulations andinstrument capabilities.
Christian Muller
505 NDSC Support to the Development of ERS-2 GOMEGeophysical Data
J.C. Lambert

ERS-ENVISAT SYMPOSIUMGöteborg, 16-20 October 2000
ENVISAT ESA 1
Chair: Yves Louis DesnosCo-Chair: Guido Levrini
From - To Abst.ID
Title of the Presentation Speaker
14.00 – 14.10 449 The ENVISAT System Guido Levrini
14.10 – 14.20 1414 Earth Observation in the Fifth Framework Programme Michel Schouppe
14.20 – 14.40 450 The ENVISAT Cal / Val Approach Guido Levrini
14.40 – 15.00 477 ASAR Instrument Calibration Christopher Buck
15.00 – 15.20 504 ASAR ground Processor verification and Wave validation Yves-Louis Desnos
15.20 – 15.40 447 MERIS instrument calibration Steven Delwart
15.40 – 16.00 444 MERIS validation Plan Jean-Paul Huot
16.00 – 16.20 Coffee Break

ERS-ENVISAT SYMPOSIUMGöteborg, 16-20 October 2000
ENVISAT ESA 2
Chair: Guido LevriniCo-Chair: Yves Louis desnos
From - To Abst.ID
Title of the Presentation Speaker
16.20 – 16.40 475 MIPAS Calibration and Processor Verification Herbert Nett
16.40 – 17.00 466 GOMOS Calibration and Processor Verification Torgeir Paulsen
17.00 – 17.20 488 The validation of the products derived from the AtmosphericChemistry Instruments
E. Attema
17.20 – 17.40 411 The SCIAMACHY Validation program H. Kelder
17.40 – 18.00 454 The RA-2 Calibration Program Monica Roca
18.00 – 18.20 256 The RA-2 and MWR Validation and Cross-Calibration Jerome Benveniste
18.20 – 18.40 502 The validation of the ENVISAT orbits Patrick Vincent
18.40 – 19.00 29 The AATSR Cal/Val plan Marianne Edwards

ERS-ENVISAT SYMPOSIUMGöteborg, 16-20 October 2000
ENVISAT RA2
Chair: Jérôme BenvenisteCo-Chair: Monica Roca
From - To Abst.ID
Title of the Presentation Speaker
9.00 – 9.20 34 An ENVISAT S-Band altimeter CAL / VAL experiment in theframework of the OSCAR project
Monique Dechambre
9.20 – 9.40 171 Radar Altimeter Calibration using Ground Based Transponders Andrew Birks
9.40 – 10.00 276 The ENVISAT RA-2 Value-Added Ocean/Ice Processor at GFZPotsdam
Alexander Braun
10.00 – 10.20 257 The ENVISAT Altimetry Mission Data Products Jerome Benveniste
10.20 – 10.40 106 CLS contribution to Envisat CALVAL Joël Dorandeu
10.40 – 11.00 Coffee Break
11.00 – 11.20 135 Absolute and Relative Calibration of ERS-2 RA withApplications to ENVISAT
Philip Moore
11.20 – 11.40 142 Land Calibration and Monitoring of ENVISAT RA-2 Sigma0 Philippa Berry
11.40 – 12.00 337 Measurements and modeling of ocean surface slopes andcalibration of the radar altimeter
Bertrand Chapron
12.00 – 12.20 427 The CATALA campaigns: Indirect calibration technique forENVISAT altimeter calibration
J. J. Martínez-Benjamin
Posters
Abst.ID
Title of the Poster Presenter
26 Analysis of the effect rain on Envisat altimeter: definition of arain flag
Jean Tournadre
114 Concept for using GPS-buoys for RA drift monitoring Tilo Schoene

ERS-ENVISAT SYMPOSIUMGöteborg, 16-20 October 2000
FLOODS AND STORMS
Chair: Herve YesouCo-Chair: Marc Paganini
From - To Abst.ID
Title of the Presentation Speaker
11.20 – 11.40 104 China Remote Sensing Satellite Ground Station and its FloodMonitoring with ERS in China.
An Li
11.40 – 12.00 453 Flood monitoring in Bangladesh. An application of SAR imageryfor impact assessments of flood extent, flood depth and duration.
Joris de Vente
12.00 – 12.20 327 Evaluation of multitemporal radar data for the mapping ofinundation dynamics in the Save-flood plain (Croatia)
Roland De Kook
12.20 – 12.40 122 Contribution of ERS SAR images and ERS coherence data to aflood information system on the Meuse basin -France
Hervé Yesou
12.40 – 13.00 123 Application of SAR-data for flood modelling in SouthernGermany
Heike Bach
13.00 – 14.00 Lunch Time
14.00 – 14.20 203 Validating soil moisture estimation with ERS PRI data:operational use in DeciDe, a decision support system for floods
Alberto Ortolani
14.20 – 14.40 118 Mapping Storm Forest Damage using SAR Coherence Data. Thecase of the Haguenau Forset - France
Hervé Yesou
14.40 – 15.00 165 Forest storm damage assessment with ERS tandem data Andreas Wiesmann
15.00 – 15.20 210 The Devastation of Venezuela by Heavy Rains in December1999: Assessment of the Situation using ERS InSAR TandemData and SPOT Images
Edmond Nezry
Posters
Abst.ID
Title of the Poster Presenter
27 Flood monitoring in the Senegal River valley: First results basedon SAR PRI data
Rasmus Fensholt
217 Mapping and Evaluation of "Mitch" hurricane damages in CentralAmerica using ERS SAR and SPOT images
Edmond Nezry
329 A rapid Mapping System for Hurricane Damage Assessment Kader Fellah
250 Watching for the Hazardous Spring 99 Flooding in the ChernobylZone in Ukraine with the ERS SAR Images
Rudolf Greku

ERS-ENVISAT SYMPOSIUMGöteborg, 16-20 October 2000
FORESTRY
Chair: Martti HallikainenCo-Chair: Henri laur
From - To Abst.ID
Title of the Presentation Speaker
11.40 – 12.00 235 ERS and JERS-1 SAR data application for Russian boreal forestsmapping and monitoring
L.P. Bobylev
12.00 – 12.20 81 Boreal Forest Monitoring with ERS Coherence Maurizio Santoro
12.20 – 12.40 196 An Analysis of InSAR Coherence of Boreal Forests Based onElectromagnetic Scattering Modeling
Xianyun Luo
12.40 – 14.00 251 Mapping Siberian Landscapes: natural and Anthropogenic Factorsaffecting Carbon Balance
Jon Ranson
13.00 – 13.40 Lunch Time
14.00 – 14.20 469 Characterizing transpiration and biomass in a Siberian landscapeby combining JERS / ERS-1/2 InSAR image classification,InSAR DEM analysis and field measurements
Reiner Zimmermann
14.20 – 14.40 308 Calculation of Microwave Backscatter from a Scots Pine Forest Terhikki Manninen14.40 – 15.00 492 Combined use of soil and vegetation data, a digital elevation
model and SAR classification for C and N Pool Assessment in aCentral Alaskan landscape
Jan Dempewolf
15.00 – 15.20 369 An Operational Forest Mapping Tool using Spaceborne SARData
Eduard Dwyer
15.20 – 15.40 1053 Global burned Area mapping using the ERS-ATSR2 Jose Miguel Pereira
Posters
Abst.ID
Title of the Poster Presenter
97 Pine forest understorey sensing with ERS-2 SAR imagery Leonor Cadete 398 Processing and Integration of Multisensor and Multidate Satellite
Data for Forest Management Mapping in Gabon (application tothe first forest zone)
Marcellin Nziengui
513 Usefulness of ERS coherence time series for monitoring thevegetation cycle of a mixed temperate forest.
Christophe Proisy
489 Mapping China Forest with ERS SAR Tandem Data Ranera Franck 521 Fire damage assessment using ERS-SAR and NOAA-AVHRR
data in East Kalimantan, IndonesiaRuandha AgungSugardiman
85 ERS coherence and SLC images in forest characterisation Terhikki Manninen 271 Fire impact assessment in Indonesian rainforests with ERS and
JERS SAR dataFlorian Siegert

ERS-ENVISAT SYMPOSIUMGöteborg, 16-20 October 2000
GEODESY
Chair: Remko ScharrooCo-Chair: Pierre Femenias
From - To Abst.ID
Title of the Presentation Speaker
15.20 – 15.40 92 The KMS99 Global Marine Gravity Field from ERS andGEOSAT Altimetry
Ole Andersen
15.40 – 16.00 350 Improved Modelling of Earth Gravity and Impact on ERS POD Christoph Reigber
16.00 – 16.20 Coffee Break
16.20 – 16.40 248 Black Sea Geoid and Sea Surface Topography with the ERS-1Altimeter Data
Rudolf Greku
16.40 – 17.00 226 The time tag bias of ERS altimeter data Remko Scharroo
17.00 – 17.20 198 Identification and Correction of Clock Asymmetry in the ERS-1and ERS-2 Radar Altimeters
Richard Francis
17.20 – 17.40 227 Analysis of geophysical corrections applied to ERS altimeter data Remko Scharroo
Posters
Abst.ID
Title of the Poster Presenter
148 Non-Parametric Estimation of the Wet Tropospheric Correction,Cloud Liquid Water Content and Sea Surface Wind Speed in ERSConfiguration.
Estelle Obligis
346 The PRARE System onboard ERS-2: Status and Results F.H. Massmann
136 ERS Orbit Determination and Gravity Field Model Tailoring:Recent Developments
Remko Scharroo
228 A recipe for upgrading ERS altimeter data Remko Scharroo
168 Operational Altimetry at GFZ - From ERS-2 to Envisat Matthias Rentsch
New mean sea surface and gravity anomaly determination forocean circulation studies
Fabrice Hernandez

ERS-ENVISAT SYMPOSIUMGöteborg, 16-20 October 2000
GEOLOGY AND VOLCANOES
Chair: Geoff WadgeCo-Chair: Maurizio Fea
From - To Abst.ID
Title of the Presentation Speaker
9.00 – 9.20 32 Comparing spaceborne ERS-SAR and airborne geophysical data :Application to geology in the French Guiana rainforest landscapes
Jean-Paul Deroin
9.20 – 9.40 194 Reconstruction of the paleodrainage and geologic evolution ofLake Abhe, East Africa
Lucia Marinangeli
9.40 – 10.00 224 ERS SAR Data and DEM Analysis to complement the GeologicalInterpretation of the Kalecýk-Hasayaz basin, Ankara, Türkýye
Tamer Özalp
10.00 – 10.20 30 Studies of volcanoes of Alaska by satellite radar interferometry Zhong Lu
10.20 – 10.40 1055 First results from operational volcano monitoring in the CanaryIslands
Daniel Carrasco
10.40 – 11.00 Coffee Break
11.00 – 11.20 441 Operational use of InSAR for volcano observatories: experiencein local reception at Montserrat
Geoff Wadge
Posters
Abst.ID
Title of the Poster Presenter
407 Synergism of optic and radar data to optimize lithostructuralmapping and mineral exploration in South-East Senegal and Mali(West Africa)
Souleye Wade

ERS-ENVISAT SYMPOSIUMGöteborg, 16-20 October 2000
HYDROLOGY 1
Chair: Helmut RottCo-Chair: Maurice Borgeaud
From - To Abst.ID
Title of the Presentation Speaker
9.00 – 9.20 53 Comparison ERS SAR Data derived Soil Moisture Distributionswith SVAT-Model Results
Wolfram Mauser
9.20 – 9.40 338 Comparisons of detailed in-situ soil moisture and rainmeasurements with ERS radar backscattering data
Maurice Borgeaud
9.40 – 10.00 455 Applying surface roughness discriminator based on partiallypolarised SAR data to soil moisture inversion
Francesco Mattia
10.00 – 10.20 458 Generalised inversion algorithm for bare soil moisture mappingusing ERS SAR data
Malcolm Davidson
10.20 – 10.40 417 Inferring the Effect of Plant and Soil Variables of C and LBackscatter over Agriculture Fields Based on Modeling Analysis
Katarzyna Dabrowska-Zielinska
10.40 – 11.00 Coffee Break
Posters
Abst.ID
Title of the Poster Presenter
93 Soil moisture estimation with SAR.PRI ERS images Hector Salgado 4 Soil Moisture Mapping Using ENVISAT ASAR and ERS-2 Data
in the Southern Great Plains Region of the U. SThomas Jackson
269 Appraisal of SAR Data Application in Assessment of Soil Salinityand Waterlogging Problems in Bahawalnagar and BahawalpurDistricts, Pakistan
Iftikhar Ahmed
117 Feasibility of using SAR derived soil moisture to enhance therobustness of vegetation index based crop yield models.
Sushma Panigrahy
331 Assessment of the ERS Times Series Fusion and CoherenceAnalysis for the Monitoring of Environmental Sensitive Areas inAlsace
Kader Fellah
259 ERS-2, RADARSAT SAR backscattering characteristics of theParana River Delta Wetland, Argentina
Haydee Karszenbaum
491 Observation of the wetland hydrology in the Unstrut catchementin Thuringia (Germany) by multitemporal ERS-1 and ERS-2 SARdata
Volker Hochschild
493 Monitoring of water hyacinth abundance and its occasionalfactors in Lake Victoria Area (East Africa) using ERS-1 andERS-2 SAR data
Volker Hochschild
48 The Contribution of ERS Satellite Altimetry to HydrologicalApplications
Charon Birkett
125 Retrieval of Geo- and Biophysical Information from RemoteSensing data - Overview of the GeoBIRD study
Heike Bach
418 Application of ERS-2.SAR data for soil moisture estimates overflooded areas.
K. Dabrowska-Zielinska

ERS-ENVISAT SYMPOSIUMGöteborg, 16-20 October 2000
HYDROLOGY 2
Chair: Helmut RottCo-Chair: Maurice Borgeaud
From - To Abst.ID
Title of the Presentation Speaker
11.00 – 11.20 62 An approach for radar backscatter and pedologic soilcharacteristic investigation
Piero Boccardo
11.20 – 11.40 205 Soil moisture mapping from ASAR imagery for the Flumendosa(Italy) and Meuse (Belgium-Netherlands) river basins
Claudio Paniconi
11.40 – 12.00 96 Combining the microwave model CLOUD and the growth modelPROMET-V for soil moisture retrieval
Roswitha Stolz
12.00 – 12.20 193 Mapping and Monitoring of Wetlands in the Lake Chad-basinusing ATSR-2 Data (Project AO3-151)
Jan Verhoeye
12.20 – 12.40 112 SAR-based monitoring of flood-induced landcover and landusechange in the region of the inland delta of the river Niger (Mali)
Elmar Csaplovics
12.40 – 13.00 67 On Estimating Snow Wetness Using ASAR Measurements Jiancheng Shi
13.00 – 14.00 Lunch Time
14.00 – 14.20 247 Real Time Snowmelt Runoff Forecasting using ERS SAR PRIdata
Thomas Nagler

ERS-ENVISAT SYMPOSIUMGöteborg, 16-20 October 2000
ICE 1
Chair: Christopher DoakeCo-Chair: Espen volden
From - To Abst.ID
Title of the Presentation Speaker
9.00 – 9.20 86 Processing interferometric ERS-1/2 Tandem data coast to coast inGreenland
Johan Jacob Mohr
9.20 – 9.40 3 Unsteady flow in the Antarctic ice sheet revealed by SARinterferometry and radar altimetry
Andrew Shepherd
9.40 – 10.00 36 ERS Altimetry in Antarctica Frederique Remy
10.00 – 10.20 37 Interferometry and altimetry above Dome C, Antarctica Benoit Legresy
10.20 – 10.40 134 SAR Interferometric Analysis of David Drygalski Glacial Systemand Nansen Ice Sheet (Antarctica)
Franco Coren
10.40 – 11.00 Coffee Break
11.00 – 11.20 154 The evolution of a glacier surge observed with the ERS satellites Tazio Strozzi
11.20 – 11.40 253 Investigation of Correlations Between Temporal Variations ofRadar Backscatter and Altimeter-derived Ice Sheet ElevationChanges
Anita Brenner
11.40 – 12.00 284 Glaciological information derived from combining interferometricSAR with other remote sensing measurements
Niels Reeh
12.00 – 12.20 396 Eight years of ERS1/2 observations of the evolution of WestAntarcticGlaciers: What have we learned ?
Eric Rignot
12.20 – 12.40 471 Surface motion and grounding line detection, measured bydifferential ERS-SAR Interferometry, Thwaites Glacier, WestAntarctica
Bernhard Rabus
Posters
Abst.ID
Title of the Poster Presenter
397 Validation of ice flow models with ERS SAR observations ofAntarcticglaciers and ice shelves.
Eric Rignot
476 Measurement of windspeed and snow-humidity on the AntarcticPeninsula using ERS-SAR-tandem interferometry
Bernhard Rabus
1407 Differential Interferometric SAR for global change monitoring atDronning Maud Land, Antarctica
Elaine Rowan

ERS-ENVISAT SYMPOSIUMGöteborg, 16-20 October 2000
ICE 2
Chair: Johan Jacob MohrCo-Chair: Espen Volden
From - To Abst.ID
Title of the Presentation Speaker
14.00 – 14.20 500 Glaciological Investigation of Mertz Glacier, East Antarctica,usingSAR Interferometry and field observations
Anja Poetzsch
14.20 – 14.40 65 Equilibrium and firn line detection with multipolarisation SAR Max Koenig
14.40 – 15.00 324 Features of Topography and Dynamics of Glaciers of the WesternAntarctic Peninsular by the ERS SAR Interferometry
Rudolf Greku
15.00 – 15.20 320 Shrinking of the Arctic ice Cover over the last two decades Ola M. Johannessen

ERS-ENVISAT SYMPOSIUMGöteborg, 16-20 October 2000
LAND COVER / LAND USE
Chair: Mike WoodingCo-Chair: Olivier Arino
From - To Abst.ID
Title of the Presentation Speaker
9.00 – 9.20 357 Monitoring Rapid Urbanisation with Imaging Radars David Archer9.20 – 9.40 229 Synergy Study of Multisource Data for Characterisation and
Monitoring of Soil Surfaces. Application to Algiers and LaghouatRegions (Algeria).
Youcef Smara
9.40 – 10.00 495 Application of ERS-SAR and scatterometer to the study of backscatteranisotropy in urban areas
Benedicte Dousset
10.00 – 10.20 445 Understanding ERS Coherence over Urban Areas Attilio Fanelli10.20 – 10.40 57 Urban Remote Sensing through Multispectral and Radar Data Paolo Gamba10.40 – 11.00 Coffee Break 11.00 – 11.20 1405 Application of EO data for urban planning in Mega Cities Christopher Boehm11.20 – 11.40 309 Inferring building height from SAR interferometric phase
coherence imagesWilliam Grey
11.40 – 12.00 288 Evaluation of Multisensor Spaceborne SAR for CORINE LandCover Mapping in Sweden
Yifang Ban
12.00 – 12.20 39 Interferometric SAR DEM construction for landscape processanalyses in north-eastern Iceland
Jukka Käyhkö
12.20 – 12.40 332 Optimal use of multi-temporal SAR data for land use informationextraction
Hugues Sassier
12.40 – 13.00 293 Use of ERS SAR Imagery in Refugee Relief Øyvind Dalen13.00 – 14.00 Lunch Time
14.00 – 14.20 401 Exemples d'utilisation des images radar ERS pour les etudesd'amenagement et la mise a jour cartographique en regionamazonienne, Projets ERS AO3-160 Guyane et ENVISAT ID 539
Jean Paul Rudant
14.20 – 14.40 219 Evolution of the Hydrographical Network of the Karakum Desertand Environmental Implications for the Aral Sea
Nikos Lyberis
PostersAbst.ID
Title of the Poster Presenter
159 Utilization of radar remote sensing and texture analysis for urbancartography in Cameroon : application to Yaoundé city.
Akono Alain
190 Quantitative Analysis of Temporal ESR InSAR Data over theCity of Graz
Lado-Wani Kenyi
272 Statistical Analysis and Neuro-fuzzy Classification ofPolarimetric SAR Images of Urban Areas
Paolo Gamba
241 Use of multitemporal ERS data for monitoring of landcoverchange in Sahelian regions. The exemple of the Delta of the Nigerriver (Mali)
Catherine Mering
518 Historical land transformation analysis for geographic hazardevaluation in the Italian country.
Mario Aversa
263 On the use of ERS INSAR and multitemporal data for ecologicalmonitoring of the Chernobyl area.
Alexander Zakharov

ERS-ENVISAT SYMPOSIUMGöteborg, 16-20 October 2000
LANDSLIDES
Chair: Claudie CarnecCo-Chair: Francesco Palazzo
From - To Abst.ID
Title of the Presentation Speaker
14.00 – 14.20 395 Regional scale thematic maps for landslide hazard assessmentusing neural networks techniques.
Palma Blonda
14.20 – 14.40 207 Monitoring landslide activity in a peri-urban area by SARInterferometry
Alberto Refice
14.40 – 15.00 234 The application of ERS SAR interferometry for the assessment ofhazards related to slope motion and subglacial volcanism
Helmut Rott
15.00 – 15.20 181 Detection and Quantification of Rock Glacier Movements usingERS D-InSAR Data
Lado-Wani Kenyi
15.20 – 15.40 147 Civil Protection use of ERS1-2 SAR Data - the TS-SAR Project Roberto Vidmar

ERS-ENVISAT SYMPOSIUMGöteborg, 16-20 October 2000
LAND SURFACE TEMPERATURE
Chair: Mariane EdwardsCo-Chair: Alessandra Buongiorno
From - To Abst.ID
Title of the Presentation Speaker
9.00 – 9.20 314 Synergistic use of ATSR-2 multispectral and dual-angle data forland surface studies
Zhao-Liang Li
9.20 – 9.40 204 Component temperature retrieval from ATSR-2 Claire Jacobs
9.40 – 10.00 101 Surface Temperature from ATSR-2 Data: Algorithms andValidation
José A. Sobrino
10.00 – 10.20 274 A Model-based Land Surface Temperature Retrieval Algorithm Guangjian Yan
10.20 – 10.40
10.40 – 11.00 Coffee Break
Posters
Abst.ID
Title of the Poster Presenter
242 Development of practical algorithm for inferring componenttemperatures from multi-directional measurements
Li Jia

ERS-ENVISAT SYMPOSIUMGöteborg, 16-20 October 2000
METHODS 1
Chair: Sylvie PouliquenCo-Chair: Pascal Gilles
From - To Abst.ID
Title of the Presentation Speaker
9.00 – 9.20 60 A new collocation system for satellite data Sylvie Pouliquen
9.20 – 9.40 61 CERSAT Value Added Products Valerie Harscoat
9.40 – 10.00 63 Value Added Geocoded SAR Products from the GermanENVISAT PAC
Detlev Kosmann
10.00 – 10.20 174 Developments in AATSR and ATSR Product Algorithms andData Products
Andrew Birks

ERS-ENVISAT SYMPOSIUMGöteborg, 16-20 October 2000
METHODS 2
Chair: Shaun QueganCo-Chair: Josep Closa
From - To Abst.ID
Title of the Presentation Speaker
10.40 – 11.00 260 SCANSAR data processing and radiometric calibration. Andy Smith
11.00 – 11.20 18 INSAR Activities in Central Asia Xia Ye
11.20 – 11.40 218 Speckle Filtering and Classification of ERS SAR Images usingGAMMA Distribution
Youcef Smara
11.40 – 12.00 1357 Isolation of atmospheric artifacts in differential interferometry forground displacement detection: different methods comparison
Francesco Sarti
12.00 – 12.20 1358 An efficient low-memory implementation of 2-D phaseunwrapping based on minimum cost flow algorithm
Luca Galli
12.20 – 12.40 94 Multitemporal InSAR coherence from urban type objects. Dan Johan Weydahl
12.40 – 13.00 1408 Iterated multitemporal filtering and its use in land applications Shaun Quegan

ERS-ENVISAT SYMPOSIUMGöteborg, 16-20 October 2000
METHODS 3 / METHODS 4
Chair: Laurence GrayCo-Chair: Evert Attema
From - To Abst.ID
Title of the Presentation Speaker
14.00 – 14.20 108 Modeling backscattering from leafy vegetation: the incoherentand coherent approaches
Paolo Pampaloni
14.20 – 14.40 182 The application of wavelet-based filtering techniques forretrieving bio-physical parameters from multi-temporal ERS-images
Niko Verhoest
14.40 – 15.00 145 Classification of Multi-temporal SAR Images and INSARCoherence Images using adaptive neighborhood model andsimulated annealing approach
Mingquan Bao
15.00 – 15.20 387 Influence of Auroral Zone Ionospheric Disturbances on SyntheticAperture Radar and Interferometric SAR Data.
Laurence Gray
15.20 – 15.40 197 Cloud detection from satellite imagery by wavelets Carmine Serio15.40 – 16.00 268 Advances in Operational Cloud Clearing for ATSR-1,ATSR-2,
and AATSRChristopher Mutlow
16.00 – 16.20 Coffee Break
16.20 – 16.40 281 Classification of Oceanic and Atmospheric Signatures in ASARDual Polarization Mode Imagery
Roland Romeiser
16.40 – 17.00 140 A Multi-Sensor Approach to Monitor Oceanography in the Gulfof Oman
Neil Stapleton
17.00 – 17.20 415 Phasemap, a simple software intended to give an efficient accessto interferometry
Michel Rouze
17.20 – 17.40 383 ASAR ScanSAR modes: quality enhancement A. Monti Guarnieri
Posters
Abst.ID
Title of the Poster Presenter
68 Geolocation of InSAR interferograms Giovanni Nico 180 Mosaic generation using ERS SAR imagery Peter Meadows 416 Fuzzy Sets for Cloud Detection in ATSR-2 Images Over Land Richard Smith 89 A baseline estimation method for SAR interferometry Giovanni Nico 360 SAR images Data bank for land use monitoring in Central Africa,
an efficient data storage and processing scheme .Joseph Mvogo
254 Estimation of biophysical parameters from Terra surfacereflectances
Yuri Knyazikhin
311 SAR Product Control Software (SARCON) Thomas Boerner 137 3-D reconstruction of soil surfaces by stereovision in relation with
radar backscattered signal over themRiadh Tebourbi
384 Interferometric SAR quality enhancing by space-varying spectralshift pre-filtering
Andrea MontiGuarnieri
1413 Analysis of Candidate Missions for Remote Sensing fromgeostationary Orbit
Mick Johnson

ERS-ENVISAT SYMPOSIUMGöteborg, 16-20 October 2000
OCEAN DYNAMICS
Chair: John LillibridgeCo-Chair: Jérôme Benveniste
From - To Abst.ID
Title of the Presentation Speaker
9.00 – 9.20 58 Small-scale processes in the South Atlantic observed in synergyof ATSR and SAR data during the Tandem Mission.
Ian Robinson
9.20 – 9.40 105 Feasibility of ERS altimeter data to study subsurface processes inthe North Atlantic
Jacob Hoeyer
9.40 – 10.00 206 ERS-2 Altimetry in Operational NOAA Forecast Models John Lillibridge10.00 – 10.20 252 Analysis of the Atlantic Ocean response to Pressure Variations
using the Altimeters of ERS-1 and ERS-2 Satellites during hisTandem Mission
Jesus Gomez-Enri
10.20 – 10.40 1411 Satellite Observation of sharp frontal shear instabilities Ettore Sallustio
10.40 – 11.00 Coffee Break
11.00 – 11.20 287 Indian Ocean Circulation: an Integrated Model and RemoteSensing Study
Vibeke E. J. Haugen
11.20 – 11.40 348 Thermal plumes and internal solitary waves generated in theLombok Strait studied by ERS SAR
Leonid Mitnik
11.40 – 12.00 496 Determination and Characterization of Global Mean Sea LevelChange
C. K. Shum
12.00 – 12.20 534 Use of SAR derived Doppler data for obtaining quantitativecurrent velocity information in the Gulf of Mexico
Marco van der Kooij
12.20 – 12.40 189 Internal solitary waves in the Sulu Sea studied by ERS SARimagery
Werner Alpers
12.40 – 13.00 232 Local mean sea level slope from multi-satellite altimeter data:data analysis and unification in the Western Mediterranean Sea
Luciana Fenoglio-Marc
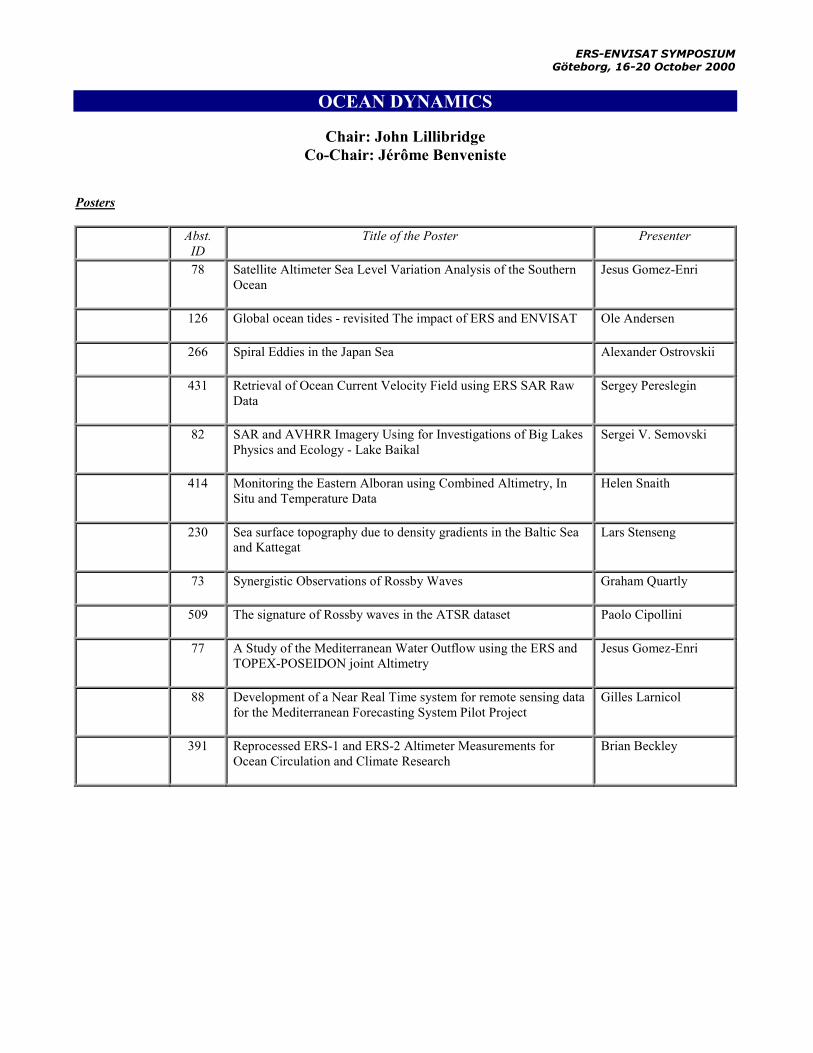
ERS-ENVISAT SYMPOSIUMGöteborg, 16-20 October 2000
OCEAN DYNAMICS
Chair: John LillibridgeCo-Chair: Jérôme Benveniste
Posters
Abst.ID
Title of the Poster Presenter
78 Satellite Altimeter Sea Level Variation Analysis of the SouthernOcean
Jesus Gomez-Enri
126 Global ocean tides - revisited The impact of ERS and ENVISAT Ole Andersen
266 Spiral Eddies in the Japan Sea Alexander Ostrovskii
431 Retrieval of Ocean Current Velocity Field using ERS SAR RawData
Sergey Pereslegin
82 SAR and AVHRR Imagery Using for Investigations of Big LakesPhysics and Ecology - Lake Baikal
Sergei V. Semovski
414 Monitoring the Eastern Alboran using Combined Altimetry, InSitu and Temperature Data
Helen Snaith
230 Sea surface topography due to density gradients in the Baltic Seaand Kattegat
Lars Stenseng
73 Synergistic Observations of Rossby Waves Graham Quartly
509 The signature of Rossby waves in the ATSR dataset Paolo Cipollini
77 A Study of the Mediterranean Water Outflow using the ERS andTOPEX-POSEIDON joint Altimetry
Jesus Gomez-Enri
88 Development of a Near Real Time system for remote sensing datafor the Mediterranean Forecasting System Pilot Project
Gilles Larnicol
391 Reprocessed ERS-1 and ERS-2 Altimeter Measurements forOcean Circulation and Climate Research
Brian Beckley

ERS-ENVISAT SYMPOSIUMGöteborg, 16-20 October 2000
PERFORMANCE
Chair: Pascal LecomteCo-Chair: Betlem Rosich Tell
From - To Abst.ID
Title of the Presentation Speaker
9.00 – 9.20 459 Five Years of ERS-2 Low Bit Rate Mission: routine Cal/Val andLong Loop Sensor Performance Monitoring.
Pascal Lecomte
9.20 – 9.40 313 ERS and Envisat orbit determination and prediction at ESOC Rene Zandbergen
9.40 – 10.00 208 Assessment of the new ERS-2 mono-gyro piloting mode on thequality of ERS SAR data and ERS SAR applications performance
Betlem Rosich
10.00 – 10.20 178 The performance of the ERS-2 Synthetic Aperture Radar Peter Meadows
10.20 – 10.40 42 Orbit Control of ERS-1, ERS-2 and ENVISAT to support SARinterferometry
Mats Rosengren
10.40 – 11.00 Coffee Break
11.00 – 11.20 128 Spatial and Temporal Errors in ERS-2 Radial Positioning Philip Moore
11.20 – 11.40 1410 Implementation of a single gyroscope attitude and orbit controlsystem on ERS-2
Miguel CanelaMarques

ERS-ENVISAT SYMPOSIUMGöteborg, 16-20 October 2000
RICE
Chair: Thuy Le ToanCo-Chair: Sylvie Rémondière
From - To Abst.ID
Title of the Presentation Speaker
16.00 – 16.20 430 Towards operational use of ERS SAR data for rice monitoring Thuy Le Toan
16.20 – 16.40 116 Analysis of multi-temporal and multi-incidence angle data for ricecrop using C band RADARSAT and ERS SAR data.
Manab Chakraborty
16.40 – 17.00 365 Rice Mapping using ERS SAR Data in Guangdong Province,China
Mike Wooding
17.00 – 17.20 372 An Operational Rice Field Mapping Tool using Spaceborne SARData
Eduard Dwyer
17.20 – 17.40 231 Rice Yield Estimation Using SAR Images, Meteorological Dataand GIS
Mika Karjalainen

ERS-ENVISAT SYMPOSIUMGöteborg, 16-20 October 2000
SEA FEATURES
Chair: Richard OlsenCo-Chair: Andrea Petrocchi
From - To Abst.ID
Title of the Presentation Speaker
9.00 – 9.20 221 Multisensor Observations of Internal Waves and their effects inthe Bay of Biscay.
Jose da Silva
9.20 – 9.40 270 Identification and classification of mesoscale ocean features onERS SAR imagery
KonstantinLitovchenko
9.40 – 10.00 245 Manifestations of Sea Currents and Eddies in ERS-SAR Imagesof the Bering Strait
Olga Lavrova
10.00 – 10.20 246 Internal waves in the Andaman Sea, new results from ERS SARand other sensors
robert Potter
10.20 – 10.40 364 Multi-year ERS observations of ocean circulation features alongthe coast of Northern Norway
Richard Olsen
10.40 – 11.00 Coffee Break
11.00 – 11.20 1412 Nonlinear Internal Waves in the South of China Sea Ming-K. Hsu
Posters
Abst.ID
Title of the Poster Presenter
389 The use of ERS-1/2 SAR to the study of ocean surface features inthe Gulf of California Mexico
A. Martínez-Díaz-de-León
292 Detection and Interpretation of Oceanic and AtmosphericSignatures in Spaceborne Radar Imagery of the North-WesternPacific
Olga Lavrova
222 On the variety of IW radar observations in the Ocean. 1. Slick-like signatures.
Jose da Silva
223 On the variety of IW radar observations in the Ocean. 2. Rip-likesignatures.
Jose da Silva

ERS-ENVISAT SYMPOSIUMGöteborg, 16-20 October 2000
SEA ICE 1
Chair: Benjamin HoltCo-Chair: Ola Grabak
From - To Abst.ID
Title of the Presentation Speaker
14.20 – 14.40 40 Arctic Ice Thickness from ERS1/2 Radar Altimetry Seymour Laxon
14.40 – 15.00 19 SAR, SSMI and numerical model characterisation of ArcticOcean coastal polynyas
Sverre Thune Dokken
15.00 – 15.20 239 Sea and lake ice studies in the Northwestern Russia using ERSSAR and other satellite data
Vitali Alexandrov
15.20 – 15.40 243 ERS SAR Data Application Use for Studying Sea Ice Parametersand Retrieving of Greenland Seals Migration
Vladimir Melentyev
15.40 – 16.00 317 Mapping Sea Ice Thickness with RADARSAT and a Helicopter-borne Electromagnetic-Induction System
Ingrid Peterson
16.00 – 16.20 Coffee Break
Posters
Abst.ID
Title of the Poster Presenter
119 Seasonal ERS SAR studies of sea ice in the Pechora and Kara Searegion
Maria Lundhaug
172 Sea Ice Algorithm Validation and Improvement by Multi-SensorAnalysis.
Lars Kaleschke
305 Seasonal Characteristics of Antarctic Sea Ice Backscatter Stefan Voss
319 Analysis of multi-polarmetric SAR imagery from the Kara Sea Richard Hall
300 Sea Ice Interpretation Manual for SAR images Stein Sandven
249 Extension and Types of Sea Ice with the ERS-1 Scatterometry inSurroundings of the Antarctic Peninsula
Rudolf Greku

ERS-ENVISAT SYMPOSIUMGöteborg, 16-20 October 2000
SEA ICE 2
Chair: Preben GudmansenCo-Chair: Ola Grabak
From - To Abst.ID
Title of the Presentation Speaker
16.20 – 16.40 409 Lincoln Sea and Nares Strait - a remote sensing study Preben Gudmandsen16.40 – 17.00 303 Satellite Ice Monitoring for Navigation of an ice-going tanker in
the Kara SeaStein Sandven
17.00 – 17.20 506 Operational Use of Satellite SAR for Sea Ice Monitoring inCanada - Past Experience and Future Possibilities
Dean Flett
17.20 – 17.40 516 Sea Ice Thickness from SAR-derived Kinematics Benjamin Holt
17.40 – 18.00 160 Extraction of Sea Ice Parameters from Imagette Data Thomas Koenig
18.00 – 18.20 74 SImA - A Software System for Motion Analysis in SatelliteImage Sequences
Roland Neumann /Rene Bartholomae
18.20 – 18.40 436 SAR Sea Ice Concentration in Baltic Sea Verified by AlbedoMeasurements
Maria Lundin
18.40 – 19.00 302 Satellite studies of ocean fronts and eddies for deepwaterdevelopment in the Norwegian Sea
Stein Sandven

ERS-ENVISAT SYMPOSIUMGöteborg, 16-20 October 2000
SERVICES AND MARKET
Chair: Steve CoulsonCo-Chair: Philippe Bally
From - To Abst.ID
Title of the Presentation Speaker
9.00 – 9.20 ESA E.O. Data User Programme Olivier Arino
9.20 – 9.40 158 The ERS oil-spill research project in New Zealand:demonstrations to the commercial market
Stella Belliss
9.40 – 10.00 1106 waveclimate.com the online offshore-climate assessment tool Han Wensink
10.00 – 10.20 370 National-scale DEM Generation using ERS Tandem Data inAlpine Regions
Carla Poidomani
10.20 – 10.40 28 SAGA - Satellite data and Geoinformation for Agrologistics Bernd Schieche
10.40 – 11.00 Coffee Break
11.00 – 11.20 382 Support to the evaluation of the short-term exploitationopportunities for ERS data within the agribusiness market
Judith Johnston
11.20 – 11.40 428 Fast damages assessment from EO data for assistance to reliefoperations after major natural disasters
Richard Guillande
11.40 – 12.00 412 Advanced SAR/Optical Remote Sensing Techniques for ForestryApplications: A Case Study in Sarawak (Malaysia)
Edmond Nezry
12.00 – 12.20 482 ESA Mission Marketing Activities. The E.M.M.A. offer for thedevelopment of the ERS and ENVISAT market.
Andrea Celentano
12.20 – 12.40 486 Commercial distribution of ERS and ENVISAT products andservices
Alain Hirschfeld
12.40 – 13.00 ESA E.O. Market Development Steve Coulson
Posters
Abst.ID
Title of the Poster Presenter
51 GAMMA SAR and Interferometric Processing Software Charles Werner
1406 SAR products for all: Rent-a-RAPIDS Niek Schaap

ERS-ENVISAT SYMPOSIUMGöteborg, 16-20 October 2000
FORESTRY: SIBERIA
Chair: Christiane SchmulliusCo-Chair: Henri laur
From - To Abst.ID
Title of the Presentation Speaker
9.00 – 9.20 473 ERS Interferometric Processing for Boreal Forest Applications Achim Roth
9.20 – 9.40 410 JERS-1 INSAR coherence over Siberian boreal forest Andreas Wiesmann
9.40 – 10.00 429 Assessing ERS and JERS SAR information content for large scaleforestmapping in Siberia
Thuy Le Toan
10.00 – 10.20 70 The classification procedure in SIBERIA: rationale andmethodology
Shaun Quegan
10.20 – 10.40 334 Global forest classification using JERS and tandem ERS data Adrian Luckman
10.40 – 11.00 Coffee Break
11.00 – 11.20 328 Accuracy assessment issues in the SIBERIA project Shaun Quegan
11.20 – 11.40 461 Russian Forest Inventory Requirements and Remote SensingParameters-Operational Aspects evolving from the SIBERIAProject
Christiane Schmullius
Posters
Abst.ID
Title of the Poster Presenter
463 Generating a universal forest ground- truth catalogue for RemoteSensing applications to Forest Observation
Christine Schmullius
464 Automated Training-Site Selection based on a Coherence Modelfor Forest Classification in the SIBERIA Project
Christine Schmullius
465 A Comparision of SAR-Interferomety- and cartographicallygenerated Digital Elevation Models by errors, accuracies andextracted hydrographic features
Christine Schmullius

ERS-ENVISAT SYMPOSIUMGöteborg, 16-20 October 2000
SEA SURFACE TEMPERATURE
Chair: Ian BartonCo-Chair: Philippe Goryl
From - To Abst.ID
Title of the Presentation Speaker
11.00 – 11.20 129 The relationship between in situ and Satellite Sea SurfaceTemperatures in the South-western Atlantic Ocean.
Ronald Souza
11.20 – 11.40 115 ATSR maps coral bleaching on Australia's Great Barrier Reef Ian Barton
11.40 – 12.00 127 Changes in Sea level, sea surface temperature and sea surfacepressure from Satellites - The impact of ERS and ENVISAT
Ole Andersen
Posters
Abst.ID
Title of the Poster Presenter
31 Conversion of ATSR-2 skin sea surface temperatures to bulktemperature for use in climate studies.
Anne O'Carroll
278 ATSR-SST in enclosed basins - a case study in the Baltic sea Bertil Hakansson
80 Sea Surface Temperature and chlorophyll-a Correlation Index:Seasonal variability on Iberian Margin.
J. M. Torres Palenzuela

ERS-ENVISAT SYMPOSIUMGöteborg, 16-20 October 2000
TOPOGRAPHY
Chair: Philippa BerryCo-Chair: Steve Coulson
From - To Abst.ID
Title of the Presentation Speaker
9.00 – 9.20 173 ENVISAT RA-2: Potential For Land Topographic Mapping Philippa Berry
9.20 – 9.40 341 The LANDMAP project for the Automated Creation andValidation of multi-resolution orthorectified satellite imageproducts and a 1" DEM of the British Isles from ERS tandemSAR interferometry.
Jan-Peter Muller
9.40 – 10.00 91 Evaluation of Methods used in Assessing the Accuracy of InSARderived DEMs
Premalatha Balan
10.00 – 10.20 343 Using the LANDMAP British Isles 1" IfSAR DEM forHydrological Network Derivation.
Alec Walker
10.20 – 10.40 380 DTM production by fusion of mixed sar and optical image data Thierry Laurencot
10.40 – 11.00 Coffee Break
11.00 – 11.20 507 Geomorphological and Geological Validation of Digital TerrainModels processed from spatial imagery. Applications in thePyrennees (S France) and E Sénégal (W Africa)
Benoit Deffontaines
11.20 – 11.40 130 Automated tiepoint retrieval through heteromorphic imagesimulation for spaceborne SAR sensors
David Small
11.40 – 12.00 258 ERS Georeferencing Precision Andy Smith
Posters
Abst.ID
Title of the Poster Presenter
141 ACE: A new 30" GDEM incorporating satellite altimeter derivedheights
Philippa Berry

ERS-ENVISAT SYMPOSIUMGöteborg, 16-20 October 2000
VEGETATION AND AGRICULTURE
Chair: Henning SkriverCo-Chair: Juerg Lichtenegger
From - To Abst.ID
Title of the Presentation Speaker
14.40 – 15.00 107 Global scale monitoring of soil and vegetation with ERS WindScatterometer and SSM/I
Paolo Pampaloni
15.00 – 15.20 183 Interpretation of ERS WSC time series over Sahel during theperiod 1991-1999
Lionel Jarlan
15.20 – 15.40 393 Relating ERS Scatterometer Data to Global Vegetation Models Maged Abdel-Messeh15.40 – 16.00 304 Tree shape description for backscattering modelling of LAI Terhikki Manninen
16.00 – 16.20 Coffee Break
16.20 – 16.40 79 ERS Data use for wide-area sampling of agricultural areas: ImageLogic for Cereal Monitoring.
Guido Lemoine
16.40 – 17.00 176 Crops classification in southern Sweden with multitemporal ERS-2 SAR data
Xuetang Xie
17.00 – 17.20 323 Land-use mapping using airborne polarimetric SAR Henning Skriver
17.20 – 17.40 408 Amazonia Bio-diversity Estimation using remote sensing andindigenous taxonomy
Luigi Fabbro
Posters
Abst.ID
Title of the Poster Presenter
138 An inversion model of ERS2 Radar data to retrieve wildvegetation cover in semi-arid regions
Mehrez Zribi
435 Biomass Monitoring with SAR Paul Snoeij
515 CAESAR: Crop area estimation using SAR images F Mediavilla de Diego

ERS-ENVISAT SYMPOSIUMGöteborg, 16-20 October 2000
WIND AND WAVES 1
Chair: Susanne LehnerCo-Chair: Andrea Bellini
From - To Abst.ID
Title of the Presentation Speaker
9.00 – 9.20 113 Wind Speed and SWH Calibration for Radar Altimetry in theNorth Sea
Tilo Schoene
9.20 – 9.40 342 Use of ERS-2 Altimeter Wind/Wave Data for the Validation ofSea State Models
Jean Michel Lefevre
9.40 – 10.00 157 Mesoscale Wind Fields Retrieved from RADARSAT-1 ScanSARin View of ENVISAT ASAR
Jochen Horstmann
10.00 – 10.20 301 ERS SAR wind retrieval in the marginal ice zone Birgitte Furevik
10.20 – 10.40 315 Near Real-time Sea-surface Winds from ERS Synthetic ApertureRadar (SAR) Data
Tony Bauna
10.40 – 11.00 Coffee Break
11.00 – 11.20 163 High Resolution Wind Fields and their Variation Extracted fromERS SAR
Jochen Horstmann
11.20 – 11.40 480 The Ocean and Sea Ice Satellite Application Facility WindProduct
Tilly Driesenaar
11.40 – 12.00 102 A Physically-based Model of Ocean Backscatter for Wind Speedretrieval from SAR, Scatterometer and Altimeter.
Graham Quartly
12.00 – 12.20 275 Tracking of Tropical Cyclones with the ERS Scatterometer:Algorithm Performances and post-processed data examples.
Raffaele Crapolicchio
12.20 – 12.40 359 Use of scatterometer wind data in ECMWF's assimilation system Lars Isaksen
Posters
Abst.ID
Title of the Poster Presenter
64 Quality of long term satellite wind and wave measurements Pierre Queffeulou
5 Internal Solitons Near Gibraltar: A Multi-Year Study Using ERS-1 & 2 SAR Imagery
John R. Apel
139 Validation of Wind Retrieval Algorithms from Spaceborne SAR. Flavio Parmiggiani 1404 A model for wind speed and wave height retrieval from radar
altimeter measurementsRosaria Della Rocca
1409 Operational use of ERS scatterometerdata at the NorwegianMeteorological Institute
Lars-Anders Breivik
1054 On the ERS scatterometer wind measurements accuracy: evidenceof seasonal and regional biasses
Yves Quilfen

ERS-ENVISAT SYMPOSIUMGöteborg, 16-20 October 2000
WIND AND WAVES 2
Chair: Werner AlpersCo-Chair: Andrea Bellini
From - To Abst.ID
Title of the Presentation Speaker
14.00 – 14.20 166 Global Observations of Wind Speed and Sea Surface Featuresusing SAR Wave Mode
Susanne Lehner
14.20 – 14.40 169 SAR Ocean Wave Inversion - A Hierarchic Approach J. Schulz-Stellenfleth14.40 – 15.00 16 A new composite model, including non-Bragg scattering effects
for the estimate of radar cross-section and Modulation TransferFunction, in wind-scatterometer and SAR conditions
Daniele Hauser
15.00 – 15.20 440 Improvement of the high resolution mesoscale atmospheric modelRAMS with ERS-SAR, for detailed sea surface windreconstruction of small scalephenomena
Alberto Ortolani
15.20 – 15.40 279 ENVISAR ASAR wave mode data simulated by ERS SAR Birgit Schaetller
15.40 – 16.00 6 Airborne polarimetric radar measurements in the context of thegeophysical validation of the ENVISAT ASAR products over theocean
Daniele Hauser
16.00 – 16.20 Coffee Break
16.20 – 16.40 508 Validation of Envisat ASAR Wave Mode Level 1 and Level 2Product Using ERS SAR Data
Harald Johnsen
16.40 – 17.00 23 Validation of ENVISAT SAR Wind Fields: Lessons from ERSand RADARSAT
Frank Monaldo
17.00 – 17.20 394 Comparisons of observed and modelled wave energy spectrausing ERS-2 SAR observations and the Met.Office wave model.
James Gunson
17.20 – 17.40 333 Waves and mixing in the coastal zone F. Ocampo-Torres
An operational service is provided by the Tromso Satellite Station (TSS) for high-resolution wind fieldobservation based on cross-spectral analysis. Current numerical models provide wind information at aresolution of 25 km while the new SAR wind service can give information at 12-km resolution. Preliminaryvalidations show that wind speed and direction can be provided with the following accuracy: wind speedrange 1-20 m/s: <2 m/s, wind direction <20 degrees. Other stations and customers should follow thisexample. There is a lot of potential interest in the European user community, only limited by the scarceavailability of the SAR scenes.
Results were presented for backscattering modeling of sea surface at various polarisation states. Althoughempirical models are commonly used to retrieve wind information the research progressed in developingphysically-based models to understand and to predict the behaviour of the radar cross-section in variousimaging configurations. In this context, a new model (semi-physical) which presents several newcharacteristics with respect to the classical 2-scales models has been presented. The model takes intoaccount non-Bragg scattering associated to the specular reflection of breaking waves.
Conclusions and RecommendationsThe impact of sea features (oil slicks, sea ice) in the imagette has been analysed and the development of ascheme which needs minimum a priori information deserves further investigations. This will require a largedataset allowing statistics for specific regions and seasons as well as collocated buoy measurements forvalidation.
From the TSS operational service, recommendations are given to combine the use of the cross-spectralproperties (decorrelation and phase) and backscatter measurements (CMOD).
Due to the overlapping swaths of ERS scatterometer and SAR wave mode data, a recommendation is givento collocate the imagettes with scatterometer data. This would allow to flag scatterometer datacontaminated with disturbing sea features like ice, oil slicks or low wind areas.
An algorithm to derive wind fields from RADARSAT data was presented. A similar ENVISAT ASAR500km x 500km wind product is required. Plans to have this as an official ESA product should beconsidered. Recommendations are given to assure continuity to ERS SAR wave mode observations. ASARwave mode data can be processed starting by ERS wave mode acquisitions. A message has been given toreprocess the ERS archive to ENVISAT-like data and to release the data for the scientific community.
Analyses of sources of errors in wind fields estimates were featured; calibration of SAR data is a majorissue. The propagation of the calibration error in the retrieval algorithm might lead to consistent wind speederrors. For the incidence angle it was shown that the best range for wind speed retrieval is above 30degrees.
For SAR high-resolution data, discussions were triggered by the analysis of the improvements in the windretrieval algorithms by using the polarisation-ratio and by some discrepancies observed. It is commonopinion that the availability of ENVISAT simultaneous dual-polarisation images will offer a uniqueopportunity to improve the general understanding and will give the opportunity to improve high-resolutionwind inversion techniques.

LIST OF PARTICIPANTSOMMITTEES
Last Name First Name Institute Country E-mail
Abbas Douglas CTH SWEDEN [email protected]
Abdel-Messeh Maged University of Sheffield (UK) UNITED KINGDOM [email protected]
Aben Ilse Space Research Organization Netherlands (SRON) NETHERLANDS [email protected]
Åkerman Daniel Nordpointer SIS/OM&M SWEDEN [email protected]
Alain Akono Les Technologies SOFTMAP CANADA [email protected]
Albani Mario ESA/ESRIN ITALY [email protected]
Albert Peter Free University Berlin GERMANY [email protected]
Al-Dousari Ahmad Kuwait Institute for Scientific Research KUWAIT [email protected]
Alexandrov Vitali Nansen International Environmental and Remote Sensing Center
RUSSIAN FEDERATION [email protected]
Alho Petteri Department of Geography, University of Turku FINLAND [email protected]
Alpers Werner Institute of Oceanography, University of Hamburg GERMANY [email protected]
Amlien Jostein Norwegian computing center NORWAY [email protected]
Andersen Ole Kort og matrikelstyrelsen Geodesy DENMARK [email protected]
Apel John R. Global Ocean Associates UNITED STATES [email protected]
Archer David Natural Resources Institute (University of Greenwich) UNITED KINGDOM [email protected]
Arculeo Daniele ESA/ESRIN ITALY [email protected]
Argentieri Aldo ESA/ESRIN ITALY [email protected]
Arino Olivier ESA/ESRIN ITALY [email protected]
List of Participants - ERS-Envisat Symposium
Last Name First Name Institute Country E-mail
Arnaud Alain Altamira Information - KINOA SPAIN [email protected]
Askne Jan Dept Radio and Space Science SWEDEN [email protected]
Astrom Sture ELSI-TECH AB SWEDEN [email protected]
Attema Evert ESA/ESTEC NETHERLANDS [email protected]
Aulamo Osmo Finnish Meteorological Institute Sodankylä Observatory FINLAND [email protected]
Avenius Malin Swedish Radio Freelance Reporter SWEDEN [email protected]
Azevedo Carlos Faculdade de Ciencias da Universidade do Porto PORTUGAL [email protected]
Bach Heike VISTA GmbH GERMANY [email protected]
Balan Premalatha University of Nottingham UNITED KINGDOM [email protected]
Bald-Kuehnen Ute Hugin GmbH GERMANY [email protected]
Bally Philippe ESA/ESRIN ITALY [email protected]
Bamber Jonathan Bristol Glaciology Centre, School of Geographical Sciences UNITED KINGDOM [email protected]
Bao Mingquan German Aerospace Center (DLR) Institute of Remote Sensing Technology
GERMANY [email protected]
Baratto Daniela Universita' degli studi di Pisa ITALY [email protected]
Barbieri Massimo ESA/ESRIN ITALY [email protected]
Bartholomä René University of Bremen - FB 3 - Computer Science Center of Computing Technology - Image Processing Department
GERMANY [email protected]
Bartoloni Antonio Telespazio ITALY [email protected]
Barton Ian CSIRO Marine Research AUSTRALIA [email protected]
Bauna Tony Tromsø Satellite Station AS NORWAY [email protected]
Bellini Andrea Vitrociset c/o ESA-ESRIN ITALY [email protected]
Belliss Stella Landcare Research New Zealand Ltd NEW ZEALAND [email protected]
Bennartz Ralf Free University Berlin GERMANY [email protected]
Last Name First Name Institute Country E-mail
Bentley Thomas Systems Engineering & Assessment Ltd. UNITED KINGDOM [email protected]
Benveniste Jerome ESA/ESRIN ITALY [email protected]
Berger Franz H. Dresden University of Technology IHM / Meteorology GERMANY [email protected]
Bergquist Karl ESA/HQ FRANCE [email protected]
Bernard Anne-Marie SPOT IMAGE FRANCE [email protected]
Berry Philippa De Montfort University UNITED KINGDOM [email protected]
Beysens Jeroen KNMI NETHERLANDS [email protected]
Bianchini Giovanni CNR/IROE ITALY [email protected]
Bidlot Jean-Raymond European Centre for Medium Range Weather Forecasts UNITED KINGDOM [email protected]
Birkett Charon NASA/GSFC UNITED STATES [email protected]
Birks Andrew Rutherford Appleton Laboratory UNITED KINGDOM [email protected]
Blaes Xavier UCL-MILA BELGIUM [email protected]
Blechschmied Heiko Dresden University of Technology GERMANY [email protected]
Blom Cornelis Forschungszentrum Karlsruhe (FZK), Institute for Meteorology and Climate Research
GERMANY [email protected]
Blonda Palma IESI-CNR ITALY [email protected]
Bobylev Leonid Nansen International Environmental and Remote Sensing Centre (NIERSC)
RUSSIAN FEDERATION [email protected]
Boccardo Piero DIGETPolitecnico di Torino ITALY [email protected]
Boerner Thomas DLR - Deutsches Zentrum fuer Luft- und Raumfahrt e.V., Oberpfaffenhofen
GERMANY [email protected]
Bogumil Konstanze Institute of Environmental Physics, University of Bremen, FB1 GERMANY [email protected]
Bojkov Bojan Norwegian Institute for Air Research (NILU) NORWAY [email protected]
Borde Regis Joint Research Center ITALY [email protected]
Borgeaud Maurice ESA/ESTEC - European Space Agency Electromagnetics Division ESTEC, TOS-EEP
NETHERLANDS [email protected]
Last Name First Name Institute Country E-mail
Borrell Peter P&PMB Consultants GERMANY [email protected]
Borrell Patricia P&PMB Consultants GERMANY [email protected]
Bortoli Daniele ISAO-CNR ITALY [email protected]
Bosquillon de Frescheville
François ESA/ESOC GERMANY [email protected]
Boyle Julie National Remote Sensing Centre Limited UNITED KINGDOM [email protected]
Braun Alexander GeoForschungsZentrum Potsdam (GFZ) GERMANY [email protected]
Brenner Anita Raytheon ITSS UNITED STATES [email protected]
Briggs Stephen ESA/ESRIN ITALY [email protected]
Brockmann Carsten Brockmann Consult GERMANY [email protected]
Brooker Guy VEGA Group Ltd UNITED KINGDOM [email protected]
Brown Ian Stockholm University SWEDEN [email protected]
Bruniquel Jerome Alcatel Space Industries FRANCE [email protected]
Buck Christopher ESA/ESTEC NETHERLANDS [email protected]
Bunnik N.J.J. Netherlands Remote Sensing Board NETHERLANDS [email protected] [email protected]
Buongiorno Alessandra ESA/ESRIN ITALY [email protected]
Burrows John Institute of Environmental Physics, University of Bremen GERMANY [email protected]
Busck Jens University of Copenhagen DENMARK [email protected]
Calabresi Gianna ESA/ESRIN ITALY [email protected]
Callies Joerg ESA/ESTEC METOP project NETHERLANDS [email protected]
Callinicos Elizabeth Southampton Oceanographic Centre UNITED KINGDOM
Campbell Gordon ESA/ESRIN ITALY [email protected]
Canela Marques Miguel ESA/ESTEC NETHERLANDS [email protected]
Last Name First Name Institute Country E-mail
Capes Ren NPA UNITED KINGDOM [email protected]
Carnec Claudie BRGM - ARN FRANCE [email protected]
Carrasco Daniel INDRA ESPACIO SPAIN [email protected]
Casadio Stefano SERCO c/o ESA/ESRIN ITALY [email protected]
Caspar Christophe ESA/ESRIN ITALY [email protected]
Castaldo Amedeo Eurimage ITALY [email protected]
Cataldo Mariangela Planetek Italia ITALY [email protected]
Celentano Andrea Eurimage SpA ITALY [email protected]
Cervino Marco ISAO-CNR ITALY [email protected]
Chance Kelly Harvard-Smithsonian Center for Astrophysics UNITED STATES [email protected]
Chapron Bertrand IFREMER FRANCE [email protected]
Cheney Margaret Lund University SWEDEN [email protected]
Chesworth Simon Radarsat International UNITED KINGDOM [email protected]
Clemente-Colón Pablo U.S. Dept. Commerce NOAA/NESDIS UNITED STATES [email protected]
Closa Josep ESA/ESRIN / Altamira ITALY [email protected]
Colagrande Paola Vitrociset c/o ESA/ESRIN ITALY [email protected]
Coldewey Melanie Institute for Environmental Physics GERMANY [email protected]
Coren Franco Istituto Nazionale di Oceanografia e di Geofisica Sperimentale - OGS-
ITALY [email protected]
Corlett Gary University of Leicester UNITED KINGDOM [email protected]
Costa Maria João ISAO-CNR ITALY [email protected]
Costantini Mario Telespazio S.p.A. ITALY [email protected]
Coulson Stephen ESA/ESRIN ITALY [email protected]
Last Name First Name Institute Country E-mail
Crapolicchio Raffaele SERCO S.p.A. ITALY [email protected]
Cretaux Jean-Francois LEGOS-GRGS/CNES FRANCE [email protected]
Csaplovics Elmar Department of Geosciences University of Dresden GERMANY [email protected]
Cudlip Wyn DERA UNITED KINGDOM [email protected]
Da Silva José University of Lisbon PORTUGAL [email protected]
Dabrowska - Zielinska
Katarzyna Institute of Geodesy and Cartography - Head of Remote Sensing Division
POLAND [email protected]
Dalen Øyvind Nansen Environmental and Remote Sensing Center NORWAY [email protected]
Dammert Patrik Ericsson Microwave Systems AB SWEDEN [email protected]
Davidson Malcolm CESBIO (Centre d'Etudes Spatiales de la Biosphere) FRANCE [email protected]
de Beek Rüdiger Institute of Environmental Physics/Remote Sensing University of Bremen
GERMANY [email protected]
de Groot Rolf Peter Space Research Organisation Netherlands (SRON) NETHERLANDS [email protected]
De Kok Roeland TUM MUNICH ITALY [email protected]
De Leeuw Gerrit TNO Physics and Electronics Laboratory NETHERLANDS [email protected]
De Winter-Sorkina Renata IMAU, Utrecht University NETHERLANDS [email protected]
Debie Herman VITO BELGIUM [email protected]
Dechambre Monique CETP/CNRS/UVSQ FRANCE [email protected]
Deffontaines Benoit CNRS-UPMC FRANCE [email protected]
Dehn Angelika ESA/ESRIN ITALY [email protected]
Della Rocca Maria Rosaria Universitá degli Studi di Salerno - Dipartimento di Ingegneria Civile
ITALY [email protected]
Delwart Steven ESA/ESTEC NETHERLANDS [email protected]
Demuth Dietmar ASTRIUM GmbH GERMANY [email protected]
Derauw Dominique Centre Spatial de Liège BELGIUM [email protected]

Last Name First Name Institute Country E-mail
Deroin Jean-Paul INSTITUT EGID-BORDEAUX 3 FRANCE [email protected]
Desnos Yves-Louis ESA/ESRIN ITALY [email protected]
Di Domenico Luciana Eurimage SpA ITALY [email protected]
Ditlevsen Eva Howe Department of Geophysics University of Copenhagen DENMARK [email protected]
Doake Christopher British Antarctic Survey UNITED KINGDOM [email protected]
Dodd Mike MacDonald Dettwiler CANADA [email protected]
Doherty Mark ESA/ESRIN ITALY [email protected]
Dokken Sverre Thune Chalmers University of Technology SWEDEN [email protected]
Dorandeu Joël CLS FRANCE [email protected]
Dowson Monica De Montfort University Leicester UK UNITED KINGDOM [email protected]
Driesenaar Tilly KNMI Satellite Data Department NETHERLANDS [email protected]
Duchesnay Jacques AVEC VOUS FRANCE [email protected]
Duesmann Berthyl ESA/ESTEC NETHERLANDS [email protected]
Dwyer Ned Sarmap s.a. SWITZERLAND [email protected]
Edwards Marianne Space Research Centre, University of Leicester UNITED KINGDOM [email protected]
El Serafy G. Royal Netherlands Meteorological Institute NETHERLANDS [email protected]
Elbern Hendrik Institute for Geophysics and Meteorology (EURAD) University of Cologne
GERMANY [email protected]
Elgered Gunnar Chalmers University of Technology SWEDEN [email protected]
Enell Carl-Fredrik Institutet för Rymdfysik SWEDEN [email protected]
Enoksen Rolf Terje Tromsoe Satellite Station NORWAY [email protected]
Eriksson Bjoern ESA/ESOC GERMANY [email protected]
Eriksson Patrick Dept. Radio and Space Science Chalmers University of Technology
SWEDEN [email protected]
Last Name First Name Institute Country E-mail
Eriksson Leif Dept. of Geography-Geoinformatics Friedrich-Schiller University GERMANY
Eskes Henk KNMI NETHERLANDS [email protected]
Ezraty Robert IFREMER FRANCE [email protected]
Fabbri Katia Vitrociset S.p.A. Space Division ITALY [email protected]
Fabbro Luigi Associacao Amazonia ITALY [email protected]
Fanelli Attilio Dept. Scienza e Ingegneria dello Spazio "Luigi G. Napolitano" University of Naples "Federico II"
ITALY [email protected]
Farrow John International Space University (ISU) FRANCE [email protected]
Fea Maurizio ESA/ESRIN ITALY [email protected]
Fellah Kader SERTIT FRANCE [email protected]
Femenias Pierre ESA/ESRIN-APP-ADQ ITALY [email protected]
Fenoglio-Marc Luciana Institute of Physical Geodesy, Technical University Darmstadt GERMANY [email protected]
Fensholt Rasmus Istitute of Geography,University of Copenhagen, Denmark DENMARK [email protected]
Fernandes Joana Faculdade de Ciências, Universidade do Porto PORTUGAL [email protected]
Fernando Nick Research Systems UNITED KINGDOM [email protected]
Filippi Paola Research Systems Italia ITALY [email protected]
Fischer Herbert Research Center Karlsruhe/University Karlsruhe GERMANY [email protected]
Fitoussi Geraldine KINOA FRANCE [email protected]
Flett Dean Canadian Ice Service CANADA [email protected]
Fonteyn Dominique BIRA-IASB BELGIUM [email protected]
Forsberg Rene KMS DENMARK [email protected]
Francis Richard ESA/ESTEC NETHERLANDS [email protected]
Frauenberger Olaf Space Systems Finland Ltd. FINLAND [email protected]
Last Name First Name Institute Country E-mail
Frerick Johannes ESA/ESTEC NETHERLANDS [email protected]
Frette Øyvind University of Bergen, Department of Physics NORWAY [email protected]
Fruneau Benedicte Institut Francilien des GeosciencesUniversite de Marne-la-Vallee
FRANCE [email protected]
Furevik Birgitte Nansen Environmental and Remote Sensing Center NORWAY [email protected]
Furrer Cristina Sarmap S.A. SWITZERLAND [email protected]
Fusco Adele University of Benevento ITALY [email protected]
Gade Martin Universität Hamburg Institut für Meereskunde GERMANY [email protected]
Gagliardi Leonardo Telespazio ITALY [email protected]
Galle Bo Chalmers University of Technology SWEDEN [email protected]
Galli Luca Advanced Computer Systems ITALY [email protected]
Gamba Paolo Department of Electronics, University of Pavia ITALY [email protected]
Geyer Andreas Inorganic Environmental ChemistryChalmers University
SWEDEN [email protected]
Gilles Pascal ESA/ESRIN ITALY [email protected]
Gleason James NASA Goddard Space Flight Center UNITED STATES [email protected]
Godefroy Madeleine EARSeL FRANCE [email protected]
Goede Albert Space Research Organisation Netherlands (SRON) NETHERLANDS [email protected]
Gomarasca Mario A. CNR IRRS Telerilevamento ITALY [email protected]
Gomez-Enri Jesus ESA/ESRIN ITALY [email protected]
Gonzales Pablo INDRA ESPACIO SPAIN [email protected]
Goryl Philippe ESA/ESRIN ITALY [email protected]
Grabak Ola ESA/ESRIN ITALY [email protected]
Gray Laurence Canada Centre for Remote Sensing CANADA [email protected]
Last Name First Name Institute Country E-mail
Greco Bruno ESA/ESRIN ITALY [email protected]
Greku Rudolf Institute of Geological Sciences of NASU UKRAINE [email protected]
Grey William University of Wales Swansea UNITED KINGDOM [email protected]
Grøncs Einar Kongsberg Spacetec NORWAY [email protected]
Gruszczynska Maria Institute of Geodesy and Cartography POLAND [email protected]
Guccione Pietro DEE - Politecnico di Bari ITALY [email protected]
Gudmandsen Preben NPOC-Denmark DENMARK [email protected]
Guerre Louis-François Spot Image FRANCE [email protected]
Guertin Florian Canada Centre for Remote Sensing CANADA [email protected]
Gulde Thomas Institut für Meteorologie und Klimaforschung Forschungszentrum Karlsruhe
GERMANY [email protected]
Gunson James The Met.Office UNITED KINGDOM [email protected]
Haardeng-Pedersen Gary Sir Wilfred Grenfell College, Memorial University of Newfoundland
CANADA [email protected]
Hahne Achim ESA/ESTEC NETHERLANDS [email protected]
Hakansson Bertil Swedish Meteorological and Hydrological Institute SWEDEN [email protected]
Hall Richard Scott Polar Research Institute UNITED KINGDOM [email protected]
Hallikainen Martti Helsinki University of Technology Laboratory of Space Technology
FINLAND [email protected]
Halpern David Jet Propulsion Laboratory UNITED STATES [email protected]
Harscoat Valerie Ifremer Département d'Océanographie Spatiale FRANCE [email protected]
Hartmann H.W. Space Research Organisation Netherlands NETHERLANDS [email protected]
Hauser Daniele Centre d'Etudes des Environnements Terrestres et Planétaires (CNRS/Universite de Versailles)
FRANCE [email protected]
Hayman Garry National Environmental Technology Centre AEA Technology plc UNITED KINGDOM [email protected]
Hesselmans Gerard ARGOSS NETHERLANDS [email protected]
Last Name First Name Institute Country E-mail
Hild Lars Institute of Environmental Physics University of Bremen GERMANY [email protected]
Hilgers Siegfried Remote Sensing Technology Institute German Aerospace Center
GERMANY [email protected]
Hilton Richard De Montfort University UNITED KINGDOM [email protected]
Hirschfeld Alain SPOT IMAGE FRANCE [email protected] [email protected]
Hochschild Volker Institut fuer Geographie Friedrich-Schiller-Universitaet Jena GERMANY [email protected]
Hoeyer Jacob Kort og Matrikelstyrelsen DENMARK [email protected]
Hofer Peter Swiss Federal Laboratories for Materials Testing and Research (EMPA)
SWITZERLAND [email protected]
Holt Benjamin Jet Propulsion Laboratory UNITED STATES [email protected]
Hong Zhang Institute of Remote Sensing Applications, Chinese Academy of Sciences
CHINA [email protected]
Horstmann Jochen GKSS Research Center GERMANY [email protected]
Houghton Nigel CLRC UNITED KINGDOM [email protected]
Iavarone Ferdinando Advanced Computer Systems SpA ITALY [email protected]
Ibrahim Hussein G.O.R.S. SYRIA [email protected]
Isaksen Lars ECMWF UNITED KINGDOM [email protected]
Ivanov Andrei Yu P.P.Shirshov Institute of Oceanology,Russian Academy of Sciences
RUSSIAN FEDERATION [email protected]
Jacobsen Sine Munk Department of Geophysics University of Copenhagen DENMARK [email protected]
Jalota Lalit Vega Group plc UNITED KINGDOM [email protected]
Jansson Johan Department of Meteorology, Stockholm University (MISU) SWEDEN [email protected]
Jarlan Lionel CESBIO (CNES/CNRS/UPS) (Centre d'Etudes Spatiales de la Biosphere)
FRANCE [email protected]
Jeker Dominique Swiss Federal Laboratories for Materials Testing and Research (EMPA)
SWITZERLAND [email protected]
Jia Li Alterra green world research NETHERLANDS [email protected]
Jimenez Carlos RSGChalmers University of Technology
SWEDEN [email protected]
Last Name First Name Institute Country E-mail
Jöborn Anna County administration of Västra Götaland SWEDEN [email protected]
Johannessen Johnny Nansen Environmental and Remote Sensing Center NORWAY [email protected]
Johnsen Harald Norut IT NORWAY [email protected]
Johnston Judith National Remote Sensing Centre Limited UNITED KINGDOM [email protected]
Jørgensen Rita Nordahl Tromsø Satellite Station NORWAY [email protected]
Jutz Simon ESA/ESRIN ITALY [email protected]
Kaifel Anton Center for Solar Energy and Hydrogen Research GERMANY [email protected]
Kamie Kitmitto University of Manchester UNITED KINGDOM [email protected]
Karamali Lia European Commission DG JRS SAI ITALY [email protected]
Karjalainen Mika Finnish Geodetic Institute Department of Photogrammetry and Remote Sensing
FINLAND [email protected]
Karszenbaum Haydee Instituto de Astronomia y Fisica del Espacio (IAFE) (Astronomy and Space Physics Institute)
ARGENTINA [email protected]
Käyhkö Jukka Department of Geography FINLAND [email protected]
Keller Johannes Paul Scherrer Institute SWITZERLAND [email protected]
Kenyi Lado-Wani Joanneum Research,Institute of Digital Image Processing AUSTRIA [email protected]
Kervyn François Royal Museum for Central Africa BELGIUM [email protected]
Keyte Gordon Defence Evaluation and Research Agency (DERA) UNITED KINGDOM [email protected]
Knudsen Per KORT & MATRIKELSTYRELSEN DENMARK [email protected]
Koenig Max Norsk Polarinstitutt NORWAY [email protected]
Koenig Thomas Deutsches Zentrum fuer Luft- und Raumfahrt e.V. Institut fuer Methodik der Fernerkundung
GERMANY [email protected]
Kohlhammer Gunther ESA/ESRIN ITALY [email protected]
Kontoes Charalabos Institute for Space Applications and Remote Sensing National Observatory of Athens
GREECE [email protected]
Koopman Robert ESA/ESRIN ITALY [email protected]
Last Name First Name Institute Country E-mail
Koskinen Lasse Finnish Meteorological Insititute FINLAND [email protected]
Kosmann Detlev DLR German Remote Sensing Data Center GERMANY [email protected]
Krätzschmar Elke HUGIN GmbH GERMANY
Kucheryavenkova Irina Institute of Radioengineering and Electronics, Russian Academy of Sciences
RUSSIAN FEDERATION [email protected]
Kudashev Efim Space Research Institute Russian Academy of Sciences RUSSIAN FEDERATION [email protected]
Kühnen Andreas HUGIN GmbH GERMANY [email protected]
Kyllergård Christer Swedish Space Corporation SWEDEN [email protected]
Lahoz William CGAM, Department of Meteorology UNITED KINGDOM [email protected]
Lamberti Fiorella DATAMAT S.p.A. ITALY [email protected]
Lang Oliver German Aerospace Center DLR German Remote Sensing Data Center DFD
GERMANY [email protected]
Langham Edward Canadian Space Agency CANADA [email protected]
Laur Henri ESA/ESRIN ITALY [email protected]
Laurencot Thierry Thomson-CSF / ISR FRANCE [email protected]
Lavrova Olga Space Research Institute of Russian Academy of sciences RUSSIAN FEDERATION [email protected]
Laxon Seymour University College London UNITED KINGDOM [email protected]
Lazzary Franko Foreign Press Corr. SWEDEN
Le Gall Frédéric ESA/ESRIN ITALY [email protected]
Le Toan Thuy CESBIO (Centre d'Etudes Spatiales de la Biosphere) FRANCE [email protected]
Lecomte Pascal ESA/ESRIN ITALY [email protected]
Lee-Bapty Ian Defence Evaluation and Research Agency, UK UNITED KINGDOM [email protected]
Lefevre Jean Michel METEO FRANCE FRANCE [email protected]
Lehner Susanne German Aerospace Center GERMANY [email protected]
Last Name First Name Institute Country E-mail
Lelkes Miklós Institute of Geodesy, Cartography and Remote Sensing Remote Sensing Centre
HUNGARY [email protected]
Lemke Peter Institute of Marine Research GERMANY [email protected]
Lemoine Guido JRC - SAI ITALY [email protected]
Leone Elia ESA/ESRIN ITALY [email protected]
Leppelmeier Gilbert W. G & S Associates FINLAND [email protected]
Levrini Guido ESA/ESTEC NETHERLANDS [email protected]
Li Zhao-Liang Laboratoire des Sciences de l'Image, de l' Informatique et de la Teledetection, Universite Louis Pasteur
FRANCE [email protected]
Lichtenberger Ja'nos Space Research Group, Dept. of Geophysics, Eövös University HUNGARY [email protected]
Lichtenegger Juerg ESA/ESRIN ITALY [email protected]
Lillibridge John NOAA/NESDIS Lab. for Satellite Altimetry UNITED STATES [email protected]
Liu Antony NASA UNITED STATES [email protected]
Louet Jacques ESA/ESTEC NETHERLANDS [email protected]
Loyola Diego German Aerospace Center (DLR) Remote Sensing Technology Institute (MF-AP)
GERMANY [email protected]
Lu Zhong Raytheon STX Corporation, U.S. Geological Survey, EROS Data Center
UNITED STATES [email protected]
Luckman Adrian University of Wales, Swansea UNITED KINGDOM [email protected]
Lukowski Tom Canada Centre for Remote Sensing CANADA [email protected]
Lundhaug Maria Nansen Environmental and Remote Sensing Center NORWAY [email protected]
Lundin Maria Swedish Meteorological and Hydrological Institute SWEDEN [email protected]
Lundqvist Tommy Swedish Space Corporation SWEDEN [email protected]
Luo Xianyun Department of Radio and Space Science Chalmers University of Technology
SWEDEN [email protected]
Lyberis Nikos Université Pierre et Marie Curie FRANCE [email protected]
MacRae Isabell Atlantis Scientific Inc. CANADA [email protected]
Last Name First Name Institute Country E-mail
Maddonni Roberta ESA/ESRIN ITALY [email protected]
Manninen Terhikki VTT Automation, Remote Sensing FINLAND [email protected]
Marchetti Pier Giorgio ESA ESRIN ITALY [email protected]
Marcopoulos Johan Swedish National Space Board SWEDEN [email protected]
Martin Carmen Indra Espacio SPAIN [email protected]
Martínez-Benjamin Juan José UNIVERSITAT POLITECNICA DE CATALUNYA SPAIN [email protected]
Martini Annalisa ESA/ESRIN ITALY [email protected]
Massmann Franz-Heinrich GeoForschungsZentrum Potsdam (GFZ) GERMANY [email protected]
Mastracci Claudio ESA/HQ FRANCE [email protected]
Mattia Francesco Istituto di Tecnologia Informatica Spaziale (ITIS)-CNR ITALY [email protected]
Maurellis Ahilleas Space Research Organization of the Netherlands NETHERLANDS [email protected]
Mauser Wolfram Institute for Geography, University of Munich GERMANY [email protected]
Meadows Peter BAE SYSTEMS Advanced Technology Centre UNITED KINGDOM [email protected]
Medri Roberto ACS ITALY [email protected]
Melentyev Vladimir Nansen International Environmental and Remote Sensing Centre (NIERSC)
RUSSIAN FEDERATION [email protected]
Mering Catherine Université Paris 7 Denis Diderot FRANCE [email protected]
Metsämäki Sari Finnish environment institute FINLAND [email protected]
Meyer Jerome Institute of Environmental Physics University of Bremen GERMANY [email protected]
Michel Rémi Commissariat à l'Energie Atomique FRANCE [email protected]
Miller Heinz Alfred Wegener Institute GERMANY [email protected]
Minnett Peter University of Miami UNITED STATES [email protected]
Mitiaguina Marina Space Research Institute of Russian Academy of Sciences RUSSIAN FEDERATION [email protected]

Last Name First Name Institute Country E-mail
Mitnik Leonid Pacific Oceanological Institute, Far Eastern Branch, Russian Academy of Sciences
RUSSIAN FEDERATION [email protected]
Mohr Johan Jacob Danish Center for Remote Sensing Dept. of Electromagnetic Systems
DENMARK [email protected]
Molina Iñigo Escuela Universitaria de Ing. Téc. Topográfica, Universidad Politécnica de Madrid
SPAIN [email protected]
Monjoux Eric ESA/ESRIN ITALY [email protected]
Monti Guarnieri Andrea Dipartimento di Elettronica e Informazione Politecnico di Milano ITALY [email protected]
Moore Philip Department of Geomatics University of Newcastle-upon-Tyne UNITED KINGDOM [email protected]
Morgia Franca ESA/ESRIN ITALY [email protected]
Morley Jeremy Dept. Geomatic Engineering, University College London UNITED KINGDOM [email protected]
Morse Elizabeth RMIT University AUSTRALIA [email protected]@rmit.edu.au
Morten David NPA GROUP UNITED KINGDOM [email protected]
Mueller Martin Center for Solar Energy and Hydrogen Research GERMANY [email protected]
Muller Christian Belgian Institute for Space Aeronomy BELGIUM [email protected]
Muller Jan-Peter University College London UNITED KINGDOM [email protected]
Munro Rosemary EUMETSAT GERMANY [email protected]
Murtagh Donal Meteorologiska Istitutionen, Stockholms Universitet SWEDEN [email protected]
Mutlow Christopher Rutherford Appleton Laboratory UNITED KINGDOM [email protected]
Nett Herbert ESA/ESTEC NETHERLANDS [email protected]
Neumann Roland University of Bremen - FB 3 - Computer Science Center of Computing Technology - Image Processing Department
GERMANY [email protected]
Nezry Edmond PRIVATEERS N.V. Private Experts in Remote Sensing FRANCE [email protected]
Nilsson Maria Swedish National Space Board SWEDEN [email protected]
Nirchio Francesco Italian Space Agency ITALY [email protected]
Noel Stefan Institute of Remote Sensing/Environmental Physics, University of Bremen
GERMANY [email protected]
Last Name First Name Institute Country E-mail
O Clerigh Eoin Eoin O Clerigh IRELAND [email protected]
Ocampo-Torres Francisco Department of Physical Oceanography, CICESE MEXICO [email protected]
O'Carroll Anne The Met. Office UNITED KINGDOM [email protected]
Oelhaf Hermann Institut für Meteorlogie und Klimaforschung, Forschungszentrum Karlsruhe GmbH (IMK/FZK)
GERMANY [email protected]
Ofverholm Ivan Saab Ericsson Space SWEDEN [email protected]
Ohlson Byörn Swedish Space Corporation SWEDEN [email protected]
Olsen Richard Norwegian Defence Research Establishment NORWAY [email protected]
O'Neill Alan NERC Centre for Global Atmospheric Modelling University of Reading
UNITED KINGDOM [email protected]
Ortolani Alberto Lamma ITALY [email protected]
Özalp Tamer TÜBITAK(The Scientific and Technical Research Council of Turkey)YDABCAG
TURKEY [email protected]
Paganini Marc ESA/ESRIN ITALY [email protected]
Palazzo Francesco SERCO ITALY [email protected]
Palenzuela Jesus University of Vigo SPAIN [email protected]
Paloscia Simonetta CNR/IROE ITALY [email protected]
Pampaloni Paolo CNR-IROE ITALY [email protected]
Paniconi Claudio CRS4 (Center for Advanced Studies, Research and Development in Sardinia)
ITALY [email protected]
Parisse Maurizio University of Rome, Italy ITALY [email protected]
Parlow Eberhard Inst. of. Meteorology, Climatology and Remote sensing University Basel
SWITZERLAND [email protected]
Parmiggiani Flavio ISAO-CNR ITALY [email protected]
Parsons Barry University of Oxford UNITED KINGDOM [email protected]
Pasquali Paolo Sarmap s.a. SWITZERLAND [email protected]
Paulsen Torgeir ESA/ESTEC NETHERLANDS [email protected]
Last Name First Name Institute Country E-mail
Pearson Tim RSAC Ltd UNITED KINGDOM [email protected]
Pedersen Jan Petter Tromsø Satellite Station NORWAY [email protected]
Peltzer Gilles Jet Propulsion Laboratory, California Institute of Technology UNITED STATES [email protected]
Perez-Burgos Ana University of Valladolid SPAIN [email protected]
Perron Gaetan ABB Bomem Inc CANADA [email protected]
Persson Jan Saab Ericsson Space SWEDEN [email protected]
Peterson Ingrid Fisheries and Oceans Canada CANADA [email protected]
Petrocchi Andrea Vitrociset c/o ESA/ESRIN ITALY [email protected]
Pettersson Kent Journalist School of Gothenburg SWEDEN [email protected]
Pichel William National Oceanic and Atmospheric Administration (NOAA) National Environmental Satellite, Data, and Information Service
UNITED STATES [email protected]
PIOLLE Jean-Francois IFREMER FRANCE [email protected]
Piso Marius-Loan Romanian Space Agency ROMANIA [email protected]
Piters Ankie KNMI NETHERLANDS [email protected]
Pittella Giancarlo ESA/ESRIN ITALY [email protected]
Platt Ulrich Institut für Umweltphysik, Univ. Heidelberg GERMANY [email protected]
Poetzsch Anja TU Dresden Institut fuer Planetare Geodaesie GERMANY [email protected]
Posa Francesco Dipartimento Interateneo di Fisica Politecnico di Bari ITALY [email protected]
Potin Pierre ESA / ESRIN ITALY [email protected]
Potter Robert School of Ocean and Earth Science, University of Southampton, UK
UNITED KINGDOM [email protected]
Pouliquen Sylvie IFREMER FRANCE [email protected]
Prata Fred CSIRO Atmospheric Research AUSTRALIA [email protected]
Prati Claudio Politecnico di Milano - DEI ITALY [email protected]
Last Name First Name Institute Country E-mail
Preusker Rene Free University Berlin GERMANY [email protected]
Proisy Christophe Centre d'Etudes Spatiales de la BIOsphère FRANCE [email protected]
Pugliese Carratelli Eugenio Università degli Studi di Salerno ITALY [email protected]
Pulliainen Jouni Helsinki University of Technology, Laboratory of Space Technology
FINLAND [email protected]
Quartly Graham Southampton Oceanography Centre UNITED KINGDOM [email protected]
Queffeulou Pierre IFREMER FRANCE [email protected]
Quegan Shaun University of Sheffield UNITED KINGDOM [email protected]
Quilfen Yves IFREMER FRANCE [email protected]
Rabus Bernhard DFD - German Remote Sensing Data Center GERMANY [email protected]
Ranera Franck ESA/ESRIN ITALY [email protected]
Readings Christopher J. ESA/ESTEC NETHERLANDS [email protected]
Rebhan Helge ESA/ESTEC NETHERLANDS [email protected]
Refice Alberto Dipartimento Interateneo di Fisica ITALY [email protected]
Regner Peter ESA/ESRIN ITALY [email protected]
Rémondière Sylvie ESA/ESRIN ITALY [email protected]
Remy Frederique CNRS FRANCE [email protected]
Renis Irene ESA/ESRIN ITALY [email protected]
Rentsch Matthias GeoForschungsZentrum Potsdam (GFZ) Division Kinematics and Dynamics of the Earth
GERMANY [email protected]
Reuther Markus EUROTRAC-2 International Scientific Secretariat (ISS) GERMANY [email protected]
Ribbes Florence Spot Image FRANCE [email protected]
Richter Andreas Institute of Environmental Physics University of Bremen GERMANY [email protected]
Ridolfi Marco IROE - CNR ITALY [email protected]
Last Name First Name Institute Country E-mail
Riese Martin University of Wuppertal GERMANY [email protected]
Rignot Eric JPL -Jet Propulsion Laboratory UNITED STATES [email protected]
Robinson Roger British National Space Centre UNITED KINGDOM [email protected]
Roca Mònica ESA/ESTEC NETHERLANDS [email protected]
Rocca Fabio Politecnico di Milano - DEI ITALY [email protected]
Romeiser Roland Institute of Oceanography University of Hamburg GERMANY [email protected]
Rosengren Mats ESA/ESOC GERMANY [email protected]
Rosich Betlem ESA/ESRIN ITALY [email protected]
Rossi-Jänig Ingrid ESA/ESRIN ITALY [email protected]
Rostan Friedhelm Astrium GmbH GERMANY [email protected]
Roth Achim DLR-DFD GERMANY [email protected]
Rott Helmut Institute for Meteorology and Geophysics, University of Innsbruck
AUSTRIA [email protected]
Rouzé Michel CNES FRANCE [email protected]
Rudant Jean Paul Universite de Marne la vallee Institut francilien des Geosciences FRANCE [email protected]
Ruud Ann-Lisbeth Norwegian Space Centre NORWAY
Ruwwe Thomas DLR (German Aerospace Center) GERMANY [email protected]
Saavedra Lidia ESA/ESRIN ITALY [email protected]
Salas William Institute for the Study of Earth, Oceans, and Space, University of New Hampshire
UNITED STATES [email protected]
Salgado Hector Facultad de Agronomía, Universidad de Buenos Aires ARGENTINA [email protected]
Sallustio Ettore INFN - Rome ITALY [email protected]
Salson Laetitia SPOT IMAGE FRANCE [email protected]
Sandell Håkan National Technology Agency - TEKES FINLAND [email protected]
Last Name First Name Institute Country E-mail
Sandven Stein Nansen Environmental and Remote Sensing Center NORWAY [email protected]
Santantonio Nicola Telespazio ITALY [email protected]
Santoro Maurizio Department of Radio and Space Science Chalmers University of Technology
SWEDEN [email protected]
Sarti Francesco Centre National d'Etudes Spatiales (CNES) FRANCE [email protected]
Sassier Hugues ALCATEL SPACE INDUSTRIES FRANCE [email protected]
Sawaya-Lacoste Huguette ESA-ESTEC Publications Division NETHERLANDS [email protected]
Schaap Niek National Aerospace Laboratory (NLR) NETHERLANDS [email protected]
Scharroo Remko Delft Institute for Earth-Oriented Space Research Delft University of Technology
NETHERLANDS [email protected]
Schets Henk RMI-Royal Meteorological Institute of Belgium BELGIUM [email protected]
Schlager Hans DLR-Institute for Atmospheric Physics GERMANY [email protected]
Schmullius Christiane Institute for Geography, Dept. of Geoinformatics and Remote Sensing, Friedrich-Schiller-University
GERMANY [email protected]
Schoene Tilo GeoForschungsZentrum Potsdam (GFZ) GERMANY [email protected]
Schönemann Biggi ESA/ESTEC NETHERLANDS [email protected]
Schouppe Michel European Commission DG RTD BELGIUM [email protected]
Schroedter Marion German Aerospace Center (DLR) German Remote Sensing Data Center (DFD)
GERMANY [email protected]
Schüller Lothar Institut für Weltraumwissenschaften Freie Universität Berlin GERMANY [email protected]
Schulz-Stellenfleth Johannes German Aerospace Center GERMANY [email protected]
Schutgens N.A.J. Royal Netherlands Meteorological Office (KNMI) NETHERLANDS [email protected]
Schyberg Harald Norwegian Meteorological Institute (DNMI) NORWAY [email protected]
Seifert Frank Martin ESA/ESRIN ITALY [email protected]
Serban Florin Romanian Space Agency ROMANIA [email protected]
Serio Carmine Dip. Ingegneria e FIsica Ambientale, Universita della Basilicata and Gruppo collegato di Potenza, Sezione INFM di Napoli
ITALY [email protected]

Last Name First Name Institute Country E-mail
Shepherd Andrew University College London UNITED KINGDOM [email protected]
Shi Jiancheng University of California, Santa Barbara, U.S.A UNITED STATES [email protected]
Shokr Mohammed Atmospheric Environment Service Environment Canada CANADA [email protected]
Shum C. K. Civil/Environmental Engineering & Geodetic Science Ohio State University
UNITED STATES [email protected]
Siddans Richard Rutherford Appleton Laboratory UNITED KINGDOM [email protected]
Sigbjørnsen Marit Brudesalongen NORWAY [email protected]
Similä Markku Finnish Institute of Marine Research FINLAND [email protected]
Skinner Laine Department of Geography, University of Wales: Swansea UNITED KINGDOM [email protected]
Skoglund Sverker Ocean Origo SWEDEN [email protected]
Skriver Henning Department of Electromagnetic Systems Technical University of Denmark
DENMARK [email protected]
Skrøvseth Per Erik Norwegian Space Centre NORWAY [email protected]
Slijkhuis Sander DLR - Deutsches Zentrum fuer Luft- und Raumfahrt e.V. Remote Sensing Technology Institute (DLR-MF)
GERMANY [email protected]
Small David Remote Sensing Laboratories University of Zürich SWITZERLAND [email protected]
Smara Youcef Laboratoire de Traitement d'Images Institut d'Electronique / USTHB
ALGERIA [email protected]
Smith Arthur tno physics and electronics laboratory NETHERLANDS [email protected]
Smith Andy Phoenix Systems & Associates Ltd. UNITED KINGDOM [email protected]
Snaith Helen Southampton Oceanography Centre UNITED KINGDOM [email protected]
Snel Ralph Space Research Organisation Netherlands (SRON) NETHERLANDS [email protected]
Snoeij Paul Fokker Space NETHERLANDS [email protected]
Snoeij Paul ESA/ESTEC APP-PPP NETHERLANDS [email protected]
Sollie Arnt Cap Gemini Ernst & Young NORWAY [email protected]
Spichtinger-Rakowsky
Nicole Chair of Bioclimatology TU - Munich GERMANY [email protected]
Last Name First Name Institute Country E-mail
Spurr Robert HARVARD-SMITHSONIAN CENTER for ASTROPHYSICS UNITED STATES [email protected]
Stammes Piet Royal Netherlands Meteorological Institute (KNMI) Climate Research and Seismology Department
NETHERLANDS [email protected]
Stankiewicz Krystyna Institute of Geodesy and Cartography POLAND [email protected]
Stapleton Neil Defence Evaluation and Research Agency UNITED KINGDOM [email protected]
Stegman Jacek Department of Meteorology Stockholm University SWEDEN [email protected]
Stenseng Lars Department of Geophysics Niels Bohr Institute for Astronomy, Physics and Geophysics
DENMARK [email protected]
Stolz Roswitha Institute for Geography University of Munich GERMANY [email protected]
Stow Richard University of Nottingham UNITED KINGDOM [email protected]
Strom Guro D. Norwegian Space Centre NORWAY [email protected]
Strozzi Tazio University of Wales Swansea Department of Geography UNITED KINGDOM [email protected]
Suba Zsuzsanna Institute of Geodesy, Cartography and Remote Sensing, FOMI Remote Sensing Centre
HUNGARY [email protected]
Sugardiman R.A. Departement of Environmental SciencesWageningen University, The Netherlands
NETHERLANDS [email protected]
Sussmann Ralf Fraunhofer Institute for Atmospheric Environmental Research, IFU
GERMANY [email protected]
Sylos Labini Giovanni Planetek Italia ITALY [email protected]
Tait Hannah ESA/ESTEC NETHERLANDS [email protected]
Tanzi Cristina SRON NETHERLANDS [email protected]
Tegnér Per RYMDSTYRELSEN Swedish National Space Board
SWEDEN [email protected]
Tellmann Silvia institute of environmental physics/ institute of remote sensing University of Bremen
GERMANY [email protected]
Tennvassaas Tove Kongsberg Spacetec NORWAY [email protected]
Tholey Nadine SERTIT FRANCE [email protected]
Thomas Werner Deutsches Zentrum fuer Luft- und Raumfahrt (DLR), Institut fuer Methodik der Fernerkundung (IMF)
GERMANY [email protected]
Thompson Donald R. Johns Hopkins University/APL UNITED STATES [email protected]
Last Name First Name Institute Country E-mail
Timmermans Renske Royal Netherlands Meteorological Institute NETHERLANDS [email protected]
Torbo Per Norwegian Space Centre NORWAY [email protected]
Toritani Hitoshi National Institute of Agro-Environmental Sciences JAPAN [email protected]
Torres Palenzuela Jesús M. Universidad de Vigo,Departamento de Física Aplicada, Laboratorio de Teledetección y S.I.G
SPAIN [email protected]
Trebossen Herve Laboratoire Geomateriaux FRANCE [email protected]
Tuinder Olaf Institute for Marine and Atmospheric research Utrecht (IMAU)Utrecht University
NETHERLANDS [email protected]
Valero Juan Luis Wester European Union SPAIN [email protected]
Valks Pieter KNMI NETHERLANDS [email protected]
van der A Ronald KNMI NETHERLANDS [email protected]
van der Kooij Marco Atlantis Scientific Inc. CANADA [email protected]
Van der Wal Wouter Delft University of Technology NETHERLANDS [email protected]
van Geffen Jos KNMI NETHERLANDS [email protected]
Van Gent Jeroen KNMI NETHERLANDS [email protected]
van Hees Richard SRON NETHERLANDS [email protected]
Van Leekwen Hans Synoptics NETHERLANDS [email protected]
Van Oss Roeland KNMI - Royal Netherlands Meteorological Institute Section of Atmospheric Composition
NETHERLANDS [email protected]
Van Roozendael Michel Belgian Institute for Space Aeronomy BELGIUM [email protected]
Vazzana Sergio ESA/ESRIN ITALY [email protected]
Verdebout Jean European Commission Joint Research Centre Space Applications Institute
ITALY [email protected]
Verhoest Niko Laboratory of Hydrology and Water Management Ghent University
BELGIUM [email protected]
Verhoeye Jan University of Gent BELGIUM [email protected]
Vincent Patrick Centre National d'Etudes Spatiales FRANCE [email protected]

Last Name First Name Institute Country E-mail
Volden Espen ESA/ESRIN ITALY [email protected]
von Clarmann Thomas Forschungszentrum Karlsruhe, IMK GERMANY [email protected]
Voss Stefan Institute of Environmental Physics GERMANY [email protected]
Vuorela Arto Novosat Ltd FINLAND [email protected]
Wadge Geoff Environmental Systems Science Centre UNITED KINGDOM [email protected]
Wagner Thomas Institut für Umweltphysik, University of Heidelberg GERMANY [email protected]
Walker Alec H. University College London UNITED KINGDOM [email protected]
Wang Chao Institue of Remote Sensing ApplicationsChinese Academy of Sciences
CHINA [email protected]
Watts Philip Rutherford Appleton Laboratory UNITED KINGDOM [email protected]
Weber Mark University of Bremen GERMANY [email protected]
Wegmuller Urs Gamma Remote Sensing SWITZERLAND [email protected]
Wensink Han ARGOSS NETHERLANDS [email protected]
Weydahl Dan Johan Norwegian Defence Research Establishment, Division for Electronics
NORWAY [email protected]
Wiesmann Andreas Gamma Remote Sensing SWITZERLAND [email protected]
Wilson Steven British National Space Centre UNITED KINGDOM [email protected]
Wilson Steven Natural Environment Research Council UNITED KINGDOM [email protected]
Wilson Julian Environment Institute, European Commission ITALY [email protected]
Wingham Duncan University College London UNITED KINGDOM [email protected]
Wooding Mike Remote Sensing Applications Consultants UNITED KINGDOM [email protected]
Wright Tim Department of Earth Sciences, Oxford University UNITED KINGDOM [email protected]
Wuttke Manfred University of Bremen FB1 Institute of Environmental Physics / Remote Sensing
GERMANY [email protected]
Xie Xuetang Royal Institute of Technology, Sweden SWEDEN [email protected]

Last Name First Name Institute Country E-mail
Yan Guangjian Beijing Normal University CHINA [email protected] [email protected]
Yesou Hervé Service Régional de Traitement d'Image et de Télédétection FRANCE [email protected]
Yu Yong School of Environmental Science, Chalmers University. Inorganic Chemistry, Göteborg University
SWEDEN [email protected]
Zakharov Alexander Institute of Radioengineering and Electronics, RAS RUSSIAN FEDERATION [email protected]
Zandbergen René ESA/ESOC GERMANY [email protected]
Zanife Ouan-Zan CLS FRANCE [email protected]
Zine Sonia Université de Marne-la-Vallée FRANCE [email protected]
Zink Manfred ESA/ESTEC NETHERLANDS [email protected]
Zmuda Andy Defence Evaluation Research Agency (DERA) Space Deaprtment
UNITED KINGDOM [email protected]
Zwally Jay Nasa Goddard UNITED STATES [email protected]

ABSTRACTSOMMITTEES

ABSTRACTS BOOK - ORAL PRESENTATIONSOMMITTEES

ABSTRACTS BOOK - POSTERSOMMITTEES
Expectations for GOME-2 on the METOP satellites................................................................. 12
Munro Rosemary ........................................................................................................................ 12
On the variability of total column ozone derived from ERS-2 GOME and TOMS................ 13
Erbertseder Thilo ........................................................................................................................ 13
Validation of ozone profile retrieval at KNMI........................................................................... 14
Van der A Ronald ....................................................................................................................... 14
Science Objectives of EOS-CHEM's Ozone Monitoring Instrument (OMI)........................... 15
Levelt P.F.................................................................................................................................... 15
GOME satellite detection of ozone vertical column over a snow/ice covered surface in thepresence of broken clouds ............................................................................................................ 16
Tellmann Silvia........................................................................................................................... 16
Fast and accurate ozone profile retrieval for GOME-2 using 4-stream LIDORT.................. 17
Van Oss Roeland ........................................................................................................................ 17
Intercomparison of GOME Ozone Profiles ................................................................................ 18
GOME Fast delivery and value-Added Products (GOFAP) ..................................................... 19
Van der A Ronald ....................................................................................................................... 19
Software for Extraction of GOME Data from Level-2 to -3 for Total Column Ozone andother Parameters........................................................................................................................... 20
Murti M.V.R. .............................................................................................................................. 20
Retrieval of Cloud Properties from Oxygen A-Band Spectra measured by the Global OzoneMonitoring Experiment................................................................................................................ 21
Koelemeijer Robert..................................................................................................................... 21
Discrimination between water and ice clouds using near-IR AVIRIS measurements............ 22
Knap Wouter............................................................................................................................... 22
PMD Cloud Detection Schemes for GOME: Comparison with ATSR-2 Data and ICFA DataRegarding the Impact on GOME Ozone VCD........................................................................... 23
Von Bargen Albrecht .................................................................................................................. 23
Detection of cloud cover fractions by GOME Polarisation Measurement Devices andvalidation by surface observations and Meteosat data.............................................................. 24
Tuinder Olaf................................................................................................................................ 24
SCIAMACHY Optical Performance Characteristics ...................................................................... 26
Bovensmann Heinrich................................................................................................................. 26
A parametrisation of the earthshine polarisation in the UV..................................................... 27
Quality Assessment for GOME/ERS-2 Level 1 and Level 2 Products ..................................... 28
Loyola Diego .............................................................................................................................. 28
Degradation of UV Earth Radiance Observations by GOME.................................................. 29
Tanzi Cristina P. ......................................................................................................................... 29
ABSTRACTS BOOK- POSTERS -
Ring Effect studies for a cloudy atmosphere using GOME data .............................................. 30
De Beek Rüdiger......................................................................................................................... 30
Retrieving spectral reflectivities from Extracted GOME Instrument header data ................ 31
Ankie Piters ................................................................................................................................ 31
Precision Estimates for Trace Gas Profile Retrievals from SCIAMACHY LimbMeasurements ............................................................................................................................... 32
Kaiser Johannes W...................................................................................................................... 32
A new radiative transfer model for a spherical planetary atmosphere.................................... 33
Rozanov Vladimir....................................................................................................................... 33
Measurements of lightning-produced NO2 by GOME and LIS............................................... 34
Hild Lars ..................................................................................................................................... 34
GOME DATA ANALYSIS AND GROUND-BASED IN THE MEDITERRANEAN AREADURING ETNAVOLCANO ACTIVITY................................................................................... 35
Giovanelli Giorgio .......................................................................................................................... 35
Tropospheric OH Primary Production from ERS-2 Data ........................................................ 36
De Winter-Sorkina Renata.......................................................................................................... 36
Surface UV flux estimation from GOME: Impact of clouds and wavelength dependenteffective albedo.............................................................................................................................. 37
Coldewey Melanie ...................................................................................................................... 37
TROPOSAT: The use and usability of satellite data for tropospheric research ..................... 38
Borrell Peter................................................................................................................................ 38
GOME observations of Formaldehyde ....................................................................................... 40
Wittrock Folkard......................................................................................................................... 40
ERS SAR Imaging over the Brazil-Malvinas Confluence and Argentine Coastal Waters; itsUsefulness for different Ocean activities..................................................................................... 41
Gagliardini Domingo Antonio .................................................................................................... 41
Observation of seasonal variations of the north Caspian coast vegetation covers based onERS-2 SAR multitemporal data received in 1999 year ............................................................. 42
Kucheryavenkova Irina............................................................................................................... 42
On the use of ERS INSAR data for classification of coastal cover types and detection of fastvariations of water level ............................................................................................................... 43
Kucheryavenkova Irina............................................................................................................... 43
Coastal changes and the role of mangrove and morphological features on the dynamics andproductivity of the NE-Brazilian oceanic waters ....................................................................... 44
Martínez-Benjamin Juan José ..................................................................................................... 44
Clean Seas: A North Sea Test Site............................................................................................... 45
Snaith Helen................................................................................................................................ 45
Topographic mapping of the german tidal flat areas using ERS-SAR images........................ 46
Klocke Britta............................................................................................................................... 46
POSTERS (2)
Monitoring bluefin tuna habits with the help of satellite environmental data: ERS experiencewaiting for Envisat........................................................................................................................ 47
Cataldo Mariangela..................................................................................................................... 47
Numerical Model of Wave Spectra Refraction By TOPSAR Polarised Data.......................... 48
Maged Marghany........................................................................................................................ 48
Wave Refraction Pattern and Coastal Erosion .......................................................................... 49
Maged Marghany........................................................................................................................ 49
Residual Currents Movements and Oil Spills Transport .......................................................... 50
Maged Marghany........................................................................................................................ 50
Preliminary Studies for ENVISAT Proposal (AO-ID-542): determining Offisheries andCoastal Management Plan by using Remote Sensing Techniques in Lake Van, EasternTurkey............................................................................................................................................ 51
Sari Mustafa................................................................................................................................ 51
Environmental remote sensing system for coastal water monitoring (Envisat AO 560) ........ 52
Caramizoiu Alexandra-Valentina ............................................................................................... 52
Chinese Progress Toward Coastal and Marine Applications of Spaceborne SAR ................. 53
Huang Weigen ............................................................................................................................ 53
Oil Spill Monitoring in the Mediterranean Sea using ERS SAR Data..................................... 54
Nirchio Francesco ....................................................................................................................... 54
Water dynamics in the Kuril straits area: study with ERS SAR.............................................. 55
Mitnik Leonid ............................................................................................................................. 55
GAMMA SAR and Interferometric Processing Software......................................................... 56
Werner Charles ........................................................................................................................... 56
SAR products for all: Rent-a-RAPIDS ....................................................................................... 57
Analysis of the effect rain on Envisat altimeter: definition of a rain flag ................................ 58
Tournadre Jean............................................................................................................................ 58
Advanced MIPAS-Level-2 Data Analysis (AMIL2DA)............................................................. 59
V. Clarmann Thomas.................................................................................................................. 59
Concept for using GPS-buoys for RA drift monitoring............................................................. 61
Schoene Tilo ............................................................................................................................... 61
The Envisat Exploitation Programme......................................................................................... 62
Zmuda Andy ............................................................................................................................... 62
Operational Long Term Monitoring of the SCIAMACHY Instrument on ENVISAT........... 63
Wuttke Manfred.......................................................................................................................... 63
German Contribution to SCIAMACHY Validation with Ground-based FTIR Observationsfrom the NDSC Network: Preparation Phase ............................................................................ 64
Sussmann Ralf ............................................................................................................................ 64
Study of the Geometric Properties of ENVISAT ASAR Products ........................................... 65
Roth Achim................................................................................................................................. 65
POSTERS (3)
In-situ validation of the AATSR skin SST products with the SISTeR radiometer................. 66
Nightingale Tim.......................................................................................................................... 66
Altimetric measurements at L, S, C and Ku bands from an open sea platform...................... 67
Zecchetto Stefano ....................................................................................................................... 67
The Development of An Advanced Calibration Transponder for Quad-Pol SAR andSCANSAR ..................................................................................................................................... 68
Cooper Peter ............................................................................................................................... 68
Calibration and evaluation of Envisat temperature and ozone data using statistics from theUK Met Office NWP system ........................................................................................................ 69
Lahoz William ............................................................................................................................ 69
Passive calibration targets with a large, stable and controllable RCS for spaceborne SAR.. 70
Zakharov Alexander ................................................................................................................... 70
Comparison of Ground Based FTIR measurements at Harestua to spacebornemeasurements................................................................................................................................ 71
Mellqvist Johan........................................................................................................................... 71
SAFIRE-A measurements during the APE-GAIA campaign........................................................ 72
Cortesi Ugo ................................................................................................................................. 72
Tools for the Analysis of Residual Spectra Affecting MIPAS Level 2 Products ..................... 73
Hilgers Siegfried ......................................................................................................................... 73
Ground Based High Resolution FTIR Measurements of Stratospheric Molecules aboveHarestua, Norway, during 1995 to 2000. .................................................................................... 74
Galle Bo ...................................................................................................................................... 74
Upper atmospheric NO from SCIAMACHY: simulations and instrument capabilities ........ 75
Muller Christian.......................................................................................................................... 75
NDSC Support to the Development of ERS-2 GOME Geophysical Data................................ 76
Lambert Jean-Christopher........................................................................................................... 76
Non-Parametric Estimation of the Wet Tropospheric Correction, Cloud Liquid WaterContent and Sea Surface Wind Speed in ERS Configuration................................................... 77
Obligis Estelle............................................................................................................................. 77
The PRARE System on board ERS-2: Status and Results.............................................................. 78
Massmann Franz-Heinrich.......................................................................................................... 78
ERS Orbit Determination and Gravity Field Model Tailoring: Recent Developments.......... 79
Scharroo Remko ......................................................................................................................... 79
A recipe for upgrading ERS altimeter data................................................................................ 80
Scharroo Remko ......................................................................................................................... 80
Operational Altimetry at GFZ - From ERS-2 to Envisat.......................................................... 81
Rentsch Matthias......................................................................................................................... 81
Numerical and analogue modelling of large flank collapse at Mount Etna............................. 82
Ranvier Fabien............................................................................................................................ 82
POSTERS (4)

Synergism of optic and radar data to optimize lithostructural mapping and mineralexploration in South-East Senegal and Mali (West Africa) ...................................................... 83
Wade Souleye ............................................................................................................................. 83
Exploration for Improved Quality Groundwater in Semi-Desert Namaqualand, South Africa........................................................................................................................................................ 84
Stow Richard .............................................................................................................................. 84
Analysis of the paleodrainages of the Northwestern Simpson Desert, Australia from ERS1-2images............................................................................................................................................. 85
Marinangeli Lucia....................................................................................................................... 85
Flood monitoring in the Senegal River valley: First results based on SAR PRI data............. 86
Sandholt Inge .............................................................................................................................. 86
Mapping and Evaluation of "Mitch" hurricane damages in Central America using ERS SARand SPOT images.......................................................................................................................... 87
Nezry Edmond ............................................................................................................................ 87
A rapid Mapping System for Hurricane Damage Assessment.................................................. 88
Fellah Kader................................................................................................................................ 88
Watching for the Hazardous Spring 99 Flooding in the Chernobyl Zone in Ukraine with theERS SAR Images .......................................................................................................................... 89
Greku Rudolf .............................................................................................................................. 89
Mining Induced Seismic Events - Imaging Surface Deformation of Deep Mine Rock Burstsand Fault Movements ................................................................................................................... 90
Stow Richard .............................................................................................................................. 90
SURVEY OF LARGE DEFORMATION IN THE CHILE-PERU SEISMIC GAP (SOUTHAMERICA) USING SAR INTERFEROMETRY: THE LOADING AND TRIGGERING OFGIANT EARTHQUAKE.............................................................................................................. 91
De Chabalier Jean-Bernard .......................................................................................................... 91
Flood monitoring in the Senegal River valley: First results based on SAR PRI data............. 92
Sandholt Inge .............................................................................................................................. 92
Mapping and Evaluation of "Mitch" hurricane damages in Central America using ERS SARand SPOT images.......................................................................................................................... 93
Nezry Edmond ............................................................................................................................ 93
A rapid Mapping System for Hurricane Damage Assessment.................................................. 94
Fellah Kader................................................................................................................................ 94
Watching for the Hazardous Spring 99 Flooding in the Chernobyl Zone in Ukraine with theERS SAR Images .......................................................................................................................... 95
Greku Rudolf .............................................................................................................................. 95
Mining Induced Seismic Events - Imaging Surface Deformation of Deep Mine Rock Burstsand Fault Movements ................................................................................................................... 96
Stow Richard .............................................................................................................................. 96
SURVEY OF LARGE DEFORMATION IN THE CHILE-PERU SEISMIC GAP (SOUTHAMERICA) USING SAR INTERFEROMETRY: THE LOADING AND TRIGGERING OFGIANT EARTHQUAKE.............................................................................................................. 97
POSTERS (5)
De Chabalier Jean-Bernard ......................................................................................................... 97
Study of surface displacements in urban context with SAR interferometry: application to thecities of Paris (France), and Tainan (Taiwan) ............................................................................ 98
Fruneau Benedicte ...................................................................................................................... 98
Subsidence Monitoring Using Sparse SAR Differential Interferometric Measurements: TheBologna Case Study ...................................................................................................................... 99
Costantini Mario ......................................................................................................................... 99
Soil moisture estimation with SAR.PRI ERS images............................................................... 100
Salgado Hector.......................................................................................................................... 100
Soil Moisture Mapping Using ENVISAT ASAR and ERS-2 Data in the Southern GreatPlains Region of the U. S ............................................................................................................ 101
Jackson Thomas........................................................................................................................ 101
Appraisal of SAR Data Application in Assessment of Soil Salinity and WaterloggingProblems in Bahawalnagar and Bahawalpur Districts, Pakistan........................................... 102
Ahmed Iftikhar.......................................................................................................................... 102
Feasibility of using SAR derived soil moisture to enhance the robustness of vegetation indexbased crop yield models.............................................................................................................. 103
Panigrahy Sushma..................................................................................................................... 103
Assessment of the ERS Times Series Fusion and Coherence Analysis for the Monitoring ofEnvironmental Sensitive Areas in Alsace ................................................................................. 104
Fellah Kader.............................................................................................................................. 104
ERS-2, RADARSAT SAR backscattering characteristics of the Parana River Delta Wetland,Argentina ..................................................................................................................................... 105
Karszenbaum Haydee ............................................................................................................... 105
Observation of the wetland hydrology in the Unstrut catchement in Thuringia (Germany) bymultitemporal ERS-1 and ERS-2 SAR data............................................................................. 106
Hochschild Volker .................................................................................................................... 106
Institut fuer Geographie Friedrich-Schiller-Universitaet Jena ................................................. 106
Monitoring of water hyacinth abundance and its occasional factors in Lake Victoria Area(East Africa) using ERS-1 and ERS-2 SAR data ..................................................................... 107
Hochschild Volker .................................................................................................................... 107
The Contribution of ERS Satellite Altimetry to Hydrological Applications ......................... 108
Birkett Charon........................................................................................................................... 108
Retrieval of Geo- and Biophysical Information from Remote Sensing data - Overview of theGeoBIRD study ........................................................................................................................... 109
Bach Heike................................................................................................................................ 109
Application of ERS-2.SAR data for soil moisture estimates over flooded areas. .................. 111
Gruszczynska Maria.................................................................................................................. 111
Validation of ice flow models with ERS SAR observations of Antarcticglaciers and iceshelves .......................................................................................................................................... 112
Rignot Eric................................................................................................................................ 112
POSTERS (6)
Measurement of windspeed and snow-humidity on the Antarctic Peninsula using ERS-SAR-tandem interferometry ............................................................................................................... 113
Rabus Bernhard......................................................................................................................... 113
Development of practical algorithm for inferring component temperatures from multi-directional measurements .......................................................................................................... 114
Jia Li ......................................................................................................................................... 114
Geolocation of InSAR interferograms ...................................................................................... 115
Nico Giovanni........................................................................................................................... 115
Elimination of tropospheric artefacts in dINSAR images using numerical weather models116
Pany Thomas............................................................................................................................. 116
Mosaic generation using ERS SAR imagery ............................................................................ 117
Meadows Peter.......................................................................................................................... 117
Fuzzy Sets for Cloud Detection in ATSR-2 Images Over Land.............................................. 118
Smith Richard ........................................................................................................................... 118
A baseline estimation method for SAR interferometry ........................................................... 119
Nico Giovanni........................................................................................................................... 119
SAR images Data bank for land use monitoring in Central Africa, an efficient data storageand processing scheme................................................................................................................ 120
Mvogo Joseph........................................................................................................................... 120
Estimation of biophysical parameters from Terra surface reflectances ................................ 121
Knyazikhin Yuri ....................................................................................................................... 121
SAR Product Control Software (SARCON)............................................................................. 122
Boerner Thomas........................................................................................................................ 122
3-D reconstruction of soil surfaces by stereovision in relation with radar backscattered signalover them..................................................................................................................................... 123
Tebourbi Riadh ......................................................................................................................... 123
Interferometric SAR quality enhancing by space-varying spectral shift pre-filtering ......... 124
Monti Guarnieri Andrea............................................................................................................ 124
Satellite Altimeter Sea Level Variation Analysis of the Southern Ocean .............................. 125
Gomez-Enri Jesus ..................................................................................................................... 125
Global ocean tides - revisited The impact of ERS and ENVISAT.......................................... 126
Andersen Ole ............................................................................................................................ 126
Spiral Eddies in the Japan Sea .................................................................................................. 127
Ostrovskii Alexander ................................................................................................................ 127
Retrieval of Ocean Current Velocity Field using ERS SAR Raw Data ................................. 128
Pereslegin Sergey ........................................................................................................................ 128
Regional long term sea level variability from multi-satellite altimetry.................................. 129
Fenoglio-Marc Luciana............................................................................................................. 129
POSTERS (7)

SAR and AVHRR Imagery Using for Investigations of Big Lakes Physics and Ecology - LakeBaikal ........................................................................................................................................... 130
Semovski Sergei V.................................................................................................................... 130
Monitoring the Eastern Alboran using Combined Altimetry, In Situ and Temperature Data...................................................................................................................................................... 131
Snaith Helen ................................................................................................................................ 131
Sea surface topography due to density gradients in the Baltic Sea and Kattegat ................. 132
Stenseng Lars............................................................................................................................ 132
Synergistic Observations of Rossby Waves .............................................................................. 133
Quartly Graham ........................................................................................................................ 133
The signature of Rossby waves in the ATSR dataset............................................................... 134
Cipollini Paolo .......................................................................................................................... 134
A Study of the Mediterranean Water Outflow using the ERS and TOPEX-POSEIDON jointAltimetry...................................................................................................................................... 135
Gomez-Enri Jesus ..................................................................................................................... 135
Reprocessed ERS-1 and ERS-2 Altimeter Measurements for Ocean Circulation and ClimateResearch....................................................................................................................................... 136
Beckley Brian ........................................................................................................................... 136
Seasonal ERS SAR studies of sea ice in the Pechora and Kara Sea region ........................... 137
Lundhaug Maria........................................................................................................................ 137
Sea Ice Algorithm Validation and Improvement by Multi Sensor Analysis.......................... 138
Kaleschke Lars.......................................................................................................................... 138
Seasonal Characteristics of Antarctic Sea Ice Backscatter ..................................................... 139
Voss Stefan ............................................................................................................................... 139
Analysis of multi-polarmetric SAR imagery from the Kara Sea............................................ 140
Hall Richard.............................................................................................................................. 140
Sea Ice Interpretation Manual for SAR images ....................................................................... 141
Sandven Stein ........................................................................................................................... 141
Extension and Types of Sea Ice with the ERS-1 Scatterometry in Surroundings of theAntarctic Peninsula..................................................................................................................... 142
Greku Rudolf ............................................................................................................................ 142
Seasonal ERS SAR studies of sea ice in the Pechora and Kara Sea region ........................... 143
Lundhaug Maria........................................................................................................................ 143
Sea Ice Algorithm Validation and Improvement by Multi Sensor Analysis.......................... 144
Kaleschke Lars.......................................................................................................................... 144
Seasonal Characteristics of Antarctic Sea Ice Backscatter ..................................................... 145
Voss Stefan ............................................................................................................................... 145
Analysis of multi-polarmetric SAR imagery from the Kara Sea............................................ 146
Hall Richard.............................................................................................................................. 146
POSTERS (8)
Sea Ice Interpretation Manual for SAR images ....................................................................... 147
Sandven Stein ........................................................................................................................... 147
Extension and Types of Sea Ice with the ERS-1 Scatterometry in Surroundings of theAntarctic Peninsula..................................................................................................................... 148
Greku Rudolf ............................................................................................................................ 148
Quality of long term satellite wind and wave measurements.................................................. 149
Internal Solitons Near Gibraltar: A Multi-Year Study Using ERS-1 & 2 SAR Imagery..... 150
Apel John R. ............................................................................................................................. 150
Validation of Wind Retrieval Algorithms from Spaceborne SAR.......................................... 151
Parmiggiani Flavio.................................................................................................................... 151
Case Studies of Coastal Ocean Wind Field Retrievals from RADARSAT Synthetic ApertureRadar Images near the Island of Hainan, China ..................................................................... 153
Huang Weigen .......................................................................................................................... 153
A MODEL FOR WIND SPEED AND WAVE HEIGHT RETRIEVAL FROM RADARALTIMETER MEASUREMENTS........................................................................................... 154
Quality of long term satellite wind and wave measurements.................................................. 155
Internal Solitons Near Gibraltar: A Multi-Year Study Using ERS-1 & 2 SAR Imagery..... 156
Apel John R. ............................................................................................................................. 156
Validation of Wind Retrieval Algorithms from Spaceborne SAR.......................................... 157
Parmiggiani Flavio.................................................................................................................... 157
Case Studies of Coastal Ocean Wind Field Retrievals from RADARSAT Synthetic ApertureRadar Images near the Island of Hainan, China ..................................................................... 159
Huang Weigen .......................................................................................................................... 159
A MODEL FOR WIND SPEED AND WAVE HEIGHT RETRIEVAL FROM RADARALTIMETER MEASUREMENTS........................................................................................... 160
The use of ERS-1/2 SAR to the study of ocean surface features in theGulf of CaliforniaMexico.......................................................................................................................................... 161
Martínez-Díaz-de-León Asdrubal ............................................................................................. 161
Detection and Interpretation of Oceanic and Atmospheric Signatures in Spaceborne RadarImagery of the North-Western Pacific ...................................................................................... 162
Lavrova Olga ............................................................................................................................ 162
On the variety of IW radar observations in the Ocean - Slick-like signatures..................... 163
Da Silva Jose............................................................................................................................. 163
On the variety of IW radar observations in the Ocean ........................................................... 164
Da Silva Jose............................................................................................................................. 164
Generating a universal forest ground-truth catalogue for Remote Sensing applications toForest Observation ..................................................................................................................... 165
Schmullius Christiane ............................................................................................................... 165
Automated Training-Site Selection based on a Coherence Model for Forest Classification inthe SIBERIA Project .................................................................................................................. 166
POSTERS (9)
Schmullius Christiane ............................................................................................................... 166
A Comparision of SAR-Interferometry- and cartographically generated Digital ElevationModels by errors, accuracies and extracted hydrographic features ...................................... 167
Schmullius Christiane ............................................................................................................... 167
Pine forest understorey sensing with ERS-2 SAR imagery..................................................... 168
Cadete Leonor........................................................................................................................... 168
Using L-Band Polarimetric Interferometric Data to Retrieve Estimates of Forest BiomassDensity ......................................................................................................................................... 169
Skinner Laine............................................................................................................................ 169
Processing and Integration of Multisensor and Multidate Satellite Data for ForestManagement Mapping in Gabon (application to the first forest zone) .................................. 170
Nziengui Marcellin ................................................................................................................... 170
USEFULNESS OF ERS COHERENCE TIME SERIES FOR MONITORING THEVEGETATION CYCLE OF A MIXED TEMPERATE FOREST ........................................ 171
Mapping China Forest with ERS SAR Tandem Data ............................................................. 172
Franck Ranera ........................................................................................................................... 172
FIRE DAMAGE ASSESSMENT USING ERS-SAR AND NOAA-AVHRR DATA INEASTKALIMANTAN, INDONESIA ....................................................................................... 173
ERS coherence and SLC images in forest characterisation .................................................... 174
Manninen Terhikki ................................................................................................................... 174
Fire impact assessment in Indonesian rainforests with ERS and JERS SAR data............... 175
Siegert Florian........................................................................................................................... 175
Utilization of radar remote sensing and texture analysis for urban cartography inCameroon: application to Yaoundé city ................................................................................... 176
Alain Akono.............................................................................................................................. 176
Quantitative Analysis of Temporal ESR InSAR Data over the City of Graz........................ 177
Kenyi Lado-Wani ..................................................................................................................... 177
Statistical Analysis and Neuro-fuzzy Classification of Polarimetric SAR Images of urbanAreas ............................................................................................................................................ 178
Gamba Paolo............................................................................................................................. 178
Use of multitemporal ERS data for monitoring of landcover change in Sahelian regions. Theexemple of the Delta of the Niger river (Mali).......................................................................... 179
Mering Catherine ...................................................................................................................... 179
Historical land transformation analysis for geographic hazard evaluation in the Italiancountry......................................................................................................................................... 180
Aversa Mario ............................................................................................................................ 180
On the use of ERS INSAR and multitemporal data for ecological monitoring of theChernobyl area............................................................................................................................ 181
Zakharov Alexander ................................................................................................................. 181
An inversion model of ERS2 Radar data to retrieve wild vegetation cover in semi-aridregions.......................................................................................................................................... 182
POSTERS (10)
Zribi Mehrez ............................................................................................................................. 182
Biomass Monitoring with SAR .................................................................................................. 183
Snoeij Paul ................................................................................................................................ 183
Conversion of ATSR-2 skin sea surface temperatures to bulk temperature for use in climatestudies........................................................................................................................................... 184
O'Carroll Anne.......................................................................................................................... 184
ATSR-SST in enclosed basins - a case study in the Baltic sea................................................. 185
Hakansson Bertil....................................................................................................................... 185
Sea Surface Temperature and chlorophyll-a Correlation Index: Seasonal variability onIberian Margin............................................................................................................................ 186
Torres Palenzuela Jesús M........................................................................................................ 186
ACE: A new 30" GDEM incorporating satellite altimeter derived heights........................... 188
Berry Philippa ........................................................................................................................... 188
POSTERS (11)
EXPECTATIONS FOR GOME-2 ON THE METOP SATELLITES
Munro Rosemary
E-mail: [email protected]
Am Kavalleriesand 31Telephone: 0049 6151 807452
Fax: 0049 6151 807838
Co-author/s:A. Perez-Albinana (EUMETSAT, Darmstadt) J. Callies, E. Corpaccioli, M. Eisinger, A. Lefebvreand A. Hahne (Earth Observation Projects Department, European Space Agency /ESTEC,Noordwijk)
ABSTRACT
The first Global Ozone Monitoring Experiment (GOME) was launched in April 1995 on ERS-2.The objective was to measure the global distribution of ozone and other trace gases; an objectivewhich has been achieved.
GOME has demonstrated its capability to measure total column ozone, ozone profile, nitrogendioxide, sulphur dioxide, formaldehyde and halogen oxides. Furthermore, cloud parameters andaerosol properties have also been successfully retrieved. Both KNMI and DLR provide totalcolumn ozone data in near real time.
Building on the success of GOME, GOME-2 has been selected to fly as part of the payload of thefirst three METOP satellites, thereby ensuring operational monitoring of Ozone for a fifteen-yearperiod.
GOME-2 has a number of improvements over GOME, including improved calibration capabilitiesby addition of a new on-board white light source, and better characterisation of the PolarisationState of incoming radiation from new polarisation measuring devices.
The expectations for GOME-2, its role as an operational instrument will be discussed.
ON THE VARIABILITY OF TOTAL COLUMN OZONE DERIVEDFROM ERS-2 GOME AND TOMS
Erbertseder Thilo
E-mail: [email protected] Aerospace Center DLROberpfaffenhofen, PO Box 1116Telephone: 0049 (0)8153 283665
Fax: 0049 (0)8153 281445
Co-author/s:Michael Bittner
ABSTRACT
ERS-2-GOME has been successfully operating in space since April 1995 in a near polar orbit.Total column ozone has been derived since then on an operational basis almost continuously.
Temporal and spatial variability of the total column ozone is analysed over a wide range of scalescovering smaller scale structures such as streamers, medium scale structures such as planetarywaves and interannual variations. For the long-term studies also TOMS total ozone data is takeninto account.
In recent years it became evident that the distribution of ozone is also characterised by small-scalestructures. Examples are the so-called streamers, finger-like structures of ozone-low air massesreaching out from tropical latitudes towards northern latitudes. They turned out to be highlyvariable on time scales of a few days. For the longer-term studies the total ozone column is used asa dynamical tracer, supplying information on the dynamical activity of the atmosphere and itsdevelopment.
Different spectral schemes such as Kalman Filter, Harmonic and Wavelet analysis based methodsare used as well as sequential data assimilation techniques such as advection and wind driven 3Dchemical transport modeling. Aimed is to get the maximum information content by a combinationof measurement and model at best.
Results, model result intercomparisons and comparisons to climatologies will be presented. Thebenefit of the utilization of ENVISAT data will be addressed.
VALIDATION OF OZONE PROFILE RETRIEVAL AT KNMI
Van der A Ronald
E-mail: [email protected]
P.O. Box 201Telephone: 0031 30 2206412
Fax: 0031 30 2203028
Co-author/s:Ronald van der A Royal Netherlands Meteorological Institute (KNMI), P.O. Box 201, 3730 AEDe Bilt, The Netherlands E-mail: [email protected]. Telephone: 00-31-30-2206412,Fax: 00-31-30-2210407
ABSTRACT
At the KNMI ozone profiles are retrieved from GOME observations using the optimal estimationmethod. A-priori ozone profiles and temperature profiles are taken from climatologies. Theradiative transfer is modelled using the MODTRAN code which includes the multiple scatteringbased on DISORT. Prior to the retrieval a correction is applied to the level 1 product to account forthe wavelength calibration and the degradation of the sun-normalized radiance.
Ozone profiles have been retrieved from GOME overpass observations at De Bilt (Netherlands)and Paramaribo (Surinam). These sites represent urban mid-latitude and rural tropical situations.These overpass data are compiled for the period 1996 up to 2000. These results are compared withlocal ground measurements of ozone profiles and with total ozone measurements at theselocations.
SCIENCE OBJECTIVES OF EOS-CHEM'S OZONE MONITORINGINSTRUMENT (OMI)
Levelt P.F.
E-mail: [email protected] (Royal Netherlands Meteorological Institute)
P.O. Box 201Telephone: 0031-30-2206667
Fax: 0031-30-2210407
Co-author/s:B. van den Oord (1), E. Hilsenrath (2), G. Leppelmeier (3), P. Stammes (1), H. Kelder (1), R vander A (1), R. van Oss (1), P. Veefkind (1) (1) KNMI, PO Box 201, 3730 AE De BiltThe Netherlands. E-mail: [email protected], fax +31 302210407, tel +31 302206667;(2)NASA/GSFC, Mail code 916, Greenbelt MD 20771, USA. E-mail: [email protected],fax +1-301-614-5903, tel. +1-301-614-6033; (3) FMI, PO Box 503, FIN-00101 Helsinki, Finland.E-mail [email protected], fax +358-9-1929-4603, tel. +358-9-1929-4644
ABSTRACT
The Ozone Monitoring Instrument (OMI) will fly on NASA's satellite EOS-CHEM, which will belaunched in December 2002. The EOS-CHEM satellite is focussed on atmospheric chemistry andclimate issues. The main science objectives of the EOS-CHEM mission are: (1) Is the ozone layerrecovering as expected? (2) What are the sources of tropospheric pollutants, their chemicaltransformation and their transport? (3) What are the roles of upper-tropospheric water vapor,aerosols and ozone in climate change? The EOS-CHEM satellite consists of 4 instruments, whichare the Microwave Limb Sounder (MLS), the High Resolution Dynamics Limb Sounder(HIRDLS), the Tropospheric Emission Spectrometer (TES), which is a nadir and limb sounder,and OMI.
OMI is a UV/VIS nadir solar backscatter spectrograph, which reaches global coverage in one daywith a 13 x 24km2 footprint. OMI is derived from the European satellite instruments GOME andSCIAMACHY. OMI is capable of measuring (ir) radiances of the sun and earth in the wavelengthrange of 270 to 500 nm, from which ozone column and profile, NO2, SO2 and BrO as well asaerosols, cloud coverage and cloud top pressure can be derived. OClO and HCHO are in principlealso possible data products of OMI.
OMI's unique capability in measuring column amounts of ozone, NO2 etc. with a small footprintand daily global coverage will enable EOS-CHEM to monitor tropospheric pollution on a regionalscale. The design and capability of OMI will be explained. The contribution of OMI to answer theabove mentioned science questions and the resulting science requirements of the instrument willbe discussed.
GOME SATELLITE DETECTION OF OZONE VERTICAL COLUMNOVER A SNOW/ICE COVERED SURFACE IN THE PRESENCE OF
BROKEN CLOUDS
Tellmann Silvia
E-mail: [email protected] For Environmental Physics/Institute for Remote Sensing University of Bremen
Postfach 330440Telephone: 0049-421-2184584
Fax: 0049-421-2184555
Co-author/s:Rozanov, Vladimir V., Institute for Environmental Physics, University of Bremen: Weber, Mark,Institute for Environmental Physics, University of Bremen: Burrows, John P., Institute forEnvironmental Physics, University of Bremen
ABSTRACT
In the presence of broken clouds over snow or ice covered surfaces it is quite difficult todistinguish between clouds and surfaces.
A new approach has been developed, which treats the cloud as a Lambertian surface andcharacterizes the inhomogeneous pixel area (with broken clouds) by deriving an effective albedoand cloud-top-height. These parameters are determined by minimizing the difference betweenGOME measured sun-normalized radiances and corresponding model spectra in the spectral rangeof O_4 absorption near 370 nm. Extrapolation of the effective albedo to short wavelengths enablesto improve the ozone vertical column retrieval in the 315-335 nm range.
It will be shown that this method can clearly distinguish between clouds and snow-covered(bright) surfaces, which improves the accuracy of the retrieved ozone column.
FAST AND ACCURATE OZONE PROFILE RETRIEVAL FOR GOME-2USING 4-STREAM LIDORT
Van Oss Roeland
E-mail: [email protected] - Royal Netherlands Meteorological Institute
Section of Atmospheric CompositionP.O. Box 201
Telephone: 0031-30-2206439Fax: 0031-30-2203028
Co-author/s:Roeland van Oss, KNMI, P.O.Box 201, 3730 AE Be Bilt, The Netherlands.E-mail: [email protected], Telephone/Fax: 00-31-30-2206439/2210407.Robert Spurr, Harvard-Smithsonian Center for Astrophysics, 60 Garden Street, Cambridge, MA02138-U. S. A. E-mail: [email protected]. Telephone/Fax: 001-617-4967819/4957389
ABSTRACT
The retrieval of vertical profile information of ozone from nadir viewing UV/VIS sensors, such asGOME and GOME-2, requires the calculation of radiances for any given ozone profile as well asthe derivatives of the radiance to the ozone at specific atmospheric layers (weighting functions).The LIDORT scheme solves for both quantities by utilizing the well-known discrete-ordinatesmethod expanded by a scheme to calculate the derivatives in a computationally economicalmanner. In view of the requirements on the speed of the ozone profile retrieval algorithm resultingfrom the high data rate of the instruments, a fast version of LIDORT has been developed:LIDIRT4A. The number of streams has been limited to four thereby allowing analytic solutions toreplace certain numerical steps in the LIDORT scheme. Only the sparse linear system that has tobe solved to fix the boundary conditions still requires a numerical module. The low number ofstreams results in a small degradation in accuracy (about 0.5). However, this is still acceptable inview of the uncertainties inherent to the calibration of the instruments. This will be shown bycomparing profile retrievals using LIDORT4A and LIDORT with sufficient streams for differentatmospheric and viewing conditions. Apart from its use for the NRT retrieval for GOME, thealgorithm development is part of the preparations for the NRT GOME-2 processing within theEUMETSAT Ozone SAF project.
INTERCOMPARISON OF GOME OZONE PROFILES
Gleason James
E-mail: [email protected] Goddard Space Flight Center
Mail Code 916Telephon: 003016146036
Fax: 003016145903
Co-author/s:J.P. Burrows, U of Bremen, DE L.E. Flynn, NOAA, USA; B.J. Kerridge, RAL, UK;J.C. Lambert, BIRA-IASB, BE, R. Van der A, KNMI, NL
ABSTRACT
A number of groups have started producing ozone profiles from the ERS-2 GOME radiance data.At the request of the GOME Science Advisory Group, this group was formed to compare theresults from the different ozone profile algorithms. The intercomparison will be done in threephases:
1) Level 1 Radiance adjustment
The first area will be GOME calibration and how each group adjusts (or not) the GOME radiances.There are known wavelength dependent errors in the Band 1a calibration, there is a calibrationoffset between Band 1 and Band 2, there are probably other errors as well. The details how eachgroup adjusts the level 1 radiances, all bands, before running their ozone profile algorithm will bepresented.
2) Synthetic Data Retrieval
Synthetic spectra willl be generated over the GOME wavelength interval. The spectra with theappropriate meta-data will be distributed to the participating groups. The retrieved profiles will becompared will be compared with the input ozone profiles.
3) Validation with NDSC ozone profile data
The ozone profiles over NDSC sites will be compared with NDSC ozone lidar and ozonesondeprofiles.
GOME FAST DELIVERY AND VALUE-ADDED PRODUCTS (GOFAP)
Van der A Ronald
E-mail: [email protected]
P.O. Box 201Telephone: 0031 30 2206412
Fax: 0031 30 2203028
Co-author/s:Ronald van der A (1) E-mail: [email protected], Telephone: 00-31-30-2206412,Fax: 00-31-30-2210407, Ankie Piters (1), Pieter Valks (1), Jos van Geffen (1), Claus Zehner(2).(1) KNMI, POBox 201, 3730 AE De Bilt The Netherlands (2) ESA ESRIN, Via Galileo Galilei,00044 Frascati (Rome), Italy
ABSTRACT
In the framework of the ESA Data User Porgram a Fast Delivery processor has been developed toprovide GOME ozone products within 3 hours after observation. This service meets the growingdemand for ozone products for purposes like assimilation in numerical weather prediction models,radiation forecasts, and planning of experiments related to atmospheric chemistry research.
By making maximum use of the existing ERS ground segment and European Internet links theretrieval of ozone products can be performed within 3 hours after observation from the ExtractedGOME Instrument Header (EGOI) Data. This data contains parts of the ultra violet spectrumapplicable for the retrieval of ozone columns and stratospheric ozone profiles. The EGOI data iscalibrated and processed to a level 1b product.
For the total ozone column retrieval a very fast processor has been developed. The retrievaltechnique is based on the Differential Optical Absorption Spectroscopy (DOAS).
Data assimilation software has been incorporated in the automatic GOME fast-delivery processingto provide global maps of ozone. In the data assimilation a transport model (TM3) and wind fieldsprovided by ECMWF describe the atmospheric flow of ozone.
An existing off-line profile retrieval algorithm has been adapted to produce reliable stratosphericozone profiles within the strict time constraint with a spatial resolution sufficient for numericalweather predictions.
The processed level 1 data is also used for the computation of additional NRT products like cloudand aerosol information. The cloud fraction and cloud top pressure are calculated with theFRESCO algorithm. The aerosol absorption index is computed to have an indication for areas withheavy aerosol pollution.
The near-real time processor and the presently delivered ozone products will be presented. Detailsof the work can be found in dedicated poster presentations.
SOFTWARE FOR EXTRACTION OF GOME DATA FROM LEVEL-2 TO-3 FOR TOTAL COLUMN OZONE AND OTHER PARAMETERS
Murti M.V.R.
E-mail: [email protected] Institute of Technology
PowaiMumbai- 400 076Telephone: 00 91-22 576 7688
Fax: 00 91-22 572 3190
Co-author/s:Raju S.Kamble And C.S.Rao
ABSTRACT
The Global Ozone Monitoring Experiment (GOME) has been launched on board the secondEuropean Remote Sensing Satellite (ERS-2) designed to measure a range of atmospheric traceconstituents with particular emphasis on global ozone distribution. GOME is a spectrometer whichmeasures the solar radiation scattered from the Earth's atmosphere and reflected by the Earth'ssurface in nadir viewing geometry in the wavelength range of 240 - 790 nm with a spectralresolution of 0.2 - 0.4 nm. For a 960 km swath width GOME achieves global coverage in threedays. Global Total Column Ozone maps are provided in near real time shows actual situation ofStratospheric Ozone layer. It is difficult to ascertain the actual total column ozone values fordifferent locations from these maps as they are based on color code. GOME level 1 to 2 software isprovided for extraction of GOME Level-2 data in ASCII readable format from Level-2 binary data.In this paper, Level 2-to-3 Processing software is developed for obtaining actual concentration oftotal column ozone and other trace gases in numerical format. This software has different modulefor extraction of information and for each forward scan pixel, latitude, longitude andcorresponding total column of ozone, vertical column density, DOAS slant column of ozone andother trace gases and also cloud top pressure and surface pressure, etc.

RETRIEVAL OF CLOUD PROPERTIES FROM OXYGEN A-BANDSPECTRA MEASURED BY THE GLOBAL OZONE MONITORING
EXPERIMENT
Koelemeijer Robert
E-mail: [email protected] Netherlands Meteorological Institute (KNMI)
P.O. Box 201Telephone: 0031 2206 467
Fax: 0031 30 2210 407
Co-author/s:Authors:Koelemeijer, Robert B. A. and P. StammesCorrespondingauthor: Robert KoelemeijerKNMIP.O. Box 2013730 AE De BiltThe Netherlands.E-mail: [email protected]. Telephone: +31 2206 467, Fax: +31 2210 407.
ABSTRACT
With the launch of the Global Ozone Monitoring Experiment (GOME), a UV-VIS spectrometeroperating on board the ERS-2 satellite since April1995, the first global space-based measurementsof the oxygen A-band (758-775 nm) have become available at a moderately high spectralresolution of 0.35 nm. These spectra offer a unique possibility to derive cloud properties, becausethe depth of the oxygen A-band is sensitive to cloud top pressure, whereas the reflectivity atcontinuum wavelengths is sensitive to cloud fraction and cloud optical thickness. Therefore, wedeveloped a fast retrieval method, called FRESCO (Fast Retrieval Scheme for Clouds using theOxygen A-band), to derive simultaneously cloud fraction and cloud top pressure. The FRESCOalgorithm makes use of radiances measured in three narrow wavelength intervals inside andoutside the oxygen A-band, namely at 758 nm (no absorption), 761 nm (strong absorption), and765 nm (moderate absorption). The cloud properties derived using FRESCO are used as input fornear-real-time ozone column retrievals from GOME, but are also important to study cloudproperties on the global scale. Global monthly average FRESCO cloud fractions and cloud toppressures have been compared to ISCCP-D2 data, showing good overall agreement both for cloudfraction (0.01 average difference, 0.10 standard deviation) and cloud top pressure (35 hPa averagedifference, 105 hPa standard deviation). In addition, a detailed validation of FRESCO usingcollocated ATSR-2 data has been performed. To this end, a cloud detection algorithm is used toseparate clear and cloudy pixels inATSR-2 images. The brightness temperatures of the cloudypixels as measured by ATSR-2 are related to cloud top pressures using ECMWF profiles.Generally, the results from GOME and ATSR-2 agree well. The average difference in cloudfraction is 0.05, with a standard deviation of 0.09. The average difference in cloud top pressure is65 hPa, with a standard deviation of 91 hPa. The comparison of FRESCO cloud properties to thoseof ISCCP-D2 and ATSR-2 indicates that problems with FRESCO occur mainly due to absorptionwithin the cloud and uncertainties in the surface albedo. We will make suggestions about possibleimprovements to our FRESCO retrieval algorithm.

DISCRIMINATION BETWEEN WATER AND ICE CLOUDS USINGNEAR-IR AVIRIS MEASUREMENTS
Knap Wouter
E-mail: [email protected] Netherlands Meteorological Institute (KNMI)
Atmospheric Research DivisionPO Box 201
Telephone: 00
Co-author/s:Wouter H. Knap, Piet Stammes, and Robert Koelemeijer
ABSTRACT
Around 1.6 micron, the spectral shape of the absorption bands of water and ice is different: thewater absorption spectrum exhibits a local minimum whereas for ice there is a negative gradient.This difference is exploited to develop a water/ice-cloud discrimination algorithm for top-of-atmosphere reflectivities. The algorithm is based on radiative transfer modelling using thedoubling-adding method to describe multiple scattering. The single scattering properties of cloudparticles are calculated by means of Mie theory for water droplets and ray-tracing techniques forimperfect hexagonal ice crystals. The central theme of this paper is the testing of the algorithmusing airborne spectral radiance measurements made over clouds. The algorithm has beendeveloped for the analysis of measurements to be made by SCIAMACHY (SCanning ImagingAbsorption spectroMeter for Atmospheric CHartographY). This spectrometer has been designed tomeasure radiances in the ultraviolet, visible and near-infrared wavelength regions (240-2380 nm)at moderate spectral resolution (0.2-1.5 nm). It will be flown on ENVISAT, which is planned to belaunched in 2001. In order to test the concept described above, measurements made by NASA'sAirborne Visible/Infrared Imaging Spectrometer (AVIRIS) are used. The relatively low spectralresolution of AVIRIS (10 nm) is still sufficient for detecting spectral structures related todifferences in water/ice absorption around 1.6 micron. Three cloudy AVIRIS flight lines are usedfor the analysis of the algorithm. The flight lines contain measurements made over different typesof water and ice clouds over ocean. Several clusters of AVIRIS spectra acquired over these cloudsare analysed with respect to their 1.6 ?m spectral gradient. On the basis of this analysis thewater/ice-cloud discrimination algorithm is examined in detail and conclusions are drawn withrespect to the applicability of the algorithm to future SCIAMACHY measurements.

PMD CLOUD DETECTION SCHEMES FOR GOME: COMPARISONWITH ATSR-2 DATA AND ICFA DATA REGARDING THE IMPACT ON
GOME OZONE VCD
Von Bargen Albrecht
E-mail: [email protected] Aerospace Center
Institute for Remote Sensing TechnologyPostfach 1116
Telephone: 0049-8153-282742Fax: 0049-8153-281446
ABSTRACT
In order to determine the ozone and other trace gase amounts more accurately, it is clear thatcolumn densities achieved by DOAS fitting have to be corrected for cloudy and partially cloudyscenes. Therefore, cloud parameters are needed. At present, the fractional cloud coverage is onlyretrieved in GDP (GOME Data Processor) by ICFA (Initial Cloud Fitting Algorithm). ICFAextracts information about clouds from GOME measurements both outside and within the O2 A-band. In the project CRAG (Cloud Retrieval Algorithm for GOME) a two-step procedure based onthe PMDs and the GOME measurements of the O2 A-band, has been introduced. Since there havebeen two PMD algorithm available, we present a comparison of both in this paper.
Both PMD algorithm retrieve the fractional cloud coverage. One of these schemes is based on athreshold technique, the other on "cloud-free composite" technique. Since both algorithms work ona heuristic base, their results have to be verified with respect to the existing cloud retrievalalgorithm for GOME, ICFA (Initial Cloud Fitting Algorithm), and to the cloud recognition resultsof other sensors. Therefore, a comparison of ICFA results will be presented. Furthermore, theimpact on GOME ozone vertical column densities (VCD) by all cloud detection schemes, ICFAand both PMD algorithms, will be compared. Therefore, a computation of a broad set of orbitscovering data from 1995 until 1997 has been performed.
In addition, a comparison with results of several ATSR-2 (Along Track Scattering Radiometer)swathes for the computation of the fractional cloud coverage will be shown. Finally, a discussionof both PMD algorithm will be presented including also operational aspects.
DETECTION OF CLOUD COVER FRACTIONS BY GOMEPOLARISATION MEASUREMENT DEVICES AND VALIDATION BY
SURFACE OBSERVATIONS AND METEOSAT DATA
Tuinder Olaf
E-mail: [email protected] for Marine and Atmospheric research Utrech (IMAU) Utrecht University
Princetonplein 5Telephone: 00 31 253 3271
Fax: 00 31 254 3163
ABSTRACT
Photodissociation rates of species in the atmosphere are strongly influenced by the presence ofclouds. In order to determine the actinic flux and photodissociation rates from GOMEmeasurements, the knowledge of cloud characteristics is of crucial importance. GOME Level-2data contain cloud fractions from the Initial Cloud Fitting Algorithm (ICFA). The ICFA giveseffective cloud fractions for cloud optical thickness of 20. Additionally, errors are introduced byusing monthly mean cloud top heights from the ISCCP climatology. It is shown that the errors onsurface photodissociation rates calculated using the ICFA cloud fraction of up to 20 are introduceddue to unknown cloud optical thickness. Other methods for determining the cloud fraction havebeen developed using data from the broadband Polarisation Measurement Detectors (PMDs). Thisallows the estimation of cloud optical thickness and top height from the oxygen A-band (CRAGalgorithm), which are important for actinic flux profile estimation. The aim of this work is tovalidate a method that produces cloud cover fractions from GOME PMD data. By using the PMDsof GOME we divide the wide swath (320x40 km) seen by the spectral detectors into smaller parts(20x40 km) at the cost of a lower spectral resolution. The PMD detected albedo of the earth can beused to distinguish between cloud and surface if the reflectance of the surface remains constant. Alookup table for each 0.5x0.5 degree grid box was generated by processing all PMD data for onemonth and storing the minimum and maximum value of each of the three PMD devices whichrepresent a cloud free and a completely clouded situation respectively. All values in between areinterpolated linearly to a fractional cloud cover. All GOME pixels over the Netherlands areselected for the test month and the cloud fraction per PMD sub-pixel is calculated. Observationsfrom surface weather stations, collocated within the PMD sub-pixel, are compared with thecalculated cloud fractions. Results of the comparison show that the PMD cloud algorithm hasdifficulty representing small cloud fractions correctly and has a wide range of solutions for highercloud fractional covers.
CLOUD PROPERTIES DERIVED FROM ATSR-2 AND AEROSOLOPTICAL THICKNESSES DERIVED FROM GOME IN CO-LOCATED
CLOUD-FREE SCENES
Siddans Richard
E-mail: [email protected] Appleton Laboratory
Chilton, DidcotTelephone: 0044 1235 446428
Fax: 0044 1235 445848
Co-author/s:Stevens, B.J.Kerridge, R.Siddans, W.J.Reburn, R.Guzzi
ABSTRACT
A scheme to derive cloud-top height, reflectance and coverage has been developed at theRutherford Appleton Laboratory. The scheme was developed specifically to characterise cloud inpixels used for height-resolved ozone retrieval from the ERS-2 GOME instrument and to identifycloud-free GOME pixels unambiguously for retrieval of aerosol. The scheme operates by (a) co-locating the GOME and ATSR-2 fields-of-view (FOV); (b) classifying (from visible channelreflectance ratios) all ATSR-2 pixels within each GOME pixel according to surface/cloud type;and (c) generating histograms of occurrence of each ATSR-2 pixel type vs infra-red brightnesstempertature, visible-channel reflectance and parallax-height (derived by stereo-matching forwardand nadir ATSR-2 views). Infra-red brightness temperature is related to cloud height by referenceto the nearest temperature profile from the appropriate UKMO analysis. Cloud and surfaceparameters representative of the GOME pixel are derived from the histograms: e.g. total, "thick"and "thin" cloud fractions; mean and standard deviation of cloud reflectance, mean and standarddeviation cloud height (from both temperature and parallax approaches). The scheme has beenapplied in parallel with the GOME ozone profile algorithm (see parallel paper) to a significant sub-set of the GOME/ATSR-2 data-set and the derived information is available via the BritishAtmospheric Data Centre (http://www.badc.rl.ac.uk)
A scheme to retrieve tropospheric aerosol from GOME measurements in the O2 A-band (near760nm) has also been developed and applied to pixels identified as "cloud-free" by the aboveATSR-2 scheme. Aerosol optical thicknesses retrieved from the A-band have been comparedsystematically with those obtained for the same pixels by a completely independent methoddeveloped by IMGA which uses GOME measurements in the visible and near-IR. Potential forfurther development of the A-band scheme will be discussed.
SCIAMACHY OPTICAL PERFORMANCE CHARACTERISTICS
Bovensmann Heinrich
E-mail: [email protected] of Environmental Physics and Remote Sensing
University of Bremen, FB1 P.O. Box 33 04 40Telephone: 0049-421-218 4081
Fax: 0049-421-218 4555
Co-Author/s:J. P. Burrows Institute of Remote Sensing/Environmental Physics, University of Bremen, FB1,P.O.Box 330440, D-28334 Bremen, Germany R.W.M. Hoogeveen, R. C. Snell, H. Schrijver,A.P.H. Goede Space Research Organisation Netherlands, Sorbonnelaan 2, 3584 CA Utrecht,The Netherlands Ch. Muller Institut d'Aeronomie Spatiale de Belgique, Avenue Circulaire 3,B-1180 Bruxelles, Belgique
ABSTRACT
The Scanning Imaging Absorption spectroMeter for Atmospheric CHartographY (SCIAMACHY)is a contribution to the ENVISAT-1 satellite, which will be launched in mid 2001. TheSCIAMACHY instrument is designed to measure sunlight transmitted, reflected and scattered bythe Earth's atmosphere or surface simultaneously from the UV to the NIR spectral region (240 -2380 nm) in various viewing geometries, namely nadir, limb, and both solar and lunar occulation.
From these measurements atmospheric concentration distributions of O3, NO, NO2, NO3, BrO,OClO, SO2, H2CO, H2O, CO, CO2, N2O, and CH4 will be deduced globally. SCIAMACHY isthe only instrument on ENVISAT, which is able to detect the concentrations of O3, NO2, BrO,SO2, H2CO, H2O, CO, CO2, N2O, and CH4 down the boundary layer or the cloud top.
The accuracy of the envisaged data products depends on a) the instrument performance andcharacterisation, b) the algorithms used for inversion of the data (data processing), c) thevalidation of the data products. Instrument performance is now well characterised and thecalibrated instrument was delivered to ESA-ENVISAT in early 2000. The development ofscientific and operational algorithms is progressing. The SCIAMACHY validation campaignembedded in the ENVISAT validation campaign is also under preparation.
In this contribution the as-build status of the optical performance of SCIAMACHY is presentedand compared with the required performance.
Special emphasis will be placed on performance aspects relevant for data processing andvalidation.
A PARAMETRISATION OF THE EARTHSHINE POLARISATION INTHE UV
Schutgens N.A.J.
E-mail: [email protected] Netherlands Meteorological Office (KNMI)
P.O. Box 201Telephone: 0031 30 2206 459
Fax: 0031 30 2210 407
Co-author/s:N.A.J. Schutgens Royal Netherlands Meteorological Office (KNMI) P.O.Box 201, 3730 AEDe Bilt, The Netherlands, E-mail: [email protected]. Stammes, Royal Netherlands Meteorological Office (KNMI) P.O.Box 201, 3730 AEDe Bilt, The Netherlands, E-mail: [email protected]
ABSTRACT
Since many satellite remote sensing instruments (e.g. GOME, SCIAMACHY, OSIRIS) aresensitive to polarisation, we may expect to improve the quality of calibrated earthshine radiancesthrough theoretical knowledge of the behaviour of the Stokes vector of atmospheric radiation. Inparticular, earthshine spectra show strong variation of their polarisation characteristics in thewavelength range of 290-340 nm, which is used for both ozone column and profile retrieval(ozone Huggins band).
We have constructed a database of calculated earthshine spectra for a variety of viewing angles,solar angles and surface albedos. The first three Stokes parameters I, Q and U for part of the UV(290-350 nm, at 0.2 nm intervals) were calculated using a plane-parallel polarised radiativetransfer code developed at the KNMI (DAK, using the doubling-adding algorithm of de Haan et al.1987). Only ozone absorption and molecular Rayleigh scattering for a set of standard atmosphereswere considered. Surface reflectance was assumed Lambertian in nature. This database allows usto construct spectra for large ground pixels (40 x 320 km2) as observed by e.g. GOME, byinterpolation to and addition of subpixel spectra.
We show applications of this database, in particular the improvement of the polarisation correctionfor GOME radiances. For example, the largest wavelength for which the polarisation may bedetermined from single Rayleigh scattering theory (around 300 nm) can be parametrised in solarzenith angle. A combination of similar parametrisations of the polarisation in the Hugginsabsorption band leads to significant improvement of the calibrated GOME radiances.
QUALITY ASSESSMENT FOR GOME/ERS-2 LEVEL 1 AND LEVEL 2PRODUCTS
Loyola Diego
E-mail: [email protected] Aerospace Center (DLR) Remote Sensing Technology Institute (MF-AP)
OberpfaffenhofenTelephone: 0049-8153-281367
Fax: 0049-8153-281446
Co-author/s:Bernd Aberle
ABSTRACT
The ERS-2 Satellite Payload includes the Global Ozone Monitoring Experiment (GOME)designed to measure a range of atmospheric trace constituents with particular emphasis on globalozone distribution. Good data quality assessment (QA) is essential for the scientific acceptance ofthe GOME data products. This paper presents the QA system used during the operationalprocessing of GOME data. A set of QA indicators of key GOME Level 1 and Level 2 parametershas been carefully selected. The Level 1 indicators are based on instrument performance andphysical constraints like mean values of science data, ratios of PMD and science channel readouts,start and end wavelength of each channel and ratios of GOME sun spectra compared to a referencespectrum. The Level 2 indicators show climatological constraints in the form of ozone and NO2vertical columns histograms for each orbit with their corresponding errors and monthlyclimatologies for ozone and NO2. The QA indicators as well as statistics on the viewing mode ofGOME and quicklooks showing the ground-track for each orbit are stored in a QA database. TheQA database is accessed through a QA tool implemented as a Java applet that runs on standardbrowsers. The QA tool can plot time series of QA indicators, showing possible limit violations,and it has several additional features like for example the possibility to select a specific productusing orbit number, acquisition time or geographical coordinates. The routinely GOME QAprocessing runs automatically. Human intervention is limited to checking of the QA indicators andflagging of the products with low quality. Such an automatic QA system is especially importantduring the reprocessing period where up to 200 orbits can be processed per day. The GOME QAsystem demonstrated to be very useful for finding and for the detailed investigation of "anomalies"not only with the data products, but also with the GOME sensor itself.
DEGRADATION OF UV EARTH RADIANCE OBSERVATIONS BYGOME
Tanzi Cristina P.
E-mail: [email protected]
Sorbonnelaan 2Telephone: 0031302538585
Fax: 0031302540860
Co-author/s:R. Snel and I. Aben Space Research Organization Netherlands, SRON Sorbonnelaan 2,NL-3584CA Utrecht, The [email protected], [email protected] Tel. 0031-30-2535600Fax 0031-30-2540860
ABSTRACT
Degradation of optical components in space is a problem affecting many remote sensingintruments. The degradation of the Global Ozone Monitoring Experiment (GOME) is monitoredin-flight by observing either the sun or, occasionally, the moon. The solar measurements areacquired daily and therefore best allow to monitor the degradation of GOME. The lightbackscattered by the Earth's atmosphere follows however a different optical path through thespectrometer than solar irradiance. Because of the absence of a reference source for Earthradiances, the effect of the instrument degradation on the accuracy of Earth albedo is difficult todetermine. In this paper we will show how the accuracy of Earth albedo measurements can bedetermined by identifying a range of Earth radiance targets suitable for monitoring degradation inthe UV. The choice criteria, and their uncertainties, will be determined by means of a doublyadding radiative transfer code. These targets, with identical solar illumination and similar ozonecolumns, will yield information year after year on the degradation of the instrument along theEarth radiance path. Moreover, this information can be directly compared with the degradationobserved for Moon radiance measurements, which are acquired with a different angle of the scanmirror but otherwise follow the same optical path in the instrument. In addition, the GOMEinstrument is polarization sensitive: the measurement of the degree of polarization of the incominglight is necessary for the radiometric calibration of earth radiance, but not for solar irradiances,which are not polarized. It follows that the sun is not a viable calibration target for degradationphenomena which might affect polarization measurements.Zonal averages of the Earth radiancesmeasures by the Polarization Measuring Devices will also yield additional information on the waythat Earth albeod measurements are affected.
RING EFFECT STUDIES FOR A CLOUDY ATMOSPHERE USINGGOME DATA
De Beek Rüdiger
E-mail: [email protected] of Environmental Physics/Remote Sensing
University of BremenKufsteiner Str., Geb. NW1
Telephone: 0049-421-2184584Fax: 0049-421-2184555
Co-author/s:M. Vountas, IUP/IFE, University of Bremen, Kufsteiner Str, Geb. NW1, 28359 Bremen,E-mail: [email protected], Telephone: 0049-421-2184584,Fax: 0049-421-2184555.V. V. Rozanov, IUP/IFE, University of Bremen, Kufsteiner Str, Geb. NW1, 28359 Bremen,E-mail: [email protected], Telephone: 0049-421-2184582,Fax: 0049-421-2184555.A. Richter, IUP/IFE, University of Bremen, Kufsteiner Str, Geb. NW1, 28359 Bremen,E-mail: [email protected], Telephone: 49-421-2184474, Fax: 0049-421-2184555.J. P. Burrows, IUP/IFE, University of Bremen, Kufsteiner Str, Geb. NW1, 28359 Bremen,E-mail: [email protected], Telephone: 0049-421-2184548,Fax: 0049-421-2184555.
ABSTRACT
Filling-in of spectral features observed in scattered sunlight lead to what is known as the "RingEffect". The Ring Effect can have significant consequences for the retrieval of atmosphericconstituents if not adequately corrected. As clouds also have strong impacts on the radiativetransfer in the UV/visible spectral range, possible changes of the Ring Effect due to clouds have tobe considered. Such investigations require radiative transfer modelling including both cloud andRing features. This is provided by the radiative transfer model SCIATRAN, developed at theInstitute of Environmental Physics/Remote Sensing (IUP/IFE), University of Bremen. UV/visiblemeasurements from GOME and also ground-based measurements, both taken under cloudyconditions, have been used to validate model spectra, adequately calculated with SCIATRAN byincluding Ring and cloud modelling. A number of different cloud scenarios have been taken tosimulate measured radiances in both ground and satellite geometry. Retrievals of NO2 from thesespectra have been investigated using the differential optical absorption spectroscopy technique.Resulting errors using different Ring spectra in the retrieval have been derived. Results of thevalidation and the model study will be presented, which are used to clearly explain the sources ofvariable filling-in of Fraunhofer and absorption structures in the presence of clouds.

RETRIEVING SPECTRAL REFLECTIVITIES FROM EXTRACTEDGOME INSTRUMENT HEADER DATA
Ankie Piters
E-mail: [email protected]
P.O. Box 201Telephone: 00-31-30-2206433
Fax: 00-31-30-2210407
Co-author/s:Van der A Ronald, E-mail: [email protected], Telephone: 0031 30 2206412,Fax: 0031 30 2203028, Ronald van der A, Jos van Geffen, Roeland van Oss, and Pieter Valks,KNMI, PO Box 201, 3730 AE De Bilt, The Netherlands
ABSTRACT
The Extracted GOME Instrument header (EGOI) data, which are available near-real time andcontain parts of the UV-Vis spectra, are used in the retrieval of ozone columns and profiles. Thiswork is done in the framework of the ESA-DUP project GOFAP.
The level 0-1 algorithms used are based on the GOME Data Processor (GDP) algorithms of DLR,but there are several differences. The corrections for straylight and polarisation sensitivity differfrom the GDP algorithms in order to account for the limited spectral information in the EGOI data(only nine small spectral windows are available).
Detailed validation studies have resulted in several improvements in the level 0 to 1 algorithms.These comprise the wavelength calibration, correction of Peltier cooler interference, correction forpolarisation sensitivity and correction of the effective reflectivity degradation. This paper gives anoverview of the level 0-1 processor.
PRECISION ESTIMATES FOR TRACE GAS PROFILE RETRIEVALSFROM SCIAMACHY LIMB MEASUREMENTS
Kaiser Johannes W.
E-mail: [email protected] of Remote Sensing, University of Bremen
FB 1Telephone: 0049 421 218 4352
Fax: 0049 421 218 4555
Co-author/s:Rüdiger de Beek, Michael Buchwitz, Vladimir V. Rozanov, and John P. Burrows
ABSTRACT
The limb measurements of SCIAMACHY provide a unique opportunity to retrieve stratosphericconcentration profiles for atmospheric trace constituents. For a strong absorber like O3 profileinformation can be derived for the free troposphere and the lower mesosphere.
The precisions of the anticipated profile retrievals are studied using a fully spherical radiativetransfer model, which computes weighting functions for the trace gas profiles quasi-analytically.This model is combined with an instrument model incorporating realistic signal/noise and field-of-view integration of SCIAMACHY to produce retrieval variances according to the optimalestimation formalism by Rodgers.
Thus the precisions of retrieved profiles of O3, NO2, ClO, BrO, SO2 and OClO in severalmeasurement scenarios, i.e., mid-latitude, polar and ozone-hole polar, are estimated. Theseestimates describe the theoretical limits for the SCIAMACHY limb data products. The influencesof other potential error sources like data processing uncertainties have to be investigated afterlaunch.
By comparison of SCIAMACHY's retrieval precisions to those of other instruments aboardEnvisat overlaps can be identified which enable a validation of both instruments by a cross-comparison of their retrieval results.
A NEW RADIATIVE TRANSFER MODEL FOR A SPHERICALPLANETARY ATMOSPHERE
Rozanov Vladimir
E-mail: [email protected] of Remote Sensing, University of Bremen
P.O. Box 330440Telephone: 0049 421 218-4582
Fax: 0049 421 218-4555
Co-author/s:A. Rozanov, J. P. Burrows
ABSTRACT
A new radiative transfer model suitable to calculate the radiation field in a spherical planetaryatmosphere has been developed. The developed approach involves the Picard iterativeapproximation to solve the radiative transfer equation in its integral form. The radiation fieldcalculated by solving of the differential radiative transfer equation in a pseudo-sphericalatmosphere is used as initial guess for the iterative scheme. This approach has on the one hand thesame advantages and is on the other hand much more computationally efficient as compared to theMonte-Carlo method. The developed radiative transfer model has been verified using a Monte-Carlo radiative transfer model. The relative difference between the radiance at top of atmospherecalculated by both models has a typical value of less than 1.
MEASUREMENTS OF LIGHTNING-PRODUCED NO2 BY GOME AND LIS
Hild Lars
E-mail: [email protected] of Environmental Physics University of Bremen
P.O. Box 33 04 40Telephone: 0049 421 218 7006
Fax: 0049 421 218 4555
Co-author/s:A. Richter, J.P. Burrows
ABSTRACT
The budget of the nitrogen oxide (NOX) production by lightning is difficult to establish becausethe dynamics of a thunderstorm disturb NOX-measurements from both in-situ and remote-sensingtechniques. Also, the interpretation of the measurements is complicated by the in homogeneity ofclouds and transport effects. Therefore, only a rough estimate of 2-20 TgN/a of global NOX-production by lightning is possible up to know. In this study, some examples of NO2-production inthunderstorms are analysed using NO2-measurements from the European satellite spectrometerGlobal Ozone Monitoring Experiment (GOME). Lightning data measured by the NASA-satelliteproject Lightning Imaging Sensor (LIS) are used to identify lightning events coinciding withGOME measurements.
GOME DATA ANALYSIS AND GROUND-BASED IN THEMEDITERRANEAN AREA DURING ETNAVOLCANO ACTIVITY
Giovanelli Giorgio
E-mail: [email protected] - CNR
Via Gobetti 101Telephone: 0039-051-6399591
Fax: 0039-051-6399652
ABSTRACT
The ozone decline at mid-latitude can be explained by three different and concomitantmechanisms: - loss inside the arctic vortex and subsequent transport of low-level ozone air massesto mid latitude - local process - chlorine activation on extra-vortices PSCs
A collaborative study is started with the aim to address the first two questions by means of analysisof satellite (GOME) data, integrated by ground-based (DOAS) and balloon measurements.Furthermore we are verifying the use of GOME data for measuring volcanic (and possiblyanthropogenic) emission of SO2 in the Mediterranean area, in order to estimate climatic impact ofvolcanic emission and monitor potentially dangerous eruptive activity. The preliminary results arepresented.
TROPOSPHERIC OH PRIMARY PRODUCTION FROM ERS-2 DATA
De Winter-Sorkina Renata
E-mail: [email protected], Utrecht University
P.O. Box 80005Telephone: 00 31 30 2533271
Fax: 00 31 30 2543163
ABSTRACT
In order to calculate the OH production rate from satellite measurements, one has to estimate thefollowing quantities:o Profile of the photodissociation rate of ozoneo Tropospheric ozone profileoTropospheric water vapour profile. The estimation of tropospheric OH primary production ratefrom ERS-2 data is demonstrated. The tropospheric ozone profiles retrieved by RAL from GOMEnarrow-swath mode (40 km by 80 km) available via BADC were used. The tropospheric actinicflux profile and photodissociation rates of ozone are calculated from GOME and ATSR-2measurements using the TUV radiation model with the DISORT radiative transfer code. Forpartially cloudy GOME ground pixels the photodissociation rates are approximated as a linearcombination from the clear-sky and the fully cloudy cases according to an independent pixelapproximation. Total ozone, ozone profile, NO2 column, spectral albedo at the top of theatmosphere (TOA), UTC date and time of pixel at the end of integration time, and ground pixellocation coordinates are used in the TUV model from the GOME measurements. Thick cloud, thincloud and cloud free fractions for GOME FOV and the thick and thin cloud top height are usedfrom the ATSR-2 measurements processed by RAL and available via BADC. Additionally, themean reflectance of ATSR-2 555 nm and 659 nm channels for thick cloud, thin cloud and cloudfree are used to determine the cloud optical thickness using the radiative transfer model. Next, thefitting of simulated GOME albedo spectra at the TOA with the measured ones is performed. Theeffective wavelength dependent surface albedo for GOME pixel is determined, cloud opticalthickness within the error bars is optimised and for cloud free GOME pixels the aerosol extinctionis changed if needed to fit with the albedo at TOA measured by GOME. The water vapour contentfrom the ATSR Microwave Sounder is used to estimate the tropospheric OH primary productionrate. The estimates are made as well using the NOAA-14 RTOVS layer precipitable water for 3layers between 1000 and 300 mb, and DMSP F14 SSM/T-2 water vapour mixing ratios at 15levels from 1000 mb to 300 mb.
SURFACE UV FLUX ESTIMATION FROM GOME: IMPACT OFCLOUDS AND WAVELENGTH DEPENDENT EFFECTIVE ALBEDO
Coldewey Melanie
E-mail: [email protected] for Environmental Physics
P.O. Box 330 440Telephone: 0049-421-218-4584
Fax: 0049-421-218-4555
Co-author/s:Mark Weber, Institute for Environmental Physics, University of Bremen, Germany Vladimir V.Rozanov, Institute for Environmental Physics, University of Bremen, Germany John P. Burrows,Institute for Environmental Physics, University of Bremen, Germany
ABSTRACT
GOME satellite measurements deliver global top of the atmosphere sun normalized radiances inthe spectral range of 240-790 nm with a spectral resolution of 0.2-0.4 nm. Using ozone and cloudinformation from spectral inversion, surface UV flux and actinic flux can be determined. CurrentUV satellite methods (e.g. TOMS derived UV-B irradiances) usually employ only one discretewavelength assuming a constant effective albedo for the entire spectral UV range. The reflectivityat 360 or 380 nm is considered to be representative.
In this study an attempt is made to take into account the wavelength dependent UV surface albedoto derive the surface flux. For various surface properties as vegetation, soil or ocean, preliminaryresults of estimating a typical wavelength dependence are given. Relating the cloud effectivealbedo to cloud optical depth makes it possible to obtain an improved cloud transmission estimateas a function of wavelength. Preliminary results from the comparison with ground-based UVsurface flux measurements will be presented.
TROPOSAT: THE USE AND USABILITY OF SATELLITE DATA FORTROPOSPHERIC RESEARCH
Borrell Peter
E-mail: [email protected]&PMB ConsultantsEhrwalder Strasse 9
Telephone: 00-8821-73981Fax: 00-8821-625655
Co-author/s: *ABSTRACT
While the measurement of stratospheric gases was the primary goal of the current satelliteinstruments, the newly-gained capability of observing tropospheric trace gas distributions (such asNO2, O3, SO2, HCHO, BrO, or water vapour) with space-borne sensors can truly be regarded as arevolutionary step in the technical development and will lead to a significant enhancement of ourcapability of investigating the chemistry and physics of the troposphere. To explore and encouragethe use of satellite data for tropospheric research a new subproject, TROPOSAT, has been formedwithin EUROTRAC-2, the EUREKA project studying the transport and transformation ofpollutants in the troposphere. The aim of TROPOSAT is to determine two- and three- dimensionaldistributions and time series of trace gases and other parameters in the troposphere and so facilitatefuture research and environmental monitoring on regional and global scales, in particularthrough:* the development of algorithms for the retrieval of tropospheric species and parameters; *the use of satellite data for understanding atmospheric processes; * the synergistic use of differentinstrumentation and platforms for tropospheric measurements; * the development of validationstrategies for tropospheric satellite data products. In addition TROPOSAT will undertake otherunderpinning and derived activities such as the development of appropriate data assimilationtechniques combining satellite measurements with modelling, and the specification of therequirements for future satellite instruments for tropospheric work. The poster describes theorganisation and scientific work of the project and will present recent results on regionaltropospheric distributions of NO2, BrO and SO2.
*Ulrich Platt, University of Heidelberg Institut für Umweltphysik,Im Neuenheimer Feld 229,D-69120 Heidelberg, Germany, Tel.: 00 49 6221 546339,E-mail: [email protected], Fax: 00 49 6221 546405.John P. Burrows,University of Bremen Institut für Umweltphysik/Institut für Fernerkundung,Kufsteinerstr., D-28395 Bremen, Germany, Tel.: 00 49 421 218 4548,E-mail: [email protected], Fax: 00 49 421 218 4555.Peter Borrell, P&PMB Consultants, Ehrwalder Straße 9,D-82467 Garmisch-Partenkirchen,Germany, Tel: +49-8821-73981, E-mail: [email protected], Fax: +49-8821-625655.Martin Dameris, Institut für Physik der Atmosphäre, DLR-Oberpfaffenhofen, D-82230 Wessling,Germany, Tel.: +49-8153-281558, E-mail: [email protected], Fax: +49-8153-281841.Albert P.H. Goede, Space Research Organization Netherlands (SRON), EOS division,Sorbonnelaan 2, 3583 CA Utrecht, Netherlands, Tel.: +31 30 253 8579, E-mail: [email protected],Fax: +31 30 254 0860Hennie Kelder, KNMI (Royal Netherlands Meteorological Institute), P.O. Box 201, 3730 AE DeBilt, The Netherlands, Tel.: 00 31-30-2206472,, E-mail: [email protected], Fax: 00 31-30-2210407 .Paul S. Monks, University of Leicester, Department of Chemistry, University Road, Leicester LE17RH, UK, Tel.: +44-116-252 2141,E-mail: [email protected], Fax: +44-116-252 3789.

Co-author/s (cont):Andreas Richter, University of Bremen, Institut für Umweltphysik, Kufsteinerstr., D-28395Bremen, Germany , Tel.: 00 49 421 21 8 4474, E-mail: [email protected] , Fax: 00 49 421 218 4555.Herman G.J. Smit, Research Centre Jülich / , P.O. Box 1913 , , 52428 Jülich, Germany, Tel.: 00-49-2461-613290, E-mail: [email protected] , Fax.: 00-49-2461-615346.Thomas Wagner, University of Heidelberg, Institut für Umweltphysik, Im Neuenheimer Feld 229,D-69120 Heidelberg, Germany , Tel : 00 49 6221 546314 , e-mail: [email protected] , Fax: 00 49 6221 546405.
GOME OBSERVATIONS OF FORMALDEHYDE
Wittrock Folkard
E-mail: [email protected] of Environmental Physics
University of BremenKufsteiner Str.
Telephone: 00494212184585Fax: 00494212184555
Co-author/s:Annette Ladstätter-Weißenmayer Andreas Richter John P. Burrows
ABSTRACT
Formaldehyde indicates and supports photochemical activity in the atmosphere. Large amounts areexpected to found in industrial areas and during biomass burning. HCHO is a major intermediatein the degradation of methane (and many other hydrocarbons). In the absence of heterogenouslosses, essentially every methane is molecule is converted to HCHO. Therefore it is foundthroughout the troposphere. It is destroyed via photolysis and reaction with OH.
GOME is the first instrument that allows measurements of Formaldehyde on a global scale. Thisstudy presents the seasonal and regional variation since launch of ERS-2 in 1995.
During large biomass burning events in Indonesia, South Africa and South America verticalcolumns of up to 2*10exp16 molec/cm2 are found. Other regions with high excess of HCHO arethe Southeast of the United States, Eastern Europe, Southeast Asia and India depending on theseason. Possible sources and the influence on the tropospheric photochemistry and in particular onthe ozone production will be discussed in this study.
ERS SAR IMAGING OVER THE BRAZIL-MALVINAS CONFLUENCEAND ARGENTINE COASTAL WATERS; ITS USEFULNESS FOR
DIFFERENT OCEAN ACTIVITIES
Gagliardini Domingo Antonio
E-mail: [email protected] - Instituto de Astronomia y Fisica del Espacio (IAFE)
Pabellon IAFE, Ciudad UniversitariaTelephone: 00541147832642
Fax: 00541147868114
ABSTRACT
Argentina is one of the South American countries with a very long coastline, of approximately4725-km, extending from the southern coast of the La Plata estuary down to Cape Horn. Thiscoastline includes one peninsula and a considerable number of bays, gulfs, and straits. Thedynamics of the water masses bordering these coasts consist of different littoral drift currentsinfluenced by the flow of the La Plata River, other secondary river affluents and the Magallanstrait. Further offshore, the Western South Atlantic Ocean is dominated by the encounter of thepoleward-flowing Brazil Currents and the ecuatorward Malvinas (Falkland) Current. Thisencounter occurs near the entrance of the La Plata River estuary, roughly between 35º and 40º Sand is referred to as the Brazil-Malvinas Confluence. Multiple meanders, eddies and filaments mayappear in this area, resulting in an extensive mixing zone with SST gradients that can exceed 10º Cover a distance of only a few kilometers. The argentine Comisión Nacional de ActividadesEspaciales inaugurated its satellite receiving station in Falda del Carmen, Cordoba, in 1997. Fromthen on, a large volume of data of the coast and the Western South Atlantic Ocean is beingacquired. In this paper, a selection of ERS SAR images from this source and from two ESA PilotProjects, are presented and discussed. They provide a variety of radar backscatter patterns over theBrazil-Malvinas confluence and argentine coastal waters. The sensibility of microwaves to anumber of atmospherics and ocean phenomena are shown, among them: wind fronts, atmosphericgravity waves, rain cells, current boundaries, eddies and internal waves. Also, the capability of thistype of information to reveal natural films, oil spills, ships and ship wakes and bathymetricfeatures is shown. This set of images is a good example of the usefulness of this type ofinformation for different activities in the region, such us: fishery, transport, petroleum and gasextraction, recreation, scientific, etc.
OBSERVATION OF SEASONAL VARIATIONS OF THE NORTHCASPIAN COAST VEGETATION COVERS BASED ON ERS-2 SAR
MULTITEMPORAL DATA RECEIVED IN 1999 YEAR
Kucheryavenkova Irina
E-mail: [email protected] of Radioengineering and Electronics, Russian Academy of Sciences
Vvedensky sq. 1Telephone: 007 095 5269047
Fax: 007 095 7029572
Co-author/s:Zakharov Aleksander I., Kravtsova Valentina I., Baldina Elena A., Labutina Irina A.
ABSTRACT
This work has been carried out as a part of AO-3 project "Observation of Caspian coastalevolution caused by rise of the sea level" because the study of the evolution of this nature complexfrom year to year is not possible without a consideration of seasonal variations of the coastalvegetation covers. Analysis of the multitemporal (May, June, July) ERS-2 data on the area ofinterest has been carried out and dynamics maps of vegetation covers have been generated. Threecoastal areas were researched - Kalmykia coast and Damchiksky and Obgeorovsky regions ofAstrakhansky Biosphere Reserve. Seasonal dynamic differences allowed us to classify three zoneson the maps of estuary parts, there are marine part of estuary covered by water vegetation, reedgrowth drainage zone and dry land that is an alluvial plain, cut by rivers arms and covered bymeadows and fields. One more zone is detected in the Kalmykia coast, it is a zone of semi-desertvegetation. Dark spots in the images received in June pointed places of underwater vegetationwhich will appear only in July in the north of estuary, but in the south of one such vegetation(lotus etc.) appears in June on the water surface (sigma-naught is increased). The reed growthdrainage zone has close values of sigma-naught on all these images because backscatteringproperties of reed growth are stable from May to July. The meadows vegetation on alluvial plainappeared in the May, and the sigma-naught increased in June and in July along the rivers arms butin the distance of the rivers sigma-naught of meadows and semi-desert vegetation decreased inJuly. Numerous agricultural lands have their original seasonal dynamics.Use of ERS SARmultitemporal data allowed to differ seasonal dynamics of the coastal vegetation covers.
ON THE USE OF ERS INSAR DATA FOR CLASSIFICATION OFCOASTAL COVER TYPES AND DETECTION OF FAST VARIATIONS
OF WATER LEVEL
Kucheryavenkova Irina
E-mail: [email protected] of Radioengineering and Electronics, Russian Academy of Sciences
Vvedensky sq. 1Telephone: 007 095 5269047
Fax: 007 095 7029572
Co-author/s:Zakharov Alexander
ABSTRACT
The AO-3 project "Observation of Caspian coastal evolution caused by rise of the sea level"included the use of ERS INSAR data for classification cover types. Single-look complex dataobtained in tandem mission on 2 May and 3 May 1996 were used to study a possibility ofclassification of coastal cover types and the detection of the coast modifications between thesessions. Combined pseudo-color images consisted of multitemporal images plus coherence mapshave been generated and used to classify the coverage types and to study fast modifications oftheir state. Numerous types of surface coverage have been classified. Among them are open watersurfaces of sea and internal reservoirs, water surfaces covered by vegetation, reed growth,meadows, fields, plowed lands, forests, flooded lands, urban zones, salt-marshes etc. A series ofthe fast variations such as appearance new plowed lands, modifications of soil moisture andmodifications in reed growth drainage zone were detected.. The interferogram, representing thesurface topography and surface dynamics have been generated. Analysis of combined pseudo-color images and interferogram results in new information. The level of islands borders and someshore borders covered by reed growth was displaced up to 15 cm within one day betweenobservarions. We suppose that a reason is a drop of the scattering surfaces level followed by a fastdrop of sea level. This may be results of siccus, occurred in Caspian sea at that time. We supposethat interferometry may be used to classify a density of coastal covers and detection of fastvariations of water level.
COASTAL CHANGES AND THE ROLE OF MANGROVE ANDMORPHOLOGICAL FEATURES ON THE DYNAMICS AND
PRODUCTIVITY OF THE NE-BRAZILIAN OCEANIC WATERS
Martínez-Benjamin Juan José
E-mail: [email protected] Politécnica de Catalunya
Dpto. Fisica Aplicada/E.T.S. Ingenieros de Caminos, Canales y PuertosGran Capitan s/nTelephone: 0034-934017057
Fax: 0034-934016090
Co-author/s:Carmen Medeiros (PI, Departamento de Oceanografia, Laboratorio de Oceanografia FisicaEstuarina e Costeira, Universidade Federal de Pernambuco, Av. Arquitectura s/n, CampusUniversitario, 50.739-540, Recife, PE-BRASIL, Telephone: 55-812718225,E-mail:[email protected]), Juan J. Martinez-Benjamin (Co-I)
ABSTRACT
The coast of Pernambuco in Brazil is drained by several small rivers, all surrounded bymangroves. Due to the small load of continental sediments and characteristics of the area (waveregime, climate, topography, etc) this coast is vulnerable to erosional process. At the last fewdecades, erosional problem has largely increased, in part due to the lack of planning of coastaloccupation and in part due to the construction of pier, sea walls, etc, by private initiative. Thisconstruction while aimed to resolve point-problem has caused disturbances in much larger areas.Analysis of SAR images have been proved useful for monitoring coastal dynamics and studies ofsedimentation and erosion zones. ERS images, C-Band, VV Polarization in ascending orbits havebeen used. The SAR scenes correspond to ERS-1 (orbit 25240, 13 May 1996 and orbit 25469, 29May 1996) and ERS-2 (orbit 05295, 25 April 1996 and orbit 05796, 30 May 1996). Also oneRADARSAT image, C-Band, HH Polarization, of the NE-Brazilian coast has been used. It wastaken on 8 September 1997 on a descending orbit. The beam mode was ScanSar Wide. The goalsand results of the study have been related to the use of SAR ERS images to position morphologicalfeatures, to trace coastline evolution and detect changes in mangrove coverage. Particular attentionhas been applied to: 1) Identify and map coastal features such as reefs in Recife and Olinda,sandbars, banks and marine structures as Suape Harbour, 2) Characterize mangrove vegetation asin the Itamaraca island. Finally the results have been compared with RADARSAT image.The workhas been made in the framework of ERS AO3-137 project(C. Medeiros, PI, J. M.Benjamin,Co-I).
CLEAN SEAS: A NORTH SEA TEST SITE
Snaith Helen
E-mail: [email protected] Oceanography Centre
JRD, SOC,European WayTelephone: 44 23 8059 6410
Fax: 44 23 8059 6400
Co-author/s:Gordon W Jolly, Antoine Mangin, Martin Gade, Vittorio Barale, Ove Rud, Miho Ishii
ABSTRACT
Over three years, the Clean Seas project team focused on the problem of monitoring marinepollution and the role that existing earth observing satellites might play. Here we present someresults from the North Sea test site, examined in detail during a two-year acquisition campaign.We have examined synergy within the data from radar, optical and infrared sensors, in conjunctionwith hydrodynamic models. The North Sea test site is a region where river discharges can be seenfrom satellite imagery to have an influence on the local sea conditions. The Rhine discharge intothe continental coastal waters can be clearly seen in satellite imagery. These waters remain as adistinct water mass around the west and north coasts of the Netherlands, continuing east toDenmark. We chose to look at sediment dispersal patterns from the Rhine discharge, as anindicator of the types of pollution that the Clean Seas approach of combined remote sensing andmodelling might tackle well. We present results from two test periods, August 1997 and May1998, during which several interesting hydrodynamic and turbidity patterns were observed in SST,colour and SAR images. AVHRR data were used for model boundary conditions, whilst the higheraccuracy ATSR data were used for validation of the model results. Sediment distribution patternsfrom the model were verified using "chlorophyll concentration" data from MOS and SeaWiFS. Inturbid coastal waters such as those along the Dutch coast, the chlorophyll algorithms are corruptedby high sediment loads and become indicators of suspended sediment. In conjunction with thevisible channels of AVHRR and ATSR, they give an uncalibrated measure of the sediment load.During the test periods studied, there was good correlation between the data sources, e.g. betweenSST and ERS-2 SAR images for August 97. Both data sets showed the development of fine plumestructures close to the Rhine outflow, apparently associated with the outflow, and possibly causedby tidal pulsing of the Rhine Plume. Although the model reproduced the general temperature andsediment distributions well, these fine structures were not reproduced. In the North Sea test site,we see the importance of using a model to alleviate the problems of remote sensed data intemperate coastal climates, where both cloud cover and wind speed act to restrict the amount ofuseful data. Future missions with coincident infrared, visible and active microwave data willimprove the options for combining data. However, using the model we will still be able to see amore complete picture of the way the Rhine plume disperses over time than will be evident fromthe remote sensed data alone.
TOPOGRAPHIC MAPPING OF THE GERMAN TIDAL FLAT AREASUSING ERS-SAR IMAGES
Klocke Britta
E-mail: [email protected] of Environmental PhysicsUniversity of Bremen
P.O. Box 330 440Telephone: 00494212184726
Fax: 00494212184555
Co-author/s:Jens Dannenberg, Ralf Schmidt, Sylvin Mueller-Navarra, Georg Heygster
ABSTRACT
The tidal flats of the Wadden Sea along the coast of northwest Germany are highly dynamic areaswhose topography changes on timescales from a few hours (storm events) up to several months(sediment ablations and disposal). Conventionally generated maps based on echo sounding andgeodetic leveling techniques often do not represent the actual situation because it takes severalyears to map the complete Wadden Sea. With the help of remote sensing data, especially ERS-SAR images, it is possible to achieve a more frequent updating of the topographic maps of tidalareas between high and low water level using the 'waterline method'. For this purpose waterlines inERS-SAR images acquired at different tidal levels are extracted. After geocoding the SAR images,each point of the extracted waterlines is assigned to a water level provided by a water level modelto represent the height of the sea bottom. The operational model of the German Maritime andHydrographic Agency (BSH) calculates currents and water levels based on forecasts of wind andair pressure above the North Sea. The heights of the points along each waterline form a randomgrid of topographic points with a wide spacing when the gradient of the sea bottom is flat and anarrow spacing when the gradient is steep. A digital elevation model is derived from this irregulargrid by triangulation and interpolation using the software package TASH (TopographischesAuswertesystem der Universitaet Hanover) which is based on the Delaunay triangulation method.The results of the 'waterline method' are evaluated by comparing the interpolated topography todata aquired by echo sounding and geodetic data and can be included in conventionally derivedmaps.
MONITORING BLUEFIN TUNA HABITS WITH THE HELP OFSATELLITE ENVIRONMENTAL DATA: ERS EXPERIENCE WAITING
FOR ENVISAT
Cataldo Mariangela
E-mail: [email protected] Italia
S.P. per Casamassima Km 3Telephone: 00390804670611
Fax: 00390804670610
Co-author/s:Giovanni Sylos Labini - Planetek Italia - [email protected] Gregorio De Metrio - Department ofAnimal Production, University of Bari - [email protected]
ABSTRACT
Many studies have provided evidence of a deep correlation between several parameters (notablyclimate, physical and chemical conditions of the marine environment and food-chain processes)and tuna fishes spatial distribution and displacements.
Some theories suggest that tunas follow the warm water fluxes in search of food. Actually, eventhough the upwelling (deep water rich in minerals and nutrients rising to the surface) takes place incold waters, secondary production organisms (zooplankton and micronekton) which feed tunas arepushed from the cold waters where they are generated to the warm pools.
Objective of European Community project "Study of Eastern Atlantic and Mediterranean bluefintuna migrations using Pop-off satellite tags" (Fair CT97-3975) is to get more precise informationabout bluefin tunas migration patterns and spawning areas, in order to supply ICCAT(International Commission for the Conservation of Atlantic Tunas) with detailed stock assessmentinformation and EC with tools for a better management of resources.
On one side, tunas are tagged and their route is followed thanks to tags transmitted signalsreceived from the ARGOS satellite system. On the other side, the analysis of oceanographic data(Ocean Colour and Sea Surface Temperature) in the tunas crossed areas gives some hints atcorrelation between environmental parameters and fish behaviour.
In order to monitor environmental parameters ATSR, AVHRR data (SST) and SeaWiFS level-2geophysical data (in particular chlorophyll concentration) have been chosen. The criteria for dataacquisition have been changed during the project together with those for working out otherplanned activities. Many unforeseen problems have troubled the first project phase, giving hints atnew research procedures.
NUMERICAL MODEL OF WAVE SPECTRA REFRACTION BYTOPSAR POLARISED DATA
Maged Marghany
E-mail: [email protected] Institute for Aerospace Survey & Earth Sciences (ITC)
Division of Applied Geomorphological SurveysHengelose straat 99 P.O. Box 6
Telephone: 0031-534874285Fax: 0031-534874336
Co-author/s:Maged Marghany International Institute for Aerospace Survey & Earth Sciences (ITC) Division ofApplied Geomorphological Surveys Visiting adress: Hengelose straat 99 P.O. Box 6, 7500AA Enschede, The Netherlands
ABSTRACT
This paper presents work done utilizing TOPSAR data to detect wave refraction patterns alongTerengganu coastline. TOPSAR data was used to extract information on wave spectra. This wavespectra wave used to model the wave refraction patterns. For this purpose, 2-DFFT was appliedwith a selective window size of 100 x 100 pixels and lines to present wave spectra refractionpattern. The quasi-linear model was used to model the real wave spectra into TOPSAR wavespectra. A composite image of wave spectra summation was used to detect the wave refractionpattern. The gamma filter was then applied to detect the area of wave convergence and wavedivergences. The density spectra for the convergence and divergence waves were used to modelthe energy spectra along the wave orthogonal.
The results show that L-band is more suitable for detecting wave spectra refraction patterncompare to C-band. The maximum convergence spectra energy is found near to the SultanMohamed Airport. The wave spectra model had a good correlation with L-HH polarised bandcompare to L-HV band and C-VV band. This means that the L-HH polarised band are suitable todetect the wave refraction pattern.
It can be concluded that wave refraction pattern could be detected by polarised data. The polariseddata of L-band has a more potentials for monitoring wave spectra refraction pattern.
WAVE REFRACTION PATTERN AND COASTAL EROSION
Maged Marghany
E-mail: [email protected], [email protected] Institute for Aerospace Survey & Earth Sciences
(ITC) Division of Applied Geomorphological SurveysHengelose straat 99 P.O. Box 6
Telephone: 0031-534874285Fax: 0031-534874336
ABSTRACT
Waves play an important role for shoreline configuration. Wave pattern could induce erosion andsedimentation. The main objective of this study to model the wave refraction effects on shorelinechange. Polarised TOPSAR data and ERS-1 data are used for this purpose ERS-1 data are taken in8 th August 1993 and polarised TOPSAR data was taken in 6 th December 1996. For this purpose,2-DFFT was applied with selective window size of 100 x 100 pixels and lines to present wavespectra refraction patterns. The simulation of quasi-linear model was used to model the rate ofshoreline change. The vectors of shoreline were used to compare with wave spectra model in orderto exam the accuracy of coastal erosion model. The results show that the wave refraction patternmodeled from TOPSAR data have a good correlation with the quasi-linear model compare to oneextracted from ERS-1 data. The dominated feature from TOPSAR data and ERS-1 is the wavespectra tend to converge along the Sultan Mahmud Airport, which means erosion event. Theshoreline rate modeled from vectors data of TOPSAR data and ERS-1 have a good correlationwith a quasi-linear model. In addition, L-band polarised data were more sensitive to detectshoreline change compare to C-band. In conclusion, wave refraction patterns are good index forshoreline erosion. The integration between polarised SAR data consider as a good tools forinvestigation of wave effects on shoreline change.
RESIDUAL CURRENTS MOVEMENTS AND OIL SPILLS TRANSPORT
Maged Marghany
E-mail: [email protected] Institute for Aerospace Survey & Earth Sciences (ITC)
Division of Applied Geomorphological SurveysHengelose straat 99 P.O. Box 6
Telephone: 0031-534874285Fax: 0031-534874336
Co-author/s:Maged Marghany ITC, The Netherlands
ABSTRACT
Oil Spill trajectory could be detected from radar data. Radar data such as Radarsat are good toolsfor oil spills movements. In this study the finite element model was applied with Dopplerfrequency shift to model surface water currents on the coastal water of Malacca Straits, Malaysia.This study was used the probability density function and time series analysis to predict oil spillmovements due to the effects of residual currents componets.
The results show that the water current on Malacca Straits moved in elliptical shape. The Majoraxis are parrallal to the coastline of Malaysia. The minor axis have a right angle with the coastlineof Malaysia. It is clear that the oil spills moved towards the coastline with constant current velocityof o.23 m/s and spread in small parcales along the coastal water of Malaysia. The time wasrequired for oil spills spreading was 12 hours.
In conclusion, the average current velocity of the time period play significant role for oil spillsspreading. The extraction of oil spills with current speed make Radarsat as good tools formodelling oil spills movements in coastal zone.
PRELIMINARY STUDIES FOR ENVISAT PROPOSAL (AO-ID-542):DETERMINING OFFISHERIES AND COASTAL MANAGEMENT PLAN
BY USING REMOTE SENSING TECHNIQUES IN LAKE VAN,EASTERN TURKEY
Sari Mustafa
E-mail: [email protected] Sensing Center of Yuzuncu Yil University
65080 Van, TurkeyTelephone: 00904322251401
Fax: 00904322251104
ABSTRACT
Lake Van is largest Soda Lake on earth. The lake covers a surface area 3574km2 and its volume607 km3, its elevation is 1650 m and average depth 171 mand the deepest point 451 m and its pHis 9.8. It is very suitable both in the feeding and living habitat for Chalcalburnus tarichi (localname Vanfish) that only one species lives into Lake Van and taken second row with a portion31after carp in the inland water fish production of Turkey. This project have been intended toinvestigate of following elements: Fisheries monitoring, understanding of lake coast process, seasurface temperature (SST), detection of pollution and coastal processes, identification of area forVan fish distribution, chlorophyll concentration and coastal dynamics, creating of new lakebatyhmetric map. In this project will be used ENVISAT data from AATSR, ASAR, MERIS andRA-2 sensors. Its also investigates a methodology by using a multi-stage approach and state of theart of the space technologies especially for SAR. This will increase the level of understanding andby applying the ENVISAT data used in Turkish research and academic institutions.
ENVIRONMENTAL REMOTE SENSING SYSTEM FOR COASTALWATER MONITORING (ENVISAT AO 560)
Caramizoiu Alexandra-Valentina
E-mail: [email protected] of Optoelectronics S.A.
111 Atomistilor StreetTelephone: 00401 7806640
Fax: 00401 4232532
Co-author/s:Alexandra Caramizoiu, Axente Stoica, Manuel Vais
ABSTRACT
Human activities that take place in the coastal zones (industry, tourism, fishing, aquaculture, etc)are affecting the environment. Also, human activities effects on the coastal environment can havea remote origin, and the observed effects are often difficult to relate to the causes, as they may donot appear immediately. The strong seasonal variations in tourist activity and in the associatedenvironmental pressures makes complicate the management of the coastal zones.
Finally, as a result of taking these interactions into account insufficiently or too late in the planningprocesses, human activities handicap each other and damage the environment.
The main objectives of the system are: - Integrate and assemble all environmental researches in theBlack Sea zone on the purpose of achieving a superior understanding of physical, chemical andbiological phenomena;- Create the structure of an operational system, partially independent ofbudget funds, having as inputs local measurements and researches and as output, specializedreports for different users (industrial, tourist industry, government);- Ensure the use of edgetechnologies in environmental monitoring, shortening the way innovative technologies have totravel to the commercial applications.- Create an environmental monitoring system that wouldcomply and support the European and international environmental legislation;- Provide anoperational system as decisional support for disaster and environmental monitoring.
An operational system, near real time effective can solve a great deal of these problems, especiallywhen related to early response. A structure of such a system is presented, adapted to the social-economic realities of Romania, together with some methodological aspects of the use dataprovided by ERS-1&2 and Envisat on-board sensors.
CHINESE PROGRESS TOWARD COASTAL AND MARINEAPPLICATIONS OF SPACEBORNE SAR
Huang Weigen
E-mail: [email protected] Institute of Oceanography State Oceanic Administration P. R. China
Xi Xi He Xia 9 HangzhouTelephone: 0086 571 8076924
Fax: 0086 571 8071539
Co-author/s:Jianfeng Lin, Changbao Zhou, Jingsong Yang, etc.
ABSTRACT
Images from the synthetic aperture radars (SARs) aboard the European Remote Sensing SatellitesERS-1/2, the Canadian Radarsat and the first Japanese Remote Sensing Satelllite JERS-1 havebeen used by Chinese marine community since 1991. This paper presents the recent progresstoward coastal and marine applications of the SAR images in China. Particular attention has beenpaid to mapping of coastal zone, observations of internal waves, and measurements of oceansurface winds.
OIL SPILL MONITORING IN THE MEDITERRANEAN SEA USING ERSSAR DATA
Nirchio Francesco
E-mail: [email protected] Space Agency
Loc. Terlecchia c.p. apertaTelephone: 0039 0835 377220
Fax: 0039 0835 339005
Co-author/s:Benedetto Fiscella, Università di Torino, Dip. di Fisica Generale, Via P. Giuria 1, 10125 Torino,Italy Tel. 0039011 6707411, Fax. 0039011 658444, email: [email protected] AntonioGiancaspro, Telespazio Geodesy Space Centre, Loc. Terlecchia 75100 - Matera, Italy Tel.0039.0835.377246; Fax 0039.0835.339005; e-mail: [email protected] PieroPavese, Istituto di Cosmogeofisica, C.N.R., Corso Fiume 4, 10133 Torino, Italy Tel. 00390116306800, Fax. 0039011 6604056, E-mail: [email protected] Paolo Trivero, Università delPiemonte Orientale " A. Avogadro". Corso Borsalino 54, 15100 Alessandria, ItalyTel. 00390131 283857, Fax. 0039011 254410, E-mail: [email protected]
ABSTRACT
Although SAR imagery is widely accepted as a valuable method in detecting oil spills, itsoperational use largely adopts subjective criteria to discriminate between slicks and other similarnatural features. In the present paper a set of image features are tested in order to select thoseuseful in detecting the oil spills.
Two different statistical approaches have also been developed in order to evaluate the probabilityfor a dark area to be a slick on a SAR image. A comparison of the results of the two methods isprovided. The advantages and the drawbacks of both are presented and discussed. Based on theprevious algorithms a SAR post processing imagery system has been developed. It can analyseboth in automatic or manual modality the ERS SAR PRI images in order to identify the slicks andto produce a detection report. The system functionalities, its performances and the operationalframework are described. The system validation activity has been carried out on two data sets, theone used to statistically characterise the slicks and on a new one. The results obtained are veryencouraging, showing about 85101153650 of correct classification in both the situations.
Last but not least, a comparison on the detection capabilities is performed, using as input to thesystem images with different spatial and radiometric resolutions. This analysis is devoted toidentify possible system parameters to reduce the time gap between the image acquisition and thedetection report availability.
WATER DYNAMICS IN THE KURIL STRAITS AREA: STUDY WITHERS SAR
Mitnik Leonid
E-mail: [email protected] Oceanological Institute, Far Eastern Branch, Russian Academy of Sciences
43 Baltiyskaya St.Telephone: 074232312854
Fax: 074232312573
Co-author/s:Vyacheslav Dubina, Vyacheslav Lobanov, and Tatyana Supranovich Pacific OceanologicalInstitute, Far Eastern Branch, Russian Academy of Sciences 43 Baltiyskaya St., 690041,Vladivostok, Russia Phone: 7-(4232) 312 854, Fax: 7-(4232) 312 573,E-mail: [email protected]
ABSTRACT
Synthetic aperture radar (SAR) images obtained from the ERS-1 and ERS-2 satellites are analyzedtogether with NOAA AVHRR imagery, weather maps and hydrographic CTD data to studypeculiarities of water dynamics in the southern Okhotsk Sea. The mesoscale features such aseddies of 100-150 km in diameter and fronts associated with the main currents were detected onthe AVHRR, while the SAR data provided evidences on the smaller scales of ocean structure.
Characteristic outlines of anticyclonic rings were clearly defined at wind speed of 3-10 m/s andwere likely associated with a modulation of the surface capillary-gravity waves by the currentshear. Some small-scale features of circulation were also found due to the presence of surfacefilms. Spatially organized compact vortex structures of 7-15 km in diameter were especially wellvisible in spring and fall periods, which correlates with a biological activity in the area. Amongthem cyclonic eddies are dominant outside of strong flows.
Rough bottom topography and strong tidal currents in the area of Kuril Islands are responsible forformation of rips, wakes and headland vortices, and packets of internal waves. Pattern of the shearfronts on the SAR images varies with a tidal phase. However the main areas of tidal energydissipation are tightly related to the bottom topography and are likely stable. Typical spatialpatterns of water dynamics and new fine details of the surface water structure are discussed.

GAMMA SAR AND INTERFEROMETRIC PROCESSING SOFTWARE
Werner Charles
E-mail: [email protected] Remote Sensing
Thunstrasse 130Telephone: 0041 31 9517005
Fax: 0041 31 9517008
Co-author/s:Urs Wegmüller Gamma Remote Sensing, Thunstrasse 130CH-3074 Muri b. Bern, Switzerland.Telephone: +41 31 951 70 05, Fax: +41 31 951 70 08, E-mail: [email protected]
ABSTRACT
The Gamma Modular SAR Processor (MSP), Interferometric SAR Processor (ISP), DifferentialInterferometry and Geocoding Software (DIFF&GEO), and Land Application Tools (LAT) aremodular software packages useful to process synthetic aperture radar (SAR) images. Data of bothspaceborne and airborne sensors including ERS-1/2, JERS-1, SIR-C, SEASAT, RADARSATStripMap mode, and the single-pass Dornier DOSAR interferometer have been successfullyprocessed interferometrically. Up-to-date algorithms were implemented to achieve accurateprocessing of the data while permitting timely processing of large data sets. Recent projectscompleted with the software were the SAR and interferometric processing of more than 700 JERSscenes in the frame of the SIBERIA project and the generation of subsidence maps for Bologna,Abano, and Mexico City. User-friendly display tools and full documentation in HTML languagecomplement the software. Both binary and source code licenses are provided.
Recent development included the adaptation of the software to PC operated under LINUX or NToperating systems and the improvement of the functionality for differential SAR interferometry.Furthermore, as part of our ERS AO3 project (ERS AO3-175), software demonstration, training,and testing examples which can be distributed to the users were generated. Development in thenear future will include the adaptation of the software to the processing of ENVISAT ASAR (withdata provided through ENV AO-210) and ALOS PALSAR (ALOS AO proposal submitted) data.
SAR PRODUCTS FOR ALL: RENT-A-RAPIDS
Niek Schaap
Email: [email protected] Aerospace Laboratory (NLR),
Remote Sensing Department,Voorsterweg 31, 8316 PR, Marknesse,
The NetherlandsTelephone: 0031 (0) 527 248249
Fax: 0031 (0) 528248210
ABSTRACT
Through the new SARCOM consortium, a mobile receiving station can be rented. This uniqueservice enables users to get access to timely, low cost ERS-SAR data products world-wide. SARproducts for all: anybody (low cost), anytime (up to near real-time), and anywhere (station canbe deployed worldwide).
For this service, NLR's mobile receiving station RAPIDS is used. RAPIDS is a cost-effective PC-based ground receiving station, capable of local acquisition and processing of satellite data fromERS and also Spot. Further, the station will be upgraded to receive ASAR data from the futureENVISAT. Due to the low complexity and small size of RAPIDS, the station can rapidly bedeployed anywhere in the world. The turn-around time (break-down plus build-up) of RAPIDS isless than 24 hours. RAPIDS is transportable by car, ship and wide-body aircraft. The station can beoperated by NLR staff or by the customer (the customer will then be trained by NLR staff). Moreinformation about RAPIDS is on the Internet: www.rapids.nl
The SARCOM consortium has been selected by the European Space Agency to distribute dataproducts worldwide from the ERS and ENVISAT satellites. Because of this worldwide license, theRent-a-RAPIDS service is inclusive the license for data reception. The SARCOM consortium is agroup of major players in the satellite imagery market: Spot Image (France), Geoserve (theNetherlands), Nigel Press Associates (UK), NLR (the Netherlands), RADARSAT International(Canada), Satellus (Sweden) and Tromsø Satellite Station (Norway).
The Rent-a-RAPIDS service can be a solution for applications for which currently no (timely)ERS-SAR data is available. Examples applications include flood monitoring in Bangladesh,forestry and bathymetry in Indonesia and volcano monitoring on Montserrat.
KEYWORDS: worldwide, mobile receiving station, low cost, rapid deployment, commercialservice.
ANALYSIS OF THE EFFECT RAIN ON ENVISAT ALTIMETER:DEFINITION OF A RAIN FLAG
Tournadre Jean
E-mail: [email protected]
BP 70Telephone: 0033298224497
Fax: 0033298224533
Co-author/s:G.D. Quartly, M.A. Srokosz, Southampton Oceanography Centre, UK.
ABSTRACT
Attenuation of the signal and distortion of the waveforms by oceanic rain can significantly degradethe quality of altimeter measurements. Several studies have analysed in details the effect of rain onthe dual-frequency (Ku and C bands) Topex altimeter (NRA) data. They showed that thefrequency dependence of the electromagnetic signal attenuation by rain can be used to define arain flag based on the detection of departure from a rain free relationship between the twofrequency backscatter coefficients. This kind of rain flag proved to perform better than theoperational one based on coincident passive microwave data. The future Envisat altimeter will alsohave a dual-frequency capability and will operate in Ku and S bands. The aim of the present studyis to analyse in detail the distortion of the altimeter waveforms to define a rain flag. For thispurpose, an analytical model has been developed to compute Ku and S band waveforms inpresence of a rain cell. It has been used to quantify the deformation of waveforms for a wide rangeof rain rate and rain cell diameter. The results of the modelling are used to define a rain detectioncriterion based on the attenuation of the Ku band signal compared to the S band one. The resultsare also used jointly with a cloud liquid water estimate based on Marshall-Palmer drop sizedistributions within rain cell to propose an inversion technique to retrieve rain rate and rain celldiameter from attenuation and passive microwave cloud liquid water estimates.
ADVANCED MIPAS-LEVEL-2 DATA ANALYSIS (AMIL2DA)
V. Clarmann Thomas
E-mail: [email protected] Karlsruhe, IMK
POB 3640Telephone: 00497247825946
Fax: 00497247824742
Co-author/s:Heinrich Bovensmann Universitaet Bremen, POB 330440, D-28334 BremenE-mail: [email protected] Phone: 0049-421-218-4081,Fax: 0049-421-218-4555Anu Dudhia Oxford University, Parks Road, Oxford OX1 3PU, UKE-mail: [email protected], Phone: 0044-1865-272922, Fax: 0044-1865-272923Jean-Marie Flaud LPM, CNRS, Universite Paris 11, Campus d'Orsay, Batiment 210,F-91405 Orsay Cedex, E-mail: [email protected], Phone: 0033-0-169158252,Fax: 0033-0-169158251,Brian Kerridge RAL, Chilton, Didcot, Oxfordshire OX11 0QX, UK E-mail: [email protected],Phone: 0044-1235-446524, Fax: 0044-1235-446434Erkki Kyrola FMI, Geophysical Research Division, POB 503, FIN-00101 HelsinkiE-mail: [email protected], Phone: 00358-9-19294640, Fax: 00358-9-19294603Francesco Javier Martin-Torres IAA-CSIC, Apartado Postal 3004, 18080 Granada, Spain currentlywith: Universitaet Karlsruhe, IMK, POB 6980, D-76128 Karlsruhe E-mail: [email protected],Phone: 0049-7247-825306, Fax: 0049-7247-824742Marco Ridolfi IROE-CNR, Via Panciatichi, 64, I-50127 Firenze, E-mail: [email protected],Phone: 0039-055-435939, Fax: 0039-055-432694Franz Schreier DLR Oberpfaffenhofen, Remote Sensing Technology Institute, D-82234 WesslingE-mail: [email protected], Phone: 0049-8153-281234, Fax: 0049-8153-281446
ABSTRACT
Changes in atmospheric composition are important in the context of stratospheric ozone depletion,global change and related environmental problems. The Michelson Interferometer for PassiveAtmospheric Sounding (MIPAS), which is a core instrument of the Envisat polar platform to belaunched in 2001 by the European Space Agency (ESA), is a powerful tool to measure verticalprofiles of trace species on a global scale. While operational data processing by ESA covers onlyanalysis of pressure, temperature, and the mixing ratios of the species O3, H2O, HNO3, CH4,N2O, and NO2, MIPAS infrared spectral limb emission measurements contain information on abulk of further important species. The goal of AMIL2DA is to generate data analysis tools forthese supplemental species along with thorough validation of these algorithms. Instead of mergingthe contributions of all participants to one data analysis algorithm which fits all purposes, theAMIL2DA strategy is to maintain the diversity of different computer codes by each group whichare custom-tailored to their specific scientific needs. First, forward radiative transfer algorithmsand retrieval processors are adapted to the physical and computational needs of the MIPASexperiment. These codes then are cross-validated by intercomparison to reveal potentialweaknesses of the assessed computer models. Spectroscopic line data not included in the currentdatabases but important to MIPAS applications are generated. After cross-validation of forwardradiative transfer models and subsequent upgrading, these are operated in the context of aninversion computer code, which infers atmospheric constituent abundances from measured spectra.The different inversion algorithms are applied to a common set of synthetic measurement data in a

blind-test validation mode. After upgrading the inversion models and fine-tuning of processingparameters, a common agreed set of real MIPAS measurements is used for further testing.Residuals between measured and best-fitting modeled spectra are analyzed for systematic patterns.Emphasis is put on candidate explanations such as inappropriate predictions on instrumentcharacteristics; different use of initial guess and a priori data; over-or under-regularization of theretrieval, and possible deficiencies in spectroscopic data. Furthermore, GOMOS, SCIAMACHY,and other data are used for validation.
CONCEPT FOR USING GPS-BUOYS FOR RA DRIFT MONITORING
Schoene Tilo
E-mail: [email protected] Potsdam (GFZ)
Division Kinematics & Dynamics of the Earth Telegrafenberg,D-14473 Potsdam
Telephone: 0049-8153-281391Fax: 0049-8153-281207
Co-author/s:Alexander Braun, Christoph Reigber, Matthias Rentsch, C.K. Shum (Department of Civil andEnvironmental Engineering and Geodetic Sciences, Ohio State University)
ABSTRACT
Radar altimetry is a valuable tool for measuring instantaneous sea levels or mean sea surfaceheights. Until today a long series of measurements from different altimeter missions exist. A mainproblem in using these data for determination of sea level changes are the biases between themissions and a only weakly determined drift of the different sensors. For the past and currentmissions different strategies are used for calibration and drift monitoring, e.g. using crossovers ortide gauges as a height reference. The disadvantage of all calibration methods is, that no directmeasurement beneath the sub-satellite tracks are available and, therefore, models have to be usedto account for e.g. the sea surface slope or time varying signals. A more reliable method exists,when using oil platforms equipped with GPS and tide gauges beneath the sub-tracks.Unfortunately, only a few of them are probable located. With the availability of GPS a differentstrategy can be applied. As shown for ERS and Topex/Poseidon, a GPS-equipped buoy, anchoredbeneath a sub-track, can be used as a height reference. Since GPS-derived coordinates are ITRF-referenced, an absolute calibration is possible. Until today only lightweight buoys were deployed.Therefore, no long-term sensor for the calibration and drift monitoring exists. A ruggedized GPS-buoy will be deployed in the North Sea in the context of a large German sea level monitoringproject. An ENVISAT crossover, which intersects with a Topex/Poseidon and GFO sub-track, willbe chosen. The lifetime of the buoy is expected to be several years, therefore, a long-termcalibration, drift monitoring and inter-calibration of different missions will be possible. A secondbuoy will be deployed in the Gulf of Mexico. In addition, the buoy will be equipped withsupplementary sensors, like wind speed, gyros and air pressure sensors, allowing a broader use forcalibration, e.g. of wind speed or significant wave heights.
THE ENVISAT EXPLOITATION PROGRAMME
Zmuda Andy
E-mail: [email protected] Evaluation Research Agency (DERA) Space Department
Building A8 FarnboroughTelephone: 0044-1252-394223
Fax: 0044-1252-396310
ABSTRACT
The UK EnviSat Exploitation Programme (EEP) has aimed to encourage the EO communitiesconcerned with policy, research, applications development and operations to work closely togetheron common objectives. This has been to stimulate the use of data and products that will beavailable from the EnviSat mission not only in the large public and science sectors but also in thewider commercial base. The programme has concentrated on the applications and potentialproducts of the land, ocean and atmospheric instruments. This includes: - ASAR (AdvancedSynthetic Aperture Radar) - MERIS (MEdium Resolution Imaging Spectrometer) - AATSR(Advanced Along Track Scanning Radiometer) - RA-2 (Radar Altimeter) - MWR (MicrowaveRadiometer) - GOMOS (Global Ozone Monitoring by Occultation of Stars) - MIPAS (MichelsonInterferometer for Passive Atmospheric Sounding) - SCIAMACHY (Scanning ImagingAbsorption Spectrometer for Atmospheric Cartography)
The following areas have been addressed that include information provision and gathering, datahandling development, technical meetings and the provision of reports and publicity material. Theresults of these activities can be viewed from a Web site, address: www.eoboard.co.uk. Thepotential of EnviSat instruments for sea state and marine monitoring through the use ofdemonstrators has been included on this site. To stimulate land applications and geocoding ofASAR and MERIS data, a world wide DEM catalogue has also been produced, address:www.demcat.co.uk. For the Advanced Along Track Scanning Radiometer and the MediumResolution Imaging Spectrometer, application studies were undertaken that produced either sampledata or demonstrated higher level products. These are available on CD-ROM. There is now acomprehensive set of information leaflets that cover the EnviSat satellite, atmosphere, land,marine, global, agriculture and forestry as well geological applications.
OPERATIONAL LONG TERM MONITORING OF THE SCIAMACHYINSTRUMENT ON ENVISAT
Wuttke Manfred
E-mail: [email protected] of Bremen FB1 Institute of Environmental Physics / Remote Sensing
P. O. Box 33 04 40Telephone: 0049 421 218 4081
Fax: 0049 421 218 4555
Co-author/s:John P. Burrows, Stefan Noel, Heinrich Bovensmann University of Bremen FB1 Institute ofEnvironmental Physics / Remote Sensing P. O. Box 33 04 40 D-28334 Bremen Manfred Gottwald,Volker Krieg DLR-IMF German Remote Sensing Data Center Münchner Str. 20 D-82234Oberpfaffenhofen, Telephone: 0049 8153 28 1591 Fax: 0049 8153 28 1446E-mail:[email protected] Johannes Frerick ESA-ESTEC Noordwijk The NetherlandsFax: 0031 71 565 5617
ABSTRACT
We outline the concept, including functions and responsibilities, for the operational instrumentmonitoring for SCIAMACHY. According to agreements between ESA and the Announcement ofOpportunity Provider (AOP), the operational long term monitoring (OLTM) is a function whichhas to be provided by AOP. Its technical and scientific implementation will be realised as part ofthe tasks of the SCIAMACHY Operations Support Team (SOST). Monitoring the behaviour ofSCIAMACHY in-orbit is an essential function during the Commissioning and Routine OperationsPhase. OLTM ensures that the actual instrument status is known, that countermeasures preventinginstrument malfunctions can be initiated, and that data processing can incorporate the most up-to-date instrument characterization. Thus for the full complement of OLTM tasks, both housekeeping(HK) and science data have to be evaluated. Modifications to instrument characterization will beprovided by OLTM in order to account for degradation of optical components of the instrumentover the mission lifetime. These are achieved by the so-called "m-factors", which ratio the actualradiance at a specific time during the mission, obtained under well defined measurementconditions, and a reference radiance determined at a phase when the instrument status could bedescribed by the original calibration parameters. In a complementary sense also the behaviour ofsingle optical components is monitored. OLTM based on HK data will mainly deal with long termtrend analysis of parameters: extrapolation of the temporal behaviour to estimate the occurence ofspecific events (e.g. heater power to learn when de-contamination has to be scheduled),extrapolation of the temporal behaviour to avoid occurences of out-of-limit events, correlation ofspecific events with measurement parameters, investigation of out-of-limit events (e.g. frequency,triggering events, etc.) orbital dependencies. According to the presently identified orbit scenariosand their planned execution pattern in-flight calibration & monitoring data will be generated on aregular basis. Among the numerous analysis methods and purposes for these data a well-definedsubset will be used to achieve the monitoring goals as described above, based on the currentknowledge of the instrument and on lessons learned from GOME on ERS-2.
GERMAN CONTRIBUTION TO SCIAMACHY VALIDATION WITHGROUND-BASED FTIR OBSERVATIONS FROM THE NDSC
NETWORK: PREPARATION PHASE
Sussmann Ralf
E-mail: [email protected] Institute for Atmospheric Environmental Research, IFU
Kreuzeckbahnstrasse 19Telephone: 0049 8821 183 159
Fax: 0049 8821 73573
ABSTRACT
Within this German SCIAMACHY CAL/VAL project columns of O3, NO2, N2O, CO, CO2,CH4, H2CO, and profiles of O3, N2O, and CH4 shall be validated with ground-based FTIRmeasurements. The German NDSC-FTIR-Validation Network includes sites covering 28 - 68 °N:Zugspitze (NDSC Primary Site, run by IFU-Garmisch), and Kiruna and Izana (NDSCComplementary Sites, run by IMK-Karlsruhe). In the ongoing preparation phase, existing expertknow how will be exploited to guarantee an optimum consistency and quality control of theground-based FTIR measurements and retrieval techniques. Examples of the current work will bediscussed.
STUDY OF THE GEOMETRIC PROPERTIES OF ENVISAT ASARPRODUCTS
Roth Achim
Email: [email protected]
German Remote Sensing Data CenterTelephone 0049 - 08153 / 28 2706
Fax: 0049 - 08153 / 28 1445
Co-author/s:Michael Eineder, Detlev Kosmann, Birgit SchaettlerDLRDFD - German Remote Sensing DataCenterD-82234 WesslingTel. 0049-0853 / 28-2706 Fax 0049-0853 / 28-1445
ABSTRACT
The base for the interpretation of remote sensing data is the calibration of the data to be analyzed.ESA is taking into account this fundamental needs by including also the ENVISAT sensors into itslong tradition of high precision calibration and validation. DLR-DFD participated in thoseactivities as one of the Processing and Archiving Centers of the ERS ground segment andconsequently intends to contribute to the calibration of ENVISAT-ASAR data, too. Additionallythe institute has long experience in the definition, exemplary implementation and operation ofprocessing chains for the generation of higher level SAR products. This service shall be extendedto support ENVISAT-ASAR data as well. A basic requirement is the suitability of the inputstandard products.
Therefore the geometric properties of the precision image, the single look complex and mediumresolution products shall be checked and reported regarding product annotation, timing parameters,orbit precision, parameter stability by considering repeat acquisitions and processing artifacts. Theproducts shall be terrain corrected and interferometrically processed. During the orthorectificationprocedure the ASAR data set is combined with ground control points as well as digital elevationmodels serving as external references. Possible processing artifacts as well as geodeticinconsistencies would be identified. Interferometric processing is a sensitive tool for theidentification of several error sources like timing and orbit precision and phase behavior. Theanalysis of the coherence allows a fine scale investigation.
The proposed presentation will describe the intended procedures. It will be complemented withresults achieved during the calibration and validation of ERS-SAR-data.
IN-SITU VALIDATION OF THE AATSR SKIN SST PRODUCTS WITHTHE SISTER RADIOMETER
Nightingale Tim
E-mail: [email protected] Science and Technology Department Rutherford Appleton Laboratory
Chilton DidcotTelephone: 0044 1235 445914
Fax: 0044 1235 445848
Co-author/s:Dr. Craig Donlon CEC - JRC ISPRA Space Applications Institute Marine Environment UnitI-21020 Ispra (Va) Italy TP 690 E-mail: [email protected] Tel: 0039 0332 786353Fax: 0039 0332 789648 Dr. Marianne Edwards Space Research Centre Department of Physics andAstronomy University of Leicester University Road Leicester LE1 7RH United KingdomE-mail: [email protected] Tel: 0044 116 252 3521 Fax: 0044 116 252 5262 Dr. Chris Mutlow SpaceScience and Technology Department Rutherford Appleton Laboratory Chilton Didcot OxonOX11 0QX United Kingdom, Email: [email protected] Tel: 0044 1235 446525 Fax: 0044 1235445848
ABSTRACT
The ENVISAT AATSR (Advanced Along Track Scanning Radiometer) is a filter radiometercapable of measuring infrared brightness temperatures (BTs) to very high accuracy. The principalderived AATSR product is a skin sea surface temperature (SSST), calculated from the BTs with aphysically based retrieval algorithm.
Convection within the sea is inhibited at the air-sea boundary, so the transport of heat through thesurface layer is relatively inefficient and the SSST is often decoupled significantly from the bulksea surface temperature (BSST) immediately below. As a result, it is not adequate to validate theAATSR SSST product against buoy measurements of BSST alone.
The authors plan to collect in-situ measurements of SSST with the SISTeR (Scanning Infrared Seasurface Temperature Radiometer), a compact and flexible chopped, self-calibrating infrared filterradiometer specially designed for research in a maritime environment. All external radiancemeasurements are referred to two internal black bodies, operated at ambient temperature and at aprogrammable increment (typically 10K) above ambient temperature.
Measurements of the upwelling sea surface radiance are made at an angle as near as practicable tonadir, where the emissivity of the sea surface is highest. A second interlaced set of downwellingsky radiance measurements are made at the complementary angle so that a deficit due to thereflected sky signal can be corrected and the true SSST calculated.
The SISTeR will be deployed on research ships and other ships of opportunity to collect sea-levelradiometric data co-incident with ENVISAT/AATSR overpasses. The SISTeR has previously beendeployed in support of ATSR-2 both in coastal waters and over the open ocean. Illustrative resultsfrom some of these campaigns are discussed.
ALTIMETRIC MEASUREMENTS AT L, S, C AND KU BANDS FROM ANOPEN SEA PLATFORM
Zecchetto Stefano
Email: [email protected] Studio Dinamica Grandi Masse, C.N.R.
1364 S. PoloTelephone 0039-041-5216848
Fax: 0039-041-2602340
Co-author/s:Francesco De Biasio, Istituto Studio Dinamica Grandi Masse, C.N.R., Venezia, ItalyPaolo Trivero,Universita' del Piemonte Orientale, Alessandria, Italy
ABSTRACT
Altimetric measurements have been carried out using coherent and impulsive radars at L (1.25GHz), S (2.5 GHz), C (5.4 GHz) and Ku (15.4 GHz) bands, from the Italian Oil Company (AGIP)platform "Barbara C", in a deep-water site in the Central Adriatic Sea. One of the aims of theexperiment is to study the properties of the sea surface obtainable from the specular reflection ofthe e.m. waves. This is possible due to the coherency of the radars, which allows to measure thesea surface displacement along with the radar backscatter. The instantaneous properties of theradar backscatter, as a function of the wave isplacement and of the wind, are studied using thecontinuous wavelet analysis, a technique which allows to distinguish between the different roles ofwind and waves in the determination of the radar backscatter. Besides this, the measures allow thedetermination of the electromagnetic bias, which is one of the most important parameters inaltimetry. The implications of these measurements, hopefully continued in the future, with thesatellite altimetry, concern the e.m. bias as well as the dependence of the radar backscatter onwave age and turbulent properties of the atmospheric boundary layer.
THE DEVELOPMENT OF AN ADVANCED CALIBRATIONTRANSPONDER FOR QUAD-POL SAR AND SCANSAR
Cooper Peter
E-mail: [email protected] Engineering & Assesment Ltd
Beckington CastlePO Box 800Telephone: 00 44 1373 852015
Fax: 00 44 1373 831800
Co-author/s:Christopher Buck ESTEC PO Box 299, Noordwijk, NL - 2200 AG, NETHERLANDSE-mail [email protected], Tel 31 71 565 3970 Fax 31 71 565 4596 Dr Arthur DawkinsSpace Department Defence Evaluation and Research Agency Farnborough, GU14 0LX, UKE-mail [email protected] Tel 44 1252 392302Fax 44 1252 396330 Scott MitchellE-mail [email protected] 44 1373 852203, Fax 44 1373 831800 Anthony WonsE-mail [email protected], Telephone: +44 1373 852033, Fax 44 1373 831800.
ABSTRACT
For future SAR systems with increased complexity, number of modes and number of beams thecalibration requirement is significantly greater than that for ERS. For example, calibration of SARinstruments with multiple polarisations is difficult with conventional transponders and cornerreflectors because of the problems in controlling the channel responses and separating them in thefinal image. Similarly, it is no longer possible to rely on a single well prepared and characterisedcalibration site and transponder to conduct a cost-effective calibration campaign. The advancedSAR transponder design described in this paper addresses both of these issues - additionalfunctionality and multiple deployment. The transponder features separate pulse coding for each ofthe polarisation channels. This has two main benefits. The images from the different channels nolonger interfere since the decoding processing only focuses one channel at a time. Also thebackground level variance in the image is reduced allowing more accurate measurements to bemade. The technique has the added benefit of allowing operation without the use of speciallyprepared sites. The transponder also features digital pulse replication, which allows improvedcalibration statistics without saturating the radar receiver. This will be of particular benefit forcalibrating low-resolution modes such as SCANSAR. This transponder builds on the original ESAdesign used for ERS but cost-effectiveness is improved by using smaller Potter horn antennas anda simplified internal calibration system. The technique has been successfully demonstratedpreviously using experimental C band equipment. A prototype transponder is now being developedunder GSTP funding. This implements a single channel of the full quad-pol system and is beingused to demonstrate the technology.

CALIBRATION AND EVALUATION OF ENVISAT TEMPERATUREAND OZONE DATA USING STATISTICS FROM THE UK MET OFFICE
NWP SYSTEM
Lahoz William
E-mail: [email protected], Department of Meteorology, University of Reading
University of ReadingTelephone: 00-44-118-9316981
Fax: 00-44-118-9318316
Co-author/s:Alan O'Neill, CGAM, Department of Meteorology, University of Reading, RG6 6BB, Reading,United Kingdom E-mail: [email protected]., Telephone: 00-44-118-9318317Fax: 00-44-118-9318316
ABSTRACT
Temperature and ozone data from the GOMOS, MIPAS and SCIAMACHY instruments aboardEnvisat will be assimilated into the UK Met Office Numerical Weather Prediction (NWP) system.The operational data routinely used by the weather agencies will be assimilated together with theEnvisat data. This assimilation system seeks to combine in an optimal manner atmosphericobservations with data from a general circulation model of the atmosphere. The statistics generatedby the assimilation procedure on the difference between the Envisat observations and the dataassimilation analyses, and between the Envisat observations and forecasts using the analyses asinitial data, will be used to calibrate and evaluate the Envisat data. The approach will follow thatapplied to temperature and ozone data from instruments aboard NASA's Upper AtmosphereResearch Satellite (UARS) and from ESA's GOME instrument. Observation processing datasetsgenerated by the statistics will be used to identify potential biases in the data. In collaboration withthe Envisat instrument teams, biases in the observations will be estimated. The impact of theEnvisat datasets will be tested using Observation System Experiments (OSEs) in which differentsets of data are systematically removed from the assimilation. Wherever possible, themeteorological analyses incorporating Envisat data and operational data will be evaluated againstindependent observations (i.e. observations not used in the assimilation). The error characteristicsprovided by the instrument teams will be assessed. An attempt will also be made to identifyshortcomings in the UK Met Office assimilation system.
PASSIVE CALIBRATION TARGETS WITH A LARGE, STABLE ANDCONTROLLABLE RCS FOR SPACEBORNE SAR
Zakharov Alexander
E-mail: [email protected] of Radioengineering and Electronics, RAS
Vvedensky square, 1Telephone: 007-095-5269047
Fax: 007-095-7029572
Co-author/s:Peter A.Zherdev, Mikhail M. Borisov, Alexey G. Sokolov, Kees van t Klooster
ABSTRACT
The series of calibration experiments with ERS-1/2 SAR was conducted in 1995 and 1999 at theBear Lakes calibration site near Moscow. Since a very beginning in the number of calibartionscenarios along with standard targets (corner reflectors) new passive calibration targets based onparabolic antennas were investigated. Main tasks - study of the scatterers stability and a way tobroaden scatterer pattern were made and reported earlier.
Experiments of the year 1999 were conducted under AO3-343 project and devoted to thecontinuation of the study of the parabolic antennas scattering stability and a way to control theirradar cross section. Three parabolic antennas, used in the experiment, were located at the cornersof the rectangular triangle with 50 m legs. Two antennas were used as a reference, and another onewas a calibration target with polarisation grid in focal area. The use of the polarization gridallowed us to modify scattering matrix of the antenna. Final scattering properties of the structurebecome similar to that of the dipole. As a result, setting the angle q between the SAR polarizationplane and the grid polarization plane, we were able to change the targets RCS for a singlepolarization system, like as ERS SAR.
The SLCI data obtained under AO3-343 project were used for the measurements of the antennasRCS. The measurements show, that reference antennas have very stable and very large, with ~ 52dBm2 radar cross-section. The cross-section of the last one was controlled by the orientation of thepolarization grid with respect to ERS-2 polarization plane. The results are in good agreement withtheoretical predictions except for orthogonal orientation, where observe 4 dB higher scatter than itwas predicted.
The study conducted with a use of ERS SAR data confirms high stability of the parabolic antennasand the possibility to control the polarization plane (radar cross section) of the backscatteredsignal, what is of special value for multipolarization SAR systems like as Envisat ASAR.
COMPARISON OF GROUND BASED FTIR MEASUREMENTS ATHARESTUA TO SPACEBORNE MEASUREMENTS
Mellqvist Johan
E-mail: [email protected] University of Technology
Dep. of Analytical and Marine ChemistryTelephone: 0046 31 7256250
Fax: 0046 31 7256290
Co-author/s:Bo Galle Swedish Environmental Research Institute (IVL), P.O. Box 47086, S-40258, Göteborg,Sweden, and Chalmers University of Technology, S-412 96 Gothenburg, Sweden.
ABSTRACT
Ground based high resolution Solar FTIR measurements conducted at the complementary NDSC(Network for Detection of Stratospheric Change) site Harestua in (60oN, 11oE, altitude 590 m) arehere compared to spaceborne measurements from various instruments, such as HALOE, CRISTA(on the space shuttle) and MOPITT.
The two first above-mentioned instruments are focused on detecting stratospheric species of largerelevance for the ozone depletion chemistry, such as HCl, HNO3 and O3. The Moppitt instrumentalso covers the troposphere measuring CO and methane. These species are of high importance fortropospheric as well as stratospheric atmospheric chemistry. Both gases have a stronganthropogenic component and especially CO with its relatively short lifetime (3 months) is likelyto show a considerable variation in time and space.
In the present paper partial and total columns retrieved from spectra at the Harestua site insouthern Norway (60oN, 11oE, altitude 590 m) during 1994 - 2000 will be compared to coincidentmeasurements in time and space with the above-mentioned space borne instruments. The resultswill be discussed and related to the uncertainties of the FTIR measurements.
SAFIRE-A MEASUREMENTS DURING THE APE-GAIA CAMPAIGN
Cortesi Ugo
E-mail: [email protected]
Via Leone Pancaldo 3/37Telephone: 0039 055 435939
Fax: 0039 055 432694
Co-author/s:(1)Peter Ade, (2)Giovanni Bianchini, (2)Bruno Carli, (3)Ugo Cortesi, (3)Bianca Maria Dinelli,(2)Alessandro Gignoli, (1)Clare Lee, (1)Peter Hamilton, (2)Luca Palchetti, (2)Enzo Pascale.(1)Queen Mary And Westfiel College), London - Uk(2)Istituto Di Ricerca Sulle Onde Elettromagnetiche Nello Carrara (Iroe-Cnr), Florence - Italy(3)Istituto Di Spettroscopia Molecolare (Ism-Cnr), Bologna - Italy
ABSTRACT
Results of measurements obtained by SAFIRE-A (Spectroscopy of the Atmosphere by using FarInfraRed Emission - Airborne) during the APE-GAIA (Airborne Polar Experiment GeophysicaAircraft In Antarctica, Ushuaia, Argentina, 15th September 15th October 1999) campaign arepresented, providing an assessment of instrument performances in view of its participation to theplanned M55-Geophsyica activities for ENVISAT validation. The SAFIRE-A Far Infrared FTspectrometer was operated onboard the Geophysica stratospheric platform during the fivescientific flight which the aircraft performed over the Antarctic Peninsula, aiming at investigatingthe chemistry and dynamics across the boundary of the southern polar vortex. The instrumentprovided limb sounding observations of atmospheric emission spectra over two frequencyintervals: [22-23.5 cm-1], and [123-125 cm-1] where spectral features respectively of O3, ClO,N2O, HNO3 and HCl, H2O are displayed. Volume mixing ratio vertical profiles of the observedspecies are retrieved from limb-scanning sequences by data analysis and inversion. Variability ofO3, ClO, N2O and HNO3, along the flight track, has been studied as a function of altitude andlatitude and results of measurements obtained in some of the APE-GAIA Antarctic flights aredisplayed.
TOOLS FOR THE ANALYSIS OF RESIDUAL SPECTRA AFFECTINGMIPAS LEVEL 2 PRODUCTS
Hilgers Siegfried
E-mail: [email protected] Sensing Technology Institute German Aerospace Center
DLR OberpfaffenhofenTelephone: 00498153282695
Fax: 00498153281420
Co-author/s:S.Hilgers, H.Kemnitzer, G.Schwarz Deutsches Zentrum fuer Luft- und Raumfahrt (DLR) RemoteSensing Technology Institute (MF) Oberpfaffenhofen, D-82234 Wessling, GermanyT.v.Clarmann, M.Milz Forschungszentrum Karlsruhe, IMK D-76021 Karlsruhe, Germany
ABSTRACT
One of the atmospheric payload instruments of ENVISAT is MIPAS, an infrared Fourierspectrometer operated as a limb sounder. MIPAS level 1 products consist of sequences ofcalibrated emission spectra covering the range from 4.15 to 14.6 micrometer; level 2 products arevertical profiles of pressure, temperature and selected trace gas VMRs derived from sequentiallevel 1 scans. The retrieval of the level 2 products is based on the use of initial guess data, forwardmodelling and iterative improvements of the assumed parameters until convergence to a stablesolution has been reached.
The attainable profile quality will be affected by random as well as by systematic effects that resultin differences between measured and simulated spectra remaining after the level 2 retrievaliterations. Time averaged residual spectra should average out random noise and be close to zero.Deviations from zero can be due to imprecise spectroscopic data or instrument parameters,shortcomings of radiative transfer modelling, or inappropriate retrieval techniques and parameters.
The level 2 data will be generated as near real time as well as off-line products. For both types ofdata our work aims at the identification and subsequent minimisation of level 2 residual spectra.To this end, a number of analysis techniques and tools have been designed and implementedallowing the detailed analysis of spectra, profiles, Jacobians and quality metrics. Some of thesetools can be operated automatically, while others require interactive investigation and parametermodification.
Concepts and typical examples will be presented, where the manipulation of simulatedinstrumental parameters, of spectral measurements and of retrieval parameters leads to degradedprofile quality. The application of the proposed tools allows the identification and quantification ofseparate error terms and hints to their origin.
During the mission, when we cannot rely on simulated data with known degradations, data ofincreasing atmospheric complexity shall be used. Thus, our first analysis steps will be theidentification of instrumental features, followed by the determination of general spectralcharacteristics and special meso-scale effects. This rationale and the available tools will help toverify the selected approaches during the level 2 processing including the choice of the proposedemission line windows, the retrieval approaches and parameters, and the knowledge of theattainable level 2 data quality. Special emphasis has to be given to the sequential application of thevarious tools.
GROUND BASED HIGH RESOLUTION FTIR MEASUREMENTS OFSTRATOSPHERIC MOLECULES ABOVE HARESTUA, NORWAY,
DURING 1995 TO 2000.
Galle Bo
E-mail: [email protected] University of Technology
Dep. of Analytical and Marine ChemistryTelephone: 0046 31 7256200
Fax: 0046 31 7256290
Co-author/s:Johan Mellqvist
ABSTRACT
Groundbased high-resolution Solar FTIR measurements have been conducted at thecomplementary NDSC (Network for Detection of Stratospheric Change) site Harestua in southernNorway (60oN, 11oE, altitude 590 m) since 1994. Measurements has primarily been focused onmolecules of interest for stratospheric ozone depletion research, HCl, HF, HNO3, ClO, ClONO2,N2O, COF2, and O3 as part of the field campaigns SESAME and THESEO. A primary goal ofNDSC is satellite validation and the site is part of three accepted ENVISAT AO-proposals:
Validation of ENVISAT-1 level-2 products related to lower atmosphere O3 and NOy chemistry byan FTIR quasi-global network. Global study of inorganic chlorine and flourine loading in theearths atmosphere, based on correlative measurements by ENVISAT-1 and 12 NDSC sites.Isotopic ratios of water and methane for the study of stratospheric oxidation processes.
In order to increase the capabilities of the technique in the above mentioned applicationssubstantial work has been devoted to development, application and validation of algorithms forretreival of vertical concentration profiles from the pressure-broadening of the absorption lines.
The FTIR measurements are performed using a Bruker 120 M high-resolution (0.0035 cm-1) FTspectrometer connected to a coeliostat. Total columns are retrieved using the softwares SFIT andMALT. In addition vertical concentration profiles of some species are derived from the pressurebroadened absorption lines. Two methods for the profile retrieval have been employed: i.e. theChahine Twomey technique which is an iterative search method and the optimal estimationtechnique (SFIT2) which uses a statistical approach. The retrieved profiles have been comparedwith other measurement data. In general the comparisons show good agreement when comparingtotal columns, while differences of up to 20 13620336s seen when comparing partial columns.
Results from 5 years of measurements will be presented and discussed in relation to otherobservations and modelling data.
UPPER ATMOSPHERIC NO FROM SCIAMACHY: SIMULATIONS ANDINSTRUMENT CAPABILITIES
Muller Christian
E-mail: [email protected] Institute for Space Aeronomy
Avenue Circulaire, 3Telephone: 003223730372
Fax: 003223748423
Co-author/s:C.Muller , J.C. Lambert, M. Van Roozendael
ABSTRACT
The SCanning Imaging Absorption spectroMeter for Atmospheric ChartograpHY (SCIAMACHY)operates in eight channels covering the UV, the visible and two infrared regions. Recentdevelopments in the testing of the instrument now enable not only the full use of channel 1 (240nm-314 nm) at a required high level of performance but in some special cases its extension to 220nm. This instrumental improvement allows new objectives to be addressed in the upperstratosphere, on top of the already proposed mesospheric and thermospheric investigations of nitricoxide. Simulations will show the instrument capabilities for these studies and will be comparedwith the latest instrument test data obtained before instrument delivery. The operation modescorresponding to these NO observations will also be described. The capabilities of SCIAMACHYfor mapping the total column of upper atmospheric NO will be investigated as well as possibilitiesto infer NO vertical distribution and transfer properties between the different atmospheric regions.Nitric oxide signal will also be discussed in the present ERS-2 GOME observation.
NDSC SUPPORT TO THE DEVELOPMENT OF ERS-2 GOMEGEOPHYSICAL DATA
Lambert Jean-Christopher
E-mail: [email protected] Institute for Space Aeronomy (IASB)
Avenue Circulaire 3Telephone: 0032 2 373 0468
Fax: 0032 2 374 84 23
Co-author/s:M. Van Roozendael, M. De Maziere, et al.
ABSTRACT
Operating aboard the ESAs ERS-2 heliosynchronous polar satellite since 1995, the Global OzoneMonitoring Experiment (GOME) measures the solar irradiance and the Earth radiance from 240nm through 790 nm, at 0.2-0.4 nm spectral resolution. The atmospheric abundance of several tracespecies - such as O3, NO2, BrO, OClO, CH2O and SO2 - is derived from GOME spectra usingdifferential absorption spectroscopy techniques. GOME has proven to be a major component ofthe global observing system and is the successful prototype of a series of new-generationspaceborne sensors.
The ground-based Network for the Detection of Stratospheric Change (NDSC) is another majorcontributor to the global observing system for atmospheric composition. Started in 1991, at thepresent time the NDSC includes five primary and two dozen complementary stations distributedfrom the Arctic to the Antarctic. The column abundance and vertical distribution of keyatmospheric constituents are monitored at NDSC stations by a variety of complementarytechniques and instruments such as UV-visible spectrometers, Fourier transform infraredspectrometers, lidars, millimeter wave radiometers, and ozone sondes. A main goal of the NDSC isto provide an independent calibration and validation of satellite measurements on the global scaleas well as in the long term.
Through the geophysical validation of GOME data products and retrieval algorithms, ground-based observations associated with the NDSC have played a unique role in the furtherdevelopment of GOME. The NDSC provided an extensive, high-quality database to the GOMEvalidation campaign conducted during the ERS-2 commissioning phase. It has generated well-controlled correlative data records needed for the quality assessment and the long-term verificationof operational GOME data products. It has provided experimental support to advanced studiesfocusing on specific aspects of data retrieval. Furthermore, the synergistic use of GOME, NDSCand other correlative data has enhanced their geophysical exploitation.
The present paper highlights several contributions of the NDSC to the further development ofGOME data products. Focusing on the integrated exploitation of multi-technique network datarecords, it also illustrates NDSC capabilities for the pseudo-global and long-term validation offuture GOME-like spaceborne sensors.

NON-PARAMETRIC ESTIMATION OF THE WET TROPOSPHERICCORRECTION, CLOUD LIQUID WATER CONTENT AND SEA
SURFACE WIND SPEED IN ERS CONFIGURATION.
Obligis Estelle
E-mail: [email protected]/DOS
Address: 8-10 rue HermesTelephone: 00 33 0 5 62 19 36 52
Fax: 00 33 0 5 62 19 36 56
ABSTRACT
Traditionally, geophysical parameters are estimated using parametric regression on an appropriatedatabase. This estimation method is accurate in the densest region but often fails for less densedata region. In this work, we have compared performances of parametric and non parametricregression. For the wet tropospheric correction (dh in cm), the cloud liquid water content (clw inkg/m2), the atmospheric attenuation of the backscattering coefficient in Ku band (att in dB) andthe sea surface wind speed (us in ms-1), estimations are made using the 2 brightness temperatures(TB24 at 23.8 GHz and TB36 at 36.5 GHz) and the backscattering coefficient in Ku band (s0Ku).This last term is used instead of a term in us_altimeter-7 m/s like in ERS2 standard products. Itappears that this modification improves the atmospheric parameters retrieval since the sea surfaceroughness is taken into account more directly than using the sea surface wind speed calculatedfrom s0Ku by the Witter and Chelton algorithm. Nonparametric regression (NPR) is a method tostatistically smooth a data set such that a valid estimate of a variable (geophysical parameter) canbe found in measurements space (TB and s0). The database consists of 12 global meteorologicalfields, containing both analyses and guesses of surface and atmospheric parameters. Theseparameters are given in 1.125x1.125 degree meshes (Bourras et al, 99). In each mesh, geophysicalparameters are associated to brightness temperatures and backscattering coefficients simulated bya radiative transfer model. For a given set of ERS2 measurements the estimation of a geophysicalparameter at this point is a combination of this geophysical parameter at each point of the databasewith the associate weight. This last is a function of the distance between the set of measurementsand each set of simulations. For our non parametric regression, we take a spherical Epanechnikovkernel associated to the appropriate bandwidth in each direction, and we prefer a local linearregression estimator to the classical Nadaray-Watson regression estimator which induces biaswhere data density varies a lot. This retrieval method is tested first over the database itself toconclude on the regression quality and then is validated using radiosounding measurements.

THE PRARE SYSTEM ON BOARD ERS-2: STATUS AND RESULTS
Massmann Franz-Heinrich
E-mail: [email protected] Forschungs Zentrum Potsdam (GFZ)
Division Kinematics & Dynamics of the Earth,Telegrafenberg, D-14473 Potsdam
Telephone: 0049 8153 281206Fax: 0049 8153 281207
Co-author/s:J.C. Raimondo, Ch. Reigber, C. Falck, F. Flechtner, A. Scherbatschenko
ABSTRACT
The PRARE system onboard ERS-2 is the primary tracking system of the satellite. Throughout thepast 5 years this system has proven to be a reliable and highly precise range and range ratemeasuring instrument operating under all weather conditions in even rough climatic regions.Through various revisions the quality of the data has steadily been improved. Since 1996 thePRARE data are used by GFZ in the operational ERS-2 POD, replacing the radar altimetercrossovers. Additionally normal equations for Earth gravity coefficients and station coordinatesrecovery were created. The gravity and PRARE station solution of the joint GFZ/GRGS modelGRIM5-S1 has been compared with external solutions, which confirm the high quality of thesolution.
The poster will present the system status and the achieved scientific results.
ERS ORBIT DETERMINATION AND GRAVITY FIELD MODELTAILORING: RECENT DEVELOPMENTS
Scharroo Remko
E-mail: [email protected] Institute for Earth-Oriented Space Research Delft University of Technology
Kluyverweg 1Telephone: 0031 15 278 1483
Fax: 0031 15 278 5322
Co-author/s:Pieter Visser (DUT/DEOS) and Neil Peacock (UCL/MSSL)
ABSTRACT
In the last ten years significant advances have been made in gravity field modelling, culminating ingeneral purpose-models like JGM-3, TEG-3 and EGM96. Significant defects remain in the qualityof the models when applied to orbit determination of some altimeter satellites, leading to largeorbit errors, characterised by the geographically correlated nature of the altimeter crossover heightdifferences. However, we have used these data effectively in the adjustment of JGM-3 andEGM96 to models tailored to ERS-1 and ERS-2. Many gravity field coefficients are "invisible" toaltimetry, but still cause radial orbit errors through misfits with the basic tracking data: SLR andPRARE. We have now incorporated these observations in the tailoring process, and the adjustmentis carried up to degree and order 70. This led to significant improvements to the EGM96 model,reducing the radial orbit error from 7 to 4.5 cm and cutting the tracking data residuals by 3 cm inRSS sense. With the availability of altimeter crossovers over the ice-covered Arctic (courtesy ofUCL/MSSL) we now have valuable new information on the behaviour of the gravity field inducedorbit error over this remote area. This independent source of information is used to validate severalgravity field models and orbit products.
A RECIPE FOR UPGRADING ERS ALTIMETER DATA
Scharroo Remko
E-mail: [email protected] Institute for Earth-Oriented Space Research
Delft University of TechnologyKluyverweg 1
Telephone: 0031 15 278 1483Fax: 0031 15 278 5322
Co-authors:Ejo Schrama and Marc Naeije (Dut/Deos) Jerome Benveniste (Esa/Esrin)
ABSTRACT
ERS-1 altimeter data have a history of product and algorithm definitions dating back to 1990, andnot surprisingly these were soon surpassed by TOPEX-aided knowledge and models. In additionno measurements re-calibrations have been applied since, to safeguard the homogeneity of the datasets. It was only in 1995, after the launch of ERS-2, that the altimeter product generation wasupgraded. Still, older ERS-1 data were never reprocessed, and more precise orbits were neverincorporated. But also the ERS-2 altimeter data require upgrading by applying some instrumentcorrections and replacing a number of geophysical corrections by more recent models. Thecombination of a long list of re-calibration algorithms, updated geophysical corrections and preciseorbits has led to a harmonised and accurate ERS-1/2 altimeter data set that allows thereconstruction of many ocean parameters with equal efficiency as other modern altimeters, butwith denser spatial (35-day) coverage. In this poster we provide this upgrade recipe and presentsome new data analyses that demonstrate the quality of the new data set that is now part of theDEOS' Radar Altimeter Database System (RADS). Despite the suggested recipe, it isrecommended that ESA reprocesses all ERS waveforms with the latest insights.
OPERATIONAL ALTIMETRY AT GFZ - FROM ERS-2 TO ENVISAT
Rentsch Matthias
E-mail: [email protected] Potsdam (GFZ)
Division Kinematics & Dynamics of the Earthc/o DLR Oberpfaffenhofen
Telephone: 0049-8153-281267Fax: 0049-8153-281207
Co-author/s:A. Braun, S. Eickschen, A. Helm, T. Schöne
ABSTRACT
As part of the German Processing - and Archiving Facility for ERS (D-PAF), the Altimeter DataProcessing System (ADP) at GFZ is responsible for the systematic acquisition and processing ofERS-2 altimeter data, the quality control, the generation of upgraded geophysical data productsand its distribution.
The quick-look products are based on standard ERS-2 fast-delivery data, which are upgraded bymerging the GFZ preliminary orbit, by recomputing corrections for atmospheric path delay, byapplying the tides and additional altimeter range corrections, e.g. USO drift and SPTR correction.Three product types are provided and are available within 6 to 12 days, the along-track Quick-Look Ocean Product (QLOPR), the Quick-Look Ocean Crossovers (QLOPC) and the Quick-LookSea Surface Height Model (SSHQL).
The precise products are derived from upgraded Level-2 altimeter data. Herein, the precise orbit,generated at GFZ, is merged and the altimeter ranges are corrected similar as for the quick-lookproducts. Two gridded data sets are provided, the Short Period Sea Surface Height Model which isbased on the complete altimeter data sequence of one ERS-2 cycle (35 days) and the Long PeriodSea Surface Height Model which is produced each half year by accumulation of all data sincelaunch.
The experience in operational altimetry with ERS-1/2 will be continued for the Envisat era. Basedon Envisat level 1b and level 2 data products, ADP will generate various value-added ocean andice data products. Standard geophysical data products will be provided as well as user-specific dataproducts which will fulfill the requirements resulting from two user inquires which were initiatedby GFZ in 1994 and 1995.
NUMERICAL AND ANALOGUE MODELLING OF LARGE FLANKCOLLAPSE AT MOUNT ETNA
Ranvier Fabien
E-mail: [email protected] "Magma et volcans" (UMR 6524 and CNRS), Université Blaise Pascal, Clermont-Ferrand, France
5, rue KesslerTelephone: 33-4-7334-6721
Fax: 33-4-7334-6744
Co-author/s:V. Cayol, J.L. Froger, O. Merle
ABSTRACT
Previous works have proposed that the dynamic of Mount Etna is dominated by large scalecollapses. A recent study, based on INSAR data, has shown an active spreading of the flanks of thevolcano. Two main sectors of instability, which have different spreading process, have beenidentified. An eastern sector bounded by the Pernicana faults system to the north, by the North andthe South Rift Zones to the west and by the Mascalucia-Tremestieri-Trecastagni faults to the SouthEast, slides to the east. A southern sector, limited to the south by an active anticlinal ridge, isdriven by southward gravity spreading over a basal decollement. The onset of the sliding coincidewith a new cycle of volcanic activity in summer 1996. We have used both numerical and analoguemodelling in order to better constrain the geometry and the kinematic of the collapse processes ofMount Etna. The scaled analogue experiments take into account the E-W extension and also theweak Plio-Quaternary basement. The analogue models emphasises that both the E-W extensionand the southward gravity spreading drive the evolution of the volcanic edifice. Numericalmodelling with a boundary element method was used to explain the displacement field, observedby radar interferometry, and to estimate the stress field. It shows that stability of Mount Etna issubcritical and a perturbation like dyke's injection may be enough to destabilise the whole edifice.This work points out the interest of coupling analogic and numerical study to the understand theevolution of a volcanic edifice.
SYNERGISM OF OPTIC AND RADAR DATA TO OPTIMIZELITHOSTRUCTURAL MAPPING AND MINERAL EXPLORATION IN
SOUTH-EAST SENEGAL AND MALI (WEST AFRICA)
Wade Souleye
E-mail: [email protected]
ESA/ESRIN, Via Galileo Galilei - CP 64, 00044 Frascati (Italy)Telephone: +39 06 94180 708
Fax: +36 06 94180 280
Co-author/s:Aminata NDoye, Institut des Sciences de la Terre/Faculte des Sciences et Techniques/UniversiteCheikh Anta Diop, BP 5396 Dakar-Fann (Senegal), Tel: +221 825 25 30, Fax: +221 824 63 18Benoit Deffontaines, Universite Pierre et Marie Curie, Departement de Geotechnique, 4 PlaceJussieu 75005 Paris (France), Telephone: +33 1 44 27 5087, Fax: +33 1 44 27 5085,E-mail: [email protected] - Massaer MBaye, Centre de Suivi Ecologique, BP 15 532Dakar-Fann (Senegal), Telephone: +221 825 80 66/825 80 67, Fax: +221 825 81 68,E-mail: [email protected] - Jean Paul Rudant, Universite de Marne-la-Vallee Institut Francilien desGeosciences Laboratoire Geomateriaux , 5 Bd Descartes Champs s/Marne, 77454 Marne-la-ValleeCedex 2, Tel: +33 1 49 32 90 7271, Fax: +33 1 49 32 9137, E-mail: [email protected]
ABSTRACT
Satellite remote sensing data, thanks to their synoptic view and their visible, infrared andmicrowave information content, are valuable geological information sources, particularly forlithostructural mapping and mineral exploration in remote regions and in terrains characterized byimportant vegetation, alluvial and laterite covers. We developped our research activities in twodirections: (1) merging of optic and radar data, and (2) assessment of the potential ofinterferometric data. A composite image where spectral and textural information are combined,has been computed from Landsat-TM and radar SAR ERS-1 data covering the area of the Bobotigranitic massif (South-East Senegal), by applying Principal Component Analysis and Intensity-Hue-Saturation image merging techniques. The IHS technique appeared as the most impressive,giving the possibility to weight the radar contribution in the resultant image. We interpreted thisERS-1/TM merged image and got a more accurate cartography of the Bambadji granitic massifand its fracture pattern. This is of major interest as far as the unexplored contacts of the batholitewith the intruded rocks may be proposed as exploration targets for additional iron reserves and thefracture nods, as potential gold metallotects. A field trip has been conducted from 18 to 24February 2000 in the areas of Kedougou (Senegal) and Kenieba (Mali), with a set of ERS andRADARSAT amplitude and coherence images. It demonstrated the usefulness of coherenceimages in understanding surface characteristics and changes, and also their capacity to enhance theexpression of lithologic differences, when merged with amplitude images. In fact, thanks to theirgreat sensitivity to vegetation types, coherence images allow to follow easily the talweg networkoutlined by forest galleries, and to discriminate subtle differences among vegetation covers onmajor river beds and plateaus zones, which may be related to the nature of underlying rocks. Theseresults clearly indicate the possibility to optimize lithostructural mapping and mineral explorationin poorly outcropped terrains, by adding merged optic/radar images and interferometry derivedproducts to the package of geological information sources.
EXPLORATION FOR IMPROVED QUALITY GROUNDWATER INSEMI-DESERT NAMAQUALAND, SOUTH AFRICA
Stow Richard
E-mail: [email protected] of Nottingham
6, Roydhouse ShelleyTelephone: +44 1484 603986
Fax: +44 1484 603986
Co-author/s:R Stow, University of Nottingham - J Van Beever Donker, University of Western Cape et al.
ABSTRACT
Synthetic aperture radar (SAR) data from European Space Agency satellites ERS1 and ERS2 isused to help test a hypothesis that may improve ground water quality in Namaqualand, SouthAfrica. Precipitation in this semi-desert is mainly from sea mist, which condenses on exposedgranite domes, feeding the extremely limited aquifers. It is hypothesised that finely fissured granitedomes feed the aquifers more effectively than smooth granite domes. Fissured and smooth domesare being classified by SAR speckle analysis. Results are presented.
ANALYSIS OF THE PALEODRAINAGES OF THE NORTHWESTERNSIMPSON DESERT, AUSTRALIA FROM ERS1-2 IMAGES
Marinangeli Lucia
E-mail: [email protected] Research School of Planetary Sciences
Viale Pindaro 42Telephone: 00-39-085-4537507
Fax: 00-39-085-4537545
Co-author/s:V. Cayol, J.L. Froger, O. Merle
ABSTRACT
The Simpson Desert is located in the arid center of the Australian continent and is part of thelargest internally draining basin, Lake Eyre, in the Southern Hemisphere. To date paleoclimatic,geomorphic and sedimentologic investigations in the basin have been concentrated in the easternriver catchments and the Lake Eyre Playa itself. By contrast, the equally ancient northwesternalluvial systems, which are hypothesized to have once drained into Lake Eyre, have not beenmapped or adequately studied as they are now buried by the Simpson Desert. Relative to theancient drainage systems, the modern rivers in the basins northwest are smaller and tend todisappear in the dune swales, a short distance from the mountain ranges. Recent fieldwork in theregion has revealed that this ancient channel pattern may be a strong control on the location ofcatastrophically avulsed channels during the late Pleistocene and Holocene. Little is known orunderstood about this surface which is believed to have been formed by large drainage systemsduring more pluvial climate regimes. Sediments in the region are variable but depositionalenvironments are distinguishable by texture variations. The Pleistocene dune fields overlie olderfluvial gravel deposits, which are often exposed in the dune swales or lie at shallow depth. Aeoliansediments tend to be fine grained, well-sorted, quartz sand with red hematite coats yielding areddish-orange color. Fluvial sediments are coarser (medium sand to coarse gravel) and arearranged in channel fills and bar forms, and tend not to be red. The analysis of radar data for thisregion reveals important information on the channel location, channel scale and channel patternswhich form this ancient alluvial surface. The channel patterns are essentially single thread, straightor gently winding with localized anabranching and changes to distributary patterns in theintermediate and terminal floodouts. A combination of multispectral and ERS 1-2 radar images hasbeen used to reconstruct the past hydrological and climatic variations of the study area. This is partof the ESA project AO3-348.
FLOOD MONITORING IN THE SENEGAL RIVER VALLEY: FIRSTRESULTS BASED ON SAR PRI DATA
Sandholt Inge
E-mail: [email protected] of Geography, University of Copenhagen
Ostervoldgade 10Telephone: 0045 35322500
Fax: 0045 35322500
Co-author/s:Bjarne Fog, Institute of Geography, University of Copenhagen, Ostervoldgade 10, DK-1350Copenhagen K, DENMARK, Phone: 004535322500, Fax: 004535322501,E-mail: [email protected]
ABSTRACT
The traditional flood recession agriculture in the Senegal River valley in West Africa relies onadequate inundation of the valley, adequate with respect to areal extent and duration of the flood.In the recent decades, the river flow has been regulated through operations of dams in the riverbasin in order to provide a steady water flow in the river for use in irrigated farming. This incombination with a general decline in precipitation in the 70's and 80's in the Sahel, has resulted ina lower potential for flood recession agriculture. In 1999, the western part of Sahel, hasexperienced higher precipitation rates, and thus larger inundations than during the last 30 years.
Remote sensing is currently the only means for mapping the extent of the flooding in the verycomplex landscape, and SAR data is in particular useful. This study focuses on a small test area inthe middle part of the river valley around Podor in Senegal. Four ERS2 PRI SAR scenes have beenused in the analysis for delineation of flooded areas. Transects of the inundated areas measured bydifferential GPS, have resulted in profiles of the surface elevation across the area of floodrecession agriculture. The combined use of surface elevation measurements and satellite dataenabled a contour mapping of the flooded cuvette, and a rough estimation of the amount offlooding. The duration and extend of the flood could be estimated, and the result may thus serveuseful to local decision-makers in crop yield estimation etc.

MAPPING AND EVALUATION OF "MITCH" HURRICANE DAMAGESIN CENTRAL AMERICA USING ERS SAR AND SPOT IMAGES
Nezry Edmond
E-mail: [email protected] N.V. Private Experts in Remote Sensing
c/o 13 Avenue de la GloireTelephone: 0033561545827
Fax: 0033561991724
Co-author/s:Edmond Nezry, Francis Yakam-Simen, Paul Romeijn and Philippe Bally Edmond Nezry, FrancisYakam-Simen Privateers Nv, Private Experts in Remote Sensing c/o 13 Avenue de la Gloire,31500 Toulouse, France Phone: (+33) 5-61545827; Fax: (+33) 5-61991724;E-mail: [email protected] Paul Romeijn Treemail, International Forestry AdvisorsPrins Bernhardlaan 37, BW 6866 Heelsum, The Netherlands, E-mail: [email protected] Bally Spotimage, 5 rue des Satellites, 31055 Toulouse Cedex, France, E-mail: [email protected]
ABSTRACT
In November 1998, Central America was devastated by the hurricane "Mitch". Never before, hadthis area suffered such total devastation combining wide flooding, huge forest destruction,landslides, and large-scale destruction of housing and infrastructures. A project was immediatelyput up to carry out a wide area / high spatial resolution evaluation of these damages, using SPOTand ERS satellite imagery. The aim was to deliver as quickly as possible accurate high spatialresolution maps of the damages that could be used by local photo-interpreters. To reach this goal,the following data processing procedure was applied: - The ERS SAR data were used to detect thedamages. In the change detection process, the ERS SAR archive data acquired before "Mitch"were compared to the ERS SAR data acquired just after "Mitch". - Combined speckle filtering andsuper-resolution techniques have been applied to the ERS SAR data, to detect and map existingtargets at a spatial resolution of 10 meters (SPOT-P resolution) before and after "Mitch", withparticular emphasis to housing and infrastructures. - Change detection techniques appropriate toSAR images have been applied to detect and map the damages. - SPOT-P archive data were usedas mapping background. The final product is the result of a common-sense data fusion processintegrating ERS SAR change detection and SPOT-P archive data, to facilitate photo-interpretationof the final product. - Finally, two sets of cartographic UTM maps of "Mitch" damages have beenproduced, on 10 and 20 meters grids.
The SPOT and ERS satellite images were made available respectively during November andDecember 1998. Altogether, these data allowed to study about 120.000 km2 in the most devastatedareas of Honduras, Nicaragua and El Salvador. All the cartographic high spatial resolutionproducts were delivered in the first days of 1999.
This efficiency in operating the project enabled rapid validation of the results (El-Salvador inJanuary/February 1999, Nicaragua in February 1999 and Honduras in March 1999), withsatisfactory results. Validation results in Honduras are presented.
A RAPID MAPPING SYSTEM FOR HURRICANE DAMAGEASSESSMENT
Fellah Kader
E-mail: [email protected]
Boulevard Sébastien BrantTelephone: 00 33 3 88 65 52 00
Fax: 00 33 3 88 65 51 99
Co-author/s:K. Fellah (1), E. Nezry (2), P.Bally (3), J. Bequignon (4), A. Herrmann (1), C. Bestault (1) P. deFraipont (1)(1)Service Régional de Traitement d'Image et de Télédétection (SERTIT), bv Sébastien Brant, 67400 Illkirch, FPh +33 (0) 3 88655200, Fax +33 (0) 3 88655199, [email protected],http://sertit.u-strasbg.fr(2)Privateers N.V, 13 Avenue de la Gloire, 31500 Toulouse, FPh +33 (0) 5 61545827, Fax +33 (0)5 61991724, [email protected], http://www.treemail.nl/privateers/index.htm(3)Spot Image, 5, rue des Satellites, B.P. 4359, 31030 Toulouse Cedex 4, FrancePh +33 (0)562194248, Fax +33 (0) 562194053,(4)ESA/ESRIN, V. Galileo Galilei 00044 Frascati, IPh +39 06 94180 1, Fax +39 06 94180 280,E-mail: [email protected], http://www.esrin.esa.it/
ABSTRACT
After the catastrophic damage caused by the hurricane Mitch in Central America, the subsequentintervention of the French Civil Defence Agency DDSC, and the work carried out by ESA and theCNES, ESA and the DDSC had agreed to co-operate during the following, end of 1999, cycloneseason. The objective was to assess the contribution of space techniques to perform disastermanagement in an operational context. Within this framework, ESA granted a contract to a consortiumbetween SPOT IMAGE, SERTIT, PRIVATEERS and IGN Espace. The experiment was focusing onrisk management in relation to hurricane threats in inter-tropical regions, the French West Indies and LaRéunion Island. The main objective is to design a rapid response mapping system in order to quicklyprovide the DDSC with adequate cartographic and damage assessment map products. On the 16th ofNovember 1999, the hurricane Lenny was brewing in the Antilles and therefore started the procedure.During this event, archive data from ERS, Radarsat, SPOT were processed and new acquisitionsplanned. Then, on the 18th of November the hurricane reached and damaged Guadeloupe. At first, abasic cartographic product was produced in less than 24hrs after a Radarsat data acquisition, the 22nd ofNovember. This information overlaid on IGN maps and SPOT data shows the main areas affected bythe hurricane. Then, high level cartographic products called damage assessment products wereproduced by applying radar change detection techniques. These high resolution thematic productsdetailed the areas affected by the hurricane and indicates potential damage levels. All the cartographicproducts were up-loaded to an interactive Web Intranet server which enables the partners and theDDSC to visualise and request advanced geographical and thematic mapping from the online database.The experiment demonstrates the ability to rapidly delimit potentially damaged areas using EO satellitescomplemented with cartographic maps. It provides feedback for assessing the contribution of EO basedproducts and services to risk management in an operational context. The different constraints imposedby operational EO systems, the required level of processing plus thematic analyses and time aspects ofthe data and information provision chain are exposed. Acknowledgements: The experiment wasperformed with support of ESA, CNES and CSA which provided respectively ERS, SPOT andRADARSAT data.

WATCHING FOR THE HAZARDOUS SPRING 99 FLOODING IN THECHERNOBYL ZONE IN UKRAINE WITH THE ERS SAR IMAGES
Greku Rudolf
E-mail: [email protected] of Geological Sciences of NASU
SATMAR, January Revolution Str., 3, 127, P.O. Box 105 Kiev-10, 252010,Telephone: 380-44-290-7188
Fax: 380-44-216-9334
Co-author/s:A.A. Ishuk and V.G. Shvaiko, INFOCenter of Chernobyl, Kiev, Ukraine;D. Saryan, ECOMM Co.,Kiev, Ukraine; e-mail: [email protected]. Greku, SATMAR Satellite Marine TechnologyLaboratory, Kiev, Ukraine,e-mail: [email protected]
ABSTRACT
The basin of the Pripyat River is located within a high radioactiveness zone what was occurredafter the Chernobyl catastrophe. There are radioactive marshes and many burial-places of theradioactive waste materials near by the Chernobyl Nuclear Power Station (building rubbish, treessubjected by radiation, machines and equipment used for clearing and disactivation). Thesedangerous objects are fenced in polder dams. But overflow the dams can be happen in case of ahigh flood. A following return of radioactive water to the Pripyat and Dnieper Rivers bears ahazard to the densely populated areas located along the rivers. Such situation has been warned atthe spring 99. To obtain a real situation the ERS-2 SAR data was required within the framework ofthe ESA AO3.358 Project. Forecasting by means of the domestic hydrological model on thecritical high water time has been compared and defined more precisely with the ERS SAR image.Comparison with the normal situation during the previous dry autumn was carried out with anotherSAR image.

MINING INDUCED SEISMIC EVENTS - IMAGING SURFACEDEFORMATION OF DEEP MINE ROCK BURSTS AND FAULT
MOVEMENTS
Stow Richard
E-mail: [email protected] of Nottingham
6 Roydhouse ShelleyTelephone: 0044 1484 603986
Fax: 0044 1484 603986
Co-author/s:R J Stow, University of Nottingham. G Doyle. University of Cape Town.
ABSTRACT
Seismic events, some exceeding Richter magnitude 6, caused by rock bursts and fault movementinduced by deep mining (around 2.5 km), are being studied with data from European SpaceAgency satellites ERS1 and ERS 2. The satellite synthetic aperture radar (SAR) data is applied byinterferometry (InSAR) and used to image surface deformation caused by such events, with theobjective of aiding mine seismology and safety. Results are presented.
SURVEY OF LARGE DEFORMATION IN THE CHILE-PERU SEISMICGAP (SOUTH AMERICA) USING SAR INTERFEROMETRY: THE
LOADING AND TRIGGERING OF GIANT EARTHQUAKE
De Chabalier Jean-Bernard
E-mail: [email protected] de Physique du Globe de Paris
4, Place JussieuTelephone: 00 33 1 44 27 24 29
Fax: 00 33 1 44 27 38 94
Co-author/s:M. Chlieh, J.C. Ruegg, R. Armijo (Institut de Physique du Globe de Paris, France) B. Fruneau(Université de Marne La Vallée, France)R. Cattin (Ecole Normale Supérieure, France)
ABSTRACT:
The 1995 M=8.1 Antofagasta earthquake ruptured the southern segment of Chile-Peru seismic gaplocated on one of the fastest plate boundary, the subduction of the oceanic Nasca plate beneathSouth America (nearly 80 mm/yr of relative convergence). Studies of this earthquake corroboratethat the conditions of applying SAR technique are exceptionally good in this region due to theextreme aridity of the Atacama desert. Combined with GPS and seismic modelling, SARinterferometry has proved to be essential to constrain the surface deformation, and to characterizethe mechanics and kinematics of the earthquake: the area of co-seismic deformation is very large(200km x 300 km) and reach 60 cm of range increase; the variation of slip distribution on the faultplane indicates non homogeneous strain release; blocked in the north, by the presence of thegeometrical asperity of Mejillones penninsula, the rupture propagates toward the south. The 1995may be a foreshock of a huge earthquake that pending in the Northern Chile Gap (20°S). Thisregion offers the unique opportunity to tackle the understanding of the mechanical processes thattake place during the elasting loading (inter-seismic phase) and the triggering of earthquake (pre-seismic phase). We processed ERS scenes centred o the North Chile gap (20°S), on an area of250km x 200km, that consist of 8 scenes on 3 parallel orbits over a period of 2 to 4 years. The mapof inter-seismic deformation reveals 10 to 14 mm/yr of range decrease, consistent with uplift andeastward displacements measured by GPS. The maximum of gradient is located on the first 100km from the coast. Modelling the inter-seismic displacement using back-arc dislocation modelindicates high value of coupling (70-100), and a depth of locking of 40-50 km. To study post-seismic deformation in Antofagasta area we processed an interferogram that include 3.5 years ofdisplacement after the event. The image of post-seismic deformation reveals a superposition ofinter-seismic loading along the coast and post-seismic signal in the area of the 1995 earthquake.This can be modelled as after-slip on a fault larger and deeper than the fault, which was activatedduring the earthquake.

FLOOD MONITORING IN THE SENEGAL RIVER VALLEY: FIRSTRESULTS BASED ON SAR PRI DATA
Sandholt Inge
E-mail: [email protected] of Geography, University of Copenhagen
Ostervoldgade 10Telephone: 0045 35322500
Fax: 0045 35322500
Co-author/s:Bjarne Fog, Institute of Geography, University of Copenhagen, Ostervoldgade 10, DK-1350Copenhagen K, DENMARK, Phone: 004535322500, Fax: 004535322501,E-mail: [email protected]
ABSTRACT
The traditional flood recession agriculture in the Senegal River valley in West Africa relies onadequate inundation of the valley, adequate with respect to areal extent and duration of the flood.In the recent decades, the river flow has been regulated through operations of dams in the riverbasin in order to provide a steady water flow in the river for use in irrigated farming. This incombination with a general decline in precipitation in the 70's and 80's in the Sahel, has resulted ina lower potential for flood recession agriculture. In 1999, the western part of Sahel, hasexperienced higher precipitation rates, and thus larger inundations than during the last 30 years.
Remote sensing is currently the only means for mapping the extent of the flooding in the verycomplex landscape, and SAR data is in particular useful. This study focuses on a small test area inthe middle part of the river valley around Podor in Senegal. Four ERS2 PRI SAR scenes have beenused in the analysis for delineation of flooded areas. Transects of the inundated areas measured bydifferential GPS, have resulted in profiles of the surface elevation across the area of floodrecession agriculture. The combined use of surface elevation measurements and satellite dataenabled a contour mapping of the flooded cuvette, and a rough estimation of the amount offlooding. The duration and extend of the flood could be estimated, and the result may thus serveuseful to local decision-makers in crop yield estimation etc.
MAPPING AND EVALUATION OF "MITCH" HURRICANE DAMAGESIN CENTRAL AMERICA USING ERS SAR AND SPOT IMAGES
Nezry Edmond
E-mail: [email protected] N.V. Private Experts in Remote Sensing
c/o 13 Avenue de la GloireTelephone: 0033561545827
Fax: 0033561991724
Co-author/s:Edmond Nezry, Francis Yakam-Simen, Paul Romeijn and Philippe Bally Edmond Nezry, FrancisYakam-Simen Privateers Nv, Private Experts in Remote Sensing c/o 13 Avenue de la Gloire,31500 Toulouse, France Phone: (+33) 5-61545827; Fax: (+33) 5-61991724;E-mail: [email protected] Paul Romeijn Treemail, International Forestry AdvisorsPrins Bernhardlaan 37, BW 6866 Heelsum, The Netherlands, E-mail: [email protected] Bally Spotimage, 5 rue des Satellites, 31055 Toulouse Cedex, France, E-mail: [email protected]
ABSTRACT
In November 1998, Central America was devastated by the hurricane "Mitch". Never before, hadthis area suffered such total devastation combining wide flooding, huge forest destruction,landslides, and large-scale destruction of housing and infrastructures. A project was immediatelyput up to carry out a wide area / high spatial resolution evaluation of these damages, using SPOTand ERS satellite imagery. The aim was to deliver as quickly as possible accurate high spatialresolution maps of the damages that could be used by local photo-interpreters. To reach this goal,the following data processing procedure was applied: - The ERS SAR data were used to detect thedamages. In the change detection process, the ERS SAR archive data acquired before "Mitch"were compared to the ERS SAR data acquired just after "Mitch". - Combined speckle filtering andsuper-resolution techniques have been applied to the ERS SAR data, to detect and map existingtargets at a spatial resolution of 10 meters (SPOT-P resolution) before and after "Mitch", withparticular emphasis to housing and infrastructures. - Change detection techniques appropriate toSAR images have been applied to detect and map the damages. - SPOT-P archive data were usedas mapping background. The final product is the result of a common-sense data fusion processintegrating ERS SAR change detection and SPOT-P archive data, to facilitate photo-interpretationof the final product. - Finally, two sets of cartographic UTM maps of "Mitch" damages have beenproduced, on 10 and 20 meters grids.
The SPOT and ERS satellite images were made available respectively during November andDecember 1998. Altogether, these data allowed to study about 120.000 km2 in the most devastatedareas of Honduras, Nicaragua and El Salvador. All the cartographic high spatial resolutionproducts were delivered in the first days of 1999.
This efficiency in operating the project enabled rapid validation of the results (El-Salvador inJanuary/February 1999, Nicaragua in February 1999 and Honduras in March 1999), withsatisfactory results. Validation results in Honduras are presented.

A RAPID MAPPING SYSTEM FOR HURRICANE DAMAGEASSESSMENT
Fellah Kader
E-mail: [email protected]
Boulevard Sébastien BrantTelephone: 00 33 3 88 65 52 00
Fax: 00 33 3 88 65 51 99
Co-author/s:K. Fellah (1), E. Nezry (2), P.Bally (3), J. Bequignon (4), A. Herrmann (1), C. Bestault (1) P. deFraipont (1)(1)Service Régional de Traitement d'Image et de Télédétection (SERTIT), bv Sébastien Brant, 67400 Illkirch, FPh +33 (0) 3 88655200, Fax +33 (0) 3 88655199, [email protected],http://sertit.u-strasbg.fr(2)Privateers N.V, 13 Avenue de la Gloire, 31500 Toulouse, FPh +33 (0) 5 61545827, Fax +33 (0)5 61991724, [email protected], http://www.treemail.nl/privateers/index.htm(3)Spot Image, 5, rue des Satellites, B.P. 4359, 31030 Toulouse Cedex 4, FrancePh +33 (0)562194248, Fax +33 (0) 562194053,(4)ESA/ESRIN, V. Galileo Galilei 00044 Frascati, IPh +39 06 94180 1, Fax +39 06 94180 280,E-mail: [email protected], http://www.esrin.esa.it/
ABSTRACT
After the catastrophic damage caused by the hurricane Mitch in Central America, the subsequentintervention of the French Civil Defence Agency DDSC, and the work carried out by ESA and theCNES, ESA and the DDSC had agreed to co-operate during the following, end of 1999, cycloneseason. The objective was to assess the contribution of space techniques to perform disastermanagement in an operational context. Within this framework, ESA granted a contract to a consortiumbetween SPOT IMAGE, SERTIT, PRIVATEERS and IGN Espace. The experiment was focusing onrisk management in relation to hurricane threats in inter-tropical regions, the French West Indies and LaRéunion Island. The main objective is to design a rapid response mapping system in order to quicklyprovide the DDSC with adequate cartographic and damage assessment map products. On the 16th ofNovember 1999, the hurricane Lenny was brewing in the Antilles and therefore started the procedure.During this event, archive data from ERS, Radarsat, SPOT were processed and new acquisitionsplanned. Then, on the 18th of November the hurricane reached and damaged Guadeloupe. At first, abasic cartographic product was produced in less than 24hrs after a Radarsat data acquisition, the 22nd ofNovember. This information overlaid on IGN maps and SPOT data shows the main areas affected bythe hurricane. Then, high level cartographic products called damage assessment products wereproduced by applying radar change detection techniques. These high resolution thematic productsdetailed the areas affected by the hurricane and indicates potential damage levels. All the cartographicproducts were up-loaded to an interactive Web Intranet server which enables the partners and theDDSC to visualise and request advanced geographical and thematic mapping from the online database.The experiment demonstrates the ability to rapidly delimit potentially damaged areas using EO satellitescomplemented with cartographic maps. It provides feedback for assessing the contribution of EO basedproducts and services to risk management in an operational context. The different constraints imposedby operational EO systems, the required level of processing plus thematic analyses and time aspects ofthe data and information provision chain are exposed. Acknowledgements: The experiment wasperformed with support of ESA, CNES and CSA which provided respectively ERS, SPOT andRADARSAT data.
WATCHING FOR THE HAZARDOUS SPRING 99 FLOODING IN THECHERNOBYL ZONE IN UKRAINE WITH THE ERS SAR IMAGES
Greku Rudolf
E-mail: [email protected] of Geological Sciences of NASU
SATMAR, January Revolution Str., 3, 127, P.O. Box 105 Kiev-10, 252010,Telephone: 380-44-290-7188
Fax: 380-44-216-9334
Co-author/s:A.A. Ishuk and V.G. Shvaiko, INFOCenter of Chernobyl, Kiev, Ukraine;D. Saryan, ECOMM Co.,Kiev, Ukraine; e-mail: [email protected]. Greku, SATMAR Satellite Marine TechnologyLaboratory, Kiev, Ukraine,e-mail: [email protected]
ABSTRACT
The basin of the Pripyat River is located within a high radioactiveness zone what was occurredafter the Chernobyl catastrophe. There are radioactive marshes and many burial-places of theradioactive waste materials near by the Chernobyl Nuclear Power Station (building rubbish, treessubjected by radiation, machines and equipment used for clearing and disactivation). Thesedangerous objects are fenced in polder dams. But overflow the dams can be happen in case of ahigh flood. A following return of radioactive water to the Pripyat and Dnieper Rivers bears ahazard to the densely populated areas located along the rivers. Such situation has been warned atthe spring 99. To obtain a real situation the ERS-2 SAR data was required within the framework ofthe ESA AO3.358 Project. Forecasting by means of the domestic hydrological model on thecritical high water time has been compared and defined more precisely with the ERS SAR image.Comparison with the normal situation during the previous dry autumn was carried out with anotherSAR image.
MINING INDUCED SEISMIC EVENTS - IMAGING SURFACEDEFORMATION OF DEEP MINE ROCK BURSTS AND FAULT
MOVEMENTS
Stow Richard
E-mail: [email protected] of Nottingham
6 Roydhouse ShelleyTelephone: 0044 1484 603986
Fax: 0044 1484 603986
Co-author/s:R J Stow, University of Nottingham. G Doyle. University of Cape Town.
ABSTRACT
Seismic events, some exceeding Richter magnitude 6, caused by rock bursts and fault movementinduced by deep mining (around 2.5 km), are being studied with data from European SpaceAgency satellites ERS1 and ERS 2. The satellite synthetic aperture radar (SAR) data is applied byinterferometry (InSAR) and used to image surface deformation caused by such events, with theobjective of aiding mine seismology and safety. Results are presented.
SURVEY OF LARGE DEFORMATION IN THE CHILE-PERU SEISMICGAP (SOUTH AMERICA) USING SAR INTERFEROMETRY: THE
LOADING AND TRIGGERING OF GIANT EARTHQUAKE
De Chabalier Jean-Bernard
E-mail: [email protected] de Physique du Globe de Paris
4, Place JussieuTelephone: 00 33 1 44 27 24 29
Fax: 00 33 1 44 27 38 94
Co-author/s:M. Chlieh, J.C. Ruegg, R. Armijo (Institut de Physique du Globe de Paris, France) B. Fruneau(Université de Marne La Vallée, France)R. Cattin (Ecole Normale Supérieure, France)
ABSTRACT:
The 1995 M=8.1 Antofagasta earthquake ruptured the southern segment of Chile-Peru seismic gaplocated on one of the fastest plate boundary, the subduction of the oceanic Nasca plate beneathSouth America (nearly 80 mm/yr of relative convergence). Studies of this earthquake corroboratethat the conditions of applying SAR technique are exceptionally good in this region due to theextreme aridity of the Atacama desert. Combined with GPS and seismic modelling, SARinterferometry has proved to be essential to constrain the surface deformation, and to characterizethe mechanics and kinematics of the earthquake: the area of co-seismic deformation is very large(200km x 300 km) and reach 60 cm of range increase; the variation of slip distribution on the faultplane indicates non homogeneous strain release; blocked in the north, by the presence of thegeometrical asperity of Mejillones penninsula, the rupture propagates toward the south. The 1995may be a foreshock of a huge earthquake that pending in the Northern Chile Gap (20°S). Thisregion offers the unique opportunity to tackle the understanding of the mechanical processes thattake place during the elasting loading (inter-seismic phase) and the triggering of earthquake (pre-seismic phase). We processed ERS scenes centred o the North Chile gap (20°S), on an area of250km x 200km, that consist of 8 scenes on 3 parallel orbits over a period of 2 to 4 years. The mapof inter-seismic deformation reveals 10 to 14 mm/yr of range decrease, consistent with uplift andeastward displacements measured by GPS. The maximum of gradient is located on the first 100km from the coast. Modelling the inter-seismic displacement using back-arc dislocation modelindicates high value of coupling (70-100), and a depth of locking of 40-50 km. To study post-seismic deformation in Antofagasta area we processed an interferogram that include 3.5 years ofdisplacement after the event. The image of post-seismic deformation reveals a superposition ofinter-seismic loading along the coast and post-seismic signal in the area of the 1995 earthquake.This can be modelled as after-slip on a fault larger and deeper than the fault, which was activatedduring the earthquake.
STUDY OF SURFACE DISPLACEMENTS IN URBAN CONTEXT WITHSAR INTERFEROMETRY: APPLICATION TO THE CITIES OF PARIS
(FRANCE), AND TAINAN (TAIWAN)
Fruneau Benedicte
E-mail: [email protected] Francilien des Geosciences Universite de Marne-la-Vallee
5 bd DescartesTelephone: 00 33 1 49 32 90 61/71
Fax: 00 33 1 49 32 91 37
Co-author/s:Francesco Sarti, CNES, QTIS/SR, 18 avenue Edouard Belin, Bpi 811, 31401 Toulouse, France,Tel: 00.33.5.61.28.21.33 Fax: 00.33.5.61.27.31.67 E-mail:[email protected], BenoitDeffontaines, Erwan Pathier, Daniel Raymond, Departement de Geotectonique, Universite Pierreet Marie Curie, 4 place Jussieu, 75252 Paris Cedex 5, France,Tel : 00.33.1.44.27.58.30 Fax:00.33.1.44.27.50.85 E-mail: [email protected]
ABSTRACT
Differential SAR interferometry allows detection and mapping of slow deformations, especially inurban areas, where coherence remains high over long time scales. One limiting factor is then thevariation of atmospheric conditions between the acquisition of images, which can introduce largeartifacts on interferograms. On Paris city (France), atmospheric heterogeneities were clearlydetected on all differential interferograms we have generated. A method for automaticcharacterization of displacement fringes, free of atmospheric artifacts, based on complexcorrelation of interferograms was used, and allowed us to reveal two subsiding zones. Thesecentimetric subsidences are associated with the construction of an underground station(Haussmann-St.Lazare) for the Eole subway, beginning in 1995 and ending in 1997. They resultfrom the lowering of the piezometric level, due to phreatic water pumping. The spatial subsidingextent may be mapped, and the temporal evolution of the subsidences is carefully examined. Wealso studied Tainan city (1.2 millions of inhabitants), located in the southwestern part of Taiwan.Tainan is built on a small elongated hill, 35 m high, towering above the surrounding coastal plain.The ten processed differential interferograms show deformation of this relief on the range of 3 cmduring the period 1996-1998. This validates a recent geological model (Deffontaines et al., 1997)which interpret this area as an uplift resulting from the westward propagation of the Taiwaneseorogene deformation front, linked to the active collision of the Eurasian and Philippine plates.Such study leads to revalue the natural hazard mitigation in Tainan. These studies highlight thepotentiality of SAR interferometry for detection, in urban context, of slow deformation (fewcentimeters per year) of small or larger extent (e.g. 2 km and 50 km² for Paris and Tainanrespectively), related to human or natural causes. This project is supported by ESA (ERS AO3-350/ Envisat AO-441).
SUBSIDENCE MONITORING USING SPARSE SAR DIFFERENTIALINTERFEROMETRIC MEASUREMENTS: THE BOLOGNA CASE
STUDY
Costantini Mario
E-mail: [email protected] S.p.A.Via Tiburtina, 965
Telephone: 0039.06.4079.6445Fax: 0039.06.4079.6202
ABSTRACT
From differential interferometric synthetic aperture radar (SAR) data it is possible to measuresmall deformations of the terrain occurred between different acquisitions. In this paper, we useERS 1 and ERS 2 data, covering a time interval spanning from March 1993 to June 1999, to studyterrain displacements occurring in the area of Bologna, Italy, and its surroundings.
According to previous studies, based on both in-situ and SAR differential interferometrymeasurements, the considered area has been affected by subsidence phenomena, probably causedby extraction of water from subsoil. The interferometric measurements performed up to now havebeen limited to Bologna's urban area, due to the limitations of traditional phase unwrappingtechniques. As a matter of fact, temporal decorrelation causes a nearly complete loss of coherenceover most part of the imaged scene, and good quality data are available only on sparse areas (urbanareas and/or isolated buildings, other stable objects, arid terrain). This prevents unwrapping thegood quality phase by means of algorithms requiring that input data are on a regular rectangulargrid. Here, we make use of a new generalized technique, presented in [1] that is able to deal withsparse data. Therefore, we are able to extend the analysis to the Bologna's surrounding area.
The displacement maps corresponding to the obtained unwrapped phases are then properlycombined to perform a temporal analysis of the subsidence phenomena occurring in the consideredarea, thus obtaining a complete space-time description of the terrain movements. Temporalanalysis of data is also useful to minimize the impact of atmospheric artifacts and inaccuratesatellite orbit knowledge. Finally, in order to test the effectiveness of the method, the obtainedresults are compared with in situ measurements.
References[1] M. Costantini, P. Rosen, "A generalized phase unwrapping approach for sparse data," in Proc.Int. Geosci. Remote Sens. Symp.," 1999.
SOIL MOISTURE ESTIMATION WITH SAR.PRI ERS IMAGES
Salgado Hector
E-mail: [email protected] de Agronomía, Universidad de Buenos Aires
Avda. San Martín 4453Telephone: 0054 11 45248006
ABSTRACT
The estimation of the water content in the root soil zone is of fundamental importance for cropmanagement and yield forecast. This subject requires a periodic and extended monitoring alongwide surfaces, which can only be achieved by means of remote sensing.
The active microwaves sensors operating in C band, such as the Synthetic Aperture Radar (SAR)of ERS, have demonstrated to be a useful tool for monitoring the level of surface soil moisture,ensuring also the systematic availability of information under any meteorological or lightcondition. SAR backscattering depends on the surface roughness, slope and its physical-chemicalcharacteristics. Indeed, the backscatterered energy is a function of the dielectric constant of thesoil, which depends on the water content.
This paper presents the first results of humidity estimation on soils dedicated to agriculture, withfallow cover, located in the Llanura Pampeana (in the Centre-South of the County of BuenosAires, Argentina). Campaigns of soil sampling simultaneously with the satellite acquisition werecarried out in 12 places. Samples were extracted with drill between 0 and 10 cm of depth and wereprocessed following the gravimetric method, obtaining the corresponding values of volumetricmoisture. In the first stage of the project, three images ERS-2 SAR PRI were used. The imageswere georeferenced and radiometrically calibrated in order to retrieve the values of sigma noughtover the sampling places, using the software SAR Toolbox (ESA) and PCI (RSI Inc.). Thecorrelation between sigma nought s0 (expressed in dB) and the measured volumetric humidity HV(expressed in ) is presented. It shows an acceptable coefficient of lineal correlation (r2 = 0,65) fora linear adjustment HV = a + b . s0.
The images were classified applying this correlation function, obtaining maps of humidity for theparcels of interest. These results are compared with the values obtained estimating the humidity byhydric balance. These first experiences, limitations and the future plans for the project arepresented in this paper.
SOIL MOISTURE MAPPING USING ENVISAT ASAR AND ERS-2 DATAIN THE SOUTHERN GREAT PLAINS REGION OF THE U. S
Jackson Thomas
E-mail: [email protected]. Dept. of AgricultureAgricultural Research ServiceHydrology Lab
USDA Hydrology Lab104 Bldg. 007 BARC-WestBeltsville, MD 20705 USATelephone: 301-504-8511
Fax: 301-504-8931
Co-author/s:T. J. Jackson, USDA ARS Hydrology Lab, 104 Bldg. 007 BARC-West, Beltsville, MD 20705,USA, E-mail: [email protected], Telephone: 301-504-8511, Fax 301-504-8931Oldak, USDA ARS Hydrology Lab, Beltsville, MD 20705, USA P. Starks, USDA ARSGrazinglands Research Lab, El Reno, OK, USA R. Elliott, Oklahoma State Univ., Stillwater, OK,USA J. Shi, Univ. of California Santa Barbara, Santa Barbara, CA, USA
ABSTRACT
ENVISAT data will be used to develop a regional soil moisture algorithm for the Southern GreatPlains of the United States. This region is characterized by low levels of vegetation for most of theyear and variable soil moisture conditions. Data from the ASAR (alternating polarization mode)will be the primary information used. A time series of ERS-2 data is currently being acquired inconjunction with ground observations of soil moisture. The time series is based upon allacquisitions for a specific track and three frames. This data set will be used to establish baselineconditions and to better understand the annual temporal backscatter coefficient signatures ofgrasslands and winter wheat. The time series would be continued for one year after the beginningof data collection by ENVISAT and will include the ASAR data. Alternative modeling approachesare being evaluated using this data set as well as other data already available within this region(AIRSAR, SIR-C and Radarsat). There are significant limitations in using a single channelsynthetic aperture radar for soil moisture estimation. It is expected that the multipolarization dataof ASAR will greatly improve these techniques. The results of the first year of ERS-2 observationswill be presented. Backscattering coefficients will be compared with ground based soil moistureand land cover information for twelve sites. Land cover information is based upon interpretation ofLandsat Thematic Mapper images acquired close to the date of each ERS-2 acquisition. Since theinception of the series in June of 1999, two acquisitions have not been useable due to ongoingrainfall at the time of the overpass.
APPRAISAL OF SAR DATA APPLICATION IN ASSESSMENT OF SOILSALINITY AND WATERLOGGING PROBLEMS IN BAHAWALNAGAR
AND BAHAWALPUR DISTRICTS, PAKISTAN
Ahmed Iftikhar
E-mail: [email protected] Space & Upper Atmosphere Research Commission
(SUPARCO)Satellite Ground Station, SUPARCO, P.O. Box 1271, Islamabad
Telephone: 009251495908Fax: 009251495909
Co-author/s:1)Abdul Raouf2)Zuhair BokhariSatellite Ground Station, SUPARCO, P.O. Box, 1271, Islamabad-44000,PakistanTelephone: 009251495908, Fax: 009251495909, E-mail: [email protected]
ABSTRACT
Salinity and waterlogging are highly detrimental to both fertility of the soil and the environment.An accurate assessment of these problems and their physical factors in timely and cost effectivemanner is one of the prime requirements for reclamation of degraded soil. This study, aimed onappraisal of ERS-SAR data in assessment of soil salinity and waterlogging problems, has beenconducted at SUPARCOs Satellite Ground Station, Islamabad, Pakistan in collaboration withEuropean Space Agency (ESA) under AO3 framework. Both optical and microwave data, inseparate as well as complemented modes, have been used to demonstrate the potential of satelliteremote sensing technology in assessment of soil salinity and associated problems in agriculturalareas. SPOT XS and ERS-SAR multi-temporal data (between 1993 and 1999) have been analyzedusing digital image processing and GIS techniques to study the areal extent and intensity of the saltaffected and waterlogged areas of a small test site. Independent as well as complementedapplications of both sensors data have been found useful in mapping of highly saline areas (mostlyin crust form). However, both types of data could not provide encouraging results indiscrimination between moderately saline and other eroded material like sand silt, etc. Conjunctiveuse of SAR and optical data provided satisfactory results in salinity mapping during the wetseason, as microwave is sensitive to the geometrical characteristics (surface roughness, dielectricproperties and penetration through surface layers to some extent) of the ground surface. Theauthors wish to thank the European Space Agency (ESA) for providing ERS-SAR data andguidance to complete this study.
FEASIBILITY OF USING SAR DERIVED SOIL MOISTURE TOENHANCE THE ROBUSTNESS OF VEGETATION INDEX BASED CROP
YIELD MODELS.
Panigrahy Sushma
E-mail: [email protected] Applications Centre (ISRO)
Jodhpur Tekra Ambawadi Vistar P.O.Telephone: 00 91 79 677 4081
Fax: 00 91 79 674 8813
Co-author/s:Parul Patel
ABSTRACT
Realising the importance of soil moisture for crop survey, soil moisture estimation models usingSAR data from ERS and RADARSAT have been used to develop site specific operational modelsin India.
In the present study, attempts have been made to derive soil moisture status using ERS SAR dataof February 8, 1998 and NDVI from IRS data of February 9, 1998 for a mustard and wheatgrowing area covering parts of Agra, Mathura and Bharatpur district of Uttar Pradesh andRajasthan states in India. Wheat and mustard fields were categorised as dry, medium moist andmoist based on the derived moisture value. Corresponding average NDVI of the same fields weregenerated. Correlation between NDVI and the field moisture status was carried out. In case ofmustard, it was observed that very low NDVI were associated with low soil moisture. However,high NDVI values of mustard crop was found to have a large variation in the underlying soilmoisture. Further analysis using taluk (an administrative unit with in the district) showed thataverage soil moisture status was low for low yielding taluks and high for high yielding ones. Therewas no significant difference in the corresponding NDVI. Similar analysis for wheat fields showeda very low NDVI status for all the fields due to the early crop stage.
This indicates the possibility of deriving a soil moisture index to improve the crop yieldforecasting models. This is particularly significant for indeterminant crops like mustard, whereNDVI alone was not very effective indicator of crop vigour.
ASSESSMENT OF THE ERS TIMES SERIES FUSION ANDCOHERENCE ANALYSIS FOR THE MONITORING OF
ENVIRONMENTAL SENSITIVE AREAS IN ALSACE
Fellah Kader
E-mail: [email protected]
Boulevard Sébastien BrantTelephone: 00 33 3 88 65 52 00
Fax: 00 33 3 88 65 51 99
Co-author/s:K. Fellah, W. Gommenginger, C. Meyer, S. Clandillon, A. Herrmann, H. Yésou , P. de FraipontService Régional de Traitement d'Image et de Télédétection (SERTIT), bv Sébastien Brant,F-67 400 Illkirch, Telephone: +33 (0) 3 88 65 52 00, Fax +33 (0) 3 88 65 51 99,E-mail: [email protected] , http://sertit.u-strasbg.fr
ABSTRACT
At present, due to the advantages multi-temporal capability, the high stability of the ERS satellitesand the historical data-set archived over many years, it is possible to envisage the monitoring ofenvironmental changes on a medium term basis. This AO3-340 project exploits these advantagesand is designed to develop the use of SAR data from both an application and applied researchpoint of view.- the applied research aspects are focused on the assessment SAR time seriesprocessing and coherence for hydrological modelling. This is englobed within the framework ofthe European Project ARSGISIP, Applied Remote Sensing and GIS Integration for ModelParameterization.- the application is developed for wetland monitoring and the control of thesesensitive area. It is designed to meet the needs of customers with an obligation to conserve humidarea habitats. This falls within the framework of the European Project MANHUMA, Managementand Conservation of Humid Areas. The application study zone, a very flat area and anenvironmentally sensitive biotope which is strongly influenced by hydrological processes istherefore affected by new EU environmental and CAP directives. In this context, the use of new orcomplementary geo-information products derived from multi-annual EO data is investigated.Multi-temporal ERS SAR fusion techniques and coherence image analyses are used to achievethese objectives. These SAR specific image processing techniques take advantage of theavailability of multi-temporal ERS data sets in order to consider both the gain in the quantificationof bio-geophysical parameters to be derived, the temporal change detection of these features andthe delineation and characterisation of humid areas.
ERS-2, RADARSAT SAR BACKSCATTERING CHARACTERISTICS OFTHE PARANA RIVER DELTA WETLAND, ARGENTINA
Karszenbaum Haydee
E-mail: [email protected] de Astronomia y Fisica del Espacio (IAFE)
(Astronomy and Space Physics Institute)Pabellon IAFE, Ciudad Universitaria
Telephone: 0054 011 47832642Fax: 0054 011 47868114
Co-author/s:H. Karszenbaum(1), P. Kandus(2), G. Parmuchi(1), and J. Tiffenberg(1) (2) CONICET - Institutode Astronomia y Fisica del espacio (IAFE), Pabellón IAFE, Ciudad Universitaria (1428), BuenosAires, Argentina. E-mail: [email protected] (2)Laboratorio de Ecología Regional,Departamento de Biología - Facultad de Ciencias Exactas y Naturales Universidad de BuenosAires (UBA) Ciudad Universitaria, Pab. II 4to.piso. (1428) Buenos Aires, Argentina.E-mail: [email protected] Jean Michel Martinez, Thuy Le Toan Centre de Etudes Sàtiales de laBIOsphere (CESBIO),CNES-CNRS-Université Paul Sabatier, 18 Avenue Edouard Belin, 31401Toulouse Cedex 4, France, E-mail: [email protected], E-mail: [email protected]
ABSTRACT
The Lower Delta Islands of the Paraná River in Argentina constitute a major coastal tidalfreshwater wetland located at the De La Plata River estuary. It is a complex region where thelandscape pattern is characterized by mosaics of natural and man made ecosystems. Since the lastfew years an increased number of SAR images has been available for monitoring coastal wetlandsand deltas, but the complexity of the microwave-vegetation-water-interaction mechanisms takenplace needs further investigation. Difficulties arise due to scene factors such as environmentalconditions, vegetation phenology, and management practices. Also, differences in the observationgeometry (ascending and descending paths) add complexity to the overall interpretation of theradar response. This study was conducted to assess the potential of combined imagery fromRADARSAT (C-band, HH polarization) and ERS 2 (C-band, VV polarization) SAR systems formonitoring wetland ecosystems and assess flood condition. This paper discusses the microwave-vegetation-water interaction mechanisms identified in RADARSAT, and ERS 2 SAR images, forthree distinct vegetation structures forest, marshes, and rushes, and different flood conditions. TMimages of close dates, an existing vegetation map and field data were used as backgroundinformation. SAR images were carefully calibrated and geolocated. To establish hypothesis aboutthe links between land cover structure, flood condition, sensor characteristics (HH, VV) andresulting scattering process the information extraction procedure consisted on the multitemporalanalysis of the backscattering characteristics of well identified samples. Results show significantdifferences in the way SAR modes interact with woody and herbaceous vegetation, and floodcondition. In addition, ascending and descending ERS 2 imagery (day and night) show interestingdifferences in the radar response due to the vegetation moisture conditions. Current SARoperational satellites are single frequency and single polarization, but the new generation of SARsystems will provide multi polarization measurements. Therefore it is expected that the analysis ofcombined ERS-2 and Radarsat data, that this paper addresses, may contribute to the understandingof the future ASAR Envisat data.
OBSERVATION OF THE WETLAND HYDROLOGY IN THE UNSTRUTCATCHEMENT IN THURINGIA (GERMANY) BY MULTITEMPORAL
ERS-1 AND ERS-2 SAR DATA
Hochschild Volker
E-mail: [email protected]
INSTITUT FUER GEOGRAPHIE FRIEDRICH-SCHILLER-UNIVERSITAET JENA
Loebdergraben 32Telephone: 0049-3641-948855
Fax: 0049-3641-948852
ABSTRACT
The objective of the ENVISAT ASAR preparational work in Thuringia is the observation of thedevelopment of wetlands (i.e. Esperstädter Ried) which could be balanced area covering over thelast 10 years using ERS-1 and ERS-2 data. After the reunification of Germany all the pumps weredestroyed and the wetlands were flooded. Now there is a continuous dehydration every springtimeto use the area as pasture for cattle disturbing the natural water balance. This results in a short termand a long term variation of the water balance which will be observed using the multipolarimetricpossibilities of ENVISAT ASAR.
Some of the wetlands in Thuringia play an important role as permanent used grassland areas forcattle farming. These areas would be large water covered lakesides without pumping of water.Since the subsidised market in Europe allows the closing down of large scale agricultural areas,the Federal State of Thuringia has an interest in revitalising these areas in terms of breeding placesfor water birds or protected areas for salt adapted plants. The multitemporal ERS remote sensingdata is used to analyse the seasonal differences between the pumping of water in spring and therising water table over summer time until autumn. Apart from the seasonal development also thelong term alterations after the reunification of Germany are analysed since 1992, when the wholewetlands were full of water up to a fully developed agricultural site today.
The Thuringia Environmental Agency has a strong interest and supports the remote sensing study,since they intend to extend it to further wetland areas within Thuringia. With the multipolarimetricpossibilities of the ENVISAT ASAR there are even more detailed informations about the wetlandwater balances are expected.
MONITORING OF WATER HYACINTH ABUNDANCE AND ITSOCCASIONAL FACTORS IN LAKE VICTORIA AREA (EAST AFRICA)
USING ERS-1 AND ERS-2 SAR DATA
Hochschild Volker
E-mail: [email protected] fuer Geographie Friedrich-Schiller-Universitaet Jena
Loebdergraben 32Telephone: 0049-3641-948855
Fax: 0049-3641-948852
ABSTRACT
This poster shows results of as proposal for the Third Announcement of Opportunity for theExploitation of ERS Data, section '2.4 New or better Coverage by ERS Receiving Stations',especially for the evaluation of data from the new receiving station in Malindi (Kenya). Theoverall objective is the detection of water hyacinth in Lake Victoria with the evaluation of ERSbackscatter and the phase information of interferometric ERS-1/ERS-2 pairs. Water hyacinth is aweed with enormous growth rates causing serious problems for shipping traffic, fishing,freshwater fish fauna, plant diversity, etc. The aim is now not only the detection of the weedduring bad weather conditions, but also to observe the intensive agricultural land use in thesurroundings of the lake and to model the solute transport from point and non point sources. Thespecific objective and focus of the proposal is therefore threefold:
1. Detection of the water hyacinth weed within the beaches of Lake Victoria during bad weatherconditions (three rainy seasons) by the use of ERS SAR data. Control mechanisms need to have anareal and actual basis for appropriate management of the problem, therefore long termobservations with the 35-day-orbit are necessary to monitor the development of the water hyacinthmats throughout the seasons. The water hyacinth grows on top of the water surface up to severalcm heigh affecting the radar backscattering due to an altered surface roughness.
2. Observation of land use in marginal test catchments as an input base for distributed hydrologicalmodelling of water balance and water quality. Around the Lake Victoria intensive agricultural landuse (irrigation - plantations of sugar cane, tea, cotton, maize, etc.) is widespread. Each of thesedifferent land use types has its specific contribution to erosion and solute transport due to landcultivation techniques and fertilizer input. Areal extent and changes in time are importantinformation sources for hydrological modelling. In particular the Nyando subcatchment, prone toflooding, near the lake could be contributing to high pollution and solute transport rates into thelake.
3. Modelling of solute transport within the test catchments. Remote sensing data serves as input forobject oriented hydrological models (OMS) of freshwater pollution by agricultural non pointsource areas. Results are so called 'what if? - scenarios' of nutrient inputs into the lake and possibleextensions of water hyacinth mats, considering growth rates, irrigation amounts, fertilizer inputs,runoff measurements, etc.
THE CONTRIBUTION OF ERS SATELLITE ALTIMETRY TOHYDROLOGICAL APPLICATIONS
Birkett Charon
E-mail: [email protected]/GSFC
Mailcode 971 NASA/GSFCTelephone: 00 1 301 614 5923
Fax: 00 1 301 614 5644
ABSTRACT
A number of satellite radar altimeters have been launched over the last few decades. Althoughtheir primary priorities are aimed at ocean and ice studies, they have had considerable success overinland water bodies. In particular, the ability to monitor level changes in lakes and inland seas hasbeen demonstrated. Unhindered by vegetation or canopy cover, the techniques have additionallybeen applied to a number of rivers, wetlands and flood plains in several test-case studies. Theresults demonstrate how sub-monthly, seasonal, and interannual variations in surface water heightcan be monitored. The instruments are also unhindered by time of day or clouds, sample thesurface at pre-defined geographical and temporal resolutions, and the retrieved heights aredetermined with respect to one common reference datum. These are keen advantages at a timewhen there is much descoping of traditional gauging stations, and often little or slow disseminationof data.
This study looks at the contribution of the ERS RA data to inland water studies. In particular,results from the ERS-1 phase G will be presented for a selection of lakes in North America and theFlorida wetlands. The performance of the instrument over a wide range of target sizes will bediscussed paying particular attention to the acquisition time, tracker stability and overall heightaccuracy for both ocean-like and narrow-peaked echoes. The merits of ocean mode versus ice-mode tracking will also be debated, as well as an assessment of the overall contribution of ERSand ENVISAT altimeric data to several ongoing NASA projects (e.g., the Large-Scale Biosphere-Atmosphere Experiment in Amazonia, Natural Hazards: Flood and Drought in Africa).
RETRIEVAL OF GEO- AND BIOPHYSICAL INFORMATION FROMREMOTE SENSING DATA - OVERVIEW OF THE GEOBIRD STUDY
Bach Heike
E-mail: [email protected] GmbHLuisenstr.45
Telephone: 0049 89 523 89802Fax: 0049 89 523 89804
Co-author/s:Borgeaud Maurice, ESA, Electromagnetics Division, TOS-EEP, PO Box 299, 2200 AGNoordwijk, NL-The Netherlands, E-mail: [email protected], Tel: 0031-71-565-4830,Fax: 0031-71-565-4999 Häme Tuomas, VTT Automation, Remote Sensing, Box 13002 (Otakaari7), FIN-02044 VTT (Espoo), SF-Finland, E-mail: [email protected], Tel: 00358 9 456-6282,Fax: 00358 9 456-6475, Hans van Leeuwen, SYNOPTICS Integrated Remote Sensing &GIS Applications BV, P.O.Box 117, 6700 AC Wageningen, NL-The Netherlands,E-mail: [email protected], Tel: 0031 317 421221, Fax: 0031 317 416146Manninen Terhikki, VTT Automation, Remote Sensing, Box 13002 (Otakaari 7), FIN-02044 VTT(Espoo), SF-Finland, E-mail: [email protected], Tel: 00358 9 456-6285,Fax: 00358 9 456-6475 Mauser Wolfram, Institute for Geography, University of Munich,Luisenstr. 37, 80333 München, D-Germany, E-mail: [email protected],Tel: 0049 89 2180-6674, fax: 0049 89 2180-6675 Schneider Karl, VISTA Remote SensingApplications in Geosciences, Luisenstr. 45, 80333 München, D-Germany,E-mail: [email protected], Tel: 0049 89 2180-6694, Fax: 0049 89 2180-6675 Schouten Léon, SYNOPTICS Integrated Remote Sensing & GIS Applications BV, P.O.Box117, 6700 AC Wageningen, NL-The Netherlands, E-mail: [email protected],Tel: 0031 317 421221, Fax: 0031 317 416146 Stolz Roswitha, Institute for Geography, Universityof Munich, Luisenstr. 37, 80333 München, D-Germany,E-mail: [email protected], Tel: 0049 89 2180-6680, Fax: 0049 89 2180-6675Verhoef Wout, NLR Remote Sensing Dept., P.O.Box 153, 8300 AD Emmeloord, NL-TheNetherlands, E-mail: [email protected], Tel: 0031 527 248253, Fax: 0031 527 248210
ABSTRACT
An overview of the results of the GeoBIRD study, a project under ESA contract number12950/98/NL/GD, will be presented. The goal of GeoBIRD is the improved retrieval of bio-geophysical parameters crop yield, vegetation height, and tree species from multisensoral remotesensing data using ERS and optical sensors (TM, SPOT). This will be achieved through acombined application of the vegetation growth model PROMET-V, which simulates plant growthfrom environmental information, and remote sensing models (CLOUD and empirical models forSAR data; GeoSAIL and FLIM for optical data), which simulate sensor response from surfaceproperties. For a variety of agricultural and forest test sites in Europe the applicability of themethodology was investigated. ERS-1 SAR images were calibrated and corrected for localincidence angle by means of orbital and digital terrain elevation data. Parameters of the CLOUDmodel for several agricultural crops and meadows were derived by statistical fitting of gammavalues to ground observed parameters. Using information on the spatial distribution of plantparameters (biomass, vegetation water) from PROMET-V the CLOUD model was applied in theinverse mode to determine spatially distributed fields of surface soil moisture. The results werecompared to field measurements and water balance calculations. For forests, also texture and

coherence information was used. It could be demonstrated that forest stand parameters can bederived from coherence information under certain environmental conditions.
By means of model inversion of GeoSAIL, Landsat TM ground reflectance images in the sixoptical bands were processed into maps of LAI, fraction brown leaves and surface moisture. Here,initial ranges of parameters computed with PROMET-V were used to constrain the modelinversion. Updating of PROMET-V local initial plant densities from a retrieved LAI map of onedate resulted into highly consistent dynamic and spatial behaviour for most crops, and maytherefore result into much more detailed and realistic yield maps than a raster based growth modelwithout updating from remote sensing data can provide.

APPLICATION OF ERS-2.SAR DATA FOR SOIL MOISTUREESTIMATES OVER FLOODED AREAS.
Gruszczynska Maria
E-mail: [email protected] of Geodesy and Cartography
Remote Sensing and Spatial Information CentreJasna 2/4, Poland
Telephone: 0048/22 827 03 28Fax: 0048/22 827 03 28
Co-author/s:K. Dabrowska-Zielinska, M. Gruszczynska, A. Ciolkosz, S. Mularz
ABSTRACT
The flood in 1997 has been one of the biggest disasters in Poland in the last two centuries.European Space Agency has provided full set of satellite images ERS-2 over the flooded part ofPoland. Some agriculture areas were flooded and in some others soil moisture content was veryhigh exceeding the soil capacity. The information about soil moisture has been important not onlyfor agricultural prognosis, but also could be the essential information for the flood forecast in orderto determine the extent of saturation of the watershed and for partitioning of rainfall into surfacerunoff and infiltration. In July 1998 and 1999 the ground observations have been carried out inorder to develop the method of soil moisture estimates. The measurements of soil moisture andvegetation parameters have been done for the area of 100x100 km2 covering the whole ERS-2.SAR scene. On radar images, it is generally difficult to separate the backscattered componentsrelated to surface roughness, vegetation cover and soil moisture. To calculate soil moisture thecrop type and the crop status must be similar in order to avoid vegetation surface roughnessvariations. These variations can be expressed by LAI (Leaf Area Index) values, which reflectgeometrical properties of an object. It has been assumed that the same type of crop coveredagricultural fields in 1997 as in 1999 (crop rotation). It has been also assumed that the vegetationin the same periods of observation has been in the same stage of development. On the basis ofthese assumptions the developed soil moisture models have been applied for different type ofcrops using backscattering coefficient calculated from ERS-2 SAR. As the result, soil moisture hasbeen obtained for each of agriculture fields. The research has proved that SAR images (C-VV)could deliver important information about the flooded area and soil moisture for its excessiveamount. Extensive cloud cover, usually prevailing during flood periods seriously limits theusefulness of satellite images obtained in optical spectrum. In such cases the evaluation of floodevent can only be based on images taken in microwave portion of electromagnetic spectrum.
VALIDATION OF ICE FLOW MODELS WITH ERS SAROBSERVATIONS OF ANTARCTICGLACIERS AND ICE SHELVES
Rignot Eric
E-mail: [email protected] -Jet Propulsion Laboratory
4800 Oak Grove DriveTelephone: 001-818 354-1640
Fax: 001-818 393-3077
Co-author/s:Marjorie Schmeltz, Jet Propulsion Laboratory, Mail Stop 300-2354800 Oak Grove DrivePasadena, CA 91109-8099 USA, Telephone. (818) 354-3798; Fax (818) 393-3077;E-mail [email protected] Douglas Mac Ayeal University of Chicago GeophysicalSciences 5734 S. Ellis Avenue Chicago, IL 60637, E-mail: [email protected];Telephone: 773-702-8027 Eric Rignot Jet Propulsion Laboratory, Mail Stop 300-2354800 OakGrove Drive Pasadena, CA 91109-8099 USA Telephone. (818) 354-1640; Fax (818) 393-3077;Email [email protected]
ABSTRACT
We compared predictions from a coupled ice stream / ice shelf finite element flow model to ERSinterferometric observations of glacier andice stream flow in various sectors of West Antarctica.The model requires input information on the ice shelf / stream geometry, which we take from theERS imagery, ice thickness, which we obtain from ERS radaraltimetry or prior ice sounding radaror gravimetry data, and icerheology which we obtain from the literature. Free parameters includethe coefficient of basal friction at the bed and ice softening along the margins of fast-moving ice.Forward modelling shows that it is possible to match with a high degree of precision (less than 10percent difference in velocity) the results of the ERS interferometric analysis. The comparison inturn provides clues about the physical controls onglacier flow, such as bed processes and icesoftening at the margins. Following this validation process, the flow models are then used topredict the future evolution of these glaciers with a changing climate, for instance once the iceshelves that buttress them from flowing fast into the ocean are removed by enhance basal melting.
MEASUREMENT OF WINDSPEED AND SNOW-HUMIDITY ON THEANTARCTIC PENINSULA USING ERS-SAR-TANDEM
INTERFEROMETRY
Rabus Bernhard
E-mail: [email protected]
DLR Oberpfaffenhofen Postfach 1116Telephone: 0049 8153 282895
Fax: 0049 8153 281445
Co-author/s:Lang, Oliver DFD, DLR Oberpfaffenhofen, Postfach 1116, 82230 Wessling, [email protected] tel: 0049 8153 281376 fax: 0049 8153 281445 Hofmann, Anne IPG,University Freiburg, 79085 Freiburg, Germany [email protected] Rau, Frank IPG,University Freiburg, 79085 Freiburg, Germany [email protected] tel: 0049 7612033550 fax: 0049 761 2033596 Kothe, Gunnar IPG, University Freiburg, 79085 Freiburg,Germany
ABSTRACT
The relation between interferometric coherence and meteorological parameters at the snow surfaceis investigated for three areas on the Antarctic Peninsula. For each area ERS tandem pairs havebeen processed to provide image sets of ERS-1/2 backscatter amplitudes and coherence.Coherence and backscatter differences are compared to meteorological ground data. Asmeteorological parameters, appropriate for comparison, we calculate snow humidity at the times ofacquisition and mean windspeed during the 24-h periods between tandem acquisitions. For thecoastal portions of the ice sheet, backscatter shows large seasonal variations. While smaller,backscatter variations within the 24-h periods of the tandem pairs are also significant. For thevicinity of the weather stations there is reasonable correlation between measured changes insurface humidity and these short-term variations. On the contrary, backscatter variations of drysnow at the high plateau are negligible both over 24 hour periods and seasonally. Thisdemonstrates the absence of significant humidity and surface roughness changes at the plateauover time. Differences in coherence between tandem pairs are therefore expected to stem from onemain source only: winddrift. We find a good linear fit between coherence and mean windspeed.For the coastal areas we evaluate the possibility of measuring windspeed and humidity separatelywith ERS-SAR by combining the observed backscatter changes with the coherence results.
DEVELOPMENT OF PRACTICAL ALGORITHM FOR INFERRINGCOMPONENT TEMPERATURES FROM MULTI-DIRECTIONAL
MEASUREMENTS
Jia Li
E-mail: [email protected] green world research
Droevendaalsesteeg 3a P.O. Box 47The Netherlands
Telephone: 0031 317 474381Fax: 0031 317 419000
Co-author/s:Z.L.Li, C. Jacobs, M.Menenti, Z.B.Su
ABSTRACT
A mixture of soil and vegetation is an important category of land surfaces on which significantangular variations in thermal infrared radiance exhibits. The variation of thermal structure of thesurface with view angles leads to directional effects in observed surface temperature. Thedirectional observations from satellites imply the information of thermodynamic of mixtureelements mentioned above. Especially for partial canopies, mixture targets are often characterizedby large temperature differences between vegetation and the soil. Studies based on modelsimulations and field measurements show the angular variations of the brightness surfacetemperatures, which may be usable to determine vegetation and soil temperatures. The Along-Track Scanning Radiometer (ATSR) on board the First European Remote Sensing Satellite(ERS-1) is the only sensor to be able to capture the directional signatures simultaneously. Thought thereis limitation in separating directional signals due to the lower spatial resolution and theheterogeneity of the surface, ATSR provides a possibility to derive components temperatureswhich is usually applied to dual-source heat fluxes models and improves quantifying of landsurface processes. In this paper, the suitable algorithm is proposed to retrieve vegetation and soiltemperature over mixture land surface based on the analysis of multi-angle and multi-channelobservation made by ATSR-2. Limitation of the algorithm is also discussed when it is applied tovarious surfaces in range of fractional cover of surface and in conditions of homogeneity/in-homogeneity. Uncertainties in retrieving component temperatures using current algorithm andsatellite data are studied further.
GEOLOCATION OF INSAR INTERFEROGRAMS
Nico Giovanni
E-mail: [email protected] Applications Institute, Joint Reaserch Centre
Joint Research Centre, TP 272Telephone: 00 39 0332 789230
Fax: 00 39 0332 785469
ABSTRACT
The development of Interferometric Synthetic Aperture Radar (InSAR) systems for themeasurement of highly accurate Digital Elevation Models (DEM's) has already been welldocumented in the literature. Three measurements are required to reconstruct the topographicinformation: range, azimuth, and elevation. The first is obtained by timing the return of the radarpulse, the second by observing its Doppler frequency shift, and the last by measuring the phasedifference between the signals recovered at the spatially displaced antennae. The phaseinfromation is taken from the interferogram. Geolocation can introduce significant errorsdepending upon the choice of method and earth model. Methods to reduce the processing time andprovide more accurate results are extremely desirable.
In this paper a new general scheme for the geolocation of InSAR information is presented. Itavoids the use of an earth model and exploits the full information of a SAR interferometer: orbitdata, range and Doppler frequency shift relative to each SAR image, interferometric phase. Twogeolocation algorithms are obtained from this scheme.
The former studies the geolocation as the intersection of three surface defined by the threemeasurements: range, Doppler frequency shift and interferometric phase. In particular, the threesurfaces are: the range sphere centered at the SAR antenna which is also where the Dopplerfrequency shift cone is located. The cone axis of symmetry is the velocity vector. Theinterferometric phase adds another surface - a phase cone - whose axis of symmetry is theinterferometer baseline and whose apex is the center of baseline. These three surfaces intersect attwo locations in space. One of them is the geolocation of image pixel. The last algorithm is basedon the solution of a set of four equation: the range sphere and the Doppler frequency shift conerelative to the two SAR images. An exact closed-form solution is obtained. This solution does notuse approximations and avoids iterative algorithms. This results in a reduction of thecomputational load.

ELIMINATION OF TROPOSPHERIC ARTEFACTS IN DINSAR IMAGESUSING NUMERICAL WEATHER MODELS
Pany Thomas
E-mail: [email protected] Academy of Sciences Space Research
Institute Department of Satellite GeodesyLustbühelstraße 46
Telephone: 0043 316 322607Fax: 0043 316 3210914
Co-author/s:L. Kenyi, Joanneum Research, Department of Remote Sensing H. Raggam, Joanneum Research,Department of Remote Sensing H. Sünkel, Austrian Academy of Sciences, Space ResearchInstitute
ABSTRACT
Numerical weather models assimilate continuously meteorological measurments and provide acomplete state of the atmosphere typically every 6 hours. With these data sets it is possible tocalculate the tropospheric delay for each pixel of a differential interferometric SAR image using aray-tracing procedure. The delay is substracted from the SAR image reducing atmosphericartefacts in the interferogram.
For this investigation we use a global weather model from the European Centre of Medium-RangeWeather Forecasts and a mesoscale model from the German Weather Service to test this approachon SAR images in Austria. We discuss the practical and theoretical limitations and compare theresults to a similiar project with GPS observations.
MOSAIC GENERATION USING ERS SAR IMAGERY
Meadows Peter
E-mail: [email protected] SYSTEMS Advanced Technology Centre
West Hanningfield Road Chelmsford Essex CM2 8HN United KingdomTelephone: 00441245242664
Fax: 00441245475244
Co-author/s:Patricia Wright, BAE SYSTEMS Advanced Technology Centre, West Hanningfield Road,Chelmsford, Essex, CM2 8HN, United Kingdom. Email: [email protected]
ABSRACT
The large archive of ERS SAR imagery can be exploited to generate extensive mosaics. Much ofthis data has been acquired such that large areas have been imaged over short periods of time. Todate three mosaics have been generated - these being of the British Isles, Iceland and northernEurope. For the latter two regions, sufficient data is available that multi-temporal mosaics havebeen created. These mosaics enable large-scale land features to be visualised and show potentialfor land use monitoring on a Europe wide scale. The generation of SAR mosaics serves to convertthe location of individual 100km by 100-km ERS SAR PRI images to a common map projectionand to combine images from adjacent swaths. There is a need to remove the across-track imageintensity variations due to the changing radar cross-section of land surfaces across the SAR swathand also to mask out water regions. The localisation information within the ERS SAR PRI producthas been found to be adequate for registration of images within the mosaic. For the multi-temporalmosaics, it is necessary to ensure that the time span between the individual mosaics is sufficient toshow changes in radar backscatter. This paper will show the three mosaics and describe how theyhave been generated. It is important to note that large scale mosaic generation should becomemuch easier when wide swath products from the forthcoming ESA ENVISAT ASAR instrumentbecome available.
FUZZY SETS FOR CLOUD DETECTION IN ATSR-2 IMAGES OVERLAND
Smith Richard
E-mail: [email protected] University
Department of Aerospace DesignCollege of Aeronautics Cranfield UniversityTelephone: 0044(0) 1234 750111 ext.5141
Fax: 0044 (0) 1234 752149
Co-author/s:Dr Stephen Hobbs Department of Aerospace Design Cranfield University Bedford MK43 0APUnited Kingdom, E-mail: [email protected], Telephone: 0044 (0) 1234 750111Fax: 0044 (0) 1234 752149
ABSTRACT
The field of land use studies includes examples of both commercial and scientific uses of low-resolution satellite data. For the effective application of processing techniques used to deriveinformation from satellite data, it is first necessary to determine if the image data containatmospheric artifacts.
Algorithms used to derive land surface products from satellite data require the pixel in question tobe completely cloud. Most current detection methods use crude threshold based algorithms,resulting in the removal of many useful pixels from the available data set.
This paper presents a cloud detection scheme for ATSR-2 data that has been developed using afuzzy set methodology. Fuzzy sets allow pixel classes to be defined with soft, real-world, decisionboundaries, rather than the traditional "yes/no" characterization. Described by a membershipfunction, the grade of membership of a given fuzzy set is assigned for all image pixels.
For this scheme the cloud and surface data sets produced by the International Satellite CloudClimatology Program (ISCCP) are used as a knowledge base of a priori data. A simpleatmospheric model allows the ISCCP data to be reduced to an "as seen by ATSR-2" form, fromwhich bi-variate fuzzy sets for a variety of Earth surfaces and cloud types are calculated, based ontheir probability distributions. Applied to cloud detection in ATSR-2 images, this varying degreeof membership for an image pixel in the cloudy/clear fuzzy sets results in a superior imageclassification.
The result of cloud detection performed for fifty ATSR-2 images over a variety of land surfaces ispresented. The performance of the scheme has been evaluated against the SADIST cloud detectionresults packaged with the ATSR-2 gridded data products, and against a visual, analyst-based cloudclearance.
A BASELINE ESTIMATION METHOD FOR SAR INTERFEROMETRY
Nico Giovanni
E-mail: [email protected] Applications Institute, Joint Reaserch Centre
Joint Research Centre, TP 272Telephone: 00 39 0332 789230
Fax: 00 39 0332 785469
ABSTRACT
Synthetic Aperture Radar Interferometry (InSAR) makes use of the phase difference between twoSAR images to generate topographic height information. The height map generation alwaysincludes a transformation of the unwrapped phase to the terrain height. To accomplish thisoperation the baseline, or space difference between the two radar positions, should be estimated.Various methods for carrying out this step have been developed. Among them, we cite the fringefrequency estimation in flat regions, the use of tiepoints, or of an existing Digital Elevation Model(DEM). However, in many cases it is not possible to satisfy the conditions these methods require.For example, when flat regions or tiepoints are not present within the scene, or an accurate DEM isnot available. In this paper, we describe a method for the baseline estimation which do not requireany of the previously cited conditions. The proposed approach relies on a closed-form geocodingalgorithm, which allows to estimate the topographic height corresponding to each interferogrampixel by using only the orbit data and the range/Doppler frequency shift information. These data,joined to that of sensor altitude above the geoid, results in a linear system having as unknowns thetwo baseline components. A solution can be obtained without the need of tiepoints. Moreover, thisalgorithm can be applied in rough and hilly regions where the flat terrain approach is useless.
SAR IMAGES DATA BANK FOR LAND USE MONITORING INCENTRAL AFRICA, AN EFFICIENT DATA STORAGE AND
PROCESSING SCHEME
Mvogo Joseph
E-mail: [email protected]é de Marne-la-vallée
Université de Marne-la-valléeIFG5, Boulevard DescartesF 77 454 cedex2Telephone: 00 33 1 49 32 90 72
Fax: 00 33 1 49 32 91 37
Co-author/s:Grégoire Mercier, E-mail: [email protected], Onana V.D.P,E-mail: [email protected], Hervé Trebossen, E-mail: [email protected], J.P RudantE-mail: [email protected], E. Tonyé, E-mail: [email protected], Awono Onana,E-mail: [email protected]
ABSTRACT
Due to persistent cloud cover over Central Africa, Sar images are preferred to optical data forremote sensing applications. However, land use monitoring with SAR images, which is oftenbased on multitemporal or spatial mosaic data critically, increase, the amount of data requirements.As an illustration, the ERS-SAR mosaic of Central Africa merely consumes more than 50gigabytes (GB). Managing Data in a long-term cycle is a difficult problem, Land use monitoringrequire interdisciplinary collaboration and therefore the scientific community and final usersexpectation is to share and access to online data and metadata. Our objective is to implement adata bank for land use monitoring applications in Central Africa. It is obvious that images have tobe stored and handled in a compressed form, which is strongly dependent of the application. Manydata compression schemes exists for natural scenes, these, methods are not efficient for SARimages because of the presence of speckle noise, futhermore the quality assessment of thecompression techniques goes beyond the commonly use psychovisual quality. In fact boundederrors on edges and textures are needed in order to preserve sufficient quality for land usemonitoring. In this paper we propose an efficient transform scheme. A frequency adaptativedecomposition of the SAR image based on wavelets and multiwavelets packets functions and asuitable quantization scheme on the obtained wavelets coefficients. Our method out-performsbetter PSNR ratios, with poor loss of information compared to JPEG or the baseline wavelet coder.A segmentation method in the wavelet domain is developed, so there is no need to use areconstruction scheme in the spatial domain for land use monitoring applications. Some results arepresented with ERS images of Central Africa. Those images are compressed up to a ratio of 30: 1while still remaining of sufficient quality for visual interpretation, segmentation and land usemonitoring. Our future work concerns the indexation of the data bank for queries management.
ESTIMATION OF BIOPHYSICAL PARAMETERS FROM TERRASURFACE REFLECTANCES
Knyazikhin Yuri
E-mail: [email protected] UniversityDepartment of Geography
675 Commonwealth AvenueTelephone: 001-617-353-8843
Fax: 001-617-353-8399
Co-author/s:R.B.Myneni, Y. Knyazikhin, Y. Tian, Y. WANG, and Y. ZHANG
ABSTRACT
Land surface processes are important components of the terrestrial climate system. Accuratedescriptions of the interaction between the surface and the atmosphere require reliable quantitativeinformation on the fluxes, mass, and momentum, especially over terrestrial areas, where they areclosely associated with the rates of evapotranspiration and photosynthesis. Many of theseprocesses can be related to the spectral reflectance of the surface. The vegetation canopy isclassified as a special type of surface not only due to its role in the energy balance but also due toits impact on the global carbon cycle. Its reflection results from bio-physiological, chemical andphysical processes, and is characterized by spatial, seasonal and diurnal variations. Modernsatellite-born sensors (e.g., MODIS, MERIS) allow for rich spectral and angular sampling of theradiation field reflected by vegetation canopies. While much work on forward modeling ofvegetation reflectance has been done, it is only recently, in the context of new satellite sensorssuch as MODIS, MISR, MERIS, POLDER, etc., that attention has focused on the inverse problem;that is, estimating biophysical parameters from remote reflectance measurements. Thispresentation will provide an overview of retrieval techniques, which allow us to realize the fullpotential of the multi-angle and multi-channel satellite-born sensors. An emphasis will be given tothe operational algorithm of global leaf area index and fraction of photosynthetically activeradiation absorbed by vegetation developed for the MODIS and MISR instruments of the EOSTerra mission as well as an analysis of global leaf area index and fraction of photosyntheticallyactive radiation absorbed by vegetation derived from MODIS and MISR data.
SAR PRODUCT CONTROL SOFTWARE (SARCON)
Boerner Thomas
E-mail: [email protected] - Deutsches Zentrum fuer Luft- und Raumfahrt e.V., Oberpfaffenhofen
D-82234 WesslingGermanyTelephone: 0049-8153-28-2368
Fax: 0049-8153-28-1135
Co-author/s:M. Chandra(1), D. Geudtner(1), D. Hounam(1), B. Schättler(1), M. Schwerdt(1), M. Zink(1),A.J. Rye(2), P.J. Meadows(2), R.A. Cordey(2), P. Mancini(3), B. Rosich Tell(4), D. Esteban(4)(1)Deutsches Zentrum für Luft- und Raumfahrt e.V. (DLR) D-82234 Weßling, Germany(2)BAE SYSTEMS Research Centre, Great Baddow, Chelmsford, Essex CM2 8HN, UK(3)ESA Headquarters, 8-10 rue Mario Nikis, 75738 Paris Cedex 15, France(4)ESA/ESRIN, Via Galileo Galilei, 00044 Frascati, Italy
ABSTRACT
As SAR instruments and their operating modes become more complex, as new applications placemore and more demands on image quality and as our understanding of their imperfectionsbecomes more sophisticated, there is increasing recognition that SAR data quality has to becontrolled more comprehensively to keep pace. SARCON is a comprehensive SAR productcontrol software tailored to the new generations of SAR sensors. SARCON profits from the mostup-to-date thinking on SAR image performance derived from other spaceborne and airborne SARprojects and is based on the newest applications. This paper gives an overview of the structure andthe features of this new software tool, which is a product of a co-operation between teams atMarconi Research Centre and DLR. The basic features of the SARCON software include raw dataanalysis, antenna pattern estimation, point target analysis, distributed target analysis, polarimetricanalysis, noise estimation, analysis of wave mode products, target detection, InSAR and analysisof propagation effects. The SARCON software will be initiated under operator control, i.e. theoperator will select datasets for analysis, the required quality parameters, type of visualisation ofresults etc. SARCON contains an internal database to store the derived quality parameters in orderto facilitate retrospective analyses and predictions of performance. Visualisation of the results isperformed by accessing the database. The database contains the two types of quality measures,applications quality parameters and system quality parameters as well as calibration andcharacterisation data. Another important function of SARCON is to screen data to identifyimperfections such as missing or duplicated lines. With the improvements provided by theSARCON software, it will enable problems in SAR instruments or in the processing chain to bequickly detected and, hence, remedied. It will enable data quality to be monitored over time towarn of problematic trends. Looking at historical data, SARCON can help to trace changes inperformance and help to identify the cause. It will enable data sets to be specified more accuratelyand more meaningfully for the user. And it will help to advance the knowledge on SARperformance and to specify future sensors more effectively and efficiently.
3-D RECONSTRUCTION OF SOIL SURFACES BY STEREOVISION INRELATION WITH RADAR BACKSCATTERED SIGNAL OVER THEM
Tebourbi Riadh
E-mail: [email protected] Nationale d'Ingénieur de Tunis
Laboratoire de Télédétection et Système d’Informationà Référence Spatiale ENIT, BP 37
Telephone: +216 1 872627Fax: +216 1 87 2729
Co-author/s:Odile Taconet, Ziad Belhadj, Valérie Ciarletti, Mehrez ZribiRemark: information regarding co-authors affiliation not available.
ABSTRACT
Potential of radar imagery to measure soil roughness is being demonstrated. To overcomelimitations in soil geometry descriptions by pin (laser) profilers, three-dimensional (3-D)reconstruction of soil surface by stereovision has been powerful to improve simulation of soilbackscattered signal.
In the frame of the European project Flaubert, three campaigns combining satellite and in-situ datahave been made in 1999 (April, June, July) to follow the soil degradation under Mediterraneanclimatic conditions on agricultural sites of North Tunisia. A large number of stereoscopic imageshave been taken with CCD cameras near Bizerte over a large range of soil roughness. A purpose isto qualifiy 3-D reconstruction and make it of easy use. The algorithm establishes a model, whichrelates pixel, coordinates to 3-D soil coordinates. It is done by camera calibration which computesthe camera projection matrices and by performing disparity map from the 2-D images. Disparitywith sub-pixel resolution is calculated by parabola method. To validate our reconstruction methodof soil surface we have simulated stereoscopic images of different random simulated soil surfaceswith gaussian correlation function and obtained reconstructed 3-D maps. Their comparisons allowus to evaluate the accuracy. We evaluate the filtering of the small-scale fractal soil structure, whichis of determining influence on the radar-backscattered signal. We study its relation with the radarsignal using the Moment Method to simulate backscattered signal over these reconstructedsurfaces. Recent work has also shown that it is possible to recover the projective structure of ascene from point correspondences only, without the need of camera calibration. This approachleads to the calculation of the fundamental matrix from the geometric information contains in thedifferent viewpoints. The two methods (calibrated and uncalibrated) are compared on natural andsynthetic targets. Impacts on the radar backscattered signal over soils is also studied using theMoment Method.
INTERFEROMETRIC SAR QUALITY ENHANCING BY SPACE-VARYING SPECTRAL SHIFT PRE-FILTERING
Monti Guarnieri Andrea
E-mail: [email protected] di Elettronica e Informazione
Politecnico di MilanoPiazza Leonardo da Vinci, 32Telephone: 00 39 0223993446
Fax: 00 390223993413
Co-author/s:G. Fornaro(2), F. Rocca(3)(2)IRECE-CNR Via Diocleziano, 328 -- Napoli – Italy(3) T.r.E Tele-rilevamento Europa s.r.l. Piazza L. da Vinci, 32 - 20133 Milano - Italy
ABSTRACT
Interferometric SAR data should be pre-filtered in order to remove the geometrical decorrelationby applying the proper spectral shift. This filtering cancels the amplitude components relative tothe wave numbers not illuminated in both passes.
Up to now this filtering has been carried out by assuming planar topography and therefore spatialstationarity of the wave number spectra. This approximation is now superseded and two optimumspace-varying linear filters are identified. They allow to estimate, from the two takes, theinterferogram with the least square error. Obviously, the filter is dependent on the DigitalElevation Model. Therefore, the problem becomes non-linear when the DEM has to be estimatedfrom the data. The optimality is dependent on the computational complexity; simpleapproximations corresponding to low order kernels are also analyzed.
SATELLITE ALTIMETER SEA LEVEL VARIATION ANALYSIS OFTHE SOUTHERN OCEAN
Gomez-Enri Jesus
E-mail: [email protected] (ESA)
Via Galileo GalileiTelephone: 00390694180528
Fax: 00390694180552
Co-author/s:Villares P.(2), Gomez-Enri J(1), Bruno M.(1), Alonso JJ(2), Catalan-M M.(3),Ruiz-Canavate A(2), Catalan P-U M.(2), Jimenez-Garay R(2)1)ESRIN-ESA. Via Galileo Galilei. 00044 Frascati (Italy). E-mail: [email protected]: 00390694180528(2)2)University of Cadiz. Poligono Rio S. Pedro s/n. Puerto Real (Spain).E-mail: [email protected]. Telephone: 00349560160703)Real Observatorio de la Armada. San Fernando (Spain)
ABSTRACT
The spatial and time variations of the Southern Ocean sea level and its possible relationship withthe Antarctic sea ice changes and surface geostrophic currents in the area are investigated usingaltimeter data sets from ERS-1, ERS-2 and Topex-Poseidon between 1992 and 1999. Altimeterdata are analysed following an Empirical Orthogonal Function Decomposition (EOFD) suggestingthe following results: 1-The sea level variability is complex and bathymetrically controlled. 2-Most of the energy is accounted by the two first modes of the EOFD, that separates the sea leveltime variability into annual and semiannual cycles. The third mode could be locally related toannual-semiannual interaction processes. 3- The Antarctic Circumpolar Current is dominated bythe annual component. In the Brasilian-Malvinas Confluence region the energies in the semiannualand annual components are equally important with a clear spatial variation. 4- The stational sealevel variation in the Brasilian-Malvinas and Agulhas current areas are in opposition of phase withthe variation in the seasonal sea ice area. 5- An important part of the complex sea level variation inthe Southern Ocean seems to be explained by the heat interchange due to ice-ocean waterinteraction including ice-induced salinity changes and Ocean-Atmosphere processes that affectsthe dynamic circulation of the Southern Ocean that may have a significant impact both in theregional weather and global climate. 6- Some transference functions that regionally relatesbathymetry with altimeter measurements, can be found.
GLOBAL OCEAN TIDES - REVISITED THE IMPACT OF ERS ANDENVISAT
Andersen Ole
E-mail: [email protected] og matrikelstyrelsen Geodesy
Rentemestervej 8Telephone: 00+4535875050
Fax: 00+35875052
ABSTRACT
Global ocean tides from TOPEX/POSEIDON and ERS-1 has previously been presented byAndersen, (1995), Andersen and Knudsen (1997) and Smith, (1999). It was concluded that morethan 3 years of ERS data available at that time was required if ERS should be able to possibleimprove the global ocean tide models derived from TOPEX/POSEIDON alone. The possibility ofimproving the global ocean tide models using ERS data is revisited now that 8 years ofobservations are available. Especially the issue on improved ocean tide modelling in near coastalregions are investigated as the increased ground track spacing of the ERS and ENVISAT satellitesis very important form ocean tide modelling in shallow waters.
SPIRAL EDDIES IN THE JAPAN SEA
Ostrovskii Alexander
E-mail: [email protected] Observational Research System for Global Change, JAMSTEC
SEAVANS N. 7th Floor, 1-2-1, Shibaura, Minato-kuTelephone: 81-3-5765-7100
Fax: 81-3-5765-7103
Co-author/s:Sergey Dikarev (P.P. Shirshov Institute of Oceanology, Russian Academy of Sciences, Moscow,Russia
ABSTRACT
This note concerns with spiral eddies, which were overlooked by earlier studies of the Japan Sea.Previous analyses focused mostly on the mesoscale anticyclonic eddies that could be easilyidentified in the satellite infrared imagery of the Japan Sea (Toba et al. 1984, Isoda and Tameishi1992, Ostrovskii 1995, Ginzburg et al. 1998, and Takematsu et al. 1999). Two types of cycloniceddies were also observed: the streets of small cyclonic vortices of the size of about 10 km,associated with the baroclinic instabilities (Takematsu et al. 1999), and cyclonic eddies as thecounterparts of anticyclones in the vortex dipoles (Bunimovich et al. 1993). New analysis of theJapan Sea upper layer dynamics is based on the ERS SAR remote sensing during CREAMS-I(1993-1997). This analysis allowed a visualization of various spiral eddies for the first time in theJapan Sea. Eddies appeared in the SAR imagery as a result of wave/current interaction, whichoutlines the shape of the eddy, or were revealed indirectly by presence of surfactant film trappedwithin spiralling lines associated with eddy orbital motion that led to backscatter contrasts of up to10 dB. Spectacular images of the spiral eddies were obtained at the end of October 1992 and inNovember1993, i.e. in the season when the phytoplankton pigment concentration is high in theJapan Sea (Ishizaka et al. 1997). The eddies were also seen at the end of April 1993. The streaks ofthe surfactant films always spiralled counter clockwise. The eddy dimension varied from 1-3 km inthe Japan Basin interior to 20-40 km south of the subtropical front. Although some of the observedspiral eddies can be explained within framework of recent theory, which dealt with frontogenesis(Munk et al. 2000 and Eldevik and Dysthe 2000), certain features remain unaccounted for byexisting models. In particular small eddies of the size of the order of 1 km, located far away fromthe known strong currents, inside the northern gyre of the Japan Sea, seem unlikely to be related tothe frontal dynamics. It is suggested that if such an eddy is cyclonic, its spiral is formed from theeddy centre towards the eddy periphery, so the eddy core serves as a source of a surfactant filmthat is upwelled to the sea surface from the interior below.
RETRIEVAL OF OCEAN CURRENT VELOCITY FIELD USING ERSSAR RAW DATA
PERESLEGIN SERGEY
E-mail: [email protected] Institute of Oceanology, Russian Academy of Sciences
Nakhimovsky prospect, 36Telephone: 007 095 1247392
Fax: 007 095 1245983
Co-author/s:S.V. Pereslegin, M.Yu. Dostovalov, A.Yu. Ivanov, L.B. Neronskii
ABSTRACT
It is known that to measure spatial and temporal variability of ocean currents by using contactmeasurements from ships is very difficult. Principal possibility of ocean current measurements byusing spaceborne SARs has been realized only several years ago. In order to study possibilities ofspaceborne radars to retrieve mesoscale ocean current fields ERS Synthetic Aperture Radar (SAR)images and raw data has been collected in the framework of the ESA AO3 Project #219 titled"Experimental verification of the method for restoration mesoscale ocean velocity fields usingERS SAR data". The objective of the work was to understand ERS SAR potential for monitoringocean current fields. The paper reports the results obtained from processing and analysis of theERS SAR raw data as a step in the investigation the ocean with use a spaceborne SAR. Due tostability of satellite orbit there is a possibility to measure ocean current velocity by usingfrequency shift of Doppler spectra. Theoretical studies conducted in Institute of Oceanologyshowed that the Doppler radar method allows to restore only radial component of surface currentvelocity vector. Radar signals scattered by short surface waves have also parasite Doppler shiftsdue to phase velocities of short waves and orbital velocities of large waves. Conducted studiesshowed that shift errors due to those effects are about 3-7 cm/s. The method of processing raw dataincludes formation of partial Doppler spectra in non-focusing aperture regime, non-coherentaccumulation of these spectra for every range element in real aperture, accumulation in respectivenumber of range elements and measurements of averaged spectrum median. Firstly developedmethod has been applied to Almaz-1 raw data taken over the Gulf Stream when a possibility ofocean velocity field restoration has been shown. For method validation the test site in the FloridaStrait between USA and Cuba has been selected. By applying developed method to ERS SAR rawdata covering the strait the current velocity field has been retrieved. Obtained results show thatcurrent velocity field has been restored and acceptable accuracy achieved. Possibilities andlimitations of the methods are also discussed.
REGIONAL LONG TERM SEA LEVEL VARIABILITY FROM MULTI-SATELLITE ALTIMETRY
Fenoglio-Marc Luciana
E-mail: [email protected] of Physical Geodesy, Technical University Darmstadt
Petersenstrasse 13Telephone: 0049-6151-163012
Fax: 0049-6151-164512
ABSTRACT
The monitoring of the long-term sea level variability requires the use of multi-satellite altimetrydata. Geosat, ERS and Topex/Poseidon altimeter data are combined to analyse the sea levelvariability in the Mediterranean Sea over more than ten years. In a first step, the multi-missiondata are analysed and unified by a multi-crossover adjustment. The analysis shows a change in therelative bias between the satellites, which is partly due to different corrections used in the pre-processing. In a further step, the main components of the variability are extracted from the unifieddata using statistical and spectral methods.
SAR AND AVHRR IMAGERY USING FOR INVESTIGATIONS OF BIGLAKES PHYSICS AND ECOLOGY - LAKE BAIKAL
Semovski Sergei V.
E-mail: [email protected] Institute SB RASP.O.Box 4199 Ulanbatorskaya 3
Telephone: 7-3952-466933Fax: 7-3952-460405
Co-author/s:(1)Sergei V.Semovski (2)Nikolay Yu.Mogilev (3)Werner Alpers, (3)Corinna Schrum(1)Limnological Institute SB RAS P.O. Box 4199, Irkutsk, Russia 664033E-mail: [email protected](2)Institute of Space-Terrestrial Physics SB RAS Irkutsk, Russia(3)Institute fuer Meerskunde, Hamburg University Hamburg, Germany.
ABSTRACT
Lake Baikal, situated in the centre of Asian continent, is the deepest, the most voluminous, and theoldest freshwater basin on the Earth. These factors are responsible for the formation of its peculiarhydrophysics and ecology. The lake has been the subject of intensive investigations for more thencentury, however, using of satellite remote sensing for studies of temperature regime, circulationand ecology is on initial stage nowadays. The first opportunity to use SAR imagery for intensiveBaikal studies were carried out after European Space Agency mobile receiving station set up inUlan-Bator, Mongolia during Autumn 1997 and Summer 1998. Courtesy to ESA announcement ofopportunity about 80 images proceeding by ERS satellite-born SAR instrument, have been givenin our disposal. Simultaneous AVHRR HRPT imagery has been received from NOAA satellites inIrkutsk Centre of Space Monitoring. This information was used intensively for data fusion andbetter understanding of physical and biological features. When possible, contact data of researchcruises was incorporated into analysis. Manifestations of short internal waves in water (with periodof 400-800 m) on 1997-98 SAR images of Baikal demonstrate great diversity of direction andtransformation in interaction with bottom topography. Some of these wave trains can present high-frequency modulation on the front of coastal-trapped Kelvin wave. Atmospheric internal wavescan be also detected on SAR images as well as lee waves, thermal fronts and some otherhydrophysical features. Independence of SAR images quality of atmospheric conditions supportstheir usage for detailed tracing of ice structure. We apply multispectral AVHRR imagery forclassification on Baikal ice cover types. Database of AVHRR imagery is used intensively forstudies of spatial variability of ice cover and its interannual changes. We apply SAR imagery aswell as high resolution "Resurs" satellite images in visual band for calibration and verification ofAVHRR-based classification. SAR imagery can be used for novel knowledge on Baikal ecosystemvariability. For the late Summer autumn 1998 ERS SAR images show slicks of biological originon the North Baikal. Probably, intensive bloom of green-blue Anabaena lemmermanii wasdetected. In situ observations made in the same time in research cruise of r/v "Vereshchagin" showhigh concentration of this algae in surface layer. This Cyanophita is capable to form patterns ofhigh concentration (5-10 g/m3) in the thin surface layer during low wind conditions. AVHRR-derived surface temperature demonstrate similar structures of circulation field, that determinestransport of cianobacteria from warm coastal area into pelagic waters.
MONITORING THE EASTERN ALBORAN USING COMBINEDALTIMETRY, IN SITU AND TEMPERATURE DATA
SNAITH HELEN
E-mail: [email protected] Oceanography Centre
JRD, SOC,European Way
Telephone: 44 23 8059 6410Fax: 44 23 8059 6400
Co-author/s:S. Alderson, J.T. Allen and T.H. Guymer
ABSTRACT
As part of the EU funded OMEGA project a cruise to the Eastern Alboran (WesternMediterranean) was carried out on board RRS Discovery during December 1996 and January1997. During the cruise, a fine scale survey, designed to be oriented along ERS ground tracks, wasrepeated several times. Several additional survey legs were carried out, part of which lay alongadditional ERS or TOPEX/POSEIDON altimeter ground tracks. Hydrographic and current profiledata were collected continuously along these survey tracks using an undulating, towed CTD and anAcoustic Doppler Current Profiler referenced to a Global Positioning System,. The in situ datahave been merged with the along track altimeter data to give profiles of the absolute surfacecurrent at several locations across the Almeria-Oran front, which limits the easternmost gyre in theAlboran gyre system. Where a track was repeated, several estimates of the absolute current profilehave been made in order to try and understand some of the possible sources of error in theestimates. After the "one-time" calculation of the absolute profiles, several years of repeatedaltimeter data have been used to monitor the flow across the Almeria-Oran front. At times, thefront appears to move to the south, apparently when the eastern Alboran gyre collapses, asobserved in previous in situ and remote sensed studies. It is also possible to see times when thefront moves northward and intensifies. The coincident altimeter and in situ tracks have high along-track resolution but much coarser track spacing and they also have limited spatial extent. Thismakes it difficult to gain a complete picture of the state of the Almeria-Oran front from thealtimetry alone. In order to try and gain a wider spatial context, and improve the dimensionality ofthe data, the altimetry data have been further combined with remote sensed Sea SurfaceTemperature (SST) data, in particular from ATSR. Coincident data obtained during the cruise havebeen used to determine a relationship between the temperature field and the current structure. Thisrelationship has been used to infer two-dimensional current fields from combined altimeter andSST data.
SEA SURFACE TOPOGRAPHY DUE TO DENSITY GRADIENTS IN THEBALTIC SEA AND KATTEGAT
Stenseng Lars
E-mail: [email protected] of Geophysics
Niels Bohr Institute for Astronomy, Physics and GeophysicsJuliane Maries Vej 30
Telephone: 004535320602Fax: 004535365357
Co-author/s:Sine M. JacobsenEva H. DitlevsenSolva K. Eliasen
ABSTRACT
Data from ERS1/2 and TOPEX/POSEIDON have been used to calculate the sea surfacetopography in the Baltic Sea and Kattegat. By using data from two different satellites the resultscan be compared. The difference between the mean sea surface topography and the geoid isobtained by subtracting the NKG96 geoid from the mean sea surface topography. The difference isincreasing with approx. 50 cm from Kattegat to the north end of the Botnic Bay. The variation isdue to the density differences between the brackish Baltic water and the salty North Sea water. Thephenomena have also been observed by oceanographic observations by Ekman and these are usedas a check. Fourier transformation of data has been applied to see temporal variations of the seasurface topography.
SYNERGISTIC OBSERVATIONS OF ROSSBY WAVES
Quartly Graham
E-mail: [email protected] Oceanography Centre
Empress DockTelephone: 00 44 23 8059 6412
Fax: 00 44 23 8059 6400
Co-author/s:P.Cipollini, D. Cromwell, P.G. Challenor
ABSTRACT
Baroclinic Rossby waves are large-scale propagating features that transmit information from theeastern side of an ocean basin to the west, where they maintain and may displace the WesternBoundary Currents. Satellite altimetry has led to significant advances in the mapping of Rossbywave activity, providing results to challenge the understanding of the theoreticians. Here we lookat Rossby waves evidenced in sea surface height, sea surface temperature and ocean colour, usingdata from ERS-1, ERS-2 and other satellites.
There is good agreement in the Rossby waves recorded by the altimeters on both theTOPEX/Poseidon and ERS platforms, with signals present in all ocean basins and at mostlatitudes. Westward propagating features are also seen in SST derived from both infrared (ATSR)and passive microwave instruments (TMI). The signature of Rossby waves in ocean colour data isharder to detect and tends to be masked by the strong annual phytoplankton bloom, but evidencehas been found in data from both OCTS and SeaWiFS. The interpretation of such a signal is evenmore challenging. Possibly this is due to thermocline displacement and its effect on biology.
The Rossby waves at any given latitude do not all propagate at a uniform constant speed. In manycases they speed up as they move from eastern basins to the west, in response to changing verticaldensity structure. Also there may exist several different modes (corresponding to different verticalstructures) each of which travels at a different speed. In this paper we will compare theinformation on Rossby waves derived from these many diverse sensors and look at the addedinformation acquired from synergistic observations, which suggest that whilst altimeters primarilydetect the first baroclinic mode, SST and ocean colour are often more sensitive to higher modes.

THE SIGNATURE OF ROSSBY WAVES IN THE ATSR DATASET
Cipollini Paolo
E-mail: [email protected] Oceanography Centre
European WayTelephone: 0044-23-80596404
Fax: 0044-23-80596400
Co-author/s:Katherine L. Hill, Ian S. Robinson
ABSTRACT
The purpose of this paper is to examine the surface thermal signatures of extratropical baroclinicRossby waves (a special class of planetary waves) in the ocean and measure their propagationspeed. We show that longitude-time plots of the global sea surface temperature (SST) recordproduced by the Along Track Scanning Radiometer (ATSR) on board ERS-1 between August1991 and April 1996 contain clear evidence of wave propagation in all parts of the world oceansand at many latitudes. The propagation is studied with the help of a 2D Radon transform method inorder to analyse more objectively the wave speed and its variation with location and time. Theresultant spatial distribution of velocity estimates broadly matches the Rossby wave speedspredicted by the most recent theory and those measured by TOPEX altimetry, but there are somediscrepancies, for instance at lower latitudes the waves in the SST field appear to propagate slowerthan in the altimeter data. We describe in details how the signals vary in both space and time in thedata record. Wave signatures are found to be strongest between 25 and 40 S, where the meridionaltemperature gradient is strongest. Here the observed speeds are 20-30 9.50753e-305reater thantheoretical predictions. Planetary wave speed is also found to vary considerably with longitude. Ingeneral there is an increase towards the west of ocean basins, consistent with the theoreticalfindings. Another feature of particular interest is the presence of eastward propagating signaturesin the Southern Ocean. We conclude that the ATSR ASST data are a valuable source ofinformation for studying basin scale wave processes as a complement to the use of altimetry. Byobserving the thermal signature of Rossby waves the method has the potential to clarify theirinfluence on air-sea interaction processes, and contribute to climate modelling studies.
A STUDY OF THE MEDITERRANEAN WATER OUTFLOW USING THEERS AND TOPEX-POSEIDON JOINT ALTIMETRY
Gomez-Enri Jesus
E-mail: [email protected] (ESA)
Via Galileo GalileiTelephone: 00390694180528
Fax: 00390694180552
Co-author/s:Gomez-Enri J(1)Catalan P-U M(2), Catalan-M M.(3)(1)ESRIN-ESA. Via Galileo Galilei. 00044 Frascati (Italy). E-mail: [email protected]: 00390694180528(2)University of Cadiz. Poligono Rio S. Pedro s/n. Puerto Real (Spain).E-mail: [email protected]. Telephone: 0034956016070(3)Real Observatorio de la Armada. San Fernando (Cádiz). E-mail: [email protected]
ABSTRACT
After leaving the Strait of Gibraltar the Mediterranean water outflow descends close to the bottomof the slopping topography towards the Gulf of Cadiz, being deflected to the right as aconsequence of earth rotation effects, starting its mixes with its surrounding Atlantic waters.Consequently, the termohaline characteristics of the Mediterranean outflow are graduallymodified, its salinity decreases and becomes less and less dense reaching, at a certain stage thedensity values corresponding to the mid-depth layers of the Atlantic Ocean. In the Gulf of Cadizthe Mediterranean water can be described as a gravity current flowing along the Iberiancontinental slope. Due to a bifurcation, its densest part proceeds westward along deeper isobathsseveral tens of kilometers offshore from the lighter part. The two cores may become lockedtogether. The presence of these anticyclonic eddies, detached from the main body ofMediterranean undercurrent water, can be detected in the termohaline field, since they form lens-like structures of anomalously high temperatures and salinity, as compared with the surroundingAtlantic waters, and in the velocity field by its vortex rotating structure. This communicationpresents the results we have obtained in the detection of meddies using jointly the altimetry ofTopex-Poseidon and ERS, analysing its sea surface dynamic signals and comparing it with thetracks recorded of several possible meddies off the Portuguese coasts, primarily detected by rafosgiven us for the Portuguese group of Ioceano. As meddies dynamic signals were in subdecimetricorder of magnitude we have to improve both, the accuracy of the satellite orbit and the geophysicalcorrections applied to the satellite altimeter data.
REPROCESSED ERS-1 AND ERS-2 ALTIMETER MEASUREMENTSFOR OCEAN CIRCULATION AND CLIMATE RESEARCH
Beckley Brian
E-mail: [email protected] ITSS
NASA Goddard Space Flight CenterCode 971Telephone: 00 301 614 5894
Fax: 00 301 614 5644
Co-author/s:C.J. Koblinsky, NASA/GSFC Code 971B.D. Beckley, Raytheon ITSSY.M. Wang, RaytheonITSSB. Cornuelle, Scripps Institute of Oceanography R. Ray. NASA/GSFC Code 926V.Zlotnicki, NASA/JPL.
ABSTRACT
The estimated accuracy of sea surface height measurements from the NASA/CNESTOPEX/POSEIDON (T/P) altimeter satellite is 2-3 cm. (Fu et al., 1994). As a result of thisunprecedented level of accuracy, the measurements from all satellite altimeters have beensignificantly upgraded by successfully exploiting the results from T/P during the initial phase ofthe NASA Ocean Altimeter Pathfinder Project (Koblinsky et al., 1998, 1999). This presentationprovides an overview of the significant improvements made to the ERS-1 and ERS-2 altimeterdata sets and details current research activities and results from the NASA Ocean AltimeterPathfinder project and collaborative work with other investigations including: Height anomaliesfrom merged ERS -1/2, T/P, and Geosat-Follow-On (GFO)·Mean Sea Level estimates from ERSand T/P·Geostrophic velocity computations from altimetry and in-situ validationtechniques·Barotropic de-aliasing: model and removal of the fast response of the ocean to windand pressure·Global tide model improvements through embedding regional models in shallow andenclosed seas within the T/P based tide model Ionosphere modeling with IRI-2000 for SingleFrequency Altimeters GFO improved orbit information·Next generation mean sea surface.Evaluation of NVAP model in Indonesian Archipelago The NOAA/NASA Pathfinder programwas created by the Earth Observing System (EOS) Program Office to determine how existingsatellite-based data sets can be processed and used to study global change. The data sets aredesigned to be long time-series data processed with stable calibration and community consensusalgorithms to better assist the research community. The Ocean Altimeter Pathfinder Projectinvolves the reprocessing of all altimeter observations with a consistent set of improvedalgorithms, based on the results from TOPEX/POSEIDON (T/P), into easy-to-use data sets for theoceanographic community for climate research.

SEASONAL ERS SAR STUDIES OF SEA ICE IN THE PECHORA ANDKARA SEA REGION
Lundhaug Maria
E-mail: [email protected] Environmental and Remote Sensing Center
Edvard Griegsvei 3ATelephone: 00 47 55 29 72 88
Fax: 00 47 55 20 00 50
Co-author/s:Ola M. Johannessen Kim H. Esbensen
ABSTRACT
There is a strong seasonal and regional variability in the sea ice distribution in the Kara andPechora Seas. It is an important sea ice production region because of very low air temperatures andrepeated opening of polynya areas driven mainly by strong winds. With SAR data it is possible tomap areas of open water and thin ice for estimation of heat exchange from water to air, which isessential for modelling of the climate system at high latitudes.
This study will focus on characterisation of the different types of first-year sea ice in the Pechoraand Kara Sea. Regional and seasonal signatures, during the whole ice season from the earlyformation of thin ice to the melt period will be investigated. ERS SAR data will be used, as theseare especially valuable in the Arctic due to the independence of fog, cloud cover and lack ofsunlight. Image data will be examined and parameters for characterising the sea ice will beextracted. Environmental information will be used to get a better understanding of thedevelopment of the ice during the year under different weather conditions.
Monitoring of sea ice in the Pechora and Kara Sea region is very important both for economic andenvironmental reasons. Extensive oil and gas resources are found here, and exploitation of these aswell as cargo transport along the Northern Sea Route may cause environmental problems. Also,transport of pollutants from the land areas by the huge rivers that flow into the seas, maycontribute to the contamination of the Arctic environment. Sea ice information is important forplanning of oil and gas installations, and safe exploitation and transport of these resources.

SEA ICE ALGORITHM VALIDATION AND IMPROVEMENT BYMULTI SENSOR ANALYSIS
Kaleschke Lars
E-mail: [email protected] of Environmental Physics,University of BremenAddress: P.O. Box 33 04 40, D-28334 Bremen, Germany
Telephone: 00 49 421 218 4726Fax: 00 49 421 218 4555
Co-author/s:Axel Bochert, Alfred Wegener Institute for Polar and Marine Research (AWI) Columbusstraße,D-27568 Bremerhaven Germany, Phone: 00 49 471 4831 1172, FAX: 00 49 471 4831 1149,Email: [email protected]
ABSTRACT
In order to validate and improve sea ice algorithms a hierarchically structured analysis of remotesensing methods was carried out ranging from large scale coverage of satellite passive microwaveover intermediate scale of satellite active microwave to small scale aircraft based measurements.
The used dataset was acquired during ARTIST (Arctic Radiation and Interaction Study) whichtook place around Svalbard in March/April 1998. Airborne measurements were carried out withtwo research aircrafts of the Alfred Wegener Institute. The aircraft was equipped with well provendevices (e.g. line scanners, radiation thermometer) and new systems (19.35 GHz and 37 GHzradiometers) which were operated for the first time during ARTIST. Several coordinated satelliteunder flights (SSM/I and ERS SAR) were performed in the vicinity of the marginal sea ice zone.
The dissimilar resolutions and swath widths of different remote sensing systems is a commonproblem for multi-sensor applications. The newly developed ARTIST Sea Ice algorithm (ASI)combines the NASA team and Svendsens 85GHz methods bringing together the nearly weatherindependence of the lower frequency SSM/I channels with the high spatial resolution of the85GHz channels. The goal of the ASI algorithm is to reduce the gap of resolution between ERSSAR and SSM/I. The resolution of the ASI sea ice maps (ASI:about 14km, NASA team:60km) issuitable for mesoscale applications: e.g. the accurate position of the sea ice edge meets therequirements of the mesoscale atmospheric modeling part of ARTIST, the state of the ice edge(diffuse or compact) can easily be identified, and it allows for a higher resolved interpretation ofERS SAR images in terms of sea ice concentrations. Furthermore a texture based classificationalgorithm for ERS SAR images was developed using co-occurrence texture features and learningvector quantization for supervised learning of the training data. The selection of training samplesfrom the ERS SAR images can thereby aided either by the ASI sea ice maps or the aircraftmeasurements and observations.

SEASONAL CHARACTERISTICS OF ANTARCTIC SEA ICEBACKSCATTER
Voss Stefan
E-mail: [email protected] of Environmental Physics
University of BremenP.O.Box 33 04 40Telephone: 0049-421-218-4274
ABSTRACT
Sea ice is an important component of the global climate system and is considered as a sensitiveindicator of climate changes because it responds sensitively to them as model runs have shown.Besides microwave sensors like SSM/I only scatterometers like the wind scatterometer on boardthe ERS-1/2 satellites allows for a frequent and complete observation of sea ice in both PolarRegions. In view of a synergetic use of both sensor types a more thorough understanding of thescatterometer signal of sea ice is desirable. As recently reported, the backscatter of sea ice in theWeddell and Ross Sea behaves opposite to the Arctic, where there is a sudden decrease in multi-year ice backscatter once air temperatures approach or exceed zero centigrade. In the Antarctic,there is a pronounced seasonal cycle, with higher backscatter in summer than in winter. In the lateaustral summer, backscatter decreases again and slowly approaches winter values. The seasonalcycle is interpreted in terms of processes at the ice surface. The spring backscatter rise may beassociated with the formation of superimposed ice. In fall, when formation of superimposed iceceases due to surface cooling, gradual surface flooding with seawater becomes the dominatingprocess and causes the observed decrease of backscatter. In this study, the seasonal cycle of aboutten selected Antarctic Sea ice regions are observed with the ERS-1/2 wind scatterometer. Theexamination will be supplemented with data of the Sea Winds 13.4 GHz microwave radarinstrument on board the NASA QUICK SCATterometer satellite (Quickscat), launched in June1999. Combined with the ERS-1/2 wind scatterometer, the Sea Winds Ku band instrument mayprovide complimentary information.

ANALYSIS OF MULTI-POLARMETRIC SAR IMAGERY FROM THEKARA SEA
Hall Richard
E-mail: [email protected] Polar Research Institute
Lensfield RoadTelephone: 00 44 1223 336570
Fax: 00 44 1223 336549
ABSTRACT
Sea ice plays an important role within the global climate system. Knowledge of the Polar Regionsis limited due to their size and the hostile environment in which they lie. Satellite imagery canprovide synoptic coverage that overcomes these limitations. While single SAR images provideexcellent data for monitoring the ice cover in all weather conditions, it is limited due to theambiguous appearance of the surfaces of ice and water under certain conditions. To address thisproblem calibrated ERS-2 (C-band, VV polarisation) and RADARSAT (C-band, HH polarization)SAR images were acquired over the Kara Sea on 24th March 1997 to form a composite multi-polarmetric image. Analysis of the synergistic composite can improve the classification of sea icein satellite imagery, and provide an indication as to how the ASAR sensor on board ENVISATwill respond to sea ice.
SEA ICE INTERPRETATION MANUAL FOR SAR IMAGES
Sandven Stein
E-mail: [email protected] Environmental and Remote Sensing Center
Edvard Griegsvei 3aTelephone: 00 47 55 297288
Fax: 00 47 55 200050
Co-author/s:Ø. Dalen, K. Kloster, V.V. Melentyev, V. Alexandrov and N.I. Babich
ABSTRACT
The overall objective of producing a SAR ice interpretation manual is to 1. Support the use ofSynthetic Aperture Radar (SAR) images from ERS, RADARSAT and ENVISAT in national IceServices and other operational users of SAR-derived ice information; 2. Promote and facilitate useof SAR images among end users such as shipping companies, oil companies and other importantoperators in Arctic regions; and 3. Education and training. There is a demand for a SAR iceinterpretation manual which can be used in education at marine colleges and universities and inspecial training courses for captains, ice pilots, oil companies, oceanographers, meteorologists andother personnel working with sea ice. The manual contains an introduction to SAR imaging ofdifferent sea ice types and forms as observed by ERS and RADARSAT images from the Europeansector of the Arctic Ocean and adjacent seas. The main part of the manual consists of about 50examples of typical ice types and phenomena as observed by SAR together with interpretation andanalysis of the ice features, which are apparent in the images. The manual will be made availablefor public use both in hardcopy and on Internet.
EXTENSION AND TYPES OF SEA ICE WITH THE ERS-1SCATTEROMETRY IN SURROUNDINGS OF THE ANTARCTIC
PENINSULA
Greku Rudolf
E-mail: [email protected] of Geological Sciences of NASU
SATMAR, January Revolution Str., 3, 127, P.O. Box 105 Kiev-10, 252010Telephone: 380-44-290-7188
Fax: 380-44-216-9334
Co-author/s:T.R. Greku, Ukrainian Antarctic Center, Kiev, Ukraine, E-mail: [email protected]. Greku, Institute of Geological Sciences of NASU, Kiev, Ukraine,E-mail: [email protected]
ABSTRACT
Sea ice is a most changeable component of the Antarctic ice cover. The ice characteristics areunder affect of climatic and weather factors, hydrodynamic, wind and wave variation. Traps of thecoast and shallows catch and concentrate broken and drifting sea ice forming multi-year ice.Dynamics and transformation of the sea ice by the scatterometer data were considered for theAntarctic Peninsula region and for the Ukrainian Vernadsky Station area in particular. These dataare an importance to the climatic analysis and active ice navigation of the research and touristvessels in the western Antarctic. The Polar Sea Ice Grids of the ERS-1 AMI provided byIFREMER were used for our research.
SEASONAL ERS SAR STUDIES OF SEA ICE IN THE PECHORA ANDKARA SEA REGION
Lundhaug Maria
E-mail: [email protected] Environmental and Remote Sensing Center
Edvard Griegsvei 3ATelephone: 00 47 55 29 72 88
Fax: 00 47 55 20 00 50
Co-author/s:Ola M. Johannessen Kim H. Esbensen
ABSTRACT
There is a strong seasonal and regional variability in the sea ice distribution in the Kara andPechora Seas. It is an important sea ice production region because of very low air temperatures andrepeated opening of polynya areas driven mainly by strong winds. With SAR data it is possible tomap areas of open water and thin ice for estimation of heat exchange from water to air, which isessential for modelling of the climate system at high latitudes.
This study will focus on characterisation of the different types of first-year sea ice in the Pechoraand Kara Sea. Regional and seasonal signatures, during the whole ice season from the earlyformation of thin ice to the melt period will be investigated. ERS SAR data will be used, as theseare especially valuable in the Arctic due to the independence of fog, cloud cover and lack ofsunlight. Image data will be examined and parameters for characterising the sea ice will beextracted. Environmental information will be used to get a better understanding of thedevelopment of the ice during the year under different weather conditions.
Monitoring of sea ice in the Pechora and Kara Sea region is very important both for economic andenvironmental reasons. Extensive oil and gas resources are found here, and exploitation of these aswell as cargo transport along the Northern Sea Route may cause environmental problems. Also,transport of pollutants from the land areas by the huge rivers that flow into the seas, maycontribute to the contamination of the Arctic environment. Sea ice information is important forplanning of oil and gas installations, and safe exploitation and transport of these resources.
SEA ICE ALGORITHM VALIDATION AND IMPROVEMENT BYMULTI SENSOR ANALYSIS
Kaleschke Lars
E-mail: [email protected] of Environmental Physics,University of BremenAddress: P.O. Box 33 04 40, D-28334 Bremen, Germany
Telephone: 00 49 421 218 4726Fax: 00 49 421 218 4555
Co-author/s:Axel Bochert, Alfred Wegener Institute for Polar and Marine Research (AWI) Columbusstraße,D-27568 Bremerhaven Germany, Phone: 00 49 471 4831 1172, FAX: 00 49 471 4831 1149,Email: [email protected]
ABSTRACT
In order to validate and improve sea ice algorithms a hierarchically structured analysis of remotesensing methods was carried out ranging from large scale coverage of satellite passive microwaveover intermediate scale of satellite active microwave to small scale aircraft based measurements.
The used dataset was acquired during ARTIST (Arctic Radiation and Interaction Study) whichtook place around Svalbard in March/April 1998. Airborne measurements were carried out withtwo research aircrafts of the Alfred Wegener Institute. The aircraft was equipped with well provendevices (e.g. line scanners, radiation thermometer) and new systems (19.35 GHz and 37 GHzradiometers) which were operated for the first time during ARTIST. Several coordinated satelliteunder flights (SSM/I and ERS SAR) were performed in the vicinity of the marginal sea ice zone.
The dissimilar resolutions and swath widths of different remote sensing systems is a commonproblem for multi-sensor applications. The newly developed ARTIST Sea Ice algorithm (ASI)combines the NASA team and Svendsens 85GHz methods bringing together the nearly weatherindependence of the lower frequency SSM/I channels with the high spatial resolution of the85GHz channels. The goal of the ASI algorithm is to reduce the gap of resolution between ERSSAR and SSM/I. The resolution of the ASI sea ice maps (ASI:about 14km, NASA team:60km) issuitable for mesoscale applications: e.g. the accurate position of the sea ice edge meets therequirements of the mesoscale atmospheric modeling part of ARTIST, the state of the ice edge(diffuse or compact) can easily be identified, and it allows for a higher resolved interpretation ofERS SAR images in terms of sea ice concentrations. Furthermore a texture based classificationalgorithm for ERS SAR images was developed using co-occurrence texture features and learningvector quantization for supervised learning of the training data. The selection of training samplesfrom the ERS SAR images can thereby aided either by the ASI sea ice maps or the aircraftmeasurements and observations.
SEASONAL CHARACTERISTICS OF ANTARCTIC SEA ICEBACKSCATTER
Voss Stefan
E-mail: [email protected] of Environmental Physics
University of BremenP.O.Box 33 04 40Telephone: 0049-421-218-4274
ABSTRACT
Sea ice is an important component of the global climate system and is considered as a sensitiveindicator of climate changes because it responds sensitively to them as model runs have shown.Besides microwave sensors like SSM/I only scatterometers like the wind scatterometer on boardthe ERS-1/2 satellites allows for a frequent and complete observation of sea ice in both PolarRegions. In view of a synergetic use of both sensor types a more thorough understanding of thescatterometer signal of sea ice is desirable. As recently reported, the backscatter of sea ice in theWeddell and Ross Sea behaves opposite to the Arctic, where there is a sudden decrease in multi-year ice backscatter once air temperatures approach or exceed zero centigrade. In the Antarctic,there is a pronounced seasonal cycle, with higher backscatter in summer than in winter. In the lateaustral summer, backscatter decreases again and slowly approaches winter values. The seasonalcycle is interpreted in terms of processes at the ice surface. The spring backscatter rise may beassociated with the formation of superimposed ice. In fall, when formation of superimposed iceceases due to surface cooling, gradual surface flooding with seawater becomes the dominatingprocess and causes the observed decrease of backscatter. In this study, the seasonal cycle of aboutten selected Antarctic Sea ice regions are observed with the ERS-1/2 wind scatterometer. Theexamination will be supplemented with data of the Sea Winds 13.4 GHz microwave radarinstrument on board the NASA QUICK SCATterometer satellite (Quickscat), launched in June1999. Combined with the ERS-1/2 wind scatterometer, the Sea Winds Ku band instrument mayprovide complimentary information.
ANALYSIS OF MULTI-POLARMETRIC SAR IMAGERY FROM THEKARA SEA
Hall Richard
E-mail: [email protected] Polar Research Institute
Lensfield RoadTelephone: 00 44 1223 336570
Fax: 00 44 1223 336549
ABSTRACT
Sea ice plays an important role within the global climate system. Knowledge of the Polar Regionsis limited due to their size and the hostile environment in which they lie. Satellite imagery canprovide synoptic coverage that overcomes these limitations. While single SAR images provideexcellent data for monitoring the ice cover in all weather conditions, it is limited due to theambiguous appearance of the surfaces of ice and water under certain conditions. To address thisproblem calibrated ERS-2 (C-band, VV polarisation) and RADARSAT (C-band, HH polarization)SAR images were acquired over the Kara Sea on 24th March 1997 to form a composite multi-polarmetric image. Analysis of the synergistic composite can improve the classification of sea icein satellite imagery, and provide an indication as to how the ASAR sensor on board ENVISATwill respond to sea ice.

SEA ICE INTERPRETATION MANUAL FOR SAR IMAGES
Sandven Stein
E-mail: [email protected] Environmental and Remote Sensing Center
Edvard Griegsvei 3aTelephone: 00 47 55 297288
Fax: 00 47 55 200050
Co-author/s:Ø. Dalen, K. Kloster, V.V. Melentyev, V. Alexandrov and N.I. Babich
ABSTRACT
The overall objective of producing a SAR ice interpretation manual is to 1. Support the use ofSynthetic Aperture Radar (SAR) images from ERS, RADARSAT and ENVISAT in national IceServices and other operational users of SAR-derived ice information; 2. Promote and facilitate useof SAR images among end users such as shipping companies, oil companies and other importantoperators in Arctic regions; and 3. Education and training. There is a demand for a SAR iceinterpretation manual which can be used in education at marine colleges and universities and inspecial training courses for captains, ice pilots, oil companies, oceanographers, meteorologists andother personnel working with sea ice. The manual contains an introduction to SAR imaging ofdifferent sea ice types and forms as observed by ERS and RADARSAT images from the Europeansector of the Arctic Ocean and adjacent seas. The main part of the manual consists of about 50examples of typical ice types and phenomena as observed by SAR together with interpretation andanalysis of the ice features, which are apparent in the images. The manual will be made availablefor public use both in hardcopy and on Internet.

EXTENSION AND TYPES OF SEA ICE WITH THE ERS-1SCATTEROMETRY IN SURROUNDINGS OF THE ANTARCTIC
PENINSULA
Greku Rudolf
E-mail: [email protected] of Geological Sciences of NASU
SATMAR, January Revolution Str., 3, 127, P.O. Box 105 Kiev-10, 252010Telephone: 380-44-290-7188
Fax: 380-44-216-9334
Co-author/s:T.R. Greku, Ukrainian Antarctic Center, Kiev, Ukraine, E-mail: [email protected]. Greku, Institute of Geological Sciences of NASU, Kiev, Ukraine,E-mail: [email protected]
ABSTRACT
Sea ice is a most changeable component of the Antarctic ice cover. The ice characteristics areunder affect of climatic and weather factors, hydrodynamic, wind and wave variation. Traps of thecoast and shallows catch and concentrate broken and drifting sea ice forming multi-year ice.Dynamics and transformation of the sea ice by the scatterometer data were considered for theAntarctic Peninsula region and for the Ukrainian Vernadsky Station area in particular. These dataare an importance to the climatic analysis and active ice navigation of the research and touristvessels in the western Antarctic. The Polar Sea Ice Grids of the ERS-1 AMI provided byIFREMER were used for our research.
QUALITY OF LONG TERM SATELLITE WIND AND WAVEMEASUREMENTS
Queffeulou Pierre
E-mail: [email protected]
Departement d'Oceanographie SpatialeBP 70Telephone: 00 33 2 98 22 42 94
Fax: 00 33 2 98 22 45 33
ABSTRACT
Since the time of the first data from ERS-1, in 1991, the french PAF CERSAT of IFREMERDépartement d'Océanographie Spatiale has processed and distributed data from ERS-1 and ERS-2.Concurrently the Département was involved in algorithm development and geophysical validationof the products of ERS altimeters and AMI's, and then of other satellites, like TOPEX, NSCATand, more recently, QuikSCAT. For this purpose, procedures of cross validation of sensors weredeveloped with the aim of building long time series from various sensors and satellites, withhomogeneous quality. Here we present long term validation of significant wave height (SWH) andwind speed measurements from altimeters and scatterometers. Two methods are used: globalstatistical analysis and cross validation at same time and location. The first one is applied to ERS-1, ERS-2 and TOPEX SWH, and shows significant differences, up to more than half a meter forSWH, between the satellite products, over the time period from 1991 to 2000. Furthermore thesedifferences are not constant with time but depend on changes for processing improvement, or onelectronics drifts, for instance. The second method, completed by in situ data comparisons, allowsto propose corrections for the data, in order to improve their global quality. Results from sametechnics applied to sea surface wind speed measurements from ERS-1, ERS-2 and TOPEXaltimeters are shown and completed with comparisons from scatterometers of ERS, NSCAT andQuikSCAT. Beyond the scope of validation, this work is a step for merging data from varioussensors to infer more accurate wind and wave fields.
INTERNAL SOLITONS NEAR GIBRALTAR: A MULTI-YEAR STUDYUSING ERS-1 & 2 SAR IMAGERY
Apel John R.
E-mail: [email protected] Ocean Associates
P.O. Box 12131Telephone: 00 1-301-460-7018
Fax: 00 1-301-460 9775
Co-author/s:John R. Apel, Global Ocean Associates, Silver Spring, MD USA, Peter Worcester, ScrippsInstitution of Oceanography, La Jolla, CA, USA Ewe Send, Institut fur Meereskunde, Kiel,Germany, Michel Crepon, Universite de Paris, Paris, France
ABSTRACT
Synthetic aperture radar (SAR) images are especially useful for observing surface signatures ofcoherent internal waves in the ocean. A study has been conducted of the dynamics of internalsoliton packets in and near the Strait of Gibraltar, using several years' worth of imagery from theEuropean Remote Sensing Satellites, ERS-1 & 2. The study reveals new features of the wave fieldas well as reaffirming behavior previously reported. It shows the waves may have two modes ofpropagation out into the Alboran Sea, termed Northeast and Southeast; that they penetrateeastward well beyond 200 km from their source; that they appear to be dependent on fortnightlytides as well as on semi-diurnal and diurnal forcing; and that smaller packets are generated at theCamarinal Sill that propagate into the Atlantic. The data are interpreted in terms of (1) the little-known "dnoidal" solution to the Korteweg De Vries equation for the amplitude and (2) the Taylor-Goldstein equation for the vertical internal modes, using continuously distributed profiles ofdensity and mean flow velocity. Both historical and contemporaneous in-situ data are used. Thesetwo equations together capture many quantitative features of the soliton packets. Comparisonsbetween observations and theory will be presented. The study has been supported by the EuropeanSpace Agency and the U.S. Office of Naval Research.
VALIDATION OF WIND RETRIEVAL ALGORITHMS FROMSPACEBORNE SAR
Parmiggiani Flavio
E-mail: [email protected]
Via Gobetti 101Telephone: 0039 051 639 8009
Fax: 0039 051 639 8132
Co-author/s:E. Arabini(1), G. Carrera(2), G. De Carolis(3), A. Siccardi(4) and R. Tedeschi(2)(1)ISAO-CNR, via Gobetti 101, 40129 Bologna (Italy)(2)Dip. Ingegneria Navale, University of Genoa, Genoa (Italy)(3)ITIS-CNR, P.O. Box 11, Matera (Italy)(4)IAN-CNR, via De Marini 6, 16149 Genoa (Italy)
ABSTRACT
The exploitation of Synthetic Aperture Radar (SAR) imagery as a tool to obtain geophysicalinformation of the marine environment has been object of intense studies by the scientificcommunity in the recent years. Several methods have been proposed in the last few years toretrieve quantitative estimates of ocean wave spectra and of wind speed and direction at a givenreference height from SAR imagery. These tools appear very interesting in view of the future dual-polarised ASAR instrument onboard the European ENVISAT satellite, whose launch is plannedfor June 2001.
In preparation of the availability of ENVISAT/ASAR data, we have planned a validationcampaign for wind retrieval algorithms from ERS-2/SAR. The main source of reference data is thebuoy ODAS Italia 1, located in the North Tyrrhenian Sea at 43.8 N and 9.1 E. ODAS Italia 1 isindeed a real open sea laboratory, equipped with a large set of meteo-marine instrumentation [1],like anemometer, pyranometer, thermometers, current meter, etc.
As a case study, an ERS-2/SAR scene of March 30 (orbit: 25842, frame: 2727) over the NorthTyrrhenian Sea was selected and both PRI and SLCI products were acquired. The image showsrelevant features due to the the action of the wind on the sea surface. In particular, the presence ofwind streaks, which are surface evidence of the wind direction, is clearly visible. However, the``true'' wind direction cannot be immediately recognized because of the 180 degrees ambiguity.We propose to exploit the SAR backscatter spatial structure as a mean to remove the directionalambiguity. The SAR image was analyzed: i) using the empirical backscatter model CMOD4 [2] toretrieve the wind stress; and ii) by means of the VISA method [3] to retrieve the wind directionwithout ambiguity. Indeed, the VISA procedure allows to discriminate the ``true'' wind directionwhen unstable thermal conditions are fulfilled. All the relevant meteorological parameters (windintensity, wind direction, air/sea temperature) had been collected by ODAS Italia 1 during a totalof 1 hour of acquisition, centered around the time of satellite pass. The comparison of measuredwind intensity and direction with SAR retrieved values confirms the soundness of the employedalgorithms.
Future plans of validation activities, in connection with the availability of ENVISAT/ASAR data,regard the installation of an ondametric buoy [4] in the vicinity of ODAS Italia 1, in order tojointly validate wind and wave spectra retrieval methods from SAR.

REFERENCES[1] A. Siccardi, R. Bono, F. Grosso, R. Amore, R. Mantovani and A. Mistrangelo, ``Open seamonitoring: ODAS Italia 1, an operational system and a challenge for the future'', OceanologyInternat. 96, Brighton, U.K., March 1996.[2] A.C.M. Stoffelen and D.L.T. Anderson, "Scatterometer data interpretation: estimation andvalidation of the transfer function CMOD4'', J. Geophys. Res., vol. 102, C3, 1997, 5767-5780.[3] S. Zecchetto, P. Trivero, B. Fiscella and P. Pavese, "Wind stress structure in the unstablemarine surface layer detected by SAR'', Boundary-Layer Meteorology, vol. 86, 1998, 1-28.[4] G. Carrera and R. Tedeschi, "Wave measurements at Terra Nova bay'', in "Italian GeophysicalObservatories in Antarctica", (Eds.: A. Meloni & A. Morelli), pp. 199-210, Ed. Compositori 1996.

CASE STUDIES OF COASTAL OCEAN WIND FIELD RETRIEVALSFROM RADARSAT SYNTHETIC APERTURE RADAR IMAGES NEAR
THE ISLAND OF HAINAN, CHINA
Huang Weigen
E-mail: [email protected] Institute of Oceanography State Oceanic Administration P. R. China
Xi Xi He Xia 9 HangzhouTelephone: 0086 571 8076924
Fax: 0086 571 8071539
Co-author/s:Jingsong Yang, Changbao Zhou, etc.
ABSTRACT
High resolution coastal zone wind field estimates may be retrieved from radiometrically calibratedsynthetic aperture radar (SAR) images of the coastal zone; the wind field modulates that surfaceroughness, which in turn modulates the observed radar cross section. Higher wind speeds producelarger cross sections. We consider two calibrated RADARSAT SAR images of the coastal zonenear the Island of Hainan, China and used a spectral analysis of the long wavelength structure inthe SAR image to estimate the wind direction. The estimated direction and the radar cross section,along with a scatterometer wind retrieval model, were used to estimate the wind speed. SARimages can provide the wind vector with a high spatial resolution; our retrieved estimates areshown to be in reasonable agreement with conventional synoptic weather analyses from theobservation times closest to the SAR passes. The images also provide visual evidence of thespatial development and evolution of the marine atmospheric boundary layer. Secondaryatmospheric flow phenomena, such as boundary layer rolls and atmospheric internal waves,modulate the ocean surface roughness and may be imaged by SAR.
A MODEL FOR WIND SPEED AND WAVE HEIGHT RETRIEVALFROM RADAR ALTIMETER MEASUREMENTS
Della Rocca Maria Rosaria
E-mail: [email protected]á degli Studi di Salerno - Dipartimento di Ingegneria Civile
Via Ponte don MelilloTelephone: 0039 089 964044
Fax: 0039 089 964045
Co-author/s:Eugenio Pugliese Carratelli
ABSTRACT
A new algorithm for simulation of the measurement of ocean wave height and wind speed by radaraltimeter is proposed. This algorithm considers ocean wave spectrum and employs a parametricmodel for the simulation of the electromagnetic waves diffusion from surface; it offers greaterflexibility and realism as to analytical models currently used.
Numerical results give assurance of independence of the measured significant wave height fromwave period. They are consistent even if different backscatter models are employed. On thecontrary, the numerical results show that wind speed measurements are significantly affected bywave period.
The aim of this work is two-fold: on the one hand to allow a more accurate calibration of altimeterdata and on the other hand to develop a model which can be used for simulation of the sea stateresponse as seen by other microwave instruments working at other incidence angles.
QUALITY OF LONG TERM SATELLITE WIND AND WAVEMEASUREMENTS
Queffeulou Pierre
E-mail: [email protected]
Departement d'Oceanographie SpatialeBP 70Telephone: 00 33 2 98 22 42 94
Fax: 00 33 2 98 22 45 33
ABSTRACT
Since the time of the first data from ERS-1, in 1991, the french PAF CERSAT of IFREMERDépartement d'Océanographie Spatiale has processed and distributed data from ERS-1 and ERS-2.Concurrently the Département was involved in algorithm development and geophysical validationof the products of ERS altimeters and AMI's, and then of other satellites, like TOPEX, NSCATand, more recently, QuikSCAT. For this purpose, procedures of cross validation of sensors weredeveloped with the aim of building long time series from various sensors and satellites, withhomogeneous quality. Here we present long term validation of significant wave height (SWH) andwind speed measurements from altimeters and scatterometers. Two methods are used: globalstatistical analysis and cross validation at same time and location. The first one is applied to ERS-1, ERS-2 and TOPEX SWH, and shows significant differences, up to more than half a meter forSWH, between the satellite products, over the time period from 1991 to 2000. Furthermore thesedifferences are not constant with time but depend on changes for processing improvement, or onelectronics drifts, for instance. The second method, completed by in situ data comparisons, allowsto propose corrections for the data, in order to improve their global quality. Results from sametechnics applied to sea surface wind speed measurements from ERS-1, ERS-2 and TOPEXaltimeters are shown and completed with comparisons from scatterometers of ERS, NSCAT andQuikSCAT. Beyond the scope of validation, this work is a step for merging data from varioussensors to infer more accurate wind and wave fields.
INTERNAL SOLITONS NEAR GIBRALTAR: A MULTI-YEAR STUDYUSING ERS-1 & 2 SAR IMAGERY
Apel John R.
E-mail: [email protected] Ocean Associates
P.O. Box 12131Telephone: 00 1-301-460-7018
Fax: 00 1-301-460 9775
Co-author/s:John R. Apel, Global Ocean Associates, Silver Spring, MD USA, Peter Worcester, ScrippsInstitution of Oceanography, La Jolla, CA, USA Ewe Send, Institut fur Meereskunde, Kiel,Germany, Michel Crepon, Universite de Paris, Paris, France
ABSTRACT
Synthetic aperture radar (SAR) images are especially useful for observing surface signatures ofcoherent internal waves in the ocean. A study has been conducted of the dynamics of internalsoliton packets in and near the Strait of Gibraltar, using several years' worth of imagery from theEuropean Remote Sensing Satellites, ERS-1 & 2. The study reveals new features of the wave fieldas well as reaffirming behavior previously reported. It shows the waves may have two modes ofpropagation out into the Alboran Sea, termed Northeast and Southeast; that they penetrateeastward well beyond 200 km from their source; that they appear to be dependent on fortnightlytides as well as on semi-diurnal and diurnal forcing; and that smaller packets are generated at theCamarinal Sill that propagate into the Atlantic. The data are interpreted in terms of (1) the little-known "dnoidal" solution to the Korteweg De Vries equation for the amplitude and (2) the Taylor-Goldstein equation for the vertical internal modes, using continuously distributed profiles ofdensity and mean flow velocity. Both historical and contemporaneous in-situ data are used. Thesetwo equations together capture many quantitative features of the soliton packets. Comparisonsbetween observations and theory will be presented. The study has been supported by the EuropeanSpace Agency and the U.S. Office of Naval Research.
VALIDATION OF WIND RETRIEVAL ALGORITHMS FROMSPACEBORNE SAR
Parmiggiani Flavio
E-mail: [email protected]
Via Gobetti 101Telephone: 0039 051 639 8009
Fax: 0039 051 639 8132
Co-author/s:E. Arabini(1), G. Carrera(2), G. De Carolis(3), A. Siccardi(4) and R. Tedeschi(2)(1)ISAO-CNR, via Gobetti 101, 40129 Bologna (Italy)(2)Dip. Ingegneria Navale, University of Genoa, Genoa (Italy)(3)ITIS-CNR, P.O. Box 11, Matera (Italy)(4)IAN-CNR, via De Marini 6, 16149 Genoa (Italy)
ABSTRACT
The exploitation of Synthetic Aperture Radar (SAR) imagery as a tool to obtain geophysicalinformation of the marine environment has been object of intense studies by the scientificcommunity in the recent years. Several methods have been proposed in the last few years toretrieve quantitative estimates of ocean wave spectra and of wind speed and direction at a givenreference height from SAR imagery. These tools appear very interesting in view of the future dual-polarised ASAR instrument onboard the European ENVISAT satellite, whose launch is plannedfor June 2001.
In preparation of the availability of ENVISAT/ASAR data, we have planned a validationcampaign for wind retrieval algorithms from ERS-2/SAR. The main source of reference data is thebuoy ODAS Italia 1, located in the North Tyrrhenian Sea at 43.8 N and 9.1 E. ODAS Italia 1 isindeed a real open sea laboratory, equipped with a large set of meteo-marine instrumentation [1],like anemometer, pyranometer, thermometers, current meter, etc.
As a case study, an ERS-2/SAR scene of March 30 (orbit: 25842, frame: 2727) over the NorthTyrrhenian Sea was selected and both PRI and SLCI products were acquired. The image showsrelevant features due to the the action of the wind on the sea surface. In particular, the presence ofwind streaks, which are surface evidence of the wind direction, is clearly visible. However, the``true'' wind direction cannot be immediately recognized because of the 180 degrees ambiguity.We propose to exploit the SAR backscatter spatial structure as a mean to remove the directionalambiguity. The SAR image was analyzed: i) using the empirical backscatter model CMOD4 [2] toretrieve the wind stress; and ii) by means of the VISA method [3] to retrieve the wind directionwithout ambiguity. Indeed, the VISA procedure allows to discriminate the ``true'' wind directionwhen unstable thermal conditions are fulfilled. All the relevant meteorological parameters (windintensity, wind direction, air/sea temperature) had been collected by ODAS Italia 1 during a totalof 1 hour of acquisition, centered around the time of satellite pass. The comparison of measuredwind intensity and direction with SAR retrieved values confirms the soundness of the employedalgorithms.
Future plans of validation activities, in connection with the availability of ENVISAT/ASAR data,regard the installation of an ondametric buoy [4] in the vicinity of ODAS Italia 1, in order tojointly validate wind and wave spectra retrieval methods from SAR.

REFERENCES[1] A. Siccardi, R. Bono, F. Grosso, R. Amore, R. Mantovani and A. Mistrangelo, ``Open seamonitoring: ODAS Italia 1, an operational system and a challenge for the future'', OceanologyInternat. 96, Brighton, U.K., March 1996.[2] A.C.M. Stoffelen and D.L.T. Anderson, "Scatterometer data interpretation: estimation andvalidation of the transfer function CMOD4'', J. Geophys. Res., vol. 102, C3, 1997, 5767-5780.[3] S. Zecchetto, P. Trivero, B. Fiscella and P. Pavese, "Wind stress structure in the unstablemarine surface layer detected by SAR'', Boundary-Layer Meteorology, vol. 86, 1998, 1-28.[4] G. Carrera and R. Tedeschi, "Wave measurements at Terra Nova bay'', in "Italian GeophysicalObservatories in Antarctica", (Eds.: A. Meloni & A. Morelli), pp. 199-210, Ed. Compositori 1996.
CASE STUDIES OF COASTAL OCEAN WIND FIELD RETRIEVALSFROM RADARSAT SYNTHETIC APERTURE RADAR IMAGES NEAR
THE ISLAND OF HAINAN, CHINA
Huang Weigen
E-mail: [email protected] Institute of Oceanography State Oceanic Administration P. R. China
Xi Xi He Xia 9 HangzhouTelephone: 0086 571 8076924
Fax: 0086 571 8071539
Co-author/s:Jingsong Yang, Changbao Zhou, etc.
ABSTRACT
High resolution coastal zone wind field estimates may be retrieved from radiometrically calibratedsynthetic aperture radar (SAR) images of the coastal zone; the wind field modulates that surfaceroughness, which in turn modulates the observed radar cross section. Higher wind speeds producelarger cross sections. We consider two calibrated RADARSAT SAR images of the coastal zonenear the Island of Hainan, China and used a spectral analysis of the long wavelength structure inthe SAR image to estimate the wind direction. The estimated direction and the radar cross section,along with a scatterometer wind retrieval model, were used to estimate the wind speed. SARimages can provide the wind vector with a high spatial resolution; our retrieved estimates areshown to be in reasonable agreement with conventional synoptic weather analyses from theobservation times closest to the SAR passes. The images also provide visual evidence of thespatial development and evolution of the marine atmospheric boundary layer. Secondaryatmospheric flow phenomena, such as boundary layer rolls and atmospheric internal waves,modulate the ocean surface roughness and may be imaged by SAR.

A MODEL FOR WIND SPEED AND WAVE HEIGHT RETRIEVALFROM RADAR ALTIMETER MEASUREMENTS
Della Rocca Maria Rosaria
E-mail: [email protected]á degli Studi di Salerno - Dipartimento di Ingegneria Civile
Via Ponte don MelilloTelephone: 0039 089 964044
Fax: 0039 089 964045
Co-author/s:Eugenio Pugliese Carratelli
ABSTRACT
A new algorithm for simulation of the measurement of ocean wave height and wind speed by radaraltimeter is proposed. This algorithm considers ocean wave spectrum and employs a parametricmodel for the simulation of the electromagnetic waves diffusion from surface; it offers greaterflexibility and realism as to analytical models currently used.
Numerical results give assurance of independence of the measured significant wave height fromwave period. They are consistent even if different backscatter models are employed. On thecontrary, the numerical results show that wind speed measurements are significantly affected bywave period.
The aim of this work is two-fold: on the one hand to allow a more accurate calibration of altimeterdata and on the other hand to develop a model which can be used for simulation of the sea stateresponse as seen by other microwave instruments working at other incidence angles.
THE USE OF ERS-1/2 SAR TO THE STUDY OF OCEAN SURFACEFEATURES IN THEGULF OF CALIFORNIA MEXICO
Martínez-Díaz-de-León Asdrubal
E-mail: [email protected] de Investigaciones OceanologicasUniversidad Autonoma de
Baja CaliforniaA. Postal #453Ensenada, B.C. Mexico 22800
Telephone: 00 52 6 1744601Fax: 00 52 6 1745303
ABSTRACT
The Gulf of California, a large semi-enclosed sea located in the north-western Mexico between theBaja California Peninsula and the Mexican main land, is a very interesting and complex region,with considerable oceanographic and meteorological interest due to its similarity to other marginalseas, such as the Red Sea, the Adriatic Sea, and the East China Sea (Roden, 1958; Badan-Dangonet al., 1991). Among the outstanding oceanographic features of the Gulf of California are the largeannual range of sea surface temperature, its impressive tidal range, that increase gradually from theGulf entrance up to Tiburon Island and than rapidly toward its head, exceeding 10m during springtides. There is a seasonally reversing gyre, cyclonic in the summer and anticyclonic in the winter,located in the northern Gulf with speeds reaching 0.7 ms-1. The high tidal range and thecomplicated bottom topography produce strong currents along the Gulf, especially in the vicinityof Tiburon Island where strong tidal mixing fronts and high internal wave activity are observed.Until now the complex oceanographic processes occurring in the Gulf of California have beeninvestigated mainly by sampling from insitu instruments aided in some occasions by nearly-coincident infra-red derived sea surface temperature images. Unfortunately, in most cases, insitumeasurements do not provide adequate spatial and temporal cover of the intrinsic scales ofvariability associated with these oceanographic features, and due to cloud cover, a commonsituation to many coastal areas, infra-red imagery is not always a success. In this paper we showevidence that ERS-1/2 SAR can play a useful role in observing the complicated upper-oceancirculation features occurring in the Gulf of California.

DETECTION AND INTERPRETATION OF OCEANIC ANDATMOSPHERIC SIGNATURES IN SPACEBORNE RADAR IMAGERY
OF THE NORTH-WESTERN PACIFIC
Lavrova Olga
E-mail: [email protected] Research Institute of Russian Academy of Sciences
84/32 Profsoyuznaya str.Telephone: 007-095-3334256
Fax: 007-095-3331056
Co-author/s:Marina I. Mityagina, Space Research Institute of Russian Academy of Sciences,84/32 Profsoyznaya str., 117810, Moscow, Russiatel. Telephone: 007-095-3335078,Fax: 007-095-3331056, E-mail: [email protected]
ABSTRACT
This work presents the results of analysis of the ERS-SAR images of the Othotsk and Japan seas,which are at our disposal in the frame of ESA, grant AO3-224. The obtained images were used tostudy three problems.1) Investigation of internal waves. A detailed analysis of accumulated data has shown that in theNorthwestern Pacific there were regions of regular manifestations of internal waves propagating indifferent directions. The wave surface signatures exhibit clear nonlinear features typical for trainsof internal solitons: higher-than-linear group velocities, decreases in wavelength, crest length andamplitude toward the rear of the packet. Interaction of wave structures is a very sensitive detectorof both the effectiveness of nonlinear processes and principal physical mechanisms responsible forthis interaction. The focus was on specific manifestations of non-linear interaction of internalwaves at sea surface. The obtained results were compared with those received by the SpaceResearch Institute in the same region in the 80s using an airborne Ku-band radar.2) The study of ocean and atmosphere interaction in regions of intensive energy exchange such asthe Kuril straits, including the Friza strait, featuring intensive convergent currents and sharptemperature contrasts. First of all, the Friza strait serves as an exchange of waters between theOkhotsk Sea and the Pacific. The strait accommodates a two-directional current system built bytidal flows and characterised by high stability in time and in space. SAR images taken by the ERS-2 on September 25, 1998, at a 12-hour difference permitted to observe the development of vortexstructures on the sea surface. Here comparisons were also made with data obtained in the early 80sby means of a set of airborne and spaceborne instruments, which included a satellite-borne SAR of5cm "Almaz-1", an aircraft-laboratory and a research vessel. The comparisons confirmed thestable character of the observed phenomena, which could add valuable information to theunderstanding of the long-term oceanic variability in that region.3) The analysis of the available data made it possible to accurately identify and investigate surfacemanifestations of gravitational waves in lower troposphere, convective motions in atmosphere,wind fronts, etc.
ON THE VARIETY OF IW RADAR OBSERVATIONS IN THE OCEAN -SLICK-LIKE SIGNATURES
Da Silva Jose
E-mail: [email protected] of Ocean and Earth Science Southampton Oceanography Centre
European Way Express DockTelephone: 00442380596467
Fax: 00442380593059
Co-author/s:S.A. Ermakov, I.S. Robinson
ABSTRACT
It was shown recently that three different types of short-period Internal Wave SAR signaturesoccur on the Iberian Shelf depending on parameters of surface-active films. Large scalemodulation of film characteristics by currents associated with internal tidal waves can also producea signature in ERS SAR images. On the Western Iberian shelf short-period IWs typicallypropagate in groups of packets that are believed to be generated by the evolution of internal tidalwaves over the shelf. Here it is shown that onshore propagating short-period IWs can exhibitdifferent SAR signatures within the same wave packet according to their position relative to thephase of the internal tidal wave. These transitions of signature mode can be explained by largescale variations of film parameters produced by the internal tidal waves. At low-to- moderatewinds leading waves in the IW packets usually exhibit double sign signatures, which evolve tonegative sign signatures for the subsequent waves in the packets. At very low, near-threshold,winds the IW signatures can be in the form of the double sign type undergoing transition topositive sign signatures when compared to the background behind the IW packet. This is aconsequence of different threshold wind speeds for excitation of Bragg waves at different filmpressures. It is demonstrated that there is an increase of unperturbed film pressure in the directionof the ranking order of solitons in a packet of short-period IWs, which is predicted by a theoreticalmodel and in agreement with measurements of film elasticity. It is concluded that observations ofSAR signature mode transitions are consistent with previous model results, and a diagramdescribing mode transitions of the IW signatures in relation to film pressure and wind speed ispresented. Examples of such transitions in different regions of the global ocean are presented,illustrating where slick-dominated SAR signatures are expected to occur.
ON THE VARIETY OF IW RADAR OBSERVATIONS IN THE OCEAN
2. Rip-like signatures
Da Silva Jose
E-mail: [email protected] of Ocean and Earth Science Southampton Oceanography Centre
European Way Express DockTelephone: 00442380596467
Fax: 00442380593059
Co-author/s:I.B. Araujo, S.A. Ermakov and I.S. Robinson
ABSTRACT
In the accompanying paper (part 1. Slick-like signatures) we describe and present results of arecent classification scheme for synthetic aperture radar (SAR) signatures of internal waves (IWs)that has been proposed based on the analysis of ERS SAR images of the Iberian shelf zone.According to this classification IWs display three different signatures depending on the parametersof surface-active films and wind speed. In particular, it was found that at very low wind speedsIWs display single positive backscatter signatures as a result of the image background falling tothe noise floor at such low wind conditions. Here, we present results of observations ofpredominant single positive signatures even when the background backscatter is well above thenoise floor. A variety of observations from different oceanic regions, such as the Strait ofGibraltar, Andaman Sea, Sea of Bali, Gulf of California, central Bay of Biscay, etc., are presentedas evidence of the phenomena. One common factor associated with these SAR observations seemsto be that they correspond to comparatively long IWs (their wavelength can be up to severalkilometres) which are known to propagate with high phase velocities (Cp>1 m/s). However,analysis of a data set of the West Iberian shelf also shows that predominant positive signatures canoccur in this region, where typical values of IW phase speed is Cp~0.5 m/s. This has been madeclear from analysis of the mode of signature, which is defined by a parameter that evaluates the IWintensity profiles in relation to the mean backscatter of the image background. The signature modeparameter is found to be correlated with the angle between the IW propagation direction and thewind velocity. A simple model which takes into account modulation of short-scale surface wavesby the relative wind velocity to the surface current generated by the IWs is considered and wasfound to be in good qualitative agreement with the experimental results. While in theaccompanying paper (part 1) we found the signature mode parameter to be sensitive to the localconcentration of films, in this paper we demonstrate that it can also be sensitive to the relativewind direction to the IW propagation. In addition, we investigate also the signature dependence formoderate wind speed, which was not predicted in the accompanying paper.
GENERATING A UNIVERSAL FOREST GROUND-TRUTHCATALOGUE FOR REMOTE SENSING APPLICATIONS TO FOREST
OBSERVATION
Schmullius Christiane
E-mail: [email protected] for Geography, Dept. of Geoinformatics and Remote Sensing,
Friedrich-Schiller-UniversityLöbdergraben 32
Telephone: 0049.(0)3641.948877Fax: 0049.(0)3641.948852
Co-author/s:Anatoly Shvidenko(2), Sten Nilsson(1), Michael Gluck(1), Christiane Schmullius(2),Victor Skudin(3), Vladimir Sokolov(4), Vjacheslav Rozhkov(5), Leonid Vashuk(6)(1)International Institute for Applied Systems Analysis, A-2361, Laxenburg, AustriaTel.0043.(0) 2236.817497, Fax 818599, E-mail: [email protected](2)DLR, Cermany(3)East Siberian Forest Inventory Enterprise, Krasnoyarsk, Russia(4)V.N.Sukachev Institute of Forest, Krasnoyarsk, Russia(5)V.V.Dkuchaev Soil Institute, Moscow, Russia(6)Irkutsk Regional Forest Service, Irkutsk, Russia
ABSTRACT
For cost, time and accessibility reasons, the on-ground truth data collection is the usual problemfor both research and practical implementation of new remote sensing sensors and technologies. Inthe framework of the SIBERIA, an attempt to generate a permanent universal system of on-groundtruth data for all possible (current and future) remote sensing observations of Northern Eurasiaterrestrial ecosystems with a special emphases to forests has been realized. In its current form, thesystem comprises three levels: 1) federal, 2) (sub) regional and 3) local, which are presented in aform of attributive data bases and connected GIS components. The federal level includes thecomprehensive description of entire Russian land by ecological regions (totally 141 for Russia)and administrative units of the federal level. GIS components of this level are presented by anumber of digitized maps at scale from 1:1 Mio to 1:4 Mio (including landscape, vegetation, soil,forest, land-use/land-cover maps, relevant layers of the DCW, others). Units of the (sub) regionallevel called test territories have the average area from 1 to 3 million ha and are designated todescribe zonal and altitudinal diversity of landscapes & terrestrial ecosystems. GIS componentsare at scale 1:200000-1:300000. The local level is presented by test areas of typical landscapes (ofthe average area from 30000 to 150000 ha) with attributive DBs describing each land-use/land-cover unit (e.g., primary forest inventory & management units are used for forests). CorrespondingGIS components have the scale at 1:50000. Two lower levels have been developed for the territoryinvestigated by SIBERIA (of total area at about 100 million ha), and includes 8 test territories and51 test areas. The system presents possibilities 1) to examine RS images of different types with theresolution from 5-7 m to 150-200 m; 2) to plan an appropriate design of multi-layer observationsand 3) to develop appropriate classifications. Problems of spatial accuracy and up dating of thesystem are discussed.
AUTOMATED TRAINING-SITE SELECTION BASED ON ACOHERENCE MODEL FOR FOREST CLASSIFICATION IN THE
SIBERIA PROJECT
Schmullius Christiane
E-mail: [email protected] for Geography, Dept. of Geoinformatics and Remote Sensing,
Friedrich-Schiller-UniversityLöbdergraben 32
Telephone: 0049.(0)3641.948877Fax: 0049.(0)3641.948852
Co-author/s:Wolfgang Wagner, Jan Vietmeier German Aerospace Center (DLR), German Remote SensingData Center (DFD), P.O. Box 11 16, D-82230 Wessling, Germany Tel. 0049.(0) 8153.28-2358,Fax 28-1449, E-mail: [email protected]
ABSTRACT
In recent years SAR Interferometry has proven its value for deriving terrain height information andfor detecting movements of the Earth's surface. Quasi as a by-product, SAR Interferometry can beused as an input to classification. In this paper the possibility of using coherence informationderived from ERS Tandem Paris for estimating growing stock volume of boreal forest isinvestigated.
To study the relationship between forest parameters and radar parameters an extensive data set wasbuilt up within the framework of the SIBERIA project. Forestry data from 36 testsites, eachcovering from 20,000 to 100,000 hectares of forested land, were made available. This extensivedatabase provides a good basis for understanding the potential and limitations for using ERSTandem coherence for forestry applications. A visual analysis of scatter plots of ERS coherenceversus growing stock volume showed that the scatter is generally relatively large. However, fortest sites with a small degree of scattering, an exponential relationship is evident. To study thebehaviour of the coherence model, it was fitted to the scatter plots from all testsites. With someexceptions, the estimated model parameters lay within the expected range.
The exponential coherence model was then used to select automatically training sites (or regionsof interest, ROIs) as input for the maximum likelihood classification. The general idea is todetermine coherence thresholds for each growing stock volume class using the coherence model,select training sites using this thresholds, and run the classifier using the signatures from thetraining sites. Growing stock classes for the forested areas are: < 20 qm/ha, 20-50 qm/ha, 50-80qm/ha, >80 qm/ha. The method works quite stable for different ERS frames of the SIBERIAproject area and also different image product (GTC or GEC). This method proved the capabilitiesof the coherence model described above.
A COMPARISION OF SAR-INTERFEROMETRY- ANDCARTOGRAPHICALLY GENERATED DIGITAL ELEVATION
MODELS BY ERRORS, ACCURACIES AND EXTRACTEDHYDROGRAPHIC FEATURES
Schmullius Christiane
E-mail: [email protected] for Geography, Dept. of Geoinformatics and RemoteSensing,
Friedrich-Schiller-UniversityLöbdergraben 32
Telephone: 0049.(0)3641.948877Fax: 0049.(0)3641.948852
Co-author/s:Karsten Frotscher Institute for Geography, Dept. Of Geoinformations and Remote Sensing,Friedrich-Schiller-University, Löbdergraben 32, D-07743 Jena, GermanyTel. 0049.(0)3641.948877, Fax 948852, E-mail: [email protected]
ABSTRACT
Topographic data are critical to the accuracy of a variety of environmental computer models. Withrapidly changing technologies in the mapping industries, the quality of Digital Elevation Models(DEM) improved significant. Data from satellite altimetry (SAR Interferometry) as well as datafrom cartographic sources are compared. This study focuses on errors, accuracies and theextraction of hydrographic features from DEMs.
The SAR Interferometry- models are derived from JERS and ERS with fixed-length 50-meterpixels as well as from SRTM with resampled fixed-length 25-meter pixels. All three modelsrepresent different wavelengths and system geometries. The models from cartographic sourcesbase on maps at 1:200,000 (fixed-length 50-meter pixels) and 1:1,000,000 (GTOPO30, fixed-angle30 arcseconds pixels) scale. The testsites are situated on Lake Baikal, Russia, within theframework of the SIBERIA project. The DEM data contain errors of three types: blunders, whichare removed prior to entry in the data set; systematic errors, which follow some fixed system-specific pattern; and random errors, which are of random nature and are completely unpredictable.The horizontal and vertical discretization process generates artifical dams, pits and flats. Theselocal differences among DEM grid cells are analyzed to compute accurate slopes, flow directionsand other hydrographic parameters. The relative vertical accuracy, rather than the absoluteaccuracy, determines the quality of such parameters derived from local differencing computations.
The first phase of analysis focuses on the absolute and relative accuracy in horizontal and verticaldimensions of the DEM data. System-specific errors are described. The next step of calculatingflow grids, includes depression filling, indication of flow direction for each cell and computationof flow accumulation, a value equal to the total number of cells that drain to it. Strahler streamorders are used to measure structural complexity of the river networks and classifying the majorand minor tributaries for the different DEM's. The higher resoluted SRTM data also providesbetter identification of the heads of Strahler-first-order channels known as sources.

PINE FOREST UNDERSTOREY SENSING WITH ERS-2 SAR IMAGERY
Cadete Leonor
E-mail: [email protected] Nacional de Informaçao Geográfica (CNIG, Portugal)
Taguspark, Nucleo Central, 301Telephone: 00 351 21 4219800
Fax: 00 351 21 4219856
ABSTRACT
Remote sensing forest studies have mainly concentrated on the overstorey component, continuingto provide innovative approaches, particularly for the quantitative estimation of forest parameters.However, the understorey stratum has not yet received a deserved attention within thistechnological domain.
On one hand, the understorey has a relevant role both in the structure and functioning of forests,e.g. by being an important layer for wildlife habitats, limiting erosion hazards or providing fuel forfires. On the other hand, the inherent advantages of remote sensing tools can provide new inputsfor its monitoring and characterisation, and should be further explored.
Though few, some recent contributions in the optical field have already selected this subject asstudy object and provided interesting results. However, SAR imagery has remained outside thesatellite data choices. A priori, limitation and risks can be highlighted when approaching the use ofspaceborne SAR data to understorey studies, but this type of imagery can be sensitive to this forestcomponent, under certain circumstances. The known advantages presented by radar images whencompared to optical data - independent of solar light, cloud cover or hazy atmospheric conditions,and increased penetration capabilities - have justified the start of a pathfinder project dedicated tothis issue.
The objective of the present document is to explain the strategy followed to dig in the analysis ofthe understorey forest stratum based on ERS-2 SAR imagery and present the results achieved sofar. Maritime pine (Pinus pinaster, Aiton) stands located in central Portugal were used as test areasand ground truth data was obtained through other research projects (Institutional collaboration andsynergy).
USING L-BAND POLARIMETRIC INTERFEROMETRIC DATA TORETRIEVE ESTIMATES OF FOREST BIOMASS DENSITY
Skinner Laine
E-mail: [email protected] of Geography, University of Wales: Swansea
Singleton Park,Telephone: 01792252252
Fax: 01792252254
Co-author/s:Luckman, Department of Geography, University of Wales: Swansea, Swansea, SA2 8PP.E-mail: [email protected]. H. Balzter, Institute of Terrestrial Ecology, Monks Wood, AbbotsRipton, Huntingdon, Cambridge, PE17 2LS. Tel. +44(0) 1487 773381,E-mail: [email protected]
ABSTRACT
Previous use of SAR to retrieve specific forest characteristics has been limited by saturation of thebackscatter over densely forested areas. The backscatter is also affected by the structure of theforest canopy making mixed forests especially difficult to characterize. A number of currentairborne, as well as the next generation spaceborne sensors, hope to extend these limits using fullypolarimetric L-band sensors. This will allow retrievals of forest parameters up to greater densitiesand additionally permit an interpretation of the scattering mechanisms through polarimetricanalysis. Another source of information will be provided by interfering different polarimetriccombinations, where repeat pass systems acquire suitable data, and generating coherence imagesover the forested areas.
This paper presents a preliminary analysis of two L-band polarimetric data sets from forest sites.The first consists of data from the SIR-C mission (Oct 1994) over Duke Forest, N. Carolina, USAand the second of L-Band polarimetric interferometric (PolInSAR) data from the BNSC SHAC(SAR and Hyper-spectral) airborne mission over Thetford Forest, East Anglia, UK. A Landsat TMimage covering Duke Forest, ground DEM and forest database of Thetford Forest were acquiredfor ground truth. Each PolInSAR image was co-registered and geocoded to the ground database.Specific scattering combinations (HH, HV and VV) were derived from the full scattering matrixand used to derive coherence images between each polarization pair (HH+HH, HV+HV andVV+VV).
Polarimetric decomposition using the Freeman - Durden model shows volume scatter to be thedominant form of scattering over dense forest (typically > 50 t/ha). Single bounce interactionsappear to become less significant as biomass density increases. Coherence over the forested areasremains relatively high even over high biomass density stands and the greatest dynamic range wasobserved in the HV+HV case where the majority of the scattering events occur as volume scatterwithin the forest canopy. Classification results were increased in both the number of classes andaccuracy of class determination using the combined polarimetric and interferometric data.Therefore, by using all the information available from a typical SAR image, that is the backscatter,at different polarizations and phase coherence, we can greatly increase the accuracy of theclassification results over higher biomass density forests.
PROCESSING AND INTEGRATION OF MULTISENSOR ANDMULTIDATE SATELLITE DATA FOR FOREST MANAGEMENT
MAPPING IN GABON (APPLICATION TO THE FIRST FOREST ZONE)
Nziengui Marcellin
E-mail: [email protected]ère des Eaux et Forêts, Gabon
Ministère des Eaux et ForêtsLaboratoire de GéomatiqueForestièreDIARF Libreville Gabon
Telephone: 00 241 72 23 34Fax: 00 241 76 10 73
Co-author/s:Jean Paul Rudant Université de Marne La Vallée, Institut Francilien des GéomatériauxTel: 00 33 0 (1) 49 32 90 71, Fax: 00 33 0 (1) 49 32 91 37, E-mail : [email protected]é Trébossen Université de Marne La Vallée, Institut Francilien des GéomatériauxTel: 00 33 0 (1) 49 32 90 71, Fax: 00 33 0 (1) 49 32 91 37, E-mail: [email protected] Mougin Centre d'Etudes Spatiales de la BIOsphère CNRS/UPS18, Avenue E. Belin,BPI 2801, 31401 Toulouse Cedex, Tel: 00 33 0 5 61 55 85 19, Fax: 00 33 5 61 55 85 00,E-mail: [email protected] Danny Lo Seen Laboratoire GEOTROP/CIRAD-AMIS, Maisonde la Télédétection500, Rue Jean François BRETON, 34093 Montpellier Cedex 05 France, Tel: 0033 0 4 67 54 87 37 Fax: 00 33 0 4 67 54 87 00, E-mail: [email protected]
ABSTRACTThe Central African region hosts the world's second largest tropical forest, which constitute asource of wealth: biological, ecological, as well as economic, for the different countries of theregion. Given that it is almost impossible to obtain a recent and cloud-free coverage of the regionwith optical images, and that it is difficult to perform an aerial survey with reasonable delay andcost, radar satellites with their all-weather capabilities has appeared as an interesting source of datato be explored when carrying out thematic mapping. Mapping for forest management has longbeen carried out using aerial photographs. Satellite images have been used mainly as acomplement, like to give an overall view of the study area or to solve some of the geometricproblems of map projections. The limits of these data, however, have not been thoroughlyexplored. The subject of our work is therefore the assessment of the potential of optical and radarsatellite images for forest mapping and management, with the objective of evaluating thecontribution of multisensor and multidate images in the context of tropical forest mapping. Thestudy is based on data provided by operational satellites (ERS 1 and 2, RADARSAT, SPOT,Landsat) which will be used in preparation of future satellite data such as those of ENVISAT. Themethodology used is based on the comparison of manual and automatic approaches. On three testsites, computer-aided photointerpretation, as well as supervised and unsupervised numericalclassification have been carried out in order to extract thematic information. GIS tools were thenused to perform integration of results with existing vegetation maps so as to assess the processingmade. The results show that both approaches give good results when the data include opticalimages. Also, the manual approach seems well suited in presence of radar images whose specklenoise, even when kept to a minimum is still a handicap. The work will then be focused on thesegmentation and classification methods applied to multisource data and on the contribution ofradar interferometry data for the caracterization of foret cover. Images provided by:Projet OIBTPD 8/95 Rev.1 (F). Stratification, cartographie et inventaire multi-sourcesen vue de l'aménagementde la première zone forestière du Gabon, phase 1 ;Projet Forêts et Environnement au Gabon (surfinancement banque mondiale)Projet ENVISAT ID 539 (demande d'images ERSinterférométriques en cours).
USEFULNESS OF ERS COHERENCE TIME SERIES FORMONITORING THE VEGETATION CYCLE OF A MIXED TEMPERATE
FOREST
PROISY CHRISTOPHE
E-mail: [email protected] d'Etudes Spatiales de la BIOsphère
18, avenue E. Belin, BPI 2801Telephone: 0033561558519
Fax: 0033561558500
Co-author/s:(1)Proisy, C., (1)Mougin, E., (1)0Lopes, A., (2)Borderies, P., (2)Ruiz, C., (2)Chênerie I., (3)SartiF., (4)Dufrêne, E., (4)LeDantec, V.(1)Centre d'Etudes Spatiales de la BIOsphère, CNES/CNRS/UPS BPI 2801, 18 avenue E. Belin,31401 Toulouse Cedex 4, France. E-mail: [email protected], Telephone: 33.5.61.55.85.19,Fax: 33.5.61.55.85.00(2) Département d'Electromagnétisme et Radar, ONERA/CERT avenue E. Belin, B.P. 4025,31055 Toulouse Cedex, France.(3) Centre National d'Etudes Spatiales, CNES/DSO/OT/QTIS/SR B.P.I. 811, 18 avenue E. Belin,31401 Toulouse Cedex 4, France.(4) Laboratoire d'Ecologie Végétale, Université de Paris XI, Bat. 362, 91405 Orsay Cedex, France.
ABSTRACT
Within the frame of the EMAC campaign, numerous spaceborne remote sensing data includingERS-1/2 intensity images and ERS Tandem couples have been collected over the Fontainebleauforest during the period 1994-1997. The seasonal dynamics of this mixed deciduous forest hasbeen studied using backscattering coefficients time series but no indication on the leafy period wasretrieved. This study aims to investigate the capability of INSAR time series for detecting thevegetation cycle of a deciduous forest.
Prior to the analysis, a normalization process has to be implemented in order to compare absolutevalues of degrees of coherence computed in different acquisition conditions. Using theinterferometric software Diapason developed at CNES, we processed 11 ERS tandem couples,acquired over the period of August 95 to July 1996.
The temporal variation of the degree of coherence versus foliage biomass is analyzed for a beechstand during the 1996 vegetation cycle. The interferometric profile is also compared to the s°profile. With the assistance of a coherent model, the seasonal variations of the degree of coherenceare simulated and finally interpreted.
MAPPING CHINA FOREST WITH ERS SAR TANDEM DATA
Franck Ranera
E-mail: [email protected]
Via Galileo GalileiTelephone: 06 941 80 627
Fax: 00
Co-author/s:L. Zengyuan(1), C. Erxue(1), F. Ranera(2), B. Rosich(2), F. M. Seifert(2)(1)Chinese Academy of Forestry Institute or Forest Resources Information Technique Wan ShouShan Hou, Beijing, China E-mail: [email protected](2) Earth Observation Application Department ESA/ESRIN Via Galileo Galilei, Frascati, ItalyE-mail: [email protected]
ABSTRACT
The need to monitor forest is dramatically increasing in china, particularly after the introduction ofnew laws against deforestation. The well known potential of ERS SAR to distinguish forest fromnon forest areas and the interest of the Chinese authorities to perform forest monitoring based onremote sensing data have motivated the co-operation between ESA and the China Ministry ofScience and Technology (MOST) in this area. This interest found its expression in theMACFERST project, where the Chinese Institute of Forestry and ESRIN work jointly to generatea forest cover map over China. To generate this forest cover map of the whole Chinese territory,ERS SAR Interferometric Land Use images (ILU) at a quick look level are used. The project issplit in four phases, each one covering a quarter of China, starting with the North-Easternprovinces. Considering the size of the area to be covered, the use of medium resolution imagesbecomes mandatory to achieve the result in a reasonable time. The generation of a global largescale forest map requires solving problems such as the mosaicking of coherence from differentInSAR pairs in overlapping areas and the adaptation of the classification algorithm as a function ofthe climatic zones. This paper presents the work carried out from the identification of the mostadequate ERS SAR images to the selection of appropriated classification algorithms, including thestrategy adopted to resolve problems related to seasonal and geographical differences affecting theradar backscattering.
FIRE DAMAGE ASSESSMENT USING ERS-SAR AND NOAA-AVHRRDATA IN EASTKALIMANTAN, INDONESIA
SUGARDIMAN RUANDHA AGUNG
E-mail: [email protected] of Environmental Sciences Wageningen University,
The NetherlandsWater Resources Nieuwe Kanaal 11
Telephone: 00 31 317 483576Fax: 00 31 317 484885
ABSTRACT
This study is to examine the application of remote sensing (using ERS.SAR.PRI images andNOAA-AVHRR data) and geographic information system for fire damage assessment and toevaluate the accuracy for this study. Eleven ERS.SAR.PRI images and a set of NOAA-AVHRRdata, dated just before, during and just after the fire event of 1997/1998 have been used. The studyarea was located in East Kalimantan, Indonesia near to Tropenbos research station, the Wanariset -Samboja. Extensive fieldcheck was also conducted to collect field information about landcover,landuse, fire damage and when the fire was happening
Adaptive filtering by Gamma Filter and multi-temporal Segmentation were the main techniqueapplied dealing with the reduction of speckle. The maximum likelihood algorithm was used forsupervised classification in ENVI (The Environment for Visualising Images). Error matrices,KAPPA analyses were the method applied in accuracy assessment. ERS-Segmentation gave betterresult than ERS-Filtered, with an overall accuracy of around 82 0.000000 or Error Matrix andaround 79 - 861467222101823183176651990175739721995365123368009015874426855603416093790270296162359665339710773576983495208086783138465055671392781196033436612576358558325805341545750017173720169576158933787223054953602909693515001061441536.000000 or Kappa analysis. Fire damage map was the final result of this study,which visualises the distribution of burnt areas and their extents/ areas.
Further research is needed to improve the methodology to obtain more accurate results as apractical and applicable methodology for fire damage monitoring.
ERS COHERENCE AND SLC IMAGES IN FORESTCHARACTERISATION
Manninen Terhikki
E-mail: [email protected] Automation, Remote Sensing
P.O. Box 13002Telephone: 358-9-456 6285
Fax: 358-9-456 6475
Co-author/s:Parmes, E., Häme, T., Sephton, A., VTT Automation, Remote Sensing, P.O. Box, 13002,FIN-02044 VTT, E-mail: [email protected], E-mail: [email protected],E-mail: [email protected], Tel. +358-9-4561, Fax: +358-9-4566475Bach, H., Vista, Luisenstr.45, 80333 München Tel: +49-89-52389802, Fax: +49-89-52389804 andBorgeaud, M. European Space Agency, ESTEC-TOS-EEP, Postbus 299, 2200 AG Noordwijk,The Netherlands, E-mail: [email protected], Tel: +31 71 565 4830, Fax: +31 71 565 4999
ABSTRACT
The coherence of an ERS-1/ERS-2 tandem pair of winter conditions in Finland was studied.Relationships between the coherence and various boreal forest parameters were derived on thebasis of standwise (partly pointwise) ground measurements of roughly 1000 stands. The resultswere compared with a similar study carried out in Sweden (Fransson et al., 1999) using acoherence pair of the same days. Although the stand structure in the Finnish test site is moreheterogeneous the results support clearly the results obtained in Sweden: many forest parameters(diameter, height, stem volume, age) are correlated with the coherence. The shape of thedependence does not markedly change if only the 159 stands larger than 5 ha or the 417 standslarger than 2 ha are taken into account. Small stands were excluded because of possiblegeolocation errors and the large percentage of border areas, where the forest is systematicallydifferent from the bulk forest. The detection of clear cuttings was studied both using coherenceimages and multitemporal ERS SLC images. The ground truth for the clear cuttings was an opticalmosaic with a pixel size of 1 m. Clear cuttings of various ages were easily identified in thecoherence image. In the ERS SLC-images it was not trivial to distinguish all the clear cuttings,although some of them could be found. One reason is that many of the clear cuttings are in areas ofquite rough topography with rocks and cobble deposit. Another reason is that after the treeremoval many of the clear cuttings have been tilled with quite a wide spacing. In the opticalmosaic, stripes with a spacing of about 5 m are visible in some clear cuttings. So in many casesthere was a natural cause to cancel out the decrease of backscattering due to the clearance of trees.
FIRE IMPACT ASSESSMENT IN INDONESIAN RAINFORESTS WITHERS AND JERS SAR DATA
Siegert Florian
E-mail: [email protected]. Biology Ludwig-Maximilians-University
Luisenstr. 4Telephone: 0049-89-5902469
Fax: 0049-89-5902450
Co-author/s:Mikiyasu Nakayama United Graduate School of Agricultural Science Tokyo University ofAgriculture and Technology 3-5-8 Saiwai-cho, Fuchuu-city, Tokyo 183-8509, Japan,Tel: 0081-42-367-5667 Fax: 0081-42-360-7167 E-mail: [email protected]
ABSTRACT
During the large El-Nino petiod in 1997 to 1998, Indonesia has experienced one of the greatest firedisaster ever observed in a tropical rainforest environment. Following this event ESA and NASDAdecided to set up a cooperation project to compare and combine the capabilities of the two SARsatellite sensors systems ERS-1/2 and JERS-1 aiming at an in depth analysis of this disaster.
It was investigated whether these SAR systems can provide high resolution data on the pre-firevegetation cover, the extent of the fire affected area and the damage to the vegetation. Differentprocessing techniques were applied: 1.) Monotemporal approach deploying texture analysis toidentify different vegetation types. 2.) Multitemporal ERS and JERS SAR images were producedfrom images acquired before and after the fire event. 3.) ERS SAR coherence images wereproduced from ERS-1 and ERS-2 tandem data. The results of the evaluation were quantitativelycompared to a Landsat TM scene acquired during the fires, NOAA-AVHRR hotspot data andextensive field and aerial surveys.
Similar vegetation types were identified in ERS and JERS pre-fire images based on the structure ofthe forest canopy and moisture content of the leaves. Six classes could be discriminated, there wasno synergy between ERS and JERS in this area. Burnt scar detection was based on changes inSAR backscatter when fire had affected vegetation. Burnt scars could be identified with highaccuracy in multitemporal SAR images acquired during dry weather, a condition which prevailedduring the fires. Furthermore it was possible to estimate the amount of dead, uncombusted biomassthus providing important information on greenhouse gas emission and future fire risk.
Meteorological conditions strongly influenced radar backscatter. An evaluation of orbits acquiredduring rainy conditions showed that it was difficult to discriminate burnt from unburnt areas inboth ERS and JERS images. Similar problems occurred with Interferometric Land Use (ILU)images produced from ERS-1/2 tandem orbits. Forest/non-forest discrimination became unreliablein ILU images acquired during rainy conditions.
UTILIZATION OF RADAR REMOTE SENSING AND TEXTUREANALYSIS FOR URBAN CARTOGRAPHY IN CAMEROON:
APPLICATION TO YAOUNDÉ CITY
Alain Akono
E-mail: [email protected] LAVAL,Centre de recherche en geomatique
Universite LAVAL, Centre de recherche en geomatique,Pavillon CasaultTelephone: 0014186565491
Fax: 0014186563607
Co-author/s:Geoffrey Edwards, Emmanuel Tonye , Jean-Paul Rudant
ABSTRACT
The goal of this study is to produce a recent cartography of the city of Yaounde in Cameroon, byusing a SAR ERS-2 image acquired in 1999. The Yaounde City is growing fast and the urbancommunity is interested in acquiring recent maps. The actual maps are too old and the means toget new ones are very expensive. Radar remote sensing is a very useful technique allowing toproduce recent maps with little time delay. Another advantage granted by radar imagery is that, inthis particular area clouds are frequently planning above the sky, making acquisition of imagesvery difficult with the optical sensors. Some studies have already been done with radar remotesensing images in Cameroon, particularly in the area of coastal zones mapping. We are nowinterested in producing maps in some particular urban areas. We started with the area of Kribi, andthe study was presented at the last ESA symposium in Liege. We now focus our attention to thecity of Yaounde. Many parameters and methods of texture analysis are used here to reach our goal.Texture features issued from the gray level co-occurrence matrix are used, as well as those issuedfrom the run length gray level method. A rigorous selection of the parameters has been done by thesequential progressive and regressive selection method, in order to determine the parametersgranting the best rate of textural classification. The norms of Chernoff and Battacharya, and thetransformed divergence are conjointly used to evaluate the classes distinction. The multiplicity oftexture features and parameters selection methods allow a best choice, and results to a cartographyvery close to the ground truth.
QUANTITATIVE ANALYSIS OF TEMPORAL ESR INSAR DATA OVERTHE CITY OF GRAZ
Kenyi Lado-Wani
E-mail: [email protected] Research, Institute of Digital Image Processing
Wastiangasee 6Telephone: 0043 316 876 1715
Fax: 0043 316 876 1720
ABSTRACT
Results of a quantitative analysis of temporal SAR interferometric (InSAR) derived products,namely digital terrain models (DTM), correlation, and amplitude images for cartographic andthematic mapping of the area around the city of Graz in Austria are presented.
ERS-1/2 single look complex (SLC) image data sets acquired over the period August 1995 to May1999 were compiled and interferometrically processed. The InSAR generated DTMs and thecontour lines digitised reference DTM were converted to interferograms in the ERS slant rangegeometry and compared to the original interferograms. Differences between the original andsimulated interferograms were observed, which were attributed to erroneous phase unwrappingand forest heights.
The fusion of the temporal DTMs and the error maps resulted in a detailed high quality DTM withrms. of about 8 m. The comparison of the high quality DTM with the reference one enabled theestimation of heights of some spatially large urban features such as the Graz Airport and somefactory buildings.
In addition, the temporal correlation and amplitude images were fused in the RGB colour codingand the seasonal changes were observed. Forested area, urban targets, water bodies, agricultural,and stable fields were clearly detectable between the images acquired in May and August. It wasalso observed that some shadow areas were of high coherency and classify as stable fields;whereas, overlay regions classify as forest. The results of the RGB image composite agrees with areference thematic map of the area generated from Landsat TM data.
STATISTICAL ANALYSIS AND NEURO-FUZZY CLASSIFICATION OFPOLARIMETRIC SAR IMAGES OF URBAN AREAS
Gamba Paolo
E-mail: [email protected] of Electronics, University of Pavia
Via Ferrata, 1Telephone: 0039-0382-505781
Fax: 0039-0382-422583
Co-author/s:E. Costamagna(1), P. Lombardo(2), G. Chinino(2)(1)Dipartimento di Elettronica Università di Pavia, Via Ferrata, 1, I-27100 Pavia, ItalyFax: +39-0382-422583 Tel: +39-0382-505923 E-mail: [email protected](2) Dipartimento INFOCOM Università di Roma "La Sapienza", Via Eudossiana, 18, I-00184Roma, Italy, Fax: +39-06-4873300, Tel: +39-06-44585472, E-mail: [email protected]
ABSTRACT
The use of radar sensors to analyze urban environments has been already widely established intechnical literature, even if it is somehow limited by the coarse ground resolution and the limitedinformation contained in single channel images with a fixed off-nadir angle available fromcommercial satellite sensors. For instance, ERS data have been considered to individuate built-upareas or to describe urbanized texture patterns, but no attempt has been made to provideinformation about more precise environments, without considering at the same time data comingfrom multispetral/hyperspectral sen-sors. This paper describes first a detailed statistical analysis ofSAR images of urban areas, which aims at investigating the impact of the different polarimetricchannels and the different incidence angles on the probability density function (PDF) of the back-scattered intensity. This analysis is be the basis for optimised segmentation and classification ofENVISAT SAR images that fully exploits the statistic of the data. In preparation for the ENVISATdata, a set of SIR-C/X-SAR images of Pavia (Italy) is considered. A number of different areas areidentified inside Pavia, which are of potential interest for automatic classification and monitoring.Their PDF and the charts of their moments are separately characterised as functions ofpolarimetric channels and angles of incidence, and compared. Moreover, the correlation betweenthe different images of each area is studied. This allows us to devise few optimised discriminantsto classify the considered areas with statistical methods. Preliminary results of this classificationare shown and compared to the classifications obtained with a neural and/or fuzzy approach of thesame data set. To this aim, a Fuzzy C-Means approach or a fuzzy ARTMAP spectral/spatialclassification tools have been developed and used. Since these algorithms are suitable to jointlyconsider data coming from different sensors, we compare the results also with classificationsobtained considering aerial photographs (suitably spatially degraded) of the same area.
USE OF MULTITEMPORAL ERS DATA FOR MONITORING OFLANDCOVER CHANGE IN SAHELIAN REGIONS. THE EXEMPLE OF
THE DELTA OF THE NIGER RIVER (MALI)
Mering Catherine
E-mail: [email protected]é Paris 7 Denis Diderot
UFR GHSS case courrier 7001 2 Place Jussieu75251 Paris Cedex 05Telephone: 33 (1) 44 27 76 69
Fax: 33 (1) 44 27 76 69
Co-author/s:Claplovics Elmar, Hess Siegried, Poncet Yveline
ABSTRACT
In the Sahelian zone, changes of land cover may not be considered only as a consequence of interseasonal change. Global climatic changes and mainly the decrease of pluviometry between the 70and the 90 must also be taken into account to explain annual changes. In the inland delta of theNiger, changes in the land cover is due to pre-flood and post flood hydrological conditions of theNiger and its tributaries. In order to observe with accuracy annual changes as well as seasonal one,we have selected a set of ERS images in the region of Mopti, taken in the pre-flood and post floodperiods between 1995 and 1996. We first have reduced the speckle on ERS images by means ofappropriate connected filters in order to use edge and region detection for change mapping.Actually, we had two kind of objectives, that is, on one hand to map some invariant patterns andon the other hand to detect changes in the landscape. For a given season, we may consider thatland patters such as ridges or plateaus are invariant structures. These structures are detected bymeans of edge detection methods, applied to multidate data for a given season. Change detectionbetween dry and wet season are then analysed by combining region extraction, obtained with a flatzone approach, with colour making images by RGB techniques from both dates. On the resultingimages, major variations in the back scattering of landscape units will appear as coloured flatzones: major decrease of backscatter appears in magenta as major increasing appears in green.With the help of ground truth and aerial photographs of some well-known areas, the colouredzones are interpreted whether as flood, whether as change in the vegetation cover. The sameproceeding is then used to detect annual changes from images of different years and of the sameseason. The results are then superimposed on corresponding maps of the hydrographical networkobtained by edge extraction.
HISTORICAL LAND TRANSFORMATION ANALYSIS FORGEOGRAPHIC HAZARD EVALUATION IN THE ITALIAN COUNTRY
Aversa Mario
E-mail: [email protected] Presidence of Minister Council Department of Technical Services
Hydrological and Oceanographic ServiceVia Curtatone, 3
Telephone: 0039644442628Fax: 003964957947
ABSTRACT
Examples of historical analyses referred to the Italian country are presented. Satellite imagines(ERS 1-2) are correlated with significant morphologic features. Archeological areas, historicalland use, hydrological and geological (sismic and volcanic) evidences are analysed. Particularcases of ancient latium (Roman area) are reported: Aniene valley and Ardea coast. In the Anienevalley the verify historical information are demonstration in the evidence.
ON THE USE OF ERS INSAR AND MULTITEMPORAL DATA FORECOLOGICAL MONITORING OF THE CHERNOBYL AREA
Zakharov Alexander
Email: [email protected] of Radioengineering and Electronics, RAS
Vvedensky square, 1Telephone: 007-095-5269047
Fax: 007-095-7029572
Co-author/s:Irina L. Kucheryavenkova, Victor P. Sinilo, Mark V. Sorochinsky
ABSTRACT
Study of the ecological situation in the area of prohibited access around the Chernobyl nuclearpower plant with a use of ERS SAR in our AO3-246 project is concentrated on the monitoring ofthe coniferous Forests State - the most sensitive component of the vegetation covers to theradioactive pollution. For our analysis we have selected a series of ERS SAR archival data for thetime interval of 1992-1996, obtained at different meteorological conditions and in differentseasons of the year. Among the data used in the study are set of 16 ERS PRI scenes and ERSINSAR SLCI pair from a tandem mission. The combination of ERS resulted in multitemporalmaps, coherence and DEM for the area of study - the 30 km area around the nuclear power station.The multitemporal maps mentioned above allowed us to classify the next types of the surfaces -deciduous and coniferous forests located on the regular and over moistened soils, open areas withvarious extent of small-scale roughness and moisture, the area of dry forest on the western trace ofnuclear fallout happened in the year 1986 and vast areas of forest fires on the border of the area ofprohibited access occured during the period 1986-1992. The ERS INSAR coherence and DEMdata allowed to improve classification based on the level of coherence and the altitude of thescattering layers. The use of ERS data in a form of mulritemporal images and INSAR coherencedemonstrated applicability of C-band SAR data for forest studies.

AN INVERSION MODEL OF ERS2 RADAR DATA TO RETRIEVE WILDVEGETATION COVER IN SEMI-ARID REGIONS
Zribi Mehrez
E-mail: [email protected]/CNRS
10-12 avenue de l'EuropeTelephone: 0033 1 39254823
Fax: 0033 1 39254778
Co-author/s:M. Zribi1, S. Le Hégarat-Mascle, V. Ciarletti1, O. Taconet1, D. Vidal-Madjar1
ABSTRACT
During the last years, a large number of studies have been achieved to protect water resources andto study erosion in semi-arid regions in particular in the North of Africa. The new physically basedmodels incorporate Geophysical Information System. This incorporation facilitates applications inlarge catchments and allows remotely sensed to be used. A considerable effort has been devoted tostudy the sensitivity of radar response over natural surfaces in agricultural sites. For hydrologyapplications, studies have been focused in particular to retrieve soil moisture and roughnessindispensable to describe the hydrological cycle of water. Many other works have been interestedin the characterisation of vegetation cover. These models have been often used for agricultural wetwatersheds. Our objective, in this study, is to go more in the description of the radar potential tocharacterise this type of regions and particularly wild vegetation cover. During 1998-1999, a largenumber of ERS2 images has been taken over Kairouan site in the center of Tunisia. The climate issemi-arid with a run fall between 150 and 350 mm per year. In plain, there is a vegetation typeadapted to weak precipitation with a dispersed wild and short vegetation over a very smoothsurface. A model is proposed in this paper to retrieve the vegetation cover over soil surface fromradar signal for this semi-arid region. Vegetation in these regions is characterised by the presenceof clumps, which cover a part of soil surface. Our model described the relation between thiscovered percentage of surface and radar signal. Soil surface is taken from numerical verticalphotos of test fields in the studied site. From these photos, a classification is done to retrievevegetation percentage for each one. A high correlation is observed between backscatteringmeasure and vegetation percentage. This behaviour is studied for three dates for which moisture isthe same in all the site. They correspond to the end of summer and also to April. A model is thendeveloped to characterise theoretically the relation between vegetation cover and radar signal. Thecomparison between simulated radar signal and real radar data over different test fields shows avery good agreement. A classification is then done over the site to map the vegetation percentage.
BIOMASS MONITORING WITH SAR
Snoeij Paul
E-mail: [email protected] SpaceNewtonweg 1
Telephone: 071 5245589Fax: 071 5245835
Co-author/s:Paul Snoeij(1) and Peter van Oevelen(2)(1)Fokker Space B.V., P.O.Box 32070, 2303 DB Leiden, The Netherlands, Tel: +31/71/5245589,Fax: +31/71/5245835, E-mail: [email protected](2) Wageningen University, The Netherlands
ABSTRACT
By mapping the aboveground woody biomass in northern boreal forests and the distribution andaccumulation of secondary regenerating forests in the tropics, along with the vegetation in thesavannah, biomass measurements will provide insight into the size of the carbon sink. The carbonfluxes however are related to changes in the carbon sink and to green biomass activity andtherefore monitoring of vegetation changes and activity are needed. By monitoring the changes inabove ground woody biomass and estimation of total biomass and its temporal variability, such amission will contribute significantly to the understanding of the carbon cycle. Furthermorebiomass information is also very important to the economies of various countries both in thetropics and in boreal climates. Airborne measurements and in-situ ground campaigns cannotprovide a homogeneous and frequently updated data set on a global scale, which is collectedindependent of national interests. Radar backscatter measurements have proven to be positivelycorrelated with aboveground biomass and this correlation increases with the wavelength. Biomassretrieval algorithms have been developed for airborne P-band data collected over both boreal andtropical forests. Radar measurements are insensitive to cloud cover and can be operated during dayand night. Hence a spaceborne radar system, operating at low frequency, will permit themeasurement, mapping, and understanding of these parameters with a spatial and temporalresolution suitable for modelling ecosystem processes at regional, continental, and global scales.BioSAR will be a stand-alone mission such that its objective can be met without any additionaldata, but synergy is expected with using other radar and optical sensors. The main geophysicalparameters, which are estimated from the polarimetric radar backscatter measurements performedby this mission, are biomass, flooding condition, and land cover class. Based on experience withairborne campaigns, a polarimetric low frequency SAR has been shown to be the most appropriateinstrument to this purpose. The design philosophy behind a P-band spaceborne SAR is based onsmall size and low-cost, which should be achieved by using available space qualified hardwarecomponents. Also a (relative) small antenna is foreseen, for which an adequate performance willbe shown. By merging user and scientific requirements with technical constrains the scenario of aSAR instrument has been investigated. It operates as a normal side-looking synthetic apertureradar and images a 50-km swath positioned such that the incidence angle at mid swath is 23degrees, which also coincide with the ERS AMI SAR swath and the ASAR IS2 swath. This paperwill concentrate on the concept of the instrument, the SAR (antenna) design and the potentialapplications.
CONVERSION OF ATSR-2 SKIN SEA SURFACE TEMPERATURES TOBULK TEMPERATURE FOR USE IN CLIMATE STUDIES.
O'Carroll Anne
E-mail: [email protected] Met. Office
Satellite Applications NWP Division Room 334The Met.Office London Road
Telephone: 44 1344 854983Fax: 44 1344 854026
Co-author/s:Mr. B Candy, Institution: The Met. Office, Satellite Applications, London Road, Bracknell,Berkshire, RG12 2SZ, UK, E-mail: [email protected], Telephone: 0044 1344856876,Fax: 0044 1344854026. Dr. A R Harris, Satellite Applications, London Road, Bracknell,Berkshire, RG12 2SZ, UK, E-mail: [email protected], Telephone: 0044 1344854527,Fax: 0044 1344854026
ABSTRACT
The high accuracy and almost ten year time period of skin Sea Surface Temperatures retrievedfrom the Along Track Scanning Radiometer (ATSR) series of instruments make them usefulobservations for climate studies. However, the retrieved satellite skin observations need to beconverted to an observation of Bulk Sea Surface Temperature (SST) at a depth of around onemetre in order to be consistent with other SST observations used for climate studies such as fromships and buoys. The conversion of skin SST to bulk SST were processed using 3.5 years worth ofATSR-2 cloud-cleared skin SSTs (averaged at a resolution of 0.5 degrees), using a skin to bulktemperature algorithm developed at The Met. Office (UK). The algorithm is based on the physicalFairall model and covers all wind speed ranges. The near surface diurnal thermocline is alsomodelled with the aim of rejecting those observations thought to have a strong surfacethermocline. This poster presents the results from comparisons of bulk SST with climate datasetscontaining SSTs at 1 and 5 degrees resolution. The datasets are maintained by the Hadley Centre atThe Met. Office, and contain SST observations gathered from a combination of data including in-situ and Advanced Very High-Resolution Radiometer (AVHRR) observations. Additionally, weinvestigate the effect of the skin to bulk conversion and the final bulk product when different SSTretrieval schemes are used.
ATSR-SST IN ENCLOSED BASINS - A CASE STUDY IN THE BALTICSEA
Hakansson Bertil
E-mail: [email protected] Meteorological and Hydrological Institute
Folkborgsvagen 1Telephone: 0046114958385
Fax: 0046114958001
Co-author/s:MSc. Katinka Lindqvist
ABSTRACT
High resolution SST data from the ERS-1,2 ATSR instrument has been used to derive compositimages at weekly to monthly time-scales. The technique and results are presented from this AO-3project. Presently the data covers one year - 1997. The product is developed to meet the needs ofSST-users and in particular for prognostic models in oceanography and meteorology.
SEA SURFACE TEMPERATURE AND CHLOROPHYLL-ACORRELATION INDEX: SEASONAL VARIABILITY ON IBERIAN
MARGIN
Torres Palenzuela Jesús M.
E-mail: [email protected] de Vigo, Departamento de Física Aplicada Laboratorio de Teledetección y S.I.G
Universidad de Vigo, Facultad de Ciencias Lagoas Marcosende S/NTelephone: 34 986 812631
Fax: 34 986 812556
Co-author/s:Jesus M. Torres, Monica Miguel Lago, MªMar Sacau, Jaime Peón F.
ABSTRACT
The research objective is to find a correlation index between sea surface temperature andchlorophyll-a on the north-west of the Iberian Margin. The self-edge is characterised byclimatology driven intense seasonal upwelling between April and August along the entirecoastline, revealing also frequent alternations between upwelling events and relaxation periods.Surface water in upwelling regions reflects a chronological display, with newer water nearer theupwelling source becoming progressively modified with age as it moves away from the source.This modification occurs as a result of its exposure to light and the ensuing biological production.
Satellite-derived chlorophyll-a from SeaWiFS data, which will be provided by the Remote SensingGroup at Plymouth Marine Laboratory and will be compared with sea surface temperature fromAVHRR data processed by the Remote Sensing Laboratory at the University of Vigo, in functionto implement "the state of the art of upwelling understanding". There will be a strong positivecorrelation between sea surface temperature and satellite-derived chlorophyll-a. The studied datawill allow us to describe and quantify the key factors regulating primary production and the short-time-scale variability of this ecosystem during this important event and to develop presentalgorithms for red tides prediction. Tracking an upwelling event may prove possible with thehigher resolution of MERIS and development of algorithms that may be especially useful forharmful bloom species. ENVISAT technology involving new sensors is especially attractive as asampling tool and must be conducted to a better understood.
KEYWORDS: Iberian Margin, satellite-derived data (chlorophyll-a, SST), upwelling, primaryproduction.
BIBLIOGRAPHY: _Alvarez-Salgado, X. A., et al., (1993). Hydrographic variability off the RíasBaixas (NW Spain) during the upwelling season. Journal of geophysical research, vol. 98, n. C8,14447-14455. _ Bricaud, A., and D. Stramski, (1990). Spectral absorption coefficients of livingphytoplankton and non-algal biogenous matter: A comparison between the Peru upwelling areaand the Sargasso Sea. Limnol. Oceangr, 35 (3), 562-582. _ Denman, K. L., and M. R. Abbott,(1994). Time scales of pattern evolution from cross-spectrum analysis of advanced very high-resolution radiometer and coastal zone color scanner imagery. Journal of geophysical Research,vol. 99, n. C4, 7433-7442. _ Fraga, S., et al. (1988). Influence of Upwelling Relaxation onDinoflagellates and Shellfish Toxicity in Ría de Vigo, Spain. Est. Coast. Shelf Sci, 27:349-361. _Greeg, W. W., and R. H. Woodward, (1998). Improvements in Coverage Frequency of OceanColor: Combining data from SeaWiFS and MODIS. IEEE transactions on geo-science and remotesensing, vol. 36, n. 4, 1350-1353. _ Greeg, W. W., (1999). Initial analysis of ocean color data from
the ocean color and temperature scanner. I. Imagery analysis. Applied Optics, vol. 38, n. 3, 476-485. _ Hoepffener, N., et al., (1994). Use of an analytical model to determine the primaryproduction from satellite data in a coastal upwelling environment. Oceanologica acta, vol. 17, n. 4,431-442. _ Hoge, F. E., and R. N. Swift., (1993). The influence of chlorophyll pigment uponupwelling spectral radiances from the North Atlantic Ocean: an active-passive correlationspectroscopy study. Deep-Sea Research II, vol. 40, n. 1/2, 265-277. _ Lavender, S. J., and S. B.Groom, (1999). The SeaWiFS Automatic Data Processing System (SeaAPS). Int. J. RemoteSensing, vol. 20, n. 6, 1051-1056. _ Longhurst, A., et al. (1995). An estimate of global primaryproduction in the ocean from satellite radiometer data. Journal of Plankton Research, vol. 17, n. 6,1245-1271. _ McClain, C.R et al., (1986). Wind-Driven Upwelling in the Vicinity of CapeFinisterre, Spain. Journal of Geophysical Research, vol 91, n. C7, 8470-8486._ Miller, P., et al.,(1997). Panorama: A semi-automated AVHRR and CZCS system for observation of coastal andocean processes. 23rd Annual Conference and Exhibition of the Remote Sensing Society. Univ.Reading Sep97. 539-544. _ O'Reilly, J. E., et al., (1998); Ocean Color chlorophyll algorithms forSeaWiFS. Journal of geophysical Research, vol. 103, n C11, 24937-24953. _ Platt, T., and S.Sathyendranath, (1988). Oceanic primary production: Estimation by Remote sensing at local andregional scales. Science, vol. 241, 16131619. _ Sathyendranath, S., et al (1991). Estimation of newproduction in the ocean by compound remote sensing. Nature, vol. 353, 129-133. _ Ullman, D. S.,and P. C. Cornillon, (1999). Satellite-derived sea surface temperature fronts on the continentalshelf off the northeast U.S. coast. Journal of Geophysical Research, vol 104, n. C10, 23459-23478.CONTACTS: Ms. Mónica Miguel Lago & Dr. Jesús M. Torres Palenzuela Applied Physics Dept:Remote Sensing & G.I.S.Faculty of Science. Lagoas Marcosende 36200. University of Vigo,Spain, Telephone: (+34) 986 812631/17 Fax: (+34) 986 812556, E-mail, [email protected],E-mail: [email protected], E-mail: [email protected]
ACE: A NEW 30" GDEM INCORPORATING SATELLITE ALTIMETERDERIVED HEIGHTS
Berry Philippa
E-mail: [email protected] Montfort University
Geomatics Unit Faculty of Computing & EngineeringDe Montfort University, The Gateway
Telephone: +44 116 2577497Fax: +44 116 2541891
Co-author/s:Berry P.A.M., Pinnock R.A., Hilton R.D., Johnson C.P.D.
ABSTRACT
A new Global Digital Elevation Model has been generated at 30" resolution by combining the bestavailable ground truth with a unique global database of satellite altimeter derived heights. Thismodel, ACE (Altimeter Corrected Elevations) demonstrates radically improved spatial accuracyand resolution over large parts of the globe, in particular over Africa and South America. Theindependent altimeter based dataset, which contains over 100 million individual height estimates,has enabled the identification and correction of gross errors in individual ground truth datasets.Source data of low spatial resolution have been replaced with greatly improved altimeter generatedsurfaces. Additionally, the use of this satellite derived near-global dataset of very high verticalaccuracy, referenced to a single datum, has allowed the identification, measurement and correctionof the vertical offsets between adjacent tiles of DTED data, widely reported by users of previousmodels. The result is a model in which a significant proportion of the earth's land surface isrepresented by a completely new dataset: this is especially true of areas for which previous modelshave drawn on Digital Chart of the World. Adjoining ground based datasets of good quality havealso been adjusted for vertical and horizontal misplacement. The detailed assessment of datasetquality undertaken as part of the programme to create the ACE GDEM has allowed the inclusionof a unique additional information matrix: a data quality indicator is being constructed for everyland pixel of ACE, together with detailed source information. This will allow the user, for the firsttime, to make an informed judgement on expected performance of the ACE GDEM for the desiredapplication. The ACE GDEM is now in beta release, undergoing validation with selected end usersprior to full release at the end of this year.

ABSTRACTS BOOK - DEMOsOMMITTEES

CERSAT ACTIVITIES.................................................................................................................. 2
A VISUAL ARCHIVE SYSTEM OF SEA ICE PARAMETERS DERIVED FROMSYNERGISTIC ATSR, AVHRR, SSMI AND ERS-1 SAR DATA ............................................ 3
DESIGN OF THE NETHERLANDS SCIAMACHY DATA CENTER .................................... 4
ERS SAR VIEWS THE TROPICAL AND SUBTROPICAL OCEAN: A NEW WEBSITE... 5
ENVIVIEW: AN ENVISAT PRODUCT TOOL ......................................................................... 6
ABSTRACTS BOOK- DEMOs -
CERSAT ACTIVITIES
Harscoat Valerie
E-mail: [email protected] Département d'océanographie spatiale
BP 70Telephone: 00 33 2 98 22 44 13
Fax: 00 33 2 98 22 45 33
Co-author/s:Sylvie Pouliquen, IFREMER, [email protected] Jean-Francois Piolle, Ifremer,E-mail:[email protected]
ABSTRACT
Since 1991 CERSAT has been the French processing and archiving facility for the low bit rateprocessing of ERS1 and ERS2 radar altimeter and scatterometer. Since 1996 CERSAT hasextended its activities to other scatterometers (NSCAT, QUIKSCAT launched by NASA), and alsostarted providing the users with value added products such as the Mean WIND FIELD Atlas andthe SEA-ICE atlas derived from ERS and NSCAT scatterometers. These atlases are respectivelydistributed to 1800 and 200 laboratories.
In 1996 we also started collocation activities providing the users with collocated database betweenall the sensors archived at IFREMER (ERS 1 and ERS2 radar altimeter and scatterometers,NSCAT and Quikscat scatterometers, SSM/I Radiometer for F10/F11/F13/F14 and Topex). Thenews sensors should be rapidly integrated in the system after their launch On the stand CERSATwill present all these data, its WWW server, its collocation database, and the future developmentsfor the new sensors such as Envisat, SeaWinds, METOP.
A VISUAL ARCHIVE SYSTEM OF SEA ICE PARAMETERS DERIVEDFROM SYNERGISTIC ATSR, AVHRR, SSMI AND ERS-1 SAR DATA
Shokr Mohammed
E-mail: [email protected] Canada
4905 Dufferin St.Telephone: 1 416 739 4906
Fax: 1 416 739 4221
Co-author/s:Mr. Hao Le Flashback Imaging 15 Keefer Court, Thornhill, Ontario, Canada L4J 5Y4,Telephone: l: 1 905 738 3674, Fax: 1 905 738 6981
ABSTRACT
Layers of information derived from coincident and co-located data of Arctic sea ice, acquired fromdifferent sensors, are presented within a display and browsing system that has unique usersinteractive features. Sea ice surface parameters are calculated from the following sensors: (1)surface temperature from the IR channels of AVHRR and ATSR independently; (2) surface albedofrom the AVHRR visible channels, (3) thickness of thin ice (recently growing) from integration ofSSM/I and AVHRR, and (4) major ice types (thin, first-year, and multi-year) from ERS-2 SAR.All parameters along with the original observation parameters from each sensor are combined in avisual display system in which each parameter (or a group of observation parameters) is presentedas a layer of information. The entire information hierarchy can be displayed, browsed andanimated in a very fast manner. The data from all sensors are co-located using a technique thatdefines the contours of the footprint from a coarse-resolution sensor (such as SSMI or AVHRR orATSR) and overlays it on an image from a finer resolution sensor. These contours can also bedisplayed to examine the heterogeneity of ground cover within a footprint of a coarse-resolutioncell using the coincident samples from the corresponding fine-resolution cell. The thermal historyof Arctic sea ice in the study region will be presented. This approach allows the user to absorbhuge amount of imagery data in an intuitive way.
DESIGN OF THE NETHERLANDS SCIAMACHY DATA CENTER
Som de Cerff Wim
E-mail: [email protected] Netherlands Meteorological Institute (KNMI) Observation and Modelling Department,
Satellite Data DivisionP.O. Box 201
Telephone: 0031-30-2206871Fax: 0031-30-2210407
Co-author/s:S. Barlag(1), J.A. Beysens, R.M. van Hees(2), R.B.A. Koelemeijer(1), A.J.M. Piters, H.Schrijver(2), P. Stammes(1), P. Valks(1), J van de Vegte(1)(1)Royal Netherlands Meteorological Institute (KNMI) PO BOX 201, 3730 AE De Bilt,The Netherlands(2)Space Research Organisation Netherlands (SRON) Sorbonnelaan 2, 3584 CA Utrecht,The Netherlands URL: http://neonet.knmi.nl/
ABSTRACT
The primary goal of the Netherlands SCIAMACHY Data Center (NL-SCIA-DC) is to provide dataservices and processing facilities to Dutch users of SCIAMACHY data beyond those offered bythe ENVISAT ground segment and German D-PAC. The NL-SCIA-DC will offer data services forGOME and SCIAMACHY data. In the future more instrument data may be added to the datacenter. As the NL-SCIA-DC is a joint effort of KNMI and SRON, the data center will bedistributed over these two institutes.
The need for a NL-SCIA-DC came from the atmospheric researchers in the Netherlands whoneeded faster access and more flexibility in accessing and processing GOME data. Fromexperience in previous projects the need for close cooperation with the future users wasrecognized. Therefore the users do not only define the User Requirements, but also need to beactively involved in the development of the NL-SCIA-DC. The users got access to developmentversions of the data center, thus allowing them to evaluate their requirements and allowing newrequirements to be incorporated in the design. For these reasons it has been decided to apply anevolutionary life cycle approach for the development of the NL-SCIA-DC. The evolutionaryapproach consists of multiple waterfall cycles with an overlap in development. All documents andproject plans are made according the ESA PSS-05-lite standard.
While the described development was based on GOME data and data processing, it is intended tooperate these facilities from 2001 onward and continue the development with new data fromSCIAMACHY on ENVISAT.
Features: * Access the NL-SCIA-DC through the Internet at any place on any computer.* Interactive access to satellite data located at the NL-SCIA-DC. * Generic, dynamic and platformindependent GUI. * Three data selecting mechanisms:1. Catalogue search enables file level searchfor data. 2. Query search enables data selection on meta data parameters. 3. Browse search enablesa graphical entry to select data. * Downloading of selected data. * (Re) processing of selected data.* User settings are saved and used in the next session. * Distributed architecture not visible for theuser. * Facilities to test new data processors.
ERS SAR VIEWS THE TROPICAL AND SUBTROPICAL OCEAN: ANEW WEBSITE
Alpers Werner
E-mail: [email protected] of Oceanography, University of Hamburg
Troplowitzstr. 7 / IIITelephone: 49.40.42838 5432
Fax: 49.40.42838 5713
Co-author/s:Leonid Mitnik Pacific Oceanological Institute, FEB RAS, 43 Baltiyskaya St., Vladivostok 690041,Russia, Telephone: 7.4232.312.854 Fax: 7.4232.312.573E-mail: [email protected],Lim Hock Centre for Remote Imaging, Sensing and Processing, National University of SingaporeLower Kent Road, Singapore 119260, Telephone: 65.8743220, Fax: 65.7757717E-mail: [email protected] Shan Chen Center for Space and Remote Sensing Research, National Central University,Chung-Li, Taiwan, R.O.C. Telephone: 886.3422.7151, Ext.: 7617 Fax: 886.34255535E-mail: [email protected]
ABSTRACT
ERS SAR images acquired over mid-latitude ocean areas have been used quite extensively tostudy mesoscale phenomena in the ocean and in the marine atmospheric boundary layer, but not soin tropical and subtropical ocean areas. In order to improve this situation the European SpaceAgency (ESA) has funded a project to set up a website aimed at informing a broad readershipabout the potential of ERS SAR imagery for studying these phenomena also in low latitude oceanareas. We have searched the archives at ESA as well as at the Singapore and the Taiwan ERSground stations for ERS SAR images showing pronounced radar signatures of mesoscale oceanicand atmospheric phenomena like, e.g., oceanic internal waves, ocean current fronts, underwaterbottom topography, river plumes, oil pollution, atmospheric internal waves, coastal wind fields,atmospheric boundary layer rolls, and tropical rain cells. From these images we have selectedmore than 200 ERS SAR images and put them on the website. For most of them we have addedsupporting data like NOAA AVHRR images, SPOT images, bathymetric maps, or weather mapsand have added comments on how geophysical parameters can be extracted from them. In thepresentation, which requires an LCD projector, the most spectacular ERS SAR images togetherwith supporting data will be presented and their usefulness in scientific investigations will bepointed out.
ENVIVIEW: AN ENVISAT PRODUCT TOOL
Brooker Guy
E-mail: [email protected] Group Ltd
2, Falcon Way, Shire Park, Welwyn Garden CityTelephone: 0033 534 452571
Fax: 0033 534 452572
Co-author/s;G. Levrini (ESA)
ABSTRACT
The Envisat mission, to be launched next year, is the largest European remote-sensing missionever flown. It will deliver a very large number of data products from its 10 instruments. TheEnvisat products will use a specific data format, where each product is orbit based, binary encodedand contains several geophysical quantities in the same product file. With the aim of improvingand widening the access to the Envisat products, the European Space Agency is developing aproduct tool (called EnviView) which is characterised by the following main properties: it isplatform independent (developed in Java); it can access any Envisat product; it can display thecontent of any field in the product (image or graphs); it can be run in manual or batch mode; it candisplay the value of any field in any product along with its format definition and with its scientificdefinition; it includes the product handbook of all Envisat products. In addition, EnviView canconvert part or all of an Envisat product into a number of different formats, such as HDF. Userswho are already familiar with HDF products or that have already developed application softwarefor HDF products can use EnviView to bring the Envisat products directly into their workingenvironment. EnviView can also be used to allow immediate access to the Envisat products by allthose commercial software packages, which are able to read and manipulate HDF files.
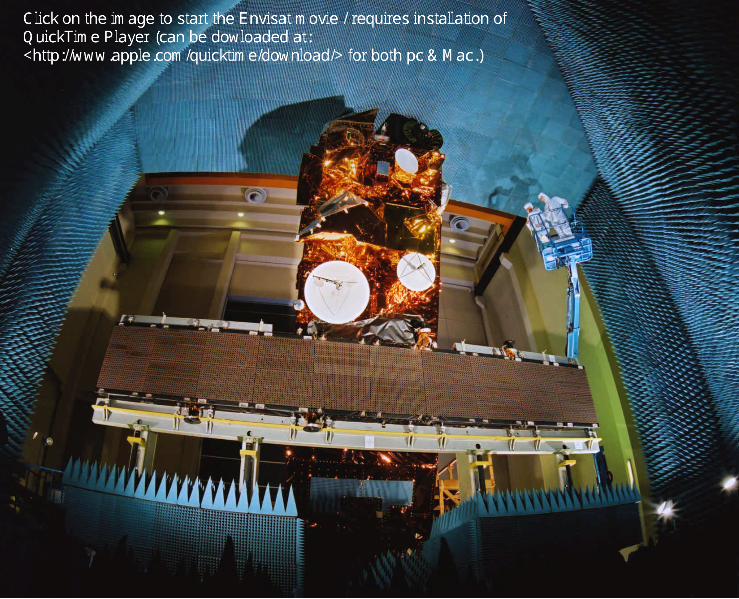

Final Papers:Links to the final papers are located on the Title of
the Presentation, organised by sessions as presented inGöteborg. See FINAL PAPERS – Table of Contentsbookmark.
If a link is not found, the paper has not beensubmitted. You can view the abstract under theAbstracts Book section, by doing a search function underthe session by title or speaker (Ctrl F). See ABSTRACTSbookmark.
Some PDF files have been created using Type 3 fonts,and therefore display poorly on screen. However, theprinting is not affected.
All files are text searchable, including by subject andauthors in the document properties.
Sessions Summaries:You may look up a session summary by title under
the individual bookmarks or with links in the Table ofContents – See Table of Contents – Summariesbookmark.
Notes from the Editor
Copyright © 2022 FDOKUMEN