A Network Perspective on Metabolic Inconsistency
13
Sonnenschein et al. BMC Systems Biology 2012, 6:41 http://www.biomedcentral.com/1752-0509/6/41 RESEARCH ARTICLE Open Access A network perspective on metabolic inconsistency Nikolaus Sonnenschein 1* , Jos ´ e Felipe Golib Dzib 2 , Annick Lesne 2,3 , Sebastian Eilebrecht 2,4 , Sheerazed Boulkroun 5 , Maria-Christina Zennaro 5,6 , Arndt Benecke 2,4 and Marc-Thorsten H ¨ utt 1 Abstract Background: Integrating gene expression profiles and metabolic pathways under different experimental conditions is essential for understanding the coherence of these two layers of cellular organization. The network character of metabolic systems can be instrumental in developing concepts of agreement between expression data and pathways. A network-driven interpretation of gene expression data has the potential of suggesting novel classifiers for pathological cellular states and of contributing to a general theoretical understanding of gene regulation. Results: Here, we analyze the coherence of gene expression patterns and a reconstruction of human metabolism, using consistency scores obtained from network and constraint-based analysis methods. We find a surprisingly strong correlation between the two measures, demonstrating that a substantial part of inconsistencies between metabolic processes and gene expression can be understood from a network perspective alone. Prompted by this finding, we investigate the topological context of the individual biochemical reactions responsible for the observed inconsistencies. On this basis, we are able to separate the differential contributions that bear physiological information about the system, from the unspecific contributions that unravel gaps in the metabolic reconstruction. We demonstrate the biological potential of our network-driven approach by analyzing transcriptome profiles of aldosterone producing adenomas that have been obtained from a cohort of Primary Aldosteronism patients. We unravel systematics in the data that could not have been resolved by conventional microarray data analysis. In particular, we discover two distinct metabolic states in the adenoma expression patterns. Conclusions: The methodology presented here can help understand metabolic inconsistencies from a network perspective. It thus serves as a mediator between the topology of metabolic systems and their dynamical function. Finally, we demonstrate how physiologically relevant insights into the structure and dynamics of metabolic networks can be obtained using this novel approach. Background Genomic knowledge allows compiling an inventory of an organism’s enzymes and thus the subsequent reconstruc- tion [1] and simulation of its metabolic system [2] using constraint-based modeling (CBM) techniques [3]. Com- pensating the lack of detailed information on the systems parameters, e.g., enzyme kinetics, gene regulation etc., CBM has proven to be a valuable tool for genome-scale system analysis. For example, flux balance analysis (FBA) *Correspondence: [email protected] 1 School of Engineering and Science, Jacobs University Bremen, Campus Ring 1, 28759 Bremen, Germany Full list of author information is available at the end of the article [4] has been used to predict with high accuracy the lethal- ity of gene deletions in unicellular organisms by taking only the metabolic system’s stoichiometry, the assump- tion of optimal growth (implicit gene regulation), and a specified growth medium into account (see e.g. [5], for a study involving Escherichia coli or [6], for a study involving Saccharomyces cerevisiae). Duarte et al. [7], published a genome-scale represen- tation of human metabolism based on genomic, bibli- ographic, and biochemical information. In contrast to metabolic representations of unicellular organisms, the following caveats play a role in the modeling of multi- cellular reconstructions, in general, and in particular for the human system [8]: (i) it is difficult to define environ- mental conditions for a multicellular system, (ii) usually © 2012 Sonnenschein et al.; licensee BioMed Central Ltd. This is an Open Access article distributed under the terms of the Creative Commons Attribution License (http://creativecommons.org/licenses/by/2.0), which permits unrestricted use, distribution, and reproduction in any medium, provided the original work is properly cited.
-
Upload
independent -
Category
Documents
-
view
8 -
download
0
Transcript of A Network Perspective on Metabolic Inconsistency

Sonnenschein et al. BMC Systems Biology 2012, 6:41http://www.biomedcentral.com/1752-0509/6/41
RESEARCH ARTICLE Open Access
A network perspective on metabolicinconsistencyNikolaus Sonnenschein1*, Jose Felipe Golib Dzib2, Annick Lesne2,3, Sebastian Eilebrecht2,4,Sheerazed Boulkroun5, Maria-Christina Zennaro5,6, Arndt Benecke2,4 and Marc-Thorsten Hutt1
Abstract
Background: Integrating gene expression profiles and metabolic pathways under different experimental conditionsis essential for understanding the coherence of these two layers of cellular organization. The network character ofmetabolic systems can be instrumental in developing concepts of agreement between expression data andpathways. A network-driven interpretation of gene expression data has the potential of suggesting novel classifiers forpathological cellular states and of contributing to a general theoretical understanding of gene regulation.
Results: Here, we analyze the coherence of gene expression patterns and a reconstruction of human metabolism,using consistency scores obtained from network and constraint-based analysis methods. We find a surprisingly strongcorrelation between the two measures, demonstrating that a substantial part of inconsistencies between metabolicprocesses and gene expression can be understood from a network perspective alone. Prompted by this finding, weinvestigate the topological context of the individual biochemical reactions responsible for the observedinconsistencies. On this basis, we are able to separate the differential contributions that bear physiological informationabout the system, from the unspecific contributions that unravel gaps in the metabolic reconstruction. Wedemonstrate the biological potential of our network-driven approach by analyzing transcriptome profiles ofaldosterone producing adenomas that have been obtained from a cohort of Primary Aldosteronism patients. Weunravel systematics in the data that could not have been resolved by conventional microarray data analysis. Inparticular, we discover two distinct metabolic states in the adenoma expression patterns.
Conclusions: The methodology presented here can help understand metabolic inconsistencies from a networkperspective. It thus serves as a mediator between the topology of metabolic systems and their dynamical function.Finally, we demonstrate how physiologically relevant insights into the structure and dynamics of metabolic networkscan be obtained using this novel approach.
BackgroundGenomic knowledge allows compiling an inventory of anorganism’s enzymes and thus the subsequent reconstruc-tion [1] and simulation of its metabolic system [2] usingconstraint-based modeling (CBM) techniques [3]. Com-pensating the lack of detailed information on the systemsparameters, e.g., enzyme kinetics, gene regulation etc.,CBM has proven to be a valuable tool for genome-scalesystem analysis. For example, flux balance analysis (FBA)
*Correspondence: [email protected] of Engineering and Science, Jacobs University Bremen, CampusRing 1, 28759 Bremen, GermanyFull list of author information is available at the end of the article
[4] has been used to predict with high accuracy the lethal-ity of gene deletions in unicellular organisms by takingonly the metabolic system’s stoichiometry, the assump-tion of optimal growth (implicit gene regulation), and aspecified growth medium into account (see e.g. [5], for astudy involving Escherichia coli or [6], for a study involvingSaccharomyces cerevisiae).
Duarte et al. [7], published a genome-scale represen-tation of human metabolism based on genomic, bibli-ographic, and biochemical information. In contrast tometabolic representations of unicellular organisms, thefollowing caveats play a role in the modeling of multi-cellular reconstructions, in general, and in particular forthe human system [8]: (i) it is difficult to define environ-mental conditions for a multicellular system, (ii) usually
© 2012 Sonnenschein et al.; licensee BioMed Central Ltd. This is an Open Access article distributed under the terms of theCreative Commons Attribution License (http://creativecommons.org/licenses/by/2.0), which permits unrestricted use,distribution, and reproduction in any medium, provided the original work is properly cited.

Sonnenschein et al. BMC Systems Biology 2012, 6:41 Page 2 of 13http://www.biomedcentral.com/1752-0509/6/41
not enough information is available about the cell-typespecificity of human metabolic pathways, and (iii) cel-lular objectives, a prerequisite for flux balance analysis,are hard to define and validate. The precision of CBMpredictions increase with the availability and accuracyof constraints, as they aid narrowing down the poten-tial solution space to the biologically meaningful systemstates. Thus, integrating experimental data can help over-come the previously mentioned limitations.
In the present work, we will integrate human tran-scriptome data from a cohort of healthy controls andaldosterone producing adenomas (APA) of adrenal glandsfrom primary aldosteronism (PAL) patients [9] with themetabolic reconstruction Human Recon 1 [7]. Primaryaldosteronism is a common form of hypertension withhypokalemia and suppressed renin-angiotensin systemcaused by autonomous aldosterone production. This data,among other data sets covered in the supporting infor-mation, will serve us to demonstrate how the metaboliccontextualization dramatically increases the resolution ofour perception of the data.
ApproachDifferent approaches to the incorporation of experimen-tal data into CBM have been proposed [8,10-13] (seeSupporting Information Additional file 1: Text S1 fora summary). The GIMME (Gene Inactivity Moderatedby Metabolism and Expression) algorithm, proposed byBecker and Palsson [14], maintains flux through a pro-posed metabolic objective (similar to FBA) by simulta-neously punishing flux through unexpressed reactions. Athreshold on the transcriptome data is used for expres-sion classification purposes (see Figure 1a and c). Thesum of fluxes through unexpressed reactions is termedinconsistency (I) and is minimized during the GIMMEoptimization. Thus, the inconsistency I gives, on theone hand, an estimate of the quality of the computedflux distribution, and measures, on the other hand, thecoherence of the objective and the experimental data(see Materials and Methods and Supporting InformationAdditional file 1: Text S1). We chose GIMME over othermethods for our analysis as (i) the threshold parameterused for determining gene presence-absence patterns is ofparticular interest to our study, and (ii) the inconsistencymeasure suits our approach of quantifying the discrep-ancy of the measured transcript levels to a given cellularobjective, e.g., aldosterone or ATP production.
We will compare the inconsistency I to the metaboliccoherence (MC) introduced previously [15], which is apurely topological quantity that measures the fragmenta-tion of effective metabolic gene networks (see Figure 1b).The coherence of metabolic gene network topology andexpression patterns is quantified as follows (see alsoMaterials and Methods): in order to extract effective
subnetworks, we map genes with expression values abovethreshold directly onto a metabolic gene network ofhuman metabolism. Then, we compute the ratio of con-nected nodes and overall nodes in the effective subnet-work. This ratio is then converted into a z-score, by using arandom distribution of expression changes as a null model(effectively choosing the same amount of affected nodes).This z-score is our metabolic coherence (MC), which mea-sures the amount of network coherence between geneexpression profiles and metabolic pathways.
The comparison between these two indices is interest-ing, as they highlight different properties of the networkdynamics. The inconsistency index I, on the one hand,measures the level of disagreement between expressiondata and anticipated network dynamics. The MC index,on the other hand, measures the amount of coordinated(connected) expressed reaction structure, which can onlybe observed after contextualization of the expression data.
Figure 1d shows a flow diagram that describes the struc-ture and necessary steps of our comparative analysis.Based on this quantitative comparison, we will conducta topological characterization of the individual contri-butions to I and show that valuable information can beextracted from them.
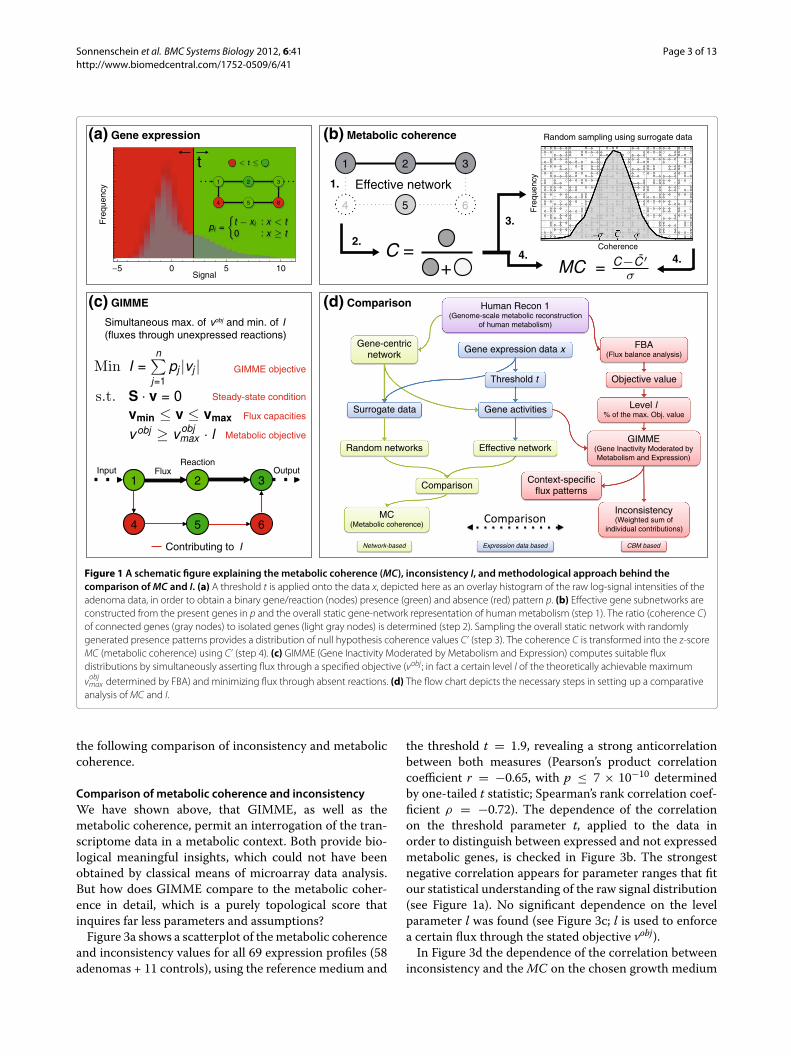
ResultsInconsistency and metabolic coherence uncover two typesof metabolic behaviorUsing the GIMME approach, can physiological insights beobtained from the adenoma transcriptome data? Figure 2ashows the distribution of inconsistency values for the con-trol and the adenoma transcriptome profiles. Maximalaldosterone production was used as the cellular objectivefunction vobj and a minimal medium composition con-taining glucose and glycerol, as well as a collection ofamino acids and fatty acids, was implemented using theappropriate boundaries on the their respective exchangereactions (for further details see Materials and Methodsand Supporting Information Additional file 1: Text S1).The histogram in Figure 2a uncovers a bimodal distri-bution of adenoma inconsistency values: it consists of agroup of adenomas exhibiting lower(higher) inconsisten-cies than the average 〈I〉 of the control group. We termthem high and low inconsistency group respectively (HIGand LIG). It is important to note that these two cate-gories (HIG and LIG) could not have been uncovered byconventional cluster analysis (see Figure 2b).
How does the purely topological metabolic coher-ence method compare to the previously applied GIMMEapproach? Measuring the metabolic coherence for theadenoma transcript data reveals a similar pattern (seeFigure 2c). Although not quite as distinct as for the incon-sistency measure (compare to Figure 2a), two groups ofhigh and low coherence are visible, which leads us to
Sonnenschein et al. BMC Systems Biology 2012, 6:41 Page 3 of 13http://www.biomedcentral.com/1752-0509/6/41
(c) GIMME
Steady-state condition
GIMME objective
Flux capacities
Metabolic objective
1 2 3
4 5 6
OutputInputReaction
Flux
Contributing to I
Simultaneous max. of vobj and min. of I (fluxes through unexpressed reactions)
Context-specific flux patterns
Comparison
MC (Metabolic coherence)
Gene-centric network
Surrogate data
Random networks GIMME
(Gene Inactivity Moderated by Metabolism and Expression)
FBA (Flux balance analysis)
Inconsistency (Weighted sum of
individual contributions)
Objective value
Level l % of the max. Obj. value
Human Recon 1 (Genome-scale metabolic reconstruction
of human metabolism)
Gene expression data x
Effective network
Gene activities
Threshold t
Network-based CBM based Expression data based
(a) Gene expression (b) Metabolic coherence
(d) Comparison
1.
2.
3.
4. 4.5 0 5 10
Signal
Fre
quen
cy
t1 2 3
4 5 6
Effective network
1 2 3
54 6
C =+
Coherence
Random sampling using surrogate data
Fre
quen
cy
Figure 1 A schematic figure explaining the metabolic coherence (MC), inconsistency I, and methodological approach behind thecomparison of MC and I. (a) A threshold t is applied onto the data x, depicted here as an overlay histogram of the raw log-signal intensities of theadenoma data, in order to obtain a binary gene/reaction (nodes) presence (green) and absence (red) pattern p. (b) Effective gene subnetworks areconstructed from the present genes in p and the overall static gene-network representation of human metabolism (step 1). The ratio (coherence C)of connected genes (gray nodes) to isolated genes (light gray nodes) is determined (step 2). Sampling the overall static network with randomlygenerated presence patterns provides a distribution of null hypothesis coherence values C’ (step 3). The coherence C is transformed into the z-scoreMC (metabolic coherence) using C’ (step 4). (c) GIMME (Gene Inactivity Moderated by Metabolism and Expression) computes suitable fluxdistributions by simultaneously asserting flux through a specified objective (vobj ; in fact a certain level l of the theoretically achievable maximum
vobjmax determined by FBA) and minimizing flux through absent reactions. (d) The flow chart depicts the necessary steps in setting up a comparative
analysis of MC and I.
the following comparison of inconsistency and metaboliccoherence.
Comparison of metabolic coherence and inconsistencyWe have shown above, that GIMME, as well as themetabolic coherence, permit an interrogation of the tran-scriptome data in a metabolic context. Both provide bio-logical meaningful insights, which could not have beenobtained by classical means of microarray data analysis.But how does GIMME compare to the metabolic coher-ence in detail, which is a purely topological score thatinquires far less parameters and assumptions?
Figure 3a shows a scatterplot of the metabolic coherenceand inconsistency values for all 69 expression profiles (58adenomas + 11 controls), using the reference medium and
the threshold t = 1.9, revealing a strong anticorrelationbetween both measures (Pearson’s product correlationcoefficient r = −0.65, with p ≤ 7 × 10⁻¹⁰ determinedby one-tailed t statistic; Spearman’s rank correlation coef-ficient ρ = −0.72). The dependence of the correlationon the threshold parameter t, applied to the data inorder to distinguish between expressed and not expressedmetabolic genes, is checked in Figure 3b. The strongestnegative correlation appears for parameter ranges that fitour statistical understanding of the raw signal distribution(see Figure 1a). No significant dependence on the levelparameter l was found (see Figure 3c; l is used to enforcea certain flux through the stated objective vobj).
In Figure 3d the dependence of the correlation betweeninconsistency and the MC on the chosen growth medium
Sonnenschein et al. BMC Systems Biology 2012, 6:41 Page 4 of 13http://www.biomedcentral.com/1752-0509/6/41
MC Control Control MC Control
0
1
2
3
MC
a
c
b
I Control Control I Control
200
400
600
800
Inco
nsis
tenc
y
0.0
0.5Probability
0-5 10 LIG HIGControl
)GIH()GIL(
0-5 10 LIG HIGControl
Figure 2 Two types of metabolic behaviors in adenoma tumors. Distributions of (a) inconsistency (I) and (c) metabolic coherence (MC) scoresfor the adenoma and control samples. (b) A hierarchical cluster-analysis of the data does not reveal a clear separation of the low (LIG) and high (HIG)inconsistency groups.
is shown. The distribution of correlation coefficients isnarrow (between −0.75 to −0.4 for r and −0.73 to −0.35for ρ), regardless of which correlation measure is con-sidered. This indicates that both inconsistency and MCand their correlation seem not be strongly dependent onthe environmental conditions provided. Furthermore, thecorrelation values obtained for the reference medium (i.e.r = −0.64 and ρ = −0.68, see also above) seem to origi-nate in the left tail of the distributions, suggesting a ratherhigh correspondence with the in vivo situation.
We confirmed that the observed anticorrelationbetween both measures is not a feature of the adenomadata, but holds true for other transcriptome data as well[16] (see Figure S1 and S2 in Supporting InformationAdditional file 1: Text S1).
Inconsistency contributions in central human metabolismFigure 4 displays inconsistency contributions and fluxpatterns for control, HIG and LIG on the carbohy-drate metabolism pathways of Homo sapiens. Strikingdifferences between the control group and the ade-noma groups become visible in this overview, e.g., thepentose-phosphate pathway seems to be activated onlyin the HIG and LIG. Furthermore, the control path-way map lays out a rather consistent pattern of flux
activities. Though, a few exceptions arise: pyruvatedehydrogenase (PDHm), the major entry point to theTCA cycle, and to lesser extent hexokinase (HEX1)and the pyruvate transport from cytosol to mitochon-drium (PYRt2m), exhibit high contribution strengths. Itis intriguing that the contribution strengths for theseparticular reactions is diminishingly small in the LIGcase, which indicates an elevated energy metabolismfor those adenomas. The HIG, on the other hand,shows a large number of reactions with elevated con-tribution strengths homogeneously distributed over thewhole map, which indicates a significantly reduced energymetabolism.
Individual contributions to the inconsistencyThe correlation between metabolic coherence and incon-sistency suggests a connection between both measures,and thus the possibility of interpreting the inconsistencyvalues from the perspective of network topology. In orderto investigate this point, we will decompose the inconsis-tency value into a vector of individual contributions, i.e.,reactions that have been reinserted during the optimiza-tion procedure in order to achieve the targeted flux-levelof the objective function. We further define the contribu-tion strength of a reaction as the number of contributions

Sonnenschein et al. BMC Systems Biology 2012, 6:41 Page 5 of 13http://www.biomedcentral.com/1752-0509/6/41
Figure 3 Comparison of metabolic coherence and inconsistency measures for the adenoma data set. (a) The aldosterone-productioninconsistency values are plotted against the MC of 69 tumor and control data sets. A clear negative correlation is visible (Pearson’s product-momentcorrelation coefficient r = −0.65, with p ≤ 7 × 10⁻¹⁰ determined by one-tailed t statistic, and Spearman’s rank correlation coefficient ρ = −0.72;t = 1.9; l = 0.95). (b) Dependency of the correlation on the threshold parameter (l = 0.95). (c) Medium dependency of the negative correlationstrength. Both Spearman’s rank correlation coefficient as well as Pearson’s correlation where computed for the MC and the inconsistency for 100random growth media (t = 1.9; l = 0.95). The dashed line in (b) indicates the threshold parameter used in (a). Arrows in (c) indicate the correlationvalues found in (a).
it makes to the inconsistencies of a data set divided by thesize of the respective data set.
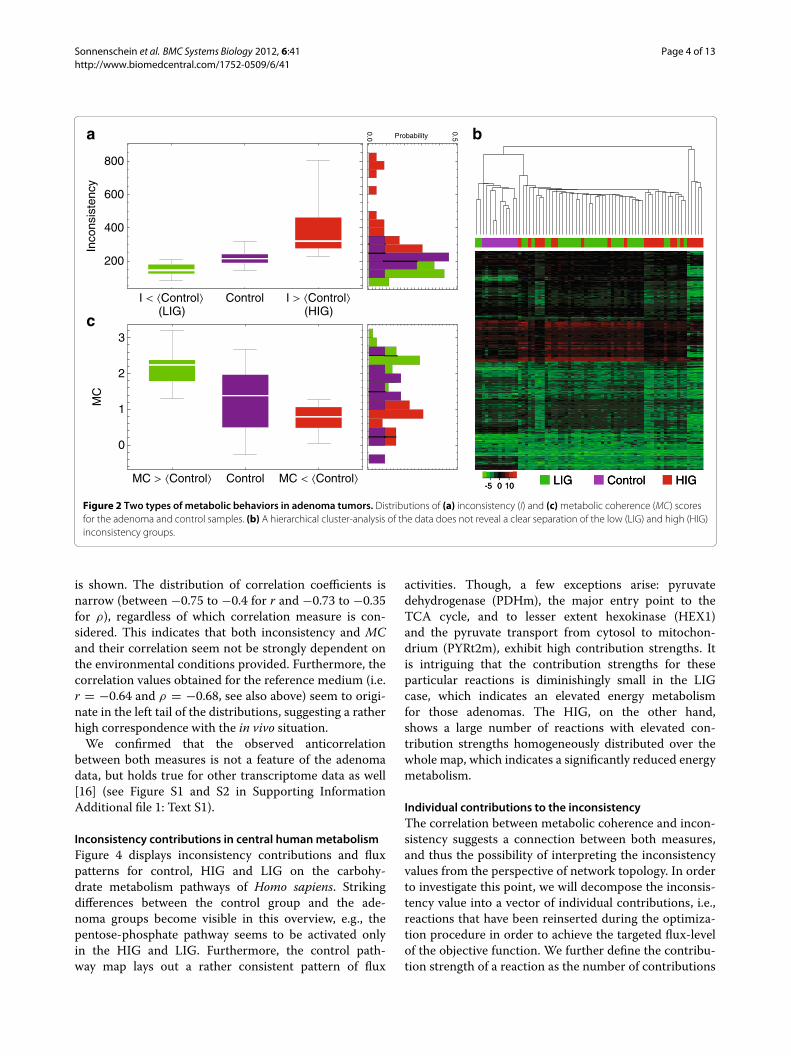
Comparing the contribution strengths of reactions incentral metabolism reveals interesting changes in thephysiology of LIG and HIG (see Figure 4). But how dothe contribution strengths vary between control, LIGand HIG on a global metabolic scale? The contributionstrengths for a subset of all contributing reactions isshown in Figure 5 (see Additional file 1: Text S1 Figure S3for the complete set of contributions). The contributingreactions have been sorted according to their contributionstrengths in the control group and at equal strength by theoverall contributions. Having already seen a few examplesfor differentially contributing reactions in the carbohy-drate pathways, it becomes evident that there are manymore to discover.
On the other hand, a group of reactions with veryhigh contribution strengths seems to contribute non-specifically and independently from the gene expressiondata. In the following, we want to elaborate on this set ofreactions, and will use certain categories and topologicalmarkers to characterize them.
The following circumstances can lead to non-specificcontributions to the inconsistency vector:
1. A reaction is expressed in vivo but the measuredgene expression intensity falls below the threshold t
under most or all experimental conditions (justbelow threshold ). This is a consequence of the rigidapplication of a universal threshold. Topologically,these contributions often disrupt a chain ofotherwise expressed reactions (chain disruptor).
2. A reaction is expressed in vivo but, e.g., wrong GPRassociations, missing isozymes, wrong geneannotations, erroneous data etc., make it invisible forthe analysis. Again, these artifacts are oftencharacterized by an interrupted chain of expressedreactions (chain disruptor).
3. The reaction is not expressed, but it has to be utilizedby GIMME due to the following reasons:
(a) The stated objective function does not reflectthe situation present in the cell. Defining theobjective functions as the output of thesystem, these reactions contributions shouldoften lie close to it (close to output layer).
(b) The chosen media composition does notreflect the in vivo environment in which theexperimental data has been obtained. Thepreliminary FBA step in GIMME is naiveabout the in vivo medium composition anduses everything provided and suitable for themaximization of the objective function. AsGIMME enforces a certain achievement of

Sonnenschein et al. BMC Systems Biology 2012, 6:41 Page 6 of 13http://www.biomedcentral.com/1752-0509/6/41
Control
Low Inconsistency Group (LIG)
High Inconsistency Group (HIG)
nadh m
pyr m
h m
h
pi
nad r
gtp
h r
co2 m
coa m
glc D
h2o
pi r
nadh m
nad m
nadph r
fad m
h
pep m
h
nad m
co2 m
adp
co2 r
mal L
nadp m
3pg
adp
gdp m
adp m
h
nadph m
coa m
h r
h m
succ m
atp
nadh m
h
h2o m
co2
coa m
adp
pi
adp m
hco3 m
nadh
oaa m
co2 m
h
co2 m
nad m
h2o r
6pgc r
co2
dhap
pi
adp
atp m
coa
fadh2 m
icit m
fum m
co2 m
oaa
h r
nadh m
atp
h rnadph r
nadph
nad r
h2o
h2o
pi m
ru5p D r
cit m
h
nadp
h
focytC m
succoa m
accoa
f6p
g3p
h
nadp m
h r
pi m
atp
oaa m
nad
pi
mal L m
nadh m
gtp m
fum
g6p r
co2 m
coa m
atp
23dpg
nadh
coa m
adp
fadh2 m
nad
nadh m
nadp r
h2o r
lac L
pep
pyr
nadp r
nh4 r
h2o m
nad
h m
2pg
pi m
co2 m
nadp
h2o
h2o
h m
akg
fad m
co2 r
nad m
nadph
nadph m
pi
fdp
gdp
nadh r
icit
ac
nadh
13dpg
g6p
atp
ficytC m
cit
gdp m
nad m
nadh r
akg m
nad m
atp m
lac L m
h
co2
gtp m
cbp rglc D r
glyc3p
6pgl r
h m
PYRt2m
CITL
PFK
L LACtcm
FBP
DPGM
TPI
PEPCK
HEX1
PGM
ME2m
LDH_L
GNDer
SUCD1m
L LACDcm
PCm
G6PPerCBPPer
ICDHxm
AKGDm
G6PDH1rer
ME2
G3PD2m
MDHm
G6Pter
PEPCKm
GAPD
SUCOASm
LDH_Lm
ACONTm
G6PDH2rer
PYK
FUM
SUCOAS1m
FUMm
G6PDH1er
ICDHyrm
MDH
ACONT
GLCter
FBA
PGI
PGK
CSm
ME1m
ACITL
ACYP
ENO
PGLer
DPGase
ICDHy
PDHm
Glycolysis
TCA Cycle
nadh m
pyr m
h m
h
h
pi
h
adp
nad r
gtp
h r
co2 m
coa m
glc D
h2o
pi r
nadh m
nad m
nadp
nadph r
fad m
h
pep m
h
amp
nad m
co2 m
adp
co2 r
mal L
nadp m
ru5p D
3pg
adp
gdp m
adp m
h
nadph m
coa m
h r
h m
succ m
atp
h
nadh m
h
h2o m
h
co2
adp
coa m
adp
g3p
g1p
f6p
pi
acald
adp m
hco3 m
nadh
atp
oaa m
co2 m
h
co2 m
nad m
h2o r
6pgc r
co2
dhap
pi
rib D
f6p
adp
atp m
coa
fadh2 m
icit m
fum m
co2 m
oaa
h r
nadh m
atp
h rnadph r
s7p
adp
nadph
nad r
h2o
h2o
pi m
h
atp
ru5p D r
cit m
h
co2
nadp
6pgc
g3p
h
focytC m
succoa m
accoa
f6p
atp
nadph
g3p
h
nadp m
h r
h2o
6pgl
pi m
prpp
atp
oaa m
nad
pi
mal L m
nadh m
gtp m
fum
g6p r
co2 m
atp
coa m
atp
23dpg
nadh
coa m
adp
fadh2 m
nad
r5p
nadh m
nadp r
h2o r
rbl D
lac L
pep
pyr
nadp
xu5p D
nadp r
nh4 r
h2o m
nad
h m
2pg
pi m
co2 m
nadp
h2o
h2o
h m
akg
fad m
co2 r
nad m
nadph
r1p
nadph m
pi
fdp
gdp
nadh r
icit
ac
nadh
13dpg
g6p
atp
2dr5p
e4p
ficytC m
e4p
cit
gdp m
nad m
nadh r
nadph
drib
h
akg m
nad m
atp m
lac L m
h
co2
gtp m
cbp rglc D r
glyc3p
6pgl r
h m
PYRt2m
RPE
CITL
PFK
L LACtcm
FBP
PPM
DPGM
TPI
PEPCK
HEX1
PGL
TALA
PGM
ME2m
LDH_L
GNDer
RPI
SUCD1m
L LACDcm
PCm
G6PPer
PRPPS
DRPA
CBPPer
ICDHxm
RBK
AKGDm
G6PDH1rer
ME2
G3PD2m
MDHm
G6Pter
PEPCKm
GAPD
SUCOASm
LDH_Lm
ACONTm
DRBK
G6PDH2rer
TKT2
PYK
GND
FUM
SUCOAS1m
RBK_D
FUMm
G6PDH1er
ICDHyrm
MDH
ACONT
GLCter
FBA
PGI
PGK
CSm
ME1m
PGMT
ACITL
ACYP
ENO
PGLer
G6PDH2r
DPGase
TKT1
ICDHy
PDHm
Glycolysis
Pentose Phosphate Pathway
TCA Cycle
from glycogen breakdown, to nucleotide
nadh m
pyr m
h m
h
h
pi
h
adp
nad r
gtp
h r
co2 m
coa m
glc D
h2o
pi r
nadh m
nad m
nadp
nadph r
fad m
h
pep m
h
amp
nad m
co2 m
adp
co2 r
mal L
nadp m
ru5p D
3pg
adp
gdp m
adp m
h
nadph m
coa m
h r
h m
succ m
atp
h
nadh m
h
h2o m
h
co2
adp
coa m
adp
g3p
g1p
f6p
pi
acald
adp m
hco3 m
nadh
atp
oaa m
co2 m
h
co2 m
nad m
h2o r
6pgc r
co2
dhap
pi
rib D
f6p
adp
atp m
coa
fadh2 m
icit m
fum m
co2 m
oaa
h r
nadh m
atp
h rnadph r
s7p
adp
nadph
nad r
h2o
h2o
pi m
h
atp
ru5p D r
cit m
h
co2
nadp
6pgc
g3p
h
focytC m
succoa m
accoa
f6p
atp
nadph
g3p
h
nadp m
h r
h2o
6pgl
pi m
prpp
atp
oaa m
nad
pi
mal L m
nadh m
gtp m
fum
g6p r
co2 m
atp
coa m
atp
23dpg
nadh
coa m
adp
fadh2 m
nad
r5p
nadh m
nadp r
h2o r
rbl D
lac L
pep
pyr
nadp
xu5p D
nadp r
nh4 r
h2o m
nad
h m
2pg
pi m
co2 m
nadp
h2o
h2o
h m
akg
fad m
co2 r
nad m
nadph
r1p
nadph m
pi
fdp
gdp
nadh r
icit
ac
nadh
13dpg
g6p
atp
2dr5p
e4p
ficytC m
e4p
cit
gdp m
nad m
nadh r
nadph
drib
h
akg m
nad m
atp m
lac L m
h
co2
gtp m
cbp rglc D r
glyc3p
6pgl r
h m
PYRt2m
RPE
CITL
PFK FBP
PPM
DPGM
TPI
PEPCK
HEX1
PGL
TALA
PGM
ME2m
LDH_L
GNDer
RPI
SUCD1m
L LACDcm
PCm
G6PPer
PRPPS
DRPA
CBPPer
ICDHxm
RBK
AKGDm
G6PDH1rer
ME2
G3PD2m
MDHm
G6Pter
PEPCKm
GAPD
SUCOASm
LDH_Lm
ACONTm
DRBK
G6PDH2rer
TKT2
PYK
GND
FUM
SUCOAS1m
RBK_D
FUMm
G6PDH1er
ICDHyrm
MDH
ACONT
GLCter
FBA
PGI
PGK
CSm
ME1m
PGMT
ACITL
ACYP
ENO
PGLer
G6PDH2r
DPGase
TKT1
ICDHy
PDHm
To nucleotide metabolism
Glycolysis
TCA Cycle
from glycogen breakdown, to nucleotide
a b
c
Pentose Phosphate Pathway
Figure 4 Inconsistency contributions to carbohydrate metabolism. The maps depict the usage patterns and inconsistency contributions for(a) the control and (b) the high and (c) low inconsistency groups (HIG and LIG). The thickness and color of a reaction edge correspond to the usagefrequency and the contribution strength, respectively. The pathway maps have been obtained from the BIGG database [17].
Sonnenschein et al. BMC Systems Biology 2012, 6:41 Page 7 of 13http://www.biomedcentral.com/1752-0509/6/41
Figure 5 Inconsistency contributions from adenoma tumor samples showing lower (LIG) and higher (HIG) inconsistencies (top andmiddle panel) in comparison to the control group (bottom panel). The gray box highlights the group of unspecific reaction contributions.These contributions are covered together with a selection differentially contributing (bold reaction labels) in Table 1 and Supporting Additionalfile 1: Text S1 Table S2. Only a subset of all contributing reactions is shown due to space limitations (the complete diagram is available in Additionalfile 1: Text S1 Figure S3).
the objective flux predicted by FBA, many ofthe transport reactions used by FBA will alsobe used by GIMME. Topologically, thesereaction contributions are characterized bylying close to the provided mediumcomponents (close to input layer).
(c) Too many missing gene-protein-reactionassociations (GPR), either due tonon-enzymatic reaction steps or knowledgegaps, before and after the contributingreaction can lead to wrongly activated paths,as missing GPR information is not punishedby GIMME (invisible path ).
(d) Alternative expressed routes to the objectivefunction are available in vivo, but are notcovered by the metabolic reconstruction.This leads to reaction contributions that arecharacterized by producing essentialprecursors for the objective function, andthus constitute bottlenecks in the system(bottleneck ).
Table 1 lists topological and biological classifications fora selection of the 11 unspecific contributions as well as 8selected differentially contributing reactions (see Figure 5;the full listing is provided in Supporting Additional file 1:
Text S1 Table S1). Pathway visualizations of the contribut-ing reactions can be found in Supporting Additional files2, 3, 4, and 5. The topological characterization from theenumeration above have also been applied to the specificcontributions.
Our network-based approach is capable of identifyingsimilar patterns as the more sophisticated methods basedon flux-balance analysis. In this way, our approach canfacilitate an understanding of metabolic inconsistenciesfrom a network perspective. It thus serves as a media-tor between the topology of metabolic systems and theirdynamical function. In the following we will discuss tworepresentative sets of contributions to the inconsistencyin greater detail.
�1-pyrroline-5-carboxylate-proline cycleProline dehydrogenase (PROD2) emerges as one of themajor unspecific inconsistency contributors (see Table 1).Together with �1-pyrroline-5-carboxylate reductase(P5CRx), it is involved in a cycle that interconvertsNADH into FADH2 (see Figure 6), a necessary redoxfactor for the biosynthesis of cholesterol biosynthesis,the ultimate precursor for all steroid pathways and con-comitantly aldosterone production. The cycle involvessynthesis and degradation of L-proline, where �1-pyrroline-5-carboxylate (1pyr5c) acts as precursor as well

Sonnenscheinetal.BM
CSystem
sBiology2012,6:41
Page8
of13http
://ww
w.b
iomedcentral.com
/1752-0509/6/41
Table 1 Classification of contributions to the inconsistency vector (bottleneck; BN, invisible path; IP, chain disruptor; CD, close to input layer; CIL, close to outputlayer; COL, SIaa; Additional file 2, SIcarb; Additional file 3, SIlip; Additional file 4, SIvit; Additional file 5)
Contributor Category Topologicalclass
Biological interpretation Reference
AATAi** unspecific BN; IP 2-Aminoadipate transaminase;one out of two 2-oxoadipate producing reactions; missing GPR assoc.
in all precursors. SIaa, B1
PROD2* unspecific CD; CIL Proline dehydrogenase; participates in a cycle that converts nadh to fadh2 (Figure 6); not expressed (Figure S5b). SIaa, D3
DPMVDx unspecific CD Diphosphomevalonate decarboxylase; essential step in the cholesterol biosynthesis pathway;
not expressed; wrong or missing GPR assoc. (Figure S5c). SIlip, B5
GLYK unspecific CIL Glycerol kinase; not expressed in control and LIG, indicating that glycerol (provided in the in silico medium)
might not be available as a in vivo medium component; slightly elevated expression levels in LIG (see Figure S5i). SIlip, E5
PHETHPTOX2 unspecific CIL Phenylalanine 4-monooxygenase; converts phenylalanine (provided in the in silico medium) into tyrosine
(not provided in the in silico medium); the high unspecific contribution strength indicates that tyrosine might be
available as an in vivo medium component. SIaa, A5
34HPPOR*** unspecific CD; CIL 4-Hydroxyphenylpyruvate dioxygenase; involed in tryosine to fumarate and acetoacetate conversion;
not expressed (see Figure S5m). SIaa, B5
FUMtm unspecific — Fumarate transport (cytosol/mitochondria); expression just below threshold (see Figure S5o). no map
GLUTCOADHm** specific CD Glutaryl-CoA dehydrogenase; involved in the 2-oxoadipate pathway (see Figure S5); elevated expression levels in LIG (see Figure S6a). SIaa, A2
PDHm specific BN Pyruvate dehydrogenase; entry point to the TCA cycle; elevated expression levels in LIG (see Figure S6c). SIcarb, C3
MMEm specific CD Methylmalonyl-CoA epimerase; involved in isoleucine degradation; slightly elevated expression levels in LIG (see Figure S6d). SIaa, D1–E1
MEVK1x specific CD Mevalonate kinase; an essential step in cholesterol biosynthesis; decreased expression levels in LIG and HIG (see Figure S6e). SIlip, B5
G6PDH(1,2)rer specific – Glucose-6-phosphate dehydrogenase; slightly elevated expression levels in LIG (see Figure S6f). SIcarb, C4–D4
DHCR71r specific CD; COL 7-Dehydrocholesterol reductase; involved in cholesterol biosynthesis; slightly elevated expression levels in LIG (see Figure S6g). SIlip, A4
HEX1 specific CD; CIL Hexokinase; first step in glycolysis; slightly elevated expression levels in LIG (see Figure S6h). SIcarb, C4–C5
SQLEr specific CD Squalene epoxidase; decreased expression levels in LIG and HIG (see Figure S6i). SIlip, A5*Proline cycle issue; see Figure 6.**2-Oxoadipate issue; see Figure 7.***Tyrosine path to fumarate and acetoacetate issue; see Figure S4 and Text S1.

Sonnenschein et al. BMC Systems Biology 2012, 6:41 Page 9 of 13http://www.biomedcentral.com/1752-0509/6/41
pro-L
Cytosol
1pyr5cP5CRx
PROD2m
P5CRxm
PROD2
pro-L 1pyr5c
nadh
nadh
fadh2
fadh2
fad
fad
nad
nad
Figure 6 �1-pyrroline-5-carboxylate-proline cycle. The NADH to FADH2 interconverting cycle composed of pyrroline-5-carboxylate reductaseand pyrroline-5-carboxylate reductase is depicted together with the distributions of expression values for the cytosolic (PROD2 and P5CRx) andmitochondrial (PROD2m and P5CRxm) versions of pyrroline-5-carboxylate reductase and proline dehydrogenase. The control is depicted in purple, theLIG and HIG in green and red, respectively, and the dashed lines indicate the threshold used for the GIMME computations (see Figure 7 for adetailed legend).
as degradative product. In the cytosol, P5CRx seems tobe expressed in most of the samples, whereas expressionlevels for PROD2 fall all below the GIMME threshold. Itis intriguing that the gene expression profiles are almostreversed in the mitochondrion, where PROD2m (a mito-chondrial version of PROD2) is expressed (at least in thecontrol) and P5CRxm (a mitochondrial version of P5CRx)is not expressed. It is known that the distinct reactionsteps of the �1-pyrroline-5-carboxylate-proline cycle arelocalized over different subcellular locations [18]: (i) thedehydrogenation of proline to 1pyr5c takes place in themitochondrion (i.e. by PROD2m), (ii) 1pyr5c emergesfrom the mitochondrion and (iii) is converted back toproline in the cytosol, (iv) which is then transported backinto the mitochondrion, closing the cycle. In fact, theseare also the steps suggested by the observed expression
patterns. So why does GIMME predict the cycle totake place exclusively in the cytosol, although PROD2expression is clearly absent in all samples? Checking themodel revealed missing mitochondrial transporters for1pyr5c (a transporter for proline is available), prohibitingits correct physiological operation and suggesting neces-sary amendments to the human model. Furthermore, thereduced expression of PROD2m in LIG and HIG consti-tutes an interesting deviation to metabolic signature ofthe control group.
2-Oxoadipate pathways2-Oxoadipate (2oxoadp) is one of the precursors foracetyl-CoA (see Figure 7a), which is heavily utilizedin cholesterol biosynthesis. Only two paths lead to 2-oxoadipate, i.e., L-tryptophan (Figure 7a) and L-lysine

Sonnenschein et al. BMC Systems Biology 2012, 6:41 Page 10 of 13http://www.biomedcentral.com/1752-0509/6/41
acetyl-CoA2-Oxoadipate
trp-L
FY
KN
H
AM
6SA
DA
MC
OX
O
ECOAH4m
lys-L
lys-L
2-Oxoadipate
2AMADPT
AATAi
SACCD3mSACCD4m
LYStm
AA
SA
D3
AA
PS
AS
TH
P2C
tpLP
CO
Xp
1PP
DC
Rp
AA
SA
D3m
a bTRPO2
KYN3OX
PCLAD
3HAO
HKYNH
2OXOADPTM
2OXOAOXm
GLUTCOADHm
HACD1m
ACACT1rm
Legend
5 0 5 100.00
0.05
0.10
0.15
0.20
0.25
0.30
0.35
Signal
Pro
babi
lity
Reaction ID
HIGControl
LIGt
Reaction IDMetabolite Metabolite
Cofactor
Contribution strengthhighlow
Figure 7 (a) 2-Oxoadipate production pathway starting from lysine and involving the unspecific contributor AATAi (see Table 1 andSupporting Additional file 1: Text S1 Table S2). Dashed lines indicate the threshold used for the GIMME computations. (b) 2-Oxoadipateproduction pathway starting from tryptophan and involving the unspecific contributor 2OXOADPTm (see Table 1 and Supporting Additional file 1:Text S1 Table S2) among other more specific contributions. Dashed lines indicate the threshold used for the GIMME computations.
degradation (Figure 7b). The many missing GPR associa-tions (Invisible pathway) on the path leading from lysine to2-oxoadipate (Figure 7b), surely promote the usage of thisspecific pathway versus the alternative pathway leadingfrom tryptophan to 2-oxoadipate (Figure 7a), explainingthe high contribution strength of AATAi (see Figure 5
and Table 1). The expression data suggests the absenceof both catabolic pathways. However, it is intriguingto see that all subsequent steps from 2-oxoadipate toacetyl-CoA seem to be expressed in the control and LIG(Figure 7a), implying that 2-oxiadipate might still bemetabolized in the samples. Further investigations in this
Sonnenschein et al. BMC Systems Biology 2012, 6:41 Page 11 of 13http://www.biomedcentral.com/1752-0509/6/41
direction might be promising, especially in the light ofthe elevated expression levels (LIG vs. control) found forglutaryl-CoA dehydrogenase (GLUTCOADHm) andacetyl-CoA C-acetyltransferase (ACACT1rm).
DiscussionThere is an ongoing interest in the generic [19] andnetwork-based [20] properties of metabolic systems,though discussions of metabolic systems from a networkperspective have frequently been criticized and are proneto artifacts, when one attempts to biologically interpretthe observed topological properties. Table 1 on the otherhand shows, how a topological perspective can help guidethe biological interpretation of experimental data andconstraint-based analysis results. Classifying metabolicinconsistencies from a topological perspective allowed usto think of such inconsistencies in terms of bottlenecks,paths and branching ratios, etc. As an extension to thiswork we would like to formalize our approach in thefuture.
Comparing the contribution strengths of individualreactions among the different sample categories (control,LIG, HIG) revealed unspecific contributions to the incon-sistency, as well as a group of reactions that differentiallycontribute in a specific fashion. We constructed a method-ological framework for the topological classification of theinconsistency contributions. Therefore, topological mark-ers were developed for the characterization of both, spe-cific and unspecific contributions, thus enabling a thor-ough understanding of the context-specific flux-activityresults. It turned out, that on the one hand, the specificcontributions cast light on an unforeseen diversity of alter-ations in the physiology of adrenal gland adenomas and,on the other hand, the unspecific contributions provideentry points for the iterative refinement of the metabolicreconstruction.
ConclusionWe have presented a sequence of three results on thenetwork-mediated correspondence between gene expres-sion patterns and metabolic systems: (1) We have shownthe general agreement between GIMME [14] and apurely topological method from [15], both of them capa-ble to detect distinct physiological behaviors in theadrenal gland tumors. (2) We have extended the GIMMEapproach by moving from the inconsistency score to theinconsistency vector that contains the various contribu-tions to the metabolic inconsistency. (3) We have beenable to formulate biological hypotheses for these vectorcomponents based on comparison with network topology.
MethodsAn extended “Methods” section is provided in the Sup-porting Information.
Model of human metabolismAll flux balance simulations were conducted using themetabolic reconstruction Recon 1, a genome-scale com-partmentalized representation of human metabolism [7],which is available in SBML [21] format via the BIGGdatabase [17].
Gene expression dataAldosterone producing adenomas were obtained throughthe COMETE network from patients who had under-gone surgery for lateralized PAL at the Hopital EuropeenGeorges Pompidou between 2002 and 2006. Methodsfor screening and criteria for diagnosing PAL were inaccordance with institutional guidelines and have beendescribed recently [22]. The clinical and biological char-acteristics of the patients are resumed in Boulkroun et al.[23]. Here, logarithmized transcript levels from 58 ade-nomas and 11 control tissue samples were mapped ontothe GPR (gene-protein-reaction) associations included inthe Human Recon 1 model. Therefore, it was necessary toreplace logical AND and OR by min and max functions,respectively, following the protocol described in [14]. Theeleven control normal adrenals (CA) were obtained fromenlarged nephrectomies (kindly provided by the depart-ment of Pathology of the University Hospital of Rouen,Hopital Tenon as described previously [9]). The EBER2gene expression has been published in [16].
Context-specific flux balance analysisContext-specific flux balance analysis of human expres-sion data was conducted using the GIMME algorithm asdescribed in [14] and in the introduction to this work.ATP-production was implemented as a cellular objectiveby introducing an artificial reaction that consumes cytoso-lic ATP. The aldosterone objective was implemented asthe maximization of flux through aldosterone synthase(model ID: P45011B21m). The pathway to aldosteronewas initially blocked in the metabolic reconstruction.Further analysis revealed 4-Methylpentanal as a dead-end metabolite inhibiting steady-state flux to the aldos-terone synthase reaction. The introduction of an artificialdrain for 4-Methylpentanal restored the functionality ofthe whole pathway. Furthermore, the same conservativeapproach was chosen regarding missing GPR: reactionswithout GPR associations were assumed to be expressed,i.e., having expression values above t. The aldosteroneobjective and the parameters t = 2 and l = 0.8 were usedthroughout the study, if not stated otherwise.
Growth mediaThe growth medium was defined as in [24] (see Table S1in Supporting Information Additional file 1: Text S1). Itcontains both glucose and glycerol as carbon sources,the amino acids L-arginine, L-histidine, L-isoleucine,

Sonnenschein et al. BMC Systems Biology 2012, 6:41 Page 12 of 13http://www.biomedcentral.com/1752-0509/6/41
L-leucine, L-lysine, L-Methionine, L-phenylalanine, L-threonine and L-tryptophane, as well as the fatty acidspalmitic and linoleic acid. Aerobic conditions wereassumed by leaving oxygen consumption unconstrained.Random media conditions were constructed by pickingrandomly between 4% (approx. the number of enabledexchange reactions in the reference medium) to 100% ofall available exchange reactions in the model and assign-ing random upper and lower boundaries in the intervals[−20, 0] and [0, 20] to them. Oxygen, protons, sulfate,phosphate, water were assumed to be always available. Incase of random media sampling, inconsistency values Ihave been normalized by the objective function’s flux inorder to make them comparable.
Metabolic coherenceThe metabolic coherence (MC) was computed asdescribed in [15]. Active genes g (obtained after thresh-olding) are mapped onto a gene network (representingmetabolism) G to obtain an effective subgraph Gsub thatconsists of nodes gsub = g ∩ V (G). Repeatedly and ran-domly choosing |gsub| nodes from G provides us with adistribution of N random subgraphs Grnd. Let C(G) be afunction that extracts the set of connected nodes from anetwork. Let
μ = 1N
N∑i=1
|C(Grndi )|
|gsub| (1)
denote the mean of the ratio of connected nodes to overallnodes in the population of random networks and
σ =√√√√ 1
N
N∑i=1
(|C(Grnd
i )||gsub| − μ)2 (2)
its standard deviation. The z-score that we term metaboliccoherence can then be described as
MC =|C(Gsub)|
|gsub| − μ
σ. (3)
Before constructing the gene network out of the bipar-tite representation, overly abundant currency metabo-lites, e.g., ATP, H2O, NADH etc., have been excludedby removal of 4% of the highest connected compoundsfrom each compartment in the network [25]. The pre-sented results, e.g., the strong anti-correlation betweenMC and inconsistency, are not particularly sensitive to thisparameter (see Additional file 1: Text S1 SupplementaryFigure S7).
Additional files
Additional file 1: Text S1. Supporting information, includingSupplemental Figures S1–7 and Tables S1–2 [8-14,16,21-24,26-28].
Additional file 2: Pathway map SIaa. Amino acid biosynthesis pathways.The map depicts the usage patterns and inconsistency contributions forthe overall contributions (page i), control (page ii), LIG (page iii), and HIG(page iv). The thickness and color of a reaction edge corresponds to theusage frequency and the contribution strength, respectively. The pathwaymaps have been obtained from the BIGG database [17].
Additional file 3: Pathway map SIcarb. Central metabolism andcarbohydrate pathways (see also Additional file 2).
Additional file 4: Pathway map SIlip. Lipid metabolism pathways (seealso Additional file 2).
Additional file 5: Pathway map SIvit. Vitamins and cofactor pathways(see also Additional file 2).
Competing interestsThe authors declare that they have no competing interests.
Authors’ contributionsNS, JFGD, AL, SB, MCZ, AB, and MTH conceived and designed the experiments.NS, JFGD, and SB performed the experiments. NS and JFGD analyzed the data.AL, SE, MCZ, and AB contributed materials and analysis tools. NS, AB, and MTHwrote the manuscript. All authors read and approved the final manuscript.
AcknowledgementsThe authors wish to thank Pr. H. Lefebvre and Dr. E. Louiset (University Hospitaland University of Rouen, France) for kindly providing tissue samples fromcontrol adrenal glands, and Pr. PF. Plouin (Hopital Europeen GeorgePompidou, Paris, France) and the COMETE network for providing adrenaltumor samples. Furthermore, the authors would like to thank MartinSigurdsson for providing us with the growth medium conditions.This work was supported in part by PHRC grant AOM 06 179 and by grantsfrom INSERM and Ministere Delegue a la Recherche et des NouvellesTechnologies for the COMETE Network. This work was furthermore funded bythe Agence Nationale pour la Recherche (ANR Physio 2007, No.: 013-01, to:MCZ, AB), the Fondation pour la Recherche sur l’Hypertension Arterielle (AO2007, to: MCZ, AB), and the Genopole Evry (to: AB), and by DeutscheForschungsgemeinschaft (grant HU-937/8-1 to MTH) JFGD is a recipient of aCoNaCyT Ph.D. fellowship from the Mexican government (No.:207676/302245). NS was supported by a Jacobs University scholarship. Allauthors have read and approved the manuscript.
Author details1School of Engineering and Science, Jacobs University Bremen, CampusRing 1, 28759 Bremen, Germany. 2Institut des Hautes Etudes Scientifiques —Centre National de la Recherche Scientifique, Bures-sur-Yvette, France.3LPTMC CNRS UMR 7600, Universite Pierre et Marie Curie-Paris 6, 4 placeJussieu, 75252 Paris Cedex 05, France. 4Vaccine Research Institute, INSERMU955, Institut Mondor de Recherche Biomedicale, Universite Paris-Est Creteil,Creteil, France. 5INSERM, U970, Paris Cardiovascular Research Center, Paris,France. 6University Paris Descartes, Paris, France.
Received: 16 November 2011 Accepted: 14 April 2012Published: 14 May 2012
References1. Feist AM, Herrgard M J, Thiele I, Reed JL, Palsson BØ: Reconstruction of
biochemical networks in microorganisms. Nat Rev Microbiol 2009,7(2):129–43.
2. Joyce AR, Palsson BØ: The model organism as a system: integrating’omics’ data sets. Nat Rev Mol Cell Biol 2006, 7(3):198–210.
3. Price ND, Reed JL, Palsson BØ: Genome-scale models of microbial cells:evaluating the consequences of constraints. Nat Rev Microbiol 2004,2(11):886–897.
4. Varma A, Palsson BØ: Stoichiometric flux balance modelsquantitatively predict growth and metabolic by-product secretionin wild-type Escherichia coli W3110. Appl Environ Microbiol 1994,60(10):3724–3731.

Sonnenschein et al. BMC Systems Biology 2012, 6:41 Page 13 of 13http://www.biomedcentral.com/1752-0509/6/41
5. Edwards JS, Palsson BØ: The Escherichia coli MG1655 in silicometabolic genotype: its definition, characteristics, and capabilities.Proc Natl Acad Sci USA 2000, 97(10):5528–5533.
6. Duarte N, Herrgard MJ, Palsson BØ: Reconstruction and validation ofSaccharomyces cerevisiae iND750, a fully compartmentalizedgenome-scale metabolic model. Genome Res 2004, 14(7):1298–1309.
7. Duarte NC, Becker SA, Jamshidi N, Thiele I, Mo ML, Vo TD, Srivas R, PalssonBØ: Global reconstruction of the human metabolic network basedon genomic and bibliomic data. Proc Natl Acad Sci USA 2007,104(6):1777–82.
8. Shlomi T, Cabili M, Herrgard M, Palsson BØ, Ruppin E: Network-basedprediction of human tissue-specific metabolism. Nat Biotechnol 2008.
9. Boulkroun S, Samson-Couterie B, Dzib JFG, Lefebvre H, Louiset E, Amar L,Plouin PF, Lalli E, Jeunemaitre X, Benecke A, Meatchi T, Zennaro MC:Adrenal cortex remodeling and functional zona glomerulosahyperplasia in primary aldosteronism. Hypertension 2010,56(5):885–92.
10. Akesson M, Forster J, Nielsen J: Integration of gene expression datainto genome-scale metabolic models. Metab Eng 2004, 6(4):285–93.
11. Jerby L, Shlomi T, Ruppin E: Computational reconstruction oftissue-specific metabolic models: application to human livermetabolism. Mol Syst Biol 2010, 6:401.
12. Colijn C, Brandes A, Zucker J, Lun DS, Weiner B, Farhat MR, Cheng TY,Moody DB, Murray M, Galagan JE: Interpreting expression data withmetabolic flux models: predicting Mycobacterium tuberculosismycolic acid production. PLoS Comput Biol 2009, 5(8):e1000489.
13. Jensen PA, Papin JA: Functional integration of a metabolic networkmodel and expression data without arbitrary thresholding.Bioinformatics 2011, 27(4):541–547.
14. Becker SA, Palsson BØ: Context-specific metabolic networks areconsistent with experiments. PLoS Comput Biol 2008, 4(5):e1000082.
15. Sonnenschein N, Geertz M, Muskhelishvili G, Hutt MT: Analog regulationof metabolic demand. BMC Syst Biol 2011, 5:40.
16. Eilebrecht S, Pellay FX, Odenwalder P, Brysbaert G, Benecke BJ, Benecke A:EBER2 RNA-induced transcriptome changes identify cellularprocesses likely targeted during Epstein Barr Virus infection. BMCRes Notes 2008, 1:100.
17. Schellenberger J, Park JO, Conrad TM, Palsson BØ: BiGG: a BiochemicalGenetic and Genomic knowledgebase of large scale metabolicreconstructions. BMC Bioinf 2010, 11:213.
18. Phang JM, Donald SP, Pandhare J, Liu Y: The metabolism of proline, astress substrate, modulates carcinogenic pathways. Amino acids2008, 35(4):681–690.
19. Maslov S, Krishna S, Pang TY, Sneppen K: Toolbox model of evolution ofprokaryotic metabolic networks and their regulation. Proc Natl AcadSci USA 2009, 106(24):9743–8.
20. Montanez R, Medina MA, Sole RV, Rodrıguez-Caso C: When metabolismmeets topology: Reconciling metabolite and reaction networks.BioEssays: News Rev Mol Cell Dev Biol 2010, 32(3):246–56.
21. Hucka M, Finney A, Sauro HM, Bolouri H, Doyle JC, Kitano H, Arkin AP,Bornstein BJ, Bray D, Cornish-Bowden A, Cuellar AA, Dronov S, Gilles ED,Ginkel M, Gor V, Goryanin II, Hedley WJ, Hodgman TC, Hofmeyr JH, HunterPJ, Juty NS, Kasberger JL, Kremling A, Kummer U, Novere NL, Loew LM,Lucio D, Mendes P, Minch E, Mjolsness ED, Nakayama Y, Nelson MR,Nielsen PF, Sakurada T, Schaff JC, Shapiro BE, Shimizu TS, Spence HD,Stelling J, Takahashi K, Tomita M, Wagner J, Wang J, Forum S: Thesystems biology markup language (SBML): a medium forrepresentation and exchange of biochemical network models.Bioinformatics 2003, 19(4):524–31.
22. Letavernier E, Peyrard S, Amar L, Zinzindohoue F, Fiquet B, Plouin PF:Blood pressure outcome of adrenalectomy in patients with primaryhyperaldosteronism with or without unilateral adenoma. J Hypertens2008, 26:1816–23.
23. Boulkroun S, Samson-Couterie B, Golib-Dzib JF, Amar L, Plouin PF, SibonyM, Lefebvre H, Louiset E, Jeunemaitre X, Meatchi T, Benecke A, Lalli E,Zennaro MC: Aldosterone-Producing Adenoma Formation in theAdrenal Cortex Involves Expression of Stem/Progenitor CellMarkers. Endocrinology 2011, en.2011-1205.
24. Sigurdsson MI, Jamshidi N, Jonsson JJ, Palsson BO: Genome-scalenetwork analysis of imprinted human metabolic genes. Epigenetics:Official J DNA Methylation Soc 2009, 4:43–6.
25. Kharchenko P, Church GM, Vitkup D: Expression dynamics of a cellularmetabolic network. Mol Syst Biol 2005, 1:2005.0016.
26. Barik J, Parnaudeau S, Lampin-Saint-Amaux A, Guiard BP, Golib-Dzib JF,Bocquet O, Bailly A, Benecke A, Tronche F: Glucocorticoid receptors indopaminoceptive neurons, key for cocaine, are dispensable formolecular and behavioral morphine responses. Biol Psychiatry 2010,68:231–9.
27. Brysbaert G, Pellay FX, Noth S, Benecke A: Quality assessment oftranscriptome data using intrinsic statistical properties. GenomicsProteomics Bioinf January 2010, 8(1):57–71.
28. Noth S, Brysbaert G, Pellay F-X, Benecke A: High-sensitivitytranscriptome data structure and implications for analysis andbiologic interpretation. Genomics Proteomics Bioinf 2006, 4:212–29.
doi:10.1186/1752-0509-6-41Cite this article as: Sonnenschein et al.: A network perspective on metabolicinconsistency. BMC Systems Biology 2012 6:41.
Submit your next manuscript to BioMed Centraland take full advantage of:
• Convenient online submission
• Thorough peer review
• No space constraints or color figure charges
• Immediate publication on acceptance
• Inclusion in PubMed, CAS, Scopus and Google Scholar
• Research which is freely available for redistribution
Submit your manuscript at www.biomedcentral.com/submit