
a model of the effects of change in communication - TTU ...
249
-
Upload
khangminh22 -
Category
Documents
-
view
0 -
download
0
Transcript of a model of the effects of change in communication - TTU ...


Copyright 1985 by Larry Meile
A MODEL OF THE EFFECTS OF CHANGE IN COMMUNICATION
TECHNOLOGY ON THE SOURCES OF INFORMATION
FOR ORGANIZATIONAL DECISION MAKING
by
LARRY CARL MEILE, B,S,, M.B,A.
A DISSERTATION
IN
BUSINESS ADMINISTRATION
Submlt^ted to the Graduate Faculty of Texas Tech University in
Partial Fulfillment of the Requirements for
the Degree of
DOCTOR OF BUSINESS ADMINISTRATION
Approved
August, 1985
^^^O.^^ ABSTRACT r The technology supporting computer assisted communica
tion (CAC) is becoming an increasingly significant factor
affecting the decision-making process. Current models do
not adequately represent this situation.
A framework is synthesized from literature represen
ting three fields of study: management information sys
tems, communication, and decision making. The framework
views all available decision-making information as either
currently residing In the mind of the decision maker or
being provided through communication sources. Furthermore,
the communication sources are divided into a formal (system
supplied) versus informal (non-system supplied) dichotomy.
A conceptual model is then created, based on the
framework, that is useful in qualitatively assessing the
effects of installing or upgrading CAC on the decision
making information that is available to the decision maker.
This model Is then used as a basis for analyzing some of
the cost/benefit tradeoffs of employing CAC.
The primary contribution of this research is a model
that provides a tool for analyzing the effects of CAC
technology on the source of decision-making information and
on the cost of making decisions using CAC.
ACKNOWLEDGEMENTS
The "term paper" is done. The faculty, students, and
staff in the Area of Information Systems and Quantitative
Sciences in the College of Business Administration at Texas
Tech have provided moral and material support that has been
vital to the completion of this project. Reflecting back
upon the five years spent at Tech, I remember, with appre
ciation, many who have been helpful. I would like to
specifically thank several who have made a special contri
bution.
Dr. Jim Courtney has created an atmosphere that is
relaxed yet productive. His concern for the doctoral stu
dents in this program is exemplary. His guidance has
helped mold fuzzy ideas and vague notions into the research
presented here. Dr. Jim Burns has, likewise, contributed
heavily. He has provided me with a role model by exhibi
ting a level of excellence that will take me a lifetime to
emulate. Dr, Ralph Bravoco receives my appreciation for
his objective assistance and encouragement.
My fellow graduate students who offered friendship,
ideas, stimulation, challenges, and support are fondly
remembered. They are some of the finest, both personally
and academically. Among them are Larry Sanders, Michael
Wang, Bharat Ruparel, Darrell Eubanks, Steven Loy, Ranjan
ii

Kini, and Greg Taylor. To Nicki Johnston goes special
thanks for her editorial expertise and support.
Now on to Boston...and the world.
iii
TABLE OF CONTENTS
ACKNOWLEDGEMENTS 11
LIST OF FIGURES vi
I. INTRODUCTION 1
Why A New Model? 1
The Organization of the Dissertation . . . . 3
II, STATEMENT OF THE PROBLEM 5
Introduction 5 Research That Has Revealed the Problem , . . 7
What Needs to be Done 10
III. LITERATURE REVIEW 13
Introduction 13 An Organizational Perspective 13 The MIS Literature 18 The Communication Literature 29 The Decision-making Literature . . . . . . . 55 The Effects of Technology on Organizational Communication 70
A Recap 78 IV. THE RESEARCH SETTING 79
Overview 79 The Organization 80 The Information System 90 A Need 102
V. FRAMEWORK DEVELOPMENT 103
A Basis for the Framework 103 Formal Versus Informal Communication . . . . Ill Putting the Combined Model
Into the Decision-making Context 114 A Recap 118
VI. THE FORMAL/INFORMAL COMMUNICATION MODEL . , . 119
Model Development 119 The Effects of Employing CAC 141
iv
Various Decision-making Environments Represented by the Model 157
Potential Applications of the Model 168 A Recap 174
VII. COST ASPECTS OF DECISION MAKING 175
Good Decisions 175 The Effects of
Lower Information Cost 180 Relaxing the Assumptions 187 A Recap 198
VIII. CONTRIBUTIONS, LIMITATIONS AND FURTHER RESEARCH 199
Objectives of the Research 199 Contributions of the Research 200 Limiting Assumptions 203 Further Research 205
BIBLIOGRAPHY 208
APPENDIX: SALIENT TECHNOLOGICAL TRENDS 222

LIST OF FIGURES
2-1 The Research Sequence 11
3-1 The Leavitt Diamond 14
3-2 The Leavitt Diamond Revised 17
3-3 A Forrester Representation
of a Simple System 21
3-4 The Dearden Framework 22
3-5 The Variables Influencing
Information Systems Design 25
3-6 MIS Research Variables 26
3-7 Three Communication Types 32
3-8 Organizational Information Flows 36
3-9 Communication Network Configurations 40
3-10 Communication Proximity Between A and B . . . . 42
3-11 A Communication Model 45
3-12 Interactive Communication 48
3-13 The Minimal A-B-X System 49
3-14 Westley and MacLean's Model, Part A 52
3-15 Westley and MacLean's Model, Part B 53
3-16 Westley and MacLean's Model, Part C 53
3-17 Westley and MacLean's Model, Part D 54
3-18 The Decision-making Process 62
3-19 Schrenk's Model 64
3-20 A General Model of the Decision Process . . . . 67
3-21 Quantitative Relationships of
the Four Types of Operation 68 vi
3-22 A Stage Model of a Decision 70
4-1 The Five Basic Parts of Oganizations 82
4-2 The Role of Information 90
4-3 The Decision-making Process 97
4-4 An Organizational Information System 99
5-1 A Combined Model for a Given Decision 109
5-2 Amount of Current Communication
Versus Decision Type Ill
5-3 The Formal/Informal Continum 112
5-4 The Basic Communication Framework . 115
6-1 The Additive Nature of Information 124
6-2 Information Yielded by Data 125
6-3 Decision Quality Versus the
Amount of Relevant Information 128
6-4 The Basic Formal/Informal Model 135
6-5 The Effects of Technological Limitations . . . . 138
6-6 Plotting the Information Sourcing
for a Given Decision 139 6-7 Formal Communication Does Not Change
But Informal Communication May Increase . . . . 144 6-8 Information Cost Is Reduced But Neither
Formal or Informal Communication Change . . . . 145
6-9 Changes Made in the Basic Framework by Introducing CAC 146
6-10 Formal Communication Increases While Informal Communication Stays Constant 147
6-11 Both Formal and Informal Communication Increases 148
vii
6-12 The Formal System Now Supplies Some of the Previously Informal Information 150
6-13 Formal Communication Increases But Informal Communication Decreases 154
6-14 Formal Communication Is Unchanged
But Informal Communication Decreases 155
6-15 A Summary of the Cases Presented 156
6-16 Decisions Classified by Level 158
6-17 Decisions Classified by Amount of Structure . . 160
6-18 Decisions Classified by Degree of Complexity . . 162
6-19 Decisions Classified by Frequency of Occurrence 163
6-20 Decisions Classified by
Length of Planning Horizon 165
6-21 Decisions Classified by Organizational Type . . 167
6-22 A Hypothetical Example of Plotted Decisions . . 170
7-1 Decision Quality Vs. Amount of Information . . . 177
7-2 Cost/Benefit Relationship Between the Source
of Information and the Quality of Decisions . . 179
7-3 Same Information at a Lower Cost 181
7-4 More Information at the Same Cost 183
7-5 Two Shapes of the C Curve
For Bundled Information 189 7-6 The Appearance of the TC Curve
With Bundled Information 189
7-7 Three Low Cost Candidates 190
7-8 A Simple Decision 192
7-9 Small Subsets of Information
with High Meaning 194
7-10 A Cost/Benefit Diagram with Offset Optimality . 197
viii
CHAPTER I
INTRODUCTION
The giant strides made in the last few years in the
application of computer technology to communication produce
effects that are not adequately accounted for in existing
theoretical models of communication in organizations. The
changes caused by these advances are significant enough to
warrant the development of a new model for viewing the
relationship of the information system to decision making.
The goal of this research was to develop a conceptual
model that expressly includes computer-augmented communi
cation of information in the decision-making process. This
model was synthesized from three disciplines: information
systems, communication, and decision making. It was then
used to analyze the effects of systematizing the informa
tion sources that a decision maker uses when making a
decision.
WhY A New Model?
A model is a representation of a system under study.
It is used to help understand the relationships between the
variables deemed relevant to the behavior of the modeled
system. Those variables deemed relevant will depend upon
the purpose of the model-building exercise. To be useful.
the model must include those factors from the real world
that will influence the model in light of the model-
builder's purposes. At the same time, those factors not
important to the model's performance (again, in light of
the intended purpose) should be omitted. If the importance
of a factor in the real-world changes, or if the purpose
changes, the model must be altered to reflect this change.
In the area of information systems, as it relates to
management decision making, a major change has taken place
in one of the factors: the degree of the decision maker's
access to information and data processing. Rockart and
Scott Morton C19843 point out that remarkable changes have
taken place in the way organizations view their data and
information handling departments. Corporations are
replacing departmental names like "Data Processing" and
"MIS" with "Information Services" and "Information
Technology" to reflect the changes in the services they
offer.
Rockart and Scott Morton list four trends as being
responsible for the corporation's changed viewpoint:
1) the widespread introduction of low-cost personal
computers, 2) the growing availability of user-friendly
software, 3) the profound changes in communication
technologies for the transmission of data, text, and
graphics, and 4) the increasing access to both external
and internal data by decision makers. These changes
provide the decision maker with increasing autonomy from
the traditional data processing groups within an
organization. The structure of, and services yielded by,
these groups is changing to meet the new demands and
challenges.
A basic premise of this research is that increased
access to data processing and communication technology has
changed the set of variables relevant to the existing
models of decision making. As the literature review in
Chapter Three will reveal, current models either completely
ignore or, at best, only weakly recognize the impact of
this new technology. Therefore, the objective of this
dissertation was to develop a framework in which the
communication of information within the decision-making
process is expressly included. This framework was then
used to develop a conceptual model capable of producing a
qualitative analysis of information sourcing and cost.
Ibe Organization of the Dissertation
The problem that was addressed in the study is stated
more completely in the next chapter. Following that.
1 For a more thorough discussion of these trends,
see the Appendix.
Chapter Three provides a survey of literature from the
three fields that this research draws upon: management
information systems, organizational communications, and
decision making. The fourth chapter furnishes an in-depth
discussion of the setting for which the conceptual model
was developed. The fifth chapter presents the basic
framework that has been developed. In the sixth and
seventh chapters, the development of the model is presented
and representative situations are analyzed. The concluding
eighth chapter presents the contributions and some
limitations of the current study and proposes further
research.
CHAPTER II
STATEMENT OF THE PROBLEM
iDtrgduction
The application of computer technology to the firm can
be viewed as having passed through four stages of evolution
with a fifth stage on the horizon. It began with the
automation of transaction processing and was aimed primar
ily at the accounting functions of the organization.
Management received little or no assistance in decision
making. In the second stage, computer-based systems
developed to include the operations level of the firm,
providing services such as production and inventory
control. This stage supported managers by generating
aggregated information and exception reports. The third
stage was characterized by the provision of models to
managers for both structured and unstructured decision
making. For the first time, direct aid was provided to
middle and upper management. A majority of this technology
has been based on mainframe computers which have been
managed by EDP, DP, or MIS organs within the firm.
The fourth stage, which we are currently entering, is
characterized by the advent of personal computers, user-
friendly software, and communication networks. With the
increased availability and reduced cost of computer-
assisted communication (CAC) technology, an opportunity
exists to provide an unprecedented degree of information
access to managers at all levels of the organization. The
introduction of this new technology (both hardware and
software) has provided for a major shift in the way the
firm and the decision maker within that firm manages
information. Rockart and Scott Morton C19841 report that
organizations are making changes to their structure to
reflect this shift.
The next stage, which is not yet existent but is being
worked on, is exemplified by Japan's effort to develop
"fifth generation" technology. The goal of this stage is
to develop systems that exhibit artificial intelligence.
They will be the creators not Just the handlers of communi
cation. Any communication generated by such a system would
be, by definition, systemic in nature and occur in prede
fined situations. It would not be generated on an ad hoc
basis.
CAC can be expected to provide an environment for
improved decision making but it may also generate some
problems that must be managed. While it may be true that
the more traditional means of communication such as face-
to-face meetings, telephone conversations, and memos are
ineffective for rapidly transmitting large volumes of
information, they do have the advantage of being social
acts. As such, they involve the communication of more than
the formal information they are intended to pass. Through
facial expression, tone of voice, or sentence structure,
they convey additional information that can be useful to
the decision maker. It is precisely this type of input
that may not be effectively included in information gained,
for example, from an executive workstation.
Dealing with the issues pertaining to information
systems and communication within the organizational setting
can become complex (Chapter Four provides a discussion of
this setting). The technical aspects of designing and
installing information systems into organizations have
received much attention. Although technical capabilities
are a precondition for system application and are, there
fore, important, they are not in the mainstream of this
research and will be largely ignored.
Eg§?S£Sb ItJ§t Has Revealed the Problem
The behavioral aspects of designing and installing
information systems have been of research interest because
many of the problems associated with making these systems
work well are people-based CSprague and Watson, 1975;
Ginsberg, 1975; Senn, 19783. Much of the research of a
behavioral nature has been targeted at the human aspects of
8
system design in relation to the machine-user interface and
user acceptance of the system. Representative is the work
known as the "Minnesota Experiments" [Dickson, Chervany,
and Senn, 1977 3.
Studies combining the fields of communication and
information systems have, for the most part, focused on
the interaction between the user and the system analyst,
primarily addressing the problem of communicating user
needs to the system designer CDeBrabander and Edstrom,
1977; Monge, 1982; DeBrabander and Thiers, 19843. In these
studies, the inclusion of communication has been directed
at the development phase of the information system life
cycle, not at the use phase. Studies under the heading of
business communication are frequently limited either to
effective oral communication skills in a one-on-one or
group setting [Leavitt,1951; Heise and Miller, 1951; Poole
and Folger, 1981; Taifel, 19823 or to effective office
communications (memos, notices, etc.) [Weinshall, 1979;
Thompson and White, 19813.
Saunders [19813 developed a theoretical framework that
looks at the determinants of departmental power, including
interdepartmental communication. The effects on the
decision-making tasks were not modelled.
Courtney, Loy, and Sanders [1983 3 found evidence that
the success of a decision support system was correlated
with increased organizational communication. What was not
made clear in that study was the nature of the communication
that was improved. Therefore, the authors called for
further research into modelling the patterns and types of
communication found in organizations employing a decision
support system.
Rockart and Scott Morton [1984 3 presented an article
on the implications that changes in information technology
have for corporate strategy. They describe the effects of
computer-augmented communication as shifting the emphasis
in organizations from data processing to information
technology. They state, "Most important, the technology
now affects ntanagement and its actions. ..." However,
in this article they elected to narrowly focus on corporate
strategy and not discuss the effects on the tactics of
decision making.
Lewis states that "...most studies have been conducted
within the last two decades. A number of these investiga
tions are now being augmented with contributions from
anthropology, psychology, and sociology, but placing the
findings of these studies into a managerial-organizational
context has been minimal" [1980, p.63. A search of the
literature yielded only three studies focusing on the
changes made in the organizational communication network by
10
installing a computer-augmented information system [Picot,
Klingenberg, and Kranzle, 1982; Hiltz, 1982; and Rice,
19823.
The results of the literature survey indicate that
there is no MIS framework which specifically integrates
the communication of information into the decision-making
process. Furthermore, there is no underlying model which
explains the effect on decision-making sourcing of
installing or upgrading an automated-information or
computer-augmented communication system.
What Needs To Be Done
Since no satisfactory framework or model exists, and
since the unmodelled effects of CAC may have far-reaching
impacts on both formal and informal systems of communi
cation, a new representation of the problem should be
developed. Ideally, an explanatory model--one that
describes relationships quantitatively and can be tested
empirically--should be generated.
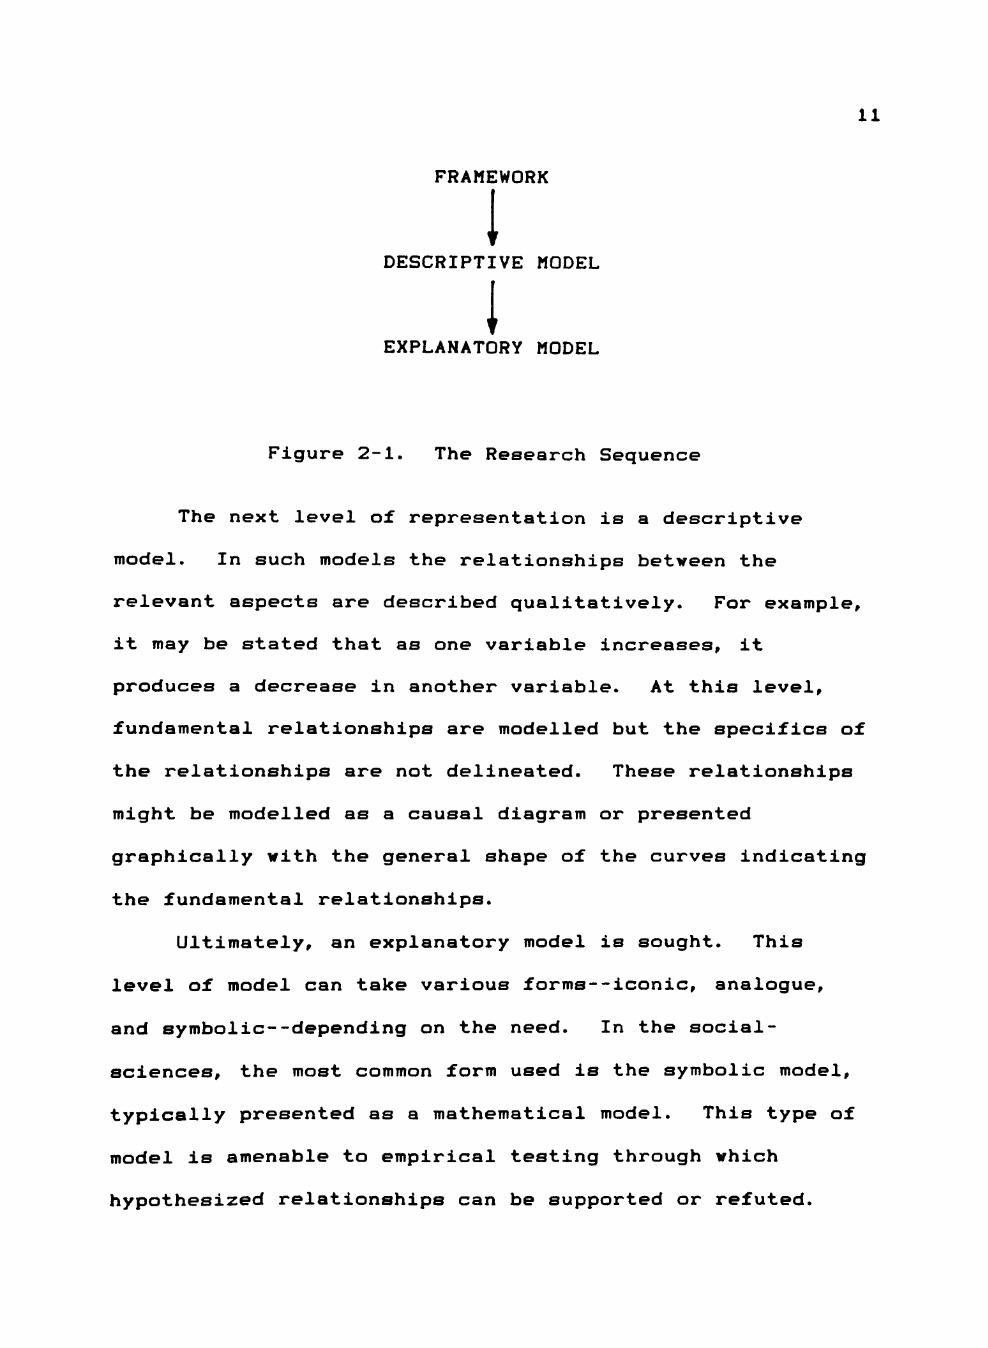
To achieve such a goal, a sequence of progressively
more specific representations are frequently developed.
This sequence is diagrammed in Figure 2-1. The preliminary
representation is usually in the form of a framework. A
framework describes the relevant aspects of the problem but
is insufficiently complete to allow analysis to be done.
11
FRAMEWORK
1 DESCRIPTIVE MODEL
1 EXPLANATORY MODEL
Figure 2-1. The Research Sequence
The next level of representation is a descriptive
model. In such models the relationships between the
relevant aspects are described qualitatively. For example,
it may be stated that as one variable increases, it
produces a decrease in another variable. At this level,
fundamental relationships are modelled but the specifics of
the relationships are not delineated. These relationships
might be modelled as a causal diagram or presented
graphically with the general shape of the curves indicating
the fundamental relationships.
Ultimately, an explanatory model is sought. This
level of model can take various forms--iconic, analogue,
and symbolic--depending on the need. In the social-
sciences, the most common form used is the symbolic model,
typically presented as a mathematical model. This type of
model is amenable to empirical testing through which
hypothesized relationships can be supported or refuted.
12
In this dissertation, the representation of the
problem will be taken only to the descriptive level.
Qualitative relationships will be expressed allowing a
conceptual analysis of the effects of CAC. Therefore, the
goal of this research is to develop a useful descriptive
model for the study of the effects of computer augmentation
of the information sources used during the decision-making
process. The next chapter reviews the previous research
that provided a basis for the development of the model.
CHAPTER III
LITERATURE REVIEW
The literature relevant to this study comes primarily
from three disciplines: management information systems,
organizational communication, and decision making. The
management information system (MIS) literature provides a
context in which to study the information flows necessary
when computer-aided decisions are made. The area of
organizational communication supplies the background
necessary for understanding what communication is and how
it affects the transmission of information between people.
Finally, the models available from the decision-making
literature give a starting point for developing an
information system, decision-making framework. After the
literature representing these three fields is reviewed, the
research investigating the effects of technology on
organizational communication is presented. The application
of all of these studies is embedded in the organization. A
look at ideas spawned by Leavitt will furnish an organiza
tional perspective.
An Organizational Perspective
Leavitt [19653 presents a survey of several approaches
13
14
to organizational change and then discusses in detail what
he calls "people approaches"--what others refer to as
behavioral approaches. The discussion centers on a four-
factor characterization of industrial organizations, the
task, the actors, the technology, and the structure. These
factors are presented in a diagram (the Leavitt Diamond--
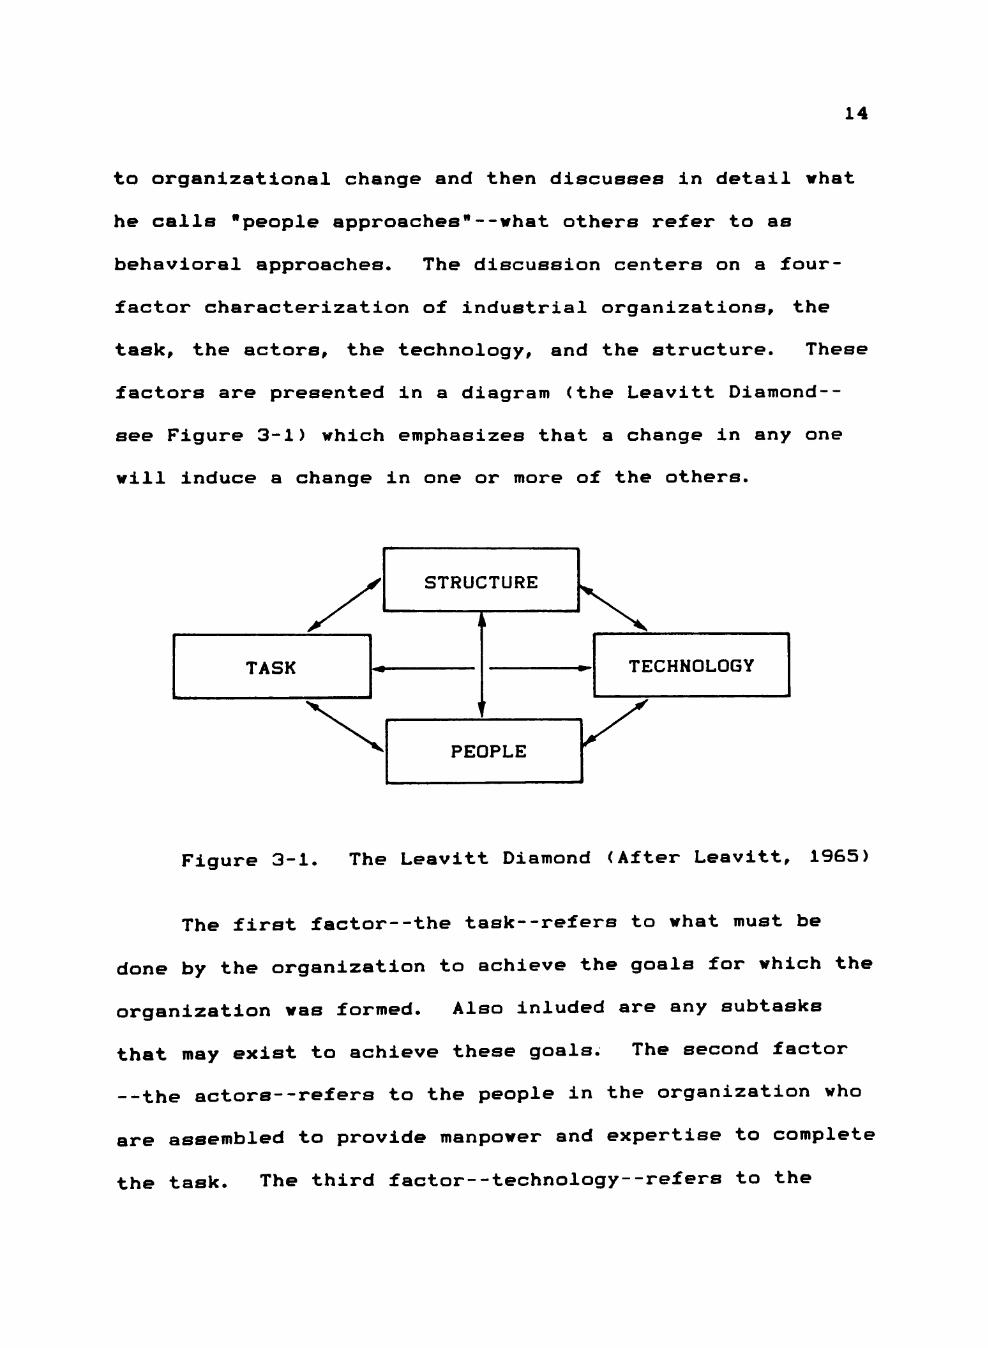
see Figure 3-1) which emphasizes that a change in any one
will induce a change in one or more of the others.
TECHNOLOGY
Figure 3-1, The Leavitt Diamond (After Leavitt, 1965)
The first factor--the task--refers to what must be
done by the organization to achieve the goals for which the
organization was formed. Also inluded are any subtasks
that may exist to achieve these goals. The second factor
--the actors--refers to the people in the organization who
are assembled to provide manpower and expertise to complete
the task. The third factor--technology--refers to the
15
tools employed by the actors in their pursuit of the task-
oriented goals. The last factoz structure--refers to the
system that defines and provides communication, authority,
and workflow paths. The important concept Leavitt presents
is that all interact with each other in such a manner that
a change in one precipitates a resulting change in the
others.
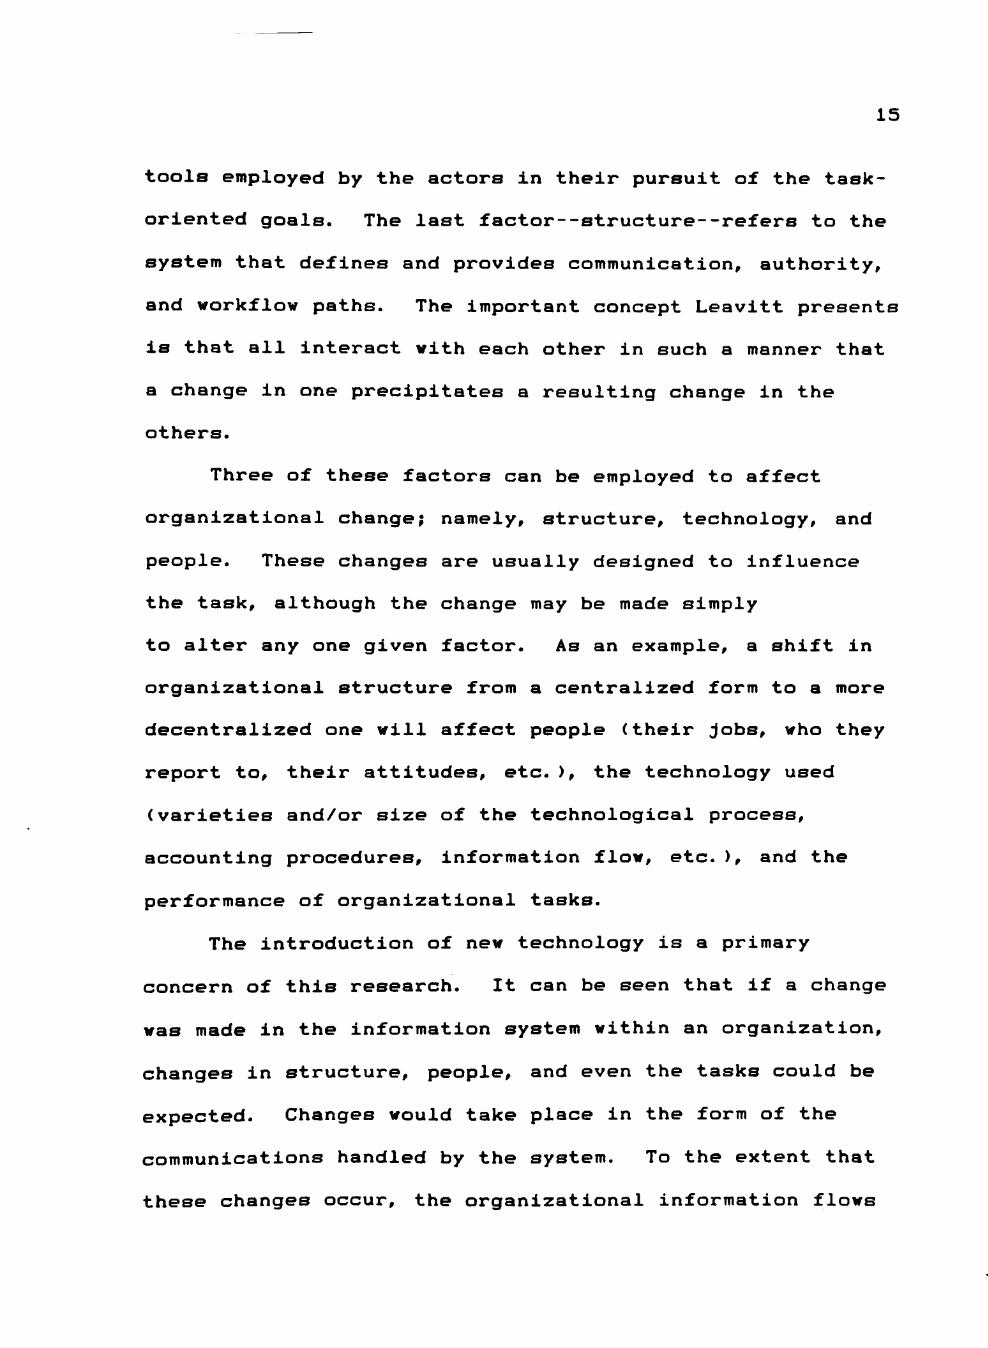
Three of these factors can be employed to affect
organizational change; namely, structure, technology, and
people. These changes are usually designed to influence
the task, although the change may be made simply
to alter any one given factor. As an example, a shift in
organizational structure from a centralized form to a more
decentralized one will affect people (their Jobs, who they
report to, their attitudes, etc.), the technology used
(varieties and/or size of the technological process,
accounting procedures, information flow, etc.), and the
performance of organizational tasks.
The introduction of new technology is a primary
concern of this research. It can be seen that if a change
was made in the information system within an organization,
changes in structure, people, and even the tasks could be
expected. Changes would take place in the form of the
communications handled by the system. To the extent that
these changes occur, the organizational information flows
16
will be affected. The number of people, the skills they
need to exhibit, and their activities could also change.
As an example, picture the effects of introducing a
system capable of handling electronic mail. Decision
makers will now be able to receive information from other
system users on a video display terminal. Because of this,
old modes of communicating will be disrupted. Advantages
in speed of information transfer will accrue at the expense
of the spontaneity and flexibility found in face-to-face
contacts. To make efficient use of this facility, users
will need to learn how to use the system and how to type
(at least to some degree). The demand for some skills may
diminish, e.g., the need for stenographers to take
dictation and transcribe memos. The users will have to
experiment to find out when the system will be an aid and
when it will be a hindrance. These, and other, behavioral
changes will occur and need to be managed.
The preceding discussion shows that to affect
organizational change, management can change the structure,
technology, or people. Given this, the model can be viewed
as having the task fixed. For any given task (for example,
a specific product to produce), the other three factors are
developed and combined to create an organization that can
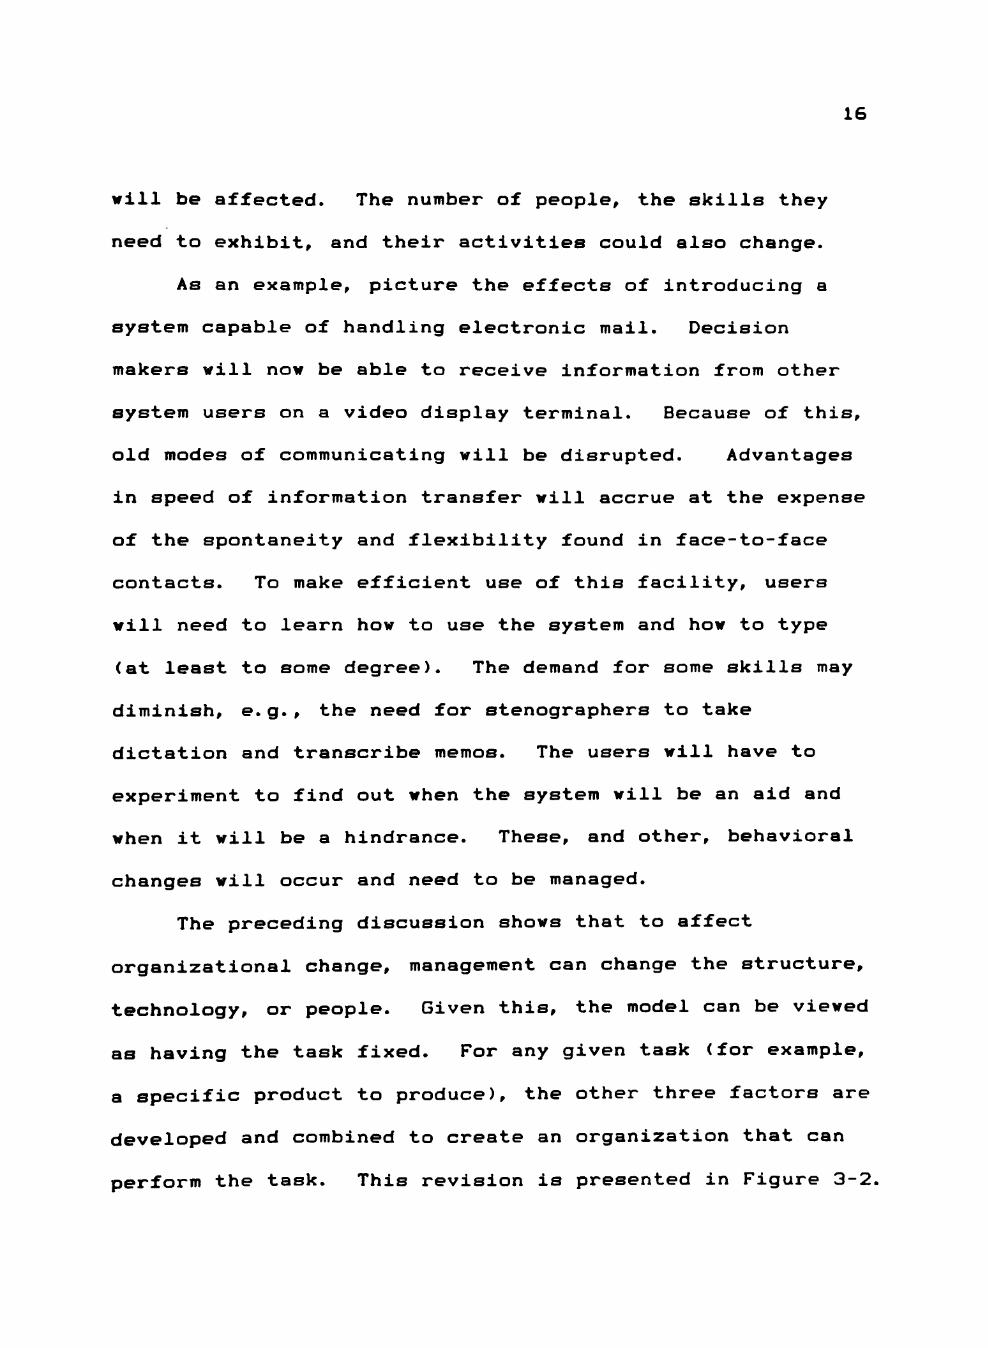
perform the task. This revision is presented in Figure 3-2i
17
EXTERNAL ENVIRONMENT
Figure 3-2. The Leavitt Diamond Revised
In the revised model, the task is now the foundation
of the diamond. Appropriately, the system is on top as an
umbrella providing the internal environment which links the
others. The addition of a representation of an external
environment shows that each component has a part in
buffering the organizaton from its destabilizing effects.
Do all organizations have the task as the foundation?
Consider an apparent counterexample, a situation where a
given technology exists for which a task is sought (for
example, finding applications for laser technology).
Notice, however, that the organization that exists to
discover applications is still task driven, the task being
to apply the technology. A given organization is not
established until an application for the technology is
discovered.
18
The Revised Leavitt Model, therefore, fits the task-
driven model of an organization [Hrebinlak, 19783.
Furthermore, it allows us to take a system view of
organizations; that is, a purposeful, goal-directed set of
subcomponents united to form a whole. When this view is
combined with Leavitt's assertion that a change in any one
of the components will produce a change in one or more of
the others, a resulting model is produced that acts as a
motivation for this research.
The value of the Leavitt model to this research is the
indication that if a technological change takes place,
adjustments must be made. Furthermore, if the task is held
constant, all adjustments will have to be made by the
people and/or the system if the organization is to remain
viable.
Ibt MIS Literature
MIS Frameworks
This research was conducted to provide a new model
embracing aspects of MIS; therefore, looking at existing
frameworks was worthwhile. Three papers provide especially
good reviews of the MIS frameworks that have been
developed. The first is that of Lucas, Clowes, and Kaplan
[19743 who reviewed six frameworks [Simon, 1960; Forrester,
1961; Anthony, 1965; Dearden, 1965; Blumenthal, 1969; and
19
Gorry and Scott Morton, 19713, rating their usefulness for
two groups of people, academicians and practitioners. Some
of these early frameworks were not expressly designed for
MIS but were included because they could be adapted to
provide useful conceptual models of information systems.
For example, Forrester's work [19613 was not targeted at
MIS but it was included because industrial dynamics
emphasizes objectives, decision points, and information
requirements, all constituents of information systems.
Two contemporary papers [Nolan and Wetherbe, 1980;
Ives, Hamilton, and Davis, 19803 reviewed a second set of
frameworks [Gorry and Scott Morton, 1971; Chervany,
Dickson, and Kozar, 1971; Lucas, 1973; Mason and Mitroff,
1973; Mock, 19733. In addition, Nolan and Wetherbe
included an enhancement to Chervany, et al. [Jenkins,
19773.
The scope of these frameworks varies widely. Some
attempt to be comprehensive; others narrow in on some
particular aspect of MIS. This variety has been respon
sible for promoting a wide range of inquiry into the
factors affecting the design, implementation, and operation
of a MIS, A majority of them are not germane to this study
because they do not directly address the issue of informa
tion passed to and from the decision maker. For example.
20
Anthony [19653 provides categories for classifying infor
mation needed for managerial activity, but the framework is
not tied to any particular technology. The means for
supplying the information is not modeled. The ones
reviewed below specifically include information flows.
Forrester
Industrial dynamics by Forrester [19613 views a system
as a network of physical flows that connect sources to
sinks. The sources and sinks are buffers of any type of
entity and are described, in the model, as the level of
some state. Entities flow between states. The flows are
regulated by rates (which can be thought of as valves).
Decisions regarding the rates are made based on fixed and
variable input values (information). Figure 3-3 provides
an example of a Forrester diagram.
One of the strengths of this model is that the rate of
change in the levels can be controlled in a nonlinear
fashion. Another is that the model expressly includes the
concept of information feedback loops. A third strength is
that it treats the organization as a whole, placing strong
emphasis on the management decision process. The model
does not, however, include the behavioral aspects of
decision making.
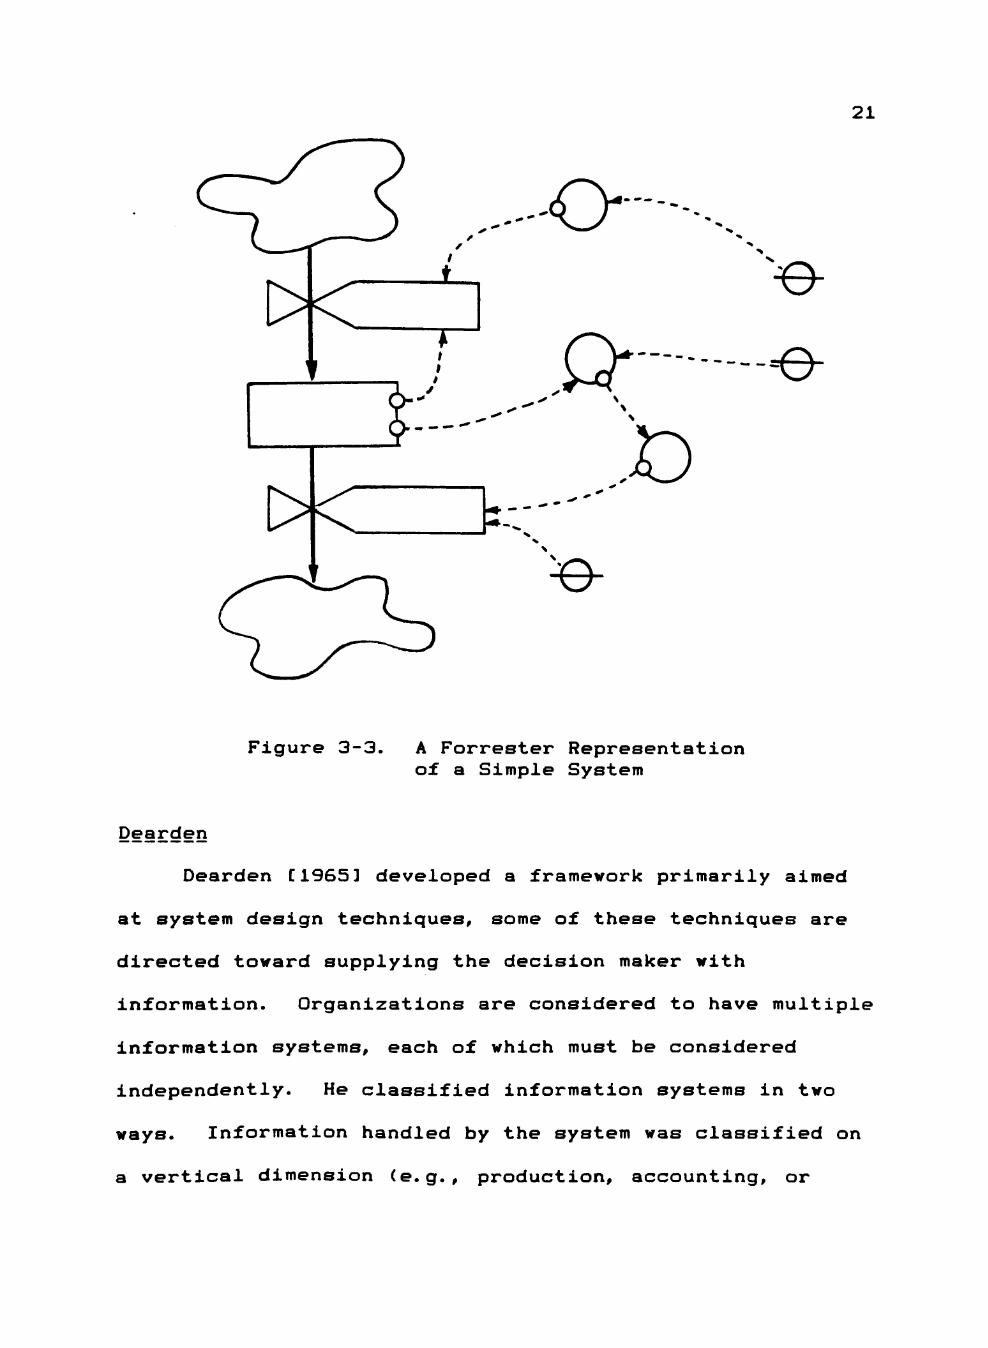
21
.-.-o-e-
h '•e-
Figure 3-3. A Forrester Representation of a Simple System
Dearden
Dearden [1965 3 developed a framework primarily aimed
at system design techniques, some of these techniques are
directed toward supplying the decision maker with
information. Organizations are considered to have multiple
information systems, each of which must be considered
independently. He classified information systems in two
ways. Information handled by the system was classified on
a vertical dimension (e.g., production, accounting, or

22
personnel subsystems), each one viewed as an independent
system. The tasks involved in creating an information
system were cast on a horizontal dimension. These sub
systems include three functions: system specification,
hardware and software procurement, and applications
programming. Figure 3-4 represents Dearden's arrangement.
T Y P E 0 F W O R K (Stages of the system development process)
T Y P E
0 F
I N F 0 R M A T I 0 N
ACCOUNTING
PRODUCTION
PERSONNEL
•
•
•
etc.
System Specification
(define what the user wants)
Done at the
user level
Data Processing Information
(development of systems
applications)
Done by the
data base
management
group
Programming
(development of special
applications)
Done by the
programming
group
Figure 3-4. The Dearden Framework
Concerning this framework's ability to model
information flows, the functional subsystems outlined are
23
useful in systems analysis and design but the decision
process is not well represented.
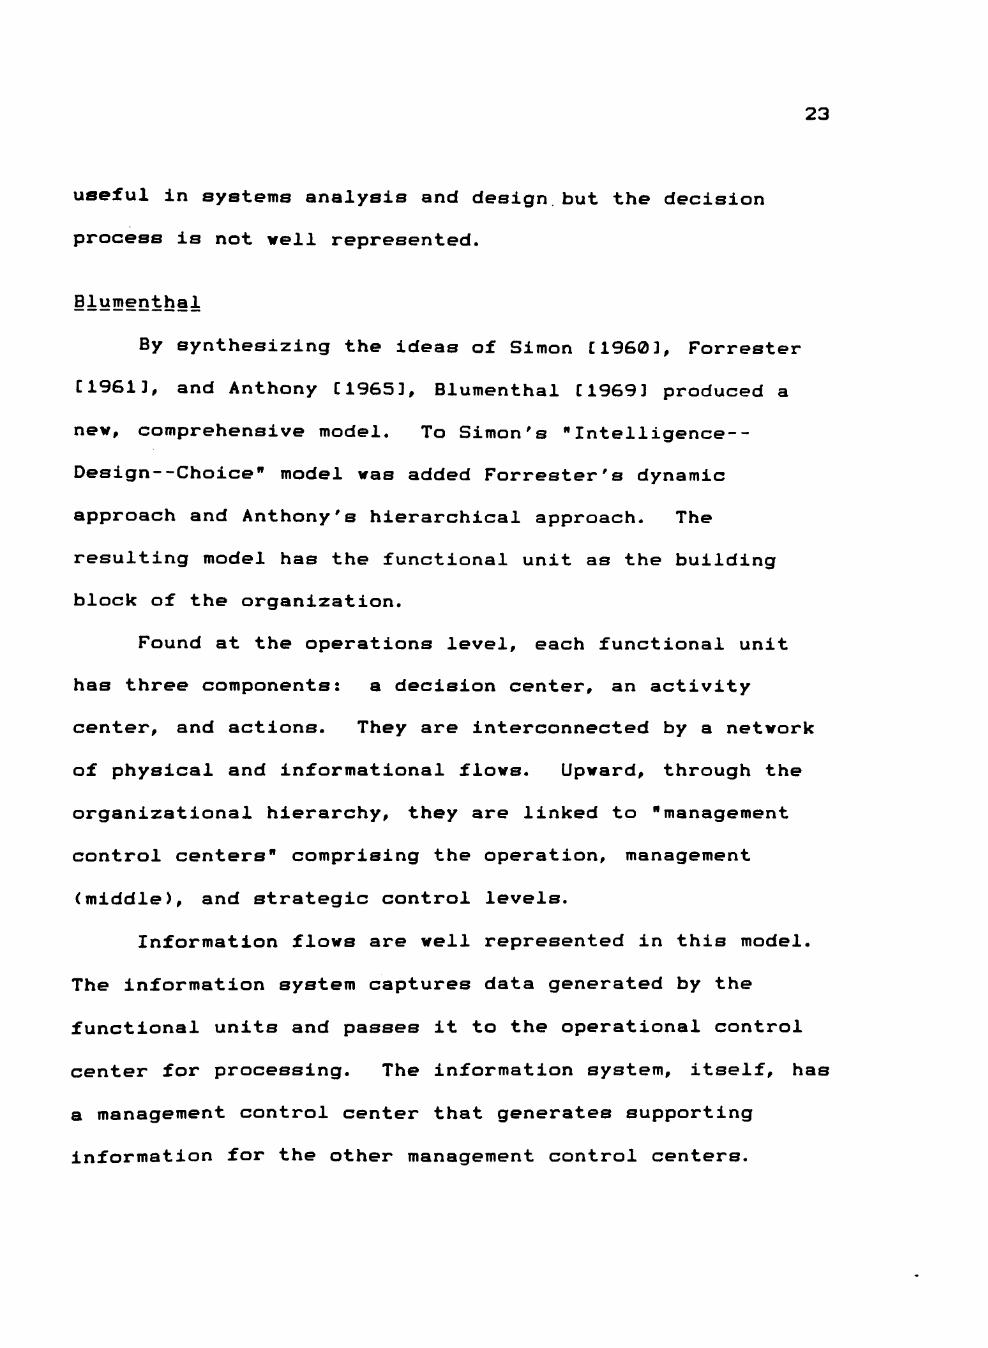
iiyiD^otbai
By synthesizing the ideas of Simon [19603, Forrester
[19613, and Anthony [19653, Blumenthal [19693 produced a
new, comprehensive model. To Simon's "Intelligence--
Design--Choice" model was added Forrester's dynamic
approach and Anthony's hierarchical approach. The
resulting model has the functional unit as the building
block of the organization.
Found at the operations level, each functional unit
has three components: a decision center, an activity
center, and actions. They are interconnected by a network
of physical and informational flows. Upward, through the
organizational hierarchy, they are linked to "management
control centers" comprising the operation, management
(middle), and strategic control levels.
Information flows are well represented in this model.
The information system captures data generated by the
functional units and passes it to the operational control
center for processing. The information system, itself, has
a management control center that generates supporting
information for the other management control centers.
24
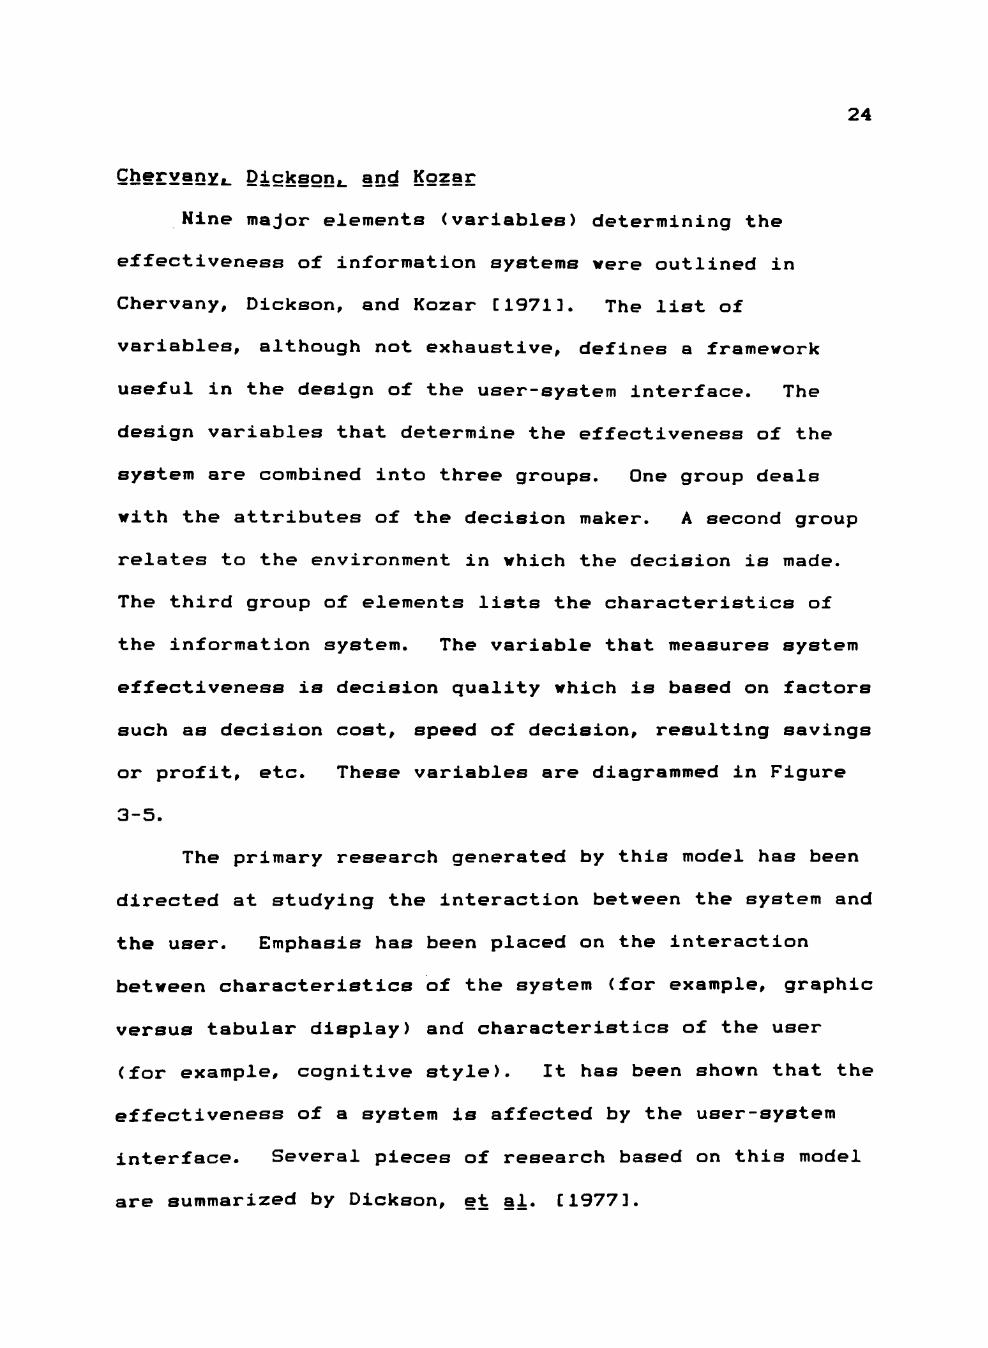
Qb®3CvanYi. Dickson,, and Kozar
Nine major elements (variables) determining the
effectiveness of information systems were outlined in
Chervany, Dickson, and Kozar [19713. The list of
variables, although not exhaustive, defines a framework
useful in the design of the user-system interface. The
design variables that determine the effectiveness of the
system are combined into three groups. One group deals
with the attributes of the decision maker. A second group
relates to the environment in which the decision is made.
The third group of elements lists the characteristics of
the information system. The variable that measures system
effectiveness is decision quality which is based on factors
such as decision cost, speed of decision, resulting savings
or profit, etc. These variables are diagrammed in Figure
3-5.
The primary research generated by this model has been
directed at studying the interaction between the system and
the user. Emphasis has been placed on the interaction
between characteristics of the system (for example, graphic
versus tabular display) and characteristics of the user
(for example, cognitive style). It has been shown that the
effectiveness of a system is affected by the user-system
interface. Several pieces of research based on this model
are summarized by Dickson, et al. [1977 3.
25
Independent Variables
Dependent Variables
The Decision Maker
The Decision
Environment
The Characteristics of the I. S.
Decision Effectiveness
Figure 3-5. The Variables Influencing Information Systems Design (from Chervany, Dickson, and Kozar, 1977)
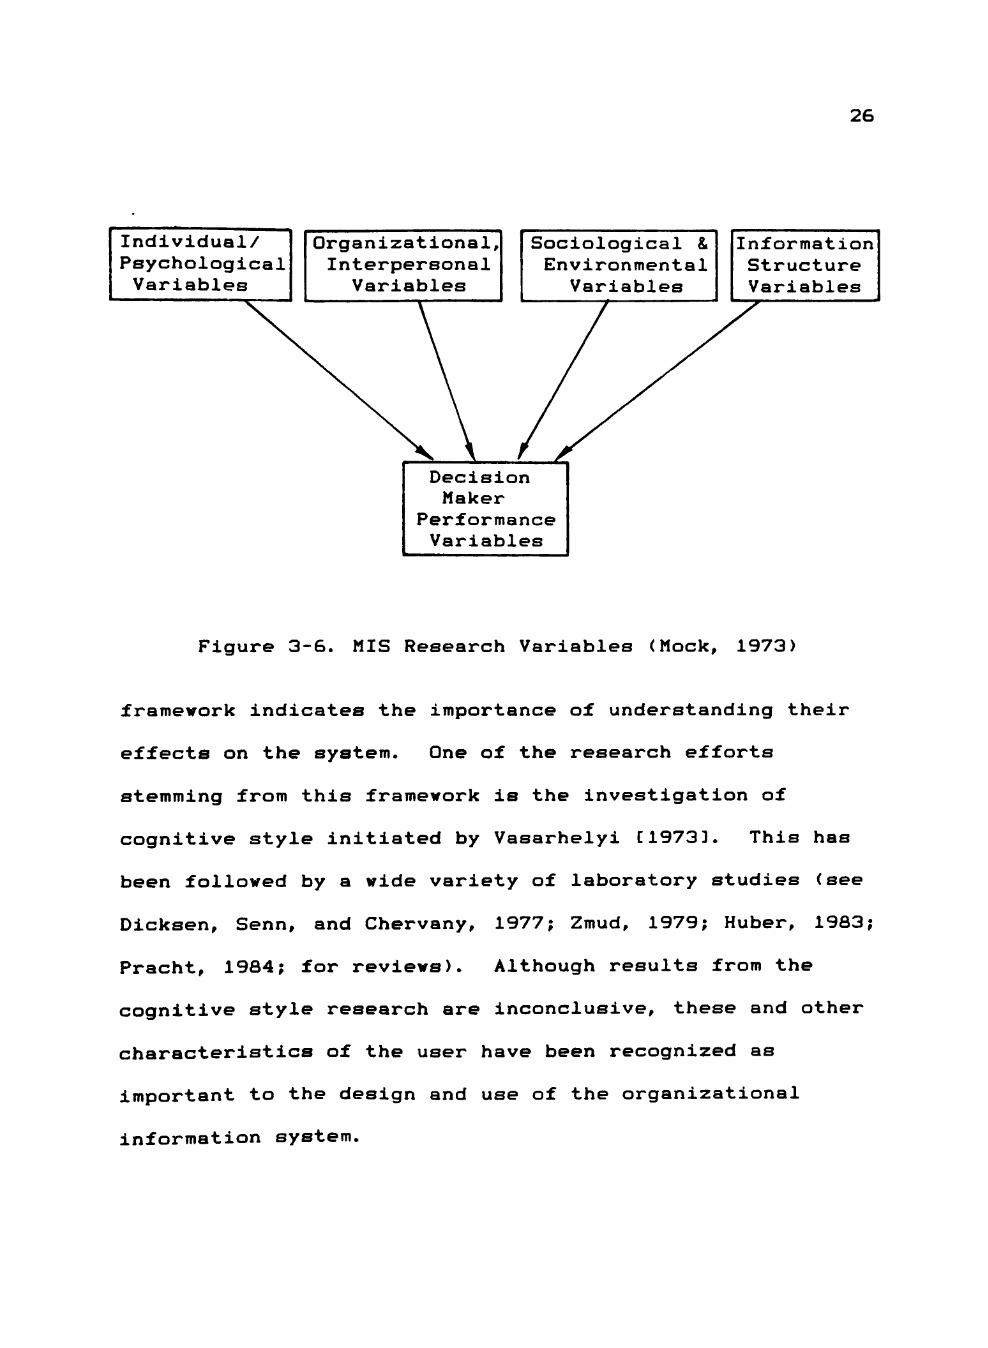
Mock
Mock [1973 3 offered a framework that guided research
into the impact of behavioral constraints on system design,
specifically the behavioral characteristics of decision
makers. Five classes of variables were described. They
include individual/psychological variables, organizational,
and interpersonal variables, sociological and environmental
variables, information variables, and decision maker
performance variables. A diagram of these variable classes
is presented in Figure 3-6.
These variables, to a large extent, are determined by
the particular setting (the technology, task, and people)
in which the system is being designed. Because of this,
the variables need to be considered, to a similar extent.
as givens to the system designer. Therefore, this
26
Individual/ Psychological Variables
Organizational, Interpersonal
Variables
Sociological & Environmental
Variables
Decision Maker
Performance Variables
Information Structure Variables
Figure 3-6. MIS Research Variables (Mock, 1973)
framework indicates the importance of understanding their
effects on the system. One of the research efforts
stemming from this framework is the investigation of
cognitive style initiated by Vasarhelyi [19733. This has
been followed by a wide variety of laboratory studies (see
Dicksen, Senn, and Chervany, 1977; Zmud, 1979; Huber, 1983;
Pracht, 1984; for reviews). Although results from the
CO gnitive style research are inconclusive, these and other
characteristics of the user have been recognized as
important to the design and use of the organizational
information system.
27
MasQD and Mitroff
The first comprehensive framework for MIS research was
presented by Mason and Mitroff [19733 and is derived from
their definition of an information system:
An information system consists of, at least, one PERSON of a certain PSYCHOLOGICAL TYPE who faces a PROBLEM within some ORGANIZATIONAL CONTEXT for which he needs EVIDENCE to arrive at a solution (i.e., to select some course of action) and that the evidence is made available to him through some MODE OF PRESENTATION.
The key variables that comprise their taxonomy in the
passage above are capitalized.
The psychological types are identified by the Myers-
Briggs Type Indicator which provides four modes of
psychological functioning that indicate how a person
perceives and evaluates the environment.
The problem is classified as structured or
unstructured. The structured problems are further
classified by the degree of certainty under which they are
being made (conditions of certainty, risk or uncertainty).
The unstructured problems are termed "wicked" decision
problems.
The evidence is provided through an inquiring system
of one of five types: data based, single model based,
multiple model based, conflicting model based, and those
based on learning systems. The last three are particularly
suited for unstructured decisions.
28
The organizational context is simply the level at
which the problem appears following Anthony's [1965 3
framework. These three problem types are: strategic
planning, management control, and operational control.
The mode of presentation refers to the method the
system employs to provide information to the decision
maker. Traditional means have been computer-generated
output (printouts and graphs). Other more personal methods
are suggested as an alternative mode. This key variable is
at the heart of the present research. Mason and Mitroff
suggest that "television, radio, films and telephones may
begin to take on more important roles in the MIS of the
future" [p. 4843, The technologies available to the
decision maker for communication have significantly
augmented the traditional modes. All of these potential
modes are not yet employed; nevertheless, techniques such
as teleconferencing, voice messaging, and electronic mail
exist and have provided new modes of presentation.
Although Mason and Mitroff state that "there is a need
to understand more thoroughly the effects of these modes of
presentation on the effectiveness of an MIS design" [p.
484 3, they do not address the effect of the source of the
information. This effect will be incorporated into the
model developed by this research.
29
A Recap
This section has reviewed six MIS frameworks that
specifically address the issue of information flows
(communication) in the design of an information system.
Although none of these frameworks include CAC as a variable
that affects the sourcing of decision-making information,
they serve to provide a context in which to study the
2 computer-aided, decision-making process. Communication,
the transfer of information, is either explicitly or
implicitly included in all these frameworks. Therefore, a
review of the communication literature is warranted and is
presented in the next section.
Xb? QQIDIDyO^Satign Literature
The word "communication" is a key term used in a large
number of disciplines. It refers to diverse concepts such
as transmitted electronic signals (in telecommunications),
the dissemination of information to large groups (mass
communication), the exchange of ideas and feelings
(interpersonal communication) or the effective and
2 One set of literature that may seem appropriate is
that describing data base management system (DBMS) architectures (i.e., a single data base with multiple user access channels, etc,). However, for the purposes of this research, it need not be discussed because if appropriately implemented, the physical architecture of the data base should be transparent to the user.
30
efficient transferral of managerial statements (business
communication takes place. Individuals sending or
communication). A look at the table of contents of
Communication Yearbook 7 [Bostrom (editor), 19833 gives the
following headings which demonstrate the wide range of
topics to which the term communication is relevant:
Information Systems Mass Communication Organizational Communication Intercultural and International Communication Political Communication Instructional Communication Health Communication Human Communication Technology
Philosophy of Communication
Each of these areas has an entire body of knowledge devoted
to it. Communication, therefore, has a plurality of
definitions, many of which are quite irrelevant to this
study.
For the purposes of this research, only the literature
related to interpersonal and intergroup communication will
be included. It would seem, at first glance, that since
this dissertation deals with the effects that electronic
ally transmitted information has on the decision maker, the
electronic communication literature would also be appropri
ate. However, the communication technology, itself, is not
the issue. It will be assumed that the technology employed
in the information system has already been developed and.
31
perhaps, is already in place. What will be studied is the
effect this technology has on the source of information
used in the decision-making process and, therefore, on the
design of information systems.
An appropriate definition of communication when
applied within an organizational context is: "the exchange
of information and the transfer of meaning, " supplied by
Katz and Kahn [1966, p.4283. There are some characteris
tics of communication implicit in this definition. One is
its two-way nature. Although it is not obvious in all
forms of organizational communication, it occurs any time
feedback, either direct or indirect, is present. Another
characteristic of communication is the coding and decoding
process. For information to be exchanged, the sender must
convert it into some codified form which is sent to the
receiver, who must then translate the message into meaning.
The translation process can be hindered if the sender and
receiver have different frames of reference. In the
organization, this problem is particularly likely to arise
when the information is exchanged across system boundaries.
For example, significant differences in frames of reference
may occur between managerial levels or between
organizational departments.

32
Communication Classification Schemes
Three types of communication, classified by their
direction, can be listed: down-line, (from superior to
subordinate), horizontal (between peers), and up-line (fro
subordinate to superior). Figure 3-7 shows the relation
ship of these three communication types.
m
T Up-line Down-line
Horizontal
Figure 3-7. Three Communication Types
Down-line communication is viewed as having five
types, based on content [Smith, Richetto, and Zima; 19723:
1) specific task directives (such as instructions for how a
Job should be done), 2) Job rationale (information designed
to produce an understanding of the task and its relation to
other organizational tasks), 3) information about organiza
tional procedures and practices, 4) feedback to the subord
inate about his or her performance, and 5) indoctrination
of goals (information intended to instill a sense of
mission).

33
Simson [1959, p.1883 defined horizontal communication
as "the lateral exchange of information among people or
units on the same level of organizational authority." Five
purposes were given: task coordination, problem-solving,
information sharing, conflict resolution, and peer support.
It was noted that more horizontal communication could be
found at lower levels of management. Horizontal
communication is also listed by Mintzberg [19793 as the
primary means for actuating the coordinating mechanism of
mutual adjustment.
Smith et al. [19723 categorized up-line communication
into three types based on content: 1) asking questions,
2) providing feedback, and 3) making suggestions. Planty
and Machauer [1952 3 had characterized upward communication
as including subordinates' messages regarding: 1) what
they are doing, 2) unsolved work problems, 3) suggestions
for improvement and, 3) how they feel about their Job,
associates, and the organization.
The value of upward communication to management is
fourfold. It indicates the receptivity of the subordinates
to down-line communication. It facilitates the acceptance
of decisions by encouraging subordinate input to the
decision-making process. It provides feedback as to the
subordinate's understanding of down-line communication.
Finally, it encourages the submission of valuable ideas.
34
Scholz C19623 adds to this list by including the value of
upward communication to management as a source of decision
making information.
Even though up-line communication is a valuable
resource to management it is not without problems. Katz
and Kahn [19663 point out that, at best, it is highly
filtered. This is due to effects caused by both the sender
and the receiver. The sender, the subordinate, is often
motivated to provide information that is incomplete and/or
self-serving because it is used for control purposes by the
receiver, the boss. On the other hand, the receiver, the
manager, often does not give full attention to the commu
nications of the sender because they are considered less
3 important than his or her own communications.
Q^§§^ification by Level of Analysis
Thayer [1968 3 discussed four levels of communication
analysis. The most elemental of these is the interpersonal
level. Involved is a person's sensation and perception at
This brings up the behavioral aspect of communication research. Behavioral issues have been the basis of the majority of research on communication, especially from the areas of psychology, sociology, and management. Although the design and use of information systems are highly affected by the behavioral issues these areas address, they are not of primary interest for this dissertation and, therefore, this body of literature will not be reviewed.
35
a neurological level. Since this level is out of the
perview of organizational communication, Thayer did not
discuss it further.
The second level is the interpersonal level wherein
communication takes place between individuals or among
small groups. This level includes the down-line, horizon
tal, and up-line communication types defined by Katz and
Kahn [1966 3. Included in the interpersonal level are one
way transmissions such as lectures and two-way exchanges
exemplified by conversations. Suggested barriers to
perfect communication include language (problems with the
denotation and connotation of words) and mental set (dif
fering predecessor events or expectations, and defensive
posturing or anxiety on the part of the receiver). Methods
discussed to achieve and maintain communication accuracy
include repetition of the transmitted information by the
sender and feedback from the receiver to the sender.
The third level discussed by Thayer, the organizational
level, describes the information flow through organizational
channels. It has elements in common with interpersonal
communication in that the communicating is done by people.
Following Fayol [19493, three modes of organizational
communication are defined: hierarchical (operationalized
by up-line and down-line communication), horizontal
(operationalized by exchanges between groups at the same
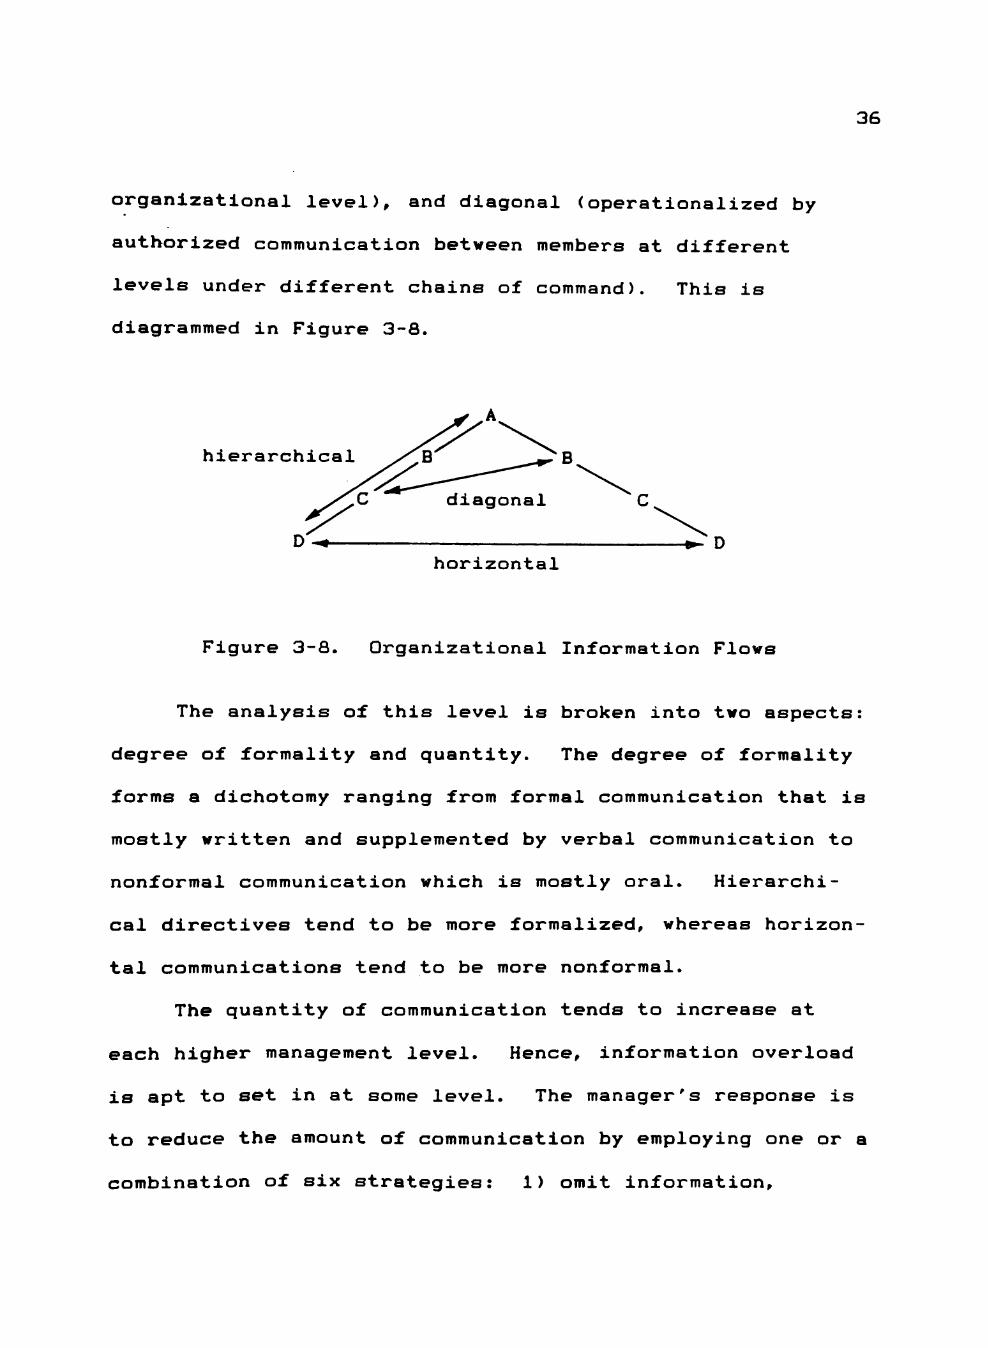
organizational level), and diagonal (operationalized by
authorized communication between members at different
levels under different chains of command). This is
diagrammed in Figure 3-8.
hierarchical
D ^ -• D horizontal
Figure 3-8. Organizational Information Flows
36
The analysis of this level is broken into two aspects:
degree of formality and quantity. The degree of formality
forms a dichotomy ranging from formal communication that is
mostly written and supplemented by verbal communication to
nonformal communication which is mostly oral. Hierarchi
cal directives tend to be more formalized, whereas horizon
tal communications tend to be more nonformal.
The quantity of communication tends to increase at
each higher management level. Hence, information overload
is apt to set in at some level. The manager's response is
to reduce the amount of communication by employing one or a
combination of six strategies: 1) omit information.
37
2) limit sources, 3) queue or delay data (with or without
prioritizing), 4) filtering, 5) data compression, and
6) delegation and/or decentralization. An appropriately
designed information system should achieve a reduction in
information overload while minimizing the deleterious
effects of the listed strategies.
Thayer's fourth level of analysis is the technical
level, one dealing with management communication and
information systems. He breaks communication into three
categories: data, information, and intelligence. His
definitions follow [p 34 3:
Data are facts cataloged according to some scheme for retrieval.
Information is problem related data gathered to provide understanding of a problem.
Intelligence results from analysis o. information so an alternative can be picked.
These three conform, respectively, to the types of
communications handled by the information system
classifications of automatic data processing (ADP),
structured decision systems (SDS), and decision support
systems (DSS) [Gorry and Scott Morton, 1971, p. 613.
The value of information comes from its ability to
create intelligence. Alexander [1974, p.853 commented:
The term information implicitly assumes the existence of usefulness (utility) as distinguished from data (facts) that do not necessarily have any apparent utility. Further, information utility may be realized
38
only when information is transmitted from one data-processing or information-generating system to another. Information when transmitted assumes an economic value because it can modify the behavior of the second system.
Mortensen [19723 discussed human interaction as
consisting of three systemic levels which closely match the
first three levels of analysis of Thayer: the intraperson-
al system, the interpersonal system, and the sociocultural
system. The intrapersonal system has a psychological
orientation; it deals with human information processing.
The interpersonal system deals with verbal and nonverbal
interactions. The socio-cultural system deals with the
situational geometry in which the interpersonal contacts
take place. This includes the social influence each person
has and experiences within the communication network.
According to Mortensen's view, the dynamics of
communication can be viewed within a "multidimensional
framework of differing yet closely interrelated levels of
activity" [1972, p. 233. This view uses "levels" to refer
to differing degrees of complexity and, therefore,
differing degrees of analysis. Thus, communication can be
studied on three levels, each level being made up of a
hierarchy of processes.
This section has reviewed several ways of classifying
communication to provide a basis for further discussion of
the topic. Although this research is directed toward the
39
individual decision maker, it is important to emphasize
that the decision-making process does not operate in a
vacuum. The decision maker must receive information
through communication channels which form a network.
Therefore, to better understand the environment in which
the decision maker operates, the communication network
literature will be reviewed.
Communication Networks
The term "communication network" refers to the overall
set of interaction pathways through which interpersonal
receiving information are referred to as nodes, and their
relationship is represented as a link between the nodes.
The simplest network is the dyad wherein one person
communicates with one other. The dyad has become the basic
unit for the study of communication networks. Most people
communicate with more than one other person in the
organization and, therefore, the set of interactions
becomes more complex. The network configurations that may
occur with interpersonal communication are the wheel, wye,
chain, circle (see Figure 3-9), and a combined form in
which each node communicates with all other nodes.
Experiments begun by Bavelas [1950, cited in
Mintzberg, 1979, p. 204 3, expanded by Leavitt [19513, and
continued by Guetzkow and Simon [1954-553 explored the
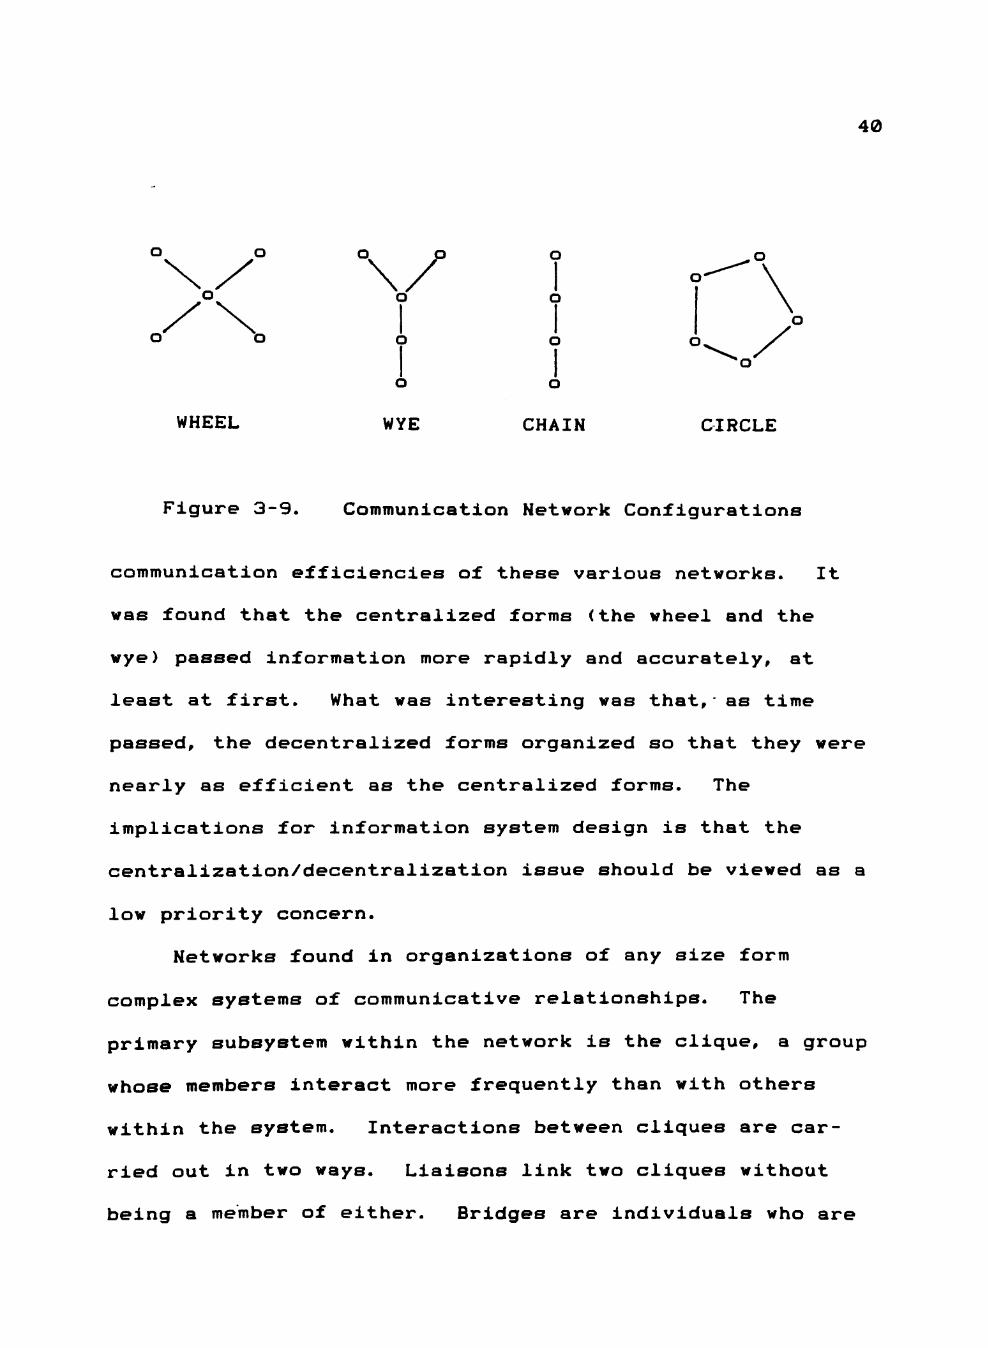
40
o ^o
I o
o 'o'
WHEEL WYE CHAIN CIRCLE
Figure 3-9. Communication Network Configurations
communication efficiencies of these various networks. It
was found that the centralized forms (the wheel and the
wye) passed information more rapidly and accurately, at
least at first. What was interesting was that,' as time
passed, the decentralized forms organized so that they were
nearly as efficient as the centralized forms. The
implications for information system design is that the
centralization/decentralization issue should be viewed as a
low priority concern.
Networks found in organizations of any size form
complex systems of communicative relationships. The
primary subsystem within the network is the clique, a group
whose members interact more frequently than with others
within the system. Interactions between cliques are car
ried out in two ways. Liaisons link two cliques without
being a member of either. Bridges are individuals who are
41
members of one clique and are also linked to a member of
another clique. The distinguishing feature of bridges is
that they provide the only (or nearly only) direct path
between two cliques. Thus, in the study of the diffusion
of information throughout an organization, liaisons and
bridges assume an important role.
A clique can have any number of its members engaged in
between-clique interactions. The amount to which the
clique exchanges information with its environment is
refered to as its degree of openness. Some members of the
organization do not communicate very much with others and
are termed isolates. This is not to imply that they
necessarily exhibit dysfunctional behavior. The isolation
may be due to the nature of their Job or to other
organizational considerations.
Rogers and Bhowmik [19713 assert that the efficacy of
communication is related to the degree of homophily between
the source and the receiver. Homophily refers to how much
the two people have in common. High homophily indicates a
large amount of congruence in interests, education, and
opinion concerning the topic being communicated. In
addition to being a condition for effective communication,
it is also a result. They point out that "effective
communication between source and receiver leads to greater
42
homophily in knowledge, beliefs, and overt behavior"
[p. 5303, This closely follows the ideas of Westley and
MacLean [1957 3 which are discussed further in the next
section of this chapter.
Although communication is facilitated by high
homophily, not all important information comes through this
type of interaction. The amount of new information passed
between two people has been investigated by Liu and Duff
[19723 who found that the informational strength of the
communication links is inversely related to the degree of
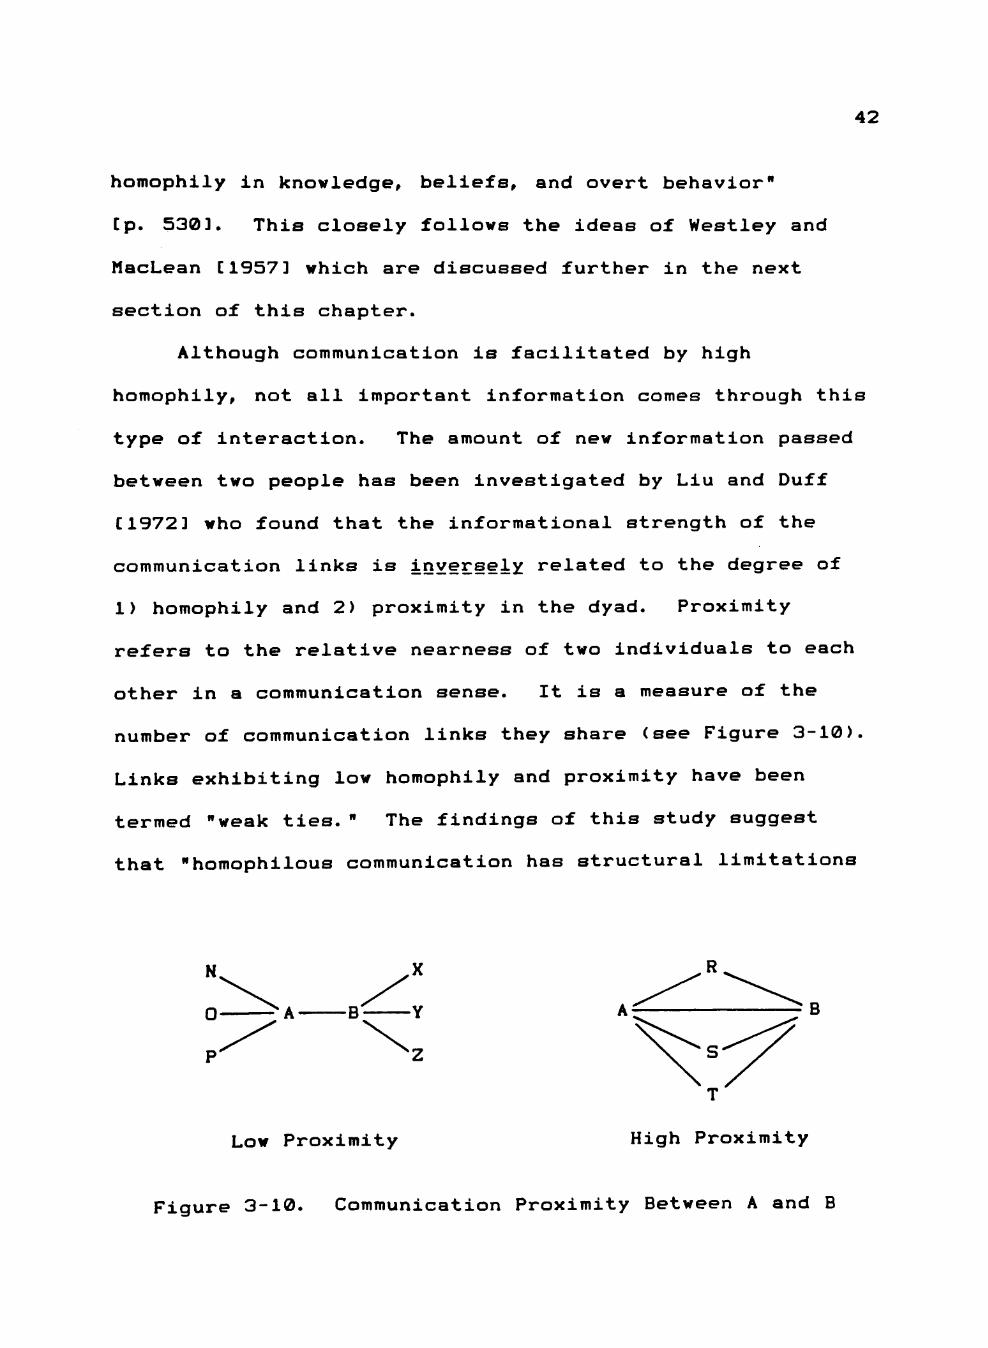
1) homophily and 2) proximity in the dyad. Proximity
refers to the relative nearness of two individuals to each
other in a communication sense. It is a measure of the
number of communication links they share (see Figure 3-10).
Links exhibiting low homophily and proximity have been
termed "weak ties. " The findings of this study suggest
that "homophilous communication has structural limitations
N.
-B
Low Proximity High Proximity
Figure 3-10. Communication Proximity Between A and B
43
to diffusion, so that information tends to recirculate
among those who already possess the same information" [p.
366 3. Infrequent but important contacts allow new ideas to
enter the clique.
In another study of social networks, Granovetter
[19733 found similar results stating that "all bridges are
weak ties" [p.13643. These individuals often have less in
common with each other than with other members of their
cliques. Persons in dyads that have a low amount of
contact often pass information that is news to each other
and to their cliques. He concludes that there is not much
informational strength in an interlocking network--there
is no news.
Rogers and Kincaid [19813 studied the effects of
communication on the introduction of new technology into a
community. They performed a communication network audit
and identified the communication roles that affected the
transfer of information. Weak ties were found to be
instrumental in the diffusion of information between
groups.
The importance of the concept of weak ties to this
research is considerable. The introduction of an improved
communication system may have two opposing effects. By
making communicative acts easier to accomplish, the
44
transference of information should be enhanced and,
therefore, the diffusion of new ideas improved. Opposing
this, however, is the possibility that weak-tie information
will be disrupted. This disruption may be a result of
automating the supply of information that previously would
have been gained through occasional contact with members
outside the decision maker's own clique. These occasional
contacts could be a source of ancillary information which
is passed as a by-product of interacting with the weak tie.
The Rogers and Kincaid [19813 study of the effect of
communication on the introduction of new technology,
although applicable to some aspects of the effect of
introducing an information system to an organization, does
not focus on the area of interest of this study. The area
of interest is not how communication networks influence the
introduction of an innovation (the new system), rather the
interest is in the effect of introducing the innovation on
a link within the network itself.
Communication Models
A majority of the interpersonal communication model
development was carried on in the late 1940's and 1950's.
Since that time the fundamental concepts have changed
little. What has occurred is an application of these
models to a wide variety of situations in which information
45
is exchanged. In the area of information system design,
much attention has been paid to the interactions between
the systems analyst and the eventual users of the system.
The following models are representative of those that form
a foundation upon which a large portion of this work is
based.
A Eynctional Model
An early, yet still useful model of interpersonal
communication was derived from models used in electrical
engineering to represent the transmission and reception of
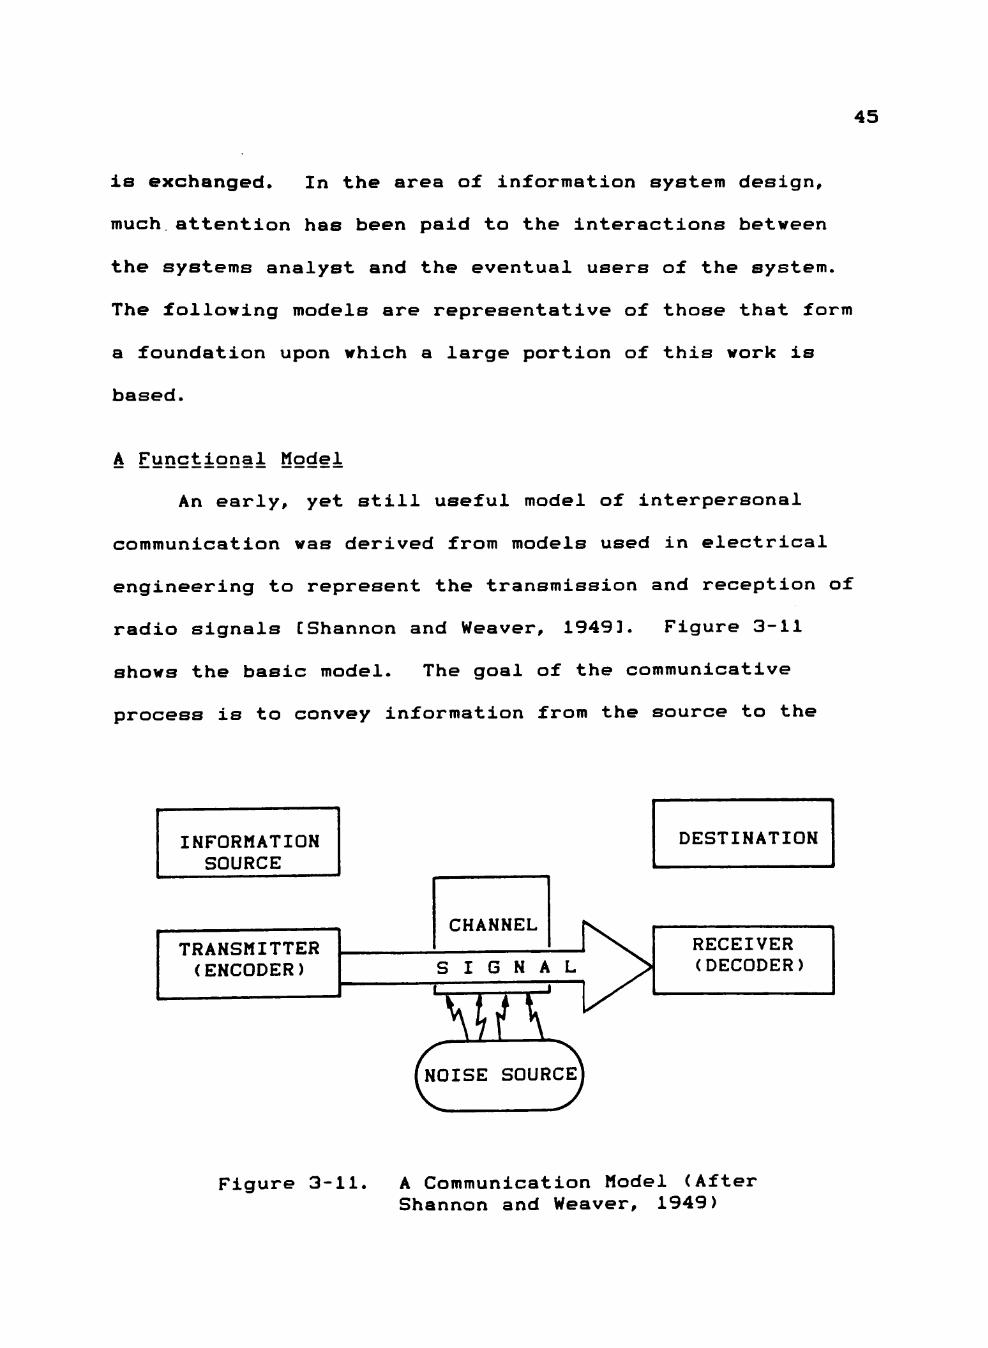
radio signals [Shannon and Weaver, 19493. Figure 3-11
shows the basic model. The goal of the communicative
process is to convey information from the source to the
INFORMATION SOURCE
TRANSMITTER (ENCODER)
CHANNEL
S I G N A L
( N O I S E SOURCEj
DESTINATION
RECEIVER (DECODER)
Figure 3-11 A Communication Model (After Shannon and Weaver, 1949)
46
destination with as much fidelity as possible. To
accomplish this, the information at the source has to be
encoded into some form that can be passed from the source
to the destination over some channel that can carry the
signal. Once received, the encoded message must be decoded
to provide the contained information to the designated
destination.
Several aspects of this model warrant further
discussion because they become relevant when CAC technology
is applied to the decision-making environment. The
capacity and effectiveness of this system depends on the
design of its elements. Two measures of system capacity
are the amount of information that can be transmitted and
the range of information that can be handled. The amount
of information that can be passed depends on the slowest of
the three active elements, the encoder, the channel, and
the decoder. The information transmission capacity of the
channel can be thought of as the baud rate of the channel.
Oftentimes, a channel can carry more than one signal at a
time. The number of simultaneous signals that a channel
can carry is referred to as its bandwidth. One method for
dealing with limited channel or decoding capacity is the
use of queues which is usually satisfactory unless
information is lost in the queue. A second method is the
47
generation of a busy signal that prohibits the transmission
of more data until the channel or decoder can deal with it.
One characteristic of communication systems that
limits effectiveness is the channel's susceptibility to
noise. Noise refers to unintentional signals that get
included with the intended signal. These degrade the
fidelity of the message carried over the channel and, if
severe enough, may mask the information that was intended
to be sent. Transmission redundancy is one primary method
of dealing with noisy communication channels.
In an interpersonal communication context, transmis
sion is typically accomplished through oral, visual, or
written channels. Encoding involves the utterance of
phonemes, the generation of visual imagery, or the
composition of text. Decoding is accomplished by listening
to, visually observing, or reading the transmitted signal.
Each of these modalities has limits to the rate at
which they can encode, transmit, and decode information.
Speech allows a moderate rate of encoding, very rapid
channel transmission, and fairly rapid decoding. Visual
imagery varies widely in its encoding rate and its
transmission rate but can provide rapid decoding rates of
large amounts of information. This is characterized by the
maxim: "A picture is worth a thousand words." Written
text takes a long time to encode, can vary widely in its
48
transmission rate, and takes a moderate amount of time to
decode.
The decoders of each modality have characteristic ways
of dealing with information overload. Oral transmissions
may simply be blocked out. Observaton of visual images may
result in only the highlights or some limited area being
observed. Written transmissions may become buried in the
"in" basket and be ignored. Each modality has other
characteristics such as degree of permanence and
susceptibility to noise.
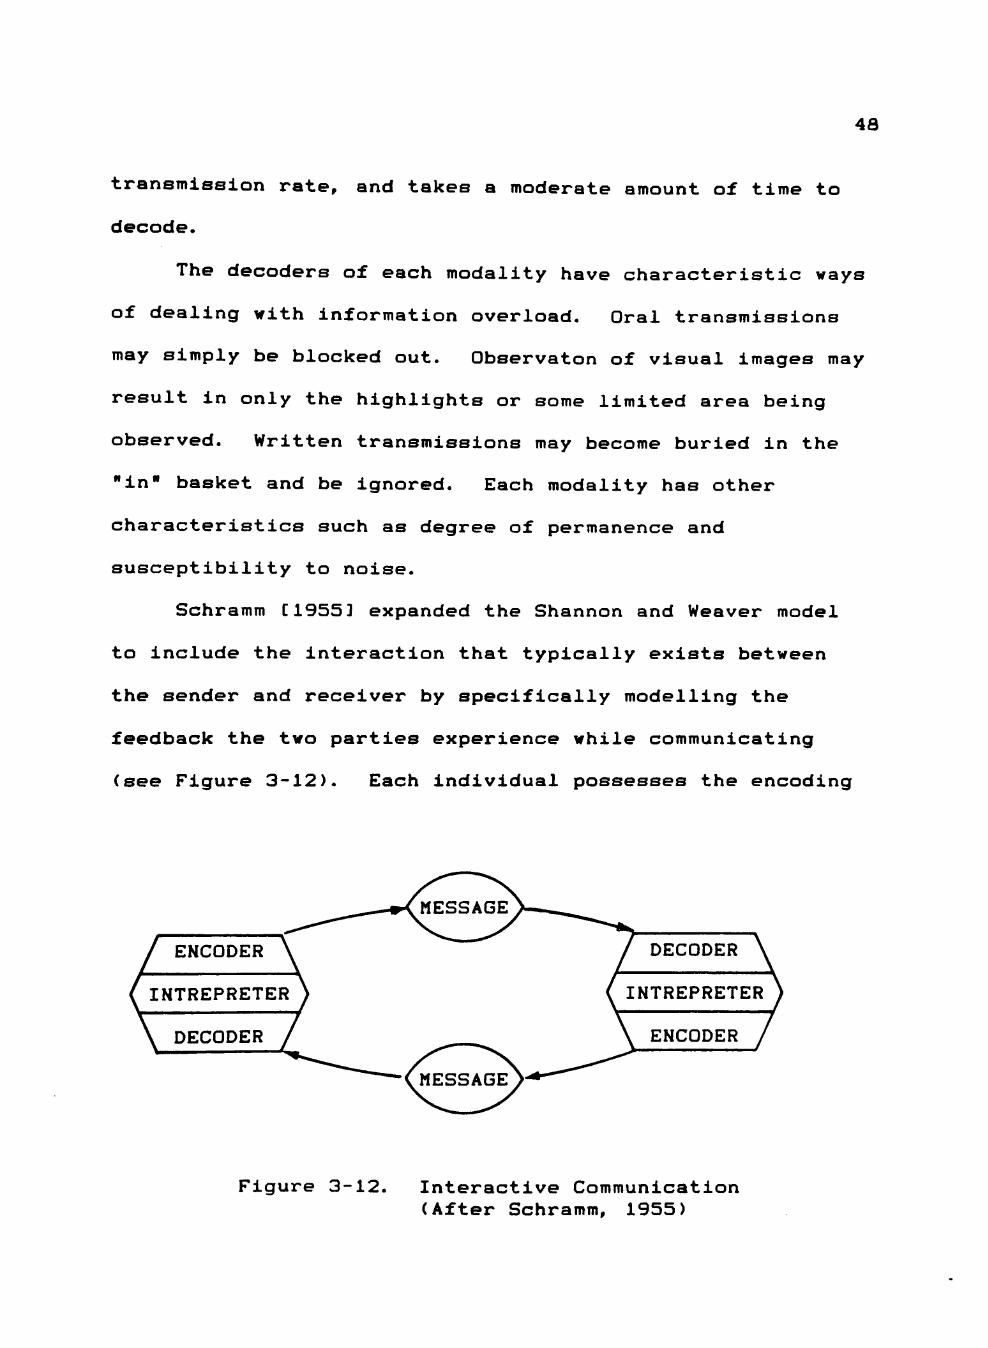
Schramm [1955 3 expanded the Shannon and Weaver model
to include the interaction that typically exists between
the sender and receiver by specifically modelling the
feedback the two parties experience while communicating
(see Figure 3-12). Each individual possesses the encoding
ENCODER
INTREPRETER
DECODER
DECODER
NTREPRETER
ENCODER
Figure 3-12. Interactive Communication (After Schramm, 1955)
49
and decoding capabilities of the Shannon and Weaver model
and, in addition, possesses an intrepreter that places the
received message into the context of that person's
understanding. This approach takes into account the fact
that perception is based on pre-existing information
residing with the receiver. With this arrangement,
messages can be exchanged until the sender is confident
that the meaning that was intended is actually received.
Communication and Environmental Perception
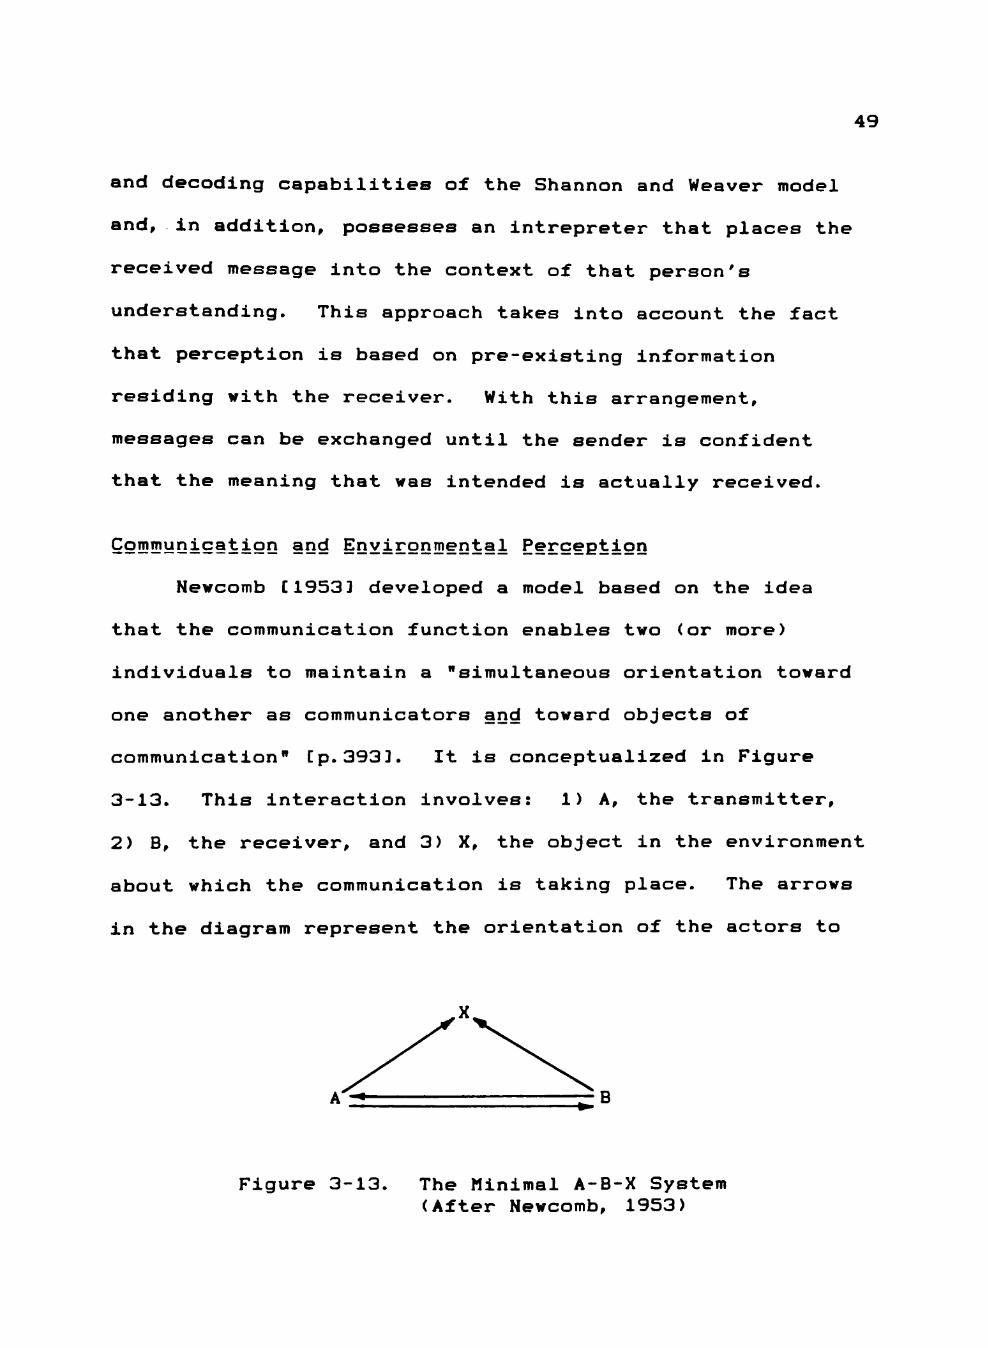
Newcomb [1953 3 developed a model based on the idea
that the communication function enables two (or more)
individuals to maintain a "simultaneous orientation toward
one another as communicators and toward objects of
communication" [p.3933. It is conceptualized in Figure
3-13. This interaction involves: 1) A, the transmitter,
2) B, the receiver, and 3) X, the object in the environment
about which the communication is taking place. The arrows
in the diagram represent the orientation of the actors to
A •< —--Z-B
Figure 3-13. The Minimal A-B-X System (After Newcomb, 1953)
50
each other and to X. Their orientation includes the
perceptions, context, and attitudes that the actor has
regarding the other person or the object about which they
are communicating.
The concept of co-orientation was also presented. The
idea of co-orientation is that, if communication occurs,
A's attitudes toward B and toward X are interdependent.
That is, A's attitude toward X is dependent on A's attitude
toward B and B's attitude toward X. The implication of co-
orientation is that similarity in attitudes facilitates
communication. The more similar the co-orientation between
A and B, the more accurate will be the translation of
information between A and B. Furthermore, cognitive
support for an idea increases as similarity in co-
orientation increases. Simlar attitudes provide more
confidence in A and B that the other has the same
understanding of X.
The minimal configuration shown in Figure 3-13
represents the communication dyad and was designed with the
assumption that the interactions are: 1) verbal, face-to-
face, 2) intentional, 3) are actively received by the
recipient, although not necessarily accurately.
Furthermore, the interactions are influenced by the
physical and social environments in which they take place.
Even though Newcomb specifically limited his discussion to
51
dir*ect, face—to—face contacts, his ideas can be extended to
any communicative situation in which feedback is possible.
Individuals make assumptions about the world in which
they live. Social communication is the most common and
most effective means by which an individual gains
information about the various objects <X's) in the
environment. It would be very costly (and physically
impossible) for a person to obtain valid assumptions about
more than an extremely limited subset of the X's that
affect his or her existence. fts Newcomb put it:
The less the possibility of testing one's assumptions by observing the physical consequences of those assumptions, the greater the reliance upon social confirmation as the test of what is true and valid CNewcomb, 1953, p. 3943.
Thus, it is communication that allows a decision maker to
make choices regarding objects and events outside the arena
of direct personal experience.
Westley and MacLean CI9573 developed a conceptual
model for communication research that was based on the
Newcomb CI9533 model. This model is presented in four
stages as follows (from Westley and MacLean C19573,
pp. 32-35):
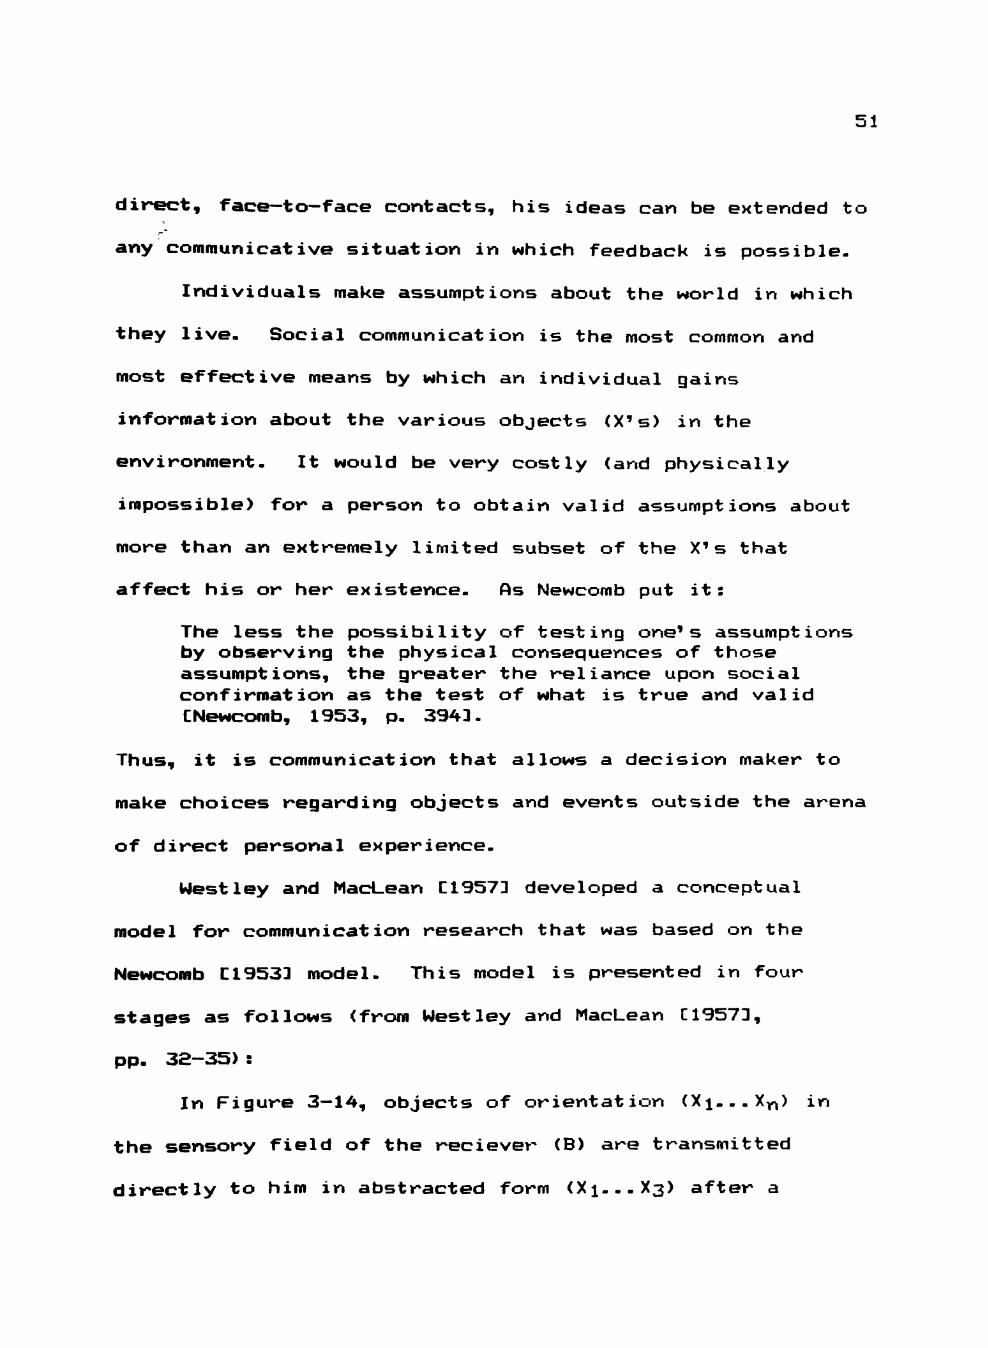
In Figure 3—14, objects of orientation (Xi...Xy^) in
the sensory field of the reciever (B) are transmitted
directly to him in abstracted form (X1-..X3) after a
52
process of selection from among all Xs, such selection
being based at least in part on the needs and problems of
B- Some or all are transmitted in more than one sense (X3m
for example).
X4 -x 3m
'n
Figure 3-14. Westley and MacLean's Model, Part A
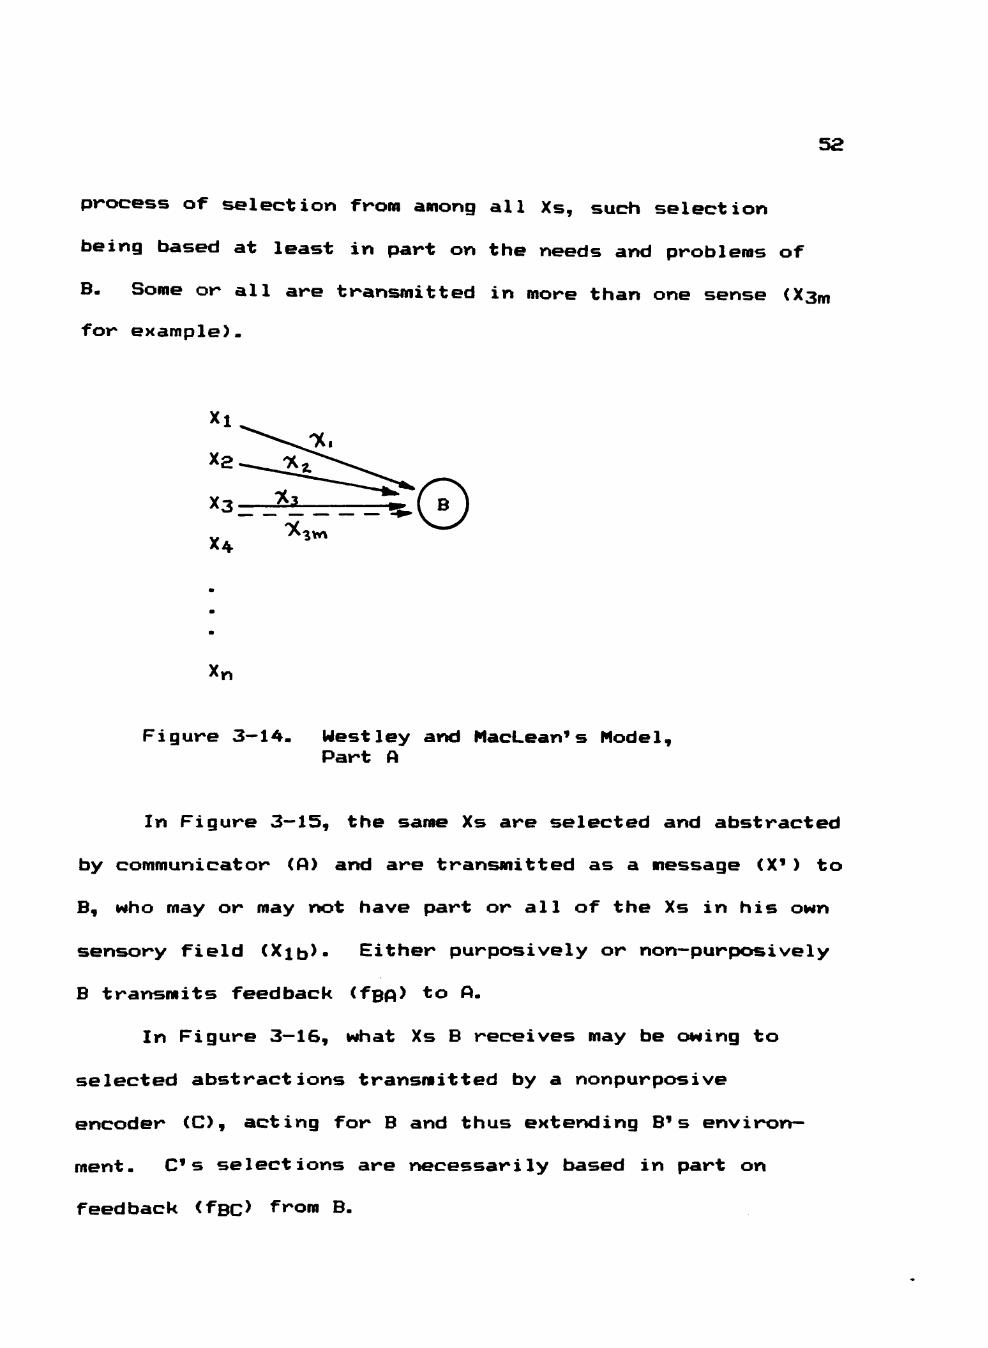
In Figure 3—15, the sarae Xs are selected and abstracted
by communicator (A) and are transmitted as a message (X' ) to
B, who may or may not have part or all of the Xs in his own
sensory field (Xib^- Either purposively or non—purposively
B transmits feedback (ffifl *o '-
In Figure 3—16, what Xs B receives may be owing to
selected abstractions transmitted by a nonpurposive
encoder <C), acting for B and thus extending B's environ
ment. C s selections are necessarily based in part on
feedback <fBC) from B.
5 3
Xi
X2
X3zr
X4 \
^n
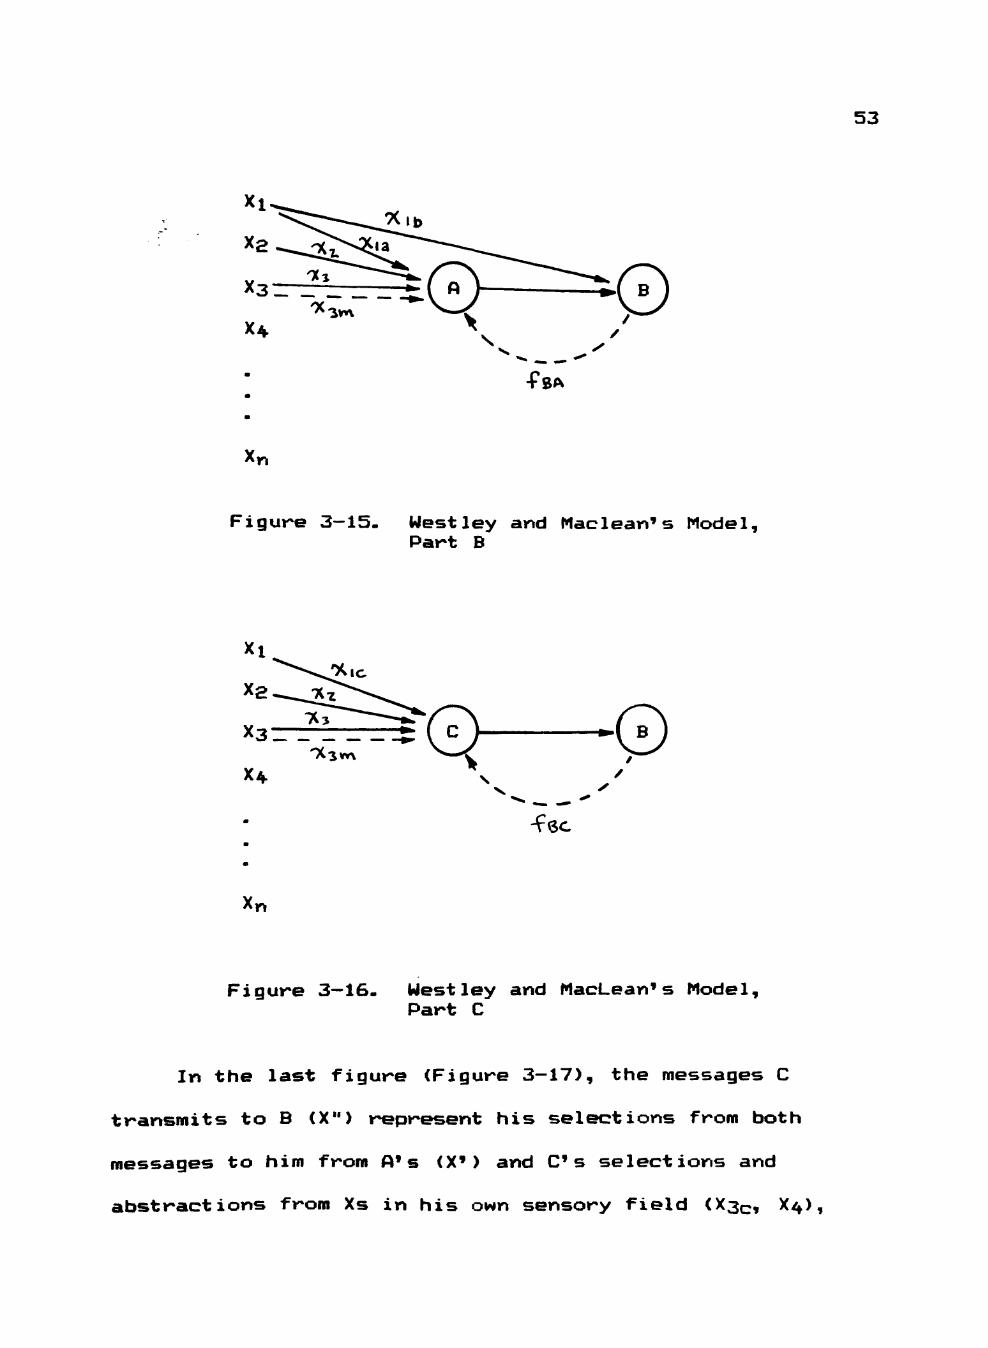
F i g u r e 3—15. Westley and Maclean's Model, Part B
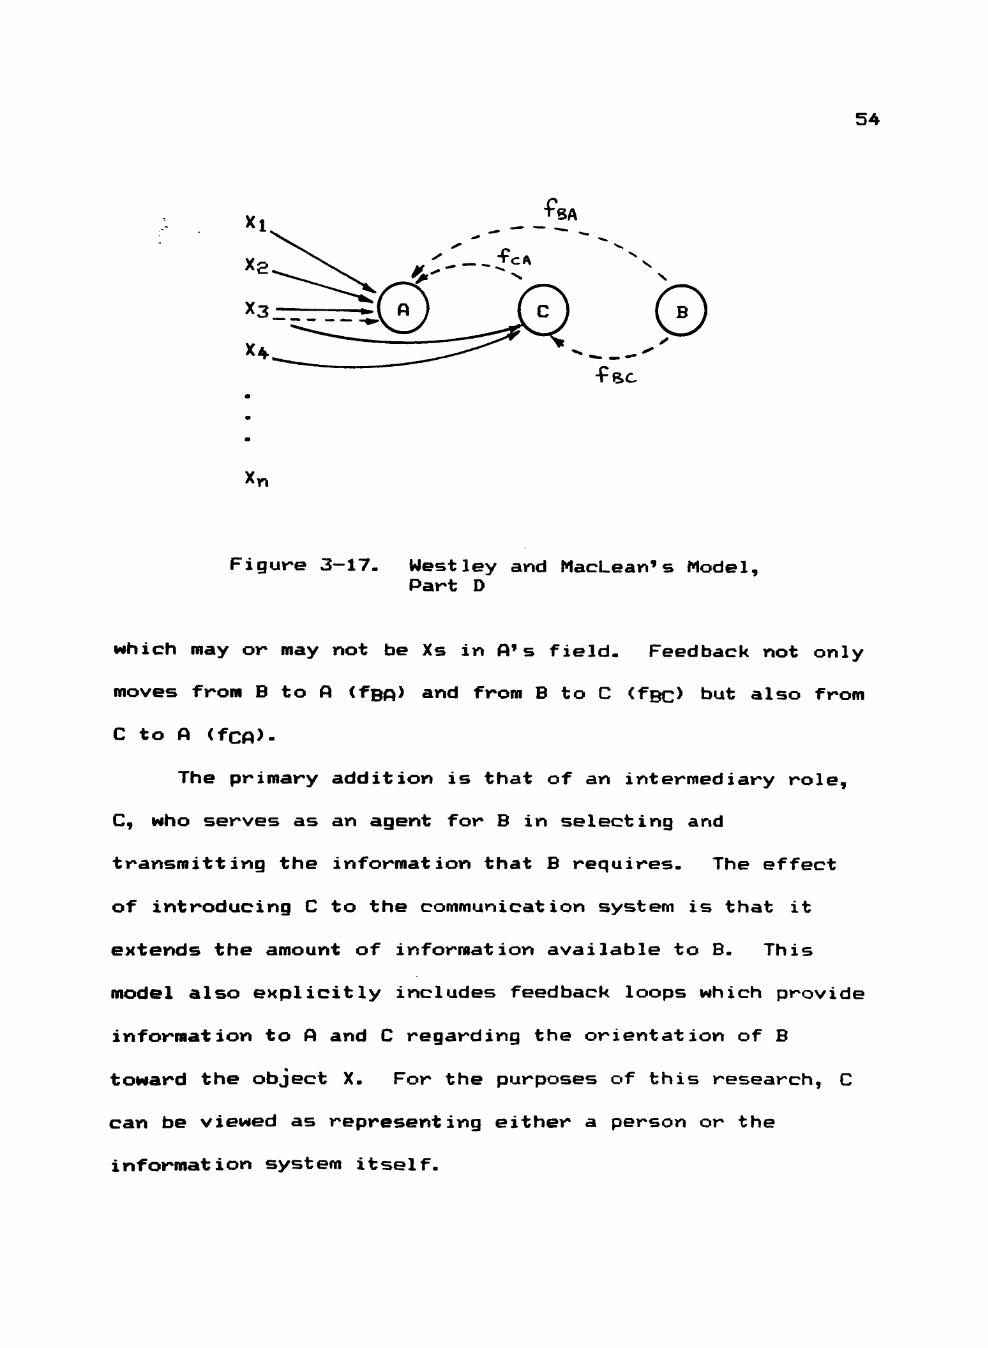
n
© -fee
Figure 3—16. Westley and MacLean's Model, Part C
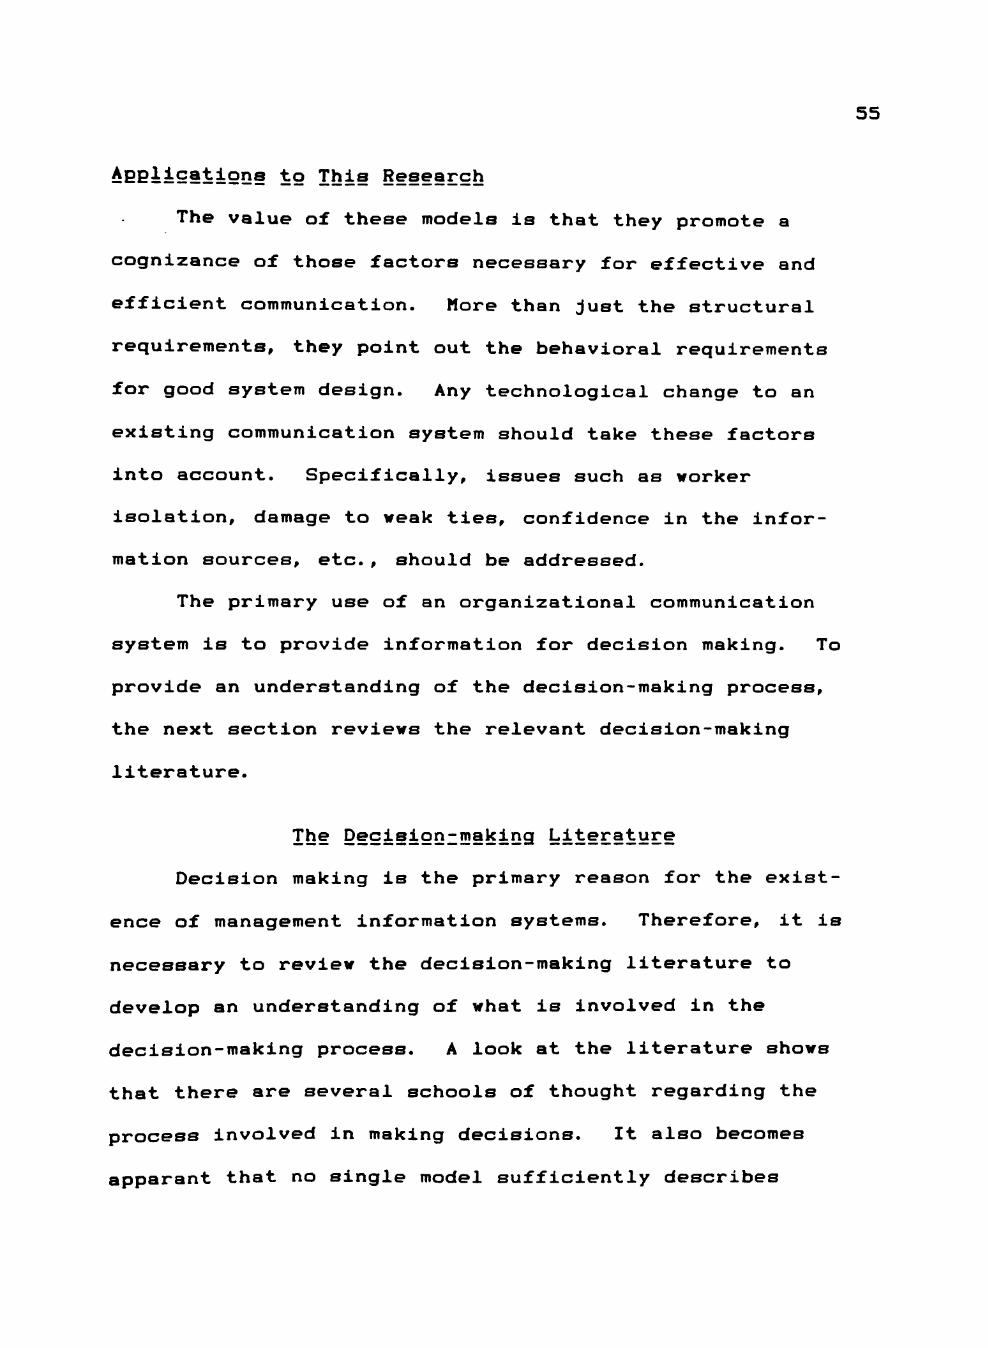
In the last figure (Figure 3-17), the messages C
transmits to B (X") represent his selections from both
messages to him from ft's (X') and C's selections and
abstractions from Xs in his own sensory field (X3c, X4),
54
0 -FRC
'n
Figure 3-17. Westley and MacLean's Model, Part D
which may or may not be Xs in fl's field. Feedback not only
moves from B to A <fBA> and from B to C (fBC> but also from
C to ft (fCft>-
The primary addition is that of art intermediary role,
C, who serves as an agent for B in selecting and
transmitting the information that B requires. The effect
of introducing C to the communication system is that it
extends the amount of information available to B. This
model also explicitly includes feedback loops which provide
information to ft and C regarding the orientation of B
toward the object X. For the purposes of this research, C
can be viewed as representing either a person or the
information system itself-
55
AEBli5§tions to This Research
The value of these models is that they promote a
cognizance of those factors necessary for effective and
efficient communication. More than Just the structural
requirements, they point out the behavioral requirements
for good system design. Any technological change to an
existing communication system should take these factors
into account. Specifically, issues such as worker
isolation, damage to weak ties, confidence in the infor
mation sources, etc., should be addressed.
The primary use of an organizational communication
system is to provide information for decision making. To
provide an understanding of the decision-making process,
the next section reviews the relevant decision-making
literature.
Tbe Decision^making Literature
Decision making is the primary reason for the exist
ence of management information systems. Therefore, it is
necessary to review the decision-making literature to
develop an understanding of what is involved in the
decision-making process. A look at the literature shows
that there are several schools of thought regarding the
process involved in making decisions. It also becomes
apparant that no single model sufficiently describes
56
decision making in all contexts. For a given situation,
the best description may be a combination of any or all of
the various points of view.
Keen and Scott Morton [1978 3 present five different
conceptual models, commenting on their implications for DSS
design and implementation. They include the rational
manager view; the satisficing, process-oriented view; the
organizational procedures view; the political view, and the
individual differences perspective. Sage [19813 provided
an exceptionally thorough (413 bibliographic entries)
discussion of information system design considerations,
including a summary of the literature on decision making.
He presented the conceptual models in categories similar to
Keen and Scott Morton with the exception that he did not
include the individual differences approach but instead
added the "garbage can" model.
Six Schools of Thought
Ibe Rational Actor View
Based on the idea of "economic man, " this normative
conceptual view looks at decision making as an optimizing
procedure. Cyert, Simon, and Trow [1956 3 present the
procedure as a process wherein the decision maker is made
aware of a set of alternatives to which the outcomes are
established. A choice is then made based on the value of

57
the respective outcomes to the decision maker, typically in
an economic sense. Sage [19813 provides a similar three-
stage framework of the decision-making procedure:
1. Formulation of the issue. This involves identifi
cation of the needs, constraints, objectives, and
alternatives in the problem domain.
2. Analysis of the issue. This involves determining
the structure of the problem and establishing
optimal values of the decision parameters.
3. Interpretation of the issue. Involved is an
evaluation of the alternatives, a choice, and the
development of implementation plans.
In its pure form, this view assumes that the decision
maker is omniscient and motivated only by economic forces.
This is, of course, an idealization because in a business
environment not all alternatives, objectives, constraints,
and outcomes will be known. Nonetheless, the rational
actor view has been useful in the development of OR/MS and
decision-making theory. It serves to define the theoreti
cal best a decision maker can achieve and thus acts as a
foundation for the model developed in this dissertation.
Xbe Bounded Rationality View
Simon [19693 has been a prime force behind a bounded
rationality modification of the rational actor model. His
58
approach represents an attempt to move closer to
representing the manager's real environmemt, one in which
limits are placed on the amount of knowledge that is
available to the decision maker. In this view, instead of
optimizing, the decision maker satisfices, usually by
applying a heuristic strategy that yields a solution good
enough for the situation. This view's rationale is that an
improved result is not worth the extra effort or cost that
would be required. This also implies that, in some cases,
an improved method is unknown, i.e., the cost of applying
that method is infinite. In many cases, a simple heuristic
may produce acceptable, even good results for a complex
problem but heuristics may also generate inferior
solutions, especially if they are overly simplistic.
Tbe Organizatignal Process View
Cyert and March [1963 3 presented a view that focused
on organizational structure, both formal and informal.
Included in this organizational view are the operating
procedures of the subunits and the communication channels
that exist between the subunits. The process of making
organizational decisions involves breaking the overall
problems (the organizational goals) into subproblems, each
handled by the appropriate subunit. The process is carried
out by the subunits following various procedures that they
59
have previously found to be effective. If the existing
procedures do not perform adequately, new routines must be
developed. This new problem-solving behavior is usually
costly to develop (both financially and behaviorally) and
therefore is undertaken somewhat reluctantly. The
decision-making process also requires that the subunits
communicate information and bargain among themselves to
develop solutions that meet the organizational goals.
The cost of instituting new routines is one of the
factors to be taken into consideration by the model
presented in this dissertation. As the organizational
process viewpoint suggests, it is necessary to weigh the
gains in informational value provided by an improved
communication system against the financial and behavioral
costs of systematizing that information.
Ibe Political View
Allison [19713 modifies the classical rational actor
view by including the political constraints that exist
within an organization. More than the organizational goals,
a manager must also meet a multiplicity of subunit and
personal goals. Multiple goals require discussion among
decision makers to bargain and compromise. The ability to
compromise and bargain is a function of power. Therefore,

60
one of the primary factors influencing decision making is
power and influence.
Laudon [1974 3 suggests that information is not to be
viewed as a neutral commodity. The perceived influence and
autonomy of a person within an organization is linked to
the amount of information he or she controls. While an
individual's access to information is not a total
determinant of power, it surely is an important factor.
Information is obtained and passed through communication
channels. It is therefore evident that any technology that
affects communication must have ramifications on the
distribution of power within an organization.
Ibe Individual Differences View
This view, discussed by Keen and Scott Morton [1978 3,
takes into account the differences in the problem-solving
and information-processing behavior of different individ
uals. The most prevalent way of categorizing decision
style is to distinguish between an analytic, methodological
approach versus an intuitive, heuristic one [Mason and
Mitroff, 1973; Miller, 1974; Taylor and Benbasat, 1980;
Keen and Bronsema, 1981; DeSanctis, 1982; Sanders, 1983;
Pracht, 19843, typically using either the Meyers-Briggs
Type Indicator or the Witkin Group Embedded Figures Test as
a device to assess cognitive style. These studies have
61
shown the value of tailoring the information system-user
interface to the decision-making style of the manager.
Mintzberg [1973 3 concluded that managers exhibit
behavior that differs from that of analysts. While
analysts concentrate on a limited number of problems,
solving each completely before moving on to the next,
managers deal with many types of problems, working for a
short time on a portion of one and then Jumping to work on
a part of another. They tend to prefer verbal, concrete
information from face-to-face discussions rather than from
written text. The implications of these findings to the
automation of the communication channels supplying the
decision maker with information is profound. Any system
that reduces problem variety, brevity, and fragmentation
may be expected to be behaviorally unacceptable and to
encounter resistance from those managers who thrive on such
an environment.
Ibe Garbage Can View
Cohen, March, and Olsen [19723 originated the garbage
can approach, so named because all the components of the
decision-making process are mixed together and become
linked in an ambiguous manner. The decision-making process
is described as: "Decisions result from the interaction of
solutions looking for problems, problems looking for
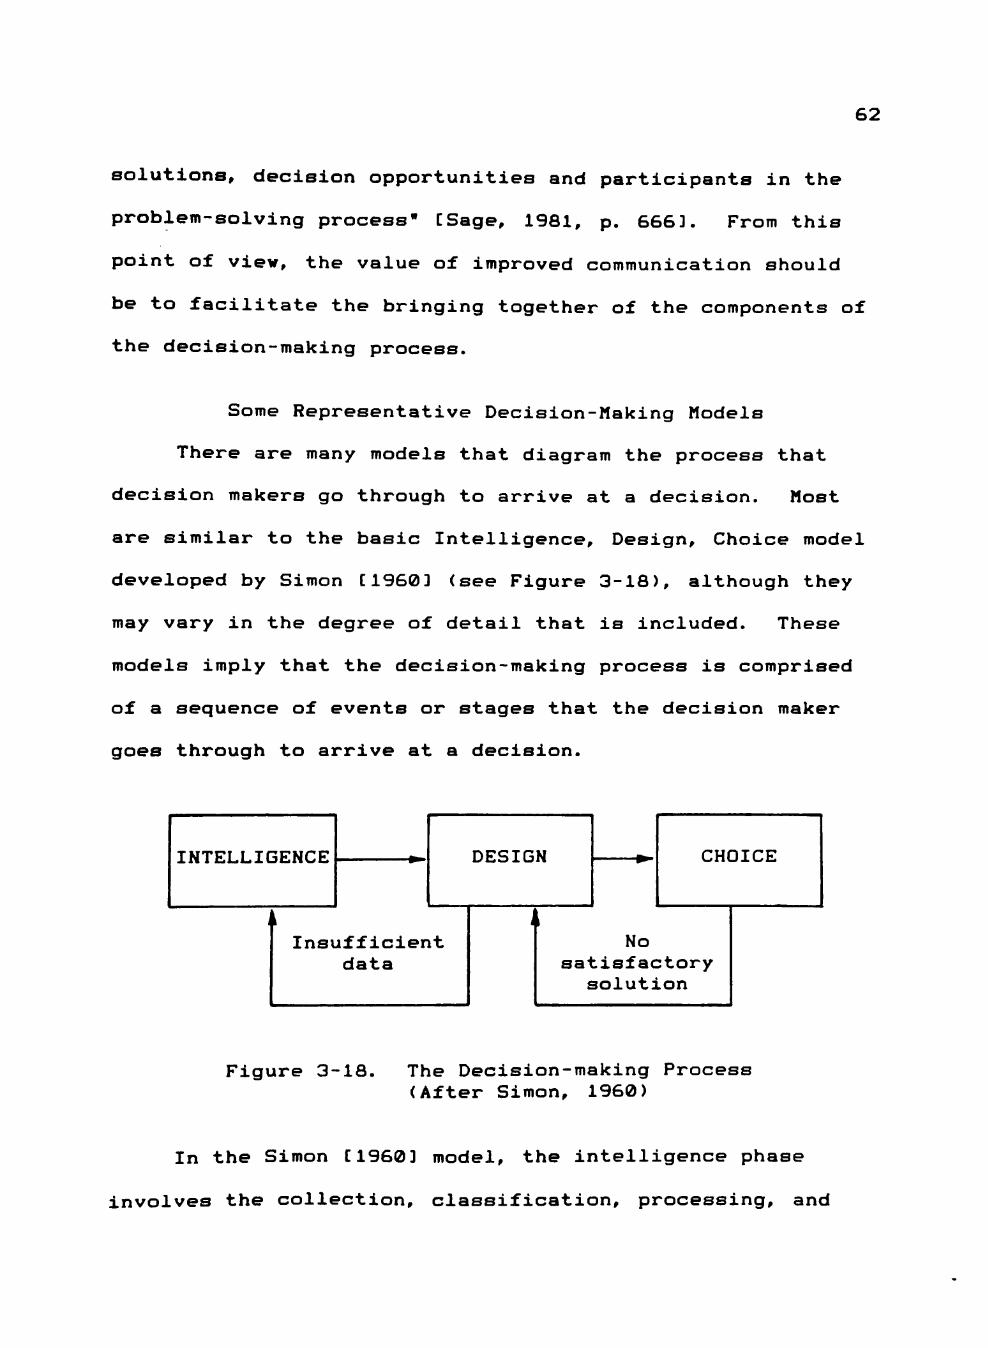
62
solutions, decision opportunities and participants in the
problem-solving process" [Sage, 1981, p. 6663. From this
point of view, the value of improved communication should
be to facilitate the bringing together of the components of
the decision-making process.
Some Representative Decision-Making Models
There are many models that diagram the process that
decision makers go through to arrive at a decision. Most
are similar to the basic Intelligence, Design, Choice model
developed by Simon [19603 (see Figure 3-18), although they
may vary in the degree of detail that is included. These
models imply that the decision-making process is comprised
of a sequence of events or stages that the decision maker
goes through to arrive at a decision.
INTELLIGENCE DESIGN
Insufficient data
CHOICE
No satisfactory
solution
Figure 3-18. The Decision-making Process (After Simon, 1960)
In the Simon [19603 model, the intelligence phase
involves the collection, classification, processing, and
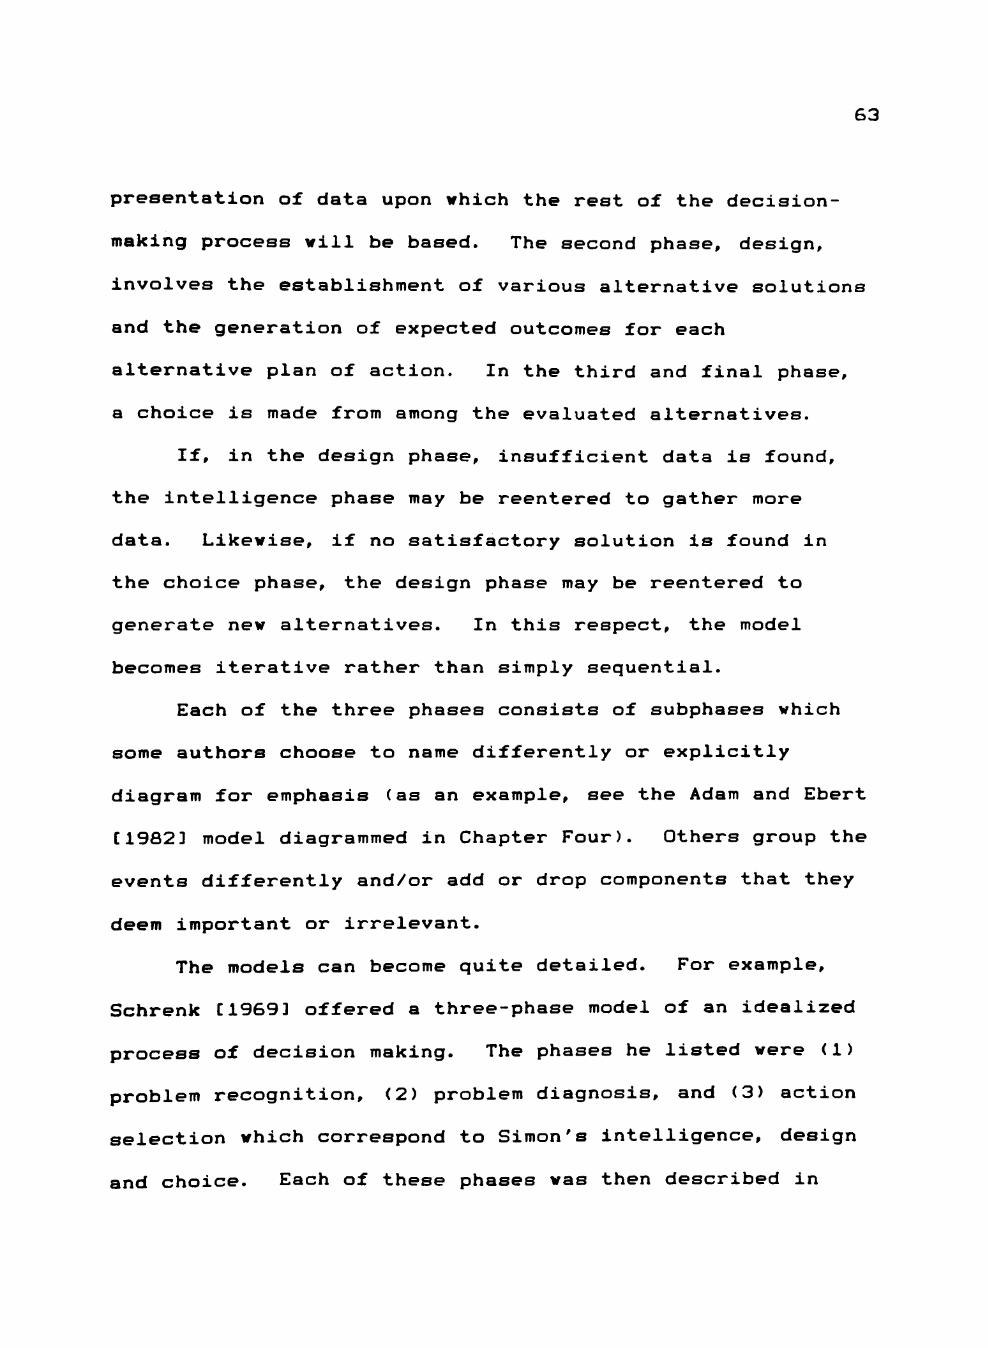
63
presentation of data upon which the rest of the decision
making process will be based. The second phase, design,
involves the establishment of various alternative solutions
and the generation of expected outcomes for each
alternative plan of action. In the third and final phase,
a choice is made from among the evaluated alternatives.
If, in the design phase, insufficient data is found,
the intelligence phase may be reentered to gather more
data. Likewise, if no satisfactory solution is found in
the choice phase, the design phase may be reentered to
generate new alternatives. In this respect, the model
becomes iterative rather than simply sequential.
Each of the three phases consists of subphases which
some authors choose to name differently or explicitly
diagram for emphasis (as an example, see the Adam and Ebert
[19823 model diagrammed in Chapter Four). Others group the
events differently and/or add or drop components that they
deem important or irrelevant.
The models can become quite detailed. For example,
Schrenk [19693 offered a three-phase model of an idealized
process of decision making. The phases he listed were (1)
problem recognition, (2) problem diagnosis, and (3) action
selection which correspond to Simon's intelligence, design
and choice. Each of these phases was then described in
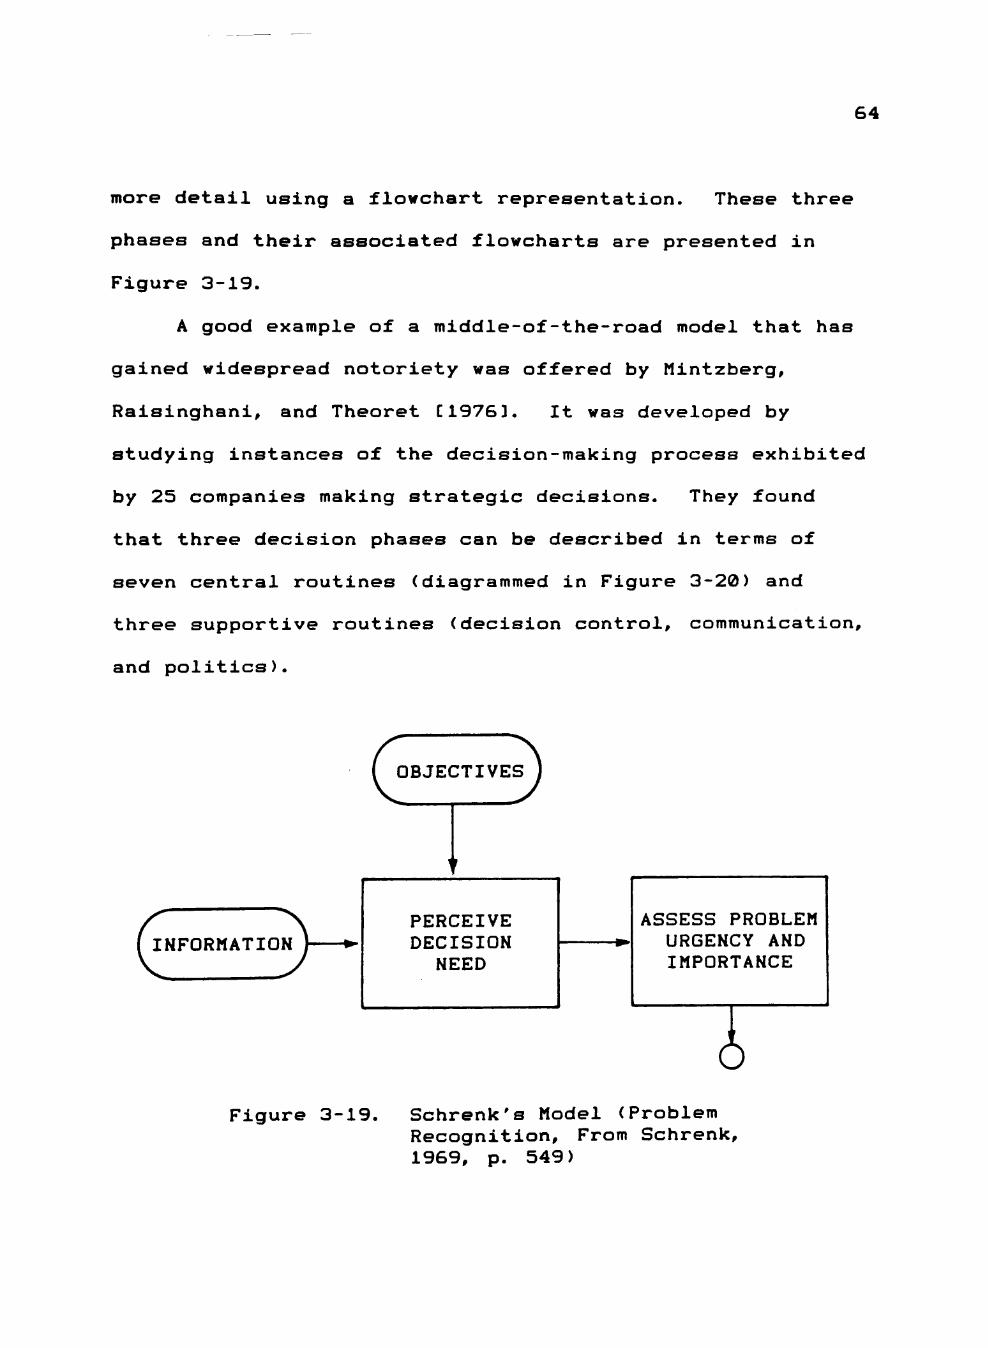
64
more detail using a flowchart representation. These three
phases and their associated flowcharts are presented in
Figure 3-19.
A good example of a middle-of-the-road model that has
gained widespread notoriety was offered by Mintzberg,
Raisinghani, and Theoret [19763. It was developed by
studying instances of the decision-making process exhibited
by 25 companies making strategic decisions. They found
that three decision phases can be described in terms of
seven central routines (diagrammed in Figure 3-20) and
three supportive routines (decision control, communication,
and politics).
INFORMATION
OBJECTIVES 9 PERCEIVE DECISION
NEED
ASSESS PROBLEM URGENCY AND IMPORTANCE
I Figure 3-19. Schrenk's Model (Problem
Recognition, From Schrenk, 1969, p. 549)

65
? DEFINE
POSSIBLE SITUATIONS
I EVALUATE
SITUATION LIKELIHOODS
IS MORE INFORMATION NEEDED?
±
no
no
IDENTIFY POSSIBLE
DATA SOURCES
I JUDGE DATA VALUE VS.
DATA COST
SEEK MORE INFORMATION
I RE-EVALUATE SITUATION
LIKELIHOODS
DO ALTERNATIVES ACCOUNT FOR ALL DATA
?
yes
MAKE DIAGNOSTIC DECISION
Figure 3-19 Continued, Schrenk's Model (Problem Diagnosis)
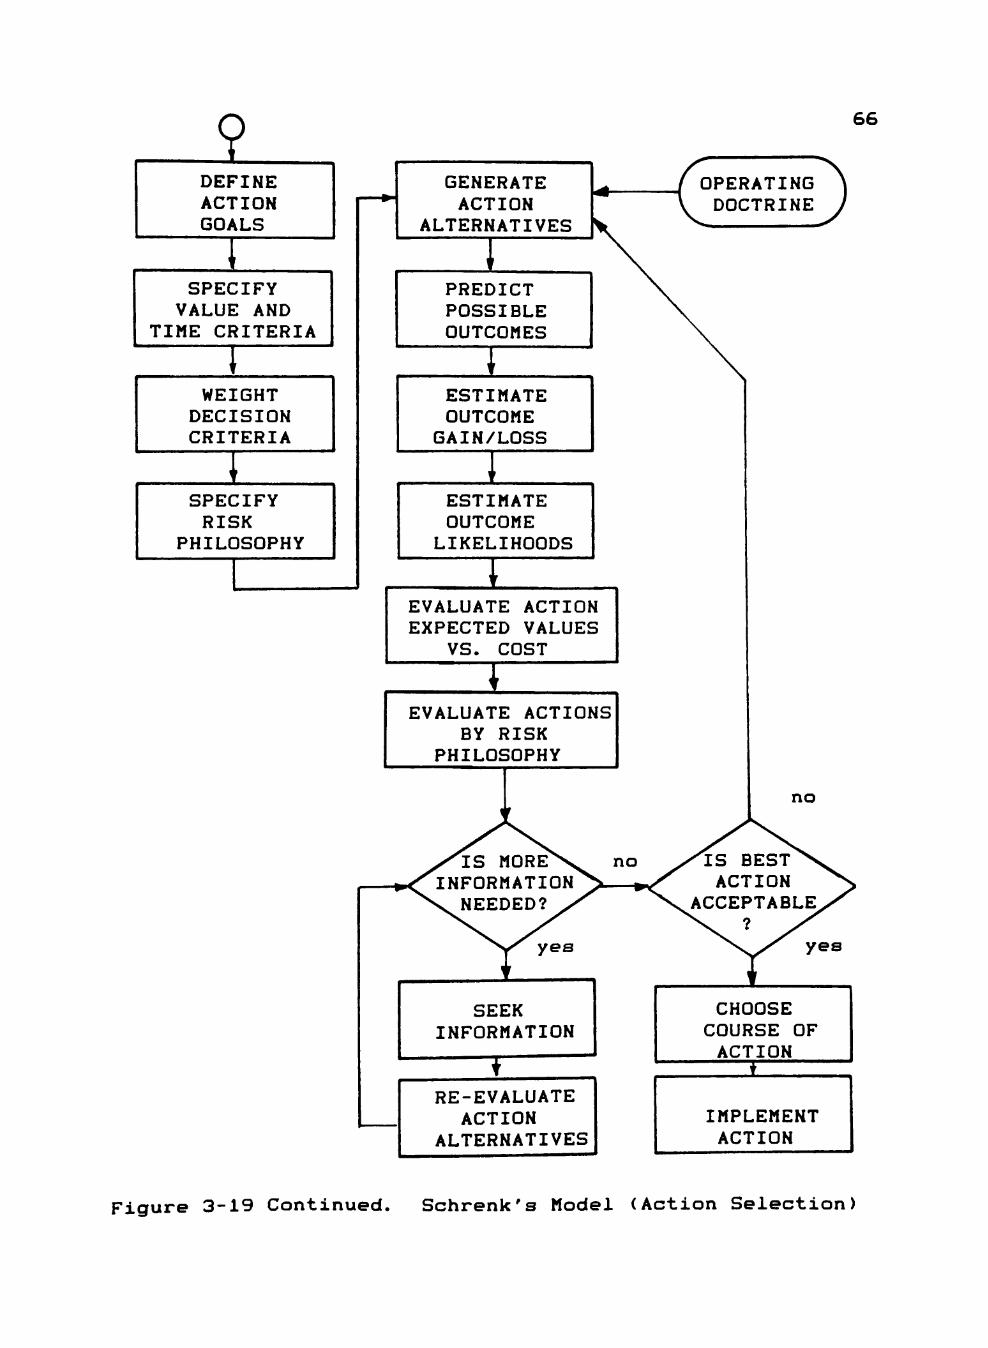
9 DEFINE ACTION GOALS
SPECIFY VALUE AND
TIME CRITERIA
WEIGHT DECISION CRITERIA
SPECIFY RISK
PHILOSOPHY
GENERATE ACTION
ALTERNATIVES
PREDICT POSSIBLE OUTCOMES
I ESTIMATE OUTCOME
GAIN/LOSS
ESTIMATE OUTCOME LIKELIHOODS
66
OPERATING DOCTRINE
EVALUATE ACTION EXPECTED VALUES
VS. COST
I EVALUATE ACTIONS
BY RISK PHILOSOPHY
no
^ ^ I S MORE^s^ • / INFORMATION^
^ V . N E E D E D ? ^ /
^Y^ y e s
SEEK INFORMATION
t RE-EVALUATE
ACTION ALTERNATIVES
no ^ ^ I S BEST ^ s . ^ ACTION ^ ^ A C C E P T A B L E /
\ ^ ^ ? > ^ ^ s , > ^ y e s
CHOOSE COURSE OF
ACTION *
IMPLEMENT ACTION
Figure 3-19 Continued. Schrenk's Model (Action Selection)
67
RECOGNITION
IDENTIFICATION
PHASE DEVELOPMENT
PHASE
JUDGMENT
ANALYSIS
BARGAINING
SELECTION
PHASE
AUTHORIZATION
Figure 3-20. A General Model of the Decision Process (From Mintzberg, et al. , 1976)
Whitte [19723 contends that the decision-making
process cannot be broken down into separate, identifiable
units. He states:
We believe that human beings cannot gather information without in some way simultaneously developing alternatives. They cannot avoid evaluating these alternatives immediately, and doing this they are forced to a decision [p. 1803.
Whitte examined 233 strategic decisions by dividing
their duration into ten equal intervals. In each interval,
the activities that occurred were recorded. The activities
examined in the study were the gathering of information,
the development of alternatives, the evaluation of
alternatives, and the making of choices (see Figure 3-21).
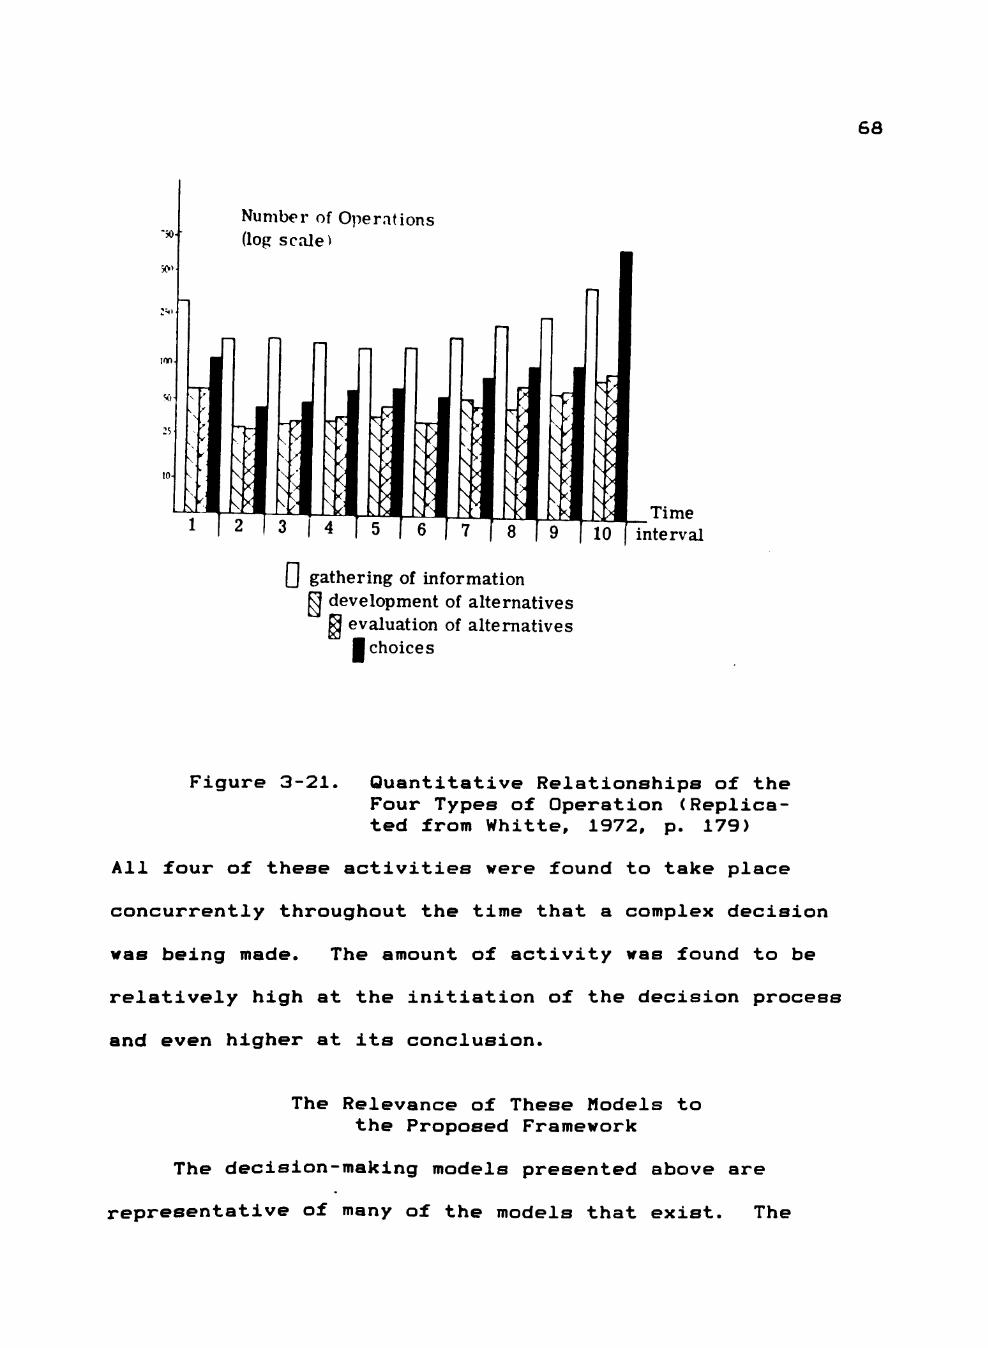
6 8
"50 Number of Oper.itions (lop scale)
[] gathering of information ^ development of alternatives
*" evaluation of alternatives B choices
Time interval
Figure 3-21. Quantitative Relationships of th( Four Types of Operation (Replica ted from Whitte, 1972, p. 179)
All four of these activities were found to take place
concurrently throughout the time that a complex decision
was being made. The amount of activity was found to be
relatively high at the initiation of the decision process
and even higher at its conclusion.
The Relevance of These Models to the Proposed Framework
The decision-making models presented above are
representative of many of the models that exist. The
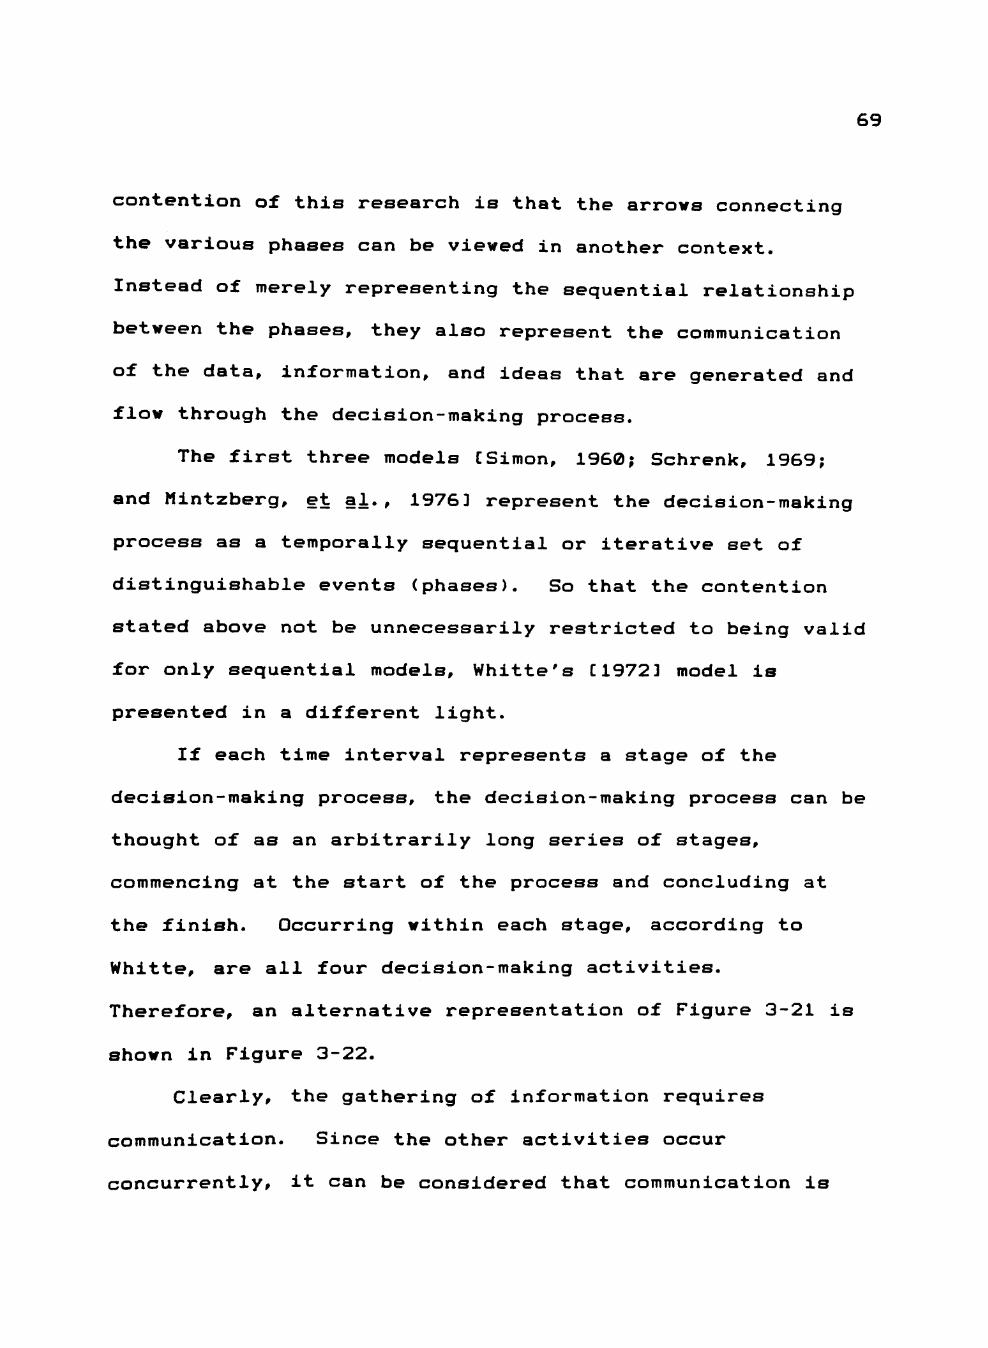
69
contention of this research is that the arrows connecting
the various phases can be viewed in another context.
Instead of merely representing the sequential relationship
between the phases, they also represent the communication
of the data, information, and ideas that are generated and
flow through the decision-making process.
The first three models [Simon, 1960; Schrenk, 1969;
and Mintzberg, et al., 1976 3 represent the decision-making
process as a temporally sequential or iterative set of
distinguishable events (phases). So that the contention
stated above not be unnecessarily restricted to being valid
for only sequential models, Whitte's [19723 model is
presented in a different light.
If each time interval represents a stage of the
decision-making process, the decision-making process can be
thought of as an arbitrarily long series of stages,
commencing at the start of the process and concluding at
the finish. Occurring within each stage, according to
Whitte, are all four decision-making activities.
Therefore, an alternative representation of Figure 3-21 is
shown in Figure 3-22.
Clearly, the gathering of information requires
communication. Since the other activities occur
concurrently, it can be considered that communication is
70
-• •
Figure 3-22. A Stage Model of a Decisi on
also vital for their function. Each succeeding stage
builds upon the activities of the preceeding stage.
Therefore, the arrows again can also represent the need
for communication. Thus, there is no need to restrict the
contention that arrows represent communicated information
to sequential decision-making models.
Although a thorough search of the literature found no
model that explains the effect of computer-augmented
information systems on the making of organizational
decisions, some research has been conducted on the effects
of technological innovation on the communication that takes
place within the organization. The next section reviews
this literature and comments on its relationship to the
present research.
Ibe Effects of lechnolggy on Qliaanizatignal Communication
Prior to Whistler [1970 3 there had been no reported
esearch on the effects of computers on interpersonal
71
communication patterns. In this research. Whistler
administered a questionnaire to the employees of fifteen
companies to determine the impact of computers on Job
content. One dimension of Job content dealt with the
effects people perceived that computer-mediated communi
cation had on interaction and communication patterns. The
results showed that after the installation of a computer,
clerks reported working alone more and communicating with
other clerks less. Reported change in communication with
superiors was mixed. Supervisors reported working alone
less, communicating with peers and superiors more, and
showed a small tendency to communicate with subordinates
less. Managers also reported working alone less, reported
more communication with peers, and a decreased tendency to
engage in both upward and downward communication.
Whistler examined the changes in communication pat
terns in relation to the length of time the computer had
been in use. The conclusions he drew were:
These differences, related to the length of computer use, indicate that, while the expectation of increased man-machine communication and diminished interpersonal communication may be sound in the long run, the short-run effects of computerization are to increase the level of interpersonal communication. [Whistler, 1970, pp. 136-1383.
He ascribed the short-run increase to the fact that people
must communicate more during the transition period during
72
which the system is being introduced, learned, and
debugged.
Wilkerson [19703 studied the effects of Digital
Equipment Corporation's internal electronic mail system,
CONNECT. She noted a loss in nonverbal cues with the
introduction of computer-mediated communication resulting
in an increase in misunderstood messages. She also found
that the total amount of communication increased in some
cases to the point of creating information overload or
redundancy at higher managerial levels.
Rice [1980 3 reported a study of the Stanford Research
Institute's on-line network, NLS. At the Stanford Research
Institute, use of the network produced an increase in
overall communication, individual effectiveness, team
consensus, and intraorganizational collaboration. Users
reported using the system for "upward-flowing messages
(bridging authority levels), and increased breadth of
contact" [Rice, 1980, p. 229 3. When NLS was used by the
Air Force, there was an increase in group connectivity and
effectiveness. However, in a Canadian application of the
network system, although communication was perceived to be
improved, little improvement in problem solving was found.
Rice addressed the potential problem of a lack of
nonverbal cues and social presence when using computer-
mediated communication systems. He contends that
73
conferencing that allows simultaneous interaction allows
for the give and take that direct communication previously
offered. Personal cues take different forms and some of
the socially limiting effects (power, intimidation,
shyness) are actually reduced. Nonetheless, he does admit
that face-to-face contact offers increased bandwidth,
information variety, the ability to more readily interrupt
and/or question, and allows more rapid adjustments to
changes in interaction.
His conclusion is that computer-mediated communication
is at least as good and sometimes better than direct
communication for (1) exchanging information, (2) asking
questions, (3) exchanging opinions or orders, (4) staying
in touch, and (5) generating ideas. It is not as good as
direct communication for (1) bargaining, (2) resolving
disagreements, (3) getting to know someone, or (4) tasks
requiring constant, focused attention.
Picot, Klingenberg, and Kranzle [1982 3 studied
managers opinions of the value of various communication
channels for supporting managerial information require
ments. They asked managers to evaluate six existing
channels for their effectiveness in meeting four
communication requirements: promptness, confidence,
accuracy, and the ability to handle complexity. The
74
results were not surprising. The telephone was preferred
when promptness was sought. Face-to-face contact was
chosen as best when confidence in the source was needed and
complex situations arose. Text was favored for accuracy.
Managers who were experienced in the new office
communication technologies were asked to Judge which of the
existing channels could be replaced and to what extent.
They indicated that "electronic text media could replace
about 4 percent of business trips, 9 percent of face-to-
face contacts, nearly 20 percent of telephone contacts, and
up to 60 percent of mail contacts" [Picot, et al. , 1982,
p. 6873.
They point out that one of the requirements of
organizational communication is to provide "social
meaning." For example: developing trusting relationships
among the organization's members, providing coordination
information for complex or changing tasks, promoting
creativity, instilling motivation, and evaluating perfor
mance. This communication requirement may not be easily
met by computer-augmented channels. The argument is made
that one can expect the new communication technologies to
effectively replace existing text-oriented channels such as
mail and telex but can expect only limited changes in oral
channels such as face-to-face and telephone.
75
Hiltz [19823 found that computer-mediated groups as
compared to face-to-face groups exhibit more equal
participation by all members but take longer to make
decisions. Also, although face-to-face groups report
greater consensus, the quality of the decisions tend to
be equal to the computer-mediated groups.
Plain [19843 studied how system use changed over time.
To do this he developed a system for categorizing message
types. The messages were broken down into two general
categories, managerial and operational. The managerial
category was further divided into two types, organizing
information and problem-solving information. The opera
tional category included all standard reports.
Using this categorization system, he tracked the
patterns of communication on a newly installed office
automation system over time. Six and a half months after
being first installed, organizing messages accounted for 48
percent of the total; problem solving messages, 44 percent;
and operational messages, 5 percent. By the end of the
study eight months later, organizing messages had increased
slightly to 56 percent, but problem-solving messages
decreased to 14 percent and operational messages climbed to
23 percent. The total usage of the system, month by month,
was not reported. These trends indicate that the intro
duction of computer-mediated communication has short and
76
long-term effects and that any study must be made with full
cognizance of this fact.
There exists within many firms the problem of inte
grating various information systems. Bravoco and Kasper
[1984 3 declared, "The success of information system
integration is directly dependent upon the extent to which
intra-firm systems can be logically consolidated. " Various
groups within an organization see the capabilities and
requirements of CAC differently. Appleton [1984 3 suggests
that there have been two viewpoints of CAC that can be
recognized, the user view and the technology view. The
user view defines the demand for information. The parti
cular demand for information varies from user to user and
is driven by the individual's organizational responsibil
ities. The term "user view" can also refer to a group of
users whose information requirements are handled by a given
data base.
The technology view considers the supply of informa
tion. It refers to the hardware and software provided by
the data processing group or by technology vendors. In
practice, this view has strongly influenced the user
viewpoint because in an effort to rapidly automate, many
organizations have fitted the user's view to the specific
technology available. The net result has been to create
77
"islands of automation" serving selected user communities
but not amenable to integration.
To overcome this fragmentation, Appleton suggests the
acceptance of a third viewpoint, the enterprise view. This
view specifies what data, hardware, support staff, and
communication should be shared and how. The logical
integration of the organization's information requirements
can be achieved using information architecture technology.
Six fundamental concepts of an information architecture
methodology are given by Bravoco and Kasper [19853 as
follows:
1, Should attack a problem by building a model or a representation of the problem, which expresses an in-depth understanding of an enterprise such as a business, school or governmental unit,
2. Would use a limited set of components to build models,
3, Should differentiate as much as practicable between the inbereot structure of the information and the storage media (e.g., forms, reports, tapes, discs) on which the information appears.
4. The language of the methodology should be a ^i§9dID!Di09 tegbnigue which would show component parts, interrelationships between them, and how they fit into a structure.
5, The methods should support disciplined, coordina^ ted teamwork, which would be required in order to produce results which reflect the best thinking of an enterprise,
6. The methods should require that all analysis decisions and comments thereon be in written form.
78
By employing these concepts, the organization should
be in a better position to integrate existing applications
into one monolithic system which can efficiently serve all
users and provide vital interorganizational communication.
A Recag
This chapter has reviewed literature from three
disciplines to form a foundation for the development of an
information system, decision-making model. Those papers
that specifically examined the effect of computer-mediated
communication on organizational communication and decision
making were grouped together in the last section. Through
out the review the salient works have been commented on
with respect to the development of the model. With this
background established, the next chapter will present the
setting for which the model developed by this research is
intended.
CHAPTER IV
THE RESEARCH SETTING
Overview
The following discussion provides a point of departure
for this study. The opening section provides a discussion
of the characteristics of organizations: 1) They are
viewed as human interaction systems which operate in an
environment that is known with varying degrees of certain
ty. 2) They are goal-driven. 3) They exhibit division of
labor with a resultant stratification of authority and
responsibility. The concept of organizational structure is
presented as the relationship among the members of the
organization. The concepts of formal and informal
structure are given along with the types of information
passed by each.
The second section contains a discussion of the role
of information in making organizational decisions and the
role of communication in transmitting this information.
Characteristics of communication are outlined and three
levels at which communication can be studied (intraperson
al, interpersonal, and intergroup) are discussed. The
concept of communication networks in the organizational
context follows. Finally, the decision-making process
79
80
and information system model used in this study are
presented.
Ibe Organization
The organization is the setting in which the effects
of information systems on communication patterns take
place. Since this study is investigating these effects, it
is necessary to establish Just what is being talked about
when the term "organization" is used. Although this study
is directed toward the business setting, the concepts are
meant to apply more broadly to Include any organization
(governmental, nonprofit, etc.) that uses a computer-based
information system to make decisions.
Characteristics of Organizations
There are many different concepts of what an organi
zation is. As one would expect, the definition used is
often stated in terms that fit a particular frame of
reference or fit a particular argument. The classical
definition is typified by Schein [19653:
, , ,the rational coordination of the activities of a number of people for the achievement of some common explicit purpose or goal, through division of labor and function, and through a hierarchy of authority and responsibility.
As such, it describes many organizations as they exist
today. Specifically, it addresses the following organi
zational characteristics:
81
1. They involve more than one person and, therefore,
provide a setting that allows interpersonal
interactions to take place.
2. They are goal directed.
3. They divide the task, assigning various types of
work to specific individuals with consequent Job
specialization.
4. They exhibit ranks of power and/or authority and,
therefore, have superiors and subordinates.
Hrebinlak [1978, p.33 provides a definition that is a
bit broader. "An organization can be viewed as a social
collectivity that engages in purposeful exchange relation
ships with its environment." This viewpoint stresses three
concepts. First is the social aspect of organizations.
They are collections of people, people that interact with
each other. Second, organizations are formed and main
tained to meet some purpose. This purpose is embodied in
the organization's set of goals. Third, the goal set is
stated in a manner that defines the desired connection
between the organization and the world in which it oper
ates. Once goals are established for an organization, its
members need to coordinate their activities so that the
stated objectives can be pursued. A major portion of this
coordination effort involves communication among decision
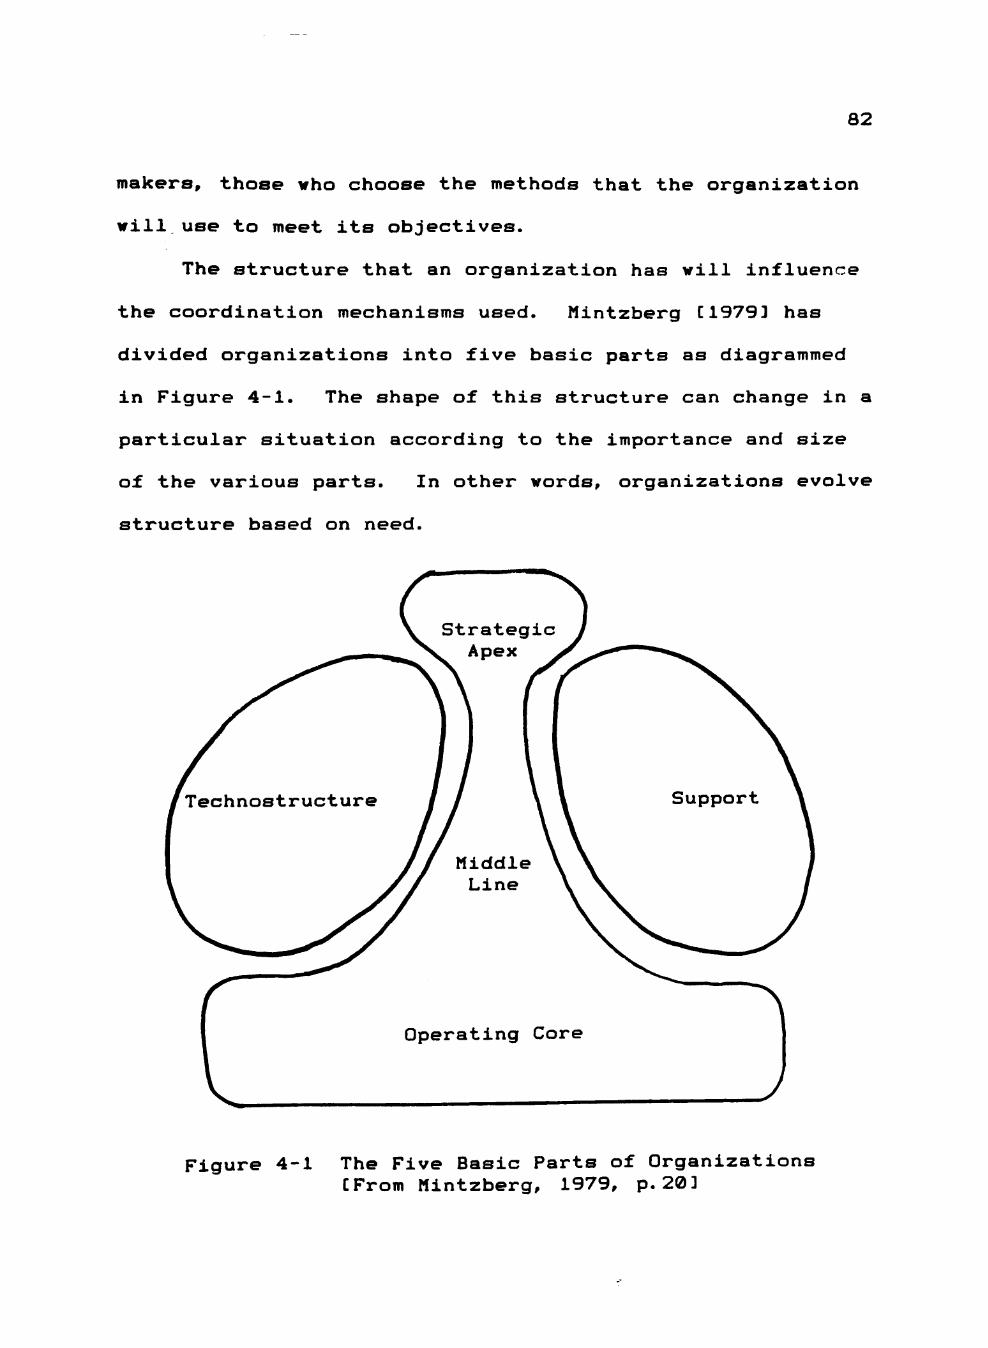
82
makers, those who choose the methods that the organization
will use to meet its objectives.
The structure that an organization has will influence
the coordination mechanisms used. Mintzberg [19793 has
divided organizations into five basic parts as diagrammed
in Figure 4-1. The shape of this structure can change in a
particular situation according to the importance and size
of the various parts. In other words, organizations evolve
structure based on need.
Strategi Apex
Middle Line
Operating Core
Figure 4-1 The Five Basic Parts of Organizations [From Mintzberg, 1979, p. 203
83
Responsible for the overall operation of the organi
zation are those managers at the strategic apex. At this
level, long-range strategies are developed to advance the
organization toward its goals. The middle line managers
connect the strategic apex to the operating core by
developing shorter-range tactics to implement the long-
range plans. The operating core carries out the input,
processing, and output of the organization. These three
basic parts are directly responsible for achieving the
goals of the organization.
Supporting these mainline groups are the two other
groups. The technostructure provides analytical expertise
to help the organization deal with the environment. It
also helps coordination by standardizing the work of
others. The last group, the support staff, provides
services to the mainline group that are necessary for
operation yet not directly involved with the primary
purpose of the organization. Examples include payroll,
personnel, custodial services, etc.
Influencing the structure that an organization takes
is the environment, both internal and external in which it
operates. Organizations exist in an external environment
which affects the inputs to the organization and consumes
the outputs of the organization. "Uncertainty appears as
the fundamental problem for complex organizations, and
84
coping with uncertainty, as the essence of the administra
tive process" [Thompson, 1967, p.1593. In this sense, they
are open systems and, as such, are subject to the uncer
tainties that exist in the world: fire, flood, shifts in
economic conditions, political change, etc. Uncertainty
and change cause problems for organizations because they
affect the goals and the methods employed to achieve those
goals. Therefore, organizations employ strategies to
reduce uncertainty; they attempt to become systems that are
more closed. The strategies used depend on the degree of
uncertainty that exists in the external environment. The
more certain the environment, the more closed the organi
zation can become.
The internal environment is comprised of the resources
embodied within the organization, both man and material.
The structure that the organization exhibits will be highly
influenced by the tasks it undertakes to reach its goals
and the technology employed. Coordinating mechanisms which
involve the passing of information will necessarily be
geared to the organizational structure if the organization
is to achieve its goals. Therefore, to effectively make
progress in obtaining goals, organizations need to be
designed (contrived) with their goals in mind and must be
viewed as tools (instruments) for this purpose. They are
means to an end.
85
Although appropriate management may attempt to exhibit
goal-directed behavior, there are some organizational char
acteristics that may present obstacles that thwart complete
success. One is that the environments are uncertain. What
may appear as a sound decision may be rendered invalid by a
change in conditions that was unexpected. Perfect informa
tion is needed for perfect control. Since decision makers
operate under conditions of bounded rationality, they may
make decisions that are intended to be goal oriented yet
fall short of best performance. Obviously, decisions made
under conditions of risk will benefit from analysis that
will enable the upside as well as the downside risks to be
evaluated.
Another relevant characteristic of organizations is
that since organizations are comprised of people, they are
social entities. As such, they present formidable problems
in coordination. As the size of the organization grows,
the number and type of interrelationships grow exponen
tially and become hard to analyze. Individuals interact
with other individuals. Individuals interact with groups.
Groups interact with other groups. The organization
becomes a society within a larger society.
The interactions also range beyond the personal or
group level to include man-machine and environmental
(extra-organizational) interactions. The technology
86
employed impacts not only the organization's product but
also its social structure. In general, as technology
increases individuals experience less autonomy (less self-
sufficiency ).
A final characteristic of organizations is that since
they are comprised of interacting people, they are politi
cal. They are power systems. Power can be exhibited in
several ways: formal authority as indicated by superior/
subordinate relationships, seniority, expertise, respect,
etc. As the old adage goes, knowledge is power. With the
advent of automated information systems, significant shifts
in the power system can be expected. No decision is com
plete until the ramifications of the existent power system
are included. A great decision may be made but if it can't
be sold to those with the power to enact or quash it, it is
useless.
Therefore, organizations can be summed up as having a
set of attributes: they are partially open, contrived,
instrumental, intendedly rational, social, technical, and
political.
Whenever the term "organization" is applied to a group
of people, the following characteristics emerge:
1. The group, as a whole, has a primary goal.
2. Group members operate as a unit to achieve their primary objective.
87
3, Each individual has a designated function which contributes toward the accomplishment of the goal or objective,
4, Each person's work would be impossible or meaningless apart from the efforts of others.
5, Each member is related to other members in a special way, [Toffler, 19713
An understanding of these characteristics is important if
one is to understand the setting in which organizational
communication takes place. The observed communication
patterns and content will be influenced by this setting.
The Formal Organization
Most organizations, for reasons of control, have a
formalized system of delegated authority and responsibili
ty. This structure, typically hierarchical, is necessary
for enabling the group to perform the tasks that advance
the organization toward its intended goals. These struc
tures are commonly represented as organizational charts.
Such a chart diagrams the delegation of duties and are
implicit statements of the nature and content of the tasks
each person is to perform. These tasks require information
to be carried out. Therefore, an organizational chart is
also a diagram of the paths that formal communication
should take. Organizations formalize the collection,
management, and distribution of information that is
necessary for making decisions. An important point here
II II^.J^^
88
is that this structure is instituted to assure that
information vital to the function and survival of the
organization is provided.
Three types of organizational information that must be
supplied through the formal system have been described by
Thayer [1967 3:
1. Operational Information--that set of messages relevant to the enterprise's daily work on its basic tasks (either short- or long-range).
2. Regulatory Information--that set of all messages relevant to the goal-setting, task defining, role-setting, and decision-framing functions of the enterprise.
3. Maintenance and Development Information--that set of messages concerning the mantenance and support of all conversion centers, channels, and action centers in their material, nonmaterial, and human aspects.
In practice, these three types are often mixed and provided
through common channels. Nonetheless, all three types must
be supplied so that all the types of decisions necessary
for the organization's operation can be adequately support
ed with relevant and timely information.
The formalized flow of information as depicted in an
organizational chart tends to suggest that these require
ments are unchanging. This may not be the case. If the
nature of a task shifts (perhaps in response to changes in
the external or internal environment) the information
requirements will change. Evidently, formalizing systems
89
of responsibility and explicit delegation of duties may
reduce an organization's ability to react to a changing
environment. The formalized system must either be suffi
ciently flexible to supply information that is suitable to
the new task or it must be changed to meet the new re
quirements. To be adequate, a formal system must supply
all three types of information in a timely manner to each
person operating within the organization.
The Informal Organization
Organizations also have an informal structure. One
reason is that it is very difficult to formalize all in
formation requirements. Additionally, even if an adequate
formal system is established, actual communication paths
may not follow the formal paths. Factors such as physical
proximity and expediency may generate information flow
paths outside the formal scheme. Additionally, personal
motivational factors may influence the flow of communicated
information. For example:
1. Employees typically communicate with those who help them achieve their aims and avoid communicating with those who do not assist or who may retard their accomplishing those goals.
2, They direct their communication toward those who make them feel more secure and gratify their needs and away from those who threaten them, and make them feel anxious, or generally provide unrewarding experiences.
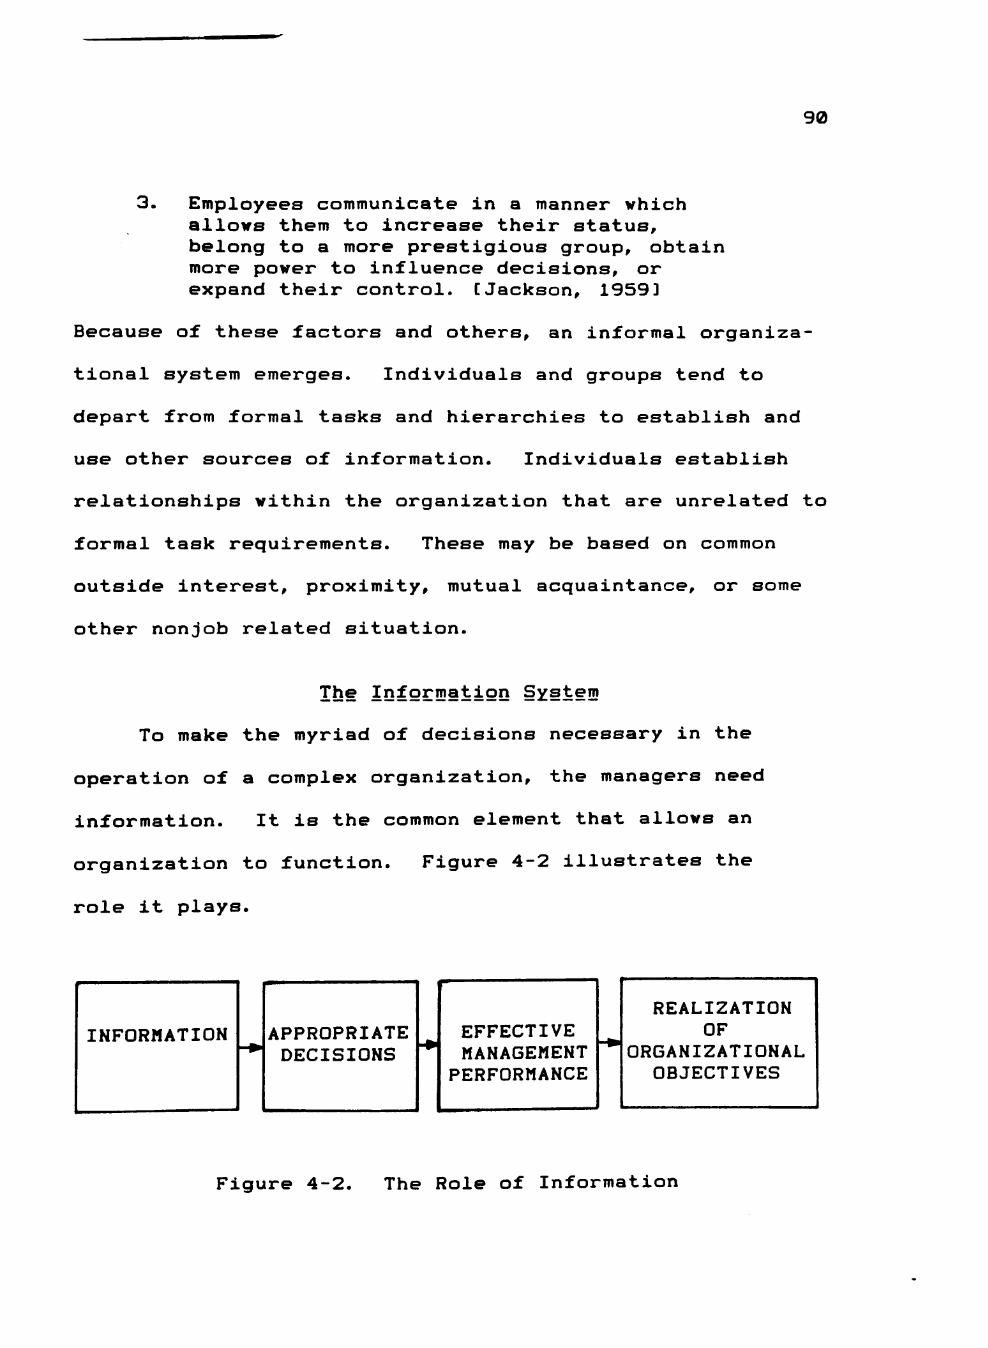
90
3. Employees communicate in a manner which allows them to increase their status, belong to a more prestigious group, obtain more power to influence decisions, or expand their control. [Jackson, 19593
Because of these factors and others, an informal organiza
tional system emerges. Individuals and groups tend to
depart from formal tasks and hierarchies to establish and
use other sources of information. Individuals establish
relationships within the organization that are unrelated to
formal task requirements. These may be based on common
outside interest, proximity, mutual acquaintance, or some
other nonjob related situation.
Ibe Information System
To make the myriad of decisions necessary in the
operation of a complex organization, the managers need
information. It is the common element that allows an
organization to function. Figure 4-2 illustrates the
role it plays.
INFORMATION APPROPRIATE DECISIONS
EFFECTIVE MANAGEMENT
PERFORMANCE
REALIZATION OF
ORGANIZATIONAL OBJECTIVES
Figure 4-2, The Role of Information
91
To transfer this information, some process must be
employed: the process called communication, Likert [1967 3
defines it as ",,.the sending and receiving of information
within a complex organization." The view this study takes
is that information systems are communication systems. As
such, many of the ideas relating to the study of communi
cation are directly applicable to information systems.
Therefore, this section will establish the groundwork for
discussing both communication and information systems.
Characteristics of Communication
Communication, as it applies to organizational
communication, is "the sharing of messages, ideas, or
attitudes resulting in a degree of understanding between
a sender and a receiver" [Lewis, 1980, P. 93. It is a
process that is made difficult because humans are involved.
Humans are notoriously complex, diversified, and hard to
predict. Therefore, the set of conditions existent during
any one exchange of information is uncertain. Education,
attitudes, beliefs, emotions, preconceptions, even physical
well-being and more affect the success of the communication
process. Successful communication occurs when "the sender
of a message and the receiver of that message achieve a
high degree of similarity in their comprehension of what
was actually transmitted" [Lewis, 1980, p. 93.
92
Communication can be studied on three levels, each
level being made up of a hierarchy of processes; a
"multidimensional framework of differing, yet closely
interrelated levels of activity" [Mortensen, 1972, p. 233.
These levels are:
1. Intrapersonal communication--this level deals with the processes going on within the person.
2. Interpersonal communication--at this level the one-on-one exchange of ideas is examined.
3. Socio-cultural communication--this level involves interactions both of individual to group and group to group.
The intrapersonal level looks at communication at the
cognitive level. At this level physiological processes are
investigated and related to observed psychological behavior.
All other levels depend on what happens at this level.
Although this level deals with the thought processes that
are a requirement for effective transmission and interpre
tation of communicated information, it falls outside the
scope of this research and will not be dealt with expli
citly. Physical ability of the decision makers to com
municate will be assumed.
The other two levels are of direct interest to this
research because they are the ones toward which information
systems are targeted. The interpersonal level deals with
the transfer of information from individual to individual.
It can be highly influenced by the relationship that exists
93
between the two parties. This relationship will be
affected by factors such as power, prestige, or authority
one individual has vis-a-vis the other in addition to the
personal relationship they enjoy.
The sociocultural level is also of interest. It
deals with the communication that goes on 1) between
Individuals and groups, 2) between groups, and 3) between
the organization and the external environment. The
interaction between individuals and groups (intragroup)
occurs in two modes. The first is one-to-many such as a
person presenting a proposal to a group. The group may be
comprised of peers, superiors, subordinates or a combina
tion of these. The second mode is many-to-one such as a
committee presenting findings to an individual for action.
Again, the receiver may be at any organizational level.
Between group (intraorganizational) interaction is
typified by the information one functional group provides
to or requires from another such as the marketing
department providing monthly demand forecasts to the
production department. Automated information processing
systems have been heavily applied to such communication
requirements.
Between the organization and the external environment
flows a constant exchange of information. The organization
94
needs information that will affect its output. Examples
include marketing data, new technology, changes in govern
mental regulation, etc. The organization also provides
information to the environment. Examples include product
promotion, public relations, employment opportunities, etc.
Acquisition and dissemination of this type of information
involves massive amounts of data, and the accuracy and
timeliness of such communications are of great importance.
All these levels need to be satisfied simultaneously.
The connecting mechanism that provides the information is
the communication network.
Communication Within the Organization
Information may be provided to an individual or group
from several directions. It may arrive through formal or
informal sources. It may come vertically from superiors
or subordinates. It may flow horizontally from peers or
diagonally from those outside the immediate chain of
command. It may arrive from within or from outside the
organization. The way these sources are connected is
called the communication network. "A network is a system
of communication lines connecting the sender and receivers
into a functioning social organization" [Communication
Networks and Monitoring, 19613.
95
Since people are the ultimate receptors of informa
tion, their communication patterns will establish their
membership and function in the network.
Network membership may be considered in terms of (a) the total number of individuals with whom a person communicates and the location of the unit within the organization, (b) the organizational level of the members in terms of communicating vertically, horizontally, or diagonally, and (c) the nature or purpose of the communication. The bulk of the network membership is among one's peers in other units (the horizontal structure) and in persons at higher or lower levels in units other than one's home base (diagonal structure) [Wickesberg, 19683.
Communication networks form patterns which inhibit or
facilitate coordination to varying degrees. The type of
network was also found to impact on morale, stability of
leadership, and flexibility. The research findings of
various investigators was presented in the literature
review.
The communication exchanged in the network is deliv
ered within a technological environment. The technology
employed influences the amount and quality of the informa
tion. The domain of the technological environment ranges
from the senses (eyes, ears, etc.) to the equipment and
software used to generate, store, manage, extract,
transmit, and present information. These technological
factors affect the quality of the communication received
and therefore the decisions being made.
96
The Decision Process and Communication
Communication within the organizational context is an
information processing system. To put this into perspec
tive, consider a production manager (decision maker) in an
organization. According to Adam and Ebert [1985, page 253,
an operations manager has three primary functions: plan
ning, organizing, and controlling. Planning is the process
of deciding what, for example, the production department
must do to meet organizational goals by formulating
production goals. Organizing is deciding how to achieve
these goals. Controlling makes use of feedback to
determine how well the production department is doing in
achieving these goals and what to do if satisfactory
progress is not being made. While performing these three
functions, the manager makes differing classes of decis
ions. They can be classified as:
1. Organizational versus Personal--organizational
can be delegated whereas personal cannot.
2. Strategic versus Tactical versus Operational--
strategic deal with how the organization plans to
meet its goals, tactical deal with the
implementation of those plans, and operational
deal with the daily achievement of the plans.
3. Programmed versus Nonprogrammed--i,e., structured
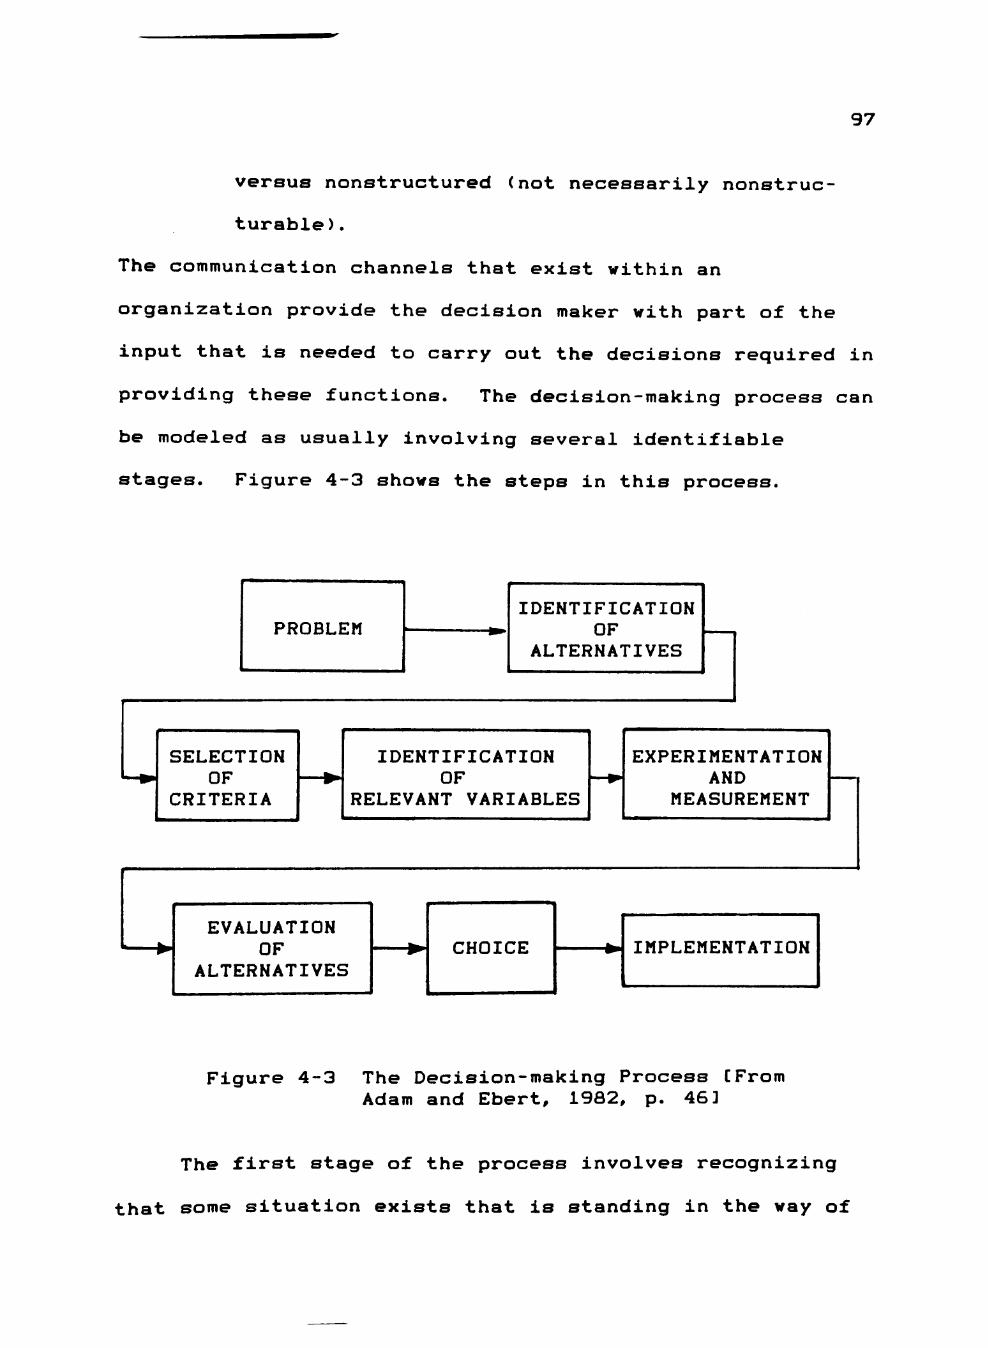
97
versus nonstructured (not necessarily nonstruc-
turable).
The communication channels that exist within an
organization provide the decision maker with part of the
input that is needed to carry out the decisions required in
providing these functions. The decision-making process can
be modeled as usually involving several Identifiable
stages. Figure 4-3 shows the steps in this process.
PROBLEM IDENTIFICATION
OF ALTERNATIVES
SELECTION OF
CRITERIA
IDENTIFICATION OF
RELEVANT VARIABLES
EXPERIMENTATION AND
MEASUREMENT
EVALUATION OF
ALTERNATIVES CHOICE IMPLEMENTATION
Figure 4-3 The Decision-making Process [From Adam and Ebert, 1982, p. 46 3
The first stage of the process involves recognizing
that some situation exists that is standing in the way of
98
achieving a goal. Second, a set of alternative approaches
to solving the problem is derived. Next, a process is used
to provide the foundation for the fourth step in which each
of the alternatives is given a rating. In the fifth step,
one of the alternatives is chosen. Finally, the choice is
put into action.
The time and/or effort put into each step varies with
the specific situation. In some cases the step becomes
trivial. For example, problem recognition is evident when
an immediate and obvious threat presents itself. In other
cases, the step may be difficult. Example: problem
recognition may become extremely difficult when conflicting
signals are received. The important point, in view of this
research, is that all stages require information--informa-
tion provided by communication.
The Information Model
To provide a common ground for this study, the infor
mation system model provided by Neumann and Hadass [1980 3
will be used. It is approximated in Figure 4-4, They view
all levels of data and information processing as comprising
the organizational information system. At the base of the
overall system is the transaction processing system. This
system processes the source documents which feed the rest
of the system and provides the clerical services needed so
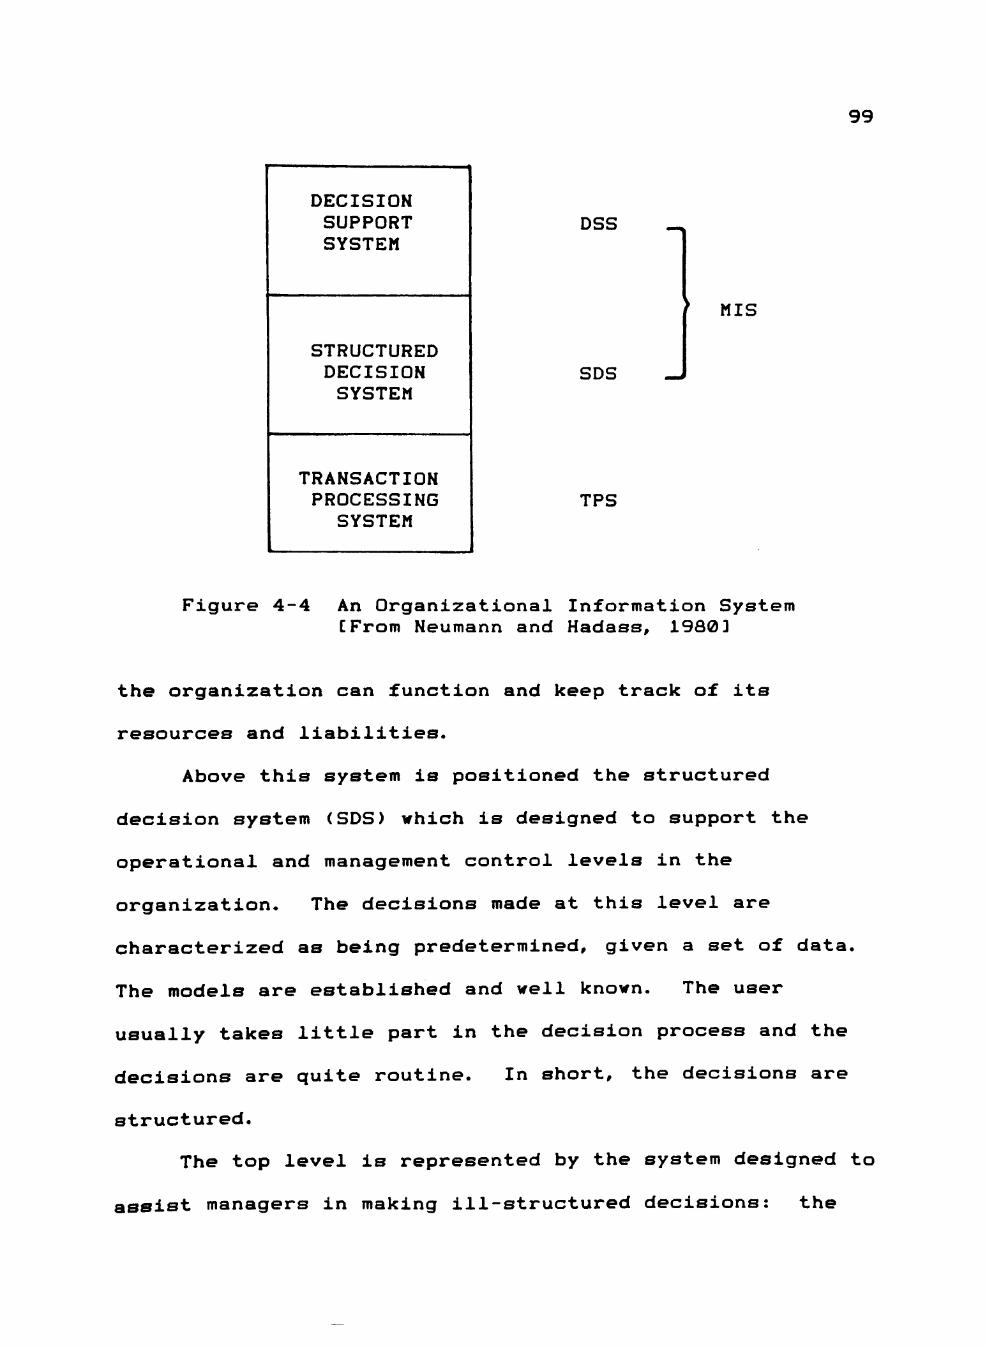
99
DECISION SUPPORT SYSTEM
STRUCTURED DECISION SYSTEM
TRANSACTION PROCESSING
SYSTEM
DSS -^
SDS -J
MIS
TPS
Figure 4-4 An Organizational Information System [From Neumann and Hadass, 19803
the organization can function and keep track of its
resources and liabilities.
Above this system is positioned the structured
decision system (SDS) which is designed to support the
operational and management control levels in the
organization. The decisions made at this level are
characterized as being predetermined, given a set of data.
The models are established and well known. The user
usually takes little part in the decision process and the
decisions are quite routine. In short, the decisions are
structured.
The top level is represented by the system designed to
assist managers in making ill-structured decisions: the
100
decision support system (DSS), This system is targeted
largely at the strategic planning levels in the organiza
tion, typically top management. The emphasis on strategic
planning is probably an artifact of circumstance rather
than substance. Managers at the strategic level had few
tools available to help them deal with the ill-structured
problems they faced. The DSS approach showed promise and
was latched onto quickly. Resources were available for
developing DSS aimed at the top management level and so the
majority of the work was done with the top manager and the
strategic problem in mind. It is very important to
realize, however, that there are ill-structured problems at
the operations control level, too, (and even a few at the
lowest levels within the organization).
The two levels directed toward serving the managerial
levels within the organization, the SDS and the DSS,
comprise what Neumann and Hadass call the management
information system (MIS). Whenever the term MIS is used in
this discussion, it will refer to systems that support both
those decisions that are well structured and those that are
illstructured.
All three levels have been profoundly affected by
changes in the technology employed (both hardware and
software). Two of the most influential changes have been
101
the introduction of low-cost personal computers and the
establishment of local- and long-distance transmission of
voice, data, images, and text. The effect of these new
technologies is to provide the decision maker with both
local and remote computational power and data storage.
This capability allows the manager to receive data and
transmit the results of analyses through the communication
network. For example, information for the decision maker
can be made available from local, company-wide, or external
data bases and the results can be transmitted through an
electronic mail system.
The net result of these new communication technologies
is to allow the decision maker to be proactive in
information acquisition. Rather than be provided with the
information that an existing system is designed to provide,
the decision maker can initiate the call for a desired set
of information. These communication processes provide an
extension to ad hoc data base query and DSS facilities
because the decision maker can request information from
other people, not Just machines. Such a network provides
collateral support to the three levels of the organizational
information systems. They become an integrated
information-communication system.
102
A Need
The operation of organizational information systems
and communication networks will become more tightly bound
than ever before. The marriage of the two will allow
significant improvement in the organizations's ability to
achieve its goals (i.e., react to shifts in the internal
and external environments). With the opportunities also
come potential problems. A theoretical model of how they
fit together would provide a contribution toward the
ability to understand and analyze the effects of CAC on the
firm and the firm's ability to efficiently and effectively
use and manage this emerging technology.
CHAPTER V
FRAMEWORK DEVELOPMENT
The purpose of this research is to build a conceptual
model designed to focus attention on the role of communica
tion in the decision-making process. Ackoff and Sasieni
state "It is frequently necessary to construct a descrip
tive model as a preliminary step toward developing an
explanatory model" [1968, p. 613. Following their advice,
a framework will be constructed that can be used as a basis
for developing the conceptual model.
A Basis for the Framework
To construct the framework, concepts from three
research domains are employed: MIS, Communication, and
Decision Making. The literature from these areas was
reviewed in Chapter Three. Additional perspective is
gained by using the organizational model offered by Leavitt
[19653 (Figure 3-1, page 14), especially as revised in
Figure 3-2 (page 17).
In the discussion of the development of the framework,
the following scenario is of interest. Some new communica
tion technology has been made available to the decision
makers in an organization. The question arises: what is
the effect of introducing this new technology on the
103
104
sources of information available to the decision maker? To
make the problem manageable, it will be assumed that the
effects are to be examined with respect to a given decision
made by a given decision maker at a given point in time.
Using Leavitt's model and following the assumptions
of the scenario, the following statements can be made. For
some particular Instance, the task (the decision) and the
people (the decision maker) are considered fixed. Given
this, a change in technology (the information system) must
produce a resulting change in the system (the sources of
information). These elements operate in an overall
environment comprised of those portions of internal and
external organizational environments that will affect the
decision.
From the MIS literature, the Chervany, Dickson, and
Kozar [1977 3 framework was chosen. This framework
(pictured in Figure 3-5, page 25) fits the revised Leavitt
perspective particularly well. They suggest three
Independent variables (the decision maker, the decision
environment, and the characteristics of the information
system) that coincide with three of Leavitt's elements
(people, the overall environment, and system). Their
dependent variable is decision effectiveness which is of
primary concern in the framework that is being developed.
105
The contribution of the Chervany, Dickson, and Kozar
framework to the framework being developed is an emphasis
on the interaction between the characteristics of the
system and the quality of the resulting decision. It also
ties the framework into the organizational perspective
which is desired for the proposed conceptual model.
From the communication literature, the Shannon and
Weaver [1949 3 model is used to represent the transferred
information (Figure 3-11, page 45), Transferred informa
tion is viewed as communication in the context of this
model. Thus, the characteristics of the channel over
which the information is transmitted and the fidelity of
the encoders and decoders become important system
considerations.
Channel characteristics are the first relevant issue
raised by the Shannon and Weaver model that will be
discussed. One channel characteristic is capacity, the
speed at which the channel is able to transmit information.
The channel capacity is insufficient if the transmission
rate is less than the rate at which the decision maker
consumes information. Insufficient capacity will restrict
the quality of the decision. The minimum desired capacity
is, therefore, equal to the peak rate at which a decision
maker can decode and assimilate information. Any capacity
106
above this minimum is superfluous. It does not hurt
anything as far as the quality of the generated decisions
are concerned. However, since higher channel capacity
often costs more to install, cost/performance
considerations may suffer.
A characteristic allied with capacity is the channel's
method of handling information overload. This condition
occurs when the instantaneous demand for information is
greater than the channel can handle. One typical way of
limiting information flow is to delay the feeding of
information to the channel (queueing).
Another characteristic is the ability of the channel
to effectively transmit a signal through a noisy
environment. Most all transmissions are carried by way of
media that have detectable ambient noise levels. A common
example is speech. When a person talks, there is usually
sound present other than the speaker's voice. A computer-
oriented example is electronic data transmission over
coaxial cable. The cable is designed to shield the signal
from external influences. Even so, internal thermal
activity or strong external disturbances can add noise to
the desired signal. Some channels reject noise quite
effectively. It is desirable to have a channel as immune
to unwanted noise as possible.
107
The second relevant issue raised by the Shannon and
Weaver model is the fidelity of the encoding and decoding
process. Fidelity refers to the resulting match between
what the source intended to send and what the destination
perceived was sent. In the encoding process, the transmit
ter encrypts the information provided by the source for
transmission across the communication channel. In the
decoding process, the receiver recovers the information
from the transmitted signal and passes it on to the
receiver.
Assuming the technological aspects of these two
processes are functioning correctly, there are still
behavioral aspects to consider which may affect the
accuracy of the transmission. Two primary behavioral
considerations are the congruence in the frame of reference
between the sender and the receiver and the ability of the
receiver to extract the intended signal from a noisy
channel.
The first behavioral consideration, congruence in the
frames of reference between the sending and the receiving
parties, is essential if the meaning of the transmitted
ideas is to be exchanged. As an example, in spoken
communication, words encrypt the meaning of the information
sent by the source. Assuming accurate recognition of the
words uttered, the sender must still count on the ability
108
of the receiver to accurately decode the meaning of the
received words. Differences in the connotation of a given
word may surface. The sender may use the term DSS to
represent a subset of MIS (a la Dickson [1980 3) whereas the
receiver connotes DSS to represent a different type of
system than a MIS (a la Carlson [19783). Newcomb [19533
(reviewed on page 49) presented a model addressing this
issue using the term "orientation" to refer to the frame of
reference of the sender and receiver. Communication is
facilitated if the orientations of the two parties is
similar.
The second behavioral consideration is the ability of
the receiver to retrieve the signal that was transmitted by
the sender from a channel that has added noise to the
message. An example of this capability can be drawn from
verbal communication. Consider a party where many
conversations are going on simultaneously. One person's
utterance can be picked out from among many others. The
factors allowing such discrimination include the timbre of
the speech, the volume of the voice, the context in which
the conversation is carried on, and other cues carried
simultaneously on other channels (such as visual "reading
lips, " etc. ). A second, computer-oriented example is data
transmission over noisy transmission lines (one where a bit
can get lost or an extra bit added). In such cases.
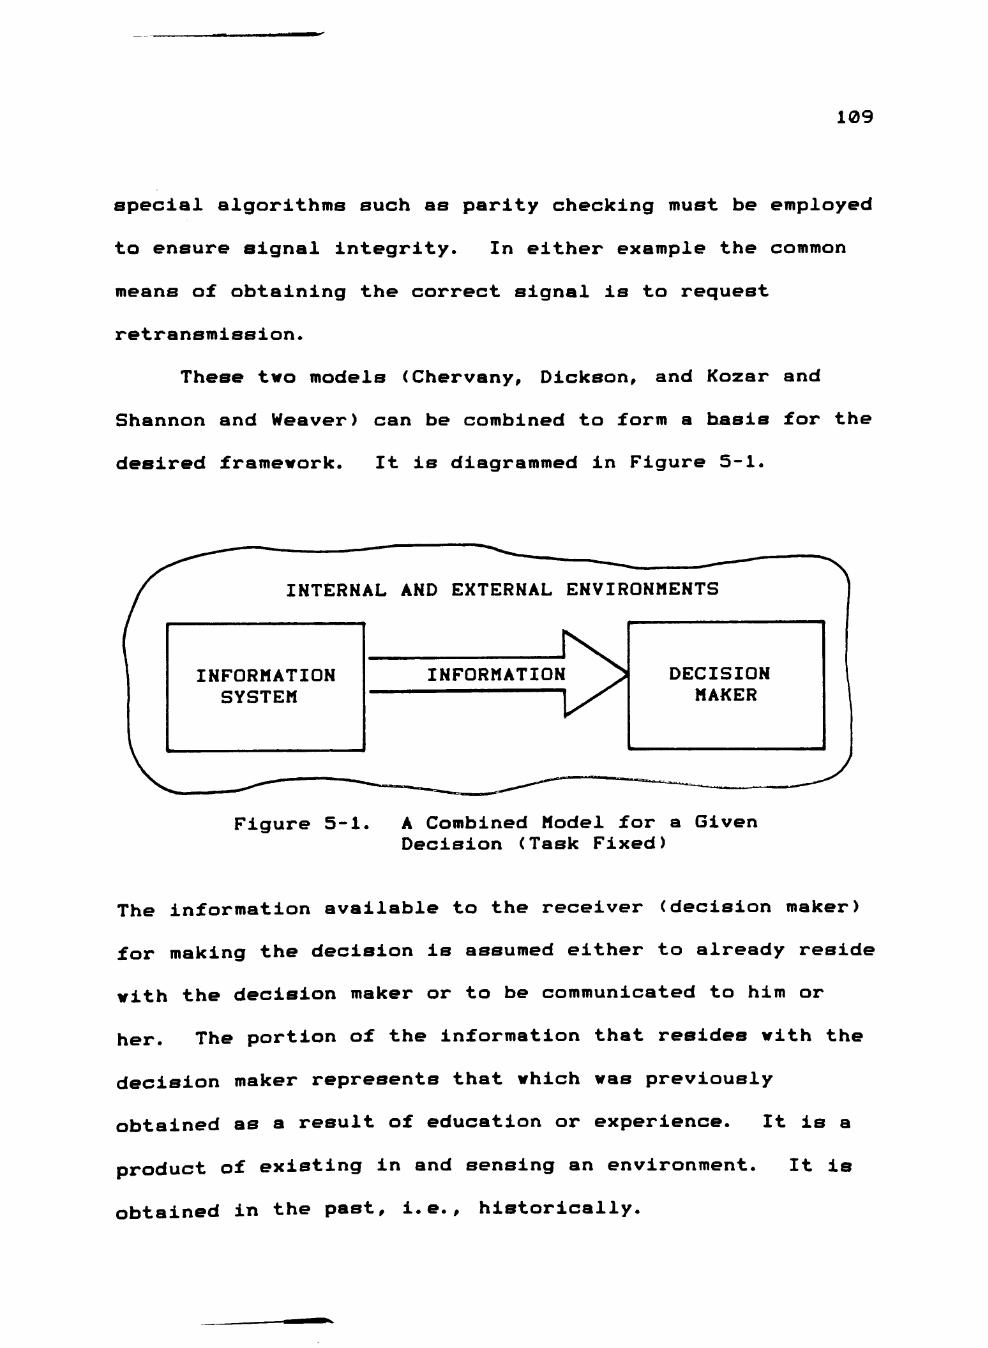
109
special algorithms such as parity checking must be employed
to ensure signal integrity. In either example the common
means of obtaining the correct signal is to request
retransmission.
These two models (Chervany, Dickson, and Kozar and
Shannon and Weaver) can be combined to form a basis for the
desired framework. It is diagrammed in Figure 5-1,
Figure 5-1. A Combined Model for a Given Decision (Task Fixed)
The information available to the receiver (decision maker)
for making the decision is assumed either to already reside
Yith the decision maker or to be communicated to him or
her. The portion of the information that resides with the
decision maker represents that which was previously
obtained as a result of education or experience. It is a
product of existing in and sensing an environment. It is
obtained in the past, i.e., historically.
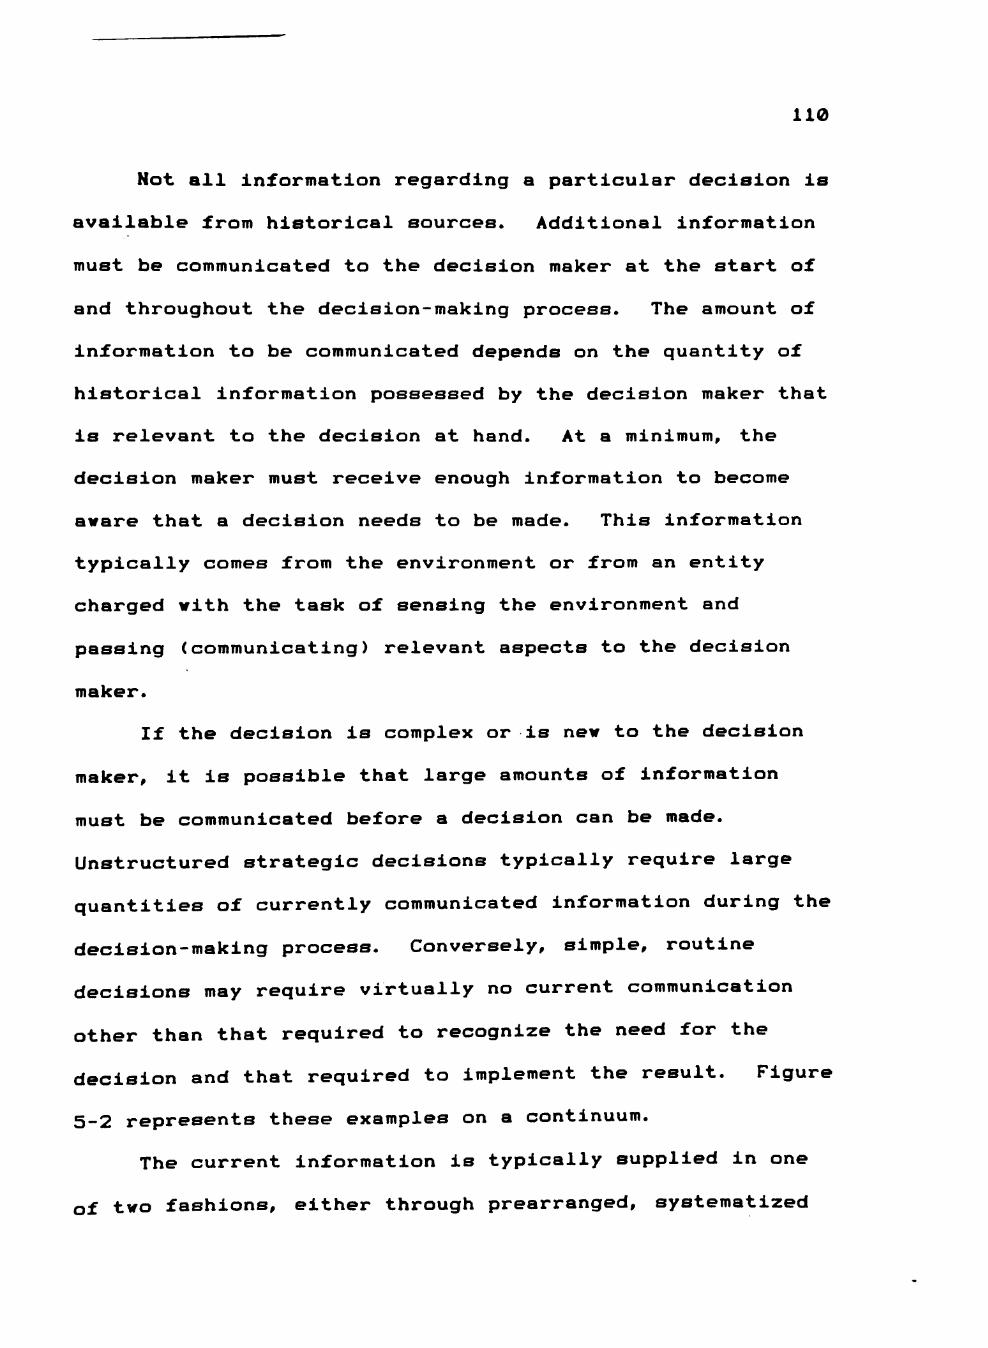
110
Not all information regarding a particular decision is
available from historical sources. Additional information
must be communicated to the decision maker at the start of
and throughout the decision-making process. The amount of
information to be communicated depends on the quantity of
historical information possessed by the decision maker that
is relevant to the decision at hand. At a minimum, the
decision maker must receive enough information to become
aware that a decision needs to be made. This Information
typically comes from the environment or from an entity
charged with the task of sensing the environment and
passing (communicating) relevant aspects to the decision
maker.
If the decision is complex or is new to the decision
maker, it is possible that large amounts of information
must be communicated before a decision can be made.
Unstructured strategic decisions typically require large
quantities of currently communicated information during the
decision-making process. Conversely, simple, routine
decisions may require virtually no current communication
other than that required to recognize the need for the
decision and that required to implement the result. Figure
5-2 represents these examples on a continuum.
The current information is typically supplied in one
of two fashions, either through prearranged, systematized
Ill
LOW AMOUNT
HIGH AMOUNT
Routine Operational Decisions
4-
Tactical Decisions
^
Unstructured Strategic Decisions
Figure 5-2. Amount of Current Communication Versus Decision Type
channels or through nonsystematized, ad hoc channels.
Systematized information includes that which is passed
through formal organizational networks or according to
prescribed protocols. Nonsystematized information arrives
through incidental, fortuitous, or other channels that were
not prearranged. Following Huber's [1984 3 lead, systema
tized channels will be referred to as formal; nonsystema
tized channels will be referred to as informal.
Formal Versus Informal Communication
The categorization of communication as formal or
informal results in a continuum rather than a natural
dichotomy. Examples of highly formal communication would
be contracts and other legal documents. Less formal
examples would be letters. Even less formal would be
interoffice memos. Somewhat informal examples would be
work-related discussions. Examples of informal
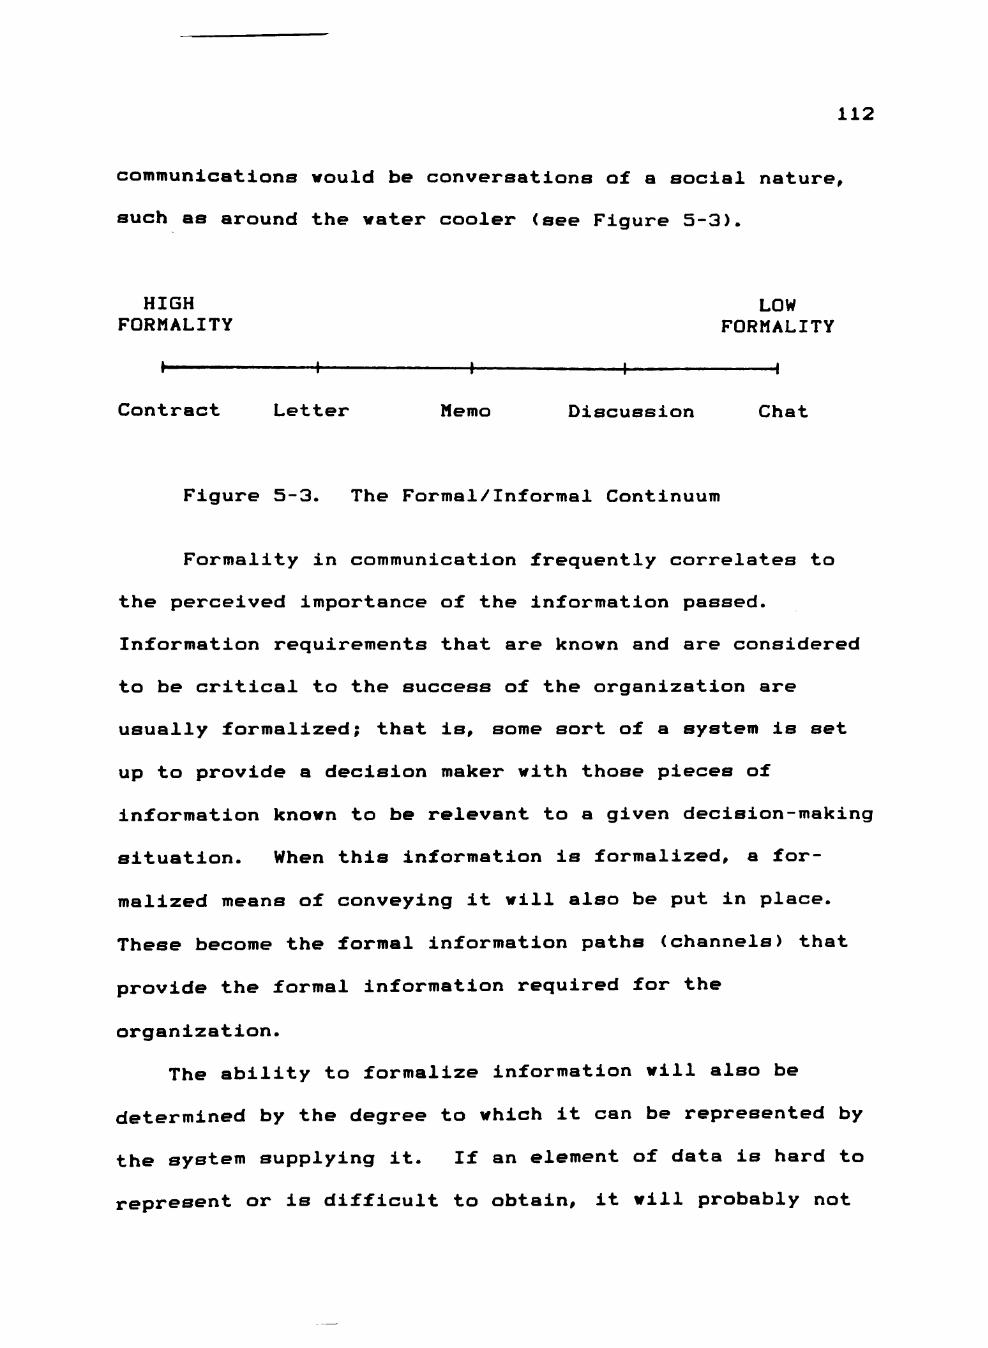
112
communications would be conversations of a social nature,
such as around the water cooler (see Figure 5-3).
HIGH FORMALITY
t
Contract
LOW FORMALITY
Letter Memo Discussion
H
Chat
Figure 5-3. The Formal/Informal Continuum
Formality in communication frequently correlates to
the perceived importance of the Information passed.
Information requirements that are known and are considered
to be critical to the success of the organization are
usually formalized; that is, some sort of a system is set
up to provide a decision maker with those pieces of
information known to be relevant to a given decision-making
situation. When this information is formalized, a for-
m alized means of conveying it will also be put in place.
These become the formal information paths (channels) that
provide the formal information required for the
organization.
The ability to formalize information will also be
determined by the degree to which it can be represented by
the system supplying it. If an element of data is hard to
represent or is difficult to obtain, it will probably not
113
be included in the formal portion of the information system
or, if it is included, it will be only weakly represented.
Informal information will include those items that are
not included in the formal information system and the means
of conveying this information will tend to be informal.
The fact that an item is not included in the formal
system does not diminish its importance. Without Informal
information, the decision maker may be unable to place the
"answer" that the formal system gives into context and,
therefore, determine whether or not it makes sense in light
of the "real world." Informal channels support informal
communication that gives the decision maker: 1) informa
tion that cannot be easily or conveniently represented
within the formal information system; 2) information which
the formal system could supply but has not yet been confi
gured to represent; and 3) a second source for information
which the system does supply, therefore increasing the
decision maker's confidence in the information provided.
All three of these provide the decision maker with the
ability to keep in touch with the real world and to make
his model relevant to the real world situation to which it
is being applied.
Since the terms formal and informal fall on a
continuum, the designation of a communication channel as
114
formal or informal becomes somewhat arbitrary. Any point
(except, perhaps, the endpoints) could be used as the
division between formal and informal. For the purposes of
this research, formal communication will include all
information provided through routinized or previously-
agreed-to channels. This includes all information provided
by an information system (whether computer-supplied or
manually generated). Informal communication will include
all other information that is not formal. Although this
definition is arbitrary, this choice does not affect the
validity of the model or the arguments that follow. Any
other operational definition could be used with similar
results.
Putting tbe Combined Model Into the Qecisign-making Context
As was discussed in Chapter Three at the end of the
decision-making literature review under the heading "The
Relevance of These Models to the Proposed Framework" (page
68), the arrows that represent the sequencing of the
decision-making phases in these models may also be
interpreted as representing communication flows. Using
this interpretation, decision-making communication can be
viewed as occurring in either the present or the past with
communication in the present being either formal or
informal. Therefore, in the framework developed here.
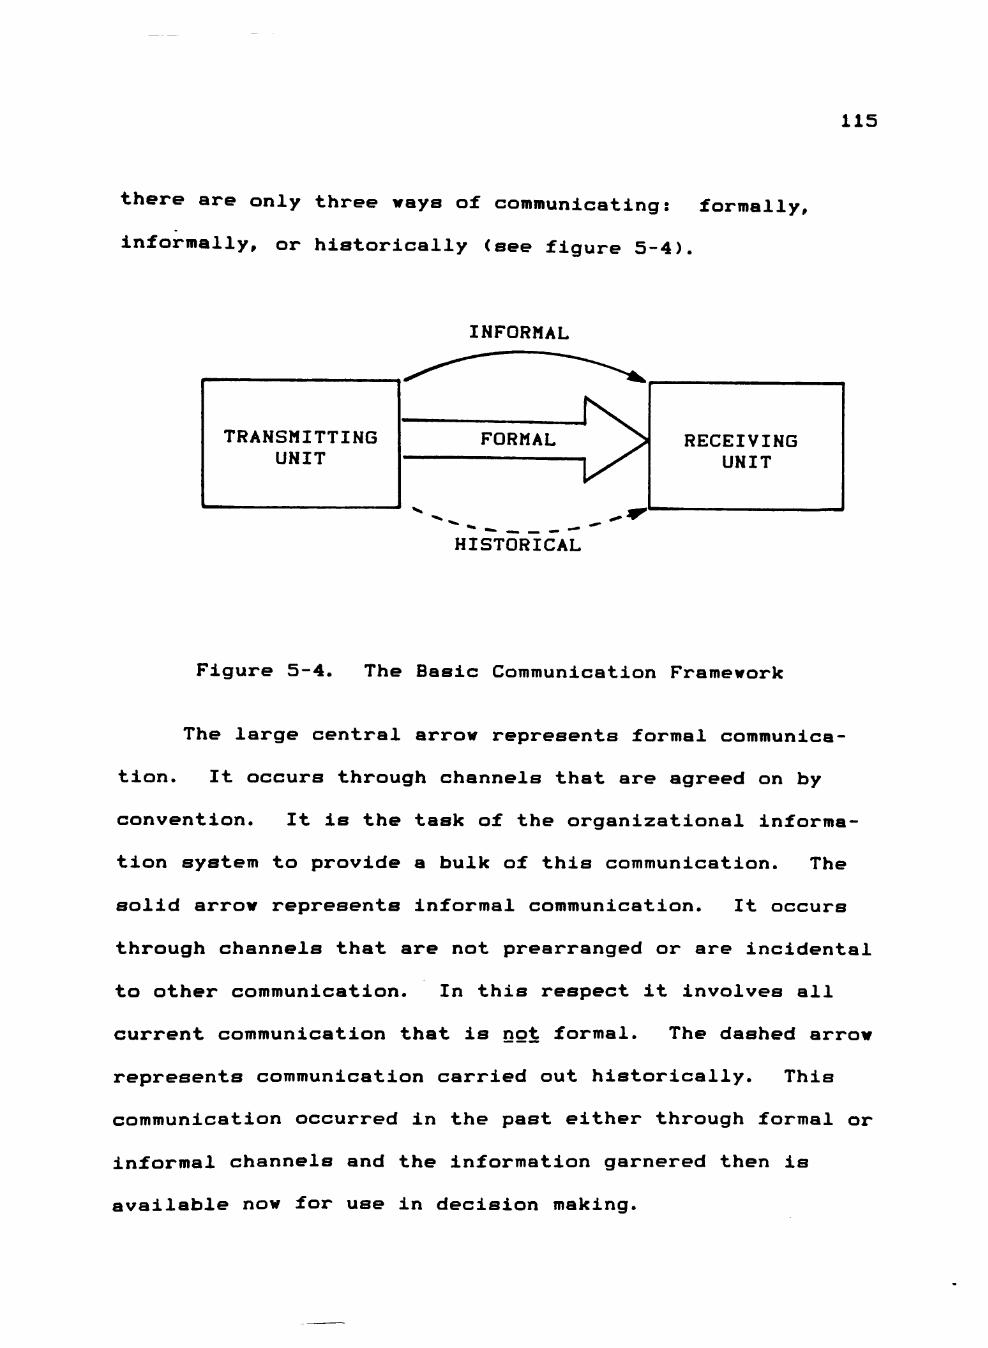
115
there are only three ways of communicating: formally,
informally, or historically (see figure 5-4).
TRANSMITTING UNIT
INFORMAL
HISTORICAL
Figure 5-4. The Basic Communication Framework
The large central arrow represents formal communica
tion. It occurs through channels that are agreed on by
convention. It is the task of the organizational informa
tion system to provide a bulk of this communication. The
solid arrow represents informal communication. It occurs
through channels that are not prearranged or are incidental
to other communication. In this respect it involves all
current communication that is not formal. The dashed arrow
represents communication carried out historically. This
communication occurred in the past either through formal or
informal channels and the information garnered then is
available now for use in decision making.
116
This basic communication framework can be integrated
into any of the decision-making models. For instance, any
of the arrows in the Mintzberg, Raisinghani, and Theoret
[1976 3 model of the decision process can be viewed as
representing situations in which the communication of data
or information is required. The arrows directed toward one
of the routines represent the information required to
actuate the routine. As this basic communication framework
indicates, these requirements can be supplied formally,
informally, or reside within the decision maker as a result
of past education or experience. Arrows leading out of a
routine represent its products which, being informational
in nature, must be communicated to the next routine. By
integrating the basic framework of communication into these
outbound arrows, one can model any explicit outputs which
would be presented formally or disseminated through the
organization's information system. Likewise, the attitudes
and predispositions of any person involved in a routine can
be modeled as informal communication. The context in which
the output of a routine is received can be modeled as
historical communication.
The right-directed arrows in the decision-making
models (example: Figure 3-18, page 62) represent inputs
and outputs of the decision process routines. Addition-
117
ally, by replacing the leftward arrows, the basic
communication framework also models feedback.
In an organizational setting, formal communication is
traditionally represented by reports, requisitions, and
memoranda. In the context of the framework, any informa
tion that the system was specifically designed to handle
would also be included. Informal communication is typical
ly thought of as socially oriented. In the context of the
model, any information obtained by other than prearranged
system channels is considered as informal. All knowledge,
experience or intuition that lends context to the decision
making process or reduces the present demand for informa
tion is considered, in the framework, to be historical
communication.
The channel effects suggested by the framework are
drawn from the Shannon and Weaver model. The character
istics of the channels used to transmit formal and
informal communication will affect the amount and the
fidelity of the information available to the decision
maker. Naturally, the better the characteristics of the
channel used, the more efficient will be the transmission
of information. One of the goals of installing improved
CAC technology is to improve the characteristics of the
channels used to transmit formal communication. An issue
addressed by the model developed in the next chapter is the
118
consequence of a net change in the characteristics of the
channels used for facilitating informal communication.
A Recap
This chapter presented the development of a framework
which combines features of models from the information
systems, communication, and decision-making literature.
This framework is different in that it specifically
includes the effects of communication technology on the
transfer of information within the decision-making process.
The framework will be used as a basis for the development
of the conceptual model. This model will be used to
qualitatively analyze the effects of computer-augmented
communication on the communication channels that supply the
decision-maker with information. The development of the
conceptual model is given in the next chapter.
CHftPTER VI
THE FORMAL/INFORMAL COMMUNICATION MODEL
godgl Developwr^lp
This chapter presents the developwent of a Mcxiel
Mhicrh cAti be used to analyze An organization** inforwation
system by breaking down the communications into two types,
those from formal (systematized) sourcres and those from
informal (nonsystematized) sources. First, the primitives
from which the model is synthesized aLirm presentiKl. This
section defines the terms used and discusses their
implications in the context of the moctel. The neMt secrtion
presents the model aund shows how it handles and represents
various information system parameters. The third section
presents the effects of introducing CAC technology on the
modelled representation of a given information system
providing support for a given decision. The final section
discusses some of the implications of this model to
information system design.
To reduce the number of issues that should be addres
sed during the developNnent of the model, the discussion
will be confined to a situation in which a single decision
maker is making a single decision at a given point in time.
This restriction eliminates the need to address the behav-*
119
i2e
ioral and logistical issues involved in group decision
making environments. Also, by considering only one decison
at a time, the variable information and system requirements
of a multiple decision environment are eliminated.
Furthermore, since we are assuming the system is fixed at a
given point in time, the historical component of the
information available to the decision maker is fixed. All
information needed to make the decision (in excess of what
the decision maker has obtained historically) will, there—
fore, need to come through formal and informal communica
tion channels.
Preliminaries
The framework developed in Chapter Five directs
attention to the means that a decision maker has of
obtaining information while making a decision. At a given
point in time, the amount of historical information stored
in the mind of the decision maker is fixed so that any
necessary additional information must be drawn from other
available sources. The sources were divided into two
categories, those that surv provided through previously
arranged channels (i.e., those that are systeiaatized) and
those that are obtained from other sources (i.e., those
that are not systematized). In organizations these are
commonly referred to respectively as formal and informal
121
sources which are supported by formal and informal modes of
commun i cat ion.
It is frequently said that information systems provide
organizational information. In the strictest sense this is
incorrect. They only provide data from which a decision
maker can extract information- The following discussion
will lead to a better understanding of this difference:
the definitions, therein, stress the objective nature of
data and the subjective nature of information.
Q Jta Versus information
Data is a terra used to refer to symbolic representa
tions of quantities, objects, events, or concepts- They
are intended to depict the identifiable attributes of what
they describe. They are generated through an encoding
process and are stored on or transmitted through some
med i um.
Information is a result of a conversion that takes the
data representations and assimilates them in a way that
increases art individual's understanding of reality- This
increased understanding of reality is information-
Therefore, it is the result of a process. The process
involves the decision maker perceiving communicated data,
extracting meaning from the data, and placing the perceived
meaning into the context of his or her experiential
122
environment. Because each decision maker has a different
experiential base, the meaning (information) derived from
any given set of data is a function of the individual's
knowledge, attitude, situation and relevant responsi
bilities.
Data, as defined above, is an abstract representation
of perceived reality. Different levels of abstraction can
exist forming a hierarchy with higher levels being
represented more abstractly- For example, the TPS supplies
data at the lowest level, the level at which it is
collected. These data can be presented, totaled,
summarized, etc., (processed) to provide "information"
(really data) to the operational level of management. For
instance, this data can be supplied as summary statistics
which the manager places into a cognitive context wherein
it becomes information.
Continuing with the example, the summary statistics
may be aggregated and combined with other data to provide
"information" to the tactical level manager. Additional
levels in the hierarchy can similarly be supplied with
data. Such data typically becomes more abstract as the
managerial level increases-
As described in the Communication Models section of
Chapter Three (page 44), communication is the transmission
of the data used to develop information- Communication is
t^
123
carried out by encoding the sender's perception of reality
and sending the resulting data over some medium to the
receiver who uses it to produce information regarding
reality. The efficacy of the communication process is
governed by the congruence in the frames of reference of
the sender and receiver- This is consistent with Newcomb's
C19531 model (presented on page 49).
From this point on, phrases such as "the transmission
of information" and "communication of information" will be
used to ref&r to the exchange of the data that results in
the development of information. Although less technically
correct, this convention is less cumbersome and conforms to
the common usage of the term in the information systems and
management literature.
I: Decision—making Information
As discussed in the last section, data is distinct
from information- The next two paragraphs refer to
information only- Information is needed in the decision
making process. To present a discussion of the "amount" of
information needed or available regarding a certain
decision, assumptions are necessary regarding the quantifi
cation of information. For the development of the follow
ing model, it will be assumed that it is theoretically
possible to measure information on at least an ordinal
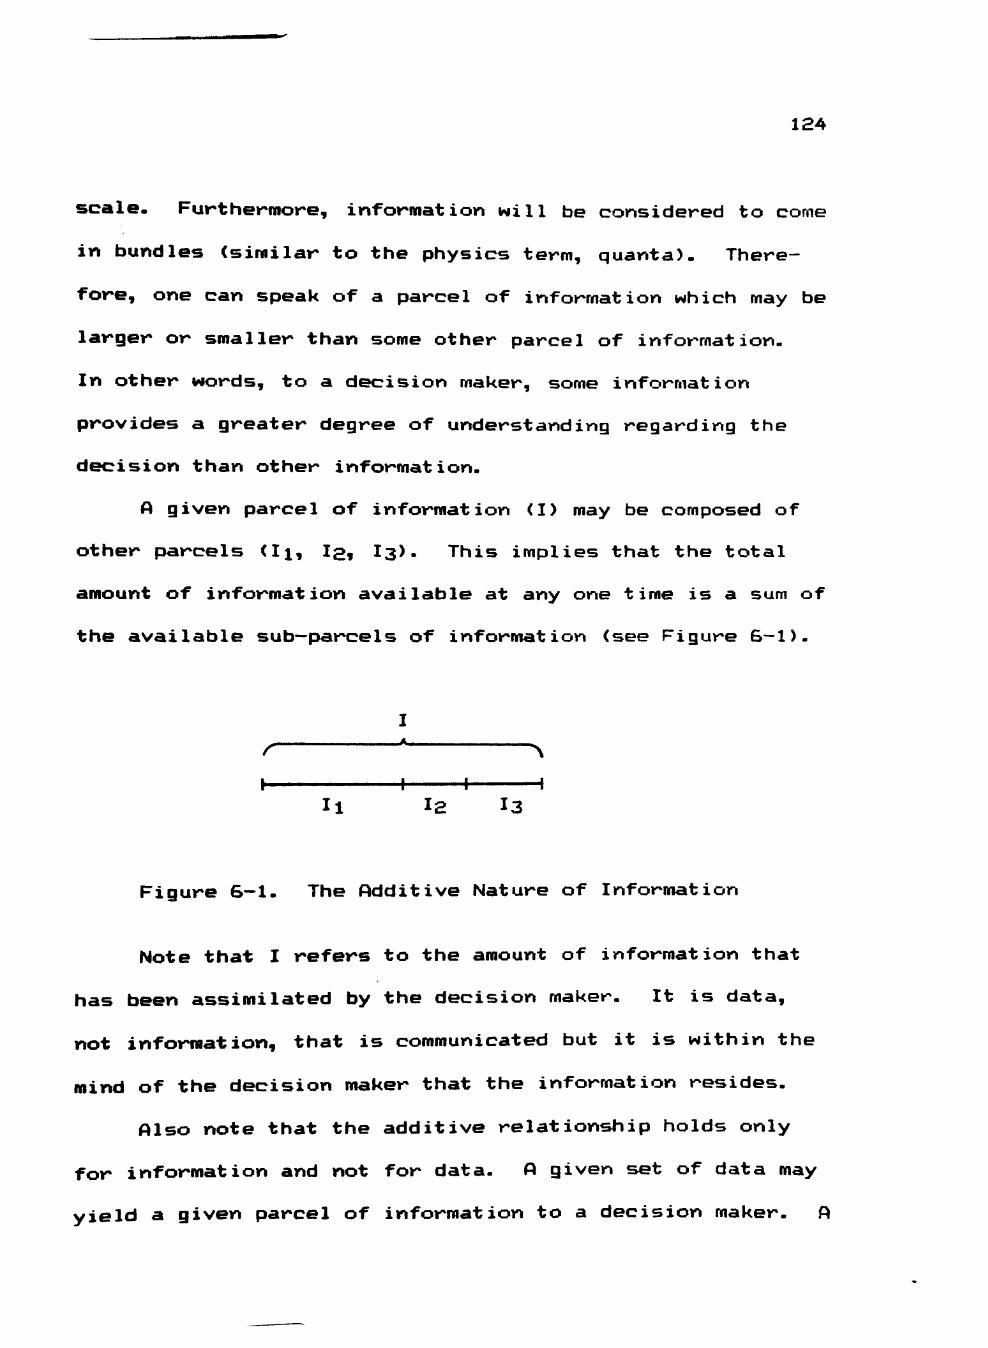
124
scale. Furthermore, information will be considered to come
in bundles (similar to the physics term, quanta). There
fore, one can speak of a parcel of information which may be
larger or smaller than some other parcel of information-
In other words, to a decision maker, some information
provides a greater degree of understanding regarding the
decision than other information-
A given parcel of information (I) may be composed of
other parcels (Ii, la, I3)- This implies that the total
amount of information available at any one time is a sum of
the available sub—parcels of information (see Figure 6—1).
I / • >
I 1 1 1 II I2 I3
Figure 6—1. The ftdditive Nature of Information
Note that I refers to the amount of information that
has been assimilated by the decision maker- It is data,
not information, that is communicated but it is within the
mind of the decision maker that the information resides-
Also note that the additive relationship holds only
for information and not for data. A given set of data may
yield a given parcel of information to a decision maker- i
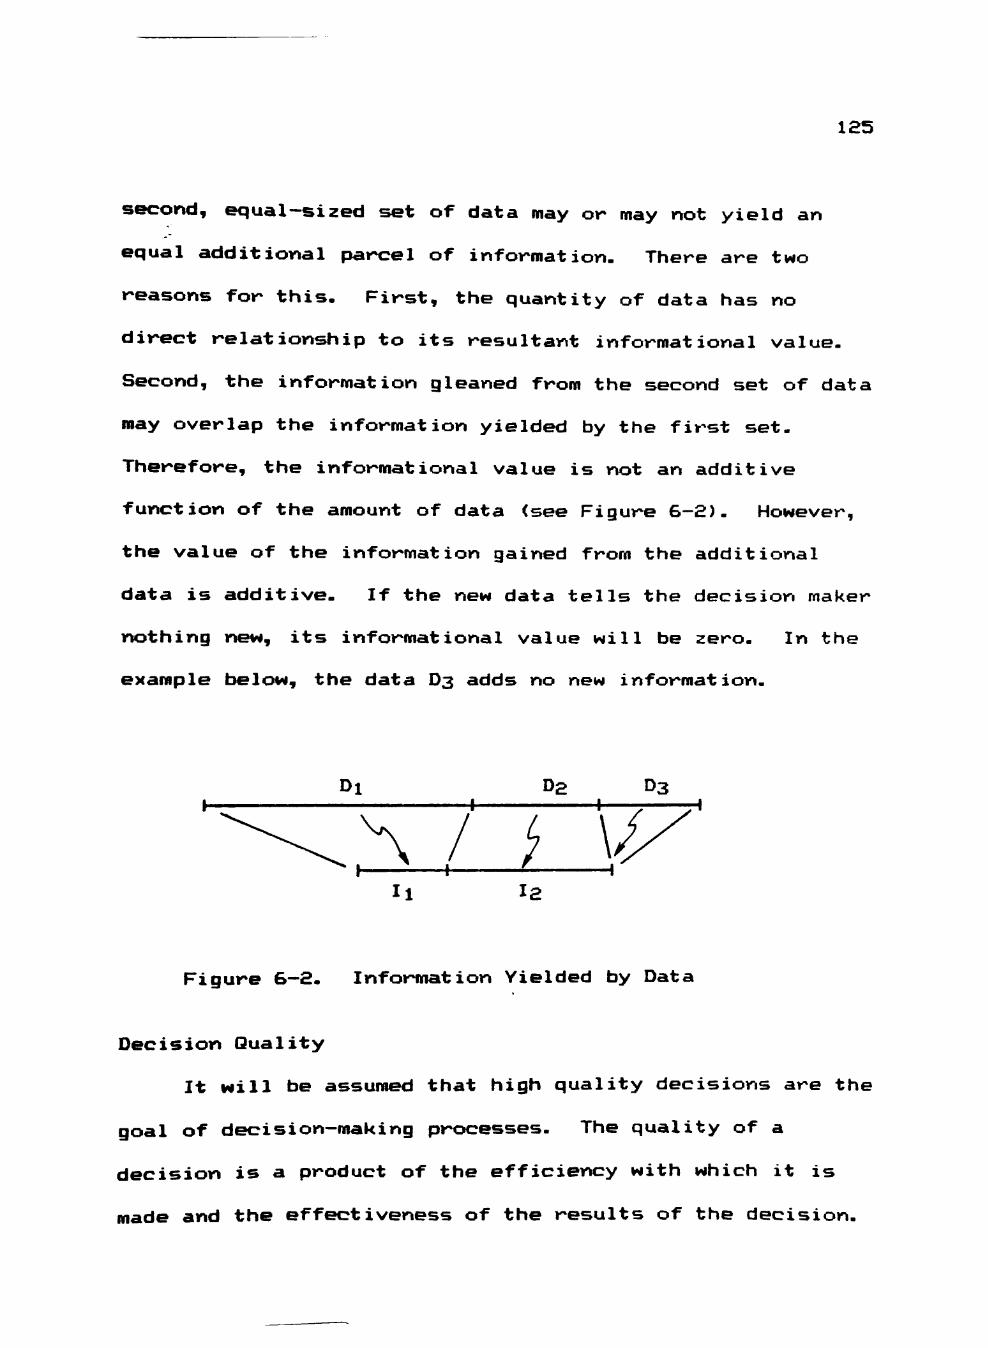
125
second, equal-sized set of data may or may not yield an
equal additional parcel of information. There are two
reasons for this. First, the quantity of data has no
direct relationship to its resultant informational value.
Second, the information gleaned from the second set of data
may overlap the information yielded by the first set.
Therefore, the informational value is not an additive
function of the amount of data (see Figure 6-2). However,
the value of the information gained from the additional
data is additive. If the new data tells the decision maker
nothing new, its informational value will be zero. In the
example below, the data D3 adds no new information.
Di D2 D3 1 5 H
>
I2
Figure 6-2. Information Yielded by Data
Decision Quality
It will be assumed that high quality decisions are the
goal of decision—making processes. The quality of a
decision is a product of the efficiency with which it is
made and the effectiveness of the results of the decision.
126
Efficiency is a measure of the productivity of the
decision-making process. It is a measure of performance:
the value of an output divided by the value of the
resources expended to achieve that output. Effectiveness
refers to how well the decision—making process achieves
organizational goals. Achieving one does not necessarily
mean the other will be attained. One may act very
efficiently but fail to achieve goals (unless efficiency
is a goal). Conversely, one may be effective at achieving
goals but not achieve them efficiently.
Although there are many issues that can be raised
concerning the efficiency and the effectiveness of the
decision—making process, they are not in the mainstream of
this research. It will be assumed, for the development of
the model, that the decision maker knows what the goals of
making the decision are and that they are relevant, and
appropriate. Furthermore, it will be assumed that one of
the primary determinants of decision quality is the amount
of correct and relevant information available to the
decision maker.
Irain- ^^ Information System Goal
The position taken for this research is that decision
making requires appropriate information; information that
is relevant to the decision at hand. In addition, it is
127
assumed that there is a necessary and sufficient set of
relevant information which, when supplied to the decision
maker, will enable the best possible decision in a given
situation. This ideal set, termed the "minimum necessary
subset of data" CBenbaset and Schroeder, 19773, holds for a
given decision maker, for a given decision, and for a given
point in time. This theoretical subset of all information
^ rain i" y be unknown to the decision maker and,
furthermore, may be unknowable. Nonetheless, it is a
useful theoretical construct which acts as a goal for the
i nformat i on syst em.
As indicated by Ackoff C19673, an effective informa
tion system provides not only relevant information but also
acts as a filter to irrelevant information. Given that an
ideal system is able to adequately filter out information
that is not useful for a given decision, it follows that
the quality of a decision will increase as the Irnin is
approached, at which point a perfect decision can be made
(see Figure 6-3)- Any information beyond Imin is not
relevant to the given decision and would be filtered out by
the system. This constraint is relaxed in the next
chapter.
For this analysis, the quantity of information applied
to a decision has been conceived of as a measurable,
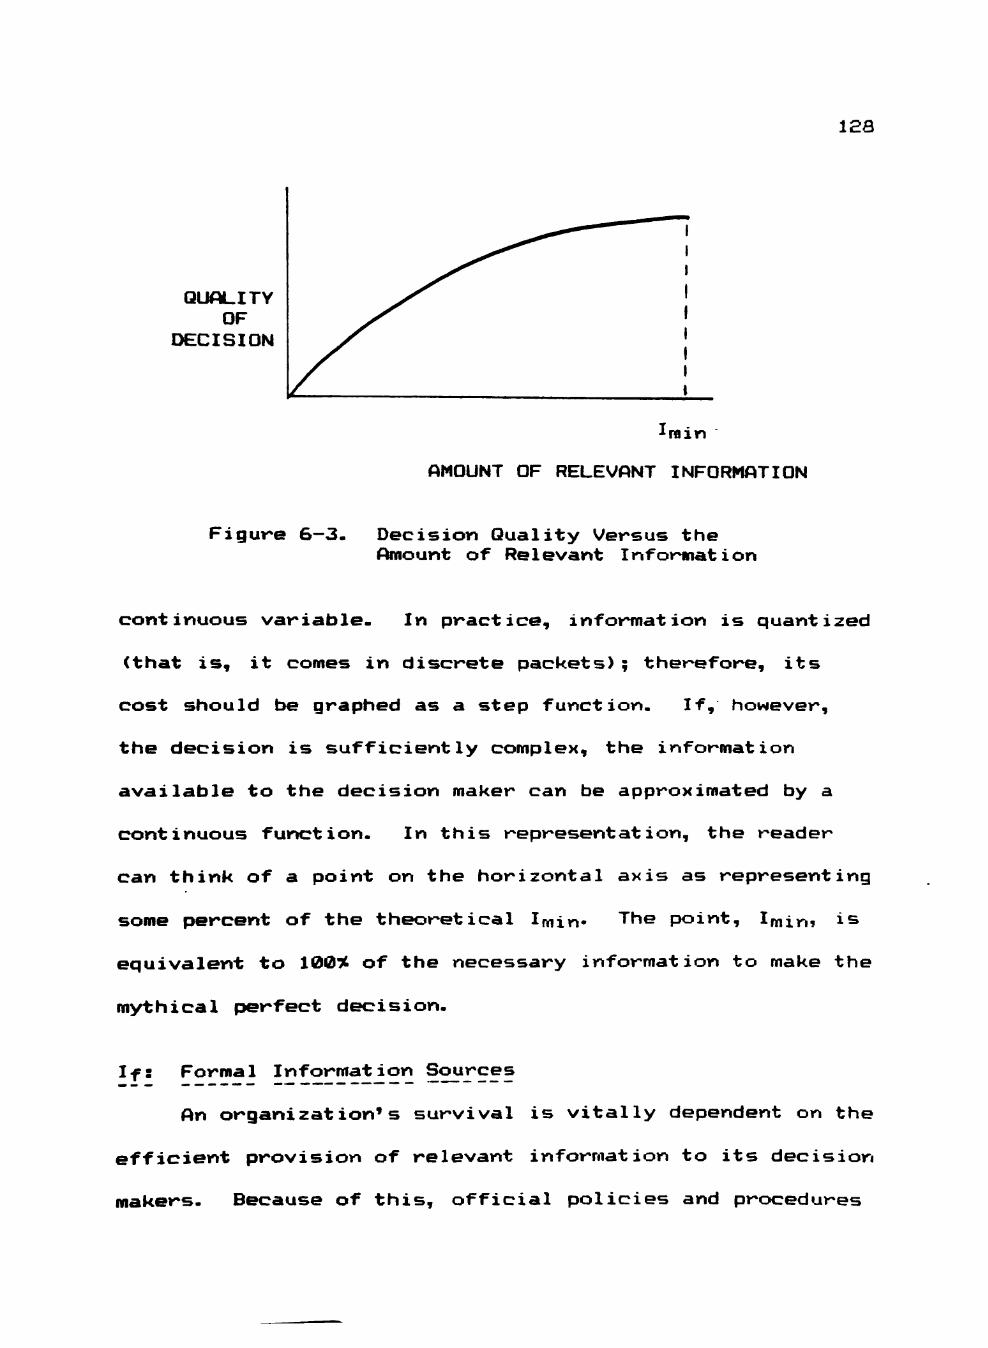
128
QUALITY OF
DECISION
•ram
AMOUNT OF RELEVANT INFORMATION
Figure 6-3. Decision Quality Versus the Amount of Relevant Information
continuous variable. In practice, information is quantized
(that is, it comes in discrete packets); therefore, its
cost should be graphed as a step function. If, however,
the decision is sufficiently complex, the information
available to the decision maker can be approximated by a
continuous function. In this representation, the reader
can think of a point on the horizontal axis as representing
some percent of the theoretical Imin- "''he point, Imim is
equivalent to 100^ of the necessary information to make the
mythical perfect decision.
If: Formal Information Sources
An organization's survival is vitally dependent on the
efficient provision of relevant information to its decision
makers. Because of this, official policies and procedures
129
for obtaining, storing, and disseminating information need
to be established. When an information system is designed
for an organization, the information analysis activity
within the systems analysis and design process looks at the
decisions made and the data needed to make them. The
resulting information requirements are then satisfied by
designing a system that formalizes the necessary data
handling processes.
The system is embedded in the organizational structure
and operates through the organization's formal channels of
communication. The idea behind providing information
through a computerized information system is to increase
the efficiency and effectiveness of the decision making
process through improved information capture, storage,
retrieval, and transfer. The symbol If will be used to
represent relevant formal information.
Ii: Informal Information Sources
Regardless of the complexity of a formal information
system, it will not be able to supply all information
requirements. Making good decisions often requires the
decision maker to incorporate information that is not
supplied by the formal information system. The decision
maker may turn to informal sources to obtain this
information- In fact, this is the only alternative (except
130
ignoring the need) since any source not within the formal
system is considered informal by the definition given in
Chapter Five (page 114). The symbol l± will be used to
represent relevant informal information.
The formal system, at best, is only a model of the
decision—making environment. Some elements may be weakly
represented or absent entirely- Unless these elements are
supplied through informal sources, the quality of a
decision based on the model will be affected- Because
informal information provides a report on conditions not
specifically handled within the formalized system, it
provides a means of opening an otherwise closed or
partially closed system. Meeting the information
requirements (discussed in the sections below) through the
use of informal sources will help keep the system open and
responsive to environmental change and improve the
organization's ability to make decisions that help achieve
goals.
Unmet Information Requirements
Decisions may arise which the system has not been set
up to handle. Reasons for these situations include the
inability of the system designer to foresee all information
requirements, insufficient system capacity, and the lack of
a capability to adequately represent all forms of
131
information. Unforeseen information requirements may arise
from the need to make an unplanned decision or to make a
planned decision in a different way (the context of the
decision may change or the set of potential solutions may
change). System capacities are not infinite. Although
some information requirements may be known, they may be
infeasible to cope with formally. The system may not be
capable of representing all types of useful information-
For example, a customer's mood may be extremely hard to
quantify and represent internally as data.
Problem Recognition
The recognition of the need to make a decision is
highly dependent on informal sources- Lyles and Mitroff
LISBQH investigated how managers became aware of problems-
About 80 percent of the managers said they were aware of a problem before formal indicators, such as financial figures, showed that it existed and before a superior or a subordinate presented the problem to them. Cp. 10S1.
In addition to the reasons given above for unmet
information requirements, part of this is due to system
response delay, the time it takes the system to capture,
process, and present data. It is also due, in part, to
system threshold, the minimum level of change in an
indicator necessary to detect a problem.
132
Coordination
Mintzberg C19793 lists five coordinating mechanisms
used by organizations- In the simplest of organizations
and as a part of the most complex, the mechanism of mutual
adjustment is used- It is based on the process of informal
communication. In this form of coordination, there is no
formal structure for control and no formal information
system. It is possible for simple organizations using this
croordinating mechanism to use I00 percent informal
information- As the complexity of the organization
increases, more and more formal coordination is required.
This results in a need for more formal organizational
structures and communication. Nonetheless, increased
complexity does not obviate the need for informal
structures and communication. Mintzberg C19793 states:
Most work just cannot get done without some informal communication. Life is simply too complicated to regulate everything. Standardization must be supplemented with mutual adjustment, even if only to deal with unexpected change Cp. 493.
Serend ipitous In format ion
Sometimes the decision maker becomes aware of some
opportunity or solution through nonsystemic sources.
Because the nature of such fortuitous information is
totally unknown ahead of time, formalizing a mechanism for
capturing and processing it is an impossibility (at least
133
until drastic improvements in artificial intelligence are
achieved).
Second Opinions
Consider the case where a given information require
ment is already supplied through the formal system. Can
the informal system still be of value in this situation?
Yes. From the decision maker's perspective, the informal
information can give additional input against which to
judge the validity of the output of the formal system.
The "answers" the formal system yield can be put into the
context of a larger world. If the outside information
source confirms the results provided by the formal system,
the decision maker can operate with increased confidence.
If the outside source contradicts the system—generated
results, a warning is raised upon which the decision maker
can act.
Ip: The Amount of Inf ormat ion 5*^311 able
For any given situation, a decision maker has poten
tially available through the formal and the informal
communication channels a given amount of information d p ) .
This amount is a function of and thereby limited by the
physical and temporal constraints inherent in the config
uration of the given information system- Such constraints
include the quantity of information possessed by the
134
sources, the effectiveness and efficiency of the
communication channels, the amount of time that can be
spent gathering information, etc.
The amount of information that is available will
change as the configuration of the information system
changes. The primary reason that improved syst era designs
are created is to increase the amount of Ip. The
assumption is that by increasing the amount of relevant If
and/or Ii obtainable by the decision maker, a value of Ip
can be provided that is closer to the goal of Imin-
The Basic Formal/Informal Information Model
The concepts and definitions developed in the
preceding section will now be incorporated into a model
that is based on the framework presented in Chapter Five.
Since the framework divides all communication into two
categories, formal (F) and informal (I), the model will be
presented as a set of Cartesian coordinates with the
horizontal axis representing the amount of information
obtained through informal (nonsystematized) sources and the
vertical axis representing information obtained through
formal (systematized) sources (see Figure 6-4).
The diagram indicates that all of the relevant
information necessary to make a "perfect" decision can
theoretically be communicated through formal channels, be
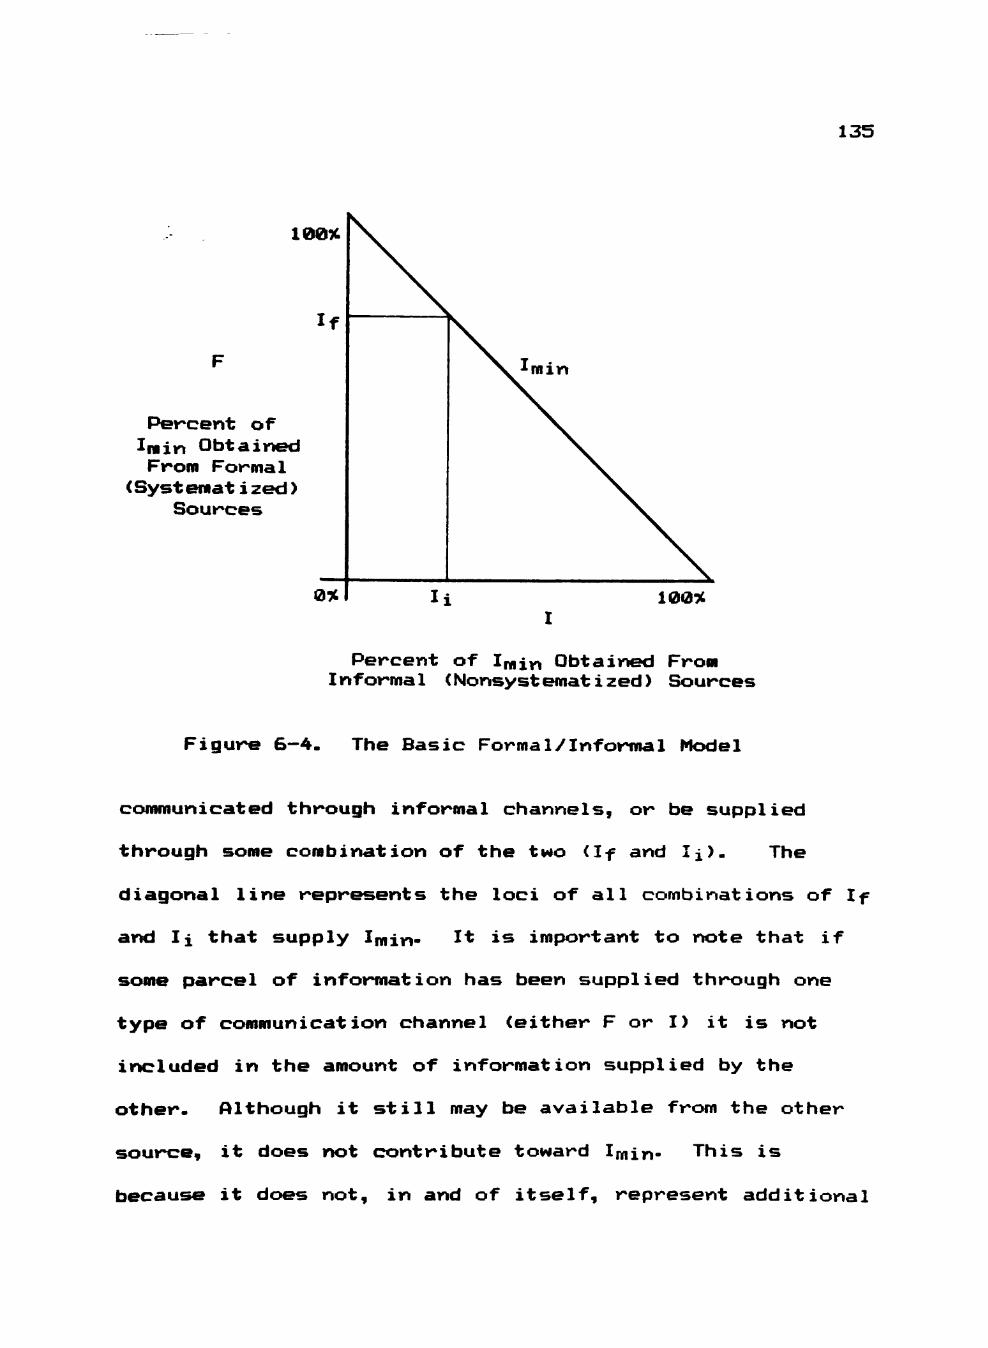
135
10d%
Percent of Imin Obtained From Formal
(Systemat i zed) Sources
min
1007^
Percent of Iniin Obtained From Informa1 (Nonsyst emat i zed) Sources
Figure 6-4. The Basic Formal/Informal Model
communicated through informal channels, or be supplied
through some combination of the two (If and Ii). The
diagonal line represents the loci of all combinations of If
and Ii that supply Imin- It is important to note that if
some parcel of information has been supplied through one
type of communication channel (either F or I) it is not
included in the amount of information supplied by the
other. Although it still may be available from the other
source, it does not contribute toward Imin- This is
because it does not, in and of itself, represent additional
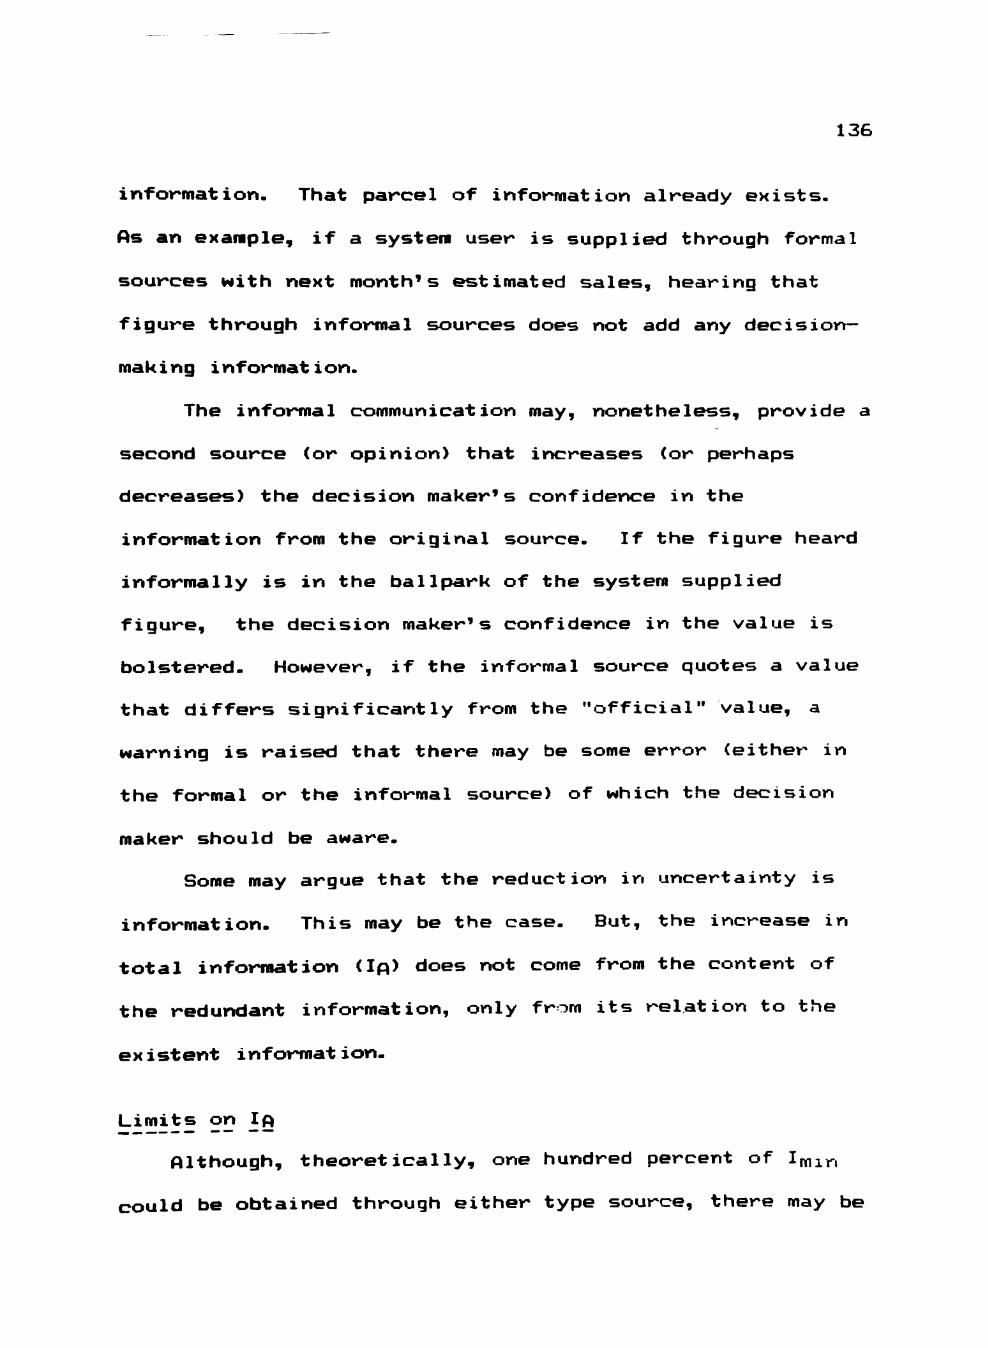
136
information. That parcel of information already exists.
As an example, if a system user is supplied through formal
sources with next month's estimated sales, hearing that
figure through informal sources does not add any decision—
mak i ng i nformat i on.
The informal communication may, nonetheless, provide a
second source (or opinion) that increases (or perhaps
decreases) the decision maker's confidence in the
information from the original source. If the figure heard
informally is in the ballpark of the system supplied
figure, the decision maker's confidence in the value is
bolstered. However, if the informal source quotes a value
that differs significantly from the "official" value, a
warning is raised that there may be some error (either in
the formal or the informal source) of which the decision
maker should be aware.
Some may argue that the reduction in uncertainty is
information. This may be the case. But, the increase in
total information (Ip^ does not come from the content of
the redundant information, only from its relation to the
existent information-
Limits on I ft
Although, theoretically, one hundred percent of Imm
could be obtained through either type source, there may be
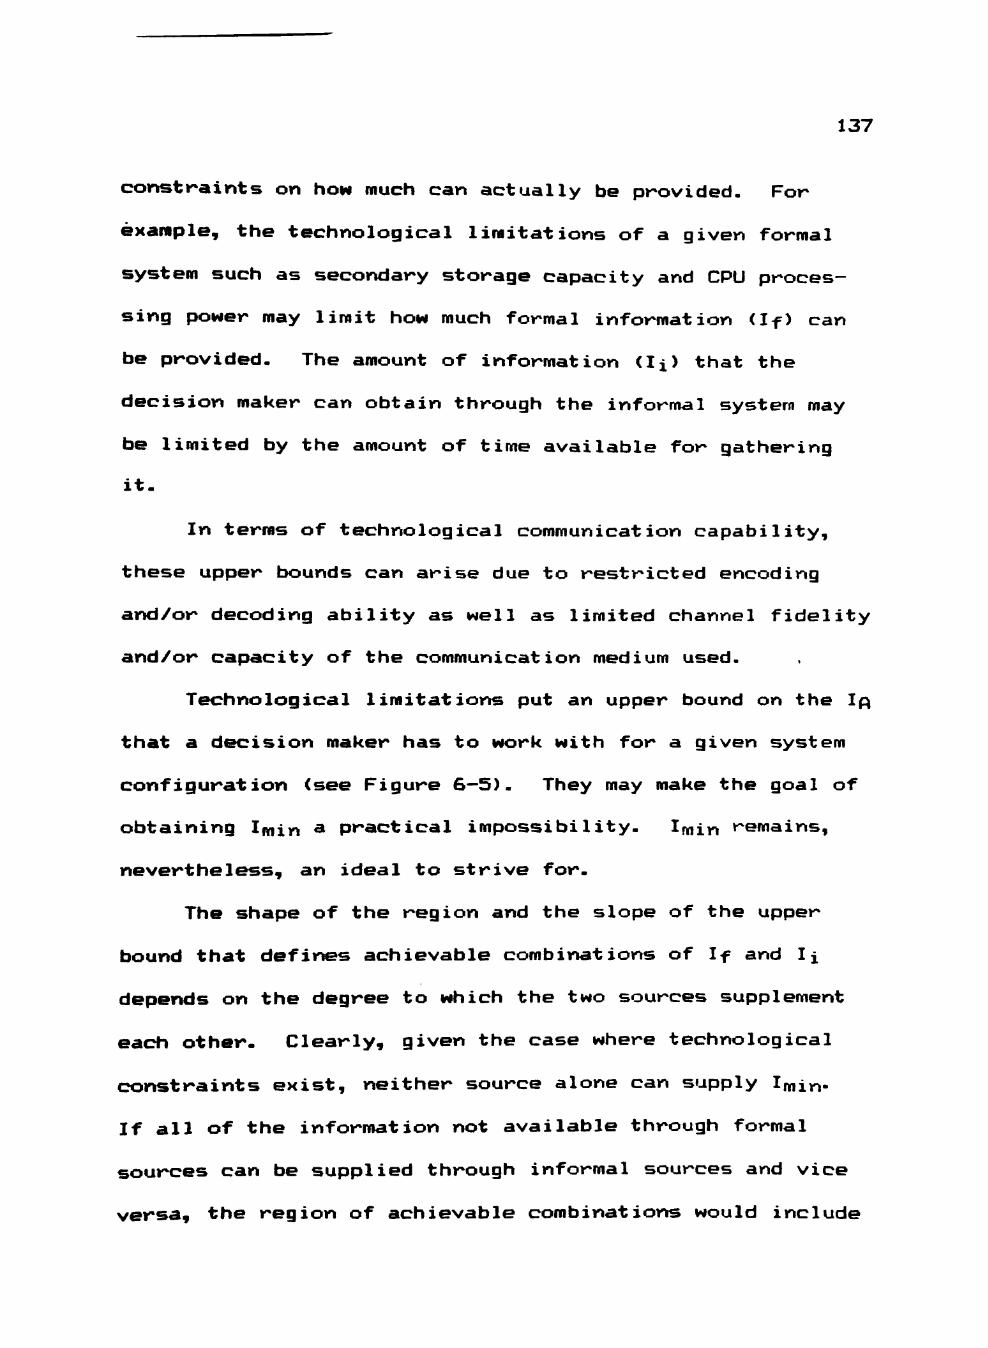
137
constraints on how much can actually be provided. For
example, the technological limitations of a given formal
system such as secondary storage capacity and CPU proces
sing power may limit how much formal information (If) can
be provided. The amount of information (Ii) that the
decision maker can obtain through the informal system may
be limited by the amount of time available for gathering
it-
In terras of technological communication capability,
these upper bounds can arise due to restricted encoding
and/or decoding ability as well as limited channel fidelity
and/or capacity of the communication medium used.
Technological limitations put an upper bound on the Ip
that a decision maker has to work with for a given system
configuration (see Figure 6—5). They may make the goal of
obtaining Imin a practical impossibility. Imin remains,
nevertheless, an ideal to strive for.
The shape of the region and the slope of the upper
bound that defir^s achievable combinations of If and Ii
depends on the degree to which the two sources supplement
each other- Clearly, given the case where technological
constraints exist, neither source alone can supply Imin-
If all of the information not available through formal
sources can be supplied through informal sources and vice
versa, the region of achievable combinations would include
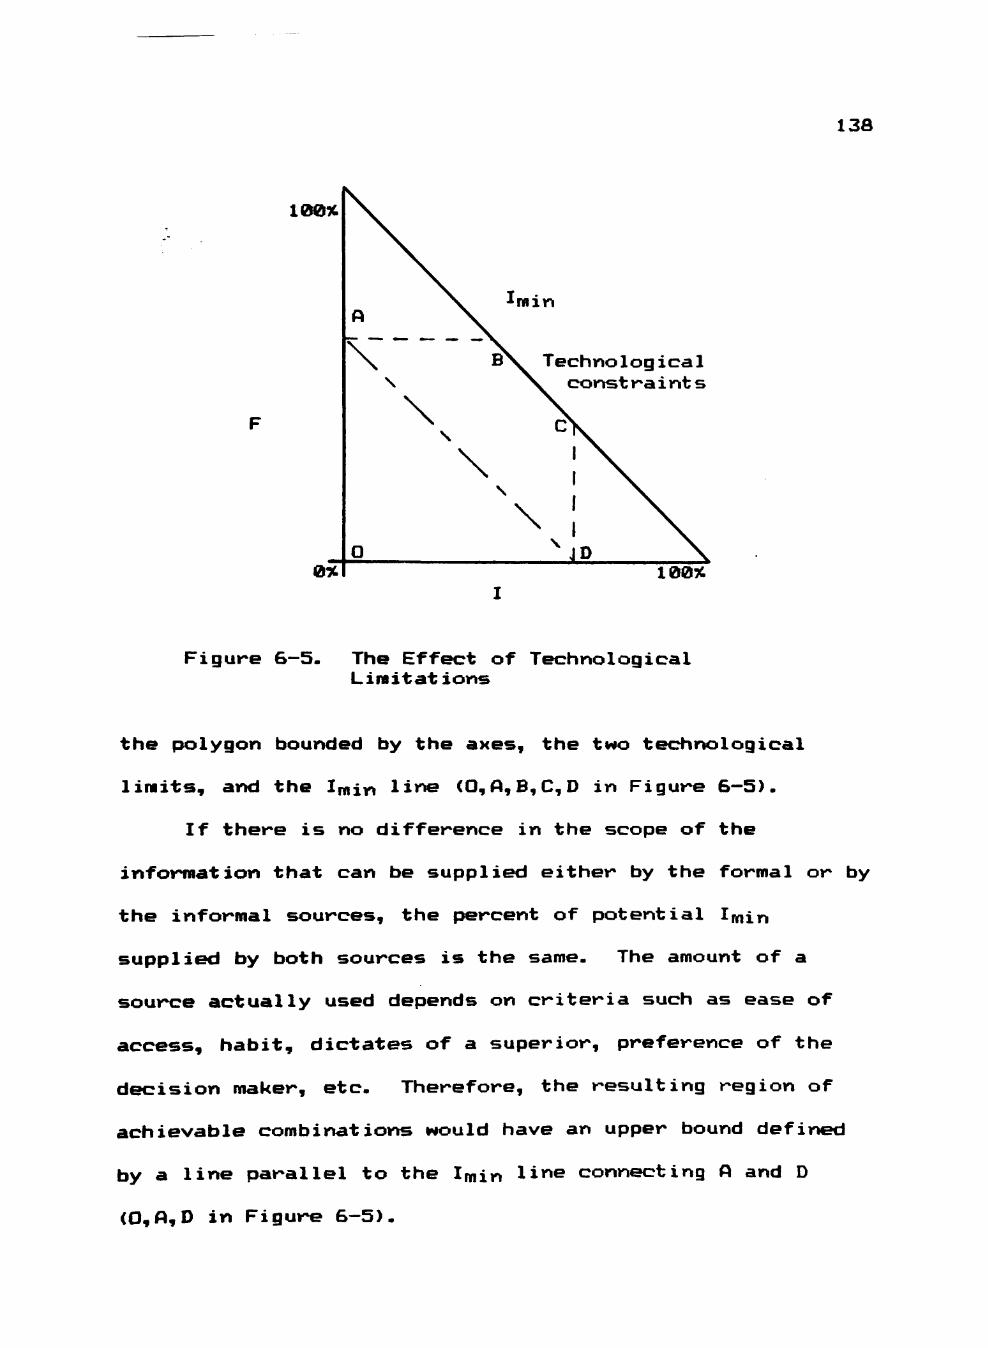
138
100%
ram
0%
B N ^ Technological const r a i nt s
100%
Figure 6—5- The Effect of Technological Limitations
the polygon bounded by the axes, the two technological
limits, and the Imin lir e (O, A, B,C, D in Figure 6—5).
If there is no difference in the scope of the
information that can be supplied either by the formal or by
the informal sources, the percent of potential Imin
supplied by both sources is the same- The amount of a
source actually used depends on criteria such as ease of
access, habit, dictates of a superior, preference of the
decision maker, etc. Therefore, the resulting region of
achievable combinations would have an upper bound defined
by a line parallel to the Imin line connecting A and D
(O,A,D in Figure 6-5).
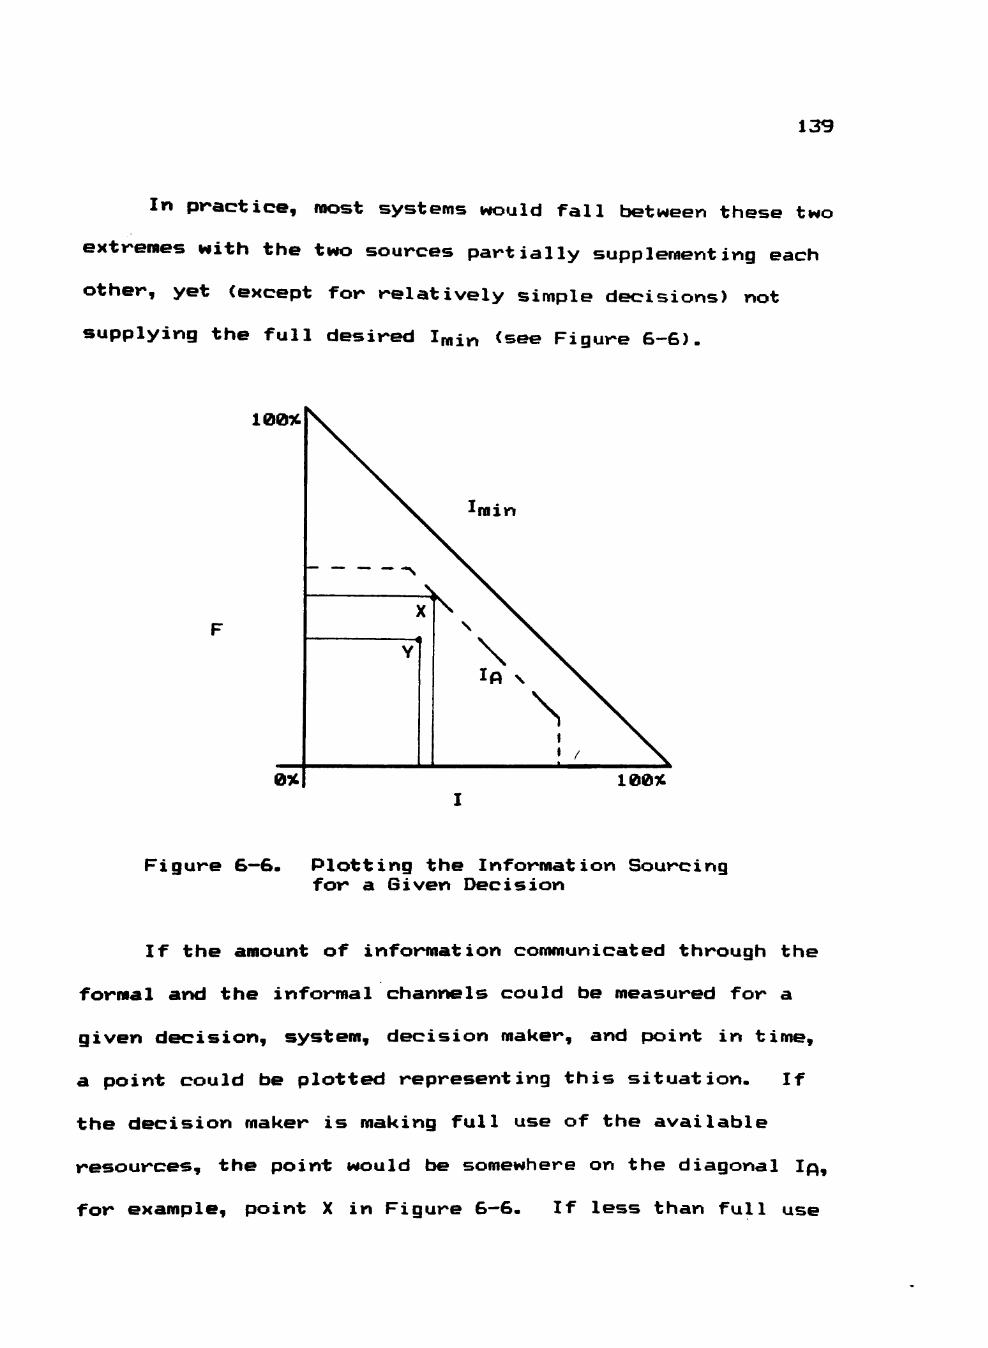
139
In practice, most systems would fall between these two
extremes with the two sources partially supplementing each
other, yet (except for relatively simple decisions) not
supplying the full desired Imin <see Figure 6-6)-
100%
0%
^
X
Y
I m i n
\ \
1 \ ! f \
100%
Figure 6—6. Plotting the Information Sourcing for a Given Decision
If the amount of information communicated through the
formal and the informal channels could be measured for a
given decision, system, decision maker, and point in time,
a point could be plotted representing this situation. If
the decision maker is making full use of the available
resources, the point would be somewhere on the diagonal Ip,
for example, point X in Figure 6—6- If less than full use
140
is made, the point will plot somewhere within the interior
of the feasible region (for example, point Y in Figure
6-6).
Assuming the decision maker follcM^s the rational man
approach to decision making, the point chosen will be the
one that maximizes the effectiveness of the decision given
the efficiency of the existing system. The cost/benefit
issues of this assumption are the topic of Chapter Seven.
For the rest of this chapter, it will be assumed that the
decision maker makes full use of the resources available
and, therefore, will operate on the outer edge of the
polygon defining the feasible region.
Recap
This model provides a means of analyzing the
information environment used by a decision maker when
making decisions- It breaks down the information used
by the decision maker, based on the percent of the "ideal"
amount of information provided by one of two classes of
communication. It allows the modeling of an organization's
information system so that changes in the structure of the
system can be visualized and the result judged in terms of
how well the resulting change assists the decision maker in
approaching the goal of Imin-
141
The next section will use the model to analyze the
&ff&ct^ that the introduction of CAC technology will have
on the amount of information that is available through the
organizational communication channels and, thus, on the
quality of the decision that is made.
Ibe Effects of Emeioymg CAC
A decision maker's access to the organizational
information system, as described in the model above, is
provided through both formal and informal communication
channels. The communication channels used to obtain
information are subject to change. The change may be
unplanned from the organizational point of view. As an
example, a change in informal contacts might occur when a
decision maker discovers that some other pierson has
knowledge about a problem at hand- There may not exist any
preplanned communication channels with this person, yet the
decision maker will establish communication to obtain the
necessary information- Conversely, the change may be
planned. A prime example would be the installation of a
new MIS. Such a system follows (or at least should follow)
a system analysis and design that results in a planned
change to the information flow (communication channels)
within the organization.
Typically, a new MIS would be designed to take
142
advantage of available technological advances- Some of the
recent advances have been in CAC technology- Hence, it is
reasonable to expect that CAC technology is responsible for
motivating some of the changes that are occurring in
organizational information systems. It is assumed that any
planned change to the system will be made to improve
efficiency and/or effectiveness. Therefore, it is
important that the systemic ramifications of such a change
be investigated- The model described in the previous
s€»ction can be used to analyze these effects-
The primary effect of increasing the amount of CAC
that can be used by the decision maker will be either to
make more information available through new formal channels
or to improve access to the information that is already
available through existent formal channels- Several
secrondary effects are possible when a new or improved
system is installed. When present, these effects arise
from a concomitant increase or decrease in the amount of
informal (Ii) information that is available to the decision
maker. The net effects of these possible system changes on
the total amount of decision-making information available
are presented in the sections below.
It is necessary to interject, at this point, an
acknowledgement of the behavioral effects of an extreme
reduction in interpersonal communication- Total isolation
143
of an individual is undesirable from a social interaction
viewpoint. For this study, it is assumed that the degree
of formalization of the system is not so high that the
decision maker's social contacts will be excessively
eliminated. Therefore, the class of behavioral effects
attributable to social isolation will not be considered.
For the following discussion, the person(s) designing
the system will be given the benefit of the doubt by
assuming that the new system actually improves the
efficiency and/or effectiveness of the formal communication
it supports. If it does not, the system needs more help
than this model can provide.
Diagramming the Effects of CAC
If Is Unchanged, Ii Increases
Improving the information system by employing CAC
technology does not necessarily mean that more formal
information will be provided. The system may be designed
to provide the same formal information that was previously
available, only provide it more efficiently. A situation
such as this may still provide an overall increase in the
total amount of information available to the decision
maker- By reducing the amount of time required to obtain
the formal information, more time is made available for
seeking information from informal sources- This, in
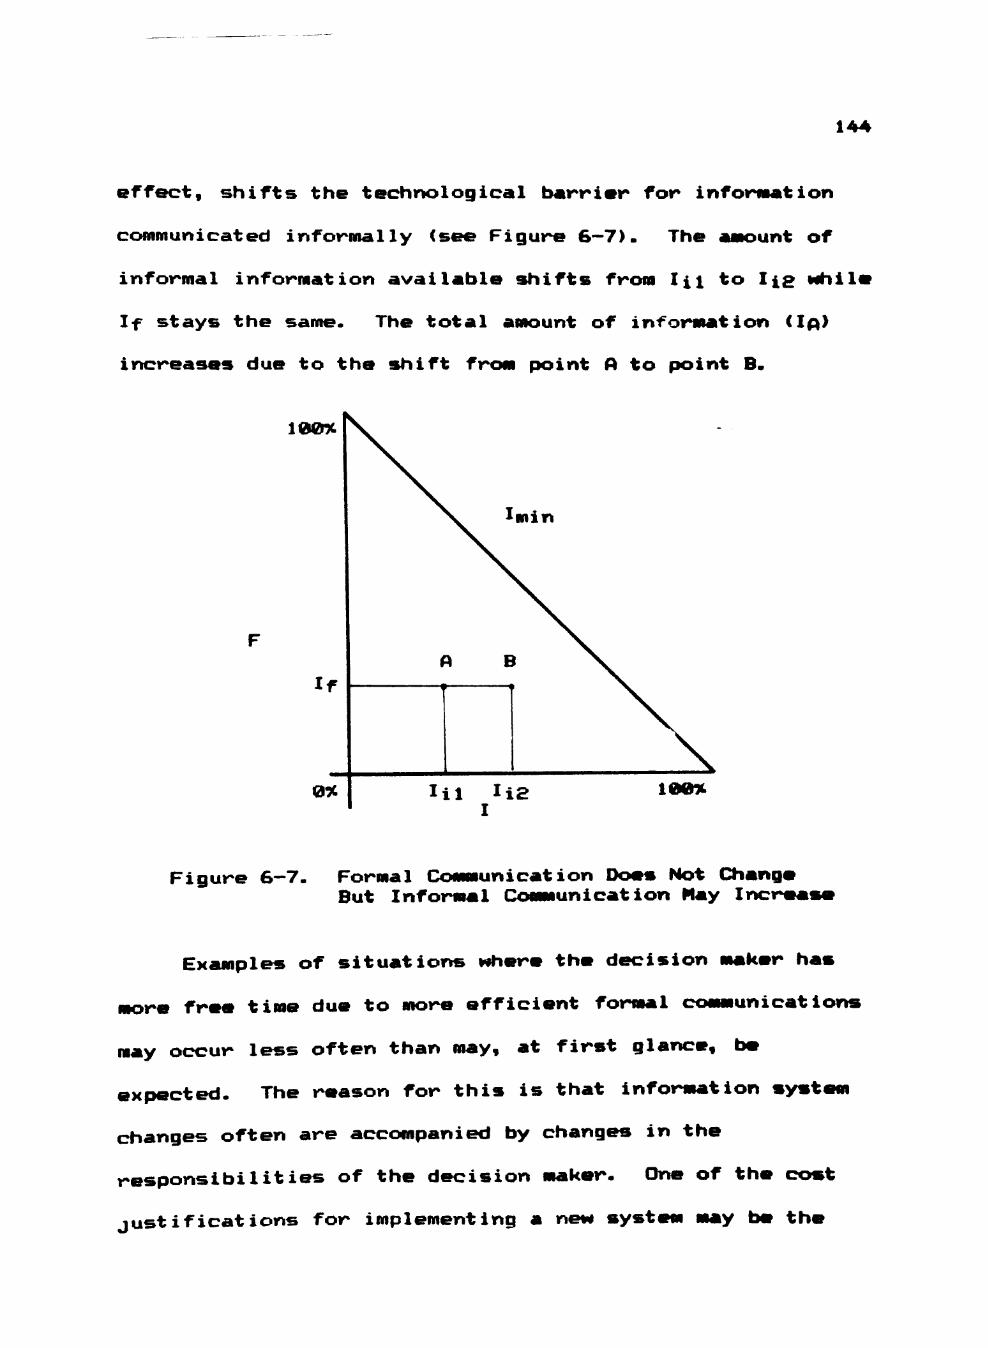
144
effect, shifts the technological barrier for information
communicated informally (see Figure 6-7). The unt of
informal information available shifts from I n to Its whili
If stays the same. The total amount of information ilfk}
increases due to the shift from point A to point B.
100%
100%
Figure 6-7. Formal Communication Does Not Change But Informal Communication Hay Increase
Examples of situations where the decision maker has
free time due to more efficient formal unicat ions
system
may occur less often than may, at first glance, be
expected. The reason for this is that information
changes often are accompanied by changes in the
responsibilities of the decision maker. One of th<
justifications for implementing a new system may be the
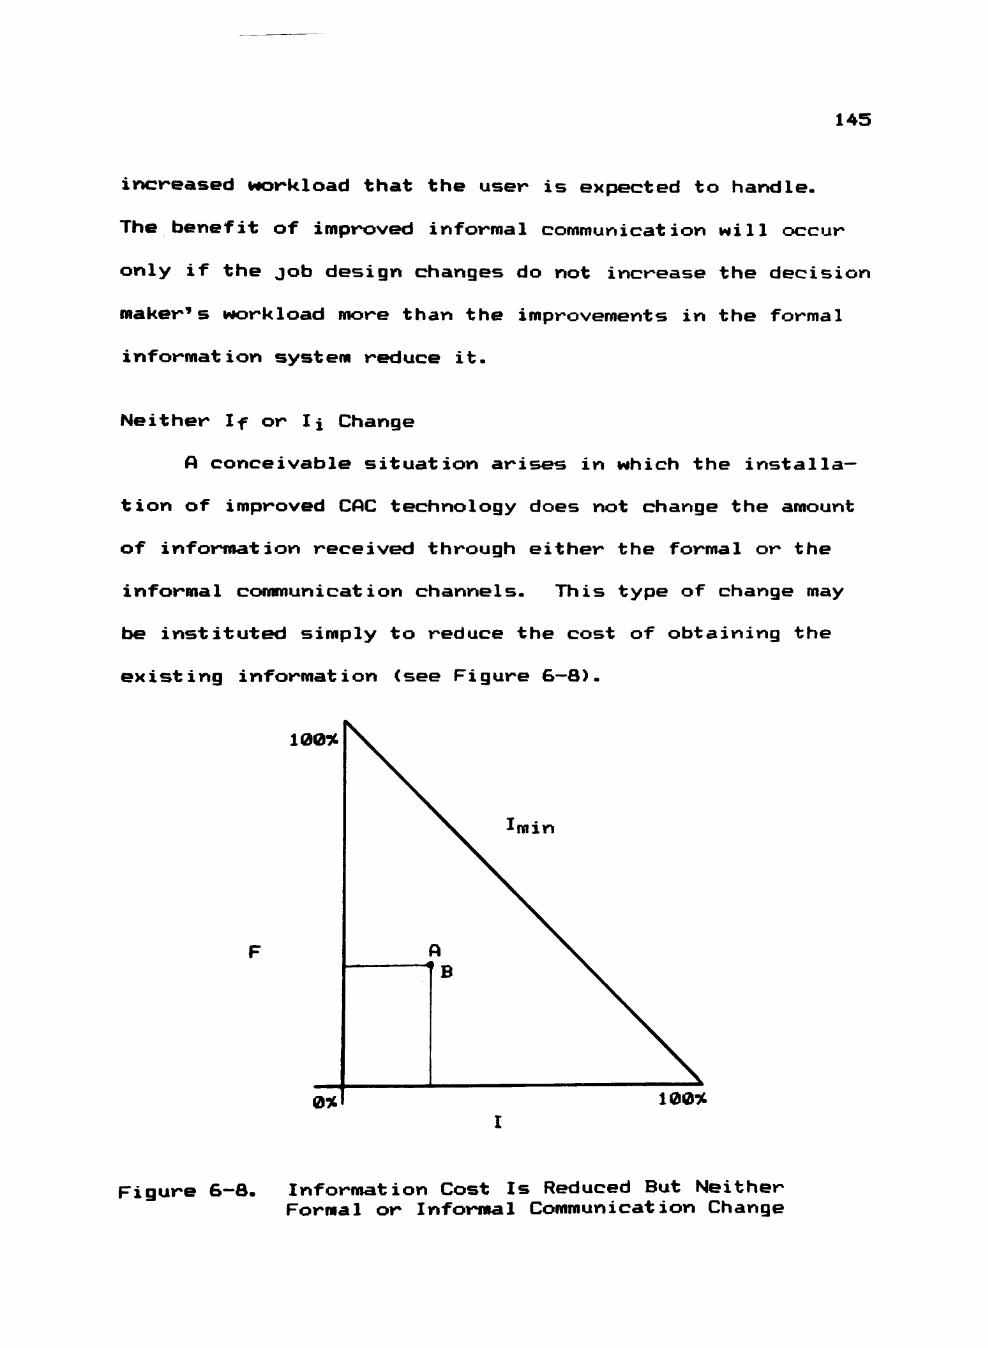
145
increased workload that the user is expected to handle.
The benefit of improved informal communication will occur
only if the job design changes do not increase the decision
maker's workload more than the improvements in the formal
information system reduce it.
Neither If or Ii Change
A conceivable situation arises in which the installa
tion of improved CAC technology does not change the amount
of information received through either the formal or the
informal communication channels. This type of change may
be instituted simply to reduce the cost of obtaining the
existing information (see Figure 6—8).
100%
ram
100%
Figure 6-8. Information Cost Is Reduced But Neither Formal or Informal Communication Change
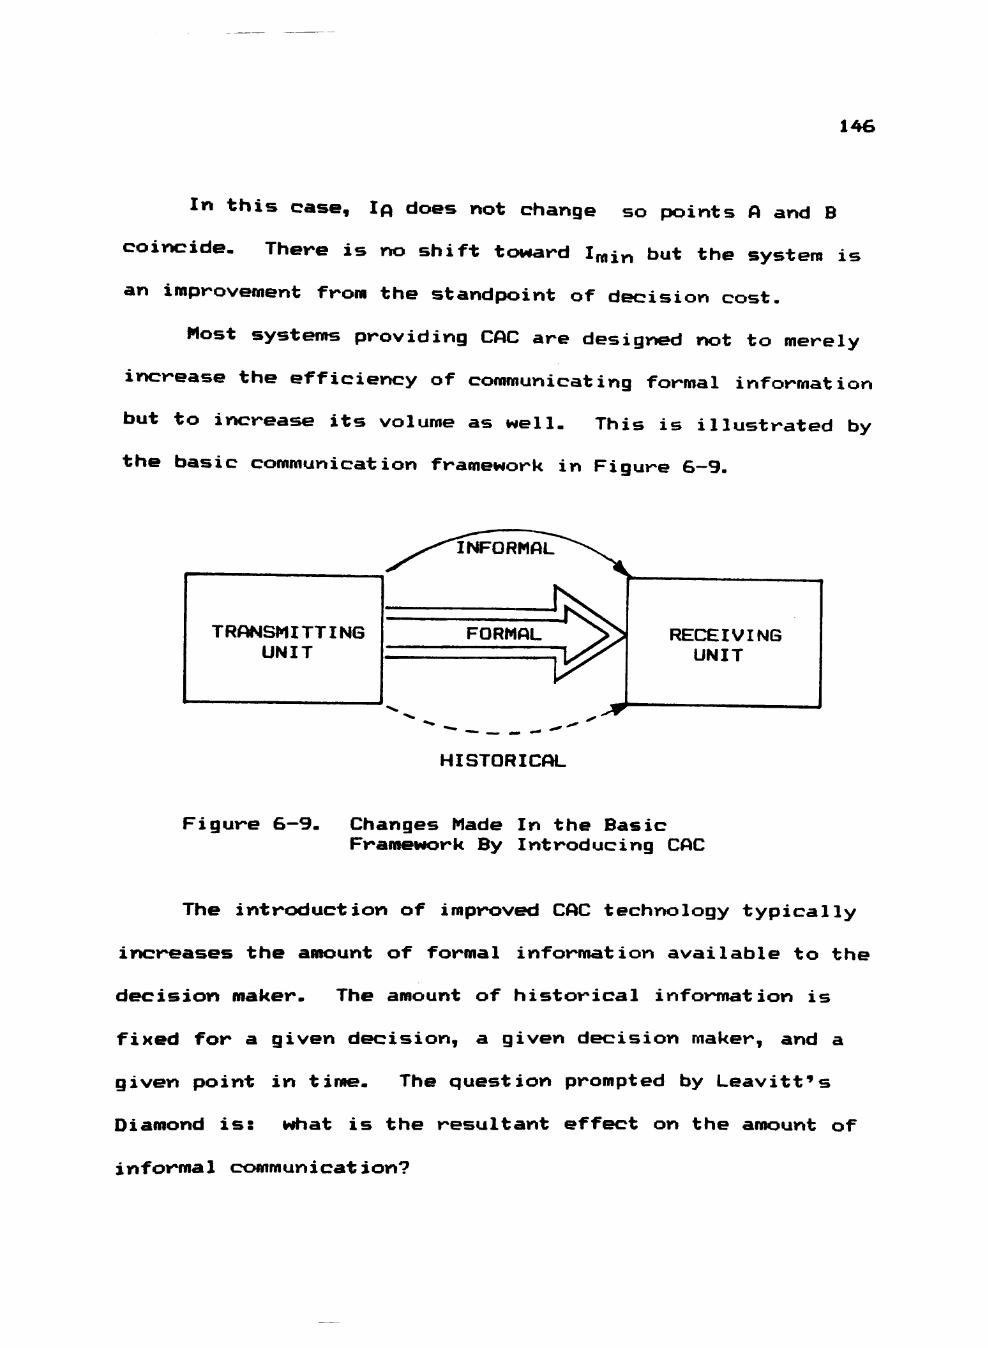
146
In this case, Ip does not change so px>ints A and B
coincide- There is no shift toward I^i^ but the system is
an improvement from the standpoint of decision cost.
Most systems providing CAC are designed not to merely
increase the efficiency of communicating formal information
but to increase its volume as well- This is illustrated by
the basic communication framework in Figure 6-9.
TRANSMITTING UNIT
HISTORICAL
Figure 6-9- Changes Made In the Basic Framework By Introducing CAC
The introduction of improved CAC technology typically
increases the amount of formal information available to the
decision maker. The amount of historical information is
fixed for a given decision, a given decision maker, and a
given point in time- The question prompted by Leavitt^s
Diamond is: what is the resultant effect on the amount of
informal communication?
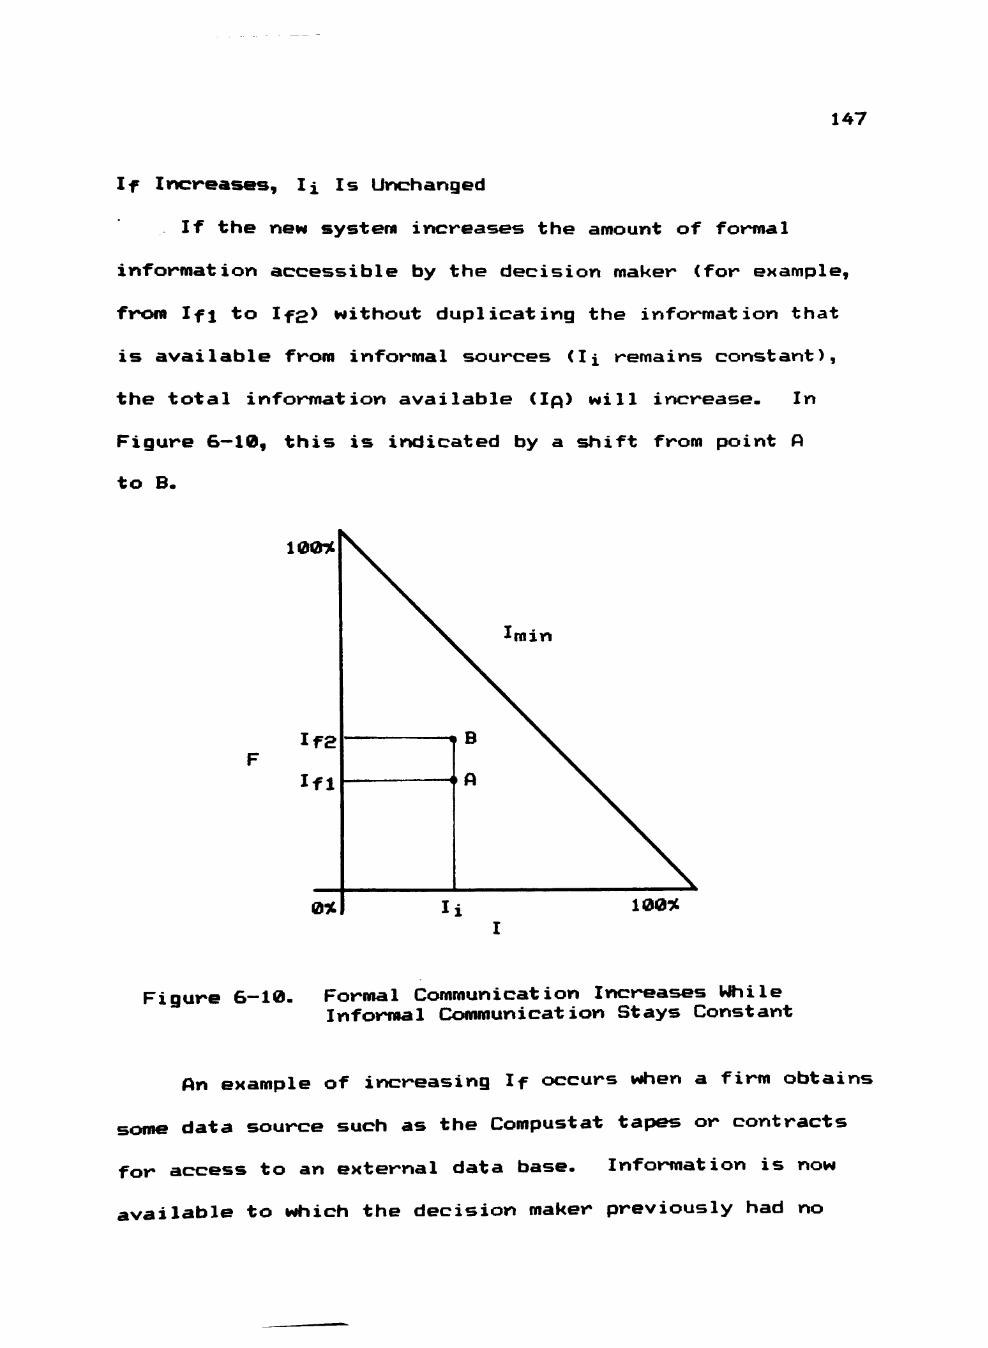
147
If Increases, Ii Is Unchanged
If the new systera increases the amount of formal
information accessible by the decision maker (for example,
from Ifi to If2) without duplicating the information that
is available from informal sources (Ii remains constant),
the total information available (Ip) will increase- In
Figure 6—10, this is indicated by a shift from point A
to B.
100%
If 2
Ifl
ram
100%
Figure 6-10- Formal Communication Increases While Informal Communication Stays Constant
An example of increasing If occurs when a firm obtains
some data source such as the Compustat tapes or contracts
for access to an external data base. Information is now
available to which the decision maker previously had no
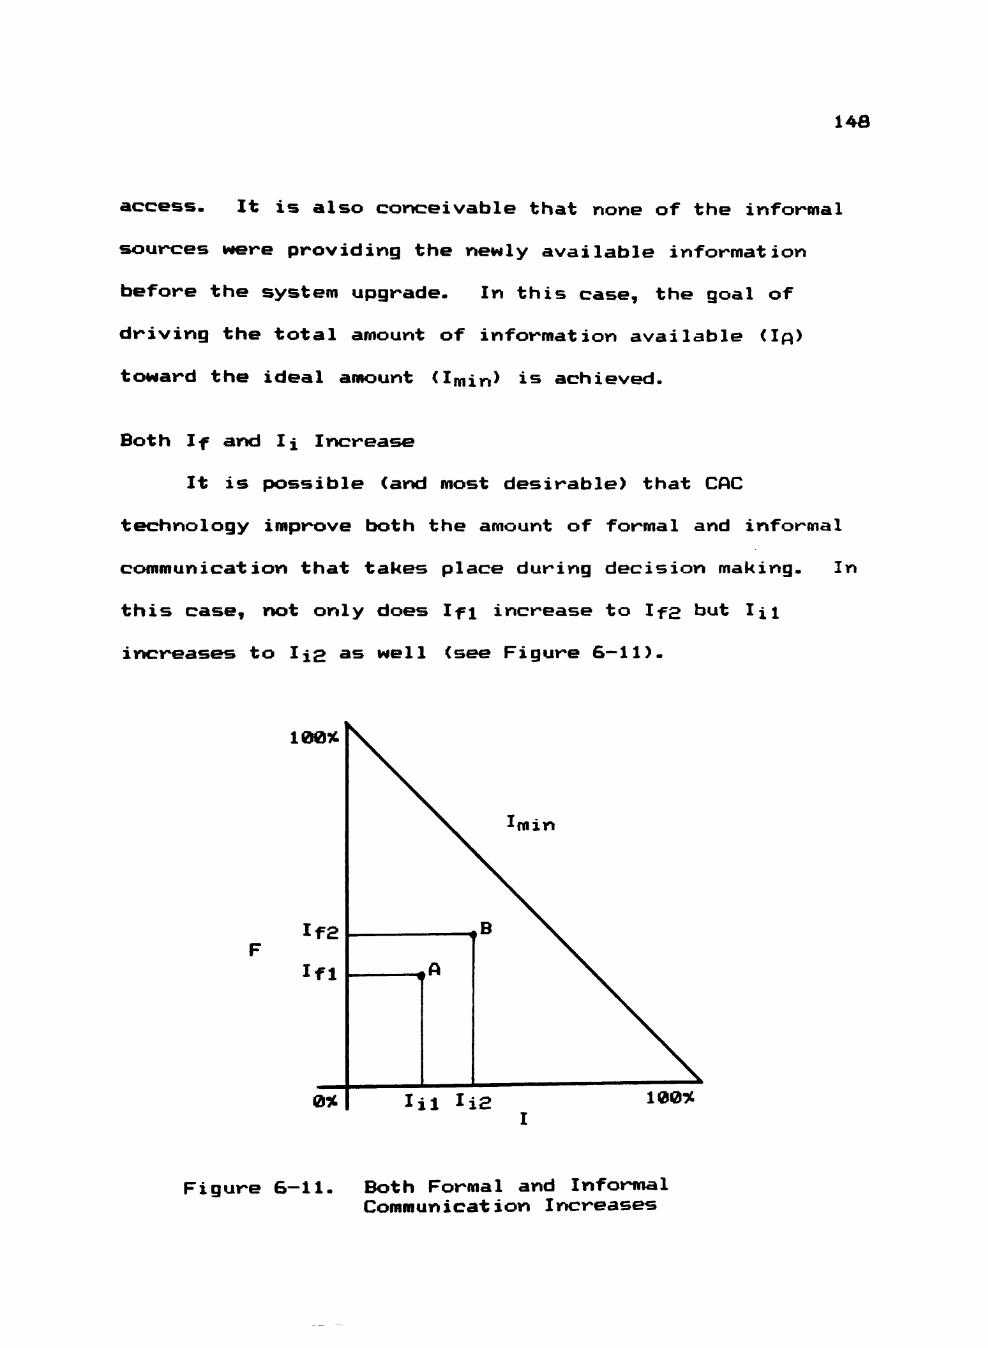
146
access. It is also cronceivable that none of the informal
sources were providing the newly available information
before the system upgrade. In this case, the goal of
driving the total amount of information available (Ip)
toward the ideal amount (Imin> is achieved.
Both If and Ii Increase
It is possible (and most desirable) that CAC
technology improve both the amount of formal and informal
communication that takes place during decision making. In
this case, not only does Ifi increase to If2 but lii
increases to Ii2 as well (see Figure 6-11).
100%
If 2
Ifl
mxn
100%
Figure 5—11. Both Formal and Informal Communication Increases
149
An increase in Ii can result from t««o systemic
effects. First, channels used to supply formal information
may also support informal communication. Second, as stated
above, if the decision maker has to spend less time
gathering a given amount of information from formal
channels, more time may be available to poll informal
sources-
An example of an improvement in both If and 1% would
occur if a comprehensive CAC system were installed which
included features such as electronic mail and chat capa
bilities. A system like this would support both formal and
informal communication and would tend to facilitate the
amount of input the informal sources could supply.
If Increases By Formalizing (Decreasing) Ij, Ip is Constant
Although the system described above would yield the
most preferable results, there is no guarantee that a
comprehensive installation of CAC technology would improve
both If and Ii- The increase in If provided by an improved
system may result from the formal system supplying informa
tion previously only supplicKl through informal communica
tion channels. The informal sources may still exist, but
their contribution to Ip is reduced to the degree that the
information they provided is subsumed by the formal syst(
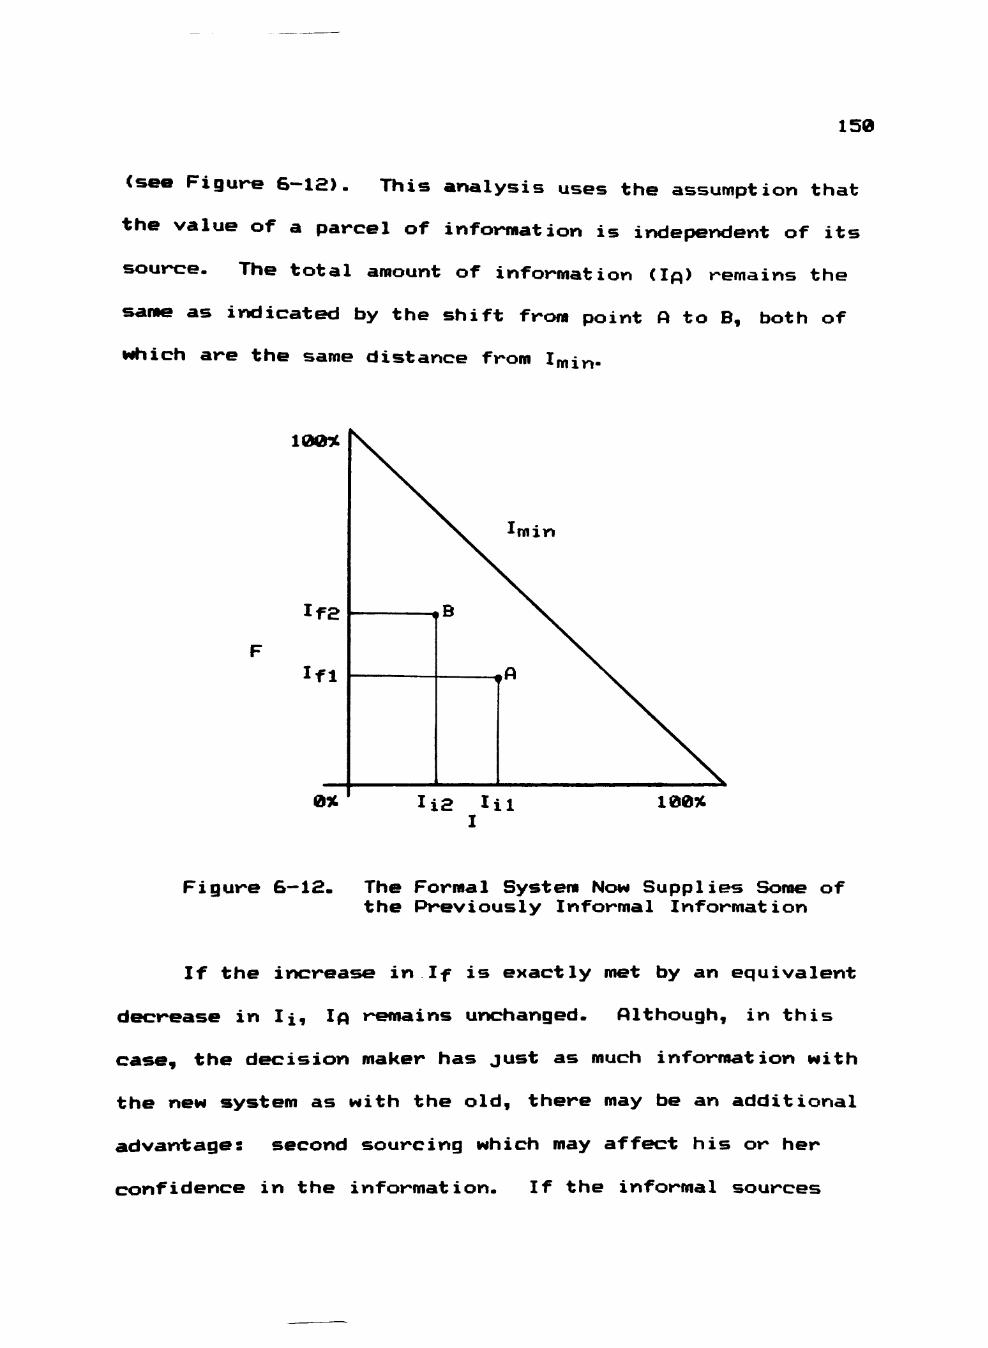
150
(see Figure 6-12)- This analysis uses the assumption that
the value of a parcel of information is independent of its
source- The total amount of information (Ip) remains the
same as indicated by the shift from point A to B, both of
which are the same distance from Imin-
100%
If 2
Ifl
ram
100%
Figure 6—12. The Formal Systera Now Supplies Some of the Previously Informal Information
If the increase in If is exactly met by an equivalent
decrease in Ii, Ip remains unchanged. Although, in this
case, the decision maker has just as much information with
the new system as with the old, there may be an additional
advantage: second sourcing which may affect his or her
confidence in the information- If the informal sources
151
still exist and are accessible, they can corroborate or
cast doubt on the system-supplied information- If the If
is confirmed, the decision maker can proceed with increased
confidence that the information upon which the decision is
being based is correct. If the informal source does not
agree with the formal, the decision maker can use this
discrepancy as a cue that further research is necessary to
establish the correctness of the information, or, if the
decision is made without further checking, be aware that
the results of the decision may be less certain.
Because of the second—sourcing effect, the decision
maker may consider that more information is received and
that Imin bas been more closely approximated- As
reassuring as this may be, it is important to reemphasize
that if the sources of information coincide there is, in
actuality, no movement toward Imin- Decision maker
behavior tends to place more emphasis on repeated values
CWinshall, 19793. The real danger occurs when the systera
has been fed erroneous data and an incorrect piece of
information is supplied through multiple channels- The
decision maker makes a decision with apparent high
confidence but, in this case, it is the wrong decision-
Although S€»cond opinions from independent sources are
the best way to increase a decision maker's confidence in
the information received, increased confidence is a
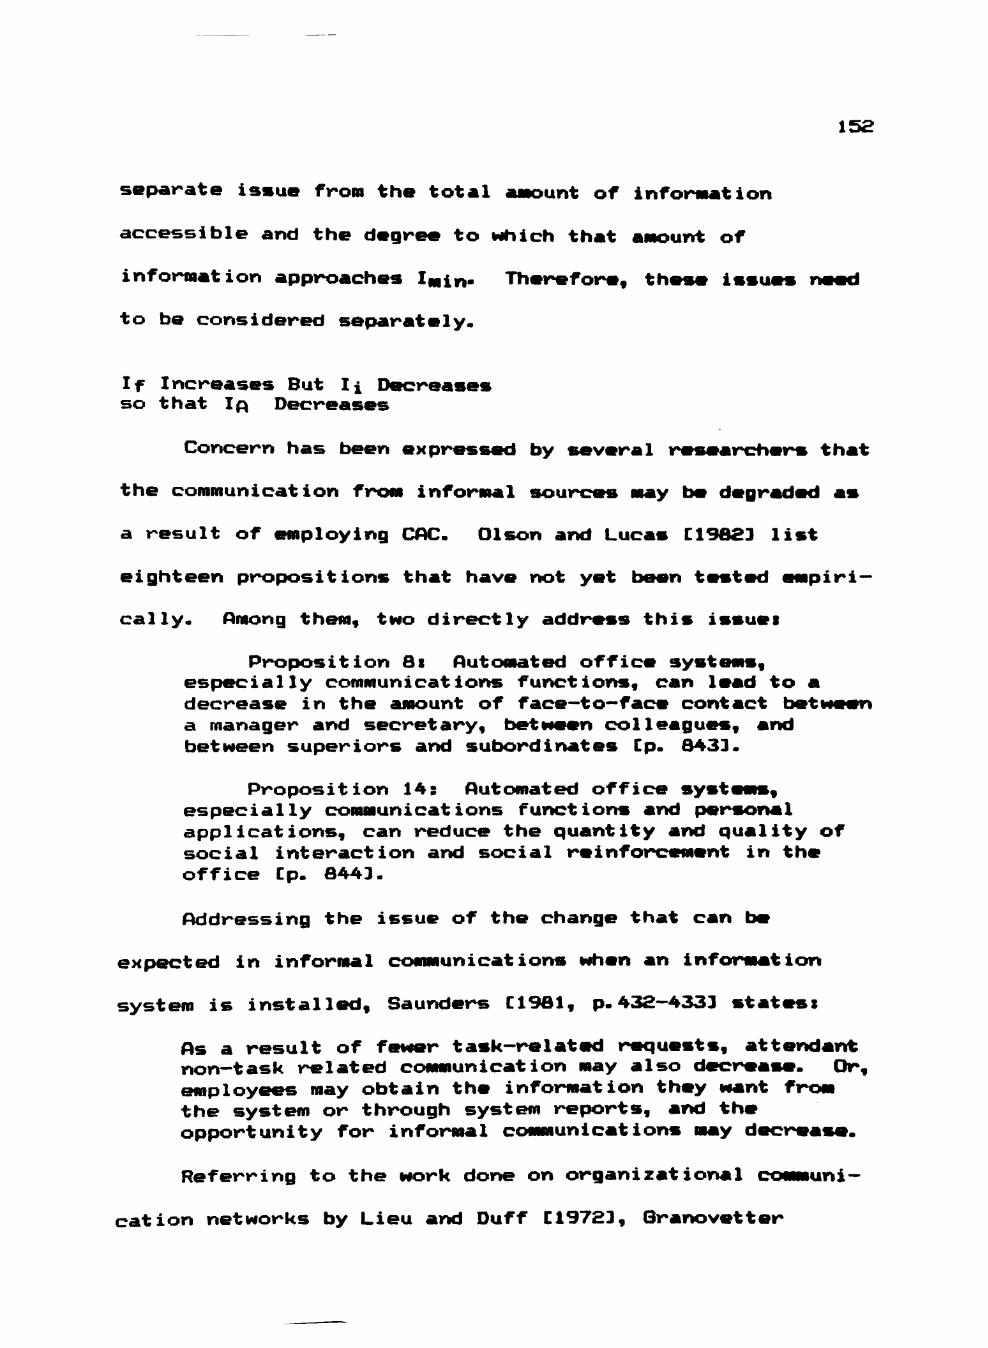
152
separate issue from the total amount of information
accessible and the degree to which that amount of
information approaches Imin- Therefore, these issues
to be considered separately.
If Increases But Ii Decreases so that Ip Decreases
Concern has been expressed by several researchers that
the communication from informal sourcres may be degraded as
a result of employing CAC. Olson and Lucas C19623 list
eighteen propositions that have not yet been tested empiri
cally. Among them, two directly address this issuei
Proposition 8i Automated office systems, especially communications functions, c»r% lead to a decrease in the amount of face—to—face contact bet a manager and secretary, between colleagues, and between superiors and subordinates Cp. 8433.
Proposition 14: Automated office systems, especially communications functions and personal applications, can reduce the quantity and quality of social interaction and social reinforcement in the office Cp. 8443-
Addressing the issue of the change that can be
expected in informal communications when Mn information
system is installed, Saunders C19ai, p. 432-4333 states:
As a result of fewer task-related requests, attendant non-task related communication may also decrease. Or, cMaployees may obtain the information they want from the system or through systera reports, and the opportunity for informal communications may decreai
Referring to the work done on organizational communi
cation networks by Lieu and Duff C19723, Granovetter
153
C19733, and Rogers and Kincaid C19ai3 (reviewed in Chapter
Three, starting on page 42), weak ties, which are important
sources of information, may have a high probability of
being disrupted. Because a CAC systera formalizes the
information that a decision maker knows is needed, occa
sional, yet vital, communications tend to be formalized-
As a result, maintenance of the weak links previously used
for the now formalized information becomes difficult-
Motivation for continuing cjontact may become absent and the
occasional contact that once existed may disappear
completely. Due to the loss of periodic contact with the
information source, the informal information that was
gained as an artifact of the encounter is also lost-
Therefore, if the weak-link communication that provides
contextualizing information is impaired, the quality of the
generated decisions may actually deteriorate even though an
"improved" system is installed- This possibility is dia
grammed in Figure 6-13-
Although formal communication is improved frora Ifj to
If2, the informal sources are impaired and the informal
contribution drops from lii to Ii2- The resulting Ip moves
from point A to point B which is further from the goal of
Irain- Resulting decisions are, therefore, inferior to
those made with the old system.
100%
m m
Figure 6-13. Formal Communioation Increa Informal Communication Decree
But
Of course, the amount of improvement (or disimprove—
ment) depends on how much information is gained through
formalizing the communication channels versus how much
information is lost from the informal channels. If the
gain in efficiency and effectiveness is large enough, a
certain degree of loss of the informal communication
sources is tolerable. The real problem arises when the
decision maker losc»s access to sources that provide
critical information which the formal system is incapable
of handling.
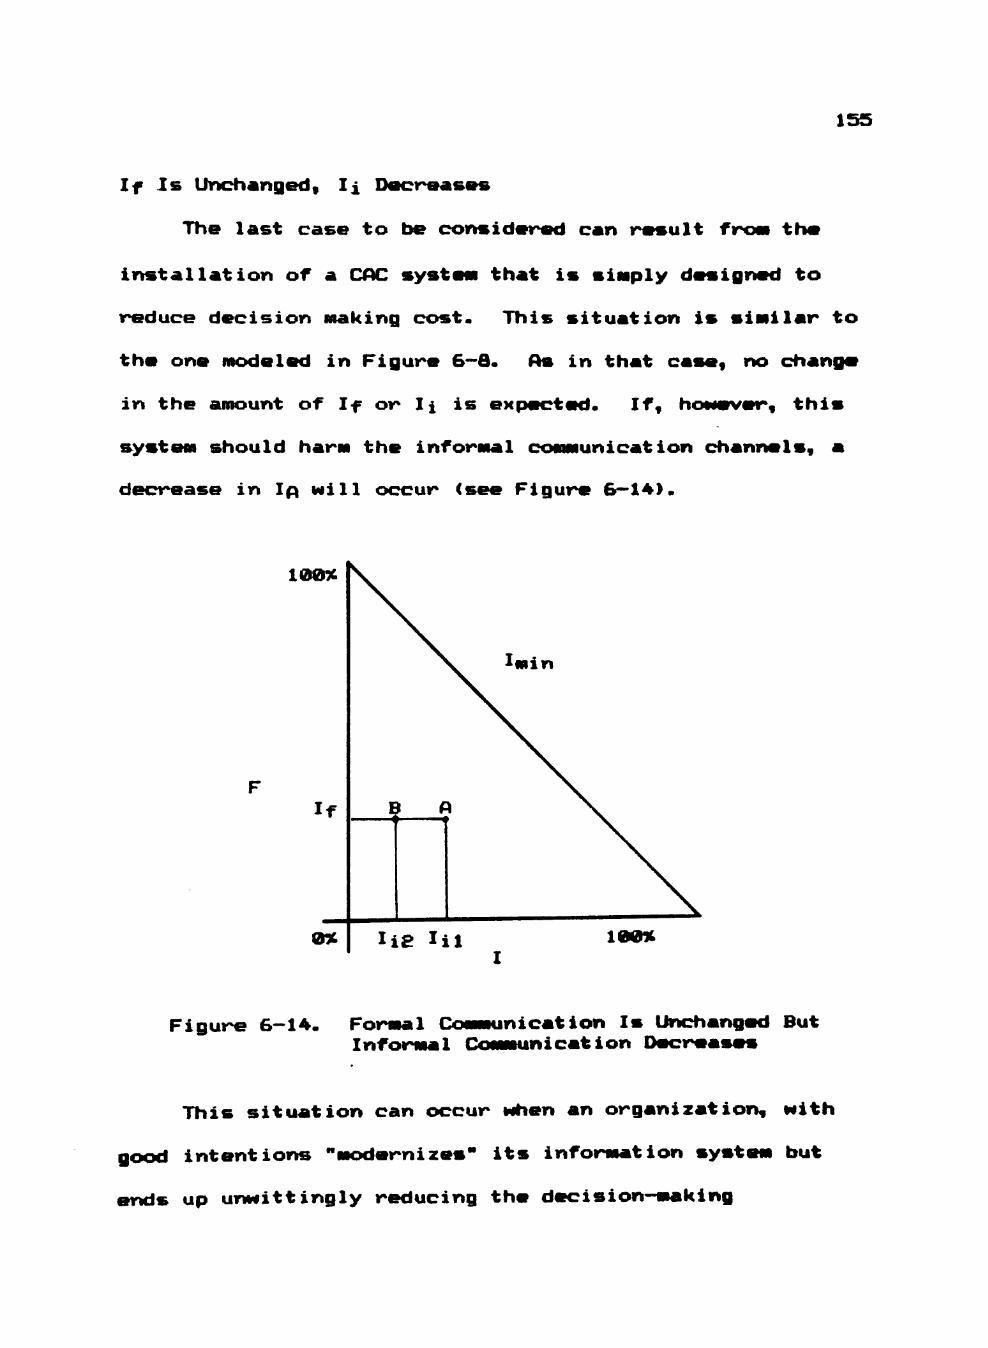
155
If Is Unchanged, Ii Decreases
The last case to be considered can result from the
installation of a CAC system that is simply designed to
reduce decision making cost. This situation is similar to
the one modeled in Figure 6-6. As in that case, no change
in the amount of If or Ii is expected. If, however, this
system should harm the informal communication channels, a
decrease in Ip will occur ( Figure 6—14).
100%
I f
0%
E
I i
\ ^ I m i n
> A
LS I i l i I
100%
Figure 6-14. Formal Communication Is Uncrhanged But Informal Communication Decreai
This situation can occur when An organization, with
good intentions "modernizes** its information system but
ends up unwittingly reducing the decision-making
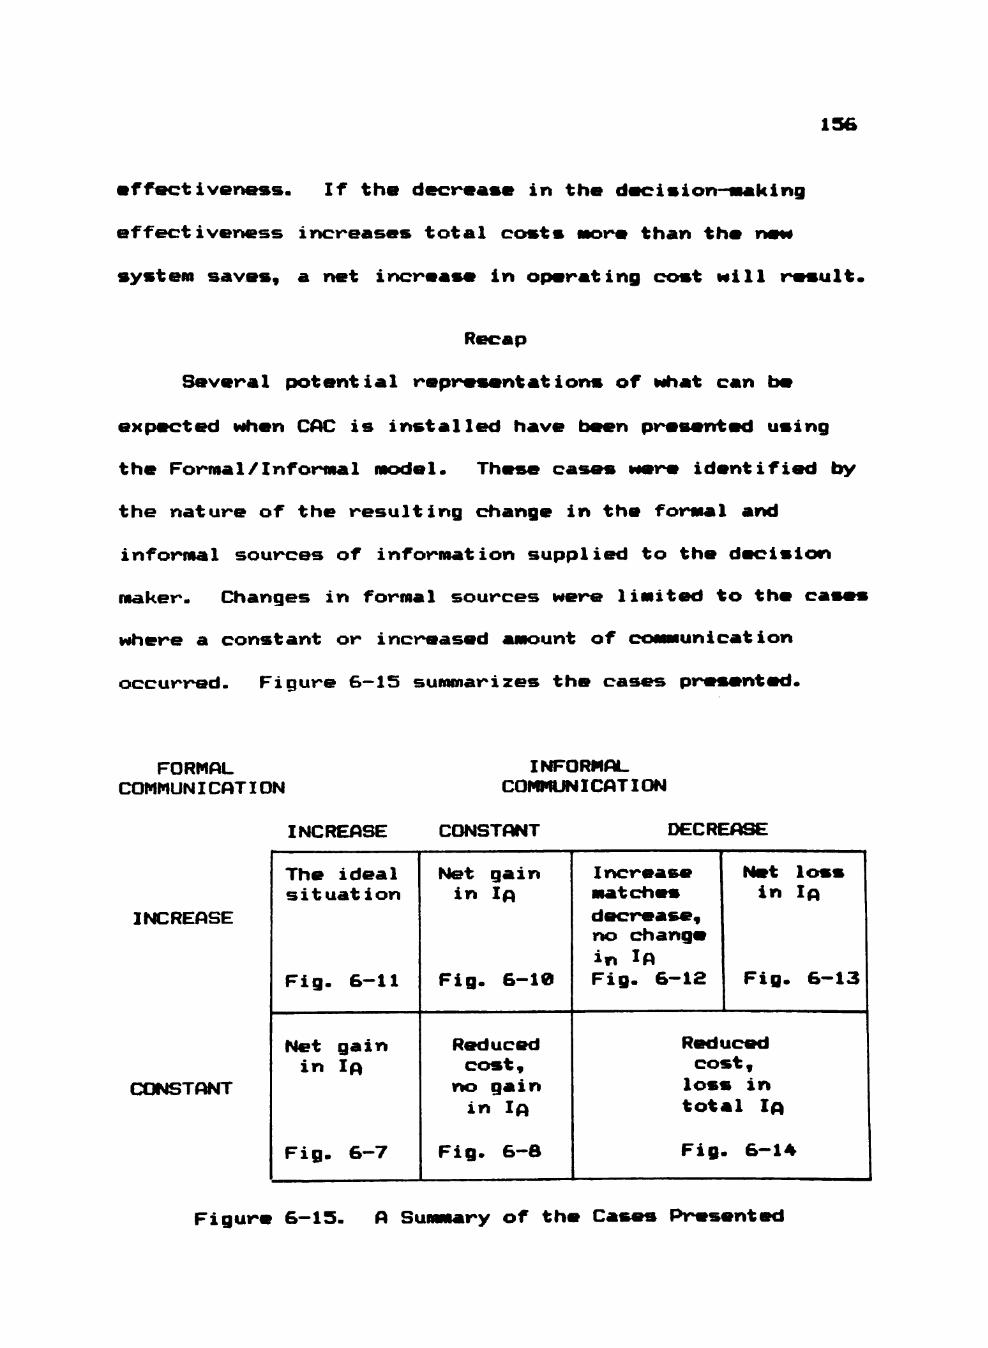
136
effectiveneres. If the decrease in the decision-making
effectiveness increases total costs more than the new
system saves, a net increase in operating cx>st will ult.
Recap
Several potential representations of what can be
expected »«hen CAC is installed have been presented using
the Formal/Informal model, Th ca were identified by
the nature of the resulting change in the formal and
informal sources of information supplied to the decision
maker- Changes in formal sources were limited to the ca
where a constant or increased amount of unicat ion
occurred- Figure 6—IS summarizes the cases p: nted.
FORMAL COMMUNICATION
INFORMAL COMMUNICATION
INCREASE CONSTANT DECREASE
INCREASE
CX)NSTANT
The ideal situation
Fig. 6-11
Net gain in Ip
Fig. 6-7
Net gain in lA
Fig. 6-10
Reduced cost.
no gain in Ip
Fig. 6-8
Increase 1 Net loss matches decrease, no change in lA Fig. 6-12
in lA
Fig. 6-13
Reduced cost. loss in total Ip
Fig. 6-14
Figure 6-IS. A Summary of the Ca Presented
157
The next section of this chapter shows how various
decision—making environments are t>3ically represented by
the model and presents eleven propositions stating the
general trends that can be expected in each of these
environments. These propositions can be USCKJ as a guide
for the systems analyst when using this model as a
diagnostic and prescriptive tool as is described after the
following section.
Various Decision-making Environments as Represented by the Model
The following statements represent generalizations.
Exceptions to each case can be readily found- By consider
ing the general case, the analysis of various system con
figurations will be targeted at the bulk of the decisions
and, therefore, will represent the major effects-
Exceptions will, naturally, require alternate analysis.
There are many ways of classifying decisions. The
following ones were chosen from the literature because they
represent some of the more cor^ion schemes. The schemes
chosen are not exhaustive yet serve to illustrate how the
model can be used to represent various classes of
decisions.
The areas delineated in the following figures
represent approximations and should be thought of as
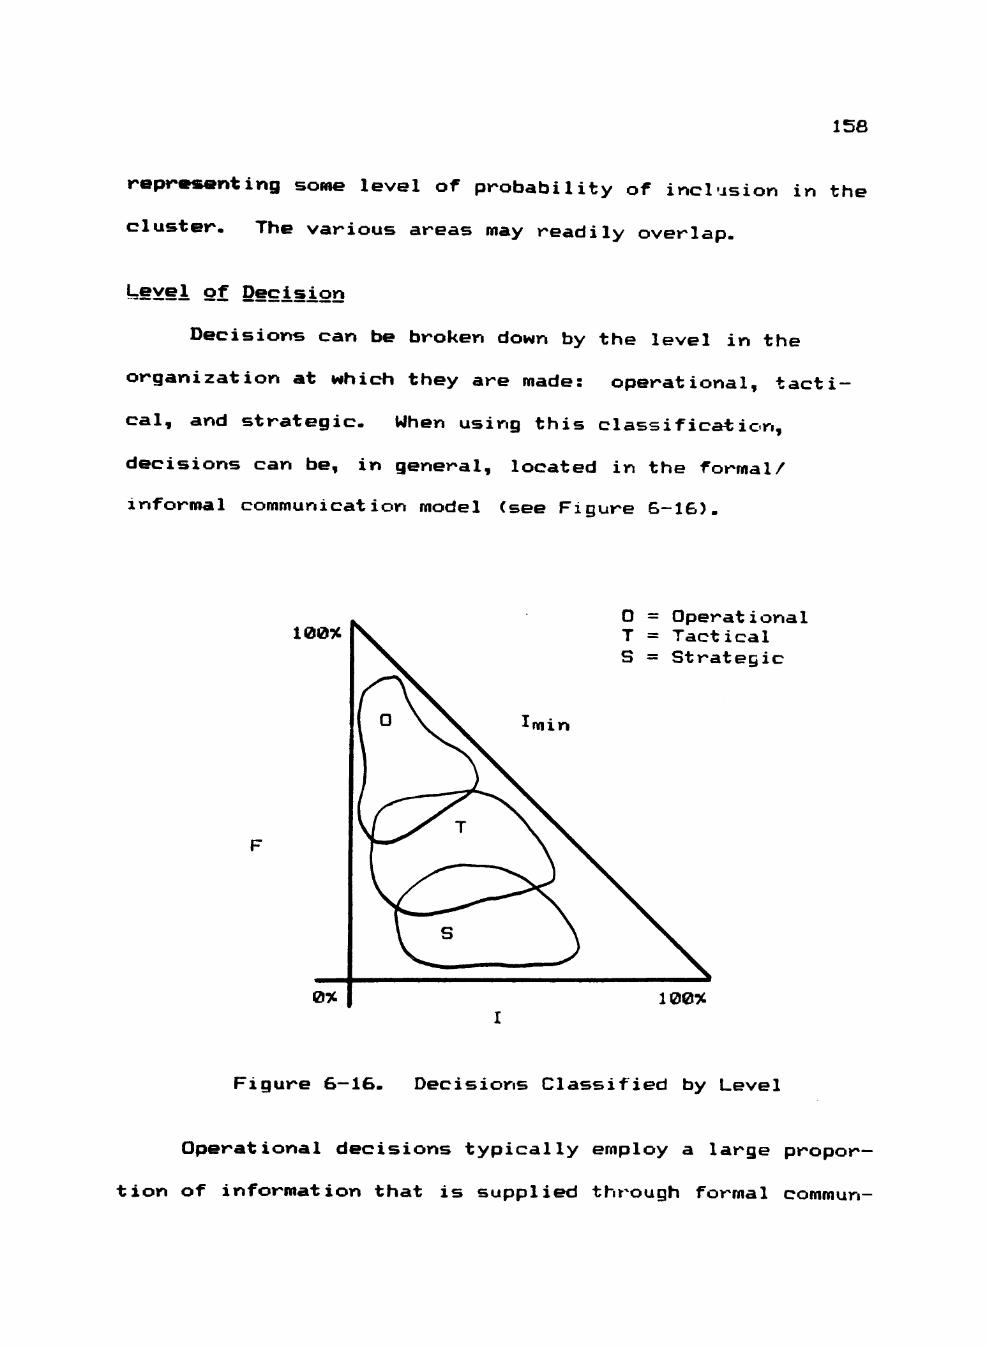
158
representing some level of probability of inclusion in the
cluster. The various areas may readily overlap.
Lgvei of Decision
Decisions can be broken down by the level in the
organization at which they are made: operational, tacti
cal, and strategic. When using this classification,
decisions can be, in general, located in the formal/
informal communication model (see Figure 6-16).
100%
0%
O T S
min
Operational Tactical Strategic
100%
Figure 6—16- Decisions Classified by Level
Operational decisions typically employ a large propor
tion of information that is supplied through formal commun-
159
ication channels. Strategic decisions frequently depend
more on informal sources. Tactical decisions employ a
mixture- In addition, the number of factors affecting a
typical operational decision tend to be limited. There
fore, it can be expected that the Ip gathered for such
decisions may closely approximate Imin- On the other hand,
strategic decisions typically involve numerous factors,
many of which may even be unknown to the decision maker.
Therefore, the chance of operating near Imin is reduced.
From the model, two propositions emerge:
Proposition I:
The lower the level of decision (operational being the
lowest, strategic the highest), the greater will be the
ratio of formal to informal communication channels used in
making ' he decision, all other factors being equal.
Proposition 2:
The lower the level of decision, the closer to Imin
will be the information available to the decision maker,
all other factors being equal.
BSd^unt of Structure
Highly structured decisions are programmable and are
amenable to formalization. Ill-structured decisions are
not. Therefore, structured decisions tend to fall in the
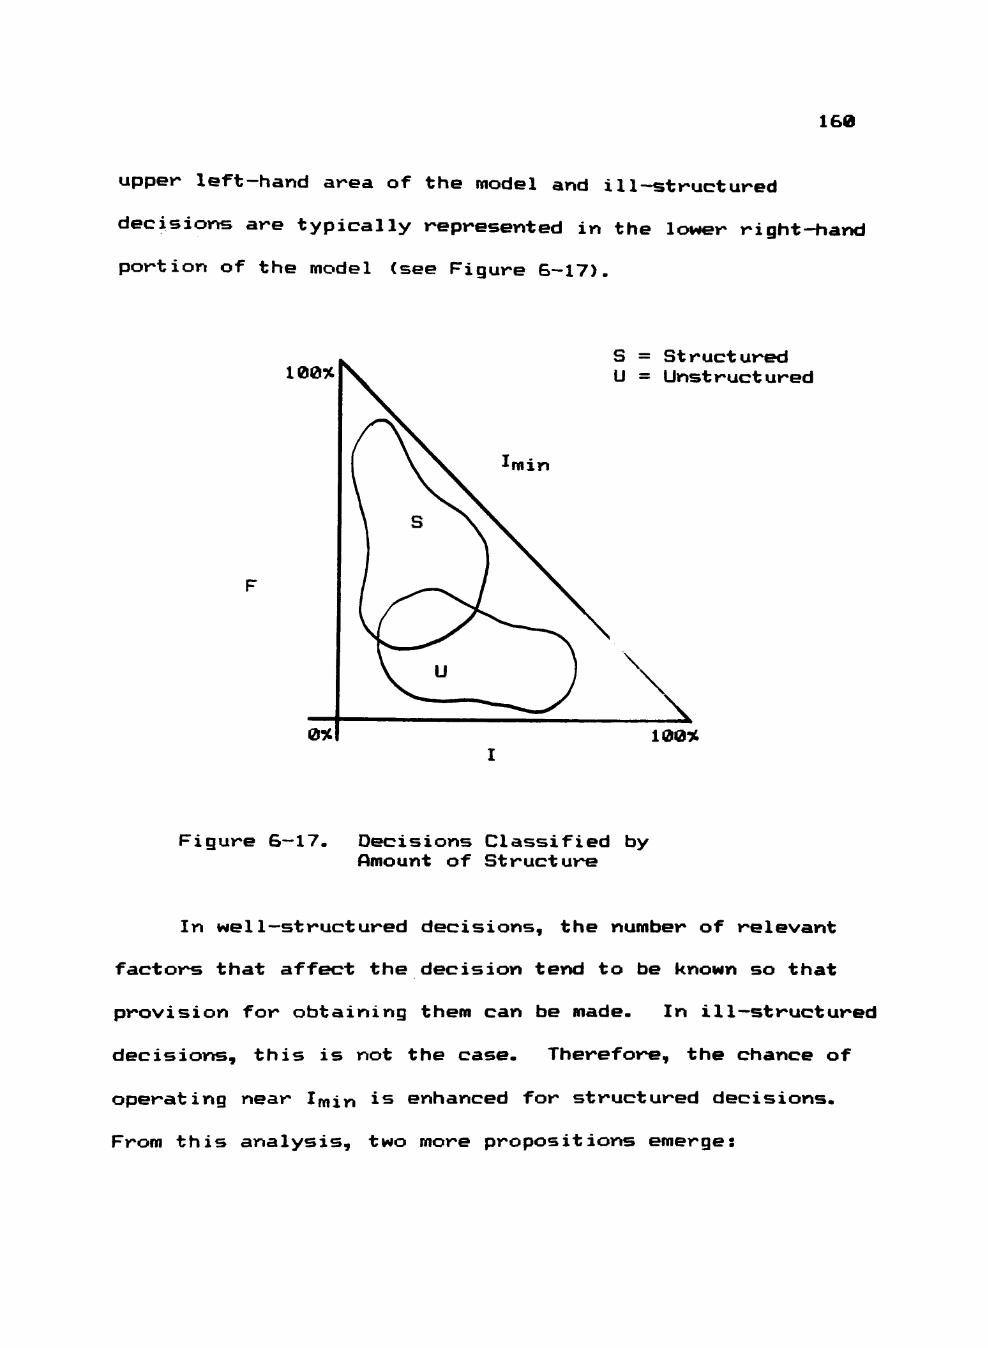
160
upper left-hand area of the model and ill-structured
decisions are typically represented in the lower right-hand
portion of the model (see Figure 6-17).
100% S = Structured U = Unstructured
100%
Figure 6—17. Decisions Classified by Amount of Structure
In wel1—structured decisions, the number of relevant
factors that affect the decision tend to be known so that
provision for obtaining them can be made. In ill—structured
decisions, this is not the case. Therefore, the chance of
operating near Imin is enhanced for structured decisions.
From this analysis, two more propositions emerge:
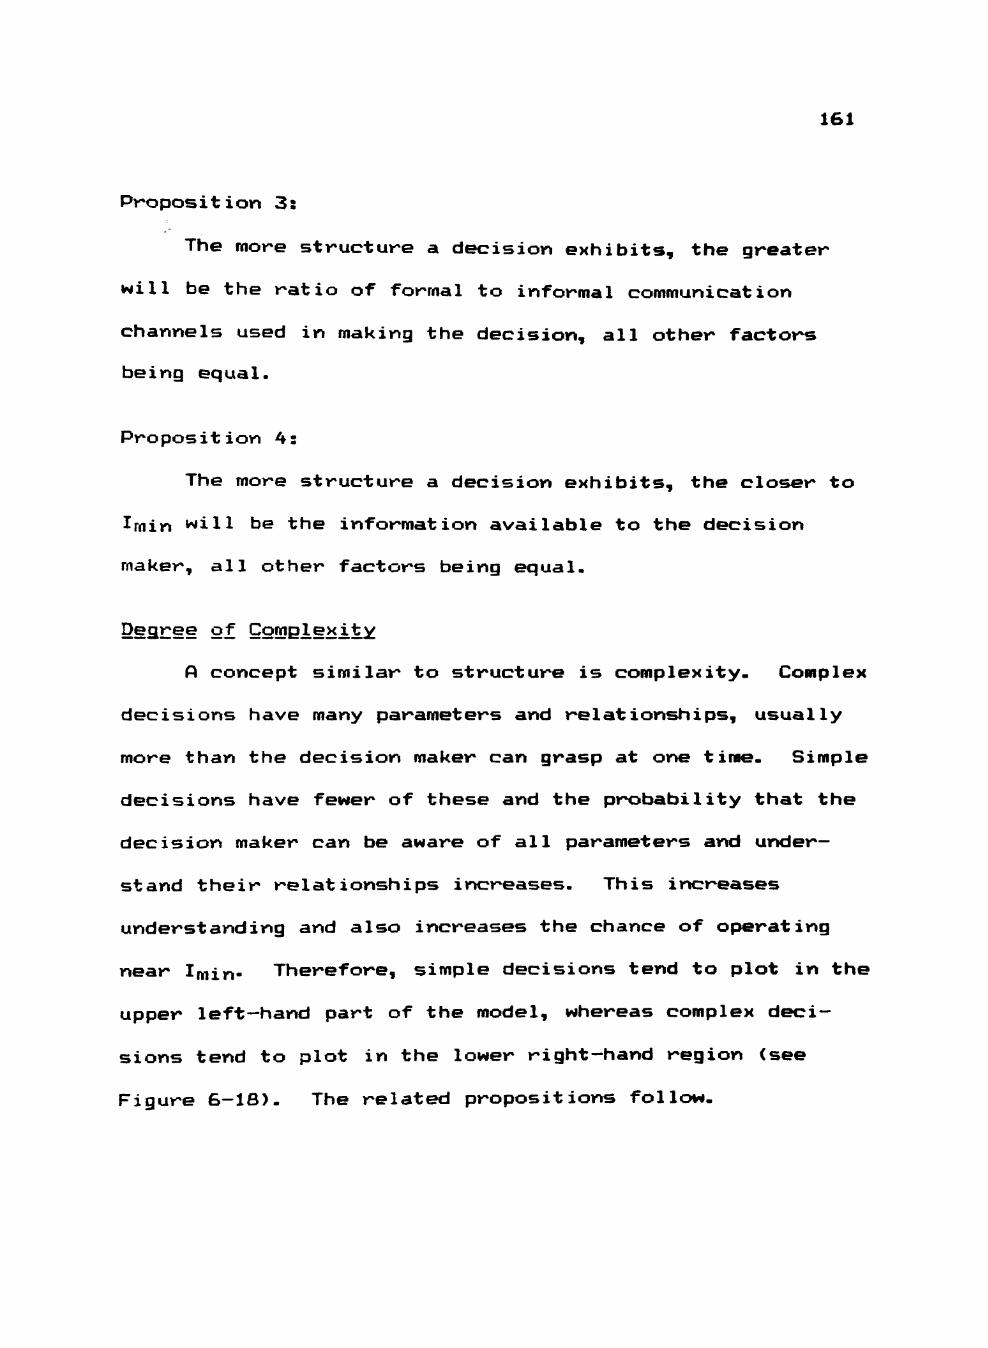
161
Proposition 3:
The more structure a decision exhibits, the greater
will be the ratio of formal to informal communication
channels used in making the decision, all other factors
being equal.
Proposition 4:
The more structure a decision exhibits, the closer to
Imin will be the information available to the decision
maker, all other factors being equal.
Degree of Comgiexity
A concept similar to structure is complexity- Complex
decisions have many parameters and relationships, usually
more than the decision maker can grasp at one time- Siraple
decisions have fewer of these and the probability that the
decision maker can be aware of all parameters and under
stand their relationships increases. This increases
understanding and also increases the chance of operating
near Imin- Therefore, simple decisions tend to plot in the
upper left—hand part of the model, whereas complex deci
sions tend to plot in the lower right-hand region (see
Figure 6-18). The related propositions follow-
162
100%
ram
S = Simple C = Complex
100%
Figure 6—18. Decisions Classified by Degree of Complexity
Propos i t i on 5:
The less complex a decision, the greater will be the
ratio of formal to informal communication channels used in
making the decision, all other factors being equal.
Propos i t i on 6:
The less complex a decision, the closer to Imin will
be the information available to the decision maker, all
other factors being equal.
ElZeguency of Occurrence
Another classification method is the frequency with
which a decision is made. Routine decisions are made
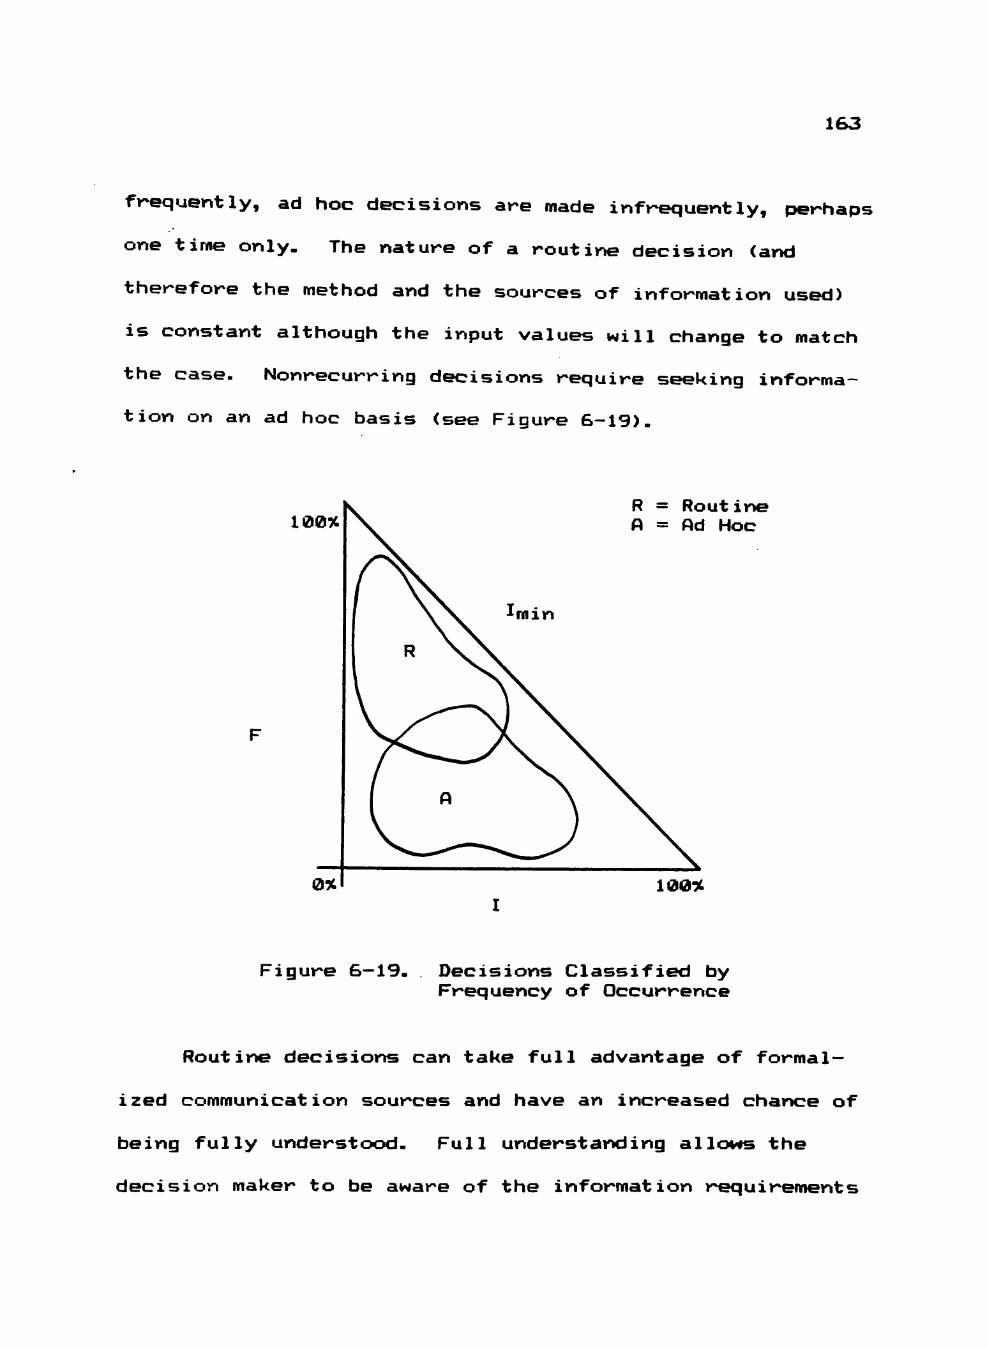
163
frequently, ad hoc decisions are made infrequently, perhaps
one time only- The nature of a routine decision (and
therefore the method and the sources of information used)
is constant although the input values will change to match
the case. Nonrecurring decisions require seeking informa
tion on an ad hoc basis (see Figure 6-19).
100%
ram
R = Routine A = Ad Hoc
100%
Figure 6—19- Decisions Classified by Frequency of Occurrence
Routine decisions can take full advantage of formal
ized communication sources and have an increased chance of
being fully understood. Full understanding allows the
decision maker to be aware of the information requirements

164
and establish communication channels to obtain that infor
mation- Therefore, routine decisions have an increased
chance of operating near Imin-
Proposition 7;
The more routine a decision, the greater will be the
ratio of formal to informal communication channels used in
making the decision, all other factors being equal-
Proposition 8:
The more routine a decision, the closer to Imin will
be the information available to the decision maker, all
other factors being equal-
Uength of lime Ayaiiabie for Decision M^isiDS
The time that a decision maker has for making a
decision varies widely with the nature of the decision and
the particular situation in which the decision is being
made. For a given decision, the longer the time available
before a choice must be made, the greater the opportunity
to gather information frora both forraal and informal sources
(see Figure 6-20).
Although it is possible to postulate that, as the
amount of decision time increases, the total information
available increases, it is difficult to generalize a trend
toward formal or informal sourcing. If little time is
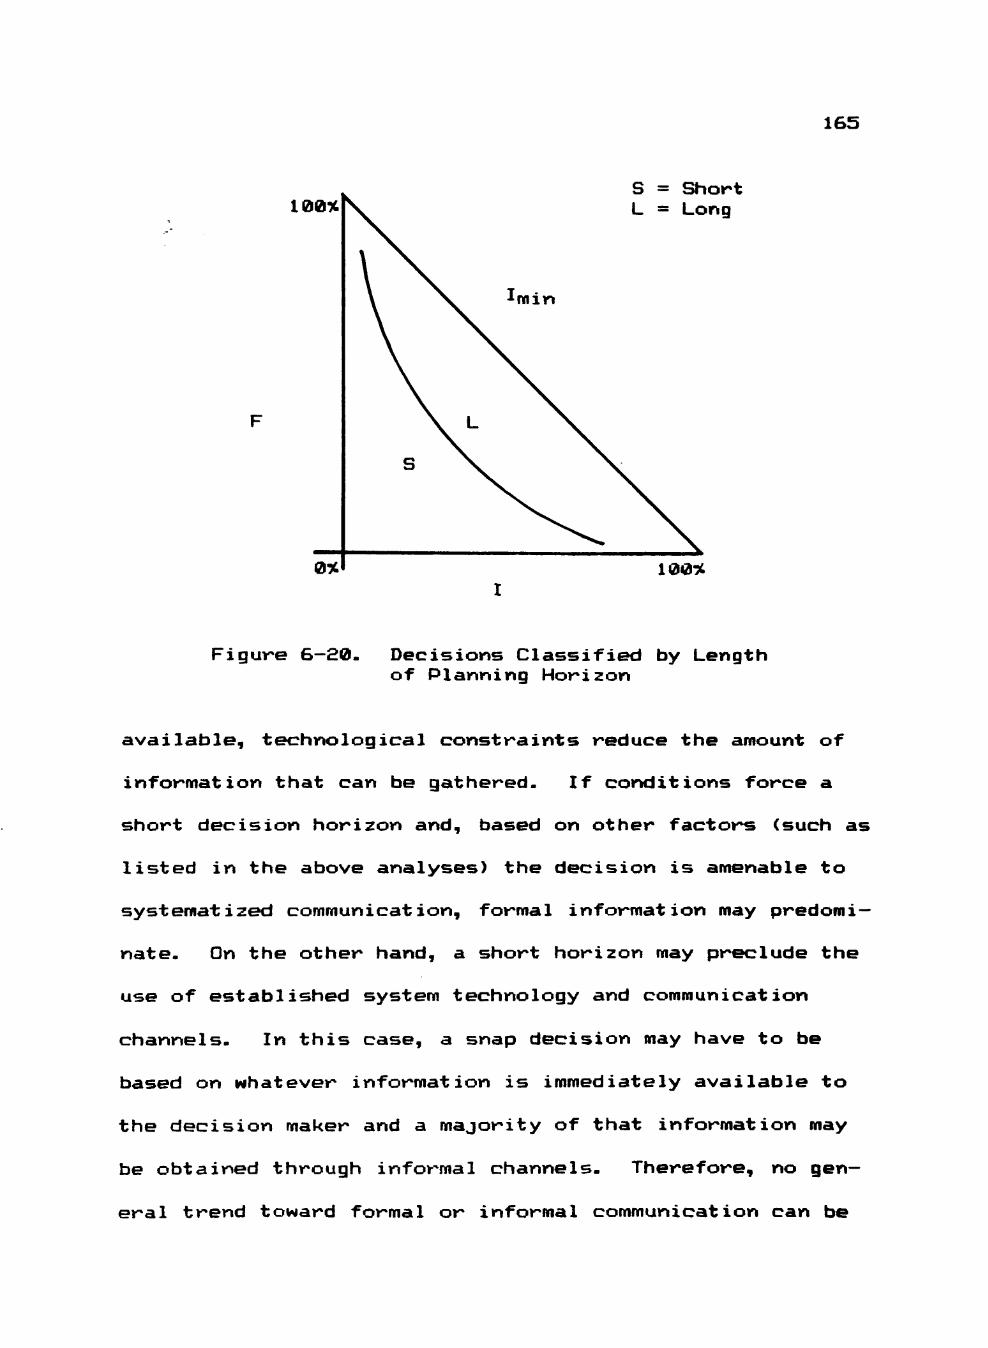
165
100%
ram
S = Short L = Long
100%
Figure 6-20. Decisions Classified by Length of Planning Horizon
available, technological constraints reduce the araount of
information that can be gathered. If conditions force a
short decision horizon and, based on other factors (such as
listed in the above analyses) the decision is amenable to
systematized communication, formal information may predomi
nate. On the other hand, a short horizon may preclude the
use of established systera technology and communication
channels. In this case, a snap decision may have to be
based on whatever information is immediately available to
the decision maker and a majority of that information may
be obtained through informal channels- Therefore, no gen
eral trend toward formal or informal communication can be
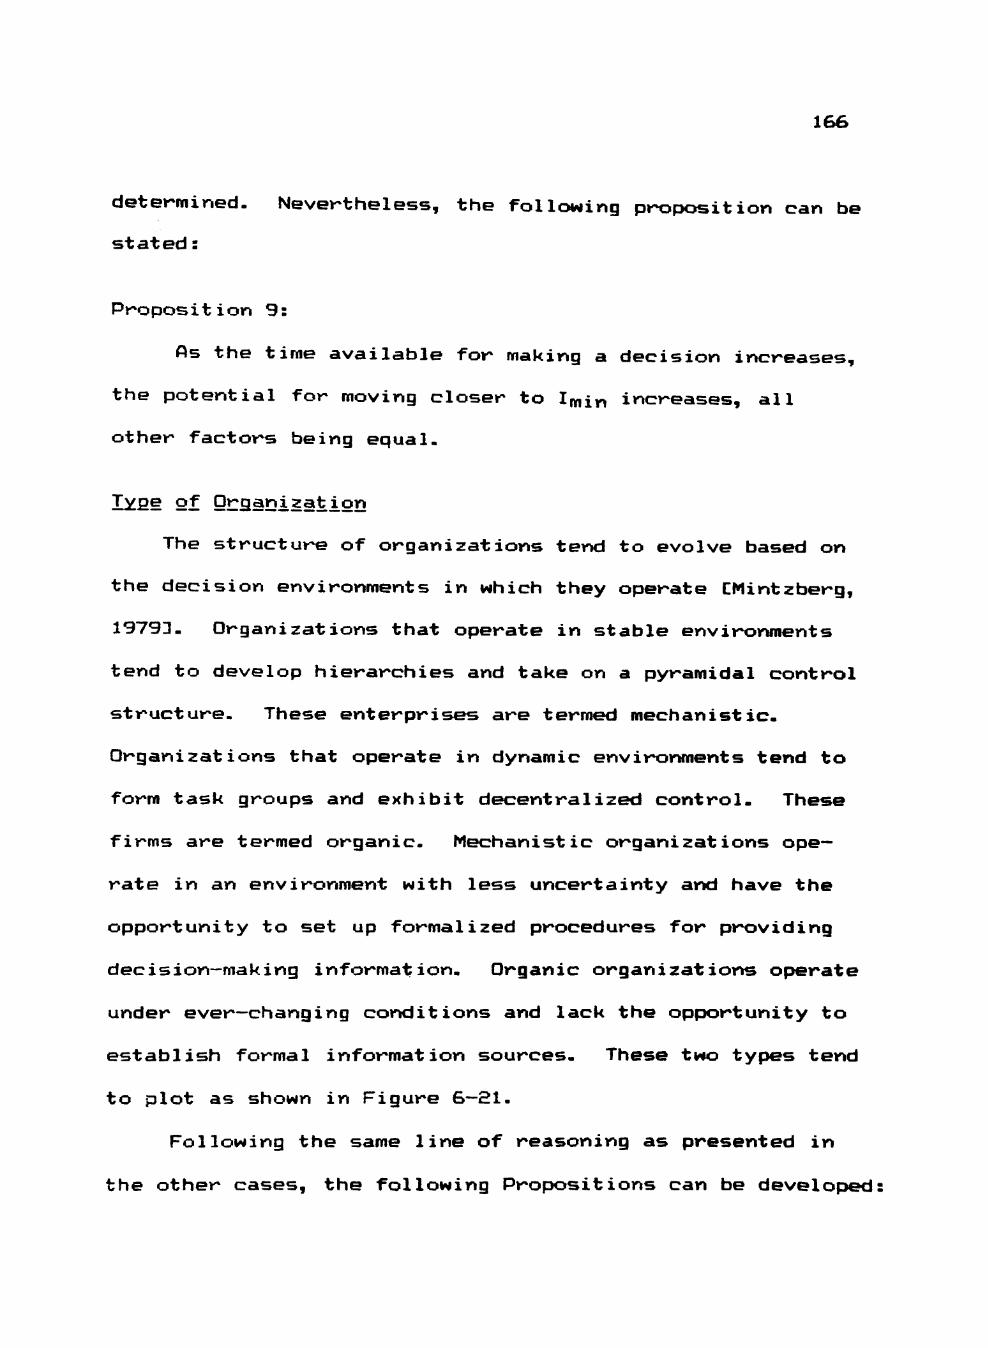
166
determined. Nevertheless, the following proposition can be
stated:
Proposition 9:
As the time available for making a decision increases,
the potential for moving closer to Imin increases, all
other factors being equal.
Tyae of Organization
The structure of organizations tend to evolve based on
the decision environments in which they operate CMintzberg,
19793- Organizations that operate in stable environments
tend to develop hierarchies and take on a pyramidal control
structure- These enterprises are termed mechanistic-
Organizations that operate in dynamic environments tend to
form task groups and exhibit decentralized control- These
firms are termed organic. Mechanistic organizations ope
rate in an environment with less uncertainty and have the
opportunity to set up formalized procedures for providing
decision—making information. Organic organizations operate
under ever—changing conditions and lack the opportunity to
establish forraal information sources- These two types tend
to plot as shown in Figure 6—21.
Following the same line of reasoning as presented in
the other cases, the following Propositions can be developed
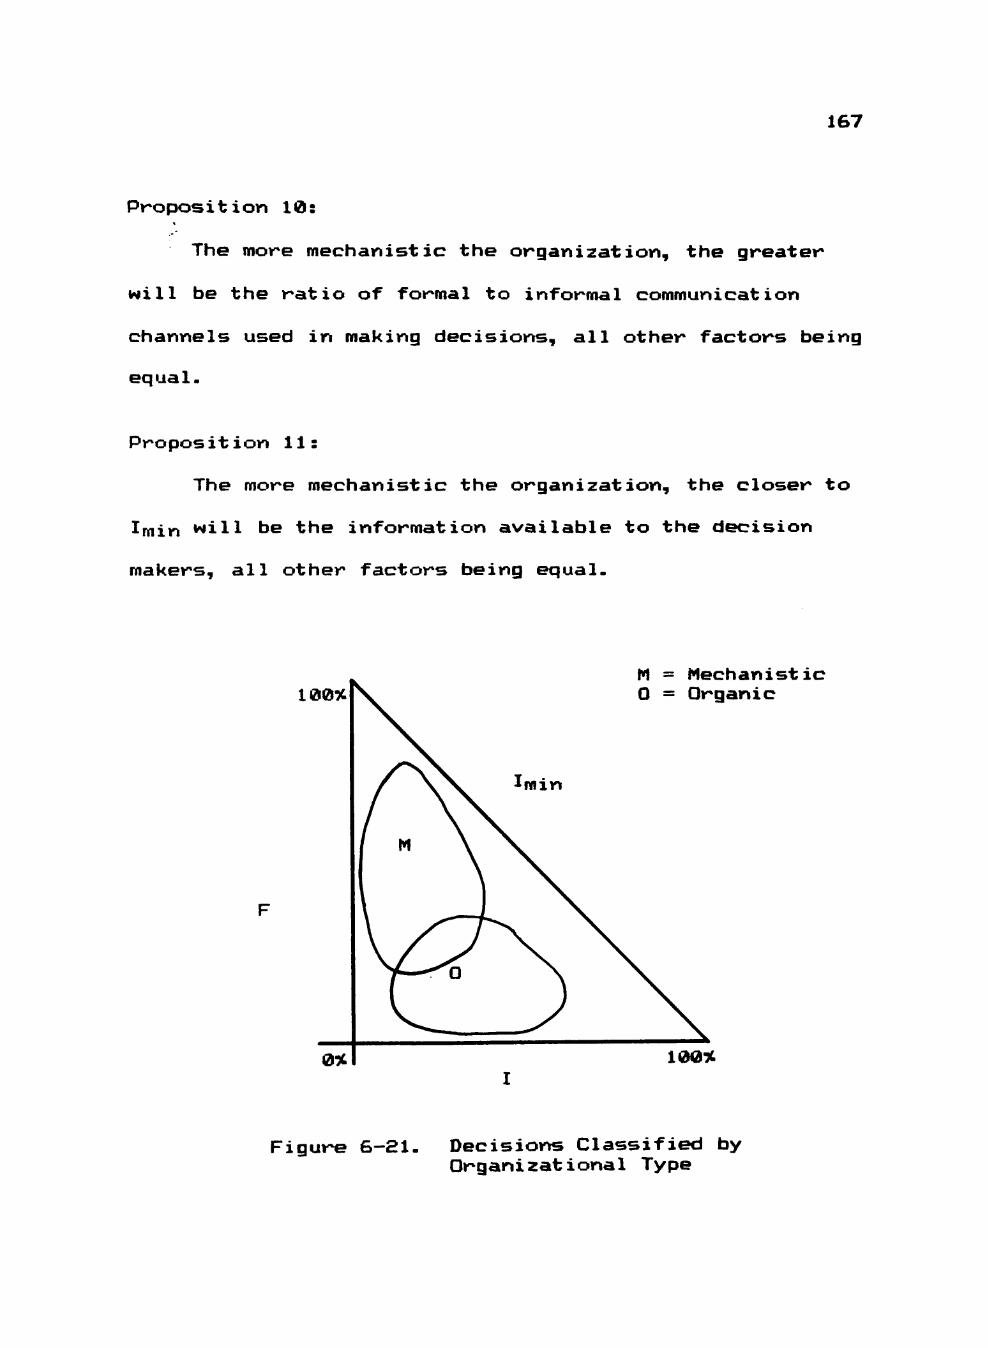
167
Proposition 10:
The more mechanistic the organization, the greater
will be the ratio of formal to informal communication
channels used in making decisions, all other factors being
equal.
Proposition 11:
The more mechanistic the organization, the closer to
m m will be the information available to the decision
makers, all other factors being equal.
100%
ram
M = Mechanistic O = Organic
100%
Figure 6-21, Decisions Classified by Organizational Type
168
Potential Applications of the Modei
The model developed in this chapter is directed at
describing the effects of implementing CAC technology on
the source (either formal or informal) of the information
made available to the decision maker. These effects are
described as a shift in the source of information used to
make decisions. Furthermore, this model points out some
potentially detrimental situations that could occur when
implementing the improved CAC technology. Therefore, this
model becomes useful to the people in the organization who
are responsible for the design and implementation of these
systems. An understanding of the potential effects of CAC
systems on the formal and informal communication channels
can improve their application and help forewarn the
developer of possible pitfalls- Since the entire range of
information sources is represented, the model is robust
enough to be relevant to decisions made at any level in the
organization.
The model has potential predictive and diagnostic uses.
As a predictive tool, it can be used to qualitatively esti
mate whether or not any improvement in information sourcing
can be expected by increasing the CAC in an organization.
To use the model for this purpose, a sample of existing
decisions would be analyzed to determine what sources were
tapped to obtain the information used by the decision
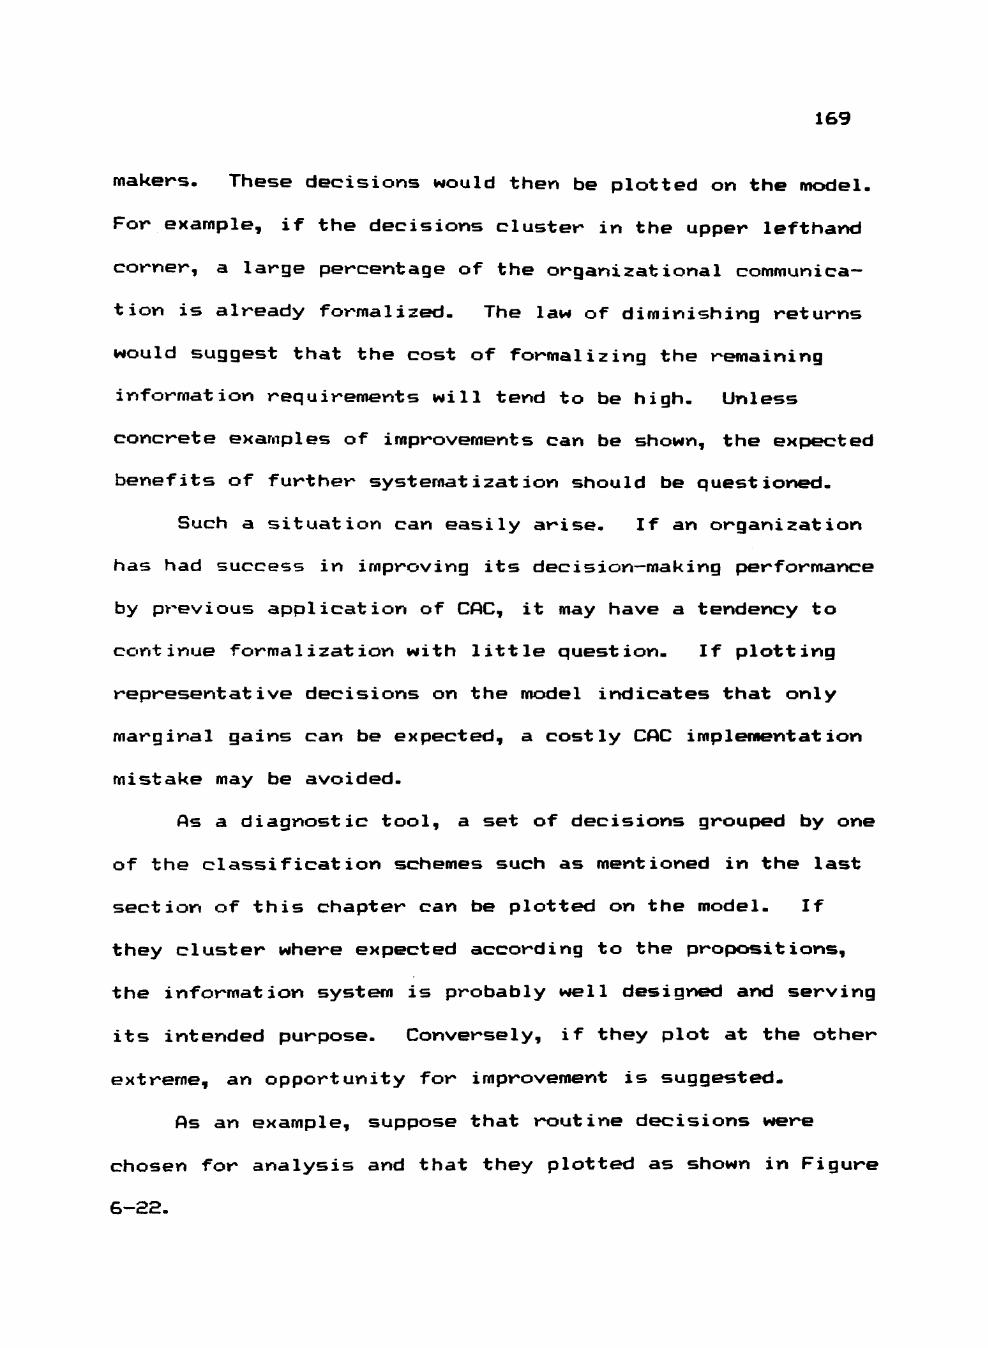
169
makers. These decisions would then be plotted on the model.
For example, if the decisions cluster in the upper lefthand
corner, a large percentage of the organizational communica
tion is already formalized- The law of diminishing returns
would suggest that the cost of formalizing the remaining
information requirements will tend to be high. Unless
concrete examples of improvements can be shown, the expected
benefits of further systematization should be questioned-
Such a situation can easily arise. If an organization
has had success in improving its decision—making performance
by previous application of CAC, it may have a tendency to
continue formalization with little question- If plotting
representative decisions on the model indicates that only
marginal gains can be expected, a costly CAC implementation
mistake may be avoided.
As a diagnostic tool, a set of decisions grouped by one
of the classification schemes such as mentioned in the last
section of this chapter can be plotted on the model. If
they cluster where expected according to the propositions,
the information systera is probably well designed and serving
its intended purpose. Conversely, if they plot at the other
extreme, an opportunity for improvement is suggested.
As an example, suppose that routine decisions were
chosen for analysis and that they plotted as shown in Figure
6-22.
170
100%
0%
mm
X X X X X
X X X X X
X X X X X X
X X X
100%
Figure 6-22. A Hypothetical Example of Plotted Decisions
According to Proposition 7, one would expect to see a
majority of the decisions located in the upper left—hand
corner. This contrary finding suggests that an opportunity
exists for expanding the amount of formal communication in
the organization. Employing CAC technology may be benefi
cial in this case. Of course, other mitigating factors
need to be considered to determine whether or not there is
good reason for the predominance of informal communication.
For example, this organization may exist in a highly vola
tile environment which precludes the establishment of a
more forraal communication structure-
171
Another diagnostic use of this model could be to com
pare the actual to the predicted use of an existing informa
tion system. For example, a given decision could be plot
ted, based on the actual use of information sources by the
decision maker. A second point could then be plotted repre
senting full use of the information available through the
existing channels. A comparison of the two points would
indicate how well the decision maker is taking advantage of
existing resources- It could make him or her aware of
untapped sources or it could be pointing out deficiencies in
the system that cause the decision maker to avoid using some
sources- Once aware of the problem, steps can be taken to
remedy it if deemed appropriate.
Unfortunately, the application of these analyses
require that it be possible to measure information and to
estimate Imin- To the extent that these operational
difficulties can be met, the model can be used. When the
theory of information advances to the point that these
measurements and estimates become more reliable, the appli
cation of this model will become more practical.
One immediate benefit of the model is a warning to
those persons involved with the design or installation of a
system offering improved CAC technology of its possible
damaging effects on the informal communication sources. As
diagrammed in Figure 6-13, decreased decision effectiveness
172
can occur even with an increase in the amount of systemic
supported communication a decision maker uses. If the
informal communication links that supply important context
ual izing information are sufficiently severed, the total
amount of information available may actually decrease. This
can even occur in a situation in which the decision is
simple, routine and highly structured; a situation that the
model would predict should use a large ratio of formal
communication. A shipping decision serves as an example.
One of the tasks that may be assigned to the distribu
tion manager of a corporation may be deciding which destina
tions get supplied from each of several sources- The rele
vant data include the quantities of the items to be shipped
frora each source, the amount needed at each destination, and
the cost, per unit, to transport each unit- This problem is
not too complex, is repetitive, and is well structured-
Solution procedures such as the transportation algo
rithm exist that, when correctly formulated and fed the
appropriate information, can yield an optimal solution-
This type of decision would probably be a candidate for an
extremely high percentage of systematized information. Yet,
if the nature of the information systera isolates the manager
from informal sources, a potential exists for making sub-
optimal, perhaps even infeasible decisions- An extension of
the example serves to illustrate this situation.
173
Suppose that the manager, using the new, high tech CAC
systera, has just generated an optimal distribution routing
while sitting in his office- While the "optimal" solution
is being created, one of the truck drivers has come into the
loading dock with information that a bridge on one of the
routes has been washed out and will be closed for the next
three months. The solution being generated is now far from
optimal. In the past, this news would have been obtained by
the manager through the informal communication that takes
place as an incidental part of his data gathering task- Now
all the data comes to him through the LAN frora the central
ized data base. He has been isolated from the informal
communication that presents a context in which to apply his
model-
This situation could be avoided if the system designer
is aware that it could occur and would make provision for
augmenting the damaged informal communication links- Fortu
nately, most CAC systems have the capability of supporting
informal communication through facilities like electronic
mail. Making a terminal available on the shipping dock and
educating the truck driver in its operation (along with some
encouragement to actually use it) could go a long way to
maintaining this informal information source. It is not a
difficult problem to deal with. It simply needs to be
recognized and appropriate action taken-
174
A Recag
;. This chapter has presented the background and develop
ment of a model for representing the information sources
used to make decisions- It has broken the sources into two
categories, formal and informal, based on whether the com
munication sources are formally supported by the systera or
not. The resulting effects of employing or improving the
information systera with CAC were diagrammed. These diagrams
showed the conditions under which the decision maker could
expect improvement or disimprovement in the total amount of
information available for making decisions.
The way the model represents several classes of
decisions were shown and propositions were offered that
stated, in general terms, the type of communication that
could be expected to support each class of decision. Final
ly, p>otential applications of the model were outlined and
some examples of how the model could be used by the practi
tioner were given.
One of the primary motivations for investing in a new
or improved CAC system is improved efficiency and effective
ness in the decision—making process. This chapter has pri
marily dealt with the effectiveness issue. The efficiency
issue is the topic of the next chapter, one measure of
efficiency being the cost incurred for a related degree of
decision effectiveness-
CHAPTER VII
COST ASPECTS OF DECISION MAKING
Sood Decisions
As previously discussed in Chapter Five, the
underlying reason for developing an information system is
to support decision making. Furthermore, the goal is not
merely to make decisions, but to make "good" decisions.
What then differentiates a good decision from a poorer
decision and what are the characteristics of "improved"
decisions?
For the purposes of this analysis (in contrast to the
analysis in Chapter Six), the quality of decisions will be
described in terms of cost. The factors comprising this
cost include the cost in time, effort, and dollars of
assimilating the information used in arriving at the
decision (efficiency) and the resultant opportunity cost of
making less than a "perfect" decision (effectiveness). A
pmrf9ct decision will be defined as the one that an
omniscient, profit—oriented being would make. Since this
being is "all—knowing", the cost of obtaining all relevant
information is low. Therefore, all relevant information
would be used to make the decision.
175
176
Real world decisions are made under conditions of
bounded rationality CSimon, 19573- Under these conditions,
information comes at a cost. Furthermore, differing
knowledge exists about the necessary information. Some
information may be required and known. Some information
may be perceived as required but not known. Finally, some
information requirements may not be known, that is, there
is no perception or cognizance of the need for such
information. Cost/benefit considerations limit the amount
of information available. A good decision, then, is one
that approaches, to the best of the decision maker's
ability, a perfect decision.
The costs of assimilating decision—making information
can be lowered three ways: 1) by reducing the time the
decision maker takes to gather specified information, 2) by
improving the presentation of the information to the
decision maker, and 3) by minimizing the system overhead
involved in storing, processing, and displaying the informa
tion.
ImprovEKf decision making can be described as an
improvement in productivity in two ways: 1) the same
decision made at a lower cost or 2) an improved decision
made at the same cost. The purpose of an information
system is to provide for good decisions and any improvement
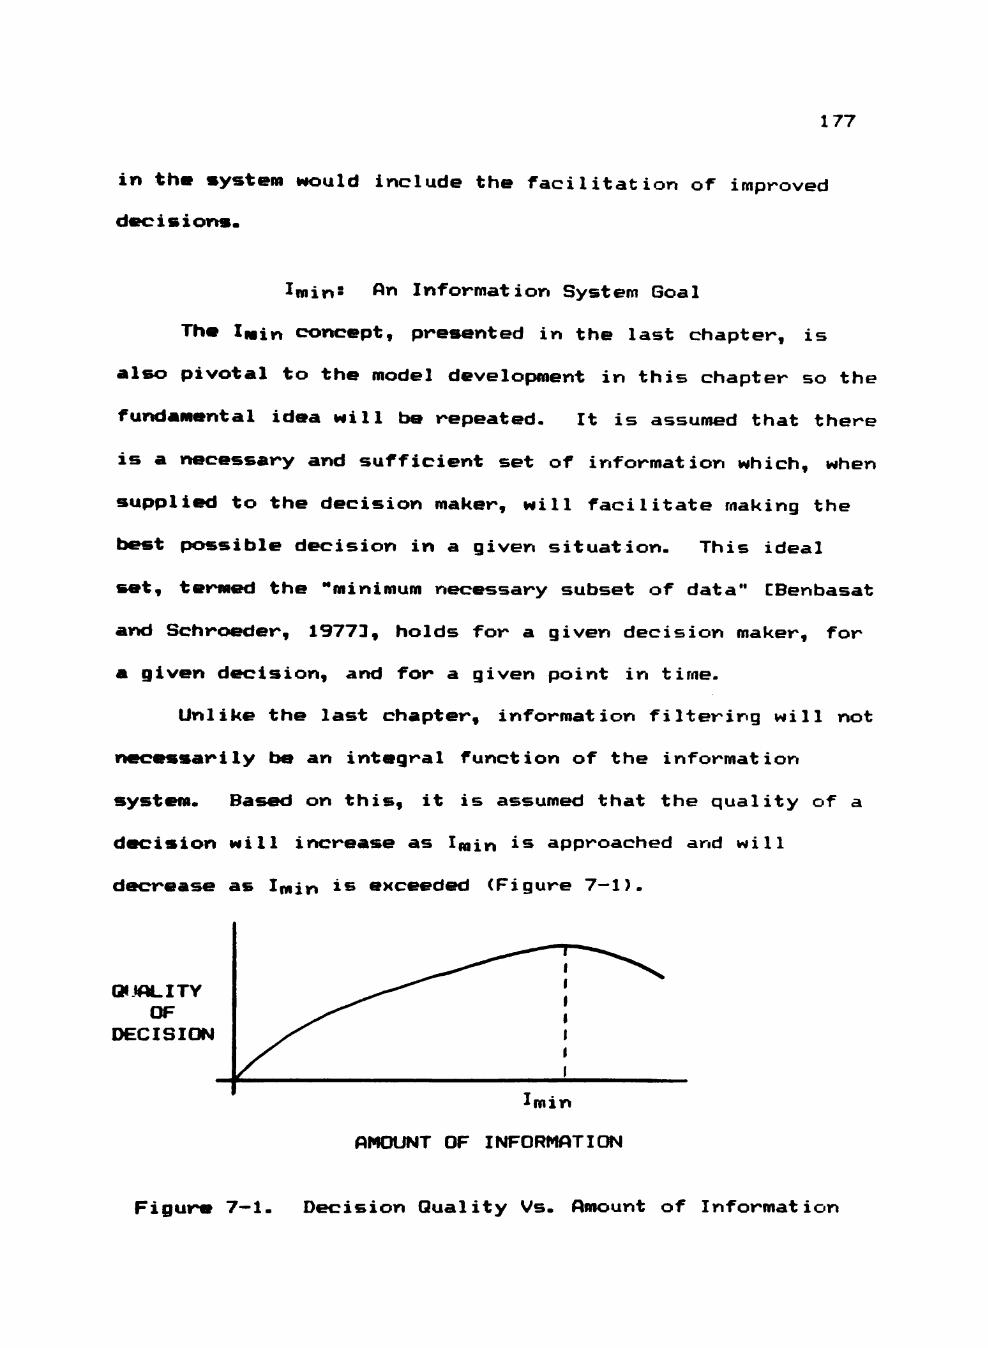
177
in the system would include the facilitation of improved
decisions.
Imin* fin Information System Goal
The Inin concept, presented in the last chapter, is
also pivotal to the model development in this chapter so the
fundamental idea will be repeated. It is assumed that there
is a necessary and sufficient set of information which, when
supplied to the decision maker, will facilitate making the
best possible decision in a given situation. This ideal
set, termed the "minimum necessary subset of data" CBenbasat
and Schroeder, 19773, holds for a given decision maker, for
a given decision, and for a given point in time.
Unlike the last chapter, information filtering will not
necessarily be an integral function of the information
system- Based on this, it is assumed that the quality of a
decision will increase as Imin is approached and will
decrease as I m m is exceeded (Figure 7—1).
QdJALITY OF
DECISION
AMOUNT OF INFORMATION
Figure 7—1- Decision Quality Vs- Amount of Information
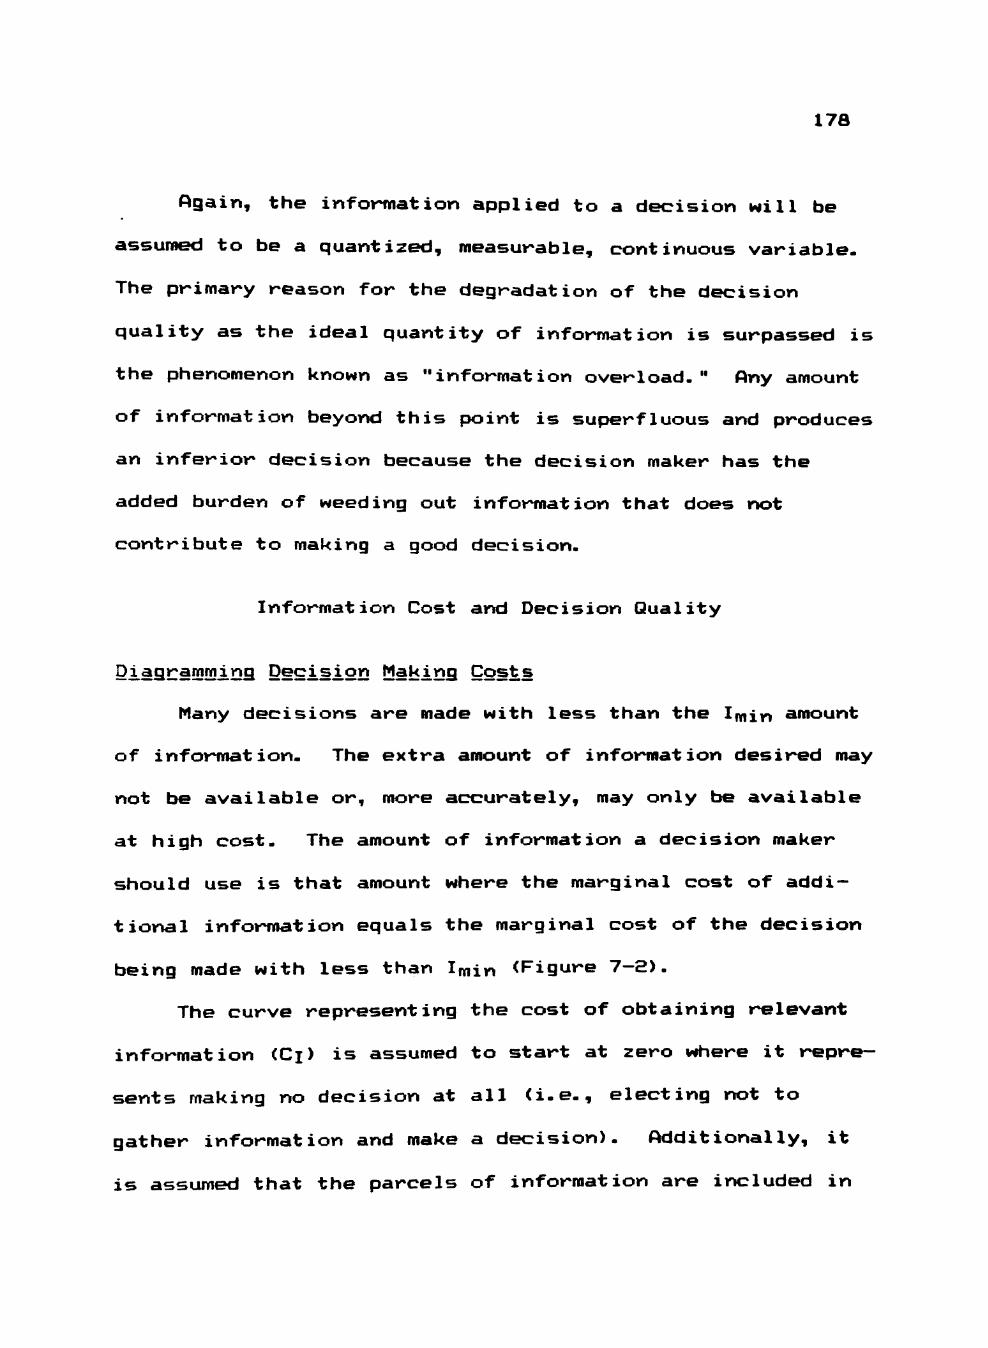
178
Again, the information applied to a decision will be
assumed to be a quantized, measurable, continuous variable-
The primary reason for the degradation of the decision
quality as the ideal quantity of information is surpassed is
the phenomenon known as "information overload." Any amount
of information beyond this point is superfluous and produces
an inferior decision because the decision maker has the
added burden of weeding out information that does not
contribute to making a good decision.
Information Cost and Decision Quality
Oiagramming Decision Making Cost.s
Many decisions are made with less than the Imin amount
of information- The extra amount of information desired may
not be available or, more accurately, may only be available
at high cost- The amount of information a decision maker
should use is that amount where the marginal cost of addi
tional information equals the marginal cost of the decision
being made with less than Imin (Figure 7-2).
The curve representing the cost of obtaining relevant
information (Cj) is assumed to start at zero where it repre
sents making no decision at all (i.e., electing not to
gather information and make a decision). Additionally, it
is assumed that the parcels of information are included in
179
COST
INFORMATION
y
ram
Increase in cost due to information overload
Figure 7-2- Cost/Benefit Relationship Between the Source of Information and the Quality of Decisions
the Ci curve in order of increasing cost- The cost of
obtaining the first pieces of information may be quite low
and will rise as the less easily obtained information is
sought- As the curve approaches Imin* the shape can vary
depending on the decision being made. It may have a finite
value, especially for well—structured problems- It may,
however, increase rapidly and become infinite if the infor
mation required is difficult or impossible to get.
180
The curve representing the cost of making less than a
perfect decision (Cr)) represents the opportunity cost
incurred as the quality of the decision changes. The cost
of making no decision (i.e., electing not to gather informa
tion and make a decision) may be known. In any case, the
cost, as the curve moves to the left, would not approach
infinity. It becomes zero at Imin where it becomes the
perfect decision- The cost curve would start to rise to the
right of Imin ^^^ to information overload.
The curve, TC, representing the total decision making
cost, is a sum of these two curves (Ci and C Q ) . The low
point of this curve indicates the preferred amount of infor
mation, from a cost standpoint. A decision maker seeking
this araount of information would be operating rationally and
would be making a good decision.
These curves were chosen to present the concepts- The
actual curves may vary f>' m these considerably. The follow
ing analyses will use the Figure 7-2, above, as starting
conditions.
The Effects of Lower Info»«raation Cost
One priraary justification for the installation of an
improved information system is to reduce the cost of provi
ding relevant information to the decision maker- The net
result of installing an "improved" information system will
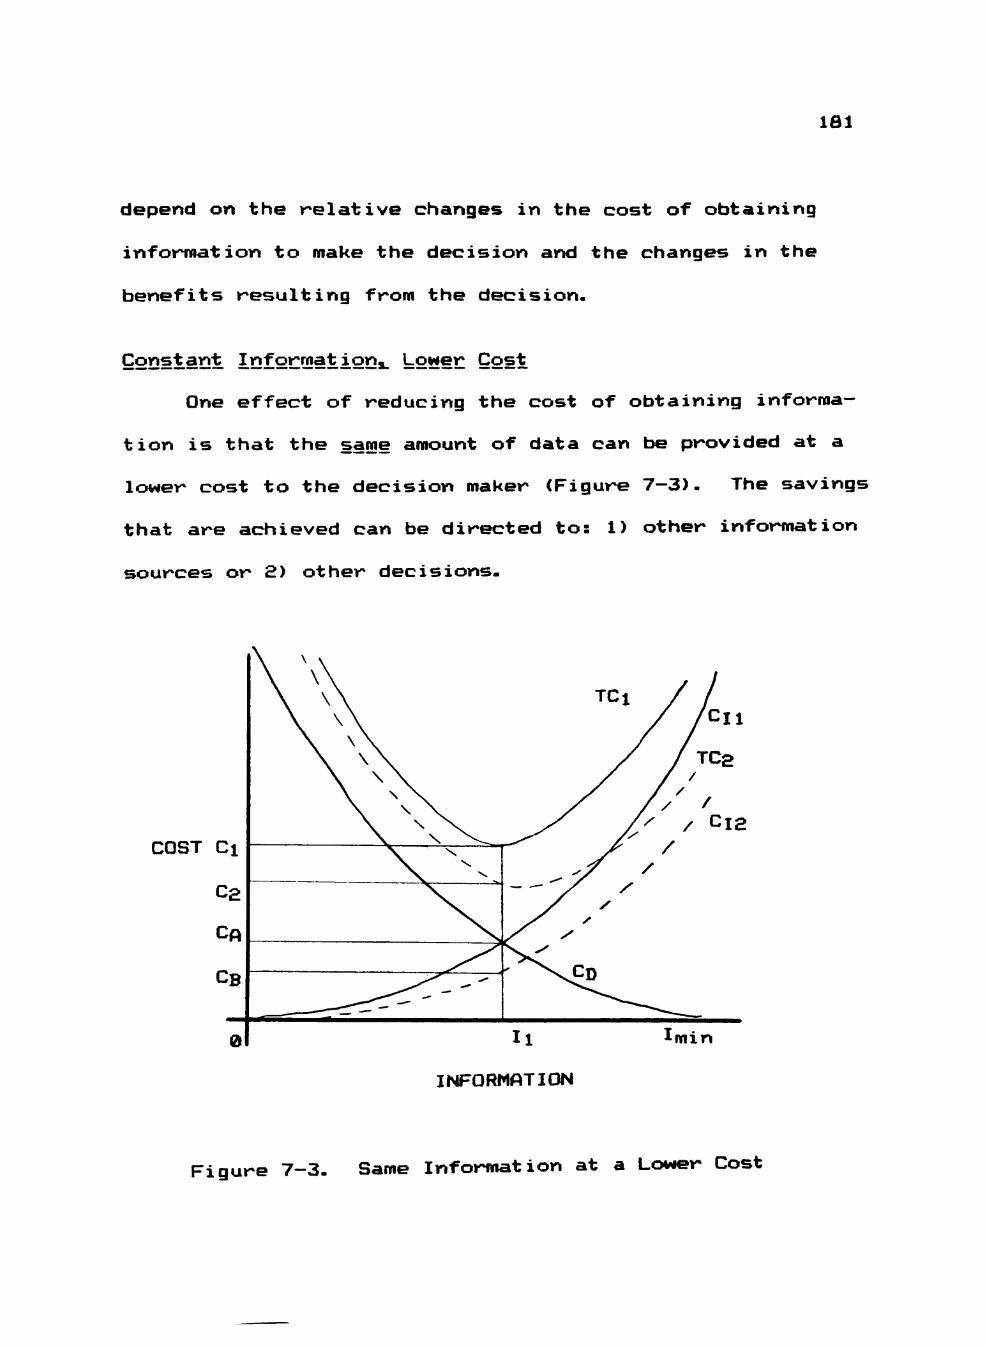
161
depend on the relative changes in the cost of obtaining
information to make the decision and the changes in the
benefits resulting from the decision-
Constant informatignj. Lower Cost
One effect of reducing the cost of obtaining informa
tion is that the same amount of data can be provided at a
lower cost to the decision maker (Figure 7—3)- The savings
that are achieved can be directed to: 1) other information
sources or 2) other decisions-
COST Ci
C2
CA
CB
0
\ ^ \
\ \ \ y / \ \ \ " 1 / /
\ \ \ / /Cll \ \ \ / /
\ \ \ X / '"2 \ ^ \ ^ ^ ^
\ ^ \
X %
x" ^^^^y^^ — ^
/ / / / y^ A / Ci2
/^ / y / /
y^ y yy •
y^ y \ ^ ^
' ^ \ C D
II Imin
INFORMATION
Figure 7-3- Same Information at a Lower Cost
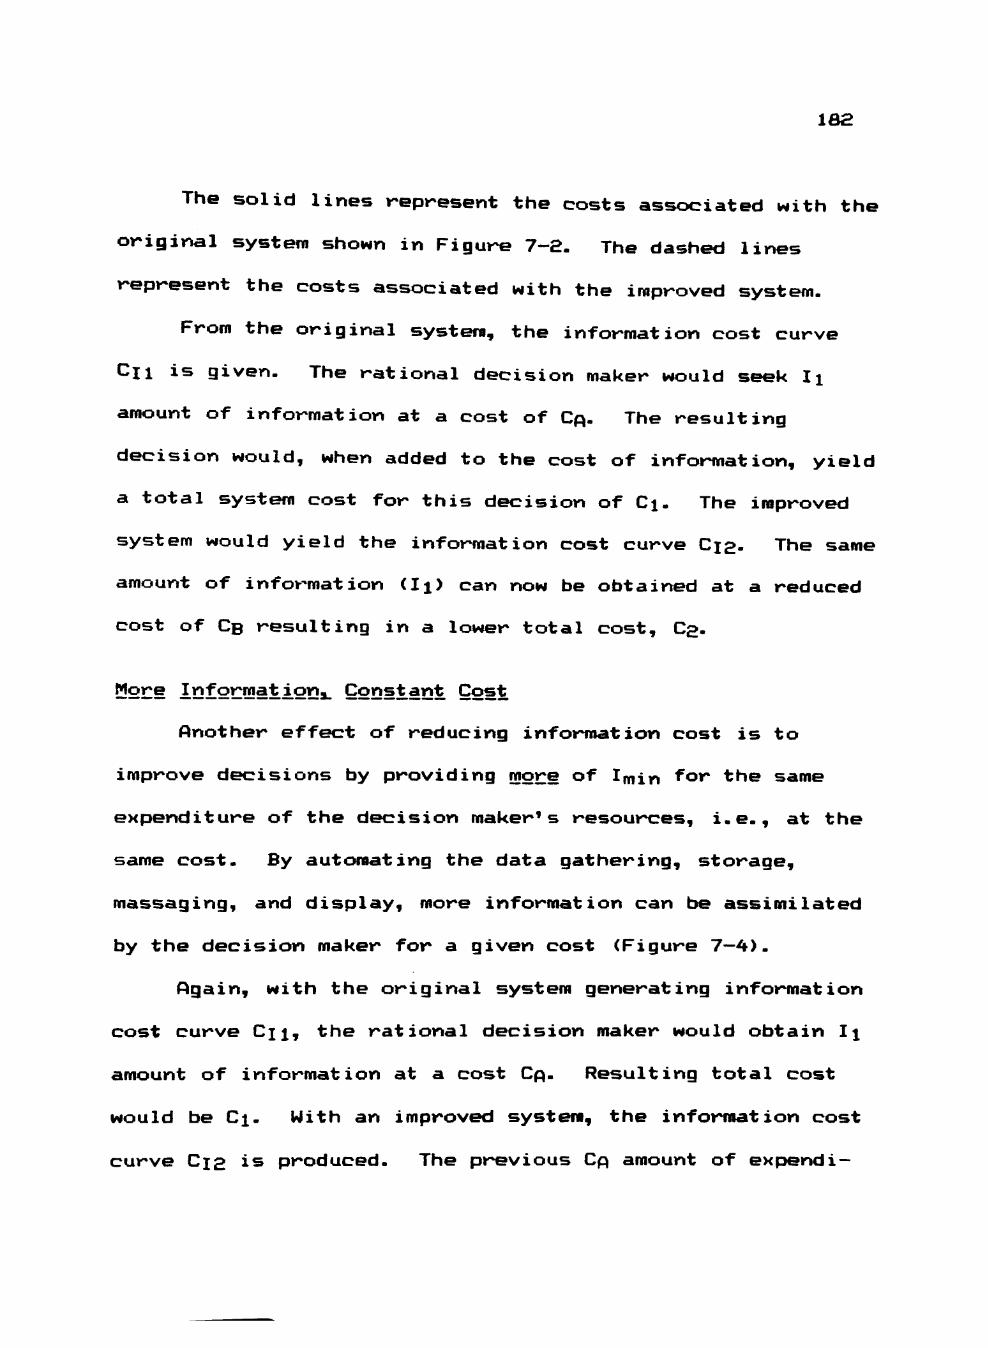
182
The solid lines represent the costs associated with the
original systera shown in Figure 7-2. The dashed lines
represent the costs associated with the iraproved system-
Frora the original systera, the inforraation cost curve
Cli is given- The rational decision maker would seek Ii
amount of inforraation at a cost of Cp- The resulting
decision would, when added to the cost of information, yield
a total systera cost for this decision of Ci- The improved
system would yield the inforraation cost curve C12- The same
amount of information (Ii) can now be obtained at a reduced
cost of C B resulting in a lower total cost, C2-
yeEe informational Const.ant Cost
Another effect of reducing inforraation cost is to
improve decisions by providing more of Imin ^or the same
expenditure of the decision maker's resources, i.e., at the
sarae cost. By automating the data gathering, storage,
massaging, and display, more information can be assimilated
by the decision maker for a given cost (Figure 7—4).
Again, with the original system generating information
cost curve Cji, the rational decision maker would obtain Ix
amount of information at a cost Cp- Resulting total cost
would be Ci- With an improved system, the information cost
curve C12 is produced. The previous Cp amount of expendi—
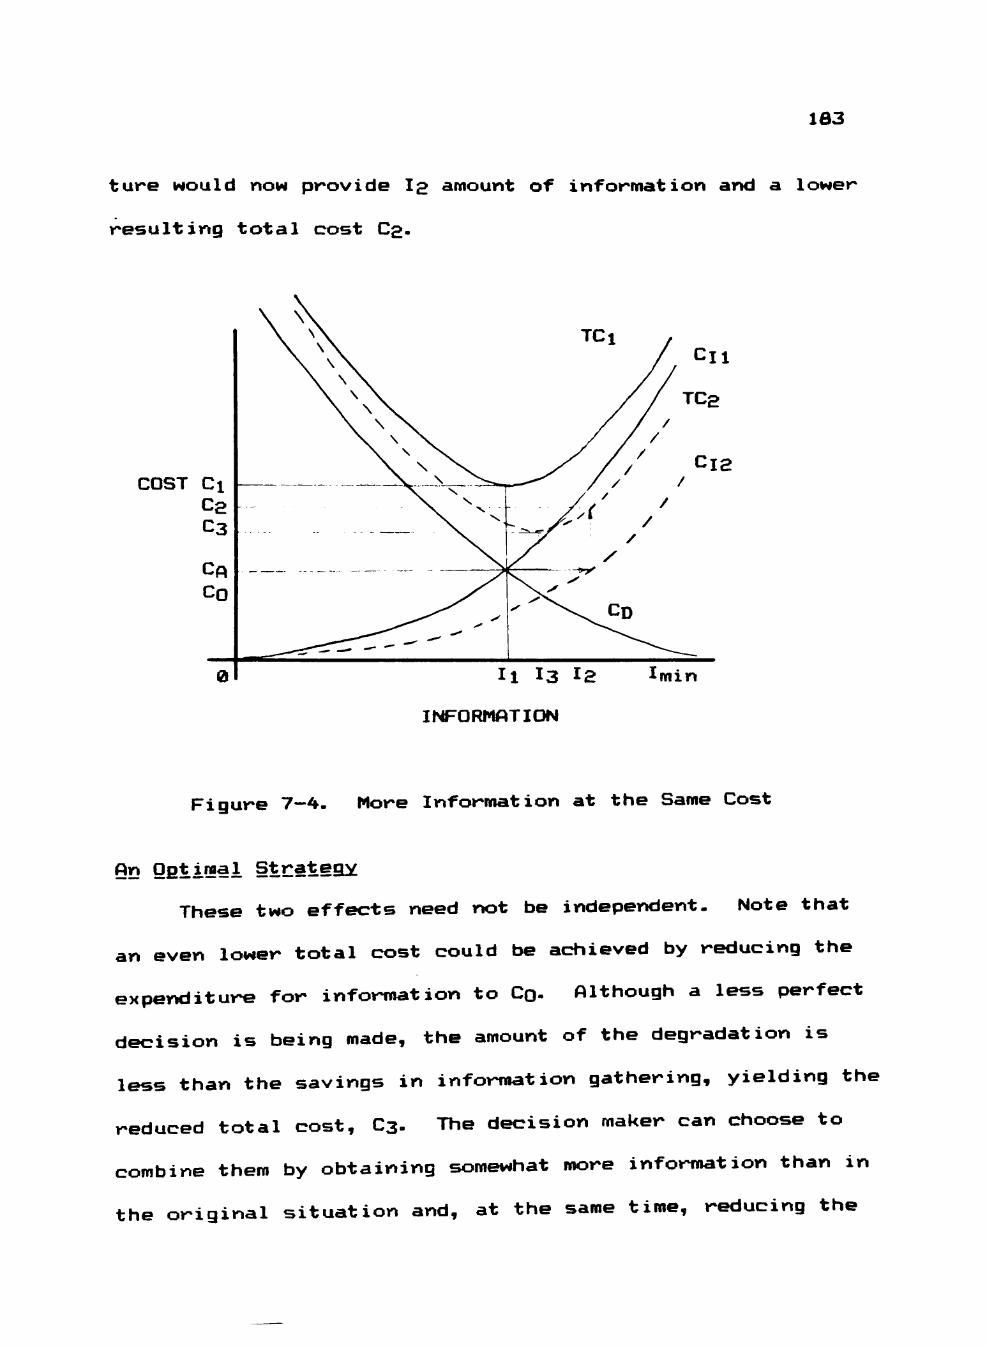
163
ture would now provide I2 amount of information and a lower
resulting total cost C2-
II I3 I2 • m m
IhFORMATION
Figure 7—4. More Information at the Same Cost
6n Qetiraal Strategy
These two effects need not be independent. Note that
an even lower total cost could be achieved by reducing the
expenditure for information to CQ. Although a less perfect
decision is being made, the amount of the degradation is
less than the savings in information gathering, yielding the
reduced total cost, C3- The decision maker can choose to
combine them by obtaining somewhat more inforraation than in
the original situation and, at the same time, reducing the
164
acquisition costs to some degree resulting in a lower total
cost.
To prove this intev^esting yet somewhat counter
intuitive assertion, again look at Figure 7-4. This graph
represents two systems. The first is a given systera that
acts as the starting point for this analysis. The second
systera represents an improvement over the first system-
Therefore, we are given two information cost curves C n and
Cl2 with
Cl2 < C n
for a given I. This is to say that curve C12 is based on a
lower cost information system than curve C n -
We are also given two total cost curves TCi and TC2.
The former is the sum of the decision cost curve C D and the
original information cost curve C n , while the latter is the
sum of the decision cost curve C Q and the lower inforraation
cost curve C12 . Due to the unimodal concavity of TCi and
TC29 there is a unique miniraura associated with each curve.
For TCi, that miniraura occurs at Ij and the associated infor
mation cost is Cp- For TC2 that miniraura occurs at I3 and
the associated information cost is CQ. In general
Co ( Cp
for all curves such that
C12 ^ Cii over the interval -C0, oo>.
165
Let Zii C D ( I I , l2> represent the change in decision
performance cost over the information interval Ii to I2-
Let Z\Ci(Ii,l2) represent the change in information cost
over the interval Ii to I2- Assume
-ef i CDdj, I2) < ^i:^Ci(Ij, I2) for some Ij = l2-e-
Given a budget Cp is available for inforraation acquisi
tion. Would it be expedient to continue spending Cp units
for inforraation under the new inforraation systera? According
to the figure, the response is no. Likewise, it is also not
best to reduce the expenditure for information by the full
amount of the savings achieved by the cost reduction from Ii
to I2- The optimal inforraation point under the new curve is
I3 and the associated information cost is CQ. To spend Cp
units results in a higher total cost on the TC2 curve
because Z^ C o d j , l2> < Z^Cidj, l2)- These concepts are now
stated in two theoreras.
Theorera 1
Given an optimal inforraation budget Cp corresponding to
total cost curve TCi and a regional operating characteristic
. ^ C D < I I » I 2 > < -«^Ci(Ii, l2> in which Ii is the amount of
information obtainable frora an expenditure of Cp using the
original systera and I2 is the inforraation obtainable for the
same expenditure under the new, low-cost information system
whose cost curve is C12- Then, the the optimal amount of
186
information is not Ii or I2 but I3 in which
II < I3 < l2
and the associated cost expenditure is C Q in which
C Q ( Cp.
Proof
The proof is a consequence of the regional operating
characteristics of the two curves C D and Ci2i namely the
requirement that
^:>>.CD(IJ, l2) < -^Ci2(Ij, I2).
Since, on this interval the change in C D is less than the
change in Ci2» the marginal cost of the additional informa
tion outweighs the improvement obtained in decision per
formance. Hence I2 is not the optimal operating point for
the new cost curve. The optimal amount of inforraation I3
raust occur at sorae point in which
I3 < 12-
Similarly, it must be true that
13 > li
as was to be shown.
Theorera 2
Given that T C d ) = CDd)-K:i<I> at the optiraal total
cost TC*(I*),
dCD _ —dCj
dl 57
187
that is, the differential change in C D is equal to the
negative of the differential change in Cj.
Proof
TC*(I*) denotes the minimal value of TC* over all non-
negative values of I. By differential calculus, this occurs
at the point where
dTC = 0
dl
But
Hence
dTC ^ dCp ^ dCj^ 0
dl dl dl
dCjy —""dCj dl dl
as was to be shown.
[email protected] the Assumptions
As mentioned at the beginning of this chapter, the
curves used for each analysis were chosen to develop the
concepts just presented. Not all cost functions will exhi
bit the shape used in the analyses above. Relaxing the
assumption that decision—making information be repre
sented as a continuous variable is the first change that
will be discussed. Discontinuous functions are represented
by curves which have sudden increases or decreases; they
have steps. Three situations which exhibit discontinuous
cost of information (Cj) curves will be examined.
188
Stepped Cost Functions
The first situation to be considered is one in which
information comes in "bundles" at a fixed, non-divisible
cost- An example is the running of a siraple statistical
package on some set of available data. The cost is derived
frora the setup and run tirae and is fairly constant over a
broad range of data set sizes. The resulting information
bundle includes, not only the mean of the data values, but
also the median, mode, standard deviation, and perhaps some
other statistics generated by the package.
The Ic curve for bundled information is characterized
by a flat horizontal segment with little or no slope. This
is because once the first parcel of the bundle is obtained,
the rest come for free or for little additional cost. Just
before the horizontal segraent there may be a vertical
segraent which represents the cost of obtaining the bundle.
In the left—hand diagrara in Figure 7—5, X araount was expen
ded to obtain the bundle yielding A amount of information-
The right-hand diagrara presents the case where B amount of
information was obtained for a vanishingly small increase
over the previous inforraation parcel. They represent the
sarae concept, only the size of X is different-
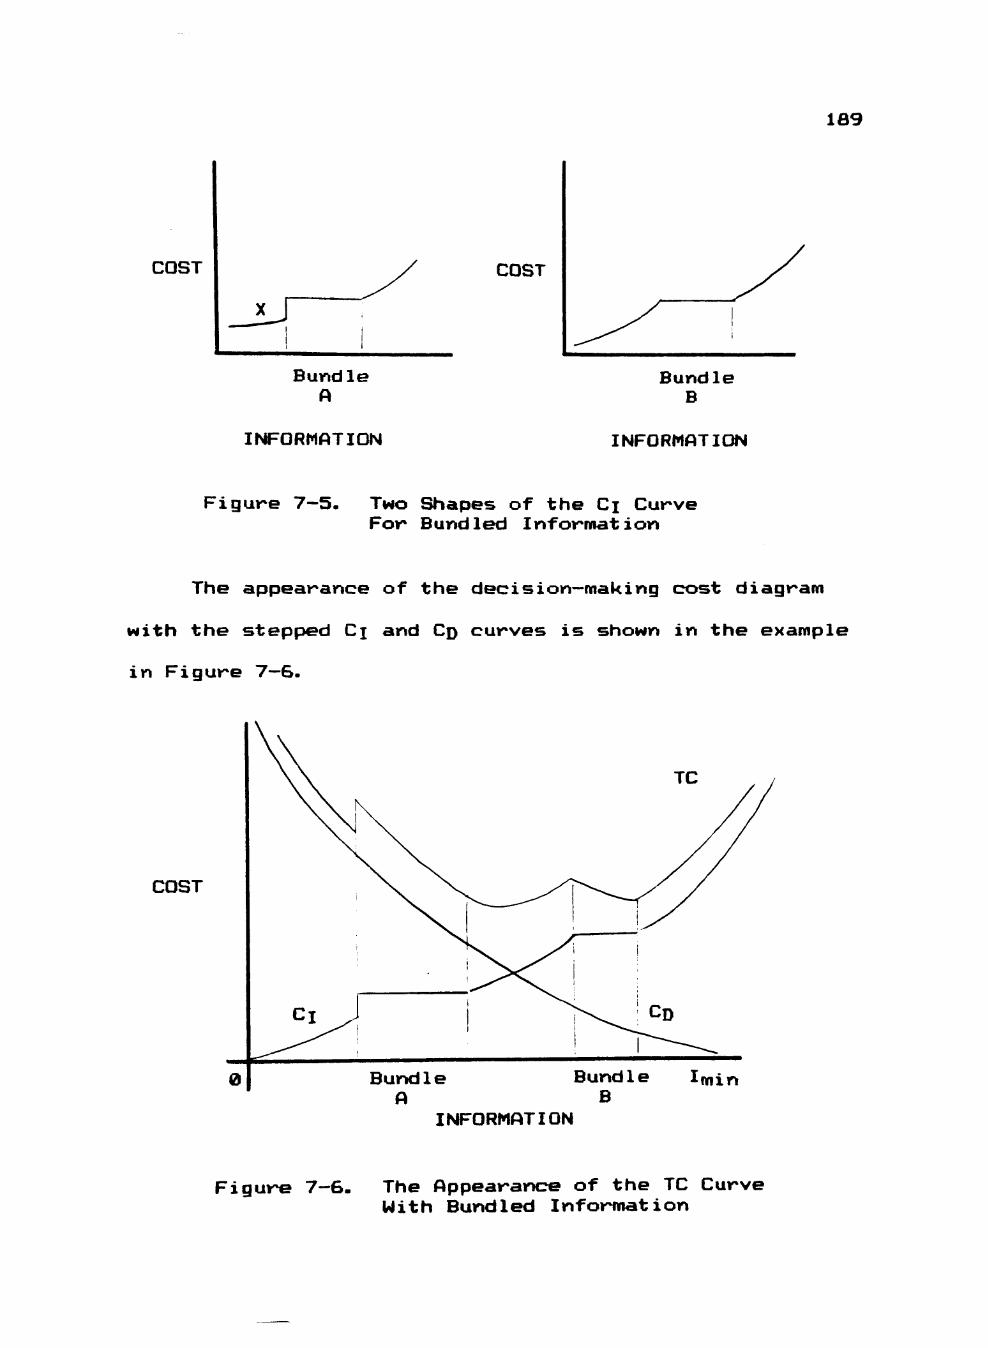
189
COST COST
Bundle A
Bundle B
INFORMATION INFORMATION
Figure 7-5- Two Shapes of the Cj Curve For Bundled Inforraation
The appearance of the decision—making cost diagram
with the stepF>ed Cj and C D curves is shown in the example
in Figure 7—6.
COST
0 Bundle Bundle A B
INFORMATION
m m
Figure 7—6. The Appearance of the TC Curve With Bundled Information
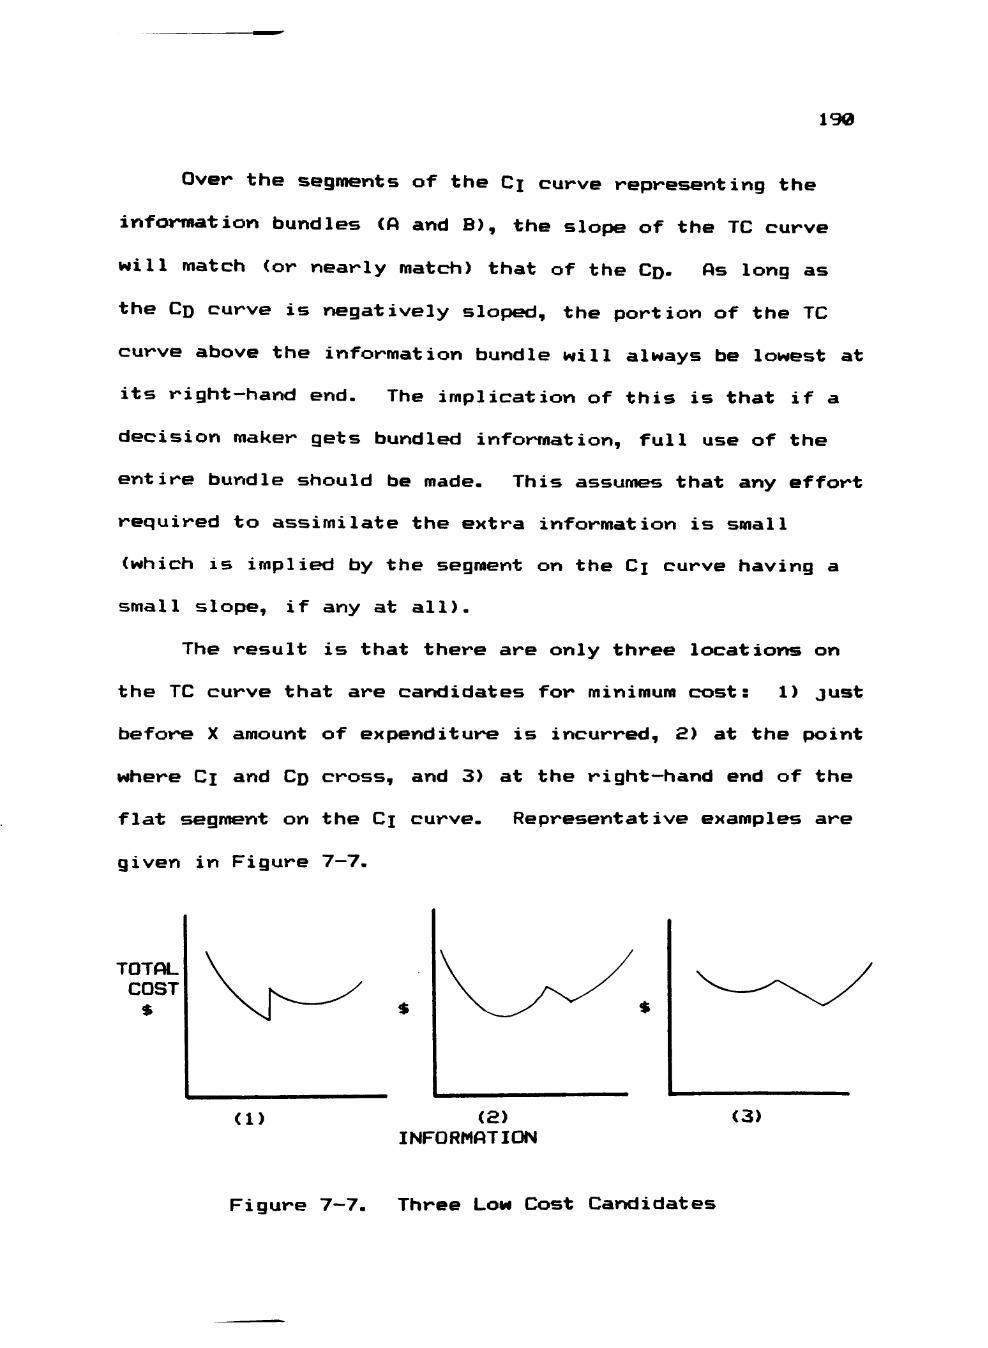
190
Over the segments of the Cj curve representing the
information bundles (A and B), the slope of the TC curve
w ill match (or nearly match) that of the CD- AS long as
the C D curve is negatively sloped, the portion of the TC
curve above the information bundle will always be lowest at
its right-hand end. The implication of this is that if a
decision maker gets bundled inforraation, full use of the
entire bundle should be made. This assumes that any effort
required to assimilate the extra inforraation is small
(which is implied by the segment on the Cj curve having a
small slope, if any at all).
The result is that there are only three locations on
the TC curve that are candidates for miniraura cost: 1) just
before X araount of expenditure is incurred, 2) at the point
where Cj and C D cross, and 3) at the right—hand end of the
flat segraent on the Cj curve. Representative exaraples are
given in Figure 7—7.
TOTAL COST
(1) (2) INFORMATION
(3)
Figure 7-7- Three Low Cost Candidates
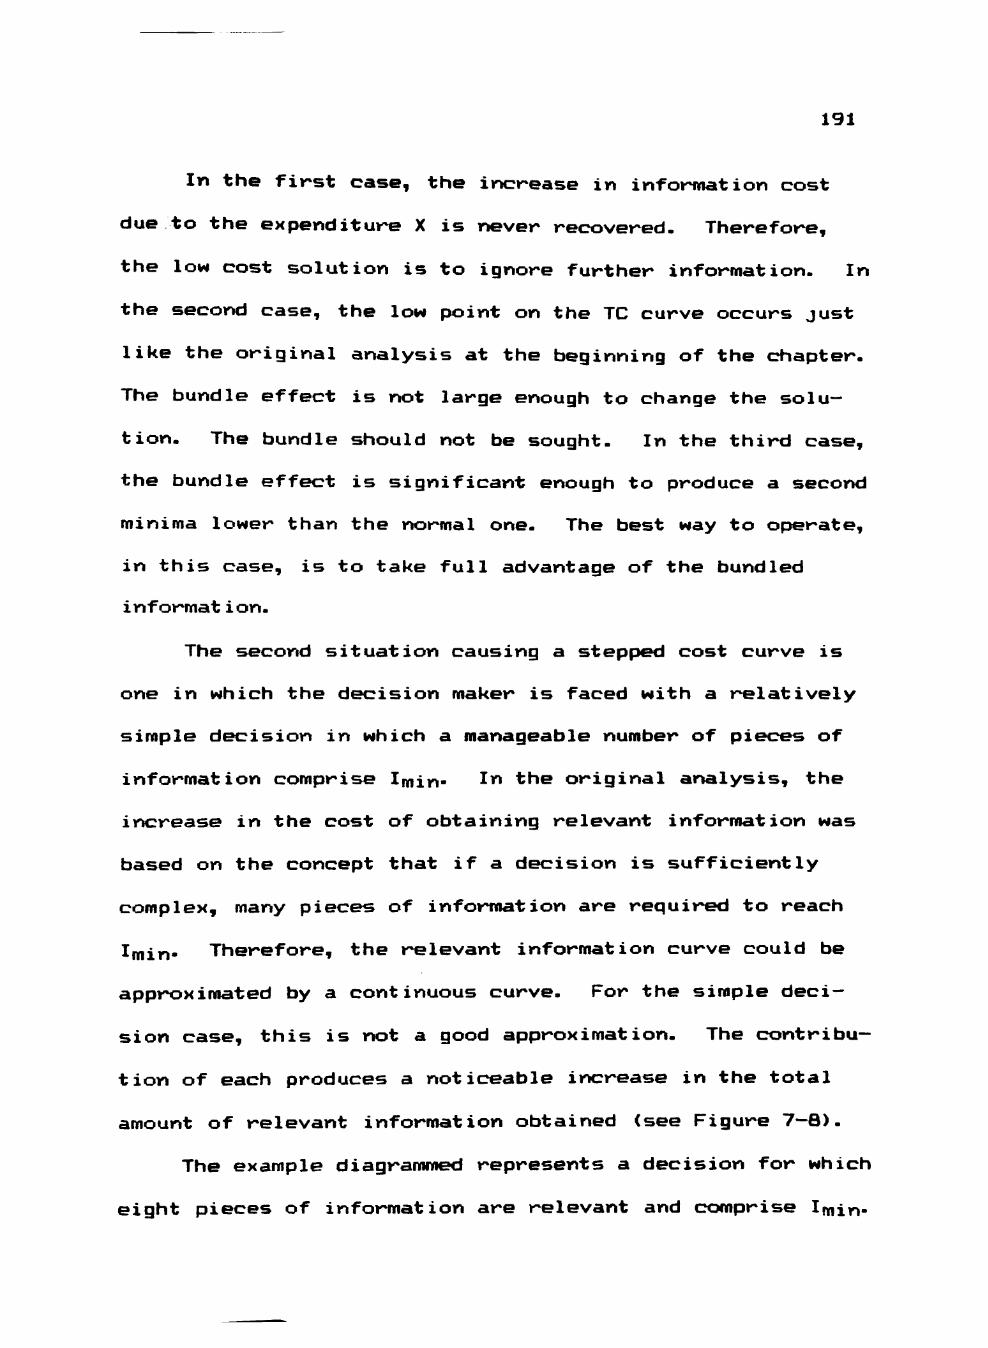
191
In the first case, the increase in information cost
due to the expenditure X is ney/er recovered. Therefore,
the low cost solution is to ignore further information. In
the second case, the low pxDint on the TC curve occurs just
like the original analysis at the beginning of the chapter-
The bundle effect is not large enough to change the solu
tion. The bundle should not be sought. In the third case,
the bundle effect is significant enough to produce a second
minima lower than the normal one- The best way to operate,
in this case, is to take full advantage of the bundled
informat ion.
The second situation causing a steppied cost curve is
one in which the decision maker is faced with a relatively
siraple decision in which a manageable number of piecres of
information comprise Imin- In the original analysis, the
increase in the cost of obtaining relevant inforraation was
based on the concept that if a decision is sufficiently
coraplex, many pieces of information are required to reach
Imin- Therefore, the relevant information curve could be
approximated by a continuous curve. For the siraple deci
sion case, this is not a good approximation. The contribu
tion of each produces a noticeable increase in the total
amount of relevant information obtained (see Figure 7-8).
The exaraple diagrammed represents a decision for which
eight pieces of information are relevant and comprise Imin-
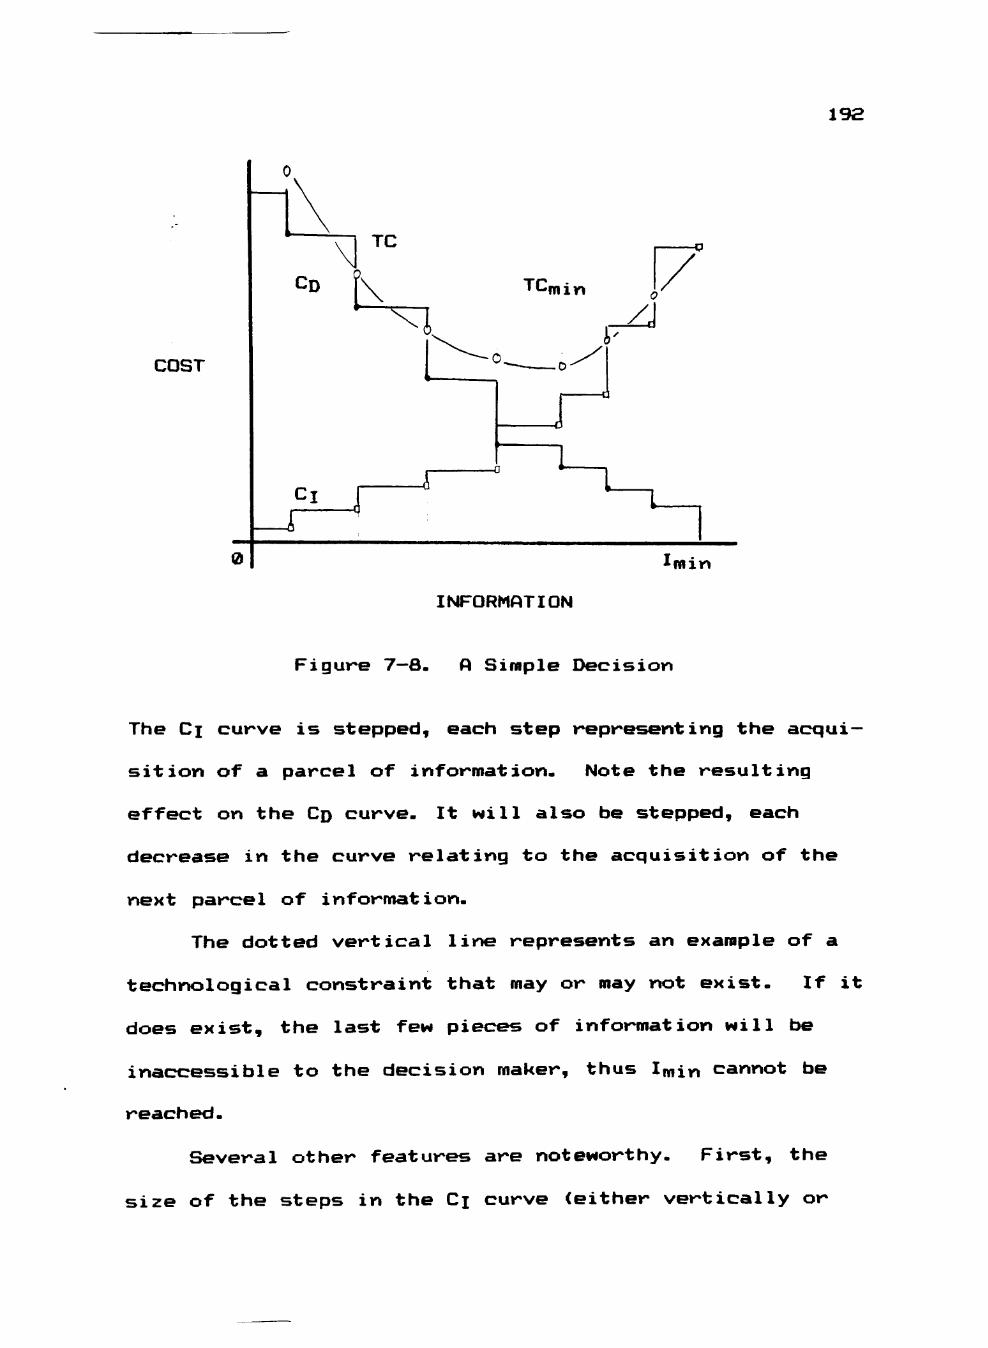
COST
CD
Cl
TC
tx • ^ ^
TC mm /I
192
0 ^ram
INFORMATION
Figure 7—8. A Siraple Decision
The CI curve is stepped, each step representing the acqui
sition of a parcel of inforraation. Note the resulting
effect on the C D curve- It will also be stepped, each
decrease in the curve relating to the acquisition of the
next parcel of information.
The dotted vertical line represents an exaraple of a
technological constraint that may or may not exist. If it
does exist, the last few pieces of information will be
inaccessible to the decision maker, thus Imin cannot be
reached-
Several other features are noteworthy- First, the
size o f the steps in the Ci curve (either vertically or
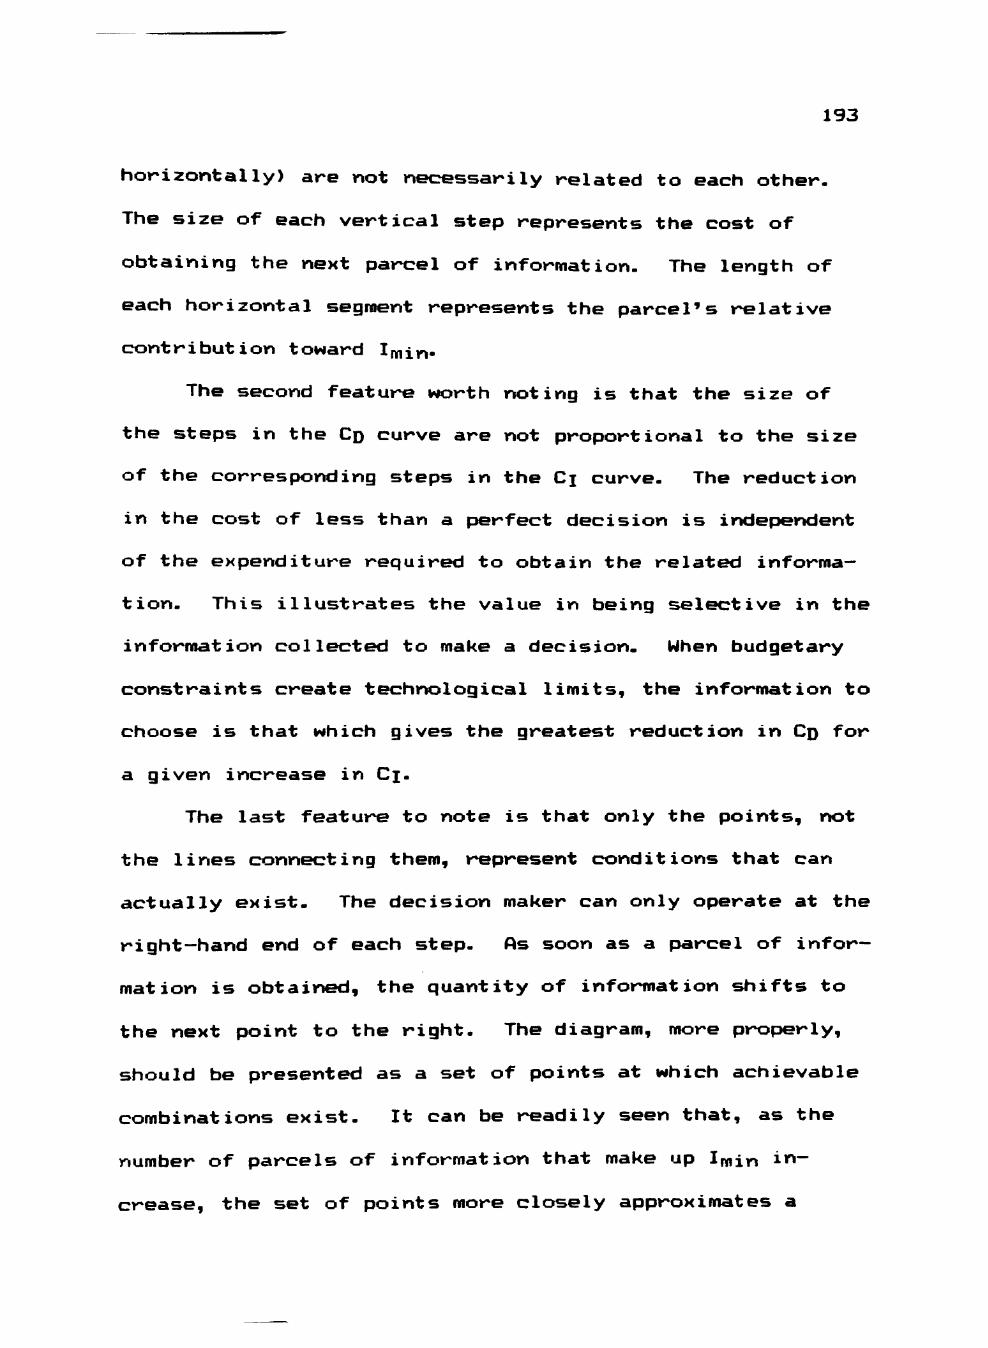
193
horizontally) are not necessarily related to each other-
The size of each vertical step represents the cost of
obtaining the next parcel of information- The length of
each horizontal segment represents the parcel's relative
contribution toward Imin-
The second feature worth noting is that the size of
the steps in the C D curve are not proportional to the size
of the corresponding steps in the Cj curve- The reduction
in the cost of less than a perfect decision is indepiendent
of the expenditure required to obtain the related informa
tion- This illustrates the value in being selective in the
inforraation collected to make a decision- When budgetary
constraints create technological limits, the information to
choose is that which gives the greatest reduction in C D for
a given increase in Ci-
The last feature to note is that only the points, not
the lines connecting them, represent conditions that can
actually exist- The decision maker can only operate at the
right—hand end of each step. As soon as a piarcel of infor
raation is obtained, the quantity of inforraation shifts to
the next point to the right. The diagram, raore properly,
should be presented as a set of points at which achievable
combinations exist. It can be readily seen that, as the
number of parcels of information that make up Imin in
crease, the set of points more closely approximates a
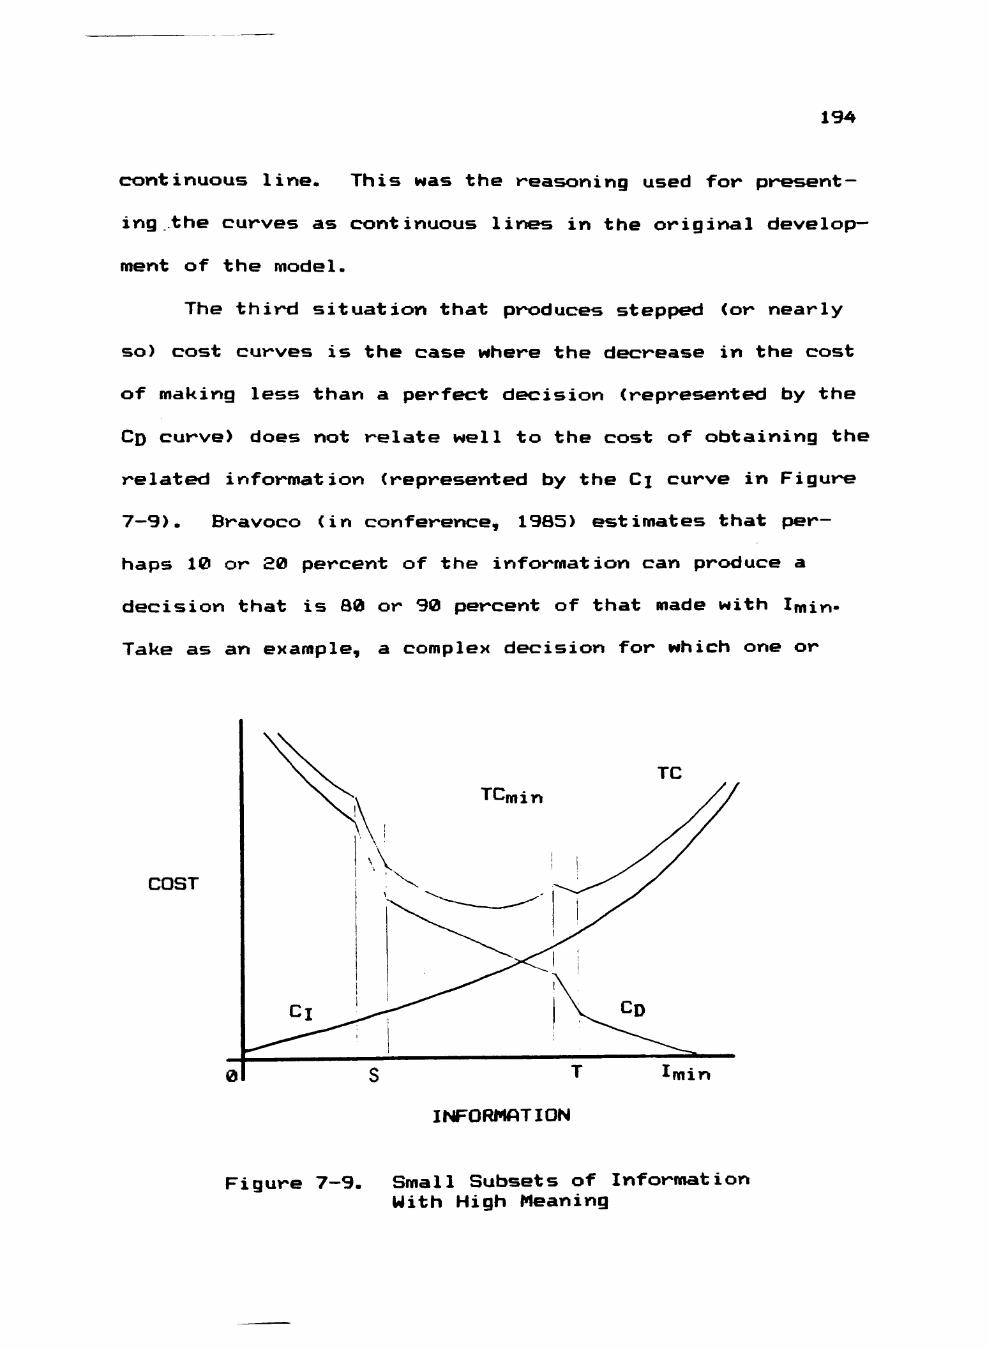
194
continuous line. This was the reasoning used for present
ing ..the curves as continuous lines in the original develop
ment of the model.
The third situation that produces stepped (or nearly
so) cost curves is the case where the decrease in the cost
of making less than a perfect decision (represented by the
C D curve) does not relate well to the cost of obtaining the
related inforraation (represented by the Cj curve in Figure
7-9). Bravoco (in conference, 1985) estimates that per
haps 10 or 20 percent of the inforraation can produce a
decision that is 80 or 90 percent of that made with Imin-
Take as an exaraple, a complex decision for which one or
COST
m m
INFORMATION
Figure 7-9. Small Subsets of Information With High Meaning
195
more small subsets of Imin are highly meaningful to the
decision maker. Such subsets are diagramraed as S and T in
Figure 7—9.
The iraplication of this situation is that the decision
maker should search for the indicators (S and T in the
diagram) that are the best predictors- If the decision
maker is aware of what information is important and has a
source for it, it may be efficient to eschew other, perhaps
less-costly, information. Nevertheless, if improved CAC
technology sufficiently reduces the cost of gathering this
less—productive information, it may become prudent to
include it in the decision—making process.
Information Sequencing
The stepped cost curve diagrammed above brings up
another assumption in the original analysis. The Cj curve
rises monotonically to the right which implies that the
lowest cost information will be sought out and obtained
first. This presupposes that the decision maker is aware
that all of these low—cost sources exist and that they will
be incorporated into the decision. This may, clearly, not
always be the case. The sequence in which the various
parc^els of information are obtained may be based, in part,
on cost but is also based on availability and decision
maker preference. Good system design increases the avalla—
«^
196
bility of information and reduces the effort required to
assimilate it so that a greater portion of Ifflin will be
preferred by the decision maker.
Representing System Improvement
It is important to point out that all of the situa
tions diagrararaed above represent inforraation systems of a
fixed size. In none of the cases, does the demand for
inforraation cause an increase in the capabilities of the
system. If the demand exceeds the technological limits, it
is siraply not raet.
To represent the installation of iraproved capacity,
alternate Cj curves must be added to the diagrams such as
was done in the original analysis at the beginning of the
chapter. Such improvements have the effect of extending
the inforraation available to the decision maker toward
Imin- The improvements may also have (but not necessarily
so) the effect of lowering the acquisition cost for infor
mation already accessible by the decision maker through the
existing systera.
Offset Optiraality
Another assumption in the original analysis was that
the low point of the TC curve would occur at the point
where the two cost curves (Ci and Cp) crossed. If, how-
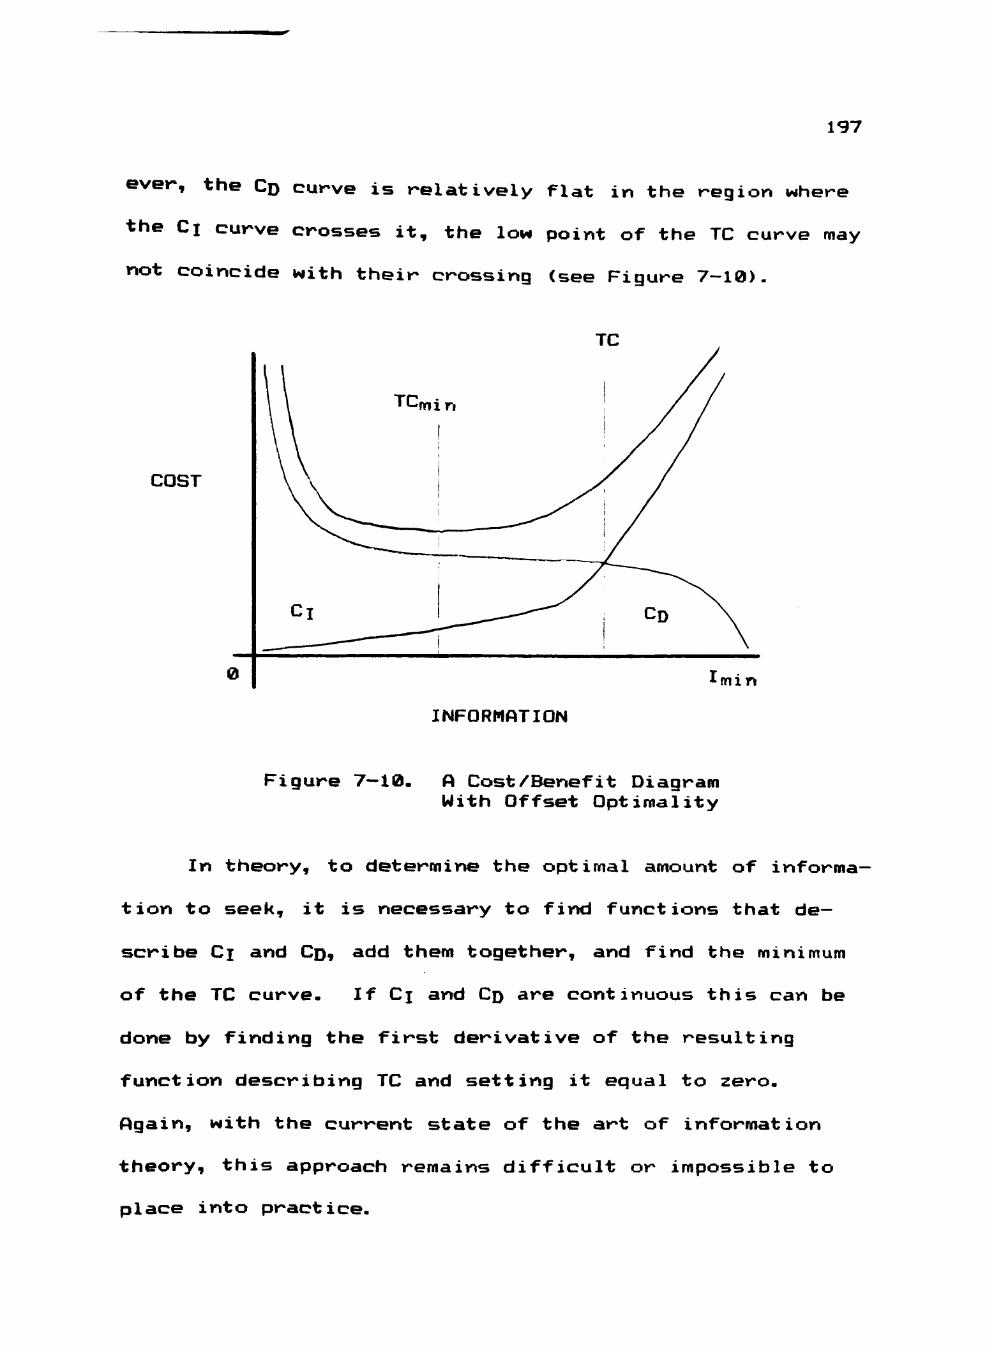
197
ever, the C D curve is relatively flat in the region where
the Ci curve crosses it, the low point of the TC curve may
not coincide with their crossing (see Figure 7-10).
COST
0 min
INFORMATION
Figure 7—10- A Cost/Benefit Diagram With Offset Optiraality
In theory, to determine the optimal amount of informa
tion to seek, it is necessary to find functions that de
scribe C I and CD* add them together, and find the minimum
of the TC curve- If Ci and C D are continuous this can be
done by finding the first derivative of the resulting
function describing TC and setting it equal to zero-
Again, with the current state of the art of information
theory, this approach remains difficult or impossible to
place into practice.
198
8 Recap
This chapter has presented the development of a model
that theoretically describes the optiraum amount of informa
tion to seek when making decisions with a given information
systera. The principal components of the model are the cost
of obtaining and integrating the information sources and
the cost to the organization of not getting all relevant
information. These were combined to yield a total
decision—making cost-
The model was the used to analyze the situation in
which the installation of an improved information system
reduces the cost of obtaining relevant information. A
proof was tendered that suggests an optimal strategy to
employ when such a systera is irapleraented. Finally, some of
the original assumptions were relaxed and several scenarios
were represented by the model.
The last chapter summarizes the contributions of this
research, presents its limitations, and lists some sugges
tions for further research-
CHAPTER VIII
CONTRIBUTIONS, LIMITATIONS, AND FURTHER RESEARCH
Qblectives of the Research
The overall goal of this research was to provide a
model that reflects the significant changes that CAC
technology has introduced into the information system
environment; one that is capable of a qualitative analysis
of an organization's decision-making information sources
and cost. As a means to this end, a framework (presented
in Chapter Five) was designed to provide a foundation for
the development of the conceptual model. This framework
combined models from the information system and communica
tion literature yielding a three-path representation of
decision-making information. In this representation, all
information is obtained either from previous experience or
through current formal and informal communication sources.
Two specific objectives were to be met. The first was
to use the basic communication framework to develop a
conceptual model that divides decision-making information
into a formal/informal (F/I) dichotomy. Two sub-objectives
were: 1) to use the F/I model to represent the effects on
the amount and type of information available to the
decision maker caused by changes made to the information
199
200
system that is designed to support decisions, and 2) to
use the F/I model to show how changes in the information
system may affect communication and, therefore, decision
quality. These objectives were the topic of Chapter Six.
The second objective was to develop an analysis of
decision-making cost based on the F/I model. This analysis
described the effects on the total relevant decision
making cost when the installation of improved CAC
technology reduces the cost of providing information to the
decision maker. The components of cost included the
cost of the information used to make the decision and the
cost of making less than a "perfect" decision. This
objective was the topic of Chapter Seven.
Contributions of the Research
This research has provided a contribution for both the
theorist and practitioner. The theorist is provided with a
model that offers a new way of thinking about the relation
ship between the sources of information and good decision
making. The practitioner is provided with a tool for
gauging the potential improvement in decision quality that
can be expected from installing improved CAC technology.
This research has synthesized models from three fields
information systems, communication, and decision making.
The resulting formal/informal (F/I) communication model
201
becomes a potential tool for the analysis of the effect of
formalizing information sources on the quality of a deci
sion. The F/I model provides a way of looking at the issue
concerning the potential effects of the new computer
assisted communication (CAC) technology. Some proponents
say that CAC application is just what is needed and that
great benefits should be expected. Others express concern
that its application may produce adverse effects. This
model provides a viewpoint that can support aspects of both
sides and explain the apparent conflict.
The model suggests that a range of results can be
expected from the application of CAC technology, spanning
from significant improvement to clear-cut failure. The key
variables to predicting success are the current way an
organization supplies decision-making information and the
type of decision-making environment in which it resides.
A set of propositions was offered that suggest the
formal/informal mix to expect based on various conditions
of the decision-making environment. The conditions consi
dered were defined by the method in which information is
communicated based on the classification of decisions made.
Decision classifications included level, complexity, rou-
tineness, and amount of structure. These provide the prac
titioner with a method of estimating the potential improve-
202
ments and possible detriments to organizational communica
tion that can be expected when a change is made to the
organization's information system. It points to situations
in which the informal communication links may be damaged so
that supplemental sources can be established to maintain
this vital information. Thus, it serves as a guide to the
systems analyst when considering the acquisition or upgrade
of a CAC system.
The specific contribution of the second model, presen
ted in Chapter Seven, is the development of a theoretical
optimum operating strategy to employ when the installation
of improved CAC technology causes a decrease in the cost of
obtaining decision-making information.
This cost model bases total cost on two fundamental
components: 1) the cost of obtaining relevant decision
making information, and 2) the cost to the organization of
making less than a "perfect" decision. Although the basic
model was developed under the assumption that the cost
curves are continuous, it was later shown how stepped cost
functions are represented.
These two descriptive models provide a contribution by
offering a new way of thinking about the relationships
between CAC technology and the quality of decisions made
using that technology. The models are qualitative in
203
nature, yet allow an analysis of the effects of CAC on the
decision-making process.
tilDiting Assumptions
When developing a model of complex subjects, it is
necessary to extract from all factors a relevant subset
upon which the model will be based. Although the impor
tance of some factors is recognized, it may not be possible
to manipulate them or to fully express them in the model
because of methodological or conceptual constraints.
It is therefore necessary to make assumptions regarding
some of the factors. This action limits the applicability
of the model to those real-world cases for which the assump
tions reasonably hold. For those cases the model is valid.
If the assumptions excessively violate a given situation,
the model should not be used for that case. The following
assumptions were made which may limit the applicability of
the model.
It was assumed that it is theoretically possible to
measure information on at least an ordinal scale. Although
information theory has not yet developed a means of ade
quately quantifying information, it is necessary to be able
to talk about "more" or "less" information and to be able to
conceptually "add" information together. Until measuring
204
techniques are developed further, this assumption will have
to suffice.
It was assumed that decision makers are rational beings
in that they try to maximize benefit relative to cost.
Therefore, this research takes a "rational man" approach to
decision making following Vlek C1979]. Obviously, when the
results of these models are applied to a real-world situa
tion, consideration must be given to the behavioral aspects
of the decision maker that may affect the results.
It was assumed that it is theoretically possible to
ke a "perfect" decision (although in practice there may be
umental obstacles to achieving such a decision). This
assumption provided an idealized goal for the decision maker
and, therefore, for the system.
If the assumption above is to be considered valid, we
are required to assume that a theoretical amount of
information exists which is necessary and sufficient to
make a perfect decision. This amount of information was
referred to as Ijnjjj
Complete knowledge of the nature and content of IjuiQ is
not critical. It may be well known for a simple decision
and poorly known for a complex one. There is no requirement
that this amount of information ever be obtained in prac
tice; it simply represents a goal.
ma
mom
205
The development of the cost/benefit model assumed that
the lowest cost information would be considered first.
Since the cost represents not only the cash outlay to
obtain the information but also the decision maker's
expenditure of time and effort, this assumption makes a
reasonable first approximation. However, with additional
analysis other orderings may yield reduced total cost.
Finally, although the decision maker operates within a
network of communication, only one decision maker was consi
dered, ignoring the communication link sequences that may
affect the information that is received.
Ey3Cther Research
A primary candidate for further research is the exten
sion of this model to include communication network effects.
The decision maker does not operate independently of others
within and without the organization. Structural changes in
both formal and informal communication networks would be of
interest. This would make the model applicable to group
decision-making situations.
Additional research should be directed toward the
validation of the F/I model. A possible method would be to
find a situation in which the implementation or upgrade of
an information system has failed and that at least a part of
the reason that it failed is ascribed to damage to the
206
informal communication network. Once such a situation was
found, a case study could be performed to see if the F/I
model would have predicted the failure.
Another method for validating the model would be a
longitudinal study of a firm that is planning to install a
system that employs CAC technology. A study of pre-
implementation communication links could be compared to
to those found after implementation. The amount of
formal and informal communication could be compared to to
the efficiency and effectiveness of the resulting decisions
and to other measures such as user satisfaction and
attitudes.
The issue of the ordering of information on the
horizontal axis in the cost/benefit model provides an
interesting research problem. For this research the
sequence chosen was lowest cost first. Other sequences
based on, for example, the greatest reduction in the less
than a perfect decision cost or the greatest C^/Cj ratio
may generate alower minimum in the TC curve. Methods for
enabling such analysis would be useful contributions.
The usefulness of using the propositions developed from
the cost model to assess the suitability of current and
proposed information system design should be verified. Most
of the propositions have been suggested in similar terms by

207
What needs to be established is their usefulness as diagnos
tic and predictive tools.
BIBLIOGRAPHY
Ackoff, Russell L. "Management Misinformation Systems." Management Science, Vol. 14, No. 4, December 1967, pp. 147-156.
Ackoff, R. L. and M.W. Sasieni. Eyndamentals of Qperatigns Research. New York: Wiley, 1968.
Adam, Everett E., Jr. and Ronald J. Ebert. Production and Qeeratigns Managementj. Cgncegts,_ Models^, and Behavior. 2nd Ed. Englewood Cliffs, NJ: Prentice-Hall, Inc., 1982.
Alexander, M.J. Information Systems Analysis. Chicago: SRA, 1974, pp. 85-86.
Allison, G.T. Essence of Decision. Boston: Little, Brown, 1971.
Alter, Steven L. Decision Sugggrt Systemsj, Current Rractices and Continuing Challenges. Reading, MA: Addison-Westley, 1980.
Alter, Steven L. "How Effective Managers Use Information Systems." Harvard Business Review, Vol. 6, November-December 1976, pp. 97-105.
Anthony, R,N. Planning and Control Systemsi A Framework tQZ Analysis. Boston: Harvard Press, 1965.
Appleton, Daniel S. "Business Rules: The Missing Link." Datamation, Vol. 30, No. 15, October 15, 1984, pp. 145-150
Appleton, Daniel S. "The State of CIM." Datamation, Vol. 30, No. 21, December 15, 1984, pp. 66-72.
Bailey, James E. and Sammy W. Pearson. "Development of a Tool for Measuring and Analyzing Computer User Satisfaction." Management Science, Vol. 29, No. 5, May 1983, pp. 530-545.
Bavelas, Alex. "Communication Patterns in Task-Oriented Groups." Journal of the Acoustical Society of America, 1950, pp. 725-730.
208
209
Berlo, D.K. "Communication as a Process: Review and Commentary." In B.D. Ruben (ed.), Cgmmunigation Yearbook 1. New Brunswick, NJ: Transaction, 1977.
Blumenthal, S.C. Hanagement Information Systemsi A Framework for Planning and Deyelggment. Englewood Cliffs, NJ: Prentice-Hall, 1969.
Bonczek, Robert H., Clyde W. Holsapple, and Andrew B. Whinston. "Computer-based Support of Organizational Decision Making." Decision Sciences, Vol. 10, 1979, pp. 268-291.
Bostrom, Robert N. (ed.) Communication Yearbook 7. Beverly Hills, CA: Sage, 1983.
Bravoco, Ralph R. and George M. Kasper. "An Overview of How Information Flow and Architecture Support Computer-Integrated Manufacturing." CIMCOM 85 Conference Pagers, April 15-18. Dearborn, MI: CASA of SME, 1985
Carlson, Eric D. "An Approach for Designing Decision Support Systems." Proceedings of the Eleventh Annual Hawaiian Cgnferenge on Systems Sciences. North Hollywood, CA: Western Periodicals, 1978.
Campbell, D.T. and J.C. Stanley. "Experimental and Quasi-experimental Designs for Research on Teaching." In N. L. Gage (ed. ), Handbook gf Resesarch on leaching. Chicago: Rand McNally, 1963, pp. 171-246.
Chandler, Alfred D., Jr. Strategy and Structurei Chagters in the History of American Industrial Entergrise. Cambridge, MA: MIT Press, 1962.
Chang, Dash. "An Introduction to Integrated Software." BYTE, Vol. 8, No. 12, December, 1983, pp. 103-108.
Chapanis, Alphonse. "Prelude to 2001: Explorations in Human Communication." American Psychologist, Vol. 26, 1971, pp. 949-961,
Chervany, N. L, and G,W. Dickson. "Organizational Characteristics and Information Systems: An Exploratory Investigation." Academy of Management Journal, Vol. 25, No. 1, March 1982, pp. 170-184.
210
Chervany, N.L., G.W. Dickson, and K. A. Kozar. "An Experimental Gaming Framework for Investigating the Influence of Management Information Systems on Decision Effectiveness." MIS Research Center, Working Paper 71-12, University of Minnesota, 1971.
Churchman, C.W., R.L. Ackoff, and E. L. Arnoff. iQtroduction to Qgeratigns Research. New York: John Wiley & Sons, 1957,
Clancy, D, K, and Frank Collins, "Informal Accounting Information Systems: Some Tentative Findings." Accounting Organizations and Society, Vol. 4, No. 1/2, 1979, pp. 21-30.
Cohen, M.D., J,G, March and J.P, Olsen. "A Garbage Can Model of Organizational Choice." Administration Science Quarterly, Vol. 17, 1972, pp. 1-25.
Cyert, R. M. and J.G. March. A Behavioral Jhegry of the Firm. Englewood Cliffs, NJ: Prentice-Hall, 1963.
Cyert, R.M., H,A. Simon, and D.B. Trow. "Observations of a Business Decision." Journal of Business, Vol. 29, No. 4, October, 1956, pp. 237-248.
Dearden, J, "How to Organize Information Systems," li§rvard Business Review, Vol, 43, No. 2, March-April, 1965, pp. 65-73.
DeBrabander, Bert and Anders Edstrom. "Successful Information System Development Projects." Management Sclenge, Vol. 24, No, 2, October 1977, pp, 191-199.
DeBrabander, B. and G. Thiers. "Successful Information System Development in Relation to Situational Factors Which Affect Effective Communication Between MIS-Users and EDP-Specialists." Management Science, Vol. 32, No. 2, February 1984, pp. 137-155.
Dervin, Brenda, Thomas L. Jackson and Michael S. Nilan. "Measuring Aspects of Information Seeking: A Test of a Quantitative/Qualitative Methodology." In Michael Burgoon (ed.), Communication Yearbook 6. Beverly Hills, CA: Sage, 1982
DeSanctis, G. "An Examination of an Expectancy Theory Model of Decision Support System Use." DBA dissertation, Texas Tech University, 1982.
211
Dickson, Gary W. Management Information Systemsi ivQlutlon and Status. Working Paper, MISRC-WP-81-02, University of Minnesota, October, 1980.
Dickson, Gary W,, James A. Senn and Norman L. Chervany. "Research in Management Information Systems: The Minnesota Experiments." Management Sgience, Vol. 33, No. 9, May 1977, pp. 913-923,
Ebert, R, J. and T.R. Mitchell. Organizatignal Decision Processesj^ Concepts and Analysis. New York: Crane, Russak and Co., Inc., 1975.
Ein-Dor, Phillip and Eli Segev. "Organizational Context and the Success of Management Information Systems." Management Science, Vol. 24, No. 10, June 1978, pp. 1064-1077,
Ein-Dor, Phillip and Eli Segev, "Strategic Planning for Management Information Systems," Haoagement Science, Vol, 24, No, 15, November 1978, pp, 1631-1640.
Ellis, C. A. and G.J. Nutt. "Office Information Systems and Computer Science." ACM Qomgutlng Surveys, Vol. 2, No. 1, March 1980, pp. 27-60.
Firnberg, David. "Concerns." Office Technology and Peggie, Vol. 1, 1982.
Forrester, Jay W. Industrial Dynamics. Cambridge, MA: MIT Press, 1961.
Ginzberg, Michael J. "Implementation as a Process of Change: A Framework and Empirical Study." Reggrt CISR2I31 Sloan Working Pager ZiZzZ5» Sloan School of Management; Massachusetts Institute of Technology, July 1975,
Goldhaber, Gerald M. Organizational Cgmmunicatlgn. Dubuque, lA: Wm. C. Brown, 1974.
Goldkuhl, Goran and Kalle Lyytinen. "A Language View of Information Systems," Paper presented at the Third International Conference on Information Systems, Ann Arbor, Michigan, December 13-15, 1982,
Gordon, Phillip. "What is Integrated Software?" PC World, October, 1984, pp. 72-77.
212
Gorry, G. A. and M. Scott Morton, "A Framework for Management Information Systems." Sloan Management Review, Vol, 13, No, 1, Fall 1971,"pp. 55-77.
Goslar, Martin D. "Information Theory Implications to Marketing Decision Making in a DSS Environment," Working Paper, University of Notre Dame, College of Business Administration, October, 1984.
Granovetter, Mark S. "The Strength of Weak Ties." American Journal of Sociology, Vol. 78, No. 6, 1973, pp. 1361-1379.
Guetzkow, H. and H.A. Simon, "The Impact of Certain Communication Nets upon Organization and Performance in Task-Oriented Groups." Management Science, 1954-55, pp. 233-250.
Hackathorn, Richard D. and Peter G.W. Keen. "Organizational Strategies for Personal Computing in Decision Support Systems." MIS Quarterly, Vol. 5, No. 3, September 1981, pp. 21-26.
Hansson, Hans-Uno. "Human Communication and Its Importance in the Field of Information Systems." SYSLAB Reggrt UQI. 15» Stockholm, Sweden, University of Goteborg, December 16, 1982.
Heise, George A. and George A, Miller, "Problem Solving Using Various Communication Nets." Journal of Abnormal and Social Psychology, Vol. 46, No. 1, January 1951.
Hrebinlak, Lawrence G. Cgmglex Organizations. St. Paul, MN: West Publishing, 1978.
Huber, George P, "Cognitive Style as a Basis for MIS and DSS Design: Much Ado About Nothing?" Management Science, Vol. 29, No. 5, 1983, pp. 567-579.
Huber, George P. "Organizational Information Systems: Determinants of Their Performance and Behavior." Management Science, Vol. 28, No. 2, February 1982, pp. 138-155.
Huber, George P, "The Nature and Design of Post-industrial Organizations," Management Science, Vol. 30, No. 8, August 1984, pp, 928-934.

213
Ives, Blake and Margarethe H. Olson. "User Involvement and MIS Success, A Review of Research. " Management Science, Vol. 30, No. 5, May 1984, pp. 586-603.
Ives, B. , M.H. Olson and J.J. Barondi. "The Measurement of User Information Satisfaction." Cgmmunicatlgns of the ACM, Vol. 26, No. 10, 1983, pp. 785-793.
Ives, Blake, S. Hamilton, and Gordon B. Davis. "A Framework for Research in Computer Based Management Information Systems." Management Science, Vol. 26, No. 9, September, 1980, pp. 910-934.
Jenkins, A.M. "A Framework for MIS Research." Proceedings of the Ninth Annual Conference! American Institute for Decision Sciences, Chicago, IL: October 12-21, 1977, p. 573.
Johnson, R.L. and I.H. Dermon. "How Intelligent is Your MIS?" Business Horizons, Vol. 13, No. 1, 1970, pp. 55-62.
Katz, D. and R.L. Kahn. The Social Psyghology of Organizations. New York: John Wiley & Sons, 1966.
Keen, P,G.W. and G.S. Bronsema, "Cognitive Style Research: A Perspective for Integration," Proceedings of the Second International Conference on Information Systems, 1981.
Keen, Peter G.W. and Michael S. Scott-Morton. Decision Support Systemsj, An Organizatignal Perspective. Reading, MA: Addison-Westley, 1978.
Kerlinger, Fred N. Foundatigns of Behavioral Research, New York: Holt, Rinehart and Winston, 1965.
Kerr, Elaine B. , Roxanne Starr and S. R. Hiltz. Cgmputer-IDediated Cgmmunlcatign Ststemsj, Status and Evaluation, New York: Academic Press, 1982.
Klahr, David and Harold J. Levitt. "Tasks, Organization Structures, and Computer Programs." In Charles A. Myers (ed.), The Impact of Computers on Management, Cambridge, MA: MIT Press, 1967, pp. 107-139.
214
Lasswell, Harold D. "The Structure and Function of Communication in Society." In L, Bryson (ed. ), The Communication of Ideas. New York: Harper and Row, 1948.
Laudon, K. Computers and Bureaucratic Reform. New York: Wiley-Interscience, 1974.
Leavitt, Harold J. "Some Effects of Certain Communication Patterns on Group Performance." Journal of Abnormal §Qd Social Psychology, Vol. 46, No. 1, January 1951, pp. 38-46.
Lesko, Matthew. "Low-Cost On-Line Databases." iYTE, Vol. 9, No, 11, October, 1984, pp, 167-174,
Leavitt, Harold J, "Applied Organizational Change in Industry: Structural, Technological and Humanistic Approaches," In James G. March (ed.), Handbook of Organizations. New York: Rand McNally, 1965.
Lewis, Phillip V. Organizational Cornmunicatigni The i^sence of Effective Management. 2nd Ed. Columbus, OH: Grid Publishing, 1980.
Likert, Rensis. The Human Qrganlzatigni. Its Management and Value. New York: McGraw-Hilir 1967,
Liu, William T, and Robert W. Duff. "The Strength in Weak Ties. " Public Opinion Quarterly, Vol. 36, No. 3, 1972, pp. 361-366.
Livingston, Laura. "Leaving Your Voice." Infgsystems, September 1984, pp. 102-104.
Lucas, Henry C. "A Descriptive Model of Information Systems in the Context of the Organization." Data Base, Vol. 5, No. 2, 1973, pp. 27-36.
Lucas, Henry, Kenneth Clowes, and Robert Kaplan. "Frameworks for Information Systems." Canadian Journal of Operations Research and Information Processing, Vol. 12, No. 3, October, 1974, pp. 180-195.
Mason, Richard D. and Ian I. Mitroff. "A Program for Research on Management Information Systems." Management Science, Vol. 19, No, J, January 1973, pp. 475-487,
215
McGrath, Joseph E. and David A. Kravitz. "Group Research." In M.R. Rosenzweig and L.W. Porter (eds.), Annual Review of Psychology, Vol. 33. Palo Alto, CA: Annual Reviews, Inc., 1982, pp. 195-230.
Melcher, Arvyn J. and Ronald Seller. "Toward a Theory of Organizational Communication: Considerations in Channel Selection." Academy of Management Journal, Vol, 10, No. 1, March, 1976, pp. 39-52.
Miller, G.A. "The Magic Number Seven,Plus or Minus Two: Some Limits on Our Capacity for Processing Information, " Psychology Review, No. 63, pp. 81-97.
Miller, J.G. "Living Systems: The Organization." Behavioral Science, Vol. 17, No. 1, 1972.
Miller, R.B. "Archetypes in Man-Computer Problem Solving." Ergonomics, Vol. 12, 1969, pp. 559-581.
Miller, R.D. "Multidimensional Processes of Implementing Computer Based Models." DBA thesis. Harvard Business School, 1974.
Miner, John B. The Management Prgcessi Theory,, Research^, and Practice. New York: MacMillan, 1973, (Chapter 12), pp. 359-388.
Mintzberg, Henry, The Structuring of Qrganizatigns. Englewood Cliffs, NJ: Prentice-Hall, 1979.
Mintzberg, Henry. IlDBedlments to the Use of Management loformation. New York: National Association of Accountants, 1974.
Mintzberg, Henry. The Nature of Managerial Work. New York Harper & Row, 1973.
Mintzberg, Henry, Duru Raisinghani and Andre Th^or^t. "The Structure of 'Unstructured' Decision Processes." Administrative Science Quarterly, Vol. 21, June 1976, pp. 246-275.
Mock, T.J. "A Longitudinal Study of Some Information Structure Alternatives." Database, Vol. 5, No. 2, 3,4, 1975, pp. 40-45.
216
Monge, Peter R. "Systems Theory and Research in the Study of Organizational Communication: The Correspondence Problem." Human Communicatign Research, Vol. 8, No. 3, Spring 1982, pp. 245-261.
Mortensen, David C. Cgmmunicatigni The Study of Human Interaction. New York: McGraw-Hill, 1972.
Naylor, Thomas H. "Decision Support Systems or Whatever Happened to MIS?" Interfaces, Vol. 12, No. 4, August 1982, pp. 92-94.
Newman, S. and M. Hadass. "On Decision Support Systems", California Management Review, Vol. 22, No. 3, Spring 1980, pp, 77-84,
Newcomb, Theodore M, "An Approach to the Study of Communicative Acts," Psychological Review, Vol. 60, November 1953, pp. 393-404.
Nichols, R.G. "Listening is Good Business." Management of Personnel Quarterly, Winter, 1962.
Nolan, Richard, and James C. Wetherbe. "Toward A Comprehensive Framework for MIS Research." MIS Qy§rterly, June, 1980, pp. 1-19.
Olson, H.H. and H.C. Lucas. "The Impact of Office Automation on the Organization: Some Implications for Research and Practice." Cgmmunicatlgns of the ACM, Vol. 25, No. 11, November 1982, pp. 838-847.
Penley, Larry E. "An Investigation of the Information Processing Framework of Organizational Communication." Human Communication Research, Vol. 8, No. 4, Summer 1982, pp. 348-365.
Picot, Arnold, Heide Klingenberg and Hans-Peter Kranzle. "Office Technology: A Report on Attitudes and Channel Selection from Field Studies in Germany." In Michael Burgoon (ed.), Communication Yearbook 6, Beverly Hills, CA: Sage, 1982, pp, 674-692.
Plain, Harold Geoffrey. "Analyzing Message Trends in Computer Office Automation: The Development of a Category System." Unpublished paper. Graduate School of Management, UCLA, 1984.
217
Planty, Earl and William Machaver. "Upward Communications: A Project in Executive Development." Personnel, Vol 28, No. 4, 1952, pp. 304-318.
Poole, M. Scott and Joseph P. Folger. "Modes of Observation and the Validation of Interaction Analysis Schemes." Small Group Behavior, Vol. 12, No. 4, November 1981, pp. 477-493.
Pracht, W.E. "An Experimental Investigation of a Graphical Interactive Problem Structuring Aid for Decision Support Systems." DBA dissertation, Texas Tech University, 1984.
Price, J. L. Organizational Ef fectiyenessj^ An Inventory of Propositions. Homewood, IL: Irwin, 1968.
Redding, W. Charles. "Research Setting: Field Studies." In P. Emmert and W. Brooks (eds.), Methods of Research ID Communication, New York: Houghton Mifflin, 1970, pp. 105-159.
Rice, R. E. "Impacts of Computer-mediated Organizational and Interpersonal Communication." In M. Williams (ed.), Annual Review of Information Science and Technology, Vol. 15. White Plains, NY: Knowledge Industry Publications, 1980.
Rockart, J.F. and M.S. Scott Morton. "Implications of Changes in Information Technology for Changes in Informa;.ion Technology for Corporate Strategy. " lOterfaces, Vol. 14, No. 1, January-February, 1984, pp. 84-95.
Rogers, Everett M. and D. Lawrence Kincaid. Qommunicatign Networks^ Toward a New Paradigm for Research. New York: Free Press, 1981.
Ruben, Brent D. (ed. ). Communicatior^ Yearbook 2. New Brunswick, NJ: Transaction Books, 1978.
Sage, Andrew P. "Behavioral and Organizational Considerations in the Design of Information Systems and Processes for Planning and Decision Support. " IEEE Tl!§0§§otigns on Systems^ d§QjL §0^ Cybernetics, Vol. SMC-11, No. 9, September 1981, pp. 640-678.
Sanders, G. Larry. "MIS/DSS Success Measure. " Systems^ Objectives^ Solutions, Vol. 4, 1984, pp. 29-34.
218
Sanders, G. Larry. A Field Study of Organizational Factors Affecting DSS Implementation. Unpublished DBA dissertation, Texas Tech University, 1983.
Sanders, G.L., J.F. Courtney, and S.L. Loy. "The Impact of DSS on Organizational Communication. " Information and Management, Vol. 7, No. 3, June 1984, pp. 141-148.
Saunders, Carol Stoak. "Management Information Systems, Communications and Departmental Power: An Integrative Model." Academy of Management Review, Vol. 6, No. 3, 1981, pp. 431-442.
Saunders, C.S. and R.T. Keller. "A Study of Maturity of the Information System Function, Task Characteristics and Interdepartmental Communication: The Importance of Information System - Organization Fit. " Proceedings of the Fourth International Conference on Information Systems, Houston, Texas, December 15-17, '983, pp. 111-127.
Schein, Edgar H. Organizational Psychology. Englewood Cliffs, NJ: Prentice-Hall, 1965.
Schramm, Wylbur. "How Communication Works." Tb? Process and Effects of Mass Communication. Urbana, IL: University of Illinois Press, 1954, pp. 3-10.
Schramm, W. MejQ^ Messages^ and Mediae A Look at Human Communication. New York: Harper and Row, 1973.
Schrenk, L.P. "Aiding the Decisionmaker - A Decision Process Model." Erggngmics, Vol. 12, 1969, pp. 543-557.
Scholz, William. "Communication for Control." Advanced Management, Vol. 24, 1959, pp. 13-15.
Scholz, William. Communication in the Business Organization. Englewood Cliffs, NJ: Prentice-Hail, 1962.
Scott Morton, Michael S. Management Decision Systemsi Computer Based Support for Decision Making. Cambridge, MA: Harvard, Division of Research, 1971.
Senn, J.A. "Enhancing the User Interface: A Research Problem in Computer-based Information Systems." Tldi/QRSA Bulletin, May 1978, pp. 14-25.
219
Shaller, Herman I. "A General Theory and Technique for Measuring Organizational Communication and Program Effectiveness." Proceedings of the Second Hawaii iQternational Conference on System Sciences, 1969.
Shannon, C.E. and W. Weaver. The Mathematical Tbegry of Communication. Urbana, IL: University of Illinois Press, 1949.
Simon, Herbert A. Tbe Shape of Automation. New York: Harper & Row, 1965.
Simon, Herbert A. Tbe New Science of Management Decision. New York: Harper and Row, 1960.
Simon, Herbert A. "A Behavioral Model of Rational Choice." In H.A. Simon (ed.), Models of Man. New York: Wiley, 1957, pp. 241-260.
Simon, Herbert A. Tbe Shape of Automation. New York: Harper and Row, 1965.
Simson, R.L. "Vertical and Horizontal Communication in Formal Organizations." Administrative Sciences Quarterly, Vol. 4, 1959, pp. 188-196.
Smith, Ronald L., Richetto, G.M., and J. P Zima. "Organizational Behavior: An Approach to Human Communication." In Richard Budd and Brent Ruben (eds. ), Approaches to Human Cgmmunicatlgn, New York: Spartan Books, 1972, pp. 269-389.
Sprague, Ralph H., Jr. "A Framework for the Development of Decision Support Systems." MIS Quarterly, Vol. 4, No. 4, December 1980, pp. 1-26.
Sprague, Ralph H., Jr., and Eric D, Carlson. Building Effective Decision Support Systems. Englewood Cliffs, NJ: Prentice-Hall,"l982.
Sprague, R.H. and H.J. Watson. "MIS Concepts - Part I." Journal of Systems Management, January 1975, pp. 34-37.
Taifel, Henri, "Social Psychology of Intergroup Relations, " in IM.R. Rosenzweig and L. W. Porter (eds.), Annual Review of Psychology, Vol. 33. Palo Alto, CA: Annual Reviews Inc., 1982, p. 1-39.
220
Taylor, R.N. and I. Benbasat. "A Critique of Cognitive Styles Theory and Research." Proceedings of the First IQternational Conference on Information Systems. Philadelphia, PA: 1980.
Thayer, Lee. Communication and Communicatign Systems. Harvard, IL: Irwin, 1968.
Thayer, Lee. "Communication and Organization Theory." In Frank E. Dance (ed.), Human Communication Theory^ Original Essays. New York! Holt, Rinehart, and Winston, 1967.
Thierauf, Robert J. Decision Support Systerrs for Effective Planning and Control. Englewood Cliffs, NJ: Prentice-Hall, 1982.
Thompson, B.E. and C.W. White. "A Theory of Intra-organization Communication." Journal of Technical Writing and Communicatign, Vol. 11, No. 4, 1981, pp. 351-359.
Thompson, James D. Qrganizatigns in Action. New York: McGraw-Hill, 1967.
Toffler, Alvin. Eyture Shock. New York: Random House, 1971
Tushman, Michael L. and David A. Nadler. "Information Processing as an Integrating Concept in Organizational Design." Academy of Management Review, Vol. 3, July 1978.
Van de Ven, Andrew H. and Diane L. Ferry. Measuring and Assessing Qrganizatigns. New York: Wiley-Interscience, 1980.
Vasarhelyi, M.A. "Man-Machine Planning Systems: A Behavioral Examination of Interactive Decision Making." Unpublished ' h. D. dissertation. University of California, Los Angeles, 1973.
Vazsonyi, Andrew. "Information Systems in Management Science." Interfaces, Vol. 9, No. 1, November 1978, pp. 72-77.
Vlek, C.A.J. "The Rational Actor Model." In Michon, Eljkman, and DeKlerk, Handbook of Psychgngmics, Vol. II. New York: North-Holland, 1979, p. 650.
221
Watson, Hugh J. and Marianne M. Hill. "DSS or What Didn't Happen with MIS," Interfaces, Vol, 13, No. 5, October 1983, pp, 81-88,
Weinshall, T, D, Managerial Communicatign^ Cgncepts^. Approaches and Technigues, New York: Academic Press, 1979,
Westley, Bruce H. and Malcolm S. MacLean, Jr. "A Conceptual Model for Communications Research." Journalism Quarterly, Vol. 34, 1957, pp. 31-38.
Whistler, Thomas L. Tbe Impact of Computers on Qrganizatigns. New York: Praeger Publishers, 1970.
Whitte, Eberhard. "Field Research on Complex Decision-Making Processes--The Phase Theorem." International Studies of Management and Organization, Vol. 2, No. 2, Summer, 1972, pp. 156-182.
Wickesberg, K.A. "Communication Networks in the Business Organization Structure," Academy gf Management Journal, Vol, 11, No. 3, September 1968, pp. 253-262.
Wilkerson, Wendy. A Study of the Behayigral ImBl^ostigns of the Comet Electronic Mail System of Digital Eguipment Cgrpgratlgn. Boston, MA: Digital Equipment Corporation, 1979.
Williams, Frederick and Ronald E. Rice. "Communication Research and the New Media Technologies." In Robert N, Bostrom (ed.), Communicatign Yearbook 7. Beverly Hills, CA: Sage, 1983, pp, 200-224.
Zani, William M. "Blueprint for MIS." Harvard Business Review, November-December, 1970, pp. 95-101.
Zmud, Robert W. "Individual Differences and MIS Success: A Review of the Empirical Literature." Management Science, Vol. 25, No. 10, October 1979, pp. 966-979.
APPENDIX
SALIENT TECHNOLOGICAL TRENDS
The decision making environment that managers operate
within has changed significantly in the last few years.
Four technological trends have driven this transformation.
First, hardware has become more compact and cost effective.
Secondly, easy to use software has reduced the problem of
interacting with the computer and has provided a wide range
of effective tools. Thirdly, computer-assisted communica
tion has enhanced the access to and the distribution of
information. Fourthly, ready access has been provided to a
vast and ever-increasing supply of data both inside and
outside the organization.
This appendix provides an overview of these four
areas. The intent is to clearly show that managers do,
indeed, operate in an environment that is different from
that of only a few years ago. The new tools that have been
developed affect the logistics of decision making. The
effect is important enough to require being included in
models of the decision-making process.
The examples presented are chosen from among those
which appear popular enough to be recognized either by name
or by concept. It would be unnecessary (and physically
222
223
impractical) to list all the advances and products that
exemplify the new technologies. The ones chosen are, I
believe, representative and, therefore, provide an under
standing of the nature of the four trends.
The development of low-cost integrated circuits (ICs)
has been the catalyst for the appearance of all these new
technologies. Three collateral developments (smaller size,
greater processing power, and lower cost) have made them
applicable to all phases of computer-assisted information
technology. Furthermore, these developments may be expec
ted to continue in the future.
Computer Hardware
The most significant new technology is the development
of the personal (micro) computer. Its introduction and
widespread acceptance has revolutionized the relationship
between the decision maker and the computer. Although the
trend in computing machinery has been toward smaller and
smaller units (for a given amount of processing power) the
critical size was reached when a complete functional unit
could be placed on the manager's desk. Contained in this
unit is provision for input and output, a usable quantity
of internal memory, adaquate processing speed, and a means
of convenient secondary storage.
224
The effect of this package was to place the control of
computing resources in the hands of the decision maker
rather than the data processing manager. The desktop
computer acts as a vehicle by means of which the other
three technologies are made available. It stimulated the
development of the other technological trends which, in
turn, made the value and acceptance of the microcomputer
even greater. The potential productivity gains that these
united technologies offer make the costs (capital, time,
and effort) of acquisition more acceptable to the decision
maker.
Acceptance was broadened when microcomputers became
transportable. The machine could be taken with the user,
providing its services wherever needed. This feature
became even more useful when built-in data communication
capabilities were added. It put the user in contact with
the home office for data transmission and retrieval.
Productivity could be enhanced even during those periods
away from the office.
Application Software
The introduction of the desktop computer would not
have been nearly as revolutionary if it were not for the
parallel development of easy-to-use (termed "user
friendly") software. In prior times, the way to use a
225
computer was to program it. Application-oriented software
has removed the requirement of using a procedural language
to control the computer. Instead, these "fourth genera
tion" languages provide a task-specific environment in
which the user, with a minimum number of commands, can be
productive. Learning the commands may require effort; but
in any case, the application can be carried out far more
easily than if it had to be programmed with a lower level
language.
Placing the control of the operation of the micro
computer in the hands of the user diminishes his or her
dependence on the data processing staff and reduces the
inherent delay in developing an application. The decision
maker must still invest considerable time to learn the
procedures for operating the new software and, more impor
tantly, its capabilities and limitations. However, once
these hurdles are overcome, the benefit is immediate access
to a tool for generating decision making information.
Applications software that is widely used by managers
can be classified into three general categories (word
processing, spread sheets, and data management) plus a
fourth category, integrated packages, which contain
features of the other three. A myriad of special purpose
packages are also available.
226
Word Processing
The first category is word processing. Word proces
sing packages are designed to enable the user to easily
produce a good-looking document. Their big advantage over
manual methods is that they allow text to be altered and
moved around on a video display before it is committed to
paper. Additions, deletions, relocations, or reformatting
can be done with only a few keystrokes. If changes to the
text are to be made, only those parts affected need to be
re-keyed. Although, for efficient operation the user needs
to have at least marginal typing skills, with a little
practice, most people can usually learn to type as fast as
they can legibly write. Examples of this category include
WordStar and Microsoft WORD,
For the manager, access to a word processing package
aids productivity in several ways. It allows the rapid
generation of short memos, letters, and reports. Text is
keyed in either by the manager or by a typist working from
notes or dictation. A draft can be printed out and, if
necessary, corrections can be made without having to re-key
or manually cut and paste the text, thus saving time and
potential keystroke errors. Another advantage is that text
is produced that is amenable to electronic transmission.
Some word processors can also serve as editors for entering
data for other applications.
227
Spreadsheets
The second general category is spreadsheets. The
introduction of VisiCalc in 1979 made the computer's
numerical processing capabilities available to non-program
mers. Since then, competitive packages have proliferated
and spreadsheets have become a major computer application.
These packages do for most mathematical models what word
processors do for text: they provide easy entry, format
ting, and editing. They allow for the storage of numbers
and their relationships, and when a critical value is
changed, all affected values are automatically adjusted.
Some include advanced features such as graphical display of
data. Examples are VisiCalc, SuperCalc, and Lotus 1-2-3.
Spreadsheets assist the decision maker in conducting
quantitative analysis of problems. They provide a method
for rapidly building mathematical models and entering
relevant data. "What if" analysis can be done to assess
the effects of changing some parameter or relationship. The
results can be stored in a data set for later use in the
same or some other application package.
Data Managers
The third general category of software package
includes file handlers and data management systems. These
packages provide easy-to-use methods for building, editing
228
and deleting records, and accessing data stored in files.
A file handler, also referred to as a record management
system, deals with a single file at a time. Data base
management systems (DBMS) are more versatile in that they
can deal with two or more files simultaneously. Further
more, DBMS often have additional features like query
languages, report generators, and data interchange facili
ties. Examples include dBASE II, PC/FOCUS, and DATAPLEX.
These tools help retrieve stored data and organize it
into a meaningful format that allows the extraction of
information. This ability is not at all trivial, for it
allows the manager to make connections between data sets
that would be difficult or impossible manually. Further
more, the data sets can be connected in ways that were not
anticipated when the data was entered into the system.
They provide a very powerful analytical means for recog
nizing and diagnosing problems.
Integrated Packages
The latest wave in software development has been the
introduction of "software that has a high level of func
tionality and is easy to use" CChang, 19833. This software
combines features of the three general categories into one
package. The advantages are: a similarity of commands,
regardless of which feature you are using, and ease of data
229
transfer between functions due to built-in data compati
bility.
Three approaches are used to integrate the functions.
Functional integration is obtained by the provision of a
family of software products. One advantage is that with
individual packages tailored to each task, the user employs
only those products that suit the application. They are
designed so that the result of one package can be readily
fed to another. The primary disadvantage is that the
current program must be exited and a new program called to
change functions. Examples are PFS:write, PFS:report, and
PFS:file.
The second approach is concurrent or "ecological"
integration which provides an apparent operating system
that submerges the resident operating system. In this
approach, different products reside in memory (physically
or virtually) all at the same time. One can be called
without exiting from another. Advantages are that you add
only those applications that you want and that you can
integrate different packages. Three disadvantages are: 1)
concurrently integrated applications require large amounts
of internal memory and, therefore, run poorly on machines
with less than 512K, 2) they provide only limited data
sharing, and 3) the integrating operating system cannot be
changed if you do not like it. This last limitaton is

230
particularily important if the package you want to use does
not use the machine's operating system to function. An
example: WordStar uses its own screen driver so it can not
be integrated. Examples of concurrent integration are the
Topview, DesQ, Macintosh Finder, and concurrent CP/M-86.
The third integrative approach is the all-in-one
approach or shared technology. This software is one
package, tightly integrated, to provide many functions from
one monolithic program loaded into memory. These packages
are designed to provide the user with all the tools to
start, and finish a job: in effect, an electronic desk.
This approach assures rapid and compatible data transfer
between applications without having to exit the program.
Disadvantages are that they use up large amounts of memory
because they are so complex and additional functions are
hard if not impossible to add. Most have one of the
general catagories as their primary mode of operation and
provide the others as secondary features. Examples are
KAMAS which is word processor based. Symphony which is
spreadsheet based, and Metafile which is file processor
based.
Integrated packages such as these are improving the
decision-making environment by providing easy and rapid
access to the data and tools the manager needs to generate
231
information and develop solutions. The net result is
increased managerial productivity; that is, an improved
ratio of inputs (information costing money, time, and
effort) to outputs (decisions increasing profit or de
creasing cost).
Special Purpose Applications
This group represents all the other software applica
tions that exist to help the decision maker, many which
could form important groups but only a few of which will be
mentioned. Accounting packages have existed since the
computer was first applied to business. The primary
changes have been toward integration with the other opera
tional areas in the organization. Likewise, graphics
packages are not new but their application to and integra
tion with the other new software is. Examples are Micro
soft Chart and Chartman. Artificial Intelligence has come
to the microcomputer. Clout acts as an interface to the
R:base 4000 data base package. Products such as Salvo and
Savvy are integrated data base management packages. Ex-
pertEase and ExpertChoice provide the decision maker with a
means for developing an expert system.
These and literally hundreds of other applications
programs have provided the manager with powerful tools for
increasing productivity and improving decision making with-
232
out having to go through the data processing department.
They have also given justification and momentum to the
acquisition of more (and more powerful) desktop computers.
The next technological trend, networking, makes the micro
computer even more useful and central to the decision
making environment.
Communicatign Networks
The third technological trend has been the vast
increase in capabilities for transmitting text and data.
Data banks, both local and remote, can be accessed from the
manager's desk. Local and wide area networks have been
made feasible by the development of high speed, low-cost-
per-bit transmission technologies like co-axial cable,
microwave communication, fiber-optic systems, and satellite
relays. The ownership of the transmission media provides
one way of classifying networks. Local area networks
(LANs) have ownership of the transmission pathways. Wide
area networks (WANs) typically use the services of a common
carrier. Although very few firms could afford to own some
of the more exotic systems for their own exclusive use, the
provision of these services by a common carrier makes their
use economical, especially when long distances are
involved.
233
Network Characteristics
LAN and WAN technology is designed for sharing resour
ces. They provide a communication path between the user's
computer and other devices or computers (mainframe or
micro). This sharing is economically motivated. The
network furnishes the decision maker with shared access to
sources of data or relatively expensive peripherals with
excess capacity. Maintaining a database or acquiring a
laser printer may not be economically feasible if only one
user has access but may be highly cost-effective if shared
access is possible.
One feature of all LANs is access to a hard disk.
Simple LANs provide disk sharing, whereas more complex LANs
support data sharing as well. Disk sharing means that two
or more users have the use of a single disk. The hardware-
software system provides each user with a portion of the
disk (the allocated size may be fixed or variable) and
access to public files. Any file designated as public may
be accessed by only one user at a time. Data sharing means
that the system allows multiple access to given files by
employing a file server. File servers use hardware similar
to disk sharing but have more complex software allowing the
apparent simultaneous sharing of a single file.
Typical capabilities offered by LANs include shared
access to some or all peripherals such as: mainframe
234
hardware, serial and parallel printers, plotters, tape
drives, RAM disks, mass storage units, modems and other
communication media. Software features include: security
(logon ID, file passwords, file protection, record protec
tion), operating system (system management, RAM disk sup
port, disk caching), applications (electronic mail, chat
capabilities, utilities), and printer spooling.
To the manager, the impact of these communication
technologies is considerable. Beyond making the system
hardware available, LANs are designed to allow a decision
maker access to a central data store (either micro or
mainframe based) from which specified data can be extracted
for local or remote processing under the user's control.
Results can then be transmitted through the LAN to the
appropriate peripheral or workstation (someone else's
micro), thus facilitating the dissemination of information.
On a larger scale, yet with similar features, are wide
area networks (WANs). These networks often cover vast
distances allowing the centralization of data storage or
mainframe computing power. Since WANs offer off-site
communication, they also are appropriate for supporting
communication processes such as teleconferencing.
Depending on the frequency and amount of data trans
mitted, the communication media may be used intermittently
235
(with other parties sharing access) or it may be dedicated
to one user only. If the media is shared, the switching
between users is carried out by the common carrier (the
supplier of the media) and is transparent to the user.
One of the features of LAN and WAN technology has had
particular impact on the manager's work environment--
electronic mail. It has eliminated the inefficiencies of
paper memos. Rapid transmission of directives and requests
can be streamlined by eliminating the manual transcription
of text to paper and the physical delay of delivering that
paper. At the same time, it does not limit the ability to
generate a paper document if necessary.
A parallel development, voice messaging, allows the
caller to leave a recorded message if the recipient does
not answer. This approach eliminates both the effort
required to generate a text message and "telephone tag."
It transforms the telephone into a nonconcurrent communica
tion medium like electronic mail. Both parties need not be
on the line simultaneously.
Electronic text and voice messaging technologies
complement each other. Text is best when the message is
complex, has numerical content, or needs to be referenced
later. Voice is best when the message is relatively short
or conversational in nature. Voice messaging allows the
236
added communication dimension carried by the tone of voice
of the sender.
On-line Data Bases
The last technological trend to be discussed is the
manager's increasing ability to access data. Improved
access to internal data has primarily been a result of the
three other technological trends. The increase in accessi
bility to external data has been helped by the improved
technologies but is also due to the formation of a new
industry that provides data for sale. Organizations that
had amassed large stores of data in their normal operation
saw an opportunity to sell it to others. Dunn & Brad-
street, TRW, Nielson and others moved aggressively to
exploit this new market. Subscribers to their services
were allowed access to their data bases, paying for the
information received. Communication access was provided
through common carriers so the information could be ac
cessed and down-loaded electronically. In some cases, off
line hard copy was also provided. Today over 3000 data
sources can be accessed. Consequently, today's decision
maker has the ability to obtain financial, market, and
economic data and forecasts on a vast number of subjects.
237
^ii Tbis Is Nice^^^^Sg What?
As Rockart and Scott Morton C19841 point out, these
trends have generated "a critical metamorphosis -- from
data processing to information technology." They further
state that these changes are "...affecting both the process
and content of decision making on semi-structured tasks."
This overview of the new technologies that have become
available to the manager provides evidence that the deci
sion making environment is different now than when existing
information system, decision-making frameworks were devel
oped. It is time to take a look at how computer assisted
communication should be included in the decision-making
process and a framework developed to reflect its effects.