Denmark's Fourth National Communication on Climate Change
406
Denmark’s Fourth National Communication on Climate Change Under the United Nations Framework Convention on Climate Change
-
Upload
khangminh22 -
Category
Documents
-
view
0 -
download
0
Transcript of Denmark's Fourth National Communication on Climate Change
Denmark’s Fourth National Communication on Climate Change
Under the United Nations Framework Convention
on Climate Change
Denmarks Fourth National Communication on Climate Change
Under the United Nations Framework Convention on Climate Change
� Denmark's Fourth National Communication on Climate Change�
Contents
Contents .............................................................. 2
Foreword .............................................................. 6
IntroduCtIon.......................................................... 9
1.exeCutIvesummary.......................................... 11
1.1 nationalcircumstancesrelevanttogreenhousegasemissionsandremovals...........................................11
1.1.1 General.........................................................11 1.1.� Energy,transport,andthe
domesticsector...........................................11 1.1.3 Businesssectorandwaste......................... 1� 1.1.4 Agricultureandforestry.............................. 1� 1.1.5 GreenlandandtheFaroeIslands............... 1�1.2 Greenhousegasinventoryinformation................... 13 1.�.1 Carbondioxide,CO�................................... 13 1.�.� Methane,CH4............................................. 15 1.�.3 Nitrousoxide,N�O..................................... 15 1.�.4 TheindustrialgasesHFCs,
PFCsandSF6.............................................. 15 1.�.5 Denmark’s,Greenland’sandthe
FaroeIslands’totalemissions andremovalsofgreenhousegases.......... 15
1.�.6 Furtherinformationunder theKyotoProtocol...................................... 17
1.3 Policiesandmeasures............................................. 171.4 Projectionsandthetotaleffectofpoliciesand
measures..................................................................261.5 vulnerabilityassessment,climatechange
impactsandadaptationmeasures..........................27 1.5.1 Climatedevelopment-effectsand
possibilityforadaptationforDenmark......�7 1.5.� ClimatechangesinGreenlandandonthe
FaroeIslands...............................................�91.6 Financialresourcesandtransferoftechnology......301.7 researchandsystematicobservations....................30
1.8 education,trainingandpublicawareness.............. 32
2 natIonalCIrCumstanCesrelevanttoGreenhouseGasemIssIonsandremovals.....................................................33
2.1 denmark................................................................... 33 �.1.1 Formofgovernmentandstructureof
administration............................................ 33 �.1.� Population...................................................34 �.1.3 Geography...................................................34 �.1.4 Climate........................................................ 35 �.1.5 Economy..................................................... 37 �.1.6 Energy.......................................................... 37 �.1.7 Domesticsector..........................................45 �.1.8 Transport.................................................... 46 �.1.9 Thebusinesssector....................................47 �.1.10 Waste.......................................................... 49
�.1.11 Buildingsandurbanstructure................... 51 �.1.1� Agriculture.................................................. 51 �.1.13 Forestry....................................................... 532.2 Greenland................................................................. 53 �.�.1 Formofgovernmentandstructureof administration............................................ 53 �.�.� Population...................................................54 �.�.3 Geography...................................................54 �.�.4 Climate........................................................54 �.�.5 Economy..................................................... 57 �.�.6 Energy.......................................................... 58 �.�.7 Transport.....................................................59 �.�.8 Industry.......................................................59 �.�.9 Waste.......................................................... 60 �.�.10 Buildingsandinfrastructure...................... 60 �.�.11 Agriculture..................................................612.3 theFaroeIslands.....................................................61 �.3.1 Formofgovernmentandstructureof
administration............................................61 �.3.� Population...................................................6� �.3.3 Geography...................................................6� �.3.4 Climate........................................................6� �.3.5 Economy.................................................... 64 �.3.6 Energy..........................................................65 �.3.7 Transport.....................................................65 �.3.8 Industry...................................................... 66 �.3.9 Buildingsandurbanstructure.................. 66 �.3.10 Agriculture.................................................67 �.3.11 Forestry......................................................67
3 GreenhouseGasInventoryInFormatIon.............................................69
3.1 Greenhousegasinventories................................... 693.2 denmark’semissionsandremovalsof
greenhousegases................................................... 69 3.�.1 Carbondioxide,CO�.................................. 69 3.�.� Methane,CH4..............................................70. 3.�.3 Nitrousoxide,N�O.................................... 71 3.�.4 Thepotentgreenhousegases
HFCs,PFCs,andSF6..................................7� 3.�.5 Denmark’stotalemissionsand
removalsofgreenhousegases...................74 3.�.6 Danishemissionsofindirect
greenhousegasesandSO�.......................743.3 denmark’s,Greenland’sandtheFaroeIslands’
totalemissionsandremovalsofgreenhousegases...................................................76
3.4 supplementalinformationundertheKyotoProtocol..........................................................79
3.4.1 Nationalsystemsforgreenhousegas inventoriespursuanttoArticle5, Section1oftheProtocolinventories......... 81
3.4.� InformationunderArticle10(a)ofthe Protocolonimprovementsofemission inventories................................................................ 81
3Denmark's Fourth National Communication on Climate Change
4 POLICIES AND MEASURES...........................83
4.1 Climate policy and the decision-making processes..................................................................834.1.1 National action plans .................................844.1.2 Denmark’s Climate Strategy.......................874.1.3 Progress in general concerning follow-up on the Climate Strategy............. 90
4.2 Measures and effects across sectors ......................934.2.1 Allowance regulation ..................................934.2.2 The Kyoto mechanisms ............................. 964.2.3 Taxes and duties ....................................... 101
4.3 Other measures and effects in Denmark’s economic sectors ...................................................1094.3.1 Energy........................................................ 1104.3.2 Transport................................................... 1224.3.3 Business sector......................................... 1274.3.4 Agriculture, forestry and fisheries ............ 1344.3.5 The domestic sector ................................. 1434.3.6 Waste and sewage .................................... 147
4.4 Policies and political measures in Greenland for the energy area .................................................153
4.5 Measures for the Faroe Islands ..............................1554.6 Supplementary information under the Kyoto
Protocol .................................................................. 1564.6.1 The national registry................................. 1564.6.2 Supplementarity........................................ 1584.6.3 Denmark’s climate efforts – a step on the way to sustainable development........ 1594.6.4 Efforts for international air transport and shipping.............................1604.6.5 Efforts to limit adverse effects in other countries..........................................1604.6.6 Legislation, enforcement and administrative procedures for
implementation of the Kyoto Protocol ....1604.6.7 Strategies to mitigate climate change cf. article 10(b) of the Kyoto Protocol ..... 162
5 PROJECTIONS AND THE TOTAL EFFECTOF POLICIES AND MEASURES................... 165
5.1 Introduction and overall effect of policies and measures ................................................................ 165
5.2 Energy including all activities with fuel combution within transport, military, business, agriculture, forestry, fisheries and the domestic sector ...........1695.2.1 Methods....................................................1695.2.2 Assumptions and key parameters ........... 1705.2.3 Results....................................................... 1725.2.4 Sensitivity analyses and scenario calculations ................................................175
5.3 Transport .................................................................1755.3.1 Methods.................................................... 1765.3.2 Assumptions and key parameters ........... 1775.3.3 Results....................................................... 178
5.3.4 Sensitivity analyses and scenario calculations ............................................... 178
5.4 Industry ................................................................. 1795.4.1 Methods.................................................... 1795.4.2 Assumptions and key parameters ............1815.4.3 Results........................................................1815.4.4 Sensitivity analyses and scenario calculations ................................................181
5.5 Agriculture...............................................................1815.5.1 Methods.................................................... 1825.5.2 Assumptions and key parameters ........... 1825.5.3 Results....................................................... 1835.5.4 Sensitivity analyses and scenario
calculations ............................................... 1845.6 Forestry................................................................... 184
5.6.1 Methods.................................................... 1845.6.2 Assumptions and key parameters .......... 1845.6.3 Results.......................................................1865.6.4 Sensitivity analyses and scenario
calculations ...............................................1865.7 Waste ...................................................................186
5.7.1 Methods....................................................1865.7.2 Assumptions and key parameters ........... 1885.7.3 Results.......................................................1895.7.4 Sensitivity analyses and scenario
calculations ...............................................1895.8 Total emissions of greenhouse gases in the projection with measures ............................... 189
5.8.1 Carbon dioxide, CO2 ................................. 1895.8.2 Methane (CH4) .........................................1905.8.3 Nitrous oxide, N2O ...................................1905.8.4 Industrial gases HFCs, PFCs and SF6...... 1915.8.5 Denmark’s total greenhouse gas emissions and removals .......................... 191
5.9 Projections without measures ............................... 1915.10 Projections with additional measures ................... 1915.11 Greenland and the Faroe Islands...........................196
5.11.1 Greenland .................................................1965.11.2 The Faroe Islands...................................... 198
6 VULNERABILITY ASSESSMENT, CLIMATE CHANGE IMPACTS AND ADAPTATIONMEASURES .................................................. 199
6.1 Climate in the future ..............................................1996.2 Climate trends in Denmark....................................199
6.2.1 The latest developments ..........................1996.2.2 Projected climate changes in Denmark.. 2006.2.3 Impacts and Denmark’s possibilities for adaptation ...........................................201
6.3 Climate changes in Greenland ............................. 2066.3.1 Effects and possibility for adaptation
on land ......................................................2076.3.2 Effects and possibility for adaptation
at sea ........................................................ 208
3
4 Denmark's Fourth National Communication on Climate Change
6.4 Climate changes on the Faroe Islands ..................2106.4.1 Impacts and adaptation in terrestrial
and marine ecosystems............................2106.5 Assessment of the significance of climate
change for the whole Arctic ....................................211
7 FINANCIAL RESOURCES AND TRANSFEROF TECHNOLOGY....................................... 213
7.1 Danish development policy ................................... 2137.2 Development cooperation ..................................... 2157.3 New and additional assistance funds ................... 217
7.3.1 Multilateral efforts .................................... 2187.4 Assistance through the private sector...................2247.5 Assistance to developing countries that are
particularly vulnerable to climate change .............2277.6 Activities in connection with technology
transfer ...................................................................229
8 RESEARCH AND SYSTEMATICOBSERVATION ............................................. 231
8.1 Climate research and observations in general ...... 2318.2 Research .................................................................232
8.2.1 Research policy and funding ....................2328.2.2 Climate processes and studies including palaeoclimatic studies.............................. 2338.2.3 Climate modelling and the climate of the future ..............................................2368.2.4 Effects of climate change .........................2388.2.5 Economic research, including evaluation of climate change and
possibilities for mitigation .......................2398.2.6 Research and development of
technologies to reduce greenhouse gas emissions and to adapt to climate change......................................... 2408.3 Systematic climate observations ...........................243
8.3.1 Atmospheric climate observations, including measurements of the composition of the atmosphere...............2438.3.2 Ice observation service ............................ 2468.3.3 Stratospheric observations ..................... 2468.3.4 Reanalyses and climate databases...........2478.3.5 Oceanographic climate observations ......2478.3.6 Terrestrial observations related to
climate changes........................................2488.3.7 Development assistance for establishment and maintenance of observation and monitoring systems ......248
9 EDUCATION, TRAINING AND PUBLICAWARENESS................................................. 251
9.1 Education and postgraduate education programmes ........................................................... 251
9.2 Climate information ............................................... 2529.3 Danish participation in international climate
activities.................................................................. 2539.4 Public campaigns ...................................................254
ANNEXES ......................................................... 256
DATA SHEET ..........................................................404

5Denmark's Fourth National Communication on Climate Change
ANNEX A GREENHOUSE GAS INVENTORIES 1990-2003...................................275
ANNEX B MEASURES AND THE EFFECT OF EFFORTS 1990-2001 ................... 264
B1: DATA SHEETS FOR MEASURES THAT AFFECT GREENHOUSE GAS EMISSIONS AND REMOVALS........................... 266
B2: EXECUTIVE SUMMARY OF THE EFFORTS ANALYSIS AND SECTION SUMMING UP THE EFFECTS OF THE MEASURES ANALYSED..........................................................................327
ANNEX C DESCRIPTION OF SELECTED JI PROJECTS .........................................338
ANNEX D SUPPLEMENTARY INFORMATION ON THE ALLOWANCE SCHEME IN DENMARK.................................................339
D1: INSTALLATIONS COVERED BY THE ACT ON CO2 ALLOWANCES 2005-2007. ................................................................... 346
D2: INFORMATION ON DENMARK’S NATIONAL CO2 EMISSIONS TRADING REGISTRY ....................................................... 346
ANNEX E RESULTS AND SUPPLEMENTARY INFORMATION CONCERNING GREENHOUSE GAS PROJECTIONS.......................... 349
E1: THE RESULTS OF DENMARK’S MAY 2005 ‘WITH MEASURES’ PROJECTION OF GREENHOUSE GAS EMISSIONS 2004-2030.........350
E2: A BRIEF DESCRIPTION OF THE WORK INVOLVED IN PREPARING THE ENERGY PROJECTIONS. ......................................... 358
ANNEX F DESCRIPTION OF SELECTED PROGRAMMES/PROJECTS TO ADVANCE AND/OR FINANCE TRANSFER OF TECHNOLOGIES TO OTHER COUNTRIES....................................................................... 362
ANNEX G LIST OF SELECTED RECENT AND CURRENT CLIMATE-RELATED RESEARCH PROJECTS ......................................... 366
ANNEX H DENMARK’S REPORT ON SYSTEMATIC CLIMATE OBSERVATIONS FOR THE GLOBAL CLIMATE OBSERVING SYSTEM (GCOS).................................................................................... 279
ANNEX I LITERATURE............................................................................................397
6 Denmark's Fourth National Communication on Climate Change
I am pleased to present Denmark’s Fourth National Com-
munication under the United Nations Framework Conven-
tion on Climate Change.
This Fourth National Communication contains information
on the action taken by Denmark, Greenland, and the Faroe
Islands on the commitments under the UN Framework
Convention on Climate Change.
The ultimate objective of the UN Framework Convention
on Climate Change is to achieve ”stabilization of green-
house gas concentrations in the atmosphere at a level that
would prevent dangerous anthropogenic interference with
the climate system”.
The Third Assessment Report from the UN Intergovern-
mental Panel on Climate Change (IPCC) shows that there
is now stronger evidence for human influence on the global
climate than previously assumed, and that most of the ob-
served warming at the earth’s surface over the last 50 years
is likely to have been due to human activities. The February
2005 Exeter Stabilisation Conference concluded that there
is strong evidence, that climate change due to anthropogenic
emissions of greenhouse gases is already occurring and that
it will result in changes in frequency, intensity and duration
of extreme weather and climate events.
The exact extent of future climate change is not known.
However, the risk that climate change will affect humans
Foreword
7Denmark's Fourth National Communication on Climate Change
and the environment in both the developed and the less
developed parts of the world is of great concern to the Dan-
ish government. The Danish government will continue its
efforts to reduce greenhouse gas emissions both at national
and at global level. This task involves fulfilling the com-
mitments under the Kyoto Protocol and the agreement on
joint fulfilment of the EU’s target under the Protocol, and
it involves exploring how to further the UN Framework
Convention on Climate Change by developing a post 2012
agreement.
The climate challenge requires further targeted and long-
term action both at international and national level. At the
international level, negotiations on an agreement on further
action after 2012 are a major global challenge. The way
forward is to ensure broader participation, which can lead
to significantly more ambitious greenhouse gas emission
reduction targets. As decided by the European Council in
March 2005, the industrialised countries should continue to
lead the way, with ambitious emission reductions, and by
granting assistance to developing countries through transfers
of technology and capacity-building to promote sustainable
development. There are many technological opportunities
to promote economic development while at the same time
contributing to reductions in emissions of greenhouse gases.
In a Danish context renewable energy is a good example
that could give inspiration to other countries.
Copenhagen, December 2005
Connie Hedegaard
MINISTER FOR THE ENVIRONMENT

8 Denmark's Fourth National Communication on Climate Change8

9Denmark's Fourth National Communication on Climate Change
Introduction
9
At the United Nations Conference on Environment and Development in Rio de Janeiro in June 1992, more than 150 countries signed the UN Framework Convention on Climate Change (the Climate Convention).
On 21 December 1993 the Climate Convention was ratified by a suffi-cient number of countries, including Denmark, for it to enter into force on 21 March 1994.
This report is Denmark’s Fourth National Communication under the Climate Convention. Since Den-mark’s ratification of the Climate Convention covers the entire Realm, the report also includes information on Greenland and the Faroe Islands. The report is organised in accor-dance with the guidelines for nation-al communications adopted by the parties to the Climate Convention.
In addition to efforts described in this report, Denmark also con-tributes to the European Union’s common efforts under the Climate Convention and the Kyoto Proto-col. Such efforts have – and will in the future – be transposed by implementation of common and coordinated policies and measures to reduce greenhouse gas emissions, including under the European Cli-mate Change Programme (ECCP). Further information on the EU’s climate policy etc. is available in the EU’s Fourth National Communica-tion.
The Danish EPA has been in charge of coordinating the work relating to Denmark’s Fourth National Com-munication. Contributions have been made by the following institu-tions:
The Danish Forest and Nature Agency,The National Environmental ResearchInstitute,The Geological Survey of Denmarkand Greenland,The Danish Energy Authority,The Ministry of Foreign Affairs,The Ministry of Finance,The Ministry of TaxationThe Ministry of Transport and Energy,The Danish Meteorological Institute,The Danish Coastal Authority,The Ministry of Food, Agriculture andFisheries,The Danish Institute of AgriculturalSciences,Forest and Landscape Denmark, TheRoyal Veterinary and Agricultural Uni-versityThe Greenland Home Rule, includingthe Department for Environment andNature,The Faroe Home Rule, including theMinistry of the Interior,Statistics Denmark,Risø National Laboratory,University of Copenhagen,University of Aarhus,The Technical University of Denmark,The Institute of Local GovernmentStudies - Denmark,The Royal Veterinary and AgriculturalUniversity.

10 Denmark's Fourth National Communication on Climate Change10

11Denmark's Fourth National Communication on Climate Change
1.1 NATIONAL CIRCUMSTANCES REL-EVANT TO GREENHOUSE GAS EMIS-SIONS AND REMOVALS
1.1.1 GeneralThe Kingdom of Denmark – the Realm - comprises Denmark, Greenland and the Faroe Islands. The UN Framework Convention on Climate Changes has been ratified on behalf of all three parts of the Realm.
Today, Denmark has a popula-tion of 5.4 mill. and a total area of 43,000 km2. More than 66% of the area is used for agricultural purpos-es, while 11% is forested and 10% is towns, roads and scattered hous-ing, while the rest consists of natural areas, including lakes, watercourses, heath, etc.
The Danish climate is temperate with precipitation evenly distributed over the year. The mean annual temperature is 7.7ºC and mean an-nual precipitation is 712 mm.
Since 1993 economic growth in Denmark has been considerable, with GDP (Gross Domestic Prod-uct) rising at an average of 2.7% per year. In 2003, GDP amounted to DKK 1,400 billion, corresponding to DKK 260,000 per capita.
1.1.2 Energy, transport, and the domestic sector
Denmark is self-sufficient in energy, due primarily to the production of oil and gas in the North Sea, but renewable energy is also increasingly
contributing to the energy supply. Denmark’s total own production of energy almost more than tripled since 1990.
Despite the economic growth, total energy consumption has remained largely unchanged at approximately 800 PJ since 1980. Denmark’s de-pendence on oil and coal has fallen, and particularly within electricity and heat production, Denmark has succeeded in substituting with other fuels. Renewable energy accounts for about 14% of Denmark’s actual energy consumption.
The actual (non-adjusted) energy consumption in 2003 was 863 PJ and was distributed over the fol-lowing energy sources: oil 343 PJ (40%), natural gas 195 PJ (23%), coal 238 PJ (28%), and renewable energy 117 PJ (14%). The net ex-port of electricity was significant in 2003, corresponding to 31 PJ (-4%).
The distribution of gross energy consumption (energy consumption adjusted for foreign electricity trade) in 2003 was as follows: industry and agriculture accounted for 26%, do-mestic sector for 27%, transport for 25% and commerce and service for 15%. Refining and non-energy pur-poses accounted for the remaining 7%. More than 2/3 of the electricity supply comes from large primary power stations or CHP plants, while the district heat supply covers al-most half of the need for heating. Energy production and supply alone account for 44% of Denmark’s total emissions of greenhouse gases.
1. Executive Summary
11
12 Denmark's Fourth National Communication on Climate Change
The domestic sector accounted for 6% of Denmark’s total greenhouse gas emissions in 2003.
Transport activity, energy con-sumption and CO2 emissions within the transport sector have devel-oped largely in step with economic growth. In 2003, passenger and goods transport performances were 14% and 44% above the 1990 levels respectively. In 2003, CO2 emis-sions by the transport sector were about 22% over the 1990 level and accounted for 22% of Denmark’s to-tal CO2 emissions and 18% of total greenhouse gas emissions.
1.1.3 Business sector and wasteIndustry’s production value accounts for about 30% of total production. The largest sectors of industry are food and beverages, engineering, electronics and the chemical indus-try. The total business sector (in-dustry, building and construction, together with public and private services) accounts for about 13% of Denmark’s total emissions of green-house gases. This does not include emissions connected to the sector’s consumption of electricity and dis-trict heating, since these emissions from power and heat plants are in-cluded in the emission calculations for energy. By far the largest part of these emissions, is CO2 from energy consumption, but the sector is also a source of emissions of industrial greenhouse gases.
The waste sector’s methane emis-sions account for 2% of the total greenhouse gas emissions in 2003.
Methane emissions from the waste sector are expected to fall in the future due to the obligation the mu-nicipalities have had since 1997 to send combustible waste for incinera-tion. In addition, gas from a number of landfill sites is used in energy production, which helps to reduce both CO2 and methane emissions.
1.1.4 Agriculture and forestryOver the last 40 years, the agricul-tural area in Denmark has fallen from 72% (30,900 km2) of the total area in 1960 to 62% (26,578 km2)in 2003. The number of farms has fallen by 50%, from 119,155 in 1980 to 48,613 in 2003, while the average size of farms has increased by more than 100% in the same period, from 24 ha to 54 ha. At approximately 11%, agricultural ex-ports still account for a considerable proportion of all Danish export. Ag-riculture accounted for approximate-ly 17% of Denmark’s total emissions of greenhouse gases in 2003.
Approximately 11% of Denmark is forested, and the Forestry Act pro-tects a very large part of the exist-ing forest from other land use. The ambition is to have about 20-25% of Denmark’s area forested by the end of the 21st century.
1.1.5 Greenland and the Faroe Islands
Greenland is the world’s largest is-land, with an area of 2.2 mill. km2,85% of which is covered by the ice sheet. From north to south, Green-land extends over 2,600 km. Green-land has a population of slightly
12

13Denmark's Fourth National Communication on Climate Change
more than 56,000, and fishing is the main occupation.
Greenland’s climate is Arctic, and forests do not grow in Greenland. The warmest recorded temperature since 1958 is 25.5ºC, while temper-atures can go down below -70ºC on the inland ice sheet.
The Faroe Islands consist of 18 is-lands with a total area of 1,399 km2
and have a population of just over 48,000. The climate is characterised by mild winters and cool summers and the weather is often moist and rainy. The mean annual temperature is 6.5ºC.
Fish and fisheries account for 98-99% of the Faroe Islands’ total ex-port earnings, apart from exports of ships, which vary greatly over the years. Agriculture was the main oc-cupation until the end of the 19th century but now only accounts for 0.3% of gross national product at factor cost. There are about 1,200 head of cattle and about 70,000 sheep on the Faroe Islands.
1.2 GREENHOUSE GAS INVENTORY
INFORMATION
Denmark’s greenhouse gas invento-ries are prepared in accordance with the guidelines from the Intergovern-mental Panel on Climate Change (IPCC) and are based on the meth-ods developed under the European CORINAIR programme.
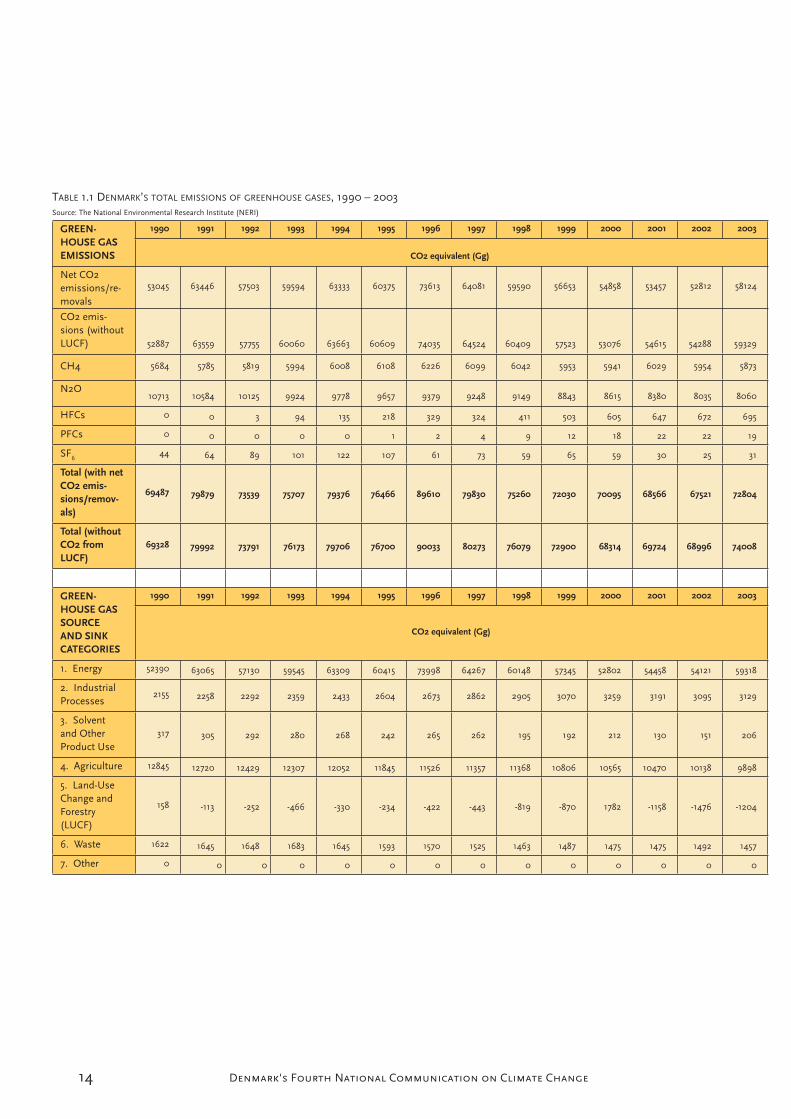
Table 1.1 shows Denmark’s total emissions of the greenhouse gases CO2, CH4 and N2O and the in-dustrial gases HFCs, PFCs and SF6 from 1990 to 2003, calculated in CO2 equivalents in accordance with the general rules for invento-ries under the Climate Convention. Inventory based on the rules under the Kyoto Protocol will involve some changes with respect to base year and removals in connection with land use change and forestry (LUCF). The increase of 7.3% from 2002 to 2003 is due to large exports of electricity to other Nordic coun-tries.
1.2.1 Carbon dioxide, CO2
Almost all CO2 emissions come from combustion of coal, oil and natural gas for energy production, although road transport also con-tributes a considerable proportion - about 22%. The relatively large fluc-tuations in the emissions from year to year are due to trade in electricity with other countries - primarily the Nordic countries.
In 2003, total actual CO2 emissions inventoried under the Climate Con-vention, excluding land-use change and forestry (LUCF), were 12% higher than in 1990. If LUCF is included, net emissions were 10% higher. Corrected for exchange of electricity with other countries and annual temperature variations, CO2
emissions dropped 13% with and 15% without LUCF during the same period.
13
14 Denmark's Fourth National Communication on Climate Change14
TABLE 1.1 DENMARK’S TOTAL EMISSIONS OF GREENHOUSE GASES, 1990 – 2003Source: The National Environmental Research Institute (NERI)
GREEN-HOUSE GASEMISSIONS
1990 1991 1992 1993 1994 1995 1996 1997 1998 1999 2000 2001 2002 2003
CO2 equivalent (Gg)
Net CO2emissions/re-movals
53045 63446 57503 59594 63333 60375 73613 64081 59590 56653 54858 53457 52812 58124
CO2 emis-sions (withoutLUCF) 52887 63559 57755 60060 63663 60609 74035 64524 60409 57523 53076 54615 54288 59329
CH4 5684 5785 5819 5994 6008 6108 6226 6099 6042 5953 5941 6029 5954 5873
N2O10713 10584 10125 9924 9778 9657 9379 9248 9149 8843 8615 8380 8035 8060
HFCs 0 0 3 94 135 218 329 324 411 503 605 647 672 695
PFCs 0 0 0 0 0 1 2 4 9 12 18 22 22 19
SF644 64 89 101 122 107 61 73 59 65 59 30 25 31
Total (with net CO2 emis-sions/remov-als)
69487 79879 73539 75707 79376 76466 89610 79830 75260 72030 70095 68566 67521 72804
Total (without CO2 from LUCF)
69328 79992 73791 76173 79706 76700 90033 80273 76079 72900 68314 69724 68996 74008
GREEN-HOUSE GASSOURCEAND SINKCATEGORIES
1990 1991 1992 1993 1994 1995 1996 1997 1998 1999 2000 2001 2002 2003
CO2 equivalent (Gg)
1. Energy 52390 63065 57130 59545 63309 60415 73998 64267 60148 57345 52802 54458 54121 59318
2. IndustrialProcesses
2155 2258 2292 2359 2433 2604 2673 2862 2905 3070 3259 3191 3095 3129
3. Solventand OtherProduct Use
317 305 292 280 268 242 265 262 195 192 212 130 151 206
4. Agriculture 12845 12720 12429 12307 12052 11845 11526 11357 11368 10806 10565 10470 10138 9898
5. Land-UseChange andForestry(LUCF)
158 -113 -252 -466 -330 -234 -422 -443 -819 -870 1782 -1158 -1476 -1204
6. Waste 1622 1645 1648 1683 1645 1593 1570 1525 1463 1487 1475 1475 1492 1457
7. Other 0 0 0 0 0 0 0 0 0 0 0 0 0 0

15Denmark's Fourth National Communication on Climate Change
The reduction since 1990 is due, in particular, to a significant change in the use of fuels in energy produc-tion from coal to natural gas and renewable energy, more widespread use of CHP and improved energy efficiency.
1.2.2 Methane, CH4
The biggest source of man-made methane emissions is agriculture, followed by landfill sites and energy production. The emissions from agriculture are due to enteric fer-mentation in farm animals and the handling of manure.
Emissions of methane from landfills are decreasing, because the produc-tion of methane has fallen year by year since the abrupt fall in landfill-ing in 1997.
The emissions from energy produc-tion have been rising with increasing use of gas engines. It is expected that these emissions will decrease, when new legislation come into force in 2006.
1.2.3 Nitrous oxide, N2OAgriculture is by far the main source of emissions of nitrous oxide be-cause this forms in soil through bacterial conversion of nitrogen in fertiliser and manure. Bacterial con-version of nitrogen also occurs in drain water and coastal water. It will be seen that there has been a 30% fall in nitrous oxide emissions from agriculture since 1990. That is due to less and better use of fertiliser. A small proportion of the nitrous oxide emissions comes from the ex-
haust of cars fitted with a catalytic converter.
In 2003, total nitrous oxide emis-sions were 25% below the 1990 level.
1.2.4 The industrial gases HFCs,PFCs and SF6
The contribution of industrial greenhouse gases (HFCs, PFCs and SF6) to Denmark’s total emissions of greenhouse gases is relatively modest, but in percentage terms, the emissions of these gases showed the biggest rise during the 1990s. The HFCs, which are primarily used in the refrigeration industry, are the biggest contributor to emissions of industrial greenhouse gases. In 2003 industrial gases accounted for a little over 1% of total emissions of green-house gases, corresponding to ap-proximately 750,000 tonnes of CO2
equivalents. In 2001 and 2002 new regulatory instruments, including both taxes and bans, were adopted. This has meant that the increase rate in emissions of industrial gases has fallen, so that significant in-creases from year to year have been replaced by small increases.
1.2.5 Denmark’s, Greenland’s and the Faroe Islands’ total emissions and removals of greenhouse gases
The total inventories for Denmark, Greenland and the Faroe Islands are reproduced in Table 1.2. As will be seen, the Climate Convention’s goal of reduction of the emissions to the 1990 level in 2000 was achieved, since emissions in 2000 were 1.4%
15

16 Denmark's Fourth National Communication on Climate Change
below the 1990 level. If emissions and removals from land use change and forestry are included, 2000 did, however, show an increase of just under 1% due to windfalls in Danish forests in December 1999.
For the time being, the inventories from Greenland contain only inven-tories of the CO2 emissions from combustion of fossil fuels. However, this is regarded as by far the main source of greenhouse gases.
16
TABLE 1.2 DENMARK’S, GREENLAND’S AND THE FAROE ISLANDS’ TOTAL EMISSIONS AND REMOVALS OF GREENHOUSE GASES, 1990 – 2003Source: The National Environmental Research Institute (NERI)
GREEN-HOUSE GASEMISSIONS
1990 1991 1992 1993 1994 1995 1996 1997 1998 1999 2000 2001 2002 2003
CO2 equivalent (Gg)
Net CO2emissions/re-movals
54378 64737 58747 60130 64371 61439 74755 65215 60756 57883 56216 54865 54180 59549
CO2 emis-sions (withoutLUCF) 54220 64850 58999 60596 64701 61673 75177 65658 61575 58753 54434 56023 55656 60754
CH4 5702 5804 5837 6012 6027 6127 6245 6119 6061 5973 5961 6049 5975 5894
N2O 10736 10609 10149 9947 9803 9683 9404 9275 9175 8870 8645 8411 8066 8091
HFCs 0 0 3 94 135 218 329 324 411 503 605 647 672 695
PFCs 0 0 0 0 0 1 2 4 9 12 18 22 22 19
SF6 44 64 89 101 122 107 61 73 59 65 59 30 25 31
Total (with net CO2 emis-sions/remov-als)
70860 81213 74826 76284 80457 77574 90796 81010 76471 73306 71504 70026 68940 74280
Total (without CO2 from LUCF)
70702 81326 75078 76750 80788 77808 91219 81453 77290 74176 69722 71184 70416 75485
GREEN-HOUSE GASSOURCEAND SINKCATEGORIES
1990 1991 1992 1993 1994 1995 1996 1997 1998 1999 2000 2001 2002 2003
CO2 equivalent (Gg)
1. Energy 52390 63065 57130 59545 63309 60415 73998 64267 60148 57345 52802 54458 54121 59318
2. IndustrialProcesses
2155 2258 2292 2359 2433 2604 2673 2862 2905 3070 3259 3191 3095 3129
3. Solventand OtherProduct Use
317 305 292 280 268 242 265 262 195 192 212 130 151 206
4. Agriculture 12845 12720 12429 12307 12052 11845 11526 11357 11368 10806 10565 10470 10138 9898
5. Land-UseChange andForestry(LUCF)
158 -113 -252 -466 -330 -234 -422 -443 -819 -870 1782 -1158 -1476 -1204
6. Waste 1622 1645 1648 1683 1645 1593 1570 1525 1463 1487 1475 1475 1492 1457
7. Other 1374 1334 1287 577 1082 1108 1186 1180 1211 1276 1408 1460 1420 1477

17Denmark's Fourth National Communication on Climate Change
The inventories for the Faroe Is-lands contain not only the CO2
emissions from fossil fuel but also the methane and nitrous oxide emis-sions.
1.2.6 Further information under the Kyoto Protocol
The National Environmental Re-search Institute of Denmark (NERI) is the contact point for the national system for greenhouse gas inven-tories, and this is being adapted to comply with Article 5, paragraph 1 of the Kyoto Protocol and the regu-lations issued in this connection.
This work includes formal agree-ment on data supplies and manuals for quality assurance and quality control of the inventories.
The emission inventories will, fur-ther to recent years’ improvements with the inclusion of minor emis-sions from wastewater treatment and certain industrial processes, be extended to include other emissions from industrial processes, and the documentation for national emission factors will be improved.
As regards the future emission inventories under the Kyoto Pro-tocol, note that Denmark chose 1995 as the base year for industrial greenhouse gases. Moreover, in the preliminary inventories under the Protocol only the removals in forests occurring as a consequence of affor-estation since 1990 are included so far, cf. Article 3, paragraph 3 of the Protocol.
1.3 POLICIES AND MEASURES
Since the end of the 1980s and during the 1990s a considerable number of measures have been im-plemented that have reduced the emissions of greenhouse gases.
In February 2003 the government published Denmark’s new Climate Strategy. Cost effectiveness is a vital planning consideration in order to achieve cost-effective solutions in environment efforts. The basis of the strategy is that Denmark must fulfil its international climate obliga-tions under the Kyoto Protocol and according to the subsequent burden-sharing agreement in the EU.
The Kyoto Protocol offers the possi-bility of planning climate action that is flexible as regards the use of both domestic and international meas-ures and that, globally, gives more cost-effective solutions in environ-ment efforts. The Climate Strategy combines cost-effective domestic measures with use of the Kyoto Pro-tocol’s flexible mechanisms.
Follow-up on the Climate Strategy in generalIn order to ensure cost-effectiveness in climate policy, as part of the fol-low-up on the Climate Strategy, the government decided to appoint a standing climate committee to fol-low up regularly on the deficit and ensure cost-effective implementation of the climate policy. In 2006 the climate committee is to co-ordinate the preparation of a progress report on the fulfilment of Denmark’s re-
17

18 Denmark's Fourth National Communication on Climate Change
duction commitment and up-date calculations concerning measures with regard to costs and potentials, aimed at a possible revision of Den-mark’s Climate Strategy. An element in this report will be the results of the Policies and Measures Project, which e.g. continues to investi-gate the potential of new domestic measures where previous calcula-tions have indicated relatively low reduction costs. It also investigates more closely whether new informa-tion exists that could contribute to reducing previously calculated costs further, and whether additional cost-effective national measures could be found.
However, it is likely that still only relatively few domestic actions with a significant potential, would be cost-effective compared to the use of the flexible mechanisms. This must be seen in the light of the fact that Denmark has already made a massive national effort up through the 1990s as documented in the report “Denmark’s CO2 emissions - the effort in the period 1990-2001 and the associated costs “ from March 2005.
Measures and effects across sectorsFor many of the energy producers and a large part of the energy-in-tensive industry, the Danish im-plementation of the EU Directive establishing a scheme for green-house gas emission allowance trad-ing within the Community will form the framework for Danish efforts. The companies that are covered by the scheme, and whose activity thus
becomes limited by a quota, can plan their climate action themselves. They can choose to reduce their own emissions when this is most appropriate, or they can buy allow-ances or credits from project-based emission reductions when this is considered most appropriate. The companies covered by the scheme will thus have the possibility of on-going adjustment of their action so that it is always as effective as pos-sible.
Besides quotas and the use of flex-ible mechanisms, the Climate Strat-egy includes a number of national measures, including existing meas-ures that are being continued and new, potential measures that will be considered on the way.
Since the reduction costs in the different sectors are continuously changing, in part due to technology development and changed economic framework conditions, the strategy includes regular evaluation of the action so that the most cost-effective policies and measures are identified.
In a comparison with the national mechanisms it is important to be aware that these must typically be seen in a sector-political context, in which climate is only one among many considerations in the policy being planned. For example, a fun-damental consideration in the energy sector is security of supply, which is improved by lower energy consump-tion and a multiple energy supply.
18
19Denmark's Fourth National Communication on Climate Change
The levels of taxes and duties are also having an effect on several greenhouse gas emitting activities across sectors. Denmark has spe-cial taxes on motor vehicles, energy products, alcohol, tobacco, and a number of other products. During the 1990s a number of new environ-mental taxes were introduced. These taxes were imposed on consumer goods that caused pollution or were scarce (water, energy products such as such as oil, petrol, electricity, etc.) or on discharges of polluting substances (CO2, HFCs, PVC, SF6,SO2, and sewage). Taxes are im-posed on mineral oil, tobacco, and alcohol in accordance with EU leg-islation. The CO2 taxes are among the subjects to be dealt with by a committee set up by the Minister for Taxation. The objective of the committee is to analyse the CO2 tax-es in relation to the CO2 allowance scheme, which entered into force on 1 January 2005, as well as to inves-tigate whether the energy taxation system can be designed more appro-priately. The committee is expected to end its work in spring 2007.
The energy sectorEnergy production and energy-con-suming activities in the different sec-tors are the main contributors to the total emissions of CO2 due to use of large quantities of coal, oil and natu-ral gas. This is due to use of large quantities of coal, oil and natural gas. The energy sector is therefore pivotal in the efforts to reduce the emissions of CO2.
The goal of the energy policy today is to create well-functioning energy markets within frameworks that se-cure cost-effective solutions, security of supply, environmental concerns and efficient use of energy.
The goal of the 1970s energy policy was to prevent supply crises using a multiple energy supply, which reduced dependency on oil. In the 1980s, the main focus was to protect against large and external increases in energy prices through increased focus on self-sufficiency, co-production and macroeconomic considerations. In the 1990s the goal was the development of a sustain-able energy sector.
Energy-policy key considerations have thus been both multi-faceted and changing as the goals were met and new challenges appeared. Over a number of years, many initiatives have been taken that have yielded positive results for society. At the same time, CO2 emissions have been reduced in a number of sectors.
First, this success is due to signifi-cant efforts in the transformation sector. Particularly in the production of electricity and heat there has been a substantial increase in co-produc-tion and substitution with other fuels. Thus, natural gas, waste and biomass are increasingly being used in small-scale and industrial CHP plants, natural gas and renewable energy is increasingly being used in large scale electricity production, and natural gas is increasingly being
19

20 Denmark's Fourth National Communication on Climate Change
used for individual heating of build-ings.
This development is emphasised by the fact that gross energy consump-tion (actual energy consumption adjusted for foreign electricity trade) only went up from 816 PJ in 1980 to 829 PJ in 2003, whereas GDP grew by 50% in the period. If we only look at CO2 emissions adjusted for climate and foreign electricity trade, the conversion sector’s CO2
emissions fell by about ¼ in the pe-riod.
Moreover, there have been active ef-forts to make energy use in all end uses more efficient. Denmark has thus been a pioneer country as re-gards broad political agreements on energy savings efforts that have de-veloped new policies and measures to limit energy consumption.
This is underlined by the trend in the final energy consumption, i.e. the energy consumption by the end user in the different sectors. The total final energy consumption in the domestic sector, agriculture and industry, commerce and serv-ice and the public sector today is about 3.5% lower than in 1980. At the same time, GDP grew by about 50%, and this means that energy consumption per GDP unit (inten-sity) fell by 34%, corresponding to an average 1.9% per year. This very positive development is summarised in Figure 1.1.
The development in final energy consumption analysed by sectors is shown in Figure 1.2.
A vast range of measures have been applied over the years to achieve the various energy policy objectives mentioned above.
Taxes have been used for a number of years as measures which also lead to a reduction of the CO2 emissions from the energy sector - partly with a view to a general reduction and partly to promote the use of fuels with lower CO2 emissions, mainly biomass. This includes lower CO2
emissions, e.g. natural gas and bio-mass. Such taxes are still being used.
Increased use of CHP and enlarging the areas receiving district heat have been main elements of the Danish strategy to promote efficient use of energy resources ever since the end of the 1970s.
Renewable energy sources have been promoted with economic meas-ures, including the tax system and through production grants.
From 2005 energy producers and parts of the energy-intensive indus-try are covered by the EU’s CO2
allowance scheme. The allowance scheme will be the most important measure in Denmark’s fulfilment of its climate obligations under the Kyoto Protocol. The allowance scheme permits significant improve-ments to the cost-effectiveness of Denmark’s climate policies and measures and forms a main element
20

22 Denmark's Fourth National Communication on Climate Change
initiatives to reduce the emissions from the business sector include promotion of energy savings and energy efficiency improvements, conversion of energy production to cleaner fuels and initiatives to reduce the emissions of industrial gases. As an extension of the politi-cal agreement of 10 June 2005 to significantly strengthen energy-sav-ing efforts, new initiatives will be commenced during 2005 and 2006.
Work to improve energy efficiency in the public sector has been go-ing on for more than 10 years, and considerable savings have been achieved. However, there are still economically viable possibilities for savings. As an extension of the Report on Energy Savings of May 2003 and the Danish government’s draft action plan from December 2004 for a renewed energy-saving effort, a new circular on energy-ef-ficiency in state institutions was sent out in the spring of 2005. This circular requires that in the future institutions must implement savings initiatives with a reasonable repay-ment period and place priority on energy efficiency when purchasing appliances and equipment. In ac-cordance with the political agree-ment on energy-saving efforts, discussions will be initiated with municipal and regional authorities on meeting the requirements that also apply to state institutions for energy-efficient procurement and achievement of energy savings based on a five-year payback time.
The regulation of emissions of the industrial greenhouse gases (HFCs, PFCs and SF6) is 2-phased, consist-ing partly in a tax and partly in a statutory order on discontinuation of the use of the gases in new instal-lations. The tax is imposed on the substances on importation because none of them is produced in Den-mark.
In July 2002 a statutory order on regulation of the industrial green-house gases entered into force. It includes a general ban on use of the industrial greenhouse gases in a wide range of new installations/prod-ucts from 1 January 2006, including, for example, domestic refrigerators and freezers, PUR foam, etc.
Agriculture, forestry and fisheriesWithin the agricultural sector the following measures have reduced, or will reduce, emissions: ban on burn-ing straw on fields, Action Plans for the Aquatic Environment I and II and the Action Plan for Sustain-able Agriculture, Action Plan for the Aquatic Environment III and the CAP reform, the Ammonia Action Plan and an amended Statutory Or-der on Manure, action plan for joint biogas installations) and support for planting of windbreaks.
The Action Plans for the Aquatic Environment and the Action Plan for Sustainable Agriculture have, in particular, reduced the emissions of nitrous oxide, and most of the changes in emissions of nitrous ox-ide from the agriculture sector that
22

23Denmark's Fourth National Communication on Climate Change
have taken place since 1990 can be attributed to these action plans.
2001 brought the adoption of an Ammonia Action Plan which, to-gether with Action Plans for the Aquatic Environment I (1987), II (1998) and III (2004), will reduce ammonia evaporation.
The purpose of banning burning of straw has been to reduce air pollu-tion from this activity. The ban has resulted in greater return of carbon to the soil and increased use of straw as a fuel.
Conversion of manure from biogas and other organic waste in biogas plants provides the opportunity to reduce methane emissions from ma-nure management at the same time as producing energy.
Planting of windbreaks contributes to reducing wind erosion and also leads to greater biodiversity in the landscape. Moreover, removal of CO2 takes place in the woody bio-mass of the windbreaks.
The national forest programme in-cludes evaluation of the possibilities offered by the Kyoto Protocol for economically viable CO2 sequestra-tion in forests. The political goal with the most direct influence on increased carbon sequestration is the declaration of intent from 1989 to double the forested area in Den-mark within 100 years. Various measures have been taken towards achieving this goal. For instance, a government grant scheme has been
establish that supports private affor-estation on agricultural land and the state itself establishes new forests. In addition, some private individuals choose to establish forests on agri-cultural land without a government grant.
The domestic sectorWith a view to reducing both direct and indirect CO2 emissions from the domestic sector, a wide range of initiatives have been launched. The initiatives promote electricity sav-ings, savings in energy consumption for space heating and fuel conver-sion (from electric heat and oil to district heat, natural gas and renew-able energy).
As a follow-up to the Report on Energy Savings of May 2003, a number of new initiatives have been commenced, including promoting particularly energy-efficient refrig-erators and freezers, phasing-out traditional double glazing (voluntary agreement), initiatives in relation to boilers and circulation pumps, reducing energy consumption for standby and strengthening of re-search and development activities.
Following the political agreement of 10 June 2005 to considerably strengthen energy-saving efforts, new initiatives will be launched dur-ing 2005 and 2006.
Political agreement on energy savingsAs a follow-up to the agreements of 29 March 2004, the Danish govern-ment presented a draft action plan
23
24 Denmark's Fourth National Communication on Climate Change24
for a renewed energy-saving effort on 29 December 2004.
On 10 June 2005 the government made a broad political agreement to significantly strengthen energy-sav-ing efforts. The agreement is ambi-tious, and sets the framework for efficient and increased energy-sav-ing efforts in the coming years. The parties to the agreement agree that overall energy consumption (exclud-ing transport) are to be reduced. Strengthened efforts will be made to attain specific and verifiable energy savings corresponding to 7.5 PJ per year on average in the period 2006-2013. Important parts of the energy savings will be achieved by better energy-saving performance by grid and distribution companies within electricity, natural gas, district heat-ing and oil.
The government’s objective is to promote energy saving initiatives to allow Denmark to remain at the forefront with regard to energy ef-ficiency. The initiatives will be based on economically justifiable invest-ments, environmental consideration and advancement of Danish energy and building technology. Measures aimed at reducing energy consump-tion include more stringent energy provisions in building regulations, new improved energy labelling, bet-ter inspection of boilers and venti-lation systems, special initiative in the public sector, and reorganisa-tion of the energy savings initiatives of energy companies. Overall, the government’s action plan and the political agreement entail a signifi-
cant strengthening of overall energy-saving efforts.
Energy strategy 2025In June 2005 the government pre-sented a new long-term energy strat-egy – Energy Strategy 2025. The strategy is an overall and coherent presentation of the government’s long-term energy policy. At the core of the strategy is a clear market-based energy-political objective, in which public authorities provide the framework for the market actors. Thus, the Energy Strategy is based on:
- liberalised energy markets with common EU framework
- market-based cost-effective in-struments, and
- public authorities providing the overall grid infrastructure and economic instruments, including the CO2 allowance scheme.
In line with this, the strategy does not propose quantitative objectives for the extension of renewable ener-gy, however it sets the stage for and envisages a market-based increase in the use of renewable energy. It also underlines the importance of strengthened research and develop-ment of new energy technologies. Finally, it focuses on the transport sector. A committee will be set up to discuss the overall perspectives for alternative propellants in the trans-port sector, including biofuels.

25Denmark's Fourth National Communication on Climate Change
The Energy Strategy also assesses the need for extending the overall electricity transmission network. The government recommends that a power line be established below the Great Belt, and that Energinet.dk, cooperating with Statnett, make a detailed study of the financial as-pects of strengthening the Skagerak power cable.
The waste sectorThe waste sector’s contribution to reduction of greenhouse gas emis-sions consists mainly in: reducing landfilling of organic waste, utilising gas from discontinued/existing land-fill sites and the waste as an energy source.
The Statutory Order on Waste was amended from 1 January 1997, to introduce a municipal obligation to assign combustible waste to incin-eration (corresponding to a ban on landfilling combustible waste). As a result of this, large quantities of combustible waste that used to go to landfill sites are now either recy-cled or used as fuel in Denmark’s incineration plants. Future action will consist mainly in a continued ban on landfilling of combustible waste and implementation of Waste Strategy 2005-2008.
GreenlandGreenland will work to promote use of renewable and environmentally friendly energy (water, wind power, solar energy, hydrogen) which in the long term will reduce CO2 emissionsand make Greenland less depend-ent on fossil fuels. The goal is to
achieve the greatest financial and energy savings, to reduce the vul-nerability of energy supply through utilisation of renewable energy and make the production and supply system more efficient.
Until the publication of the Green-land Energy Plan 2010 in 1995, the requirement for security of supply and the energy policy guidelines from 1986 meant that the main fo-cus of was to be hydropower as one of the all-important energy policy objectives in Greenland.
With Energy Plan 2010, for the first time the Home Rule presented a complete review of the energy sector and an action plan for its develop-ment and set up a more differenti-ated main energy policy objective of “establishing an energy supply that does not compromise security of supply and that ensures the least possible economic and environmen-tal burden for society and the other energy players”.
Both before and since 1995, policies and measures have been adopted and implemented in the energy sec-tor that have reduction of green-house gas emissions as one, al-though not in most cases the main, objective. Some of the most impor-tant measures are:
- Act on Energy Supply, 1997
- Decisions on 3 hydropower plants, in operation from 1993, 2005 and 2008
26 Denmark's Fourth National Communication on Climate Change
- Decisions on 6 waste incineration plants with some of the surplus heat used for district heating
- Sector Programme for Renovation with an Environment and Energy Improving Effect in Greenland 2000-2003
Faroe Islands The Climate Convention was rati-fied by the Realm, and therefore it also applies for the Faroe Islands. The Faroese have not yet formu-lated an actual Climate Strategy or energy policy.
However, after the last general elec-tion on 20 January 2004 the home rule government agreed to a state-ment of intent on the energy area, which included the following:
- Overall energy policy is a national political responsibility.
- The oil administration and the mu-nicipalities are to prepare an elec-tricity supply act.
- Energy development should con-sider nature and the environment.
- Renewable energy sources should comprise as large a proportion of total energy production as possible.
- Cooperation with respective authori-ties on R&D regarding renewable energy is to be promoted.
- Use of energy-saving products is to be promoted.
It is also intended to set up a work-ing group to prepare a proposal for an energy policy action plan by June 2006.
1.4 PROJECTIONS AND THE TOTAL EFFECT
OF POLICIES AND MEASURES
An up-dated projection of Den-mark’s emissions and removals of greenhouse gases in 2004-2030 was prepared in May 2005. This up-dated baseline projection (‘with (ex-isting) measures’ projection) is based on, e.g. an updated energy projec-tion, which now includes expected effects of the implemented EU al-lowance directive. Note that this only concerns the expected effects of the common EU allowance regula-tion on national emissions. Concern-ing agriculture, the expected effects of the Action Plan for the Aquatic Environment III have now been in-cluded in the baseline projection.
The result of this projection of emissions is shown in Table 1.3 to-gether with the expected effects of allocations of funds to JI and CDM projects in 2003-2008.
As shown in Table 1.3, the Danish deficit is estimated at 13 mill. tonnes of CO2 equivalents annually, based on Denmark’s legal commitment according to the EU Burden Shar-ing Agreement. This commitment is based on the fact that no correction has been made for the particularly large imports of electricity in 1990.

27Denmark's Fourth National Communication on Climate Change
If this compensation is made as as-sumed by Denmark, the deficit is reduced to approx. 8 mill. tonnes of CO2 equivalents annually in 2008-2012, as shown in Table 1.3.
Compared to the deficit of 20-25 mill. tonnes of CO2 equivalents an-nually in 2008-2012, inventoried on the basis of the projection which was presented together with the government’s proposal for a Climate Strategy for Denmark in February 2003 to show the expected develop-ment without implementation of ad-ditional measures, there is a reduc-tion of approx. 12 mill. tonnes of CO2 equivalents annually in 2008-2012.
With the choice of method, the defi-cit expresses the need to purchase allowances from abroad or to im-plement new measures outside the sectors subject to allowances. So, as a result of the introduction of the CO2 allowance scheme, the deficit is in principle not directly comparable to the deficit in the Government’s Climate Strategy, since the cost ef-fects of the allowances are included, whereas ultimately the allocation of allowances decides the climatic ef-fects of the scheme. Note that the projection, and therefore also the deficit, is based on model calcula-tions, which are subject to uncer-tainty. This applies, not least, to expected developments in energy prices, prices of CO2 allowances, and the developments in the Nordic electricity market, which have a di-rect influence on the size of exports of electricity. The implementation
of the EU allowance scheme has, however, created a basis for greater certainty regarding the fulfilment of Denmark’s climate commitments under the Kyoto Protocol and the EU Burden Sharing Agreement.
1.5 VULNERABILITY ASSESSMENT, CLI-MATE CHANGE IMPACTS AND ADAP-TATION MEASURES
1.5.1 Climate development - effects and possibility for adaptation for Denmark
Analyses with global and regional climate models show the follow-ing general trend for the climate in Denmark in the period 2071-2100 in relation to 1961-1990:
A rise in the annual mean tem-perature of about 3-5ºC, de-pending on the chosen scenario for emission of greenhouse gases. Greatest warming at night, and no major difference between the increase in summer and winter. Warming leads to fewer days with frost and snow and less days with snow cover.
A 10-40% increase in winter precipitation and a reduction in the oder of 10-25% in summer precipitation. A clear tendency towards more episodes with heavy precipitation, particularly in autumn, and lengthy dry pe-riods, especially in the summer.
A tendency towards more fre-quent westerly winds and at the same time a shift of the storm

28 Denmark's Fourth National Communication on Climate Change
tracks over the North Atlantic slightly eastward, leading to a small increase in storm activity over Denmark and the adjacent waters. On this basis, calcula-tions with storm surge models show that the highest sea level in the more extreme cases could rise by 5-10% relative to to-day (about 0.3 m on the west coast). In addition to this there is the global rise in sea level which the IPCC estimate at be-tween 0.1-0.9 m over the level today.
Uncertainties relating to the assess-ment of future climate change, es-pecially in projecting precipitation and extreme weather phenomena such as storms and floods, are sig-nificant. The DMI models and mostDMI models and most
other models show climate sensiti-vity at about 3oC for a doubling in the CO2 content in the atmosphere. However, new model studies pub-lished in 2005 in the journal Nature show that climate sensitivity could be considerably greater than hitherto assumed.
The impacts of possible climate changes in Denmark have been eval-uated several times since 1988, and most recently in the Danish EPA report of 2004: Adapting to the cli-mate of the future. The general con-clusion is that the direct impacts in moderate climate scenarios would be modest and could be countered by suitable, ongoing adaptation. In Oc-tober 2005 the Danish government initiated preparations to meet the primary impacts of climate change.
TABLE 1.3 THE RESULTS OF DENMARK’S LATEST "WITH EXISTING MEASURES ONLY" PROJECTION OF GREENHOUSE GAS EMISSIONS AND THE DEFICIT
COMPARED TO THE EU BURDEN SHARING OF THE EU REDUCTION TARGET UNDER THE KYOTO PROTOCOL
Source: 1990-2003: The National Inventory Report (NIR), the National Environmental Research Institute (NERI), April 2005.
2004-2030: Projection of greenhouse gas emissions, Memorandum to the Danish EPA, NERI, May 2005
Million tonnes of CO2equivalents
Base year1990/951 2003 “2010”2 “2015”3 2020 2025 2030
CO24 52.9 59.2 59.0 58.8 55.2 54.2 54.9
Methane (CH4) 5.7 5.9 5.6 5.3 5.2 5.2 5.2
Nitrous oxide (N2O) 10.7 8.1 6.9 6.8 6.6 6.5 6.5
Industrial gases, HFCs, PFCsand SF6
0.3 0.7 0.8 0.5 0.2 0.2 0.2
Total emissions 69.6 73.9 72.3 71.4 67.2 66.1 66.8
Of which exports of electricity:(- means import)
-6.3 6.9 4.4 2.3 1.4 0.9 2.7
Kyoto target (-21%) 55.0
Reductions in other countriesfrom funds allocated to JI andCDM projects
4.5
Deficit incl. JI and CDM 7.8/12.85
1 Base year for CO2, methane, and nitrous oxide is 1990. In accordance with the Kyoto Protocol, 1995 is chosen as the base year for industrial gases.
2 “2010” stands for mean emissions in 2008-2012
3 “2015” stands for mean emissions in 2013-2017
4 Here net emission of CO2 inventoried under the Kyoto Protocol, because removal of CO2 in forests planted since 1990 is included cf. Protocol article 3.3.
5 The deficit has been calculated both on the basis of the assumption of taking imports of electricity in 1990 into account, cf. the political statement of the Council and the Commission and onthe basis of Denmark’s legal commitment under the EU Burden Sharing Agreement.

29Denmark's Fourth National Communication on Climate Change
The purpose is on the basis of three possible future climate scenarios to establish a catalogue of consequenc-es and measures.
Systematic evaluations have not been made of secondary impacts for Denmark, for example in the form of changing tourist patterns, environmental refugees, agricultural prices/subsidies, or changed possi-bilities for wind turbine exports. For a small, export-oriented and open economy such as Denmark, such secondary impacts could easily be more important than the primary impacts.
In the water area, two studies in 2003 and 2004 have indicated the need for extraordinary action. In its report, the Academy of Technical Sciences pointed in particular to the need to plan renovation of drain-age systems so that they will also be able to function in a future wetter climate.
For Danish agriculture, the overall effects are estimated to be advanta-geous. Changes in cultivation prac-tice can be implemented at short notice, and production is expected to grow with rising temperature and CO2 concentration.
Denmark is placed centrally in a vegetation belt of temperate de-ciduous forest, and, with moderate future climate change, a majority of existing tree species that thrive well today are expected to persist in Denmark. Norway spruce, however, may be the exception.
About 1,800 km of the 7,400 km coastline are protected with dikes or other permanent installations. In-creasing use is being made of beach nourishment.
1.5.2 Climate changes in Greenland and on the Faroe Islands
Analyses with global climate models show the following general trend in the climate in Greenland in the peri-od 2071-2100 compared with 1961-1990 for a middle-high scenario:
A rise in the mean annual tem-perature in South Greenland of about 2 C, slightly more in winter than in summer, and in North Greenland, a rise in tem-perature of 6-10 C in winter, but only small rises in summer.
A general increase of 10-50% in precipitation. The winter in-crease could however be signifi-cantly bigger in North Green-land - locally up to more than 200%.
Analyses with global climate models show the following general trend for the climate on the Faroe Islands in the period 2071-2100 in relation to the period 1961-1990:
A rise of around 3ºC in annual mean temperature. There is only a slight difference in tem-perature rise in summer and winter.
A rise in winter precipitation of about 30%, but only slight or no increase in the summer.

30 Denmark's Fourth National Communication on Climate Change
1.6 FINANCIAL RESOURCES AND
TRANSFER OF TECHNOLOGY
In 2004 Danish development as-sistance constituted about DKK 12 billion, corresponding to 0.84% of GNI. With the strategy for Den-mark’s assistance to developing countries, A World of Difference, the Danish government has laid down priorities for Danish develop-ment assistance for the period 2004-2008.
With this strategy, the government emphasises that focus will still be on long-term development work with a view to combating poverty and that the main priorities will be initiatives within social sectors, i.e. education, health, water and sanitation. At the same time, the Danish government’s prioritisation of the global environ-ment issues and the question of free trade and market-based economic growth is maintained and strength-ened. Moreover, attempts have been made to establish better interplay be-tween environmental assistance and Denmark’s general effort to protect the global environment, including through climate initiatives under the Kyoto Protocol. International climate cooperation as well as adaptation to climate change of developing coun-tries have high priority in Denmark’s international development coopera-tion.
1.7 RESEARCH AND SYSTEMATIC
OBSERVATIONS
Research and observations within climate in the broad sense of the word are going on at a number of institutes and organisations and cover a wide range of disciplines, from natural science to evaluation of policies and measures and societal aspects.
The Danish Meteorological Institute (DMI) carries out observations of climate parameters (atmosphere and ocean), including observations under the World Meteorological Organisa-tion (WMO)’s programmes and sub-programmes. Climate observations, together with climate research, have been one of DMI’s main tasks for more than 125 years, with measure-ment, theory and modelling. DMI has research competence in carrying out calculations of the climate in the future using global and regional cli-mate models.
The National Environmental Re-search Institute (NERI) is in charge of monitoring the effect of climate change on nature and environment.
Research competence concerning physical expressions of past climate change is particulary at the Geologi-cal Survey of Denmark and Green-land (GEUS), the University of Copenhagen (KU) and Aahus Uni-versity. GEUS also has competencies in glaciological studies of Greenland’s ice sheet and its interaction with cli-mate change, and the importance of climate change for the hydrological

31Denmark's Fourth National Communication on Climate Change
cycle. The Geophysical Depart-ment and the Geological Institute at KU and the Geological Institute at Aarhus University have very great expertise in palaeoclimate data, and the climate group at KU is known worldwide for its ice core drilling and analyses. NERI contributes important research competence in relation to the effect of climate change on eco-systems.
Other institutions, e.g. Forest and Landscape Denmark (SL), the Dan-ish Institute of Agricultural Sciences (DJF), Risø National Laboratory, and the Danish National Space Cen-tre work with different aspects of cli-mate research.
It is partly on the basis of research competencies in the above-mentioned areas that Denmark participates ac-tively in IPCC’s work. In addition, the Danish climate research contrib-utes to several international projects under the World Climate Research Programme.
Danish climate research increased steadily in the period 1998 to 2001, from 172 man-years in 1998 to 189 man-years in 2001. The budget in-creased correspondingly from DKK 94 mill. in 1998 to DKK 114 mill. in 2001. Of this, foreign funding ac-counted for just under 30%. In the subsequent period, there has been a general reduction in funds for Danish climate research.
DMI monitors the main weather and climate parameters regularly. In the climate monitoring programme,
classic methods of measurement are used and new, satellite-based obser-vation methods are developed. DMI operates around 200 automatic measuring stations in the Realm (Denmark, Greenland and the Faroe Islands) with a broad measuring programme ranging from automatic water level or precipitation stations that measure only one parameter to stations with a full measuring pro-gramme, including automatic cloud height detectors and weather type detectors. To collect precipitation data, DMI also operates a network of about 450 manual precipitation stations, which are used mainly for mapping the precipitation climatolo-gy. The measurements are collected on a daily basis via telephone and are thus available shortly after meas-urements have been made.
Besides being of use for national programmes, the observations con-cern Denmark’s international con-tribution in the form of observation components from Danish territory to the worldwide meteorological observation network WWW (World Weather Watch), UNFCC and other international programmes for mapping weather and climate within the GCOS (Global Climate Ob-serving System) coordinated by the World Meteorological Organization (WMO).
The meteorological observations are stored in DMI’s database, and observations from many Danish stations are available in electronic form right back to 1872, water level measurements back to 1890, and

32 Denmark's Fourth National Communication on Climate Change
measurements of the surface tem-perature of the sea back to 1931. Each day about 75,000 observations from the Realm are added to the da-tabase, and the total number of ob-servations in the database is around 300,000,000.
1.8 EDUCATION, TRAINING AND PUBLIC
AWARENESS
In Denmark there is an ongoing public debate in the media and else-where about climate change, anthro-pogenic greenhouse gas emissions and the political reaction in the form of policies and measures. Denmark has a long tradition for involving the public and, in the environment field, this tradition was followed up by an international agreement - the Aarhus Convention from 1998. A considerable amount of information on climate change and Danish poli-cies is provided on the websites of the Ministry of Environment (www.mim.dk), the Danish Environmen-tal Protection Agency (www.mst.dk), the Ministry of Finance (www.fm.dk), the Ministry of Transport and Energy (www.trm.dk) and the Danish Energy Authority (www.ens.dk).
The websites of the Ministry of the Environment and the Danish EPA are regularly updated with the lat-est relevant information within the climate area, either directly in the form of press releases, documents, reports, etc. or through links to the actual players.
NERI has prepared a range of cli-mate reports, which, together with other climate information, e.g. cli-mate data, are published on NERI’s website www.dmu.dk. DMI has a climate website at www.dmi.dk, pro-viding current and historical climate data, together with a basic descrip-tion of the climate system and cli-mate processes, and themes on new results from the international scien-tific literature.
DMI participates in a number of international projects, with support primarily from the EU Commis-sion’s framework research pro-grammes, which involve exchange of knowledge and post-graduate train-ing of Danish research scientists. In addition, addition, the Institute contributes to IPCC’s work, and the results from that, which are commu-nicated to the public.
A number of initiatives are being carried out to promote environmen-tally sound behaviour in companies and households, particularly for climate reasons, and with respect to energy use. Labelling schemes, printed matter, information lines, media spots and similar are used to increase public knowledge of pos-sibilities for action and knowledge of less environmentally harmful tech-nologies, and every year a number of public campaigns are carried out.
33Denmark's Fourth National Communication on Climate Change
The Kingdom of Denmark com-prises Denmark, Greenland and the Faroe Islands. The UN Framework Convention on Climate Changes has been ratified on behalf of all three parts of the Realm. Therefore, this report includes information about Denmark, Greenland and the Faroe Islands. However, at the present time, more information is available on Denmark than on the other parts of the Realm. Where tables, figures, and other information in this report also cover Greenland and/or the Faroe Islands, this is stated.
2.1 DENMARK
2.1.1 Form of government and structure of administration
Denmark is a constitutional mon-archy, and the power of the state is divided between the legislative branch, the executive branch, and the judicial branch. According to the Constitution of the Realm, legisla-tive power lies with the Folketing, which consists of 179 members, two of whom are elected on the Faroe Islands and two in Greenland. The members are elected by the popula-tion for a period of normally four years. A new general election can mean that a member sits for less than this period.
The executive branch - the govern-ment - cannot have a majority of the Folketing against it, cf. the regula-tions in the Danish Constitution on votes of no confidence. Since 1953, Denmark has often had a minority government, i.e. a government sup-
ported by a minority of the mem-bers of the Folketing. In these situ-ations the government will need to include a support party.
The number of ministers in the government varies. Since 1971 Denmark has had a Minister for the Environment and a Ministry of the Environment who represent Den-mark in international negotiations on climate and which also have primary responsibility for coordination and implementation of legislation, plans etc. for the climate area.
For the last ten years or so, other ministries have also worked with environmental and climate issues. In 1988 the government decided to fol-low up the UN report on sustainable development, the Brundtland report, in which one of the main messages was the necessity of integrating the environmental issue into the ad-ministration within sectors such as transport, agriculture, and energy.
For this reason, a number of sec-tor ministries have drawn up action plans in which the environment is an integral element. Examples are sector plans for energy, transport, agriculture, and development as-sistance. In the climate area, further to the previous government’s status report Climate 2012 from 2000, the government presented an overall status in connection with the presen-tation of its proposal for ratification of the Kyoto Protocol in April 2002. This status report was followed in February 2003 by a government proposal for a national Climate
2 National circumstances relevant to greenhouse gas emissions and removals
33

34 Denmark's Fourth National Communication on Climate Change
Strategy for Denmark, including analyses from the sector ministries, which was adopted by the Folketing on 13 March 2003.
One of the main cornerstones of Danish democracy is autonomous local government. The specific en-vironmental action takes place not only at national level but also at county and municipal level. The state sets the national rules and framework for environmental ad-ministration, while the counties and municipalities, working within this framework, plan and decide initia-tives that implement and support the national legislation.
The importance of local involve-ment is stressed in Agenda 21 - a global agenda for sustainable devel-opment in the 21st century, which was adopted at the Rio Conference in 1992. The government supports the popular interest and participa-tion in climate and environmental issues in different ways - includ-ing through implementation of the Pan-European Aarhus Convention and support for the local Agenda 21 work initiated by most of the Danish municipalities.
2.1.2 PopulationToday, Denmark has a population of slightly more than 5.4 mill. As will be seen from Table 2.1, popula-tion growth has been relatively small in the last 24 years.
TABLE 2.1 POPULATION OF DENMARK
Source: Statistics Denmark.
1980 1990 2004
Denmark’spopulation(in mill.)
5.1 5.1 5.4
The latest forecasts show that popu-lation growth will continue to be moderate in the years ahead. For example, the population is expected to reach 5.46 mill. in 2010, ris-ing to 5.53 mill. in 2025. The low birth rate in the 1980s means that young people between the ages of 15 and 24 years make up only 11% of the population, while the elderly, between 50 and 64 years of age, ac-count for 20%.
Today, the population density is 125 per km2.
Today, 75% of Danish wage earners are employed in service trades, while 18% are employed in manufacturing.
2.1.3 GeographyDenmark consists of the Jutland pe-ninsula and more than 400 islands. It has a total area of 43,098 km2 andlies at about 55º N and 11º E.
The whole of the country is low-land. The surface was formed by Ice Age glaciers and glacial streams. The highest hill is approximately 170 metres above sea level.
The coastline has a length of more than 7,300 km. To protect low-ly-ing land against flooding and storm surge, it has been necessary to build
34
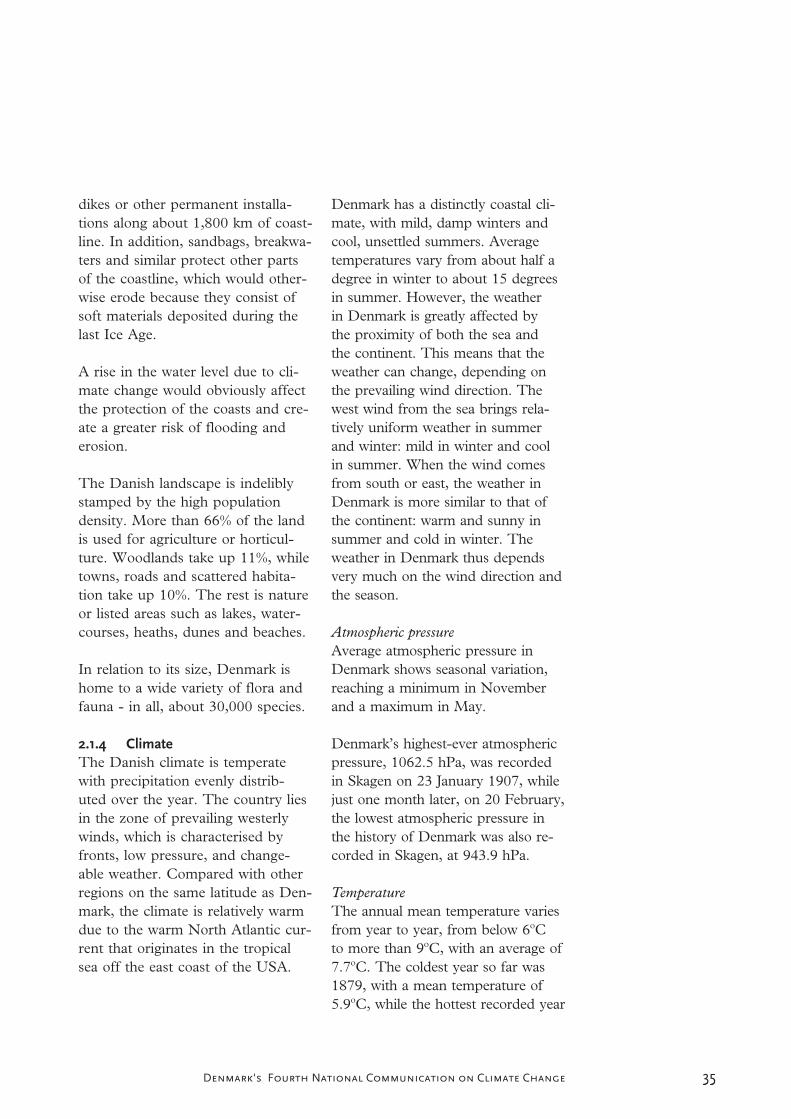
35Denmark's Fourth National Communication on Climate Change
dikes or other permanent installa-tions along about 1,800 km of coast-line. In addition, sandbags, breakwa-ters and similar protect other parts of the coastline, which would other-wise erode because they consist of soft materials deposited during the last Ice Age.
A rise in the water level due to cli-mate change would obviously affect the protection of the coasts and cre-ate a greater risk of flooding and erosion.
The Danish landscape is indelibly stamped by the high population density. More than 66% of the land is used for agriculture or horticul-ture. Woodlands take up 11%, while towns, roads and scattered habita-tion take up 10%. The rest is nature or listed areas such as lakes, water-courses, heaths, dunes and beaches.
In relation to its size, Denmark is home to a wide variety of flora and fauna - in all, about 30,000 species.
2.1.4 ClimateThe Danish climate is temperate with precipitation evenly distrib-uted over the year. The country lies in the zone of prevailing westerly winds, which is characterised by fronts, low pressure, and change-able weather. Compared with other regions on the same latitude as Den-mark, the climate is relatively warm due to the warm North Atlantic cur-rent that originates in the tropical sea off the east coast of the USA.
Denmark has a distinctly coastal cli-mate, with mild, damp winters and cool, unsettled summers. Average temperatures vary from about half a degree in winter to about 15 degrees in summer. However, the weather in Denmark is greatly affected by the proximity of both the sea and the continent. This means that the weather can change, depending on the prevailing wind direction. The west wind from the sea brings rela-tively uniform weather in summer and winter: mild in winter and cool in summer. When the wind comes from south or east, the weather in Denmark is more similar to that of the continent: warm and sunny in summer and cold in winter. The weather in Denmark thus depends very much on the wind direction and the season.
Atmospheric pressureAverage atmospheric pressure in Denmark shows seasonal variation, reaching a minimum in November and a maximum in May.
Denmark’s highest-ever atmospheric pressure, 1062.5 hPa, was recorded in Skagen on 23 January 1907, while just one month later, on 20 February, the lowest atmospheric pressure in the history of Denmark was also re-corded in Skagen, at 943.9 hPa.
TemperatureThe annual mean temperature varies from year to year, from below 6ºC to more than 9ºC, with an average of 7.7ºC. The coldest year so far was 1879, with a mean temperature of 5.9ºC, while the hottest recorded year
35
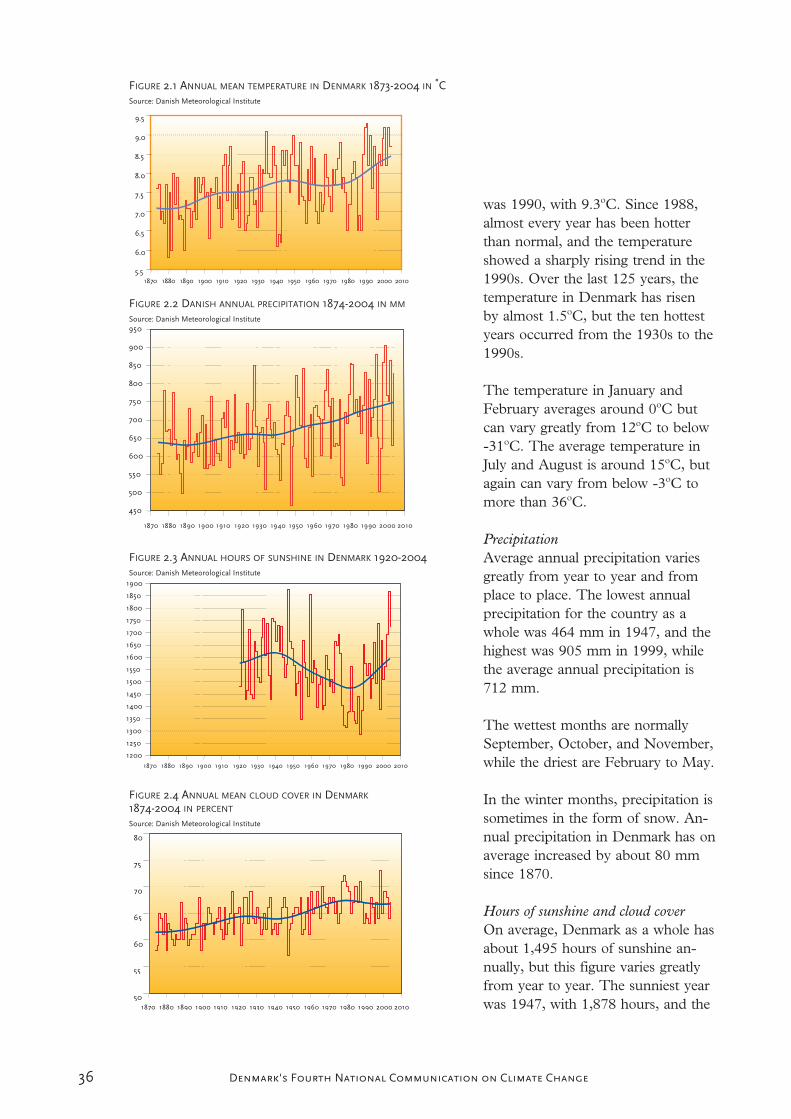
36 Denmark's Fourth National Communication on Climate Change
was 1990, with 9.3ºC. Since 1988, almost every year has been hotter than normal, and the temperature showed a sharply rising trend in the 1990s. Over the last 125 years, the temperature in Denmark has risen by almost 1.5ºC, but the ten hottest years occurred from the 1930s to the 1990s.
The temperature in January and February averages around 0ºC but can vary greatly from 12ºC to below -31ºC. The average temperature in July and August is around 15ºC, but again can vary from below -3ºC to more than 36ºC.
PrecipitationAverage annual precipitation varies greatly from year to year and from place to place. The lowest annual precipitation for the country as a whole was 464 mm in 1947, and the highest was 905 mm in 1999, while the average annual precipitation is 712 mm.
The wettest months are normally September, October, and November, while the driest are February to May.
In the winter months, precipitation is sometimes in the form of snow. An-nual precipitation in Denmark has on average increased by about 80 mm since 1870.
Hours of sunshine and cloud coverOn average, Denmark as a whole has about 1,495 hours of sunshine an-nually, but this figure varies greatly from year to year. The sunniest year was 1947, with 1,878 hours, and the
FIGURE 2.1 ANNUAL MEAN TEMPERATURE IN DENMARK 1873-2004 IN ˚CSource: Danish Meteorological Institute
FIGURE 2.2 DANISH ANNUAL PRECIPITATION 1874-2004 IN MM
Source: Danish Meteorological Institute
FIGURE 2.3 ANNUAL HOURS OF SUNSHINE IN DENMARK 1920-2004Source: Danish Meteorological Institute
FIGURE 2.4 ANNUAL MEAN CLOUD COVER IN DENMARK
1874-2004 IN PERCENT
Source: Danish Meteorological Institute
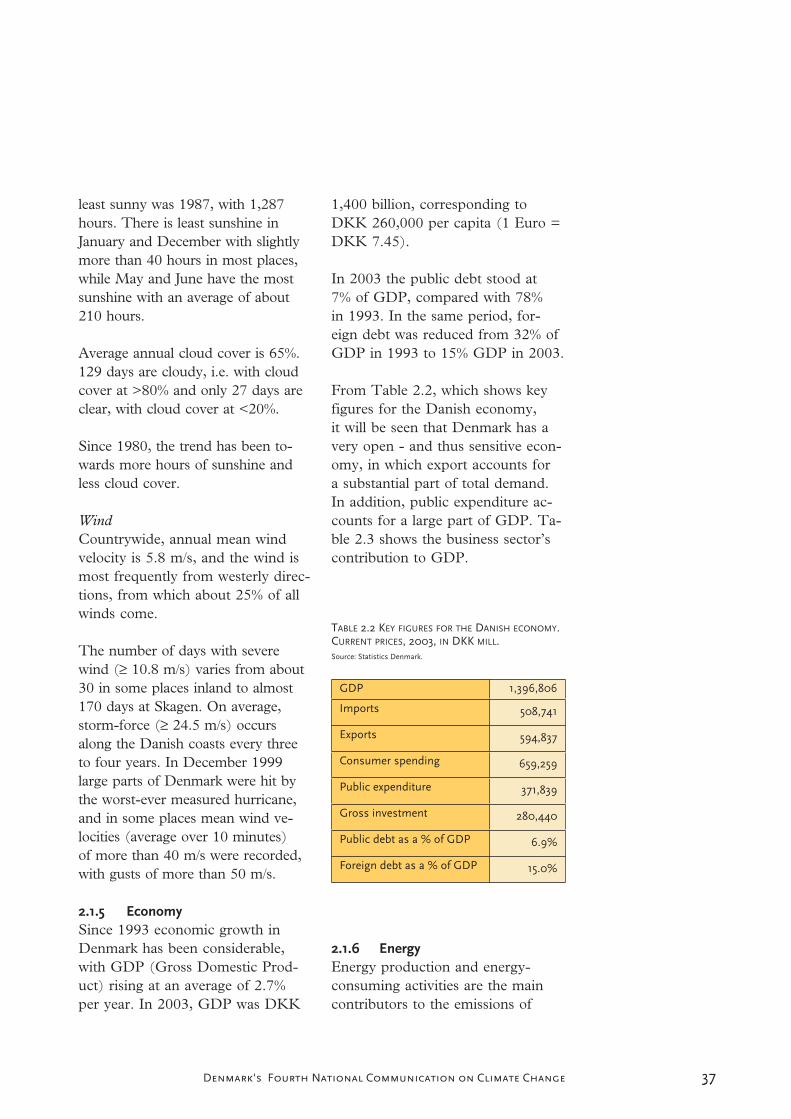
37Denmark's Fourth National Communication on Climate Change
least sunny was 1987, with 1,287 hours. There is least sunshine in January and December with slightly more than 40 hours in most places, while May and June have the most sunshine with an average of about 210 hours.
Average annual cloud cover is 65%. 129 days are cloudy, i.e. with cloud cover at >80% and only 27 days are clear, with cloud cover at <20%.
Since 1980, the trend has been to-wards more hours of sunshine and less cloud cover.
WindCountrywide, annual mean wind velocity is 5.8 m/s, and the wind is most frequently from westerly direc-tions, from which about 25% of all winds come.
The number of days with severe wind ( 10.8 m/s) varies from about 30 in some places inland to almost 170 days at Skagen. On average, storm-force ( 24.5 m/s) occurs along the Danish coasts every three to four years. In December 1999 large parts of Denmark were hit by the worst-ever measured hurricane, and in some places mean wind ve-locities (average over 10 minutes) of more than 40 m/s were recorded, with gusts of more than 50 m/s.
2.1.5 EconomySince 1993 economic growth in Denmark has been considerable, with GDP (Gross Domestic Prod-uct) rising at an average of 2.7% per year. In 2003, GDP was DKK
1,400 billion, corresponding to DKK 260,000 per capita (1 Euro = DKK 7.45).
In 2003 the public debt stood at 7% of GDP, compared with 78% in 1993. In the same period, for-eign debt was reduced from 32% of GDP in 1993 to 15% GDP in 2003.
From Table 2.2, which shows key figures for the Danish economy, it will be seen that Denmark has a very open - and thus sensitive econ-omy, in which export accounts for a substantial part of total demand. In addition, public expenditure ac-counts for a large part of GDP. Ta-ble 2.3 shows the business sector’s contribution to GDP.
TABLE 2.2 KEY FIGURES FOR THE DANISH ECONOMY.CURRENT PRICES, 2003, IN DKK MILL.Source: Statistics Denmark.
GDP 1,396,806
Imports 508,741
Exports 594,837
Consumer spending 659,259
Public expenditure 371,839
Gross investment 280,440
Public debt as a % of GDP 6.9%
Foreign debt as a % of GDP 15.0%
2.1.6 EnergyEnergy production and energy-consuming activities are the main contributors to the emissions of
37

38 Denmark's Fourth National Communication on Climate Change
greenhouse gases in Denmark. The energy sector alone (energy produc-tion and supply) accounts for 44% of Denmark’s total emissions of greenhouse gases, primarily CO2. In addition there are emissions from the energy-consuming activities in the transport sector, industry and households.
In the energy sector, CO2 emis-sions have been reduced despite strong economic growth. This was
achieved through long-term ambi-tious efforts, which must be fol-lowed up and developed further in order to maintain the positive trend.
Production and supplyAs will be seen from Table 2.4, Denmark’s own production of energy has grown almost 30-fold since 1980 and it almost more than tripled since 1990. Denmark is self-sufficient in energy, see Table 2.5. This is mainly due to the production of oil and gas in the North Sea, but renewable energy is also increasingly contributing to the country’s energy supply.
Today, 13.6% of the actual con-sumption of energy is supplied by renewable energy. The renewable energy resources are mainly wind energy and biomass, which are used to produce electricity, combined heat and power, or district heating.
38
TABLE 2.4 ENERGY PRODUCTION (PJ)Source: Danish Energy Authority
1980 1990 1995 2000 2001 2002 2003
Production, total 40 423 656 1164 1138 1202 1194
Crude oil 13 254 392 765 726 780 780
Natural gas 0 116 197 310 318 318 302
Renewable energy etc. 28 53 67 89 95 103 112
TABLE 2.5 DEGREE OF SELF-SUFFICIENCY (%)Source: Danish Energy Authority
1980 1990 1995 2000 2001 2002 2003
Energy, total 5 52 78 139 136 145 144
Oil 2 71 105 204 194 217 228
Oil and natural gas 2 84 116 189 183 197 203
TABLE 2.3 THE BUSINESS SECTOR’S CONTRIBUTION TO GDP,CURRENT PRICES 2003, IN DKK MILL
Source: Statistics Denmark.
Sector Gross increase in value
%
Agriculture, etc., mining 60,063 5.0
Industry, including energy and building 279,663 23.3
Services 902,167 75.3
Indirectly measured financial services -43,847 -3.6
Gross Domestic Product 1,198,046 100

39Denmark's Fourth National Communication on Climate Change
Internationally, Denmark is among the leading nations in wind energy.
Energy consumptionDespite the economic growth, total energy consumption has remained largely unchanged at approximately 800 PJ since 1980, cf. Tables 2.6 and 2.7.
Denmark’s dependence on oil and coal has fallen. Particularly in the production of electricity and heat, oil and coal have been substituted with other fuels. Thus, natural gas, waste and biomass are increas-ingly being used in small-scale and industrial CHP plants, natural gas and renewable energy is increasingly being used in large scale electricity production, and natural gas is in-creasingly being used for individual heating of buildings.
The distribution of gross energy consumption (energy consumption adjusted for foreign electricity trade) in 2003 was as follows: industry and agriculture accounted for 26%, domestic sector for 27%, transport for 25% and commerce and service for 15%. Refining and non-energy purposes accounted for the remain-ing 7%
Figure 2.5 shows adjusted energy consumption, sector by sector. Over the last 23 years relative consump-tion by the transport sector has ris-en, whereas relative domestic sector consumption has fallen.
Structure of the marketThe structure of the market in the
energy sector is characterised by a division between production and supply of natural gas and oil, elec-tricity, and district heating.
Most production of natural gas and oil is taken care of by a private com-pany, DUC (Dansk Undergrunds Consortium), while the state-owned
39
TABLE 2.6 ACTUAL ENERGY CONSUMPTION (PJ)Source: Danish Energy Authority
1980 1990 1995 2000 2001 2002 2003
Energyconsump-tion, total
830 752 840 812 832 822 863
Oil 555 343 371 367 368 354 343
Naturalgas
0 76 133 186 194 194 195
Coal 252 255 272 165 174 175 238
Renewa-ble energyetc.
28 53 67 92 98 106 117
Net im-ports ofelectricity
-4 25 -3 2 -2 -7 -31
TABLE 2.7 GROSS ENERGY CONSUMPTION, BREAKDOWN BY FUELS, ADJUSTED FOR CLIMATE
FLUCTUATIONS AND NET EXPORTS (PJ)Source: Danish Energy Authority
1980 1990 1995 2000 2001 2002 2003
Gross en-ergy con-sumption,total
816 820 839 837 834 827 829
Oil 548 356 373 375 375 360 343
Naturalgas
0 83 134 193 194 197 191
Coal 241 326 265 176 167 162 176
Renewa-ble energyetc.
27 55 68 94 98 108 118

40 Denmark's Fourth National Communication on Climate Change
company DONG (Dansk Olie og Naturgas) takes care of the trans-portation of natural gas from the fields in the North Sea to the shore. At the DONG treatment plant at Nybro, the gas is treated and then sent on in the natural gas system to customers. Gastra, a subsidiary of the 100% state-owned company Energinet.dk, owns and operates the transmission grid for natural gas. The distribution grids in southern Jutland and western and southern Zealand are owned and operated by DONG, while the distribution grids in northern and mid Jutland, on Fu-nen and in the Copenhagen region are owned and operated by munici-pal associations. In addition there are two natural gas storage facilities which are owned and operated by DONG. In connection with imple-mentation of the EU gas directive, there has been liberalisation in the gas sector which means, for exam-ple, that since 1 January 2004 all gas
customers have had full access to the market.
In connection with the implementa-tion of the EU Directive on liber-alisation of the electricity sector, a reform of this sector has also been carried out. This reform means full market opening and all electricity consumers have a free choice of electricity supplier. More than 2/3 of the electricity supply comes from large primary power stations or CHP plants.
Approximately half of the demand for heating is supplied by districtheating. The heat is supplied from primary and small-scale CHP plants, waste incineration plants and bio-mass-fired district heating stations. Apart from the primary plants, the plants are owned either by mu-nicipalities or by local cooperatives that are owned by the consumers. Initially, district heating will not be covered by the liberalisation process, but the government will investigate whether it is possible in the longer term to have a more free choice of supplier in areas with large, inter-connected district heating grids.
Energy policy agreements of 29 March 2004On 29 March 2004 the government entered into a number of energy policy agreements with a broad ma-jority of the Folketing parties and with the organisation representing electricity grid companies, Elfor. The main points described in the following text box reflects the agree-ments established in a new overall
40
FIGURE 2.5 ADJUSTED GROSS ENERGY CONSUMPTION,BREAKDOWN BY SECTOR
Source: Danish Energy Authority

41Denmark's Fourth National Communication on Climate Change 41
• Separation of ownership of overall electricity and gas transmission from commercial activities
Key elements of the agreement are that electricity grid companies transfer responsibil-ity for system operation and the overall transmission net to the state with a view toseparating ownership of the overall infrastructure from commercial activities relatingto trading and electricity production. Owner shares in the overall electricity transmis-sion network are taken over by the newly established state company Energinet.dk, andresponsibility for system operation is transported to the company from Elkraft Systemand Eltra. As regards natural gas, the state company DONG has transferred its sub-sidiary Gastra to Energinet.dk, so that in the future the company will own and operatesystems, electricity transmission and natural gas transmission in Denmark. This sepa-ration of ownership of the overall net from commercial activities relating to electricityand gas, provides an important basis for efficient competition in the Danish energysector.
• Changes in the ownership structure in the energy sector
As part of the energy policy agreements and the agreement with Elfor, the provisions ofthe Electricity Supply Act on distinction between free and tied-up capital were repealed,thus providing an incentive to reorganise companies and adapting the structure in theelectricity sector. The result has been that a number of grid companies and municipali-ties in Jutland and on Funen have relinquished their interests in Elsam. The remainingmunicipalities and grid companies who are shareholders have also disposed of theirholdings. On 10 December the Minister for Finance and the boards of Elsam A/S andDONG A/S made an agreement on merging Elsam and DONG.
In east Denmark, in spring 2004 Elsam took over the majority of the shares in NESAA/S, including the ownership interest in Energi E2, while SEAS, NVE and a number ofmunicipalities, including Copenhagen City entered into agreements with DONG A/Son their shares in the production enterprise Energi E2. The agreements with SEASand NVE as well as Copenhagen City allow for either cash payment, or settlement withshares.
Moreover, the DONG A/S agreements with Copenhagen City and the City of Freder-iksberg include that DONG A/S is to take over Københavns Energi and FrederiksbergForsyning.
The framework agreement of 10 December 2004 and the DONG A/S agreementsmean there is the prospect of forming a large Danish energy company which will beable to compete with the even larger foreign energy companies and act as a dynamofor strong commercial and technological development of the energy area in Denmark.However, it is still uncertain when the merger between DONG and Elsam can be im-plemented. The new company must be examined by the competition authorities.
With the agreement of 1 June 2005 between DONG, Elsam, Energi E2 and Vattenfallon power plants and shares, ownership in the Danish power plant sector has changedconsiderably. Under the agreement, Vattenfall takes over three large power plants– Nordjyllandsværket, Fynsværket and Amagerværket – and the decentral CPH plantsat Helsingør and Hillerød. It also takes over a portfolio of wind turbine activities. In all,Vattenfall takes over production activities totalling approx. 2,400 MW. DONG takesover Vattenfall’s 35.3 per cent owner shares in Elsam and the 40 per cent Vattenfallowner share in the power plant Avedøre2. Elsam and Energi E2 retain production ac-tivities totalling approx. 7,300 MW.
With this agreement, and assuming approval by the competition authorities, the estab-lishment of a new powerful energy company in Denmark is ensured through a mergerof DONG, Elsam, Energi E2, NESA, Københavs Energi (el) and Frederiksberg Forsyn-ing.
42 Denmark's Fourth National Communication on Climate Change42
• Price regulation of grid companies
With the new statutory order, revenue framework regulation of electricity grid compa-nies changed from regulation of costs to regulation of income. The new regulationsencourage enterprises to promote efficient operation, as through this they can improvetheir business. Consumers are protected against increases in net charges as they mustnot exceed the level at 1 January 2004 (calculated at fixed prices). As from 2008 thecompanies must meet a number of efficiency requirements based on benchmarking.Similarly, a revenue framework order has been issued for the natural gas distributioncompanies, providing for incentives to the companies to promote the efficiency in op-erations.
• Expansion of wind turbines
A significant element in the agreements of 29 March 2004 was the agreement on thebasis for further expansion of wind turbine capacity. It was agreed to establish two off-shore wind farms, each of 200 MW. It was decided to situate the farms at Horns Revand Rødsand. The two wind farms will be established on the basis of a negotiated pro-cedure. A prequalification of interested investors will be carried out before tenders areissued and negotiations commence. The decisive criterion in the procedure is the priceper kWh, which the tenderer requires for completing the project.
Energi E2 won the tender for a 200 MW offshore wind park at Horns Rev. The EnergyE2 bid was based on the lowest settlement price, fixed at DKK 51.8/kWh for 50,000 fullcapacity hours, corresponding to approx. 12 years of electricity production. It has beenagreed to put the park in operation in the course of 2009. The Danish Energy Author-ity has received four applications from companies wishing to take part in the tender atRødsand. The Danish Energy Authority expects in the course of autumn 2005 to selectthe companies that will be prequalified to take part in the tender.
From 1 January 2005 a new scrapping scheme has been introduced for older, poorlysited wind turbines onshore. The scheme aims at establishing new capacity of up to350 MW over the next 5 years, but with far fewer turbines, and turbines with a totalcapacity of 175 MW will be dismantled. The subsidy for scrapping is DKK 0.12 per kWhfor 12,000 full capacity hours. As one of the most important aspects of the scheme isthe designation of areas to erect replacements for the scrapped turbines, the EnergyAuthority and the Danish Forest and Nature Agency are in a continuing dialogue withthe regional planning authorities to secure sites for all the new wind turbines. Currentestimates of gross areas for wind turbines are approx. 478 MW total capacity.
• Market orientation of small-scale heat and power plants
Following the agreements of 29 March 2004, small-scale heat and power productionand other mandatory electricity are now based on market forces. Decentral plants havebeen given an incentive to organise electricity production on the basis of the prices ofelectricity on the market, because subsidies are now granted as financial, subsidies,independent of production, while electricity production is settled at the market price.This reorganisation is being introduced stepwise, so that plants above 10 MW oper-ate under the new terms as from 1 January 2005, and plants between 5 and 10 MW doso no later than 1 January 2007. Small plants below 5 MW may remain under the oldscheme indefinitely.
In order to achieve a better functioning electricity market, the regulations on manda-tory electricity production were also repealed as from 1 January 2005. All electricityproduced is now sold on the electricity market, and consumers can buy their entireconsumption on market terms.

43Denmark's Fourth National Communication on Climate Change
framework for the market structure and ownership of the energy sector.
The 29 March agreement also means that the plants must not change from taxed fuels to tax-free fuels as yet. Therefore, from De-cember 2004 regulations were intro-duced which mean that new appli-cation of biomass is only allowed in special circumstances.
Prices and taxesEnergy prices are one of the key factors governing energy consump-tion. In 2003 total spending on energy, including taxes and VAT, amounted to DKK 117.2 billion. Of this figure, domestic users paid DKK 57.8 billion, manufacturing industries DKK 26.1 billion, and the commercial sector and the service industries, including public services, DKK 27.8 billion. As a general rule, enterprises subsequently receive a full refund of energy taxes and VAT, but not of CO2 taxes.
Figures 2.6 and 2.7 show the energy prices paid by domestic users. Fig-ure 2.6 shows the current consumer prices, including taxes and VAT. Figure 2.7 shows the development in fixed 2003 prices. The fixed pric-es have been adjusted for the change in general prices according to the consumer price index.
The prices of heating oil and natural gas follow each other because this is laid down by law. The tax on petrol has risen over time, and this has af-fected the price of petrol.
Measured in fixed prices, the prices of petrol, heating oil and natural gas fell from 1980 until the early 1990s, cf. Figure 2.7. The price of electric-ity increased slightly over the period.
As an added incentive to enterprises to improve their energy efficiency and reduce Danish emissions of CO2, a green tax package with
43
FIGURE 2.6 ENERGY PRICES FOR DOMESTIC USERS IN CURRENT PRICES, DKKSource: Danish Energy Authority
FIGURE 2.7 ENERGY PRICES FOR DOMESTIC USERS IN FIXED 2003 PRICES, DKKSource: Danish Energy Authority

44 Denmark's Fourth National Communication on Climate Change
gradually increasing taxes on CO2
and SO2 emissions as well as en-ergy taxes was introduced in 1996. Enterprises with particularly high energy consumption can contract with the Danish Energy Authority on energy-efficiency improvements
in return for a discount in the CO2
taxes and possibly heating taxes. Denmark wants CO2 taxes on the al-lowance-regulated fuel consumption for industrial production processes to be repaid as far as possible, and preferably in fully. Therefore Den-mark will change the CO2 Taxes Act within the scope defined in the di-rective on energy taxation. The Eu-ropean Commission must approve the amendment, for instance under the rules on state subsidies.
In 2003 the revenue from energy taxes amounted to DKK 36.7 bil-lion, up from DKK 35.8 billion in 2002. The largest contribution, DKK 10.4 billion, comes from pet-rol. Total revenue has increased by 163% in relation to 1990, when there were no CO2 and sulphur taxes. In
44
FIGURE 2.8 REVENUES FROM ENERGY, CO2 AND SULPHUR TAXES.CURRENT PRICES IN BILLION DKKSource: Danish Energy Authority
Imports
1980 1990 1995 2000 2001 2002 2003
Crude oil, PJ 259 174 229 159 131 140 150
Oil products, PJ 363 183 205 256 250 215 204
Coal, PJ 185 262 321 161 174 159 237
Natural gas, PJ 0 0 0 0 0 0 0
Electricity, Gwh 1979 11973 4013 8417 8199 8939 7023
Exports
1980 1990 1995 2000 2001 2002 2003
Crude oil, PJ 2 118 203 203 513 590 574
Oil products, PJ 82 126 183 195 166 160 170
Coal, PJ 0 0 1 3 4 4 4
Natural gas, PJ 0 39 63 121 128 125 109
Electricity, Gwh 3216 4925 4807 7752 8775 11010 15568
TABLE 2.8 IMPORTS AND EXPORTS OF ENERGY
Source: Danish Energy Authority
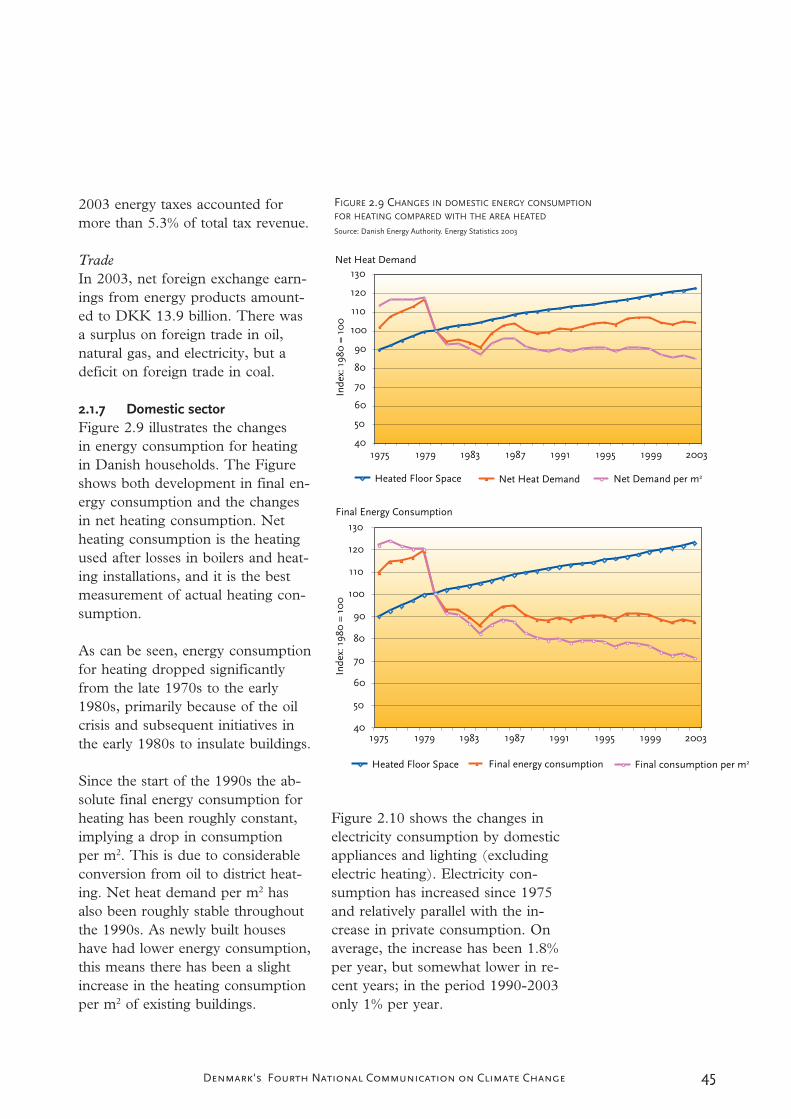
45Denmark's Fourth National Communication on Climate Change
2003 energy taxes accounted for more than 5.3% of total tax revenue.
TradeIn 2003, net foreign exchange earn-ings from energy products amount-ed to DKK 13.9 billion. There was a surplus on foreign trade in oil, natural gas, and electricity, but a deficit on foreign trade in coal.
2.1.7 Domestic sectorFigure 2.9 illustrates the changes in energy consumption for heating in Danish households. The Figure shows both development in final en-ergy consumption and the changes in net heating consumption. Net heating consumption is the heating used after losses in boilers and heat-ing installations, and it is the best measurement of actual heating con-sumption.
As can be seen, energy consumption for heating dropped significantly from the late 1970s to the early 1980s, primarily because of the oil crisis and subsequent initiatives in the early 1980s to insulate buildings.
Since the start of the 1990s the ab-solute final energy consumption for heating has been roughly constant, implying a drop in consumption per m2. This is due to considerable conversion from oil to district heat-ing. Net heat demand per m2 has also been roughly stable throughout the 1990s. As newly built houses have had lower energy consumption, this means there has been a slight increase in the heating consumption per m2 of existing buildings.
Figure 2.10 shows the changes in electricity consumption by domestic appliances and lighting (excluding electric heating). Electricity con-sumption has increased since 1975 and relatively parallel with the in-crease in private consumption. On average, the increase has been 1.8% per year, but somewhat lower in re-cent years; in the period 1990-2003 only 1% per year.
45
FIGURE 2.9 CHANGES IN DOMESTIC ENERGY CONSUMPTION
FOR HEATING COMPARED WITH THE AREA HEATED
Source: Danish Energy Authority. Energy Statistics 2003
Net Heat Demand
Final Energy Consumption

46 Denmark's Fourth National Communication on Climate Change
As a result of converting elec-tric heating, total consumption by households, including heating, has been roughly constant since the late 1990s. In 2003, the domestic sector accounted for 6% of Denmark’s to-tal greenhouse gas emissions.
2.1.8 TransportEfficient and flexible transporta-tion of goods and persons is a vital element of the foundation of the modern welfare society. At the same time, transport is in itself an important economic sector that contributes to economic growth, employment, and foreign exchange earnings.
46
FIGURE 2.10 CHANGES IN DOMESTIC ELECTRICITY CONSUMPTION
FOR APPLIANCES ETC., EXCL. ELECTRIC HEATING
Source: Danish Energy Authority. Energy Statistics 2003
TABLE 2.9 TREND IN PASSENGER TRANSPORT PERFORMANCE IN BILLION PASSENGER KM
Source: Ministry of Transport, the Road Directorate and Statistics Denmark
1980 1985 1990 1995 2000 2001 2002 2003
Aircraft 0.4 0.4 0.5 0.5 0.4 0.4 0.3 0.3
Trains 4.4 4.8 4.7 4.7 5.4 5.4 5.5 5.9
Ferries 0.5 0.5 0.6 0.6 0.2 0.2 0.2 0.2
Cars 38.6 43.2 50.3 54.0 59.8 59.3 60.7 54.8
Buses 7.3 8.8 7.6 9.1 9.1 9.1 9.0 8.8
Total 51.2 57.7 63.7 68.9 74.9 74.4 75.7 73.0
Bi-cycles 2.7 3.2 2.8 2.4 2.2 2.3 2.3
TABLE 2.10 TREND IN GOODS TRANSPORT PERFORMANCE, BILLION TONNE KM1
Source: Ministry of Transport, the Road Directorate and Statistics Denmark
1980 1985 1990 1995 2000 2001 2002 2003
Freight trains 1.1 1.3 1.2 1.4 1.2 1.0 1.0 1.0
Freighters 1.9 1.8 1.6 1.8 1.7 1.8 1.8 2.4
Lorries 7.8 8.3 9.4 9.3 11.0 10.9 11.1 11.0
Pipelines 0.9 2.9 4.6 7.1 7.2 7.6 7.8
Total 10.82 12.3 15.1 17.1 21.0 20.9 21.5 21.8
1 Goods transport by air accounts for only a small proportion of total goods transport. 2 Pipelines not included.
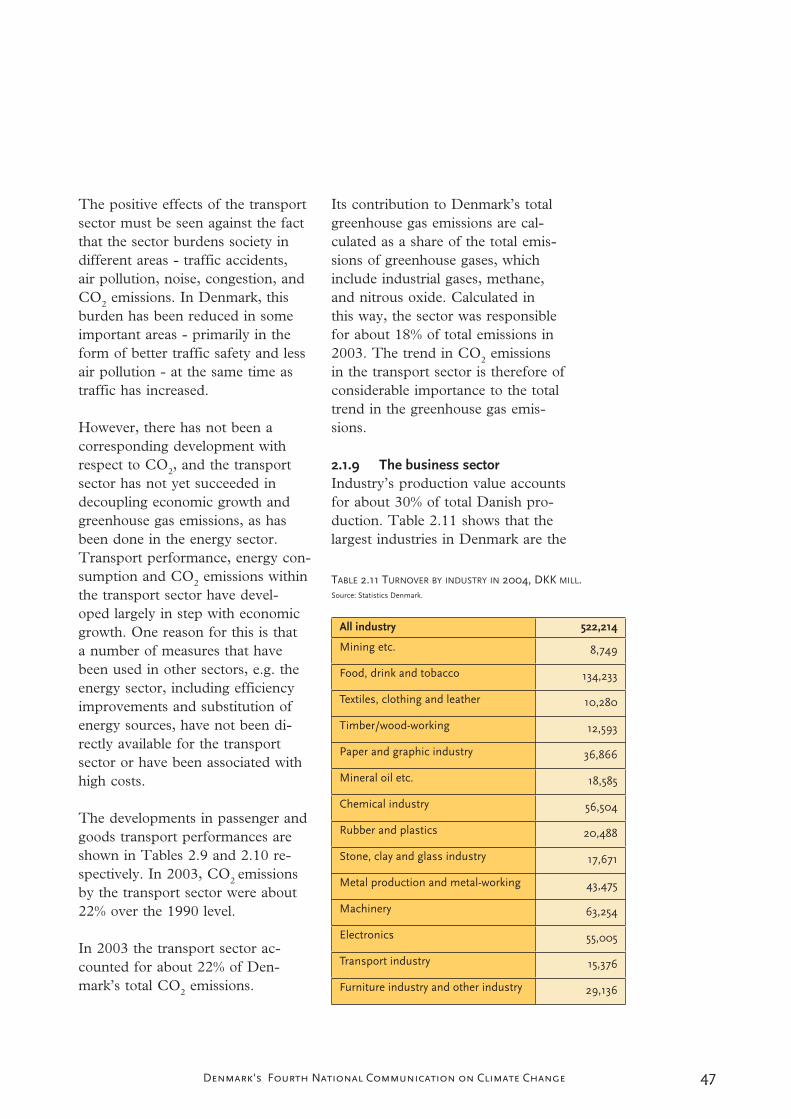
47Denmark's Fourth National Communication on Climate Change
The positive effects of the transport sector must be seen against the fact that the sector burdens society in different areas - traffic accidents, air pollution, noise, congestion, and CO2 emissions. In Denmark, this burden has been reduced in some important areas - primarily in the form of better traffic safety and less air pollution - at the same time as traffic has increased.
However, there has not been a corresponding development with respect to CO2, and the transport sector has not yet succeeded in decoupling economic growth and greenhouse gas emissions, as has been done in the energy sector. Transport performance, energy con-sumption and CO2 emissions within the transport sector have devel-oped largely in step with economic growth. One reason for this is that a number of measures that have been used in other sectors, e.g. the energy sector, including efficiency improvements and substitution of energy sources, have not been di-rectly available for the transport sector or have been associated with high costs.
The developments in passenger and goods transport performances are shown in Tables 2.9 and 2.10 re-spectively. In 2003, CO2 emissionsby the transport sector were about 22% over the 1990 level.
In 2003 the transport sector ac-counted for about 22% of Den-mark’s total CO2 emissions.
47
TABLE 2.11 TURNOVER BY INDUSTRY IN 2004, DKK MILL.Source: Statistics Denmark.
All industry 522,214
Mining etc. 8,749
Food, drink and tobacco 134,233
Textiles, clothing and leather 10,280
Timber/wood-working 12,593
Paper and graphic industry 36,866
Mineral oil etc. 18,585
Chemical industry 56,504
Rubber and plastics 20,488
Stone, clay and glass industry 17,671
Metal production and metal-working 43,475
Machinery 63,254
Electronics 55,005
Transport industry 15,376
Furniture industry and other industry 29,136
Its contribution to Denmark’s total greenhouse gas emissions are cal-culated as a share of the total emis-sions of greenhouse gases, which include industrial gases, methane, and nitrous oxide. Calculated in this way, the sector was responsible for about 18% of total emissions in 2003. The trend in CO2 emissions in the transport sector is therefore of considerable importance to the total trend in the greenhouse gas emis-sions.
2.1.9 The business sectorIndustry’s production value accounts for about 30% of total Danish pro-duction. Table 2.11 shows that the largest industries in Denmark are the

48 Denmark's Fourth National Communication on Climate Change
food, drink and tobacco, engineer-ing, electronics, and the chemical industry.
The total business sector (industry, building and construction, together with public and private services) ac-counts for about 13% of Denmark’s total emissions of greenhouse gases. By far the largest part of these emis-sions is CO2 from energy consump-tion, but the sector is also a source of emissions of industrial green-house gases.
In Denmark, the industrial sector’s energy consumption accounts for about 18% of total energy consump-tion. This 18% does not include en-ergy consumption for transport and space heating.
In the last 20 years relative con-sumption by the business sector var-ied considerably. Up to 1983, con-sumption fell considerably due to increases in the price of oil. When
oil prices fell in 1986, energy con-sumption began rising again. In the period 1990-2003 energy consump-tion by the industrial sector rose by just under 5%, while electricity consumption in the same period in-creased by almost 15%. From 2002 to 2003 energy consumption fell by almost 1%.
Since 1994 energy and electricity in-tensity has fallen, see Figure 2.11.
The change in the trend in energy and electricity intensity in 1993 cor-responds with change from a period of low economic growth to a period of high growth, implying better utili-sation of production capacity. At the same time, from 1993 the first CO2
taxes were introduced on energy consumption by businesses, with associated subsidies for energy sav-ings, agreement schemes etc. Advice to businesses from electricity com-panies was also introduced in the early 1990s.
The main action against the indus-trial sector’s energy consumption until 2005 has been based on the green tax package for businesses passed by the Folketing in 1995. The package contained a combina-tion of taxes and rebates to enter-prises through, among other meas-ures, government grants to promote energy savings by enterprises.
As can be seen from Figure 2.12, over the past 15 years there has been a steady increase in energy consumption by the private com-merce and services sector. Primarily
48
FIGURE 2.11 ENERGY AND ELECTRICITY INTENSITY IN THE INDUSTRIAL SECTOR, ADJUSTED
FOR INTER-ANNUAL CLIMATE FLUCTUATIONS
Source: Danish Energy Authority and Odyssee1
1 ODYSSEE is a joint project between ADEME, the EIE programme of the European Commission/DGTREN and allenergy efficiency agencies in the EU-15 and Norway.
00,10,20,30,40,50,60,70,80,9
1
1 980 1 982 1 984 1 986 1 988 1 990 1 992 1 994 1 996 1 998 2000 2002
TJ p
er D
KK
mill
.
Total (TJ per DKK mill.) Electricity (TJ per DKK mill.)
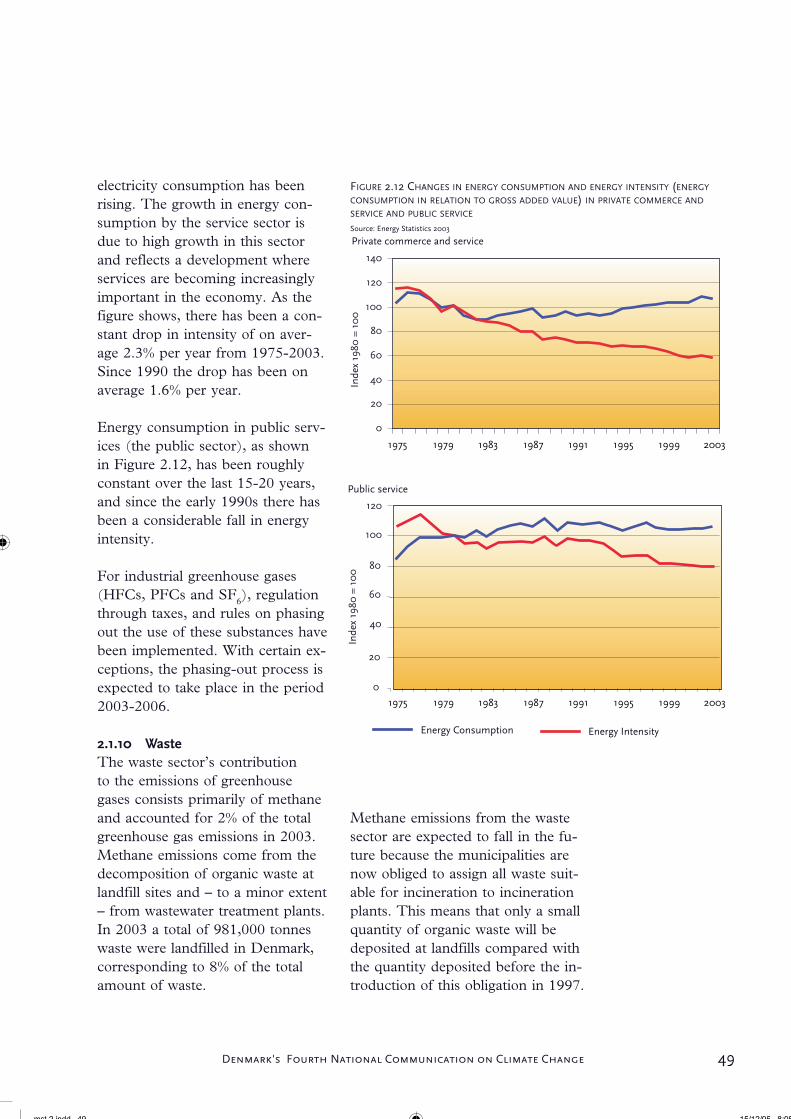
49Denmark's Fourth National Communication on Climate Change
electricity consumption has been rising. The growth in energy con-sumption by the service sector is due to high growth in this sector and reflects a development where services are becoming increasingly important in the economy. As the figure shows, there has been a con-stant drop in intensity of on aver-age 2.3% per year from 1975-2003. Since 1990 the drop has been on average 1.6% per year.
Energy consumption in public serv-ices (the public sector), as shown in Figure 2.12, has been roughly constant over the last 15-20 years, and since the early 1990s there has been a considerable fall in energy intensity.
For industrial greenhouse gases (HFCs, PFCs and SF6), regulation through taxes, and rules on phasing out the use of these substances have been implemented. With certain ex-ceptions, the phasing-out process is expected to take place in the period 2003-2006.
2.1.10 WasteThe waste sector’s contribution to the emissions of greenhouse gases consists primarily of methane and accounted for 2% of the total greenhouse gas emissions in 2003. Methane emissions come from the decomposition of organic waste at landfill sites and – to a minor extent – from wastewater treatment plants. In 2003 a total of 981,000 tonnes waste were landfilled in Denmark, corresponding to 8% of the total amount of waste.
Methane emissions from the waste sector are expected to fall in the fu-ture because the municipalities are now obliged to assign all waste suit-able for incineration to incineration plants. This means that only a small quantity of organic waste will be deposited at landfills compared with the quantity deposited before the in-troduction of this obligation in 1997.
49
Private commerce and service
0
20
40
60
80
100
120
140
Inde
x 19
80 =
10
0In
dex
1980
= 1
00
Energy Consumption Energy Intensity
Public service
0
20
40
60
80
100
120
FIGURE 2.12 CHANGES IN ENERGY CONSUMPTION AND ENERGY INTENSITY (ENERGY
CONSUMPTION IN RELATION TO GROSS ADDED VALUE) IN PRIVATE COMMERCE AND
SERVICE AND PUBLIC SERVICE
Source: Energy Statistics 2003
mst 2 indd 49 15/12/05 8:05
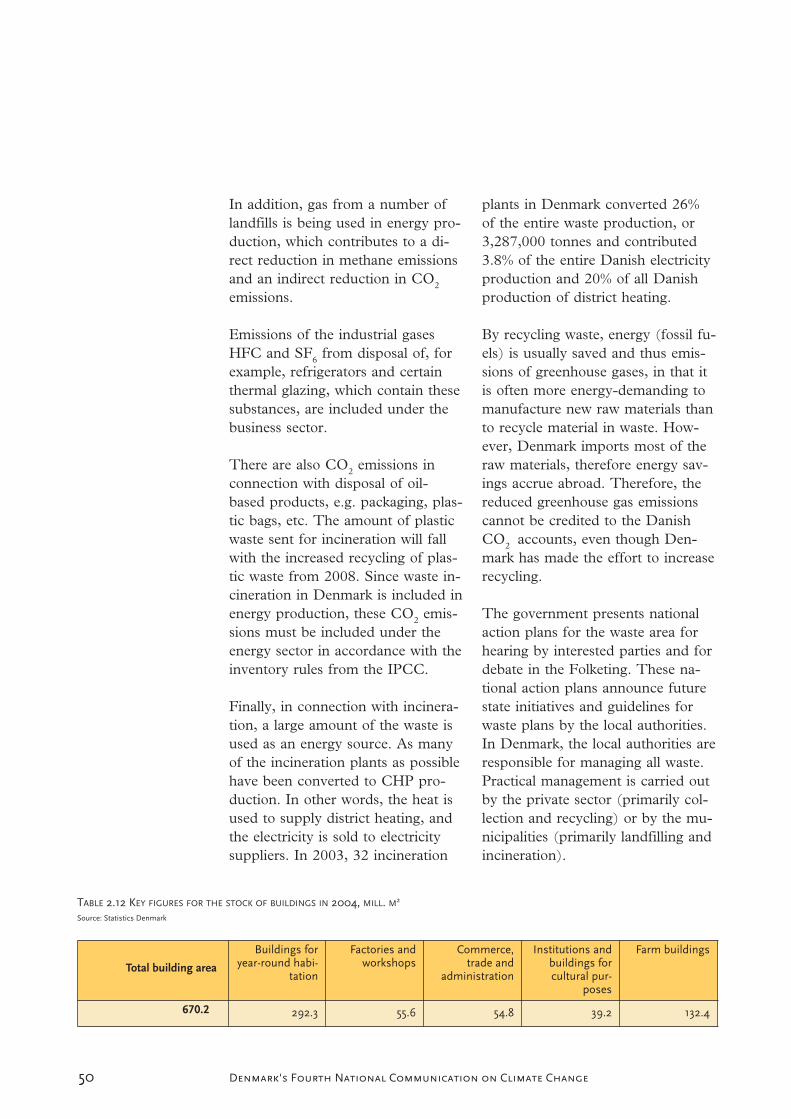
50 Denmark's Fourth National Communication on Climate Change
In addition, gas from a number of landfills is being used in energy pro-duction, which contributes to a di-rect reduction in methane emissions and an indirect reduction in CO2
emissions.
Emissions of the industrial gases HFC and SF6 from disposal of, for example, refrigerators and certain thermal glazing, which contain these substances, are included under the business sector.
There are also CO2 emissions in connection with disposal of oil-based products, e.g. packaging, plas-tic bags, etc. The amount of plastic waste sent for incineration will fall with the increased recycling of plas-tic waste from 2008. Since waste in-cineration in Denmark is included in energy production, these CO2 emis-sions must be included under the energy sector in accordance with the inventory rules from the IPCC.
Finally, in connection with incinera-tion, a large amount of the waste is used as an energy source. As many of the incineration plants as possible have been converted to CHP pro-duction. In other words, the heat is used to supply district heating, and the electricity is sold to electricity suppliers. In 2003, 32 incineration
plants in Denmark converted 26% of the entire waste production, or 3,287,000 tonnes and contributed 3.8% of the entire Danish electricity production and 20% of all Danish production of district heating.
By recycling waste, energy (fossil fu-els) is usually saved and thus emis-sions of greenhouse gases, in that it is often more energy-demanding to manufacture new raw materials than to recycle material in waste. How-ever, Denmark imports most of the raw materials, therefore energy sav-ings accrue abroad. Therefore, the reduced greenhouse gas emissions cannot be credited to the Danish CO2 accounts, even though Den-mark has made the effort to increase recycling.
The government presents national action plans for the waste area for hearing by interested parties and for debate in the Folketing. These na-tional action plans announce future state initiatives and guidelines for waste plans by the local authorities. In Denmark, the local authorities are responsible for managing all waste. Practical management is carried out by the private sector (primarily col-lection and recycling) or by the mu-nicipalities (primarily landfilling and incineration).
50
TABLE 2.12 KEY FIGURES FOR THE STOCK OF BUILDINGS IN 2004, MILL. M2
Source: Statistics Denmark
Total building area
Buildings foryear-round habi-
tation
Factories andworkshops
Commerce,trade and
administration
Institutions andbuildings forcultural pur-
poses
Farm buildings
670.2 292.3 55.6 54.8 39.2 132.4

51Denmark's Fourth National Communication on Climate Change
2.1.11 Buildings and urban structure
One-twentieth of the area of Den-mark is urbanised. 85% of Danes are town-dwellers, and most enterprises, institutions, etc., are situated in towns. Many pollution problems are therefore concentrated in the towns.
Today, the total built-up area is 670 mill. m2. Table 2.12 shows the dis-tribution of the area between hous-ing, factories, offices, etc.
Today, about 18,000 homes are built per year, which is one-third of the number built in the first half of the 1970s. House building is expect-ed to remain at this level. In recent years, house building has accounted for slightly more than half of all in-vestment in building activities, and about half of the investment in the housing sector has gone on altera-tions and extensions. Building for industry and commerce now ac-counts for around half of all build-ing in towns.
Towns and cities are generally char-acterised by separation of residen-tial and industrial areas, industrial buildings being situated in specially designated zones on the outskirts of the towns. The growth in the service industries and the growth in manu-facturing with a small environmental impact imply new possibilities for integrating industry and housing, thereby reducing the need for trans-port between home and work.
Approximately two-thirds of the total building space is heated. The most important types of heating are
district heating and central heating using oil and gas. Half of the heated space is heated by district heating and, as seen from Table 2.13, the use of both district heating and nat-ural gas has increased at the expense of oil.
2.1.12 AgricultureOver the last 40 years the agricultur-al area in Denmark has fallen from 72% (30,900 km2) of the total area in 1960 to 62% (26,578 km2) in 2003. Table 2.14 shows the break-down by type of crop over the last 33 years.
The proportion of agricultural land under grass and greenfeed in rotation and permanent grass fell considerably from 1970 to 1990, but rose considerably during the 1990s, due partly to increasing use of grass fields for dairy farming, and partly to the change in EU subsidy schemes, which means that grass or industrial seed must be grown on set-aside land. Furthermore the area with maize and cattle feed is in-cluded with the area with grass and
51
TABLE 2.13 DEVELOPMENT IN THE MAIN FORMS OF HEATING IN BUILDINGS, IN % OF
TOTAL HEATED SPACE
Source: Statistics Denmark.
1981 1991 2001 2002 2003 2004
District heating 29.4 38.6 58.7 59.3 59.8 60.2
Central heating withoil 57.2 37.4 18.6 18.0 17.4 16.9
Central heating withnatural gas 9 13.2 13.4 13.6 13.8
Furnaces fired by oiland similar 2.2 1.5 1.5 1.4 1.3 1.2
Other heating15.8 5.6 8.0 7.9 7.9 7.9
1 Central heating (not oil and natural gas), electric ovens and not specified

52 Denmark's Fourth National Communication on Climate Change
greenfeed, and the area with maize has increased significantly from 0.4% of the agricultural area in 1980 to 4.4% in 2003. This is due in part
to a warmer climate which has made maize easier to grow.
From 1980 to 2003 the number of farms fell from 119,155 to 48,613. In the same period the average size of farms increased from 24 ha to 54 ha. This development has reduced the importance of agriculture as a source of primary employment. However, in the same period agri-cultural production has grown, both in quantity and value, and agricul-tural exports still make up a large proportion - 11% - of Denmark’s total exports.
During the 1990s interest in organic farming increased considerably. In 2003 organic farms accounted for approximately 6% of land under cultivation.
In the last 30 years use of nitrogen by agriculture has varied greatly, cf. Table 2.14.
Up to 1990 there was a big increase in the use of nitrogenous fertiliser, but during the 1990s use of this type of fertiliser fell considerably, and in 2003 nitrogen consumption was below the 1970 level. The nitro-gen content of manure has dropped slightly since 1980. Consumption of phosphorus and potassium in fer-tilisers fell throughout the period.
The cattle population fell by 39% from 1970 to 2003, cf. Table 2.14. Most of the cattle are dairy cows. Since milk production remained ap-proximately unchanged throughout the period, the fall in cattle popula-
52
FIGURE 2.13 CHANGE IN ENERGY CONSUMPTION AND ENERGY INTENSITY (ENERGY
CONSUMPTION IN RELATION TO GROSS ADDED VALUE) IN AGRICULTURE AND FORESTRY
Source: Energy Statistics 2003
Agriculture and Forestry
0
20
40
60
80
100
120
140
1975 1979 1983 1987 1991 1995 1999 2003
Energy Consumption Energy Intensity
Inde
x 19
80 =
10
0
TABLE 2.14 USE OF AGRICULTURAL LAND, LIVESTOCK, AND NITROGENOUS FERTILISER
Source: Danish Institute of Agricultural Sciences, Food and Resource Economic Institute and Statistics Denmark
1970 1980 1990 2000 2003
Grain (%) 59 62 56 57 56
Pulses and industrialseed (%) 2 4 14 5 5
Root crops (%) 10 8 8 5 4
Grass and greenfeedin rotation (%) 17 14 12 16 17
Permanent grass (%) 10 9 8 13 14
Other crops (%) 2 3 2 4 4
Cattle (’000) 2,842 2,961 2,239 1,868 1,724
Pigs (’000) 8,361 9,957 9,497 11,921 12,949
Sheep (’000) 70 56 159 145 144
Poultry (‘000) 19,169 15,507 16,249 21,830 17,844
Nitrogen in fertilisers(’000 tonnes N) 271 394 400 252 201
Nitrogen in manure(’000 tonnes N) - 263 244 232 234

53Denmark's Fourth National Communication on Climate Change
tion is due to higher productivity per animal. In the same period, the pig population increased by 55%. The sheep population has doubled in relation to 1970, while the poultry population is now roughly the same as in 1970. Since the 1970s, initia-tives aimed at nutrients etc. have led to favourable trends, including with regard to greenhouse gases, where agriculture has reduced emissions by about 24% since 1990.
The agricultural sector accounted for about 17% of Denmark’s total emissions of greenhouse gases in 2003. These were primarily methane and nitrous oxides. CO2 from fuel consumption in the agricultural sec-tor accounts for about 3% of total Danish emissions.
Figure 2.13 shows the change in en-ergy consumption and energy inten-sity in agriculture and forestry. En-ergy consumption in agriculture and forestry has increased dramatically since 1980, but since 1997 there has been a slight fall. However there has been an even greater increase in gross added value and thus a drop in energy intensity.
2.1.13 ForestryApproximately 11% of Denmark is forested. Originally focus was main-ly on the potential of conifers, but in recent years focus has changed towards indigenous, deciduous tree species as offering greater long-term production and nature potential. Denmark’s forests are managed as closed canopy forests. The main objective is to ensure sustainable
and multiple-use management of the forests and to manage them in line with the overall management of the countryside. Instead of clear-cut sys-tems, forest owners are to a higher degree applying near-to-nature for-est management regimes. Unlike our Scandinavian neighbours, Denmark is not a country in which forestry plays an important role in the na-tional economy.
The Danish Forest Act protects a very large part of the existing for-ests against conversion to other land uses. Afforestation, for which public subsidies are made available, is as standard protected as forest reserve. In principle, this means that most of the forested land in Denmark will remain as forest.
The ambition is to have about 25% of Denmark’s area forested by the end of the 21st century. A consid-erable increase in the forest area is therefore to be achieved.
Denmark is the only part of the Realm in which forestry is practised. Greenland and the Faroe Islands have almost no forest.
2.2 GREENLAND
2.2.1 Form of government and structure of administration
Greenland has had home rule since 1979. The Home Rule Govern-ment consists of a directly elected parliament (the Landsting), com-prising 31 members. A general elec-tion is held every four years. The
53

54 Denmark's Fourth National Communication on Climate Change
Landsting elects a government (the Landsstyre), which is responsible for the central administration under the Prime Minister (the Landssty-reformand). The members of the government head the various landss-tyreområder (ministries).
However, since Greenland is part of the Realm, some fields of re-sponsibility remain under the state, including the Constitution, the right to vote, eligibility for election to the Folketing, the administration of jus-tice, the concept of citizenship, for-eign policy and the National Bank.
The Home Rule Government is re-sponsible for other areas, including transport and communication, and the environment and nature. Green-land is not a member of the EU, but has an OCT scheme (Overseas Countries and Territories scheme) that ensures the country open access to the European market for its fish products.
International agreements entered into by the Danish government also cover Greenland and apply to Greenland to the same extent unless the Home Rule Government specifi-cally requests exemption or devia-tion from them. Denmark’s ratifi-cation of the Climate Convention and the Kyoto Protocol both cover Greenland.
2.2.2 PopulationGreenland has a population of slightly more than 56,000, 88% of which were born in Greenland.
Most of the remainder of the popu-lation comes from Denmark.
Fishing is the main industry, and it is estimated that about 2,500 people are directly employed by it. In addi-tion, around 3,000 people work in the fisheries industry and derivative occupations.
2.2.3 GeographyWith an area of 2.2 mill. km2,Greenland is the world’s largest island. It extends over almost 24 latitudes. Nordpynten lies only 700 km from the North Pole, and Kap Farvel, 2,600 km further south, is level with Oslo. Towards the south, the height of the sun and thus the length of day and night are almost as in Denmark. Towards the north there is the midnight sun and win-ter darkness, both lasting for almost two-thirds of the year.
85% of Greenland is covered by a continuous, slightly convex ice sheet, which reaches a height of more than 3,000 m above sea level. In a borehole drilled in the cen-tral part of the ice sheet, the drill reached a depth of 3,030 m into the bedrock.
The remaining 15% of the island is home to Greenland’s flora and fauna, and here, on the edge of the ice sheet, the people live - mainly in the coastal areas, from which there is access to open water.
2.2.4 ClimateGreenland’s northern location and the cold and more or less ice-filled
54
55Denmark's Fourth National Communication on Climate Change
seas that surround it are the main reasons for its cold climate.
Greenland has a mostly arctic cli-mate, and forests cannot grow there. Particularly the northern part of the country is close to the North Ameri-can continent, separated from it by only a relatively narrow and ice-filled sea. The position of south Green-land, on the other hand, means that the climate here is influenced by the North American continent to the west, and the ocean to the east.
Atmospheric pressureAtmospheric pressure is generally highest in April/May. The weather in Greenland is most stable at this time of year. After this, in the sum-mer months, the variation in atmos-pheric pressure is small, but in win-ter it is much greater, with a gener-ally higher atmospheric pressure towards the north than towards the south, leading to a higher frequency of cold winds from northerly direc-tions and higher wind velocities.
The biggest pressure extremes in Greenland occur in the winter pe-riod because of the great tempera-ture contrasts in the atmosphere. The highest atmospheric pressure measured in Greenland was 1059.6 hPa, which was recorded in January 1958. The lowest was 936.2 hPa, recorded in 1986 and 1988.
WindStorms typically occur in connection with the passage of low-pressure systems. Between these systems, there are undisturbed periods of
varying duration throughout the year, when the wind is governed by local conditions.
An example is the ice sheet’s kata-batic wind system, the extent of which is enormous. A katabatic wind is a wind that blows down an incline, moving from the central part out towards the edge. The wind velocity accelerates with increas-ing incline of the surface, and the topography can cause channelling, resulting in an extremely high veloc-ity at the edge of the ice.
Greenland has many days with little or no wind. In some places on the east coast this is the case for 60% of the time.
Gusts can be very strong. Gusts of up to 75.1 m/s were measured in Danmarkshavn in 1975, but even stronger gusts undoubtedly occur in connection with the so-called piteraqs. These fall winds, which are katabatic, locally channelled winds from the ice sheet, occur in several locations in Greenland, and are characterised by a very abrupt change from light wind to storm. In Greenlandic, piteraq means “that which assaults one”.
TemperatureThe summer temperatures on both the west and the east coast differ by only a few degrees from south to north, despite a distance of about 2,600 km. The reason for this is the summer midnight sun in north Greenland. Conversely, winter dark-ness and the absence of warm sea
55
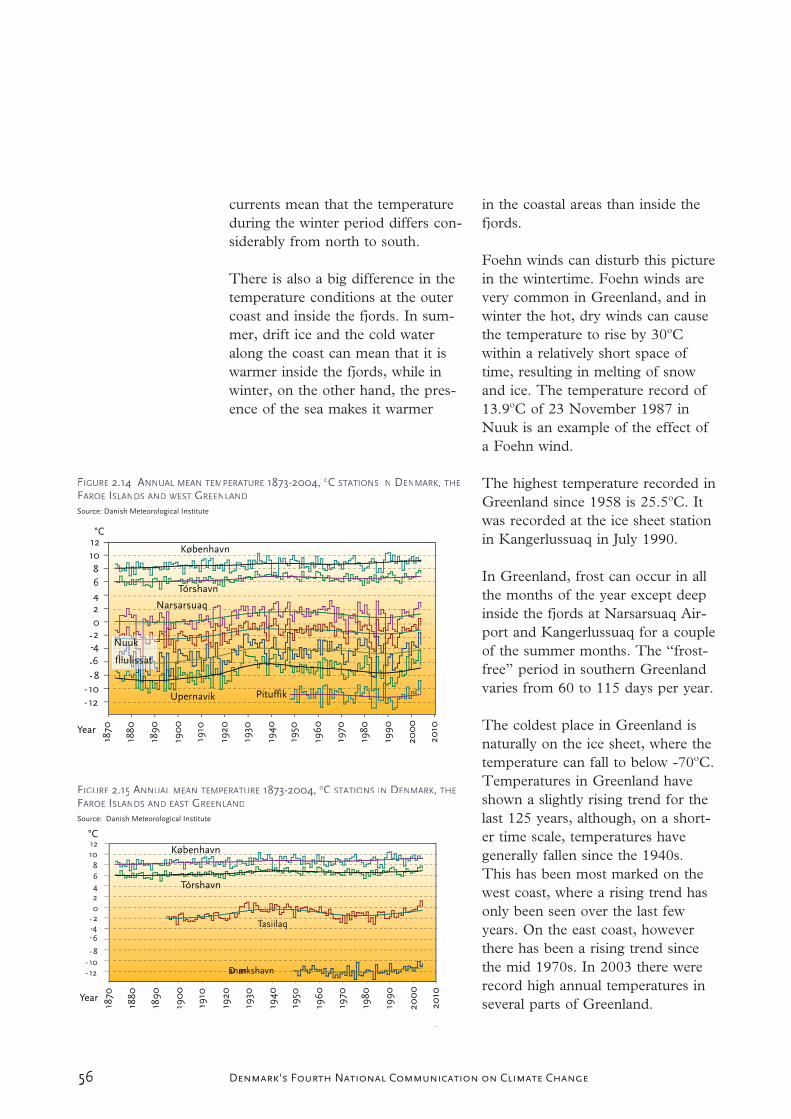

57Denmark's Fourth National Communication on Climate Change
PrecipitationRecorded precipitation in Greenland decreases with rising latitude and from the coast to the inland area. Par-ticularly for southern stations there is considerable seasonal variation.
In the extreme south and particu-larly in the south-eastern region, precipitation is significant, average annual precipitation ranging from 800 to 2,500 mm along the coasts. Further inland, towards the ice sheet, considerably less precipitation is recorded. In the northern regions of Greenland there is very little pre-cipitation, from around 250 mm down to 125 mm per year. In a few places there are arctic deserts, i.e. areas that are almost free of snow in winter, and where evaporation in summertime can exceed precipita-tion.
Not surprisingly, snow is very com-mon in Greenland. In fact, at most stations in the coastal region it can snow all year round without snow cover necessarily forming. There are thus many days with snow dur-ing the year, mostly in the southern part of the country. The snow depth is greatest in southern Greenland, averaging from one to more than two metres in all the winter months and sometimes reaching up to six metres. In southern Greenland the snow cover can disappear altogether during the winter in connection with warm Foehn winds.
Towards the north, snow cover has already formed in most places by
September and normally disappears again in June/July.
Hours of sunshineThe part of Greenland north of the Polar Circle, 66.5ºN, has mid-night sun and polar night of varying length depending on the latitude. Midnight sun means that the sun is in the sky 24 hours a day, while polar night means that the sun does not rise above the horizon at all.
Despite the polar night, the north-ern stations have more hours of sunshine than the southern stations. This is due to the “long” day, of course, but also to generally less cloud cover. However, although the surface of the soil receives more so-lar heat than in the tropics at around the summer solstice because of the long day, a considerable part of the energy is reflected because of the oblique angle of incidence and the snow-and-ice-covered surfaces.
2.2.5 EconomyPrincipal income for the Home Rule Government comes from transfers from the Danish state - the so-called block grant. In addition, the Landss-tyre and the municipalities have rev-enue from personal and corporate taxes, indirect taxes, and licences. There is no VAT. In addition, Greenland receives payment from the EU for access by EU fishermen to Greenland’s fishing waters.
Greenland uses the Danish curren-cy, and Danish currency laws apply in connection with the transfer of funds between Greenland and other
57

58 Denmark's Fourth National Communication on Climate Change
countries. This means that, in sev-eral areas, Greenland is affected by factors, e.g. interest and exchange rates that are determined by external factors.
Exports93% of Greenland’s exports of DKK 2,285 mill. in 2003 consisted of fish products, 60% of which were prawns. The export value of fish products is heavily dependent on the prices on the world market. Although there was a considerably greater production of prawns in 2003, falling prices on the world market considerably reduced the ex-port value.
ImportsApart from fishery and hunting prod-ucts, only a few goods are made in Greenland. Imports therefore include primarily all goods used in house-holds, businesses and institutions, and for investment. In 2003 imports amounted to DKK 3,031 mill.
2.2.6 EnergyAs in other modern societies, a large part of Greenland’s CO2 emissions come from energy production and supply. Approximately 55% of all energy consumption is used for heating and electricity.
Because of the big distances be-tween towns in Greenland it is nei-ther financially nor technically viable to establish a supply grid connecting them. This means that each town has its own power plant or CHP plant, and each settlement has its own power plant - so-called island
operation. At the same time, the climatic conditions mean that the towns cannot tolerate lengthy inter-ruptions in their electricity supply. It is therefore also necessary to have reserve and emergency plants.
Renewable energyUp to 1993 all energy production for electricity and district heating was based on diesel-driven power, heating and CHP plants. From 1993, when the hydropower station at Buksefjord went into operation, the capital Nuuk, where around 25% of Greenland’s population live, has been supplied with hydroelectric-ity for electric heating, lighting, and power. A small hydropower plant in east Greenland started operation in 2005, and a hydropower plant in south Greenland is currently being constructed.
Together with heat utilisation from waste incineration plants, this means that in 2001 about 8% of Green-land’s energy consumption (incl. transport, industry, etc.) came from renewable energy sources.
Regular studies have been carried out with a view to utilising other renewable energy sources, but for various reasons, including the high requirements concerning security of supply, the forms of energy utilisa-tion in question have not been of interest so far in Greenland.
HeatingSince 1993 all buildings built with public subsidies in Nuuk have been supplied with electric heating, and
58
59Denmark's Fourth National Communication on Climate Change
electric boilers with interruptible electric heating have been installed in existing district heating stations. The electric boilers operate as long as surplus electricity is avail-able. When it is not, the oil boilers take over. The electricity for this is supplied at a competitive price. In 2002, 38% of all electricity pro-duced in Greenland went to perma-nent and interruptible electric heat in Nuuk.
In 10 towns the residual heat from electricity production is used for dis-trict heating. In addition, blocks of flats have their own individual heat-ing plant, while most single-family houses have oil-fired central heating.
In settlements, most of the houses have a central heating furnace or oil stoves.
ElectricityElectricity in Nuuk and Tasiilaq comes from hydropower stations. The electricity in the other towns and settlements is produced at die-sel-driven power plants. Work is go-ing on to optimise the utilisation of the power plants.
2.2.7 TransportPassenger transportAll passenger transport to and from Greenland is by air, via either Co-penhagen-Kangerlussuaq or Copen-hagen-Narsarsuaq. From Kangerlus-suaq there is a connection via east Greenland to Iceland as well as from Narsarsuaq to Reykjavik in the sum-mer.
Between towns and settlements in Greenland, passenger transport is by passenger ship, aeroplane, or helicopter. Up through the 1990s both sea and air passenger traffic increased. The need for flexible and rapid transport between towns has increased parallel to developments in society, and this has led to an in-crease in the consumption of petrol.
There are bus services in the larger towns, while in the smaller ones, passenger transport is by taxi. To get out into surrounding areas peo-ple usually use sailing boats and dinghies. There are around 5,000 dinghies in Greenland. The use of private cars, which is not deemed to have much effect on Greenland’s CO2 emission, is increasing. In 1990, 1,410 ordinary cars were registered by private owners, while in 2001, the figure rose to 2,097 - a 50% in-crease.
Goods transportAlmost all goods transport, both to and within Greenland, is by sea. A small proportion, mainly mail and perishable goods, is transported by air. Increased coordination of pas-senger and goods transport by sea is being considered at regional level. Efficient and flexible transport of goods and passengers contributes to economic growth, increased employ-ment, and foreign-exchange earn-ings. Therefore this is essential for developing society.
2.2.8 IndustryThe principal industry in Greenland is fishing/fisheries, both with regard
59
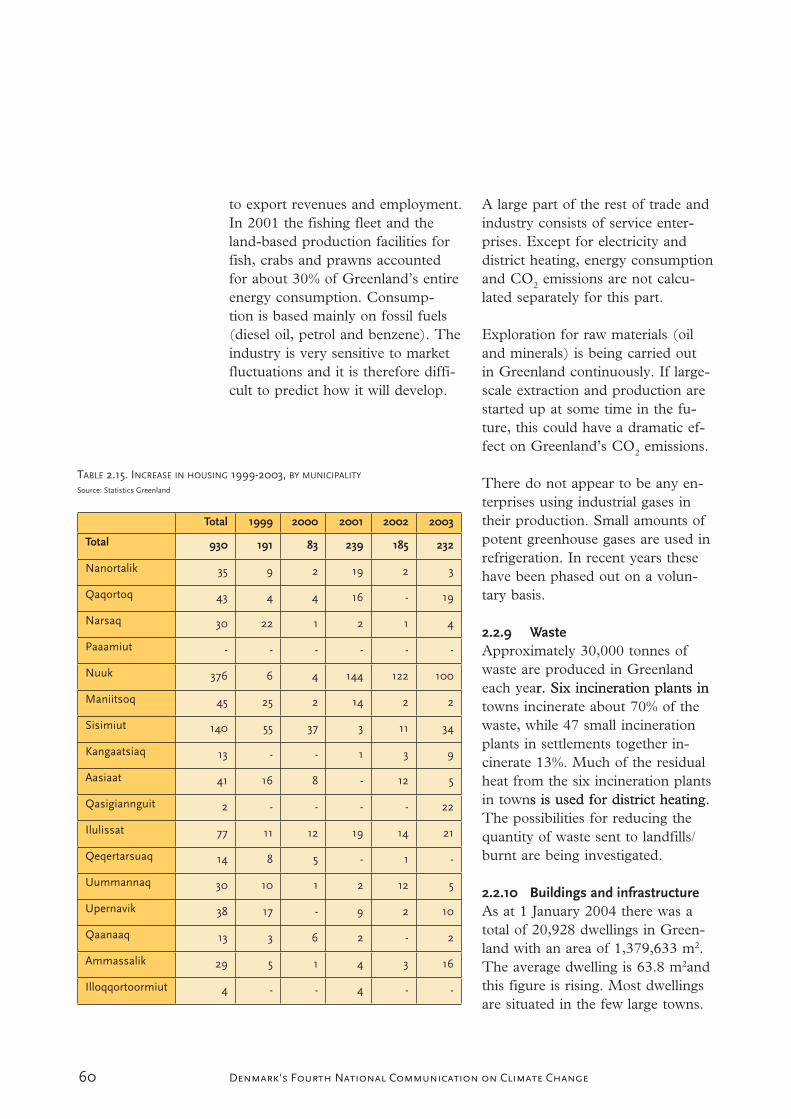
60 Denmark's Fourth National Communication on Climate Change
to export revenues and employment. In 2001 the fishing fleet and the land-based production facilities for fish, crabs and prawns accounted for about 30% of Greenland’s entire energy consumption. Consump-tion is based mainly on fossil fuels (diesel oil, petrol and benzene). The industry is very sensitive to market fluctuations and it is therefore diffi-cult to predict how it will develop.
A large part of the rest of trade and industry consists of service enter-prises. Except for electricity and district heating, energy consumption and CO2 emissions are not calcu-lated separately for this part.
Exploration for raw materials (oil and minerals) is being carried out in Greenland continuously. If large-scale extraction and production are started up at some time in the fu-ture, this could have a dramatic ef-fect on Greenland’s CO2 emissions.
There do not appear to be any en-terprises using industrial gases in their production. Small amounts of potent greenhouse gases are used in refrigeration. In recent years these have been phased out on a volun-tary basis.
2.2.9 WasteApproximately 30,000 tonnes of waste are produced in Greenland each year. Six incineration plants inr. Six incineration plants in towns incinerate about 70% of the waste, while 47 small incineration plants in settlements together in-cinerate 13%. Much of the residual heat from the six incineration plants in towns is used for district heating.s is used for district heating. The possibilities for reducing the quantity of waste sent to landfills/ burnt are being investigated.
2.2.10 Buildings and infrastructureAs at 1 January 2004 there was a total of 20,928 dwellings in Green-land with an area of 1,379,633 m2.The average dwelling is 63.8 m2andthis figure is rising. Most dwellings are situated in the few large towns.
60
TABLE 2.15. INCREASE IN HOUSING 1999-2003, BY MUNICIPALITY
Source: Statistics Greenland
Total 1999 2000 2001 2002 2003
Total 930 191 83 239 185 232
Nanortalik 35 9 2 19 2 3
Qaqortoq 43 4 4 16 - 19
Narsaq 30 22 1 2 1 4
Paaamiut - - - - - -
Nuuk 376 6 4 144 122 100
Maniitsoq 45 25 2 14 2 2
Sisimiut 140 55 37 3 11 34
Kangaatsiaq 13 - - 1 3 9
Aasiaat 41 16 8 - 12 5
Qasigiannguit 2 - - - - 22
Ilulissat 77 11 12 19 14 21
Qeqertarsuaq 14 8 5 - 1 -
Uummannaq 30 10 1 2 12 5
Upernavik 38 17 - 9 2 10
Qaanaaq 13 3 6 2 - 2
Ammassalik 29 5 1 4 3 16
Illoqqortoormiut 4 - - 4 - -

61Denmark's Fourth National Communication on Climate Change
About 200 new dwellings per year are being built. However, as can be seen from Table 2.5 below, the increase in dwellings fluctuates con-siderably from year to year.
The public sector plays a very important role in the housing sec-tor. Most housing is government housing or built with a government grant. Grants are available for hous-ing built by the owners themselves, cooperative housing, private hous-ing, as well as municipal rental housing. The public sector also sub-sidises renovation and improvements to private dwellings. For example insulation and replacement windows are initiatives which will lead to reductions in energy consumption by the dwelling. A large propor-tion of the houses are more than 15 years old, and a refurbishment programme has been initiated. This modernisation includes reducing the energy consumption of individual houses.
2.2.11 AgricultureGeographically, Greenland’s agricul-ture is placed in the south and has a very limited impact on CO2 emis-sions. It consists mainly of sheep farming, as can be seen from Table 2.16. In Greenland in 2003 there was a total of 59 livestock herds, with 57 sheep herds and 2 herds of domestic reindeer. The number of sheep has remained relatively constant since 1990, whereas the number of domesticated reindeer has more than halved. Since 1990 the area farmed has grown by 89%. The increase in the area farmed is
due to cultivation of a large quantity of coarse fodder.
TABLE 2.16. AGRICULTURAL AREA AND NUMBER OF
SHEEP AND DOMESTIC REINDEER IN GREENLAND,1990 AND 2003Source: Statistics Greenland, Home Rule Government, and Nunalerin-ermut Siunnersorteqarfik/consultancy service for agriculture
1990 2003
Agricultural area (ha) 460 870
Sheep (total) 19,929 19,242
Domestic reindeer(total)
6,000 3,100
2.2.12 Forestry
There is no forestry in Greenland apart from four experimental planta-tions with conifers, with a total area of 130 ha.
2.3 THE FAROE ISLANDS
2.3.1 Form of government and structure of administration
The Faroe Islands have home rule status, and their internal affairs are governed by the Faroese parliament (the Lagting). The Faroe Islands are not a member of the EU.
International agreements entered into by the Danish government cover the Faroe Islands and apply to them to the same extent, unless the Faroese government specifically re-quests exemption or deviation from them.
Denmark’s ratification of the Cli-mate Convention covers the Faroe Islands as well, but at the request
61

62 Denmark's Fourth National Communication on Climate Change62
of the Faroese government, geo-graphical exemption was taken for the Faroe Islands in connection with Denmark’s ratification of the Kyoto Protocol.
2.3.2 PopulationIn 2003 the Faroe Islands had a population of 48,214 - an increase of 6,000 since 1977. Net immigra-tion was relatively small up to the beginning of the 1980s but increased relatively sharply in the years 1984-89 as a consequence of a high level of economic and employment activ-ity. In the years 1990-1995 this pic-ture changed to extensive emigration due to a serious deterioration in the economic and employment situation. In 1993 and 1994 alone, net emigra-tion corresponded to 8% of the total population. Since 1996, the popula-tion has been growing. In 2003 the capital, Thorshavn, had a population of 18,684, corresponding to slightly less than 40% of the entire popula-tion.
2.3.3 GeographyThe Faroe Islands consist of 18 small, mountainous islands situated in the North Atlantic at about 62oN and 7oW. The islands extend over 113 km from north to south and 75 km from east to west, and the total area is 1,399 square kilometres. The highest points, almost 890 metres above sea level, are on the northern islands. 17 of the islands are inhabited.
2.3.4 ClimateThe climate on the Faroe Islands is strongly affected by the warm North Atlantic current and frequent pas-
sage of cyclones, which, depending on the location of the polar front, mainly come from southwest and west. The climate is characterised by mild winters and cool summers and the weather is often moist and rainy.
The high pressure over the Azores sometimes shifts towards the Faroe Islands. This can result in stable summer weather lasting several weeks, with quite high temperatures. In winter, on the other hand, the low pressure systems can move more southerly around the islands than normal, bringing in cold air from the north and a lengthy period of sunny winter weather.
The maritime climate is also a re-sult of the cold east Iceland current (polar current), which splits into two currents from eastern Iceland towards the Faroe Islands. The mix-ing of the water masses from this and the warm Gulf Stream causes a relatively big difference in the sea temperatures around the islands, and this in turn causes local variations in the climate.
Atmospheric pressureThe normal atmospheric pressure at sea level in Thorshavn is 1008 hPa on an annual basis, lowest from Oc-tober to January (1004-1005 hPa) and highest in May (1014 hPa). The lowest atmospheric pressure re-corded was 930.3 hPa on 11 January 1993, and the highest was 1048.9 hPa recorded on 13 December 1995. The islands have long periods with both low pressure and high pressure.
63Denmark's Fourth National Communication on Climate Change
The Faroe Islands lie close to the normal cyclone paths over the North Atlantic, and big and frequent changes in atmospheric pressure, with rises and falls of 20 hPa within 24 hours are common throughout the year. Sometimes, however, such violent cyclones develop that pres-sure falls of more than 80 hPA/24 hours occur.
TemperatureThe annual mean temperature in Thorshavn is 6.5°C. The tem-perature in January and February is around 3.5°C, and in July and August, around 10.5°C. The an-nual mean temperature varies from place to place and is lowest at Vága Floghavn, 6.0°C, and highest in Sandur on the island of Sandoy, 7.0°C.
In the 1990s the temperatures in Thorshavn exhibited a slightly rising trend.
PrecipitationAnnual precipitation in Thorshavn is 1284 mm, most in autumn and least in summer. There are big geo-graphical variations in precipitation, mainly due to the topography of the islands.
It rains a lot on the Faroe Islands. Indeed, the Hvalvík has as much as 300 days with precipitation, and Thorshavn, 273 days. In the winter, precipitation is often in the form of snow. On average, Thorshavn has 44 days of snowfall per year, mostly in December and January. There is no snow at all in June, July, and
August, but there can be snow in September.
Since the mid 1970s, precipitation in Thorshavn has been roughly stable.
Hours of sunshine, cloud cover and relative humidityThorshavn has 840 hours of sun-shine per year, most in May and June, the average being around 125 hours. In some Decembers there are no hours of sunshine at all. The highest number of hours of sunshine in a calendar month was 232 hours, observed in May 1948 and in May 2000.
The location in the North Atlantic, combined with frequent low-pres-sure fronts, results in a large number of cloudy days (>80% cloud cover) - 221 days in Thorshavn.
The number of hours of sunshine in Thorshavn has remained stable for the last 20 years, but with a slightly increasing trend in the most recent part of the period.
The Faroe Islands have a moist cli-mate, and the relative humidity is very high, 88% on an annual basis in Thorshavn. It is highest around August, and this is also when most fog occurs.
WindThe mean wind is generally high on the Faroe Islands, particularly in autumn and winter (6-10 m/s). The wind is normally lightest in summer (4.5-6 m/s). There are normally no storms from April to August, while

64 Denmark's Fourth National Communication on Climate Change
autumn and winter are windy, with many storms, some of which can reach hurricane force.
The highest 10-minute mean winds are about 50 m/s, recorded at Mykines Lighthouse in March 1997 and January 1999. In 1997, gusts of almost 67 m/s were recorded at Mykines Lighthouse.
Although the weather is generally windy, there are also still periods, mostly in summer and mostly of short duration.
2.3.5 EconomyThe rapid growth in the Faroese economy since 1995 reversed in 2003. The balance of trade for 2003 shows a deficit of DKK 733 mill. Compared with a surplus of DKK 339 mill. in 2002, a drop of DKK 1,072 mill. in just one year
About 80% of exports from the Faroe Islands go to EU countries. Of this, Denmark accounts for 25% and the UK slightly less. In 2002 the Faroe Islands’ GDP was DKK 10.2 billion.
In the last few years, the Faroe Is-lands have turned a net foreign debt into a net credit balance, although with a big difference between the private and the public sector. At the end of 2001 the private sector had a net credit balance of more than DKK 6 billion, while the public sec-tor’s net foreign debt stood at DKK 1.9 billion. Unemployment has fall-en sharply in the last few years and in 2003 was around 3%, although it rose to 4% in mid 2004 as a result of less favourable economic trends. Table 2.17 shows the development and breakdown by trade and in-dustry, measured in gross national product at factor cost.
The surplus on the balance of pay-ments, which, besides the balance of trade, includes services, wages, interest, transfers from the Dan-ish state and “Danmarks National-bank”, fell in 2002 by about DKK 200 mill. compared with 2001. One explanation is less transfers from abroad as a result of the reduction in the block grant from 1 January 2002. The balance of payments is expected to be much worse in 2003 as a result of the trend in the bal-ance of trade.
The Faroe Islands use the Danish currency and are part of the Danish
TABLE 2.17 GROSS NATIONAL PRODUCT AT FACTOR COST 1998 - 2002, BREAKDOWN BY
SECTOR
Source: The Office of the Danish Chief Administrator in the Faroe Islands (2004)
1998 1999 2000 2001 2002
DKK mill.
Non-financial companies 3,960 4,399 4,703 5,378 5,580
Financial companies 320 301 380 358 357
Public administration andservice
1,322 1,417 1,535 1,697 1,866
Domestic and NPISH1 990 1,089 1,198 1,477 1,563
Indirect measured finan-cial services
-334 -350 -383 -356 -361
Total 6,258 6,856 7,433 8,554 9,005
1 NPISH: Non-profit institutions for households, Source: Hagstova Føroya

65Denmark's Fourth National Communication on Climate Change
currency area, although they have their own notes.
2.3.6 EnergyThe joint municipal company SEV is responsible for the production and sale of electricity on the Faroe Is-lands. In 2003 production amounted to about 249 mill. kWh cf. Table 2.18. Of this, about 34% was based on hydroelectricity, while the remain-der was produced at diesel-driven plants. There is not much electricity production based on wind power - only 1.2% or 3 mill. KWh in 2003. There are currently plans to expand wind energy to a total of about 4 MW, at the same time annual pro-duction from wind energy is expect-ed to reach about 9.8 mill. kWh.
Sales of electricity in 2003 were dis-tributed between 31% for domestic users, 34% for industry, agriculture and fisheries, and 13% for the ser-vice sector, with the remainder for street lighting etc.
Since a number of oil finds in Brit-ish territorial waters close to the Faroese border in the 1990s, there has been a reasonable presumption that there is oil in Faroese territory, and the first licensing round was held in the spring of 2000. The first licences for exploration and produc-tion of hydrocarbons in the subsoil off the Faroe Islands were granted in August 2000. The first three ex-ploration wells were drilled in 2001, and a further well in 2003. In one of these, oil and gas were found. An evaluation programme is now being
carried out to determine whether this find is commercially viable.
2.3.7 TransportGoods transport between the Faroe Islands and the rest of the world is mainly by sea. Two Faroese ship-ping companies operate freighter services all year round. Since 1998, the Smyril Line has carried freight in connection with their passenger winter sailings to Denmark. The Icelandic company EMISKIP also operates freight services throughout the year and has an office on the Faroe Islands.
Besides Vágar Floghavn, the Faroe Islands have 12 helicopter pads. Air services are provided by MAE-RSK AIR, ICELAND AIR and the Faroese company ATLANTIC AIRWAYS. The number of air trav-ellers to and from the Faroe Islands has risen sharply in the last few years.
Passenger transport by sea takes place mainly in the summer period. There are both regular services (Smyril Line) and cruise liners. The number of foreign passenger ships
TABLE 2.18 ELECTRICITY PRODUCTION 1999-2003 (GWH)Source: The Office of the Danish Chief Administrator in the Faroe Islands (2004)
1999 2000 2001 2002 2003
Hydropower 70.2 76.0 76.0 95.9 85.7
Diesel power 130.6 136.4 154.8 143.2 160.3
Wind power 0.6 0.5 0.5 0.6 3.0
Total 201.4 212.9 231.3 239.7 249.0

66 Denmark's Fourth National Communication on Climate Change
calling at the Faroe Islands has been increasing in recent years.
For 20-30 years up to the beginning of the 1990s and again over the last few years, major investments have been made in enlarging and mod-ernising the transport infrastructure on the islands and the communica-tion links with the outside world. Constructing roads, tunnels, and harbours is costly because of the difficult topographical conditions. Since an economic downturn at the beginning of the 1990s, the number of motor vehicles has increased by almost 1,000 per year since 1995 and in 2003 there were 23,220 mo-tor vehicles, of which about 17,000 were cars and 3,900 lorries and vans.
2.3.8 IndustryExcluding exports of ships, which vary considerably over the years, 98% of the Faroe Islands’ export earnings come from fish and fish products. The fishing industry is therefore of vital importance to earnings and employment on the Faroe Islands. The limited oppor-tunities in other sectors of industry reinforce still further the totally dominant role of the fishing indus-try. Small villages in particular are almost entirely dependent on fisher-ies. In 2001 more than 27% of total wages on the Faroe Islands came from the fishing industry. Today, the number of man-years in the fishing fleet itself is estimated to be about 2,000.
Besides the actual fish industry, a number of workshops and industrial enterprises have been built up to make equipment etc. for fishing ves-sels and the fisheries industry. This group includes shipyards and firms making fishing tackle, and machines and equipment for filleting factories.
The absence of a large domestic market, high transport costs for raw materials and finished goods, and - in an international context - a rela-tively high level of overall costs have hitherto prevented the Faroe Islands from establishing export-oriented industries apart from the fishing in-dustry and the firms supplying it.
To a certain extent, the Faroese government grants loans to small businesses – particularly in outlying areas. Finally, the government has provided widespread guarantees for loans to businesses.
2.3.9 Buildings and urban structureFor many years, the Faroese author-ities have made every effort to coun-teract migration from the small or isolated villages and islands, in par-ticular through a major road-build-ing programme and other transport measures. However, population development is generally poorer in these outlying areas than in other parts of the country.
Housing is predominantly single-family houses, most of which are relatively large and of high standard.

67Denmark's Fourth National Communication on Climate Change
2.3.10 Agriculture
Until the end of the nineteenth cen-tury, farming was the Faroe Islands’ main industry, but with the eco-nomic and industrial development since then, particularly within fisher-ies, farming today accounts for only 0.3% of the Faroe Islands’ gross national income at factor cost.
With a view to increasing the self-sufficiency of the Faroe Islands, the government is providing grants for investments in farming.
With about 5% of the land under cultivation, the Faroe Islands can supply just over half of its total de-mand for lamb and mutton, most of its demand of milk, half of the demand for potatoes, quarter of the demand for eggs, and a small frac-tion of demand for beef. In 2003 the Faroe Islands had about 1,200 dairy cows and about 70,000 sheep.
2.3.11 ForestryThere is no commercial forestry on the Faroe Islands, but there are a number of plantations on the is-lands, which are maintained by the Faroese forestry authority.

68 Denmark's Fourth National Communication on Climate Change

69Denmark's Fourth National Communication on Climate Change
3.1 GREENHOUSE GAS INVENTORIES
Denmark’s greenhouse gas invento-ries are prepared in accordance with the guidelines from the Intergovern-mental Panel on Climate Change (IPCC) and are based on the meth-ods developed under the European CORINAIR programme.1
The Danish emission inventories fol-low the method described in CORI-NAIR’s guidelines2 and IPCC’s guidelines3. In accordance with the latter guidelines, some of the default methods and emission factors have been modified so that they reflect better Danish conditions.
A description of methods, emission factors and activity data is given in Denmark’s national emission inven-tory reports (NIR)4 to the Climate Convention, which also include data in the common reporting format (CRF). The latest NIR and the lat-est combined Danish inventory of greenhouse gases and other air pol-lutants can be seen at the National Environmental Research Institute’s website5 and in Illerup et al, 2005.
Greenhouse gas inventories for Greenland and the Faroe Islands are included in the national emissions inventory reports to the Climate Convention.
3.2 DENMARK’S EMISSIONS AND RE-MOVALS OF GREENHOUSE GASES
Denmark’s emission of the green-house gases CO2 (carbon dioxide),
CH4 (methane), N2O (nitrous oxide), and the so-called potent greenhouse gases (F gasses), which include HFCs (hydrofluorocarbons), PFCs (perfluorocarbons), and SF6
(sulphurhexafluoride) during the period 1990-2003 are shown in Figures 3.1-3.4 aggregated into the IPCC’s 6 main sectors and the most relevant sub-sectors. Denmark’s to-tal greenhouse gas emissions meas-ured in CO2 equivalents on the basis of the potential of each gas for glo-bal warming is shown together with the distribution with respect to gas and source/sector in Table 3.1 and Figures 3.5 and 3.6 respectively. The development in 1990-2003 bro-ken down by sources from Table 10 of the CRF are shown in Annex A.
3.2.1 Carbon dioxide, CO2
Almost all CO2 emissions come from combustion of coal, oil and natural gas at power stations and in residential properties and industry, although road transport also contrib-utes a considerable proportion.
The relatively large fluctuations in the emissions from year to year are due to trade in electricity with other countries - primarily the Nordic countries. The large emissions in 1991, 1994, 1996, and 2003 are due to large electricity exports.
From 1990 to 1996, emissions showed a rising trend, but they have fallen since 1997 because many power stations have changed their fuel mix from coal to natural gas and renewable energy. As a result of the reduced use of coal in recent
3 Greenhouse gas inventory information

70 Denmark's Fourth National Communication on Climate Change
years, most of the CO2 emissions now come from combustion of oil.
Emissions from road transport in 2003 accounted for approx. 22% of the total CO2 emissions.
In 2003, total actual CO2 emissions inventoried under the Climate Con-vention, excluding land-use change and forestry (LUCF), were 12% higher than in 1990. If LUCF is included, net emissions were 10% higher. Corrected for exchange of electricity with other countries and annual temperature variations, CO2
emissions dropped 13% with and 15% without LUCF during the same period.
3.2.2 Methane, CH4
Anthropogenic methane (CH4) emis-sions primarily stem from agricul-ture, landfills, and the energy sector, among which agriculture contributes the most by far.
The emissions from agriculture are due to the formation of methane in the digestive system of farm animals (enteric fermentation) and manure management.
Emissions of methane from landfills are decreasing, because the produc-tion of methane has fallen year by year since the abrupt fall in landfill-ing in 1997.
Emissions of methane from the en-ergy sector have been increasing due to an increased use of gas-driven en-gines, which emit large amounts of methane compared to other combus-tion technologies. However, all other
Industrialcombustionplants 9%
Industrialprocesses 3%
Transport22%
Public powerand districtheatingplants /Refineries53%
Other1%
Residentialand Commercialplants 12%
0
10000
20000
30000
40000
50000
60000
70000
80000
CO
2 em
issi
on (
100
0 to
nnes
)
Public power anddistrict heatingplants / RefineriesIndustrialcombustion plantsTransport
Residential andCommercial plants
Industrial processes
Other
Total
Total, adjusted
1990
1991
1992
1993
1994
1995
1996
1997
1998
1999
200
0
200
1
200
2
200
3
FIGURE 3.1: CO2 EMISSIONS BY SECTOR ANS
DEVELOPMENT IN 1990-2003Source: The National Environmental Research Institute (NERI)

71Denmark's Fourth National Communication on Climate Change
FIGURE 3.2 CH4 EMISSIONS BY SECTOR
AND DEVELOPMENT IN 1990-2003Source: The National Environmental Research Institute (NERI)
things remaining equal, these emis-sions are expected to be reduced by 5% from 2006, when new emission limits for existing gas-driven engines come into force pursuant to Statu-tory Order No. 720 of 5 October 1998 on the limitation of emissions of nitrogen oxides, unburned carbon hydrides and carbon monoxide from gas motors and gas turbines.
In 2003, total methane emissions were 3% above the 1990 level.
3.2.3 Nitrous oxide, N2OAgriculture constitutes the largest source by far of nitrous oxide (N2O)
emissions, since N2O can be formed in the ground, where bacteria con-vert nitrous compounds from ferti-lizer and manure. Bacterial conver-sion of nitrogen also occurs in drain water and coastal water. This nitro-gen largely comes from agriculture’s use of fertiliser, and emissions from these sources are therefore included under agriculture. From 1990, N2Oemissions from agriculture had dropped 30% due to the reduced use of commercial fertilizers and more efficient use of manure. From 1990, N2O emissions from agricul-ture had dropped 30%f due to the reduced use of commercial fertilizers and more efficient use of manure. A small share of the nitrous oxide emissions originates from power and district heating plants, and cars with catalytic converters.
In 2003, total nitrous oxide emis-sions were 25% below the 1990 level.
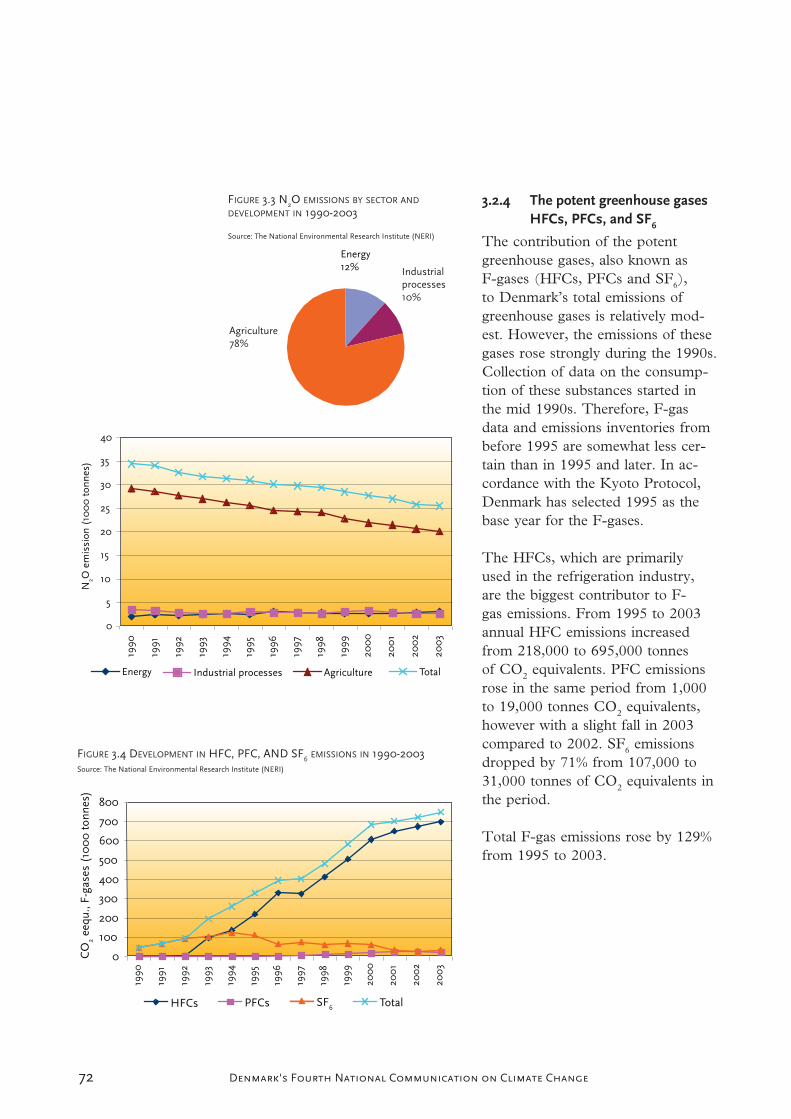
72 Denmark's Fourth National Communication on Climate Change
FIGURE 3.3 N2O EMISSIONS BY SECTOR AND
DEVELOPMENT IN 1990-2003
Source: The National Environmental Research Institute (NERI)
3.2.4 The potent greenhouse gases HFCs, PFCs, and SF6
The contribution of the potent greenhouse gases, also known as F-gases (HFCs, PFCs and SF6),to Denmark’s total emissions of greenhouse gases is relatively mod-est. However, the emissions of these gases rose strongly during the 1990s. Collection of data on the consump-tion of these substances started in the mid 1990s. Therefore, F-gas data and emissions inventories from before 1995 are somewhat less cer-tain than in 1995 and later. In ac-cordance with the Kyoto Protocol, Denmark has selected 1995 as the base year for the F-gases.
The HFCs, which are primarily used in the refrigeration industry, are the biggest contributor to F-gas emissions. From 1995 to 2003 annual HFC emissions increased from 218,000 to 695,000 tonnes of CO2 equivalents. PFC emissions rose in the same period from 1,000 to 19,000 tonnes CO2 equivalents, however with a slight fall in 2003 compared to 2002. SF6 emissions dropped by 71% from 107,000 to 31,000 tonnes of CO2 equivalents in the period.
Total F-gas emissions rose by 129% from 1995 to 2003.
FIGURE 3.4 DEVELOPMENT IN HFC, PFC, AND SF6 EMISSIONS IN 1990-2003Source: The National Environmental Research Institute (NERI)

73Denmark's Fourth National Communication on Climate Change
GREENHOUSEGAS EMISSIONS
1990 1991 1992 1993 1994 1995 1996 1997 1998 1999 2000 2001 2002 2003
CO2 equivalent (Gg)
Net CO2 emis-
sions/removals53045 63446 57503 59594 63333 60375 73613 64081 59590 56653 54858 53457 52812 58124
CO2 emissions
(without LUCF)52887 63559 57755 60060 63663 60609 74035 64524 60409 57523 53076 54615 54288 59329
CH4 5684 5785 5819 5994 6008 6108 6226 6099 6042 5953 5941 6029 5954 5873
N2O 10713 10584 10125 9924 9778 9657 9379 9248 9149 8843 8615 8380 8035 8060
HFCs 0 0 3 94 135 218 329 324 411 503 605 647 672 695
PFCs 0 0 0 0 0 1 2 4 9 12 18 22 22 19
SF6 44 64 89 101 122 107 61 73 59 65 59 30 25 31
Total (with net
CO2 emissions/
removals)
69487 79879 73539 75707 79376 76466 89610 79830 75260 72030 70095 68566 67521 72804
Total (without
CO2 from LUCF)69328 79992 73791 76173 79706 76700 90033 80273 76079 72900 68314 69724 68996 74008
GREENHOUSEGAS SOURCEAND SINKCATEGORIES
1990 1991 1992 1993 1994 1995 1996 1997 1998 1999 2000 2001 2002 2003
CO2 equivalent (Gg)
1. Energy 52390 63065 57130 59545 63309 60415 73998 64267 60148 57345 52802 54458 54121 59318
2. Industrial
Processes2155 2258 2292 2359 2433 2604 2673 2862 2905 3070 3259 3191 3095 3129
3. Solvent and
Other Product
Use
317 305 292 280 268 242 265 262 195 192 212 130 151 206
4. Agriculture 12845 12720 12429 12307 12052 11845 11526 11357 11368 10806 10565 10470 10138 9898
5. Land-Use
Change and For-
estry (LUCF)
158 -113 -252 -466 -330 -234 -422 -443 -819 -870 1782 -1158 -1476 -1204
6. Waste 1622 1645 1648 1683 1645 1593 1570 1525 1463 1487 1475 1475 1492 1457
7. Other 0 0 0 0 0 0 0 0 0 0 0 0 0 0
TABLE 3.1 DANISH GREENHOUSE GAS EMISSIONS AND REMOVALS BY GAS AND SOURCE AND SINK CATEGORIES IN 1990 - 2003Source: The National Environmental Research Institute (NERI)

74 Denmark's Fourth National Communication on Climate Change
3.2.5 Denmark’s total emissions and removals of greenhouse gases
Table 3.1, figures 3.5 and 3.6 show the development in Denmark’s greenhouse gas emissions and re-movals as CO2 equivalents and by gases and sources according to the guidelines on reporting of sum-mary information under the Climate Convention. CO2 is the most im-portant greenhouse gas followed by N2O and CH4. From 1996, when total emissions (excl. LUCF) cor-responded to 90 mill. tonnes of CO2
equivalents, there has been a general reduction until 2000, when total emissions corresponded to 68.3 mill. tonnes of CO2 equivalents, whereas total greenhouse gas emissions cor-responded to 74 mill. tonnes of CO2
equivalents (excl. LUCF) in 2003. The increase of 7.3% from 2002 to 2003 is due to large exports of elec-tricity to other Scandinavian coun-tries in 2003. Of the total green-house gas emissions in 2003, CO2
made up 80%, methane 8%, nitrous oxide 11%, and F-gasses 1%. If net contributions of CO2 emissions by sources and removals by sinks from forests and soil are included (i.e. with LUCF), then net total Danish greenhouse gas emissions corre-sponded to 72.8 mill. tonnes of CO2
equivalents in 2003.
As will be shown in section 3.4, this inventory according to regulations under the Kyoto Protocol implies certain changes with regard to base year and emissions by sources and removals by sinks in the land use and forestry sector (LUCF).
3.2.6 Danish emissions of indirect greenhouse gases and SO2
NOX
The three largest sources of emis-sions of nitrogen oxide (NOx) are transport, power and district heat-ing plants and other mobile sources such as fishing vessels and agricul-tural vehicles. In 2003, the trans-port sector contributed 37% of total Danish NOx emissions, which had fallen from approximately 300,000 tonnes in the mid 1980s to 200,000 tonnes in 2003 – a fall of 32%. The increased use of low-NOx burn-ers and de-NOx units at power and district heating plants have reduced emissions from these plants. In ad-dition, the increased number of cars fitted with catalytic converters has contributed to the trend in reduc-tions.
CORoad transport still accounts for the largest part of CO emissions despite a fall in CO emissions from this source due to the introduction of catalytic converters for vehicles in 1990. In addition, other mobile sources and combustion of wood by households are significant sources. Emissions of CO were reduced by 35% from 1990 to 2003.
NMVOCThe most significant emission sources of NMVOC are use of sol-vents, road traffic and other mobile sources. Total anthropogenic emis-sions of NMVOC were reduced by 39% from 1985 to 2003 – especially due to the increased number of cars
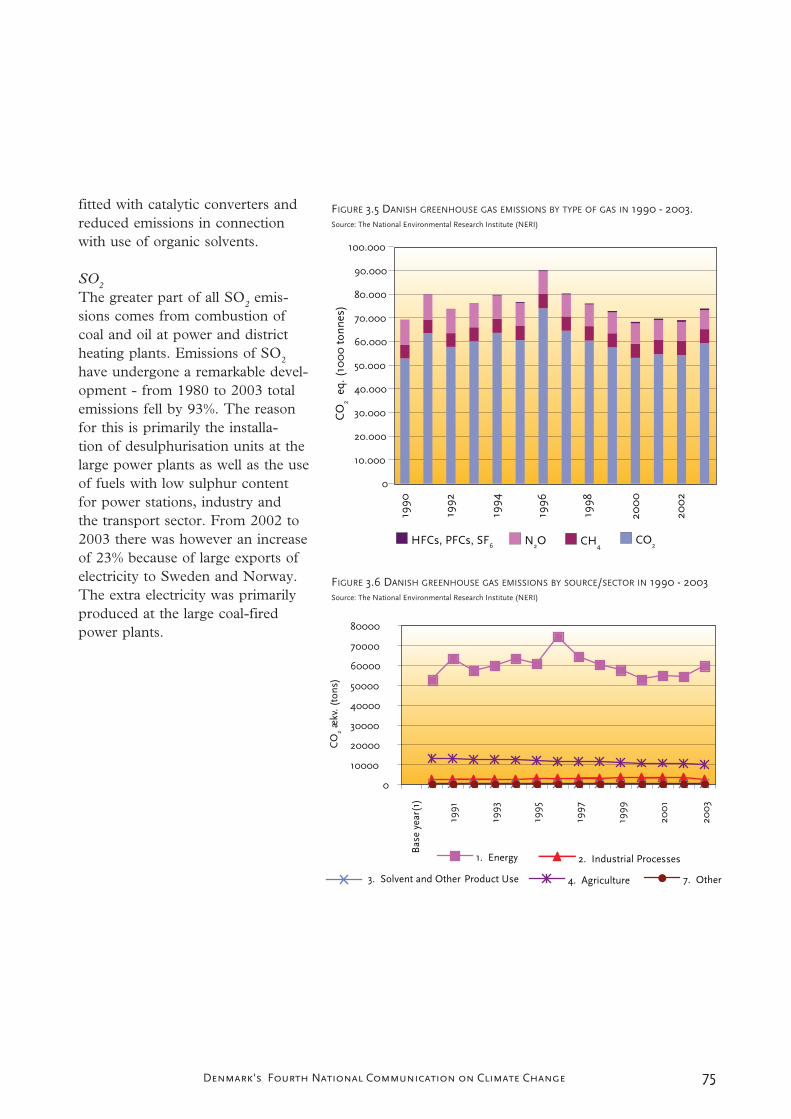
75Denmark's Fourth National Communication on Climate Change
fitted with catalytic converters and reduced emissions in connection with use of organic solvents.
SO2
The greater part of all SO2 emis-sions comes from combustion of coal and oil at power and district heating plants. Emissions of SO2
have undergone a remarkable devel-opment - from 1980 to 2003 total emissions fell by 93%. The reason for this is primarily the installa-tion of desulphurisation units at the large power plants as well as the use of fuels with low sulphur content for power stations, industry and the transport sector. From 2002 to 2003 there was however an increase of 23% because of large exports of electricity to Sweden and Norway. The extra electricity was primarily produced at the large coal-fired power plants.
75
FIGURE 3.5 DANISH GREENHOUSE GAS EMISSIONS BY TYPE OF GAS IN 1990 - 2003.Source: The National Environmental Research Institute (NERI)
FIGURE 3.6 DANISH GREENHOUSE GAS EMISSIONS BY SOURCE/SECTOR IN 1990 - 2003Source: The National Environmental Research Institute (NERI)
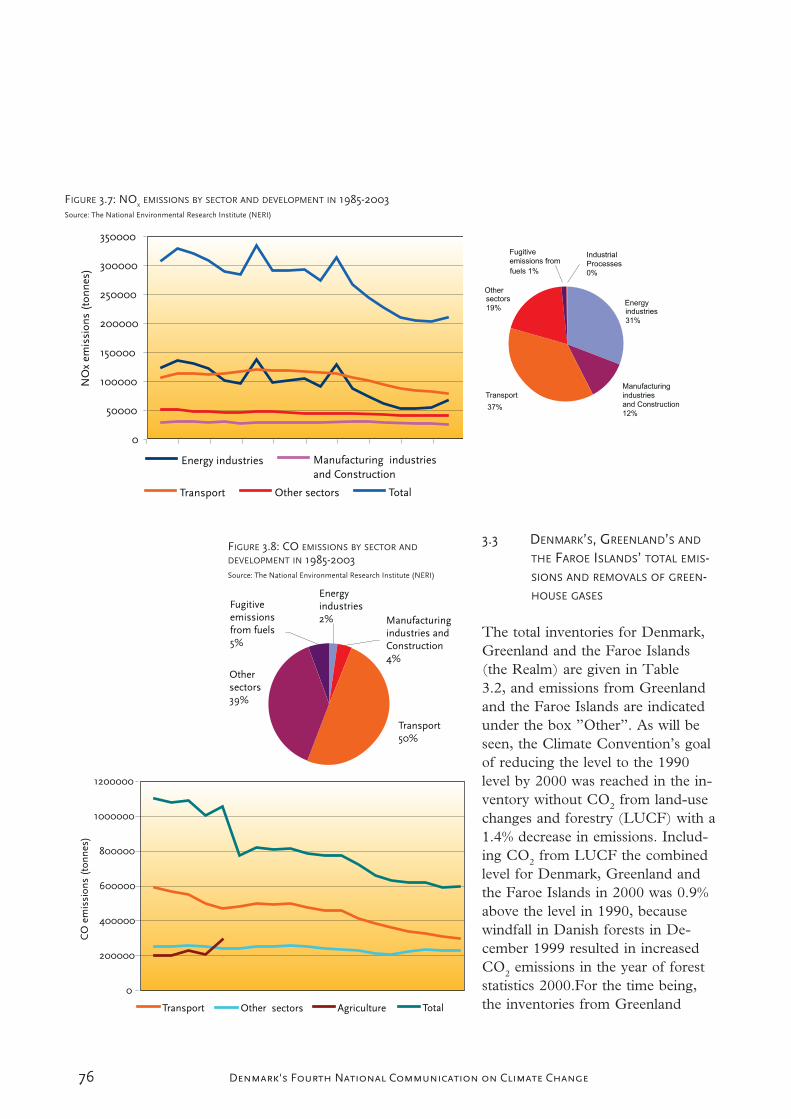
76 Denmark's Fourth National Communication on Climate Change76
3.3 DENMARK’S, GREENLAND’S AND
THE FAROE ISLANDS’ TOTAL EMIS-SIONS AND REMOVALS OF GREEN-HOUSE GASES
The total inventories for Denmark, Greenland and the Faroe Islands (the Realm) are given in Table 3.2, and emissions from Greenland and the Faroe Islands are indicated under the box ”Other”. As will be seen, the Climate Convention’s goal of reducing the level to the 1990 level by 2000 was reached in the in-ventory without CO2 from land-use changes and forestry (LUCF) with a 1.4% decrease in emissions. Includ-ing CO2 from LUCF the combined level for Denmark, Greenland and the Faroe Islands in 2000 was 0.9% above the level in 1990, because windfall in Danish forests in De-cember 1999 resulted in increased CO2 emissions in the year of forest statistics 2000.For the time being, the inventories from Greenland
FIGURE 3.7: NOX
EMISSIONS BY SECTOR AND DEVELOPMENT IN 1985-2003Source: The National Environmental Research Institute (NERI)
FIGURE 3.8: CO EMISSIONS BY SECTOR AND
DEVELOPMENT IN 1985-2003Source: The National Environmental Research Institute (NERI)
Fugitiveemissions from
fuels 1%
IndustrialProcesses0%
Transport
37%
Manufacturingindustriesand Construction12%
Energyindustries31%
Othersectors19%
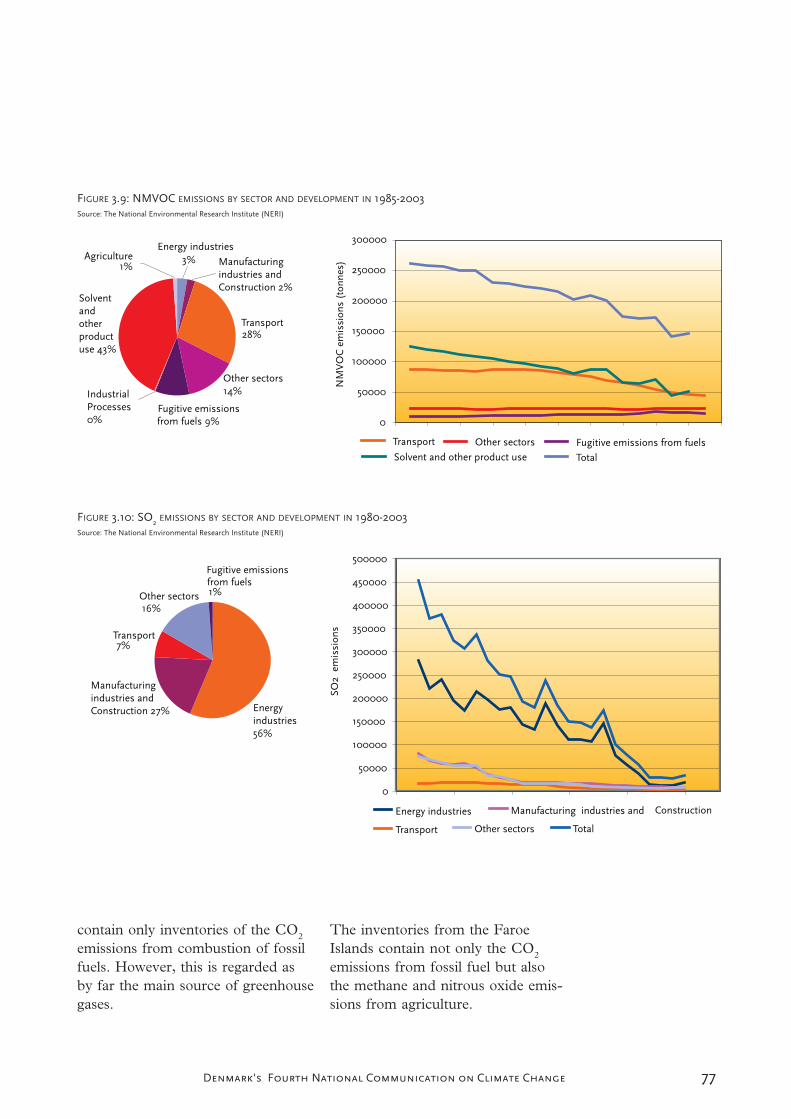
77Denmark's Fourth National Communication on Climate Change 77
FIGURE 3.9: NMVOC EMISSIONS BY SECTOR AND DEVELOPMENT IN 1985-2003Source: The National Environmental Research Institute (NERI)
FIGURE 3.10: SO2 EMISSIONS BY SECTOR AND DEVELOPMENT IN 1980-2003Source: The National Environmental Research Institute (NERI)
contain only inventories of the CO2
emissions from combustion of fossil fuels. However, this is regarded as by far the main source of greenhouse gases.
The inventories from the Faroe Islands contain not only the CO2
emissions from fossil fuel but also the methane and nitrous oxide emis-sions from agriculture.

78 Denmark's Fourth National Communication on Climate Change78
TABLE 3.2 DENMARK’S, GREENLAND’S AND THE FAROE ISLANDS’ TOTAL EMISSIONS AND REMOVALS OF GREENHOUSE GASES, 1990 - 2003Source: The National Environmental Research Institute (NERI).
GREENHOUSEGAS EMISSI-ONS
1990 1991 1992 1993 1994 1995 1996 1997 1998 1999 2000 2001 2002 2003
CO2 equivalent (Gg)
Net CO2 emis-sions/removals
54378 64737 58747 60130 64371 61439 74755 65215 60756 57883 56216 54865 54180 59549
CO2 emissions(without LUCF)
54220 64850 58999 60596 64701 61673 75177 65658 61575 58753 54434 56023 55656 60754
CH4 5702 5804 5837 6012 6027 6127 6245 6119 6061 5973 5961 6049 5975 5894
N2O 10736 10609 10149 9947 9803 9683 9404 9275 9175 8870 8645 8411 8066 8091
HFCs 0 0 3 94 135 218 329 324 411 503 605 647 672 695
PFCs 0 0 0 0 0 1 2 4 9 12 18 22 22 19
SF6 44 64 89 101 122 107 61 73 59 65 59 30 25 31
Total (with net CO2 emissions/removals)
70860 81213 74826 76284 80457 77574 90796 81010 76471 73306 71504 70026 68940 74280
Total (without CO2 from LUCF)
70702 81326 75078 76750 80788 77808 91219 81453 77290 74176 69722 71184 70416 75485
GREENHOUSEGAS SOURCEAND SINKCATEGORIES
1990 1991 1992 1993 1994 1995 1996 1997 1998 1999 2000 2001 2002 2003
CO2 equivalent (Gg)
1. Energy 52390 63065 57130 59545 63309 60415 73998 64267 60148 57345 52802 54458 54121 59318
2. IndustrialProcesses
2155 2258 2292 2359 2433 2604 2673 2862 2905 3070 3259 3191 3095 3129
3. Solvent andOther ProductUse
317 305 292 280 268 242 265 262 195 192 212 130 151 206
4. Agriculture 12845 12720 12429 12307 12052 11845 11526 11357 11368 10806 10565 10470 10138 9898
5. Land-UseChange andForestry (LUCF)
158 -113 -252 -466 -330 -234 -422 -443 -819 -870 1782 -1158 -1476 -1204
6. Waste 1622 1645 1648 1683 1645 1593 1570 1525 1463 1487 1475 1475 1492 1457
7. Other 1374 1334 1287 577 1082 1108 1186 1180 1211 1276 1408 1460 1420 1477

79Denmark's Fourth National Communication on Climate Change 79
As will be seen from Table 3.2, Greenland’s and the Faroe Islands’ greenhouse gas emissions are small compared with those of Denmark (each about 1% of the total emis-sions), and they have been almost constant since 1990.
3.4 SUPPLEMENTAL INFORMATION UN-DER THE KYOTO PROTOCOL
3.4.1 National systems for greenhouse gas inventories pursuant to Article 5, Section 1 of the Protocol
ObjectivesIn pursuance of Article 5, Section 1 of the Kyoto Protocol, the Parties to the Protocol shall establish national systems for the estimation of green-house gas emissions. The objective of establishing the national systems is to ensure good quality invento-ries. This is achieved by following the IPCC Guidelines for planning, implementation and execution of the activities connected with the work on the greenhouse gas inventories. The national system must also ensure that the inventories are transparent, consistent, comparable, complete and accurate.
Organisation of work etc.The Danish National Environmental Research Institute (NERI) is re-sponsible for producing the Danish greenhouse gas emission invento-ries and the annual reporting to the UNFCCC. NERI is therefore the contact point for Denmark’s national
system for greenhouse gas invento-ries under the Kyoto Protocol. Fur-thermore NERI participates in work under the auspices of the UNFCCC, where guidelines for reporting are discussed and decided upon, as well as participating in the EU monitor-ing mechanism for inventories of greenhouse gases, where guidelines for reporting to the EU are regu-lated.
The work on the annual inventories is carried out in cooperation with other Danish ministries, research institutes, organisations and private enterprises. The most important partners for this work are shown in the following text box.
These partners provide a range of data that are needed to produce the inventory. NERI is therefore in the process of drawing up formal agree-ments that will ensure that NERI re-ceives the necessary data on time.
Calculation methodsThe Danish emissions inventory is based on the IPCC guidelines for calculation of greenhouse gas emissions (the Revised 1996 Inter-governmental Panel on Climate Change (IPCC) Guidelines for Na-tional Greenhouse Gas Inventories (Houghton et al., 1997) and the Good Practice Guidance and Un-certainty Management in National Greenhouse Gas Inventories (Pen-man et al., 2000)) and the Euro-pean CORINAIR (COoRdination of INformation on AIR emissions) program for calculation of national emissions. Generally, emissions are
80 Denmark's Fourth National Communication on Climate Change
calculated by multiplying the activity data (e.g. fuel consumption, number of animals or vehicles) by an emis-sion factor (e.g. the mass of mate-rial emitted per unit of energy, per animal or per vehicle). Activity data are mainly based on official statis-tics. The emission factors are either national values or values recom-mended in the IPCC guidelines.
Important sourcesChoice of calculation method for the individual sources depends among other things on how significant the source is. The sources that together accounted for 95% of greenhouse gas emissions in 2003 or accounted for 95% of the change in emis-sion levels from 1990 to the most recently calculated year (2003) are defined as significant sources ac-cording to the IPCC guidelines. An analysis of the Danish sources shows that 21 sources account for 95% of total greenhouse gas emissions and that the three largest sources – that together account for 62% – are CO2
from the combustion of coal at stationary incineration plants, CO2
from road transport and CO2 from combustion of natural gas at station-ary incineration plants.
Procedure for recalculationAt the same time as the annual calculation of emissions for a new year takes place, any necessary recalculations of emission inventories from previous years are also carried out. Recalculations are made if errors or oversights are found or if better knowledge becomes available. If better knowledge becomes available, statistical data, improvements of method, activity data or emission factors are updated according to new knowledge and research. In order to ensure consistent emission inventories, recalculations will be carried out on the whole time series, as much as circumstances permit.
80
The Danish Energy Authority, the Danish Ministry of Transport and Energy:Annual energy statistics that are compatible with the format used foremission inventories and fuel consumption data for large incineration plants.
The Danish Environmental Protection Agency, the Danish Ministry of the Environment:Database on waste volumes and emissions for potent greenhouse gases (Fgasses).
Statistics Denmark, the Danish Ministry of Economic and Business Affairs:Statistical yearbook, sales statistics for industry, and agricultural statistics.
The Danish Institute of Agricultural Sciences, the Danish Ministry of Food, Agriculture and Fisheries:Data on use of fertilizer, fodder, and nitrogen emissions from livestock.
The Danish Road Directorate, the Danish Ministry of Transport and Energy:Number of vehicles grouped by categories corresponding to the EUclassifications, kilometres travelled and speeds shown by town, main roadsand motorways.
Forest and Landscape Denmark, the Royal Veterinary and AgriculturalUniversity, the Danish Ministry of Food, Agriculture and Fisheries:Background data for forests and removals of CO2 by forests.
The Civil Aviation Administration, the Danish Ministry of Transport and Energy:Aircraft data (aircraft types and flight routes) for all flight departures andarrivals in Danish airports.
DSB, the Danish Ministry of Transport and Energy:Fuel related emission factors for diesel locomotives.
Danish enterprises:Environmental accounts and other information.
81Denmark's Fourth National Communication on Climate Change
Uncertainty Uncertainty in the greenhouse gas inventories is calculated as recom-mended in the IPCC guidelines and covers 93% of total Danish green-house gas (GHG) emissions. The result of the calculations shows that total GHG emissions were calcu-lated to have an uncertainty of 46% and the increase in GHG emissions since 1990 was calculated to be 4.8% 19%. Uncertainty is greatest for N2O emissions from agricultural land, whilst the uncertainty for CO2
emissions from stationary incin-eration plants is only 8% and the uncertainty for the development is 1.8%.
Quality assurance and quality controlAs part of the national system, NERI is drawing up a manual to use in quality assurance and quality control of the emission inventories. The manual contains precise and detailed guidelines on how to assure and control quality of the invento-ries. The quality plan described in the manual is based on the IPCC guidelines and ISO 9000, 9001, 9004 and 10005 standards. The ob-jective of the quality planning is to ensure the quality of the inventories in a manner that optimises resourc-es. The quality control includes routine checks of data correctness and completeness as well as ensur-ing that any possible errors and defi-ciencies are identified and corrected. All calculation methods are docu-mented and all material concerning data, methods and recalculations is archived.
Reports are written for all sources of emissions that describe in detail and document the data and calcula-tion methods used. These reports are evaluated by persons external to NERI who are experts in the area in question, but not directly involved in the inventory work. In addition, a project has been started in which the Danish calculation methods, emis-sion factors and uncertainties are compared with those of other coun-tries, in order to further verify the correctness of the inventories.
Annual reporting NERI produces an annual report (National Inventory Report4) for the Climate Convention in which the results of the calculations are presented and the background data, calculation methods, plan for quality assurance and control, uncertainty and recalculations are described and documented. At the request of the Climate Convention, the report is evaluated each year by international experts. During the last few years, improvements have been made in the inventories’ quality and docu-mentation, as a result of the quality assurance and control procedures and the evaluations of national and international experts. The planned improvements can be found in sec-tion 3.4.2.
3.4.2 Information under Article10(a) of the Protocol on improvements of emission inventories
Since Denmark’s Third National Communication to the Climate Convention (NC3) a number of
81

82 Denmark's Fourth National Communication on Climate Change
improvements have been made to the Danish greenhouse gas emission inventories in terms of methodology used, emission factors, and docu-mentation. On evaluation of NC3, certain deficiencies were pointed out in the Danish inventories, including lack of an inventory for emissions for waste water treatment and cer-tain industrial processes, as well as a lack of organisation of the industrial incineration plants into subsectors. These deficiencies have now been corrected to a large degree, and only few improvements are planned that will influence the actual level of the greenhouse gas inventory. Before the next report for April 2006 CO2
emissions from the use of lime and limestone in flue gas desulphurisa-tion, production of expanded clay and production of sugar will be included in the inventories. These sources are expected to contribute approximately 0.2% of the total greenhouse gas emissions. Improved and more detailed inventory meth-odologies will be developed for ag-ricultural machinery and fisheries, and the issue of whether the data basis for calculating CH4 from land-fills can be improved will be consid-ered. These improvements are not expected to change the scale of the total greenhouse gas emissions.
Furthermore, overall focus will be on improving procedures for qual-ity assurance and control and on improving documentation of the na-tional emission factors.
Notes1 A detailed description of the CORINAIR system
used for Danish emissions inventories is givenin Illerup et al. 2000 and Winther et al., 1998.
2 IPCC (1997): Greenhouse Gas Inventory Re-porting Instructions. Revised 1996 IPCC Guide-lines for National Greenhouse Gas Inventories,Vol 1, 2 and 3. The Intergovernmental Panel onClimate Change (IPCC), IPCC WGI TechnicalSupport Unit, United Kingdom. http://www.ipcc-nggip.iges.or.jp/public/gl/invs1.htm
3 EMEP/Corinair (2003): Emission InventoryGuidebook. 3rd edition, prepared by the UN-ECE/EMEP Task Force on Emissions Invento-ries and Projections, 2003 update. Available athttp://reports.eea.eu.int/EMEPCORINAIR3/en(10-05-2004).
4 Illerup et al., 2000, 2001, 2002 and 2003.Illerup et al., 2000, 2001, 2002 and 2003.
5 www.dmu.dkwww.dmu.dk
6 DJF no. 113. January 2005, DJF (Danish Insti-tute of Agricultural Sciences).
82
83Denmark's Fourth National Communication on Climate Change
4.1 CLIMATE POLICY AND THE DECI-SION-MAKING PROCESSES
Since the Brundtland Commission’s report Our Common Future from 1987, Denmark’s climate policy has developed in collaboration with the different sectors of society, the inter-national climate policy, and results from related scientific research.
Thus, since the end of the 1980s and during the 1990s a considerable number of measures to reduce the emissions of greenhouse gases have been implemented.
These measures were aimed at achieving environmental improve-ments for society in general, e.g. by introducing environmental taxes and involving the public in the debate and decisions concerning the envi-ronment.
Since 2001, focus has been on mak-ing efforts to reduce emissions cost-effectively.
In order to be able to monitor the development in total effect of these efforts on greenhouse gas emissions from national energy consumption, the basis for and the follow-up has include emissions inventories cor-rected for annual temperature vari-ations and variations in Denmark’s imports of electricity.
International climate targetsSince 1990 Denmark has undertaken or committed itself to several targets with respect to reducing greenhouse gas emissions:
4 Policies and measures
In accordance with the Climate Convention, to reduce total emissions of greenhouse gases in Denmark, Greenland and the Faroe Islands to the 1990 level by 2000. This target was achieved if only emissions are included. Up-dated figures for 2000 concerning emissions from and removals by forests (reduced removal due to wind-falls are now included) and new data for land (not previously included) brings the Realm to within 1% of the target, when these emissions and removals are included in the inventory.
As a contribution to stabilisation in the EU, Denmark committed itself to reducing CO2 emissions in 2000 by 5% compared to the corrected level for 1990. This target was fulfilled.
In relation to the Kyoto Proto-col, for the period 2008-2012 the EU has committed itself to reducing emissions of green-house gases on average to 8% below the level in the so-called base year; 1990 for CO2, meth-ane, and nitrous oxide and ei-ther 1990 or 1995 for industrial greenhouse gases. Denmark has committed itself to a reduc-tion of 21% as an element of the burden-sharing agreement within the EU. In the Council’s decision on the EU ratifica-tion to the Kyoto Protocol, the commitments of the different Member States are thus given as percentages compared to the
mst 2 indd 83 14/12/05 21:52

84 Denmark's Fourth National Communication on Climate Change
as percentages compared to the base year. In 2006 the respec-tive emission levels must be given in tonnes of CO2 equiva-lents. In this connection, the Council (environment) and the Commission have, in a joint statement, agreed e.g. to show consideration for Denmark’s remarks to the Council conclu-sions of 16-17 June 1998 con-cerning emissions in the base year.
Section 2.1.1 gives a short descrip-tion of the general, democratic de-cision-making processes, to which Denmark’s climate policy is also subject.
4.1.1 National action plansIn 1988 the government of that time issued The Government’s Action Plan for Environment and Devel-opment. The plan was a follow-up on the Brundtland Report and was based in principle on striving for environmentally sustainable develop-ment. One of the main messages in the plan was the need to integrate environmental considerations in decisions and administration within such sectors as transport, agriculture and energy.
In the years since then a number of ministries have prepared sector ac-tion plans in which environment is an integral element. The sector ac-tion plans thus deal with the entire development in a sector combined with solutions of environmental problems caused by the sector. The sector plans for energy, transport,
forestry, agriculture, aquatic envi-ronment, waste, and development assistance are important examples.
The plans from the 1990s all con-tained specific environmental ob-jectives and, usually, deadlines for achieving them. In addition, there were a number of concrete initiatives that are intended to lead to achieve-ment of the objectives. Progress has been evaluated regularly to check whether the implementation of the plans resulted in achievement of the objectives. The results of the evalua-tions have been presented in political reports from the sector ministries or in special follow-up reports.
The evaluations and follow-up have often given rise to the preparation of new action plans, either because additional initiatives have been nec-essary in order to achieve the objec-tives or because the development of society or the development within the area in question has made it nec-essary to change both objectives and initiatives. Major sector plans that have been of importance for the re-duction of greenhouse gas emissions are:
The NPO Action Plan on pol-lution from livestock manure (1985)
Action Plan for the Aquatic En-vironment I (1987)
Energy 2000 (1990)

85Denmark's Fourth National Communication on Climate Change
Action plan for sustainable de-velopment in the agricultural sector (1991)
Strategy for sustainable forest management (1994)
Strategy 2000 - Danish strategy in the development assistance area (1995)
Energy 21 (1996)
Action plan for reduction of the transport sector's CO2 emissions (1996)
National sub-strategy for Dan-ish environmental and energy research (1996)
Action Plan for the Aquatic En-vironment II (1998)
Action Plan II - Ecology in De-velopment (1999)
Waste 21 (1999)
Action plan for reduction of industrial greenhouse gas emis-sions (2000)
Reduction of the transport sector's CO2 emissions - pos-sibilities, policies and measures (2000)
Reduction of the transport sec-tor's CO2 emissions - the gov-ernment’s action plan (2001)
Denmark's national forest pro-gramme (2002)
Denmark's National Strategy for Sustainable Development (2002)
National Climate Strategy for Denmark (2003)
Waste Strategy 2005-2008 (2003)
Action Plan for the Aquatic En-vironment III (2004)
Energy Strategy 2025 (2005)
Action Plan for Strengthened Energy-saving Efforts (2005)
The sector plans deal with differ-ent aspects of the climate problem. In the energy and transport sectors the main environmental concern has been the emissions of the green-house gas CO2. The plans in these sectors were therefore to a great ex-tent concerned with reducing CO2.
The frameworks for the Danish en-ergy sector, however, have changed quite significantly over a short period of time. The goal of Dan-ish energy policy today is to create well-functioning energy markets within frameworks that secure cost-effectiveness, security of supply, environmental concerns and efficient use of energy under conditions of a fully liberalised energy sector, and electricity production from Danish power plants is controlled by market forces and traded freely across na-tional borders.
86 Denmark's Fourth National Communication on Climate Change
The introduction of CO2 quota regulation as a common EU instru-ment has therefore been of absolute importance to Denmark meeting its climate commitments. From 2005, quota regulation will be the key in-strument to ensuring that the Danish energy sector can contribute to the reductions requisite to fulfilling Den-mark’s climate commitments. The remaining initiatives in the energy area will thus primarily serve pur-poses other than climate-related.
The other sector plans are not pri-marily focused on reducing green-house gas emissions, in part because the sectors are battling with other major environmental problems that efforts have been made to solve through the plans. The main con-cern in the agricultural sector has been pollution of the aquatic envi-ronment. In the waste sector it has been reduction of the volume of waste, and in the industrial sector, reduction of emissions/discharges of harmful substances to the atmos-phere/aquatic environment, the use of toxic substances, etc.
However, the implementation of the sector plans has to a great extent also resulted in reduction of green-house gas emissions. For example, the reduction in the agricultural sec-tor’s nitrogen emissions, which the aquatic environment plans are result-ing in, is at the same time reducing the emissions of the greenhouse gas nitrous oxide. The initiatives to re-duce waste quantities mean fewer landfill sites and thus less formation and emissions of methane, and the
ongoing increase in forested area will mean increased removals of CO2.
In addition, the energy and transport plans meant that changes were made in the energy and transport areas in all sectors. The initiatives in the energy area have thus resulted in re-duced energy consumption and, with that, reduced CO2 emissions within a wide range of sectors, including the domestic sector and the business sector.
In June 2002 the government’s na-tional strategy for sustainable devel-opment in Denmark, A SHARED FUTURE - balanced development, was adopted by the Folketing. The strategy must be seen in part as one of Denmark’s responses to the challenge of Agenda 21, which was adopted at the UN General Assem-bly in Rio in 1992. Counteracting climate change is also an integral part of Denmark’s National Strategy for Sustainable Development. The content of this Strategy is described in section 4.6.3.
On the environment policy front, Denmark has participated actively in improving environmental pro-tection in Europe through the EU cooperation and through bilateral environmental assistance to Central and Eastern European countries. On a number of points, the EU’s envi-ronmental regulation has put Europe ahead of the rest of world environ-mentally. There are also many ex-amples of EU rules having helped to strengthen environmental protection in Denmark. With the adoption of

87Denmark's Fourth National Communication on Climate Change
the Amsterdam Treaty, sustainable development became a main ob-jective for the EU, and integrating environmental considerations in the EU’s sector policies became an ob-ligation.
4.1.2 Denmark’s Climate StrategyThe Folketing approved Denmark’s present Climate Strategy in March 2003. The strategy lays down a framework for Denmark’s future efforts on climate. The point of de-parture in the strategy is that Den-mark is to fulfil its international cli-mate commitments under the Kyoto Protocol and the subsequent Burden Sharing Agreement in the EU, and that efforts are to be arranged cost-effectively.
Although many important initiatives have already been launched in order to live up to the climate objective, considerable work still remains be-fore Denmark can live up to its very ambitious Kyoto target. In the base-line projection for Denmark’s green-house gas emissions, which was prepared as a basis for the Climate Strategy - that is a projection which only incorporates expected effects of measures implemented prior to the strategy - it was estimated that there would be a deficit of 20-25 mill. tonnes of CO2 equivalents an-nually in 2008-2012 compared to Denmark’s Kyoto commitment, if no additional measures were imple-mented1, 2.
The Kyoto Protocol makes it pos-sible to plan climate action that is more flexible. The Climate Strategy
combines cost-effective domestic measures with use of the Kyoto Pro-tocol’s flexible mechanisms.
Reduction efforts are first and fore-most tasks for the private sector, not least for the sectors which are subject to allowance regulation. Ac-cording to the Climate Strategy, ef-forts from central authorities could supplement private efforts, and in the initial phase they could contrib-ute by getting the market for CO2
credits started. Efforts from central authorities are concentrated on the flexible mechanisms of the Kyoto Protocol which implement concrete projects to reduce greenhouse gas emissions in foreign countries. They are JI projects (joint implementa-tion of projects in other industrial-ised countries) and CDM projects (projects in collaboration with devel-oping countries on the development of cleaner technology).
Since reduction costs for possible new domestic action in the various sectors are continuously develop-ing as a result of technological de-velopment and changing economic frameworks among other things, the strategy contemplates assessing ef-forts on a regular basis with the aim of ensuring that the most cost-effec-tive measures are chosen.
In order to ensure correlation of reduction efforts across sectors and measures, the government has set a benchmark at DKK 120 per tonne of CO2, which can constitute a basis for the implementation of domestic measures outside the sectors and

88 Denmark's Fourth National Communication on Climate Change
businesses subject to the EU allow-ance scheme. The benchmark is an expression of the value of the CO2
reduction which can be included in the assessment of concrete measures. The value of any other benefits from an initiative can be added, for exam-ple other environmental benefits.
The new government platformAs regards climate issues, the 2005 government platform is based on the Government Climate Strategy. A number of elements with climate-policy aspects are also emphasised. These elements are presented briefly below.
Strategy for the future energy marketOne element of the government plat-form was the presentation of a new long-term energy strategy looking ahead to 2025.
In June 2005 the government pre-sented a new long-term energy strategy, Energy Strategy 2025. The strategy is an overall presentation of the government’s long-term energy policy. The contents of the strategy is described in more detail in section 4.3.1.
Improved energy saving initiativesThe government platform also states that the government will promote energy saving initiatives to allow Denmark to remain at the forefront with regard to energy efficiency, and that the government will present an action plan for increased energy savings based on economically jus-tifiable investments, environmental consideration and advancement of
Danish energy and building techno-logy.
Having presented its draft action plan for strengthened energy-sav-ing efforts in December 2004, the government made a broad political agreement in June 2005 in accord-ance with the government platform, addressing future energy saving measures. It is an ambitious agree-ment, which sets out the framework for efficient and increased energy-saving measures in the years to come. The contents of the agree-ment and the final action plan for re-newed energy-saving efforts present-ed in September 2005 is described in detail in section 4.3.1.
The parties have agreed on a goal of decreased total energy consumption (not including transport). Strength-ened efforts will be made to achieve specific, verifiable energy savings, corresponding to 7.5 PJ on average per year in the period 2006-2013. Significant parts of these energy sav-ings will be attained by more savings by grid and distribution companies within electricity, natural gas, district heating and oil. If, in some years’ time, Danish energy consumption figures (not including transport) are not pointing in the desired direc-tion, the parties of the agreement will discuss the situation and consider a possible enhancement of efforts via specific measures.
The government presented its final action plan for renewed energy-sav-ing efforts in September 2005.

89Denmark's Fourth National Communication on Climate Change
CO2 taxesThe government wishes to moder-nise and simplify the Danish energy and CO2 tax system, taking into ac-count the introduction of CO2 quo-tas in the EU from 1 January 2005. The government will therefore pres-ent a proposal for the structure of the future energy and CO2 taxes.
Reorganisation of motor vehicle taxesThe government will appoint a committee to investigate the options for reorganising the total motor ve-hicle tax system over several years in a way that promotes the environ-ment and retains existing revenue levels.
Investments in research and technologyThe aim is for Denmark to be one of the absolute leaders in Europe in terms of research and develop-ment. The government will present an action plan that aims to see pub-lic and private enterprises increase combined research and development spending to a level above three per cent of Denmark’s gross domestic product in 2010.
The high-technology foundationThe aim of the high-technology foundation is to promote high tech-nology research and innovation, coordinating government research efforts and trade and industry.
Foundation funds will be targeted towards selected areas, in particular, nanotechnology, biotechnology and information and communications technology. Focus will be given to particularly promising areas where
there are clear commercial interests and where Denmark has special advantages and opportunities, e.g. within the health and energy sectors.
Green technology and biofuelThe development and application of new technology can be one of the ways to solve environmental problems and can also have positive commercial effects. The government aims to boost the development of green technology, for example in the areas of energy and fuel.
In June 2005, three new research and development strategies were published: one for hydrogen tech-nologies, one for liquid biofuels, and one for wave energy. The strategies supplement Energy Strategy 2025and can be seen as a realisation of overall considerations concerning prioritising and focusing future tech-nology-development efforts.
For hydrogen technology, the overall strategic target is to make Denmark among the best at developing and demonstrating efficient and com-petitive technologies and systems, so that hydrogen – based primarily on renewable energy – can become an integral element in clean, efficient, and reliable energy supply.
These strategies will be an impor-tant building block for the interde-partmental working group which is to establish a total overview of the possibilities for development and use of different alternative propellants in transport. The strategy suggests that there is a need for continu-

90 Denmark's Fourth National Communication on Climate Change
ing the current Danish strongholds, particularly within development of new technologies for production of bioethanol fuel based on straw and other low value products.
Recently, the strategies for research and development within new energy technologies were supplemented by a strategy for wave energy. The gen-eral aim of the strategy is to enable Danish wave energy plants to con-tribute to cost-effective, sustainable electricity supply in Denmark, and to enable Danish enterprises to sup-ply competitive wave energy prod-ucts etc. in Denmark and abroad.
4.1.3 Progress in general concerning follow-up on the Climate Strategy
The Climate CommitteeIn order to ensure cost-effectiveness in climate policy, as part of the fol-low-up on the Climate Strategy, the government decided to appoint a standing climate committee to fol-low up regularly on the deficit and ensure cost-effective implementation of the climate policy. The commit-tee is composed of the Ministry of Finance, the Ministry of Economic and Business Affairs, the Ministry of Food, Agriculture and Fisheries, the Ministry of Foreign Affairs, the Ministry of Taxation, the Ministry of Transport - now the Ministry of Transport and Energy - including the Danish Energy Authority, and the Ministry of the Environment - including the Danish Environmental Protection Agency (EPA). The EPA
chairs the committee and provides the secretariat.The climate committee is to monitor the Danish climate deficit on a regu-lar basis, i.e., the difference between the Danish target for greenhouse gas emissions in 2008-2012 and the ex-pected emissions. On the basis here-of, the committee is to ensure proper co-ordination and prioritisation between different measures, which can contribute to the fulfilment of Denmark’s reduction commitment, including the use of flexible mecha-nisms (international allowance trade, Joint Implementation and Clean Development Mechanism), allow-ance regulation, and other national policies and measures across various sectors. In this connection, the com-mittee is to assess the socio-econom-ic, state-financial, environmental, distributional and competition-re-lated consequences of implementing various measures and initiatives.
In 2006 the climate committee is also to co-ordinate the preparation of a progress report on the fulfilment of Denmark’s reduction commitment and up-date calculations concerning measures with regard to costs and potentials, aimed at a possible revi-sion of Denmark’s Climate Strategy.
Policies and Measures ProjectIn Denmark’s Third National Com-munication to the Climate Conven-tion, the main results of the analyses on possible new policies and mea-sures carried out prior to the Climate Strategy are reproduced with regard to potential and socio-economic re-duction costs.
91Denmark's Fourth National Communication on Climate Change
The calculations illustrated that only relatively few domestic actions with a significant potential which did not exceed the benchmark of DKK 120 per tonne of CO2 equivalents, would be cost-effective compared to the use of the flexible mechanisms. This must be seen in the light of the fact that Denmark has already made a massive national effort up through the 1990s, while there is a large, unexploited potential in other countries.
Due to this situation, the govern-ment’s cost-effective strategy for meeting Denmark’s reductions com-mitment is based to a certain extent on the use of flexible mechanisms, Emission Trading, and the project mechanisms, Joint Implementation and Clean Development Mechanism. The EU allowance scheme will con-stitute the framework for most of the reduction efforts. Therefore, the specific combination of efforts will depend on the extent to which the enterprises concerned choose to carry out own reduction measures or to buy allowances from abroad.
In order to up-date and investigate the possibilities of implementing additional domestic measures apart from the allowance-regulated activi-ties, the follow-up on the Climate Strategy has also included imple-mentation of an interdepartmental project, the Policies and Measures Project, which e.g. continues to in-vestigate the potential of new do-mestic measures where previous calculations have indicated relatively low reduction costs. It also investi-
gates more closely whether new in-formation exists that could contrib-ute to reducing previously calculated costs further, and whether additional cost-effective national measures could be found. The project is ex-pected to end in 2006 where the results are to be part of the Climate Committee’s status 2006 report.
Annex B1 contains a collection of data sheets with further information on existing measures and on some of the measures no longere in place.
General progress on implementation of new measuresThe EU directive on a common al-lowance scheme (the EU ETS) con-stitutes the framework for efforts from 1 January 2005 for a large pro-portion of the energy producers and some of the energy-intensive indus-try. The businesses subject to the allowance scheme 2005-2007 are in the process of preparing their own climate efforts. They can choose to reduce their own emissions when this is most appropriate, or they can buy allowances or credits from project-based emission reductions when this is considered most appro-priate. This ensures that businesses concerned can adapt their efforts to market conditions on a regular basis. Denmark’s implementation of the EU allowance directive is dealt with in greater detail in sections 4.2.1 and 4.3.1.
As mentioned, using the flexiblemechanisms under the Kyoto Pro-tocol is also part of a cost-effective Danish Climate Strategy. Section
92 Denmark's Fourth National Communication on Climate Change
4.2.2 reports on progress with re-spect to allocation of funds and spe-cific JI and CDM projects.
Section 4.2.3 reports in greater detail on progress regarding taxes of im-portance to Denmark’s greenhouse gas emissions. The government tax freeze eliminates tax increases, but re-allocations may prove to be the outcome of the committee’s delibera-tions, which are expected to con-clude in 2007.
Within the energy sector, measures have been implemented to enhance further energy saving and improve energy efficiency. Section 4.3.1 reports on progress with regard to the future energy-saving efforts and the Energy Strategy 2025 (2005).
The Policies and Measures Project also investigates possibilities in thetransport sector, cf. section 4.3.2. In most cases, however, new measures in the transport sector demand a common effort within the EU to be-come sufficiently effective.
With respect to business and indus-try, focus will be on CO2 reduction by way of allowance regulations as incentives enhancing energy saving and reduction in CO2-process emis-sions. Since the latter is primarily associated with the production of ce-ment and tiles, technology offers lim-ited reduction possibilities at present. Technologically, the prospects for reducing emissions of nitrous oxide associated with the production of nitric acid in the fertilizer industry are good. As shown in section 4.3.3,
this is, however, no longer an issue, since Denmark ceased to produce nitric acid in 2004. Section 4.3.3 also described Denmark’s important contribution to reducing the use and emission of fluorine-containing greenhouse gases.
Certain possibilities also exist for re-ducing greenhouse gas emissions in the agricultural sector. The potential and possibilities of implementing cost-effective measures in this sec-tor were analysed more closely in connection with the preparation of the Action Plan for the Aquatic En-vironment III, which was adopted in 2004. The plan itself only resulted in minor reductions in greenhouse gas emissions, cf. section 4.3.4. Therefore, in continuation hereof, additional concrete measures are be-ing studied at present as part of ThePolicies and Measures Project. In June 2005, the provisional results were presented and discussed at a project day, which was open to the public.
Apart from the measures described in section 2.3.4. concerning afforesta-tion which have already been imple-mented and can be referred to article 3.3 of the Kyoto Protocol, in con-nection with The Policies and Meas-ures Project, it is being investigated whether article 3.4 of the Protocol can include cost-effective reduction potentials in connection with forests and land (revegetation, forest man-agement, cropland management, and grassland management).
Concerning the waste sector, The Policies and Measures Project is

93Denmark's Fourth National Communication on Climate Change
investigating whether there are cost-effective potentials connected to further expansion of extraction and utilisation of energy from methane from landfills, cf. section 2.3.6.
Denmark’s efforts in 1990-2001 and associated costsIn March 2005 a major analysis of Denmark’s efforts in 1990-2001 to reduce emissions of CO2 and other greenhouse gases, and associated costs was finalised and published in the report Denmark’s CO2 emissions - the effort in the period 1990-2001 and the associated costs3, hereafter the Effort Analysis.
Prior to this analysis, quantitative estimates of the effect of separate measures on greenhouse gas emis-sions were often limited to ex-ante estimates before the measure in question was adopted. In a few cas-es, the implementation of a measure was followed by an ex-post evalu-ation. A major reason that only a few ex-post evaluations of individual measures have been carried out is that it is often difficult to clearly at-tribute an observed greenhouse gas reduction to a particular measure, since many areas (sectors/sources) are affected by several measures at the same time.
In the analysis of the importance of selected, implemented measures for greenhouse gas emissions as a result of efforts in 1990-2001, the effect and cost of a number of measures were estimated - both for the year 2001 and for the period 2008-2012. Thus, the latter case is a so-called
without measures projection i.e. without the effects of measures im-plemented since 1990, which gives estimates of the size of mean annual greenhouse gas emissions in 2008-2012, if the measures until 2001 had not been implemented.
Please note that the statistical base for the Effort Analysis has included the emissions inventory submit-ted to the EU and the UN in 2003 (covering 1990-2001) and the “with measures” baseline projection (2008-2012), i.e. without additional measures, published in February 2003 together with the Government Climate Strategy.
The Effort Analysis is described in greater detail in Annex B2.
4.2 MEASURES AND EFFECTS ACROSS
SECTORS
4.2.1 Allowance regulationOn 1 January 2005 the EU Emis-sion Trading scheme (EU ETS) replaced Denmark’s national allow-ance scheme. In accordance with the Climate Strategy, this extended allowance regulation scheme has be-come part of the new central mea-sures associated with the efforts to reduce Denmark’s greenhouse gas emissions.
In its present form the EU allow-ance scheme will be valid in 2005-2007 and it will include CO2 emis-sions from the sector-specific activi-ties mentioned in Table 4.1 below.

94 Denmark's Fourth National Communication on Climate Change
TABLE 4.1 CATEGORIES OF ACTIVITIES COVERED BY THE EUROPEAN UNION GREENHOUSE GAS EMISSION
TRADING SCHEME (EU ETS)
Activities GREENHOUSE GASES
Energy activities
- Combustion installations with a rated thermal input exceeding 20 MW (except
hazardous or municipal waste installations)
- Mineral oil refineries
- Coke ovens
Carbon dioxide
Carbon dioxide
Carbon dioxide
Production and processing of ferrous metals
- Metal ore (including sulphide ore) roasting or sintering installations
- Installations for the production of pig iron or steel (primary or secondary fusion)
including continuous casting, with a capacity exceeding 2.5 tonnes per hour
Carbon dioxide
Carbon dioxide
Mineral industry
- Installations for the production of cement clinker in rotary kilns with a production
capacity exceeding 500 tonnes per day or lime in rotary kilns with a production
capacity exceeding 50 tonnes per day or in other furnaces with a production
capacity exceeding 50 tonnes per day
- Installations for the manufacture of glass including glass fibre with a melting ca-
pacity exceeding 20 tonnes per day
- Installations for the manufacture of ceramic products by firing, in particular
roofing tiles, bricks, refractory bricks, tiles, stoneware or porcelain, with a
production capacity exceeding 75 tonnes per day, and/or with a kiln capacity
exceeding 4 m3 and with a setting density per kiln exceeding 300 kg/m3
Carbon dioxide
Carbon dioxide
Carbon dioxide
Other activities
Industrial plants for the production of
(a) pulp from timber or other fibrous materials
(b) paper and board with a production capacity exceeding 20 tonnes per day
Carbon dioxide
Carbon dioxide
Denmark’s national allowance scheme only included the major pro-ducers of electricity in the energy sector. Via the national allocation plan, the present allowance regula-tion in Denmark includes individual emission limits 2005-2007 for CO2
emissions from 377 Danish produc-tion facilities within several sectors, which together produce approx. half of Denmark’s total greenhouse gas emissions4. These are still, primar-ily, energy producers and energy-intensive businesses and industries. Further information on installations
covered is included in section 4.3.1 on measures in the energy area.
Thus, in the following only the prin-ciples and general figures for Den-mark’s implementation of the EU allowance directive via the national allocation plan (NAP) will be de-scribed.
The national allocation plan set-tles the allocation of quota for set periods at a time. All EU Member States are required to prepare na-tional allocation plans. Denmark’s

95Denmark's Fourth National Communication on Climate Change
proposal for a national allocation for the period 2005-07 was published on 31 March 2004 and approved by the European Commission on 7 July 2004.
Relevant key figures in the proposed national allocation plan for Denmark
for the period 2005-07 are shown in Table 4.2.
TABLE 4.2: KEY FIGURES IN THE PROPOSAL FOR DENMARK’S NATIONAL ALLOCATION PLAN 2005-07 OF 31 MARCH 2004
Number
of instal-
lations1
2002
emis-
sions2
2003
emis-
sions
Projected
emis-
sions
2005-07
Proposed quota al-
location
and
emissions not sub-
ject to allowances
Reduc-
tion in
per cent
relative to
projection
Denmark’s
emissions target
under the EU’s
burden-sharing
agreement,
mill. tonnes CO2 equivalents per year
mill. tonnes CO2
eq. per year,
2008-12
Sectors subject toallowances, in total
357 30.9 36.62 39.3 33.5 14.8
- electricity & heatproduction
234 22.6 28.1 29.4 21.7 26.2
- other sectors sub-ject to allowances,incl. offshore in-dustries-
123 8.3 8.5 9.9 9.2 7.1
- auction 1.7
- new installations 1.0
Sectors not subjectto allowances
37.61 37.81 39.0 39.0
Total 68.52 74.42 78.3 72.5 7.4
Emissions targets2008-12 with com-pensation for baseyear
59.7
Emissions targets2008-12 withoutcompensation forbase year
54.9
1 On the basis of the European Commission’s broad definition of enterprises covered.
2 Preliminary statistics as of 31 March 2004 for sectors subject to allowances. Calculated values for a large part of the sectors not subject to allowances.
96 Denmark's Fourth National Communication on Climate Change
The Danish Allocation Plan entails a total allowance allocation of 15% be-low the baseline projection (with ex-isting measures) available in March 2004 for the sectors subject to allow-ances - with the greatest reduction from the production of electricity. Provided that emissions from the other sectors remain fairly constant, the reduction will constitute approx. 7.4% of total projected emissions. Thus, Denmark will be on its way to fulfilling its climate target for the pe-riod 2008-12 as set by the EU bur-den sharing of the reduction target under the Kyoto Protocol.
The anticipated reduction effect of 7.4% of the new allowance regula-tion corresponds to a reduction of 6 mill. tonnes of CO2 annually in 2005-2007.
The effect in 2008-2012 cannot be estimated before the Allocation Plan for this period has been prepared in 2006.
Changes to the EU allowance direc-tive and/or to Denmark’s implemen-tation of it may have been made by then - e.g. regarding activities, sectors, and greenhouse gases to be included in the scheme.
Denmark has had an active, envi-ronmentally oriented energy policy since the 1970s, and since 1990 this has been supplemented by a climate policy as such, which, on an international scale, has entailed a major strain - economically and/or via administrative regulations - on most of the greenhouse gas emis-
sions, especially from businesses and sectors that are not subject to allow-ances. Therefore the cheap reduc-tion potentials are to a certain degree exhausted in these sectors. The additional reduction efforts needed to fulfil Denmark’s climate commit-ment will, therefore, primarily affect sectors subject to allowances.
Denmark’s national allowance registryIn connection with the new allow-ance regulation that entered into force on 1 January 2005, Denmark’s national allowance registry – (DK ETR – Emission Trading Registry5),which is used to allot allowances to production facilities subject to al-lowances and enables trade in allow-ances among the allowance holders found in the registry, also opened. The allowance registry has also been prepared to contribute to Denmark’s implementation of the Kyoto Pro-tocol in such a way that Denmark’s EU allowance registry can also be made to function as the national allowance registry, which is to be established pursuant to the Kyoto Protocol as a prerequisite for the ap-plication of the Kyoto mechanisms. Section 4.6.1 contains a more de-tailed description of the registry.
4.2.2 The Kyoto mechanismsAs mentioned above, the starting point in the Government Climate Strategy is that efforts aimed at ful-filling the international climate com-mitment under the Kyoto Protocol and the subsequent EU Burden Sharing Agreement are organised cost-effectively.
97Denmark's Fourth National Communication on Climate Change
The flexible mechanisms are, therefore, important elements of the Government Climate Strategy, supplementing domestic reduction measures. The purchasing of CO2
credits is primarily a task for the pri-vate businesses under the regulations of the EU allowance directive. The market for CO2 credits is, however, still in the making. By involvement in project development, the govern-ment will contribute to “starting up” the market for CO2 credits earlier than would otherwise have been the case. The buying of credits will also contribute to the fulfilment of Den-mark’s international climate com-mitment, just as the climate projects will entail a number of additional environmental benefits such as re-duced pollution of air and water.
On this basis the government has allocated DKK 1,130 mill. for the purchasing of CO2 credits from JI and CDM projects in 2003-2008.
With a mean allowance price in the projects of DKK 50 per tonne of CO2, the allocated funds correspond to approx. 4.5 mill. tonnes of CO2
annually for 5 years (2008-2012). A target-fulfilment projection that in-cludes the effects of these additional measures in 2008-2012 is 4.5 mill. tonnes of CO2 lower than the base-line emission projection, which is a projection of Denmark’s greenhouse gas emissions and removals invento-ried under the Kyoto Protocol with implemented and adopted measures.
The implementation of specific JI and CDM projects is described in more detail in the following. The remaining “further information” under the Kyoto Protocol which the Fourth National Communica-tion must contain, cf. the reporting guidelines, is included in section 4.6.
JI projectsIf a well-functioning market for CO2 credits is to become a reality, it is important that the host coun-tries have the necessary institutions and procedures for approval of climate projects in place. This is best ensured if the Danish state as purchaser of CO2, becomes directly involved in the development of spe-cific climate projects. By building on experience and network contacts gained from the well-established en-vironmental assistance programme, the Danish state can help get the necessary approvals in place.
Climate projects in Central and Eastern EuropeOn this basis, Denmark has selected a number of promising climate projects in collaboration with countries in Eastern Europe. Contracts for the acquisition of approx. 2.6 mill. tonnes CO2
credits from five projects have been entered into. The assessment is that the contracts entered into, and negotiations about other projects, have been directly influential in enabling national authorities to build administrative capacity to manage JI projects.

98 Denmark's Fourth National Communication on Climate Change
All five projects display good envi-ronmental profiles and for the ma-jority also good social profiles. Thus, it shows how climate projects lead to several types of benefits, benefiting the country buying the CO2 reduc-tions as well as the host country. Annex C contains further informa-tion on three examples of the five JI projects.
Denmark has also instigated tenders, where private actors can offer CO2
credits from specific projects. The objective is to explore the market for good and cost-effective climate projects. Furthermore, tenders will create more awareness about the Danish state’s interest in purchas-ing CO2 credits and will thus cre-ate better supply of projects. The first tendering round closed on 15 September 2004, and a contract has been entered into with one project from the round, a landfill gas project in Poland.
Not all enterprises interested in buying CO2 credits abroad have the required capacity to get in-volved themselves directly in climate projects. These enterprises will prob-ably be demanding credits from in-termediary dealers offering less risky indirect CO2 credits. In this way, they can avoid getting involved in complex project development and contract writing, and the risk associ-ated with the individual project will be shared by several investors. By showing an interest in indirect cred-its from international emission quota banks and funds, the Danish state is helping ensure that a market for this
type of credits will exist when enter-prises subject to the EU allowance directive start showing a demand for CO2 credits.
Three contracts have been entered into with suppliers of indirect CO2
credits. These include: collaboration between the consultancy firm Eco-Securities and Standard Bank Lon-don (ESSB), the Testing Ground Facility (TGF) under the Nordic Environment Finance Corporation (NEFCO), and the World Bank. The ESSB and TGF are open for investments from private investors, whereas the Danish state’s contract with the World Bank was entered into in collaboration with the two large Danish electricity producers, Elsam and Energi E2. The contract entered into with the World Bank represent the first time large private Danish actors have invested in CO2
reductions in developing countries and Eastern Europe.
It should be noted that to the extent the JI projects lead to reductions in the greenhouse gas emissions of the host country, also before 1 Janu-ary 2008, the reductions in question could, in accordance with the con-tracts entered into, be transferred to the Danish climate account from 1 January 2008 as parts of the assigned amounts of the host country, if the conditions of the Kyoto Protocol have been met. This procedure is called “early crediting” and will in practice be registered as allowance trading in the host country and in Denmark’s national allowance regis-try.
99Denmark's Fourth National Communication on Climate Change
CDM projectsDenmark wishes to create better interaction between environmen-tal assistance and Denmark’s other initiatives to protect the global envi-ronment, including through climate efforts under the Kyoto Protocol of the Climate Convention. This will be realised through collaborating with developing countries on acqui-sition of credits from projects that reduce the emission of greenhouse gases.
In accordance with the Danish Government Climate Strategy from February 2003, Denmark will live up to its commitments under the Kyoto Protocol in a cost-effective way. Efforts will be carried out by the state with the purpose, in par-ticular, of contributing to a faster development of the markets for CO2
credits, than would otherwise be the case. The government has allocated DKK 200 mill. in 2004 and 2005 for state purchases of CO2 credits from CDM projects in developing countries. A further DKK 300 mill. is expected to be allocated to CDM projects in 2006 – 2008, out of a total allocation framework of DKK 1,130 mill. for the purchase of CO2
credits from JI and CDM projects in the years 2002-2008.
CDM collaboration with develop-ing countries is being managed by the Ministry of Foreign Affairs. The goal is to ensure the greatest pos-sible synergy between CDM collab-oration and Denmark’s international effort within development assistance. The climate effort must contribute:
to fulfilling the targets in the Government Climate Strategy to meet Denmark’s reduction commitment in a cost-effective way, and
to establishing sustainable devel-opment in the developing coun-tries Denmark is collaborating with.
This collaboration includes e.g. Danish support to the development of energy planning and economic planning, capacity building with the authorities that are to manage the climate effort, e.g. that are to as-sess and approve CDM projects, and help in the development of the CDM component of selected projects. Denmark moreover intends to purchase CDM credits, especially from the projects that Denmark has helped develop.
Denmark has chosen to commence with the implementation of the CDM effort by collaborating with countries that have been covered by the special environment assist-ance (previously MIFRESTA) for a number of years. In this way, Den-mark will be able to build on collab-oration projects on capacity building and planning which have been op-erating for a number of years. Fur-thermore, the countries must have a large emission of greenhouse gases, and thus a large reduction potential and potential for purchasing CO2
credits. Therefore, Denmark will be working together with Malaysia, South Africa, and Thailand for a start, since these countries live up
100 Denmark's Fourth National Communication on Climate Change
to the conditions mentioned. From 2005, the effort will be expanded to include Indonesia and China.
In Malaysia, South Africa, and Thai-land the Danish effort consists or three elements:
Entering into collaboration agree-ments which commit Denmark and the partner country to co-operate on efforts and help with the transfer of CO2 credits be-tween countries.
Providing support to the coun-tries with regard to establishing an administration system in rela-tion to CDM and with regard to setting out national criteria for approval of CDM projects.
Identifying eligible project ideas and elaborating these, so that they may be approved accord-ing to Kyoto Protocol rules. Denmark will subsequently buy all, or part, of the CO2 credits resulting from the projects.
In addition to the CDM collabora-tion with the five countries men-tioned above, general agreements have been entered into with Chile, Nicaragua, and Argentina with a view to paving the way for possible CDM credits trades between these countries and Denmark. An agree-ment has also been entered into with Mexico from 2005.
Furthermore, it is possible to carry out CDM collaboration by including projects being developed under the
scheme for mixed credits. At year-end 2004, a significant number of projects were under development, primarily projects on biomass and renewable energy. Some projects have been presented before the CDM Executive Board to receive an approval of method or for registra-tion; however no CDM project with Danish support has been approved yet.
Purchases of CDM credits can be bilateral, especially purchases from projects that Denmark has partici-pated in the development of, or they can be indirect, through purchases of credits from CO2 investment funds or similar. The Danish Foreign Min-istry has of yet not bought credits from individual projects; however, the Ministry is participating with the Ministry of the Environment, Elsam, and Energi E2 in a Danish CO2 fund, which will purchase cred-its from JI and CDM projects. This fund was established in collaboration with the World Bank and has a total capital DKK 200 mill.
Funds for purchasing credits from CDM projects are part of the For-eign Ministry’s budget on a special account and separate from develop-ment assistance. The purchase of credits will thus not be at the cost of funds for development assistance.
Technology transfer in the CDM collaborationThe framework and work on CDM projects include broad collabora-tion aimed at promoting efficient methods for developing, applying,
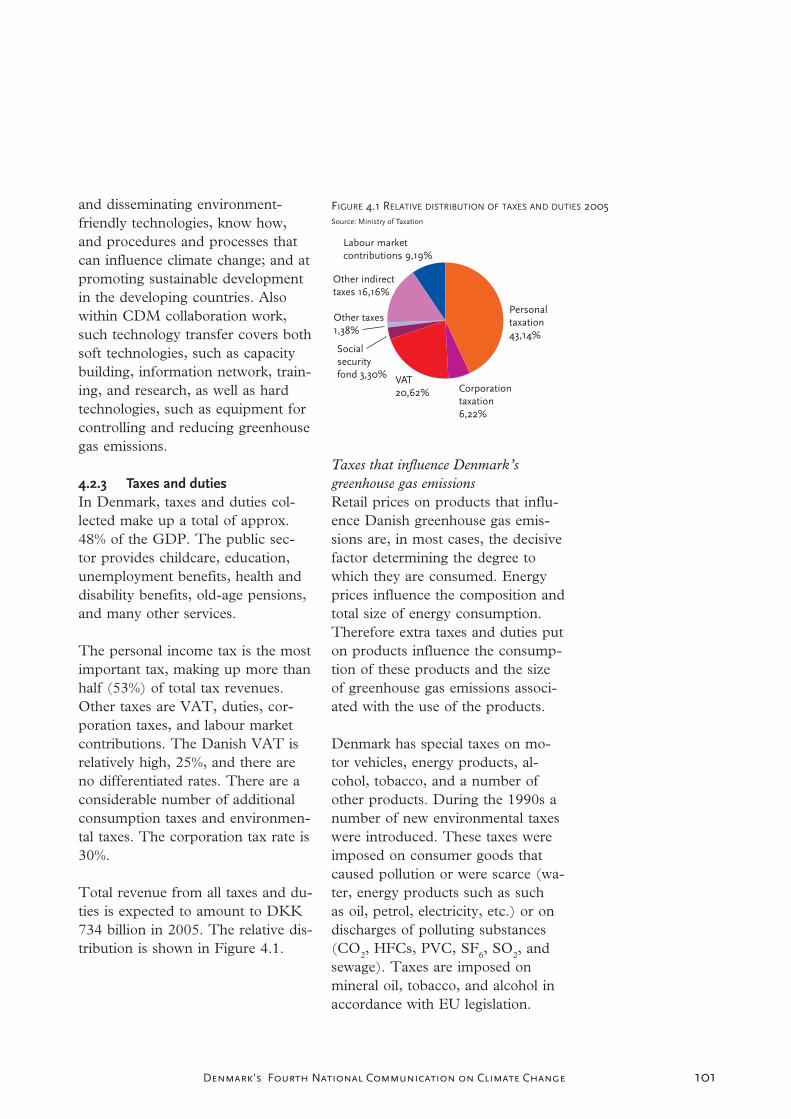
101Denmark's Fourth National Communication on Climate Change
and disseminating environment-friendly technologies, know how, and procedures and processes that can influence climate change; and at promoting sustainable development in the developing countries. Also within CDM collaboration work, such technology transfer covers both soft technologies, such as capacity building, information network, train-ing, and research, as well as hard technologies, such as equipment for controlling and reducing greenhouse gas emissions.
4.2.3 Taxes and dutiesIn Denmark, taxes and duties col-lected make up a total of approx. 48% of the GDP. The public sec-tor provides childcare, education, unemployment benefits, health and disability benefits, old-age pensions, and many other services.
The personal income tax is the most important tax, making up more than half (53%) of total tax revenues. Other taxes are VAT, duties, cor-poration taxes, and labour market contributions. The Danish VAT is relatively high, 25%, and there are no differentiated rates. There are a considerable number of additional consumption taxes and environmen-tal taxes. The corporation tax rate is 30%.
Total revenue from all taxes and du-ties is expected to amount to DKK 734 billion in 2005. The relative dis-tribution is shown in Figure 4.1.
Taxes that influence Denmark’s greenhouse gas emissionsRetail prices on products that influ-ence Danish greenhouse gas emis-sions are, in most cases, the decisive factor determining the degree to which they are consumed. Energy prices influence the composition and total size of energy consumption. Therefore extra taxes and duties put on products influence the consump-tion of these products and the size of greenhouse gas emissions associ-ated with the use of the products.
Denmark has special taxes on mo-tor vehicles, energy products, al-cohol, tobacco, and a number of other products. During the 1990s a number of new environmental taxes were introduced. These taxes were imposed on consumer goods that caused pollution or were scarce (wa-ter, energy products such as such as oil, petrol, electricity, etc.) or on discharges of polluting substances (CO2, HFCs, PVC, SF6, SO2, and sewage). Taxes are imposed on mineral oil, tobacco, and alcohol in accordance with EU legislation.
FIGURE 4.1 RELATIVE DISTRIBUTION OF TAXES AND DUTIES 2005Source: Ministry of Taxation

102 Denmark's Fourth National Communication on Climate Change
Taxes influencing Denmark’s green-house gas emissions are described in more detail in the following. Data sheets for these measures are in Ap-pendix B, which includes e.g. refer-ences to the legal basis for imple-mentation of the measures.
4.2.3.1 Implemented taxes and duties relevant to CO2, CH4, and N2O emissions Energy
Denmark has had taxes on energy for many years6. Since the first oil crisis in the early 1970s, the rates of the taxes has been aimed at reduc-ing consumption and promoting the instigation of more energy-saving measures. Lesser energy consump-tion will reduce the emissions of both CO2, methane (CH4), and ni-trous oxide (N2O) associated with combustion of fossil fuels. Energy
taxes from recent years are stated in Table 4.3 below.
Danish Energy taxes are laid down in the four Danish tax acts on min-eral-oil, gas, coal, and electricity, respectively (Mineralolieafgiftsloven, Gasafgiftsloven, Kulafgiftsloven, and Elafgiftsloven).
The tax on mineral-oil act entered into force on 1 January 1993. Before that time the tax on petrol was regulated via the petrol tax act, which entered into force on 1 January 1983, and the act on taxation of gas oil and diesel oil, heating oil, heating tar, and crude oil was regulated via the act on taxation of certain oil prod-ucts, which entered into force on 3 October 1977. Tax rates from recent years are shown in Table 4.4.
TABLE 4.3 ENERGY TAXES 1998-2005Source: Ministry of Taxation
Unit 1998 1999 2000 2001 2002 2003 2004 2005
Coal DKK/toe 1,717 1,884 1,968 2,051 2,135 2,135 2,135 2,173
Natural gas DKK/toe 1,536 1,536 1,672 2,048 2,111 2,111 2,111 2,134
Natural gas DKK/m3 1.47 1.47 1.60 1.96 2.02 2.02 2.02 2.042
Oil products: Diesel DKK/toe 2,429 2,464 2,738 2,952 2,952 2,952 2,952 2,985
Fuel oil DKK/toe 1,910 1,910 1,950 2,000 2,060 2,060 2,060 2,092
Electricity: For heating DKK/kWh 0.40 0.42 0.47 0.49 0.50 0.50 0.50 0.511
Other DKK/kWh 0.46 0.48 0.54 0.55 0.57 0.57 0.57 0.576
Waste:Heating
from waste DKK/toe 0 209 335 419 540 540 540 540
Other compostable biomass
DKK/toe 0 0 0 0 0 0 0 0
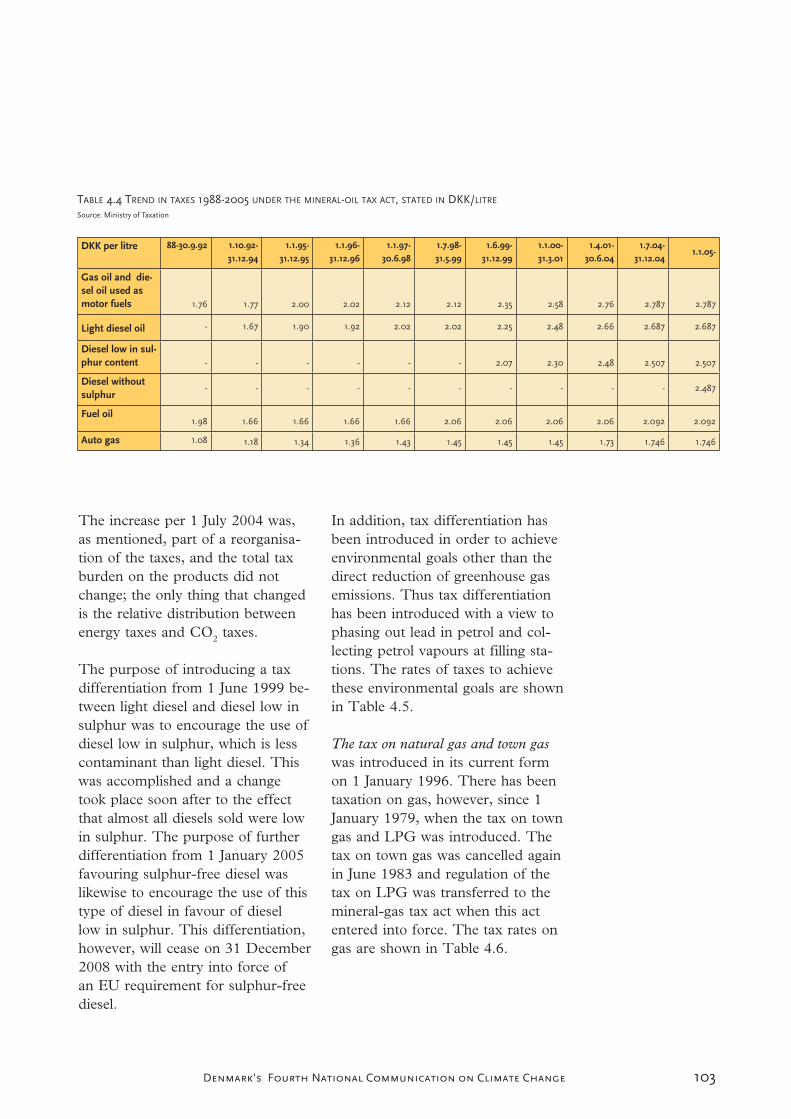
103Denmark's Fourth National Communication on Climate Change
The increase per 1 July 2004 was, as mentioned, part of a reorganisa-tion of the taxes, and the total tax burden on the products did not change; the only thing that changed is the relative distribution between energy taxes and CO2 taxes.
The purpose of introducing a tax differentiation from 1 June 1999 be-tween light diesel and diesel low in sulphur was to encourage the use of diesel low in sulphur, which is less contaminant than light diesel. This was accomplished and a change took place soon after to the effect that almost all diesels sold were low in sulphur. The purpose of further differentiation from 1 January 2005 favouring sulphur-free diesel was likewise to encourage the use of this type of diesel in favour of diesel low in sulphur. This differentiation, however, will cease on 31 December 2008 with the entry into force of an EU requirement for sulphur-free diesel.
In addition, tax differentiation has been introduced in order to achieve environmental goals other than the direct reduction of greenhouse gas emissions. Thus tax differentiation has been introduced with a view to phasing out lead in petrol and col-lecting petrol vapours at filling sta-tions. The rates of taxes to achieve these environmental goals are shown in Table 4.5.
The tax on natural gas and town gaswas introduced in its current form on 1 January 1996. There has been taxation on gas, however, since 1 January 1979, when the tax on town gas and LPG was introduced. The tax on town gas was cancelled again in June 1983 and regulation of the tax on LPG was transferred to the mineral-gas tax act when this act entered into force. The tax rates on gas are shown in Table 4.6.
TABLE 4.4 TREND IN TAXES 1988-2005 UNDER THE MINERAL-OIL TAX ACT, STATED IN DKK/LITRE
Source: Ministry of Taxation
DKK per litre 88-30.9.92 1.10.92-
31.12.94
1.1.95-
31.12.95
1.1.96-
31.12.96
1.1.97-
30.6.98
1.7.98-
31.5.99
1.6.99-
31.12.99
1.1.00-
31.3.01
1.4.01-
30.6.04
1.7.04-
31.12.041.1.05-
Gas oil and die-sel oil used asmotor fuels 1.76 1.77 2.00 2.02 2.12 2.12 2.35 2.58 2.76 2.787 2.787
Light diesel oil - 1.67 1.90 1.92 2.02 2.02 2.25 2.48 2.66 2.687 2.687
Diesel low in sul-phur content - - - - - - 2.07 2.30 2.48 2.507 2.507
Diesel without sulphur
- - - - - - - - - - 2.487
Fuel oil1.98 1.66 1.66 1.66 1.66 2.06 2.06 2.06 2.06 2.092 2.092
Auto gas 1.08 1.18 1.34 1.36 1.43 1.45 1.45 1.45 1.73 1.746 1.746

104 Denmark's Fourth National Communication on Climate Change
The tax on coal was introduced on 1 July 1982 and constituted DKK 127/tonne for hard coal and DKK 91/tonne for lignite and lignite bri-quettes on the day of entry into force. The rates have since then de-veloped as shown in Table 4.7.
The tax on electricity was introduced on 1 April 1977. Table 4.8 shows the development in electricity tax rates since 1989.
Energy and transport: CO2 taxesThe CO2 tax was introduced on 1March 1992. CO2 tax is placed on different types of energy products relative to their CO2 emissions, cf. Table 4.9.
Table 4.10 shows examples of the different types of CO2 taxes con-verted into consumer units.
TABLE 4.5 TREND IN TAXES ON DIFFERENT TYPES OF PETROL, STATED IN DKK/LITRE
Source: Ministry of Taxation
Type of petrol: -31.12.93
1.1.94-
31.3.94
1.4.94-
30.9.94
1.10.94-
31.12.94
1.1.95-
31.3.95
1.4.95-
30.9.95
1.10.95-
31.12.95
96 97 1.1.98-
30.6.98
1.7.98-
31.12.041.1.05-
With lead2
2.901 3.10 3.15 3.20 3.55 3.60 3.65 3.92 3.97 4.02 4.72 4.50
Lead-free 2.251 2.45 2.50 2.55 2.90 2.95 3.00 3.27 3.32 3.37 4.07 3.85
With lead2
& vap.rec.3 - - - - - - - 3.89 3.94 3.99 4.69 4.47
Lead-free & vap.rec.3 - - - - - - - 3.24 3.29 3.34 4.04 3.82
1 These rates are from the act on petrol taxation. They entered into force on 1.1.1990.
2 The term has been kept even though petrol companies in Denmark ceased using lead for octane improvement in 1994.
3 When sold from filling stations with vapour recovery.
TABLE 4.6 TAXES ON GAS 1996-2006, DKK PER NM3
Source: Ministry of Taxation
DKK per Nm3 1.1.96-
30.6.98
1.7.98-
31.8.98
1.9.98-
31.12.99
1.1.00-
31.12.00
1.1.01-
31.12.01
1.1.02-
31.12.02
1.1.03-
31.12.03
1.1.04-
30.6.04
1.7.04-
31.12.04
1.1.05-
31.12.051.1.06-
Natural gas 0.01 0.25 1.47 1.60 1.96 2.02 2.02 2.02 2.046 2.046 2.046
Town gas 0.01 0.25 0.25 0.38 0.68 0.99 1.25 1.50 1.50 1.7702 2.046
TABLE 4.7 TREND IN COAL TAXES SINCE 1990, DKK PER TONNE
Source: Ministry of Taxation
DKK per tonne 1.6.89-
31.12.91
1.1.92
– 31.12.94
1.1.95
– 31.12.95
1.1.96
– 31.12.96
1.1.97
– 31.12.97
1.1.98-
30.6.98
1.7.98-
31.12.98
1.1.99-
31.12.99
1.1.00-
31.12.00
1.1.01-
31.12.011.1.02 -
Hard coal 765 690 770 860 950 1040 1150 1250 1300 1350 1425
Lignite 550 505 570 635 700 764 840 910 950 990 1030

105Denmark's Fourth National Communication on Climate Change
TABLE 4.8 TREND IN ELECTRICITY TAXES SINCE JUNE 1989, DKK PER KWH
Source: Ministry of Taxation
DKK per kWh 1.06.89 –
29.02.92
1.03.94
– 31.12.931
1.01.94
– 31.12.94
1.01.95
– 31.12.95
1.01. 96
– 31.12.96
1.01.97
– 31.12.97
1.1.98 –
30.06.98
1.7.98
– 30.6.99
1.7.99
– 30.6.041.07.04–
Consumption ofelectricity, exceed-ing 4,000 kWh inall-year residencesheated by electric-ity
29.5 23.5 26.5 29.5 32.5 36.5 40.1 46.1 50.1 51.1
Other electricity 33 27 30 33 36 40 46.6 52.6 56.6 57.6
1 This reduction of the electricity tax was part of the implementation of the CO2 tax on e.g. electricity.
TABLE 4.9 CO2 TAX RATES, 1996-2005, STATED IN DKK PER TONNE OF CO2
Source: Ministry of Taxation
1996 1997 1998 1999 2000 2001 2002 2003 2004 2005
Basic rate
Heating inindustry
100 100 100 100 100 100 100 100 100 90
Light industrial processes
Basic rate 50 60 70 80 90 90 90 90 90 90
With a voluntaryagreement 50 50 50 58 68 68 68 68 68 68
Resulting subsidy 0 10 20 22 22 22 22 22 22 22
Heavy industrial processes
Basic rate 5 10 15 20 25 25 25 25 25 25
With a voluntaryagreement
3 3 3 3 3 3 3 3 3 3
Resulting subsidy 2 7 12 17 22 22 22 22 22 22
TABLE 4.10 EXAMPLES OF CO2 TAXES
Source: Ministry of Taxation
Unit 15.5.1992-
31.12.20041.7.2004 -
Gas oil and diesel oil DKK/litre 0.27 0.243
Fuel oil DKK/kg 0.32 0.288
Electricity DKK/kWh 0.10 0.09
Lignite DKK/tonne 242 217.8
Natural gas and towngas
DKK/Nm3 0.22 0.198
Petrol DKK/litre - 0.221
1 This rate has applied since 1.1 2005

106 Denmark's Fourth National Communication on Climate Change
In addition to this, there are CO2
taxes on heating tar, crude oil, coke, crude oil coke, lignite briquettes and lignite, LPG, and other gases. As evident from Table 4.10, the CO2 taxes were reduced from 1 July 2004. This reduction, however, does not mean a reduction in the tax burden and resulting increased CO2
emissions. The tax reductions were part of a reorganisation of the energy taxes to make them more transpar-ent, and the energy taxes on the different energy products have been raised correspondingly, so that the overall tax on the individual product is the same. As part of the reorgani-sation of the taxes, from 1 January 2005 a tax was placed on petrol and the energy tax on petrol was reduced correspondingly, so that the total tax burden on petrol remains un-changed. This reorganisation was in-troduced in order to make it possible to exempt biofuels from CO2 tax.
In connection with the implementa-tion of the CO2 allowance scheme a decision was made to pay back the CO2 taxes paid for fuels and heat-ing used in industrial processes that are directly allowance-regulated in industrial enterprises covered by the allowance regulations. This amend-ment is pending approval by the Eu-ropean Commission and has there-fore not yet entered into force.
TransportIn the transport sector, the number of cars in Denmark and the use of motorised vehicles are influenced by the tax on cars and fuel. The latter has been described above.
Since 1 July 1997 the annual tax on motor vehicles has been based on en-ergy consumption (the green owner tax) measured in accordance with EU Directive 93/116/EC. Before this date, the taxation was based on weight. 24 classes of energy con-sumption have been defined for both petrol-driven and diesel-driven vehi-cles. Examples of classes from 2005 are shown in Table 4.11.
TABLE 4.11 EXAMPLES FROM THE DANISH STRUCTURE
OF TAX INCENTIVES BASED ON ANNUAL TAXES ON
MOTOR VEHICLES (2005), DKK/YEAR
Source: Ministry of Taxation
Class of motor vehicle
Fuel con-sumption(km/l)
Annual tax (DKK/year)
Petrol
1 > 20.0 520
11 10.0 – 10.5 5,500
24 < 4.5 18,460
Diesel
1 25> 22.5 1,960
12 10.2 – 11.3 9,620
24 < 5.1 25,060
From 1 January 2000, three new classes were defined for diesel-driven private cars. The annual tax is given in Table 4.12.
TABLE 4.12 ANNUAL TAX FOR DIESEL-DRIVEN PRIVATE
CARS, DKK/YEAR
Source: Ministry of Taxation
DKK/year2000 2001 2002-
> 32.1 km/l 140 200 80
28.1-32.1 km/l 700 780 740
25-28.1 km/l 1,280 1,380 1,320
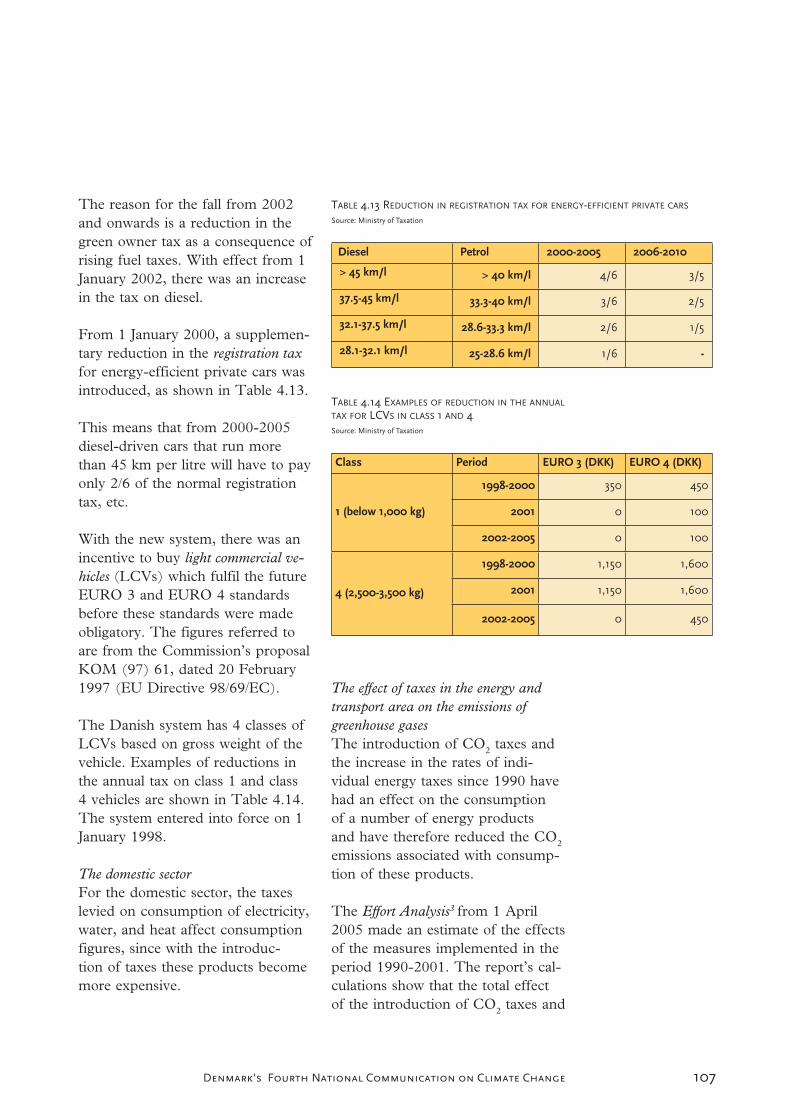
107Denmark's Fourth National Communication on Climate Change
The reason for the fall from 2002 and onwards is a reduction in the green owner tax as a consequence of rising fuel taxes. With effect from 1 January 2002, there was an increase in the tax on diesel.
From 1 January 2000, a supplemen-tary reduction in the registration taxfor energy-efficient private cars was introduced, as shown in Table 4.13.
This means that from 2000-2005 diesel-driven cars that run more than 45 km per litre will have to pay only 2/6 of the normal registration tax, etc.
With the new system, there was an incentive to buy light commercial ve-hicles (LCVs) which fulfil the future EURO 3 and EURO 4 standards before these standards were made obligatory. The figures referred to are from the Commission’s proposal KOM (97) 61, dated 20 February 1997 (EU Directive 98/69/EC).
The Danish system has 4 classes of LCVs based on gross weight of the vehicle. Examples of reductions in the annual tax on class 1 and class 4 vehicles are shown in Table 4.14. The system entered into force on 1 January 1998.
The domestic sectorFor the domestic sector, the taxes levied on consumption of electricity, water, and heat affect consumption figures, since with the introduc-tion of taxes these products become more expensive.
TABLE 4.14 EXAMPLES OF REDUCTION IN THE ANNUAL TAX FOR LCVS IN CLASS 1 AND 4Source: Ministry of Taxation
Class Period EURO 3 (DKK) EURO 4 (DKK)
1 (below 1,000 kg)
1998-2000 350 450
2001 0 100
2002-2005 0 100
4 (2,500-3,500 kg)
1998-2000 1,150 1,600
2001 1,150 1,600
2002-2005 0 450
The effect of taxes in the energy and transport area on the emissions of greenhouse gasesThe introduction of CO2 taxes and the increase in the rates of indi-vidual energy taxes since 1990 have had an effect on the consumption of a number of energy products and have therefore reduced the CO2
emissions associated with consump-tion of these products.
The Effort Analysis3 from 1 April 2005 made an estimate of the effects of the measures implemented in the period 1990-2001. The report’s cal-culations show that the total effect of the introduction of CO2 taxes and
TABLE 4.13 REDUCTION IN REGISTRATION TAX FOR ENERGY-EFFICIENT PRIVATE CARS
Source: Ministry of Taxation
Diesel Petrol 2000-2005 2006-2010
> 45 km/l > 40 km/l 4/6 3/5
37.5-45 km/l 33.3-40 km/l 3/6 2/5
32.1-37.5 km/l 28.6-33.3 km/l 2/6 1/5
28.1-32.1 km/l 25-28.6 km/l 1/6 -

108 Denmark's Fourth National Communication on Climate Change
raised energy taxes meant a reduc-tion in annual emissions of about 1.5 mill. tonnes of CO2 equivalents in 2001. The socio-economic reduc-tion costs were estimated at DKK 325/tonne. The expected average reduction in emissions for the years 2008-12 is the same as for 2001, namely about 1.5 mill. tonnes of CO2 equivalents.
The increased fuel taxes have led to an annual reduction of about 1.2 mill. tonnes of CO2 equivalents in 2001 with a socio-economic reduc-tion cost of DKK 775/tonne. The average for 2008-12 is expected to be at the 2001 level.
In 2001, the introduction of the green owner tax meant an approx. 2% reduction in CO2 emissions from cars, corresponding to 0.158 mill. tonnes of CO2 equivalents. The av-erage for 2008-12 is expected to be around 7% (0.540 mill. tonnes of CO2 equivalents).
The estimated effects and costs are also stated in Annex B.
4.2.3.2 Implemented taxes and duties relevant to consumption and emissions of HFCs, PFCs, and SF6
The industry and business sector’s consumption of HFCs, PFCs, and SF6
Since 1 March 2001, imports of in-dustrial gases HFCs, PFCs, and SF6
(F-gases) have been subject to taxa-tion. The tax is based on the Danish CO2 tax correlated with the GWP up to a maximum of DKK 400/kg, cf. the examples in Table 4.15.
TABLE 4.15 EXAMPLES OF TAXES ON F-GASES
Source: Ministry of Taxation
Substance GWP Tax in DKK
per kg
HFC-134a 1300 130
R404a (a com-
bination of 3
HFCs)
3260 326
SF6 23900 400
The effect of taxes on the consumption of HFCs, PFCs, and SF6 on emissions of greenhouse gasesThe Effort Analysis has estimated that the tax on the industrial gases HFCs, PFCs, and SF6, in combina-tion with the effect of regulation adopted and introduced, led to a re-duction of 49,000 tonnes CO2 equiv-alents in 2001. In 2005, reduction is expected to be somewhere around 150,000 tonnes of CO2 equivalents, increasing to around 370,000 tonnes in 2010. The socio-economic reduc-tion cost is estimated at about DKK 200/tonne CO2. Please note that it has not been possible to calculate the effects and costs of taxes and regula-tion separately.
The estimated effects and costs are also stated in Annex B.
4.2.3.3 New measures, measures no longer in place and that would increase emissions
The Danish government imple-mented an overall tax freeze from 2002 stipulating no tax increases, which means that no fixed rates in

109Denmark's Fourth National Communication on Climate Change
Danish kroner or in per cent may be increased.
In 2002-2003 a cross-departmen-tal group reviewed the registration tax on private cars in order to see whether changing the system from a value-based system (approximately 200%) to a system based on energy consumption (CO2) would consti-tute a more cost-effective tool for reducing CO2 emissions. A report7
was published in April 2003 and the government subsequently decided not to make any changes to the cur-rent system. The report shows that the reduction costs will amount to about DKK 9,000/tonne, which exceeds the benchmark of DKK 120/tonne for implementing national initiatives laid down in the Govern-ment Climate Strategy.
The Danish Minster for Taxation has launched a detailed review of the Danish tax system in order to reduce its complexity. The third largest group of proposals concerns energy, CO2, and sulphur taxes. A project group has been established. Its objective is to review the legisla-tion in order to reduce the adminis-trative burdens and improve trans-parency with regard to energy, CO2,and sulphur taxes. Of the changes implemented8, the following, men-tioned the text box next page, are of potential significance to reducing greenhouse gas emissions.
All the energy agreements and CO2
taxes mentioned above are among the subjects to be dealt with by a committee set up by the Minister
for Taxation. The objective of the committee is to analyse the CO2 tax-es in relation to the CO2 allowance scheme, which entered into force on 1 January 2005, as well as to inves-tigate whether the energy taxation system can be designed more appro-priately. The committee is expected to end its work in spring 2007.
4.3 OTHER MEASURES AND EFFECTS IN
DENMARK’S ECONOMIC SECTORS
The following sections, sections 4.3.1 – 4.3.6, describe the other measures of importance to green-house gas emissions and removals in the following 6 economic sectors: energy, transport, business, agricul-ture/forestry, the domestic sector, and waste. Table 4.16 shows how the allocation, which is to be used in connection with the annual emission inventories (the CRF/IPCC format), is aggregated into the 6 economic sectors.
Table 4.17 and Figure 4.2 show the main result of this aggregation for 1990/959, 2003, 2008-12, and 2013-17, as well as 2020, 2025, and 2030 without emissions and removals in connection with land use, land-use change and forestry (LULUCF), however the effect of removals by afforestation since 1990 is includ-ed10.

110 Denmark's Fourth National Communication on Climate Change
FIGURE 4.2 DENMARK’S GRENHOUSE GAS EMISSIONS
IN 2003 BY SECTOR.Source: The National Environmental Research Institute (NERI) and the
Danish Environmental Protection Agency
4.3.1 EnergyThe energy sector’s extraction, con-version and distribution of energy led to greenhouse gas emissions which in 2003 made up 44% of Denmark’s total emissions, of which
CO2 was the primary emission. 97.5% of the emissions from the en-ergy sector are CO2. 1.5% is meth-ane (CH4), and the remaining 1% is nitrous oxide (N2O).
4.3.1.1 CO2
Energy production and energy-con-suming activities in the transport sector, industry and the other sectors are the main contributors to the total emissions of CO2 due to use of large quantities of coal, oil and natural gas. The energy sector is therefore centrally placed in the efforts to re-duce the emissions of CO2.
Many initiatives have been taken over the years to reduce the emis-sions, and work is still going on to find the best and most cost-effective
- Simpler CO2 taxesThe rules on CO2 taxes have been simplified. This means thatthe administrative burden has been eased for all VAT-registeredcompanies paying CO2 taxes for the use of electricity for lighting,production plant, computer equipment, and ventilation plant.The change means that the 10 percent refund of the CO2 tax onlight processes has ceased and the tax in itself has been reducedcorrespondingly. A total of 55,000 enterprises will thereby haveeasier administration.
- Simpler tax legislationSeveral tax acts have been simplified; e.g. the tax on hard PVChas been annulled and a minimum limit has been introduced forregistration and payment of tax on incandescent lamps.The reduction in taxes on products made of hard PVC and onincandescent lamps could lead to an increase in consumptionof these products and thus, possibly, to more emissions of CO2from waste incineration due to increased amounts of plastic inthe waste, and to greater energy consumption due to the use ofincandescent lamps rather than energy saving bulbs.
- New Danish-Swedish tax agreementThe Danish and the Swedish governments have entered intoa new tax agreement that will ease the lives of cross-bordercommuters and enterprises and thus contribute to the integrationin the Øresund Region. The rules concerning work-place taxationhave been simplified and in the future cross-border commuterswill receive allowances for their pension investments as well asfor their travelling expenses.Lower transport costs enhance mobility, however they mayalso lead to more CO2 emissions in terms of increased energyconsumption for transport.
- More cars approved for yellow low-tax number plates for commercial vehiclesThe so-called 50/50 rule, which previously determined whethercertain types of cars could be approved as vans, has beenrepealed. The rule required that the platform was not shorter thanthe driver’s cab. The simplification means that more types of carscan now be approved for yellow number plates and, thus, for alower registration tax.Lower registration tax on the car types mentioned could increasethe total number of private cars in Denmark, whereby also thetotal transport activity could rise and with it the emission of CO2.

111Denmark's Fourth National Communication on Climate Change
measures with a view to fulfilling Denmark’s international climate ob-ligations.
The framework for the Danish en-ergy sector has, however, changed significantly over a few years. The energy sector is now fully liberalised. Today, electricity production from Danish power plants is controlled by market forces. Danish electricity generation is traded freely across na-tional borders on the Nordic and the north-German electricity markets. There is thus a significant extent of integration in the Northern Euro-pean electricity market on an arm’s length basis. This entails, for ex-
ample, that increased use of renew-able energy in the Danish electricity system or enhanced efforts to save electricity do not automatically mean that generation at coal-fired power plants is reduced correspondingly during the first commitment period of the Kyoto Protocol 2008-2012.
The introduction of the CO2 allow-ance regulations as a common EU instrument has thus been pivotal for Denmark’s possibilities to comply with the climate commitments. The allowance regulations constitute a central instrument in ensuring that the Danish energy sector is enabled to provide the reductions required
TABLE 4.16 AGGREGATION OF SOURCES/SECTORS IN THE CRF/IPCC FORMAT INTO THE SIX MAIN ECONOMIC SECTORS IN DENMARK
Economic sector Sources/Sectors in the CRF/IPCC format
Energy Includes extraction, conversion, and
distribution.
1A1
1B
Fuel combustion activities.
Fugetive emissions from fuels.
Transport Military included. 1A3
1A5
Transport (fuel combustion)
Others (fuel combustion in military
transport).
Agriculture and forestry Fisheries included. 1A4c
4
5
Fuel combustion in agriculture, for-
estry, and fisheries.
Agriculture
Land-use Changes and Forestry
(LUCF).
Business Includes production, building and con-
struction, service and trade, as well as
industrial gases and the use of organic
solvents.
1A2
1A4a
2
3
Fuel combustion in production and
building/construction.
Fuel combustion in commerce and
service.
Industrial processes
Use of organic solvents.
Domestic sector 1A4b Fuel combustion in households.
Waste Includes landfills and sewage treat-
ment. Incineration of waste for energy
recovery is included in the energy sec-
tor, cf. IPCC.
6 Waste
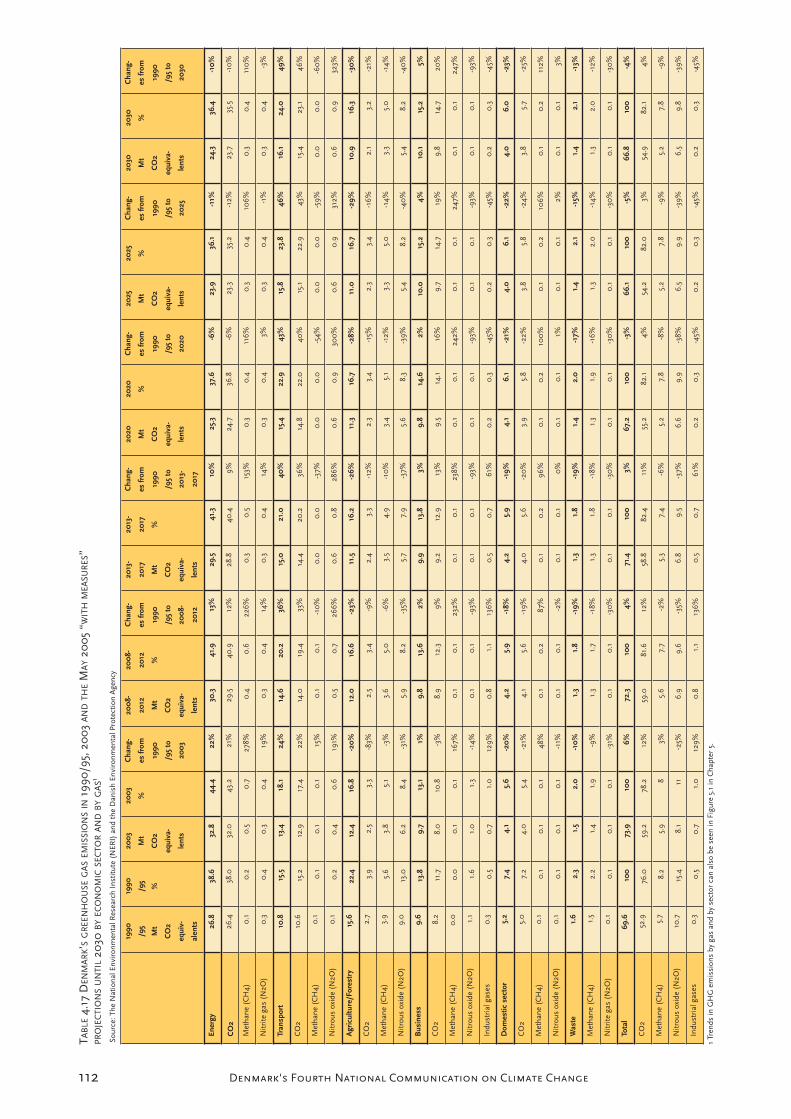
112 Denmark's Fourth National Communication on Climate Change
TAB
LE4.
17 D
ENM
AR
K’S
GR
EEN
HO
USE
GA
SEM
ISSI
ON
SIN
1990
/95,
200
3A
ND
THE
MA
Y20
05
“WIT
HM
EASU
RES
”PR
OJE
CTI
ON
SU
NTI
L20
30B
YEC
ON
OM
ICSE
CTO
RA
ND
BY
GA
S1
Sour
ce:T
heN
atio
nalE
nvir
onm
enta
lRes
earc
hIn
stitu
te(N
ERI)
and
the
Dan
ish
Envi
ronm
enta
lPro
tect
ion
Age
ncy
1990
/95
Mt
CO
2
equi
v-
alen
ts
1990
/95
%
200
3
Mt
CO
2
equi
va-
lent
s
200
3
%
Cha
ng-
es fr
om
1990
/95
to
200
3
200
8-
2012
Mt
CO
2
equi
va-
lent
s
200
8-
2012 %
Cha
ng-
es fr
om
1990
/95
to
200
8-
2012
2013
-
2017
Mt
CO
2
equi
va-
lent
s
2013
-
2017 %
Cha
ng-
es fr
om
1990
/95
to
2013
-
2017
2020
Mt
CO
2
equi
va-
lent
s
2020 %
Cha
ng-
es fr
om
1990
/95
to
2020
2025
Mt
CO
2
equi
va-
lent
s
2025 %
Cha
ng-
es fr
om
1990
/95
to
2025
2030
Mt
CO
2
equi
va-
lent
s
2030 %
Cha
ng-
es fr
om
1990
/95
to
2030
Ener
gy26
.838
.632
.844
.422
%30
.341
.913
%29
.541
.310
%25
.337
.6-6
%23
.936
.1-1
1%24
.336
.4-1
0%
CO
226
.438
.032
.043
.221
%29
.540
.912
%28
.840
.49%
24.7
36.8
-6%
23.3
35.2
-12%
23.7
35.5
-10
%
Met
hane
(CH
4)0
.10
.20
.50
.727
8%0
.40
.622
6%0
.30
.515
3%0
.30
.411
6%0
.30
.410
6%0
.30
.411
0%
Nitr
itega
s(N
2O)
0.3
0.4
0.3
0.4
19%
0.3
0.4
14%
0.3
0.4
14%
0.3
0.4
3%0
.30
.4-1
%0
.30
.4-3
%
Tran
spor
t10
.815
.513
.418
.124
%14
.620
.236
%15
.021
.040
%15
.422
.943
%15
.823
.846
%16
.124
.049
%
CO
210
.615
.212
.917
.422
%14
.019
.433
%14
.420
.236
%14
.822
.040
%15
.122
.943
%15
.423
.146
%
Met
hane
(CH
4)0
.10
.10
.10
.115
%0
.10
.1-1
0%
0.0
0.0
-37%
0.0
0.0
-54%
0.0
0.0
-59%
0.0
0.0
-60
%
Nitr
ous
oxid
e(N
2O)
0.1
0.2
0.4
0.6
191%
0.5
0.7
266%
0.6
0.8
286%
0.6
0.9
300
%0
.60
.931
2%0
.60
.932
3%
Agr
icul
ture
/For
estr
y15
.622
.412
.416
.8-2
0%
12.0
16.6
-23%
11.5
16.2
-26%
11.3
16.7
-28%
11.0
16.7
-29%
10.9
16.3
-30
%
CO
22.
73.
92.
53.
3-8
3%2.
53.
4-9
%2.
43.
3-1
2%2.
33.
4-1
5%2.
33.
4-1
6%2.
13.
2-2
1%
Met
hane
(CH
4)3.
95.
63.
85.
1-3
%3.
65.
0-6
%3.
54.
9-1
0%
3.4
5.1
-12%
3.3
5.0
-14%
3.3
5.0
-14%
Nitr
ous
oxid
e(N
2O)
9.0
13.0
6.2
8.4
-31%
5.9
8.2
-35%
5.7
7.9
-37%
5.6
8.3
-39%
5.4
8.2
-40
%5.
48.
2-4
0%
Bus
ines
s9.
613
.89.
713
.11%
9.8
13.6
2%9.
913
.83%
9.8
14.6
2%10
.015
.24%
10.1
15.2
5%
CO
28.
211
.78.
010
.8-3
%8.
912
.39%
9.2
12.9
13%
9.5
14.1
16%
9.7
14.7
19%
9.8
14.7
20%
Met
hane
(CH
4)0
.00
.00
.10
.116
7%0
.10
.123
2%0
.10
.123
8%0
.10
.124
2%0
.10
.124
7%0
.10
.124
7%
Nitr
ous
oxid
e(N
2O)
1.1
1.6
1.0
1.3
-14%
0.1
0.1
-93%
0.1
0.1
-93%
0.1
0.1
-93%
0.1
0.1
-93%
0.1
0.1
-93%
Indu
stri
alga
ses
0.3
0.5
0.7
1.0
129%
0.8
1.1
136%
0.5
0.7
61%
0.2
0.3
-45%
0.2
0.3
-45%
0.2
0.3
-45%
Dom
estic
sec
tor
5.2
7.4
4.1
5.6
-20
%4.
25.
9-1
8%4.
25.
9-1
9%4.
16.
1-2
1%4.
06.
1-2
2%4.
06.
0-2
3%
CO
25.
07.
24.
05.
4-2
1%4.
15.
6-1
9%4.
05.
6-2
0%
3.9
5.8
-22%
3.8
5.8
-24%
3.8
5.7
-25%
Met
hane
(CH
4)0
.10
.10
.10
.148
%0
.10
.287
%0
.10
.296
%0
.10
.210
0%
0.1
0.2
106%
0.1
0.2
112%
Nitr
ous
oxid
e(N
2O)
0.1
0.1
0.1
0.1
-11%
0.1
0.1
-2%
0.1
0.1
0%
0.1
0.1
1%0
.10
.12%
0.1
0.1
3%
Was
te1.
62.
31.
52.
0-1
0%
1.3
1.8
-19%
1.3
1.8
-19%
1.4
2.0
-17%
1.4
2.1
-15%
1.4
2.1
-13%
Met
hane
(CH
4)1.
52.
21.
41.
9-9
%1.
31.
7-1
8%1.
31.
8-1
8%1.
31.
9-1
6%1.
32.
0-1
4%1.
32.
0-1
2%
Nitr
itega
s(N
2O)
0.1
0.1
0.1
0.1
-31%
0.1
0.1
-30
%0
.10
.1-3
0%
0.1
0.1
-30
%0
.10
.1-3
0%
0.1
0.1
-30
%
Tota
l69
.610
073
.910
06%
72.3
100
4%71
.410
03%
67.2
100
-3%
66.1
100
-5%
66.8
100
-4%
CO
252
.976
.059
.278
.212
%59
.081
.612
%58
.882
.411
%55
.282
.14%
54.2
82.0
3%54
.982
.14%
Met
hane
(CH
4)5.
78.
25.
98
3%5.
67.
7-2
%5.
37.
4-6
%5.
27.
8-8
%5.
27.
8-9
%5.
27.
8-9
%
Nitr
ous
oxid
e(N
2O)
10.7
15.4
8.1
11-2
5%6.
99.
6-3
5%6.
89.
5-3
7%6.
69.
9-3
8%6.
59.
9-3
9%6.
59.
8-3
9%
Indu
stri
alga
ses
0.3
0.5
0.7
1.0
129%
0.8
1.1
136%
0.5
0.7
61%
0.2
0.3
-45%
0.2
0.3
-45%
0.2
0.3
-45%
1Tr
ends
inG
HG
emis
sion
sby
gas
and
byse
ctor
can
also
bese
enin
Figu
re5.
1in
Cha
pter
5.
113Denmark's Fourth National Communication on Climate Change
if Denmark is to comply with the climate commitments. At the same time, the allowance scheme permits significant improvements to the cost-effectiveness of Denmark’s climate effort.
The goal of the energy policy today is to create well-functioning energy markets within frameworks that se-cure cost-effectiveness, security of supply, environmental concerns and efficient use of energy. The best initiatives are often those that meet more than one of the purposes men-tioned at the same time. Efforts con-cerning energy should thus be seen in a broader context than CO2 alone, not least when it comes to purpose and calculation of effects. Within al-lowance-relevant areas, allowances will ensure that Danish climate com-mitments are met. Other tools may ease the burden of meeting targets, or they may have a more long-term foundation in technological develop-ment. In contrast to development of sustainable energy and electricity saving, the allowances provide secu-rity for CO2 reductions in the Kyoto Protocol commitment period 2008 – 2012. Renewable energy can, how-ever, contribute to meeting energy-policy objectives and also underpin climate policy because in this way energy supply is enhanced without increasing emissions of greenhouse gases.
For example, it is very important that wind power is now so well developed that it is close to being competitive with coal-fired electricity generation.
The costs to Denmark of meeting climate commitments are less than they would have been if Denmark did not have competitive technology to secure energy supplies while at the same time reducing emissions of greenhouse gases. Renewable energy is an important element in the long-term development of the Danish energy sector. Wind power is an en-vironmentally friendly electricity-pro-duction technology with considerable perspectives in relation to meeting climate commitments, and continued development of wind power and oth-er RE technologies is an important contribution to the necessary techno-logical development and sustainable development at global level.
The focus of this section is energy production and energy supply. The energy-consuming activities and the possibilities for energy savings in the different sectors of society are dealt with in greater detail in the subse-quent sections.
Implemented policies and measuresA large number of policies and meas-ures have been implemented over the years to meet the various energy-policy objectives cf. Table 4.18 and Annex B1.
Allowance regulationDenmark has implemented the di-rective on a common European CO2
allowance scheme for energy pro-duction and energy-intensive indus-tries (the EU ETS). The allowance scheme entered into force on 1 Janu-ary 2005.

114 Denmark's Fourth National Communication on Climate Change
The allowance scheme will be the most important measure in Den-mark’s fulfilment of its climate ob-ligations under the Kyoto Protocol. The scheme aligns well with the lib-eralisation of the energy markets and management of environment efforts by the market being implemented by the government for the energy area. The allowance scheme permits significant improvements to the cost-effectiveness of Denmark’s climate policies and measures and forms a main element of the Danish govern-ment’s Climate Strategy.
In Denmark, as previously men-tioned, 377 production units are covered by the allowance scheme. The largest group of enterprises sub-ject to allowances is electricity and heat producers. In this sector, there is a total of 244 production units, in 138 enterprises. There are 126 production units in industry in 96 enterprises subject to the allowance regulations. Finally, 7 production units in the offshore sector are cov-ered. Annex D contains overviews of the production units covered and their allowances for 2005-2007. The 377 production units would, without the allowance regulations, account for about half of Danish emissions of greenhouse gases.
Both the statutory and the admin-istrative basis for the scheme have been established. The necessary legal basis was adopted by the Folketing in June 2004 and the national alloca-tion plan was approved by the Com-mission in July 2004.
According to the national alloca-tionplan for the period 2005-2007 an average annual allowance of 33.5 mill. tonnes CO2 has been allocated. This corresponds to a drop in emis-sions of about 6 mill. tonnes per year in 2005-2007, or a reduction of about 15% compared with expected emissions for the period. This level was set by balancing environmental considerations against competitive-ness and jobs:
• Electricity and heat producers were allocated about 21.8 mill. tonnes. The allowance for elec-tricity generation is allocated as ”per kWh”, while for heat pro-duction allowances are allocated according to emissions in the base years 1998-2002.
• The other 133 production units (industry and offshore) have been allocated allowances cor-responding to emissions in the base years 1998-2002. A total of 9.3 mill. tonnes per year have been allocated to industry and offshore.
• A special pool has been allocated with free allowances for new production units and significant extensions to existing units.
• Finally, 5% of allowances have been earmarked for sale by auc-tion or similar.
Allowance allocation for 2008-12 will be set in the national alloca-tion plan, which is to be sent to the Commission no later than 1 July

115Denmark's Fourth National Communication on Climate Change
TABLE 4.18 INITIATIVES AND MEASURES IN THE ENERGY SECTOR
Source: Danish Energy Authority and Danish CO2 emissions - the effort in the period 1990-2001 and the associated costs
Name of measure or initiative
Objective GHG af-fected
Type of in-strument
Status for imple-mentation
Implementingentity/player
CO2-re-ductionin 20011
Average annual CO2 reduction for 2008-20122
The energy sector Mill.tonnesCO2
Mill.tonnes CO2
EU-CO2-allowances forelectricity and districtheating production (in-cluding Business)
CO2-reduction CO2 Economic(financial)
ImplementedAmendments toimplement theLinking Directiveadopted by theFolketing May2005
State authorities,energy producers,energy-intensiveenterprises
(Total effectunknown untilallocation planfor 2008-12set)
Biomass Agreement2 R&D, demonstration,CO2 reduction
CO2 Economic(financial)
Implemented State authorities,energy producers
Price supplement forenvironmentally friend-ly elec.
Energy efficiency,technology develop-ment, CO2 reduction
CO2 Economic Implemented State authorities,energy producers
Tenders for offshorewind turbines
Energy efficiency,technology develop-ment, CO2 reduction
CO2 Regulatory(adminis-trative)/economic(financial)
Implemented State authorities,electricity producers
Scrapping scheme forold wind turbines
Other environ-mentalimprovements
CO2 Economic(financial)
Implemented Local/ regionalauthorities, inter-est organisations,energy producers,state authorities
Energy research R&D CO2 R&D Implemented butregularly adjusted
State authorities, re-search institutions
1 With regard to effects, certain measures are included in the Effort Analysis, cf. Annex B2.
2 The Danish electricity producers Elsam Kraft A/S and Energi E2 A/S are required to establish capacity to use straw and woodchips for electricity and heat production. Electricity consumers providea subsidy for burning, the size of which is set in the Electricity Supply Act. The Biomass Agreement of 1993 requires the Danish electricity producers Elsam Kraft A/S and Energi E2 A/S to use 1.4mill. tonnes biomass. According to the revision of the Biomass Agreement of 1997, at least 1 mill. tonnes straw and 0.2 mill. tonnes wood must be used. The remaining amount of amount of 0.2mill. tonnes biomass can be divided between straw or wood as the electricity plants see fit.

116 Denmark's Fourth National Communication on Climate Change
2006. It is expected that this plan will include significant tightening of the number of allowances to ensure that Denmark meets its international climate commitments.
The national CO2 allowance scheme for electricity producersFor electricity producers, the Euro-pean CO2 allowance scheme replaces the previous Danish CO2 allowance regulation. The national allowance scheme applied from 15 June 2000 to 31 December 2004, and it put Denmark at the front in establish-ing a CO2 allowance system. The original allowance Act applied up to and including 2003, but with the approaching adoption of the com-mon European allowance scheme the national scheme was extended up to entry into force of the EU scheme.
Under the national CO2 allowance scheme, the individual electricity producers were allocated annual CO2 emissions approvals for the period 2000-2004. Total emissions approvals for electricity producers in the first year amounted to 23 mill. tonnes CO2. The emissions level was reduced to 20 mill. tonnes in 2003 and 2004. Approvals were transfer-able and could be saved-up. If an allowance was exceeded, a charge of DKK 40 per tonne of CO2 wasmade. The revenues from these charges were spent on energy sav-ings and research and development.
Energy and CO2 taxesTaxes have also been used for many years as an instrument for reducing the CO2 emissions from the energy
sector, since fuels used for heat pro-duction are subject to energy and CO2 taxes. Taxes have also been used for a number of years as meas-ures to reduce the CO2 emissions from the energy sector - partly with a view to a general reduction and partly to promote the use of fuels with lower CO2 emissions, mainly biomass. Energy and CO2 taxes are described in detail in section 4.2.3.
Research and developmentR&D activities include energy sav-ings, more efficient energy conver-sion and renewable energy technolo-gies. Research in the energy area is described in more detail in section 8.2.6.
Combined heat and powerIncreased use of CHP and enlarging the areas receiving district heat have been main elements of the Dan-ish strategy to promote efficient use of energy resources ever since the end of the 1970s. More than half of Denmark’s domestic electricity con-sumption is co-generated with heat at CHP plants, and the potential for further use of CHP is limited. For this reason, only a small increase in CHP production is expected in the future. CHP has been promoted partly by the tax system, partly by electricity production grants for small-scale CHP plants and, lastly, by prioritising electricity from small-scale CHP plants.
Renewable energyUse of renewable energy sources can reduce the emissions of CO2 from fossil fuels. The proportion of Den-
117Denmark's Fourth National Communication on Climate Change
mark’s gross energy consumption that is covered by renewable energy increased from 6.7% in 1990 to 14.3% in 2003.
Renewable energy sources are pro-moted with economic measures, in-cluding the tax system and through direct production grants. Agree-ments and orders for the electric-ity and heat sector used to play a role, but use of these instruments has largely ended. Lastly, financing R&D activities is contributing to the continued growth in the proportion of renewable energy.
Fuel conversion from coal to natural gasSubstitution of natural gas for coal or oil reduces the emissions of CO2.The first Danish natural gas was landed from the Danish sector of the North Sea in 1984, and since then consumption of natural gas has increased to 191 PJ in 2003, cover-ing 23.1% of gross energy consump-tion. In future years it is expected that use of natural gas will not in-crease significantly in that the natu-ral gas market has been more-or-less fully developed. In the longer term it is expected that use of natural gas will increase as a result of increased use of natural gas in electricity gen-eration. Natural gas is favoured by a lower CO2 tax than oil and coal because of its lower emissions and will be promoted by the EU CO2 al-lowances scheme.
Energy savings
Energy-saving efforts in Denmark are implemented by a number of ac-tors. The most important are:
The Danish Energy Authority is respon-sible for authority tasks throughout the energy-savings area. In addition to legislation and regulation, the area includes the further negotiations within the EU on implementation and control of EU Directives, for example on labelling and standards, as well as a number of operational tasks such as energy labelling of buildings. Authority tasks include setting the framework and control-ling the activities of supply com-panies and the Electricity Saving Trust, and the Authority manages tasks in connection with the agree-ment scheme with business.
The National Agency for Enterprise and Construction carries out a number of energy-related authority tasks in the building area. Tasks include energy provisions in building regula-tions, rules on individual metering of electricity, gas, water and heating, as well as rules on the efficiency of heating plant.
The Electricity Saving Trust was estab-lished in 1996 with the primary tasks of conversion to CHP and promotion of efficient appliances etc. in households and the public sector. For conversion to CHP the Trust grants subsidies and nego-tiates pricing agreements etc. In connection with promoting effi-cient electrical appliances the Trust carries out campaigns, influences
118 Denmark's Fourth National Communication on Climate Change
markets, and encourages voluntary agreements as well as making elec-tricity consumption more visible. The Trust has established an A club, where public institutions etc. are obliged to buy energy-efficient products. The annual budget of the Trust is about DKK 90 mill., which comes from a special electricity sav-ings contribution of DKK 0.006 per kWh paid by households and the public sector as part of their electric-ity bills.
Grid and distribution companies (electric-ity, gas, and heating) are required to encourage consumers to save energy. Initiatives have so far been defined as non-commercial, and subsidies have usually not been available for investments etc. A primary activity for grid companies and partly for gas companies is individual consultancy on savings opportunities with larger customers. Furthermore, campaigns and information activities etc. are carried out. Electricity companies have worked with energy savings since the early 1990s. Natural gas and district heating companies’ ac-tivities have only been formalised in the past couple of years. The costs are financed through energy prices and amount to almost DKK 240 mill. per year. With the political agreement on future energy-saving efforts the framework for the actors’ energy-saving efforts will become more market-based.
Support for environmentally freindly electricityThe amendment of the Electricity Supply Act entered into force on 1
January 2005 and it means that all environmentally friendly electricity, i.e. electricity from wind turbines and other renewable energy (RE) plant, decentralised cogeneration of heating and power etc, is now sold on market conditions. The previous support for environmentally friendly electricity, where consumers had an obligation to take the electricity at a fixed settlement price, has now been converted to financial support in the form of a price supplement on the electricity market price.
In order to reduce the environmental impact of electricity production, sup-port has been granted in the form of a price supplement for environmen-tally friendly electricity from wind turbines and other RE plant (straw, woodchips, biogas, solar energy, hydro power etc.) and decentralised cogeneration of heating and power.
The most recent figures are for 2003, and they show that the pro-portion of Danish electricity con-sumption from RE was 23.9% in 2003, of which wind turbines ac-counted for 15.8% of total consump-tion. The proportion of decentralised cogeneration of heating and power from natural gas and waste was 25% in 2003. Preliminary figures for 2004 show that the RE proportion of Danish electricity consumption was 28.5% in 2004, of which wind turbines accounted for 18.8% of consumption. (If the non-biodegrad-able part of waste is included in the figures, the proportion was about 1 percentage point higher).
119Denmark's Fourth National Communication on Climate Change
Support for environmentally friendly electricity is set by the Electricity Supply Act and paid in part by elec-tricity consumers through electricity bills as a public obligation (PSO).
The total net costs of RE electricity in 2003, collected through PSO in addition to the market value of the electricity produced was about DKK 2.3 bn., while the corresponding sup-port for decentralised cogeneration of heating and power from natural gas and waste amounted to DKK 0.8 bn. Overall, PSO costs for the price supplement will drop in future years as there is an in-built time limit and a decreasing level of support com-pared with the previous rules.
The government’s long-term energy strategyIn June 2005 the government pre-sented a new long-term energy strat-egy – Energy Strategy 2025. The strategy is an overall and coherent presentation of the government’s long-term energy policy. At the core of the strategy is a clear market-based energy-political objective, in which public authorities provide the framework for the market actors. Thus, the Energy Strategy is based on:
- liberalised energy markets with common EU framework
- market-based cost-effective in-struments, and
- public authorities providing the overall grid infrastructure and
economic instruments, includ-ing the CO2 allowance scheme.
In line with this, the strategy does not propose quantitative objectives for the extension of renewable ener-gy, however it sets the stage for and envisages a market-based increase in the use of renewable energy.
It also underlines the importance of strengthened research and develop-ment of new energy technologies.
Finally, it focuses on the transport sector – a committee will be set up to discuss the overall perspectives for alternative propellants in the transport sector, including biofuels.
The Energy Strategy also assesses the need for extending the over-all electricity transmission network The government recommends that a power line be established below the Great Belt, and that Energinet.dk, cooperating with Statnett, makes a detailed study of the financial as-pects of strengthening the Skagerak-power cable.
Government energy savings planThe government platform states that the government will promote en-ergy-savings initiatives so that Den-mark can continue to lead efficiency energy use. The government will present an action plan for increased energy savings based on economi-cally justifiable investments, environ-mental consideration and advance-ment of Danish energy and building technology11.

120 Denmark's Fourth National Communication on Climate Change
As a follow-up to the agreement of 29 March 2004, the Danish govern-ment presented a draft action plan for a renewed energy-saving effort on 29 December 2004.
On 10 June 2005 the government made a broad political agreement to significantly strengthen energy-saving efforts. The agreement is ambitious, and sets the framework for efficient and increased energy-saving efforts in the coming years.
The parties to the agreement agree that overall energy consumption (ex-cluding transport) shall be reduced. Strengthened efforts will be made to reach specific and verifiable energy savings corresponding to 7.5 PJ per year on average in the period 2006-2013.
Important parts of the energy sav-ings will be achieved by better en-ergy-saving results in grid and distri-bution companies within electricity, natural gas, district heating and oil.
Moreover, energy savings will be achieved through stricter rules on en-ergy in building regulations, new and better energy labelling, better inspec-tion of boilers and ventilation equip-ment, special efforts within the public sector, and reorganisation of energy companies’ energy-saving efforts.
Together, the government’s action plan and the political agreement en-tail a significant strengthening of the overall energy-saving efforts.
Green technology and bio-fuels
The government programme states that development and use of new technology can be one of the ways to solve environmental problems, while at the same time having positive commercial effects. The Danish gov-ernment aims to boost the develop-ment of green technology, for exam-ple in the areas of energy and fuel.
In June 2005, three new research and development strategies were published: one for hydrogen tech-nologies, one for liquid biofuels, and one for wave energy. The strategies supplement Energy Strategy 2025, and can be seen as a realisation of overall considerations concerning prioritising and focusing future tech-nology-development efforts.
For hydrogen technology, the overall strategic target is to make Denmark among the best at developing and demonstrating efficient and com-petitive technologies and systems, so that hydrogen – based primarily on renewable energy – can become an integral element in clean, efficient, and reliable energy supply.
The strategy for liquid biofuels stresses the need for maintaining current Danish strengths especially within the development of new tech-nologies for production of bioethanol based on straw and other low-value raw materials.
Both the strategy for hydrogen tech-nology and the strategy for liquid biofuels will be important building blocks for the interdepartmental

121Denmark's Fourth National Communication on Climate Change
working group which is to establish a total overview of the possibilities for development and use of different alternative propellants in transport.
The overall objective of the wave energy strategy is to enable Danish wave energy plants to contribute to cost-effective, sustainable electricity supply in Denmark, and to enable Danish enterprises to supply com-petitive wave energy products etc. in Denmark and abroad.
4.3.1.2 Methane, CH4
Many small sources contribute to the energy sector’s methane emis-sions. The biggest single contribu-tion comes from gas-fired CHP plants, which emit unburnt natural gas. With a view to minimising the emissions, a statutory order now limits the emissions from new plants, corresponding to about 3% of fuel consumption. The emissions limit value for existing plants will be reduced by 5% from 2006 pursuant to Statutory Order no. 720 on limi-tations of emissions of nitrogen ox-ides, unburnt carbon hydrides and carbon monoxide etc. of 1998. All else being equal, it is expected that total emissions from these plants will be reduced by 5% from 2006.
4.3.1.3 Measures no longer in place and measures increasing greenhouse gas emissions
Since Denmark’s Third National Communication to the Climate Con-vention in 2003, the national CO2
allowance scheme has been discon-tinued, as mentioned above. It was replaced by implementation of the
common European CO2 allowancescheme. The common European scheme will in future be the primary instrument to ensure that Denmark meets its climate commitments.
Table 4.19 and Annex B1 contains an overwiev of discontinued and replaced measures including the na-tional CO2 allowance scheme. Please note that the EU CO2 allowance scheme will be the key instrument to ensure that Denmark meets its cli-mate commitments. As can be seen, a number of the measures stated below have been replaced by new ones. In a quota system, initiatives within quota-regulated areas have no or only a modest effect on CO2, andare therefore implemented in order to achieve other effects.
As mentioned in section 4.2.3, from 1 January 2005 tax differen-tiation has been introduced which will encourage the use of sulphur-free diesel. Increased demand will increase energy consumption in desulphurisation at refineries, and CO2 emissions will also increase. However, this should be related to the environmental benefits of limit-ing emissions of sulphur dioxide cf. the supplementary information on this initiatives in section 4.3.2. Two Danish refineries are covered by allowance regulations of 1 January 2005 and have been allocated allow-ances for 2005-2008 on the basis of historical emissions of CO2 in 1998-2002. One has also been allocated further allowances as a result of the statutory requirement in EU Com-munity law.
122 Denmark's Fourth National Communication on Climate Change
4.3.2 Transport
In 2003, the transport sector was responsible for 22% of Denmark’s CO2 emissions and 18% of total greenhouse gas emissions. The emis-sions from the transport sector are primarily CO2. 13 mill. tonnes of CO2 corresponded to 96.3% of emis-sions in 2003. Nitrous oxide made up 3.2% or 0.4 mill. tonnes CO2
equivalents, and methane about 0.5% or 0.07 mill. tonnes CO2 equivalents.
In 2003, the transport sector’s en-ergy consumption - primarily oil products - made up 31.5% of total energy consumption in Denmark. Traffic, especially passenger trans-port, has risen uniformly in recent years. In step with the increase, en-ergy consumption and greenhouse gas emissions have also increased. In 2003 total greenhouse gas emis-sions from the transport sector were 24% higher than in 1990. The most recent prognosis from 2002 predicts continued growth in the sector’s CO2
emissions, in spite of the fact that technological development has led to a reduction in energy consumption per km. Thus, the expected growth in traffic is expected to be approx. 17% from 2003 to 2012, whereas the growth in the transport sector’s en-ergy consumption is expected to be approx. 9% during the same period.
4.3.2.1 CO2
Efforts to turn the upward trend in emissions of greenhouse gases in the transport sector have so far failed, partly because of a large growth in traffic intensity and partly due to limitations on CO2 emissions in
Denmark are extremely difficult without international initiatives.
As shown in Table 4.16, the green-house gas emissions from fuel for vehicles, ships and aircraft are in-cluded under transport. The contri-bution from the armed forces con-sists mainly of CO2 and accounts for just less than 1% of the inventory for the transport sector. The proportion of fuel consumption for multilateral military operations, which is there-fore kept out of the total national inventory, is at present regarded as minimal.
Implemented initiatives and measuresIn 2002, working on the basis of the previous trends in passenger and freight traffic, the Danish Road Di-rectorate carried out a projection of road traffic up to 2016 and extrapo-lation up to 2030. The projection in-dicates that road traffic will continue to grow. With the chosen assump-tions it is estimated that road traffic will grow by more than 25% from 1997 to 2016. In the period 2000 to 2010, growth is expected to lie at about 13%.
A large part of total freight and pas-senger transport is by road and is expected to increase. The trend in freight and passenger transport by road will therefore determine the transport sector’s energy consump-tion and thus its CO2 emissions.
Table 4.20 and Annex B1 shows the existing policies and measures within the transport sector. In the last few years a number of important steps

123Denmark's Fourth National Communication on Climate Change
TABLE 4.19 REPLACED AND DISCONTINUED INITIATIVES AND MEASURES IN THE ENERGY AREA
Source: Danish Energy Authority and Danish CO2 emissions - the effort in the period 1990-2001 and the associated costs
Name of replaced or discontinued measure or initiative
Name of replacement-measure , cf. Table 4.18
GHGaf-fected
Type of in-strument
Status for implementa-tion
Implementing entity/player
CO2-re-ductionin 20014
Averageannual CO2reductionfor 2008-20121
The energy sector Mill.tonnesCO2
Mill.tonnesCO2
National CO2-allowancescheme for electricity pro-ducers
EU CO2 allow-ance schemeentered intoforce 1/1 2005
(CO2) Economic(financial)
Nationalallowancescheme inforce 15/62000 to31/12 2004
State authorities, energyproducers.EU CO2 allowancescheme also coversenergy-intensive enter-prises
Subsidy to electricity gen-eration (RE)
Price sup-ple-ment forenvironmentfriendly elec2
(CO2) Economic(financial)
Reorganised1/1 2005
State authorities, energyproducers
Subsidies for electricitygeneration (wind turbines)
Price sup-ple-ment forenvironmentfriendly elec2
(CO2) Economic(financial)
Reorganised 1/1 2005
State authorities, energyproducers
Priority for electricity fromCHP plants
Price sup-ple-ment forenvironmentfriendly
(CO2) Economic(financial)
Reorganised 1/1 2005
State authorities, energyproducers
Requirement for offshorewind turbines
Tenders for off-shore turbines3
(CO2) Regulatory(admin.),economic(financial)
Replaced bytenders
State authorities, energyproducers
Scrapping scheme forold, badly located windturbines
Scrappingscheme for oldwind turbines4
(CO2) Economic(financial)
Old schemestopped endof 2003
Local/ regional authori-ties, interest organisa-tions, energy producers,state authorities
Renewable energy Island (Finished asstate initia-tive)
CO2 Economic(financial),R&D
Continuedlocally, seewww.veo.dk
Consumers, supplycompanies, interestorganisations, local/regional authorities, re-search institutions, stateauthorities
Construction subsidy forrenewable energy
(Scheme dis-continued)
Economic(financial)
State authorities, enter-prises
Subsidy for investment inenergy savings by industry
(Scheme dis-continued)
CO2 Economic(financial)
Scheme dis-continuedend of 2001
State authorities, enter-prises
Subsidy for conversion ofold housing to coal CHP
(Scheme dis-continued)
Economic(financial)
State authorities, enter-prises
Subsidy to promote con-nection to coal CHP
(Scheme dis-continued)
Economic(financial)
State authorities, enter-prises
State subsidy for energysavings measures in hous-ing for pensioners
(Scheme dis-continued)
CO2 Economic(financial)
Scheme dis-continuedend of 2003
Local and state authori-ties, consumers
1 Effects of some of these measures are included in the Effort Analysis cf. annex B2.
2 The amendment to the Electricity Supply Act, which entered into force on 1 January 2005, means that all environmentally friendly electricity, i.e. electricity from wind turbines and other renewable energy(RE) plant, small CHP plants etc., is now sold under market conditions. The previous support for environmentally friendly electricity, where consumers were obliged to take electricity at a fixed settlementprice has also been transferred to financial support as a price supplement added to the market price.
3 In accordance with the energy policy agreement of 29 March 2004 two offshore wind turbine farms will be established, each of 200 MW, one at Horns Rev, and one at Rødsand.. The offshore windfarms should be in operation in 2008/2009. There are currently no plans for further development of offshore wind farms. Any further development will depend on the initiatives taken in the Energy Strat-egy 2025, with a view to providing the basis for future extension based on market conditions.

124 Denmark's Fourth National Communication on Climate Change
have been taken at international lev-el, and these - supported by targeted and effective Danish action may help to turn the trend for the transport sector’s CO2 emissions.
Thus, the EU has set up an overall target of attaining a mean CO2 emis-sion from new passenger cars of 120 g of CO2 per km before 2010. With the aim of fulfilling this target, agreements have been made with the automobile industry in Europe, Ja-pan, and most recently Korea, which commit the industry to reducing the mean CO2 emission per km. This measure is assessed to have had, and will in the future have, considerable effect and has been implemented with the reduction of CO2 emissions as one of the primary targets.
The national environmentally-moti-vated measures for the transport sec-tor, which have also influenced CO2
emissions, are usually characterised by aiming at limiting environmental impacts in general. “Changing the registration tax to a green owner tax” and “increased fuel taxes” are both assessed to have had consider-able effects and were, furthermore, implemented with reduction of CO2
emissions as one of the primary tar-gets.
A great number of additional initia-tives aiming directly or indirectly at reducing CO2 emissions have been implemented within various areas. Characteristic for all these initiatives are information campaigns or subsi-dy schemes, while no initiatives have been established using direct regula-
tion such as requirements or bans. The effects of these initiatives is hard to quantify and in themself they are not considered to have contrib-uted significantly to CO2 reductions
As transport in itself has a number of side-effects in addition to con-tributing to the greenhouse effect through higher CO2 emissions, for example air pollution causing poor air quality or acidification, noise, accidents and congestion, it is im-portant to note that the various ini-tiatives implemented in the transport area typically address many of these aspects and can thus not only be considered in relation to CO2 emis-sions. In general the increasing traf-fic intensity has caused increased CO2 emissions, while other air pol-lution has fallen significantly. Other negative effects of transport have also been reduced, e.g. the number of injuries and fatalities in accidents fell by 22% and 47% respectively from 1990 to 2002.
Compared with Denmark’s Third Na-tional Communication Table 4.20 has been expanded to include informa-tion on the effects estimated for se-lected initiatives in the Effort Analysismentioned in section 4.1.3 and An-nex B2.
New measuresCalculations of possible national measures for reduction of Denmark’s CO2 emissions show that the cost-ef-fectiveness of the measures depends entirely on the side effects. The decision to implement the different measures within the transport sector

125Denmark's Fourth National Communication on Climate Change
must therefore to a great extent be evaluated on the basis of the meas-ure’s other effects and not simply from the point of view of reduction of CO2 emissions. The generally high economic shadow prices with-out side-effects are primarily a con-sequence of the already high level of taxation in the transport sector. It is thus a common feature of most of the measures that they are directed towards parts of the transport sec-tor that, taken together, already pay the full economic cost of transport, since there is a considerable fiscal element in the fixed car taxes.As can be seen in its platform from February 2005, the Danish govern-ment will appoint a committee to in-vestigate the options for reorganising the total motor vehicle tax system over several years in a way that pro-motes the environment and retains existing revenue levels.
An EU directive of May 2003 aims at promoting the use of biofuels in transport. The directive contains reference values for indicative tar-gets that consumption of biofuels in 2005 should comprise 2% of all pet-rol and diesel sold to transport, and that this percentage should grow to 5.75% in 2010. EU countries can set their own indicative targets, and these can be differentiated com-pare to the Commission’s proposal. Denmark’s indicative target of 0% in 2005 was reported to the Commis-sion in 2004 with a note that Danish consumption of biofuels in other sectors was high.
Biofuels are currently more expen-sive to manufacture than fossil fuels. However, the cost effectiveness can be improved through more intensive research and development. As stated in the new government platform of February 2005, the government will enhance development of green tech-nology, including biofuels.
Therefore, in the summer of 2005 the government set up an intermin-isterial working group to prepare proposals for realisation of the government’s objectives relating to fuels. The proposals from the work-ing group will focus on measures to strengthen the development of tech-nologies for alternative road trans-port propellants, for instance biofu-els, natural gas, and, in the longer term, hydrogen.
An updated overall analysis of pos-sible new measures in the transport area and their cost-effectiveness is planned for finalisation in 2006 as part of the Policies and Measures Project described in section 4.1.3.
4.3.2.2 Methane, CH4
The transport sector’s emissions of methane account for about 0.5% of the sector’s greenhouse gas emis-sions, corresponding to about 0.07 mill. tonnes CO2 equivalents.
4.3.2.3 Nitrous oxide, N2ONitrous oxide accounts for just over 3%, or 0.4 mill. tonnes CO2 equiva-lents, of the transport sector’s total greenhouse gas emissions. Emis-sions of nitrous oxide have increased considerably since the introduction
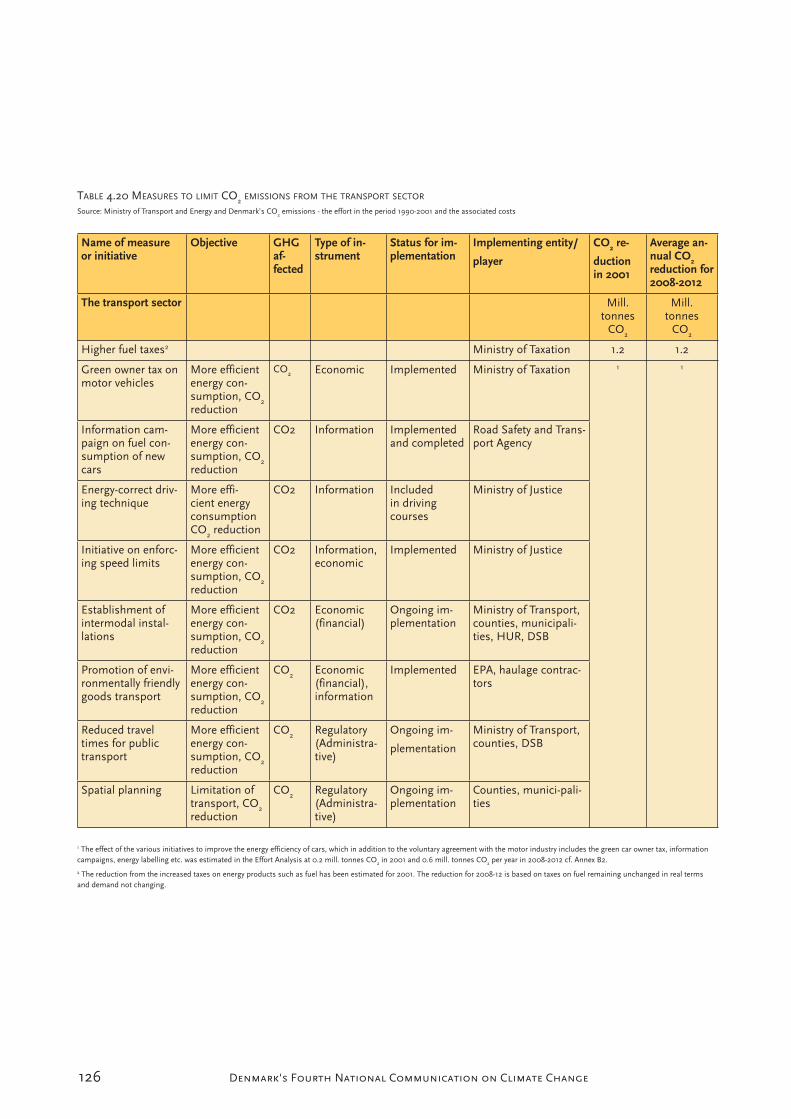
126 Denmark's Fourth National Communication on Climate Change
TABLE 4.20 MEASURES TO LIMIT CO2 EMISSIONS FROM THE TRANSPORT SECTOR
Source: Ministry of Transport and Energy and Denmark’s CO2 emissions - the effort in the period 1990-2001 and the associated costs
Name of measure or initiative
Objective GHGaf-fected
Type of in-strument
Status for im-plementation
Implementing entity/
player
CO2 re-
ductionin 2001
Average an-nual CO2reduction for 2008-2012
The transport sector Mill.tonnes
CO2
Mill.tonnes
CO2
Higher fuel taxes2 Ministry of Taxation 1.2 1.2
Green owner tax onmotor vehicles
More efficientenergy con-sumption, CO2reduction
CO2 Economic Implemented Ministry of Taxation 1 1
Information cam-paign on fuel con-sumption of newcars
More efficientenergy con-sumption, CO2reduction
CO2 Information Implementedand completed
Road Safety and Trans-port Agency
Energy-correct driv-ing technique
More effi-cient energyconsumptionCO2 reduction
CO2 Information Includedin drivingcourses
Ministry of Justice
Initiative on enforc-ing speed limits
More efficientenergy con-sumption, CO2reduction
CO2 Information,economic
Implemented Ministry of Justice
Establishment ofintermodal instal-lations
More efficientenergy con-sumption, CO2reduction
CO2 Economic(financial)
Ongoing im-plementation
Ministry of Transport,counties, municipali-ties, HUR, DSB
Promotion of envi-ronmentally friendlygoods transport
More efficientenergy con-sumption, CO2reduction
CO2 Economic(financial),information
Implemented EPA, haulage contrac-tors
Reduced traveltimes for publictransport
More efficientenergy con-sumption, CO2reduction
CO2 Regulatory(Administra-tive)
Ongoing im-
plementation
Ministry of Transport,counties, DSB
Spatial planning Limitation oftransport, CO2reduction
CO2 Regulatory(Administra-tive)
Ongoing im-plementation
Counties, munici-pali-ties
1 The effect of the various initiatives to improve the energy efficiency of cars, which in addition to the voluntary agreement with the motor industry includes the green car owner tax, informationcampaigns, energy labelling etc. was estimated in the Effort Analysis at 0.2 mill. tonnes CO2 in 2001 and 0.6 mill. tonnes CO2 per year in 2008-2012 cf. Annex B2.
2 The reduction from the increased taxes on energy products such as fuel has been estimated for 2001. The reduction for 2008-12 is based on taxes on fuel remaining unchanged in real termsand demand not changing.

127Denmark's Fourth National Communication on Climate Change
of new cars with catalytic convert-ers in 1990. As the half-life of cars from that time is approaching, it is expected that the rate of increase will fall until all cars have catalytic converters. This saturation point is expected to be reached around 2010-2012, with annual emissions of around 0.8 mill. tonnes CO2 equiva-lents.
4.3.2.4 Measures no longer in place and measures increasing greenhouse gas emissions
Since Denmark’s Third National Communication to the Climate Con-vention in 2003, there have been no great changes in measures for trans-port.
Compared with the measures listed in Denmark’s Third National Com-munication, however, it should be noted that the information campaign on fuel consumption of new cars has ended and that the measure to promote enterprise plans for traffic safety and the environment as well as transport plans has been discon-tinued as funds are no longer being made available.
With regard to the in-depth review of Denmark’s Third National Com-munication it should also be noted that in October 2004 the govern-ment decided to allocate about DKK 135 mill. to a reduction in taxes of about DKK 0.04 per li-tre sulphur-free petrol and DKK 0.02 per litre sulphur-free diesel. The purpose is to promote use of sulphurfree petrol and diesel four years before it will be mandatory
under EU regulations. On the one hand, encouraging phase out of sulphur in petrol and diesel will in principle also cause an increase in energy consumption and thus CO2
emissions, because of desulphurisa-tion at refineries. Emissions of CO2
from Danish refineries, which are solely due to requirements for desul-phurised petrol and diesel, have not been quantified. At EU level it has been assessed previously that phase 1 of the EU requirements on limit-ing sulphur in fuel in 2000 would increase total annual CO2 emis-sions from refineries in the EU12 by about 6 mill. tonnes. The effect of phase 2 of the EU regulation has not been assessed. On the other hand, sulphur-free petrol means that catalytic converters on existing cars will be more effective. Therefore the emissions of pollutants will be reduced by about 10%. Sulphur-free diesel means that emissions of soot particles from diesel cars will fall by about 5%.
4.3.3 Business sectorThe business sector covers industry, building and construction and pub-lic and private service.
In 2003, this sector was responsible for approx. 13% of Denmark’s total greenhouse gas emissions. 82% of these emissions were CO2. The sec-tor is also the only source of emis-sions of industrial gases. Climate measures within the business sector are in Table 4.21 and Annex B1.
The ongoing initiatives to reduce the emissions from the business

128 Denmark's Fourth National Communication on Climate Change
sector include both promotion of energy savings and energy efficiency improvements, conversion of energy production to cleaner fuels and ini-tiatives to reduce the emissions of in-dustrial gases. Certain energy-inten-sive businesses are also subject to al-lowance regulation as a consequence of the EU allowance directive.
Earlier analyses have shown that there is a big potential for profit-able energy efficiency improvements within the business sector, so im-proving energy efficiency is a vital area of action.
4.3.3.1 CO2
Industry, building and construction, trade and private serviceIndustry is responsible for most of the sectors’ emissions of CO2. The emissions come mainly from energy-consuming activities in industry. Cement and brick production also contributes especially high levels of CO2, which comes from the raw ma-terials used.
The main measure used to reduce energy consumption by the busi-ness sector is a green tax package for the business sector, which was introduced in 1995. The package contained a combination of taxes and rebates to enterprises through, among other measures, government grants to promote energy savings by enterprises. The package led to a higher CO2 tax and the introduction of a space-heating tax for businesses. At the same time, a scheme was in-troduced in which companies with high energy consumption have the
possibility of gaining a discount on the taxes in return for entering into an agreement on energy efficiency improvements. The combination of taxes and return of the proceeds was intended to ensure a marked reduc-tion of businesses’ CO2 emissions without affecting their international competitiveness.
Subsidies to promote energy savings in business enterprises were discon-tinued at the end of 2001.
The objective with the green tax package was to get the business sec-tor to contribute to a reduction of Denmark’s total CO2 emissions. The target contribution was about 4% in 2005 in relation to the emissions in 1988.
The green package’s overall effect was evaluated in 1999. The main conclusion is that the package has functioned as intended. Consider-able environmental gains have been achieved in an economically effective way that takes account of businesses’ international competitiveness. The energy package’s environmental ef-fects largely live up to the original expectations and the package is thus an important element of the efforts to reduce Denmark’s CO2 emissions.
The agreement scheme was evalu-ated in 2005. The main conclusion is that, with agreements in 1996-1999, businesses saved approx. 5.5% in energy, 2.5% of which is directly at-tributable to the agreements. For the period 2000-2003 the corresponding
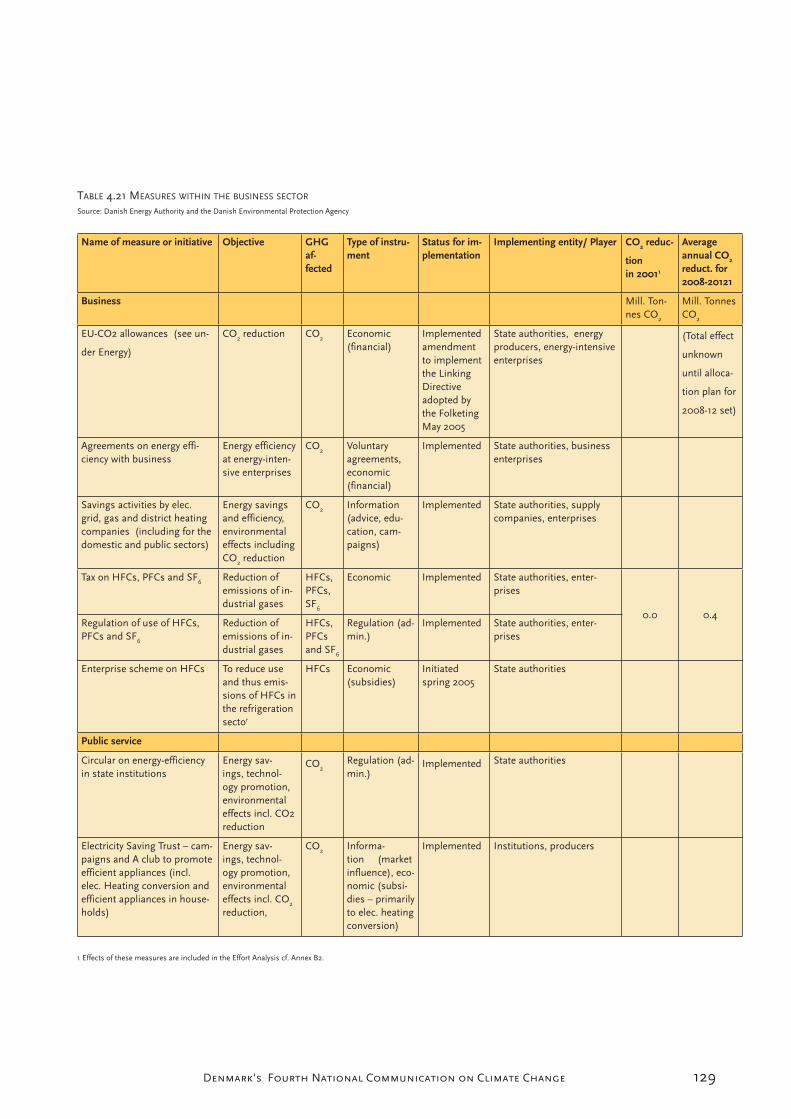
129Denmark's Fourth National Communication on Climate Change
TABLE 4.21 MEASURES WITHIN THE BUSINESS SECTOR
Source: Danish Energy Authority and the Danish Environmental Protection Agency
Name of measure or initiative Objective GHGaf-fected
Type of instru-ment
Status for im-plementation
Implementing entity/ Player CO2 reduc-
tionin 20011
Averageannual CO2
reduct. for 2008-20121
Business Mill. Ton-nes CO2
Mill. TonnesCO2
EU-CO2 allowances (see un-
der Energy)
CO2 reduction CO2 Economic (financial)
Implementedamendmentto implementthe LinkingDirectiveadopted bythe FolketingMay 2005
State authorities, energyproducers, energy-intensiveenterprises
(Total effect
unknown
until alloca-
tion plan for
2008-12 set)
Agreements on energy effi-ciency with business
Energy efficiencyat energy-inten-sive enterprises
CO2 Voluntaryagreements,economic(financial)
Implemented State authorities, businessenterprises
Savings activities by elec.grid, gas and district heatingcompanies (including for thedomestic and public sectors)
Energy savingsand efficiency,environmentaleffects includingCO2 reduction
CO2 Information(advice, edu-cation, cam-paigns)
Implemented State authorities, supplycompanies, enterprises
Tax on HFCs, PFCs and SF6 Reduction ofemissions of in-dustrial gases
HFCs,PFCs,SF6
Economic Implemented State authorities, enter-prises
0.0 0.4Regulation of use of HFCs,PFCs and SF6
Reduction ofemissions of in-dustrial gases
HFCs,PFCsand SF6
Regulation (ad-min.)
Implemented State authorities, enter-prises
Enterprise scheme on HFCs To reduce useand thus emis-sions of HFCs inthe refrigerationsector
HFCs Economic(subsidies)
Initiatedspring 2005
State authorities
Public service
Circular on energy-efficiencyin state institutions
Energy sav-ings, technol-ogy promotion,environmentaleffects incl. CO2reduction
CO2Regulation (ad-min.)
Implemented State authorities
Electricity Saving Trust – cam-paigns and A club to promoteefficient appliances (incl.elec. Heating conversion andefficient appliances in house-holds)
Energy sav-ings, technol-ogy promotion,environmentaleffects incl. CO2
reduction,
CO2 Informa-tion (marketinfluence), eco-nomic (subsi-dies – primarilyto elec. heatingconversion)
Implemented Institutions, producers
1 Effects of these measures are included in the Effort Analysis cf. Annex B2.
130 Denmark's Fourth National Communication on Climate Change
figures are approx. 4.5% and 2% re-spectively.
In the Climate Strategy from Febru-ary 2003 it was evaluated whether there was still a potential for rela-tively cheap emission reductions in the energy-intensive part of industry, which had hitherto paid lower CO2
taxes than the rest of the business sector and the domestic sector for reasons of competitiveness.
Certain energy-intensive businesses are subject to allowance regulation as a consequence of the EU allowance directive. With the common EU al-lowance scheme, CO2 regulations without too serious effects on com-petitiveness could be imposed on energy-intensive industry. Allowance regulation is the main measure to be used with regard to these businesses.
Denmark wants CO2 taxes on the al-lowance-regulated fuel consumption for industrial production processes to be repaid as far as possible, and preferably in full. Therefore Den-mark will change the CO2 Taxes Act within the scope defined in the di-rective on energy taxation. The Eu-ropean Commission must approve the amendment, for instance under the rules on state subsidies, before it can take effect. Process emissions not originating from energy con-sumption can also be covered by the EU allowance directive. In Den-mark’s case, this primarily involves the CO2 emissions from cement pro-duction. These emissions have not previously been subject to regulation through taxes.
Business and industry have intro-duced major energy efficiencies over the past 10 years. Therefore, energy consumption in this sector has re-mained unchanged, despite consider-able economic growth.
Projections of energy consumption show, however, a significant increase in energy consumption by business in the years to come. The potential for better energy efficiency is still great. The draft action plan for a re-newed energy-saving effort proposes a number of activities, including:
Efficiency consultancy and infor-mation efforts, including more focus on realising the savings as-signed.
Promotion of sales of energy services. Efforts for business and industry will be organised so that energy services are promot-ed. An information campaign will also be completed to give the market a push.
Promotion of energy manage-ment, energy-conscious plan-ning, energy-correct procure-ment and bench-marking of energy consumption.
Promotion of exploitation of sur-plus heat.
Following the political agreement of 10 June 2005 to considerably strengthen energy-saving efforts, new initiatives will be launched during 2005 and 2006.

131Denmark's Fourth National Communication on Climate Change
Cement
Cement production results in big emissions of CO2. The production process itself is very energy-inten-sive, and a large quantity of CO2 is emitted in connection with the pro-duction process.
Cement production in Denmark is concentrated in a single company. In 2001 the total annual emissions of CO2 from cement production were about 2.6 mill. tonnes. About half comes from energy consump-tion and the other half from chalk, which is one of the raw materials used in the process. A lot has been done within the cement industry. For example, in the last 20 years the Danish cement producer has sig-nificantly reduced its CO2 emissions per tonne cement produced.
Up to now, efforts with regard to the cement industry’s energy con-sumption have been based on the green business sector tax package with a combination of taxes and agreements on energy efficiency. From 1 January 2005, all CO2 emis-sions from cement production in Denmark are subject to the Euro-pean CO2 quota system.
Public serviceWork to improve energy efficiency in the public sector has been going on for more than 10 years, and considerable savings have been achieved. However, there are still economically viable possibilities for savings. This is illustrated by the fact that there is a very big
difference in consumption (per m2)between comparable institutions.
Data on energy consumption in the public sector have been collected for some years as a means of render-ing the sector’s energy consumption visible. There are now complete inventories of energy consumption in county and state institutions, but more limited inventories of the in-dividual municipalities’ energy con-sumption.
The main initiatives to promote en-ergy savings in the public sector are:
a new circular on energy-ef-ficiency in state institutions (including implementation of profitable energy savings, en-ergy-efficient behaviour and operation and energy-efficient procurement).
Guidelines for procurement in the public sector, e.g. through preparation of environmental guidelines for large buyers in the public sector.
Energy labelling and energy-checking of large properties.
A-club for public institutions, introduced by the Electricity Saving Trust. The members of the club undertake only to buy energy-efficient appliances that meet specific requirements given in guidelines for procure-ment and in a positive list.

132 Denmark's Fourth National Communication on Climate Change
Campaigns by the Electricity Saving Trust on energy-efficient lighting, ventilation and office equipment, etc.
Consultancy by supply compa-nies for institutions.
In connection with the Finance Act for the fiscal year 2005, a political agreement on several areas including energy-saving measures was made. The agreement focuses particularly on energy saving in state institutions as a consequence of the efforts of the Electricity Saving Trust (Elec-tricity Saving Trust), on new energy demands for state buildings, and on a new circular on energy-efficiency in state institutions.
Following the political agreement of 10 June 2005 to considerably strengthen energy-saving efforts, new initiatives will be launched during 2005 and 2006.
One of the issues to be discussed is how similar demands as those apply-ing to the state can be introduced in municipalities and regions.
4.3.3.2 N2O, nitrous oxideThe emission of nitrous oxide (N2O)from the production of nitric acid in connection with the production of fertilizer in Denmark has only been included in Danish emissions inven-tories in recent years, even though production from the single plant in Denmark, with associated emissions, has taken place for many years, in-cluding 1990, Denmark’s basis year for emissions of nitrous oxide.
In summer 2004, however, the owner decided to stop production of fertilizer and so production of nitric acid in Denmark. Emissions of nitrous oxide from production of nitric acid in 2003 corresponded to 0.9 mill. tonnes CO2 equivalents. In 2004 emissions will be about one-half of this, and from 2005 they will cease entirely, and probably also in 2008-2012 cf. market conditions for production of fertilizer in Europe.
4.3.3.3 HFCs, PFCs and SF6
The industrial sector is the only sec-tor which in practice emits the in-dustrial gases HFCs, PFCs, and SF6
according to the emission invento-ries. These gases are used for several purposes including as cooling and foaming agents, etc. (HFCs), cooling agents (PFCs), and insulator gas in high-tension contacts (SF6).
The Danish regulation of emissions of the industrial greenhouse gases (HFCs, PFCs, and SF6) is 2-phased, since there is a consumer tax on the use of the substances and also a statutory order on the phasing out of use of the gases in new facilities and products.
Taxes corresponding to their GWP have been imposed on each of the greenhouse gases from March 2001 in combination with the Danish CO2
tax of DKK 0.1 per kg CO2. This means that HFC-134a is subject to a tax of DKK 130/kg, as it has a GWP of 1,300. There is a ceiling of DKK 400/kg so although SF6 has a GWP of 23,900, the tax is only

133Denmark's Fourth National Communication on Climate Change
DKK 400/kg and not DKK 2,390/kg.
The tax is imposed on the substances on importation because none of them is produced in Denmark. The tax is payable whether the substances are imported as pure substances or are part of imported products. If the content in the products is not known, the tax is based on a fixed tariff.
The tax is payable on a wide range of products, including:
Refrigerating and freezing plants
Air-conditioning plants
PUR foam for cooling plant, district heating pipes, insulated gates and doors, panels for re-frigeration and freezer rooms, extruded polystyrene for insula-tion (XPS foam), jointing foam
Spray canisters
Insulation gas
The tax is also payable on service on existing and new installations/products.
On 15 July 2002, a statutory order on the regulation of certain industri-al greenhouse gases came into force.
This order includes a general ban on the use of industrial greenhouse gases in a great number of new fa-cilities and products from 1 January 2006, including household cooling and freezing appliances, PUR foam,
etc. There are, however, certain exceptions to the general phase-out date. For example, the ban will only apply to new commercial cooling plants, air-conditioning plants, etc. from 1 January 2007. Other excep-tions are new sound-insulating win-dows, in which SF6 has been banned since 1 January 2003, and PFCs, on which there has been a general ban since September 2002. However, some products and applications are exempted from the ban. This ap-plies, for example, to service on ex-isting plants, mobile cooling plants, including mobile air conditioning plants, the use of HFCs in cooling and air conditioning plants with fill-ings between 0.150 and 10 kg HFC, SF6 in high voltage plants, etc.
To ensure the best possible imple-mentation of the phase-out dates for the refrigeration sector, which is the most important area, a total of DKK 12 mill. have been reserved for the next couple of years for de-velopment of alternatives and for subsidies for implementation of al-ternatives that have been developed already. A knowledge centre for HFC-free cooling has been estab-lished. The centre will disseminate knowledge and to a certain extent also offer technical assistance.
4.3.3.4 Measures no longer in place and measures increasing greenhouse gases
Table 4.19 presents the national CO2 allowance scheme, and other measures that have been discontin-ued and changed.
134 Denmark's Fourth National Communication on Climate Change
Apart from the above changes, no significant changes in the measures for the business and industry sector have taken place since Denmark’sThird National Communication to the Climate Convention in 2003.
4.3.4 Agriculture, forestry and fisheries
The primary occupational sectors agriculture, forestry and fisheries are generally considered as one sin-gle economic sector in Denmark. However, the importance of the in-dividual sectors differs greatly with respect to Denmark’s emissions and uptake of greenhouse gases. Ag-ricultural farms have emissions of methane and nitrous oxide. The net uptake of CO2 in Denmark’s forests is included under Forestry. However, CO2 emissions from energy use in all three sectors are considered un-der one heading because there is no breakdown of these in the annual energy statistics. Table 4.22 and An-nex B1 shows measures for emission reductions within agriculture and forestry.
In 2003, agriculture was responsible for 17% of Denmark’s total green-house gas emissions. Approx. 80% consisted of methane and nitrous ox-ide and 20% of CO2 from the burn-ing of fuel.
Measures that are used in the agri-cultural sector and that have affected or will affect the sector’s greenhouse gas emissions include:
Ban on burning of straw on fields
Action Plans for the Aquatic En-vironment I and II and Action Plan for Sustainable Agriculture
Action Plan for the Aquatic En-vironment III
Ammonia Action Plan
Action Plan for Joint Biogas Plants and subsequent follow-up programmes
4.3.4.1 Methane, CH4
Methane comes mainly from the agricultural sector. The emissions in 2003 were 176,000 tonnes, cor-responding to 3.7 mill. tonnes CO2
equivalents. The methane is formed through enteric fermentation in farm animals and from conversion of car-bohydrates in manure.
Agriculture’s biggest contribution to the methane emissions comes from dairy cows.
In the digestion process, methane is a by-product of the fermentation of feed in the rumen, primarily from grass and green fodder. In addition, methane is formed during conver-sion of manure under anaerobic conditions if the temperature is sufficiently high. These conditions normally occur in manure stores and housing systems with liquid manure or deep litter.
The emission of methane from ag-riculture is expected to be reduced in 2003-2012, corresponding to ap-prox. 0.1 mill. tonnes of CO2 equiv-
135Denmark's Fourth National Communication on Climate Change
alents, primarily due to improved ef-ficiency in cattle farming.
4.3.4.2 Nitrous oxide, N2OAgriculture is the biggest source of nitrous oxide emissions in Denmark. Of the total emissions of 26,000 tonnes in 2003, 77% or 20,000 tonnes, corresponding to more than 6.2 mill. tonnes of CO2 equivalents came from agriculture.
Nitrous oxide may be emitted dur-ing microbial decomposition of organic matter. The process occurs in some types of manure stores and during conversion of minerally and organically bound nitrogen (e.g. ma-nure and applied wastewater sludge) in the soil. Some of the leached ni-trogen is also converted into nitrous oxide. Nitrogen entering the soil with fertiliser and manure and in plant residues is the main cause of nitrous gas emissions. In 2003 agri-culture’s main contribution to emis-sions of nitrous oxide consisted of a contribution of 43% from manure and a contribution of 31% from run-off12.
Ammonia volatilisation contributes to the greenhouse effect because some of the ammonia nitrate ends up as nitrous oxide in the atmos-phere. Ammonia volatilisation into the atmosphere comes almost exclusively from agriculture. In 2002 the NH3-N emissions from agriculture were slightly more than 80,800 tonnes, with a nitrous oxide contribution corresponding to 6% of agriculture’s nitrous oxide emissions. Ammonia volatilises from manure,
fertiliser, sludge, crops and treat-ment of straw with ammonia. The emissions particularly occur during handling of manure in animal hous-ing, during storage of manure, dur-ing transport of manure, and from grazing animals13.
Implemented measures and initiativesThe emissions of nitrous oxide from agriculture are expected to be reduced, corresponding to about 3 mill. tonnes of CO2
equivalents or 32% during the period from 1990 to 2008-2012. Implementation of the Action Plan for the Aquatic Environment II and III will contribute the most to this reduction14,15.
Action Plans for the Aquatic Environment I and II and Action Plan for Sustainable AgricultureOne of the main purposes of the Action Plans for the Aquatic Environment and the Action Plan for Sustainable Agriculture was to reduce agriculture’s emissions of nitrogen to the aquatic environment.
The action plans have been imple-mented as regulation of farmers’ behaviour. The Action Plan for the Aquatic Environment I was initi-ated in 1987 and the Action Plan for Sustainable Agriculture in 1991. These action plans included particu-larly requirements concerning winter green fields and better utilisation of manure. The Action Plan for the Aquatic Environment II from 1998 contained a number of additional measures, including re-establish-
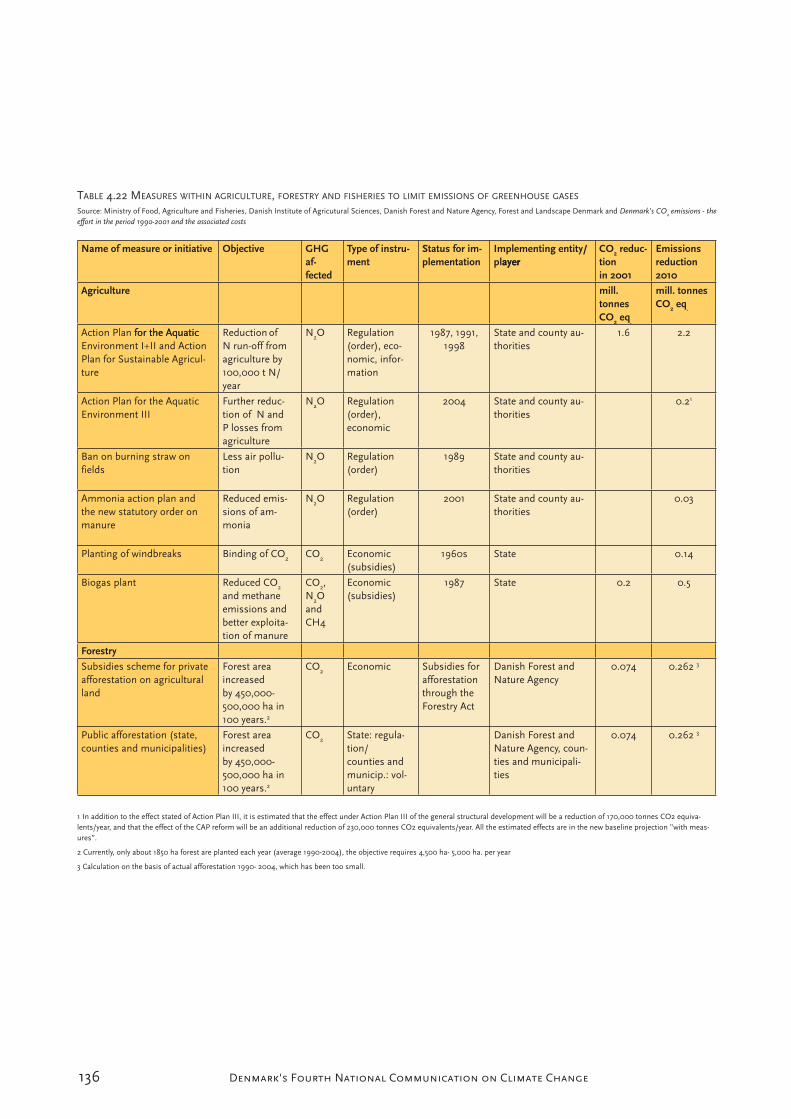
136 Denmark's Fourth National Communication on Climate Change
TABLE 4.22 MEASURES WITHIN AGRICULTURE, FORESTRY AND FISHERIES TO LIMIT EMISSIONS OF GREENHOUSE GASES
Source: Ministry of Food, Agriculture and Fisheries, Danish Institute of Agricutural Sciences, Danish Forest and Nature Agency, Forest and Landscape Denmark and Denmark’s CO2 emissions - the effort in the period 1990-2001 and the associated costs
Name of measure or initiative Objective GHGaf-fected
Type of instru-ment
Status for im-plementation
Implementing entity/playerayer
CO2 reduc-tionin 2001
Emissionsreduction2010
Agriculture mill.tonnesCO2 eq.
mill. tonnes CO2 eq.
Action Plan for the Aquaticfor the AquaticEnvironment I+II and ActionPlan for Sustainable Agricul-ture
Reduction ofN run-off fromagriculture by100,000 t N/year
N2O Regulation(order), eco-nomic, infor-mation
1987, 1991,1998
State and county au-thorities
1.6 2.2
Action Plan for the AquaticEnvironment III
Further reduc-tion of N andP losses fromagriculture
N2O Regulation(order),economic
2004 State and county au-thorities
0.21
Ban on burning straw onfields
Less air pollu-tion
N2O Regulation(order)
1989 State and county au-thorities
Ammonia action plan andthe new statutory order onmanure
Reduced emis-sions of am-monia
N2O Regulation(order)
2001 State and county au-thorities
0.03
Planting of windbreaks Binding of CO2 CO2 Economic(subsidies)
1960s State 0.14
Biogas plant Reduced CO2
and methaneemissions andbetter exploita-tion of manure
CO2,N2OandCH4
Economic(subsidies)
1987 State 0.2 0.5
Forestry
Subsidies scheme for privateafforestation on agriculturalland
Forest areaincreasedby 450,000-500,000 ha in100 years.2
CO2 Economic Subsidies forafforestationthrough theForestry Act
Danish Forest andNature Agency
0.074 0.262 3
Public afforestation (state,counties and municipalities)
Forest areaincreasedby 450,000-500,000 ha in100 years.2
CO2 State: regula-tion/counties andmunicip.: vol-untary
Danish Forest andNature Agency, coun-ties and municipali-ties
0.074 0.262 3
1 In addition to the effect stated of Action Plan III, it is estimated that the effect under Action Plan III of the general structural development will be a reduction of 170,000 tonnes CO2 equiva-lents/year, and that the effect of the CAP reform will be an additional reduction of 230,000 tonnes CO2 equivalents/year. All the estimated effects are in the new baseline projection ”with meas-ures”.
2 Currently, only about 1850 ha forest are planted each year (average 1990-2004), the objective requires 4,500 ha- 5,000 ha. per year
3 Calculation on the basis of actual afforestation 1990- 2004, which has been too small.
137Denmark's Fourth National Communication on Climate Change
ment of wetlands, afforestation, agreements on environment friendly agricultural measures, organic farm-ing on an additional 170,000 ha, improved use of fodder, reduced animal density, use of catch crops, reduced fertilisation norms and stricter requirements concerning the use of nitrogen in manure. The aim, which has now been reached, was to reduce nitrogen leaching by 100,000 tonnes N/year up to the year 200316.
These action plans have, in particu-lar, reduced the emissions of nitrous oxide. There have presumably also been small effects on methane emis-sions from manure stores, particu-larly as a consequence of increased use of anaerobic fermentation of manure in biogas plants. The in-creased use of catch crops, larger areas with organic farming and re-establishment of wetlands must also be expected to lead to increased storage of carbon in the soil.
Most of the changes in nitrous oxide emissions from agriculture in the period since 1990 can be attributed to these action plans. However, it has been calculated that even with-out the action plans there would have been a reduction in emissions, although to a much lesser extent. The effect of these action plans on emissions of nitrous oxide has been calculated at about 2.2 mill. tonnes CO2 equivalents/year19. There are no estimates of the effect on carbon storage in the soil.
Action Plan for the Aquatic Environment IIIWith the political agreement on the Action Plan for the Aquatic Environment III of 2 April 2004, a number of measures were imple-mented to follow up on the results attained via the previous plans. This third action plan contains targets with respect to nitrogen, phosphorus, sensitive natural areas, and slurry odour. This is a 10-year agreement, and in evaluations in 2008 and 2011 initiatives will also be combined with the Water Frame-work Directive and the Habitats Directive. Special emphasis is on the use of catch crops, stricter require-ments for use of manure as well as afforestation and agro-environmental measures. In addition, the agree-ment includes research initiatives aimed at slurry odours and reduc-tion of emissions of nutrients, e.g. research into technology to man-age slurry, ammonia etc. The ef-fect of the action plan in 2008-12 is estimated at 0.2 mill. tonnes CO2
equivalents/year17.
The Ammonia Action PlanAmmonia emitted from agriculture will stimulate emissions of nitrous oxide when it is deposited in other ecosystems. Reducing ammonia evaporation will therefore also result in a reduction of nitrous oxide emis-sions. An Ammonia Action Plan which was adopted in 2001 will, together with the Action Plan for the Aquatic Environment I and II, reduce ammonia emissions by 15-20,000 tonnes of nitrogen annually. Hereby ammonia evaporation from

138 Denmark's Fourth National Communication on Climate Change
agriculture should be reduced from 90,000 tonnes of nitrogen in the mid 1990s to approx. 60,000 tonnes of nitrogen in 2004.
The measures covered by the Am-monia Action Plan are:
1) Optimisation of manure handling during housing for cattle, pigs, poultry and fur animals.
2) Rules on covering storage facili-ties for solid manure and slurry tanks.
3) Ban on surface spreading and reduction of the time from field application of manure to incor-poration.
4) Ban on ammonia treatment of straw.
These measures are estimated to lead to a reduction in emissions of nitrous oxide corresponding to 34,000 tonnes of CO2 equivalents annually by 2010. A shorter period of exposure for spread manure has the greatest effect of 13,000 tonnes of CO2 equivalents annually20.
Ban on burning of strawThe purpose of the ban has been to reduce air pollution from burning of straw.
The ban has resulted in greater return of carbon to the soil and in-creased use of straw as a fuel. Both uses will result in a net reduction in CO2 emissions. Not burning straw prevents the methane and nitrous oxide emissions associated with the burning. On the other hand, there are some emissions of nitrous oxide
in connection with the return of ni-trogen to the soil when the straw is mulched.
The measure works by regulating behaviour, and the ban was intro-duced in 1989. The measure was implemented in the form of a statu-tory order under the Environmental Protection Act, and compliance is monitored by the local authorities.
The initiative has also caused in-creased carbon storage in the soil, but this has not been quantified so far.
4.3.4.3 CO2
Implemented measures
Energy consumption by agricultureThe green tax package and the grant scheme for energy savings in the business sector are resulting in en-ergy savings and thus a reduction in CO2 emissions from use of energy in agriculture.
BiogasBiogas from conversion of manure and organic waste has a number of advantages when used to substitute fossil energy – reductions in emis-sions of greenhouse gases, better exploitation of manure and manage-ment of waste18. The politically fixed supplement on the price of power production based on biogas has been adjusted several times during the last five years – most recently by the En-ergy Policy Agreement of 29 March 2004, which provides for support to biogas through a supplement on the price of electricity for biogas plants
139Denmark's Fourth National Communication on Climate Change
established before the end of 2008. It was estimated that this would lead to the establishment of 40 additional joint biogas plants. However, there are a number of barriers to building biogas plants that make it doubtful this goal can be reached. Therefore, the baseline projection only includes expansion of half this size – cor-responding to increased production of approx. 2 PJ biogas up to 2010. The increase will result in annual emissions being reduced by about 0.25 mill. tonnes CO2 equivalents/year. The reduction in methane and nitrous oxide emissions comprises about half of these effects. The oth-er half is due to reduced CO2 emis-sions from substitution of fossil fuels in energy supply.
Planting of windbreaksThe objective of planting wind-breaks is to reduce wind erosion and ensure greater biodiversity. Planting of windbreaks is supported under conditions described in the Statu-tory Order on subsidies for planting windbreaks and biotope-improving measures (Statutory Order no. 1101 of 12/12/2002). Support is granted under the EU Rural Districts Pro-gramme. Since the end of the 1960s about 1,000 km of tree-lined wind-breaks have been planted with gov-ernment subsidies. It is also estimat-ed that about 30% more has been planted without subsidies. Estimates indicate that planting of windbreaks leads to CO2 sequestration in woody biomass of about 130,000 tonnes CO2/year19.
ForestryForestry is important due to its CO2
and emissions being a consequence of trees growing, respiring and de-composing. An average Danish for-est contains a considerable store of CO2 absorbed from the atmosphere. When new forests are established, new CO2 stores are created. Affor-estation is therefore a useful climate policy instrument.
Calculating the total CO2 accu-mulation in forests is complicated. Almost all existing forests are es-tablished for wood production, e.g. logs and timber. Whether there are net emissions or net sequestration of CO2 from an existing forest de-pends on many factors, including its age and species distribution, and the management regime applied.
Compared with other sectors, for-estry has very low energy consump-tion. Green accounting and envi-ronmental management are being developed in the sector, partly with a view to determining whether the use of fossil fuels can be reduced.
The national forest programme in-cludes evaluation of the possibilities offered by the Kyoto Protocol for economically viable CO2 seques-tration in forests. Such measures should be implemented without undermining the Protocol’s envi-ronmental integrity or counteracting established measures in support of sustainable forest management. The same should also apply to forest projects in connection with CDM and JI. The forests are managed
140 Denmark's Fourth National Communication on Climate Change
with a view to multiple-use and sus-tainability, and carbon sequestration is one of several objectives. The po-litical goal with the most direct influ-ence on increased carbon sequestra-tion is the declaration of intent from 1989 to double the forested area in Denmark within 100 years.
Various measures have been taken towards achieving this goal. For in-stance, a government grant scheme has been establish that supports pri-vate afforestation on private agricul-tural land. Also, the state itself estab-lishes new forests, and some private individuals choose to establish forests on agricultural land without a gov-ernment grant.
Primarily the CO2 balance is af-fected by these measures. Forests raised on agricultural land accu-mulate far more biomass than the previous agricultural land-use. The forest biomass contains about 50% carbon, which is absorbed as CO2
through photosynthesis. Probably, additional carbon is stored in the organic matter in the soil due to a larger supply of dead organic matter and the absence of soil preparation. The effect of afforestation on other greenhouse gases, such as nitrous oxide and methane has not been properly clarified. However, the acidification of nitrogen-rich former agricultural land may stimulate the formation of nitrous oxide, and blocking of drains after afforestation and the resulting water stagnation could increase methane emissions. Increased methane and nitrous ox-ide emissions could counteract the
positive effect of afforestation on CO2 sequestration. However, since sufficient information is still unavail-able on changes in the methane and nitrous oxide emissions, analyses of the consequences are only carried out for CO2.
The Danish Forest and Nature Agency is responsible for policies on afforestation on private agricultural land and on state-owned land.
Afforestation on 12,000 hectares of privately owned farmland, cor-responding to additional binding of 131,000 tonnes of CO2, was subsi-dised in 1990-2004.
The state, counties, and municipali-ties have contributed approx. 6,400 hectares of new forest since 1990. Only little is known about private af-forestation without subsidies. It is as-sumed that about 600 ha are planted annually.
Both the subsidised private afforesta-tion and afforestation by public au-thorities will be less in the next 6-8 years, since the funds for this period have been allocated to international obligations in the nature area20.
The annual quantities of CO2 se-questrated as a consequence of sub-sidised private afforestation, public afforestation and the total afforesta-tion are summed up in Table 4.23.
Carbon sequestration in trees after afforestation is calculated by a sim-ple model. Sequestration is obtained as the planted area multiplied by the
141Denmark's Fourth National Communication on Climate Change
carbon absorption for the age class of the trees. The absorption is cal-culated by using Danish increment Tables for Norway spruce, as rep-resentative of conifers, and oak, as representative of deciduous trees21.
The areas in Table 4.23 for the period 1990-2001 are based on the evaluation of the afforestation pro-gramme carried out in the period22
together with a national forest in-ventory carried out recently23. The areas for 2005-2020 are based on a slightly revised projection24. Af-forested areas do not include planta-tions of Norman Christmas trees in short rotation on agricultural land.
The quantities of carbon are ob-tained by estimating the carbon content of the woody biomass us-ing relevant conversion factors. The stem biomass for conifers and the total above-ground woody biomass for deciduous trees are converted into total above-ground and below-ground biomass by multiplying with an expansion factor. An expansion factor of 2 is used, which is some-what higher than the expansion fac-tors used for forests planted before 1990 - 1.8 for conifers and 1.2 for deciduous trees. The reason for this is that the expansion factor depends on age.
The stem biomass thus constitutes a very small part of the total biomass in entirely young trees. The expan-sion factor therefore decreases expo-nentially towards a value between 1 and 2 as the trees grow older25.
Since there are neither Danish ex-pansion factors nor age-dependent expansion functions, the expansion factor of 2 is being used until better methodologies are available. The total biomass is subsequently con-verted into tonnes dry matter using the conversion factors 0.38 tonnes dry matter m-3 for conifers and 0.56 tonnes dry matter m-3 for decidu-ous trees26. The quantity of carbon is calculated by multiplying with the conversion factor 0.5 tonnes C/tonne dry matter. Carbon seques-tration in products can be included in the calculations, but the figures presented represent only the quan-tity of carbon that is sequestered in the forest ecosystem. This quantity of carbon is stored in the total liv-ing biomass (incl. roots) of the trees and in slash. The quantity of se-questered carbon is summed by the model for the different year classes of afforested areas since 1990, pro-viding the total carbon sequestration for the differently aged stands in specific years. Studies of soils in a time series of afforested stands have shown that, compared with the bio-mass carbon pool, there is no great change in the soil carbon pool dur-ing the first 30 years after afforesta-tion27. It is assumed in the models that the growth of the trees cor-responds to site index 2 (on a scale decreasing from 1 to 4), and that there is a ratio of 1 to 3 between the area afforested with conifers and de-ciduous trees28.
Afforestation offers many other ben-efits in addition to CO2 sequestra-tion. Besides being valuable for out-
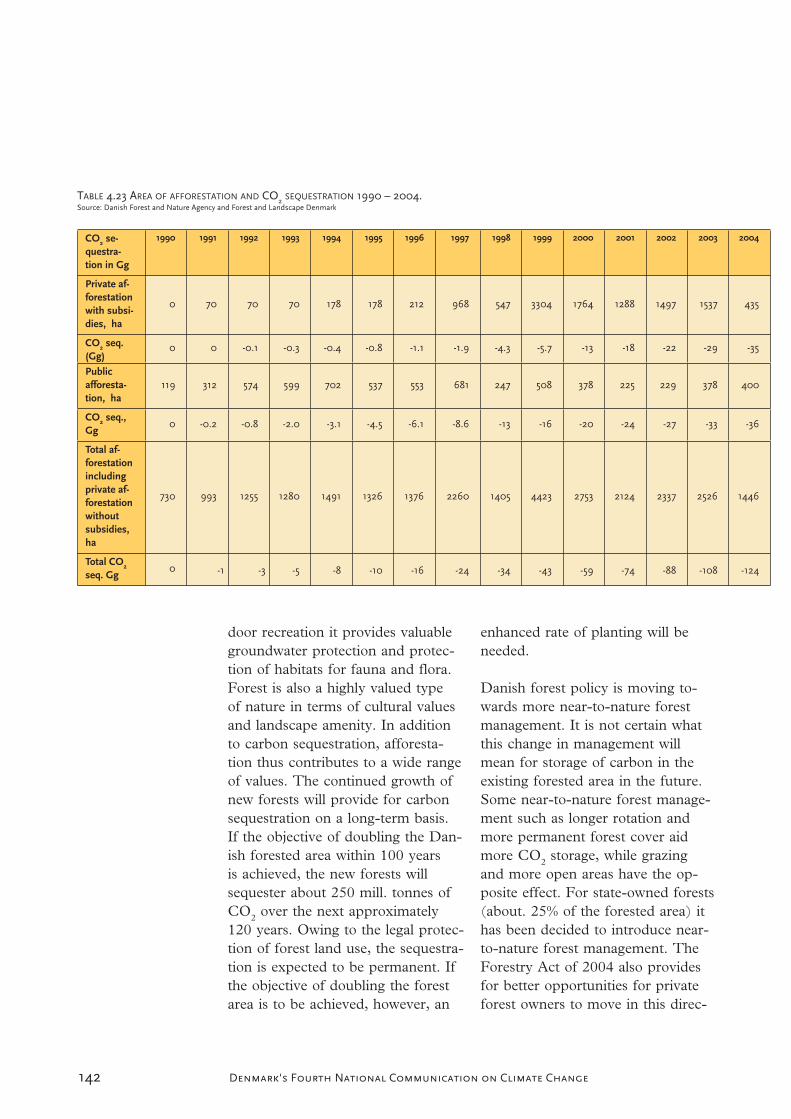
142 Denmark's Fourth National Communication on Climate Change
door recreation it provides valuable groundwater protection and protec-tion of habitats for fauna and flora. Forest is also a highly valued type of nature in terms of cultural values and landscape amenity. In addition to carbon sequestration, afforesta-tion thus contributes to a wide range of values. The continued growth of new forests will provide for carbon sequestration on a long-term basis. If the objective of doubling the Dan-ish forested area within 100 years is achieved, the new forests will sequester about 250 mill. tonnes of CO2 over the next approximately 120 years. Owing to the legal protec-tion of forest land use, the sequestra-tion is expected to be permanent. If the objective of doubling the forest area is to be achieved, however, an
enhanced rate of planting will be needed.
Danish forest policy is moving to-wards more near-to-nature forest management. It is not certain what this change in management will mean for storage of carbon in the existing forested area in the future. Some near-to-nature forest manage-ment such as longer rotation and more permanent forest cover aid more CO2 storage, while grazing and more open areas have the op-posite effect. For state-owned forests (about. 25% of the forested area) it has been decided to introduce near-to-nature forest management. The Forestry Act of 2004 also provides for better opportunities for private forest owners to move in this direc-
TABLE 4.23 AREA OF AFFORESTATION AND CO2 SEQUESTRATION 1990 – 2004.Source: Danish Forest and Nature Agency and Forest and Landscape Denmark
CO2 se-questra-tion in Gg
1990 1991 1992 1993 1994 1995 1996 1997 1998 1999 2000 2001 2002 2003 2004
Private af-forestationwith subsi-dies, ha
0 70 70 70 178 178 212 968 547 3304 1764 1288 1497 1537 435
CO2 seq. (Gg)
0 0 -0.1 -0.3 -0.4 -0.8 -1.1 -1.9 -4.3 -5.7 -13 -18 -22 -29 -35
Publicafforesta-tion, ha
119 312 574 599 702 537 553 681 247 508 378 225 229 378 400
CO2 seq., Gg
0 -0.2 -0.8 -2.0 -3.1 -4.5 -6.1 -8.6 -13 -16 -20 -24 -27 -33 -36
Total af-forestationincludingprivate af-forestationwithoutsubsidies,ha
730 993 1255 1280 1491 1326 1376 2260 1405 4423 2753 2124 2337 2526 1446
Total CO2
seq. Gg0 -1 -3 -5 -8 -10 -16 -24 -34 -43 -59 -74 -88 -108 -124

143Denmark's Fourth National Communication on Climate Change
tion. However, at the moment it is uncertain how far and how quickly this will happen.
FisheriesThe inventories of the total emis-sions and removals of greenhouse gases include the emissions of greenhouse gases from fuel sold for fishing vessels. The fishing vessels’ contribution to greenhouse gas emis-sions consist primarily of CO2. No special initiatives have been put in place concerning this, but the reduc-tion in the number of fishing vessels in recent years has also resulted in a reduction in fuel consumption and thus also in emissions of CO2.
4.3.4.4 Measures no longer in place and measures increasing greenhouse gases
Since Denmark’s Third National Communication to the Climate Con-vention in 2003, no measures limit-ing greenhouse gases have been dis-continued, nor have any measures increasing greenhouse gases been in-troduced within agriculture, forestry and fisheries. However, it should be noted that although it is positive to increase use of straw as a fuel for energy supplies in substitution for fossil energy, the amount of carbon returned and stored in the soil will be reduced at the same time. Re-moval of straw for energy purposes also seems to have negative effects for the fertility of soil29. Use of straw for energy increased from 0.72 mill. tonnes in 1990 to 1.2 mill. tonnes in 2002.
4.3.5 The domestic sector
96% of greenhouse gas emissions from households in 2003, corre-sponding to 4.1 mill. tonnes of CO2
equivalents, consisted of CO2. There are also small emissions of methane and even smaller emissions of ni-trous oxide. To this can be added emissions as a result of consumption of electricity and district heating. These emissions are included in the figures for producers and therefore they are also subject to quota regu-lation in the energy sector.
4.3.5.1 CO2
The consumption of energy by households, including electricity and district heating, is responsible for almost 30% of the total energy con-sumption in Denmark.
The largest part of the energy con-sumption is used for heating homes, where burning of oil and natural gas results in a CO2 emissions. A large part of the space heating is in the form of district heating (about 43% in 2003), which results in CO2
emissions in connection with the production of district heat. When district heat is produced at CHP plants or with CO2-friendly fuels, such as natural gas and, particularly, renewable energy, there are big CO2
savings overall from use of district heating instead of individual heat-ing based on, for example, oil-fired boilers.
Danish households also have a sub-stantial consumption of electricity. Most of the household consumption of electricity goes to household ap-
144 Denmark's Fourth National Communication on Climate Change
pliances and light sources, whereas less than 19% goes to electric heat-ing. Consumption for electric heat-ing has been decreasing in recent years as a consequence of the work of the Electricity Saving Trust, which has resulted in considerable conversion from electric heating to district heating and natural gas heat-ing.
Households’ disposal of waste also contributes to emissions of methane from landfill sites.
The action being taken on house-holds’ waste and transport consump-tion is described in the sections on waste and transport. This section therefore concentrates on the pos-sibilities of reducing the CO2 emis-sions through savings in electricity and heating in households and the possibilities for conversion to more environment-friendly forms of heat-ing. The possibilities for reduction in the public energy supply system are described in the section on the energy sector.
In 2003, the domestic sector used 157 PJ of energy for heating (cli-mate-corrected) and 32 PJ of electricity for appliances, etc. Con-sumption for heating has been quite constant for a number of years in spite of an increase in the number of households and in the area heated. The consumption of electricity for appliances, etc. has risen steadily since 1996. The increase in the con-sumption of electricity has, however, not been nearly as great as the in-crease in the number of appliances,
since these have become steadily more energy efficient.
Implemented measuresWith a view to reducing energy consumption and environmental impacts from the domestic sector, a wide range of initiatives have been launched, as described in Table 4.24 and Annex B1 in order to promote:
• Electricity savings,
• Savings in energy consumption in space heating, and
• Fuel conversion (from electric heating and the use of oil to district heating, natural gas, and the use of renewable energy).
Several concrete measures and in-centives are described below.
Energy taxesAll energy consumption for space heating as well as other energy con-sumption in households and the public sector, as well as non-VAT-registered businesses are subject to energy taxes. Throughout the 1990s CO2 and energy taxes have steadily increased. The increases have mainly affected households, helping to re-duce their energy consumption.
CO2 taxes All energy consumption in house-holds is subject to CO2 taxes.
Energy labelling of small buildingsMust be implemented on the sale of the building - primarily heating con-sumption. This applies in principle

145Denmark's Fourth National Communication on Climate Change
for all small buildings, apart from holiday homes etc.
Energy labelling of large buildings - ELOEnergy labels and an energy plan must be prepared regularly for all large buildings over 1,500 m2. In-cludes heating, water, and common electricity
Energy labelling of appliancesEnergy labelling (A-G) of white goods, lighting etc. is compulsory. There are also voluntary labelling schemes (Energy Star, Energy Ar-row, windows, boilers, electric mo-tors, ventilators) for a number of products.
The Danish Electricity Saving Trust - conversion of electricity/heatingSets up requirements for energy companies, negotiates and markets fixed-price agreements, advises cus-tomers, and grants subsidies.
The Danish Electricity Saving Trust - efficient appliancesPrepares market analyses and cam-paigns focusing on the price and ef-ficiency of energy appliances. Makes it simple, safe, and cheap to trade in an energy-appropriate manner.
DSM (electric gas and district heating).Organises campaigns and consumer-oriented activities. Particularly ex-tensive regarding electricity.
In the report on energy saving (En-ergispareredegørelsen) from May 2003, the government submitted a
number of proposals for new en-ergy-saving measures. Table 4.25 contains an overview of these meas-ures and a short progress report on implementation.
New measuresThe draft action plan for a renewed energy-saving effort includes a proposal for implementation of a number of measures in the domestic sector, including:
Tightening the energy-saving demands in building regulations by 25-30% from 2006.
Further tightening of energy demands by approx. 25% from 2010.
Abolishing mandatory linking and banning electric heating in new low-energy buildings.
Demands in building regulations for existing buildings in con-nection with major renovations, changes in heating systems, re-placement of boilers, windows and roofing.
Maintaining and further devel-oping an ambitious energy la-belling scheme for buildings.
Giving higher priority to interna-tional efforts concerning energy labelling and standards.
Promoting visualisation of en-ergy consumption and develop-ment of sophisticated energy meters.
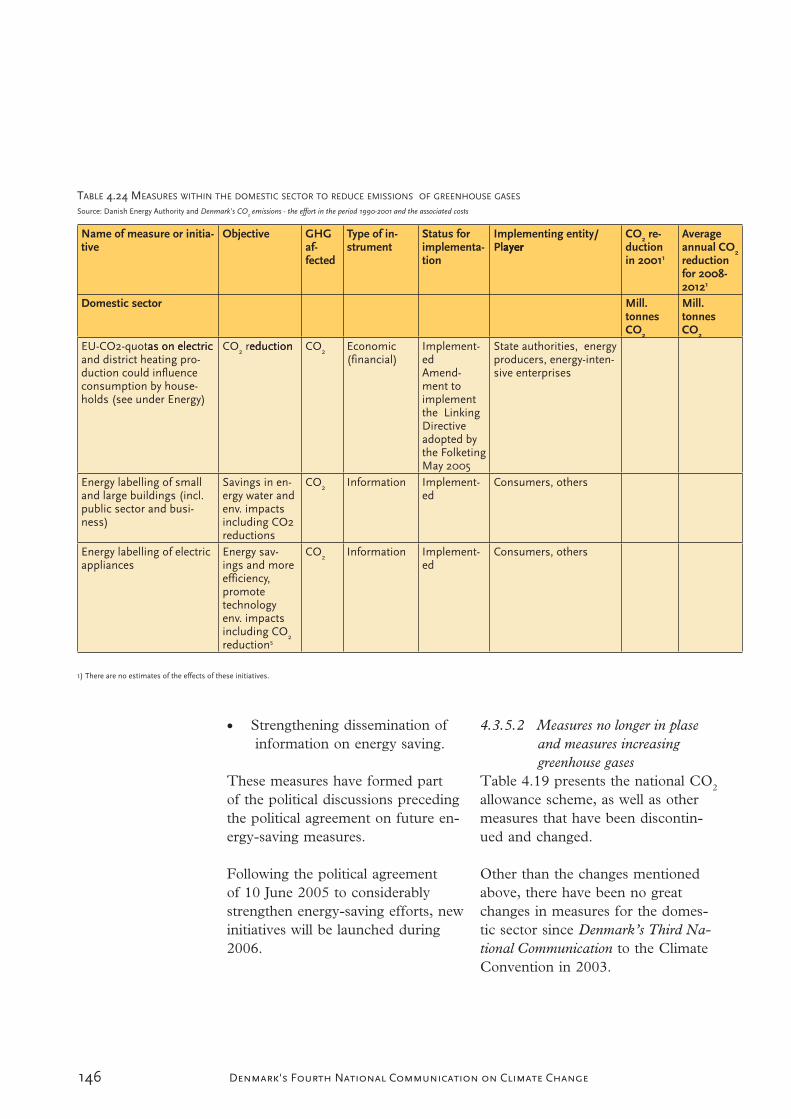
146 Denmark's Fourth National Communication on Climate Change
Strengthening dissemination of information on energy saving.
These measures have formed part of the political discussions preceding the political agreement on future en-ergy-saving measures.
Following the political agreement of 10 June 2005 to considerably strengthen energy-saving efforts, new initiatives will be launched during 2006.
4.3.5.2 Measures no longer in plase and measures increasing greenhouse gases
Table 4.19 presents the national CO2
allowance scheme, as well as other measures that have been discontin-ued and changed.
Other than the changes mentioned above, there have been no great changes in measures for the domes-tic sector since Denmark’s Third Na-tional Communication to the Climate Convention in 2003.
TABLE 4.24 MEASURES WITHIN THE DOMESTIC SECTOR TO REDUCE EMISSIONS OF GREENHOUSE GASES
Source: Danish Energy Authority and Denmark’s CO2 emissions - the effort in the period 1990-2001 and the associated costs
Name of measure or initia-tive
Objective GHGaf-fected
Type of in-strument
Status for implementa-tion
Implementing entity/Playerayer
CO2 re-ductionin 20011
Averageannual CO2reductionfor 2008-20121
Domestic sector Mill.tonnesCO2
Mill.tonnesCO2
EU-CO2-quotas on electricas on electricand district heating pro-duction could influenceconsumption by house-holds (see under Energy)
CO2 reductioneduction CO2 Economic (financial)
Implement-edAmend-ment toimplementthe LinkingDirectiveadopted bythe FolketingMay 2005
State authorities, energyproducers, energy-inten-sive enterprises
Energy labelling of smalland large buildings (incl.public sector and busi-ness)
Savings in en-ergy water andenv. impactsincluding CO2reductions
CO2 Information Implement-ed
Consumers, others
Energy labelling of electricappliances
Energy sav-ings and moreefficiency,promotetechnologyenv. impactsincluding CO2reductions
CO2 Information Implement-ed
Consumers, others
1) There are no estimates of the effects of these initiatives.

147Denmark's Fourth National Communication on Climate Change
4.3.6 Waste and sewage
The contribution of the waste sec-tor to greenhouse gas emissions consists primarily of methane from the decomposition of organic waste that takes place at landfill sites. Fol-lowing Denmark’s Third National Communication to the Climate Con-vention, statements of emissions of greenhouse gases from wastewater treatment have been prepared. Of total greenhouse gas emissions from the waste sector of just less than 1.5 mill. tonnes CO2 equivalents in 2003 – corresponding to 2% of total Dan-ish greenhouse gas emissions – the proportion from landfills was 79%, and the proportion from wastewater was 21%.
Please note that all incineration of waste in Denmark is associated with energy utilisation, which is why the emission of CO2 from the incinera-tion of plastic waste is included un-der the energy sector.
4.3.6.1 Methane, CH4
In previous years, efforts within the waste sector have been based on the Action plan for waste and recycling 1993-97, which included targets on waste treatment to the year 2000. The plan did not relate directly to the waste sector’s contribution to meth-ane emissions (CH4), but included a number of initiatives that are of relevance to waste products contai-ing industrial gases (HFCs and SF6), besides an objective concerning stop-ping landfilling combustible waste.
The previous government’s waste plan, Waste 21, which covers the
period 1998-2004, does not relate directly either to the waste sector’s possibilities for contributing to solu-tion of the problem of greenhouse gas emissions. The plan aimed at stabilising the total quantities of waste in 2004, and increasing recycling and reducing the environmental burden from the environmentally harmful substances in waste, including the in-
TABLE 4.25 OVERVIEW OF NEW INITIATIVES IN THE REPORT ON ENERGY SAVING
(ENERGISPAREREDEGØRELSEN) OF MAY 2003Source: Danish Energy Authority
Initiative Status
Promoting particularly en-ergy-efficient refrigeratorsand freezers
In 2004 and 2005, the Electricity Saving Trustreceived an extra DKK 20 mill. to make special ef-forts in this area. The campaign has started andis already showing good results.
Phasing-out traditionaldouble glazing - voluntaryagreement
In February 2004 a voluntary agreement wasmade with the glazing industry to phase out win-dows with poor energy qualities and promote en-ergy-efficient windows. As part of this agreement,the government has allocated DKK 20 mill. forcampaign activities etc. in 2004-2006. The firstcampaign was in autumn 2004.
Tightening building regula-tions
The proposal for new energy provisions in thebuilding regulations entered into force on 1 Janu-ary 2006. The requirements have been tightenedby 25-30% and a number of requirements forexisting buildings in connection with renovation,replacement etc. have been tightened.
Efficiency requirementsfor boilers and circulationpumps
In order to promote energy-efficient boilers, alabelling scheme has been established and anumber of training and campaign activities arebeing planned. Regarding pumps, the Electric-ity Saving Trust has entered into a voluntaryagreement with producers etc., and the gridcompanies have initiated campaigns to promoteenergy-efficient pumps in industry.
Reduction of standby con-sumption
In early 2004 an action plan was presented con-taining a number of initiatives to help realise partof the great potential in this area. In March 2005an international stand-by conference was held inCopenhagen.
Enhancement of researchand development activities
The framework for grid companies’ subsidy forR&D in energy efficiency was increased by DKK15 mill. to DKK 25 mill. per year from 2003.
148 Denmark's Fourth National Communication on Climate Change
The latest figures for waste in Den-mark are in the Danish EPA Waste Statistics 2003. Total waste in 2003 was 12,835,000 tonnes, of which 66% was recycled, 26% incinerated, and 8% landfilled.
Implemented measuresThe waste sector’s contribution to reduction of greenhouse gas emissions consists mainly in:
reducing landfilling of organic waste,
utilising gas from discontinued/existing landfill sites,
promoting oxidation of gas in landfill coverings,
increasing recycling of plastics, and
using waste as an energy source.
An overview of the concrete mea-sures implemented in the pursuance of these objectives is given in Table 4.26 and Annex B1.and Annex B1..
The emission of methane from Dan-ish landfills is calculated to have been 64,000 tonnes gross in 1990, increas-ing to a maximum of 68,800 tonnes in 1996, corresponding to 1.2 mill. tonnes of CO2 equivalents.
As a consequence of the ban on land-filling waste suitable for combustion, from 1 January 1997, methane emis-sions from Danish landfill sites will fall in the years ahead. The emission of methane in 2012 is, thus, calculat-
dustrial gases. With respect to waste incineration, the objective was to ad-just incineration capacity to what was absolutely necessary, to ensure best possible energy utilisation, maximum CO2 displacement and regional self-sufficiency. The plan thus contrib-uted indirectly to reduction of green-house gas emissions.
The objective in Waste 21 was for 64% of all waste to be recycled, 24% to be incinerated and not more than 12% landfilled.
That objective was already reached in the year 2000, and according to the Danish Environmental Protec-tion Agency’s Waste Statistics 2000 (ISAG). Total waste in that year amounted to about 12.8 mill. tonnes.
The current government’s waste plan, the Waste Strategy 2005-08, was issued in September 2003. The new Waste Strategy aims at decou-pling growth in waste amounts from economic growth. The Strategy also aims at preventing the loss of re-sources in waste and environmental impacts from waste, as well as better quality waste treatment and an ef-ficient waste sector. Finally, the gov-ernment is aiming at reducing waste amounts sent to landfill to 9% in 2008 and increasing recycling to 65% of all waste.
The most important initiatives re-garding greenhouse gases in the Strategy are improvement of landfills and increased collection of plastic packaging for recycling.

149Denmark's Fourth National Communication on Climate Change
ed to be 55,400 tonnes, correspond-ing to approx. 20% of the maximum in 1996.
According to the Danish Energy Authority’s inventory Biogas, Pro-duction, Forecast and Target Fig-ures, there were in all 25 landfill gas plants in Denmark in the autumn of 2002. These installations produced 10,000 tonnes of methane annually, compared to approx. 1,700 tonnes in 1993. In 2004, methane recovery from landfills amounted to 7,700 tonnes methane30. The same study shows that, through optimising exist-ing plants, a further 1,800 tonnes methane per year could be recovered over the next five years. Furthermore, the establishment of new gas-collec-tion equipment at five landfills could contribute an additional 1,300 tonnes methane per year over the next five years.
Optimisation of existing plant and establishment of new gas plants will, however, probably require subsidies. The previous subsidy scheme to pro-mote gas collection at landfills was discontinued at the end of 2001.
As a consequence of the new landfill-ing strategy, only a few biogas plants are expected to be established in the period up to 2012. The maximum quantity of methane recovered peak-ed in 1998 at about 13,200 tonnes. The quantity of methane recovered will continue to fall gradually over many years.
On the basis of the above, net emis-sions of methane (methane produced
less methane recovered) from Dan-ish landfill sites have been calculated at 63,500 tonnes in 1990, rising to 65,700 tonnes in 1993, and then fall-ing steadily to 50,700 tonnes in 2012. The average annual net methane emissions in 2008-2012 correspond to about 1.1 mill. tonnes CO2 equiva-lents.
The total quantity of waste inciner-ated rose from 2,216,000 tonnes in 1994 to 3,287,000 tonnes in 2003, i.e. an approximately 48% increase. The energy produced from the incin-eration plants is included as part of the renewable energy production in the Danish energy statistics. The in-ternational greenhouse gas inventories include greenhouse gases from in-cineration of the content of oil-based products, such as plastics in waste.
In accordance with the targets in En-ergy 21 and Waste 21, waste incin-eration plants are designed so as to optimise energy utilisation.
Besides the direct effect of waste management on greenhouse gas emissions, the emissions are also af-fected indirectly through recycling paper, cardboard, etc. which means less energy consumption and thus less CO2 emissions during produc-tion of new products. When organic material in domestic refuse is used in biogas plants and the methane produced is used in biogas motors, it is essential that emission of methane from these motors be reduced, either by use of new technologies or by af-terburning exhaust fumes.
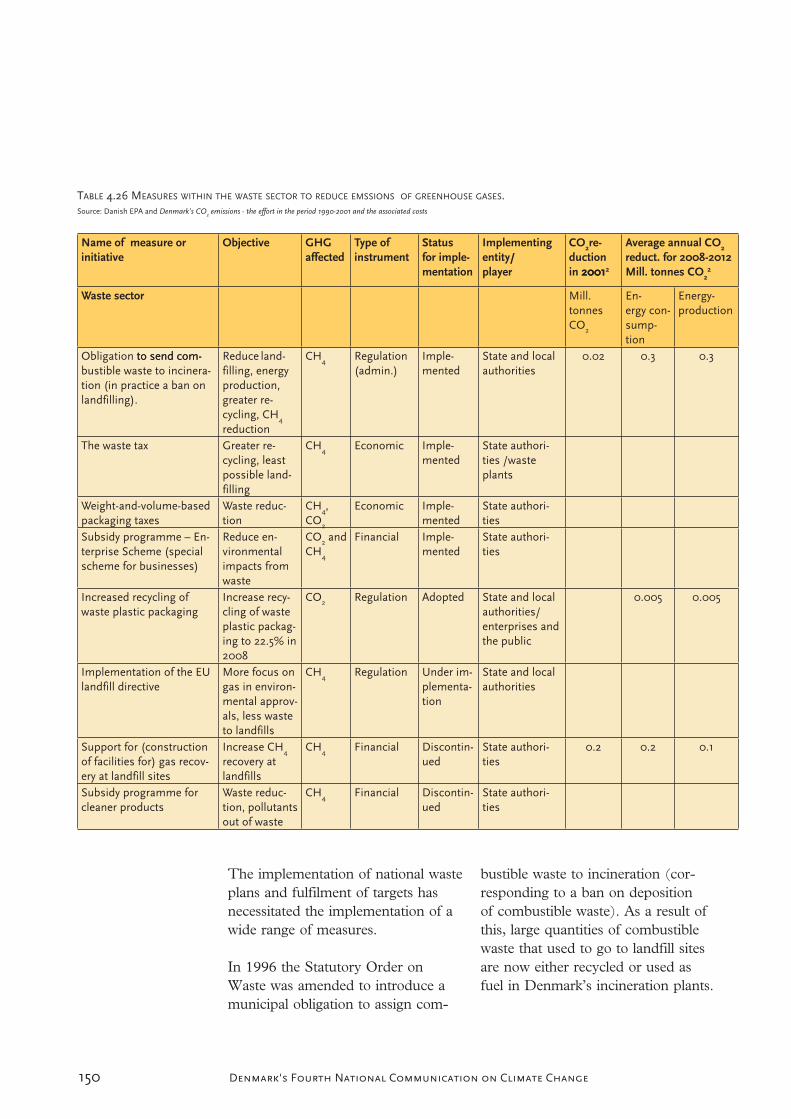
150 Denmark's Fourth National Communication on Climate Change
The implementation of national waste plans and fulfilment of targets has necessitated the implementation of a wide range of measures.
In 1996 the Statutory Order on Waste was amended to introduce a municipal obligation to assign com-
bustible waste to incineration (cor-responding to a ban on deposition of combustible waste). As a result of this, large quantities of combustible waste that used to go to landfill sites are now either recycled or used as fuel in Denmark’s incineration plants.
TABLE 4.26 MEASURES WITHIN THE WASTE SECTOR TO REDUCE EMSSIONS OF GREENHOUSE GASES.Source: Danish EPA and Denmark’s CO2 emissions - the effort in the period 1990-2001 and the associated costs
Name of measure or initiative
Objective GHGaffected
Type of instrument
Statusfor imple-mentation
Implementingentity/player
CO2re-ductionin 2001 20012
Average annual CO2
reduct. for 2008-2012Mill. tonnes CO2
2
Waste sector Mill.tonnesCO2
En-ergy con-sump-tion
Energy-production
Obligation to send com-to send com-bustible waste to incinera-tion (in practice a ban onlandfilling).
Reduce land-filling, energyproduction,greater re-cycling, CH4
reduction
CH4 Regulation(admin.)
Imple-mented
State and localauthorities
0.02 0.3 0.3
The waste tax Greater re-cycling, leastpossible land-filling
CH4 Economic Imple-mented
State authori-ties /wasteplants
Weight-and-volume-basedpackaging taxes
Waste reduc-tion
CH4,CO2
Economic Imple-mented
State authori-ties
Subsidy programme – En-terprise Scheme (specialscheme for businesses)
Reduce en-vironmentalimpacts fromwaste
CO2 andCH4
Financial Imple-mented
State authori-ties
Increased recycling ofwaste plastic packaging
Increase recy-cling of wasteplastic packag-ing to 22.5% in2008
CO2 Regulation Adopted State and localauthorities/enterprises andthe public
0.005 0.005
Implementation of the EUlandfill directive
More focus ongas in environ-mental approv-als, less wasteto landfills
CH4 Regulation Under im-plementa-tion
State and localauthorities
Support for (constructionof facilities for) gas recov-ery at landfill sites
Increase CH4
recovery atlandfills
CH4 Financial Discontin-ued
State authori-ties
0.2 0.2 0.1
Subsidy programme forcleaner products
Waste reduc-tion, pollutantsout of waste
CH4 Financial Discontin-ued
State authori-ties
151Denmark's Fourth National Communication on Climate Change
Besides the traditional regulation via legislation, statutory orders, and cir-culars, the waste sector is regulated by means of a range of policies and measures, including taxes and charg-es, grant schemes and agreements.
A tax on landfilling and incinerating waste was introduced in 1987. Since 1993 the tax has been differentiated to reflect the prioritisation of the dif-ferent forms of treatment. It thus costs most to deposit waste, less to incinerate it and nothing in tax to recycle it. The waste tax has been increased several times and it is now DKK 375 per tonne waste for land-filling and DKK 330 per tonne waste for incineration. The size of the tax thus provides an incentive to recycle as much of the waste produced as possible and to use non-recyclable, combustible waste as fuel in energy production instead of depositing it at a landfill site.
Weight-and-volume-based taxes (e.g. on various packaging, carrier bags and PVC film) encourage a reduction in packaging consumption and thus the quantities of waste. The weight-based tax is based on an index that reflects the environmental burden of the materials used.
Besides the waste tax, which the local authorities collect to finance public waste treatment, increasing use is being made of fees to finance, for ex-ample, return agreements for special waste fractions, including tyres and lead batteries. The fees are used in this context to finance collection and recycling of waste.
Under the grant programme Pro-gramme for Cleaner Products etc., grants are made for projects that reduce the environmental burden in connection with development, pro-duction, sale and use of products or in connection with the management of the waste generated during the product’s entire lifecycle. Further-more, support can be granted to waste projects aiming at reducing the problems of waste disposal. A total of about DKK 100 mill. was allocated for the 5-year period 1999 to 2003 for the part of the Programme related to waste.
In 2005 the Programme for Cleaner Products etc. was replaced by the Enterprise Scheme which refunds CO2 taxes to business. The waste part of the new programme is aimed exclusively at enterprises. A total of DKK 33 mill. for the four-year period from 2004 to 2007 has been earmarked for the waste part of the scheme. The subsidies are to be used to reduce the environmental impact of waste.
As a result of the EU Packaging Directive, collection of plastic pack-aging waste for recycling is to be increased to 22.5%, corresponding to an increase in recycling of about 11,000 tonnes plastic per year from 2008. This will be done through an amendment to the Statutory Order on Waste, which will require munici-palities to improve the possibilities of people and enterprises to separate and deliver plastic packaging waste for recycling.

152 Denmark's Fourth National Communication on Climate Change
On the basis of the EU Landfill Di-rective, demands on the arrangement and running of landfills have been tightened with Statutory Order No. 650 of 29 June 2001 on landfills. Ac-cording to the new regulations, waste-gas in landfills for mixed waste must be monitored. Gas from landfills where not insignificant amounts of bi-odegradable waste are landfilled must be managed in an environmentally-sound way or be used to produce electricity or for heating purposes.
According to the new regulations on landfilling, transitional plans must be prepared for all existing landfills, and the validating authority must re-assess the environmental conditions at the site and decide whether the facility is to comply with the new regulations or must close in 2009 at the latest.
The new regulations are expected to lead to:
a reduction in the number of landfill facilities,
a substantial increase in landfill-ing charges,
a further reduction in the annual volume of landfilled waste,
a new general requirement that waste must be characterised be-fore it is received for landfilling.
An amendment to the Statutory Or-der on Waste in 2000 means that mu-nicipalities must now assign non-re-cyclable waste PVC and impregnated wood to landfill. The objective is to
avoid adding PVC and impregnated wood to incineration with the conse-quential pollution of flue gas and slag. Moreover, landfills will receive more organic waste, and in the long term this will form methane during decom-position. Work is being carried out to develop new treatment methods in order to utilise the resources in waste. When these methods have been de-veloped and new plants established, it is expected that the Statutory Order on Waste will be amended so that PVC and impregnated wood is as-signed to these plants and landfilling is avoided.
It is not possible to make a quantita-tive estimate of the effects of the vari-ous measures for the waste area. The objectives in the national waste plans are related to waste amounts and their treatment. The developments are monitored through the annual waste statistics. However, changes in the treatment of waste cannot imme-diately be converted into changes in emissions of greenhouse gases.
New measuresThe Danish EPA has supported initiation of a development project aiming at documenting the oxida-tion of methane in landfill cover-ings. By ensuring optimal oxidation, methane emissions from landfills can be reduced, and if this can be documented it can be credited to the CO2 accounts. The project will be completed by the Technical Univer-sity of Denmark, provided funding can be attained from the EU LIFE Programme. Improved oxidation of landfill gas in coverings will be of in-

153Denmark's Fourth National Communication on Climate Change
terest to landfills with relatively low gas production so that it is unprofit-able to use the gas as well as landfills where not all gas production can be utilised.
4.3.6.2 Measures no longer in place and measures increasing greenhouse gases
As stated in Table 4.26 the subsidy programme for gas retrieval at land-fill sites and the subsidy programme for cleaner products have been dis-continued.
The requirement to assign impreg-nated wood to landfilling could lead to an increase in the amount of bio-degradable waste and therefore in-creased emissions of methane. Addi-tional contributions from this source will, however, be modest in relation to the overall amount of methane from landfills.
4.4 POLICIES AND POLITICAL MEASURES
IN GREENLAND FOR THE ENERGY
AREA
Greenland is facing new and great challenges, partly because of the country’s increasing energy con-sumption and the increasing oil prices, and partly because global climate change is especially affecting the Arctic and threatens Greenland’s way of life and hunting culture. Greenland has a global obligation to live up to the Climate Convention and the Kyoto Protocol. Greenland will work to promote use of renew-able and environmentally friendly energy (water, wind power, solar
energy, hydrogen) which in the long term will reduce CO2 emissions and make Greenland less dependent on fossil fuels. The goal is to achieve the greatest financial and energy savings, to reduce the vulnerability of energy supply through utilisation of renewable energy and make the production and supply system more efficient. Work with environmentally friendly energy supply should be encouraged so that Greenland con-tributes to mitigating global climate change.
Until the publication of the Green-land Energy Plan 2010 in 1995, the requirement for security of supply and the energy policy guidelines from 1986 meant that the main fo-cus of was to be hydropower as one of the all-important energy policy objectives in Greenland.
With Energy Plan 2010, for the first time the Home Rule presented a complete review of the energy sector and an action plan for its develop-ment and set up a more differenti-ated main energy policy objective of “establishing an energy supply that does not compromise security of supply and that ensures the least possible economic and environmen-tal burden for society and the other energy players”.
Both before and since 1995, policies and measures have been adopted and implemented in the energy sec-tor that have reduction of green-house gas emissions as one, al-though not in most cases the main, objective.

154 Denmark's Fourth National Communication on Climate Change
Some of the most important meas-ures are described below.
Act on Energy SupplyWith adoption by the Landsting of the Act on Energy Supply in 1997, for the first time Greenland got leg-islation dealing with energy supply in a broad perspective, since it covers electricity, heat and fuel supply. At the same time, it is the first time that energy efficiency improvement and energy savings have been covered by legislation. This Act confirms En-ergy Plan 2010’s main objective of promoting the most economic and environment-friendly energy supply. It is stated in the Act that energy supply must be planned with a view to economising and saving in energy consumption, the highest possible level of security of energy supply, ef-ficient improvements in the produc-tion and supply system and cleaner energy production.
Use of hydropower for energy supplySince the 1970s the Home Rule has been interested in using hydropower for energy supply. Up through the 1970s and 1980s systematic studies of possible hydropower potentials were carried out. With the presenta-tion of the energy policy guidelines in 1986, it was agreed that hydro-power should be a bearing element of the future energy supply system. The first hydropower plant, taken into use in 1993, supplies Nuuk with electricity. Since it was commis-sioned, the plant has resulted in an annual saving of more than 20,000 m3 oil, which has resulted in a re-duction in CO2 emissions of around
55,000 tonnes, or about 10% of the total CO2 emissions in Greenland.
A hydropower plant to supply Tasii-laq commenced operation in 2005, with an expected oil saving of 1,300 m3, corresponding to 3,446 tonnes CO2 per year. A small hydropower plant in South Greenland is now un-der construction to supply Qaqortoq and Narsaq. When it starts operation in early 2008, it is expected to con-tribute with displacement of oil cor-responding to 4,800 m3.
Waste incinerationWaste incineration plant has been established at the six largest towns, and these together cover about 70% of the population. Moreover, a number of small waste incineration plants have been built in settlements with waste disposal as the main ob-jective.
At all six incineration plants in set-tlements, some of the surplus heat from the incineration process is used for district heating.
Waste incineration to some extent replaces fuel oil for heating and re-duces methane emissions that would otherwise occur if the waste were deposited at landfill sites.
Sector Programme for Renovation with an Environment and Energy Improving Effect in Greenland 2000-2003In 1999 the Home Rule and the Danish State entered into an agree-ment on renovation of buildings and supply plants. The agreement covered renovation projects with a

155Denmark's Fourth National Communication on Climate Change
positive environmental and energy effect. The objective of the Sector Programme is to ensure that the ex-traordinary renovation efforts focus on environment and energy aspects, not only for the benefit of the local environment, but also for the benefit of the Arctic and global environ-ment.
Projects carried out under the Pro-gramme include renovation of elec-tricity and heat production plants, including supply grids, revision of the building regulations, renovation of buildings, preparation of a new energy plan and behaviour-regulat-ing measures.
As much electricity in Greenland is still produced by diesel-powered generators, there will be a directly measurable environmental effect through a reduction in electricity consumption and thus in electricity generation. This reduction can be achieved partly through electricity saving measures in the production process, and the distribution grid, and at the consumer. Better energy exploitation of electricity production through renovation and establishing CHP plants will reduce fuel con-sumption in boiler plants.
The Sector Programme is being concluded. Outstanding points are primarily within aquatic issues. In 2003 an interim evaluation of the Programme was carried out in which a total reduction of more than 3,900 tonnes CO2 was calculated as a result of less consumption of ener-gy, as described in Table 4.27. The
calculation was done on the basis of basic information from the Danish Energy Authority energy statistics and builds on a conversion of the reduction to Giga Joules. Gas oil and diesel have also been assumed.
4.5 MEASURES FOR THE FAROE
ISLANDS
The Climate Convention was rati-fied by the Realm, and therefore it also applies for the Faroe Islands. The Faroese have not yet formu-lated an actual Climate Strategy or energy policy.
However, after the last general elec-tion on 20 January 2004 the home rule government agreed to a state-ment of intent on the energy area, which included the following:
- Overall energy policy is a na-tional political responsibility.
- The oil administration and the municipalities are to prepare an electricity supply act.
- Energy development should con-sider nature and the environ-ment.
- Renewable energy sources should comprise as large a pro-portion of total energy produc-tion as possible.
- Cooperation with respective authorities on R&D regarding renewable energy is to be pro-moted.

156 Denmark's Fourth National Communication on Climate Change
- Use of energy-saving products is to be promoted.
It is also intended to set up a work-ing group to prepare a proposal for an energy policy action plan by June 2006. The work should emphasise describing conditions such as future energy needs, security of supply, renewable energy, initiatives and tools for energy savings, structure and competition, nature and envi-ronmental considerations as well as economic reserves. At Energikonfer-ence 78 (energy conference 78) there was a proposal to reduce oil imports for onshore use by at least 25% per capita over a ten-year period and to adapt the fishing fleet to the least possible energy consumption in rela-tion to catches.
Renewable energy was less than 5% of total energy supplies on the Faroe Islands in 2003. However, there is unexploited potential, especially in wind and wave power.
Oil consumption has increased from less than 4 to 5 MWh/capita, with a slight drop up to 1994. In 2002 hydropower was 40.1% of electric-ity production. Electricity supply on the Faroe Islands is carried out by the supply company SEV, which is owned by the Faroese municipalities jointly. It has recently been decided that a third party should have access to the SEV supply grid, and this will break the monopoly.
The Faroe Islands work with NERI on the annual inventory of green-house emissions for the Climate
Convention. In the latest inventory of April 2005, total greenhouse gas emissions from the Faroe Islands were calculated at 0.843 mill. tonnes CO2 equivalents. It is vital that the statistics are prepared and the co-operation on the annual emissions inventories and other information for the Climate Convention continues and grows so that the Realm can meet its commitments under the Cli-mate Convention.
In connection with ratification of the Kyoto Protocol by the Realm, there was a territorial reservation for the Faroe Islands as the government did not accede to the Protocol entering into force for the Faroe Islands.
It is planned that the territorial reser-vation for the Faroe Islands regard-ing the Kyoto Protocol should be debated again by the Faroese parlia-ment during autumn 200531.
4.6 SUPPLEMENTARY INFORMATION UN-DER THE KYOTO PROTOCOL
4.6.1 The national registry
BackgroundDenmark’s national allowances reg-istry and other EU Memberstates national allowances registers are part of the EU emissions trading scheme, which entered into force on 1 Janu-ary 2005. From 1 January 2008 the EU ETS will be included in the in-ternational emissions trading system under the Kyoto Protocol. Dan-mark’s national registry is therefore
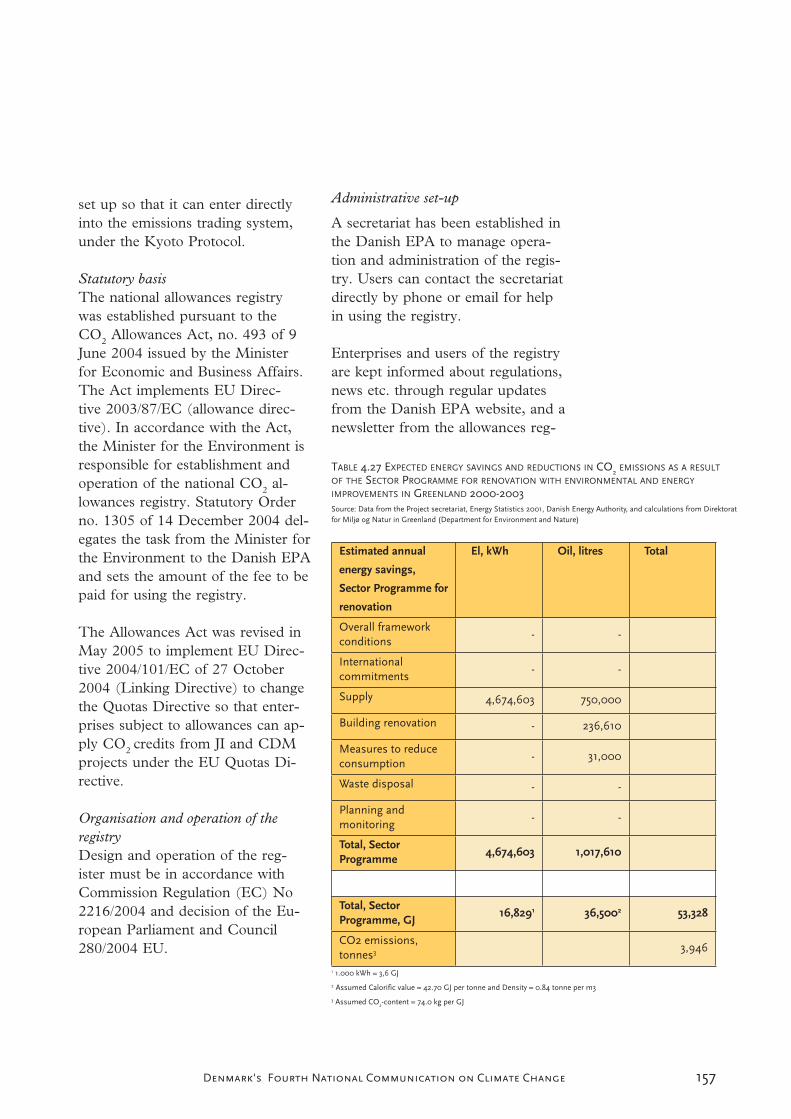
157Denmark's Fourth National Communication on Climate Change
set up so that it can enter directly into the emissions trading system, under the Kyoto Protocol.
Statutory basisThe national allowances registry was established pursuant to the CO2 Allowances Act, no. 493 of 9 June 2004 issued by the Minister for Economic and Business Affairs. The Act implements EU Direc-tive 2003/87/EC (allowance direc-tive). In accordance with the Act, the Minister for the Environment is responsible for establishment and operation of the national CO2 al-lowances registry. Statutory Order no. 1305 of 14 December 2004 del-egates the task from the Minister for the Environment to the Danish EPA and sets the amount of the fee to be paid for using the registry.
The Allowances Act was revised in May 2005 to implement EU Direc-tive 2004/101/EC of 27 October 2004 (Linking Directive) to change the Quotas Directive so that enter-prises subject to allowances can ap-ply CO2 credits from JI and CDM projects under the EU Quotas Di-rective.
Organisation and operation of the registryDesign and operation of the reg-ister must be in accordance with Commission Regulation (EC) No 2216/2004 and decision of the Eu-ropean Parliament and Council 280/2004 EU.
Administrative set-up
A secretariat has been established in the Danish EPA to manage opera-tion and administration of the regis-try. Users can contact the secretariat directly by phone or email for help in using the registry.
Enterprises and users of the registry are kept informed about regulations, news etc. through regular updates from the Danish EPA website, and a newsletter from the allowances reg-
TABLE 4.27 EXPECTED ENERGY SAVINGS AND REDUCTIONS IN CO2 EMISSIONS AS A RESULT
OF THE SECTOR PROGRAMME FOR RENOVATION WITH ENVIRONMENTAL AND ENERGY
IMPROVEMENTS IN GREENLAND 2000-2003Source: Data from the Project secretariat, Energy Statistics 2001, Danish Energy Authority, and calculations from Direktoratfor Miljø og Natur in Greenland (Department for Environment and Nature)
Estimated annual
energy savings,
Sector Programme for
renovation
El, kWh Oil, litres Total
Overall frameworkconditions
- -
Internationalcommitments
- -
Supply 4,674,603 750,000
Building renovation - 236,610
Measures to reduceconsumption
- 31,000
Waste disposal - -
Planning andmonitoring
- -
Total, SectorProgramme
4,674,603 1,017,610
Total, SectorProgramme, GJ
16,8291 36,5002 53,328
CO2 emissions,tonnes3 3,946
1 1.000 kWh = 3,6 GJ
2 Assumed Calorific value = 42.70 GJ per tonne and Density = 0.84 tonne per m3
3 Assumed CO2-content = 74.0 kg per GJ

158 Denmark's Fourth National Communication on Climate Change
istry. The newsletter will be issued quarterly or as required and will explain about new regulations and opportunities as well as any planned temporary closures (for updates etc.).
Registry softwareThe Danish EPA has entered into a licensing agreement with the UK Department for Environment, Food and Rural Affairs, DEFRA on pur-chasing registry software. The Cen-tre for Corporate Management un-der the Danish Ministry of the Envi-ronment is responsible for technical operation of the registry software.
Further information on the Danish national CO2 allowances registry is in Annex D.
4.6.2 SupplementaritySupplementarityAccording to the Kyoto Protocol, the use of the mechanisms in Articles 6 (JI), 12 (CDM) and 17 (IET) of the Protocol must serve as a supplement to domestic action to reduce green-house gas emissions. The reason for this is that action in the Annex I countries drives technological devel-opment and is also consistent with the agreement that Annex I countries must lead the way in efforts to re-duce global emissions.
The formulation used in the Pro-tocol (“..supplemental to domestic action..”) is not further qualified and no specific requirements are laid down regarding how large a propor-tion of the total national reduction objective may be fulfilled using flex-
ible mechanisms. The Marrakech Accord stipulated that “...the use of mechanisms shall be supplemental to domestic action and that domestic action shall thus constitute a signifi-cant element of the efforts made by each Party...”.
Effects of Denmark’s efforts 1990-2001As indicated in section 4.1.4, Den-mark has in 2005 completed an analysis of the impact of selected implemented measures on green-house gas emissions in the period 1990-2001. According to this Effort Analysis, the total effect of the meas-ures under consideration is approx. 20.6 mill. tonnes annually in the period 2008-2012. But since Danish electricity production is integrated into the Northern European electric-ity market, this effect is expected to be partially offset by 5 mill. tonnes annually between 2008-12 due to in-creased electricity exports. Emissions on Danish soil are therefore expect-ed to be approx. 15.6 mill. tonnes CO2 lower than if the measures con-sidered had not been implemented.
Compared to the emissions in Den-mark in 2008-2012 that were expect-ed previously in the 2003 baseline projection, if no policies or measures had been implemented, Denmark would have fallen short by 40.7 mill. tonnes CO2 annually in 2008-2012.
However, the total climate effect of the calculated measures is approx. 21 mill. tonnes.
Since 2001, the last year covered by the Effort Analysis, other significant
159Denmark's Fourth National Communication on Climate Change
climate measures have been imple-mented, and in particular the EU’s common CO2 quota scheme.
4.6.3 Denmark’s climate efforts – a step on the way to sustainable development
As mentioned above, the govern-ment’s National Strategy for Sus-tainable Development in Denmark, A SHARED FUTURE - balanced development was adopted by the Folketing in June 2002.
In this strategy, the government lists eight objectives and principles for creating sustainable development:
1. The welfare society must be de-veloped and economic growth must be decoupled from envi-ronmental impacts.
2. There must be a safe and healthy environment for every-one, and we must maintain a high level of protection.
3. We must secure a high degree of bio-diversity and protect eco-systems.
4. Resources must be used more efficiently.
5. We must take action at an inter-national level.
6. Environmental considerations must be taken into account in all sectors.
7. The market must support sus-tainable development.
8. Sustainable development is a shared responsibility and we must measure progress.
The strategy is built up with a number of sectors: food production, forestry, industry, transport, energy, urban and housing development, and intersectoral action: climate change, biodiversity, environment and health, resources and resource efficiency, knowledge and policies and measures, the global dimension and public participation.
In order to follow developments in relation to the strategy, regular in-dicator reports are prepared. The indicator reports contain 14 key indicators - including indicators for economic growth, greenhouse gas emissions, air pollution, employ-ment and discharge of nutrients to the marine environment. In addi-tion, the trend in a wide range of more specific indicators is being monitored. Examples of these indi-cators are the incidence of asthma, the thickness of the ozone layer, by-catches of porpoises, the amount of PCB in cod liver and the number of organic farms.
The conclusion in the most recent indicator report of April 2005 is that in a number of areas, Denmark is on the right course in work for more sustainable development, as amongst other things the indicators show de-coupling between economic growth and energy consumption, and the

160 Denmark's Fourth National Communication on Climate Change
number of ecolabelled products is increasing. In other areas there re-main challenges. For example it is still important to reduce emissions of greenhouse gases from transport work and business to classify chemi-cals still needs to be intensified.
4.6.4 Efforts for international air transport and shipping
Denmark is fully aware of impor-tance of reducing greenhouse gas emissions from both aviation and shipping. Denmark will therefore continue to promote the issue in international organisations through Danish support to the EU work on the subject in the ICAO and IMO. Denmark also supports internal EU strategies, to secure progress. For ex-ample there is the EU’s Sixth Envi-ronment Action Programme, the EU strategy for reduction of emissions of air pollutants from ships at sea etc.
In addition, Denmark has an overall wish to secure knowledge-building on aircraft and shipping emissions of greenhouse gases. In this connection Denmark used its EU Presidency in 2002 to initiate a study of EU Mem-ber States on emissions of green-house gases from aviation, and to support streamlining of the coopera-tion structure amongst EU countries in the area.
4.6.5 Efforts to limit adverse effects in other countries
In connection with Denmark’s con-tribution to international climate ef-forts, in accordance with the Kyoto Protocol Denmark will endeavour to implement policies and measures un-
der article 3 of the Protocol in such a way that adverse effects in other countries are minimised. However, Denmark does not consider that its contributions to international climate efforts have adverse effects in other countries as, on the contrary, the re-duction of emissions of greenhouse gases in Danish commitments under the Protocol will in fact contribute to limiting dangerous climate change in all countries.
If nothing is done to limit emissions of greenhouse gases, climate sce-narios from the IPCC indicate that developing countries in particular will experience the greatest changes in climate.
In its international efforts, Denmark will therefore continue to take the greatest possible account of special needs and concerns of developing countries and especially least devel-oped countries. This also applies to adverse effects which can already be ascertained from changes in the climate. The existing strong Dan-ish focus on the special vulnerability of developing countries to climate change underlines this (see section 7.5).
4.6.6 Legislation, enforcement and administrative procedures for implementation of the Kyoto Protocol
Section 2.1.1 briefly describes the Danish system of government. The legal basis for the division of powers into the legislative, executive, and ju-dicial power is the Danish Constitu-tion, Danmarks Riges Grundlov32.
161Denmark's Fourth National Communication on Climate Change
The Constitution includes the legal basis for how the Regent acts on be-half of the Realm in international af-fairs, and he cannot act without the consent of the Folketing in any way that increases or restricts the area of the Realm, or enter into obligations requiring cooperation of the Folket-ing or which in some other way are of great significance to the Realm. Neither can the Regent, without the consent of the Folketing, cancel an international agreement entered into with the consent of the Folketing.
On the motion of the government, the Folketing thus gave its con-sent in 2002, allowing Her Majesty Queen Margrethe the Second, on behalf of the Realm and with ter-ritorial reservations for the Faroe Islands, to ratify the Kyoto Protocol. This was on 31 May 2002.
Denmark’s implementation of the Kyoto Protocol is on-going and is being effectuated by following up on the national Climate Strategy, sector-policy strategies with climate considerations, and concrete initia-tives, which will contribute to lim-iting or reducing greenhouse gas emissions, and implementation of the other parts of the Kyoto Proto-col. The legislation necessary to do this has been adopted in pursuance of the Constitution regulations con-cerning legislative powers.
Pursuant to the Constitution, the Regent is the ultimate authority, cf. paragraphs 12-14:
“12. Subject to the limitations laid down in this Constitutional Act, the King shall have supreme authority in all the affairs of the Realm, and shall exercise such supreme author-ity through the Ministers.
13. The King shall not be answer-able for his actions; his person shall be sacrosanct. The Ministers shall be responsible for the conduct of government; their responsibility shall be defined by statute.
14. The King shall appoint and dismiss the Prime Minister and the other Ministers. He shall decide upon the number of Ministers and upon the distribution of the duties of government among them.The signature of the King to resolutions relating to legislation and govern-ment shall make such resolutions valid, provided that the signature of the King is accompanied by the signature or signatures of one or more Ministers. A Minister who has signed a resolution shall be responsi-ble for the resolution.”
With this background, the Regent delegates responsibility for various functions to government ministers through Royal resolutions. This makes the various ministers for dif-ferent areas responsible for, e.g. making proposals for new/amended legislation made necessary by the Kyoto Protocol, enforcement of leg-islation and initiation of necessary administrative procedures.
The total set of regulations can be accessed via Retsinformation34 (on-

162 Denmark's Fourth National Communication on Climate Change
line legal information system). An-nex B1 contains, as far as possible, reference to the specific legal basis for each of the concrete measures dealt with in Chapter 4. Legislation concerning measures of importance to Denmark’s commitments under the Kyoto Protocol will be enforced pursuant to the current legal basis, including pursuant to any penalty clause. Enforcement could also in-volve the judicial power.
As regards the institutional arrange-ments for the implementation the Kyoto Protocol concerning activities in connection with participation in the mechanisms under articles 6, 12, and 17 of the Kyoto Protocol and establishment and operation of a national allowance registry, the gen-eral delegation of tasks is as follows, although the Danish EPA also has activities concerning the CDM:
JI and the national register:Danish EPA under the Ministry of the Environment
CDM:Ministry of Foreign Affairs
The Danish Energy Authority under the Ministry of Transport and En-ergy is responsible for legislation and administration concerning the EU Quotas Directive.
4.6.7 Strategies to mitigate climate change cf. article 10(b) of the Kyoto Protocol
Denmark’s Climate Strategy and measures to mitigate climate change are described in sections 4.1-4.3.
163Denmark's Fourth National Communication on Climate Change
Notes1 Denmark’s Greenhouse Gas Projection until
2012, an update including preliminary projec-tion until 2017, December 2002, Jørgen Fenham,UNEP centre.
2 Difference between 20 and 25 mill. tonnes ofCO2 equivalents, depending on the outcome theEU’s final setting of the individual EU countries’reductions, which is to take place in 2006, in-cluding consideration for Denmark’s correctionto the import of electric power in the base year1990.
3 Denmark’s CO2 emissions - the effort in theperiod 1990-2001 and the associated costs,Report from the Danish EPA, No. 2, April 2005(Main report http://www.mst.dk/udgiv/publika-tioner/2005/87-7614-587-5/pdf/87-7614-588-3.pdfand Annex report:http://www.mst.dk/udgiv/pub-likationer/2005/87-7614-589-1/html).
4 http://www.mst.dk/transportuk/pdf/NAPeng.xls5 http://www.mst.dk/transport/01100000.htm,6 Energy taxation in Denmark is described in detail
in the report Energy policies of IEA Countries– Denmark 2002 (pp. 27-33) published by the IEA( International Energy Agency ) in 2002.
7 The report ”Omlægning af registreringsafgiften- Rapport fra arbejdsgruppen om en omlægn-ing af registreringsafgiften” (Restructuring ofregistration tax – the working group’s report),Ministry of Taxation, April 2003, available in Dan-ish on: http://www.skat.dk/public/dokumenter/publikationer/registreringsafgift/bilbeskatning_april2003.pdf .
8 An overview of simplifications carried out andplanned is available in Danish on http://www.skat.dk/publikationer/projekter/forenkling/3577.html
9 Under the Kyoto Protocol, Denmark’s base yearis 1990 for CO2, methane and nitrous oxide,whereas 1995 will be chosen as base year for theindustrial gases (HFCs, PFCs, and SF6) cf. Article3.8 of the Protocol.
10 Under the Kyoto Protocol, the LULUCF categoryis dealt with separately under Articles 3.3 and 3.4.Since effects of afforestation must be included asa contribution to fulfilling the reduction target,according to Article 3.3, these are also includedhere. Since it is optional to include effects ofactivities under Article 3.4 and Denmark has notyet made a decision on this, these effects areexcluded here.
1 More information at www.ens.dk/sw15966.asp12 Olesen et al., 200413 Mikkelsen et al., 2005: Mikkelsen, M.H., Gylden-
kærne, S., Poulsen, H.D., Olesen, J.E. & Sommer,S.G. (2005). Opgørelse og beregningsmetode forlandbrugets emissioner af ammoniak og drivhus-gasser 1985-2002. Arbejdsrapport fra DMU Nr.204. (in Danish).
14 Olesen et al., 2004: Olesen, J.E., Petersen, S.O.,Gyldenkærne, S., Mikkelsen, M.H., Jacobsen,B.H., Vesterdal, L., Jørgensen, A.M.K., Chris-tensen, B.T., Abildtrup, J., Heidmann, T. &Rubæk, G. (2004). Jordbrug og klimaændringerJordbrug og klimaændringer- samspil til vandmiljøplaner. DJF rapport Mark-brug nr. 109. (in Danish).
15 Olesen, 2005: Olesen, J.E. (2005). Mulighederfor reduktion af drivhusgasemissioner i jord-bruget. I: Olesen, J.E. (red). Drivhusgasser frajordbruget - reduktionsmuligheder. DJF rapportMarkbrug nr. 113, s. 12-32. (in Danish).
16 Grant et al., 2000: Grant, R., Blicher-Mathiesen,G., Jørgensen, V., Kyllingsbæk, A., Poulsen, H.D.,Børsting, C., Jørgensen, J.O., Schou, J.S., Kristen-sen, E.S., Waagepetersen, J. & Mikkelsen, H.E.(2000). Vandmiljøplan II - midtvejsevaluering.Miljø- og Energiministeriet, Danmarks Miljø-undersøgelser, Silkeborg, Denmark. 65 pp (inDanish).
17 Olesen et al., 2001: Olesen, J.E., Andersen,J.M., Jacobsen, B.H., Hvelplund, T., Jørgensen,U., Schou, J.S., Graversen, J., Dalgaard, T. &Fenhann, J. (2001). Kvantificering af tre tiltag tilreduktion af landbrugets udledning af drivhus-gasser. DJF-rapport Markbrug 48. (in Danish).
18 Sommer et al., 2004: Sommer, S.G., Petersen,S.O. & Møller, H.B. (2004). Algorithms for cal-Algorithms for cal-culating methane and nitrous oxide emissionsfrom manure management. Nutrient Cycling inNutrient Cycling inAgroecosystems 69, 143-154.
19 Gyldenkærne et al, 2005: Gyldenkærne, S., Mü-nier, B., Olesen, J.E., Olesen, S.E., Petersen, B.M.& Christensen, B.T. (2005). Opgørelse af CO2-emissioner fra arealanvendelse og ændringer iarealanvendelse. Arbejdsrapport fra DMU (underpreparation,, in Danish).
20 Nature, 2000.21 Møller, 193322 Forest and Nature Agency, 200023 Larsen and Johannsen, 200224 Danish Energy Authority, 200125 Schöne and Schulte, 199926 Moltesen, 198827 Vesterdal et al., 200228 More information on the methods can be ob-
tained from the Danish Energy Authority, 2001,and Vesterdal, 2000.
29 Christensen, 200230 Willumsen, 200431 Minister for the Interior (and Environment)
Jógvan við Keldu’s in an interview with the Dan-ish Broadcasting Corporation (DR) on 30 March2005 (http://www.dr.dk/p1/morgen/tidligere.asp?action=showarticle&id=39462, P1, 30. marts2005, 07.10-08.00, 8:15-13:20) (in Danish)
32 The Danish Constitution (Danmarks RigesGrundlov) ( http://www.retsinfo.dk/_GETDO-CI_/ACCN/A19530016930-REGL /: http://www.folketinget.dk/pdf/constitution.pdf )
34 http://www.retsinfo.dk/

164 Denmark's Fourth National Communication on Climate Change

165Denmark's Fourth National Communication on Climate Change
5.1 INTRODUCTION AND OVERALL EF-FECT OF POLICIES AND MEASURES
According to the EU’s burden shar-ing agreement, Denmark has com-mitted itself to a reduction of green-house gas emissions by 21% in the period 2008-2012 in relation to the base year 1990/95 under the Kyoto Protocol.
In connection with this agreement, Denmark had reservations with re-spect to effects of large imports of electricity from Norway and Swe-den in the base year 1990, which reduced Denmark’s emissions that year by 6.3 mill. tonnes of CO2
compared to the domestic produc-tion of electricity to cover consump-tion. The Danish position was, and is, that the Danish EU reduction commitment should not be based on low emissions in a single year like in 1990, where low emissions were due to exceptionally large im-ports of electricity. In March 2002, Denmark had to accept a Council decision subjecting Denmark to the legal commitment to reduce emis-sions by 21% compared to the base year, without correcting for imports of electricity.
Denmark was, however, assured in a political declaration from the EU Council of Ministers and the Euro-pean Commission that the assump-tions relating to base year emissions will be taken into account in connec-tion with fixing the assigned amount of emissions in 2006, measured in tonnes of CO2 equivalents. The government, therefore, aims at a
5 Projections and the total effect of policies and measures
reduction burden for Denmark in 2008-2012 which is equal to 21% of the 1990 level corrected for imports of electricity. The difference cor-responds to 5 mill. tonnes of CO2
equivalents annually in 2008-2012.
The shortfall in respect of fulfill-ing Denmark’s obligations with the existing policies and measures has been calculated both for a situation in which account is taken of the electricity import in 1990 and for a situation in which account is not taken of this.
The projections are based on a number of sector-specific projec-tions of the domestic emissions for this period. These emissions depend on the extent of economic activ-ity in all sectors of society, energy prices, technological development, and legislation regulating individual activities in relation to the environ-ment, energy efficiency, etc. Among the most important preconditions are the Ministry of Finances’ esti-mate of economic development and the IEA’s expectations regarding fu-ture energy prices. The projections are also based on measures already adopted described in Chapter 4 and annex B. Corresponding to the most recent inventory of greenhouse gas emissions, the legal reduction com-mitment of 21% entails that Den-mark has to reduce its greenhouse gas emissions from an amount cor-responding to 69.6 mill. tonnes of CO2 equivalents in the base year 1990/95 to 55 mill. tonnes of CO2
equivalents in 2008-2012.

166 Denmark's Fourth National Communication on Climate Change
The most recent projections from May 2005 include the period 2004-2030 and are shown in Annex E. Projections for 2013-2030 are, however, somewhat more uncertain than the projections up to 2013, due to several factors, including the fact that uncertainties concerning measures and their expected effects increase with projection length. The projection is a “with measures” projection, which includes measures that have been or are expected to be implemented. Therefore the pro-jection must not be confused with the most likely development, since effects of new political initiatives, which will most likely be implement-ed as part of the continued follow-up to the Climate Strategy, have not been taken into account.
Since the Climate Strategy of 2003 and the associated baseline projec-tion without additional measures, a
new baseline projection with meas-ures has been prepared and the previous emission inventories have been up-dated as a result of new knowledge, including new figures for the base year. Therefore the climate deficit has changed in comparison to the estimate in the Climate Strat-egy. The deficit is what Denmark lacks to fulfil the target for reduction of greenhouse gas emissions under the Kyoto Protocol and EU burden sharing.
In the new “with measures” base-line projection from May 2005 Denmark’s expected annual net greenhouse gas emissions under the Kyoto Protocol for the period 2008-2012 correspond to 72.3 mill. tonnes of CO2 equivalents, as shown in Table 5.1. The emissions in the new baseline projection are 7.8 mill. tonnes of CO2 equivalents lower than in the previous baseline projec-
Source: 1990-2003: The National Inventory Report (NIR), the National Environmental Research Institute (NERI), April 2005.
2004-2030: Projection of greenhouse gas emissions, Memorandum to the Danish EPA, NERI, May 2005.

167Denmark's Fourth National Communication on Climate Change
tion without additional measures, on which the Climate Strategy was based. The new baseline projection for the entire period 2004-2030 is shown in Figure 5.1, altogether and aggregated into the economic sectors described in Chapter 4.
The decrease of 7.8 mill. tonnes of CO2 equivalents in the projection for the period 2008-2012 is primarily due to the reduction in exports of electricity, e.g. as a result of price effects of new electricity produc-tion capacity in Finland and Sweden and of the introduction of the EU allowance regulation. The reduc-tion in exports of electricity corre-sponds to almost 5.5 mill. tonnes of CO2 (from 9.9 to 4.4 mill. tonnes of CO2). To this can be added a reduction corresponding to approx. 2 mill. tonnes of CO2 equivalents in the energy sector due to the contin-ued shift towards more natural gas and renewable energy, which is in reality even bigger, since the figure also includes expectations adjusted upward to emissions corresponding to approx. 1.3 mill. tonnes of CO2
equivalents from extraction in the North Sea.
In the business sector, the change in the new projection corresponds to the effect of Kemira’s termination of nitric acid production in Denmark, since the reduction in the industry’s energy consumption, corresponding to approx. 0.5 mill. tonnes of CO2
equivalents has largely been com-pensated for by a similar increase in process emissions, where the in-crease from cement production con-
tributes the most (almost 0.4 mill. tonnes of CO2 equivalents).
The increase in the domestic sector follows the upward-adjusted projec-tion of energy consumption.
Of the increase of 0.4 mill. tonnes of CO2 equivalents from waste, almost 0.3 mill. tonnes are due to the new inclusion of methane and nitrous oxide from wastewater. Since this source has also been included in the base year 1990 and it is almost un-changed, up-dating emission inven-tories and projections to include this source does not alter the deficit. But the deficit is influenced slightly by the up-dated projection of 0.1 mill. tonnes of CO2 equivalents of meth-ane from landfills due to up-dated waste statistics.
To these expected effects of new measures and changes on the total result due to the new projection of emissions should be added expected effects of funds allocated for projects reducing greenhouse gas emissions in other countries - that is the JI and CDM projects, cf. articles 6 and 12 in the Kyoto Protocol. Since the Cli-mate Strategy for the period 2003-2008 was agreed, Denmark has allocated DKK 1,130 mill. to such projects, corresponding to 4.5 mill. tonnes of CO2 equivalents annually in 2008-2012 at an average price of DKK 50 per tonne.
As appears on Table 5.1 the Dan-ish deficit is estimated on this back-ground to be approx. 13 mill. tonnes of CO2 equivalents annually, based

168 Denmark's Fourth National Communication on Climate Change
on Denmark’s legal commitment un-der the EU Burden Sharing Agree-ment. This is based on a situation where no correction has been made for the particularly large imports of electricity in 1990.
If this correction is made as assumed by Denmark, the deficit is reduced to approx. 8 mill. tonnes of CO2
equivalents annually in 2008-2012, as shown in Table 5.1.
Compared to the deficit of 20-25 mill. tonnes of CO2 equivalents an-nually in 2008-2012, calculated on the basis of the projection which was presented together with the govern-ment’s proposal for a Climate Strat-egy for Denmark in February 2003 to show the expected development without implementation of additional measures, there is a reduction of ap-prox. 12 mill. tonnes of CO2 equiva-lents annually in 2008-2012.
With the choice of method, the defi-cit expresses the need to purchase allowances from abroad or to im-plement new measures outside the sectors subject to allowances. So, as a result of the introduction of the CO2 allowance scheme, the deficit is in principle not directly comparable to the deficit in the government’s Climate Strategy, since the cost ef-fects of the allowances are included, whereas ultimately the allocation of allowances decides the climatic ef-fects of the scheme.
Note that the projection, and there-fore also the deficit, is based on model predictions, which are subject
to uncertainty. This applies, not least, to expected developments in energy prices, prices of CO2 allow-ances, and the developments in the Nordic electricity market, which have a direct influence on the size of exports of electricity. This is illus-trated in more detail through sensi-tivity analyses, cf. section 5.2.4. The implementation of the EU allowance scheme has, however, created a ba-sis for greater certainty regarding the fulfilment of Denmark’s climate commitments under the Kyoto Pro-tocol and the EU Burden Sharing Agreement.
The “with measures” projection presented in this report is the most recent projection. It was finalised in May 2005 and it is in general based on expected effects of policies and measures implemented or adopted until the end of 2004. Due to the adoption of additional energy-sav-ings initiatives in 2005, up-dated projections in the off-shore sector and new IEA projections of energy prices, an update of the May 2005 “with measures” projection has been initiated. However, results from this update will not be available until the beginning of 2006. Preliminary re-sults suggests that the action plan on additional energy-savings initiatives could lead to a 2 mill. tonnes further reduction in annual CO2 emissions 2008-2012.
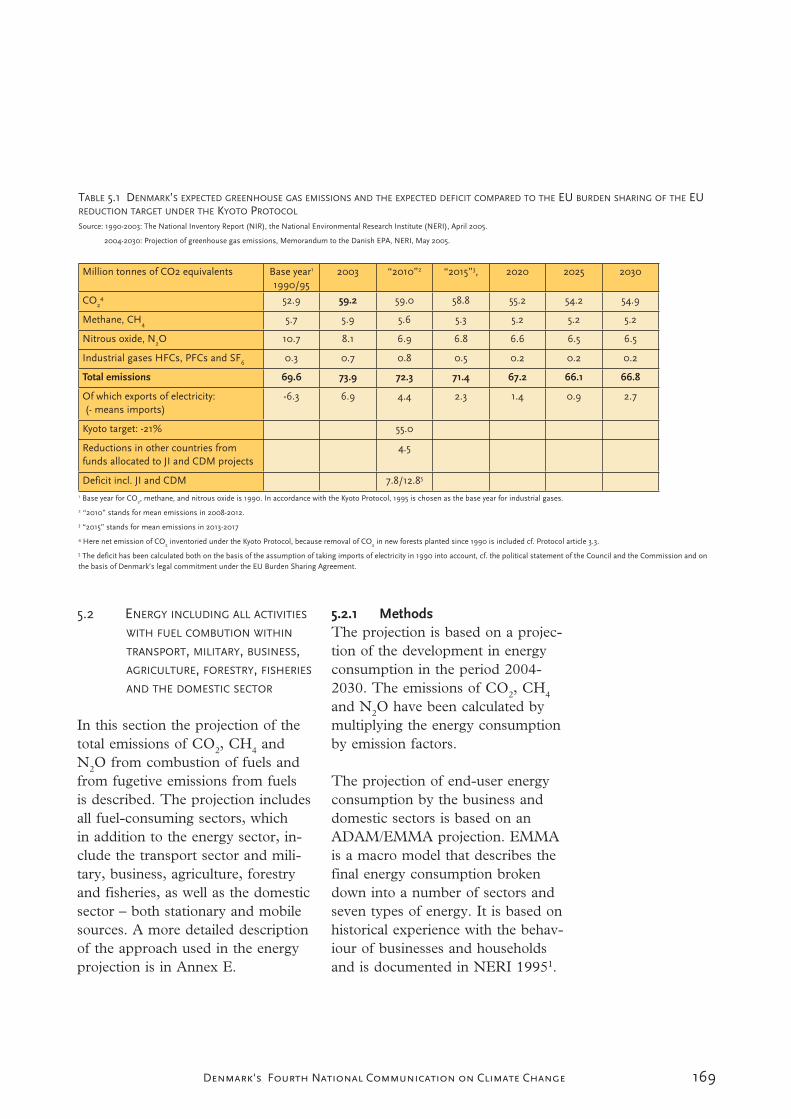
169Denmark's Fourth National Communication on Climate Change
5.2 ENERGY INCLUDING ALL ACTIVITIES
WITH FUEL COMBUTION WITHIN
TRANSPORT, MILITARY, BUSINESS,AGRICULTURE, FORESTRY, FISHERIES
AND THE DOMESTIC SECTOR
In this section the projection of the total emissions of CO2, CH4 and N2O from combustion of fuels and from fugetive emissions from fuels is described. The projection includes all fuel-consuming sectors, which in addition to the energy sector, in-clude the transport sector and mili-tary, business, agriculture, forestry and fisheries, as well as the domestic sector – both stationary and mobile sources. A more detailed description of the approach used in the energy projection is in Annex E.
5.2.1 MethodsThe projection is based on a projec-tion of the development in energy consumption in the period 2004-2030. The emissions of CO2, CH4
and N2O have been calculated by multiplying the energy consumption by emission factors.
The projection of end-user energy consumption by the business and domestic sectors is based on an ADAM/EMMA projection. EMMA is a macro model that describes the final energy consumption broken down into a number of sectors and seven types of energy. It is based on historical experience with the behav-iour of businesses and households and is documented in NERI 19951.
TABLE 5.1 DENMARK’S EXPECTED GREENHOUSE GAS EMISSIONS AND THE EXPECTED DEFICIT COMPARED TO THE EU BURDEN SHARING OF THE EU REDUCTION TARGET UNDER THE KYOTO PROTOCOL
Source: 1990-2003: The National Inventory Report (NIR), the National Environmental Research Institute (NERI), April 2005.
2004-2030: Projection of greenhouse gas emissions, Memorandum to the Danish EPA, NERI, May 2005.
Million tonnes of CO2 equivalents Base year1
1990/952003 “2010”2 “2015”3, 2020 2025 2030
CO24 52.9 59.2 59.0 58.8 55.2 54.2 54.9
Methane, CH4 5.7 5.9 5.6 5.3 5.2 5.2 5.2
Nitrous oxide, N2O 10.7 8.1 6.9 6.8 6.6 6.5 6.5
Industrial gases HFCs, PFCs and SF6 0.3 0.7 0.8 0.5 0.2 0.2 0.2
Total emissions 69.6 73.9 72.3 71.4 67.2 66.1 66.8
Of which exports of electricity:(- means imports)
-6.3 6.9 4.4 2.3 1.4 0.9 2.7
Kyoto target: -21% 55.0
Reductions in other countries fromfunds allocated to JI and CDM projects
4.5
Deficit incl. JI and CDM 7.8/12.85
1 Base year for CO2, methane, and nitrous oxide is 1990. In accordance with the Kyoto Protocol, 1995 is chosen as the base year for industrial gases.
2 “2010” stands for mean emissions in 2008-2012.
3 “2015” stands for mean emissions in 2013-2017
4 Here net emission of CO2 inventoried under the Kyoto Protocol, because removal of CO2 in new forests planted since 1990 is included cf. Protocol article 3.3.
5 The deficit has been calculated both on the basis of the assumption of taking imports of electricity in 1990 into account, cf. the political statement of the Council and the Commission and onthe basis of Denmark’s legal commitment under the EU Burden Sharing Agreement.
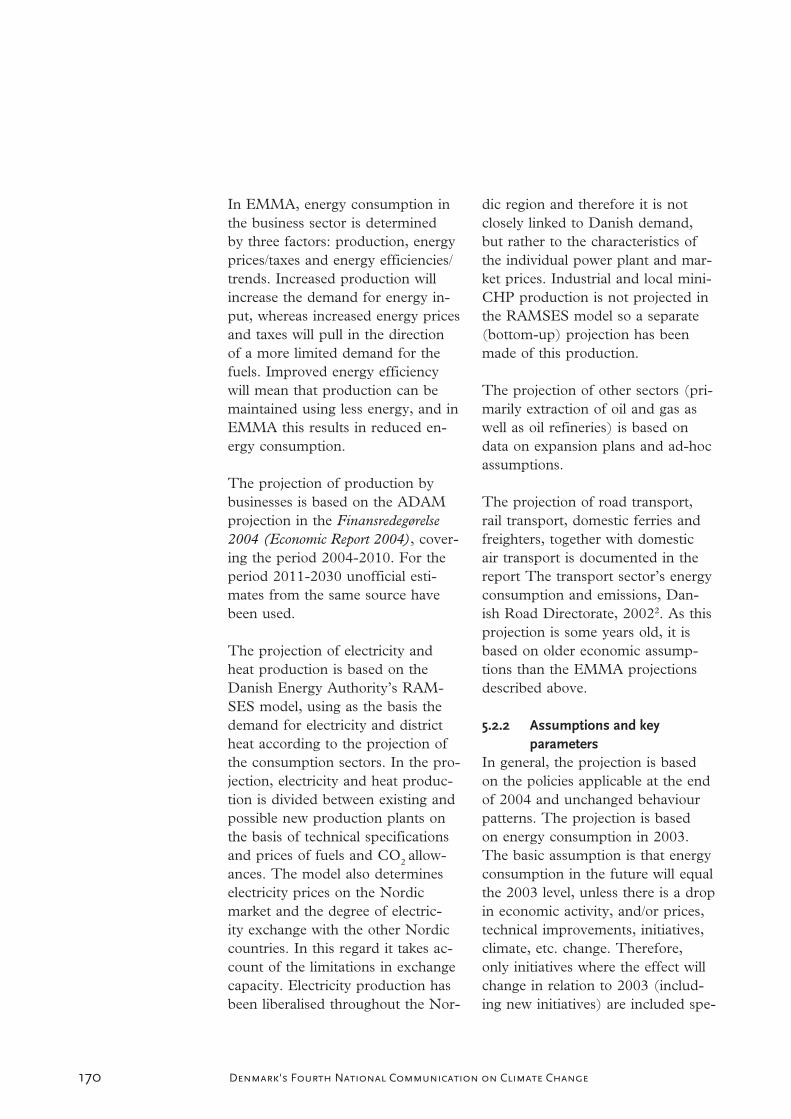
170 Denmark's Fourth National Communication on Climate Change
In EMMA, energy consumption in the business sector is determined by three factors: production, energy prices/taxes and energy efficiencies/ trends. Increased production will increase the demand for energy in-put, whereas increased energy prices and taxes will pull in the direction of a more limited demand for the fuels. Improved energy efficiency will mean that production can be maintained using less energy, and in EMMA this results in reduced en-ergy consumption.
The projection of production by businesses is based on the ADAM projection in the Finansredegørelse2004 (Economic Report 2004), cover-ing the period 2004-2010. For the period 2011-2030 unofficial esti-mates from the same source have been used.
The projection of electricity and heat production is based on the Danish Energy Authority’s RAM-SES model, using as the basis the demand for electricity and district heat according to the projection of the consumption sectors. In the pro-jection, electricity and heat produc-tion is divided between existing and possible new production plants on the basis of technical specifications and prices of fuels and CO2 allow-ances. The model also determines electricity prices on the Nordic market and the degree of electric-ity exchange with the other Nordic countries. In this regard it takes ac-count of the limitations in exchange capacity. Electricity production has been liberalised throughout the Nor-
dic region and therefore it is not closely linked to Danish demand, but rather to the characteristics of the individual power plant and mar-ket prices. Industrial and local mini-CHP production is not projected in the RAMSES model so a separate (bottom-up) projection has been made of this production.
The projection of other sectors (pri-marily extraction of oil and gas as well as oil refineries) is based on data on expansion plans and ad-hoc assumptions.
The projection of road transport, rail transport, domestic ferries and freighters, together with domestic air transport is documented in the report The transport sector’s energy consumption and emissions, Dan-ish Road Directorate, 20022. As this projection is some years old, it is based on older economic assump-tions than the EMMA projections described above.
5.2.2 Assumptions and key parameters
In general, the projection is based on the policies applicable at the end of 2004 and unchanged behaviour patterns. The projection is based on energy consumption in 2003. The basic assumption is that energy consumption in the future will equal the 2003 level, unless there is a drop in economic activity, and/or prices, technical improvements, initiatives, climate, etc. change. Therefore, only initiatives where the effect will change in relation to 2003 (includ-ing new initiatives) are included spe-

171Denmark's Fourth National Communication on Climate Change
cifically in calculating the projection. Therefore, the projection should be regarded as a ”with measures” pro-jection.
The IEA price assumptions for fos-sil fuels (World Energy Outlook, 20043) and a euro-dollar rate of 0.8 have been applied. However, the IEA assumptions have been mod-
erated so that the rather low price levels for 2006-2010 are not reached before 2009. With regard to large producers of heat and electricity, however, it is assumed that liberali-sation of the gas market will reduce the price of gas slightly compared with the IEA assumptions. Prices of biomass are assumed to remain constant in real terms. District-heat-
Source: Danish Energy Authority
Percent p.a. 1980-2003
2004 2005 2006 2007 2008 2009 2010 2010-2020
2020-2030
Production value:
Primary indust. excl. energy 1.1 1.1 1.1 1.1 1.1 1.1 1.1 1.1 1.1 1.1
Building and construction 0.8 3.6 1.2 1.7 2.1 2.2 2.4 2.2 1.6 1.2
Manufacturing excl. energy 1.7 0.5 3.0 1.1 2.2 1.8 2.0 1.9 1.3 0.6
Public service 1.7 0.5 0.4 0.5 0.5 0.5 0.5 0.5 0.8 1.0
Trade 2.4 3.5 3.7 2.0 2.7 2.6 2.7 2.6 1.8 1.0
Financial services 3.0 1.7 0.6 2.5 2.6 2.6 2.6 2.6 2.1 1.7
Other services 3.1 2.3 2.6 2.0 2.5 2.4 2.5 2.4 2.0 1.4
Total 2.0 1.7 2.2 1.5 2.1 1.9 2.0 2.0 1.5 1.1
Private consumption 1.3 3.6 3.0 1.6 2.6 2.5 2.6 2.5 2.2 1.7
Housing stock 1995 prices 1.4 1.8 1.7 1.7 1.7 1.7 1.7 1.8 1.8 1.8
Housing stock, m2 0.8 1.0 1.0 1.0 1.0 0.9 0.9 0.9 0.7 0.7
GDP 1.8 2.2 2.5 1.4 2.0 1.9 2.0 1.9 1.5 1.1
Gross added value (GAV) 1.8 1.9 2.5 1.4 2.0 1.8 2.0 1.9 1.5 1.0
Deflator, (GAV) 3.9 2.2 1.8 2.2 2.2 2.2 2.2 2.2 2.1 2.1

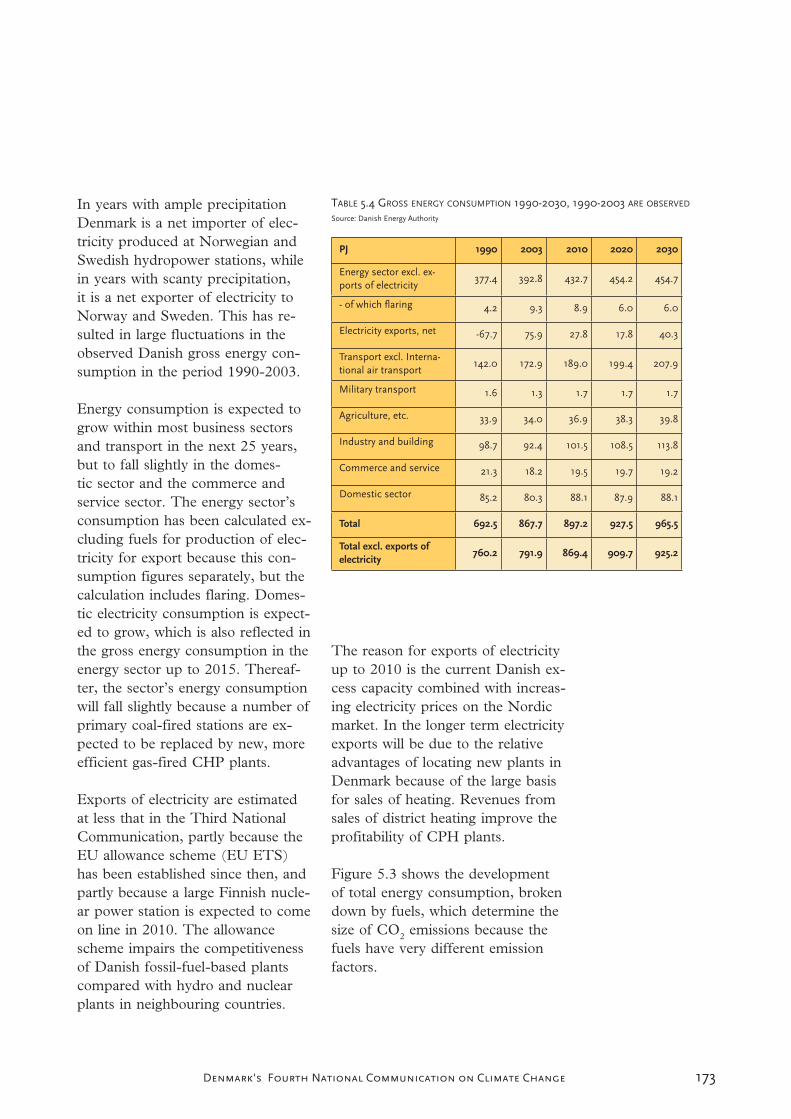
173Denmark's Fourth National Communication on Climate Change
In years with ample precipitation Denmark is a net importer of elec-tricity produced at Norwegian and Swedish hydropower stations, while in years with scanty precipitation, it is a net exporter of electricity to Norway and Sweden. This has re-sulted in large fluctuations in the observed Danish gross energy con-sumption in the period 1990-2003.
Energy consumption is expected to grow within most business sectors and transport in the next 25 years, but to fall slightly in the domes-tic sector and the commerce and service sector. The energy sector’s consumption has been calculated ex-cluding fuels for production of elec-tricity for export because this con-sumption figures separately, but the calculation includes flaring. Domes-tic electricity consumption is expect-ed to grow, which is also reflected in the gross energy consumption in the energy sector up to 2015. Thereaf-ter, the sector’s energy consumption will fall slightly because a number of primary coal-fired stations are ex-pected to be replaced by new, more efficient gas-fired CHP plants.
Exports of electricity are estimated at less that in the Third National Communication, partly because the EU allowance scheme (EU ETS) has been established since then, and partly because a large Finnish nucle-ar power station is expected to come on line in 2010. The allowance scheme impairs the competitiveness of Danish fossil-fuel-based plants compared with hydro and nuclear plants in neighbouring countries.
The reason for exports of electricity up to 2010 is the current Danish ex-cess capacity combined with increas-ing electricity prices on the Nordic market. In the longer term electricity exports will be due to the relative advantages of locating new plants in Denmark because of the large basis for sales of heating. Revenues from sales of district heating improve the profitability of CPH plants.
Figure 5.3 shows the development of total energy consumption, broken down by fuels, which determine the size of CO2 emissions because the fuels have very different emission factors.
Source: Danish Energy Authority
PJ 1990 2003 2010 2020 2030
Energy sector excl. ex-ports of electricity
377.4 392.8 432.7 454.2 454.7
- of which flaring 4.2 9.3 8.9 6.0 6.0
Electricity exports, net -67.7 75.9 27.8 17.8 40.3
Transport excl. Interna-tional air transport
142.0 172.9 189.0 199.4 207.9
Military transport 1.6 1.3 1.7 1.7 1.7
Agriculture, etc. 33.9 34.0 36.9 38.3 39.8
Industry and building 98.7 92.4 101.5 108.5 113.8
Commerce and service 21.3 18.2 19.5 19.7 19.2
Domestic sector 85.2 80.3 88.1 87.9 88.1
Total 692.5 867.7 897.2 927.5 965.5
Total excl. exports of electricity
760.2 791.9 869.4 909.7 925.2


175Denmark's Fourth National Communication on Climate Change
5.2.4 Sensitivity analyses and scenario calculations
The projection and underlying as-sumptions are naturally very uncer-tain. Therefore, sensitivity analyses have been completed with alternative assumptions for fuel prices and pric-es of CO2 allowances cf. Table 5.6.
High prices for oil, gas, coal and CO2 allowances are expected to re-duce gross energy consumption in 2030 by about 50 PJ or 5% com-pared with the projection above, while low prices increase consump-tion by about 30 PJ or 3%, cf. Fig-ure 5.4.
As can be seen, the changes in total energy consumption are expected to be moderate, but they conceal large fluctuations in the composition of fuels in the supply sector. With the high prices of natural gas, oil and CO2 allowances, expansion will be exclusively with renewable energy – wind and biomass, while with low prices of CO2 allowances, higher prices of natural gas and moderately higher coal prices, new coal-fired plants will be built.
The effects on CO2 emissions from the reorganisation of fuels in the supply sector: a reduction of 23% in the case of high prices, and an increase of 7% for low prices in 2030, cf. Figure 5.4. The effects are considerably less in 2010. Here, CO2
emissions are 4.5 mill. tonnes under basis with higher prices, but only 0.3 mill. tonnes over with low prices.
5.3 TRANSPORT
As mentioned in section 5.2, the latest projection of road transport, rail transport, domestic ferries and freighters, together with domestic air transport is documented in the report The transport sector’s energy consumption and emissions, Danish Road Directorate, 2002. Projected energy consumption is based on a projection of traffic intensity, which
Source: Danish Energy Authority
Low Basis High
Crude oil 2000-USD/barrel 20 291 50
Coal 2000-USD/tonne 37 441 60
Natural gas in Europe
2000-USD/MBtu 3.0 4.31 7.4
CO2 allowances 2000-USD/tonne 8 24 58
1 IEA assumptions from WEO 2004
Source: Danish Energy Authority

176 Denmark's Fourth National Communication on Climate Change
is described in more detail in this section.
5.3.1 MethodsThe completed projection is based on the estimate of the total emissions from the national traffic intensity carried out in Denmark, i.e. traf-fic intensity with Danish vehicles in Denmark. Projections have been made for both developments in traf-fic and changes in specific energy and emissions factors.
In principle, all-else-being-equal pro-jections of developments in traffic, energy consumption and emissions have been made. Thus, the projec-tion has been made to include only emission standards and measures al-ready adopted, or implementation of these, so that it is a “with measures” projection.
The changes in the explanatory eco-nomic variables for the period up to 2010 are based on the Ministry of Finance economic outlook from January 2002. From 2010, economic development is based on the most recent long-term economic projec-tions from the Ministry of Finance in Finansredegørelse 2001 (Economic report 2001). It should be noted that the even changes in the projections reflect the evened-out changes in the economic projections. In other words a projection of this type does not capture the exact level for the indi-vidual year, but rather it shows the expected trends over future years.
Passenger carsThe projection of passenger-car traf-fic is composed of two elements. A projection of the number of passen-ger cars, as well as assumptions re-garding developments in the average number of kilometres driven each year. Traffic intensity for motorcy-cles is assumed to follow that for passenger cars.
The projection of the number of cars is based on a sub-model for new registrations and a sub-model for survival of each year of new reg-istrations.
The historical development in number of kilometres driven per year is calculated by dividing total traffic intensity for a given year with the number of cars for the same year. This is then repeated for the expected future developments cf. the assumptions described in the next section.
Source: Danish Energy Authority

177Denmark's Fourth National Communication on Climate Change
BusesThe lack of sufficient insight into the determining factors for devel-opments in bus transport makes it difficult to establish models for the projection of bus traffic.
Vans and lorries (2-6 tonnes)The method here is to allow devel-opments to follow economic growth, either directly proportionally or us-ing an elasticity that deviates from 1.
Lorries (over 6 tonnes)This projection is based on analyses of the relationship between the eco-nomic cycle and national transport of goods by road in the period from 1980 to 2001.
The development in transport of goods by road is based on a study by Statistics Denmark of tacho-graphs, which, on the basis of a sample of lorries transporting goods nationally, provides a detailed pic-ture of the developments in goods transport and its composition.
In contrast to previous analyses, the developments in goods transport re-lated to overall economic growth in society (e.g. expressed as the change in GDP), is now based on analyses of the relationship between goods transport and production in goods-producing sectors, divided into five main sectors.
EmissionsFor this projection of energy con-sumption and emissions from the road sector, a revised projection has been made of average specific emis-
sion factors of CO, VOC, NOx and particles for vehicles from the road sector. The specific emission factors have been calculated by NERI and are based on traffic projections from the Road Directorate and emissions data from the most recent edition of the COPERT model.
5.3.2 Assumptions and key parameters
Passenger carsWith regard to new registrations, a total of about 150,000 per year is expected for the whole period 2001 - 2010. The composition of the cars on the road in 2001 has been re-tained in the projection, under the assumption that the age of cars will not change significantly compared with today, where the median life-time is just less than 17 years. The projection assumes that the current levelling-off of the number of km driven per year will continue in the period 2001 to 2010. Therefore, an increase of 2% up to 2010 has been used.
BusesDue to a lack of alternative methods, it has been assumed that the present level of bus traffic will continue throughout the period 2001 - 2010.
Vans and lorries (2-6 tonnes)Goods transport intensity has been projected in parallel with develop-ments in GDP from 2001 to 2005. In the subsequent period from 2005, an elasticity to GDP has been as-sumed of 0.75. The load factor has been assumed to remain at the 2001

178 Denmark's Fourth National Communication on Climate Change
level throughout the projection pe-riod.
Lorries (over 6 tonnes)In order to project traffic intensity for lorries of more than 6 tonnes, it has been assumed that the relation-ship between kilometres driven with and without a load remains the same as in 2000. In 2000, the number of kilometres driven without load was 19% of the kilometres driven with load.
Moreover, as previously, it has been assumed that capacity exploitation of vehicles with load increases from 50% to 55%, corresponding to a 10% improvement. It has been as-sumed that the improvement in ca-pacity occurs over a 20-year period, i.e. up to 2020.
Energy efficiencyIn this projection, primarily the total energy consumption by the transport sector has been adjusted compared with the energy statements by the Energy Authority for the years 1988 and 2001. Thus, there is numeric consistency in the statement of de-velopments in energy consumption in the period 1988 to 2002.
The projection also includes the expected effect of the agreement be-tween the EU and the auto industry on the energy efficiency of cars. Ac-cording to the agreement, the aver-age CO2 emissions from newly regis-tered passenger cars in 2008 should be no more than 140 g per km. Steady introduction of passenger cars with emissions of this level are
expected, with full implementation in 2008. In this period, it is expected that the proportion of newly regis-tered cars with 140 g CO2 emissions per km will increase on a straight-line basis from 0% in 2000 to 100% in 2008.
5.3.3 ResultsTable 5.7 shows the main results of the overall projection of emissions of CO2 and others from road traffic for the period 1988 to 2010.
The result of the total projection of emissions of greenhouse gases by the transport sector up to 2030 is described in Table 5.8. As with the historical emissions inventories, the national totals for projected emis-sions of greenhouse gases do not include emissions from international air transport and international ma-rine transport.
5.3.4 Sensitivity analyses and scenario calculations
The projection cannot be better than the material on which it is based. It is no surprise that there is great uncertainty linked to the economic data, in particular in the more dis-tant future. Similarly, on a number of occasions it has been demon-strated that tachograph data is also uncertain.
For the above reasons it is important to stress that the projection should only be used a descriptive tool for developments from one period to another. The uncertainty of the val-ues for the individual years may be
179Denmark's Fourth National Communication on Climate Change
great, and interpreting the level for the specific year may be incorrect.
However, independent analyses and scenario calculations have not been prepared for the transport projec-tion. In the sensitivity analyses pre-pared in connection with the energy projections, energy consumption and emissions by the transport sector are also influenced, however, when the price of fuel changes.
5.4 INDUSTRY
In addition to the emissions of greenhouse gases connected to energy consumption by industry discussed in section 5.2, green-house gases are also emitted from a number of industrial processes. These include emissions from the production of cement, chalk, tiles, glass etc., as well as emissions of the fluorine-containing industrial gases HFCs, PFCs and SF6 (F gases) from the production and use of products containing these substanc-es, such as refrigerants, foaming agents, and as insulation gases.
5.4.1 MethodsFor process emissions, there is often proportionality between production and emissions, if there are no signifi-cant changes in the technology used in production or any measures to limit emissions. However, it is often not possible to obtain information from enterprises on the expected future production, partly for com-mercial reasons and partly because
Source: Transport sector energy consumption and emissions, Road Directorate, 2002.
Road Traffic
Performance
National
goods trans-
port perform-
ance on roads
CO2
Mill. km Mill.
tonneskm
‘000 tonnes
1988 34,491 64,987 9,148
1989 35,490 66,505 9,343
1990 36,071 67,671 9,323
1991 36,968 68,555 9,435
1992 37,697 69,813 9,552
1993 38,150 69,301 9,550
1994 39,147 70,876 9,707
1995 40,651 72,592 10,060
1996 41,844 74,702 10,320
1997 43,159 76,534 10,541
1998 44,301 78,041 10,807
1999 45,920 80,199 11,177
2000 46,276 80,664 11,271
2001 46,449 79,979 11,385
2002 47,160 81,863 11,528
2003 48,303 83,626 11,753
2004 49,275 85,160 11,938
2005 50,356 86,863 12,132
2006 51,432 88,597 12,311
2007 52,474 90,282 12,477
2008 53,468 91,889 12,628
2009 54,357 93,337 12,762
2010 55,158 94,641 12,882
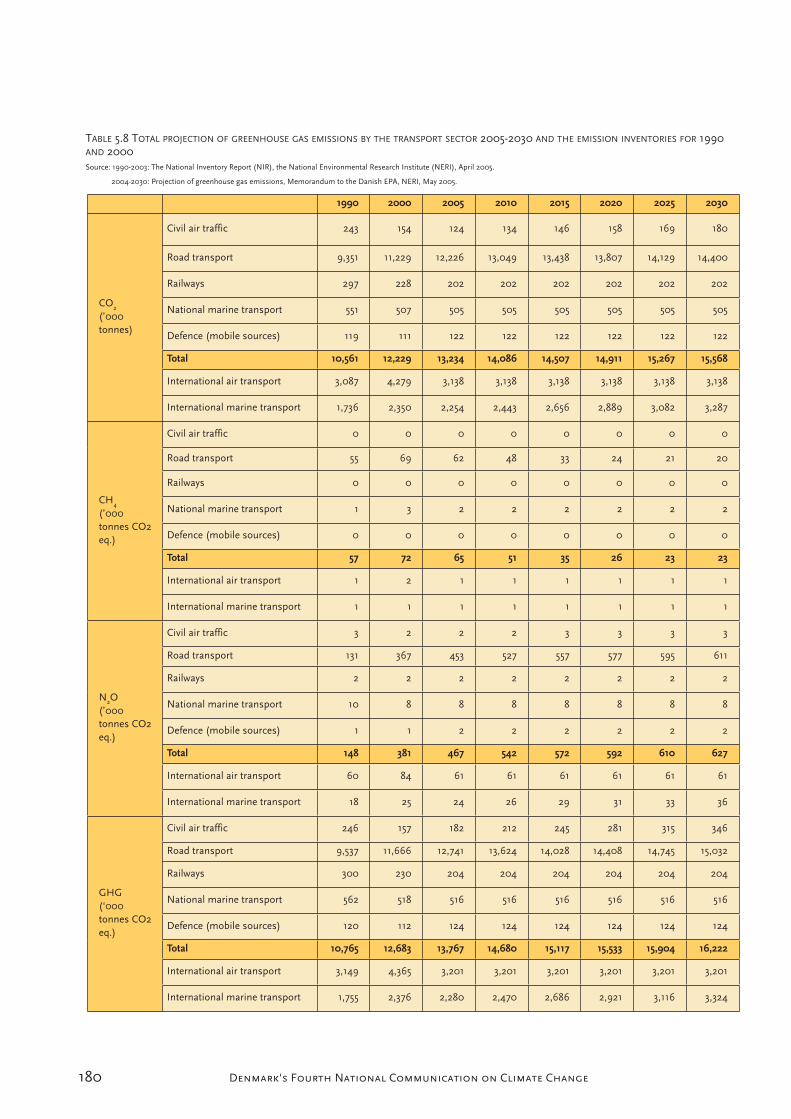
180 Denmark's Fourth National Communication on Climate Change
1990 2000 2005 2010 2015 2020 2025 2030
CO2
(’000tonnes)
Civil air traffic 243 154 124 134 146 158 169 180
Road transport 9,351 11,229 12,226 13,049 13,438 13,807 14,129 14,400
Railways 297 228 202 202 202 202 202 202
National marine transport 551 507 505 505 505 505 505 505
Defence (mobile sources) 119 111 122 122 122 122 122 122
Total 10,561 12,229 13,234 14,086 14,507 14,911 15,267 15,568
International air transport 3,087 4,279 3,138 3,138 3,138 3,138 3,138 3,138
International marine transport 1,736 2,350 2,254 2,443 2,656 2,889 3,082 3,287
CH4
(’000tonnes CO2eq.)
Civil air traffic 0 0 0 0 0 0 0 0
Road transport 55 69 62 48 33 24 21 20
Railways 0 0 0 0 0 0 0 0
National marine transport 1 3 2 2 2 2 2 2
Defence (mobile sources) 0 0 0 0 0 0 0 0
Total 57 72 65 51 35 26 23 23
International air transport 1 2 1 1 1 1 1 1
International marine transport 1 1 1 1 1 1 1 1
N2O(’000tonnes CO2eq.)
Civil air traffic 3 2 2 2 3 3 3 3
Road transport 131 367 453 527 557 577 595 611
Railways 2 2 2 2 2 2 2 2
National marine transport 10 8 8 8 8 8 8 8
Defence (mobile sources) 1 1 2 2 2 2 2 2
Total 148 381 467 542 572 592 610 627
International air transport 60 84 61 61 61 61 61 61
International marine transport 18 25 24 26 29 31 33 36
GHG(‘000tonnes CO2eq.)
Civil air traffic 246 157 182 212 245 281 315 346
Road transport 9,537 11,666 12,741 13,624 14,028 14,408 14,745 15,032
Railways 300 230 204 204 204 204 204 204
National marine transport 562 518 516 516 516 516 516 516
Defence (mobile sources) 120 112 124 124 124 124 124 124
Total 10,765 12,683 13,767 14,680 15,117 15,533 15,904 16,222
International air transport 3,149 4,365 3,201 3,201 3,201 3,201 3,201 3,201
International marine transport 1,755 2,376 2,280 2,470 2,686 2,921 3,116 3,324
TABLE 5.8 TOTAL PROJECTION OF GREENHOUSE GAS EMISSIONS BY THE TRANSPORT SECTOR 2005-2030 AND THE EMISSION INVENTORIES FOR 1990AND 2000Source: 1990-2003: The National Inventory Report (NIR), the National Environmental Research Institute (NERI), April 2005.
2004-2030: Projection of greenhouse gas emissions, Memorandum to the Danish EPA, NERI, May 2005.
181Denmark's Fourth National Communication on Climate Change
market and production conditions are unpredictable.
F gases, however, are exceptional because they are contained in the product itself, e.g. as a refrigerant or insulator gas, and they are slowly released into the atmosphere over a number of years. In this regard, emission rates etc. in the IPCC guidelines for emissions inventories have also been used in the projec-tions.
5.4.2 Assumptions and key parameters
The projection of the emissions is based on implemented and adopted policies and measures, described in Chapter 4, including a statutory order on phasing out certain indus-trial gases. This statutory order will result in a reduction in greenhouse gas emissions of, on average, 0.4-0.7 mill. tonnes CO2 equivalents per year in the period 2008-2012. It is covered by a ban on the use of HFC as a coolant in the retail trade and stationary A/C systems from 1 January 2007, except for refilling of existing systems, and as a foaming agent in PUR foam from 1 January 2006.
With regard to process emissions, unchanged market and produc-tion conditions have been assumed consistently. The only deviations are, that from 2004 production of nitric acid ceased in Denmark; that in the period 2002-2007 an increase of 5% in the production of clinker for cement production is assumed; and that emissions of process CO2
from steel production from 2005 are assumed to be at the 2001 level as from early 2005 production will resume after a period of zero pro-duction from 2002-2004.
5.4.3 ResultsResults of projections of F gases and process emissions appear in Tables 5.9 and 5.10.
5.4.4 Sensitivity analyses and scenario calculations
There are no sensitivity analyses and scenario calculations emissions of greenhouse gases from the business sector. On the basis of the effects described above, for example, it can be ascertained that the resumption of production of nitric acid in Den-mark – with the same technology as prior to the cessation in 2004, which in practice will probably not be the case – will increase annual emis-sions in 2008-2012 by about 1 mill. tonnes CO2 equivalents. In other contexts it has also been assessed that any relaxation of Danish regula-tion regarding F gases to align with EU regulation will increase Danish emissions of F gases by 0.4 – 0.7 mill. tonnes CO2 equivalents per year in 2008-2012.
5.5 AGRICULTURE
In 2003, agriculture accounted for approximately 19% of Denmark’s total emissions of greenhouse gases. The gases emitted by agriculture are mainly methane and nitrous ox-ide. The methane and nitrous oxide emissions are not taxed and are only
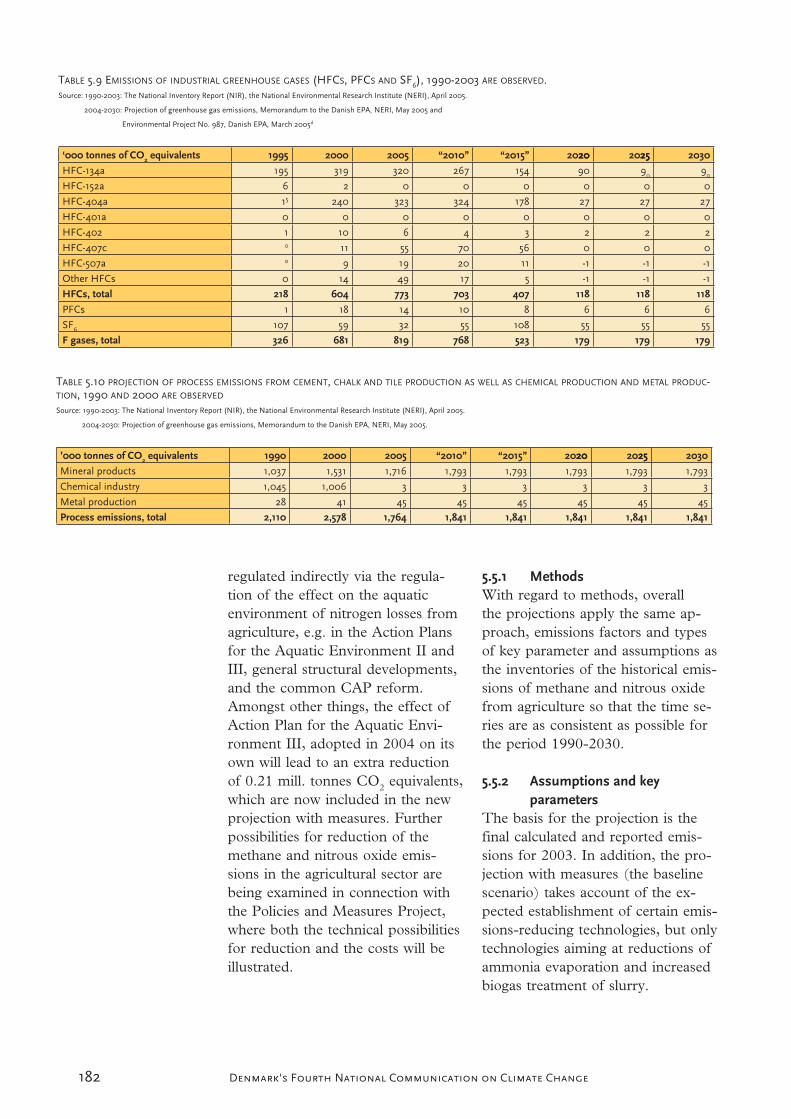
182 Denmark's Fourth National Communication on Climate Change
regulated indirectly via the regula-tion of the effect on the aquatic environment of nitrogen losses from agriculture, e.g. in the Action Plans for the Aquatic Environment II and III, general structural developments, and the common CAP reform. Amongst other things, the effect of Action Plan for the Aquatic Envi-ronment III, adopted in 2004 on its own will lead to an extra reduction of 0.21 mill. tonnes CO2 equivalents, which are now included in the new projection with measures. Further possibilities for reduction of the methane and nitrous oxide emis-sions in the agricultural sector are being examined in connection with the Policies and Measures Project, where both the technical possibilities for reduction and the costs will be illustrated.
5.5.1 MethodsWith regard to methods, overall the projections apply the same ap-proach, emissions factors and types of key parameter and assumptions as the inventories of the historical emis-sions of methane and nitrous oxide from agriculture so that the time se-ries are as consistent as possible for the period 1990-2030.
5.5.2 Assumptions and key parameters
The basis for the projection is the final calculated and reported emis-sions for 2003. In addition, the pro-jection with measures (the baseline scenario) takes account of the ex-pected establishment of certain emis-sions-reducing technologies, but only technologies aiming at reductions of ammonia evaporation and increased biogas treatment of slurry.
Source: 1990-2003: The National Inventory Report (NIR), the National Environmental Research Institute (NERI), April 2005.
2004-2030: Projection of greenhouse gas emissions, Memorandum to the Danish EPA, NERI, May 2005 and
Environmental Project No. 987, Danish EPA, March 2005d
‘000 tonnes of CO2 equivalents 1995 2000 2005 “2010” “2015” 202020 202525 2030
HFC-134a 195 319 320 267 154 90 90 90
HFC-152a 6 2 0 0 0 0 0 0
HFC-404a 15 240 323 324 178 27 27 27
HFC-401a 0 0 0 0 0 0 0 0
HFC-402 1 10 6 4 3 2 2 2
HFC-407c 0 11 55 70 56 0 0 0
HFC-507a 0 9 19 20 11 -1 -1 -1
Other HFCs 0 14 49 17 5 -1 -1 -1
HFCs, total 218 604 773 703 407 118 118 118
PFCs 1 18 14 10 8 6 6 6
SF6 107 59 32 55 108 55 55 55
F gases, total 326 681 819 768 523 179 179 179
Source: 1990-2003: The National Inventory Report (NIR), the National Environmental Research Institute (NERI), April 2005.
2004-2030: Projection of greenhouse gas emissions, Memorandum to the Danish EPA, NERI, May 2005.
’000 tonnes of CO2 equivalents 1990 2000 2005 “2010” “2015” 202020 202525 2030
Mineral products 1,037 1,531 1,716 1,793 1,793 1,793 1,793 1,793
Chemical industry 1,045 1,006 3 3 3 3 3 3
Metal production 28 41 45 45 45 45 45 45
Process emissions, total 2,110 2,578 1,764 1,841 1,841 1,841 1,841 1,841

183Denmark's Fourth National Communication on Climate Change
5.5.3 ResultsAs will be seen from Table 5.11, emissions of methane and nitrous oxide from agriculture are expected to be reduced by 12% from 9.90 mill. tonnes CO2 equivalents in 2003 to 8.69 mill. tonnes CO2 equivalents in 2025 (and 2030). This projec-tion with existing measures (baseline scenario) takes account of the EU agricultural reform, Action Plan for the Aquatic Environment III, and establishment of ammonia-reduc-
ing initiatives in stalls as well as increased biogas production. Emis-sions of methane are expected to be reduced by a drop in cattle stocks. The reduction in nitrous oxide emis-sions is primarily due to a drop in emissions from N run-off, com-mercial fertiliser, and from manure spread on fields. This is due to bet-ter exploitation of feed and better exploitation of the nitrogen content in manure, as well as a drop in the cropland area.
Source: 1990-2003: The National Inventory Report (NIR), the National Environmental Research Institute (NERI), April 2005
2004-2030: Projection of greenhouse gas emissions, Memorandum to the Danish EPA, NERI, May 2005.
Emissions from ag-riculture
19901 20001 20031 2005 ”2010” ”2015” 202020 202525 2030
CH4(Gg)
Digestive process 148.09 136.78 130.17 127.66 122.96 116.24 112.08 108.33 108.33
Manure 35.48 45.29 47.22 48.96 50.08 49.82 50.05 50.30 50.30
Biogas treatment ofslurry
-0.11 -0.68 -0.93 -1.36 -2.22 -2.33 -2.33 -2.33 -2.33
CH4, total (Gg) 183.46 181.40 176.45 175.27 170.83 163.73 159.80 156.29 156.29
N2O(Gg)
Manure 2.21 1.94 1.85 1.84 1.82 1.80 1.77 1.73 1.73
Biogas treatment ofslurry
0 -0.68 -0.04 -0.06 -0.10 -0.10 -0.10 -0.10 0.73
Commercial ferti-liser
7.69 4.83 3.87 3.78 3.52 3.31 3.21 3.13 3.13
Manure spread onfields
3.51 3.40 3.57 3.61 3.67 3.67 3.66 3.62 3.62
Wastewater used asfertiliser
0.09 0.17 0.23 0.23 0.22 0.22 0.22 0.22 0.22
Ammonia evapora-tion
1.72 1.33 1.22 1.19 1.13 1.07 1.03 1.01 1.01
N run-off 10.50 7.05 6.45 6.30 5.94 5.63 5.48 5.35 5.35
Crops with organi-cally-bound N
0.88 0.76 0.63 0.62 0.61 0.60 0.58 0.57 0.57
Crop residues 1.17 1.09 1.03 1.02 1.00 0.98 0.96 0.94 0.94
Cultivation of hu-mus soil
0.23 0.23 0.23 0.23 0.23 0.23 0.23 0.23 0.23
Biogas treatment ofslurry
0 -0.68 -0.04 -0.06 -0.10 -0.10 -0.10 -0.10 -0.10
N2O , total (Gg) 29.01 21.79 19.98 19.70 18.89 18.19 17.79 17.44 17.44
CO2
eq.CH4 3.85 3.81 3.71 3.68 3.59 3.44 3.36 3.28 3.31
N2O 8.99 6.76 6.19 6.11 5.86 5.64 5.51 5.41 5.41
CO2
eq.Total in mill. tonnes CO2 eq.
12.84 10.57 9.90 9.79 9.44 9.08 8.87 8.69 8.74
1 Emissions for 1990, 2000 and 2003 are excl. emissions from fur-bearing animals, corresponding to reporting in NIR.

184 Denmark's Fourth National Communication on Climate Change
5.5.4 Sensitivity analyses and scenario calculations
Prior to the preparation of the above new projection for agriculture, NERI published a report in 2004, which through the following five scenarios illustrated the consequences of agricultural emissions of methane and nitrous oxide:
1. Baseline scenario - based on ag-ricultural conditions in 2002
2. Implementation of the EU CAP – Common Agricultural Policy
3. Implementation of CAP + con-stant pig production at the 2003 level
4a. Implementation of CAP + 25% reduction in N run-off
4b. As 4a + specific initiatives for extra afforestation.
The results of these five scenarios appear in Table 5.12. As can be seen, there is only a small difference between the new baseline projection and the second scenario with the CAP reform in 2008-12. The scenario where pig production is kept at the 2003 level gives slightly lower emissions. A further 25% reduction of nitrogen run-off would lead to a further reduction of about 0.5 mill. tonnes CO2 equivalents per year in both 2008-12 and 2013-17. Increased conversion of agricultural area to forest would give a further reduction of 0.4 mill. tonnes CO2
equivalents per year in 2013-17,
whereas extra CO2 removals in 2008-12 only amount to one-quarter of this.
5.6 FORESTRY
Removals of CO2 in Danish forests distinguish between removals in the permanent forest existing as at 1 January 1990, and removals in new forest established since 1990. As only the latter can immediately be used in relation to Denmark’s reduc-tion commitment under the Kyoto Protocol and EU burden sharing cf. Article 3.3 of the Protocol, this section concentrates on this part of CO2 removals.
5.6.1 MethodsThe methods applied for the projec-tions of afforestation have overall used the same approach, removals factors and types of key parameters and assumptions as the inventories of historical removals in connection with afforestation for 1990-2003. Thus the time series is as consist-ent as possible for the period 1990-2030.
5.6.2 Assumptions and key parameters
The projections for CO2 sequestra-tion in forests are based on an as-sumption that for a period of six to eight years there will be fewer re-sources for planting new forests than previously, while implementation of international obligations in the nature area are carried out (Natura 2000).
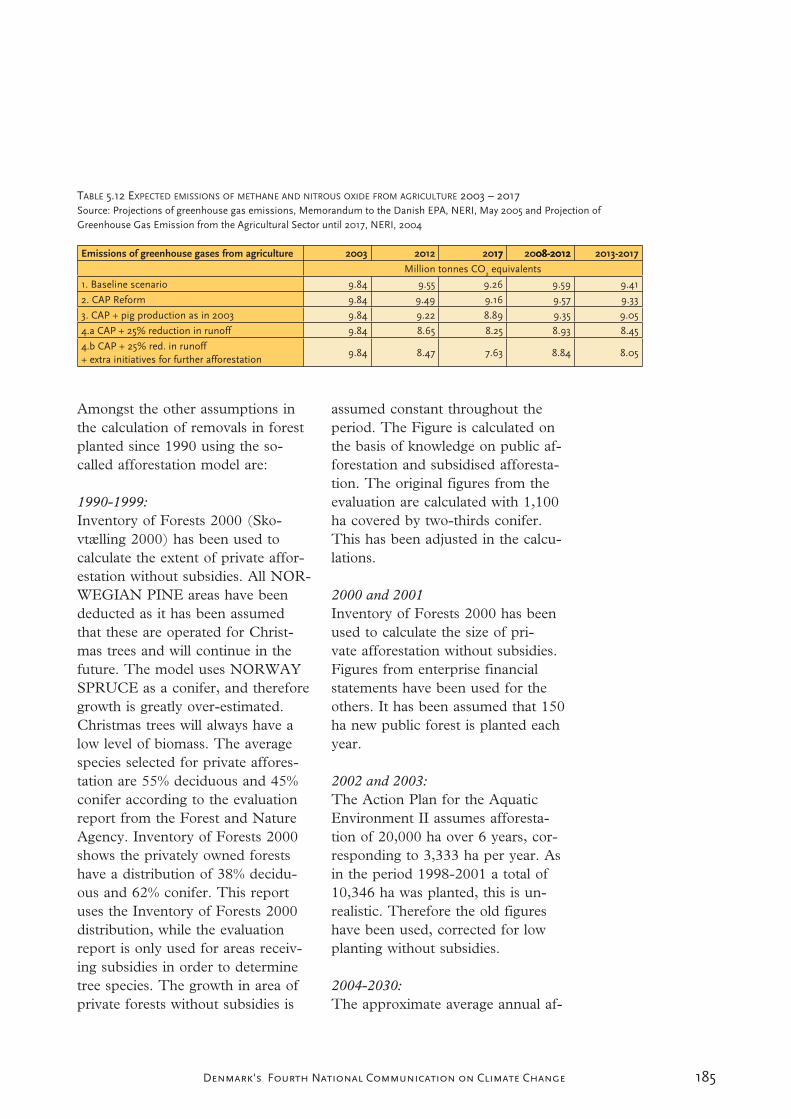
185Denmark's Fourth National Communication on Climate Change
Amongst the other assumptions in the calculation of removals in forest planted since 1990 using the so-called afforestation model are:
1990-1999:Inventory of Forests 2000 (Sko-vtælling 2000) has been used to calculate the extent of private affor-estation without subsidies. All NOR-WEGIAN PINE areas have been deducted as it has been assumed that these are operated for Christ-mas trees and will continue in the future. The model uses NORWAY SPRUCE as a conifer, and therefore growth is greatly over-estimated. Christmas trees will always have a low level of biomass. The average species selected for private affores-tation are 55% deciduous and 45% conifer according to the evaluation report from the Forest and Nature Agency. Inventory of Forests 2000 shows the privately owned forests have a distribution of 38% decidu-ous and 62% conifer. This report uses the Inventory of Forests 2000 distribution, while the evaluation report is only used for areas receiv-ing subsidies in order to determine tree species. The growth in area of private forests without subsidies is
assumed constant throughout the period. The Figure is calculated on the basis of knowledge on public af-forestation and subsidised afforesta-tion. The original figures from the evaluation are calculated with 1,100 ha covered by two-thirds conifer. This has been adjusted in the calcu-lations.
2000 and 2001Inventory of Forests 2000 has been used to calculate the size of pri-vate afforestation without subsidies. Figures from enterprise financial statements have been used for the others. It has been assumed that 150 ha new public forest is planted each year.
2002 and 2003:The Action Plan for the Aquatic Environment II assumes afforesta-tion of 20,000 ha over 6 years, cor-responding to 3,333 ha per year. As in the period 1998-2001 a total of 10,346 ha was planted, this is un-realistic. Therefore the old figures have been used, corrected for low planting without subsidies.
2004-2030:The approximate average annual af-
Emissions of greenhouse gases from agriculture 2003 2012 201717 2008-201208-2012 2013-2017
Million tonnes CO2 equivalents
1. Baseline scenario 9.84 9.55 9.26 9.59 9.41
2. CAP Reform 9.84 9.49 9.16 9.57 9.33
3. CAP + pig production as in 2003 9.84 9.22 8.89 9.35 9.05
4.a CAP + 25% reduction in runoff 9.84 8.65 8.25 8.93 8.45
4.b CAP + 25% red. in runoff+ extra initiatives for further afforestation
9.84 8.47 7.63 8.84 8.05
TABLE 5.12 EXPECTED EMISSIONS OF METHANE AND NITROUS OXIDE FROM AGRICULTURE 2003 – 2017Source: Projections of greenhouse gas emissions, Memorandum to the Danish EPA, NERI, May 2005 and Projection ofGreenhouse Gas Emission from the Agricultural Sector until 2017, NERI, 2004
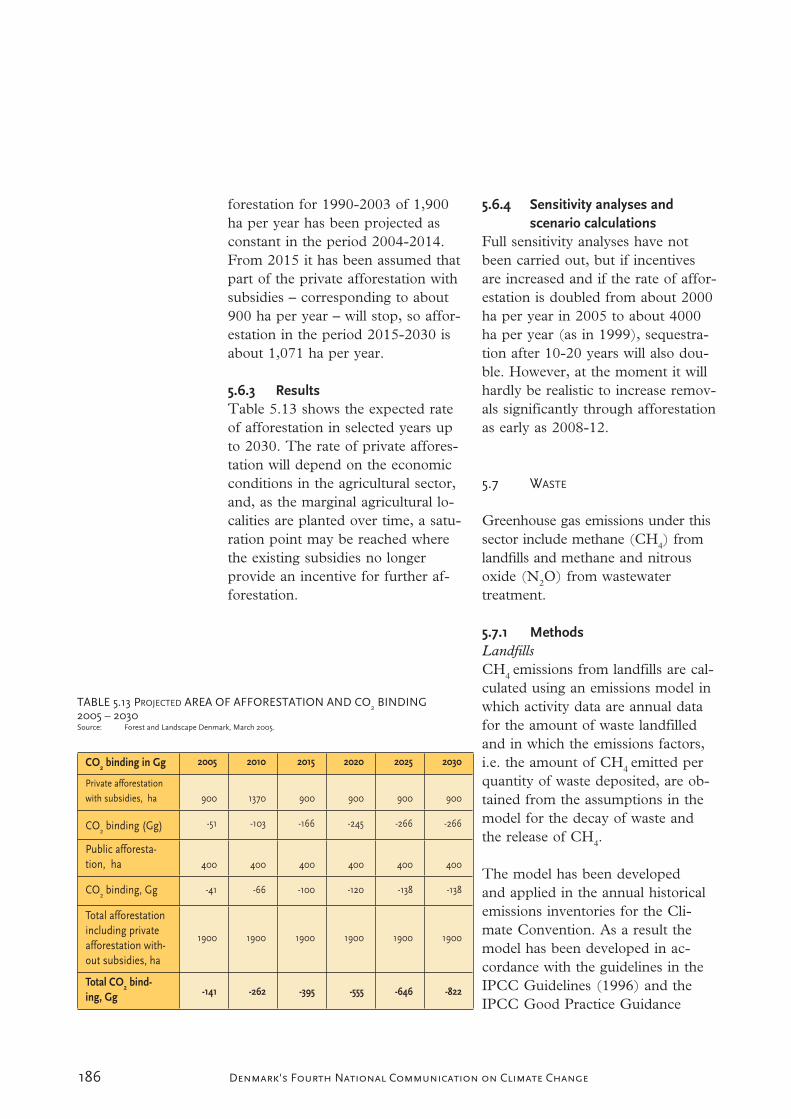
186 Denmark's Fourth National Communication on Climate Change
forestation for 1990-2003 of 1,900 ha per year has been projected as constant in the period 2004-2014. From 2015 it has been assumed that part of the private afforestation with subsidies – corresponding to about 900 ha per year – will stop, so affor-estation in the period 2015-2030 is about 1,071 ha per year.
5.6.3 ResultsTable 5.13 shows the expected rate of afforestation in selected years up to 2030. The rate of private affores-tation will depend on the economic conditions in the agricultural sector, and, as the marginal agricultural lo-calities are planted over time, a satu-ration point may be reached where the existing subsidies no longer provide an incentive for further af-forestation.
5.6.4 Sensitivity analyses and scenario calculations
Full sensitivity analyses have not been carried out, but if incentives are increased and if the rate of affor-estation is doubled from about 2000 ha per year in 2005 to about 4000 ha per year (as in 1999), sequestra-tion after 10-20 years will also dou-ble. However, at the moment it will hardly be realistic to increase remov-als significantly through afforestation as early as 2008-12.
5.7 WASTE
Greenhouse gas emissions under this sector include methane (CH4) from landfills and methane and nitrous oxide (N2O) from wastewater treatment.
5.7.1 MethodsLandfillsCH4 emissions from landfills are cal-culated using an emissions model in which activity data are annual data for the amount of waste landfilled and in which the emissions factors, i.e. the amount of CH4 emitted per quantity of waste deposited, are ob-tained from the assumptions in the model for the decay of waste and the release of CH4.
The model has been developed and applied in the annual historical emissions inventories for the Cli-mate Convention. As a result the model has been developed in ac-cordance with the guidelines in the IPCC Guidelines (1996) and the IPCC Good Practice Guidance
CO2 binding in Gg 2005 2010 2015 2020 2025 2030
Private afforestation
with subsidies, ha 900 1370 900 900 900 900
CO2 binding (Gg) -51 -103 -166 -245 -266 -266
Public afforesta-tion, ha 400 400 400 400 400 400
CO2 binding, Gg -41 -66 -100 -120 -138 -138
Total afforestationincluding privateafforestation with-out subsidies, ha
1900 1900 1900 1900 1900 1900
Total CO2 bind-ing, Gg -141 -262 -395 -555 -646 -822
TABLE 5.13 PROJECTED AREA OF AFFORESTATION AND CO2 BINDING2005 – 2030Source: Forest and Landscape Denmark, March 2005.

187Denmark's Fourth National Communication on Climate Change
(2001). On the recommendation of these reports, the model follows the Tier 2 method, which is a de-composition method. The model is described in the reports connected to the Climate Convention, most re-cently NIR2005. Briefly, the model assumes that carbon in landfilled waste decays and is converted to CH4. This process is assumed by the model to continue so that 10 years after landfilling one-half of the carbon has been converted to CH4.The model and the results have been evaluated through the Climate Convention in connection with the annual emissions inventories. The result of this evaluation has been that the model should continue to be used, unchanged, in the estimation inventories.
For the projection of emissions, the same CH4 emissions model has been used as that used in the calcula-tion of the historical emissions. The decay model for emissions of CH4
implies that fluctuations over the time series for the landfilled waste amount are much less.
Recovery of CH4 by landfill gas plants has been deducted from the calculated CH4 emissions cf. Table 5.14. Energy statistics have been used for the historical data. For the projection of this deduction for gas recovered, the Energy Authority’s general projection only includes a projection of landfill gas, and in this connection this is not considered useful. In an assignment for the Danish EPA (Danish EPA, 2005) LFG-consult (H. C. Willumsen)
reviewed Danish landfills and pre-pared scenarios for recovery of CH4
for the years 2005-2009. The result of the projection is shown in Table 5.14. For this projection a scenario (Danish EPA, 2005) without optimi-sation of the landfill gas plants has been used. The period 2010-2030 in the projection is calculated using exponential extrapolation.
WastewaterCalculations of emissions of meth-ane from wastewater handling are based on theoretical maximum emissions, called gross emissions of methane. These gross emissions are based on emissions from the entire methane potential in the amount of organic degradable material in the input wastewater at the treatment plants. The methane potential used as biogas or which is incinerated is deducted from this theoretical maximum. The resulting net meth-ane emissions are an estimate of the actual emissions of methane during wastewater treatment at treatment plants. Key parameters are industrial contributions to wastewater input to treatment plants and the fraction of wastewater sludge treated aerobi-cally.
Calculations of emissions of nitrous oxide are divided into a contribution from wastewater-treatment proc-esses at treatment plants, called direct emissions, and a contribution from output wastewater, called indirect N2O emissions.
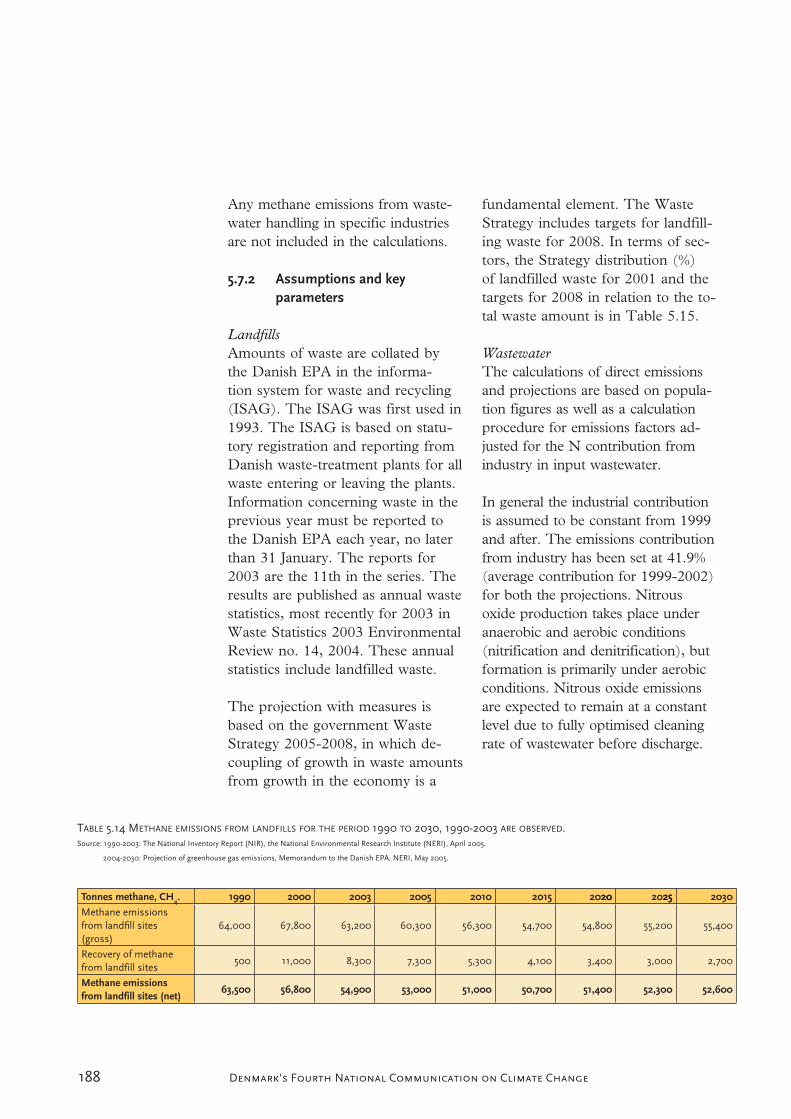
188 Denmark's Fourth National Communication on Climate Change
Any methane emissions from waste-water handling in specific industries are not included in the calculations.
5.7.2 Assumptions and key parameters
LandfillsAmounts of waste are collated by the Danish EPA in the informa-tion system for waste and recycling (ISAG). The ISAG was first used in 1993. The ISAG is based on statu-tory registration and reporting from Danish waste-treatment plants for all waste entering or leaving the plants. Information concerning waste in the previous year must be reported to the Danish EPA each year, no later than 31 January. The reports for 2003 are the 11th in the series. The results are published as annual waste statistics, most recently for 2003 in Waste Statistics 2003 Environmental Review no. 14, 2004. These annual statistics include landfilled waste.
The projection with measures is based on the government Waste Strategy 2005-2008, in which de-coupling of growth in waste amounts from growth in the economy is a
fundamental element. The Waste Strategy includes targets for landfill-ing waste for 2008. In terms of sec-tors, the Strategy distribution (%) of landfilled waste for 2001 and the targets for 2008 in relation to the to-tal waste amount is in Table 5.15.
WastewaterThe calculations of direct emissions and projections are based on popula-tion figures as well as a calculation procedure for emissions factors ad-justed for the N contribution from industry in input wastewater.
In general the industrial contribution is assumed to be constant from 1999 and after. The emissions contribution from industry has been set at 41.9% (average contribution for 1999-2002) for both the projections. Nitrous oxide production takes place under anaerobic and aerobic conditions (nitrification and denitrification), but formation is primarily under aerobic conditions. Nitrous oxide emissions are expected to remain at a constant level due to fully optimised cleaning rate of wastewater before discharge.
Source: 1990-2003: The National Inventory Report (NIR), the National Environmental Research Institute (NERI), April 2005.
2004-2030: Projection of greenhouse gas emissions, Memorandum to the Danish EPA, NERI, May 2005.
Tonnes methane, CH4. 1990 2000 2003 2005 2010 2015 202020 202525 2030
Methane emissionsfrom landfill sites(gross)
64,000 67,800 63,200 60,300 56,300 54,700 54,800 55,200 55,400
Recovery of methanefrom landfill sites
500 11,000 8,300 7,300 5,300 4,100 3,400 3,000 2,700
Methane emissions from landfill sites (net)
63,500 56,800 54,900 53,000 51,000 50,700 51,400 52,300 52,600

189Denmark's Fourth National Communication on Climate Change
5.7.3 Results
LandfillsThe overall projection of methane (CH4) from landfills is described in Table 5.16.
WastewaterThe projection of total methane and nitrous gas emissions from wastewa-ter handling in CO2 equivalents is in Table 5.17.
5.7.4 Sensitivity analyses and scenario calculations
Full sensitivity analyses have not been completed, but the potential and fi-nancial aspects in possibly developing collection of methane from landfills for energy purposes will be examined in connection with The Policies and Measures Project mentioned in sec-tion 4.1.3.
5.8 TOTAL EMISSIONS OF GREENHOUSE
GASES IN THE PROJECTION WITH
MEASURES
5.8.1 Carbon dioxide, CO2
Table 5.18 shows the expected development in CO2 emissions. A more detailed projection is in annex E. The biggest source of CO2 emis-sions in Denmark is combustion of fossil fuels, including electricity and heat production and transport.
The transport sector has had the biggest increase in CO2 emissions since 1990, and the emissions are expected to continue rising for the whole of the projection period. CO2
emissions from the transport sec-
tor were 10,441 Gg of CO2 in 1990 and had risen to 12,785 Gg of CO2
in 2003, whereas the projection for 2008-2012 is 13,890 Gg of CO2
annually. Emissions from energy production, including conversion and distribution have varied in 1990-2003 due to great variations in exports/imports of energy. Emissions from the production of electricity were 26,173 Gg of CO2 in 1990 and 31,402 Gg of CO2 in 2003, whereas the projection for 2008-2012 is 29,021 Gg of CO2 annually, of which 4,400 Gg of CO2 are due to electricity exports.
The total CO2 emissions with-out land-use change and forestry (LUCF) was 52,887 Gg in 1990 and 59,329 Gg in 2003, while for the period 2008-2012 it has been calculated that the average annual
Source: Projections of greenhouse gas emissions, Memorandum to the Danish EPA, NERI, May 2005 and the govern-ment’s Waste Strategy 2005-2008
Distribution
2001
Targets for
2008
Domestic waste 3 0
Bulky waste 26 25
Garden waste, etc. 1 0
Waste from institutions, trade and of-fices
12 5
Industry 22 15
Building and construction 8 8
Wastewater treatment plants 6 5
Power plants 1 10
Total 10 9
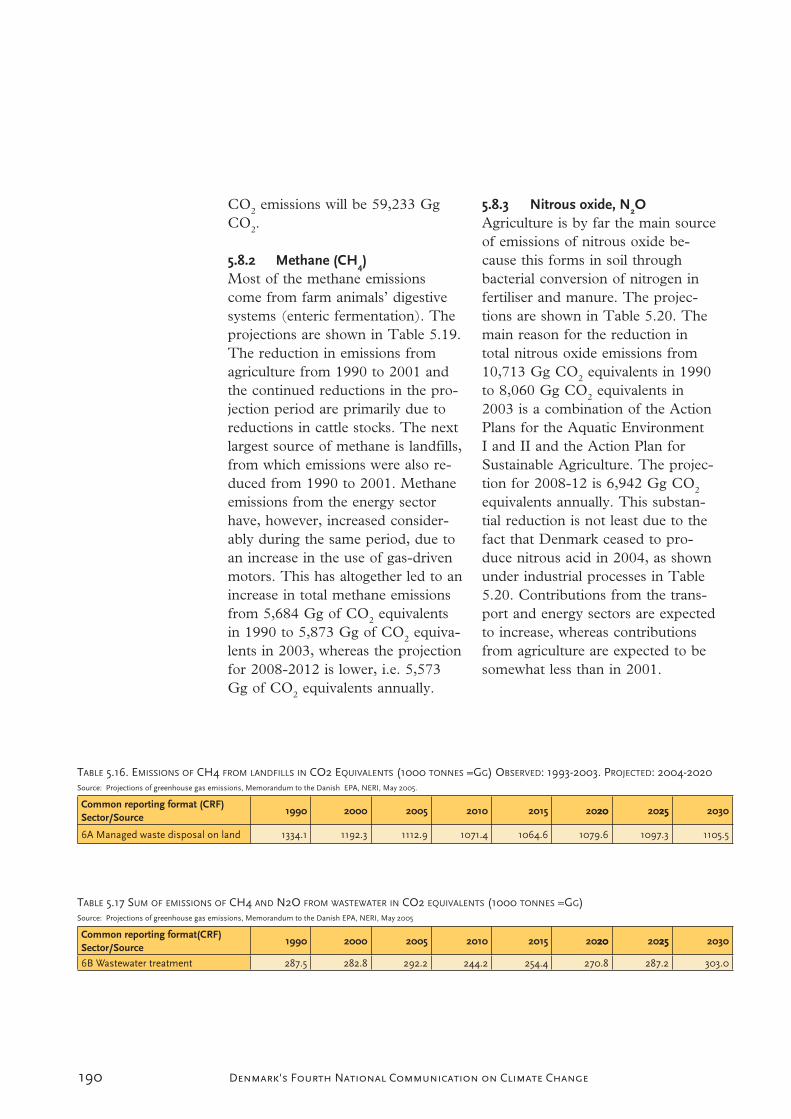
190 Denmark's Fourth National Communication on Climate Change
CO2 emissions will be 59,233 Gg CO2.
5.8.2 Methane (CH4)Most of the methane emissions come from farm animals’ digestive systems (enteric fermentation). The projections are shown in Table 5.19. The reduction in emissions from agriculture from 1990 to 2001 and the continued reductions in the pro-jection period are primarily due to reductions in cattle stocks. The next largest source of methane is landfills, from which emissions were also re-duced from 1990 to 2001. Methane emissions from the energy sector have, however, increased consider-ably during the same period, due to an increase in the use of gas-driven motors. This has altogether led to an increase in total methane emissions from 5,684 Gg of CO2 equivalents in 1990 to 5,873 Gg of CO2 equiva-lents in 2003, whereas the projection for 2008-2012 is lower, i.e. 5,573 Gg of CO2 equivalents annually.
5.8.3 Nitrous oxide, N2OAgriculture is by far the main source of emissions of nitrous oxide be-cause this forms in soil through bacterial conversion of nitrogen in fertiliser and manure. The projec-tions are shown in Table 5.20. The main reason for the reduction in total nitrous oxide emissions from 10,713 Gg CO2 equivalents in 1990 to 8,060 Gg CO2 equivalents in 2003 is a combination of the Action Plans for the Aquatic Environment I and II and the Action Plan for Sustainable Agriculture. The projec-tion for 2008-12 is 6,942 Gg CO2
equivalents annually. This substan-tial reduction is not least due to the fact that Denmark ceased to pro-duce nitrous acid in 2004, as shown under industrial processes in Table 5.20. Contributions from the trans-port and energy sectors are expected to increase, whereas contributions from agriculture are expected to be somewhat less than in 2001.
TABLE 5.16. EMISSIONS OF CH4 FROM LANDFILLS IN CO2 EQUIVALENTS (1000 TONNES =GG) OBSERVED: 1993-2003. PROJECTED: 2004-2020Source: Projections of greenhouse gas emissions, Memorandum to the Danish EPA, NERI, May 2005.
Common reporting format (CRF)Sector/Source
1990 2000 2005 2010 2015 202020 202525 2030
6A Managed waste disposal on land 1334.1 1192.3 1112.9 1071.4 1064.6 1079.6 1097.3 1105.5
TABLE 5.17 SUM OF EMISSIONS OF CH4 AND N2O FROM WASTEWATER IN CO2 EQUIVALENTS (1000 TONNES =GG)Source: Projections of greenhouse gas emissions, Memorandum to the Danish EPA, NERI, May 2005
Common reporting format(CRF)Sector/Source
1990 2000 2005 2010 2015 202020 202525 2030
6B Wastewater treatment 287.5 282.8 292.2 244.2 254.4 270.8 287.2 303.0

191Denmark's Fourth National Communication on Climate Change
5.8.4 Industrial gases HFCs, PFCs and SF6
In accordance with the possibili-ties offered in the Kyoto Protocol, Denmark has chosen 1995 as the base year for emissions of the in-dustrial gases HFCs, PFCs and SF6.Total emissions of these gases cor-responded to 326 Gg CO2 equiva-lents in 1995 and annual emissions have more than doubled since the year 2000. The rate of increase has decreased since 2003, when emis-sions corresponded to 746 Gg CO2
equivalents.
The decrease in the rate of increase is primarily due to taxes and regula-tions introduced concerning the use of new installations/products. For the period 2008-12 total emissions of industrial gases corresponding to 768 Gg CO2 equivalents annually are projected, after which a major reduction in emissions of HFCs, the major contributors, is expected and will result in a considerable reduc-tion in emissions of industrial gases following the first period of commit-ment.
5.8.5 Denmark’s total greenhouse gas emissions and removals
Table 5.22 shows the base year and projections of Denmark’s total greenhouse gas emissions and removals.
5.9 PROJECTIONS WITHOUT MEASURES
According to the guidelines for national reporting, projections in National Communications could also
include any results from projections “without measures”, i.e. projections without the expected effects of measures implemented after a certain point in time.
The Effort Analysis from 2005 includes such a projection of Denmark’s greenhouse gas emissions in 2008-2012 excluding measures which were implemented from 1990 to 2001. The results of the MeasuresAnalysis are described in Annex B2.
Note that the analysis has been prepared on the basis of the previous projection which include the effect of measures described in Denmark’s Third National Communication as the analysis was started in 2003.
As stated in Annex B2 in the Efforts Analysis, it has been estimated that average Danish emissions of greenhouse gases in 2008-2012 would have been 95.6 mill. tonnes CO2 equivalents– i.e. about 15.6 mill. tonnes CO2 equivalents greater that the previous projection with measures, if the measures initiated in the period 1990-2001 had not been initiated.
5.10 PROJECTIONS WITH ADDITIONAL
MEASURES
In accordance with the reporting guidelines for National Communications, it is also possible to include information on greenhouse gas projections where the expected effects of additional
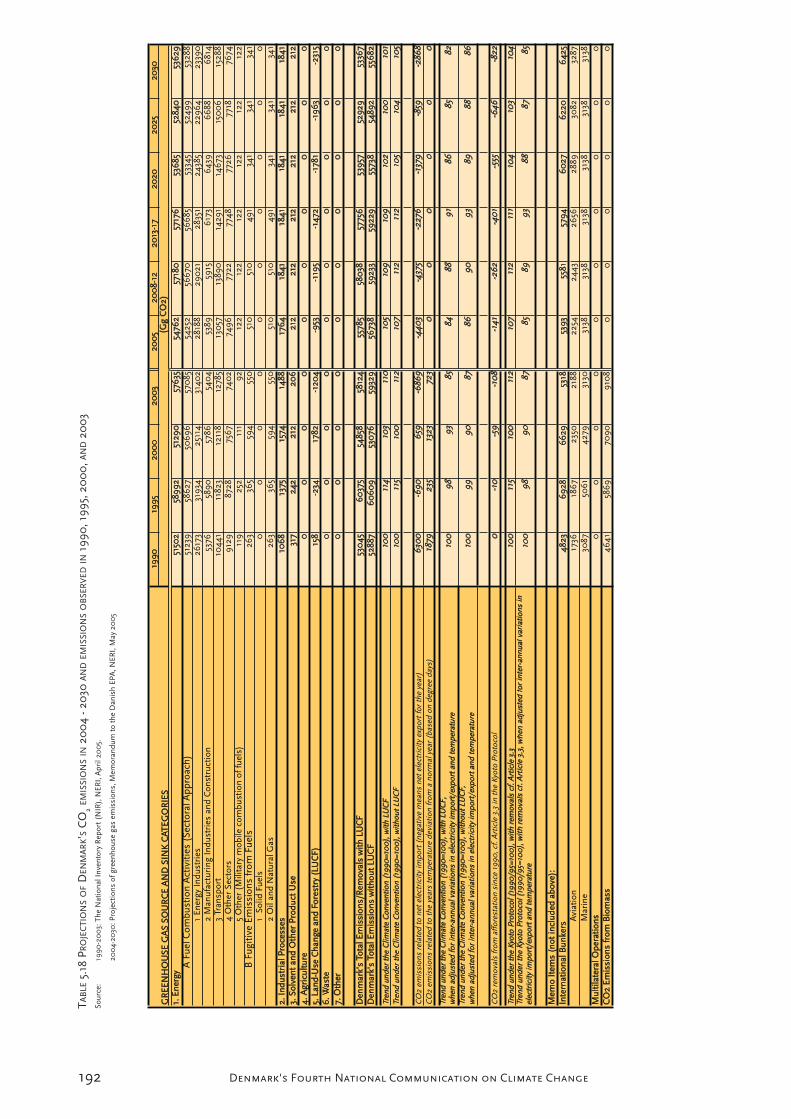
192 Denmark's Fourth National Communication on Climate Change
TAB
LE5.
18PR
OJE
CTI
ON
SO
F D
ENM
AR
K’S
CO
2EM
ISSI
ON
SIN
200
4-2
030
AN
DEM
ISSI
ON
SO
BSE
RV
EDIN
1990
,199
5,20
00
,AN
D20
03
Sour
ce:
1990
-20
03:
The
Nat
iona
lInv
ento
ryR
epor
t(N
IR),
NER
I,A
pril
200
5.
200
4-20
30:P
roje
ctio
nsof
gree
nhou
sega
sem
issi
ons,
Mem
oran
dum
toth
eD
anis
hEP
A,N
ERI,
May
20
05
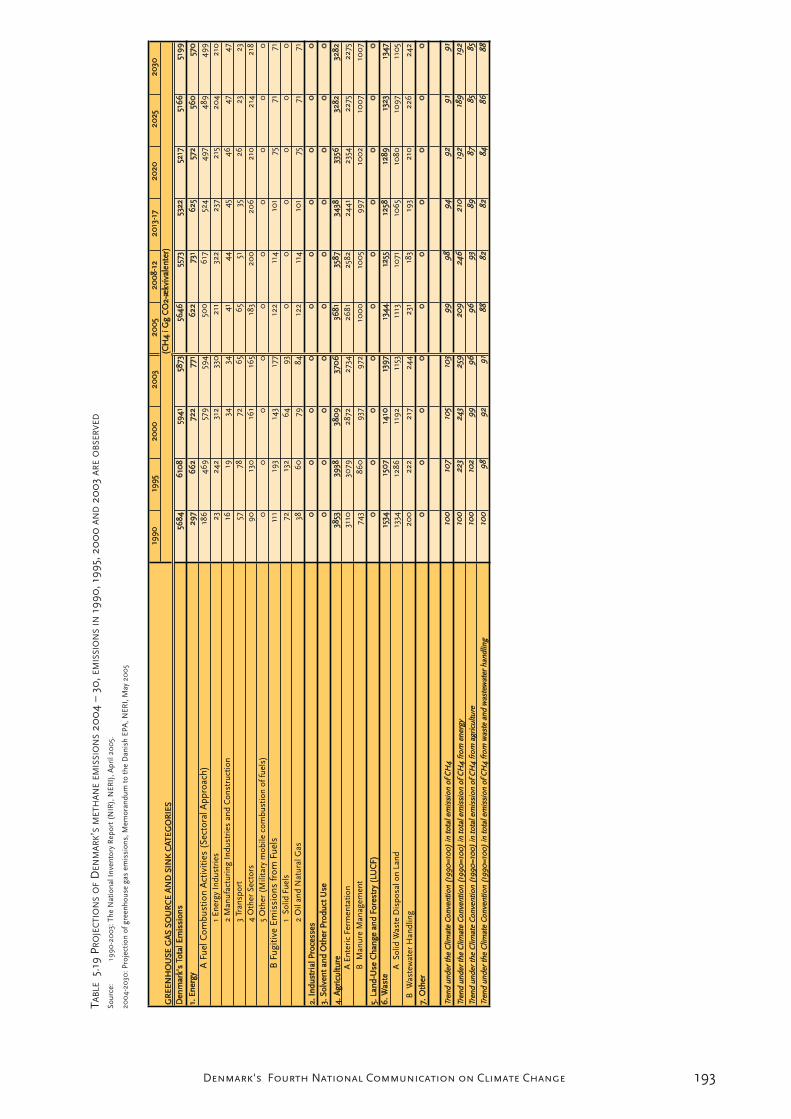
193Denmark's Fourth National Communication on Climate Change
Sour
ce:
1990
-20
03:
The
Nat
iona
lInv
ento
ryR
epor
t(N
IR),
NER
I),A
pril
200
5.
200
4-20
30:P
roje
ctio
nof
gree
nhou
sega
sem
issi
ons,
Mem
oran
dum
toth
eD
anis
hEP
A,N
ERI,
May
20
05

194 Denmark's Fourth National Communication on Climate Change
Sour
ce:1
990
-20
03:
The
Nat
iona
lInv
ento
ryR
epor
t(N
IR),
NER
I,A
pril
200
5.
2
00
4-20
30:P
roje
ctio
nof
gree
nhou
sega
sem
issi
ons,
Mem
oran
dum
toth
eD
anis
hEP
A,N
ERI,
May
20
05.

195Denmark's Fourth National Communication on Climate Change
Sour
ce:1
990
-20
03:
The
Nat
iona
lInv
ento
ryR
epor
t(N
IR),
NER
I,A
pril
200
5
20
04-
2030
:Pro
ject
ion
ofgr
eenh
ouse
gas
emis
sion
s,M
emor
andu
mto
the
Dan
ish
EPA
,NER
I,M
ay 2
00
5

196 Denmark's Fourth National Communication on Climate Change
policies and measures that are planned but still not implemented are included.
The Government Climate Strategy from 2003 contains a number of expected effects of supplemental policies and measures that are planned but still not implemented.
The Strategy does not, however, include a projection with additional measures included in such a way that effects of specific additional measures are included in a traditional manner.
Such a projection would also be incomplete. This is partly because the requirements of the Climate Strategy state that cost effectiveness is to be regularly reassessed as the costs of the possible further measures may change over time. Furthermore, from 1 January 2005, about half of Danish emissions of greenhouse gases are subject to allowance regulation in order to ensure that a predetermined goal is achieved without previously setting how the enterprises subject to allowance regulation are to meet these goals. With the allowance regulation, it is left to the individual businesses to decide whether market conditions make the buying of extra allowances or the implementation of emission-reducing measures - e.g. saving energy - most favourable.
With the coming into force of the Kyoto Protocol, demands have shifted from traditional projections of greenhouse gas emissions to
more appropriate target-fulfilment projections, which is expressed by e.g. the inclusion of expected effects of funds already allocated to JI and CDM projects in Table 5.1.
If additional, specific cost-effective measures that should be included in future planning of reduction efforts are found in connection with ThePolicies and Measures Project (section 4.1.3), then up-dated projections can be made where expected effects of these additional measures are included.
5.11 GREENLAND AND THE FAROE
ISLANDS
5.11.1 GreenlandWith respect to the expectations concerning future greenhouse gas emissions in Greenland, the pro-jections cover only electricity and district heat production. Since the Third National Communication, only small updates have been made to the projections for 2005 because of updated historical emissions fig-ures for 2000-2003. The results are in Table 5.23.
The projections for CO2 emissions from electricity and district heat production are based on a projected increase in energy consumption of 1% up to 2006, after which they will stagnate. The projections are also based on the fact that a hydropower station is under construction and ex-pected to go into operation in 2008.

197Denmark's Fourth National Communication on Climate Change
Sour
ce:
1990
-20
03:
Nat
iona
lInv
ento
ryR
epor
t(N
IR),
NER
I,A
pril
200
5.
200
4-20
30:P
roje
ctio
nof
gree
nhou
sega
sem
issi
ons,
Mem
oran
dum
toth
eD
anis
hEP
A,N
ERI,
May
20
05.
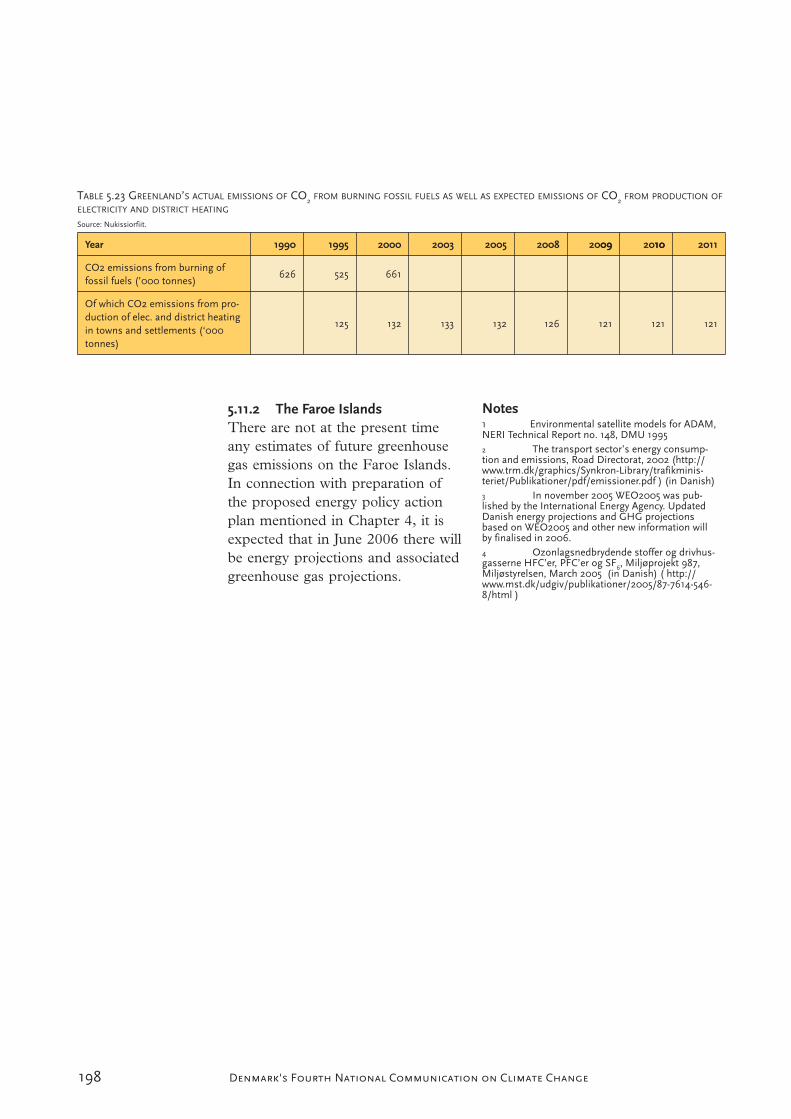
198 Denmark's Fourth National Communication on Climate Change
5.11.2 The Faroe IslandsThere are not at the present time any estimates of future greenhouse gas emissions on the Faroe Islands. In connection with preparation of the proposed energy policy action plan mentioned in Chapter 4, it is expected that in June 2006 there will be energy projections and associated greenhouse gas projections.
Notes1 Environmental satellite models for ADAM,NERI Technical Report no. 148, DMU 19952 The transport sector’s energy consump-tion and emissions, Road Directorat, 2002 (http://www.trm.dk/graphics/Synkron-Library/trafikminis-teriet/Publikationer/pdf/emissioner.pdf ) (in Danish)3 In november 2005 WEO2005 was pub-lished by the International Energy Agency. UpdatedDanish energy projections and GHG projectionsbased on WEO2005 and other new information willby finalised in 2006.4 Ozonlagsnedbrydende stoffer og drivhus-gasserne HFC’er, PFC’er og SF6, Miljøprojekt 987,Miljøstyrelsen, March 2005 (in Danish) ( http://www.mst.dk/udgiv/publikationer/2005/87-7614-546-8/html )
Source: Nukissiorfiit.
Year 1990 1995 2000 2003 2005 2008 200909 201010 2011
CO2 emissions from burning offossil fuels (’000 tonnes)
626 525 661
Of which CO2 emissions from pro-duction of elec. and district heatingin towns and settlements (‘000tonnes)
125 132 133 132 126 121 121 121
199Denmark's Fourth National Communication on Climate Change
6.1 CLIMATE IN THE FUTURE
In relation to future global climate change, Denmark is a robust country. This is primarily because of a long tradition of legislation which prevents building in river valleys, along the coast and in forests. Agricultural land is well-drained and many farmers are able to irrigate in dry periods. Moreover, the Danish population is aware of, and uses systematic warning systems of extreme weather events and the consequences thereof.
Natural and man-made forcings of the climate of the future, e.g. volcanic eruptions, varied solar activity, increased greenhouse effect and emissions of aerosols are best assessed using climate models. Simple projections on the basis of the current climate and observed trends only provide a limited impression of possible future climate changes. Climate models, which are based on the laws of physics and facts, are mathematical descriptions of the components of the climate system: atmosphere, ocean, ice and snow, land surfaces and the biosphere. Calculations are carried out on large computers and increasingly demand cooperation between modelling centres in order to reduce or quantify uncertainties.
The most important source of uncertainty regarding the future climate is related to the lack of knowledge on future greenhouse gas emissions. In addition there is uncertainty regarding the
6 Vulnerability assessment, climate change impacts and adaptation measures
sensitivity of the climate system to these greenhouse gases. Finally, uncertainty is linked to the interrelationship between changes in the global climate and the regional effects that may arise. These effects can be divided into direct consequences of climate change and indirect effects resulting from climate change in countries outside the Danish Realm.
6.2 CLIMATE TRENDS IN DENMARK
6.2.1 The latest developmentsSince the Ice Age, Denmark has had a temperate coastal climate. This climate, with wet winters and cool summers is now changing. The latest statistics1 from DMI (Dan-ish Meteorological Institute) show that the mean temperature is ap-proaching 8.5 C, an increase of almost 1.5 C since the end of the 19th century. This increase is more than double the increase in the glo-bal mean temperature for the same period. Now, the average winter temperature is most often warmer than 2ºC and the average summer temperature is about 16ºC.
The annual precipitation measured in Denmark is now about 750 mm. This has increased by about 15% - or 100 mm – since records began in 1874. Precipitation is greatest in west and Southern Jutland, with almost 1000 mm, and least precipi-tation is measured on the eastern islands, where about 600 mm is recorded each year. It is typical that wet areas experience the greatest
200 Denmark's Fourth National Communication on Climate Change
percentage increase. Therefore, pre-cipitation has increased most in west Jutland, by about 20% in the past 85 years. In the same period drainage into water courses has increased cor-respondingly2. As a result, run-off of nutrients from agricultural soil continues to be very large in wet years, despite national initiatives in the Action Plans for the Aquatic Environment I-III. The link between precipitation, drainage and run-off must be taken into account when the EU Water Framework Directive is to be implemented.
The Danish climate has become more maritime in the 20th century. On average, the cloud cover has increased by about 5 percentage points since observations began in 1874. With the clouds, more pre-cipitation has come, there are fewer days with snow cover, and tempera-tures are higher. The direct conse-quences such as decreased need for ice-breaking, shorter sledging season, earlier pollen season, longer growing season and longer swimming season, can already be felt by the Danish population.
The sea level around Denmark has risen over the past 115 years. The maximum observed rise is in south-western Denmark, where the water level is rising by about 1 mm per year. In northern and eastern Den-mark uplift of the land after the Ice Age is roughly in line with the rise in sea level.
6.2.2 Projected climate changes in Denmark
The natural causes of future cli-mate change are difficult to assess in advance. The basis for assessing the increased greenhouse effect is also uncertain for several reasons. An important source of uncertainty about the future climate arises from the lack of knowledge about future global emissions of greenhouse gases and other substances that affect the climate. Moreover, there is uncer-tainty regarding the sensitivity of the climate system to these greenhouse gases.
DMI/Denmark’s Climate Centre (in cooperation with the Hadley Centre for Climate Prediction and Research and the Max Planck Institut für Me-teorologie in Hamburg) has carried out global and regional calculations for several internationally recog-nised scenarios for future emissions of greenhouse gases and aerosols3.Analyses with global and regional climate models show the following general trend for the climate in Den-mark in the period 2071-2100 in relation to 1961-1990:
A rise in the annual mean tem-perature of 3-5°C, depend-ing on the chosen scenario for emissions of greenhouse gases. Greatest warming at night and no major difference between the increase in summer and winter. Warming leads to fewer days with frost and snow and less days with snow cover.

201Denmark's Fourth National Communication on Climate Change
An increase of 10-40% in winter precipitation and a reduction in the order of 10-25% in summer precipitation. A clear tendency towards more episodes with very heavy precipitation, par-ticularly in autumn and lengthy dry periods, especially in the summer.
A tendency towards more fre-quent westerly winds and at the same time a shift of the storm tracks over the North Atlantic slightly eastward, leading to a small increase in storm activity over Denmark and the adjacent waters. On this basis, calcula-tions with storm surge models show that the highest sea level in the more extreme cases could rise by 5-10% relative to to-day (about 0.3 m on the west coast)4. In addition to this there is the global rise in sea level which the IPCC estimate at be-tween 0.1-0.9 m over the level today.
A combined positive effect on the runoff from landareas has been cal-culated. There would be an increase of the order of 10% in the period December to April when the con-incided effect of increased winter precipitation and greater evaporation is taken into account. A bigger run-off in the entire Baltic region could make the surface layers in the inner Danish waters less saline. In combi-nation with changed wind conditions and increased run-off of nutrients, this could present a risk of negative consequences for marine ecosystems
and commercial fish stocks in the form oxygen depletion.
Note that the uncertainty mentioned above is significant in assessing fu-ture climate change, especially in projecting precipitation and extreme weather phenomena such as storms and floods. The DMI models and most other models show climate sensitivity at about 3 C for a dou-bling in the CO2 content in the at-mosphere, but new model studies, published in 2005 in the journal Nature5, show that climate sensitivity could be considerably greater than hitherto assumed.
6.2.3 Impacts and Denmark’s possibilities for adaptation
Earlier evaluationsThe impacts of possible climate changes in Denmark have been evaluated several times since 1988, and most recently in the Danish EPA report of 2004: Adapting to the climate of the future6. The general conclusion is that the direct impacts in moderate climate scenarios would be modest and could be countered by suitable ongoing adaptation. Overall, estimates indicate that it will be an advantage to plan long-term and keep to appropriate safety margins. At first, this means iden-tifying the areas of society which require short-term decisions, whilst continuously improving the basis for decisions which can wait. The Re-port points out that changes in the extreme climate could be the cause of the greatest future surprises for the Danish people. Local decision-

202 Denmark's Fourth National Communication on Climate Change
makers are encouraged to incorpo-rate climate change in all current decisions on planning and ongoing maintenance. In October 2005 the Danish government initiated prepa-rations to meet the primary impacts of climate change. The purpose is on the basis of three possible future climate scenarios to establish a cata-logue of consequences and meas-ures.
Systematic evaluations have not been made of secondary impacts for Denmark, for example in the form of changing tourist patterns, environmental refugees, agricultural prices/subsidies, or changed possi-bilities for wind turbine exports. For a small, export-oriented and open economy such as Denmark, such secondary impacts could easily be more important than the primary impacts.
Water resourcesThe size of the water resource is in-fluenced by both access to ground-water and consumption of water. With the prospect of warmer sum-mers, with greater risks of heavy downpours and longer periods with-out precipitation or even of drought, Denmark can expect an increased demand for water for several pur-poses:
In urban areas a need will arise for cooling and watering of green areas. The existing prob-lems of over-use of groundwater resources close to urban areas could be exacerbated.
In rural areas the need to irrigate will increase significantly, and the current problems with con-flicts of interest between agricul-ture and natural aquatic envi-ronments could be exacerbated.
Net precipitation is expected to increase as a result of the increas-ing difference between winter and summer precipitation. A change in precipitation patterns with fewer rain events, but of greater intensity will, however, affect surface drainage and thus formation of groundwater.
Just as important as the quantity of groundwater is its quality. Along low-lying coasts, the intrusion of salt water may affect the quality of groundwater. With a rising sea level, salt penetration would present a greater risk, which may lead to limi-tations on water-extraction possibili-ties in more places than is the case today.
Two studies in 2003 and 2004 have indicated the need for extraordi-nary action in the water area. In its report, the Academy of Technical Sciences7 pointed in particular to the need to plan renovation of drain-age systems so that they will also be able to function in a future wetter climate. Furthermore, in 2003 the Danish Board of Technology8 held workshops aimed at the public on the local possibilities for adapting to a global sea-level rise of half a meter. One of the more surprising results was that it was not important to promote construction of fixed in-stallations to secure against flooding
203Denmark's Fourth National Communication on Climate Change
of agricultural land. There was some agreement on an approach based on appropriate adaptation through slow, natural development of the coastline.
AgricultureFor Danish agriculture, the overall effects are estimated to be advanta-geous. Changes in cultivation prac-tice can be implemented at short notice, and production is expected to grow with rising temperature and CO2 concentrations. EU regulation is currently causing a development leading to less dairy production and increasing production of pig meat. The projected climate changes could reinforce this trend because market constraints in the dairy sector would limit production. In this context, the forthcoming EU CAP will play a greater role than climate change. Despite the extreme summer heat in Germany, France and Spain in 2003, where the harvest in several places fell by up to 30%, there was no overall drop in farmers’ incomes because higher prices meant better profits in the countries which were not affected. In the longer term – in a climate under change – Denmark is favourably placed in the EU inter-nal market.
However, higher temperatures and humidity could increase the risk of pests and plant diseases, resulting in an increased demand for pesti-cides. At the same time, increased production would require more nutrients for plants, which, together with more precipitation and higher soil temperatures in winter, as well as irrigation in summer, would in-
crease the risk of nutrient leaching and run-off. Implementation of the EU Water Framework Directive will help ensure both cost-effective agri-culture and long-term protection of water resources in a future changed climate.
ForestryClimate change, for instance chang-es in temperature, precipitation, and wind affects flora and fauna. The long lifecycle of forest trees (typical-ly 80-100 years) and a limited ability to adapt within one tree generation may cause a number of problems.
Denmark is placed centrally in a vegetation belt of temperate de-ciduous forest, and, with moderate future climate change, a majority of existing tree species that thrive well today are expected to persist in Denmark. Norway spruce, how-ever, may be the exception. Norway spruce occures naturally in regions with cold winters, and the species has already shown signs of poorer health in periods with warmer win-ters and much precipitation. Sum-mers characterised by drought may have a potentially larger effect on Norway spruce, because its roots do not reach as far into the ground as other species. Norway spruce makes up approx. 28% of the area covered by vegetation, and – often being grown in monoculture – there is also a large risk of forest fires, even if to-day this is not a major problem.
Beside its effects on the growth of trees, regeneration dynamics, and stability, a changed climate may also

204 Denmark's Fourth National Communication on Climate Change
pave the way for introduction of new pests or for propagation of ex-isting known pests, which, possibly in combination with weakened veg-etation, may cause problems relating to forest health and stability. Chang-es in forest management practices could be one way to adapt.
A higher atmospheric content of CO2 and longer growth seasons will increase forest increment, and will also improve water household of trees in connection with photosyn-thesis. In contrast, warmer and drier summers may cause problems relat-ing to water household, and be sig-nificant in relation to forest health, which again may reduce forest incre-ment.
Already today, the National For-est Programme, the Forest Act, and associated support schemes, are as-sisting in the development of more robust forests, making them more flexible and tolerant towards chang-ing climate variables, for instance precipitation. Adaptation takes the form of continuous efforts to shift to near-nature forestry and focus on genetic diversity in the choice of tree species and plant material. Cooper-ating with the Royal Veterinary and Agricultural University9, the Danish Forest and Nature Agency has also been in charge of the development of new concepts for near-nature forestry. The statutory windfall pool provides for economic support for replanting robust tree species. The list of species and provinence is up-dated on a continuous basis, thus enabling the best possible adaptation
to the climate of the future. In ac-cordance with national goals, forest areas must be increased and forest landscapes must cover 20-25% of Denmark in the course of one tree generation (80-100 years.).
Natural ecosystemsMany species of fauna and flora have their natural limit of extent close to Denmark, and a certain northward shift of species could therefore be expected. However, not all foreign species would be equally welcome. Pests such as the Colorado beetle have long had their northern limit just south of Denmark. The progress of the Iberian slug in recent years may be connected with a gen-erally milder winter climate. Overall, there are a number of animal and plant species which should still be monitored because they appear to be very sensitive to climate change. Overall, it is estimated that limited changes in the climate may lead to greater biodiversity.
Both freshwater and marine ecosys-tems are sensitive to climate change. At the moment it is not possible to estimate the total impacts. A large inter-disciplinary research project called CONWOY10 is being funded by the Danish research councils. The aim is to clarify the conse-quences of future climate change on the aquatic environment. For example, long-term experiments have been initiated using artificial heating of controlled marine and lake ecosystems. The results of these experiments will be presented at a scientific conference in 2006.

205Denmark's Fourth National Communication on Climate Change
A new project, CLIMAITE11, is looking into the ability of terrestrial ecosystems to adapt to the warmer and drier climate of the future. The project will be completed in 2007/2008.
Coastal zone managementThe Danish coastline partly com-prises active coastal cliffs where the sea erodes material, and partly beach-ridge complexes, where the material is deposited in the lee of prevailing winds. About 80% of the population live in urban areas con-nected to the coast. A total of about 1800 km of coastline is protected by dykes or other fixed installations. In recent years beach nourishment has increasingly been used to protect exposed stretches of coastline. As mentioned above, at the workshops organised by the Danish Board of Technology, there seems to be some agreement with the idea of keeping a natural coastline – if necessary at the expense of agricultural areas.
A special problem is linked to low-lying areas that are exposed to both increases in the sea level and are un-der pressure from increasing drain-age from the land. In particular, many of the coastal towns near estu-aries of larger rivers or at the bottom of fjords could have complex prob-lems. Merely building higher dykes, for instance, is not a long-term so-lution as the problem of backwater flooding will just become greater as a result of river water being unable to flow freely into the sea. A long-term solution requires the involve-ment of river valleys further inland.
There is a need for space for rivers to allow flood plains to flood regu-larly to take some of the pressure off at river mouths. One of the tools to change land use in river valleys could be through the EU agricultural subsidy schemes, to make river val-leys far more multi-functional.
Energy supplyUp to now, Denmark has been able to adapt energy systems to the exist-ing temperate coastal climate which traditionally has no need for, e.g. air conditioning (although many new cars are now fitted with an air-conditioning system). Overall, the climate changes will imply less heating needs, and this will lead to significantly less energy consump-tion. The current conversion from fossil fuels, including gas and oil from the North Sea, to various re-newable energy sources, is increasing Denmark’s dependency on weather and climate-sensitive energy sources. The scenarios show that there will be more wind for wind turbines. Furthermore, increased precipita-tion will affect neighbouring Nordic countries, meaning more supply of hydro-electricity. However, the sup-ply of electricity will probably be more unstable due to natural varia-tions in climate. Finally, it is possible to convert energy production to bio-fuels. These are also climate-sensi-tive to some degree, especially if the storm climate changes and larger areas of Norway spruce plantations are blown down and must be burnt.
If the need for air conditioning in housing, agricultural buildings and
206 Denmark's Fourth National Communication on Climate Change
other commercial buildings increases in line with increases in temperature, it will be necessary to consider the consequences for humans and ani-mals without access to air condition-ing. Recent studies from London12
indicate that increased use of air conditioning could move the heat problem into the streets. To a cer-tain extent, the same can be said of air conditioning in cars. Thus, it is important to think more long-term in this area.
HealthOver the next 100 years, the pro-jected changes in climate could lead to direct health impacts in the form of a higher risk of heat stroke, espe-cially amongst the old and sick. The extreme summer heat in Europe in 2003, for example, led to increased mortality in several European coun-tries. It has been estimated that as many as 30,000 additional deaths can be ascribed to the extreme sum-mer heat. It is already possible to ascertain that the health impacts of greater amounts of pollen and the earlier pollen season can possibly ex-plain the increase in the incidence of allergies. Finally, there is a risk that vector-borne diseases could become more widespread, for example, from more malarial mosquitoes, or more Borrelia or TBE-bearing ticks.
A greater risk of new infection paths and sources could also arise because of an increasing number of refugees – possibly from climate and environ-mental disasters in other countries. This would increase the risk not only of “southern” diseases, but also
of diseases that are presently under control in Denmark - e.g. tubercu-losis.
6.3 CLIMATE CHANGES IN GREENLAND
Greenland has an Arctic climate. About 80% of the land is covered by the up to 3 km-thick ice sheet, while the ice-free land areas are limited to a coastal strip 50-300 km wide. Furthest south, and closest to the edge of the ice, the climate is sub-Arctic with a mean temperature of more than 10°C in July. The climate in south-west Greenland, where most of the 55,000 population live is low-Arctic. It is characterised by relatively mild winters with a lot of snow and periods of thaw and wet summers with average temperatures of less than 10°C in the warm-est month. North and north-east Greenland are in the high-Arctic zone. The climate has continental characteristics with very cold win-ters – down to minus 50 degrees (Celsius) in north Greenland. The temperature is rarely above freez-ing from September to May. Winter precipitation is limited as parts of north Greenland has a desert climate with less than 25 mm precipitation per year, corresponding to about 1% of the precipitation at the southern tip of Greenland. The continental climate in high-Arctic Greenland is ascribed to the Polar Ice from the Arctic Ocean, which hitherto have made up the often up to sev-eral-hundred-kilometre-wide belt of pack-ice, which floats southwards along the east coast of Greenland.
207Denmark's Fourth National Communication on Climate Change
In recent years, the extent of the Polar Ice has been reduced for long periods, and this has led to unusual events such as wave erosion along the coasts which previously had not seen open sea to the same extent. The climate in high-Arctic Green-land is greatly influenced by the amount and spread of the Polar Ice.
Analyses using global and regional climate models13 show the follow-ing general trends in the climate in Greenland for the period 2071-2100 compared with 1961-1990 for a middle-high scenario:
A rise in the mean annual tem-perature in south Greenland of about 2°C, slightly more in winter than in summer. In north Greenland temperatures could rise by 6-10°C in winter, but only slightly in summer.
A general increase in precipita-tion of 10-50%. The winter increase could however be significantly greater in north Greenland – locally up to more than 200%.
Almost the entire population of Greenland live in towns and settle-ments in the low-Arctic part of the country, where the main industry is fisheries. Only in the northernmost part of the high-Arctic region on the west and east coasts are there small communities that live to some extent from hunting mammals and birds.
A description is given in the fol-lowing two sections of what could
or would happen on land and in the marine environment as a con-sequence of the expected climate changes. The description is based exclusively on general evaluations14
with the present knowledge concern-ing factors determining the welfare of the relevant species and ecosys-tems15.
6.3.1 Effects and possibility for adaptation on land
HumansSeen from the point of view of the local community, the changes men-tioned would be of limited practical importance and perhaps even an advantage in the form of more plant growth, more reindeer and musk oxen and perhaps better possibilities for farming in south Greenland. The increased thawing of the permafrost could bring problems in areas where houses, roads, airports and other structures have foundations in the permafrost, but since the vast major-ity of structures in Greenland stand on solid rock, the problem would only be a local one. Increased melt-ing of the ice cap would provide more water - for hydropower for example - but this resource is not generally a constraint today. How-ever, extensive melting may cause problems for the supply of water. The costs of heating in the winter would be reduced and there would generally be fewer problems from hard frost.
The importance of the snow coverAs a consequence of earlier snow melting in low-Arctic Greenland,
208 Denmark's Fourth National Communication on Climate Change
higher summer temperatures and more summer precipitation, a longer growing season can be expected and thus a more extensive and vigorous plant cover. Immigration of species from the south can be envisaged, but would be impeded by barriers in the form of open seawater and competition from already established species.
There is a risk of most of the high-Arctic zone disappearing together with the special fauna and flora that are adapted to precisely this zone. In north-east Greenland, large areas are completely without vegetation. There are few species of Arctic flora and fauna, and those present have adapted to the extreme climate con-ditions. Many plants and mammals depend on a stable snow cover to protect them against the cold. Other species are dependent on the snow disappearing early - or being blown away altogether in winter. The dis-tribution, duration, and thickness of the snow cover are therefore just as important factors as the temperature for the general conditions of life for many plants and animals in Green-land. In high-Arctic Greenland, more ample precipitation would pre-sumably mean more extensive plant cover, and large parts of this zone would possibly change character to become more like low-Arctic areas.
MammalsGreenland’s fauna as a whole would presumably also benefit from a milder climate and consequently more fertile and widespread plant growth, although there are important
exceptions. Many of the species in high-Arctic Greenland are depend-ent on the dry continental climate. This applies, for example, to the musk ox, where thicker snow cover and more frequent periods of thaw in winter (with the formation of ice crusts in the snow) could make it difficult for the animals to forage. Examples of this are already known with the present climatic conditions, and reindeer died out for the same reason in the whole of high-Arctic Greenland during a snowy period more than 100 years ago. The artifi-cially established population of musk oxen in south-west Greenland is hardlien likely to suffer similar prob-lems. On the contrary, both reindeer and musk oxen might thrive even better in the continental low-Arctic region.
6.3.2 Effects and possibility for adaptation at sea
HumansFor Greenland society, a warmer climate would probably mean in-creased fishing opportunities in the form of more cod, Norway haddock and other species, but fewer prawns. The possibilities for hunting ring seals and polar bears would probably be reduced, while the occurrence of several other game animals would depend more on the pressure of hunting itself.
Communication conditions would be much better because the period of open water would be longer, mak-ing it easier for boats to call at many towns and settlements. The produc-

209Denmark's Fourth National Communication on Climate Change
tion of calved ice could, however, increase by increased melting of ice, thus affecting navigation conditions. There would be far less Polar Ice. The possibility of using solid sea ice to get from place to place could be reduced as a result of thinner and later ice cover.
Melting of glaciers could have a negative effect on tourism, but the improved communication - includ-ing a longer summer season - could have a positive effect.
Marine mammalsIn north-east Greenland the ex-pected climate change would reduce the thickness of the ice in the fjords, and extend the ice-free period. As a result, more light would penetrate down in the water column, and this would stimulate biological produc-tion. Increased fresh water supply as a consequence of increased precipi-tation and melting of the ice cap in the inner parts of the fjords would increase the water exchange in the fjords and bring more nutritious water in from the open sea, thus contributing still further to increased primary production. Rising winter temperatures would mean that the ice will not reach the same thickness as today and could therefore break up more easily in spring. Overall, the walrus would benefit most from future climate change in high-Arctic Greenland.
The polar bear, on the other hand, is facing an uncertain future in east Greenland. If the ice disappears it will reduce the bears’ hunting
grounds and they would probably follow the ice northwards. Seals, which are attached to the ice, would presumably become concentrated in smaller areas with ice and would therefore be more easily accessi-ble to the bears, but in the longer term, the number of bears would decrease. In addition, the polar bear is not good at hunting seals in wa-ter. The ice conditions on the west coast of Greenland would probably not change as much as on the east coast, and the polar bears on the west coast would therefore be less affected by the climatic changes than those on the east coast.
Whales associated with sea-ice, such as the narwhale, the white whale, and the Greenland whale, would have reduced living areas in the winter months, while new areas would become available to them in the summer months. In winter, the whales would experience increased competition for food from other marine mammals. Other species of whale that use the Arctic and north-boreal waters in summer would be able to use more northern areas.
Fisheries resourcesFor many of Greenland’s fish spe-cies, the cold seas off Greenland limit their dispersal, for example, cod, Norway haddock, striped cat-fish, halibut and herring, which have their northern limit there. Therefore, relatively small variations in the temperature of the sea could result in considerable fluctuations in the dispersal of many fish species. The trend in cod fishing largely follows

210 Denmark's Fourth National Communication on Climate Change
the average sea temperature. In the last 30 years, cod and a number of other boreal fish species have largely disappeared as a consequence of a generally colder climate in south and west Greenland. Today, more cold-adapted populations of prawn, crab, and halibut constitute the main commercial fishing resources in Greenland. A change in sea currents and a rise in temperature as a conse-quence of the climate changes would probably improve the conditions for cod and some other commercially exploited fish species in these ar-eas. Increased cod stocks, however, would have a negative effect of prawn stocks due to predation.
Our knowledge about the way the ecosystems function is constantly improving, but in the case of such large changes in such a short space of time, we still know too little to make precise predictions. One of the biggest uncertainties in connec-tion with the marine environment in south Greenland is the extent to which the sea currents and thus sea temperatures follow changes in air temperature. The balance between the part of the seawater in south-west Greenland that comes from the cold east Greenland current and the part that comes from the warm North Atlantic drift (a branch of the Gulf Stream, which bends westward, south around Iceland), and the cold water masses in Baffin Bay and Davis Strait totally determines the ecological conditions off south-west Greenland, where most of Green-land’s population live.
6.4 CLIMATE CHANGES ON THE FAROE
ISLANDS
The Faeroe Islands have an extreme maritime climate, where the differ-ences between summer and winter are relatively small. Analyses with global climate models show the fol-lowing general trend for the climate on the Faroe Islands in the period 2071-2100 in relation to the period 1961-1990:16
A rise of around 3ºC in annual mean temperature. There is only a slight difference in the temperature rise in summer and winter.
A rise in winter precipitation of about 30%, but only slight or no increase in the summer.
6.4.1 Impacts and adaptation in terrestrial and marine ecosystems
Only minor changes in terrestrial ecosystems are expected following the expected climate changes. The isolation of the Faroe Islands in the Atlantic Ocean may have the conse-quence that climate-induced changes in plant and animal life will be un-balanced. Thus, the rate of possible species loss from terrestrial ecosys-tems may not be counterbalanced by a similar immigration rate, resulting in reduced species diversity.
The greatest changes are expected at sea. Warmer deep water could result in a redistribution of pelagic and benthic communities, which could lead to unexpected consequences

211Denmark's Fourth National Communication on Climate Change
for fisheries. Fish species that settle in shallow waters in the early spring such as flatfish, lumpfish, and spe-cies with pelagic drifting eggs and larvae would be at greatest risk. The incidence of cod seems to be very dependent on marine currents. That there have been more storms than normal in recent years, could have contributed to the disappearance of the cod by blowing the fry towards waters too cold for their survival. A reduction in water arriving from the south would worsen the present lack of the fry’s favourite food.
The impact on marine mammals and birds is primarily expected to concern spatial shifts in areas of food production and primary production.
6.5 ASSESSMENT OF THE SIGNIFICANCE
OF CLIMATE CHANGE FOR THE
WHOLE ARCTIC
In autumn 2004, the Arctic Coun-cil17 published its assessment of the significance of climate change for the Arctic in the report Impacts of a warming Arctic (ACIA). The report is based on contributions from more than 300 climate and climate-effect researchers and it shows that climate changes in the Arctic will be more severe than in any other place on the globe, and that this will have exten-sive consequences both regionally and globally.
The Danish Realm has contributed to the report through a number of
specific studies, projects and texts. The integrated climate and climate-effect measurement programme that has operated for almost 10 years at the high-Arctic measuring station Zackenberg in north-east Greenland has made significant contributions to describing and understanding cli-mate effects in the Arctic, and it is one of the few programmes helping establish long-term data series in the area.
It is expected that the Realm will continue this and other climate-rele-vant Arctic initiatives in future years, amongst other things as follow-up to the Arctic Council declaration on ACIA (24 November 2004) and the recommendations of the ACIA Report.
212 Denmark's Fourth National Communication on Climate Change
Notes1 Cappelen, 2000; Cappelen, 2004; Cappe-len 20052 Ministry of the Environment, 2004: Na-ture & Environment 2003 Theme: Water in Denmark.(Available at www.mst.dk)3 Christensen, 2000; Stendel et al., 2000;Stendel et al., 2001; Christensen and Christensen,2001, 2003, 2004; May,1999; May, 2001; Andersen etal., 2001; Christensen at al., 2002; Christensen 20054 Kaas et al. 2001: Christensen 20055 Stainforth et al., 20056 Danish EPA, 2004: Adapting to the cli-mate of the future (available at www.mst.dk)7 Academy of Technical Sciences publisheda report in 2003 in Danish: Effekter af Klimaæn-dringer – tilpasning i Danmark. (available in Danishat www.atv.dk)8 In February 2004 the Danish Board ofTechnology held two scenario workshops to involvethe public in two local areas in discussions on therisks from global rise in sea levels. The results areavailable in a report in Danish at www.tekno.dk.9 Jørgen Bo Larsen/KVL, 2005: Contribu-tion to the EPA and DMI ”Nyt Klimaforum” on 15April and Handlingsplan for naturnær skovdrift, Min-istry of the Environment, Forest and Nature Agency,May 200510 The CONWOY project is funded by Natu-ral Science Research Council (further information onthe project is available on http://www.conwoy.ku.dk/)11 The CLIMAITE project is financed byprivate funds (further information on the project isavailable on http://www.climaite.dk)12 UKCIP, 2002: London’s warming. Theimpacts of Climate Change on London. (available at(available atwww.ukcip.org.uk)13 May, 1999; Stendel et al., 200014 Assessments by Hans Meltofte and SørenRysgaard, NERI and Søren Anker Pedersen, Green-land Nature Institute, March 200315 Vibe, 1967; Heide-Jørgensen and Johnsen,1998; Petersen et al., 2001; Meltofte, 2002; Rysgaardet al., 200316 May, 1999; Stendel et al., 200017 In addition to the Danish Realm, theArctic Council comprises Canada, Finland, Iceland,Norway, Sweden, Russia and the US
213Denmark's Fourth National Communication on Climate Change
7.1 DANISH DEVELOPMENT POLICY
Denmark’s vision for regional and global sustainable development is a world with economic development, social welfare, and greater protec-tion of the environment. It includes a world market with free trade based on economic responsibility and envi-ronmental standards, and it includes respect for human rights, democra-tisation, transparency, and responsi-bility in administrations.
The overall goal of Danish devel-opment cooperation is to promote sustainable development through poverty-oriented economic growth. Denmark emphasises that develop-ment cooperation should contribute to meeting the 2015 goals adopted at the UN Summit (Millennium De-velopment Goals).
With a view to combating poverty and meeting the 2015 targets, de-velopment cooperation is organised taking account of government priori-ties to focus on good governance, assistance to refugees in local areas, the environment including climate change mitigation and adaptation, industrial development, women, and trade and development. On the basis of this, development assistance is also organised in close cohesion with other foreign and security policies.
The effort to promote national sustainable development is closely linked to the global challenges for sustainable development - and vice versa. Growing trade and interna-tional capital flows, conflicts and
7 Financial resources and transfer of technology
refugee flows, together with the increasing pressure on natural re-sources, have made individual coun-tries ever more dependent on the outside world. Denmark therefore has a great interest in contributing to sustainable development through national efforts and through the EU, the UN, the WTO, the OECD, and the international financial institu-tions, including the World Bank and the International Monetary Fund.
The world is facing many regional and global challenges. Of the 6 bn. people in the world, more than 1 bn. live on less than USD 1 per day, and a further 1.5 bn. on less than USD 2 per day. The challenge therefore consists primarily in cre-ating growth and jobs, eradicating poverty and creating better condi-tions of life for the poor people of the world. For example, one fifth of the world’s people do not have ac-cess to clean water and sanitation, and this particularly affects women, children, indigenous peoples, and other particularly exposed popula-tion groups.
Competition for scarce natural re-sources has in a number of cases led to violent conflicts, which especially in the developing countries have cre-ated huge refugee problems. Analy-ses from the Intergovernmental Pan-el on Climate Change (IPCC) show that climate change is very probably already a reality, and the greatest adverse effects of climate changes are expected in the developing coun-tries. Biodiversity is under increasing pressure, and nature’s resources are

214 Denmark's Fourth National Communication on Climate Change
often used on an unsustainable basis. The use of dangerous chemicals is a growing problem, both for human health and for fauna and flora.
There is often a close correlation between poverty and environmental problems. Thus, the poorest are the hardest hit by environmental dete-rioration. At the same time, poverty limits the possibilities for sustainable utilisation of natural resources be-cause limited resources are available for investment in protection of the environment. For example, poverty is contributing to soil exhaustion and desertification in Africa. Conversely, uncontrolled economic growth in developing countries and the slightly more developed countries in the East and South often leads to in-creased use of natural resources and burdens the environment.
In its entire international work for global sustainable development, Denmark attaches importance to the need to integrate and balance the economic dimension (poverty-ori-ented growth), the social dimension (promotion of such social sectors as education and health) and the envi-ronmental dimension (protection of the environment).
Denmark wants a strong global structure to promote all elements of global sustainable development, including a stronger structure for promotion of international environ-mental cooperation and environmen-tal regulation.
Denmark will continue working for global sustainable development by:
Integrating environmental con-siderations into policies and de-cisions.
Ensuring continued progress in the global environmental agenda. The goal is to gather responsibility for international environment cooperation in one single environment organisation.
Promoting economic cooperation and partnership for develop-ment, including combating glo-bal poverty and regulating trade and investments.
Contributing to international peace and stability and working to promote democracy and hu-man rights.
Working for continued develop-ment and democratisation of the international cooperation with the emphasis on openness and participation, including partici-pation by weaker groups.
Reducing emissions of green-house gases globally and in a cost-effective manner.
Promoting mutually committing partnerships with the private sector.

215Denmark's Fourth National Communication on Climate Change
7.2 DEVELOPMENT COOPERATION
In 2004, Danish development as-sistance amounted to about DKK 12 bn., corresponding to 0.84% of GNI. Assistance is primarily funded through section 06(3) of the Danish Finance Act. Denmark will continue to be amongst those countries grant-ing the most development assistance and will also grant at least 0.8% of GNI in development assistance in the years to come. In this way Dan-ish assistance will continue signifi-cantly above the UN target of 0.7% of GNI.
Since the change of government in Denmark in November 2001, the government in 2002 reviewed Den-mark’s development assistance and environmental assistance to develop-ing countries with the objective of prioritising it, focusing it, and mak-ing it more effective. In the strategy for Danish assistance to developing countries, A World of Difference, the government set out its new pri-orities for Danish development as-sistance for 2004-2008.
The Strategy confirms that focus will continue on long-term devel-opment work aiming at combating poverty, and that the main priority is work within the social sectors, i.e. education, health, water and sanita-tion.
It also confirms that Denmark will continue at the leading edge of de-velopment assistance, both with regard to quality and scope. The government priorities for global
environment issues and issues re-garding free trade and market-based economic growth are confirmed and enhanced in the Strategy. Moreover there are efforts to create a better interplay between environmental as-sistance and other Danish efforts to protect the global environment, including climate efforts under the Kyoto Protocol.
International climate cooperation, including the issue on the adapta-tion of developing countries to cli-mate change is also a high priority in Danish international development cooperation. In the energy area, the basis is the adoption by the Johan-nesburg Summit of the need to improve access for the poorest peo-ple to energy as a contribution to meeting the 2015 Goals (especially the poverty goal) and improving the proportion of renewable energy in the global energy supply
The government Strategy for devel-opment cooperation also involves stricter requirements for the govern-ments in the cooperation countries with regard to respect for human rights and democracy. Systematic and lasting violations of human rights and democratic rules of play are irreconcilable with qualifying for Danish assistance. This has meant that development cooperation has ceased with some cooperation coun-tries. At mid-2005, Danish pro-gramme cooperation countries were Bangladesh, Benin, Bhutan, Bolivia, Burkina Faso, Egypt, Ghana, Kenya, Mozambique, Nepal, Nicaragua,
216 Denmark's Fourth National Communication on Climate Change
Tanzania, Uganda, Vietnam, and Zambia.
Denmark seeks actively to encourage the many countries whose develop-ment assistance is below the UN objective of 0.7% of GNI to increase their assistance. At the UN 2005 Summit Meeting on the 2015 Goals, Denmark will work to encourage countries, including EU Member States, with a lower assistance per-centage that 0.7% of GNI to in-crease their assistance.
In international evaluations of Dan-ish work for developing countries, Denmark receives good results. In the regular OECD review of Danish assistance in both 1999 and 2003, Denmark was awarded top marks, and Denmark is at the top of the Commitment-to-development index in the US journal Foreign Policy.
Since 2001, the government has af-forded environmental efforts in de-velopment cooperation ever greater priority, partly on the basis of the follow-up necessary to realise the agreements and commitments from the Johannesburg Summit. One step was the preparation of a Strategy for Danish environmental work in developing countries 2004-2008, which was launched in 2004. This Strategy is the first to gather all en-vironment work under one common goal – combating poverty – and the first to integrate environment efforts with the overall development assist-ance. The Strategy emphasises that environmental efforts include climate efforts, for example one of the ele-
ments in the Strategy is to support climate efforts through capacity building. The Strategy covers the possibilities of countries to admin-ister work within the international environment conventions and to create opportunities to contribute to the development of CDM projects, which could later lead to Danish purchases of CO2 credits (see sec-tions 7.2 and 4.2.2). The Strategy also aims at promoting environmen-tal concerns as inter-disciplinary concerns in all assistance, both bilat-eral and multilateral.
With our EU partners, in 2004 Denmark adopted an action plan to integrate the climate into develop-ment cooperation. The Action Plan contains four elements:
1) greater priority to climate change in the dialogue with cooperation countries,
2) support to climate adaptation within relevant sector pro-grammes,
3) support to combating the causes of climate change by reducing greenhouse gas emissions, and
4) support for capacity develop-ment to promote developing countries’ efforts on climate change.
In 2004, the Ministry of Foreign Af-fairs set up a project group to pre-pare a Danish follow-up plan to the EU Action Plan. The Danish follow-
217Denmark's Fourth National Communication on Climate Change
up plan should be completed by the end of 2005.
7.3 NEW AND ADDITIONAL ASSISTANCE
FUNDS
Bilateral effortsDanish environment efforts are to contribute to meeting the overall target for Danish development as-sistance – combating poverty. In addition to this, within the frame-work of international development cooperation it is increasingly being recognised that the negative effects of climate change could present an obstacle to combating poverty and meeting the 2015 Goals. This means that environment efforts, including climate efforts, are an integrated element of the total Danish devel-opment work, and thus also part of work to realise the 2015 Goals.
Bilateral environment activities com-prise a large proportion of Danish International Development Assist-ance (Danida) sector programme support in Bhutan, Bolivia, Egypt, Nepal and Nicaragua. Moreover, the environment aspect is incor-porated in a number of other sec-tor programmes, not least for the sectors water, energy, agriculture, forestry, and fisheries, just as the en-vironment has been integrated into Danish efforts in other sector pro-grammes supported by Denmark. A number of independent projects are also supported by Denmark through Danida’s authority to make decentral grants. In addition there is environ-ment work funded by the special en-
vironment assistance. This includes environment activities in Cambodia, Malaysia, Mozambique, South Af-rica, Tanzania, Thailand, Vietnam and Zambia.
Danish environmental efforts in developing countries are organised in close, binding cooperation with cooperation countries. Efforts aim at promoting sustainable development, including adaptation by developing countries to climate change, and re-lieving poverty-related pressure on the environment and nature. Within the water area for example, action is helping to ensure millions of poor people access to clean water and to protect sources of water - e.g. by tree planting and by building up ca-pacity for sustainable management. In the energy area, Denmark pro-vides support for sustainable energy supply - e.g. supporting poor wom-en in planting trees for fuel, which provides the women with an income and at the same time protects the environment. Within nature resourc-es, Denmark is working to strength-en sustainable management and production with a view to preventing soil exhaustion and desertification. In the richer developing countries with increasing economic activity, assistance is aimed at helping coun-tries to protect nature and the envi-ronment, primarily by strengthening the capacity of the countries them-selves to solve the problems and by raising environmental awareness.
Environmental analyses continue to play an essential role in the regular revision of the country strategies for

218 Denmark's Fourth National Communication on Climate Change
Denmark’s programme cooperation countries. Another important task is to seek better integration of the objectives of international environ-mental agreements in the bilateral assistance cooperation.
Until 2003, Denmark made funds available for environmental ac-tion from both section 06(3) of the Finance Act and from a special Environment, Peace and Stability Fund (MIFRESTA). In 2004 the government decided to integrate en-vironment assistance into the overall assistance and replace MIFRESTA with a separate budget item for spe-cial environment assistance under section 06(3) of the Finance Act. In addition to the figures for total bi-lateral assistance, up to 2003, Table 7.1 includes special environment as-sistance under MIFRESTA and for 2004 the special budget item under section 06(3).
The background to the govern-ment decision not to continue MI-FRESTA was a desire to improve coordination of environment activi-ties with other Danish international development efforts. Irrespective of
whether financing of environment and environment-related assistance is through separate budgets within or outside section 06(3) of the Finance Act, it is difficult to assess whether there are new and/or additional as-sistance funds. The difficulties are primarily methodological problems in determining additionality. Nev-ertheless, the total scope of Danish assistance for the environment in developing countries will continue to be extensive.
Danish bilateral and regional assistance to support implementation of the Climate ConventionTables 7.2 – 7.6 provide an over-view of how Danish bilateral and regional assistance to developing countries to implement the Climate Convention is distributed over the main categories of mitigation and adaptation and by sector category.
7.3.1 Multilateral effortsEndeavours to create global stability and development require that the international community cooperate to provide action that promotes environmental sustainable development. This perspective must
TABLE 7.1 DANISH TOTAL BILATERAL DEVELOPMENT ASSISTANCE AND ENVIRONMENTAL ASSISTANCE 2000-2004 (DKK MILL.)Source: The Ministry of Foreign Affairs
2000 2001 2002 2003 2004
Bilateral developmentassistance, excl. spe-cial environmentalassistance
6,160.72 6,409.41 5,876.42 5,789.93 5,751.05
Special environmen-tal assistance to de-veloping countries1
508.20 645.50 560.30 466.80 404.30
1 Annual payments as reported to the OECD/DAC.
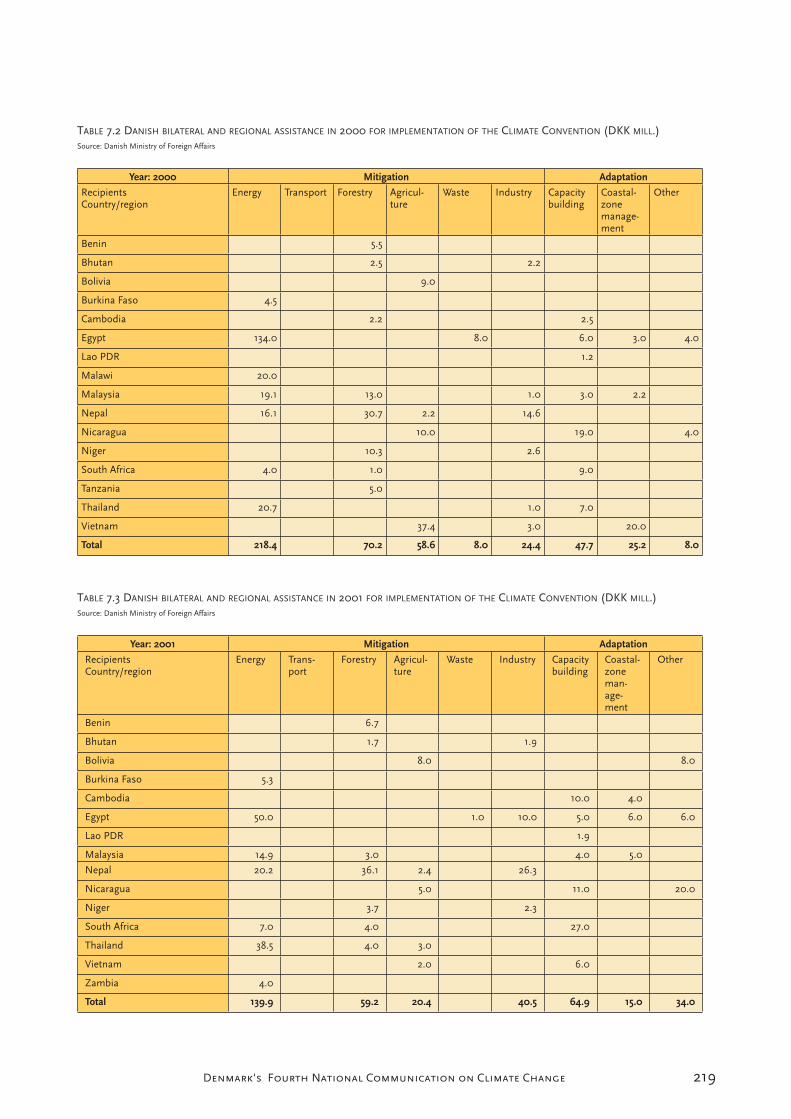
219Denmark's Fourth National Communication on Climate Change
TABLE 7.2 DANISH BILATERAL AND REGIONAL ASSISTANCE IN 2000 FOR IMPLEMENTATION OF THE CLIMATE CONVENTION (DKK MILL.)Source: Danish Ministry of Foreign Affairs
Year: 2000 Mitigation Adaptation
RecipientsCountry/region
Energy Transport Forestry Agricul-ture
Waste Industry Capacitybuilding
Coastal-zonemanage-ment
Other
Benin 5.5
Bhutan 2.5 2.2
Bolivia 9.0
Burkina Faso 4.5
Cambodia 2.2 2.5
Egypt 134.0 8.0 6.0 3.0 4.0
Lao PDR 1.2
Malawi 20.0
Malaysia 19.1 13.0 1.0 3.0 2.2
Nepal 16.1 30.7 2.2 14.6
Nicaragua 10.0 19.0 4.0
Niger 10.3 2.6
South Africa 4.0 1.0 9.0
Tanzania 5.0
Thailand 20.7 1.0 7.0
Vietnam 37.4 3.0 20.0
Total 218.4 70.2 58.6 8.0 24.4 47.7 25.2 8.0
TABLE 7.3 DANISH BILATERAL AND REGIONAL ASSISTANCE IN 2001 FOR IMPLEMENTATION OF THE CLIMATE CONVENTION (DKK MILL.)Source: Danish Ministry of Foreign Affairs
Year: 2001 Mitigation Adaptation
RecipientsCountry/region
Energy Trans-port
Forestry Agricul-ture
Waste Industry Capacitybuilding
Coastal-zoneman-age-ment
Other
Benin 6.7
Bhutan 1.7 1.9
Bolivia 8.0 8.0
Burkina Faso 5.3
Cambodia 10.0 4.0
Egypt 50.0 1.0 10.0 5.0 6.0 6.0
Lao PDR 1.9
Malaysia 14.9 3.0 4.0 5.0
Nepal 20.2 36.1 2.4 26.3
Nicaragua 5.0 11.0 20.0
Niger 3.7 2.3
South Africa 7.0 4.0 27.0
Thailand 38.5 4.0 3.0
Vietnam 2.0 6.0
Zambia 4.0
Total 139.9 59.2 20.4 40.5 64.9 15.0 34.0
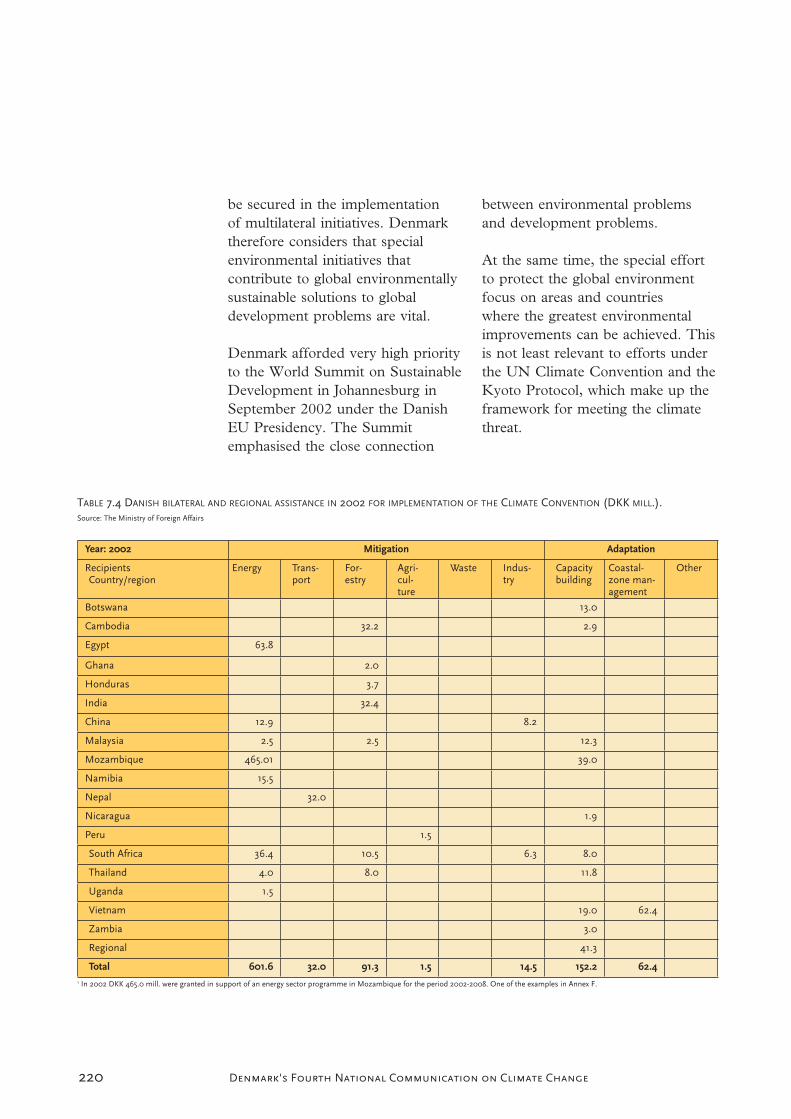
220 Denmark's Fourth National Communication on Climate Change
be secured in the implementation of multilateral initiatives. Denmark therefore considers that special environmental initiatives that contribute to global environmentally sustainable solutions to global development problems are vital.
Denmark afforded very high priority to the World Summit on Sustainable Development in Johannesburg in September 2002 under the Danish EU Presidency. The Summit emphasised the close connection
between environmental problems and development problems.
At the same time, the special effort to protect the global environment focus on areas and countries where the greatest environmental improvements can be achieved. This is not least relevant to efforts under the UN Climate Convention and the Kyoto Protocol, which make up the framework for meeting the climate threat.
TABLE 7.4 DANISH BILATERAL AND REGIONAL ASSISTANCE IN 2002 FOR IMPLEMENTATION OF THE CLIMATE CONVENTION (DKK MILL.).Source: The Ministry of Foreign Affairs
Year: 2002 Mitigation Adaptation
RecipientsCountry/region
Energy Trans-port
For-estry
Agri-cul-ture
Waste Indus-try
Capacitybuilding
Coastal-zone man-agement
Other
Botswana 13.0
Cambodia 32.2 2.9
Egypt 63.8
Ghana 2.0
Honduras 3.7
India 32.4
China 12.9 8.2
Malaysia 2.5 2.5 12.3
Mozambique 465.01 39.0
Namibia 15.5
Nepal 32.0
Nicaragua 1.9
Peru 1.5
South Africa 36.4 10.5 6.3 8.0
Thailand 4.0 8.0 11.8
Uganda 1.5
Vietnam 19.0 62.4
Zambia 3.0
Regional 41.3
Total 601.6 32.0 91.3 1.5 14.5 152.2 62.41 In 2002 DKK 465.0 mill. were granted in support of an energy sector programme in Mozambique for the period 2002-2008. One of the examples in Annex F.

221Denmark's Fourth National Communication on Climate Change
Through the EU, Denmark has worked for binding and effective regulation of international environ-mental problems through the re-gional and global environment con-ventions. This applies, for example, to the conventions on biodiversity, climate change, combating deserti-fication, the Montreal Protocol, the Basel Convention on cross-border transportation of hazardous waste and the conventions regulating chemicals, the Stockholm Conven-tion on Persistent Organic Pollut-ants, and the IMO Convention on
toxic primers. Denmark has worked to get the conventions coordinated and enforced effectively and for the precautionary principle to have a central role in the rules.
Danish international environmental assistance includes global environmental programmes funded through facilities for assistance to developing countries such as contributions to the Global Environment Facility, GEF and the UN Environment Programme, as well as to a number of other efforts
TABLE 7.5 DANISH BILATERAL AND REGIONAL ASSISTANCE IN 2003 FOR IMPLEMENTATION OF THE CLIMATE CONVENTION (DKK MILL.)Source: The Ministry of Foreign Affairs
Year: 2003 Mitigation Adaptation
RecipientsCountry/region
Energy Trans-port
For-estry
Agri-cul-ture
Waste Indus-try
Capacitybuilding
Coastal-zone man-agement
Other
Bolivia 7.0
Botswana 15.0
Burkina Faso 2.3 1.5
Cambodia 1.1
Egypt 4.5
Philippines 70.1
Ghana 3.0
China 84.9
Malaysia 82.0
Mozambique 3.9
Namibia 2.8 10.0 2.2
Nepal 7.0
Nicaragua 19.5
South Africa 13.7 10.0 5.1 3.3
Tanzania 3.6
Thailand 5.8 58.5 9.8
Uganda 2.8
Vietnam 1.5
Zambia 1.6
Regional 2.2 5.8
Total 192.3 72.4 10.0 20.5 145.3

222 Denmark's Fourth National Communication on Climate Change
to promote international cooperation on sustainable development.
After adoption of the Kyoto Protocol and the third Conference of the Parties under the Climate Convention in 1997, the Conferences of the Parties in Bonn and in Marrakech in 2001 made a number of decisions on the implementation of the Kyoto Protocol on limiting greenhouse gases. This provided the foundation for ratification of the Protocol. Up to November 2004 adequate support had been achieved so that the
Protocol could enter into force on 16 February 2005.
In accordance with the Climate Strategy from 2003, Denmark is preparing for the application of the Protocol’s project mechanism, the Clean Development Mechanism, whereby climate projects can be completed in developing countries and Denmark will be credited with the emissions credits achieved. Denmark’s CDM activities are further described in section 4.2.2.
Under the Conferences of the Parties under the Climate
TABLE 7.6 DANISH BILATERAL AND REGIONAL ASSISTANCE IN 2004 FOR IMPLEMENTATION OF THE CLIMATE CONVENTION (DKK MILL.)Source: Danish Ministry of Foreign Affairs
Year: 2004 Mitigation Adaptation
RecipientsCountry/region
Energy Transport Forestry Agricul-ture
Waste Industry Capacitybuilding
Coastal-zonemanage-ment
Other
Afghanistan 1.4
Benin 51.0 21.0 18.6
Bhutan 20.5 7.9 22.1
Burkina Faso 100.6
Cambodia 2.0
Egypt 30.4
Philippines 28.6
China 26.4
Malawi 7.2
Mozambique 7.2
Nepal 3.5
Niger 42.1
South Africa 1.1 1.1
Tanzania 5.0
Thailand 2.2
Vietnam 120.0 8.4 26.0
Zambia 20.0
Regional 4.9 14.3
Total 189.3 35.3 93.1 20.0 148.9 80.9 26.0
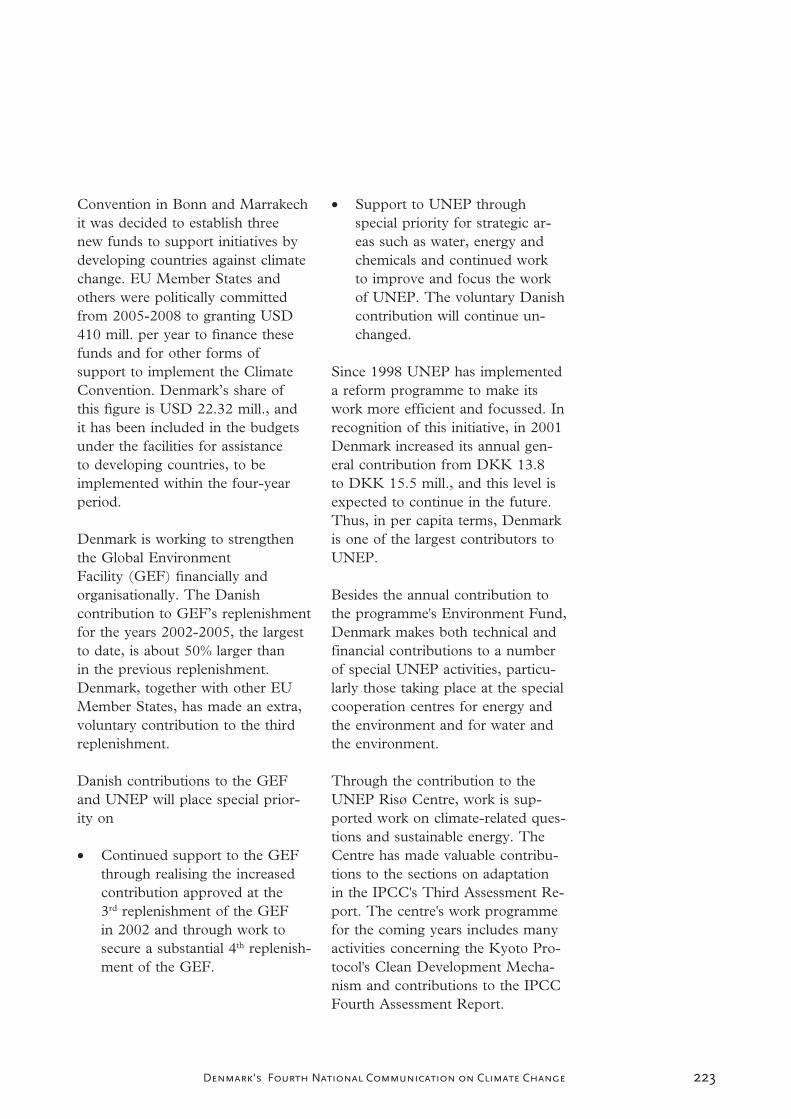
223Denmark's Fourth National Communication on Climate Change
Convention in Bonn and Marrakech it was decided to establish three new funds to support initiatives by developing countries against climate change. EU Member States and others were politically committed from 2005-2008 to granting USD 410 mill. per year to finance these funds and for other forms of support to implement the Climate Convention. Denmark’s share of this figure is USD 22.32 mill., and it has been included in the budgets under the facilities for assistance to developing countries, to be implemented within the four-year period.
Denmark is working to strengthen the Global Environment Facility (GEF) financially and organisationally. The Danish contribution to GEF’s replenishment for the years 2002-2005, the largest to date, is about 50% larger than in the previous replenishment. Denmark, together with other EU Member States, has made an extra, voluntary contribution to the third replenishment.
Danish contributions to the GEF and UNEP will place special prior-ity on
Continued support to the GEF through realising the increased contribution approved at the 3rd replenishment of the GEF in 2002 and through work to secure a substantial 4th replenish-ment of the GEF.
Support to UNEP through special priority for strategic ar-eas such as water, energy and chemicals and continued work to improve and focus the work of UNEP. The voluntary Danish contribution will continue un-changed.
Since 1998 UNEP has implemented a reform programme to make its work more efficient and focussed. In recognition of this initiative, in 2001 Denmark increased its annual gen-eral contribution from DKK 13.8 to DKK 15.5 mill., and this level is expected to continue in the future. Thus, in per capita terms, Denmark is one of the largest contributors to UNEP.
Besides the annual contribution to the programme's Environment Fund, Denmark makes both technical and financial contributions to a number of special UNEP activities, particu-larly those taking place at the special cooperation centres for energy and the environment and for water and the environment.
Through the contribution to the UNEP Risø Centre, work is sup-ported work on climate-related ques-tions and sustainable energy. The Centre has made valuable contribu-tions to the sections on adaptation in the IPCC's Third Assessment Re-port. The centre's work programme for the coming years includes many activities concerning the Kyoto Pro-tocol's Clean Development Mecha-nism and contributions to the IPCC Fourth Assessment Report.

224 Denmark's Fourth National Communication on Climate Change
The UNEP Risø Centre was an inspiration for the UNEP coopera-tion centre at the Danish Hydraulic Institute (DHI) – Water and Envi-ronment. The Danish contribution to this centre helps support global initiatives by UNEP in the water area, particularly for integrated wa-ter-resource and coastal-zone man-agement.
Denmark is a considerable contribu-tor to the Montreal Protocol's fund for financing the phasing-out of ozone-depleting substances in devel-oping countries. Danish contribution is described in Table 7.8.
Another area important to Denmark is promotion of renewable energy in developing countries. Within this area, Denmark supports use of sustainable and renewable energy through so-called ‘trust fund contri-butions’ to the World Bank and the Asian Development Bank.
Denmark’s contribution to sustain-able development includes consider-able support for international organi-sations, particularly the UN system, in which all countries in the world participate on an equal footing. Denmark is also working to make the UN more efficient so that the
division of work between the organi-sations becomes better and overlap-ping is avoided.
From the facility for assistance to developing countries, Denmark also contributes to international NGOs involved in the work with climate changes. These include the Inter-national Union for Conservation of Nature (IUCN) and the Inter-national Institute Environment and Development (IIED).
Danish contributions to multilateral institutions and programmes, includ-ing the UN organisations mentioned above and international NGOs working with climate-related activi-ties are described in Table 7.9. The figures are provided as accounting figures and there may have been be adjustments in the figures for 2000 and 2001 compared with the figures in the previous National Communi-cation.
7.4 ASSISTANCE THROUGH THE PRIVATE
SECTOR
Denmark has the following assist-ance instruments and measures for assistance to developing countries through the private sector:
Mixed creditsMixed credits can be provided in connection with projects within both the public and the private sector.
Restricted mixed credits are interest-free loans for development projects in credit-worthy developing coun-
TABLE 7.7 DANISH CONTIBUTION TO THE GEF 2000-2004Source: The Ministry of Foreign Affairs
Contribution DKK mill.
Year 2000 2001 2002 2003 2004
225Denmark's Fourth National Communication on Climate Change
tries with per capita GDP of not more than USD 2,428 (2004/2005) and are thus not reserved for pro-gramme cooperation countries. The loans are made from a Danish bank to a credit-worthy borrower in the recipient country. The interest ex-pense, export credit premium, etc. are paid via the assistance funds. The project’s assistance relevance is evaluated on the basis of Danida’s ordinary rules for project evaluation. In the period 1997-2004, assistance was granted with mixed credits for 119 projects with a total contract sum of DKK 7.4 bn. and a grant for interest payments, export credit pre-mium, premium etc., totalling DKK 3.2 bn. (see Table 7.10).
In addition to the existing restricted mixed credit scheme, a scheme for unrestricted mixed credits was in-troduced in 2002. The unrestricted scheme largely corresponds to the existing restricted scheme. The main difference between the two is that the support possibilities in the un-restricted scheme are not limited to Danish suppliers and that there is no requirement concerning the origin of the supplies. Besides this, the unre-stricted scheme can only be used in Denmark’s programme cooperation countries and in South Africa.
The Private Sector ProgrammeDenmark supports cooperation be-tween the private sector in the re-cipient countries and in Denmark, including in particular cooperation projects between companies. The Private Sector Programme in Dani-da’s programme cooperation coun-
tries, and the VtV (business-to-busi-ness) Programme in South Africa support the establishment of long-
TABLE 7.8 DANISH CONTRIBUTION TO THE MONTREAL PROTOCOL MULITILATERAL OZONE
FUND 2000-2004Source: The Ministry of Foreign Affairs
Contribution (DKK mill.)
Year 2000 2001 2002 2003 2004
TABLE 7.9 DANISH CONTRIBUTIONS TO MULTILATERAL INSTITUTIONS, NGOS, AND
PROGRAMMES
Source: The Ministry of Foreign Affairs
Institution or programme Contribution (DKK mill.)
2000 2001 2002 2003 2004
1. World Bank 825.3 541.5 520.5 464.1 543.5
2. International Finance Cor-poration
11.9 20.5 5.0 10.0 10.0
3. African Development Bank 146.0 210.4 289.5 207.1 145.4
4. Asian Development Bank 81.5 24.5 105.9 66.5 57.7
5. European Bank for Recon-struction and Development
19.1 26.0 25.1 25.1 26.1
6. Inter-American DevelopmentBank
25.8 15.3 7.2 11.0 9.7
7. United Nations Develop-ment Programme
420.0 420.0 370.0 370.0 370.0
8. United Nations EnvironmentProgramme
13.8 15.5 15.5 15.4 15.5
9. UNFCCC – Particip. & Sup-plement. Fund
- 0.5 - - 0.9
10. UNEP/Risø 11.8 6.4 7.8 8.8 8.8
11. UNEP/DHI - 3.8 3.8 - 4.0
12. IUCN 18.5 20 20 20 20.3
13. IIED 5 6 6 6 5
14. WWF 0.1 0.7
15. IISD 0.06 1.7 - 0.8 1.1

226 Denmark's Fourth National Communication on Climate Change
term and mutually binding coopera-tion between Danish enterprises and enterprises in recipient countries. The objective with cooperation with enterprises is to create economic growth in the private sector in the recipient countries through, for ex-ample job creation, local competence development, and environment im-provements. Many of the projects are environment-related, e.g. projects relating to renewable energy and energy saving through transfer of cleaner technologies. Support for these projects, divided into initia-tion activities and partnerships, is presented in Table 7.11. Note that figures for 2000 and 2001 have been updated compared with previous statements.
Industrialisation Fund for Developing CountriesThe Industrialisation Fund for De-veloping Countries (IFU) invests in joint ventures in the developing countries, including joint ventures on renewable energy. Investments are either as share or loan capital, to be repaid to the financing institu-tion. The IFU can also make grants for training personnel in companies
in developing countries. The IFU administers the Danish Fund for Environment and Training.
Partnership Facility ProgrammeThe Partnership Facility Programme was established in 1996 to involve the private sector in environmental assistance for developing countries. The goal of the Programme is to transfer technology and commercial knowledge on the environment from Danish enterprises to partner en-terprises in Thailand and Malaysia by establishing commercial partner-ships.
The Partnership Facility Programme focuses on cleaner technology and production, waste treatment, renew-able energy and energy management as well as environment monitoring and management systems. The Pro-gramme is also open to other sec-tors, provided the partnership has significance for the environment.
Originally, the Programme was administered by the Danish EPA (Danced). Table 7.12 gives an over-view of projects and grants since the Ministry of Foreign Affairs took over the Programme in 2001. Fol-lowing an evaluation in 2004, the Partnership Facility Programme has been extended for the period 2005 to 2007 and now includes China.
TABLE 7.10 NUMBER OF PROJECTS AND GRANTS UNDER THE SCHEME FOR MIXED CREDITS
2000-2004Source: The Ministry of Foreign Affairs
2000 2001 2002 2003 2004 Total
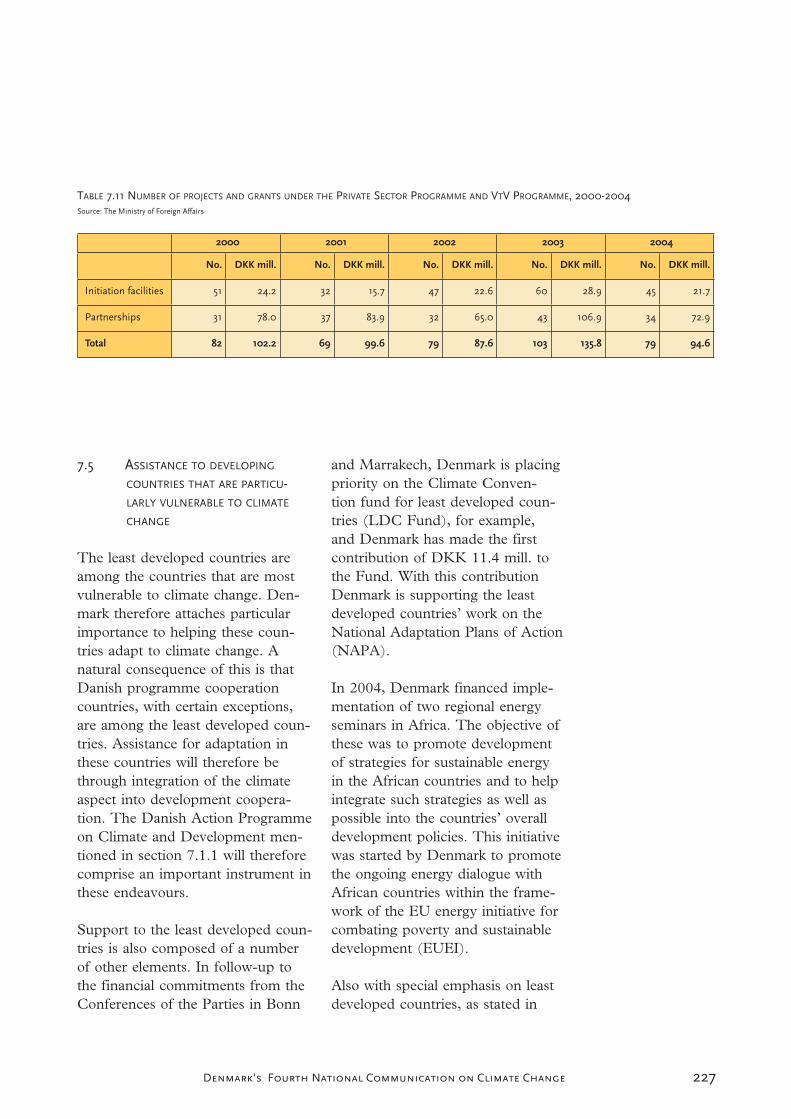
227Denmark's Fourth National Communication on Climate Change
7.5 ASSISTANCE TO DEVELOPING
COUNTRIES THAT ARE PARTICU-LARLY VULNERABLE TO CLIMATE
CHANGE
The least developed countries are among the countries that are most vulnerable to climate change. Den-mark therefore attaches particular importance to helping these coun-tries adapt to climate change. A natural consequence of this is that Danish programme cooperation countries, with certain exceptions, are among the least developed coun-tries. Assistance for adaptation in these countries will therefore be through integration of the climate aspect into development coopera-tion. The Danish Action Programme on Climate and Development men-tioned in section 7.1.1 will therefore comprise an important instrument in these endeavours.
Support to the least developed coun-tries is also composed of a number of other elements. In follow-up to the financial commitments from the Conferences of the Parties in Bonn
and Marrakech, Denmark is placing priority on the Climate Conven-tion fund for least developed coun-tries (LDC Fund), for example, and Denmark has made the first contribution of DKK 11.4 mill. to the Fund. With this contribution Denmark is supporting the least developed countries’ work on the National Adaptation Plans of Action (NAPA).
In 2004, Denmark financed imple-mentation of two regional energy seminars in Africa. The objective of these was to promote development of strategies for sustainable energy in the African countries and to help integrate such strategies as well as possible into the countries’ overall development policies. This initiative was started by Denmark to promote the ongoing energy dialogue with African countries within the frame-work of the EU energy initiative for combating poverty and sustainable development (EUEI).
Also with special emphasis on least developed countries, as stated in
TABLE 7.11 NUMBER OF PROJECTS AND GRANTS UNDER THE PRIVATE SECTOR PROGRAMME AND VTV PROGRAMME, 2000-2004Source: The Ministry of Foreign Affairs
2000 2001 2002 2003 2004
No. DKK mill. No. DKK mill. No. DKK mill. No. DKK mill. No. DKK mill.
Initiation facilities 51 24.2 32 15.7 47 22.6 60 28.9 45 21.7
Partnerships 31 78.0 37 83.9 32 65.0 43 106.9 34 72.9
Total 82 102.2 69 99.6 79 87.6 103 135.8 79 94.6

228 Denmark's Fourth National Communication on Climate Change
Table 7.8, Denmark made contri-butions to the climate secretariat fund for participation by developing countries in Climate Convention meetings and the fund to support supplementary activities under the Climate Convention.
Small Island Development States (SIDS) are particularly vulnerable to global environmental impacts, in-cluding climate change. Because of this, since the mid-1990s Denmark has developed close contact to AO-SIS and its members. This coopera-tion is expressed partly in a political cooperation under the UN, where bilateral meetings are held between Denmark and AOSIS representa-tives, and also in more concrete co-operation with SIDS countries in the south Pacific, where there is the greatest concentration of poor island states.
The special situation of the SIDS countries is reflected in several UN resolutions and the crucial role of the energy area for sustainable de-
TABLE 7.12 NUMBER OF PROJECTS AND GRANTS UNDER THE PARTNERSHIP FACILITY
PROGRAMME, 2001-2004
Source: The Ministry of Foreign Affairs
2001 2002 2003 2004
No. DKK No. DKK No. DKK No. DKK
Malaysia 9 1,958,872 6 1,018,682 21 28,910,924 1 2,864,348
Thailand 7 1,191,937 8 1,776,514 18 24,673,454 7 11,599,305
Total 16 3,150,809 14 2,795,196 39 53,584,378 8 14,463,653
velopment in SIDS countries is cen-tral in these resolutions. Denmark has been active in these resolutions and places high priority on support to SIDS in accordance with these. Denmark provides support for SIDS through multilateral assistance to regional projects in the climate and energy areas and to projects on the Maldives.
From 1998 to 2002 Danida support-ed a SPREP project on knowledge and capacity building in the climate area for governments, NGOs, and regional organisations on the Pacific islands.
In 2003, Denmark granted DKK 11 mill. to a regional project for 14 island states in the Pacific. The ob-jective of the project was to promote sustainable national energy policy with associated action and invest-ment plans. The project has helped the 14 countries enhance their insti-tutional capacity within sustainable energy with a view to improving public access to energy, promoting
229Denmark's Fourth National Communication on Climate Change
energy efficiency, and increasing the use of renewable energy. The project is being carried out by the South Pacific Applied Geoscience Commission (SOPAC) and it is a Danish contribution to implementa-tion of the EU Energy Initiative.
7.6 ACTIVITIES IN CONNECTION WITH
TECHNOLOGY TRANSFER
Danish support to technology trans-fer in relation to implementation of the Climate Convention includes a broad spectrum of activities. These activities comprise transfer of both ”soft” technology and ”hard” tech-nology. The extent of this technol-ogy transfer is significant and can-not be clearly separated from other activities in Danish development cooperation, just as there is often an unclear frontier between transfer of soft and hard technology.
The most important example of Danish-supported activities leading to technology transfer, is Danish sector programme support to the en-ergy sector in Mozambique, Burkina Faso, Egypt, Nepal and Malaysia. These sector programmes include elements such as energy planning, including plans for use of renewable energy, establishment of large wind farms, renovation of power stations, promotion of energy efficiency and promotion of sustainable use of bio-mass as a fuel. Within these sector programmes, transfer of soft and hard technology goes hand-in-hand.
Danish assistance to implementation of the Climate Convention as pre-sented in Tables 7.2 – 7.6 provides a picture of the nature and extent of Danish assistance to technology transfer. These Tables contain an estimate of the activities within cli-mate adaptation which specifically aim at transfer of soft technology, as this appears in the figures for assist-ance to capacity building. Further-more, Annex F contains examples of Danish assistance to technology transfer in the form of projects and programmes with both soft and hard technology. Finally, transfer of both soft and hard technology is the primary element of cooperation regarding CDM projects (see section 4.2.2).

230 Denmark's Fourth National Communication on Climate Change
231Denmark's Fourth National Communication on Climate Change
8.1 CLIMATE RESEARCH AND OBSERVA-TIONS IN GENERAL
Research and observations within climate in the broad sense of the word are going on at a number of institutes and organisations and cover a wide range of disciplines, from natural science to evaluation of policies and measures and societal aspects.
The Danish Meteorological Insti-tute (DMI) carries out observations of climate parameters (atmosphere and ocean) under the World Mete-orological Organisation’s (WMO) programmes and sub-programmes: World Weather Watch Programme (WWW), Global Atmosphere Watch (GAW), Global Observing System (GOS), Global Climate Observing System (GCOS) and Global Ocean Observing System (GOOS). DMI also participates in the Network for the Detection of Stratospheric Change (NDSC). Denmark is also active via DMI in the GEO initia-tive.
Climate monitoring and research has been a key task for DMI for more than 125 years. The National Environmental Research Institute (NERI) is in charge of monitoring the effect of climate change on na-ture and environment.
Danish research competence con-cerning the physical expressions of past climate changes is particularly at the Geological Survey of Den-mark and Greenland (GEUS), the University of Copenhagen (KU) and
8 Research and systematic observation
Aarhus University. GEUS also has competencies in glaciological studies of the Greenland ice sheet and the ice sheet’s interaction with climate change and in the effect of climate change on the water cycle in nature. The Geophysical Department and the Geological Institute at KU and the Geological Institute at Aarhus University have very great expertise in palaeoclimate data, and the climate group at KU is known worldwide for its ice core drilling and analyses. NERI contributes important research competence in relation to the effect of climate change on ecosystems.
DMI/Danish Climate Centre covers the physical world, i.e. measurement, theory and modelling of the climate system. However other institutions than the ones mentioned above, e.g. Forest & Landscape Denmark (SL), and the Danish Institute of Agricul-tural Sciences (DJF), Risø National Laboratory and the Danish National Space Center work with different as-pects of climate research. The Dan-ish Climate Centre has published an overview report describing the bulk of current Danish research on cli-mate changes1.
It is partly on the basis of research competencies in the above areas that Denmark also participates ac-tively in IPCC’s work. Denmark has contributed to IPCC work through e.g. contributions to all three main reports, and several researchers are currently contributing to the prepa-ration of the 4th assessment report (AR4) to be published in 2007. One researcher is lead author of a chap-

232 Denmark's Fourth National Communication on Climate Change
ter on future regional climate. Fur-thermore, Denmark has contributed to the preparation of the two recent status reports on the ozone layer un-der the WMO and UNEP.
Finally, DMI has contributed to the preparation of the Arctic Climate Impact Assessment report (ACIA) under the Arctic Council and the International Arctic Science Com-mittee (IASC).
The Copenhagen Global Change Initiative (COGCI) is a formal col-laboration including research network and PhD programme involving three Danish institutions (GEUS, DMI and NERI) and the University of Copenhagen. The COGCI comprises all relevant scientific and cross-cut-ting disciplines in global, regional and local effects of environment and cli-mate problems.
Danish research contributes to a wide range of international projects under the World Climate Research Programme, such as the Climate and Cryosphere (CliC), Climate Variability and Predictability (CLI-VAR), the Global Energy and Water Cycle Experiment (GEWEX), Strat-ospheric Processes and their Role in Climate (SPARC) and the World Ocean Circulation Experiment (WOCE).
8.2 RESEARCH
8.2.1 Research policy and fundingClimate-related research in Denmark has grown naturally within an already
existing framework of institutional activities. Denmark has not previ-ously had a general national research programme for climate change and global change. However, as follow-up on Climate 2012, a committee was appointed to look at the possibilities for improving coordination of Dan-ish research work on climate. This committee completed its work in December 2002. The work consisted primarily of mapping Danish climate research2 and making recommenda-tions on this basis.
Mapping was largely based on a questionnaire survey in which all known research centres with climate or climate-related research were con-tacted. Besides the narrowly focused scientific climate research, the survey has provided information on a broad section of climate-related research in Denmark.
The mapping exercise showed that there is great diversity of relatively extensive climate-relevant research. The research is primarily concen-trated on basic knowledge, con-sequences of climate change and mitigation of anthropogenic climate change, whereas there has been very little research in adaptation to cli-mate change.
The research is funded by the in-stitutions’ basic grants, programme grants, and the EU Commission framework programmes for research and technological development, and by the Danish research councils.
233Denmark's Fourth National Communication on Climate Change
Danish climate research increased steadily in the period 1998 to 2001, from 172 man-years in 1998 to 189 man-years in 2001. The budget in-creased correspondingly from DKK 94 mill. in 1998 to DKK 114 mill. in 2001. The subsequent period has primarily seen a reduction in funding for Danish climate research.
Besides the resources shown in Table 8.1, a number of players are working with activities related to climate research, including activities under the Danish Energy Research Programme, the Nordic Energy Re-search Programme, Public Service Obligation funds and Risø National Laboratory’s Wind Energy Depart-ment, see section 8.2.6. In 2001 these spent DKK 379 mill. on ac-tivities indirectly or partially related to activities concerning mitigation of anthropogenic climate changes.
On the basis of the mapping exer-cise, the committee recommended a general, combined evaluation to determine which areas within climate research should receive larger grants from the government research coun-cils or from other public support schemes. In addition, the committee presented the following proposals for special action areas to strengthen the entire Danish research in the area.
Climate research focused on the North Atlantic region
Adaptation and vulnerability in relation to nature and environ-ment
Emissions in the agricultural sector with a view to reducing greenhouse gas emissions
Analysis of extreme events in re-lation to the greenhouse effect
Development of climate models focused on feedback processes
Long-term stabilisation of atmos-pheric greenhouse concentra-tions and targets for greenhouse gas emissions
The effect of climate change on renewable energy
Lastly, the committee’s research representatives proposed that more attention be paid in future to inter-disciplinary cooperation, building up national and international networks, and disseminating the results, and that climate research be given a clearer place in the government’s re-search policy.
The government will consider the possibilities for following the commit-tee’s recommendations.
Danish climate-related research is de-scribed in detail in the following sec-tions, while a number of ongoing re-search projects are listed in Annex G.
8.2.2 Climate processes and studies including palaeoclimatic studies
DMI/The Danish Climate Centre and the Centre for Marine Fore-casting carry out research into e.g. atmospheric and coupled atmos-

234 Denmark's Fourth National Communication on Climate Change
pheric oceanic processes, which are important in connection with global climate change. These process stud-ies include e.g. natural atmospheric oceanic interplay on time scales from years to decades, including main processes of importance for deep water formation in the North Atlantic.
Oceanographic projects include:
West-Nordic Ocean Climate is a joint Nordic project studying changes in the circulation of the North Atlantic and its signifi-cance on climate developments in the area. Work includes ob-servations as well as data analy-sis and modelling. DMI is con-tributing to the project in col-laboration with the Greenland Nature Institute. Focus is on the waters around Greenland with special emphasis on explaining the variation in fish stocks from changes in climatic and hy-drographical conditions. More specifically, the emphasis is on transport of cod larvae from Icelandic spawning grounds to the waters around Greenland, as well as the developments in west-Greenland prawn popula-tions.
Meridional Overturning Ex-change with the Nordic Seas (MOEN). Due to rising con-centrations of greenhouse gases in the atmosphere and an in-creased hydrological cycle, a gradual decline in the intensity of the Atlantic Ocean’s meridi-
onal circulation system is to be expected over the 21st century. Sub-elements of the system in-clude the climatically important North Atlantic current, deep-water formation processes in the Nordic seas and the Labra-dor Sea, and the flow of heavy deep-water from the formation areas. MOEN will evaluate the effect of anthropogenic climate change on the ocean’s meridion-al circulation through continu-ous observation and modelling of the exchange between the North Atlantic and the Nordic seas. DMI’s task is to study variability and later develop-ment through ensemble simula-tion of the exchange across the Greenland-Scotland ridge from 1948–2002. The ensemble ex-periments are designed with at view to evaluating the depend-ence of the initial state of the development modelled, as well as quantifying the effect of the observed increased inflow to the Arctic Ocean, which is consid-ered a trend which is linked to global warming.
Through assimilation of atmospheric reanalyses in atmospheric models, several studies are being carried out of atmospheric processes, partly in order to develop improved atmos-pheric models, and partly to detect changes in the external climate impacts. In addition, trends and variations in the latest tropospheric temperature observations from satel-lites (primarily MSU data) and radio
235Denmark's Fourth National Communication on Climate Change
soundings are being analysed and compared.
At DMI, work is going on to im-prove models for describing the thinning of the stratospheric ozone layer. This area is important, not only in relation to the Vienna Con-vention concerning protection of the stratosphere’s ozone layer, but also in a climate context, because there is interaction with the greenhouse ef-fect. DMI is also working on studies of the processes in the tropical tro-popause that control water vapour entering the stratosphere, and on models for air traffic impact on the climate.
DMI has thus participated in all major European-American Arc-tic ozone research campaigns in the 1990s, such as EASOE, SESAME,THESEO, and THESEO-2000/SOLVE, as well as in the trop-ical HIBISCUS campaign. DMI’s stratospheric research is based on analyses of a broad range of avail-able observations compared with analyses of the meteorological condi-tions in the stratosphere. Research includes analyses of the dispersal of ozone-depleted air from the Polar regions to intermediate latitudes, and experimental and theoretical model work concerning the forma-tion of polar-stratospheric clouds. The aim is better understanding and modelling of the processes that lead to chemical depletion of the ozone layer.
In terms of the climate, this research is relevant because increased con-
centrations of greenhouse gases in the atmosphere and the depletion of the stratosphere’s ozone layer are expected to lead to lower tempera-tures in the Polar stratosphere and to the formation of a more stable and more long-lasting Polar vortex. These conditions could lead to more widespread formation of polar-strat-ospheric clouds and stronger chemi-cal ozone depletion lasting further into the spring months followed by the development of actual holes in the ozone layer over the Arctic, similar to what happens each Polar spring over the Antarctic. Arctic ozone depletion in the winter and spring months influences the cumu-lative dose of UV radiation in Den-mark in the subsequent six months, and this impacts human health and plant production, and causes dam-age to buildings, roads etc. Efforts are being made to forecast this UV radiation under climate-change con-ditions. There is also experimental and model-theoretical work with cirrus clouds in the tropical tropo-pause and the effects of air traffic on the formation of cirrus clouds. The tropical cirrus clouds are important for additions of water vapour to the stratosphere. Stratospheric water vapour has a great influence on cli-mate, and cirrus clouds have a direct influence on the climate.
The Geophysical Department at the Niels Bohr Institute for Astronomy, Physics and Geophysics at the Uni-versity of Copenhagen is working mainly on global and general prob-lems, such as the natural variability of the climate at all time scales and the
236 Denmark's Fourth National Communication on Climate Change
role of basic physical/chemical proc-esses in the climate system. Examples of projects are the international ice core projects, the aim of which is to analyse ice cores through Greenland’s ice sheet in order to obtain a climate series that covers as long a period of time as possible and to obtain infor-mation about the end of the last ice age 11,500 years ago, and about the last warm period 130,000 years ago.
At Odense University research is go-ing on within the areas of the stability of the climate system, the role of the ocean in the climate system and the chemical and biological development of the atmosphere and the ocean. The newly established Centre for Planet Research at the University of Copenhagen undertakes climate re-search in a more general sense - for example, it studies ice deposits not only on earth but also in the solar system.
GEUS works with the physical ex-pressions of past climate changes, including ecosystems’ response, tem-perature variations, changes in pre-cipitation and sea level change. An-other research topic is past variations in the circulation of the North Atlan-tic ocean currents and their impor-tance for climate changes. GEUS also works with mass balance studies of the Greenland ice sheet, including its interaction with climate change and its effect on changes in water level.
NERI is carrying out research in how, since the last Ice Age, climate change has affected the biological structure of North Atlantic lakes in
Greenland, Iceland and the Faroe Islands. Paleolimnological methods are being used to developprojection models.
8.2.3 Climate modelling and the climate of the future
With substantial support from the European Commission, DMI/Danish Climate Centre is working closely together with research institutions in Europe on analyses of the climatic consequences of increased green-house effect, depletion of the strat-ospheric ozone layer and variations in solar activity. The main emphasis is on Denmark and the European re-gion, as well as the Arctic, but global research is also being carried out.
The work includes both developing models and using the models for scenario calculations of the climate of the future. The models include:
Relatively simple empirical mod-els for describing local climate change and variations (downs-caling) and for use in seasonal forecasting.
A regional dynamic atmosphere-climate model for calculating re-gional/local climate change and variations. The main focus is on Denmark, Europe, and Green-land.
Finely meshed global dynamic atmospheric climate models for calculating global/regional cli-mate change and variations.
237Denmark's Fourth National Communication on Climate Change
Global dynamic coupled atmos-phere-ocean-sea-ice models, which are used for calculating climate change (primarily as a consequence of increased green-house effect) and internal vari-ability in the climate on a 5-100 year time scale.
Both global3 and regional4 scenario calculations were carried out for Denmark, the Faroe Islands and Greenland based on IPCC’s so-called SRES emissions scenarios - more specifically, scenarios A2 and B2. The results of the global simula-tions have been used in the IPCC’s Third Assessment Report and new scenarios are being calculated for the Fourth Assessment Report from the IPCC. With regard to regional simulations, the most important fo-cus area for Denmark is changes in (extreme) precipitation, soil moisture and storm activity. For Greenland, of special interest are changes in the simulated snow accumulation on the ice sheet and changes in permafrost conditions.
In the European climate project PRUDENCE5 (see also http://pru-dence.dmi.dk), which was coordinat-ed by DMI, more than ten regional climate models are used to quantify uncertainties linked to projections of the climate of the future. The project shows among other things that the DMI system of regional cli-mate models is representative of the majority of the contributing models, and conclusions based on simula-tions with this model can be consid-
ered as being well within the range of the model results.
The scenarios (also from PRU-DENCE) are made available to all groups of researchers who are study-ing the effects of climate change, and to decision makers taking part in the preparation of a Danish strat-egy for adaptation to climate change.
The research on ozone as a green-house gas includes the influence of ozone on circulation in the strato-sphere, together with radiation forc-ing and climate effects caused by changes in the ozone concentration. As opposed to the increase of CO2
, changes of ozone concentrations vary greatly in both time and space. Although the climate effects of changing ozone levels are expected to be fairly modest at the surface of the earth, they will be significant in the stratosphere and the upper trop-osphere. As a result of the large spa-tial variations of ozone changes, and of the effect of ozone on long and short-wave radiation, several feed-backs are involved in the climatic response. One of these are related to increased hydrological activity, and is most dominant for ozone changes in the upper stratosphere.
In the research in this area, use is made of a global climate model and more simple radiation convection models. Throughout the 1990s DMI coordinated the projects ROCS (Role of Ozone in the Climate System) and SCORE (Studies of Climate-Ozone Relationships), fi-nanced by the EU, and took part in

238 Denmark's Fourth National Communication on Climate Change
the project Ozone as a Climate Gas financed by the Nordic Council of Ministers.
Research at the Geophysical Depart-ment at the University of Copenha-gen includes experimental/field-relat-ed, theoretical, and modelling aspects and helps to indicate methods that can be used for evaluating the climate of the future.
8.2.4 Effects of climate changeThe effects of climate change on nature and ecosystems are covered by research at DMI, GEUS, NERI, Forest & Landscape Denmark (SL), the Danish Institute of Agricultural Sciences, the Risø National Labora-tory, and the Danish Coastal Au-thority.
Forest & Landscape Denmark car-ries out research on the direct effect of changed CO2 concentration on Danish forests through its coopera-tion with the Royal Veterinary and Agricultural University, under the auspices of which it was established in 2004.
NERI is working on the effects of cli-mate change, especially in Greenland, and it is carrying out a standardised biological/ecological monitoring pro-gramme covering a broad spectrum of processes, fauna, and flora. In connection with this project the insti-tute is carrying out research projects aimed at increasing knowledge of ba-sic Arctic ecosystems.
NERI is carrying out research in the effect of climate change on biodiver-
sity and function of the soil environ-ment, in laboratory as well as field conditions. Work includes genetic variations in soil-living fauna, and the fauna’s physiological adaptation to extreme climate conditions. NERI has research competence concerning tolerance limits for air pollution for particularly sensitive terrestrial eco-systems. In particular, the interaction between climate change, chemical substances and other factors is inves-tigated.
NERI has built up competence fo-cused on the function and dynamics of the Arctic marine ecosystem and it is investigating an Arctic fjord system and, within this, relationships between production and nutrient conversion.
Within freshwater, NERI has re-search competence concerning the effect of climate change on nutrient degradation and biological interaction in watercourses and lakes. Studies are being carried out for instance in Arc-tic, temperate and subtropical lakes, where biological interaction is being studied along climate gradients. Ex-perimental studies are being made at an advanced test plant at Silkeborg. Models are being developed as tools of projection of nutrient transport as well as effects on freshwater ecosys-tems.
GEUS has competence concerning long-term variations in ecosystems in Denmark and Greenland and on the Faroe Islands caused by the climate. The institute is investigating how the ecosystems react to climate change in lakes and marine environments in
239Denmark's Fourth National Communication on Climate Change
Denmark and Greenland and in for-ests in Scandinavia. It also registers changes in sea level and their effect on the water cycle, including the for-mation of groundwater.
The Danish Institute of Agricultural Sciences works with the interaction of climate and agriculture, including ef-fects of climate and atmospheric CO2
on processes in the soil-plant system. Other aspects being studied include factors affecting greenhouse gas emis-sions from agriculture, e.g. energy consumption in the agricultural sec-tor, biomass for energy purposes, production and management of ma-nure, biogas, and NH3 volatilisation, and greenhouse gases in relation to feeding strategies, manure handling, and soil tillage.
The Risø National Laboratory’s work includes a number of sub-projects on the effects of climate change in developing countries, where the cen-tre’s activities include both analyses of vulnerability to climate change and adaptation strategies. The activities cover the energy, industrial, forestry, agricultural, transport, and waste sec-tors.
DMI is working with modelling of both regional and global changes of permafrost. Analyses of climate mod-el calculations have been made, based provisionally on coarse-meshed global simulations. However, more refined techniques are being prepared, for use at both regional and local levels.
There is not at the present time spe-cial competence concerning the ef-
fects on human living conditions and health, which are particularly relevant in areas of the world where dramatic climate effects are expected/seen.
The Geographical Institute at the University of Copenhagen is doing research on soil-forming processes in relation to climate and vegetation that are of significance for, amongst other things, the exchange of green-house gases between soil and the atmosphere.
The Danish Coastal Authority is working with projects focusing on the effect of climate change on coastal erosion, and on alternatives to strengthening dikes in order to adapt to climate change.
8.2.5 Economic research, including evaluation of climate change and possibilities for mitigation
It is important to take account of the economic consequences of the differ-ent ways to mitigate greenhouse gas emissions.
NERI’s Centre for Analysis of Envi-ronment, Economy and Society has general competence in setting up and evaluating mechanisms for reducing emissions and special competence within the agricultural, energy and transport sectors. In addition, it pos-sesses general knowledge of the dif-ferent aspects of the Kyoto Protocol, including research competence con-cerning Clean Development Mecha-nism and Joint Implementation. Lat-est activities include preparation of guidelines for economic assessment of adaptation to climate change.

240 Denmark's Fourth National Communication on Climate Change
The Risø National Laboratory is involved in various research activi-ties, primarily relating to policies and measures for reducing greenhouse gas emissions, and relating to emis-sion scenarios for greenhouse gases. The activities include development and implementation of international methodological standards for cost and sustainability analyses of reduc-tion policies, discussion and testing of baseline approaches and various project and sector studies for the energy, transport, and agricultural sectors. The research activities have also included support for the Climate Secretariat and capacity and training programmes in developing countries. In addition, Risø has research activi-ties concerning the Kyoto Protocol’s flexible mechanisms, Emission Trad-ing (ET), Joint Implementation (JI) and Clean Development Mechanism (CDM).
Research at Aarhus University is concentrated on the judicial and poli-tological aspects of climate policy and legislation at UN, EU and national levels. Cooperating with researchers from the Aarhus School of Business, the University of Southern Denmark, the Royal Veterinary and Agricultural University, and NERI, and follow-ing up cooperation established with the Centre for Social Science Re-search on the Environment at Aarhus University (today at NERI), general competence is assured in cross-disci-plinary research into law, politology and economics. Research focuses on interaction between traditional in-struments - flexible mechanisms (JI and CDM agreements), the specific
significance of the decision process, and the effects of economic instru-ments (taxes and quotas and credits). Moreover, researchers have thor-ough knowledge of environment and energy policy and legislation. Such competence forms the basis for co-operation on a new Masters degree in Environment and Energy Law, cf. Chapter 9.
The University of Southern Denmark in Odense carries out research on cli-matic, ecological and anthropogenic impacts on marine environments, particularly the North Sea and the Baltic Sea in the period 1500-2000.
At the University of Copenhagen the main focus of climate research is the scientific aspects, but research is also being conducted in the climate field in an economic context, at the Eco-nomic Institute, for example.
At Roskilde University Centre, re-search is going on concerning scenar-io building within climate-stabilising policies, together with lifecycle analy-ses as a tool in economic evaluation of climate-stabilization strategies.
8.2.6 Research and development of technologies to reduce greenhouse gas emissions and to adapt to climate change
At the Technical University of Den-mark (DTU), the energy/environ-ment group and the group for urban ecology are basing their research on sustainable energy development and sustainable urban change, with en-ergy savings and renewable energy as central parameters.

241Denmark's Fourth National Communication on Climate Change
Research and development activities in the field of energy are not moti-vated solely by climate issues, but are relevant to climate issues, since they contribute to determining the overall framework for the CO2 intensity of energy production and consumption in the future.
The Energy Research Programme (EFP), which is administered by the Danish Energy Authority, has for a number of years been sup-porting a broad range of research, development and demonstration projects in the energy field. The overall objective of EFP is to sup-port the government’s energy policy objective of providing cost-effective, environmentally friendly and safe energy supply, and to contribute to promoting the competitiveness of Danish enterprises in the field of energy. The activities range from social science research on the in-teraction between the energy sector and the rest of society to research in such advanced energy technologies as super conductors and fuel cells. Following reduced appropriations in 2002, the programme budget was increased in 2004, bringing overall activities under the programme up to approx. DKK 65 mill. On aver-age, 50 percent of the activities un-der the Energy Research Programme are financed by EFP, one quarter by enterprises, and one quarter by other sources, i.e. research institutions, universities etc.
Activities relating to strategic energy research were also increased in 2003 with a special appropriation amount-
ing to approx. DKK 50 mill. in each of the years 2003-05 for renewable energy research. The activities are administered by the Strategic Re-search Council under the Ministry of Science, Technology and Innova-tion, and are aimed at strengthening the knowledge base within renewable energy, for instance by support-ing cross-disciplinary projects that involve technical, environmental, health, social, economic and politi-cal aspects. In the years 2005-08 the Ministry’s energy research efforts will be strengthened by a total amount of approx. DKK 280 mill. The pro-gramme areas of these funds have not yet been fixed.
Further, energy research and devel-opment are supported by PSO funds (Public Service Obligation). The power system-responsible company Energinet.dk (established in Janu-ary 2005) is continuing the support scheme for research and development in environmentally friendly power production technology, administering in 2005 support funds amounting to DKK 130 mill. Under this scheme support is given to activities relating to fuel cells and renewable energy, for instance solar cells, biomass, hydro-power and wave energy. The associa-tion of power distribution companies, Elfor, administers a scheme of sup-port to research and development within energy-efficient use of electric-ity. In 2005 more than DKK 25 mill. are available under the scheme, which aims at the development of energy-efficient products and processes in buildings, industry etc.

242 Denmark's Fourth National Communication on Climate Change
NERI is working with the main driv-ers behind greenhouse gas emissions from the energy sector, the agricul-tural sector, and the transport sector. Forest & Landscape Denmark has competence in forestry, afforestation, etc. Together, these two institutions cover the aspects of land use in the open countryside for agricultural pur-poses, forestry and nature. Both insti-tutions are looking at challenges relat-ed to use of biomass from agriculture and forestry as an energy source.
NERI makes general inventories of atmospheric emissions from all sec-tors and activities, including the greenhouse gases. The institution has special research competence in inven-tories from the agricultural sector, the transport sector, the industrial sec-tor, and the energy sector. Forest & Landscape Denmark seeks generally to quantify how forestry and changes in land-use in relation to forests affect the forest ecosystems’ carbon sinks and thus the potential binding of CO2
in biomass and soil.
NERI has models for projecting greenhouse gas emissions, based for instance on projections of activities in relevant sectors.
NERI also has research competence in modelling of the dispersal of greenhouse gases locally and region-ally, with special focus on Denmark, Europe, and Greenland. The Depart-ment for Atmospheric Environment is developing a CO2 model (DEHM) for dispersal, transport, and surface movements. The model can be used to determine the size of sources and
drains for CO2 in Europe over spe-cific areas and for estimating whether these areas comply with the Kyoto Protocol.
GEUS is researching impacts on the poles environment, and the driving forces for natural climate variations in long-term perspectives.
In cooperation with seven other countries, GEUS is the project man-ager for the EU-funded GESTCO project, in which the possibilities for finding geological storage possibilities near the European power stations and large industrial CO2 point sources are being studied. A technical-economic model is also being developed in this project for planning and price calcu-lations of different combinations of sources of CO2 emissions, transport, and types of geological storage. Sev-eral geological formations in Den-mark are known to be suitable for deposition. Publication of the results will be followed up by public hear-ings.
GEUS is also participating in the international research project SACS, in which CO2 deposition from the Norwegian Sleipner gas field is being further developed. GEUS is studying the geological properties of the stor-age, including the extent of the sand formation, the tightness of the clay seal and the chemical effects of stor-ing CO2 in the form of carbonic acid where the acidity is very low.
Risø National Laboratory is carrying out research projects on the driving forces, emissions and possibilities for
243Denmark's Fourth National Communication on Climate Change
reduction, particularly in the develop-ing countries.
Research at the Danish Institute of Agricultural Sciences focuses on the agricultural sector’s possibili-ties for adapting to climate change by changing the cultivation system, including changes in fertilisation and the use of pesticides and adapting soil tillage methods. The aim is to develop adaptation options that also reduce greenhouse gas emissions from the sector.
8.3 SYSTEMATIC CLIMATE OBSERVATIONS
8.3.1 Atmospheric climate observations, including measurements of the composition of the atmosphere
DMI carries out continuous moni-toring of key weather and climate parameters. In the climate monitor-ing programme, classic methods of measurement are used and new, sat-ellite-based observation methods are being developed.
DMI operates around 200 automatic measuring stations in the Realm (Denmark, Greenland and the Faroe Islands) with a broad measuring programme ranging from automatic sea level or precipitation stations that measure only one parameter, to stations with a full measuring pro-gramme, including automatic cloud height detectors and weather type detectors. Since 2001, a separate network for climate observations has not been operated because of
technological convergence between the climate and weather networks and a desire to rationalise the opera-tional network. The net of stations is shown in the GCOS report, Annex H, Figures H-1 to H-5.
The past manual measuring network has now been almost fully replaced by automatic measuring stations. The aim was to eliminate sources of human errors, to realise a potential for rationalisation, and to significant-ly improve observation frequencies. Observations were previously taken every three hours, but, today, obser-vations are required at 10-minute in-tervals from the new stations, which cannot be done manually. The purpose is to achieve greater coher-ency between the different types of stations so that the number of sta-tion types and spare parts can be reduced as much as possible without loss of quality.
To collect precipitation data DMI also operates a network of about 450 manual precipitation stations, which are mainly used to map the precipi-tation climatology. Measurements are collected daily via the telephone and are thus available very quickly after the measurements were taken.
Besides being of use for national programmes, the observations con-cern Denmark’s international con-tribution in the form of observation components from Danish territory to the worldwide meteorological ob-servation network WWW - World Weather Watch. Other international programmes for mapping weather
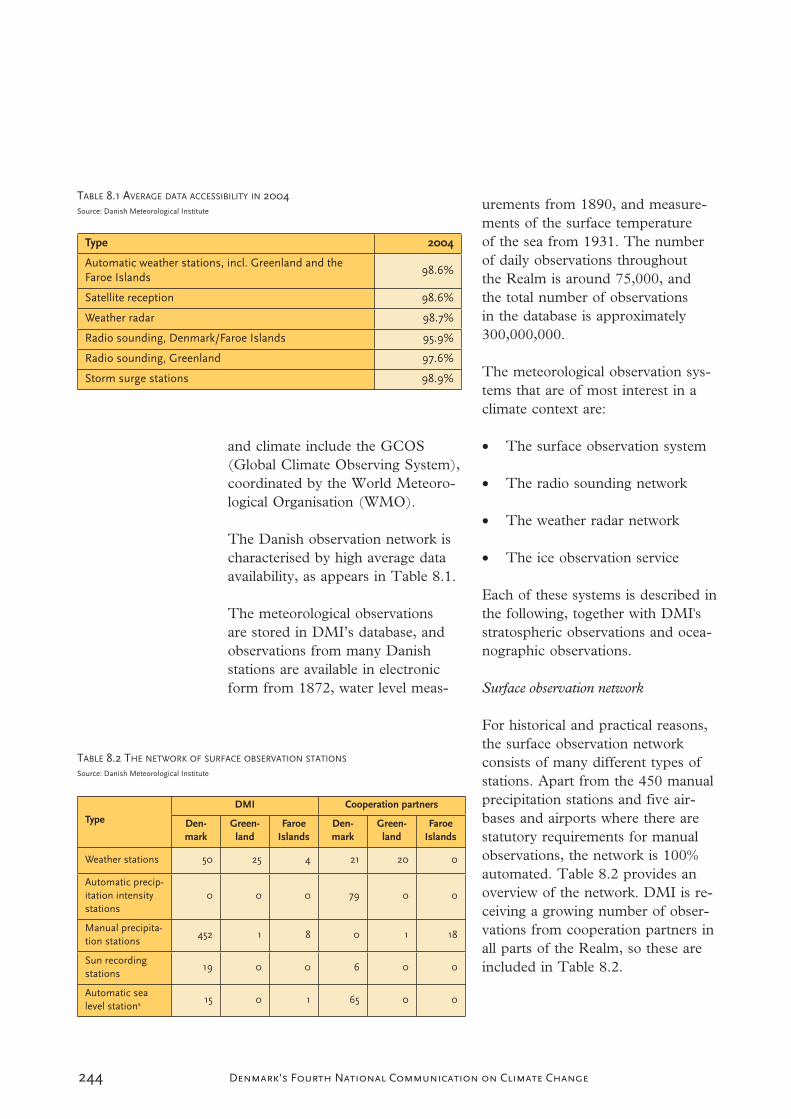
244 Denmark's Fourth National Communication on Climate Change
and climate include the GCOS (Global Climate Observing System), coordinated by the World Meteoro-logical Organisation (WMO).
The Danish observation network is characterised by high average data availability, as appears in Table 8.1.
The meteorological observations are stored in DMI’s database, and observations from many Danish stations are available in electronic form from 1872, water level meas-
urements from 1890, and measure-ments of the surface temperature of the sea from 1931. The number of daily observations throughout the Realm is around 75,000, and the total number of observations in the database is approximately 300,000,000.
The meteorological observation sys-tems that are of most interest in a climate context are:
The surface observation system
The radio sounding network
The weather radar network
The ice observation service
Each of these systems is described in the following, together with DMI's stratospheric observations and ocea-nographic observations.
Surface observation network
For historical and practical reasons, the surface observation network consists of many different types of stations. Apart from the 450 manual precipitation stations and five air-bases and airports where there are statutory requirements for manual observations, the network is 100% automated. Table 8.2 provides an overview of the network. DMI is re-ceiving a growing number of obser-vations from cooperation partners in all parts of the Realm, so these are included in Table 8.2.
TABLE 8.1 AVERAGE DATA ACCESSIBILITY IN 2004Source: Danish Meteorological Institute
Type 2004
Automatic weather stations, incl. Greenland and theFaroe Islands
98.6%
Satellite reception 98.6%
Weather radar 98.7%
Radio sounding, Denmark/Faroe Islands 95.9%
Radio sounding, Greenland 97.6%
Storm surge stations 98.9%
TABLE 8.2 THE NETWORK OF SURFACE OBSERVATION STATIONS
Source: Danish Meteorological Institute
Type
DMI Cooperation partners
Den-mark
Green-land
Faroe Islands
Den-mark
Green-land
Faroe Islands
Weather stations 50 25 4 21 20 0
Automatic precip-itation intensitystations
0 0 0 79 0 0
Manual precipita-tion stations
452 1 8 0 1 18
Sun recordingstations
19 0 0 6 0 0
Automatic sealevel stations 15 0 1 65 0 0
245Denmark's Fourth National Communication on Climate Change
Besides the observations from the Danish land areas, DMI has an ob-servation agreement with about 50 Danish, Greenlandic and Faroese ships, which carry out systematic observations in the North Sea, the Baltic, the North Atlantic and the waters around Denmark. In addi-tion, Denmark is a partner in the EGOS/SURFMAR cooperation on collection of weather observations from ships and drifting weather buoys in the North Atlantic, since DMI has strategically well placed satellite reception facilities in Kangerlussuaq (Greenland) and in Copenhagen. Danish observations are also included, and are coordinat-ed with EUCOS (European Coordi-nated Observation System), which is organised by EUMETNET (Euro-pean Meteorological Network).
The radio sounding networkIn radio sounding, a small, fully au-tomatic weather station is sent up by balloon. The balloon can reach a height of about 35 kilometres, and all the way up it sends observations of temperature, pressure, humid-ity, and wind velocity via radio to a receiving station. Radio sound-ings provide measurement of the atmosphere’s vertical profile for use in analyses of the condition of the atmosphere. They also enable meas-urement of ozone and radioactivity.
The DMI operates radio sounding stations in Copenhagen, in Thor-shavn on the Faroe Islands and in Danmarkshavn, Illoqqortoormiit, Tasiilaq, Narsarsuaq, and Aasiaat in Greenland. Soundings are also
received from two so-called ASAP (Automated Shipboard Aerologi-cal Programme) containers, which are portable radio sounding stations designed for use on ships. DMI has had an agreement for many years with a Greenland shipping company on ship-borne radio soundings in the North Sea and the North Atlantic. The radio sounding stations and the ASAP units take two daily sound-ings, although the ASAP units do not take a sounding if they are near a land radio sounding station, such as the one in Thorshavn. The total number of soundings per year is in the order of 5,800.
Weather radar networkWith radars in Sindal and on Stevns, Rømø and Bornholm, Denmark’s network of weather radars provides almost 100% coverage, which ena-bles comparison with ground-truth data from a network of land-based precipitation stations.
The weather radar network has a high spatial resolution and is there-fore able to provide precipitation-climatological information at a very high degree of detail nationally, regionally, and locally. By calibrat-ing radar data against surface-based point-precipitation measurements, the latest research results show that good absolute accuracy can be achieved. The present radar network has a data frequency of six data sets per hour and the spatial resolution is 2x2 km2.
246 Denmark's Fourth National Communication on Climate Change
Satellite dataDenmark contributes to space-based observations through membership of the European Space Agency ESA and the European meteorological satellite organisation EUMETSAT, and DMI has facilities for receiv-ing satellite data in Denmark and Greenland.
In cooperation with EUMETSAT, DMI is managing the development of a so-called satellite application fa-cility (SAF) for use of GPS data for weather and climate monitoring and is also participating in the develop-ment of SAFs for oceanography and sea-ice, together with ozone and UV radiation.
8.3.2 Ice observation serviceDMI is responsible for systematic monitoring of the ice conditions in the waters around Greenland. Observations of the ice conditions have been collected for about 125 years, and there is a very large quan-tity of data in graphic form such as monthly surveys, ice maps, etc. Since 1959 the waters south of Kap Farvel, in particular, have been in-tensively monitored with a view to making shipping in the area safer. Ice maps are prepared several times a week with detailed information on relevant ice conditions. All new ice maps are in vector-graphic form. Since 2000 weekly maps have been prepared showing the ice condi-tions all the way round Greenland. The maps are based on satellite data and are essentially an automatically produced product that is primarily intended as a basis for analyses of
climatic conditions for Greenland and the surrounding waters. DMI is carrying out research in mapping the extent of sea-ice through the past centuries.
8.3.3 Stratospheric observationsDMI is engaged in studies of the physical processes resulting in changes of the ozone layer, and stratospheric monitoring of relevance to the climate of the future. The DMI research and systematic obser-vations are underpinned by the rec-ommendations of the Montreal Pro-tocol and form part of the research to which Denmark is committed by its ratification of the Vienna Con-vention of 22 March 1985 for the Protection of the Ozone Layer.
Measurements of the ozone layer and UV radiation are made at Copenhagen and Kangerlussuaq (Søndre Strømfjord), using Brewer ozone spectrometers. At Pituffik (Thule) measurements are made of the ozone layer, UV radiation, global radiation, aerosols and stratospheric NO2, using a Dobson spectrometer, SAOZ spectrometer, UV spectro-radiometer, pyranometer and aero-sol radiometer. In order to monitor the ozone depletion in the lower stratosphere in the winter and spring months, and with a view to estab-lishing ozone profile climatology, DMI has since 1989 launched ozone probes from a number of stations in Greenland. Since January 1993 ozone probes have been launched each week from Ittoqqortoormiit (Scoresbysund) on the east coast of Greenland.
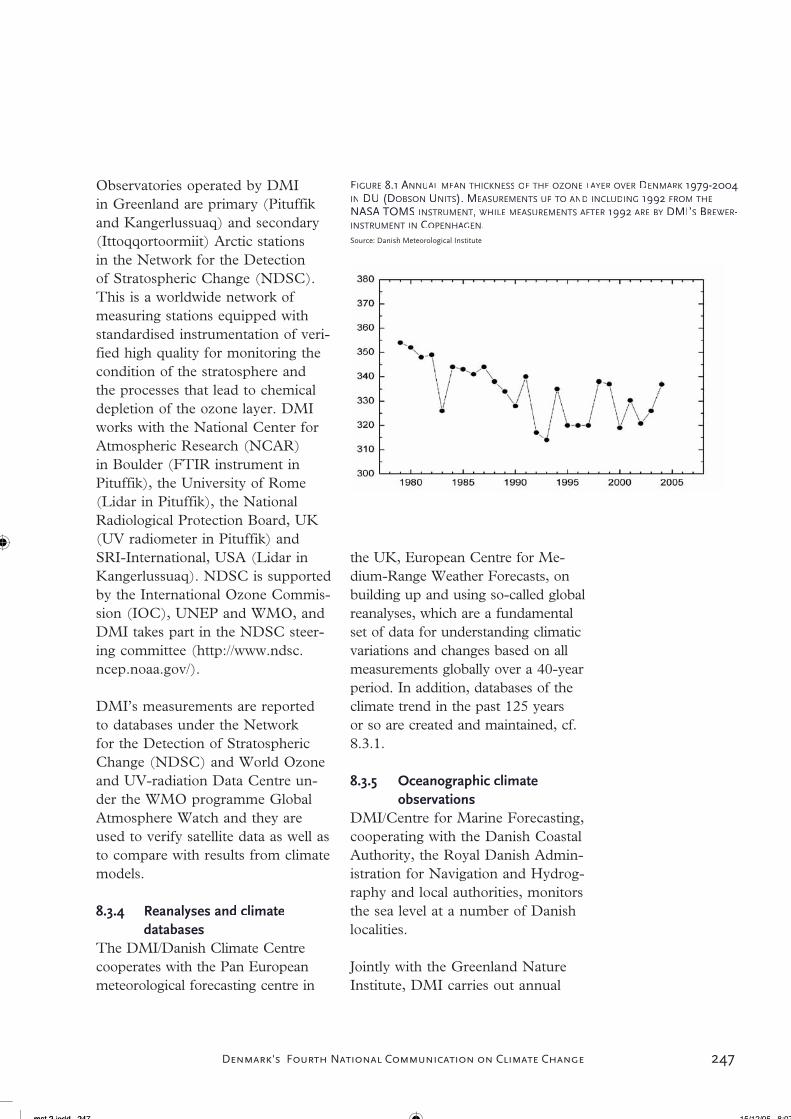

248 Denmark's Fourth National Communication on Climate Change
oceanographic observations in stand-ard sections off the west coast of Greenland, aiming at monitoring climate change in the Greenland marine environment and using the data in assessments of the future fishery ressources. In recent years this programme has been extended to include stations in fiords near Si-simiut, in order to be able to under-stand the causes of the fairly recent crab fishery.
DMI is also processing oceano-graphic data from the annual trawl cruises made by the Greenland Na-ture Institute. Monitoring stations are shown in Figure 8.2.
8.3.6 Terrestrial observations related to climate changes
Monitoring of snow cover, sea-ice and surface radiation is reported in sections 8.3.1 and 8.3.2. Denmark does not carry out further terres-trial observations that can be related to climate change, but Denmark’s climate related research (cf. 8.2) in-cludes monitoring and studying the effect of terrestrial conditions.
8.3.7 Development assistance for establishment and maintenance of observation and monitoring systems
From 1997 to 2004 DMI participat-ed in a development project together with the meteorological institute of Ghana (Meteorological Services De-partment - MSD). The purpose of the project included re-establishing a network of meteorological stations in the country, thereby ensuring col-lection of data. At the same time, it was to improve communication and use of the collected data. The project was completed in 2004. At the end of the project, MSD had an efficient network of around 300 observation stations registering the usual meteorological parameters.
DMI also coordinated the project ‘Use of climatic seasonal forecasts to improve cultivation strategies for crops in West Africa’. The purpose of this project was to examine the possibilities for adapting cultivation practice for a selected agricultural crop (peanuts) in Ghana, using the best available seasonal forecasts for the climate. The project was funded
FIGURE 8.2 STANDARD HYDROGRAPHIC SECTIONS OFF THE WEST COAST OF GREENLAND.SOUTHERN STATIONS – INCLUDING SISIMIUT – ARE OPERATED BY DMI, WHILE
NORTHERN STATIONS ARE OPERATED BY THE GREENLAND NATURE INSTITUTE.Source: Danish Meteorological Institute
249Denmark's Fourth National Communication on Climate Change
by the Council for Developing Country Research (RUF).
In 2004 DMI and AGRHYMET in Niger prepared a proposal for a project on the use of satellite data and preparation of seasonal fore-casts. However, contrary to expecta-tions, the necessary project funds will probably not be available.
Notes1 Climate Change Research – Danish Contri-butions, Jørgensen et al., 20012 Mapping of Danish climate research andproposals for strengthening action areas. Preparedfor the Working Group for a Danish Climate ResearchProgramme, ECON Center for Economic Analysis,December 20023 The climate of the 21st century: Transientsimulations with a coupled atmosphere-ocean gen-eral circulation model, Stendel et al. 20004 Christensen and Christensen, 2003; Kiils-holm et al., 2004.5 Christensen et al. 2002; 2005Christensen et al. 2002; 2005

250 Denmark's Fourth National Communication on Climate Change
251Denmark's Fourth National Communication on Climate Change
In Denmark there is an ongoing public debate in the media and else-where about climate change, anthro-pogenic greenhouse gas emissions and political reactions in terms of policies and measures. In 2002 the government published its strategy for sustainable development. The Danish climate policy – includ-ing the Climate Strategy adopted in 2003 - must be seen in the light of the action to make the develop-ment of Danish society sustainable. Part of the strategy is to involve the public and openness around the strategy, decision-making and analyses. Denmark has a long tradi-tion for involving the public and, in the environment field, this tradition was followed up by an international agreement - the Aarhus Convention from 1998. In the international UN negotiations on a common effort to mitigate the effect of climate chang-es, both Danish industry, and green and development-oriented organisa-tions were represented in the Danish delegation. A considerable amount of information on climate change and Danish policies is provided on the websites of the Ministry of Envi-ronment (www.mim.dk), the Danish Environmental Protection Agency (www.mst.dk), the Ministry of Fi-nance (www.fm.dk), the Ministry of Transport and Energy (www.trm.dk) and the Danish Energy Author-ity (www.ens.dk).
9 Education, training and public awareness
9.1 EDUCATION AND POSTGRADUATE
EDUCATION PROGRAMMES
Climate change is a central theme at Copenhagen Global Change Ini-tiative (COGCI), which is a PhD school and research network estab-lished in cooperation between the University of Copenhagen, DMI, NERI, and GEUS. The school has 22 PhD students registered at present. The programme comprises general and specialist courses, to-gether with seminars and theme days. The seminars and theme days are open to the public.
The universities disseminate widely the result of research - for example, the Niels Bohr Institute’s activities are published at the website http://www.fys.ku.dk/hco/presse/Formi-dling2002.htm. A large part of this work concerns climate, both specifi-cally and more generally.
Climate regulation at UN, EU and national levels (and associated lob-byism) is a key issue in the new Master in Environment and Energy Law (MEEL). The degree is of-fered from 1 September 2006 at the University of Aarhus, cooperating with Aarhus School of Business, the University of Southern Denmark, and the Royal Veterinary and Ag-ricultural University. NERI is also contributing to the course.
Members of DMI/Danish Cli-mate Centre staff give lectures to high-school students, teachers and researchers, and others. Staff mem-bers have, for instance, since 1998

252 Denmark's Fourth National Communication on Climate Change
taken part in the Danish Science Festival, giving lectures around Den-mark. For further information, visit http://www.dnf2004.dk/. 150,000 people have taken part in each of the festival’s 2000 events and activi-ties. Further, primary/lower second-ary and upper secondary students take part in special science training programmes in the festival periods. DMI presents general information material on www.dmi.dk, offering both basic knowledge on climate and climate change issues, and topic themes/news, which is largely used in Danish schools.
In connection with the many projects initiated under the Danish Environmental Protection Agen-cy’s (Danish EPA) Programme for Cleaner Products, reports are required, and these are made pub-licly accessible. In addition, articles are prepared for various technical journals so that the relevant target groups learn about the results.
On the Danish EPA website http://www.mst.dk (click top border ”Un-dervisningsmateriale”), the Agency presents teaching material which can be used for instance for teach-ing various disciplines in Danish schools at all levels. The teaching material is targeted towards specific levels. Cooperating with the Ministry of Foreign Affairs, the Ministry of the Environment has prepared the Global Environment project with teaching material targeted towards environmental studies, focusing i.a. on climate. The material is internet-
based (www.globalemiljoe.dk) and supplemented by a manual.
The Danish EPA also operates a website, www.dea-ccat.dk, with interactive simple climate models (based on the second assessment re-port of the Intergovernmental Panel on Climate Change). On the web-site, school children and others may test the reductions required in order to stabilise the atmospheric content of greenhouse gases. The model, originally developed by the Danish Energy Authority’s Climate Group, is used extensively by upper second-ary students and teachers. DEA-CCAT has also supported the de-velopment of the JCM (java climate model, www.chooseclimate.org), and requested a Danish version of the web facility.
On http://www.emu.dk/miljoe/ you will find extensive information on environment and nature, including impacts on the climate, targeted to-wards teaching at upper secondary schools, primary and lower second-ary schools, and vocational training, and aiming at helping teachers and pupils integrate environmental is-sues in general training. This is done by presenting teaching courses, by giving access to information and lit-erature, and by reference and links to relevant national and international authorities and institutions.
9.2 CLIMATE INFORMATION
The websites of the Ministry of the Environment and of the Danish

253Denmark's Fourth National Communication on Climate Change
EPA are updated regularly with the latest relevant information within the climate area, either directly in the form of press releases, documents, reports, etc. or through links to the actual players.
The Ministry of the Environment publishes the series Miljø-Tema (environmental essays) focussing on various subjects, including the leaflet: Adapting to the climate of the future. These can be ordered from the Ministry’s information centre, Frontlinien, at http://www.frontlinien.dk, or be downloaded at http://www.mst.dk/udgiv/Publica-tions/2004/87-7614-456-9/html/de-fault_eng.htm
The Danish EPA publishes a number of environmental data on the website http://www.mst.dk (click top border ”Miljødatabaser”), in-cluding for instance discharge data from sewage treatment plants, sepa-rate industrial discharges, and fresh-water fish farming, and data from marine and saltwater fish farming.
DERI prepares regular reports about environmental issues. Tech-nical Report No. 401 contains an evaluation of Denmark’s need and possibilities for adapting to future climate changes. In connection with the report, a poster with illustrations has been published. The report fea-tures on NERI’s website www.dmu.dk. A number of NERI’s reports on climate are designed for use in the education sector, including Theme Report 29/1999 Where does air pollution come from? and Theme
Report 31/2000 CO2, where, why, how much?. The report Danish ad-aptation to a changed climate from NERI 2002 presents the climate changes expected in Denmark. The report shows that rational long-term planning may prevent much damage and many effects of probable climate changes.
DMI/Danish Climate Centre dis-seminates knowledge on climate issues to the general public on an extensive website on www.dmi.dk. DMI also communicates through lectures and popular articles in newspapers and trade journals, through series of reports, and at theme days (Nyt Klimaforum). In 2001 DMI/Danish Climate Centre published the book ´Climate Change Research - Danish Contributions´. The book provides a general in-troduction to the problem of man-made climate changes and describes research projects and results at a number of institutions in Denmark. Reports, KlimaNyt and Climate Change Research can be obtained at www.dmi.dk. Finally, employees at DMI often take part in radio and TV interviews, and in interviews in the printed press.
Another relevant website is http://www.glaciology.gfy.ku.dk/, which is updated regularly.
9.3 DANISH PARTICIPATION IN INTERNA-TIONAL CLIMATE ACTIVITIES
DMI/the Danish Climate Centre participates in a number of inter-
254 Denmark's Fourth National Communication on Climate Change
national research projects with sup-port primarily from the European Commission’s framework research programmes. In addition, the Centre contributes to IPCC work. This in-cludes analyses of the development of climate for several of the IPCC’s SRES emission scenarios with a coupled atmosphere ocean model system, carried out in international cooperation. These scenarios are available for effect studies in the IPCC’s scenario database. Employ-ees at DMI/ Danish Climate Centre have also participated in the prepa-ration of the IPCC’s Third Assess-ment Report (TAR) - one was coor-dinating author, another contributing author and several participated as expert reviewers. The same applies for IPCC’s Fourth Assessment Re-port (AR4). DMI is also very active in communication the IPCC’s re-ports to the public through transla-tions and popular articles/books.
The Danish Institute of Agricul-tural Sciences has contributed to the IPCC through an EU Concerted Action concerning effects of climate changes and adaptation to a changed climate in Europe.
The Risø National Laboratory also participates at expert level in the IPCC. The UNEP Centre at Risø has contributed to the TAR WG III Report with five authors and a coor-dinating author. The UNEP Centre participates in a wide range of infor-mation activities in that connection with different policy possibilities in cooperation with e.g. DMI, NERI, and others.
NERI works in different ways to popularise and communicate the content of e.g. TAR, the latest re-search results on climate effects, etc.
Via DEA-CCAT the Danish EPA has taken part in the so-called Match Project (Modelling and As-sessment of Contributions to Cli-mate Change, www.match-info.net),working with practical methods to link future climate change to spe-cific emissions from the different countries. The Match Project was triggered by a proposal which was originally presented by Brazil under the Climate Convention, and reports back to the Climate Convention’s Conference of the Parties.
9.4 PUBLIC CAMPAIGNS
A number of initiatives are being carried out to promote environmen-tally sound behaviour in companies and households, particularly for climate reasons, and with respect to energy use. Labelling schemes, printed matter, information lines, media spots and similar are used to increase public knowledge of pos-sibilities for action and knowledge of less environmentally harmful tech-nologies.
Traffic, health and the environment. In the last few years environment policy has increasingly focused on the fact that we all share responsi-bility for environmental problems and for helping to solve them. This strategy is now also penetrating in the transport sector, and in the last
255Denmark's Fourth National Communication on Climate Change
three to four years, two large na-tionwide environmental traffic cam-paigns have been implemented. We Bicycle to Work and Environmental Traffic Week, which is an element in the European car-free day on 22 September and European Mobility Week, in which more than 1,000 towns all over Europe participated in 2002.
In We Bicycle to Work, the Danish Cyclists’ Federation has established good cooperation with many citizens and companies and has particularly communicated the health benefits of cycling as a form of transport.
In Green Transport Week the em-phasis was on demonstrating more environment-friendly transport hab-its (use the car less, buy an energy-efficient car, drive together with oth-ers, use the bike for short trips, use public transport as much as possible, etc.). Emphasis was also on discuss-ing traffic habits with the public in open dialogue and without reproach. In this way greater public engage-ment in the cause of environmental traffic can be established and help to create greater understanding of new ways of organising urban transport systems.
Another reason for the increased campaign and information activities is that a combination of measures affecting attitudes and behaviour and other forms of encouragement, such as economy and accessibility without a car are needed to promote more environment-friendly traffic habits.
Evaluations show that both We Bi-cycle to Work and the Environmen-tal Traffic Week have had a good effect and have been well received by municipalities, interest and grass-roots organisations, and companies, all of which were in charge of most of the actual activities. The Ministry of Transport and the Ministry of the Environment have so far provided annual funding of DKK 4-5 mill. for Environmental Traffic Week in or-der to support and co-fund the work of the municipalities. The present government co-funding ended in 2003 and it has since been up to the Danish municipalities themselves to finance any participation in Euro-pean Mobility Week.
In the years ahead the growing pub-lic focus on lifestyle diseases and obesity will probably provide good opportunities for marketing non-mo-torised forms of transport, such as cycling and walking, in public health campaigns drawing people’s atten-tion to the health benefits of using a bicycle more often, walking to the shops, leisure activities, etc.

256 Denmark's Fourth National Communication on Climate Change

257Denmark's Fourth National Communication on Climate Change
This Annex contains five tables summarising the results of the latest greenhouse gas inventories for Den-mark 1990-2003 and tables showing the inventories of Greenland’s CO2
emissions from energy use 1990-2003 and the Faroe Islands’ emis-sion of CO2, methane (CH4) and ni-trous oxide (N2O) 1990-2003. The tables have been reproduced from the annual report to the Climate Convention from April 2005 (The National Inventory Report - NIR, including the Common Reporting Format - CRF).
Table A.1 (CRF Table 10-1): Den-mark’s emissions and removals of carbon dioxide (CO2) in the period 1990-2003
Table A.2 (CRF Table 10-2): Den-mark’s emissions of methane (CH4)in the period 1990-2003
Table A.3 (CRF Table 10-3): Den-mark’s emissions of nitrous oxide (N2O) in the period 1990-2003
Table A.4 (CRF Table 10-4): Den-mark’s emissions of industrial green-house gases (HCFs, PFCs and SF6)in the period 1990-2003
Table A.5 (CRF Table 10-5): Den-mark’s total emissions and removals of greenhouse gases in the period 1990-2003
Table A.6 : Greenland’s CO2 emis-sions from energy use, the Faroe Islands’ emissions of CO2, methane (CH4) and nitrous oxide (N2O), and the combined inventory for Den-
Annex A Greenhouse gas inventories 1990-2003
mark, Greenland and the Faroe Is-lands in the period 1990-2003
Note references in the tables:
1) Denmark’ base year under the Climate Con-
vention is 1990. Denmark’s base year under
the Kyoto Protocol, which in accordance
with the procedures in the Protocol will not
be finally fixed until 2006-2007, will deviate
from the base year under the Convention.
2) Emissions and removals of CO2 from agri-
cultural land are included in accordance with
the guidelines from the Intergovernmental
Panel on Climate Change (IPCC) in the in-
ventories on total CO2 emissions and remov-
als from land (category 5D).
3) & (7) Total net emissions are shown for
each year in this category. A negative (-) net
emissions means that there are net removals.
4) & (6) Denmark’s total net emissions are
shown both with and without LUCF to facili-
tate comparisons with other countries. The
LUCF category is also treated separately un-
der the Kyoto Protocol, cf. Articles 3.3 and
3.4 of the Protocol.
5) Current emissions are stated here.
Abbreviations used in the tables:.
NE: Not Estimated

258 Denmark's Fourth National Communication on Climate Change
Base
yea
r(1)
1990
1991
1992
1993
1994
1995
1996
1997
1998
1999
2000
2001
2002
2003
(Gg C
O2)
1. E
ner
gy
51502
62015
56107
58411
62026
58992
72324
62650
58595
55792
51290
52879
52535
57635
A. F
uel C
om
bust
ion (
Sect
ora
l Appro
ach
)51239
61497
55573
57943
61558
58627
71923
62085
58173
54895
50696
52246
52000
57085
1. E
ner
gy I
ndust
ries
26173
35113
30082
31627
35352
31934
44321
35084
31381
28231
25114
26400
26553
31402
2. M
anufa
cturi
ng I
ndust
ries
and C
onst
ruct
ion
5376
5800
5502
5438
5697
5890
6012
6019
5970
6020
5786
5804
5559
5404
3.
Tra
nsp
ort
10441
10917
11046
11237
11685
11823
12028
12159
12191
12253
12118
12142
12319
12785
4. O
ther
Sec
tors
9129
9380
8801
9403
8573
8728
9386
8652
8427
8208
7567
7803
7481
7402
5. O
ther
119
287
141
237
252
252
176
171
204
182
111
97
89
92
B. F
ugiti
ve E
mis
sions
from
Fuels
263
518
534
468
468
365
400
565
422
898
594
633
535
550
1. S
oli
d F
uel
s0
00
00
00
00
00
00
0
2. O
il a
nd N
atura
l G
as263
518
534
468
468
365
400
565
422
898
594
633
535
550
2. I
nd
ust
rial
Pro
cess
es1068
1239
1356
1369
1369
1375
1446
1612
1618
1539
1574
1606
1601
1488
A. M
iner
al P
roduct
s1037
1209
1326
1336
1334
1335
1409
1576
1575
1494
1531
1556
1598
1486
B. C
hem
ical
Indust
ry
22
22
22
22
12
33
33
C. M
etal
Pro
duct
ion
28
28
28
31
34
39
35
35
42
43
41
47
00
D. O
ther
Pro
duct
ion
NE
NE
NE
NE
NE
NE
NE
NE
NE
NE
NE
NE
NE
NE
E. P
roduct
ion o
f H
aloca
rbons
and S
F6
F. C
onsu
mpti
on o
f H
aloca
rbons
and S
F6
G. O
ther
0
00
00
00
00
00
00
0
3. S
olv
ent
an
d O
ther
Pro
du
ct U
se
317
305
292
280
268
242
265
262
195
192
212
130
151
206
4.
Agri
cult
ure
00
00
00
00
00
00
00
A. E
nte
ric
Fer
men
tati
on
B. M
anure
Man
agem
ent
C. R
ice
Cult
ivat
ion
D.
Agri
cult
ura
l S
oil
s (2
)0
00
00
00
00
00
00
0
E. P
resc
ribed
Burn
ing o
f S
avan
nas
F. F
ield
Burn
ing o
f A
gri
cult
ura
l R
esid
ues
G. O
ther
5. L
an
d-U
se C
han
ge
an
d F
ore
stry
(3)
158
-113
-252
-466
-330
-234
-422
-443
-819
-870
1782
-1158
-1476
-1204
A. C
han
ges
in F
ore
st a
nd O
ther
Woody B
iom
ass
Sto
cks
-2832
-3013
-3000
-3215
-3100
-2992
-3064
-3153
-3313
-3311
-653
-3539
-3813
-3533
B. F
ore
st a
nd G
rass
land C
onver
sion
00
00
00
00
00
00
00
C.
Aban
donm
ent
of
Man
aged
Lan
ds
00
00
00
00
00
00
00
D. C
O2 E
mis
sions
and R
emoval
s fr
om
Soil
2990
2900
2748
2749
2770
2758
2642
2710
2494
2441
2435
2381
2337
2329
E. O
ther
0
00
00
00
00
00
00
0
6.
Wast
e0
00
00
00
00
00
00
0
A. S
oli
d W
aste
Dis
posa
l on L
and
B.
Was
te-w
ater
Han
dli
ng
C.
Was
te I
nci
ner
atio
n
D. O
ther
7. O
ther
(p
lease
sp
ecif
y)
00
00
00
00
00
00
00
Tota
l E
mis
sion
s/R
emovals
wit
h L
UC
F (
4)
53045
63446
57503
59594
63333
60375
73613
64081
59590
56653
54858
53457
52812
58124
Tota
l E
mis
sion
s w
ith
ou
t L
UC
F(4
)52887
63559
57755
60060
63663
60609
74035
64524
60409
57523
53076
54615
54288
59329
Mem
o I
tem
s:
Inte
rnati
on
al
Bu
nk
ers
4823
4394
4580
5958
6647
6928
6774
6414
6573
6445
6629
5990
5025
5318
Avia
tion
1736
1632
1693
1659
1818
1867
1971
2010
2159
2290
2350
2385
2059
2188
Mar
ine
3087
2762
2887
4300
4829
5061
4803
4403
4414
4155
4279
3605
2966
3130
Mu
ltil
ate
ral
Op
erati
on
s0
00
00
00
00
00
00
0
9108
9108
9108
9108
9108
9108
9108
9108
9108
9108
9108
9108
9108
9108
9108
9108
(1)
Fil
l in
th
e b
ase
yea
r ad
op
ted b
y t
he
Par
ty u
nder
the
Conven
tion,
if d
iffe
rent
from
1990.
(2)
See
fo
otn
ote
4 t
o S
um
mar
y 1
.A o
f th
is c
om
mon r
eport
ing f
orm
at.
(3)
Tak
e th
e n
et e
mis
sio
ns
as r
eport
ed i
n S
um
mar
y 1
.A o
f th
is c
om
mon r
eport
ing f
orm
at.
Ple
ase
note
that
for
the
pu
rpo
ses
of
rep
ort
ing
, th
e si
gn
s fo
r u
pta
ke
are
alw
ays
(-)
and
fo
r em
issi
on
s (+
).
(4)
Th
e in
form
atio
n i
n t
hes
e ro
ws
is r
eques
ted t
o f
acil
itat
e co
mpar
ison o
f dat
a, s
ince
Par
ties
dif
fer
in t
he
way
they
rep
ort
CO
2 e
mis
sio
ns
and
rem
ov
als
fro
m L
and
-Use
Ch
ang
e an
d F
ore
stry
.
GR
EE
NH
OU
SE
GA
S S
OU
RC
E A
ND
SIN
K C
AT
EG
OR
IES

259Denmark's Fourth National Communication on Climate Change
Base
yea
r(1)
1990
1991
1992
1993
1994
1995
1996
1997
1998
1999
2000
2001
2002
2003
(Gg C
H4)
Tota
l E
mis
sion
s270,6
6275,4
9277,0
7285,4
2286,0
9290,8
4296,4
7290,4
4287,7
0283,4
9282,9
1287,0
9283,5
3279,6
8
1. E
ner
gy
14,1
516,1
516,7
120,2
024,4
331,5
236,4
236,6
534,8
335,0
634,3
836,0
735,5
236,7
1
A. F
uel C
om
bust
ion (
Sect
ora
l Appro
ach
)8,8
89,9
610,7
013,0
816,3
922,3
427,3
027,0
428,2
928,1
727,5
829,0
028,6
828,3
0
1. E
ner
gy I
ndust
ries
1,1
11,5
31,8
33,3
86,3
711,5
114,9
614,5
115,7
015,6
314,8
416,0
716,0
015,7
1
2. M
anufa
cturi
ng I
ndust
ries
and C
onst
ruct
ion
0,7
80,8
20,7
90,8
10,8
30,9
31,3
51,3
61,4
41,4
51,6
41,6
91,6
51,6
2
3.
Tra
nsp
ort
2,6
92,9
73,1
13,3
83,5
53,7
13,9
83,8
23,6
63,5
83,4
43,4
03,1
53,1
0
4. O
ther
Sec
tors
4,2
94,6
24,9
55,4
95,6
46,1
86,9
97,3
47,4
87,5
07,6
57,8
47,8
77,8
7
5. O
ther
0,0
10,0
20,0
10,0
10,0
10,0
20,0
10,0
10,0
10,0
10,0
10,0
10,0
00,0
0
B. F
ugiti
ve E
mis
sions
from
Fuels
5,2
76,1
96,0
27,1
28,0
49,1
89,1
39,6
16,5
46,8
96,8
07,0
66,8
58,4
1
1. S
oli
d F
uel
s3,4
53,9
73,9
14,7
95,6
16,3
06,3
66,5
33,4
73,3
73,0
43,2
82,9
74,4
3
2. O
il a
nd N
atura
l G
as1,8
32,2
22,1
12,3
32,4
32,8
82,7
63,0
83,0
73,5
13,7
63,7
83,8
83,9
8
2. I
nd
ust
rial
Pro
cess
es0,0
00,0
00,0
00,0
00,0
00,0
00,0
00,0
00,0
00,0
00,0
00,0
00,0
00,0
0
A. M
iner
al P
roduct
s0,0
00,0
00,0
00,0
00,0
00,0
00,0
00,0
00,0
00,0
00,0
00,0
00,0
00,0
0
B. C
hem
ical
Indust
ry
0,0
00,0
00,0
00,0
00,0
00,0
00,0
00,0
00,0
00,0
00,0
00,0
00,0
00,0
0
C. M
etal
Pro
duct
ion
0,0
00,0
00,0
00,0
00,0
00,0
00,0
00,0
00,0
00,0
00,0
00,0
00,0
00,0
0
D. O
ther
Pro
duct
ion
E. P
roduct
ion o
f H
aloca
rbons
and S
F6
F. C
onsu
mpti
on o
f H
aloca
rbons
and S
F6
G. O
ther
0,0
00,0
00,0
00,0
00,0
00,0
00,0
00,0
00,0
00,0
00,0
00,0
00,0
00,0
0
3. S
olv
ent
an
d O
ther
Pro
du
ct U
se
4.
Agri
cult
ure
183,4
6184,9
7185,3
7189,3
9187,7
1187,5
4188,5
9184,2
9186,3
3180,5
8181,4
0183,5
3179,7
3176,4
5
A. E
nte
ric
Fer
men
tati
on
148,0
9147,9
0145,8
2147,3
0146,6
9146,6
1147,0
6142,2
4142,5
8137,4
0136,7
8138,0
0133,7
1130,1
7
B. M
anure
Man
agem
ent
35,3
737,0
839,5
542,0
941,0
340,9
341,5
342,0
543,7
543,1
844,6
245,5
346,0
246,2
8
C. R
ice
Cult
ivat
ion
0,0
00,0
00,0
00,0
00,0
00,0
00,0
00,0
00,0
00,0
00,0
00,0
00,0
00,0
0
D.
Agri
cult
ura
l S
oil
s0,0
00,0
00,0
00,0
00,0
00,0
00,0
00,0
00,0
00,0
00,0
00,0
00,0
00,0
0
E. P
resc
ribed
Burn
ing o
f S
avan
nas
0,0
00,0
00,0
00,0
00,0
00,0
00,0
00,0
00,0
00,0
00,0
00,0
00,0
00,0
0
F. F
ield
Burn
ing o
f A
gri
cult
ura
l R
esid
ues
0,0
00,0
00,0
00,0
00,0
00,0
00,0
00,0
00,0
00,0
00,0
00,0
00,0
00,0
0
G. O
ther
0,0
00,0
00,0
00,0
00,0
00,0
00,0
00,0
00,0
00,0
00,0
00,0
00,0
00,0
0
5. L
an
d-U
se C
han
ge
an
d F
ore
stry
0,0
00,0
00,0
00,0
00,0
00,0
00,0
00,0
00,0
00,0
00,0
00,0
00,0
00,0
0
A. C
han
ges
in F
ore
st a
nd O
ther
Woody B
iom
ass
Sto
cks
B. F
ore
st a
nd G
rass
land C
onver
sion
0,0
00,0
00,0
00,0
00,0
00,0
00,0
00,0
00,0
00,0
00,0
00,0
00,0
00,0
0
C.
Aban
donm
ent
of
Man
aged
Lan
ds
D. C
O2 E
mis
sions
and R
emoval
s fr
om
Soil
E. O
ther
0,0
00,0
00,0
00,0
00,0
00,0
00,0
00,0
00,0
00,0
00,0
00,0
00,0
00,0
0
6.
Wast
e73,0
574,3
774,9
975,8
373,9
471,7
971,4
769,5
066,5
367,8
667,1
367,4
968,2
766,5
1
A. S
oli
d W
aste
Dis
posa
l on L
and
63,5
364,6
565,0
665,6
963,5
961,2
260,6
857,5
155,3
356,7
056,7
756,5
755,0
654,9
0
B.
Was
te-w
ater
Han
dli
ng
9,5
29,7
29,9
310,1
410,3
510,5
710,7
811,9
911,2
111,1
610,3
610,9
213,2
111,6
2
C.
Was
te I
nci
ner
atio
n0,0
00,0
00,0
00,0
00,0
00,0
00,0
00,0
00,0
00,0
00,0
00,0
00,0
00,0
0
D. O
ther
0,0
00,0
00,0
00,0
00,0
00,0
00,0
00,0
00,0
00,0
00,0
00,0
00,0
00,0
0
7. O
ther
(p
lease
sp
ecif
y)
0,0
00,0
00,0
00,0
00,0
00,0
00,0
00,0
00,0
00,0
00,0
00,0
00,0
00,0
0
Mem
o I
tem
s:
Inte
rnati
on
al
Bu
nk
ers
0,1
00,0
90,1
00,1
30,1
40,1
50,1
50,1
40,1
40,1
40,1
40,1
20,1
10,1
1
Avia
tion
0,0
30,0
30,0
30,0
30,0
30,0
40,0
40,0
40,0
40,0
40,0
40,0
40,0
40,0
4
Mar
ine
0,0
70,0
60,0
70,1
00,1
10,1
10,1
10,1
00,1
00,0
90,1
00,0
80,0
70,0
7
Mu
ltil
ate
ral
Op
erati
on
s0,0
00,0
00,0
00,0
00,0
00,0
00,0
00,0
00,0
00,0
00,0
00,0
00,0
00,0
0
CO
2E
mis
sion
s fr
om
Bio
mass
GR
EE
NH
OU
SE
GA
S S
OU
RC
E A
ND
SIN
K C
AT
EG
OR
IES
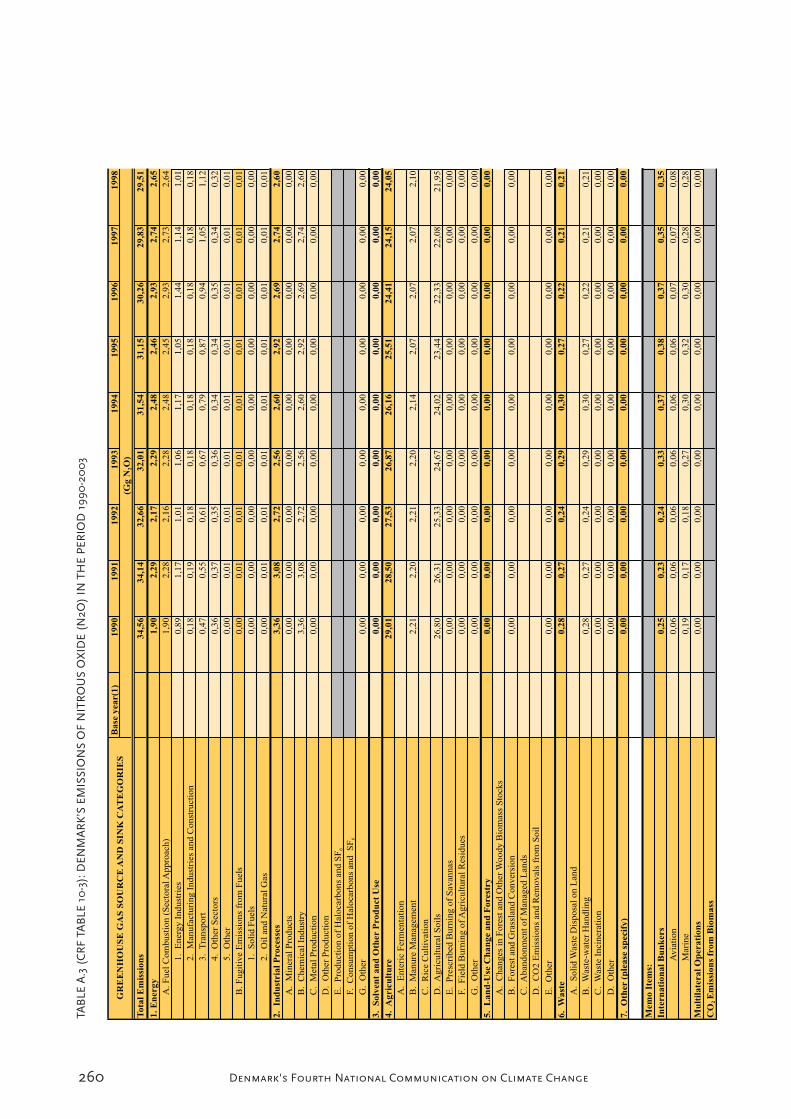
260 Denmark's Fourth National Communication on Climate Change
Ba
se y
ea
r(1
)1
99
01
99
11
99
21
99
31
99
41
99
51
99
61
99
71
99
8
(Gg
N2O
)
To
tal
Em
issi
on
s3
4,5
63
4,1
43
2,6
63
2,0
13
1,5
43
1,1
53
0,2
62
9,8
32
9,5
1
1.
En
erg
y
1,9
02
,29
2,1
72
,29
2,4
82
,46
2,9
32
,74
2,6
5
A.
Fu
el
Co
mb
ust
ion
(S
ecto
ral A
pp
roach
)1
,90
2,2
82
,16
2,2
82
,48
2,4
52
,93
2,7
32
,64
1.
En
erg
y I
nd
ust
ries
0,8
91
,17
1,0
11
,06
1,1
71
,05
1,4
41
,14
1,0
1
2.
Man
ufa
ctu
rin
g I
nd
ust
ries
an
d C
on
stru
cti
on
0
,18
0,1
90
,18
0,1
80
,18
0,1
80
,18
0,1
80
,18
3.
Tra
nsp
ort
0,4
70
,55
0,6
10
,67
0,7
90
,87
0,9
41
,05
1,1
2
4.
Oth
er
Secto
rs0
,36
0,3
70
,35
0,3
60
,34
0,3
40
,35
0,3
40
,32
5.
Oth
er
0,0
00
,01
0,0
10
,01
0,0
10
,01
0,0
10
,01
0,0
1
B.
Fu
git
ive E
mis
sio
ns
fro
m F
uels
0,0
00
,01
0,0
10
,01
0,0
10
,01
0,0
10
,01
0,0
1
1.
So
lid
Fu
els
0,0
00
,00
0,0
00
,00
0,0
00
,00
0,0
00
,00
0,0
0
2.
Oil
an
d N
atu
ral
Gas
0,0
00
,01
0,0
10
,01
0,0
10
,01
0,0
10
,01
0,0
1
2.
In
du
stria
l P
rocess
es
3,3
63
,08
2,7
22
,56
2,6
02
,92
2,6
92
,74
2,6
0
A.
Min
era
l P
rod
ucts
0,0
00
,00
0,0
00
,00
0,0
00
,00
0,0
00
,00
0,0
0
B.
Ch
em
ical
Ind
ust
ry
3,3
63
,08
2,7
22
,56
2,6
02
,92
2,6
92
,74
2,6
0
C.
Meta
l P
rod
ucti
on
0,0
00
,00
0,0
00
,00
0,0
00
,00
0,0
00
,00
0,0
0
D.
Oth
er
Pro
du
cti
on
E.
Pro
du
cti
on
of
Halo
carb
on
s an
d S
F6
F.
Co
nsu
mp
tio
n o
f H
alo
carb
on
s an
d
SF
6
G.
Oth
er
0,0
00
,00
0,0
00
,00
0,0
00
,00
0,0
00
,00
0,0
0
3.
So
lven
t a
nd
Oth
er
Pro
du
ct
Use
0
,00
0,0
00
,00
0,0
00
,00
0,0
00
,00
0,0
00
,00
4.
Ag
ric
ult
ure
29
,01
28
,50
27
,53
26
,87
26
,16
25
,51
24
,41
24
,15
24
,05
A.
En
teri
c F
erm
en
tati
on
B.
Man
ure
Man
ag
em
en
t2
,21
2,2
02
,21
2,2
02
,14
2,0
72
,07
2,0
72
,10
C.
Ric
e C
ult
ivati
on
D.
Ag
ricu
ltu
ral
So
ils
26
,80
26
,31
25
,33
24
,67
24
,02
23
,44
22
,33
22
,08
21
,95
E.
Pre
scri
bed
Bu
rnin
g o
f S
av
an
nas
0,0
00
,00
0,0
00
,00
0,0
00
,00
0,0
00
,00
0,0
0
F.
Fie
ld B
urn
ing
of
Ag
ricu
ltu
ral
Resi
du
es
0,0
00
,00
0,0
00
,00
0,0
00
,00
0,0
00
,00
0,0
0
G.
Oth
er
0,0
00
,00
0,0
00
,00
0,0
00
,00
0,0
00
,00
0,0
0
5.
La
nd
-Use
Ch
an
ge a
nd
Fo
rest
ry
0,0
00
,00
0,0
00
,00
0,0
00
,00
0,0
00
,00
0,0
0
A.
Ch
an
ges
in F
ore
st a
nd
Oth
er
Wo
od
y B
iom
ass
Sto
ck
s
B.
Fo
rest
an
d G
rass
lan
d C
on
vers
ion
0,0
00
,00
0,0
00
,00
0,0
00
,00
0,0
00
,00
0,0
0
C.
Ab
an
do
nm
en
t o
f M
an
ag
ed
Lan
ds
D.
CO
2 E
mis
sio
ns
an
d R
em
ov
als
fro
m S
oil
E.
Oth
er
0,0
00
,00
0,0
00
,00
0,0
00
,00
0,0
00
,00
0,0
0
6.
Wa
ste
0,2
80
,27
0,2
40
,29
0,3
00
,27
0,2
20
,21
0,2
1
A.
So
lid
Wast
e D
isp
osa
l o
n L
an
d
B.
Wast
e-w
ate
r H
an
dli
ng
0,2
80
,27
0,2
40
,29
0,3
00
,27
0,2
20
,21
0,2
1
C.
Wast
e I
ncin
era
tio
n0
,00
0,0
00
,00
0,0
00
,00
0,0
00
,00
0,0
00
,00
D.
Oth
er
0,0
00
,00
0,0
00
,00
0,0
00
,00
0,0
00
,00
0,0
0
7.
Oth
er
(ple
ase
sp
ecif
y)
0,0
00
,00
0,0
00
,00
0,0
00
,00
0,0
00
,00
0,0
0
Mem
o I
tem
s:
Inte
rn
ati
on
al
Bu
nk
ers
0,2
50
,23
0,2
40
,33
0,3
70
,38
0,3
70
,35
0,3
5
Av
iati
on
0,0
60
,06
0,0
60
,06
0,0
60
,06
0,0
70
,07
0,0
8
Mari
ne
0,1
90
,17
0,1
80
,27
0,3
00
,32
0,3
00
,28
0,2
8
Mu
ltil
ate
ra
l O
pera
tio
ns
0,0
00
,00
0,0
00
,00
0,0
00
,00
0,0
00
,00
0,0
0
CO
2E
mis
sio
ns
fro
m B
iom
ass
GR
EE
NH
OU
SE
GA
S S
OU
RC
E A
ND
SIN
K C
AT
EG
OR
IES
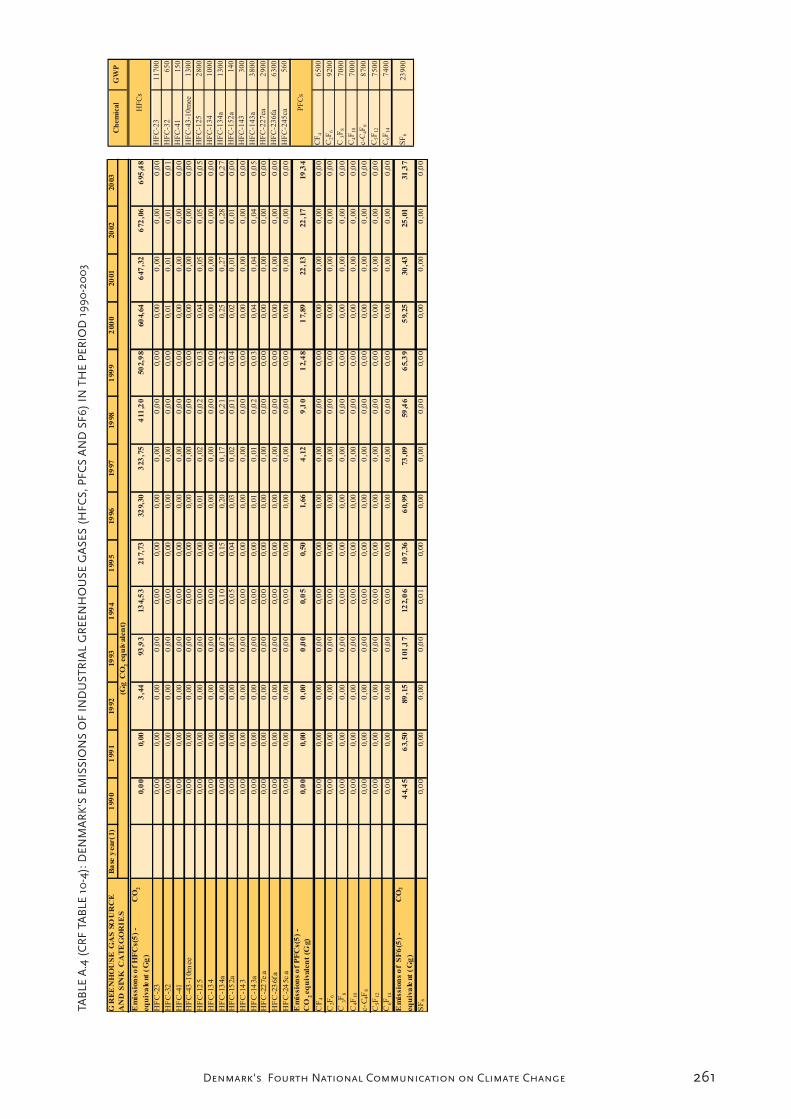
261Denmark's Fourth National Communication on Climate Change
Ba
sey
ear(1)
199
01
99
119
92
19
93
199
41
99
519
96
19
97
19
98
199
92
00
020
01
20
02
20
03
(Gg
CO
2eq
uiv
ale
nt)
Em
issio
ns
of
HF
Cs(5
)-
CO
2
eq
uiv
ale
nt
(G
g)
0,0
00,0
03
,44
93
,93
13
4,5
321
7,7
332
9,3
03
23
,75
411
,20
50
2,9
860
4,6
46
47
,32
672
,06
695
,48
HF
C-2
30,0
00,0
00
,00
0,0
00,0
00,0
00,0
00
,00
0,0
00,0
00,0
00
,00
0,0
00
,00
HF
C-3
20,0
00,0
00
,00
0,0
00,0
00,0
00,0
00
,00
0,0
00,0
00,0
10
,01
0,0
10
,01
HF
C-4
10,0
00,0
00
,00
0,0
00,0
00,0
00,0
00
,00
0,0
00,0
00,0
00
,00
0,0
00
,00
HF
C-4
3-1
0m
ee
0,0
00,0
00
,00
0,0
00,0
00,0
00,0
00
,00
0,0
00,0
00,0
00
,00
0,0
00
,00
HF
C-1
25
0,0
00,0
00
,00
0,0
00,0
00,0
00,0
10
,02
0,0
20,0
30,0
40
,05
0,0
50
,05
HF
C-1
34
0,0
00,0
00
,00
0,0
00,0
00,0
00,0
00
,00
0,0
00,0
00,0
00
,00
0,0
00
,00
HF
C-1
34a
0,0
00,0
00
,00
0,0
70,1
00,1
50,2
00
,17
0,2
10,2
30,2
50
,27
0,2
80
,27
HF
C-1
52a
0,0
00,0
00
,00
0,0
30,0
50,0
40,0
30
,02
0,0
10,0
40,0
20
,01
0,0
10
,00
HF
C-1
43
0,0
00,0
00
,00
0,0
00,0
00,0
00,0
00
,00
0,0
00,0
00,0
00
,00
0,0
00
,00
HF
C-1
43a
0,0
00,0
00
,00
0,0
00,0
00,0
00,0
10
,01
0,0
20,0
30,0
40
,04
0,0
40
,05
HF
C-2
27e
a0,0
00,0
00
,00
0,0
00,0
00,0
00,0
00
,00
0,0
00,0
00,0
00
,00
0,0
00
,00
HF
C-2
36fa
0,0
00,0
00
,00
0,0
00,0
00,0
00,0
00
,00
0,0
00,0
00,0
00
,00
0,0
00
,00
HF
C-2
45c
a0,0
00,0
00
,00
0,0
00,0
00,0
00,0
00
,00
0,0
00,0
00,0
00
,00
0,0
00
,00
Em
issio
ns
of
PF
Cs(5
)-
CO
2eq
uiv
ale
nt
(Gg)
0,0
00,0
00
,00
0,0
00,0
50,5
01,6
64
,12
9,1
01
2,4
81
7,8
922
,13
22
,17
19
,34
CF
40,0
00,0
00
,00
0,0
00,0
00,0
00,0
00
,00
0,0
00,0
00,0
00
,00
0,0
00
,00
C2F
60,0
00,0
00
,00
0,0
00,0
00,0
00,0
00
,00
0,0
00,0
00,0
00
,00
0,0
00
,00
C3F
80,0
00,0
00
,00
0,0
00,0
00,0
00,0
00
,00
0,0
00,0
00,0
00
,00
0,0
00
,00
C4F
10
0,0
00,0
00
,00
0,0
00,0
00,0
00,0
00
,00
0,0
00,0
00,0
00
,00
0,0
00
,00
c-C
4F
80,0
00,0
00
,00
0,0
00,0
00,0
00,0
00
,00
0,0
00,0
00,0
00
,00
0,0
00
,00
C5F
12
0,0
00,0
00
,00
0,0
00,0
00,0
00,0
00
,00
0,0
00,0
00,0
00
,00
0,0
00
,00
C6F
14
0,0
00,0
00
,00
0,0
00,0
00,0
00,0
00
,00
0,0
00,0
00,0
00
,00
0,0
00
,00
Em
issio
ns
of
SF
6(5
)-
CO
2
eq
uiv
ale
nt
(G
g)
44,4
56
3,5
089
,15
101
,17
12
2,0
610
7,3
66
0,9
973
,09
59
,46
65,3
95
9,2
530
,43
25
,01
31
,37
SF
60,0
00,0
00
,00
0,0
00,0
10,0
00,0
00
,00
0,0
00,0
00,0
00
,00
0,0
00
,00
GR
EE
NH
OU
SE
GA
SSO
UR
CE
AN
DS
INK
CA
TE
GO
RIE
S
HF
C-2
31
17
00
HF
C-3
26
50
HF
C-4
11
50
HF
C-4
3-1
0m
ee1
30
0
HF
C-1
25
28
00
HF
C-1
34
10
00
HF
C-1
34
a1
30
0
HF
C-1
52
a1
40
HF
C-1
43
30
0
HF
C-1
43
a3
80
0
HF
C-2
27
ea2
90
0
HF
C-2
36
fa6
30
0
HF
C-2
45
ca5
60
CF
46
50
0
C2F
69
20
0
C3F
87
00
0
C4F
10
70
00
c-C
4F
88
70
0
C5F
12
75
00
C6F
14
74
00
SF
62
39
00
PF
Cs
Ch
emic
al
GW
P
HF
Cs

262 Denmark's Fourth National Communication on Climate Change
Ba
se y
ear(
1)
19
90
19
91
19
92
19
93
19
94
19
95
19
96
19
97
19
98
19
99
20
00
20
01
20
02
20
03
CO
2 e
qu
iva
len
t (G
g)
Net
CO
2em
issi
on
s/re
mo
val
s5
30
45
63
44
65
75
03
59
59
46
33
33
60
37
57
36
13
64
08
15
95
90
56
65
35
48
58
53
45
75
28
12
58
12
4
CO
2 e
mis
sio
ns
(wit
ho
ut
LU
CF
) (6
)5
28
87
63
55
95
77
55
60
06
06
36
63
60
60
97
40
35
64
52
46
04
09
57
52
35
30
76
54
61
55
42
88
59
32
9
CH
45
68
45
78
55
81
95
99
46
00
86
10
86
22
66
09
96
04
25
95
35
94
16
02
95
95
45
87
3
N2O
10
71
31
05
84
10
12
59
92
49
77
89
65
79
37
99
24
89
14
98
84
38
61
58
38
08
03
58
06
0
HF
Cs
00
39
41
35
21
83
29
32
44
11
50
36
05
64
76
72
69
5
PF
Cs
00
00
01
24
91
21
82
22
21
9
SF
64
46
48
91
01
12
21
07
61
73
59
65
59
30
25
31
To
tal
(wit
h n
et C
O2 e
mis
sio
ns/
rem
ov
als
)6
94
87
79
87
97
35
39
75
70
77
93
76
76
46
68
96
10
79
83
07
52
60
72
03
07
00
95
68
56
66
75
21
72
80
4
To
tal
(wit
ho
ut
CO
2 f
rom
LU
CF
) (6
)6
93
28
79
99
27
37
91
76
17
37
97
06
76
70
09
00
33
80
27
37
60
79
72
90
06
83
14
69
72
46
89
96
74
00
8
GR
EE
NH
OU
SE
GA
S S
OU
RC
E A
ND
SIN
K
Ba
se y
ear(
1)
19
90
19
91
19
92
19
93
19
94
19
95
19
96
19
97
19
98
19
99
20
00
20
01
20
02
20
03
CA
TE
GO
RIE
S C
O2 e
qu
iva
len
t (G
g)
1.
En
erg
y
52
39
06
30
65
57
13
05
95
45
63
30
96
04
15
73
99
86
42
67
60
14
85
73
45
52
80
25
44
58
54
12
15
93
18
2.
In
du
stri
al P
roce
sses
21
55
22
58
22
92
23
59
24
33
26
04
26
73
28
62
29
05
30
70
32
59
31
91
30
95
31
29
3.
So
lven
t an
d O
ther
Pro
du
ct U
se3
17
30
52
92
28
02
68
24
22
65
26
21
95
19
22
12
13
01
51
20
6
4.
Ag
ricu
ltu
re
12
84
51
27
20
12
42
91
23
07
12
05
211
84
511
52
611
35
711
36
81
08
06
10
56
51
04
70
10
13
89
89
8
5.
Lan
d-U
se C
han
ge
and
Fo
rest
ry (
7)
15
8-1
13
-25
2-4
66
-33
0-2
34
-42
2-4
43
-81
9-8
70
17
82
-11
58
-14
76
-12
04
6.
Was
te
16
22
16
45
16
48
16
83
16
45
15
93
15
70
15
25
14
63
14
87
14
75
14
75
14
92
14
57
7.
Oth
er0
00
00
00
00
00
00
0
GR
EE
NH
OU
SE
GA
S E
MIS
SIO
NS

263Denmark's Fourth National Communication on Climate Change
19
90
19
91
19
92
19
93
19
94
19
95
19
96
19
97
19
98
19
99
20
00
20
01
CO
2 e
qu
iva
len
t (G
g)
Gre
enla
nd
's C
O2 e
mis
sio
ns
(wit
ho
ut
LU
CF
)6
24
60
95
94
04
94
52
35
64
57
55
50
58
56
59
61
7
Far
oe
Isla
nd
's C
O2 e
mis
sio
ns
(wit
ho
ut
LU
CF
)7
09
68
26
50
53
65
44
54
15
78
55
96
16
64
56
99
79
1
Far
oe
Isla
nd
's C
H4 e
mis
sio
ns
18
19
19
18
19
19
19
20
19
19
20
20
Far
oe
Isla
nd
's N
2O
em
issi
on
s2
32
42
42
32
42
52
52
72
62
73
03
1
Fa
roe
Isla
nd
's T
ota
l E
mis
sio
ns
wit
ho
ut
LU
CF
75
07
25
69
35
77
58
85
85
62
26
05
66
16
91
74
98
43
Th
e K
ing
do
m's
To
tal
Em
issi
on
s a
nd
Rem
ov
als
wit
h L
UC
F7
08
60
81
21
37
48
26
76
28
48
04
57
77
57
49
07
96
81
01
07
64
71
73
30
67
15
04
70
02
6
Th
e K
ing
do
m's
To
tal
Em
issi
on
s a
nd
Rem
ov
als
wit
ho
ut
LU
CF
70
70
28
13
26
75
07
87
67
50
80
78
87
78
08
91
21
98
14
53
77
29
07
41
76
69
72
27
118
4
Tre
nd
sin
ce 1
99
0 (
19
90
=in
dex
10
0),
wit
h L
UC
F1
00
115
10
61
08
114
10
91
28
114
10
81
03
10
19
9
Tre
nd
sin
ce 1
99
0 (
19
90
=in
dex
10
0),
wit
ho
ut
LU
CF
10
011
51
06
10
911
411
01
29
115
10
91
05
99
10
1
GR
EE
NH
OU
SE
GA
S S
OU
RC
E A
ND
SIN
K C
AT
EG
OR
IES

264 Denmark's Fourth National Communication on Climate Change
This Annex consist of the following two sub-annexes:
Annex B1: Data sheets for mea-sures that affect greenhouse gas emissions and removals
Taxes and dutiesThe data sheets for taxes and duties that affect
greenhouse gas emissions include:
1. Mineral-oil Tax Act
2. Gas Tax Act
3. Coal Tax Act
4. Electricity Tax Act
5. CO2 Tax Act
6. Green owner tax
7. Registration Tax (reduced on energy-
efficient cars)
EnergyThe data sheets for existing measures that
still exist and measures that have ceased to
exist or have been replaced in the energy
sector and that affect greenhouse gas emis-
sions include:
Existing:
1) EU CO2 allowances on electricity and
heat production (including the business
and domestic sectors)
2) The Biomass Agreement
3) Price supplement for suppliers of envi-
ronmentally friendly electricity
4) Tenders for offshore wind turbines
5) Scrapping scheme for old wind tur-
bines
6) Energy research
Initiatives that are no longer in place or
have been replaced:
7) National CO2 allowance scheme for
producers of electricity
8a) Subsidies for the production of electric-
ity (RE)
8b) Subsidies for the production of electric-
ity (wind turbines)
Annex B Measures and the effect of efforts 1990-2001
9) Giving priority to electricity from com-
bined heat and power plants
10) Compulsory offshore wind turbines
11) Scrapping scheme for old wind tur-
bines and wind turbines in an inappro-
priate location
12) Renewable energy island - Samsø
13) Subsidies for facilities producing re-
newable energy
14) Subsidies for investments in energy
savings in industry
15) Subsidies for conversion of older dwell-
ings to combined heating and power
16) Subsidies for the promotion of linking
to coal-fired CPH
17) Subsidies for energy savings in dwell-
ings for pensioners
TransportThe data sheets for measures in the trans-
port sector that affect greenhouse gas emis-
sions include:
x) Increased fuel tax
y) Green owner taxes on motor vehicles
1) Information campaign on the fuel con-
sumption of new cars
2) Low-energy driving techniques
3) Action for compliance with current
speed limits
4) Establishment of intermodal installa-
tions
5) Promotion of environment-friendly
freight transport
6) Reduced travelling time for public
transport
7) Spatial planning
The business sectorThe data sheets for measures in the business
sector that affect greenhouse gas emissions
include:
z) EU CO2 allowances (a proportion of
the energy consumption and process
emissions of the business sector are
265Denmark's Fourth National Communication on Climate Change
included in the EU allowance regulation,
cf. the datasheet concerning this under
Energy)
1) Agreements on energy-efficiency im-
provements in the business sector
2) Savings activities by electricity grid, gas
and district heating companies (incl. for
the domestic and public sectors)
3) Tax on HFCs, PFCs and SF6
4) Regulation of use of HFCs, PFCs and
SF6
5) The enterprise scheme (HFCs)
6) Circular on energy-efficiency in state in-
stitutions
7) Electricity Saving Trust (Elsparefonden)
- campaigns and A-club to promote ef-
ficient appliances (incl. electricity-heat
conversion and efficient appliances in
households).
Agriculture and ForestryThe data sheets for measures in the agricul-
ture and forestry sector that affect greenhouse
gas emissions include:
1) Action Plan for the Aquatic Environ-
ment I+II and Action Plan for Sustain-
able Agriculture
2) Action Plan for the Aquatic Environ-
ment III
3) Ban on the burning of straw on fields
4) Ammonia Action Plan and new Statu-
tory Order on Manure
a) Optimisation of manure handling
during housing for cattle, pigs, poultry
and fur animals.
b) Rules on covering storage facilities
for solid manure and slurry tanks.
c) Ban on surface spreading of manure.
d) Reduction of the time from field ap-
plication of manure to incorporation.
e) Ban on ammonia treatment of straw.
5) Planting of windbreaks
6) Biogas plants
7) Subsidies for private afforestation on ag-
ricultural land
8) Public afforestation (state, counties, and
municipalities).
The domestic sectorThe data sheets for measures that affect the
domestic sector’s contribution to greenhouse
gas emissions include:
z) EU CO2 allowances (some of the do-
mestic energy consumption - electricity
and heating - are subject to EU allow-
ance regulation, cf. the data sheet for
this under Energy
1) Energy labelling of small and large build-
ings (incl. the public sector and busi-
nesses)
2) Energy labelling of electrical appliances.
WasteThe data sheets for measures that affect
greenhouse gas emissions from waste include:
1) Obligation to send combustible waste to
incineration (in practice a ban on land-
filling)
2) The Waste tax
3) Weight- and volume-based packaging
taxes
4) Subsidy programme - Enterprise Scheme
(special scheme for businesses)
5) Increased recycling of waste plastic
packaging
6) Implementation of the EU landfill direc-
tive
7) Support for (construction of facilities
for) gas recovery at landfill sites
8) Subsidy programme for cleaner products
Annex B2: Executive summary of the efforts analysis and section sum-ming up the effects of the measures analysed.
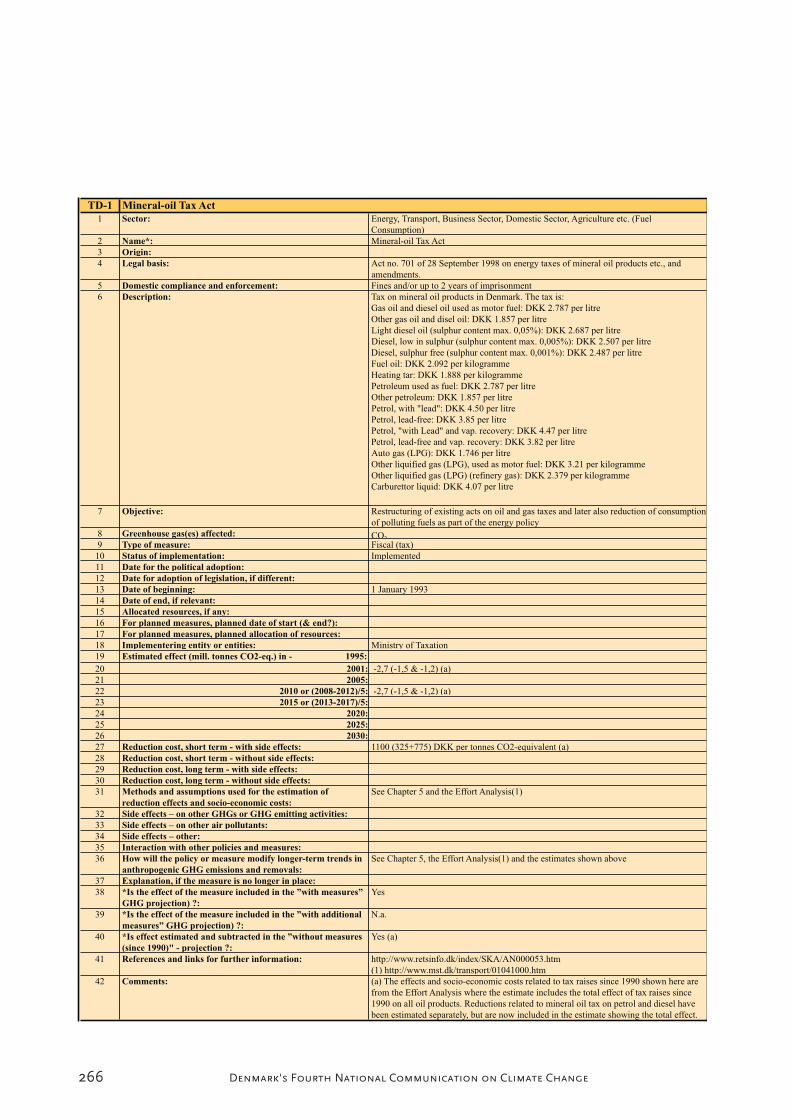
266 Denmark's Fourth National Communication on Climate Change
TD-1 Mineral-oil Tax Act
1 Sector: Energy, Transport, Business Sector, Domestic Sector, Agriculture etc. (Fuel
Consumption)
2 Name*: Mineral-oil Tax Act
3 Origin:
4 Legal basis: Act no. 701 of 28 September 1998 on energy taxes of mineral oil products etc., and
amendments.
5 Domestic compliance and enforcement: Fines and/or up to 2 years of imprisonment
6 Description: Tax on mineral oil products in Denmark. The tax is:
Gas oil and diesel oil used as motor fuel: DKK 2.787 per litre
Other gas oil and disel oil: DKK 1.857 per litre
Light diesel oil (sulphur content max. 0,05%): DKK 2.687 per litre
Diesel, low in sulphur (sulphur content max. 0,005%): DKK 2.507 per litre
Diesel, sulphur free (sulphur content max. 0,001%): DKK 2.487 per litre
Fuel oil: DKK 2.092 per kilogramme
Heating tar: DKK 1.888 per kilogramme
Petroleum used as fuel: DKK 2.787 per litre
Other petroleum: DKK 1.857 per litre
Petrol, with "lead": DKK 4.50 per litre
Petrol, lead-free: DKK 3.85 per litre
Petrol, "with Lead" and vap. recovery: DKK 4.47 per litre
Petrol, lead-free and vap. recovery: DKK 3.82 per litre
Auto gas (LPG): DKK 1.746 per litre
Other liquified gas (LPG), used as motor fuel: DKK 3.21 per kilogramme
Other liquified gas (LPG) (refinery gas): DKK 2.379 per kilogramme
Carburettor liquid: DKK 4.07 per litre
7 Objective: Restructuring of existing acts on oil and gas taxes and later also reduction of consumption
of polluting fuels as part of the energy policy
8 Greenhouse gas(es) affected: CO2
9 Type of measure: Fiscal (tax)
10 Status of implementation: Implemented
11 Date for the political adoption:
12 Date for adoption of legislation, if different:
13 Date of beginning: 1 January 1993
14 Date of end, if relevant:
15 Allocated resources, if any:
16 For planned measures, planned date of start (& end?):
17 For planned measures, planned allocation of resources:
18 Implementering entity or entities: Ministry of Taxation
19 Estimated effect (mill. tonnes CO2-eq.) in - 1995:
20 2001: -2,7 (-1,5 & -1,2) (a)
21 2005:
22 2010 or (2008-2012)/5: -2,7 (-1,5 & -1,2) (a)
23 2015 or (2013-2017)/5:
24 2020:
25 2025:
26 2030:
27 Reduction cost, short term - with side effects: 1100 (325+775) DKK per tonnes CO2-equivalent (a)
28 Reduction cost, short term - without side effects:
29 Reduction cost, long term - with side effects:
30 Reduction cost, long term - without side effects:
31 Methods and assumptions used for the estimation of
reduction effects and socio-economic costs:
See Chapter 5 and the Effort Analysis(1)
32 Side effects – on other GHGs or GHG emitting activities:
33 Side effects – on other air pollutants:
34 Side effects – other:
35 Interaction with other policies and measures:
36 How will the policy or measure modify longer-term trends in
anthropogenic GHG emissions and removals:
See Chapter 5, the Effort Analysis(1) and the estimates shown above
37 Explanation, if the measure is no longer in place:
38 *Is the effect of the measure included in the ”with measures”
GHG projection) ?:
Yes
39 *Is the effect of the measure included in the ”with additional
measures” GHG projection) ?:
N.a.
40 *Is effect estimated and subtracted in the ”without measures
(since 1990)" - projection ?:
Yes (a)
41 References and links for further information: http://www.retsinfo.dk/index/SKA/AN000053.htm
(1) http://www.mst.dk/transport/01041000.htm
42 Comments: (a) The effects and socio-economic costs related to tax raises since 1990 shown here are
from the Effort Analysis where the estimate includes the total effect of tax raises since
1990 on all oil products. Reductions related to mineral oil tax on petrol and diesel have
been estimated separately, but are now included in the estimate showing the total effect.
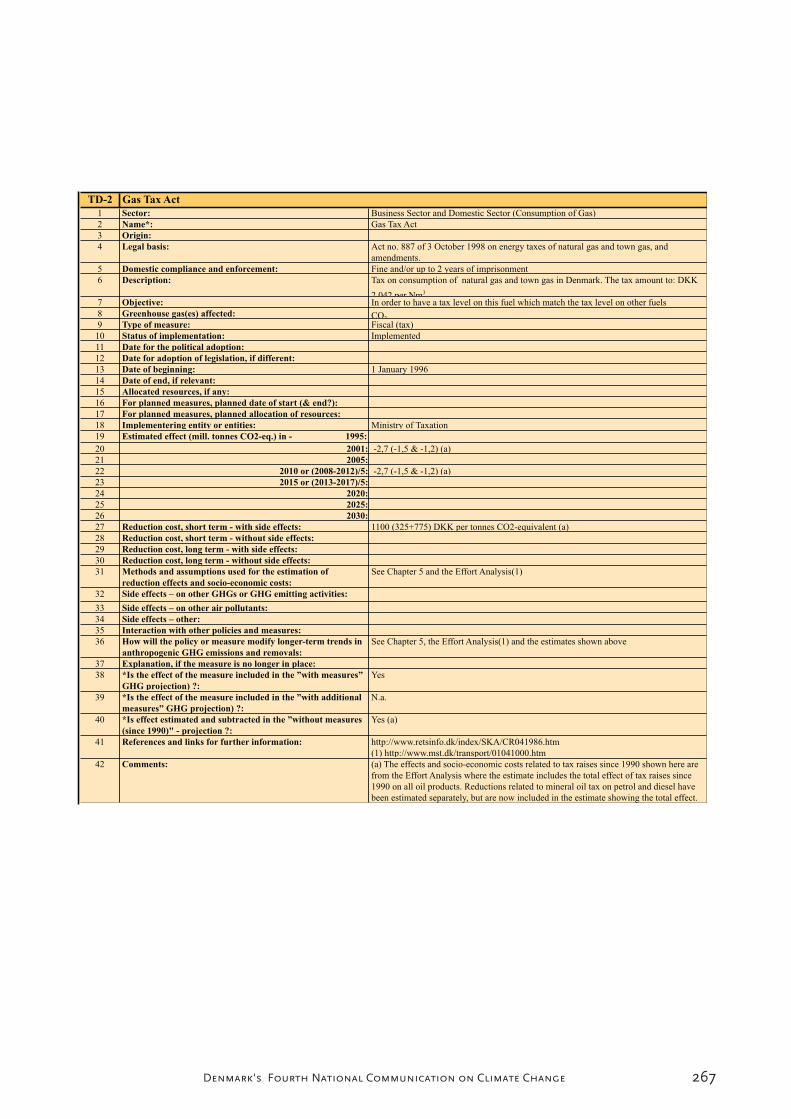
267Denmark's Fourth National Communication on Climate Change
TD-2 Gas Tax Act
1 Sector: Business Sector and Domestic Sector (Consumption of Gas)
2 Name*: Gas Tax Act
3 Origin:
4 Legal basis: Act no. 887 of 3 October 1998 on energy taxes of natural gas and town gas, and
amendments.
5 Domestic compliance and enforcement: Fine and/or up to 2 years of imprisonment
6 Description: Tax on consumption of natural gas and town gas in Denmark. The tax amount to: DKK
2 042 per Nm3
7 Objective: In order to have a tax level on this fuel which match the tax level on other fuels
8 Greenhouse gas(es) affected: CO2
9 Type of measure: Fiscal (tax)
10 Status of implementation: Implemented
11 Date for the political adoption:
12 Date for adoption of legislation, if different:
13 Date of beginning: 1 January 1996
14 Date of end, if relevant:
15 Allocated resources, if any:
16 For planned measures, planned date of start (& end?):
17 For planned measures, planned allocation of resources:
18 Implementering entity or entities: Ministry of Taxation
19 Estimated effect (mill. tonnes CO2-eq.) in - 1995:
20 2001: -2,7 (-1,5 & -1,2) (a)
21 2005:
22 2010 or (2008-2012)/5: -2,7 (-1,5 & -1,2) (a)
23 2015 or (2013-2017)/5:
24 2020:
25 2025:
26 2030:
27 Reduction cost, short term - with side effects: 1100 (325+775) DKK per tonnes CO2-equivalent (a)
28 Reduction cost, short term - without side effects:
29 Reduction cost, long term - with side effects:
30 Reduction cost, long term - without side effects:
31 Methods and assumptions used for the estimation of
reduction effects and socio-economic costs:
See Chapter 5 and the Effort Analysis(1)
32 Side effects – on other GHGs or GHG emitting activities:
33 Side effects – on other air pollutants:
34 Side effects – other:
35 Interaction with other policies and measures:
36 How will the policy or measure modify longer-term trends in
anthropogenic GHG emissions and removals:
See Chapter 5, the Effort Analysis(1) and the estimates shown above
37 Explanation, if the measure is no longer in place:
38 *Is the effect of the measure included in the ”with measures”
GHG projection) ?:
Yes
39 *Is the effect of the measure included in the ”with additional
measures” GHG projection) ?:
N.a.
40 *Is effect estimated and subtracted in the ”without measures
(since 1990)" - projection ?:
Yes (a)
41 References and links for further information: http://www.retsinfo.dk/index/SKA/CR041986.htm
(1) http://www.mst.dk/transport/01041000.htm
42 Comments: (a) The effects and socio-economic costs related to tax raises since 1990 shown here are
from the Effort Analysis where the estimate includes the total effect of tax raises since
1990 on all oil products. Reductions related to mineral oil tax on petrol and diesel have
been estimated separately, but are now included in the estimate showing the total effect.

268 Denmark's Fourth National Communication on Climate Change
TD-3 Coal Tax Act
1 Sector: Energy and Business Sector (Consumption of coal)
2 Name*: Coal Tax Act
3 Origin:
4 Legal basis: Act no. 702 of 28 September 1998 on energy taxes of coal, lignite and coke etc., and
amendments.
5 Domestic compliance and enforcement: Fine and/or up to 2 years of imprisonment
6 Description: Tax rated after the calorific value of coal, coke, furnace coke, coke gravel, crude coke,
lignite briquettes and lignite, tall oil, wood tar, vegetable pitch etc. The tax amount to
DKK 51,9 per GJ
7 Objective: At its introduction the objective was both fiscal and reductions in energy use. Later, CO2
reduction also became an objective.
8 Greenhouse gas(es) affected: CO2
9 Type of measure: Fiscal (tax)
10 Status of implementation: Implemented
11 Date for the political adoption:
12 Date for adoption of legislation, if different:
13 Date of beginning: 1 July 1982
14 Date of end, if relevant:
15 Allocated resources, if any:
16 For planned measures, planned date of start (& end?):
17 For planned measures, planned allocation of resources:
18 Implementering entity or entities: Ministry of Taxation
19 Estimated effect (mill. tonnes CO2-eq.) in - 1995:
20 2001: -2,7 (-1,5 & -1,2) (a)
21 2005:
22 2010 or (2008-2012)/5: -2,7 (-1,5 & -1,2) (a)
23 2015 or (2013-2017)/5:
24 2020:
25 2025:
26 2030:
27 Reduction cost, short term - with side effects: 1100 (325+775) DKK per tonnes CO2-equivalent (a)
28 Reduction cost, short term - without side effects:
29 Reduction cost, long term - with side effects:
30 Reduction cost, long term - without side effects:
31 Methods and assumptions used for the estimation of
reduction effects and socio-economic costs:
See Chapter 5 and the Effort Analysis(1)
32 Side effects – on other GHGs or GHG emitting activities:
33 Side effects – on other air pollutants:
34 Side effects – other:
35 Interaction with other policies and measures:
36 How will the policy or measure modify longer-term trends in
anthropogenic GHG emissions and removals:
See Chapter 5, the Effort Analysis(1) and the estimates shown above
37 Explanation, if the measure is no longer in place:
38 *Is the effect of the measure included in the ”with measures”
GHG projection) ?:
Yes
39 *Is the effect of the measure included in the ”with additional
measures” GHG projection) ?:
N.a.
40 *Is effect estimated and subtracted in the ”without measures
(since 1990)" - projection ?:
Yes (a)
41 References and links for further information: http://www.retsinfo.dk/index/SKA/AN000050.htm
(1) http://www.mst.dk/transport/01041000.htm
42 Comments: (a) The effects and socio-economic costs related to tax raises since 1990 shown here are
from the Effort Analysis where the estimate includes the total effect of tax raises since
1990 on all oil products. Reductions related to mineral oil tax on petrol and diesel have
been estimated separately, but are now included in the estimate showing the total effect.

269Denmark's Fourth National Communication on Climate Change
TD-4 Electricity Tax
1 Sector: Business Sector and Domestic Sector (Consumption of electricity)
2 Name*: Electricity Tax
3 Origin:
4 Legal basis: Act no. 689 of 17 September 1998 on electricity tax, and amendments.
5 Domestic compliance and enforcement: Fine and/or up to 2 years of imprisonment
6 Description: Tax on consumption of elektricity. The tax amount to DKK 0.511 per kWh for electricity
consumption over 4000 kWh in buildings heated by electric panels. Tax the on all other
consumption of electricity amount to DKK 0,576 øre per kWh.
7 Objective: At its introduction in 1977, the objective was both fiscal and reductions in energy use.
Since the beginning of the 1990s, amentments also have had CO2 reduction as an
objective.
8 Greenhouse gas(es) affected: CO2
9 Type of measure: Fiscal (tax)
10 Status of implementation: Implemented
11 Date for the political adoption:
12 Date for adoption of legislation, if different:
13 Date of beginning: 1 April 1977
14 Date of end, if relevant:
15 Allocated resources, if any:
16 For planned measures, planned date of start (& end?):
17 For planned measures, planned allocation of resources:
18 Implementering entity or entities: Ministry of Taxation
19 Estimated effect (mill. tonnes CO2-eq.) in - 1995:
20 2001: -2,7 (-1,5 & -1,2) (a)
21 2005:
22 2010 or (2008-2012)/5: -2,7 (-1,5 & -1,2) (a)
23 2015 or (2013-2017)/5:
24 2020:
25 2025:
26 2030:
27 Reduction cost, short term - with side effects: 1100 (325+775) DKK per tonnes CO2-equivalent (a)
28 Reduction cost, short term - without side effects:
29 Reduction cost, long term - with side effects:
30 Reduction cost, long term - without side effects:
31 Methods and assumptions used for the estimation of
reduction effects and socio-economic costs:
See Chapter 5 and the Effort Analysis(1)
32 Side effects – on other GHGs or GHG emitting activities:
33 Side effects – on other air pollutants:
34 Side effects – other:
35 Interaction with other policies and measures:
36 How will the policy or measure modify longer-term trends in
anthropogenic GHG emissions and removals:
See Chapter 5, the Effort Analysis(1) and the estimates shown above
37 Explanation, if the measure is no longer in place:
38 *Is the effect of the measure included in the ”with measures”
GHG projection) ?:
Yes
39 *Is the effect of the measure included in the ”with additional
measures” GHG projection) ?:
N.a.
40 *Is effect estimated and subtracted in the ”without measures
(since 1990)" - projection ?:
Yes (a)
41 References and links for further information: http://www.retsinfo.dk/index/SKA/AN000057.htm
(1) http://www.mst.dk/transport/01041000.htm
42 Comments: (a) The effects and socio-economic costs related to tax raises since 1990 shown here are
from the Effort Analysis where the estimate includes the total effect of tax raises since
1990 on all oil products. Reductions related to mineral oil tax on petrol and diesel have
been estimated separately, but are now included in the estimate showing the total effect.

270 Denmark's Fourth National Communication on Climate Change
TD-5 Carbondioxide tax on energy products
1 Sector: Business Sector and Domestic Sector (CO2 emissions from energy consumption)2 Name*: Carbondioxide tax on energy products
3 Origin:
4 Legal basis: Act no. 643 of 27 August 1998 on carbondioxide taxes of certain energy products, and
amendments.
5 Domestic compliance and enforcement: Fine and/or up to 2 years of imprisonment
6 Description: Tax on energy products depending on their contribution to CO2 emissions based an
average tax of DKK 90 per tonnes of CO2. The taxes are:
Gas oil and diesel oil: DKK 0.243 per litre
Fuel oil: DKK 0.288 per kilogramme
Heating tar: DKK 0.252 per kilogramme
Petroleum: DKK 0.243 per litre
Coal, coke, furnace coke, coke gravel: DKK 217.8 per tonnes
Crude coke: DKK 290.7 per tonnes
Lignite briquettes and lignite: DKK 160.2 per tonnes
Electricity: DKK 0.09 per kWh
Auto gas (LPG): DKK 0.144 per kilogramme
Other liquified gas: DKK 0.27 per kilogramme
Gas (refinery gas): DKK 0.261 per kilogramme
Natural gas and Town gas: DKK 0.198 per Nm3
7 Objective: Reductions in energy use and related CO2 emissions
8 Greenhouse gas(es) affected: CO2
9 Type of measure: Fiscal (tax)
10 Status of implementation: Implemented
11 Date for the political adoption:
12 Date for adoption of legislation, if different:
13 Date of beginning: 1 March 1992
14 Date of end, if relevant:
15 Allocated resources, if any:
16 For planned measures, planned date of start (& end?):
17 For planned measures, planned allocation of resources:
18 Implementering entity or entities: Ministry of Taxation
19 Estimated effect (mill. tonnes CO2-eq.) in - 1995:
20 2001: -2,7 (-1,5 & -1,2) (a)
21 2005:
22 2010 or (2008-2012)/5: -2,7 (-1,5 & -1,2) (a)
23 2015 or (2013-2017)/5:
24 2020:
25 2025:
26 2030:
27 Reduction cost, short term - with side effects: 1100 (325+775) DKK per tonnes CO2-equivalent (a)
28 Reduction cost, short term - without side effects:
29 Reduction cost, long term - with side effects:
30 Reduction cost, long term - without side effects:
31 Methods and assumptions used for the estimation of
reduction effects and socio-economic costs:
See Chapter 5 and the Effort Analysis(1)
32 Side effects – on other GHGs or GHG emitting activities:
33 Side effects – on other air pollutants:
34 Side effects – other:
35 Interaction with other policies and measures:
36 How will the policy or measure modify longer-term trends in
anthropogenic GHG emissions and removals:
See Chapter 5, the Effort Analysis(1) and the estimates shown above
37 Explanation, if the measure is no longer in place:
38 *Is the effect of the measure included in the ”with measures”
GHG projection) ?:
Yes
39 *Is the effect of the measure included in the ”with additional
measures” GHG projection) ?:
N.a.
40 *Is effect estimated and subtracted in the ”without measures
(since 1990)" - projection ?:
Yes (a)
41 References and links for further information: http://www.retsinfo.dk/index/SKA/AN000065.htm
(1) http://www.mst.dk/transport/01041000.htm
42 Comments: (a) The effects and socio-economic costs related to tax raises since 1990 shown here are
from the Effort Analysis where the estimate includes the total effect of tax raises since
1990 on all oil products. Reductions related to mineral oil tax on petrol and diesel have
been estimated separately, but are now included in the estimate showing the total effect.

271Denmark's Fourth National Communication on Climate Change
TD-6 Green Owner Tax
1 Sector: Transport (Energy consumption)
2 Name*: Green Owner Tax
3 Origin: Related to Council Directive 80/1268/EC
4 Legal basis: Act no. 864 of 22 October 2002 on taxes on passenger cars depending on fuel efficiency,
and amendments.
5 Domestic compliance and enforcement: Fines
6 Description: Car owners have to pay annual taxes which are differentiated in accordance with the fuel
efficiency of the cars expressed in kilometers per litre.
7 Objective: To strengthen the incentive to choose more fuel efficient /energy efficient cars in order to
increase the contribution to achieve the environmental objectives concerning limitation
and reduction of the environmental impacts from the transport sector's pollution.
8 Greenhouse gas(es) affected: CO2
9 Type of measure: Fiscal (tax)
10 Status of implementation: Implemented
11 Date for the political adoption: 2 June 1997
12 Date for adoption of legislation, if different:
13 Date of beginning: 1 July 1997
14 Date of end, if relevant:
15 Allocated resources, if any:
16 For planned measures, planned date of start (& end?):
17 For planned measures, planned allocation of resources:
18 Implementering entity or entities: Ministry of Taxation
19 Estimated effect (mill. tonnes CO2-eq.) in - 1995:
20 2001: -0,2 (a)
21 2005:
22 2010 or (2008-2012)/5: -0,6 (a)
23 2015 or (2013-2017)/5:
24 2020:
25 2025:
26 2030:
27 Reduction cost, short term - with side effects:
28 Reduction cost, short term - without side effects:
29 Reduction cost, long term - with side effects:
30 Reduction cost, long term - without side effects:
31 Methods and assumptions used for the estimation of
reduction effects and socio-economic costs:
See Chapter 5 and the Effort Analysis(1)
32 Side effects – on other GHGs or GHG emitting activities:
33 Side effects – on other air pollutants: NMVOCs, NOx, CO, sulphur, benzene, particles34 Side effects – other:
35 Interaction with other policies and measures:
36 How will the policy or measure modify longer-term trends in
anthropogenic GHG emissions and removals:
See Chapter 5, the Effort Analysis(1) and the estimates shown above
37 Explanation, if the measure is no longer in place:
38 *Is the effect of the measure included in the ”with measures”
GHG projection) ?:
Yes
39 *Is the effect of the measure included in the ”with additional
measures” GHG projection) ?:
N.a.
40 *Is effect estimated and subtracted in the ”without measures
(since 1990)" - projection ?:
Yes (a)
41 References and links for further information: http://www.retsinfo.dk/index/SKA/AN003124.htm
(1) http://www.mst.dk/transport/01041000.htm
42 Comments: (a) The effects related to improvement of energy efficiency of cars, both on individual
cars and in total, and shown here are from the Effort Analysis where the estimate includes
the total effect of EU measures (voluntary agreements with the automobile industry) and
national measures (the green owner tax, information campaigns, energy labelling etc.)
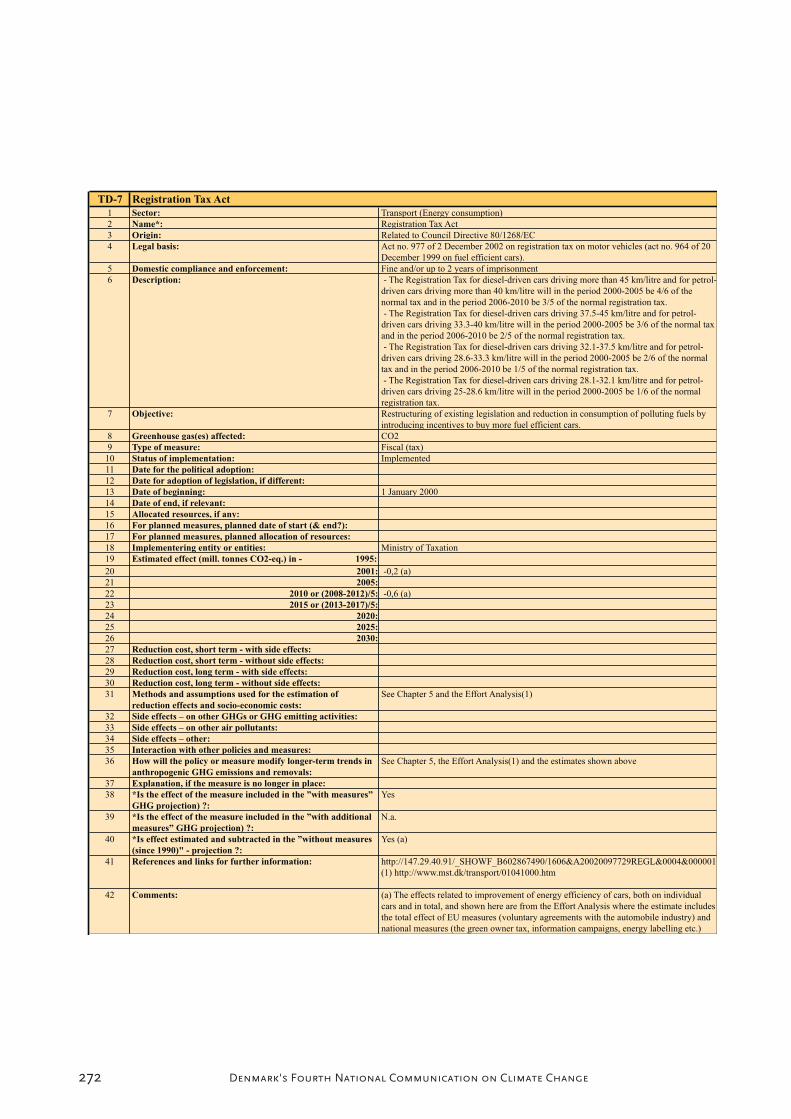
272 Denmark's Fourth National Communication on Climate Change
TD-7 Registration Tax Act
1 Sector: Transport (Energy consumption)
2 Name*: Registration Tax Act
3 Origin: Related to Council Directive 80/1268/EC
4 Legal basis: Act no. 977 of 2 December 2002 on registration tax on motor vehicles (act no. 964 of 20
December 1999 on fuel efficient cars).
5 Domestic compliance and enforcement: Fine and/or up to 2 years of imprisonment
6 Description: - The Registration Tax for diesel-driven cars driving more than 45 km/litre and for petrol-
driven cars driving more than 40 km/litre will in the period 2000-2005 be 4/6 of the
normal tax and in the period 2006-2010 be 3/5 of the normal registration tax.
- The Registration Tax for diesel-driven cars driving 37.5-45 km/litre and for petrol-
driven cars driving 33.3-40 km/litre will in the period 2000-2005 be 3/6 of the normal tax
and in the period 2006-2010 be 2/5 of the normal registration tax.
- The Registration Tax for diesel-driven cars driving 32.1-37.5 km/litre and for petrol-
driven cars driving 28.6-33.3 km/litre will in the period 2000-2005 be 2/6 of the normal
tax and in the period 2006-2010 be 1/5 of the normal registration tax.
- The Registration Tax for diesel-driven cars driving 28.1-32.1 km/litre and for petrol-
driven cars driving 25-28.6 km/litre will in the period 2000-2005 be 1/6 of the normal
registration tax.
7 Objective: Restructuring of existing legislation and reduction in consumption of polluting fuels by
introducing incentives to buy more fuel efficient cars.
8 Greenhouse gas(es) affected: CO2
9 Type of measure: Fiscal (tax)
10 Status of implementation: Implemented
11 Date for the political adoption:
12 Date for adoption of legislation, if different:
13 Date of beginning: 1 January 2000
14 Date of end, if relevant:
15 Allocated resources, if any:
16 For planned measures, planned date of start (& end?):
17 For planned measures, planned allocation of resources:
18 Implementering entity or entities: Ministry of Taxation
19 Estimated effect (mill. tonnes CO2-eq.) in - 1995:
20 2001: -0,2 (a)
21 2005:
22 2010 or (2008-2012)/5: -0,6 (a)
23 2015 or (2013-2017)/5:
24 2020:
25 2025:
26 2030:
27 Reduction cost, short term - with side effects:
28 Reduction cost, short term - without side effects:
29 Reduction cost, long term - with side effects:
30 Reduction cost, long term - without side effects:
31 Methods and assumptions used for the estimation of
reduction effects and socio-economic costs:
See Chapter 5 and the Effort Analysis(1)
32 Side effects – on other GHGs or GHG emitting activities:
33 Side effects – on other air pollutants:
34 Side effects – other:
35 Interaction with other policies and measures:
36 How will the policy or measure modify longer-term trends in
anthropogenic GHG emissions and removals:
See Chapter 5, the Effort Analysis(1) and the estimates shown above
37 Explanation, if the measure is no longer in place:
38 *Is the effect of the measure included in the ”with measures”
GHG projection) ?:
Yes
39 *Is the effect of the measure included in the ”with additional
measures” GHG projection) ?:
N.a.
40 *Is effect estimated and subtracted in the ”without measures
(since 1990)" - projection ?:
Yes (a)
41 References and links for further information: http://147.29.40.91/_SHOWF_B602867490/1606&A20020097729REGL&0004&000001
(1) http://www.mst.dk/transport/01041000.htm
42 Comments: (a) The effects related to improvement of energy efficiency of cars, both on individual
cars and in total, and shown here are from the Effort Analysis where the estimate includes
the total effect of EU measures (voluntary agreements with the automobile industry) and
national measures (the green owner tax, information campaigns, energy labelling etc.)
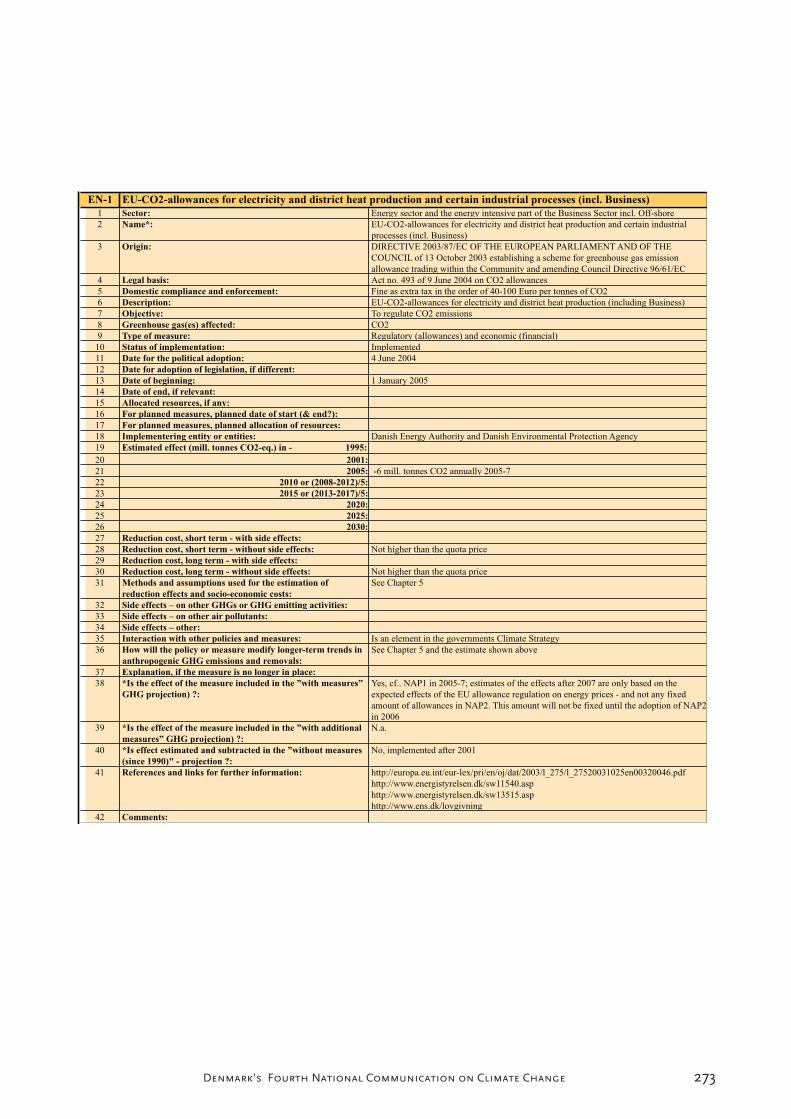
273Denmark's Fourth National Communication on Climate Change
EN-1 EU-CO2-allowances for electricity and district heat production and certain industrial processes (incl. Business)
1 Sector: Energy sector and the energy intensive part of the Business Sector incl. Off-shore
2 Name*: EU-CO2-allowances for electricity and district heat production and certain industrial
processes (incl. Business)
3 Origin: DIRECTIVE 2003/87/EC OF THE EUROPEAN PARLIAMENT AND OF THE
COUNCIL of 13 October 2003 establishing a scheme for greenhouse gas emission
allowance trading within the Community and amending Council Directive 96/61/EC
4 Legal basis: Act no. 493 of 9 June 2004 on CO2 allowances
5 Domestic compliance and enforcement: Fine as extra tax in the order of 40-100 Euro per tonnes of CO2
6 Description: EU-CO2-allowances for electricity and district heat production (including Business)
7 Objective: To regulate CO2 emissions
8 Greenhouse gas(es) affected: CO2
9 Type of measure: Regulatory (allowances) and economic (financial)
10 Status of implementation: Implemented
11 Date for the political adoption: 4 June 2004
12 Date for adoption of legislation, if different:
13 Date of beginning: 1 January 2005
14 Date of end, if relevant:
15 Allocated resources, if any:
16 For planned measures, planned date of start (& end?):
17 For planned measures, planned allocation of resources:
18 Implementering entity or entities: Danish Energy Authority and Danish Environmental Protection Agency
19 Estimated effect (mill. tonnes CO2-eq.) in - 1995:
20 2001:
21 2005: -6 mill. tonnes CO2 annually 2005-7
22 2010 or (2008-2012)/5:
23 2015 or (2013-2017)/5:
24 2020:
25 2025:
26 2030:
27 Reduction cost, short term - with side effects:
28 Reduction cost, short term - without side effects: Not higher than the quota price
29 Reduction cost, long term - with side effects:
30 Reduction cost, long term - without side effects: Not higher than the quota price
31 Methods and assumptions used for the estimation of
reduction effects and socio-economic costs:
See Chapter 5
32 Side effects – on other GHGs or GHG emitting activities:
33 Side effects – on other air pollutants:
34 Side effects – other:
35 Interaction with other policies and measures: Is an element in the governments Climate Strategy
36 How will the policy or measure modify longer-term trends in
anthropogenic GHG emissions and removals:
See Chapter 5 and the estimate shown above
37 Explanation, if the measure is no longer in place:
38 *Is the effect of the measure included in the ”with measures”
GHG projection) ?:
Yes, cf.. NAP1 in 2005-7; estimates of the effects after 2007 are only based on the
expected effects of the EU allowance regulation on energy prices - and not any fixed
amount of allowances in NAP2. This amount will not be fixed until the adoption of NAP2
in 2006
39 *Is the effect of the measure included in the ”with additional
measures” GHG projection) ?:
N.a.
40 *Is effect estimated and subtracted in the ”without measures
(since 1990)" - projection ?:
No, implemented after 2001
41 References and links for further information: http://europa.eu.int/eur-lex/pri/en/oj/dat/2003/l_275/l_27520031025en00320046.pdf
http://www.energistyrelsen.dk/sw11540.asp
http://www.energistyrelsen.dk/sw13515.asp
http://www.ens.dk/lovgivning
42 Comments:
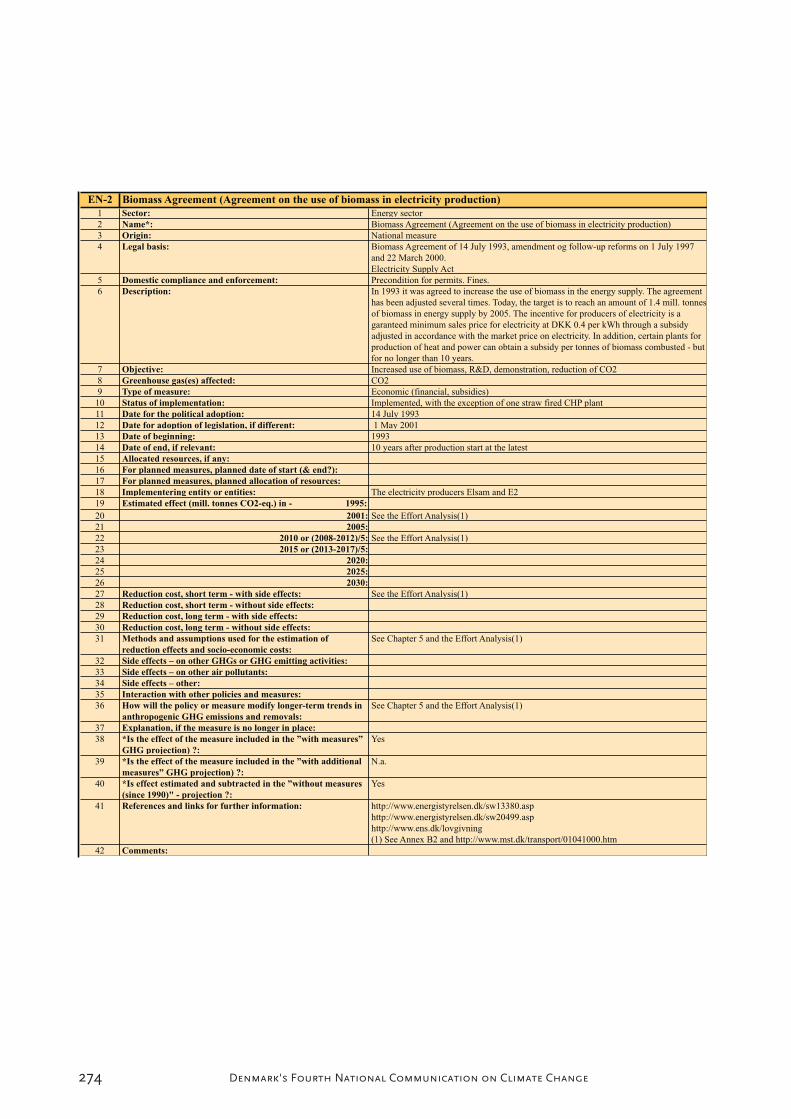
274 Denmark's Fourth National Communication on Climate Change
EN-2 Biomass Agreement (Agreement on the use of biomass in electricity production)
1 Sector: Energy sector
2 Name*: Biomass Agreement (Agreement on the use of biomass in electricity production)
3 Origin: National measure
4 Legal basis: Biomass Agreement of 14 July 1993, amendment og follow-up reforms on 1 July 1997
and 22 March 2000.
Electricity Supply Act
5 Domestic compliance and enforcement: Precondition for permits. Fines.
6 Description: In 1993 it was agreed to increase the use of biomass in the energy supply. The agreement
has been adjusted several times. Today, the target is to reach an amount of 1.4 mill. tonnes
of biomass in energy supply by 2005. The incentive for producers of electricity is a
garanteed minimum sales price for electricity at DKK 0.4 per kWh through a subsidy
adjusted in accordance with the market price on electricity. In addition, certain plants for
production of heat and power can obtain a subsidy per tonnes of biomass combusted - but
for no longer than 10 years.
7 Objective: Increased use of biomass, R&D, demonstration, reduction of CO2
8 Greenhouse gas(es) affected: CO2
9 Type of measure: Economic (financial, subsidies)
10 Status of implementation: Implemented, with the exception of one straw fired CHP plant
11 Date for the political adoption: 14 July 1993
12 Date for adoption of legislation, if different: 1 May 2001
13 Date of beginning: 1993
14 Date of end, if relevant: 10 years after production start at the latest
15 Allocated resources, if any:
16 For planned measures, planned date of start (& end?):
17 For planned measures, planned allocation of resources:
18 Implementering entity or entities: The electricity producers Elsam and E2
19 Estimated effect (mill. tonnes CO2-eq.) in - 1995:
20 2001: See the Effort Analysis(1)
21 2005:
22 2010 or (2008-2012)/5: See the Effort Analysis(1)
23 2015 or (2013-2017)/5:
24 2020:
25 2025:
26 2030:
27 Reduction cost, short term - with side effects: See the Effort Analysis(1)
28 Reduction cost, short term - without side effects:
29 Reduction cost, long term - with side effects:
30 Reduction cost, long term - without side effects:
31 Methods and assumptions used for the estimation of
reduction effects and socio-economic costs:
See Chapter 5 and the Effort Analysis(1)
32 Side effects – on other GHGs or GHG emitting activities:
33 Side effects – on other air pollutants:
34 Side effects – other:
35 Interaction with other policies and measures:
36 How will the policy or measure modify longer-term trends in
anthropogenic GHG emissions and removals:
See Chapter 5 and the Effort Analysis(1)
37 Explanation, if the measure is no longer in place:
38 *Is the effect of the measure included in the ”with measures”
GHG projection) ?:
Yes
39 *Is the effect of the measure included in the ”with additional
measures” GHG projection) ?:
N.a.
40 *Is effect estimated and subtracted in the ”without measures
(since 1990)" - projection ?:
Yes
41 References and links for further information: http://www.energistyrelsen.dk/sw13380.asp
http://www.energistyrelsen.dk/sw20499.asp
http://www.ens.dk/lovgivning
(1) See Annex B2 and http://www.mst.dk/transport/01041000.htm
42 Comments:
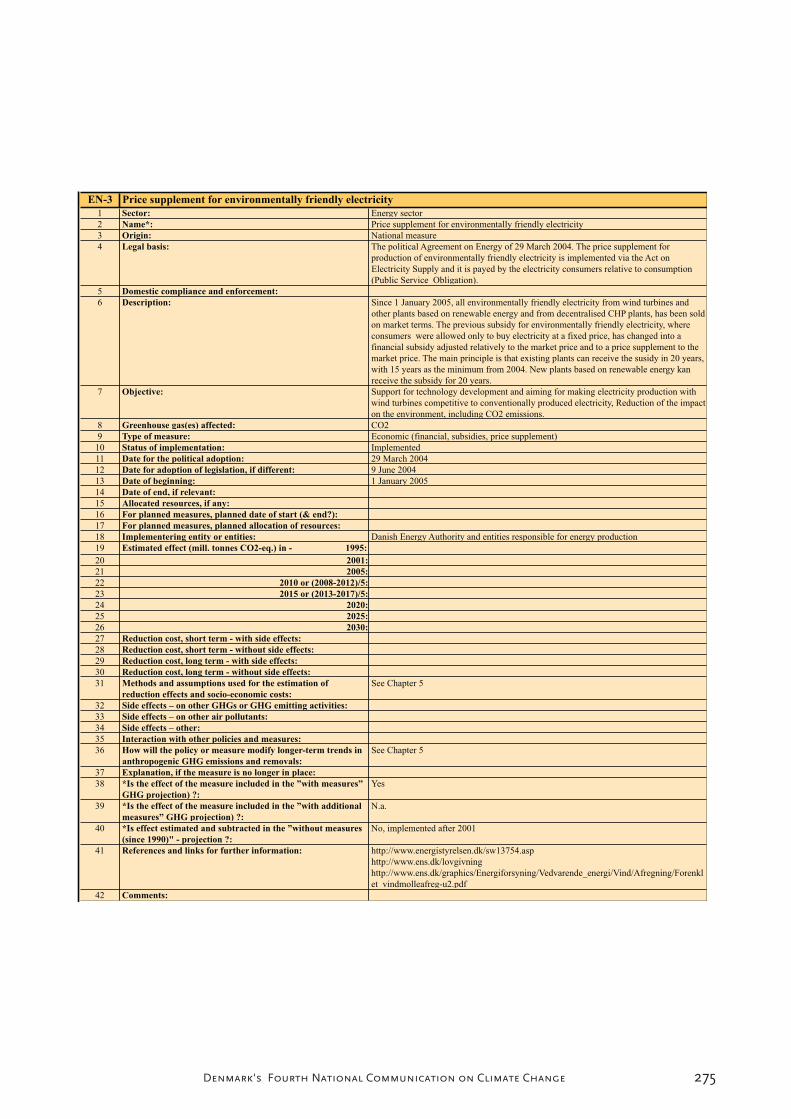
275Denmark's Fourth National Communication on Climate Change
EN-3 Price supplement for environmentally friendly electricity
1 Sector: Energy sector
2 Name*: Price supplement for environmentally friendly electricity
3 Origin: National measure
4 Legal basis: The political Agreement on Energy of 29 March 2004. The price supplement for
production of environmentally friendly electricity is implemented via the Act on
Electricity Supply and it is payed by the electricity consumers relative to consumption
(Public Service Obligation).
5 Domestic compliance and enforcement:
6 Description: Since 1 January 2005, all environmentally friendly electricity from wind turbines and
other plants based on renewable energy and from decentralised CHP plants, has been sold
on market terms. The previous subsidy for environmentally friendly electricity, where
consumers were allowed only to buy electricity at a fixed price, has changed into a
financial subsidy adjusted relatively to the market price and to a price supplement to the
market price. The main principle is that existing plants can receive the susidy in 20 years,
with 15 years as the minimum from 2004. New plants based on renewable energy kan
receive the subsidy for 20 years.
7 Objective: Support for technology development and aiming for making electricity production with
wind turbines competitive to conventionally produced electricity, Reduction of the impact
on the environment, including CO2 emissions.
8 Greenhouse gas(es) affected: CO2
9 Type of measure: Economic (financial, subsidies, price supplement)
10 Status of implementation: Implemented
11 Date for the political adoption: 29 March 2004
12 Date for adoption of legislation, if different: 9 June 2004
13 Date of beginning: 1 January 2005
14 Date of end, if relevant:
15 Allocated resources, if any:
16 For planned measures, planned date of start (& end?):
17 For planned measures, planned allocation of resources:
18 Implementering entity or entities: Danish Energy Authority and entities responsible for energy production
19 Estimated effect (mill. tonnes CO2-eq.) in - 1995:
20 2001:
21 2005:
22 2010 or (2008-2012)/5:
23 2015 or (2013-2017)/5:
24 2020:
25 2025:
26 2030:
27 Reduction cost, short term - with side effects:
28 Reduction cost, short term - without side effects:
29 Reduction cost, long term - with side effects:
30 Reduction cost, long term - without side effects:
31 Methods and assumptions used for the estimation of
reduction effects and socio-economic costs:
See Chapter 5
32 Side effects – on other GHGs or GHG emitting activities:
33 Side effects – on other air pollutants:
34 Side effects – other:
35 Interaction with other policies and measures:
36 How will the policy or measure modify longer-term trends in
anthropogenic GHG emissions and removals:
See Chapter 5
37 Explanation, if the measure is no longer in place:
38 *Is the effect of the measure included in the ”with measures”
GHG projection) ?:
Yes
39 *Is the effect of the measure included in the ”with additional
measures” GHG projection) ?:
N.a.
40 *Is effect estimated and subtracted in the ”without measures
(since 1990)" - projection ?:
No, implemented after 2001
41 References and links for further information: http://www.energistyrelsen.dk/sw13754.asp
http://www.ens.dk/lovgivning
http://www.ens.dk/graphics/Energiforsyning/Vedvarende_energi/Vind/Afregning/Forenkl
et vindmolleafreg-u2.pdf
42 Comments:

276 Denmark's Fourth National Communication on Climate Change
EN-4 Tenders for offshore wind turbines
1 Sector: Energy sector
2 Name*: Tenders for offshore wind turbines
3 Origin: National measure
4 Legal basis: The Act on Electricity Supply
5 Domestic compliance and enforcement:
6 Description: In the agreements of 29 March 2004 it was agreed to establish 2 offshore wind turbine
facilities, each wih a size of 200 MW. One of the facilities should be located at Horns Rev
("Horns Rev II") and the other at Rødsand ("Rødsand II"). Both should be build on the
basis of tenders.
7 Objective: Promote technology development and aiming for making electricity production with wind
turbines competitive to conventionally produced electricity. Reduction of the electricity
production's impact on the environment, including CO2 emissions.
8 Greenhouse gas(es) affected: CO2
9 Type of measure: Regulatory (administrative, tender), Economic (financial, tender)
10 Status of implementation: In 2005, the winner of the tender on Horns Rev II has been found and production is
expected to start in 2009. The deadline for the final bid on Rødsand II is 13 December
2005.
11 Date for the political adoption: 29 March 2004
12 Date for adoption of legislation, if different: Additional legal steps, if necessary, will be take by the end of 2005 or in 2006.
13 Date of beginning:
14 Date of end, if relevant:
15 Allocated resources, if any:
16 For planned measures, planned date of start (& end?):
17 For planned measures, planned allocation of resources: The winners of the tenders will receive price supplement
18 Implementering entity or entities: Danish Energy Authority
19 Estimated effect (mill. tonnes CO2-eq.) in - 1995:
20 2001:
21 2005:
22 2010 or (2008-2012)/5:
23 2015 or (2013-2017)/5:
24 2020:
25 2025:
26 2030:
27 Reduction cost, short term - with side effects:
28 Reduction cost, short term - without side effects:
29 Reduction cost, long term - with side effects:
30 Reduction cost, long term - without side effects:
31 Methods and assumptions used for the estimation of
reduction effects and socio-economic costs:
See Chapter 5
32 Side effects – on other GHGs or GHG emitting activities:
33 Side effects – on other air pollutants:
34 Side effects – other:
35 Interaction with other policies and measures:
36 How will the policy or measure modify longer-term trends in
anthropogenic GHG emissions and removals:
See Chapter 5
37 Explanation, if the measure is no longer in place:
38 *Is the effect of the measure included in the ”with measures”
GHG projection) ?:
Yes
39 *Is the effect of the measure included in the ”with additional
measures” GHG projection) ?:
N.a.
40 *Is effect estimated and subtracted in the ”without measures
(since 1990)" - projection ?:
No, implemented after 2001
41 References and links for further information: http://www.energistyrelsen.dk/sw13778.asp
http://www.energistyrelsen.dk/sw14306.asp
http://www.ens.dk/lovgivning
42 Comments:

277Denmark's Fourth National Communication on Climate Change
EN-5 Scrapping scheme for old wind turbines
1 Sector: Energy sector
2 Name*: Scrapping scheme for old wind turbines
3 Origin: National measure
4 Legal basis: Act no. 495 of 9 June 2004, Statutory order on Wind turbines (Statutory Order no. 1365
of 15 December 2004) and the guidelines on issuance and administration of scapping
certificates etc. from the entities responsible for the energy system.
5 Domestic compliance and enforcement:
6 Description: The scrapping scheme will support taking down old and unfavourable placed wind
turbines and will support expansion of wind power - aiming at 350 MW new capacity
within 5 years. It will only be possible to issue scrapping certificates within a total of 175
MW
7 Objective: Promote technology development and aiming for making electricity production with wind
turbines competitive to conventionally produced electricity. Reduction of the electricity
production's impact on the environment, including CO2 emissions.
8 Greenhouse gas(es) affected: CO2
9 Type of measure: Economic (financial, price supplement)
10 Status of implementation: The legal basis has been implemented. In 2005, the planning of where to relocate old and
locate new wind turbines began.
11 Date for the political adoption: 29 March 2004
12 Date for adoption of legislation, if different: 9 June 2004
13 Date of beginning: The price supplement is given to new (ab factory) wind turbines connected to the grid in
the period from 1 January 2005 to 31 December 2009.
14 Date of end, if relevant: For the price supplement: 31 December 2009
15 Allocated resources, if any: The price supplement is DKK 0.12 per kWh and is given to production of electricity from
a wind turbine, but no more than what is equal to 12,000 full load hours for twice the
installed effect of the scrapped wind turbine. If the sum of the electricity market price, the
ordinary price supplement, and the scrapping price supplement exceed DKK 0.48 per
kWh, the scrapping price supplement will be reduced accordingly.
16 For planned measures, planned date of start (& end?): Wind turbines to be scrappede under this scheme shall be taken down in the period 15
December 2004 - 15 December 2009. The replacing wind turbines shall be connected to
the grid in the period from 1 January 2005 to 31 December 2009.
17 For planned measures, planned allocation of resources:
18 Implementering entity or entities: Danish Energy Authority
19 Estimated effect (mill. tonnes CO2-eq.) in - 1995:
20 2001:
21 2005:
22 2010 or (2008-2012)/5:
23 2015 or (2013-2017)/5:
24 2020:
25 2025:
26 2030:
27 Reduction cost, short term - with side effects:
28 Reduction cost, short term - without side effects:
29 Reduction cost, long term - with side effects:
30 Reduction cost, long term - without side effects:
31 Methods and assumptions used for the estimation of
reduction effects and socio-economic costs:
See Chapter 5
32 Side effects – on other GHGs or GHG emitting activities:
33 Side effects – on other air pollutants:
34 Side effects – other:
35 Interaction with other policies and measures:
36 How will the policy or measure modify longer-term trends in
anthropogenic GHG emissions and removals:
See Chapter 5
37 Explanation, if the measure is no longer in place:
38 *Is the effect of the measure included in the ”with measures”
GHG projection) ?:
Yes
39 *Is the effect of the measure included in the ”with additional
measures” GHG projection) ?:
N.a.
40 *Is effect estimated and subtracted in the ”without measures
(since 1990)" - projection ?:
No, implemented after 2001
41 References and links for further information: http://www.energistyrelsen.dk/sw14138.asp
http://www.energistyrelsen.dk/sw15568.asp
http://www.ens.dk/lovgivning
42 Comments:

278 Denmark's Fourth National Communication on Climate Change
EN-6 Energy research
1 Sector: Energy sector
2 Name*: Energy research
3 Origin: National measure
4 Legal basis: Act no. 1024 of 23 December 1998 on financial support for research and technology
development within the energy area
5 Domestic compliance and enforcement:
6 Description: The Energy Research Programme (EFP), under the responsability of the Danish Energy
Authority, support energy research, development and pilot projects
7 Objective: The main objective of the EFP is to support the governments energy policy target, which
is a cost effective, environmentally friendly and stable energy supply, and to support the
competitiveness of Danish compagnies in the energy area
8 Greenhouse gas(es) affected: CO2
9 Type of measure: Research
10 Status of implementation: Implemented
11 Date for the political adoption:
12 Date for adoption of legislation, if different:
13 Date of beginning: 1976-77
14 Date of end, if relevant:
15 Allocated resources, if any: Financial support for energy research, development and pilot projects can be obtained
from different programmes with different sub-objectives (the budgets for 2005 are shown
in the parentesis):
- The Energy Research Programme (DKK 72 mil.),
- The PSO-scheme on environmentally friendly electricity production technologies (DKK
130 mill.),
- The PSO-scheme for efficient use of electricity (DKK 25 mill.) and
- The Strategical Research Council's budget for energy and environment (65 mill.).
16 For planned measures, planned date of start (& end?):
17 For planned measures, planned allocation of resources:
18 Implementering entity or entities: Danish Energy Authority
19 Estimated effect (mill. tonnes CO2-eq.) in - 1995:
20 2001:
21 2005:
22 2010 or (2008-2012)/5:
23 2015 or (2013-2017)/5:
24 2020:
25 2025:
26 2030:
27 Reduction cost, short term - with side effects:
28 Reduction cost, short term - without side effects:
29 Reduction cost, long term - with side effects:
30 Reduction cost, long term - without side effects:
31 Methods and assumptions used for the estimation of
reduction effects and socio-economic costs:
See Chapter 5
32 Side effects – on other GHGs or GHG emitting activities:
33 Side effects – on other air pollutants:
34 Side effects – other:
35 Interaction with other policies and measures:
36 How will the policy or measure modify longer-term trends in
anthropogenic GHG emissions and removals:
See Chapter 5
37 Explanation, if the measure is no longer in place:
38 *Is the effect of the measure included in the ”with measures”
GHG projection) ?:
No, not direct, but indirect through the support of the technology development assumed in
the energy projections - on which the GHG emission projection is based
39 *Is the effect of the measure included in the ”with additional
measures” GHG projection) ?:
N.a.
40 *Is effect estimated and subtracted in the ”without measures
(since 1990)" - projection ?:
No
41 References and links for further information: http://www.energistyrelsen.dk/sw11580.asp
http://www.energistyrelsen.dk/sw12337.asp
http://www.ens.dk/lovgivning
42 Comments:

279Denmark's Fourth National Communication on Climate Change
EN-7 National CO2 allowance scheme for electricity producers
1 Sector: Energy sector, measures no longer in place or replaced
2 Name*: National CO2 allowance scheme for electricity producers3 Origin: National measure
4 Legal basis: Act no. 376 of 2 June 1999.
5 Domestic compliance and enforcement: Extra tax (on emissions exceeding the allocated amount of allowances), fines
6 Description: The national CO2 allowance scheme imposed CO2 emission ceilings on production of
electricity, if CO2 emissions were above 100,000 tonnes of CO2. If the ceiling was
exceeded the producer of electricity had to pay an extra tax. Allowances could be traded
among producers of electricity under the scheme.
7 Objective: CO2-reduction, forerunner for the EU allowance regulation8 Greenhouse gas(es) affected: CO2
9 Type of measure: Economic (financial)
10 Status of implementation: Implemented and in place in the period 2001-2004
11 Date for the political adoption: 3 March 1999
12 Date for adoption of legislation, if different: 2 June 1999
13 Date of beginning: 1 January 2001
14 Date of end, if relevant: 31. december 2004
15 Allocated resources, if any: None
16 For planned measures, planned date of start (& end?):
17 For planned measures, planned allocation of resources:
18 Implementering entity or entities: State authorities (Danish Energy Authority), energy producers.
EU CO2 allowance scheme also covers energy-intensive enterprises
19 Estimated effect (mill. tonnes CO2-eq.) in - 1995:
20 2001: -3 mill. tonnes CO2 in total in the period from 2000 to 200421 2005:
22 2010 or (2008-2012)/5:
23 2015 or (2013-2017)/5:
24 2020:
25 2025:
26 2030:
27 Reduction cost, short term - with side effects:
28 Reduction cost, short term - without side effects: Not higher than the quota price
29 Reduction cost, long term - with side effects:
30 Reduction cost, long term - without side effects:
31 Methods and assumptions used for the estimation of
reduction effects and socio-economic costs:
See Chapter 5
32 Side effects – on other GHGs or GHG emitting activities:
33 Side effects – on other air pollutants:
34 Side effects – other:
35 Interaction with other policies and measures:
36 How will the policy or measure modify longer-term trends in
anthropogenic GHG emissions and removals:
See Chapter 5 and the estimate shown above
37 Explanation, if the measure is no longer in place: Replaced by the EU CO2 allowance scheme (EU ETS) from 1 January 2005
38 *Is the effect of the measure included in the ”with measures”
GHG projection) ?:
Yes, for the first year of the projection (2004)
39 *Is the effect of the measure included in the ”with additional
measures” GHG projection) ?:
N.a.
40 *Is effect estimated and subtracted in the ”without measures
(since 1990)" - projection ?:
No
41 References and links for further information: http://www.energistyrelsen.dk/sw19297.asp
http://www.energistyrelsen.dk/sw17278.asp
http://www.ens.dk/lovgivning
42 Comments:
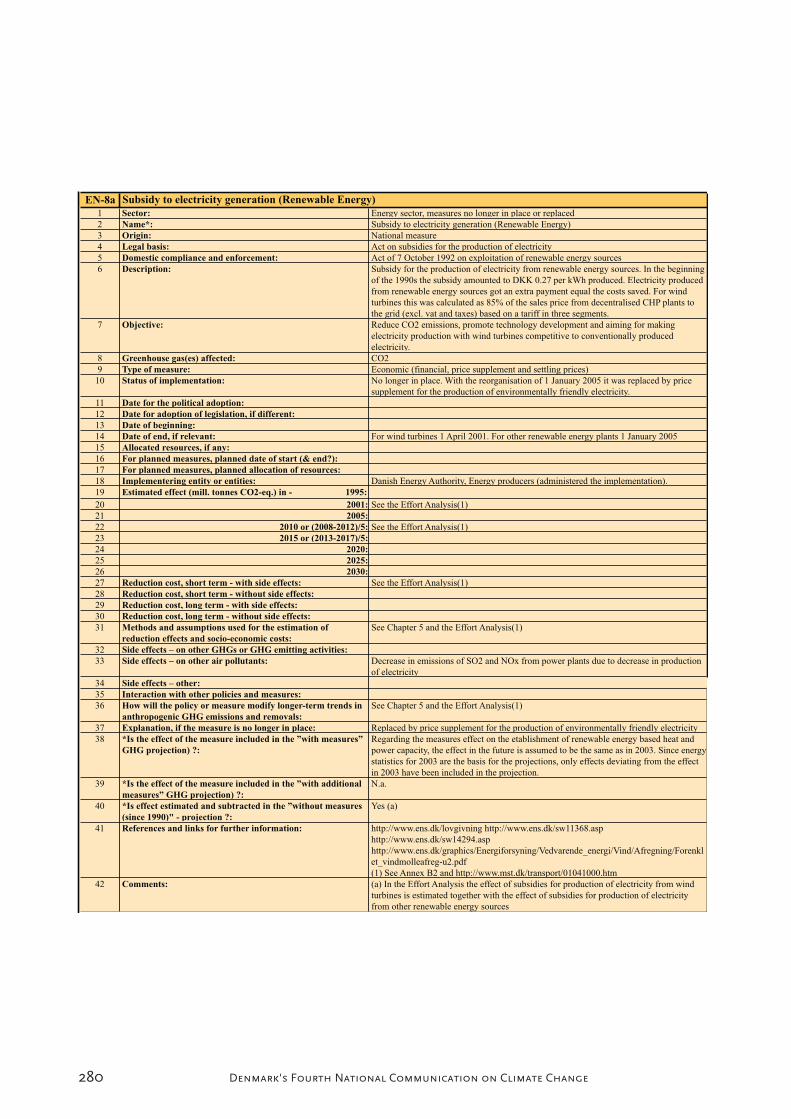
280 Denmark's Fourth National Communication on Climate Change
EN-8a Subsidy to electricity generation (Renewable Energy)
1 Sector: Energy sector, measures no longer in place or replaced
2 Name*: Subsidy to electricity generation (Renewable Energy)
3 Origin: National measure
4 Legal basis: Act on subsidies for the production of electricity
5 Domestic compliance and enforcement: Act of 7 October 1992 on exploitation of renewable energy sources
6 Description: Subsidy for the production of electricity from renewable energy sources. In the beginning
of the 1990s the subsidy amounted to DKK 0.27 per kWh produced. Electricity produced
from renewable energy sources got an extra payment equal the costs saved. For wind
turbines this was calculated as 85% of the sales price from decentralised CHP plants to
the grid (excl. vat and taxes) based on a tariff in three segments.
7 Objective: Reduce CO2 emissions, promote technology development and aiming for making
electricity production with wind turbines competitive to conventionally produced
electricity.
8 Greenhouse gas(es) affected: CO2
9 Type of measure: Economic (financial, price supplement and settling prices)
10 Status of implementation: No longer in place. With the reorganisation of 1 January 2005 it was replaced by price
supplement for the production of environmentally friendly electricity.
11 Date for the political adoption:
12 Date for adoption of legislation, if different:
13 Date of beginning:
14 Date of end, if relevant: For wind turbines 1 April 2001. For other renewable energy plants 1 January 2005
15 Allocated resources, if any:
16 For planned measures, planned date of start (& end?):
17 For planned measures, planned allocation of resources:
18 Implementering entity or entities: Danish Energy Authority, Energy producers (administered the implementation).
19 Estimated effect (mill. tonnes CO2-eq.) in - 1995:
20 2001: See the Effort Analysis(1)
21 2005:
22 2010 or (2008-2012)/5: See the Effort Analysis(1)
23 2015 or (2013-2017)/5:
24 2020:
25 2025:
26 2030:
27 Reduction cost, short term - with side effects: See the Effort Analysis(1)
28 Reduction cost, short term - without side effects:
29 Reduction cost, long term - with side effects:
30 Reduction cost, long term - without side effects:
31 Methods and assumptions used for the estimation of
reduction effects and socio-economic costs:
See Chapter 5 and the Effort Analysis(1)
32 Side effects – on other GHGs or GHG emitting activities:
33 Side effects – on other air pollutants: Decrease in emissions of SO2 and NOx from power plants due to decrease in production
of electricity
34 Side effects – other:
35 Interaction with other policies and measures:
36 How will the policy or measure modify longer-term trends in
anthropogenic GHG emissions and removals:
See Chapter 5 and the Effort Analysis(1)
37 Explanation, if the measure is no longer in place: Replaced by price supplement for the production of environmentally friendly electricity
38 *Is the effect of the measure included in the ”with measures”
GHG projection) ?:
Regarding the measures effect on the etablishment of renewable energy based heat and
power capacity, the effect in the future is assumed to be the same as in 2003. Since energy
statistics for 2003 are the basis for the projections, only effects deviating from the effect
in 2003 have been included in the projection.
39 *Is the effect of the measure included in the ”with additional
measures” GHG projection) ?:
N.a.
40 *Is effect estimated and subtracted in the ”without measures
(since 1990)" - projection ?:
Yes (a)
41 References and links for further information: http://www.ens.dk/lovgivning http://www.ens.dk/sw11368.asp
http://www.ens.dk/sw14294.asp
http://www.ens.dk/graphics/Energiforsyning/Vedvarende_energi/Vind/Afregning/Forenkl
et_vindmolleafreg-u2.pdf
(1) See Annex B2 and http://www.mst.dk/transport/01041000.htm
42 Comments: (a) In the Effort Analysis the effect of subsidies for production of electricity from wind
turbines is estimated together with the effect of subsidies for production of electricity
from other renewable energy sources
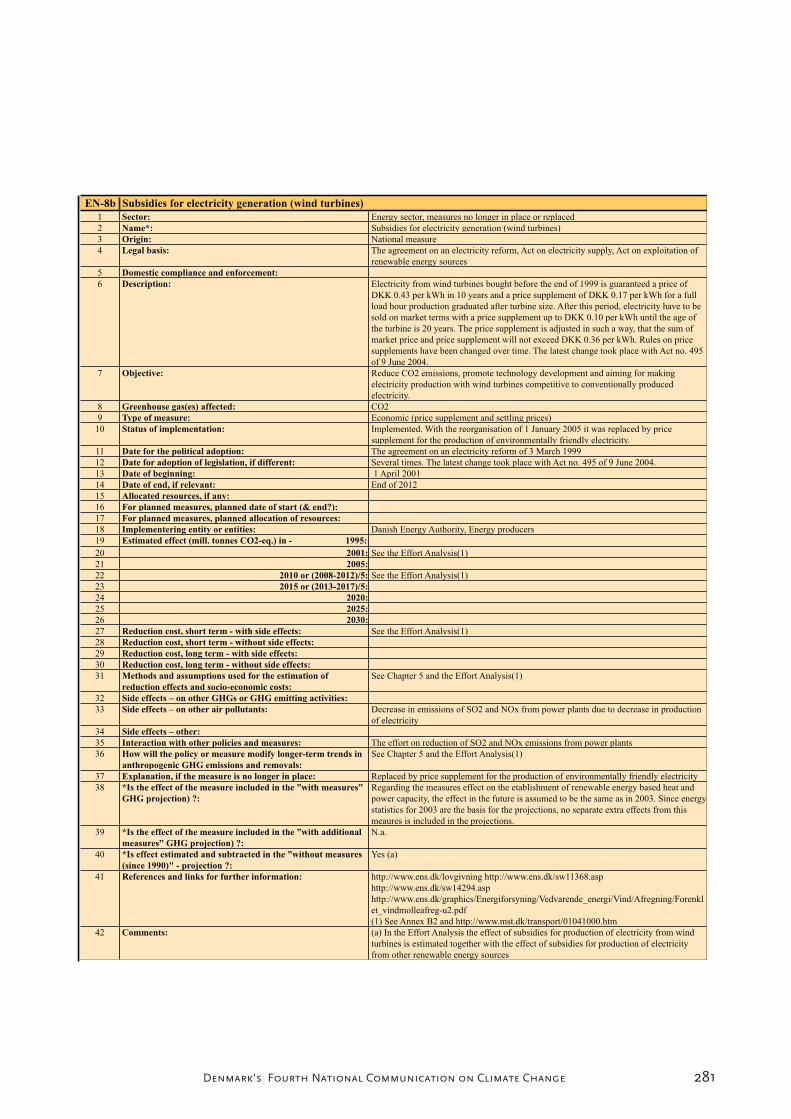
281Denmark's Fourth National Communication on Climate Change
EN-8b Subsidies for electricity generation (wind turbines)
1 Sector: Energy sector, measures no longer in place or replaced
2 Name*: Subsidies for electricity generation (wind turbines)
3 Origin: National measure
4 Legal basis: The agreement on an electricity reform, Act on electricity supply, Act on exploitation of
renewable energy sources
5 Domestic compliance and enforcement:
6 Description: Electricity from wind turbines bought before the end of 1999 is guaranteed a price of
DKK 0.43 per kWh in 10 years and a price supplement of DKK 0.17 per kWh for a full
load hour production graduated after turbine size. After this period, electricity have to be
sold on market terms with a price supplement up to DKK 0.10 per kWh until the age of
the turbine is 20 years. The price supplement is adjusted in such a way, that the sum of
market price and price supplement will not exceed DKK 0.36 per kWh. Rules on price
supplements have been changed over time. The latest change took place with Act no. 495
of 9 June 2004.
7 Objective: Reduce CO2 emissions, promote technology development and aiming for making
electricity production with wind turbines competitive to conventionally produced
electricity.
8 Greenhouse gas(es) affected: CO2
9 Type of measure: Economic (price supplement and settling prices)
10 Status of implementation: Implemented. With the reorganisation of 1 January 2005 it was replaced by price
supplement for the production of environmentally friendly electricity.
11 Date for the political adoption: The agreement on an electricity reform of 3 March 1999
12 Date for adoption of legislation, if different: Several times. The latest change took place with Act no. 495 of 9 June 2004.
13 Date of beginning: 1 April 2001
14 Date of end, if relevant: End of 2012
15 Allocated resources, if any:
16 For planned measures, planned date of start (& end?):
17 For planned measures, planned allocation of resources:
18 Implementering entity or entities: Danish Energy Authority, Energy producers
19 Estimated effect (mill. tonnes CO2-eq.) in - 1995:
20 2001: See the Effort Analysis(1)
21 2005:
22 2010 or (2008-2012)/5: See the Effort Analysis(1)
23 2015 or (2013-2017)/5:
24 2020:
25 2025:
26 2030:
27 Reduction cost, short term - with side effects: See the Effort Analysis(1)
28 Reduction cost, short term - without side effects:
29 Reduction cost, long term - with side effects:
30 Reduction cost, long term - without side effects:
31 Methods and assumptions used for the estimation of
reduction effects and socio-economic costs:
See Chapter 5 and the Effort Analysis(1)
32 Side effects – on other GHGs or GHG emitting activities:
33 Side effects – on other air pollutants: Decrease in emissions of SO2 and NOx from power plants due to decrease in production
of electricity
34 Side effects – other:
35 Interaction with other policies and measures: The effort on reduction of SO2 and NOx emissions from power plants
36 How will the policy or measure modify longer-term trends in
anthropogenic GHG emissions and removals:
See Chapter 5 and the Effort Analysis(1)
37 Explanation, if the measure is no longer in place: Replaced by price supplement for the production of environmentally friendly electricity
38 *Is the effect of the measure included in the ”with measures”
GHG projection) ?:
Regarding the measures effect on the etablishment of renewable energy based heat and
power capacity, the effect in the future is assumed to be the same as in 2003. Since energy
statistics for 2003 are the basis for the projections, no separate extra effects from this
meaures is included in the projections.
39 *Is the effect of the measure included in the ”with additional
measures” GHG projection) ?:
N.a.
40 *Is effect estimated and subtracted in the ”without measures
(since 1990)" - projection ?:
Yes (a)
41 References and links for further information: http://www.ens.dk/lovgivning http://www.ens.dk/sw11368.asp
http://www.ens.dk/sw14294.asp
http://www.ens.dk/graphics/Energiforsyning/Vedvarende_energi/Vind/Afregning/Forenkl
et_vindmolleafreg-u2.pdf
(1) See Annex B2 and http://www.mst.dk/transport/01041000.htm
42 Comments: (a) In the Effort Analysis the effect of subsidies for production of electricity from wind
turbines is estimated together with the effect of subsidies for production of electricity
from other renewable energy sources
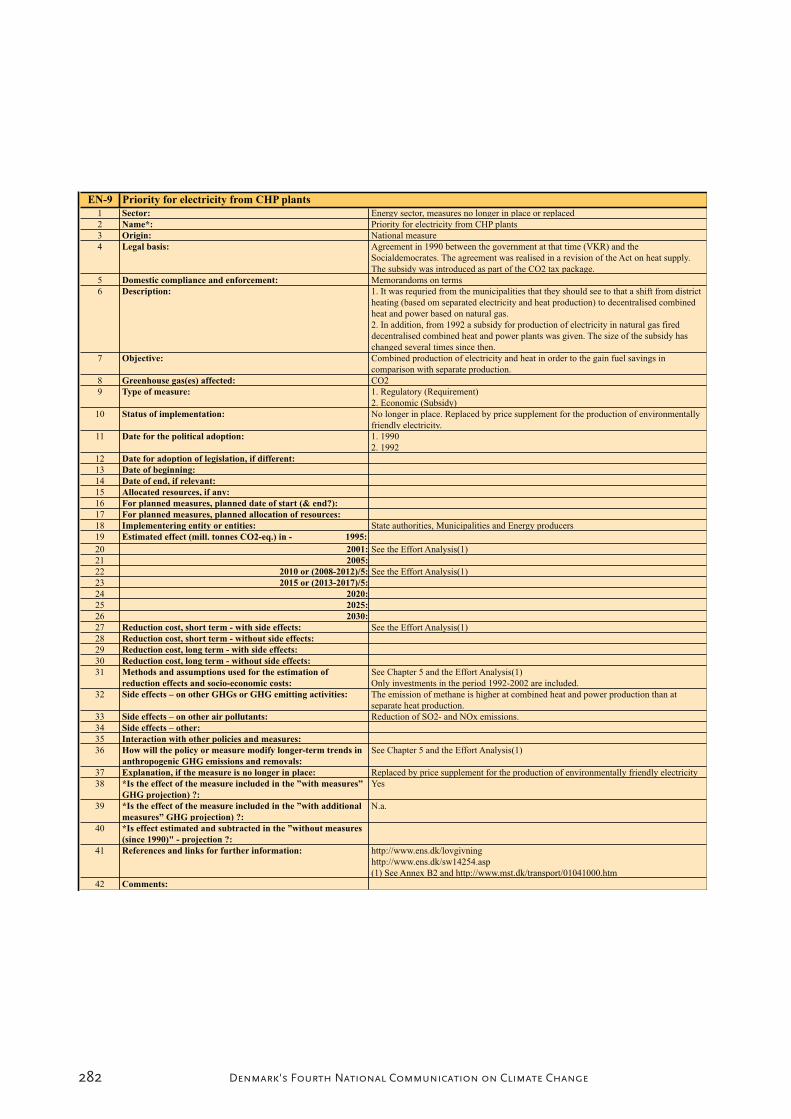
282 Denmark's Fourth National Communication on Climate Change
EN-9 Priority for electricity from CHP plants
1 Sector: Energy sector, measures no longer in place or replaced
2 Name*: Priority for electricity from CHP plants
3 Origin: National measure
4 Legal basis: Agreement in 1990 between the government at that time (VKR) and the
Socialdemocrates. The agreement was realised in a revision of the Act on heat supply.
The subsidy was introduced as part of the CO2 tax package.
5 Domestic compliance and enforcement: Memorandoms on terms
6 Description: 1. It was requried from the municipalities that they should see to that a shift from district
heating (based om separated electricity and heat production) to decentralised combined
heat and power based on natural gas.
2. In addition, from 1992 a subsidy for production of electricity in natural gas fired
decentralised combined heat and power plants was given. The size of the subsidy has
changed several times since then.
7 Objective: Combined production of electricity and heat in order to the gain fuel savings in
comparison with separate production.
8 Greenhouse gas(es) affected: CO2
9 Type of measure: 1. Regulatory (Requirement)
2. Economic (Subsidy)
10 Status of implementation: No longer in place. Replaced by price supplement for the production of environmentally
friendly electricity.
11 Date for the political adoption: 1. 1990
2. 1992
12 Date for adoption of legislation, if different:
13 Date of beginning:
14 Date of end, if relevant:
15 Allocated resources, if any:
16 For planned measures, planned date of start (& end?):
17 For planned measures, planned allocation of resources:
18 Implementering entity or entities: State authorities, Municipalities and Energy producers
19 Estimated effect (mill. tonnes CO2-eq.) in - 1995:
20 2001: See the Effort Analysis(1)
21 2005:
22 2010 or (2008-2012)/5: See the Effort Analysis(1)
23 2015 or (2013-2017)/5:
24 2020:
25 2025:
26 2030:
27 Reduction cost, short term - with side effects: See the Effort Analysis(1)
28 Reduction cost, short term - without side effects:
29 Reduction cost, long term - with side effects:
30 Reduction cost, long term - without side effects:
31 Methods and assumptions used for the estimation of
reduction effects and socio-economic costs:
See Chapter 5 and the Effort Analysis(1)
Only investments in the period 1992-2002 are included.
32 Side effects – on other GHGs or GHG emitting activities: The emission of methane is higher at combined heat and power production than at
separate heat production.
33 Side effects – on other air pollutants: Reduction of SO2- and NOx emissions.
34 Side effects – other:
35 Interaction with other policies and measures:
36 How will the policy or measure modify longer-term trends in
anthropogenic GHG emissions and removals:
See Chapter 5 and the Effort Analysis(1)
37 Explanation, if the measure is no longer in place: Replaced by price supplement for the production of environmentally friendly electricity
38 *Is the effect of the measure included in the ”with measures”
GHG projection) ?:
Yes
39 *Is the effect of the measure included in the ”with additional
measures” GHG projection) ?:
N.a.
40 *Is effect estimated and subtracted in the ”without measures
(since 1990)" - projection ?:
41 References and links for further information: http://www.ens.dk/lovgivning
http://www.ens.dk/sw14254.asp
(1) See Annex B2 and http://www.mst.dk/transport/01041000.htm
42 Comments:

283Denmark's Fourth National Communication on Climate Change
EN-10 Requirement for offshore wind turbines
1 Sector: Energy sector, measures no longer in place or replaced
2 Name*: Requirement for offshore wind turbines
3 Origin: National measure
4 Legal basis: Recommandations from "The action plan on offshore windturbines in Danish waters
(1997)"
5 Domestic compliance and enforcement: Requirement
6 Description: Requirement to the power plants to build:
1. 200 MW wind power on land before 2000 (according to agreement between the
Ministry for the Envionment and Energy and producers of electricity).
2. 750 MW offshore wind power in the period 2002-2008 (an element in the energi
savings action plan Energy 21). However, this order was withdrawn in 2002.
3. In addition, a state financed subsidy of DKK 10 per kWh was given to the production
of electricity from 1992 until mid 1999.
7 Objective: Expansion of environmentally friendly technology in electricity production.
8 Greenhouse gas(es) affected: CO2
9 Type of measure: Regulatory (administrative), Economic (financial)
10 Status of implementation: 1. Implemented
2. Withdrawn and replaced by tenders
3. With the reorganisation of 1 January 2005 it was replaced by price supplement for the
production of environmentally friendly electricity.
11 Date for the political adoption: 1996
12 Date for adoption of legislation, if different:
13 Date of beginning:
14 Date of end, if relevant:
15 Allocated resources, if any:
16 For planned measures, planned date of start (& end?):
17 For planned measures, planned allocation of resources:
18 Implementering entity or entities:
19 Estimated effect (mill. tonnes CO2-eq.) in - 1995:
20 2001: See the Effort Analysis(1)
21 2005:
22 2010 or (2008-2012)/5: See the Effort Analysis(1)
23 2015 or (2013-2017)/5:
24 2020:
25 2025:
26 2030:
27 Reduction cost, short term - with side effects: See the Effort Analysis(1)
28 Reduction cost, short term - without side effects:
29 Reduction cost, long term - with side effects:
30 Reduction cost, long term - without side effects:
31 Methods and assumptions used for the estimation of
reduction effects and socio-economic costs:
See Chapter 5 and the Effort Analysis(1)
32 Side effects – on other GHGs or GHG emitting activities:
33 Side effects – on other air pollutants: Decrease in emissions of SO2 and NOx from power plants due to decrease in production
of electricity. Therefore power plants can save some of the costs related to compliance
with the SO2- og NOx quota regulation. With this, it is assumed that there are no extra
environmental benefits from reduction of SO2- and NOx-emissions.
34 Side effects – other:
35 Interaction with other policies and measures:
36 How will the policy or measure modify longer-term trends in
anthropogenic GHG emissions and removals:
See Chapter 5 and the Effort Analysis(1)
37 Explanation, if the measure is no longer in place: Replaced by offshore wind turbine tenders and price supplement for the production of
environmentally friendly electricity.
38 *Is the effect of the measure included in the ”with measures”
GHG projection) ?:
Yes
39 *Is the effect of the measure included in the ”with additional
measures” GHG projection) ?:
N.a.
40 *Is effect estimated and subtracted in the ”without measures
(since 1990)" - projection ?:
41 References and links for further information: http://www.energistyrelsen.dk/sw13787.asp
http://www.energistyrelsen.dk/sw14312.asp
http://www.ens.dk/lovgivning
(1) See Annex B2 and http://www.mst.dk/transport/01041000.htm
42 Comments:

284 Denmark's Fourth National Communication on Climate Change
EN-11 Scrapping scheme for old, badly located wind turbines
1 Sector: Energy sector, measures no longer in place or replaced
2 Name*: Scrapping scheme for old, badly located wind turbines
3 Origin: National measure
4 Legal basis: Act no. 273 of 2 June 1999 and amendment by Act no. 1277 of 20 December 2000.
5 Domestic compliance and enforcement: Fine and/or pay back of unwarranted subsidy
6 Description: As an element in the electricity reform a replacement scheme was etablished. The scheme
implied a scrapping certificate for scrapped wind turbines under 150 kW which entitled
the owner(s) to a price supplement of DKK 0.17 per kWh in 12,000 full load hours in a
new wind turbine. The scheme was in place until 1 January 2004.
7 Objective: Scrapping of old, badly located wind turbines
8 Greenhouse gas(es) affected: CO2
9 Type of measure: Economic (financial, price supplement)
10 Status of implementation: The scheme is no longer in place. From 2005, a new scrapping scheme has been
established
11 Date for the political adoption: The agreement on a electricity reform of 3 March 1999
12 Date for adoption of legislation, if different:
13 Date of beginning: 1 April 2001
14 Date of end, if relevant: End of 2003
15 Allocated resources, if any:
16 For planned measures, planned date of start (& end?):
17 For planned measures, planned allocation of resources:
18 Implementering entity or entities: Danish Energy Authority
19 Estimated effect (mill. tonnes CO2-eq.) in - 1995:
20 2001:
21 2005:
22 2010 or (2008-2012)/5:
23 2015 or (2013-2017)/5:
24 2020:
25 2025:
26 2030:
27 Reduction cost, short term - with side effects:
28 Reduction cost, short term - without side effects:
29 Reduction cost, long term - with side effects:
30 Reduction cost, long term - without side effects:
31 Methods and assumptions used for the estimation of
reduction effects and socio-economic costs:
See Chapter 5
32 Side effects – on other GHGs or GHG emitting activities:
33 Side effects – on other air pollutants:
34 Side effects – other:
35 Interaction with other policies and measures:
36 How will the policy or measure modify longer-term trends in
anthropogenic GHG emissions and removals:
See Chapter 5
37 Explanation, if the measure is no longer in place: From 2005, a new scrapping scheme has been established
38 *Is the effect of the measure included in the ”with measures”
GHG projection) ?:
Yes
39 *Is the effect of the measure included in the ”with additional
measures” GHG projection) ?:
N.a.
40 *Is effect estimated and subtracted in the ”without measures
(since 1990)" - projection ?:
41 References and links for further information: http://www.energistyrelsen.dk/sw14138.asp
http://www.ens.dk/lovgivning
42 Comments:
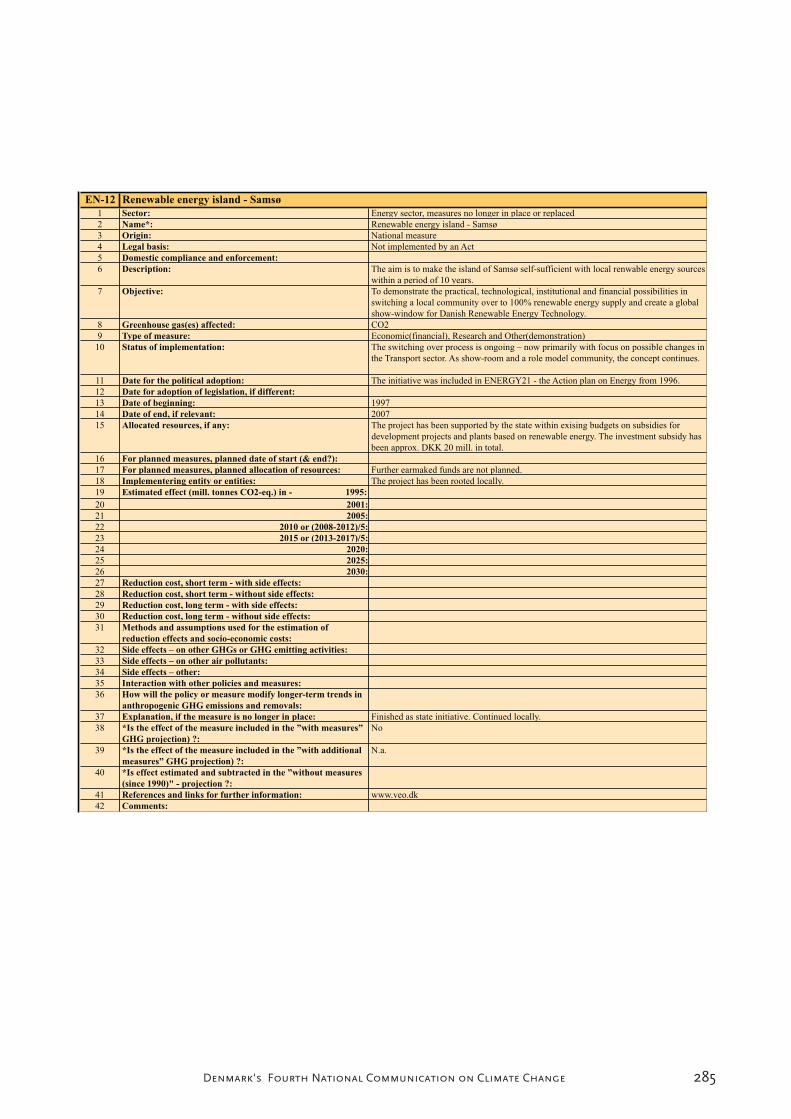
285Denmark's Fourth National Communication on Climate Change
EN-12 Renewable energy island - Samsø
1 Sector: Energy sector, measures no longer in place or replaced
2 Name*: Renewable energy island - Samsø
3 Origin: National measure
4 Legal basis: Not implemented by an Act
5 Domestic compliance and enforcement:
6 Description: The aim is to make the island of Samsø self-sufficient with local renwable energy sources
within a period of 10 years.
7 Objective: To demonstrate the practical, technological, institutional and financial possibilities in
switching a local community over to 100% renewable energy supply and create a global
show-window for Danish Renewable Energy Technology.
8 Greenhouse gas(es) affected: CO2
9 Type of measure: Economic(financial), Research and Other(demonstration)
10 Status of implementation: The switching over process is ongoing – now primarily with focus on possible changes in
the Transport sector. As show-room and a role model community, the concept continues.
11 Date for the political adoption: The initiative was included in ENERGY21 - the Action plan on Energy from 1996.
12 Date for adoption of legislation, if different:
13 Date of beginning: 1997
14 Date of end, if relevant: 2007
15 Allocated resources, if any: The project has been supported by the state within exising budgets on subsidies for
development projects and plants based on renewable energy. The investment subsidy has
been approx. DKK 20 mill. in total.
16 For planned measures, planned date of start (& end?):
17 For planned measures, planned allocation of resources: Further earmaked funds are not planned.
18 Implementering entity or entities: The project has been rooted locally.
19 Estimated effect (mill. tonnes CO2-eq.) in - 1995:
20 2001:
21 2005:
22 2010 or (2008-2012)/5:
23 2015 or (2013-2017)/5:
24 2020:
25 2025:
26 2030:
27 Reduction cost, short term - with side effects:
28 Reduction cost, short term - without side effects:
29 Reduction cost, long term - with side effects:
30 Reduction cost, long term - without side effects:
31 Methods and assumptions used for the estimation of
reduction effects and socio-economic costs:
32 Side effects – on other GHGs or GHG emitting activities:
33 Side effects – on other air pollutants:
34 Side effects – other:
35 Interaction with other policies and measures:
36 How will the policy or measure modify longer-term trends in
anthropogenic GHG emissions and removals:
37 Explanation, if the measure is no longer in place: Finished as state initiative. Continued locally.
38 *Is the effect of the measure included in the ”with measures”
GHG projection) ?:
No
39 *Is the effect of the measure included in the ”with additional
measures” GHG projection) ?:
N.a.
40 *Is effect estimated and subtracted in the ”without measures
(since 1990)" - projection ?:
41 References and links for further information: www.veo.dk
42 Comments:

286 Denmark's Fourth National Communication on Climate Change
EN-13 Construction subsidy for renewable energy
1 Sector: Energy sector, measures no longer in place or replaced
2 Name*: Construction subsidy for renewable energy
3 Origin: National measure
4 Legal basis: The Development Programme for Renwable Energy (UVE)
5 Domestic compliance and enforcement: Fine and/or pay back of unwarranted subsidy
6 Description: Arrangements according to which subsidies were given to system approved boilers based
on solar heat, heating pumps, biogas and biomass and for test facilities, information
activities and test and demonstration projects.
7 Objective: Incentive to use renewable energy.
8 Greenhouse gas(es) affected: CO2
9 Type of measure: Economic (financial, subsidy)
10 Status of implementation: Development and Demonstration projects under UVE as well as the special programmes
on hydrogen, solar energy, geothermi and wave energy - except in a few cases - have
ended in 2004.
11 Date for the political adoption:
12 Date for adoption of legislation, if different:
13 Date of beginning: Beginning of 1970s
14 Date of end, if relevant: End of 2001
15 Allocated resources, if any: DKK 450 mill. in the period 1991-2001.
16 For planned measures, planned date of start (& end?):
17 For planned measures, planned allocation of resources:
18 Implementering entity or entities:
19 Estimated effect (mill. tonnes CO2-eq.) in - 1995:
20 2001: See the Effort Analysis(1)
21 2005:
22 2010 or (2008-2012)/5: See the Effort Analysis(1)
23 2015 or (2013-2017)/5:
24 2020:
25 2025:
26 2030:
27 Reduction cost, short term - with side effects: See the Effort Analysis(1)
28 Reduction cost, short term - without side effects:
29 Reduction cost, long term - with side effects:
30 Reduction cost, long term - without side effects:
31 Methods and assumptions used for the estimation of
reduction effects and socio-economic costs:
See Chapter 5 and the Effort Analysis(1)
Only subsidies for solar heating, biomass fired plants and heating pumps have been
included in the Effort Analysis. See Danish Energy Authority (2004)
32 Side effects – on other GHGs or GHG emitting activities:
33 Side effects – on other air pollutants:
34 Side effects – other:
35 Interaction with other policies and measures:
36 How will the policy or measure modify longer-term trends in
anthropogenic GHG emissions and removals:
See Chapter 5 and the Effort Analysis(1)
37 Explanation, if the measure is no longer in place: The subsidies are no longer in place
38 *Is the effect of the measure included in the ”with measures”
GHG projection) ?:
No
39 *Is the effect of the measure included in the ”with additional
measures” GHG projection) ?:
N.a.
40 *Is effect estimated and subtracted in the ”without measures
(since 1990)" - projection ?:
Yes
41 References and links for further information: http://www.ens.dk/sw16321.asp
http://www.ens.dk/lovgivning
(1) See Annex B2 and http://www.mst.dk/transport/01041000.htm
42 Comments:

287Denmark's Fourth National Communication on Climate Change
EN-14 Subsidy for investment in energy savings by industry
1 Sector: Energy sector, Business sector, measures no longer in place or replaced
2 Name*: Subsidy for investment in energy savings by industry
3 Origin: National measure
4 Legal basis: Lov nr. 2 af 3. januar 1992
Lov nr. 284 af 27. april 1994
Lov nr. 406 af 14. juni 1995
5 Domestic compliance and enforcement: Fine and/or pay back of unwarranted subsidy
6 Description: Subsidy for investments in energy efficient technology, establishment of CHP in industry,
projects with development, test or demonstration objectives, advisory and information
activities etc. The subsidy typically amounted to 20-40% of the total budget. This
arrangement was linked to so-called Agreement Scheme.
7 Objective: Energy Savings
8 Greenhouse gas(es) affected: CO2
9 Type of measure: Economic (subsidies)
10 Status of implementation: No longer in place
11 Date for the political adoption:
12 Date for adoption of legislation, if different:
13 Date of beginning: 1993
14 Date of end, if relevant: 2001
15 Allocated resources, if any: DKK 1.8 bn.
16 For planned measures, planned date of start (& end?):
17 For planned measures, planned allocation of resources:
18 Implementering entity or entities: Danish Energy Authority
Estimated effect (mill. tonnes CO2-eq.) in - 1995:
20 2001: See the Effort Analysis(1)
21 2005:
22 2010 or (2008-2012)/5: See the Effort Analysis(1)
23 2015 or (2013-2017)/5:
24 2020:
25 2025:
26 2030:
27 Reduction cost, short term - with side effects: See the Effort Analysis(1)
28 Reduction cost, short term - without side effects:
29 Reduction cost, long term - with side effects:
30 Reduction cost, long term - without side effects:
31 Methods and assumptions used for the estimation of
reduction effects and socio-economic costs:
See Chapter 5 and the Effort Analysis(1)
32 Side effects – on other GHGs or GHG emitting activities:
33 Side effects – on other air pollutants: SO2 og NOx
34 Side effects – other:
35 Interaction with other policies and measures:
36 How will the policy or measure modify longer-term trends in
anthropogenic GHG emissions and removals:
See Chapter 5 and the Effort Analysis(1)
37 Explanation, if the measure is no longer in place:
38 *Is the effect of the measure included in the ”with measures”
GHG projection) ?:
Yes. To the extent that the effect deviates from the effect in 2003 - the latest year with
energy statistics on which the energy projection is based - it is included in the projection.
39 *Is the effect of the measure included in the ”with additional
measures” GHG projection) ?:
N.a.
40 *Is effect estimated and subtracted in the ”without measures
(since 1990)" - projection ?:
Yes
41 References and links for further information: http://www.ens.dk/sw11574.asp
http://www.ens.dk/lovgivning
http://www.ens.dk/sw12329.asp
http://www.ens.dk/sw17747.asp
(1) See Annex B2 and http://www.mst.dk/transport/01041000.htm
42 Comments:

288 Denmark's Fourth National Communication on Climate Change
EN-15 Subsidy for conversion of old housing to CHP
1 Sector: Energy sector, Domestic sector, measures no longer in place or replaced
2 Name*: Subsidy for conversion of old housing to CHP
3 Origin: National measure
4 Legal basis: Act no. 5 of 3 January 1992 on state subsidy for conversion of old housing to CHP.
5 Domestic compliance and enforcement: Fine and/or pay back of unwarranted subsidy
6 Description: Subsidy for connection to district heating for old housing (build before 1950) without
central heating, but with heating based on paraffin, town gas, bottled gas, electric heating
or wood etc. A precondition was that housing was situated in an area with CHP district
heating supply.
7 Objective: To reduce CO2 emissions
8 Greenhouse gas(es) affected: CO2
9 Type of measure: Economic (financial, subsidy)
10 Status of implementation: Implemented, but no longer in place
11 Date for the political adoption: 3 January 1992
12 Date for adoption of legislation, if different: Latest statutory order: No. 534 of 8 July 1998
13 Date of beginning: 1 January 1993
14 Date of end, if relevant: 31 December 2001
15 Allocated resources, if any: In the period 1993-2003: DKK 1,080 mill. (Budget was: DKK 1,500 mill.)
16 For planned measures, planned date of start (& end?): 1 January 1993
17 For planned measures, planned allocation of resources:
18 Implementering entity or entities: Danish Energy Authority and Municipality Boards
19 Estimated effect (mill. tonnes CO2-eq.) in - 1995:
20 2001: See the Effort Analysis(1)
21 2005:
22 2010 or (2008-2012)/5: See the Effort Analysis(1)
23 2015 or (2013-2017)/5:
24 2020:
25 2025:
26 2030:
27 Reduction cost, short term - with side effects: See the Effort Analysis(1)
28 Reduction cost, short term - without side effects:
29 Reduction cost, long term - with side effects:
30 Reduction cost, long term - without side effects:
31 Methods and assumptions used for the estimation of
reduction effects and socio-economic costs:
See Chapter 5 and the Effort Analysis(1)
32 Side effects – on other GHGs or GHG emitting activities:
33 Side effects – on other air pollutants:
34 Side effects – other:
35 Interaction with other policies and measures:
36 How will the policy or measure modify longer-term trends in
anthropogenic GHG emissions and removals:
See Chapter 5 and the Effort Analysis(1)
37 Explanation, if the measure is no longer in place:
38 *Is the effect of the measure included in the ”with measures”
GHG projection) ?:
It is estimated that the effect in the future will be the same as in 2003. Since 2003 is the
latest year of energy statistics on which the projection of energy consumption is based, no
additional effects have been included in the projection.
39 *Is the effect of the measure included in the ”with additional
measures” GHG projection) ?:
N.a.
40 *Is effect estimated and subtracted in the ”without measures
(since 1990)" - projection ?:
Yes
41 References and links for further information: http://www.ens.dk/lovgivning
(1) See Annex B2 and http://www.mst.dk/transport/01041000.htm
42 Comments:

289Denmark's Fourth National Communication on Climate Change
EN-16 Subsidy to promote connection to coal CHP
1 Sector: Energy sector, Domestic sector, measures no longer in place or replaced
2 Name*: Subsidy to promote connection to coal CHP
3 Origin: National measure
4 Legal basis: Act no. 420 of 1 June 1994 on state subsidy to promote connection to coal CHP.
5 Domestic compliance and enforcement: Fine and/or pay back of unwarranted subsidy
6 Description: Subsidy as an incentive to house owners with oil burners or electric heating to shift to
district heating.
7 Objective: Targetted compensation for the increase in coal tax in 1993.
8 Greenhouse gas(es) affected: CO2
9 Type of measure: Economic (subsidy).
10 Status of implementation: No longer in place
11 Date for the political adoption: 1 June 1994
12 Date for adoption of legislation, if different: 1 June 1994
13 Date of beginning: 1994
14 Date of end, if relevant: 2003
15 Allocated resources, if any: At the adoption of the Act the budget for this subsidy was DKK 240 mill., but since then
the budget has been reduced gradually. Until 2003 the total payment of this subsidy
amounted to DKK 160 mill.
16 For planned measures, planned date of start (& end?):
17 For planned measures, planned allocation of resources:
18 Implementering entity or entities: Danish Energy Authority
19 Estimated effect (mill. tonnes CO2-eq.) in - 1995:
20 2001: See the Effort Analysis(1)
21 2005:
22 2010 or (2008-2012)/5: See the Effort Analysis(1)
23 2015 or (2013-2017)/5:
24 2020:
25 2025:
26 2030:
27 Reduction cost, short term - with side effects: See the Effort Analysis(1)
28 Reduction cost, short term - without side effects:
29 Reduction cost, long term - with side effects:
30 Reduction cost, long term - without side effects:
31 Methods and assumptions used for the estimation of
reduction effects and socio-economic costs:
See Chapter 5 and the Effort Analysis(1)
32 Side effects – on other GHGs or GHG emitting activities:
33 Side effects – on other air pollutants:
34 Side effects – other:
35 Interaction with other policies and measures:
36 How will the policy or measure modify longer-term trends in
anthropogenic GHG emissions and removals:
See Chapter 5 and the Effort Analysis(1)
37 Explanation, if the measure is no longer in place:
38 *Is the effect of the measure included in the ”with measures”
GHG projection) ?:
It is estimated that the effect in the future will be the same as in 2003. Since 2003 is the
latest year of energy statistics on which the projection of energy consumption is based, no
additional effects have been included in the projection.
39 *Is the effect of the measure included in the ”with additional
measures” GHG projection) ?:
N.a.
40 *Is effect estimated and subtracted in the ”without measures
(since 1990)" - projection ?:
Yes
41 References and links for further information: http://www.ens.dk/lovgivning
(1) See Annex B2 and http://www.mst.dk/transport/01041000.htm
42 Comments:
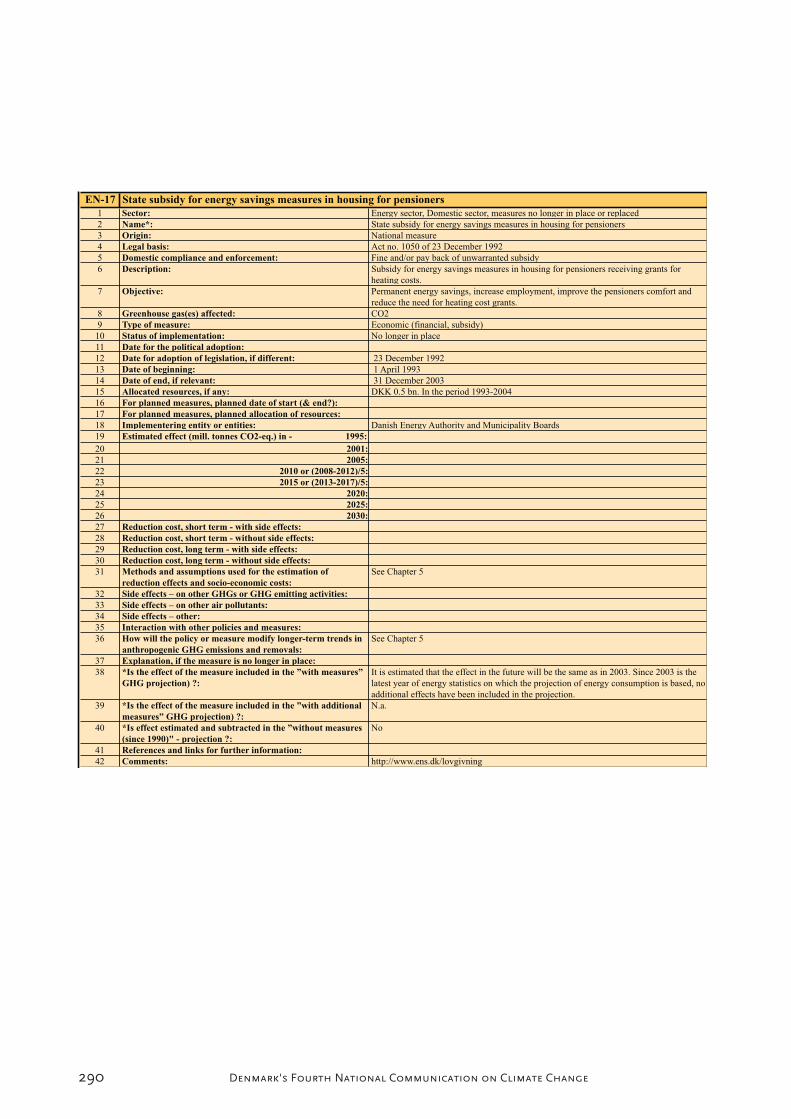
290 Denmark's Fourth National Communication on Climate Change
EN-17 State subsidy for energy savings measures in housing for pensioners
1 Sector: Energy sector, Domestic sector, measures no longer in place or replaced
2 Name*: State subsidy for energy savings measures in housing for pensioners
3 Origin: National measure
4 Legal basis: Act no. 1050 of 23 December 1992
5 Domestic compliance and enforcement: Fine and/or pay back of unwarranted subsidy
6 Description: Subsidy for energy savings measures in housing for pensioners receiving grants for
heating costs.
7 Objective: Permanent energy savings, increase employment, improve the pensioners comfort and
reduce the need for heating cost grants.
8 Greenhouse gas(es) affected: CO2
9 Type of measure: Economic (financial, subsidy)
10 Status of implementation: No longer in place
11 Date for the political adoption:
12 Date for adoption of legislation, if different: 23 December 1992
13 Date of beginning: 1 April 1993
14 Date of end, if relevant: 31 December 2003
15 Allocated resources, if any: DKK 0.5 bn. In the period 1993-2004
16 For planned measures, planned date of start (& end?):
17 For planned measures, planned allocation of resources:
18 Implementering entity or entities: Danish Energy Authority and Municipality Boards
19 Estimated effect (mill. tonnes CO2-eq.) in - 1995:
20 2001:
21 2005:
22 2010 or (2008-2012)/5:
23 2015 or (2013-2017)/5:
24 2020:
25 2025:
26 2030:
27 Reduction cost, short term - with side effects:
28 Reduction cost, short term - without side effects:
29 Reduction cost, long term - with side effects:
30 Reduction cost, long term - without side effects:
31 Methods and assumptions used for the estimation of
reduction effects and socio-economic costs:
See Chapter 5
32 Side effects – on other GHGs or GHG emitting activities:
33 Side effects – on other air pollutants:
34 Side effects – other:
35 Interaction with other policies and measures:
36 How will the policy or measure modify longer-term trends in
anthropogenic GHG emissions and removals:
See Chapter 5
37 Explanation, if the measure is no longer in place:
38 *Is the effect of the measure included in the ”with measures”
GHG projection) ?:
It is estimated that the effect in the future will be the same as in 2003. Since 2003 is the
latest year of energy statistics on which the projection of energy consumption is based, no
additional effects have been included in the projection.
39 *Is the effect of the measure included in the ”with additional
measures” GHG projection) ?:
N.a.
40 *Is effect estimated and subtracted in the ”without measures
(since 1990)" - projection ?:
No
41 References and links for further information:
42 Comments: http://www.ens.dk/lovgivning
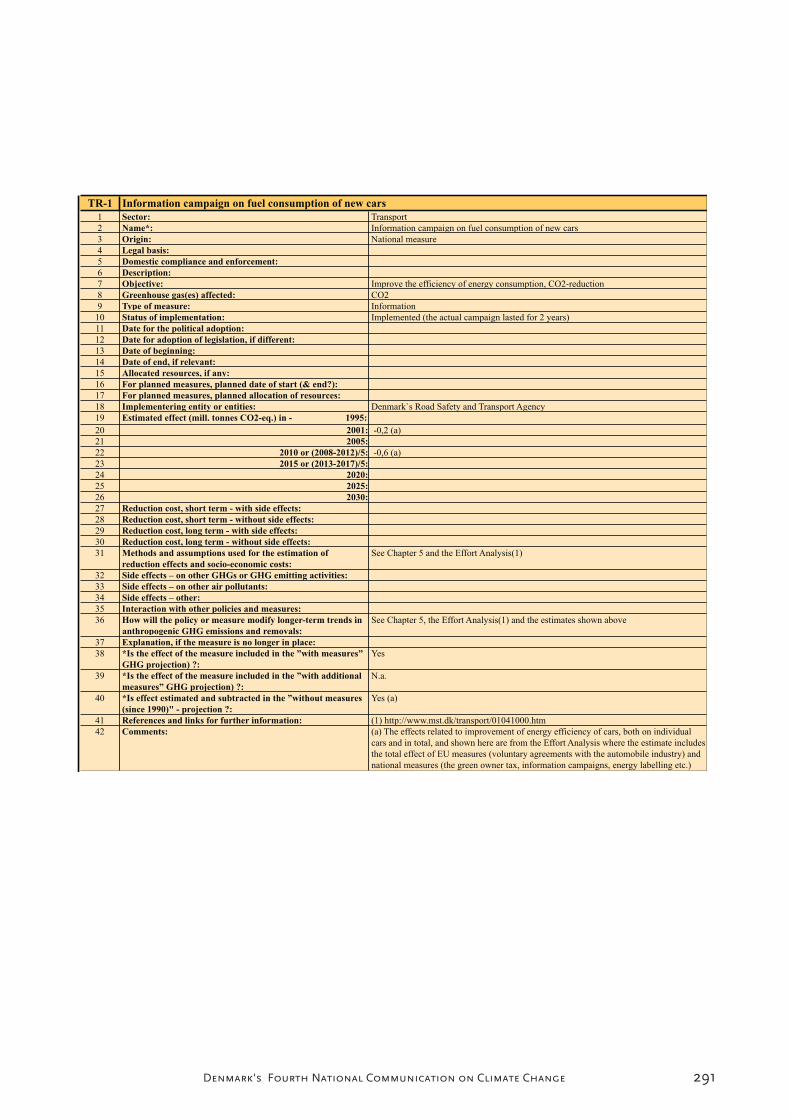
291Denmark's Fourth National Communication on Climate Change
TR-1 Information campaign on fuel consumption of new cars
1 Sector: Transport
2 Name*: Information campaign on fuel consumption of new cars
3 Origin: National measure
4 Legal basis:
5 Domestic compliance and enforcement:
6 Description:
7 Objective: Improve the efficiency of energy consumption, CO2-reduction
8 Greenhouse gas(es) affected: CO2
9 Type of measure: Information
10 Status of implementation: Implemented (the actual campaign lasted for 2 years)
11 Date for the political adoption:
12 Date for adoption of legislation, if different:
13 Date of beginning:
14 Date of end, if relevant:
15 Allocated resources, if any:
16 For planned measures, planned date of start (& end?):
17 For planned measures, planned allocation of resources:
18 Implementering entity or entities: Denmark`s Road Safety and Transport Agency
19 Estimated effect (mill. tonnes CO2-eq.) in - 1995:
20 2001: -0,2 (a)
21 2005:
22 2010 or (2008-2012)/5: -0,6 (a)
23 2015 or (2013-2017)/5:
24 2020:
25 2025:
26 2030:
27 Reduction cost, short term - with side effects:
28 Reduction cost, short term - without side effects:
29 Reduction cost, long term - with side effects:
30 Reduction cost, long term - without side effects:
31 Methods and assumptions used for the estimation of
reduction effects and socio-economic costs:
See Chapter 5 and the Effort Analysis(1)
32 Side effects – on other GHGs or GHG emitting activities:
33 Side effects – on other air pollutants:
34 Side effects – other:
35 Interaction with other policies and measures:
36 How will the policy or measure modify longer-term trends in
anthropogenic GHG emissions and removals:
See Chapter 5, the Effort Analysis(1) and the estimates shown above
37 Explanation, if the measure is no longer in place:
38 *Is the effect of the measure included in the ”with measures”
GHG projection) ?:
Yes
39 *Is the effect of the measure included in the ”with additional
measures” GHG projection) ?:
N.a.
40 *Is effect estimated and subtracted in the ”without measures
(since 1990)" - projection ?:
Yes (a)
41 References and links for further information: (1) http://www.mst.dk/transport/01041000.htm
42 Comments: (a) The effects related to improvement of energy efficiency of cars, both on individual
cars and in total, and shown here are from the Effort Analysis where the estimate includes
the total effect of EU measures (voluntary agreements with the automobile industry) and
national measures (the green owner tax, information campaigns, energy labelling etc.)
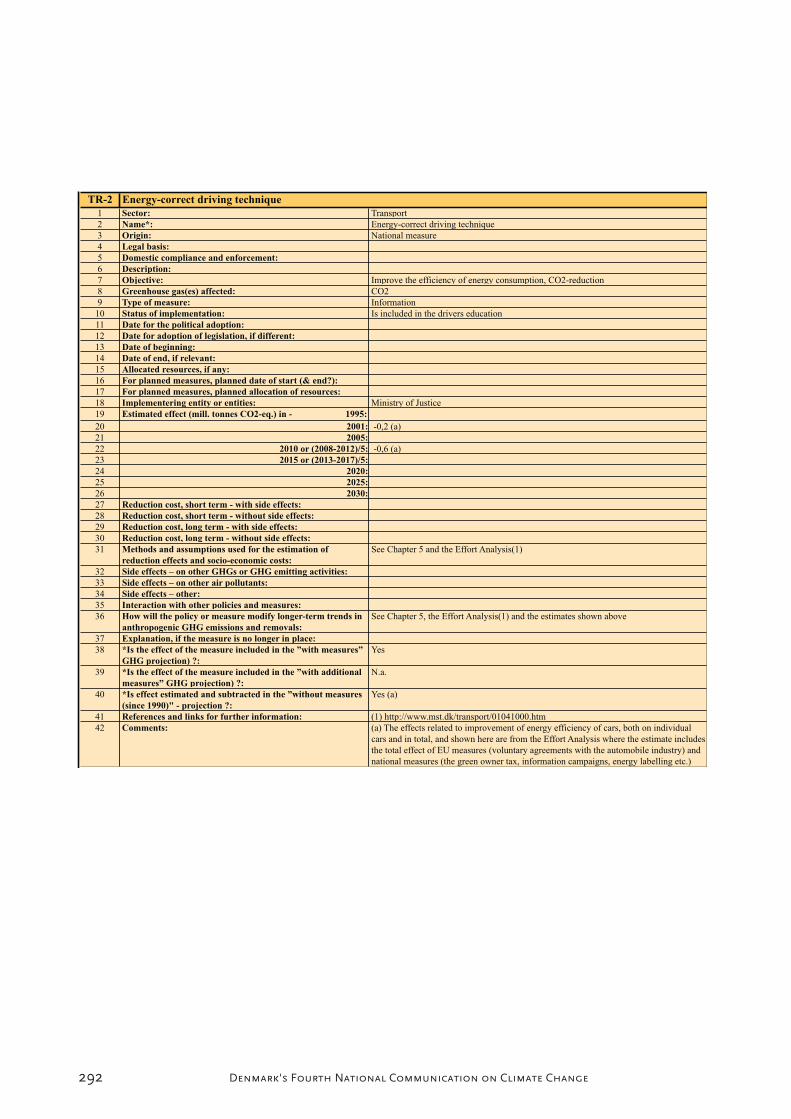
292 Denmark's Fourth National Communication on Climate Change
TR-2 Energy-correct driving technique
1 Sector: Transport
2 Name*: Energy-correct driving technique
3 Origin: National measure
4 Legal basis:
5 Domestic compliance and enforcement:
6 Description:
7 Objective: Improve the efficiency of energy consumption, CO2-reduction
8 Greenhouse gas(es) affected: CO2
9 Type of measure: Information
10 Status of implementation: Is included in the drivers education
11 Date for the political adoption:
12 Date for adoption of legislation, if different:
13 Date of beginning:
14 Date of end, if relevant:
15 Allocated resources, if any:
16 For planned measures, planned date of start (& end?):
17 For planned measures, planned allocation of resources:
18 Implementering entity or entities: Ministry of Justice
19 Estimated effect (mill. tonnes CO2-eq.) in - 1995:
20 2001: -0,2 (a)
21 2005:
22 2010 or (2008-2012)/5: -0,6 (a)
23 2015 or (2013-2017)/5:
24 2020:
25 2025:
26 2030:
27 Reduction cost, short term - with side effects:
28 Reduction cost, short term - without side effects:
29 Reduction cost, long term - with side effects:
30 Reduction cost, long term - without side effects:
31 Methods and assumptions used for the estimation of
reduction effects and socio-economic costs:
See Chapter 5 and the Effort Analysis(1)
32 Side effects – on other GHGs or GHG emitting activities:
33 Side effects – on other air pollutants:
34 Side effects – other:
35 Interaction with other policies and measures:
36 How will the policy or measure modify longer-term trends in
anthropogenic GHG emissions and removals:
See Chapter 5, the Effort Analysis(1) and the estimates shown above
37 Explanation, if the measure is no longer in place:
38 *Is the effect of the measure included in the ”with measures”
GHG projection) ?:
Yes
39 *Is the effect of the measure included in the ”with additional
measures” GHG projection) ?:
N.a.
40 *Is effect estimated and subtracted in the ”without measures
(since 1990)" - projection ?:
Yes (a)
41 References and links for further information: (1) http://www.mst.dk/transport/01041000.htm
42 Comments: (a) The effects related to improvement of energy efficiency of cars, both on individual
cars and in total, and shown here are from the Effort Analysis where the estimate includes
the total effect of EU measures (voluntary agreements with the automobile industry) and
national measures (the green owner tax, information campaigns, energy labelling etc.)
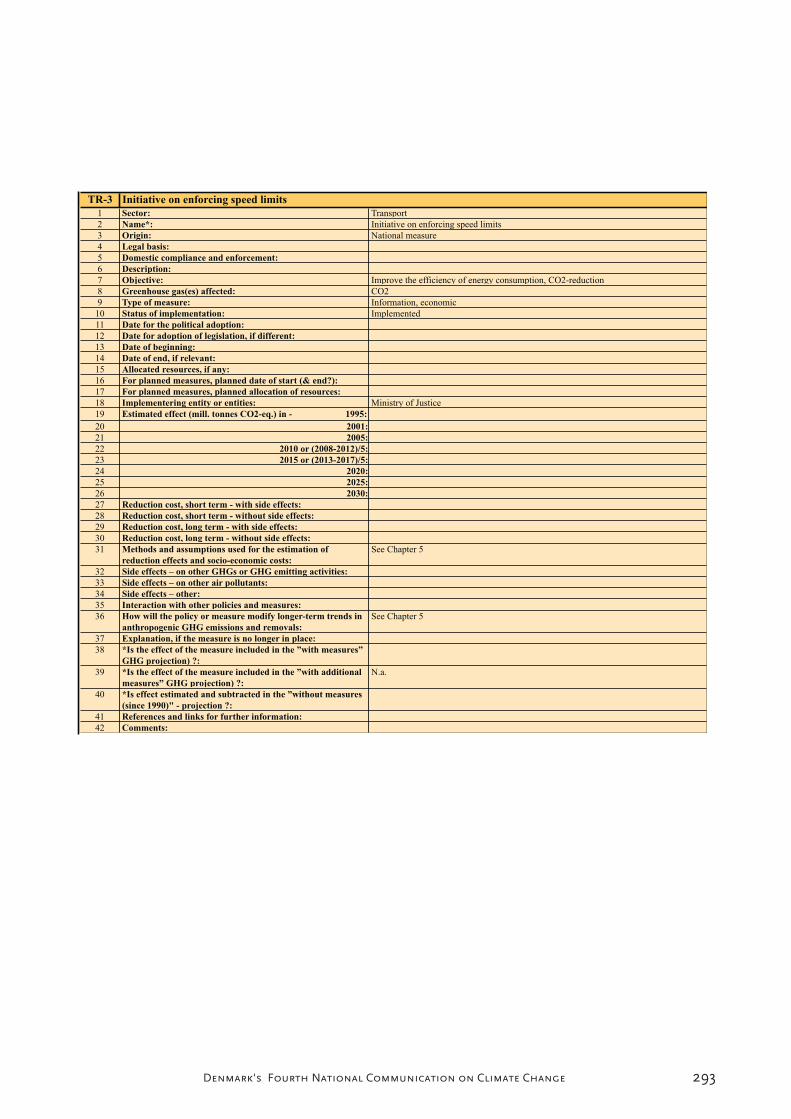
293Denmark's Fourth National Communication on Climate Change
TR-3 Initiative on enforcing speed limits
1 Sector: Transport
2 Name*: Initiative on enforcing speed limits
3 Origin: National measure
4 Legal basis:
5 Domestic compliance and enforcement:
6 Description:
7 Objective: Improve the efficiency of energy consumption, CO2-reduction
8 Greenhouse gas(es) affected: CO2
9 Type of measure: Information, economic
10 Status of implementation: Implemented
11 Date for the political adoption:
12 Date for adoption of legislation, if different:
13 Date of beginning:
14 Date of end, if relevant:
15 Allocated resources, if any:
16 For planned measures, planned date of start (& end?):
17 For planned measures, planned allocation of resources:
18 Implementering entity or entities: Ministry of Justice
19 Estimated effect (mill. tonnes CO2-eq.) in - 1995:
20 2001:
21 2005:
22 2010 or (2008-2012)/5:
23 2015 or (2013-2017)/5:
24 2020:
25 2025:
26 2030:
27 Reduction cost, short term - with side effects:
28 Reduction cost, short term - without side effects:
29 Reduction cost, long term - with side effects:
30 Reduction cost, long term - without side effects:
31 Methods and assumptions used for the estimation of
reduction effects and socio-economic costs:
See Chapter 5
32 Side effects – on other GHGs or GHG emitting activities:
33 Side effects – on other air pollutants:
34 Side effects – other:
35 Interaction with other policies and measures:
36 How will the policy or measure modify longer-term trends in
anthropogenic GHG emissions and removals:
See Chapter 5
37 Explanation, if the measure is no longer in place:
38 *Is the effect of the measure included in the ”with measures”
GHG projection) ?:
39 *Is the effect of the measure included in the ”with additional
measures” GHG projection) ?:
N.a.
40 *Is effect estimated and subtracted in the ”without measures
(since 1990)" - projection ?:
41 References and links for further information:
42 Comments:
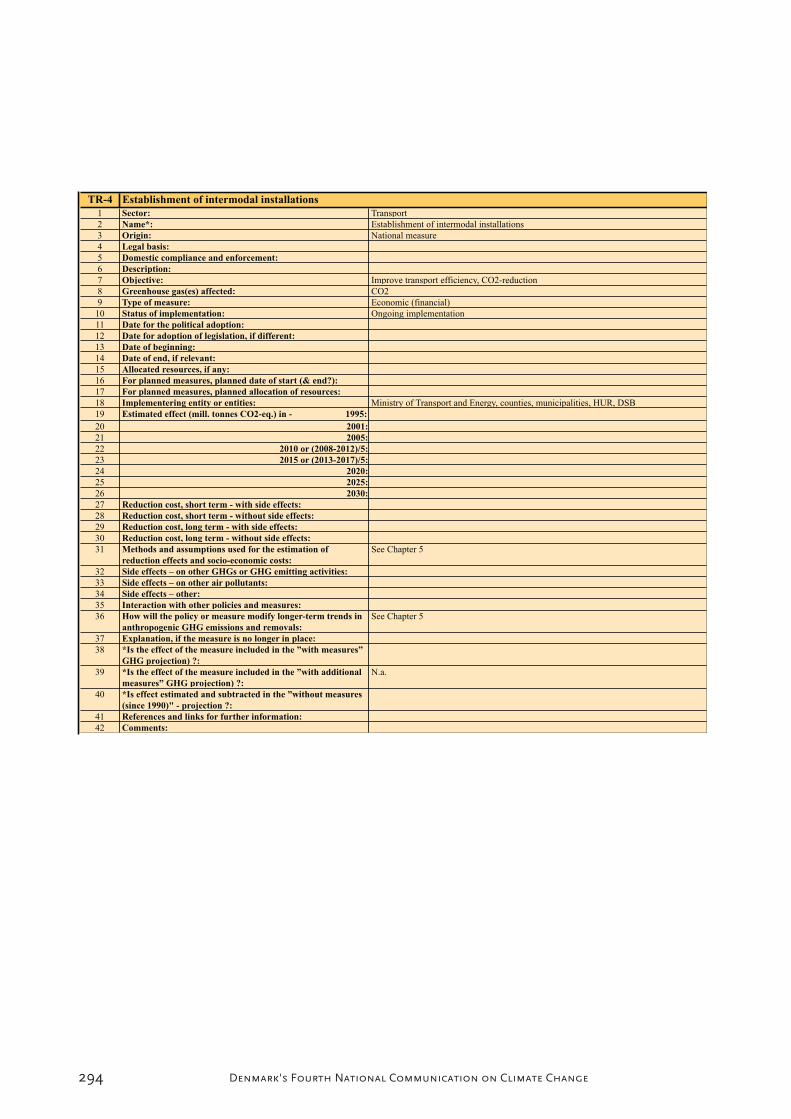
294 Denmark's Fourth National Communication on Climate Change
TR-4 Establishment of intermodal installations
1 Sector: Transport
2 Name*: Establishment of intermodal installations
3 Origin: National measure
4 Legal basis:
5 Domestic compliance and enforcement:
6 Description:
7 Objective: Improve transport efficiency, CO2-reduction
8 Greenhouse gas(es) affected: CO2
9 Type of measure: Economic (financial)
10 Status of implementation: Ongoing implementation
11 Date for the political adoption:
12 Date for adoption of legislation, if different:
13 Date of beginning:
14 Date of end, if relevant:
15 Allocated resources, if any:
16 For planned measures, planned date of start (& end?):
17 For planned measures, planned allocation of resources:
18 Implementering entity or entities: Ministry of Transport and Energy, counties, municipalities, HUR, DSB
19 Estimated effect (mill. tonnes CO2-eq.) in - 1995:
20 2001:
21 2005:
22 2010 or (2008-2012)/5:
23 2015 or (2013-2017)/5:
24 2020:
25 2025:
26 2030:
27 Reduction cost, short term - with side effects:
28 Reduction cost, short term - without side effects:
29 Reduction cost, long term - with side effects:
30 Reduction cost, long term - without side effects:
31 Methods and assumptions used for the estimation of
reduction effects and socio-economic costs:
See Chapter 5
32 Side effects – on other GHGs or GHG emitting activities:
33 Side effects – on other air pollutants:
34 Side effects – other:
35 Interaction with other policies and measures:
36 How will the policy or measure modify longer-term trends in
anthropogenic GHG emissions and removals:
See Chapter 5
37 Explanation, if the measure is no longer in place:
38 *Is the effect of the measure included in the ”with measures”
GHG projection) ?:
39 *Is the effect of the measure included in the ”with additional
measures” GHG projection) ?:
N.a.
40 *Is effect estimated and subtracted in the ”without measures
(since 1990)" - projection ?:
41 References and links for further information:
42 Comments:
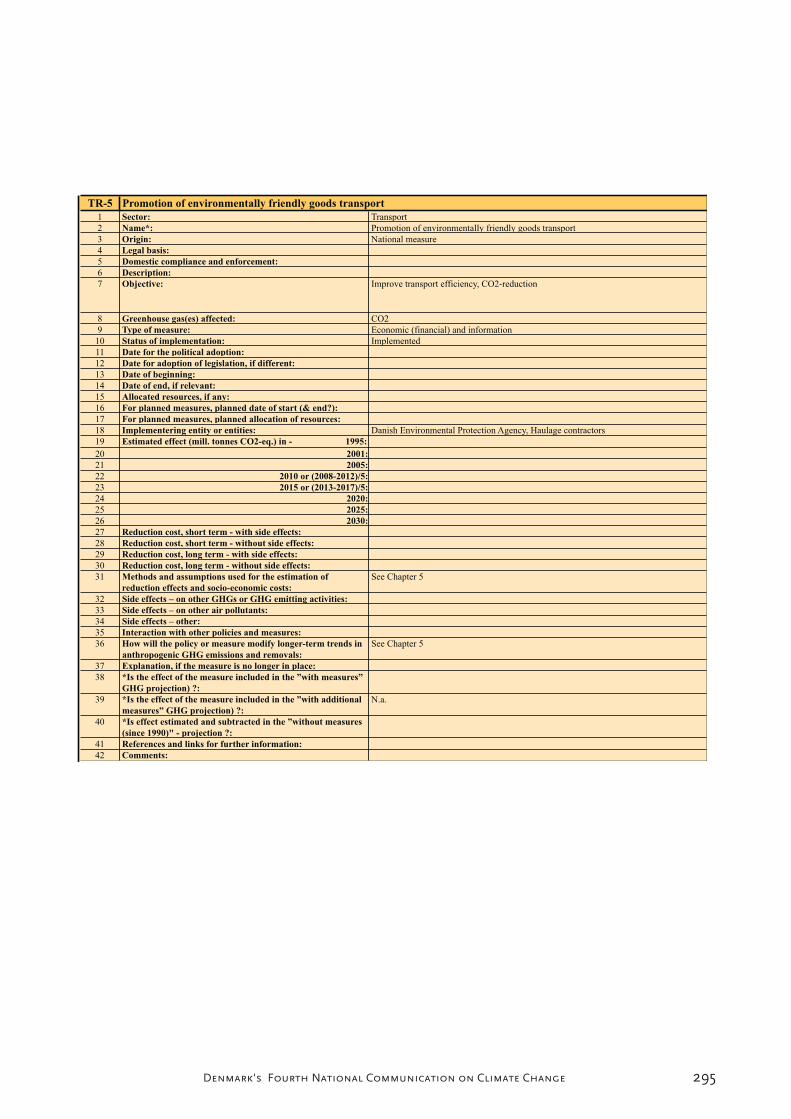
295Denmark's Fourth National Communication on Climate Change
TR-5 Promotion of environmentally friendly goods transport
1 Sector: Transport
2 Name*: Promotion of environmentally friendly goods transport
3 Origin: National measure
4 Legal basis:
5 Domestic compliance and enforcement:
6 Description:
7 Objective: Improve transport efficiency, CO2-reduction
8 Greenhouse gas(es) affected: CO2
9 Type of measure: Economic (financial) and information
10 Status of implementation: Implemented
11 Date for the political adoption:
12 Date for adoption of legislation, if different:
13 Date of beginning:
14 Date of end, if relevant:
15 Allocated resources, if any:
16 For planned measures, planned date of start (& end?):
17 For planned measures, planned allocation of resources:
18 Implementering entity or entities: Danish Environmental Protection Agency, Haulage contractors
19 Estimated effect (mill. tonnes CO2-eq.) in - 1995:
20 2001:
21 2005:
22 2010 or (2008-2012)/5:
23 2015 or (2013-2017)/5:
24 2020:
25 2025:
26 2030:
27 Reduction cost, short term - with side effects:
28 Reduction cost, short term - without side effects:
29 Reduction cost, long term - with side effects:
30 Reduction cost, long term - without side effects:
31 Methods and assumptions used for the estimation of
reduction effects and socio-economic costs:
See Chapter 5
32 Side effects – on other GHGs or GHG emitting activities:
33 Side effects – on other air pollutants:
34 Side effects – other:
35 Interaction with other policies and measures:
36 How will the policy or measure modify longer-term trends in
anthropogenic GHG emissions and removals:
See Chapter 5
37 Explanation, if the measure is no longer in place:
38 *Is the effect of the measure included in the ”with measures”
GHG projection) ?:
39 *Is the effect of the measure included in the ”with additional
measures” GHG projection) ?:
N.a.
40 *Is effect estimated and subtracted in the ”without measures
(since 1990)" - projection ?:
41 References and links for further information:
42 Comments:

296 Denmark's Fourth National Communication on Climate Change
TR-6 Reduced travel times for public transport
1 Sector: Transport
2 Name*: Reduced travel times for public transport
3 Origin: National measure
4 Legal basis:
5 Domestic compliance and enforcement:
6 Description:
7 Objective: Improve transport efficiency, CO2-reduction
8 Greenhouse gas(es) affected: CO2
9 Type of measure: Regulatory (Administrative)
10 Status of implementation: Ongoing implementation
11 Date for the political adoption:
12 Date for adoption of legislation, if different:
13 Date of beginning:
14 Date of end, if relevant:
15 Allocated resources, if any:
16 For planned measures, planned date of start (& end?):
17 For planned measures, planned allocation of resources:
18 Implementering entity or entities: Ministry of Transport and Energy, Counties and Danish State Railways (DSB)
19 Estimated effect (mill. tonnes CO2-eq.) in - 1995:
20 2001:
21 2005:
22 2010 or (2008-2012)/5:
23 2015 or (2013-2017)/5:
24 2020:
25 2025:
26 2030:
27 Reduction cost, short term - with side effects:
28 Reduction cost, short term - without side effects:
29 Reduction cost, long term - with side effects:
30 Reduction cost, long term - without side effects:
31 Methods and assumptions used for the estimation of
reduction effects and socio-economic costs:
See Chapter 5
32 Side effects – on other GHGs or GHG emitting activities:
33 Side effects – on other air pollutants:
34 Side effects – other:
35 Interaction with other policies and measures:
36 How will the policy or measure modify longer-term trends in
anthropogenic GHG emissions and removals:
See Chapter 5
37 Explanation, if the measure is no longer in place:
38 *Is the effect of the measure included in the ”with measures”
GHG projection) ?:
39 *Is the effect of the measure included in the ”with additional
measures” GHG projection) ?:
N.a.
40 *Is effect estimated and subtracted in the ”without measures
(since 1990)" - projection ?:
41 References and links for further information:
42 Comments:

297Denmark's Fourth National Communication on Climate Change
TR-7 Spatial planning
1 Sector: Transport
2 Name*: Spatial planning
3 Origin: National measure
4 Legal basis:
5 Domestic compliance and enforcement:
6 Description:
7 Objective: Reduce the need for transport, CO2-reduction
8 Greenhouse gas(es) affected: CO2
9 Type of measure: Regulatory (Administrative)
10 Status of implementation: Ongoing implementation
11 Date for the political adoption:
12 Date for adoption of legislation, if different:
13 Date of beginning:
14 Date of end, if relevant:
15 Allocated resources, if any:
16 For planned measures, planned date of start (& end?):
17 For planned measures, planned allocation of resources:
18 Implementering entity or entities: Counties, municipalities
19 Estimated effect (mill. tonnes CO2-eq.) in - 1995:
20 2001:
21 2005:
22 2010 or (2008-2012)/5:
23 2015 or (2013-2017)/5:
24 2020:
25 2025:
26 2030:
27 Reduction cost, short term - with side effects:
28 Reduction cost, short term - without side effects:
29 Reduction cost, long term - with side effects:
30 Reduction cost, long term - without side effects:
31 Methods and assumptions used for the estimation of
reduction effects and socio-economic costs:
See Chapter 5
32 Side effects – on other GHGs or GHG emitting activities:
33 Side effects – on other air pollutants:
34 Side effects – other:
35 Interaction with other policies and measures:
36 How will the policy or measure modify longer-term trends in
anthropogenic GHG emissions and removals:
See Chapter 5
37 Explanation, if the measure is no longer in place:
38 *Is the effect of the measure included in the ”with measures”
GHG projection) ?:
39 *Is the effect of the measure included in the ”with additional
measures” GHG projection) ?:
N.a.
40 *Is effect estimated and subtracted in the ”without measures
(since 1990)" - projection ?:
41 References and links for further information:
42 Comments:

298 Denmark's Fourth National Communication on Climate Change
BU-1 Agreements on energy efficiency with business
1 Sector: Business (energy consumption)
2 Name*: Agreements on energy efficiency with business
3 Origin: National measure
4 Legal basis: Act no. 1 of 3 Frebuary 1992
Act no. 850 of 13 November 1995
Statutory Order no. 863 of 17 November 1995
5 Domestic compliance and enforcement: Cancellation of the agreement and the CO2 tax discount. Fines in the case of incorrect or
detained information.
6 Description: In connection with the implementation of the CO2 tax also a subsidy for CO2 tax
descount for energy intensive industries was introduced. However, a condition for getting
the CO2 tax discount is an agreement on improvements in energy efficiency. Industries
under the CO2 allowance scheme are no longer covered by this arrangement. The
aggrement scheme was significantly revised in 1996.
7 Objective: Energy efficiency at energy-intensive enterprises and to reduce the effect of the CO2 tax
on energy intensive industries' competitiveness.
8 Greenhouse gas(es) affected: CO2
9 Type of measure: Voluntary agreements, economic (financial)
10 Status of implementation: Implemented
11 Date for the political adoption:
12 Date for adoption of legislation, if different:
13 Date of beginning: 1993
14 Date of end, if relevant:
15 Allocated resources, if any: Subsidies (CO2 tax discount) approx. DKK 130 mill. annually (in 2004)
16 For planned measures, planned date of start (& end?):
17 For planned measures, planned allocation of resources:
18 Implementering entity or entities: Danish Energy Authority
19 Estimated effect (mill. tonnes CO2-eq.) in - 1995:
20 2001: See the Effort Analysis(1)
21 2005:
22 2010 or (2008-2012)/5: See the Effort Analysis(1)
23 2015 or (2013-2017)/5:
24 2020:
25 2025:
26 2030:
27 Reduction cost, short term - with side effects: See the Effort Analysis(1)
28 Reduction cost, short term - without side effects:
29 Reduction cost, long term - with side effects:
30 Reduction cost, long term - without side effects:
31 Methods and assumptions used for the estimation of
reduction effects and socio-economic costs:
See Chapter 5 and the Effort Analysis(1)
32 Side effects – on other GHGs or GHG emitting activities:
33 Side effects – on other air pollutants:
34 Side effects – other:
35 Interaction with other policies and measures:
36 How will the policy or measure modify longer-term trends in
anthropogenic GHG emissions and removals:
See Chapter 5 and the Effort Analysis(1)
37 Explanation, if the measure is no longer in place:
38 *Is the effect of the measure included in the ”with measures”
GHG projection) ?:
Yes. To the extent that the effect deviates from the effect in 2003 - the latest year with
energy statistics on which the energy projection is based - it is included in the projection.
39 *Is the effect of the measure included in the ”with additional
measures” GHG projection) ?:
N.a.
40 *Is effect estimated and subtracted in the ”without measures
(since 1990)" - projection ?:
41 References and links for further information: http://www.ens.dk/sw11574.asp
http://www.ens.dk/lovgivning
http://www.ens.dk/sw12329.asp
(1) See Annex B2 and http://www.mst.dk/transport/01041000.htm, where estimation of
effects relate to the revised agreement scheme from 1996.
42 Comments: (EN-18)

299Denmark's Fourth National Communication on Climate Change
BU-2 Savings activities by elec. grid, gas and district heating companies (incl. for the domestic and public sectors)
1 Sector: Energy, Business
2 Name*: Savings activities by elec. grid, gas and district heating companies (incl. for the domestic
and public sectors)
3 Origin: National measure
4 Legal basis: Electricity grid companies: The Electricity Supply Act
District heating companies: The Heating Supply Act
Gas distribution companies: The Natural Gas Supply Act
5 Domestic compliance and enforcement: Fines in the case of failures in fulfillment of the energy suppy companies' obligations
6 Description: The energy companies carry out campaigns and energy saving activities aimed at energy
consumers. A special advisory service is offered to consumers with large consumptions.
The effort is most significant with regard to electricity. The effort is financed by the
consumers via the consumers' electricity price.
7 Objective: Energy savings, reduced energy costs
8 Greenhouse gas(es) affected: CO2
9 Type of measure: Information (advice, education, campaigns), Regulation (administrative)
10 Status of implementation: Implemented
11 Date for the political adoption: 1999 og 2000 (in its present form)
12 Date for adoption of legislation, if different: 2000 og 2001
13 Date of beginning: 2001 in its present form (the electricity companies have worked with energy savings since
1992-93)
14 Date of end, if relevant:
15 Allocated resources, if any: The energy companies' information effort amount to approx. DKK 240 mill. annually
16 For planned measures, planned date of start (& end?):
17 For planned measures, planned allocation of resources:
18 Implementering entity or entities: Danish Energy Authority
19 Estimated effect (mill. tonnes CO2-eq.) in - 1995:
20 2001:
21 2005: Electricity companies: Annual electricity savings amount to approx. 150 TWh
22 2010 or (2008-2012)/5:
23 2015 or (2013-2017)/5:
24 2020:
25 2025:
26 2030:
27 Reduction cost, short term - with side effects: The CO2 shadow price of the electricity companies' information effort amount to approx.
DKK 40 per tonnes of CO2
28 Reduction cost, short term - without side effects:
29 Reduction cost, long term - with side effects:
30 Reduction cost, long term - without side effects:
31 Methods and assumptions used for the estimation of
reduction effects and socio-economic costs:
See Chapter 5
32 Side effects – on other GHGs or GHG emitting activities:
33 Side effects – on other air pollutants:
34 Side effects – other:
35 Interaction with other policies and measures:
36 How will the policy or measure modify longer-term trends in
anthropogenic GHG emissions and removals:
See Chapter 5
37 Explanation, if the measure is no longer in place:
38 *Is the effect of the measure included in the ”with measures”
GHG projection) ?:

300 Denmark's Fourth National Communication on Climate Change
BU-3 Tax on HFCs, PFCs and SF6
1 Sector: Business (the industrial gases)
2 Name*: Tax on HFCs, PFCs and SF6
3 Origin: National measure
4 Legal basis: Act no. 208 of 22 March 2001 on tax on ozone depleting substances and greenhouse
gases. Latest amendment is in Act no. 127 of 27 February 2004.
5 Domestic compliance and enforcement: Fines. The Ministry of taxation and its institutions is responsible for the enforcement of
domestic compliance.
6 Description: Tax on HFC, SF6 og PFC. The tax is differentiated in accordance with the global
warming potential of the substance with DKK 0.1 per kilogramme of CO2 equivalents as
the general principle and with DKK 400 per kilogramme of CO2 equivalents as a general
upper limit.
7 Objective: Reduction of HFCs, PFCs and SF6 emissions
8 Greenhouse gas(es) affected: HFCs, PFCs and SF6
9 Type of measure: Fiscal (tax)
10 Status of implementation: Implementedt
11 Date for the political adoption: 15 December 2000
12 Date for adoption of legislation, if different:
13 Date of beginning: 1 March 2001
14 Date of end, if relevant:
15 Allocated resources, if any:
16 For planned measures, planned date of start (& end?):
17 For planned measures, planned allocation of resources:
18 Implementering entity or entities: Ministry of taxation
19 Estimated effect (mill. tonnes CO2-eq.) in - 1995:
20 2001: -0.05 mill. tonnes CO2-eq. (a)
21 2005:
22 2010 or (2008-2012)/5: -0,4 mill. tonnes CO2-eq. (a)
23 2015 or (2013-2017)/5:
24 2020:
25 2025:
26 2030:
27 Reduction cost, short term - with side effects: In average DKK 200 per tonnes of CO2-eq. (a)
28 Reduction cost, short term - without side effects:
29 Reduction cost, long term - with side effects:
30 Reduction cost, long term - without side effects:
31 Methods and assumptions used for the estimation of
reduction effects and socio-economic costs:
See Chapter 5 and the Effort Analysis(1)
32 Side effects – on other GHGs or GHG emitting activities:
33 Side effects – on other air pollutants:
34 Side effects – other:
35 Interaction with other policies and measures:
36 How will the policy or measure modify longer-term trends in
anthropogenic GHG emissions and removals:
Reduce consumption and emissions of HFCs, PFCs and SF6 - e.g. by providing
incentives to focus on leakages of these substances from major plants or uses.
See also Chapter 5, the effort analysis(1) and the effects shown above.
37 Explanation, if the measure is no longer in place:
38 *Is the effect of the measure included in the ”with measures”
GHG projection) ?:
Yes
39 *Is the effect of the measure included in the ”with additional
measures” GHG projection) ?:
N.a.
40 *Is effect estimated and subtracted in the ”without measures
(since 1990)" - projection ?:
Yes (a)
41 References and links for further information: (1) See Annex B2 and http://www.mst.dk/transport/01041000.htm
42 Comments: (a) Reductions and costs have been estimated as the total effect of taxes on and regulation
of HFC's, PFCs and SF6.

301Denmark's Fourth National Communication on Climate Change
BU-4 Regulation of use of HFCs, PFCs and SF6 (phasing out most of the uses)
1 Sector: Business (the industrial gases)
2 Name*: Regulation of use of HFCs, PFCs and SF6 (phasing out most of the uses)
3 Origin: National measure
4 Legal basis: Statutory order no. 552 of 2 July 2002 on regulation of certain industrial greenhouse
gases.
5 Domestic compliance and enforcement: Fines and/or up to 2 years of imprisonment.
6 Description: Import, sale and use of the substances or new products containing the substances is
forbidden from 1 January 2006 with some exceptions.
7 Objective: Reduction of HFCs, PFCs and SF6 emissions
8 Greenhouse gas(es) affected: HFCs, PFCs and SF6
9 Type of measure: Regulation (administrative, ban)
10 Status of implementation: Implemented (full effect from 1 January 2006)
11 Date for the political adoption: 2 July 2002
12 Date for adoption of legislation, if different:
13 Date of beginning: In general 1 January 2006, but for some uses before
14 Date of end, if relevant:
15 Allocated resources, if any:
16 For planned measures, planned date of start (& end?):
17 For planned measures, planned allocation of resources:
18 Implementering entity or entities: Danish Environmental Protection Agency
19 Estimated effect (mill. tonnes CO2-eq.) in - 1995:
20 2001: -0.05 mill. tonnes CO2-eq. (a)
21 2005:
22 2010 or (2008-2012)/5: -0,4 mill. tonnes CO2-eq. (a)
23 2015 or (2013-2017)/5:
24 2020:
25 2025:
26 2030:
27 Reduction cost, short term - with side effects: In average DKK 200 per tonnes of CO2-eq. (a)
28 Reduction cost, short term - without side effects:
29 Reduction cost, long term - with side effects:
30 Reduction cost, long term - without side effects:
31 Methods and assumptions used for the estimation of
reduction effects and socio-economic costs:
See Chapter 5 and the Effort Analysis(1)
32 Side effects – on other GHGs or GHG emitting activities:
33 Side effects – on other air pollutants:
34 Side effects – other:
35 Interaction with other policies and measures:
36 How will the policy or measure modify longer-term trends in
anthropogenic GHG emissions and removals:
Reduce consumption and emissions of HFCs, PFCs and SF6 - e.g. by making it necessary
for users to focus on leakages of these substances from major plants or uses.
See also Chapter 5, the effort analysis(1) and the effects shown above.
37 Explanation, if the measure is no longer in place:
38 *Is the effect of the measure included in the ”with measures”
GHG projection) ?:
Yes
39 *Is the effect of the measure included in the ”with additional
measures” GHG projection) ?:
N.a.
40 *Is effect estimated and subtracted in the ”without measures
(since 1990)" - projection ?:
Yes (a)
41 References and links for further information: (1) See Annex B2 and http://www.mst.dk/transport/01041000.htm
42 Comments: (a) Reductions and costs have been estimated as the total effect of taxes on and regulation
of HFC's, PFCs and SF6.
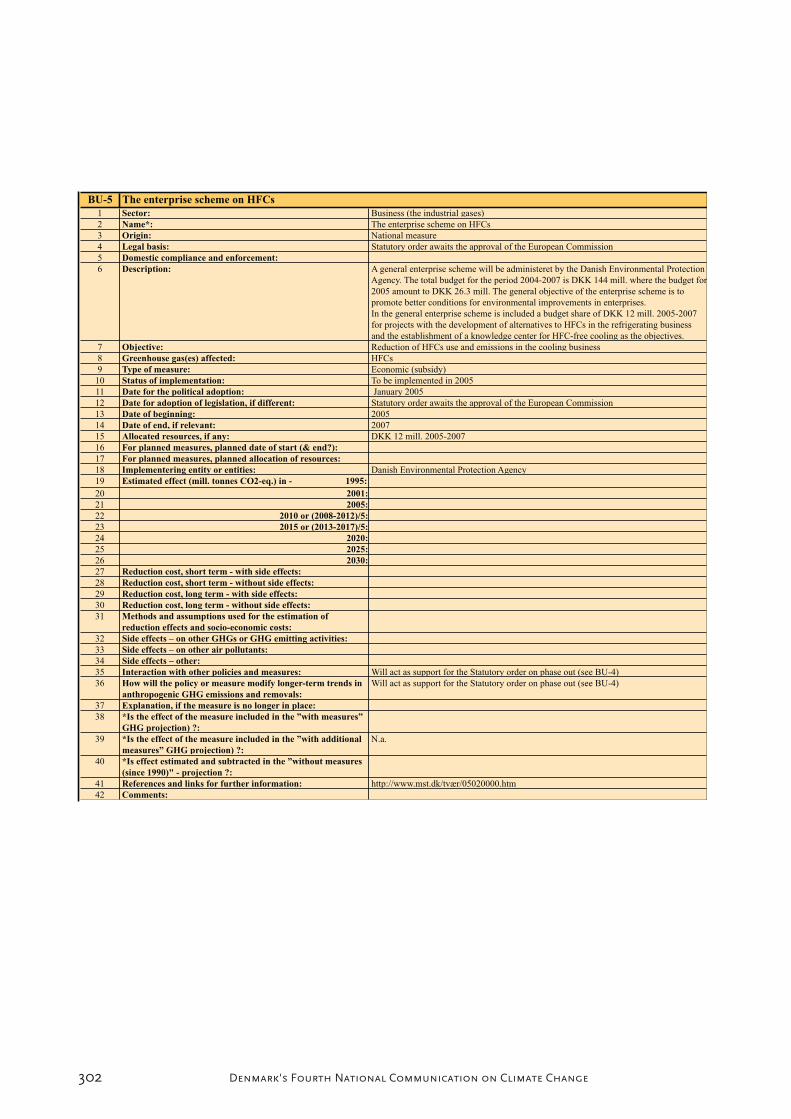
302 Denmark's Fourth National Communication on Climate Change
BU-5 The enterprise scheme on HFCs
1 Sector: Business (the industrial gases)
2 Name*: The enterprise scheme on HFCs
3 Origin: National measure
4 Legal basis: Statutory order awaits the approval of the European Commission
5 Domestic compliance and enforcement:
6 Description: A general enterprise scheme will be administeret by the Danish Environmental Protection
Agency. The total budget for the period 2004-2007 is DKK 144 mill. where the budget for
2005 amount to DKK 26.3 mill. The general objective of the enterprise scheme is to
promote better conditions for environmental improvements in enterprises.
In the general enterprise scheme is included a budget share of DKK 12 mill. 2005-2007
for projects with the development of alternatives to HFCs in the refrigerating business
and the establishment of a knowledge center for HFC-free cooling as the objectives.
7 Objective: Reduction of HFCs use and emissions in the cooling business
8 Greenhouse gas(es) affected: HFCs
9 Type of measure: Economic (subsidy)
10 Status of implementation: To be implemented in 2005
11 Date for the political adoption: January 2005
12 Date for adoption of legislation, if different: Statutory order awaits the approval of the European Commission
13 Date of beginning: 2005
14 Date of end, if relevant: 2007
15 Allocated resources, if any: DKK 12 mill. 2005-2007
16 For planned measures, planned date of start (& end?):
17 For planned measures, planned allocation of resources:
18 Implementering entity or entities: Danish Environmental Protection Agency
19 Estimated effect (mill. tonnes CO2-eq.) in - 1995:
20 2001:
21 2005:
22 2010 or (2008-2012)/5:
23 2015 or (2013-2017)/5:
24 2020:
25 2025:
26 2030:
27 Reduction cost, short term - with side effects:
28 Reduction cost, short term - without side effects:
29 Reduction cost, long term - with side effects:
30 Reduction cost, long term - without side effects:
31 Methods and assumptions used for the estimation of
reduction effects and socio-economic costs:
32 Side effects – on other GHGs or GHG emitting activities:
33 Side effects – on other air pollutants:
34 Side effects – other:
35 Interaction with other policies and measures: Will act as support for the Statutory order on phase out (see BU-4)
36 How will the policy or measure modify longer-term trends in
anthropogenic GHG emissions and removals:
Will act as support for the Statutory order on phase out (see BU-4)
37 Explanation, if the measure is no longer in place:
38 *Is the effect of the measure included in the ”with measures”
GHG projection) ?:
39 *Is the effect of the measure included in the ”with additional
measures” GHG projection) ?:
N.a.
40 *Is effect estimated and subtracted in the ”without measures
(since 1990)" - projection ?:
41 References and links for further information: http://www.mst.dk/tvær/05020000.htm
42 Comments:

303Denmark's Fourth National Communication on Climate Change
BU-6 Circular on energy-efficiency in state institutions
1 Sector: Energy, public service
2 Name*: Circular on energy-efficiency in state institutions
3 Origin: National measure
4 Legal basis: Circular no. 27 of 19 April 2005
5 Domestic compliance and enforcement: This is based on the general principle of self-governance in state institutions. According
to this each ministry and its minister is responsible for being in compliance with the
circular.
6 Description: The circular require state institutions to:
· Focus on energy efficiency in their behaviour
· Buy energy efficient products
· Oprerate state buildings in an energy efficient manner
· Report on, and make public, figures on consumption of energy and water and energy
labelling of buildings
7 Objective: To limit central authorities' consumption of energy and water through promotion of
energy efficient purchase and energy efficient behaviour in state institutions and to
operate and maintain buildings owned or rented by the state in an energy efficient manner.
8 Greenhouse gas(es) affected: CO2
9 Type of measure: Regulation (administrative)
10 Status of implementation: Implemented
11 Date for the political adoption: 19 April 2005 (Signed by the Minister for Transport and Energy)
12 Date for adoption of legislation, if different:
13 Date of beginning: 27 April 2005
14 Date of end, if relevant:
15 Allocated resources, if any:
16 For planned measures, planned date of start (& end?):
17 For planned measures, planned allocation of resources:
18 Implementering entity or entities: The Minister for Transport and Energy / The Danish Energy Authority is responsible for
the circular. The individual ministries and state institutions are responsible for the
implementation of the circular.
19 Estimated effect (mill. tonnes CO2-eq.) in - 1995:
20 2001:
21 2005:
22 2010 or (2008-2012)/5:
23 2015 or (2013-2017)/5:
24 2020:
25 2025:
26 2030:
27 Reduction cost, short term - with side effects:
28 Reduction cost, short term - without side effects:
29 Reduction cost, long term - with side effects:
30 Reduction cost, long term - without side effects:
31 Methods and assumptions used for the estimation of
reduction effects and socio-economic costs:
See Chapter 5
32 Side effects – on other GHGs or GHG emitting activities:
33 Side effects – on other air pollutants:
34 Side effects – other:
35 Interaction with other policies and measures:
36 How will the policy or measure modify longer-term trends in
anthropogenic GHG emissions and removals:
See Chapter 5
37 Explanation, if the measure is no longer in place:
38 *Is the effect of the measure included in the ”with measures”
GHG projection) ?:
It is estimated that the effect in the future will be the same as in 2003. Since 2003 is the
latest year of energy statistics on which the projection of energy consumption is based, no
additional effects have been included in the projection.
39 *Is the effect of the measure included in the ”with additional
measures” GHG projection) ?:
N.a.
40 *Is effect estimated and subtracted in the ”without measures
(since 1990)" - projection ?:
41 References and links for further information: http://www.ens.dk/lovgivning
http://www.ens.dk/sw11614.asp
http://www.ens.dk/sw23194.asp
42 Comments: (EN-20)

304 Denmark's Fourth National Communication on Climate Change
BU-7 Electricity Saving Trust – campaigns and A club to promote energy efficient appliances
1 Sector: Energi, offentlig service
2 Name*: Electricity Saving Trust – campaigns and A club to promote energy efficient appliances
3 Origin: National measure
4 Legal basis: Act no. 1209 of 27 December 1996
Act no. 819 of 3 November 1997
5 Domestic compliance and enforcement: Fine and/or pay back of unwarranted subsidy
6 Description: The task of the Electricity Saving Trust includes th promotion of efficient electric
appliances etc. and electric heating conversion in households and the public sector. The
Trust are making use of measures such as national campaigns, efforts to influence the
market, voluntary agreements and efforts to raise awareness on the consumption. The
budget is approx. DKK 90-100 mill. annually.
7 Objective: Electricity savings, technology development and market promotion of energy efficient
products and appliances.
8 Greenhouse gas(es) affected: CO2
9 Type of measure: Information (campaigns), agreements, economic (subsidies)
10 Status of implementation: Implemented
11 Date for the political adoption: 1996
12 Date for adoption of legislation, if different: 1 December 1996
13 Date of beginning: 1997
14 Date of end, if relevant:
15 Allocated resources, if any: DKK approx. 90-100 mill. annually. The Trust is financed by households and public
institutions via a special energy saving contribution on the electricity bill.
16 For planned measures, planned date of start (& end?):
17 For planned measures, planned allocation of resources: DKK approx. 90-100 mill. annually.
18 Implementering entity or entities: The Minister for Transport and Energy / The Danish Energy Authority
19 Estimated effect (mill. tonnes CO2-eq.) in - 1995:
20 2001:
21 2005: In the period 1997-2007 the annual electricity savings is expected to reach an average of
approx. 100 GWh.
22 2010 or (2008-2012)/5:
23 2015 or (2013-2017)/5:
24 2020:
25 2025:
26 2030:
27 Reduction cost, short term - with side effects: According to the Trust, the cost of the effort in the period 1997-2007 is expected to reach
an average of approx. DKK 120 per tonnes of CO2.
28 Reduction cost, short term - without side effects:
29 Reduction cost, long term - with side effects:
30 Reduction cost, long term - without side effects:
31 Methods and assumptions used for the estimation of
reduction effects and socio-economic costs:
See Chapter 5
32 Side effects – on other GHGs or GHG emitting activities:
33 Side effects – on other air pollutants:
34 Side effects – other:
35 Interaction with other policies and measures:
36 How will the policy or measure modify longer-term trends in
anthropogenic GHG emissions and removals:
See Chapter 5
37 Explanation, if the measure is no longer in place:
38 *Is the effect of the measure included in the ”with measures”
GHG projection) ?:
It is estimated that the effect in the future will be the same as in 2003. Since 2003 is the
latest year of energy statistics on which the projection of energy consumption is based, no
additional effects have been included in the projection.
39 *Is the effect of the measure included in the ”with additional
measures” GHG projection) ?:
N.a.
40 *Is effect estimated and subtracted in the ”without measures
(since 1990)" - projection ?:
41 References and links for further information: http://www.ens.dk/lovgivning
http://www.ens.dk/sw13892.asp
http://www.ens.dk/sw20018.asp
42 Comments: (EN-21)

305Denmark's Fourth National Communication on Climate Change
AF-1 Action Plan for the Aquatic Environment I+II and Action Plan for Sustainable Agriculture
1 Sector: Agriculture (/Land-use)
2 Name*: Action Plan for the Aquatic Environment I+II and Action Plan for Sustainable Agriculture
3 Origin: National measure
4 Legal basis:
5 Domestic compliance and enforcement:
6 Description: The action plans contain several measures e.g. with the objective to increase the area with
winter green fields and better utilisation of manure.
7 Objective: Reduction of nitrate pollution to the aquatic environment, i.e. reduction of N run-off from
agriculture by 100,000 tonnes N per year.
8 Greenhouse gas(es) affected: N2O
9 Type of measure: Regulation (order)
10 Status of implementation: Implemented
11 Date for the political adoption: 1991 og 1998
12 Date for adoption of legislation, if different:
13 Date of beginning:
14 Date of end, if relevant:
15 Allocated resources, if any:
16 For planned measures, planned date of start (& end?):
17 For planned measures, planned allocation of resources:
18 Implementering entity or entities: State and county authorities
19 Estimated effect (mill. tonnes CO2-eq.) in - 1995:
20 2001: -1.6 mill. tonnes CO2-eq. (a)
21 2005:
22 2010 or (2008-2012)/5: -1.9 mill. tonnes CO2-eq. (a) in (1), however this could be too low according to new
estimates: -2,2 mio.t.CO2ækv.(2)
23 2015 or (2013-2017)/5:
24 2020:
25 2025:
26 2030:
27 Reduction cost, short term - with side effects:
28 Reduction cost, short term - without side effects:
29 Reduction cost, long term - with side effects:
30 Reduction cost, long term - without side effects:
31 Methods and assumptions used for the estimation of
reduction effects and socio-economic costs:
See Chapter 5 and the Effort Analysis(1)
32 Side effects – on other GHGs or GHG emitting activities: The action plans have especially reduced emissions of N2O, but it is likely that they have
also reduced emissions of methane from storages of manure and emissions of CO2
through an increased storage of carbon in agricutural soils.
33 Side effects – on other air pollutants:
34 Side effects – other:
35 Interaction with other policies and measures:
36 How will the policy or measure modify longer-term trends in
anthropogenic GHG emissions and removals:
See Chapter 5, the effort analysis(1) and the effects shown above.
37 Explanation, if the measure is no longer in place:
38 *Is the effect of the measure included in the ”with measures”
GHG projection) ?:
Yes
39 *Is the effect of the measure included in the ”with additional
measures” GHG projection) ?:
N.a.
40 *Is effect estimated and subtracted in the ”without measures
(since 1990)" - projection ?:
Yes (a)
41 References and links for further information: Olesen et al. (2004)
(1) See Annex B2 and http://www.mst.dk/transport/01041000.htm
(2) Gyldenkærne et al. (2005) - in preparetion
42 Comments: (a) The total effect of the Action Plan for the Aquatic Environment I+II and Action Plan
for Sustainable Agriculture and the NPO Action Plan

306 Denmark's Fourth National Communication on Climate Change
AF-2 Action Plan for the Aquatic Environment III
1 Sector: Agriculture
2 Name*: Action Plan for the Aquatic Environment III
3 Origin: National measure
4 Legal basis:
5 Domestic compliance and enforcement:
6 Description: The plan contain several measures, where the most import in relation to greenhouse gas
emissions are:
· Establishment of 4000 ha wetlands in 2004 and 2005.
· Making the rules on catch crops more rigorous.
· Making the rules on exploitation of N in animal manure more rigorous.
· Additional environmentally friendly measures in crop farming.
7 Objective: Protection of the aquatic environment from nitrate and phosphorus pollution.
8 Greenhouse gas(es) affected: N2O
9 Type of measure: Regulation (order), economic
10 Status of implementation: Implemented
11 Date for the political adoption: 2004
12 Date for adoption of legislation, if different:
13 Date of beginning:
14 Date of end, if relevant:
15 Allocated resources, if any:
16 For planned measures, planned date of start (& end?):
17 For planned measures, planned allocation of resources:
18 Implementering entity or entities: State and county authorities
19 Estimated effect (mill. tonnes CO2-eq.) in - 1995:
20 2001:
21 2005:
22 2010 or (2008-2012)/5: -0,15 without taking into account the effects of catch crops / with: -0,20
23 2015 or (2013-2017)/5:
24 2020:
25 2025:
26 2030:
27 Reduction cost, short term - with side effects:
28 Reduction cost, short term - without side effects:
29 Reduction cost, long term - with side effects:
30 Reduction cost, long term - without side effects:
31 Methods and assumptions used for the estimation of
reduction effects and socio-economic costs:
See Chapter 5
32 Side effects – on other GHGs or GHG emitting activities:
33 Side effects – on other air pollutants:
34 Side effects – other:
35 Interaction with other policies and measures:
36 How will the policy or measure modify longer-term trends in
anthropogenic GHG emissions and removals:
See Chapter 5 and the effects shown above.
37 Explanation, if the measure is no longer in place:
38 *Is the effect of the measure included in the ”with measures”
GHG projection) ?:
Yes
39 *Is the effect of the measure included in the ”with additional
measures” GHG projection) ?:
N.a.
40 *Is effect estimated and subtracted in the ”without measures
(since 1990)" - projection ?:
No, implemented after 2001
41 References and links for further information: Olesen (2004)
42 Comments:

307Denmark's Fourth National Communication on Climate Change
AF-3 Ban on burning straw on fields
1 Sector: Agriculture
2 Name*: Ban on burning straw on fields
3 Origin: National measure
4 Legal basis: Act no. 68 of 24 January 1989 on environment protection as amended in Act. No. 753 of
25 August 2001
5 Domestic compliance and enforcement:
6 Description: Ban on burning straw on fields
7 Objective: Less air pollution
8 Greenhouse gas(es) affected: CO2, CH4, N2O
9 Type of measure: Regulation (order)
10 Status of implementation: Implemented
11 Date for the political adoption:
12 Date for adoption of legislation, if different:
13 Date of beginning: 1989
14 Date of end, if relevant:
15 Allocated resources, if any:
16 For planned measures, planned date of start (& end?):
17 For planned measures, planned allocation of resources:
18 Implementering entity or entities: State and county authorities
19 Estimated effect (mill. tonnes CO2-eq.) in - 1995:
20 2001:
21 2005:
22 2010 or (2008-2012)/5:
23 2015 or (2013-2017)/5:
24 2020:
25 2025:
26 2030:
27 Reduction cost, short term - with side effects:
28 Reduction cost, short term - without side effects:
29 Reduction cost, long term - with side effects:
30 Reduction cost, long term - without side effects:
31 Methods and assumptions used for the estimation of
reduction effects and socio-economic costs:
See Chapter 5
32 Side effects – on other GHGs or GHG emitting activities: CO2 emissions will be reduced both from increased return of straw in order to increase
stored soil carbon and from incresed use of straw as substitute for fossil fuel in energy
supply. Emissions of methane and nitrous oxide from burning of straw will be reduced.
However, increased decomposition of straw residues will increase emissions of nitrous
oxide to some extent.
33 Side effects – on other air pollutants:
34 Side effects – other:
35 Interaction with other policies and measures:
36 How will the policy or measure modify longer-term trends in
anthropogenic GHG emissions and removals:
See Chapter 5
37 Explanation, if the measure is no longer in place:
38 *Is the effect of the measure included in the ”with measures”
GHG projection) ?:
39 *Is the effect of the measure included in the ”with additional
measures” GHG projection) ?:
N.a.
40 *Is effect estimated and subtracted in the ”without measures
(since 1990)" - projection ?:
No
41 References and links for further information:
42 Comments:

308 Denmark's Fourth National Communication on Climate Change
AF-4a Ammonia action plan and the new statutory order on manure: Optimisation of manure handling during housing.
1 Sector: Agriculture (/Land-use)
2 Name*: Ammonia action plan and the new statutory order on manure: Optimisation of manure
handling during housing.
3 Origin: National measure
4 Legal basis: Statutory order no. 753 of 25 August 2001 on fur animal farms
Statutory order no. 604 of 15 July 2002 on professional animal farming, manure and
slurry etc.
5 Domestic compliance and enforcement: Fines and/or up to 2 years of imprisonment
6 Description: Ammonia action plan and the new statutory order on manure: Optimisation of manure
handling during housing for cattle, pigs, poultry and fur animals e.g. cleaning in fur
animal houses at least once a week and a maximum time of 6 hours from field application
of manure to incorporation and cover requirements etc..
7 Objective: Protection of the aquatic environment from nitrate pollution.
8 Greenhouse gas(es) affected: N2O
9 Type of measure: Regulation (order)
10 Status of implementation: Implemented
11 Date for the political adoption:
12 Date for adoption of legislation, if different:
13 Date of beginning: Cleaning: 1 August 2002 - 1 August 2007
Storage: See the data sheet on AF-4b
Spreading: See the data sheet on AF-4c.
14 Date of end, if relevant:
15 Allocated resources, if any:
16 For planned measures, planned date of start (& end?):
17 For planned measures, planned allocation of resources:
18 Implementering entity or entities: State and county authorities
19 Estimated effect (mill. tonnes CO2-eq.) in - 1995:
20 2001:
21 2005:
22 2010 or (2008-2012)/5: -0,03 (a)
23 2015 or (2013-2017)/5:
24 2020:
25 2025:
26 2030:
27 Reduction cost, short term - with side effects:
28 Reduction cost, short term - without side effects:
29 Reduction cost, long term - with side effects:
30 Reduction cost, long term - without side effects:
31 Methods and assumptions used for the estimation of
reduction effects and socio-economic costs:
See Chapter 5
32 Side effects – on other GHGs or GHG emitting activities:
33 Side effects – on other air pollutants:
34 Side effects – other:
35 Interaction with other policies and measures: An element in the Ammonia Action Plan.
36 How will the policy or measure modify longer-term trends in
anthropogenic GHG emissions and removals:
See Chapter 5 and the effects shown above.
37 Explanation, if the measure is no longer in place:
38 *Is the effect of the measure included in the ”with measures”
GHG projection) ?:
Yes
39 *Is the effect of the measure included in the ”with additional
measures” GHG projection) ?:
N.a.
40 *Is effect estimated and subtracted in the ”without measures
(since 1990)" - projection ?:
No, implemented after 2001
41 References and links for further information:
42 Comments: (a) The total effect of the Ammonia Action Plan (Ban on spreading, cover on manure,
reduced storage time, ban on ammonia treatment of straw)
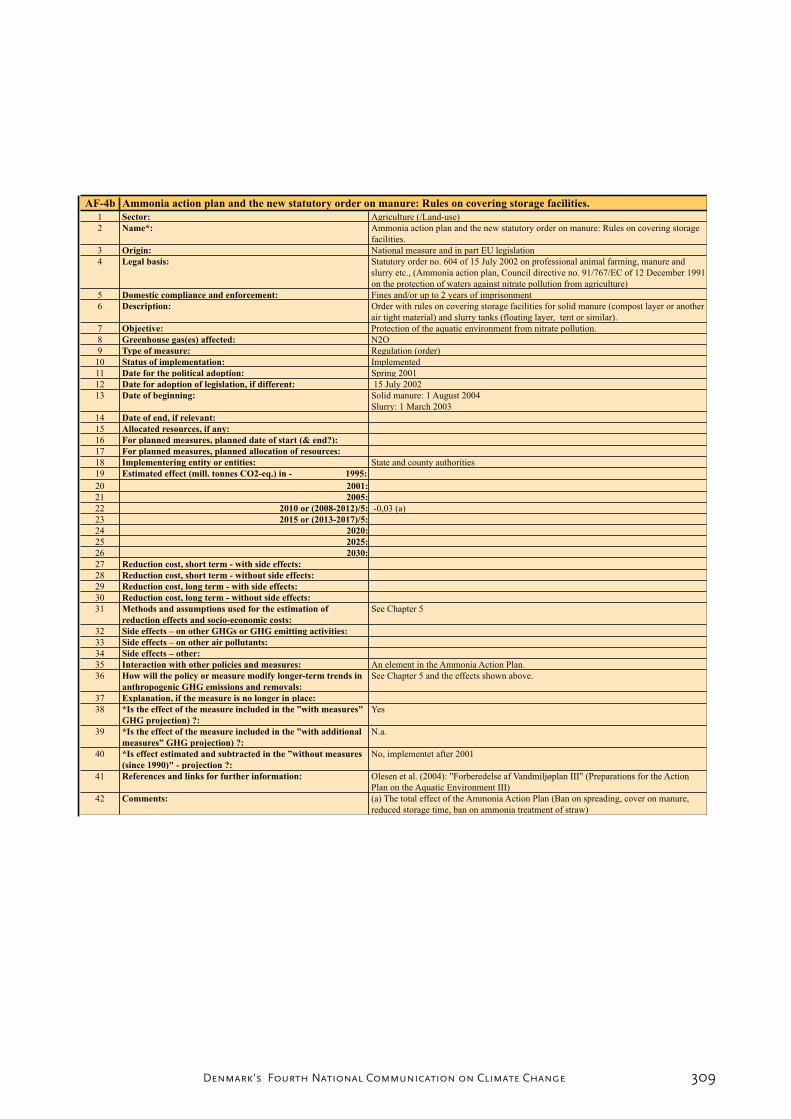
309Denmark's Fourth National Communication on Climate Change
AF-4b Ammonia action plan and the new statutory order on manure: Rules on covering storage facilities.
1 Sector: Agriculture (/Land-use)
2 Name*: Ammonia action plan and the new statutory order on manure: Rules on covering storage
facilities.
3 Origin: National measure and in part EU legislation
4 Legal basis: Statutory order no. 604 of 15 July 2002 on professional animal farming, manure and
slurry etc., (Ammonia action plan, Council directive no. 91/767/EC of 12 December 1991
on the protection of waters against nitrate pollution from agriculture)
5 Domestic compliance and enforcement: Fines and/or up to 2 years of imprisonment
6 Description: Order with rules on covering storage facilities for solid manure (compost layer or another
air tight material) and slurry tanks (floating layer, tent or similar).
7 Objective: Protection of the aquatic environment from nitrate pollution.
8 Greenhouse gas(es) affected: N2O
9 Type of measure: Regulation (order)
10 Status of implementation: Implemented
11 Date for the political adoption: Spring 2001
12 Date for adoption of legislation, if different: 15 July 2002
13 Date of beginning: Solid manure: 1 August 2004
Slurry: 1 March 2003
14 Date of end, if relevant:
15 Allocated resources, if any:
16 For planned measures, planned date of start (& end?):
17 For planned measures, planned allocation of resources:
18 Implementering entity or entities: State and county authorities
19 Estimated effect (mill. tonnes CO2-eq.) in - 1995:
20 2001:
21 2005:
22 2010 or (2008-2012)/5: -0,03 (a)
23 2015 or (2013-2017)/5:
24 2020:
25 2025:
26 2030:
27 Reduction cost, short term - with side effects:
28 Reduction cost, short term - without side effects:
29 Reduction cost, long term - with side effects:
30 Reduction cost, long term - without side effects:
31 Methods and assumptions used for the estimation of
reduction effects and socio-economic costs:
See Chapter 5
32 Side effects – on other GHGs or GHG emitting activities:
33 Side effects – on other air pollutants:
34 Side effects – other:
35 Interaction with other policies and measures: An element in the Ammonia Action Plan.
36 How will the policy or measure modify longer-term trends in
anthropogenic GHG emissions and removals:
See Chapter 5 and the effects shown above.
37 Explanation, if the measure is no longer in place:
38 *Is the effect of the measure included in the ”with measures”
GHG projection) ?:
Yes
39 *Is the effect of the measure included in the ”with additional
measures” GHG projection) ?:
N.a.
40 *Is effect estimated and subtracted in the ”without measures
(since 1990)" - projection ?:
No, implementet after 2001
41 References and links for further information: Olesen et al. (2004): "Forberedelse af Vandmiljøplan III" (Preparations for the Action
Plan on the Aquatic Environment III)
42 Comments: (a) The total effect of the Ammonia Action Plan (Ban on spreading, cover on manure,
reduced storage time, ban on ammonia treatment of straw)
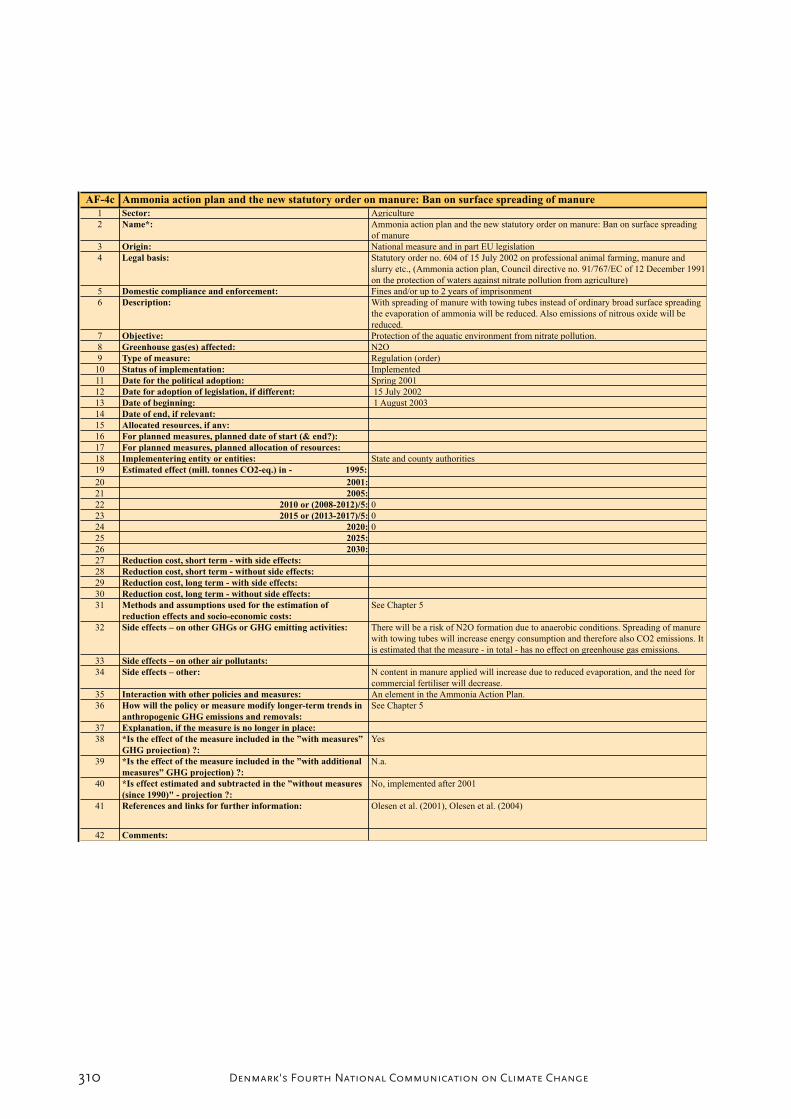
310 Denmark's Fourth National Communication on Climate Change
AF-4c Ammonia action plan and the new statutory order on manure: Ban on surface spreading of manure
1 Sector: Agriculture
2 Name*: Ammonia action plan and the new statutory order on manure: Ban on surface spreading
of manure
3 Origin: National measure and in part EU legislation
4 Legal basis: Statutory order no. 604 of 15 July 2002 on professional animal farming, manure and
slurry etc., (Ammonia action plan, Council directive no. 91/767/EC of 12 December 1991
on the protection of waters against nitrate pollution from agriculture)
5 Domestic compliance and enforcement: Fines and/or up to 2 years of imprisonment
6 Description: With spreading of manure with towing tubes instead of ordinary broad surface spreading
the evaporation of ammonia will be reduced. Also emissions of nitrous oxide will be
reduced.
7 Objective: Protection of the aquatic environment from nitrate pollution.
8 Greenhouse gas(es) affected: N2O
9 Type of measure: Regulation (order)
10 Status of implementation: Implemented
11 Date for the political adoption: Spring 2001
12 Date for adoption of legislation, if different: 15 July 2002
13 Date of beginning: 1 August 2003
14 Date of end, if relevant:
15 Allocated resources, if any:
16 For planned measures, planned date of start (& end?):
17 For planned measures, planned allocation of resources:
18 Implementering entity or entities: State and county authorities
19 Estimated effect (mill. tonnes CO2-eq.) in - 1995:
20 2001:
21 2005:
22 2010 or (2008-2012)/5: 0
23 2015 or (2013-2017)/5: 0
24 2020: 0
25 2025:
26 2030:
27 Reduction cost, short term - with side effects:
28 Reduction cost, short term - without side effects:
29 Reduction cost, long term - with side effects:
30 Reduction cost, long term - without side effects:
31 Methods and assumptions used for the estimation of
reduction effects and socio-economic costs:
See Chapter 5
32 Side effects – on other GHGs or GHG emitting activities: There will be a risk of N2O formation due to anaerobic conditions. Spreading of manure
with towing tubes will increase energy consumption and therefore also CO2 emissions. It
is estimated that the measure - in total - has no effect on greenhouse gas emissions.
33 Side effects – on other air pollutants:
34 Side effects – other: N content in manure applied will increase due to reduced evaporation, and the need for
commercial fertiliser will decrease.
35 Interaction with other policies and measures: An element in the Ammonia Action Plan.
36 How will the policy or measure modify longer-term trends in
anthropogenic GHG emissions and removals:
See Chapter 5
37 Explanation, if the measure is no longer in place:
38 *Is the effect of the measure included in the ”with measures”
GHG projection) ?:
Yes
39 *Is the effect of the measure included in the ”with additional
measures” GHG projection) ?:
N.a.
40 *Is effect estimated and subtracted in the ”without measures
(since 1990)" - projection ?:
No, implemented after 2001
41 References and links for further information: Olesen et al. (2001), Olesen et al. (2004)
42 Comments:
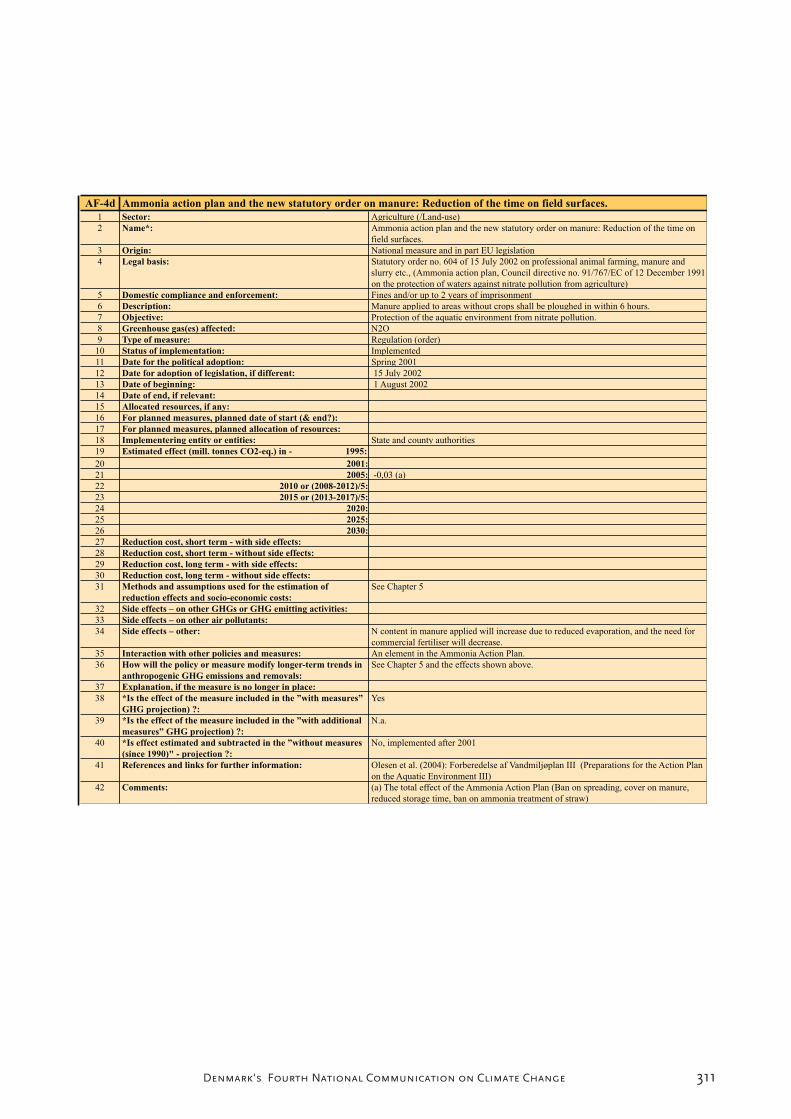
311Denmark's Fourth National Communication on Climate Change
AF-4d Ammonia action plan and the new statutory order on manure: Reduction of the time on field surfaces.
1 Sector: Agriculture (/Land-use)
2 Name*: Ammonia action plan and the new statutory order on manure: Reduction of the time on
field surfaces.
3 Origin: National measure and in part EU legislation
4 Legal basis: Statutory order no. 604 of 15 July 2002 on professional animal farming, manure and
slurry etc., (Ammonia action plan, Council directive no. 91/767/EC of 12 December 1991
on the protection of waters against nitrate pollution from agriculture)
5 Domestic compliance and enforcement: Fines and/or up to 2 years of imprisonment
6 Description: Manure applied to areas without crops shall be ploughed in within 6 hours.
7 Objective: Protection of the aquatic environment from nitrate pollution.
8 Greenhouse gas(es) affected: N2O
9 Type of measure: Regulation (order)
10 Status of implementation: Implemented
11 Date for the political adoption: Spring 2001
12 Date for adoption of legislation, if different: 15 July 2002
13 Date of beginning: 1 August 2002
14 Date of end, if relevant:
15 Allocated resources, if any:
16 For planned measures, planned date of start (& end?):
17 For planned measures, planned allocation of resources:
18 Implementering entity or entities: State and county authorities
19 Estimated effect (mill. tonnes CO2-eq.) in - 1995:
20 2001:
21 2005: -0,03 (a)
22 2010 or (2008-2012)/5:
23 2015 or (2013-2017)/5:
24 2020:
25 2025:
26 2030:
27 Reduction cost, short term - with side effects:
28 Reduction cost, short term - without side effects:
29 Reduction cost, long term - with side effects:
30 Reduction cost, long term - without side effects:
31 Methods and assumptions used for the estimation of
reduction effects and socio-economic costs:
See Chapter 5
32 Side effects – on other GHGs or GHG emitting activities:
33 Side effects – on other air pollutants:
34 Side effects – other: N content in manure applied will increase due to reduced evaporation, and the need for
commercial fertiliser will decrease.
35 Interaction with other policies and measures: An element in the Ammonia Action Plan.
36 How will the policy or measure modify longer-term trends in
anthropogenic GHG emissions and removals:
See Chapter 5 and the effects shown above.
37 Explanation, if the measure is no longer in place:
38 *Is the effect of the measure included in the ”with measures”
GHG projection) ?:
Yes
39 *Is the effect of the measure included in the ”with additional
measures” GHG projection) ?:
N.a.
40 *Is effect estimated and subtracted in the ”without measures
(since 1990)" - projection ?:
No, implemented after 2001
41 References and links for further information: Olesen et al. (2004): Forberedelse af Vandmiljøplan III (Preparations for the Action Plan
on the Aquatic Environment III)
42 Comments: (a) The total effect of the Ammonia Action Plan (Ban on spreading, cover on manure,
reduced storage time, ban on ammonia treatment of straw)

312 Denmark's Fourth National Communication on Climate Change
AF-4e Ammonia action plan and the new statutory order on manure: Ban on ammonia treatment of straw.
1 Sector: Agriculture (/Land-use)
2 Name*: Ammonia action plan and the new statutory order on manure: Ban on ammonia treatment
of straw.
3 Origin: National measure and in part EU legislation
4 Legal basis: Statutory order no. 604 of 15 July 2002 on professional animal farming, manure and
slurry etc., (Ammonia action plan, Council directive no. 91/767/EC of 12 December 1991
on the protection of waters against nitrate pollution from agriculture)
5 Domestic compliance and enforcement: Fines and/or up to 2 years of imprisonment
6 Description: Ban on ammonia treatment of straw.
7 Objective: Protection of the aquatic environment from nitrate pollution.
8 Greenhouse gas(es) affected: N2O
9 Type of measure: Regulation (order)
10 Status of implementation: Implemented
11 Date for the political adoption: Spring 2001
12 Date for adoption of legislation, if different: 15 July 2002
13 Date of beginning: 1 August 2002
14 Date of end, if relevant:
15 Allocated resources, if any:
16 For planned measures, planned date of start (& end?):
17 For planned measures, planned allocation of resources:
18 Implementering entity or entities: State and county authorities
19 Estimated effect (mill. tonnes CO2-eq.) in - 1995:
20 2001:
21 2005: -0,03 (a)
22 2010 or (2008-2012)/5:
23 2015 or (2013-2017)/5:
24 2020:
25 2025:
26 2030:
27 Reduction cost, short term - with side effects:
28 Reduction cost, short term - without side effects:
29 Reduction cost, long term - with side effects:
30 Reduction cost, long term - without side effects:
31 Methods and assumptions used for the estimation of
reduction effects and socio-economic costs:
See Chapter 5
32 Side effects – on other GHGs or GHG emitting activities:
33 Side effects – on other air pollutants:
34 Side effects – other:
35 Interaction with other policies and measures: An element in the Ammonia Action Plan.
36 How will the policy or measure modify longer-term trends in
anthropogenic GHG emissions and removals:
See Chapter 5 and the effects shown above.
37 Explanation, if the measure is no longer in place:
38 *Is the effect of the measure included in the ”with measures”
GHG projection) ?:
Yes
39 *Is the effect of the measure included in the ”with additional
measures” GHG projection) ?:
N.a.
40 *Is effect estimated and subtracted in the ”without measures
(since 1990)" - projection ?:
No, implemented after 2001
41 References and links for further information: Olesen et al. (2004): Forberedelse af Vandmiljøplan III (Preparations for the Action Plan
on the Aquatic Environment III)
42 Comments: (a) The total effect of the Ammonia Action Plan (Ban on spreading, cover on manure,
reduced storage time, ban on ammonia treatment of straw)

313Denmark's Fourth National Communication on Climate Change
AF-5 Planting of windbreaks
1 Sector: Agriculture
2 Name*: Planting of windbreaks
3 Origin: National measure
4 Legal basis:
5 Domestic compliance and enforcement:
6 Description:
7 Objective: Binding of CO2
8 Greenhouse gas(es) affected: CO2
9 Type of measure: Economic (subsidies)
10 Status of implementation: Implemented
11 Date for the political adoption:
12 Date for adoption of legislation, if different:
13 Date of beginning: 1960s
14 Date of end, if relevant:
15 Allocated resources, if any:
16 For planned measures, planned date of start (& end?):
17 For planned measures, planned allocation of resources:
18 Implementering entity or entities: State
19 Estimated effect (mill. tonnes CO2-eq.) in - 1995:
20 2001:
21 2005:
22 2010 or (2008-2012)/5: 0,14
23 2015 or (2013-2017)/5:
24 2020:
25 2025:
26 2030:
27 Reduction cost, short term - with side effects:
28 Reduction cost, short term - without side effects:
29 Reduction cost, long term - with side effects:
30 Reduction cost, long term - without side effects:
31 Methods and assumptions used for the estimation of
reduction effects and socio-economic costs:
See Chapter 5
32 Side effects – on other GHGs or GHG emitting activities:
33 Side effects – on other air pollutants:
34 Side effects – other:
35 Interaction with other policies and measures:
36 How will the policy or measure modify longer-term trends in
anthropogenic GHG emissions and removals:
See Chapter 5 and the effects shown above.
37 Explanation, if the measure is no longer in place:
38 *Is the effect of the measure included in the ”with measures”
GHG projection) ?:
39 *Is the effect of the measure included in the ”with additional
measures” GHG projection) ?:
N.a.
40 *Is effect estimated and subtracted in the ”without measures
(since 1990)" - projection ?:
41 References and links for further information:
42 Comments:
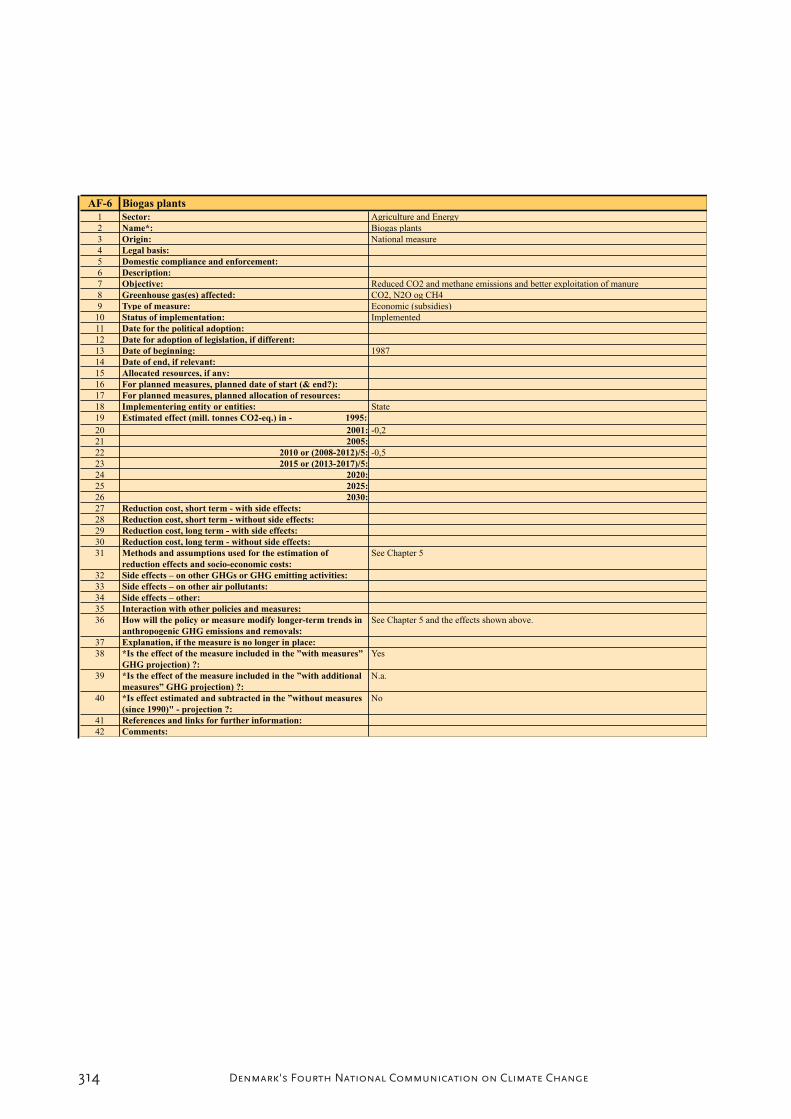
314 Denmark's Fourth National Communication on Climate Change
AF-6 Biogas plants
1 Sector: Agriculture and Energy
2 Name*: Biogas plants
3 Origin: National measure
4 Legal basis:
5 Domestic compliance and enforcement:
6 Description:
7 Objective: Reduced CO2 and methane emissions and better exploitation of manure
8 Greenhouse gas(es) affected: CO2, N2O og CH4
9 Type of measure: Economic (subsidies)
10 Status of implementation: Implemented
11 Date for the political adoption:
12 Date for adoption of legislation, if different:
13 Date of beginning: 1987
14 Date of end, if relevant:
15 Allocated resources, if any:
16 For planned measures, planned date of start (& end?):
17 For planned measures, planned allocation of resources:
18 Implementering entity or entities: State
19 Estimated effect (mill. tonnes CO2-eq.) in - 1995:
20 2001: -0,2
21 2005:
22 2010 or (2008-2012)/5: -0,5
23 2015 or (2013-2017)/5:
24 2020:
25 2025:
26 2030:
27 Reduction cost, short term - with side effects:
28 Reduction cost, short term - without side effects:
29 Reduction cost, long term - with side effects:
30 Reduction cost, long term - without side effects:
31 Methods and assumptions used for the estimation of
reduction effects and socio-economic costs:
See Chapter 5
32 Side effects – on other GHGs or GHG emitting activities:
33 Side effects – on other air pollutants:
34 Side effects – other:
35 Interaction with other policies and measures:
36 How will the policy or measure modify longer-term trends in
anthropogenic GHG emissions and removals:
See Chapter 5 and the effects shown above.
37 Explanation, if the measure is no longer in place:
38 *Is the effect of the measure included in the ”with measures”
GHG projection) ?:
Yes
39 *Is the effect of the measure included in the ”with additional
measures” GHG projection) ?:
N.a.
40 *Is effect estimated and subtracted in the ”without measures
(since 1990)" - projection ?:
No
41 References and links for further information:
42 Comments:

315Denmark's Fourth National Communication on Climate Change
AF-7 Subsidies scheme for private afforestation on agricultural land (increase the forest area in Denmark)
1 Sector: Forstry / Land-use
2 Name*: Subsidies scheme for private afforestation on agricultural land (increase the forest area in
Denmark)
3 Origin: National measure and in part EU legislation
4 Legal basis: Act no. 959 of 2 November 1996
Statutory Order no. 80 of 30 January 1997 on subsidies for private afforestation
Council resolution no. 1257/1999, Chapter 8.
5 Domestic compliance and enforcement: Approved subsidies may be canceled in part or totally. Pay back of subsidies already
payed can be required with interests. Fines is also possible in servere cases.
6 Description: Private owners of agricultural land can get grants for establishment of broadleaves or
conifer forests, nursing of these in the first 5 years, establishment of fences, mapping and
or accounting of the area as well as income compensation in the first 10 years - if the
forest will be established in an area planned for afforestation.
7 Objective: Promote private afforestation in achieving the target of an increse in forest area by
450,000-500,000 ha in 100 years.
8 Greenhouse gas(es) affected: CO2
9 Type of measure: Economic (subsidies)
10 Status of implementation: Implemented
11 Date for the political adoption: 30 January 1997
12 Date for adoption of legislation, if different:
13 Date of beginning: 8 February 1997
14 Date of end, if relevant:
15 Allocated resources, if any:
16 For planned measures, planned date of start (& end?):
17 For planned measures, planned allocation of resources:
18 Implementering entity or entities: Danish Forest and Nature Agency
19 Estimated effect (mill. tonnes CO2-eq.) in - 1995:
20 2001: -0.074 (a)
21 2005:
22 2010 or (2008-2012)/5: -0,262 (a)
23 2015 or (2013-2017)/5:
24 2020:
25 2025:
26 2030:
27 Reduction cost, short term - with side effects:
28 Reduction cost, short term - without side effects:
29 Reduction cost, long term - with side effects:
30 Reduction cost, long term - without side effects:
31 Methods and assumptions used for the estimation of
reduction effects and socio-economic costs:
See Chapter 5
32 Side effects – on other GHGs or GHG emitting activities:
33 Side effects – on other air pollutants:
34 Side effects – other:
35 Interaction with other policies and measures:
36 How will the policy or measure modify longer-term trends in
anthropogenic GHG emissions and removals:
See Chapter 5 and the effects shown above.
37 Explanation, if the measure is no longer in place:
38 *Is the effect of the measure included in the ”with measures”
GHG projection) ?:
Yes
39 *Is the effect of the measure included in the ”with additional
measures” GHG projection) ?:
N.a.
40 *Is effect estimated and subtracted in the ”without measures
(since 1990)" - projection ?:
41 References and links for further information:
42 Comments: (a) Total effect of private afforestation and the planned public afforestation.

316 Denmark's Fourth National Communication on Climate Change
AF-8 Public afforestation (state, counties and municipalities)
1 Sector: Forstry / Land-use
2 Name*: Public afforestation (state, counties and municipalities)
3 Origin: National measure
4 Legal basis:
5 Domestic compliance and enforcement:
6 Description:
7 Objective: Public afforestation in achieving the target of an increse in forest area by 450,000-
500,000 ha in 100 years for purposes such as outdoor recreation, groundwater protection
and CO2 sequestration.
8 Greenhouse gas(es) affected: CO2
9 Type of measure: State: Regulation (adopted target, with financial support through the annual state budget)
/ Counties and Municipalities: Voluntary agreements
10 Status of implementation: Ongoring implementation through annual budgets
11 Date for the political adoption:
12 Date for adoption of legislation, if different:
13 Date of beginning:
14 Date of end, if relevant:
15 Allocated resources, if any:
16 For planned measures, planned date of start (& end?):
17 For planned measures, planned allocation of resources:
18 Implementering entity or entities: Danish Forest and Nature Agency, counties and municipalities
19 Estimated effect (mill. tonnes CO2-eq.) in - 1995:
20 2001: -0,074 (a)
21 2005:
22 2010 or (2008-2012)/5: -0,262 (a)
23 2015 or (2013-2017)/5:
24 2020:
25 2025:
26 2030:
27 Reduction cost, short term - with side effects:
28 Reduction cost, short term - without side effects:
29 Reduction cost, long term - with side effects:
30 Reduction cost, long term - without side effects:
31 Methods and assumptions used for the estimation of
reduction effects and socio-economic costs:
See Chapter 5
32 Side effects – on other GHGs or GHG emitting activities:
33 Side effects – on other air pollutants:
34 Side effects – other:
35 Interaction with other policies and measures:
36 How will the policy or measure modify longer-term trends in
anthropogenic GHG emissions and removals:
See Chapter 5 and the effects shown above.
37 Explanation, if the measure is no longer in place:
38 *Is the effect of the measure included in the ”with measures”
GHG projection) ?:
39 *Is the effect of the measure included in the ”with additional
measures” GHG projection) ?:
N.a.
40 *Is effect estimated and subtracted in the ”without measures
(since 1990)" - projection ?:
41 References and links for further information:
42 Comments: (a) Total effect of private afforestation and the planned public afforestation.

317Denmark's Fourth National Communication on Climate Change
DO-1 Energy labelling of small and large buildings (incl. public sector and business)
1 Sector: Energy, Domestic sector
2 Name*: Energy labelling of small and large buildings (incl. public sector and business)
3 Origin: National measure
4 Legal basis: Act no. 485 of 12 June 1996 on promotion of energy and water savings in buildings
5 Domestic compliance and enforcement: Fines in the case of missing or inadequate labelling
6 Description: Sales of small buildnings (under 1500 m2 ) shall be accompanied with energy labels
recommending the buyer how to achieve cost effective energy saving measures. The
requirement for larger buildings is the establishment of an energy management plan
containing an annual review of the building and its energy consumption and potential
energy savings.
7 Objective: Promotion of energy savings.
8 Greenhouse gas(es) affected: CO2
9 Type of measure: Information, Regulation (administrative, order)
10 Status of implementation: Implemented. The act is under revision in order to implement the EU building directive.
11 Date for the political adoption: 12 June 1996
12 Date for adoption of legislation, if different:
13 Date of beginning: 1 January 1997
14 Date of end, if relevant:
15 Allocated resources, if any: Financed by the users
16 For planned measures, planned date of start (& end?):
17 For planned measures, planned allocation of resources:
18 Implementering entity or entities: Danish Energy Authority
19 Estimated effect (mill. tonnes CO2-eq.) in - 1995:
20 2001: See the Effort Analysis(1)
21 2005:
22 2010 or (2008-2012)/5: See the Effort Analysis(1)
23 2015 or (2013-2017)/5:
24 2020:
25 2025:
26 2030:
27 Reduction cost, short term - with side effects: See the Effort Analysis(1)
28 Reduction cost, short term - without side effects:
29 Reduction cost, long term - with side effects:
30 Reduction cost, long term - without side effects:
31 Methods and assumptions used for the estimation of
reduction effects and socio-economic costs:
See Chapter 5 and the Effort Analysis(1)
32 Side effects – on other GHGs or GHG emitting activities:
33 Side effects – on other air pollutants:
34 Side effects – other:
35 Interaction with other policies and measures:
36 How will the policy or measure modify longer-term trends in
anthropogenic GHG emissions and removals:
See Chapter 5 and the Effort Analysis(1)
37 Explanation, if the measure is no longer in place:
38 *Is the effect of the measure included in the ”with measures”
GHG projection) ?:
It is estimated that the effect in the future will be the same as in 2003. Since 2003 is the
latest year of energy statistics on which the projection of energy consumption is based, no
additional effects have been included in the projection.
39 *Is the effect of the measure included in the ”with additional
measures” GHG projection) ?:
N.a.
40 *Is effect estimated and subtracted in the ”without measures
(since 1990)" - projection ?:
Yes
41 References and links for further information: http://www.ens.dk/lovgivning
http://www.ens.dk/sw13867.asp
http://www.ens.dk/sw13289.asp
(1) See Annex B2 and http://www.mst.dk/transport/01041000.htm
42 Comments: (EN-22)
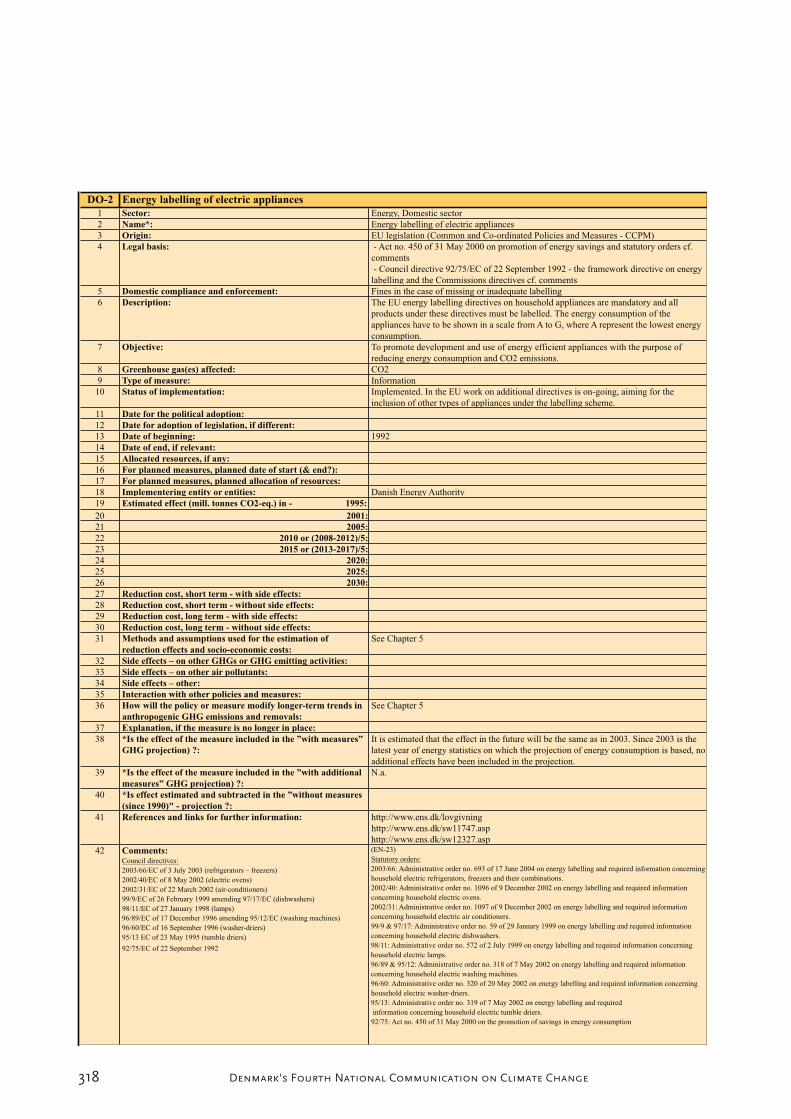
318 Denmark's Fourth National Communication on Climate Change
DO-2 Energy labelling of electric appliances
1 Sector: Energy, Domestic sector
2 Name*: Energy labelling of electric appliances
3 Origin: EU legislation (Common and Co-ordinated Policies and Measures - CCPM)
4 Legal basis: - Act no. 450 of 31 May 2000 on promotion of energy savings and statutory orders cf.
comments
- Council directive 92/75/EC of 22 September 1992 - the framework directive on energy
labelling and the Commissions directives cf. comments
5 Domestic compliance and enforcement: Fines in the case of missing or inadequate labelling
6 Description: The EU energy labelling directives on household appliances are mandatory and all
products under these directives must be labelled. The energy consumption of the
appliances have to be shown in a scale from A to G, where A represent the lowest energy
consumption.
7 Objective: To promote development and use of energy efficient appliances with the purpose of
reducing energy consumption and CO2 emissions.
8 Greenhouse gas(es) affected: CO2
9 Type of measure: Information
10 Status of implementation: Implemented. In the EU work on additional directives is on-going, aiming for the
inclusion of other types of appliances under the labelling scheme.
11 Date for the political adoption:
12 Date for adoption of legislation, if different:
13 Date of beginning: 1992
14 Date of end, if relevant:
15 Allocated resources, if any:
16 For planned measures, planned date of start (& end?):
17 For planned measures, planned allocation of resources:
18 Implementering entity or entities: Danish Energy Authority
19 Estimated effect (mill. tonnes CO2-eq.) in - 1995:
20 2001:
21 2005:
22 2010 or (2008-2012)/5:
23 2015 or (2013-2017)/5:
24 2020:
25 2025:
26 2030:
27 Reduction cost, short term - with side effects:
28 Reduction cost, short term - without side effects:
29 Reduction cost, long term - with side effects:
30 Reduction cost, long term - without side effects:
31 Methods and assumptions used for the estimation of
reduction effects and socio-economic costs:
See Chapter 5
32 Side effects – on other GHGs or GHG emitting activities:
33 Side effects – on other air pollutants:
34 Side effects – other:
35 Interaction with other policies and measures:
36 How will the policy or measure modify longer-term trends in
anthropogenic GHG emissions and removals:
See Chapter 5
37 Explanation, if the measure is no longer in place:
38 *Is the effect of the measure included in the ”with measures”
GHG projection) ?:
It is estimated that the effect in the future will be the same as in 2003. Since 2003 is the
latest year of energy statistics on which the projection of energy consumption is based, no
additional effects have been included in the projection.
39 *Is the effect of the measure included in the ”with additional
measures” GHG projection) ?:
N.a.
40 *Is effect estimated and subtracted in the ”without measures
(since 1990)" - projection ?:
41 References and links for further information: http://www.ens.dk/lovgivning
http://www.ens.dk/sw11747.asp
http://www.ens.dk/sw12327.asp
42 Comments:Council directives:
2003/66/EC of 3 July 2003 (refrigerators – freezers)
2002/40/EC of 8 May 2002 (electric ovens)
2002/31/EC of 22 March 2002 (air-conditioners)
99/9/EC of 26 February 1999 amending 97/17/EC (dishwashers)
98/11/EC of 27 January 1998 (lamps)
96/89/EC of 17 December 1996 amending 95/12/EC (washing machines)
96/60/EC of 16 September 1996 (washer-driers)
95/13 EC of 23 May 1995 (tumble driers)
92/75/EC of 22 September 1992
(EN-23)
Statutory orders:
2003/66: Administrative order no. 693 of 17 June 2004 on energy labelling and required information concerning
household electric refrigerators, freezers and their combinations.
2002/40: Administrative order no. 1096 of 9 December 2002 on energy labelling and required information
concerning household electric ovens.
2002/31: Administrative order no. 1097 of 9 December 2002 on energy labelling and required information
concerning household electric air conditioners.
99/9 & 97/17: Administrative order no. 59 of 29 January 1999 on energy labelling and required information
concerning household electric dishwashers.
98/11: Administrative order no. 572 of 2 July 1999 on energy labelling and required information concerning
household electric lamps.
96/89 & 95/12: Administrative order no. 318 of 7 May 2002 on energy labelling and required information
concerning household electric washing machines.
96/60: Administrative order no. 320 of 20 May 2002 on energy labelling and required information concerning
household electric washer-driers.
95/13: Administrative order no. 319 of 7 May 2002 on energy labelling and required
information concerning household electric tumble driers.
92/75: Act no. 450 of 31 May 2000 on the promotion of savings in energy consumption

319Denmark's Fourth National Communication on Climate Change
WA-1 Obligation to send combustible waste to incineration (in practice a ban on landfilling).
1 Sector: Waste
2 Name*: Obligation to send combustible waste to incineration (in practice a ban on landfilling).
3 Origin: National measure
4 Legal basis: Statutory order no. 581 of 24 june 1996 om waste as amended in statutory order no. 619
of 27 June 2000 on waste.
5 Domestic compliance and enforcement: Fines and/or up to 2 years of imprisonment.
6 Description:
7 Objective: Reduce landfilling, energy production, greater recycling, CH4 reduction
8 Greenhouse gas(es) affected: CH4 (methane)
9 Type of measure: Regulation (administative)
10 Status of implementation: Implemented
11 Date for the political adoption: 1994
12 Date for adoption of legislation, if different:
13 Date of beginning: 1 January 1997
14 Date of end, if relevant:
15 Allocated resources, if any:
16 For planned measures, planned date of start (& end?):
17 For planned measures, planned allocation of resources:
18 Implementering entity or entities: Municipalities
19 Estimated effect (mill. tonnes CO2-eq.) in - 1995:
20 2001: 0,021
21 2005:
22 2010 or (2008-2012)/5: 0,333
23 2015 or (2013-2017)/5:
24 2020:
25 2025:
26 2030:
27 Reduction cost, short term - with side effects:
28 Reduction cost, short term - without side effects:
29 Reduction cost, long term - with side effects:
30 Reduction cost, long term - without side effects:
31 Methods and assumptions used for the estimation of
reduction effects and socio-economic costs:
See Chapter 5 and the Effort Analysis(1)
32 Side effects – on other GHGs or GHG emitting activities: Reductions of CO2 emission in energy supply when biomass in waste for incineration
substitutes fossil fuel combustion. All incineration plants in Denmark are connected to
district heating grids. However, this effect has not been quantified separately.
33 Side effects – on other air pollutants:
34 Side effects – other:
35 Interaction with other policies and measures:
36 How will the policy or measure modify longer-term trends in
anthropogenic GHG emissions and removals:
See Chapter 5, the Effort Analysis(1) and the effects shown above
37 Explanation, if the measure is no longer in place:
38 *Is the effect of the measure included in the ”with measures”
GHG projection) ?:
Yes
39 *Is the effect of the measure included in the ”with additional
measures” GHG projection) ?:
N.a.
40 *Is effect estimated and subtracted in the ”without measures
(since 1990)" - projection ?:
Yes
41 References and links for further information: (1) See Annex B2 and http://www.mst.dk/transport/01041000.htm
42 Comments:
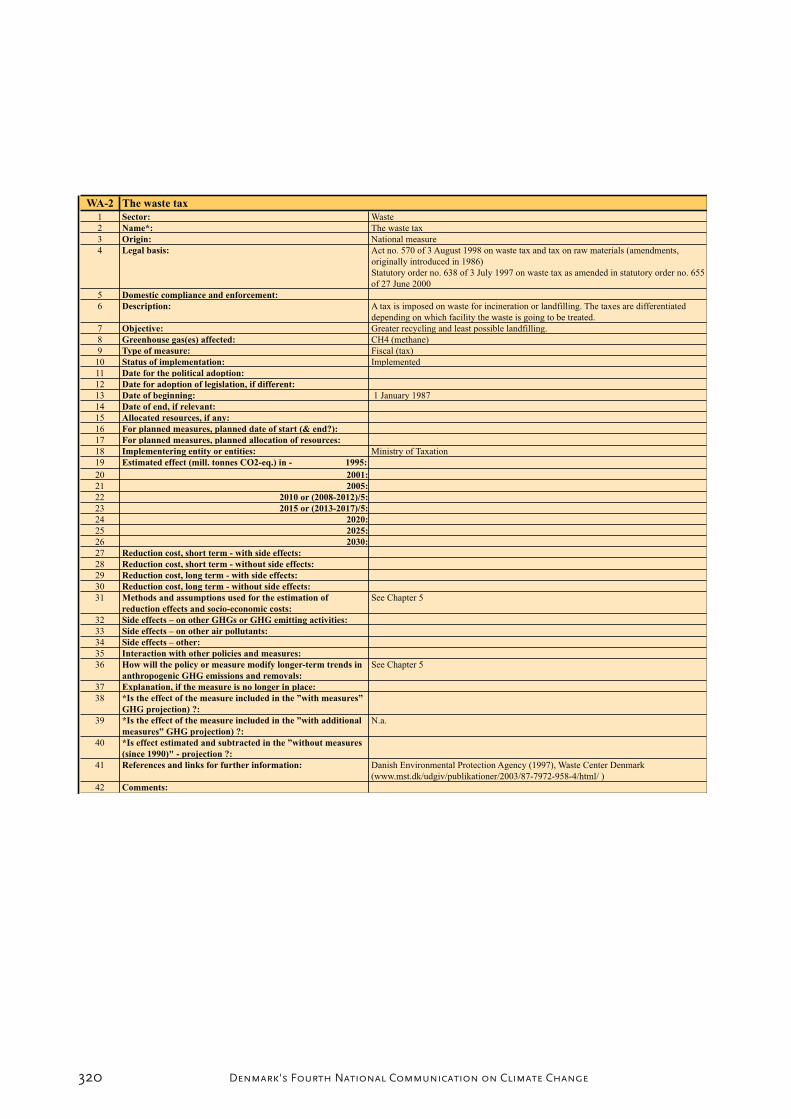
320 Denmark's Fourth National Communication on Climate Change
WA-2 The waste tax
1 Sector: Waste
2 Name*: The waste tax
3 Origin: National measure
4 Legal basis: Act no. 570 of 3 August 1998 on waste tax and tax on raw materials (amendments,
originally introduced in 1986)
Statutory order no. 638 of 3 July 1997 on waste tax as amended in statutory order no. 655
of 27 June 2000
5 Domestic compliance and enforcement:
6 Description: A tax is imposed on waste for incineration or landfilling. The taxes are differentiated
depending on which facility the waste is going to be treated.
7 Objective: Greater recycling and least possible landfilling.
8 Greenhouse gas(es) affected: CH4 (methane)
9 Type of measure: Fiscal (tax)
10 Status of implementation: Implemented
11 Date for the political adoption:
12 Date for adoption of legislation, if different:
13 Date of beginning: 1 January 1987
14 Date of end, if relevant:
15 Allocated resources, if any:
16 For planned measures, planned date of start (& end?):
17 For planned measures, planned allocation of resources:
18 Implementering entity or entities: Ministry of Taxation
19 Estimated effect (mill. tonnes CO2-eq.) in - 1995:
20 2001:
21 2005:
22 2010 or (2008-2012)/5:
23 2015 or (2013-2017)/5:
24 2020:
25 2025:
26 2030:
27 Reduction cost, short term - with side effects:
28 Reduction cost, short term - without side effects:
29 Reduction cost, long term - with side effects:
30 Reduction cost, long term - without side effects:
31 Methods and assumptions used for the estimation of
reduction effects and socio-economic costs:
See Chapter 5
32 Side effects – on other GHGs or GHG emitting activities:
33 Side effects – on other air pollutants:
34 Side effects – other:
35 Interaction with other policies and measures:
36 How will the policy or measure modify longer-term trends in
anthropogenic GHG emissions and removals:
See Chapter 5
37 Explanation, if the measure is no longer in place:
38 *Is the effect of the measure included in the ”with measures”
GHG projection) ?:
39 *Is the effect of the measure included in the ”with additional
measures” GHG projection) ?:
N.a.
40 *Is effect estimated and subtracted in the ”without measures
(since 1990)" - projection ?:
41 References and links for further information: Danish Environmental Protection Agency (1997), Waste Center Denmark
(www.mst.dk/udgiv/publikationer/2003/87-7972-958-4/html/ )
42 Comments:

321Denmark's Fourth National Communication on Climate Change
WA-3 Weight-and-volume-based packaging taxes
1 Sector: Waste
2 Name*: Weight-and-volume-based packaging taxes
3 Origin: National measure
4 Legal basis: Act no 101 of 13 Frebuary 2001 on tax on packings, bags, service and PVC folios
Statutory order no. 111 of 5 February 2000 on tires
Statutory order of 22 March 2001 on CFCs
Statutory order no. 1060 of 4 December 2000 on lead accumulators
5 Domestic compliance and enforcement:
6 Description: Taxes or compensations on several products. E.g. taxes on packings, tires, lead
accumulators, CFCs and bags.
7 Objective: The objectives of both weight and volume -based packaging taxes are to reduce the
amount of packaging waste and its impacts on the environment. The taxes provide for
economic incentives to behave in accordance with these objectives.
8 Greenhouse gas(es) affected: CH4 (methane) and CO2
9 Type of measure: Fiscal (tax)
10 Status of implementation: Implemented
11 Date for the political adoption:
12 Date for adoption of legislation, if different:
13 Date of beginning:
14 Date of end, if relevant:
15 Allocated resources, if any:
16 For planned measures, planned date of start (& end?):
17 For planned measures, planned allocation of resources:
18 Implementering entity or entities:
19 Estimated effect (mill. tonnes CO2-eq.) in - 1995:
20 2001:
21 2005:
22 2010 or (2008-2012)/5:
23 2015 or (2013-2017)/5:
24 2020:
25 2025:
26 2030:
27 Reduction cost, short term - with side effects:
28 Reduction cost, short term - without side effects:
29 Reduction cost, long term - with side effects:
30 Reduction cost, long term - without side effects:
31 Methods and assumptions used for the estimation of
reduction effects and socio-economic costs:
See Chapter 5
32 Side effects – on other GHGs or GHG emitting activities:
33 Side effects – on other air pollutants:
34 Side effects – other:
35 Interaction with other policies and measures:
36 How will the policy or measure modify longer-term trends in
anthropogenic GHG emissions and removals:
See Chapter 5
37 Explanation, if the measure is no longer in place:
38 *Is the effect of the measure included in the ”with measures”
GHG projection) ?:
39 *Is the effect of the measure included in the ”with additional
measures” GHG projection) ?:
N.a.
40 *Is effect estimated and subtracted in the ”without measures
(since 1990)" - projection ?:
41 References and links for further information: Waste Centre Denmark (www.affaldsinfo.dk/vidensbank) have an electronic industrial
waste bank that collates and systematizes knowledge about industrial waste in 20 sectors.
42 Comments:
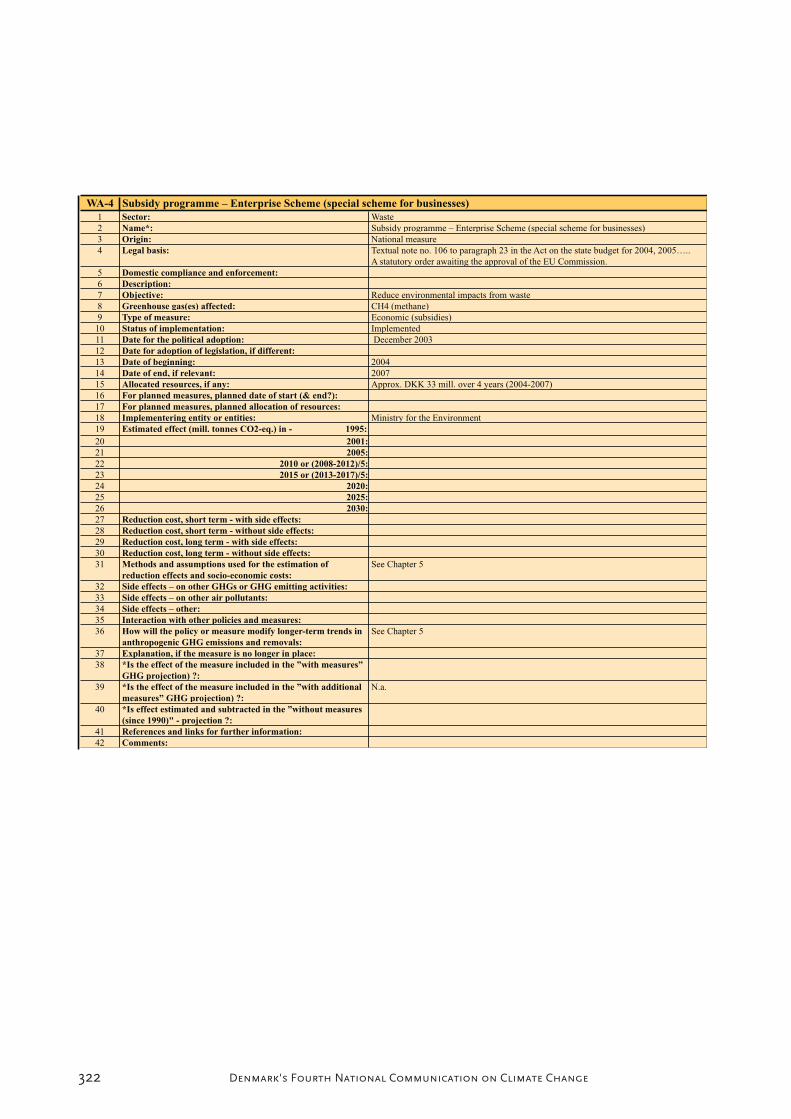
322 Denmark's Fourth National Communication on Climate Change
WA-4 Subsidy programme – Enterprise Scheme (special scheme for businesses)
1 Sector: Waste
2 Name*: Subsidy programme – Enterprise Scheme (special scheme for businesses)
3 Origin: National measure
4 Legal basis: Textual note no. 106 to paragraph 23 in the Act on the state budget for 2004, 2005…..
A statutory order awaiting the approval of the EU Commission.
5 Domestic compliance and enforcement:
6 Description:
7 Objective: Reduce environmental impacts from waste
8 Greenhouse gas(es) affected: CH4 (methane)
9 Type of measure: Economic (subsidies)
10 Status of implementation: Implemented
11 Date for the political adoption: December 2003
12 Date for adoption of legislation, if different:
13 Date of beginning: 2004
14 Date of end, if relevant: 2007
15 Allocated resources, if any: Approx. DKK 33 mill. over 4 years (2004-2007)
16 For planned measures, planned date of start (& end?):
17 For planned measures, planned allocation of resources:
18 Implementering entity or entities: Ministry for the Environment
19 Estimated effect (mill. tonnes CO2-eq.) in - 1995:
20 2001:
21 2005:
22 2010 or (2008-2012)/5:
23 2015 or (2013-2017)/5:
24 2020:
25 2025:
26 2030:
27 Reduction cost, short term - with side effects:
28 Reduction cost, short term - without side effects:
29 Reduction cost, long term - with side effects:
30 Reduction cost, long term - without side effects:
31 Methods and assumptions used for the estimation of
reduction effects and socio-economic costs:
See Chapter 5
32 Side effects – on other GHGs or GHG emitting activities:
33 Side effects – on other air pollutants:
34 Side effects – other:
35 Interaction with other policies and measures:
36 How will the policy or measure modify longer-term trends in
anthropogenic GHG emissions and removals:
See Chapter 5
37 Explanation, if the measure is no longer in place:
38 *Is the effect of the measure included in the ”with measures”
GHG projection) ?:
39 *Is the effect of the measure included in the ”with additional
measures” GHG projection) ?:
N.a.
40 *Is effect estimated and subtracted in the ”without measures
(since 1990)" - projection ?:
41 References and links for further information:
42 Comments:
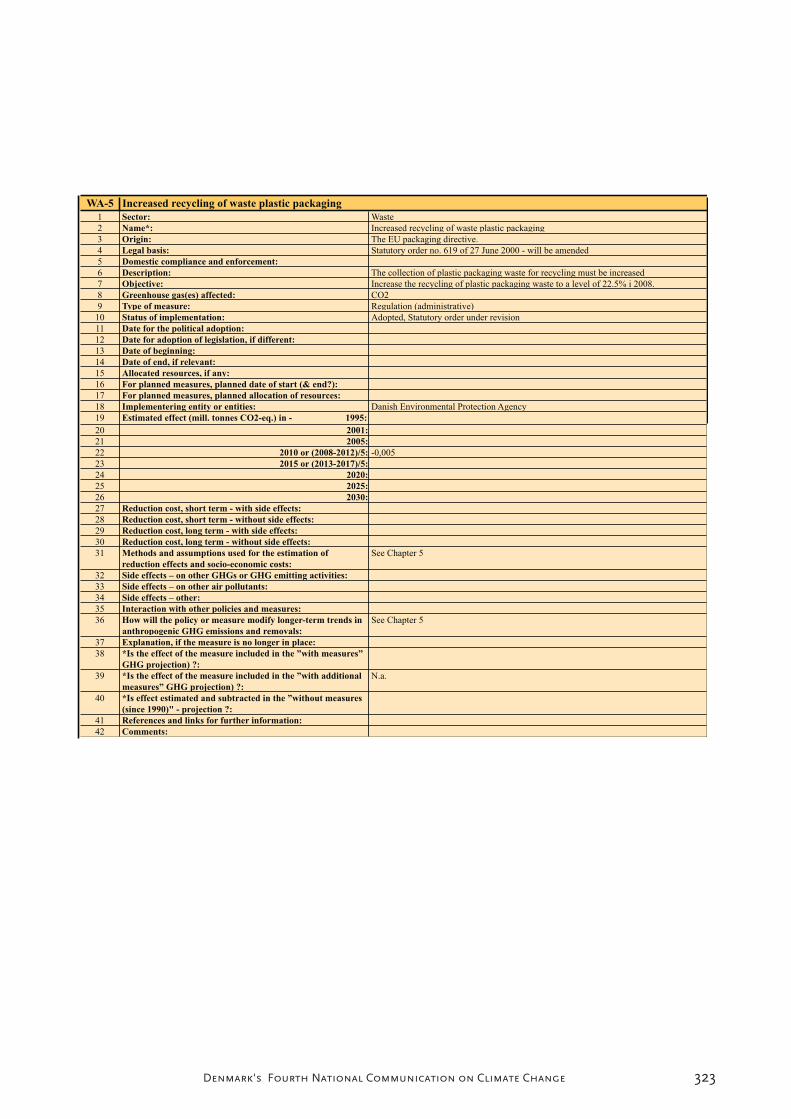
323Denmark's Fourth National Communication on Climate Change
WA-5 Increased recycling of waste plastic packaging
1 Sector: Waste
2 Name*: Increased recycling of waste plastic packaging
3 Origin: The EU packaging directive.
4 Legal basis: Statutory order no. 619 of 27 June 2000 - will be amended
5 Domestic compliance and enforcement:
6 Description: The collection of plastic packaging waste for recycling must be increased
7 Objective: Increase the recycling of plastic packaging waste to a level of 22.5% i 2008.
8 Greenhouse gas(es) affected: CO2
9 Type of measure: Regulation (administrative)
10 Status of implementation: Adopted, Statutory order under revision
11 Date for the political adoption:
12 Date for adoption of legislation, if different:
13 Date of beginning:
14 Date of end, if relevant:
15 Allocated resources, if any:
16 For planned measures, planned date of start (& end?):
17 For planned measures, planned allocation of resources:
18 Implementering entity or entities: Danish Environmental Protection Agency
19 Estimated effect (mill. tonnes CO2-eq.) in - 1995:
20 2001:
21 2005:
22 2010 or (2008-2012)/5: -0,005
23 2015 or (2013-2017)/5:
24 2020:
25 2025:
26 2030:
27 Reduction cost, short term - with side effects:
28 Reduction cost, short term - without side effects:
29 Reduction cost, long term - with side effects:
30 Reduction cost, long term - without side effects:
31 Methods and assumptions used for the estimation of
reduction effects and socio-economic costs:
See Chapter 5
32 Side effects – on other GHGs or GHG emitting activities:
33 Side effects – on other air pollutants:
34 Side effects – other:
35 Interaction with other policies and measures:
36 How will the policy or measure modify longer-term trends in
anthropogenic GHG emissions and removals:
See Chapter 5
37 Explanation, if the measure is no longer in place:
38 *Is the effect of the measure included in the ”with measures”
GHG projection) ?:
39 *Is the effect of the measure included in the ”with additional
measures” GHG projection) ?:
N.a.
40 *Is effect estimated and subtracted in the ”without measures
(since 1990)" - projection ?:
41 References and links for further information:
42 Comments:
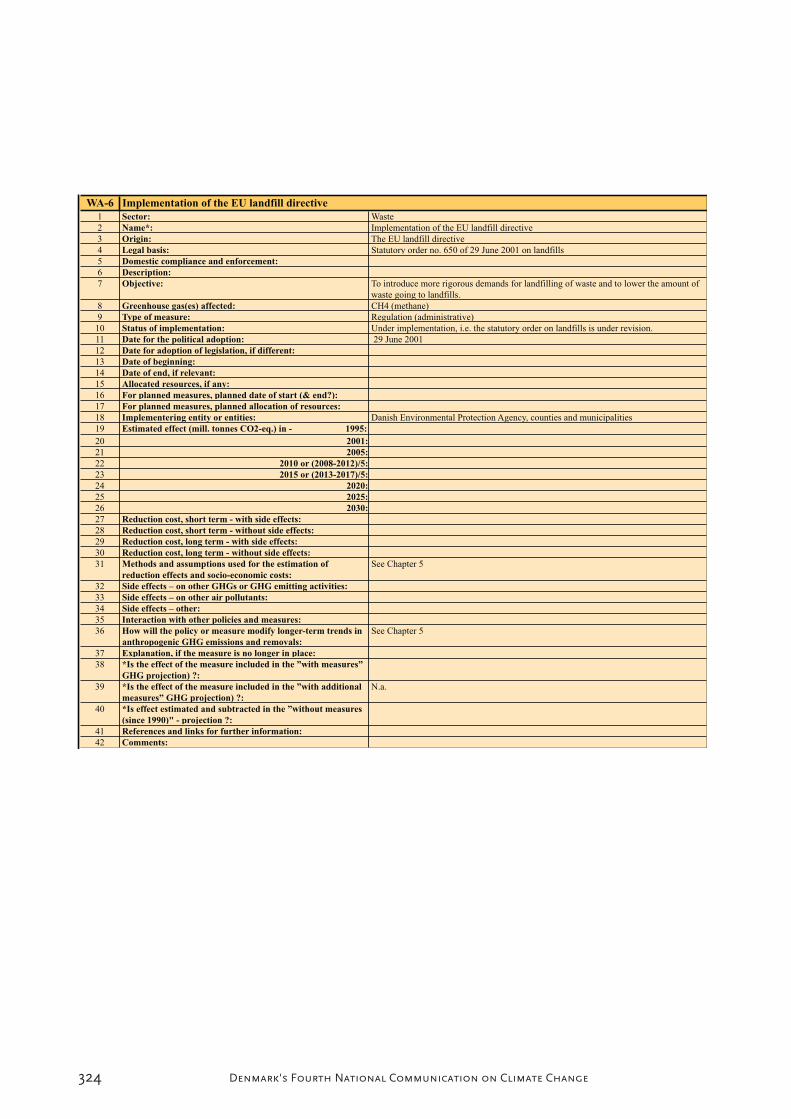
324 Denmark's Fourth National Communication on Climate Change
WA-6 Implementation of the EU landfill directive
1 Sector: Waste
2 Name*: Implementation of the EU landfill directive
3 Origin: The EU landfill directive
4 Legal basis: Statutory order no. 650 of 29 June 2001 on landfills
5 Domestic compliance and enforcement:
6 Description:
7 Objective: To introduce more rigorous demands for landfilling of waste and to lower the amount of
waste going to landfills.
8 Greenhouse gas(es) affected: CH4 (methane)
9 Type of measure: Regulation (administrative)
10 Status of implementation: Under implementation, i.e. the statutory order on landfills is under revision.
11 Date for the political adoption: 29 June 2001
12 Date for adoption of legislation, if different:
13 Date of beginning:
14 Date of end, if relevant:
15 Allocated resources, if any:
16 For planned measures, planned date of start (& end?):
17 For planned measures, planned allocation of resources:
18 Implementering entity or entities: Danish Environmental Protection Agency, counties and municipalities
19 Estimated effect (mill. tonnes CO2-eq.) in - 1995:
20 2001:
21 2005:
22 2010 or (2008-2012)/5:
23 2015 or (2013-2017)/5:
24 2020:
25 2025:
26 2030:
27 Reduction cost, short term - with side effects:
28 Reduction cost, short term - without side effects:
29 Reduction cost, long term - with side effects:
30 Reduction cost, long term - without side effects:
31 Methods and assumptions used for the estimation of
reduction effects and socio-economic costs:
See Chapter 5
32 Side effects – on other GHGs or GHG emitting activities:
33 Side effects – on other air pollutants:
34 Side effects – other:
35 Interaction with other policies and measures:
36 How will the policy or measure modify longer-term trends in
anthropogenic GHG emissions and removals:
See Chapter 5
37 Explanation, if the measure is no longer in place:
38 *Is the effect of the measure included in the ”with measures”
GHG projection) ?:
39 *Is the effect of the measure included in the ”with additional
measures” GHG projection) ?:
N.a.
40 *Is effect estimated and subtracted in the ”without measures
(since 1990)" - projection ?:
41 References and links for further information:
42 Comments:
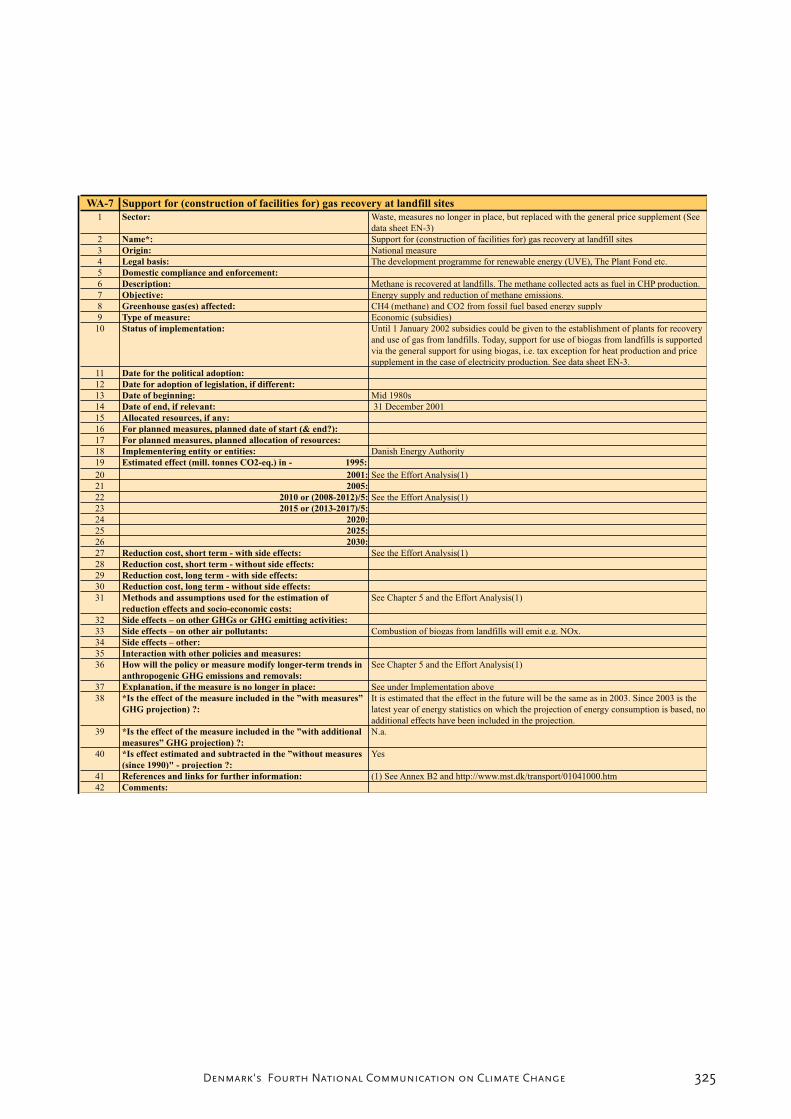
325Denmark's Fourth National Communication on Climate Change
WA-7 Support for (construction of facilities for) gas recovery at landfill sites
1 Sector: Waste, measures no longer in place, but replaced with the general price supplement (See
data sheet EN-3)
2 Name*: Support for (construction of facilities for) gas recovery at landfill sites
3 Origin: National measure
4 Legal basis: The development programme for renewable energy (UVE), The Plant Fond etc.
5 Domestic compliance and enforcement:
6 Description: Methane is recovered at landfills. The methane collected acts as fuel in CHP production.
7 Objective: Energy supply and reduction of methane emissions.
8 Greenhouse gas(es) affected: CH4 (methane) and CO2 from fossil fuel based energy supply
9 Type of measure: Economic (subsidies)
10 Status of implementation: Until 1 January 2002 subsidies could be given to the establishment of plants for recovery
and use of gas from landfills. Today, support for use of biogas from landfills is supported
via the general support for using biogas, i.e. tax exception for heat production and price
supplement in the case of electricity production. See data sheet EN-3.
11 Date for the political adoption:
12 Date for adoption of legislation, if different:
13 Date of beginning: Mid 1980s
14 Date of end, if relevant: 31 December 2001
15 Allocated resources, if any:
16 For planned measures, planned date of start (& end?):
17 For planned measures, planned allocation of resources:
18 Implementering entity or entities: Danish Energy Authority
19 Estimated effect (mill. tonnes CO2-eq.) in - 1995:
20 2001: See the Effort Analysis(1)
21 2005:
22 2010 or (2008-2012)/5: See the Effort Analysis(1)
23 2015 or (2013-2017)/5:
24 2020:
25 2025:
26 2030:
27 Reduction cost, short term - with side effects: See the Effort Analysis(1)
28 Reduction cost, short term - without side effects:
29 Reduction cost, long term - with side effects:
30 Reduction cost, long term - without side effects:
31 Methods and assumptions used for the estimation of
reduction effects and socio-economic costs:
See Chapter 5 and the Effort Analysis(1)
32 Side effects – on other GHGs or GHG emitting activities:
33 Side effects – on other air pollutants: Combustion of biogas from landfills will emit e.g. NOx.
34 Side effects – other:
35 Interaction with other policies and measures:
36 How will the policy or measure modify longer-term trends in
anthropogenic GHG emissions and removals:
See Chapter 5 and the Effort Analysis(1)
37 Explanation, if the measure is no longer in place: See under Implementation above
38 *Is the effect of the measure included in the ”with measures”
GHG projection) ?:
It is estimated that the effect in the future will be the same as in 2003. Since 2003 is the
latest year of energy statistics on which the projection of energy consumption is based, no
additional effects have been included in the projection.
39 *Is the effect of the measure included in the ”with additional
measures” GHG projection) ?:
N.a.
40 *Is effect estimated and subtracted in the ”without measures
(since 1990)" - projection ?:
Yes
41 References and links for further information: (1) See Annex B2 and http://www.mst.dk/transport/01041000.htm
42 Comments:

326 Denmark's Fourth National Communication on Climate Change
WA-8 Subsidy programme for cleaner products
1 Sector: Waste, measures no longer in place
2 Name*: Subsidy programme for cleaner products
3 Origin: National measure
4 Legal basis: Statutory order no. 731 and 732 of 9 October 1998 on subsidy programme for cleaner
products and on The Environment Council on Cleaner Products as amended in Statutory
order no. 784 of 4 September 2003.
5 Domestic compliance and enforcement:
6 Description: Under the subsidy programme for cleaner products it was possible to get grants for
projects targetted at reducing the environmental impact from handling of waste generated
throughout the life cycle of products as well as for projects with the objective to limit
environmental problems in connection with the handling of waste.
7 Objective: Reduce the impact of waste on the environmental.
8 Greenhouse gas(es) affected: CH4 (methane)
9 Type of measure: Economic (subsidies)
10 Status of implementation: Implemented, but no longer in place.
11 Date for the political adoption: 9 October 1998
12 Date for adoption of legislation, if different:
13 Date of beginning: 1999
14 Date of end, if relevant: 2003
15 Allocated resources, if any: Approx. DKK 100 mill. in total the period 1999-2003
16 For planned measures, planned date of start (& end?):
17 For planned measures, planned allocation of resources:
18 Implementering entity or entities: Ministry for the Environment
19 Estimated effect (mill. tonnes CO2-eq.) in - 1995:
20 2001:
21 2005:
22 2010 or (2008-2012)/5:
23 2015 or (2013-2017)/5:
24 2020:
25 2025:
26 2030:
27 Reduction cost, short term - with side effects:
28 Reduction cost, short term - without side effects:
29 Reduction cost, long term - with side effects:
30 Reduction cost, long term - without side effects:
31 Methods and assumptions used for the estimation of
reduction effects and socio-economic costs:
See Chapter 5
32 Side effects – on other GHGs or GHG emitting activities:
33 Side effects – on other air pollutants:
34 Side effects – other:
35 Interaction with other policies and measures:
36 How will the policy or measure modify longer-term trends in
anthropogenic GHG emissions and removals:
See Chapter 5
37 Explanation, if the measure is no longer in place:
38 *Is the effect of the measure included in the ”with measures”
GHG projection) ?:
39 *Is the effect of the measure included in the ”with additional
measures” GHG projection) ?:
N.a.
40 *Is effect estimated and subtracted in the ”without measures
(since 1990)" - projection ?:
41 References and links for further information:
42 Comments:
327Denmark's Fourth National Communication on Climate Change
SUMMARY
Since 1990, a broad range of na-tional policies and measures have been implemented in Denmark that have impacted on emissions of greenhouse gases. Some initiatives have been implemented with CO2
reduction as the primary aim, while other initiatives have been motivated by other aims.
The Effort Analysis1 reports on Denmark’s effort related to the re-duction of greenhouse gas emissions undertaken on national level in the period 1990-2001, and the costs of this effort.
Under the Kyoto Protocol and the EU’s subsequent Burden Sharing Agreement, Denmark has under-taken to reduce greenhouse gas emissions by 21% in 2008-2012, compared to 1990 levels2
One of the additional requirements of the Kyoto Protocol is that the use of flexible mechanisms must be sup-plemental to domestic action. The calculation of the total Danish effort is relevant in this connection.
1 The Effort Analysis is published in the report ”Danmarks udledning af CO2 – indsatsen i perioden 1990-2001 og omkostningerne herved
2 Emissions – Efforts in the Period 1990-2001 and the costs involved) – Main and Annex Report, Statement from the Danish EPA no. 2 and 3, 2005 (in Danish).
2 However, in 2002 the (Environment) Council and the Commission adopted a political declaration stating that the calculation of the assigned amounts (measured in tonnes) in 2006 shall take into
Burden Sharing Agreement in 1998, i.a. stating that
adjusted 1990 level, and that the adoption of additional common European measures is assumed.
Annex B2 The Effort Analysis
It is therefore relevant to consider the effects of Denmark’s efforts both in relation to the Kyoto accounting, and in relation to the total effect - regardless of whether the emissions reductions have been in Denmark or abroad.
In relation to the Kyoto accounting, which is based on the CO2 impact associated with the specific emis-sions in Denmark, it is expected that part of the effect of the energy sector initiatives will be offset by increased electricity exports. This means that the CO2 emissions linked to the exported electricity com-ponent have a negative impact on Denmark’s Kyoto accounting, rather than on that of the electricity im-porting country.
Choice of measuresThe Effort Analysis report aimed to include the most important environ-ment and energy policy measures implemented in the period 1990-2001 that have had a significant ef-fect on greenhouse gas emissions.
Please note that many of the mea-sures have not been planned and adopted with the aim of contribut-ing to the fulfilment of Denmark’s Kyoto obligation, but derive from the political objective from 1990 (in the “Energy 2000 action plan) of reducing CO2 emissions from Den-mark’s energy consumption by 20% between 1988 and 2005. Thus the Effort Analysis does not evaluate the implemented initiatives against their original objective, but rather in rela-

328 Denmark's Fourth National Communication on Climate Change
tion to reducing greenhouse gases, and how much the implemented ini-tiatives will contribute to the binding Kyoto objectives that exist today.
The chronological definition of the initiatives is not always straightfor-ward. Some initiatives were intro-duced prior to 1990, but the imple-mentation (and associated reduction in greenhouse gas emissions) has taken place after 1990. This is the case, for example, for the conversion to natural gas and for Action Plan for the Aquatic Environment I. The calculations in the Effort Analysisonly include the CO2 reductions that have taken place after 1990.
Denmark’s effort in the period 1990-2001The Effort Analysis evaluates the ef-fects of measures implemented in the period 1990-2001 in relation to the actual emissions in 2001, and in relation to the expected average an-nual emissions in 2008-2012, as laid down in the base projection used as a basis for the Danish climate strategy from February 2003 (i.e. the previous ‘with measures’ projec-tion, which only took into account the effects of measures implemented or adopted before the Climate Strat-egy). Initiatives adopted after 2001 are therefore not included in the re-sults of the Effort Analysis, and hence these results cannot be used as a total status report for the Danish ef-forts in relation to the Kyoto target.
The Effort Analysis reports on and calculates the Danish initiatives by considering their total effect, regard-less of whether they have resulted in reductions in emissions in Denmark or abroad. However, the analysed initiatives have also been assessed in relation to Denmark’s international obligations under the Kyoto Proto-col, based on the CO2 impact as-sociated with the specific emissions in Denmark. Figure B2-1 illustrates how much greater Denmark’s CO2
emissions would have been in 2001 and in 2008-12 if the initiatives ana-lysed had not been implemented.
FIGURE B2-1:
1 The reduction requirement in the figure has been calculated as Denmark’s legal obligation. i.e. the figure has notbeen corrected for the particularly large electricity imports in the 1990 base year. However, in 2002 the (Environ-ment) Council and the Commission adopted a political declaration stating that the calculation of the assignedamounts (measured in tonnes) in 2006 shall take into account Denmark’s statement in connection with the BurdenSharing Agreement in 1998, e.g. stating that Denmark’s reductions shall be seen in relation to an adjusted 1990level. When this factor is taken into account, the reduction requirement would be reduced by up to 5 million tonnesannually.
2 The reduction calculated in 2001 includes the full effects, i.e. it includes the CO2 reductions that domestic actionshave led to in other countries.
-
1 0,00
20,00
3 0,00
40,00
5 0,00
60,00
7 0,00
80,00
90,00
1 00,00
1 990/95 2001 2 2008-1 2
Mill.tonnesC O
2
eq .Kyoto-Target1
Emissions in the reference develop-ment (the 2003 “with measures” projection)
Referencedevelopment
Further emissions if the initiatives analysed had not been implemented
Part of the reductionfrom the initiatives ass-umed to be offset by increased elec. exports

329Denmark's Fourth National Communication on Climate Change
As Figure B2-1 shows, the initiatives under consideration are estimated to give rise to CO2 reductions of ap-prox. 20.6 million tonnes per year in the 2008-12 period. This expresses the total effect of Denmark’s effort in the 1990-2001 period. It also shows (see below) that part of the effect of energy sector initiatives is expected to be offset by increased electricity exports, such that in rela-tion to the Kyoto emission account-ing, the initiatives under consider-ation are estimated to lead to CO2
reductions of approx. 15.6 million tonnes per year in the 2008-12 pe-riod.
A number of the initiatives imple-mented have been aimed at reduc-ing CO2 emissions from Danish electricity consumption. However, Danish electricity production is inte-grated into the Northern European electricity market, and the effect of initiatives in the electricity sector are – and are expected to continue
to be – partially offset by increased exports of fossil fuel electricity pro-duction from Denmark. Estimation of the size of this effect is subject to extreme uncertainty. Based on a rudimentary assumption that 50% of the effects of the electricity sector initiatives will be offset by electric-ity exports, approx. 5.0 of the 20.6 million tonnes of CO2 will be offset by increased electricity exports. This estimate is subject to significant un-certainty and depends, for example, on the future expansion of produc-tion capacity in the Scandinavian countries (cf. the background report, “Energy policy initiatives in the 1990’s: Costs and CO2 effects
3 )
The Effort Analysis’ ‘without mea-sures’ calculation of CO2 emissions per sector is shown in Table B2-1.
3 Danish Energy Authority 2005, Publishedelectronically in May 2005 on the Authority’s website(http://www.ens.dk/graphics/Publikationer/Energi-politik/Energipolitiske_tiltag_i_1990erne/pdf/energi-pol_tiltag_CO2effekt.pdf )
TABLE B2-1:
Sector 1990/951 2001 2008-12
Base2 Currentemissions2
Reductionsfrom measures
Emissionswithout
measures
Emission projection2 Reductionsfrom measures
Emissionswithout
measures
Energy 42.7 43.2 13.5 56.8 53.1 11.0/16.03) 64.1
Transport 10.7 12.6 1.3 13.9 14.6 1.7 16.3
Industry 0.3 0.7 0.0 0.7 0.7 0.4 1.1
Agriculture 14.4 11.7 1.6 13.3 10.8 1.9 12.7
Waste 1.3 1.2 0.2 1.4 0.9 0.5 1.4
Total 69.5 69.6 16.73 86.2 80.1 15.6 /20.64 95.6
1 1990/95 indicates the emissions in the base year. CO2, CH4 and N2O emissions have 1990 as the base year, while the industrial gases have 1995 as the base year. No corrections have been made forelectricity imports/exports.
2 Source: Emissions figures (base, current in 2001 and projections for 2008-12: Danish Ministry of the Environment 2003)
3 These 16.7 million tonnes CO2 per year include the full effects, i.e. they include the CO2 reductions that domestic actions have led to abroad.
4 For the energy sector measures the full reduction is specified. The Danish Energy Authority estimates that approx. 5.0 of these 20.6 million tonnes CO2 annually will be offset by increased electricityexports based on the calculation assumptions of the climate strategy.

330 Denmark's Fourth National Communication on Climate Change
The Effort Analysis estimates that Denmark’s “without measures CO2
emissions in 2008-12 would have been 95.7 million tonnes CO2 an-nually. Denmark’s legal reduction obligation of 21% in relation to 1990 levels corresponds to emissions in 2008-2012 being reduced to approx. 54.9 million tonnes CO2 annually20.Denmark would have therefore fallen short of this goal by 40.7 million tonnes CO2 annually in 2008-2012 if the initiatives analysed had not been implemented.
In summary, the effect between 2008-2012 of the initiatives analysed would be 15.6 million tonnes annu-ally, after taking into account that 50% of the electricity sector initia-tives are expected to be offset by electricity exports.
As mentioned above, the total reduc-tion effects, in Denmark and abroad, from the implemented domestic initiatives can be estimated at 20.6 million tons annually. Therefore it can be concluded that Denmark has already made significant progress domestically.
Extensive Danish electricity imports from Norway and Sweden in the 1990 base year led to unusually low Danish emissions. If the effects of these imports are compensated for, it would allow Denmark to reduce Danish emissions by approx. 5 mil-lion tonnes less than specified above.
In 2002, the (Environment) Coun-cil and the Commission adopted a political declaration stating that the
calculation of the permitted emis-sion volumes (measured in tonnes) in 2006 shall take into account Denmark’s statement in connection with the Burden Sharing Agreement in 1998, e.g. stating that Denmark’s reductions shall be seen in relation to an adjusted 1990 level.
Costs of measuresThe costs of the CO2 reduction have also been estimated in the Effort Analysis, but only for selected mea-sures. The choice of these measures has largely been governed by which measures CO2 costs had previously been calculated for.
The estimate is based on a cost-ben-efit analysis of the total costs and benefits for each measure, excluding the value of the reduction in CO2
emissions.
An expression of the total socio-eco-nomic costs per tonne of reduced CO2 emissions (also called the initiative’s CO2 shadow price) can be found by comparing the total net costs of the initiative against the esti-mated resultant CO2 reduction. The total CO2 reduction has been used, i.e. regardless of whether this CO2
reduction took place in Denmark or abroad (consumption-based calcula-tion).
This corresponds to the method used in previous analyses carried out by the Danish Ministry of Finance and others in 2001, by the Economic Council in 2002, and in cost estima-tions used in the Government’s cli-mate strategy from 2003.
331Denmark's Fourth National Communication on Climate Change
Please note that the introduction of the EU’s CO2 allowance scheme (EU-ETS) from 2005 changes the framework conditions for large parts of the energy sector and energy-intensive industry, such that the calculation method cannot be used to assess future measures within these areas where quotas have been imposed. The introduction of the allowance scheme means that CO2
emissions from the sectors subject to allowances, including electricity production, will be unequivocally determined by the total amount of allowances accounted in accordance with the Kyoto Protocol. The calcu-lations of the shadow values for the areas subject to allowances, up until the 2008-12 period where the new Kyoto regime will have entered into force, thus serve purely illustrative purposes.
The introduction of the open in-ternational electricity market since the late 1990s means it is no longer certain that for example such as the expansion of renewable energy will reduce CO2 emissions from Danish electricity producers correspond-ingly, as it may be an advantage for producers to export electricity rather than reduce production. Where this is the case, CO2 emissions will be reduced in other countries instead. This is a major issue in relation to calculating how great an effect the measures will have in relation to the base projection.
Please note that the CO2 allowance scheme will increase the European electricity price and thus increase
the profitability of electricity savings compared to the situation today.
Note that no attempt has been made in the Effort Analysis to incorporate any positive effects on security of supply, technology development and commercial development, nor has it been possible to include the value of all environmental impacts. This is due to the difficulty of quantifying and valuing these effects, which in principle should be included.
The value of the reductions in SO2
and NOx emissions resulting from the measures has been included, but the valuation of these physical reduc-tions is very uncertain. This report uses the same valuations as the cli-mate strategy. Since the calculations were carried out, the National Envi-ronmental Research Institute, Den-mark (NERI) has published new, higher valuations for the cost of the negative impacts of SO2 and NOx
emissions. Using these new, updated assumptions from NERI – and with nothing else changed – the calcula-tions would have resulted in lower CO2 shadow prices for several mea-sures.
Table B2-2 shows that the shadow costs for the selected measures vary substantially, and for most of the measures are higher than the indi-cator of DKK 120 per tonne CO2
specified in the Government’s cli-mate strategy. In the energy sector, the “Grant for conversion of apart-ments for the aged to cogenerated heat and power, “Grants for solar heating, heat pumps, and biomass

332 Denmark's Fourth National Communication on Climate Change
Sector MeasureAverage annual CO2 reduction for 2008-2012-{}-Mill. tonnes CO2 per year
Socio-economic cost1 per tonne CO2
DKK/tonne CO2 (2002 prices)
Energy
Grants to private wind turbines 3.4275
Electricity generation plant expansion using windturbines
0.9250
Expansion in decentralised cogeneration of heatingand power
2.1100
Agreement on use of biomass for electricityproduction
1.1 325
Grants for energy savings in businesses 0.9 275
Grant to cover CO2 tax (agreement scheme) 0.6 0
Grant for conversion of old dwellings to cogeneratedheat and power
0.2 1,9252
Grant to promote connection to coal-fired CHP 0.1 850
Grants for solar heating, heat pumps, biomass 0.1 1,5003
Building labelling 0.4 1,300
Tax measuresChanges to taxes on energy products4 1.5 325
Increased taxes on fuel4 1.2 7755
Industry Regulation of industrial gases 0.4 2006
1 The shadow price has been calculated based on the total CO2 reduction.
2 This measure has also lead to improved comfort for those who have changed to CHP. This is believed to have been part of the political motive for the measure. However, no attempt has beenmade to value this gain.
3 Weighted average. This shadow price covers three initiative areas with very different shadow prices. Solar heating (DKK 5,700 /tonne CO2 ), Heat pumps (DKK 650/tonne CO2) and Biomass(DKK 600/tonne CO2).
4 The effect and the shadow price have been estimated for 2001 based on the nominal tax increase from 1990 to 2001. Assuming there are no changes in demand, and constant real prices andtaxes, it will also be possible to use this estimate for the 2008-12 period. Note that these assumptions are not fully compatible with the assumptions about changes to fuel prices associated withthe energy measures.
5 The CO2 reduction has been calculated for all fuel consumption, i.e. fuel consumption for both passenger cars and trucks. However the shadow price has only been calculated for fuel consump-tion in passenger cars, corresponding to the calculations carried out in connection with the Government’s 2003 Climate Strategy.
6 Industrial gases are used for many purposes. The illustrated shadow price has been calculated, as an example, for the costs of replacing HFC gases with more environmentally-friendly refriger-ants in industrial refrigeration plant, the biggest consumption group within the affected industrial gases.
333Denmark's Fourth National Communication on Climate Change
and “Building labelling measures are estimated to have been associated with the highest costs in relation to their CO2 reduction, while the “Grant to cover CO2 tax (agreement scheme) and “Expansion in decen-tralised cogeneration of heating and power have been associated with the lowest costs.
Note that the calculations are gener-ally subject to significant uncertainty and it has not been possible to in-clude all the socio-economic effects in the calculations. For example, the benefit of increased comfort associ-ated with the transition to CHP has not been included in the calcula-tion of the net costs for the “Grant for conversion of old dwellings to cogenerated heat and power initia-tive. Many of the measures will also have a positive effect on the security of the energy supply, which has not been valued.
Please refer to the annex report to the Effort Analysis and to “Energypolicy measures in the 1990s: Costs and CO2 effects for further description of the conditions and assumptions underlying the calculation of the shadow price for each measure.
Uncertainty and sensitivity analyses
Both the CO2 reductions and shad-ow costs for the analysed measures are subject to significant uncertainty due to the complexity and scope of the calculations alone. The fol-lowing key issues in relation to the uncertainty of the results should be highlighted:
• It is not unequivocally clear how the demarcation of an initiative should be carried out. This ap-plies both to choosing which measures to include and, in cer-tain cases, how to define each initiative. Demarcation influ-ences both the CO2 reduction and shadow cost.
• The CO2 reductions have been calculated separately for each initiative. There may be certain consequential effects from an initiative that are not included in the analysis of another initia-tive. Caution should therefore be exercised when comparing the shadow costs of various measures and across sectors.
In addition to the uncertainty associ-ated with determining the expected reductions, there is also significant uncertainty linked to determining the socio-economic prices for the various effects included in such an analysis. With regard to the socio-economic energy prices, the same fuel price assumptions have gener-ally been used as were used in the Government’s 2003 Climate Strat-egy.
To give an indication of the signifi-cance of central assumptions, table B2-3 contains a few examples show-ing how much the shadow price var-ies in response to potential changes to the key background parameters. For a more complete and system-atic presentation of the sensitivity analyses for the individual measures, please refer to “Energy policy mea-

334 Denmark's Fourth National Communication on Climate Change
sures in the 1990s: Costs and CO2 ef-fects”.
EffectsEstimate of reductionsSo as to estimate the effect an ini-tiative has had on greenhouse gas emissions, the change compared to a reference scenario must be assessed. The reference scenario is based on the base projection of CO2 emissions carried out in connection with the Danish climate strategy from Febru-ary 2003. As a rule this projection is assumed to reflect the effect of the initiatives analysed. As regards the individual initiatives, how great the increase in emissions would have been if the initiative in question had not been introduced has thus been estimated.
The initiatives have typically been assessed individually, i.e. in some cases the interaction effects between some initiatives have not been taken fully into account. Reductions in
energy consumption due to tax in-creases, for example, can have effect the use of energy production from wind turbines and vice versa. Fur-thermore please note that all initia-tives in the energy area have been calculated based on one and the same reference development (base projection from February 2003). The base projection is character-ised by all calculations being based on a world with existing regulation, including e.g. existing taxes and du-ties. In principle calculations should also take into account the order in which the different initiatives have been – or will be – introduced as each initiative may affect the other initiatives both with regard to effect and costs. This has not been pos-sible to do within the scope of theEffort Analysis.
The emission inventory method under the Kyoto Protocol uses the energy production or the ac-tual emission of CO2 in Denmark, as opposed to in the Energy 2000
TABLE B2-3: SENSITIVITY ANALYSES FOR SELECTED MEASURES – EXAMPLES
Measure Change in parameter Result of base calculationShadow price
reduction in 2008-12
Result of sensitivity analysis
Grants to private wind turbines A discount rate of 3 % instead of6 % p.a.
3.4 million tonnes CO2 / year
DKK 275/tonne CO2
-
DKK 175/tonne CO2
(- DKK 100/tonne)
Grants to private wind turbines Change in the electricity price from2005 of - DKK 0.02/kWh
3.4 million tonnes CO2 / yearDKK 275/tonne CO2
-DKK 295/tonne
(+ DKK 20/tonne)
Increases to fuel taxes 1 Demand elasticity halved from -0.6to -0.3 (passenger vehicles) and
-0.2 to -0.1 (trucks)
1.2 million tonnes CO2 / year
DKK 775/tonne CO2
0.6 million tonnes/year(-0.6 mill. tonnes/year)
DKK 575/tonne(- DKK 200/tonne)
1 The CO2 reduction has been calculated for all fuel consumption, i.e. fuel consumption for both passenger cars and trucks. However the shadow price has only been calculated for fuel consump-tion in passenger cars, corresponding to the calculations carried out in connection with the Government’s 2003 Climate Strategy. This factor also applies to the sensitivity analysis for “Increasesto fuel taxes.
335Denmark's Fourth National Communication on Climate Change
emission inventory, which is based on CO2 impacts caused by energy consumption in Denmark. This is a crucial difference as regards initia-tives that either affect the demand for electricity or the production of environmentally-friendly electricity. Electricity production (and therefore CO2 emissions) in Denmark is de-termined by the price development in the electricity market and cannot be controlled directly through na-tional initiatives.
One of the additional requirements of the Kyoto Protocol is that the use of flexible mechanisms has to be supplemental to domestic action. Therefore two estimates of Dan-ish efforts are in principle relevant – one estimate on achieved emission reductions in Denmark compared to the inventory calculations under the Kyoto Protocol, and one estimate of the total effect of the Danish efforts under the Kyoto Protocol, regardless of whether an initiative has led to reductions in emission in Denmark or abroad.
With the introduction of the open international electricity market in the late 1990s, it is not a given fact that for example extension of renewable energy will reduce CO2 emissions from Danish electricity producers correspondingly, as it may be an advantage for Danish electricity pro-ducers to export electricity instead of limiting their production. To the ex-tent that this is the case, CO2 emis-sions will decrease in other countries instead of in Denmark. This is a central issue of concern as regards
calculating how great the effect of initiatives will be when compared to the base projections.
The Danish electricity production in the Northern European electric-ity market, and the effect of initia-tives for limiting the need for fossil electricity production is – and is ex-pected to be – partially countered by an increase in exports of fossil elec-tricity production from Denmark. Estimation of the size of this effect is subject to extreme uncertainty. A rudimentary assumption is that, 50% of the effects of the electric-ity sector initiatives will be offset by electricity exports. This estimate is subject to significant uncertainty and depends, for example, on the future expansion of production capacity in the Scandinavian countries (cf. the background report, Energy policy initiatives in the 1990’s: Costs and CO2 effects (Danish Energy Author-ity, 2005).
Emission reductions
The estimated reductions for mea-sures for the year 2001 and the an-nual average in the period 2008-12 is presented in table B2-4 below. Please note that CO2 reductions in the period 2008-2012 are expressed both from an energy consumption and energy production angle. The energy consumption angle ia based on the assumption that all CO2
reductions will be allotted to Den-mark, while reductions based on the energy production angle alone concern changes in actual emissions from Danish areas.
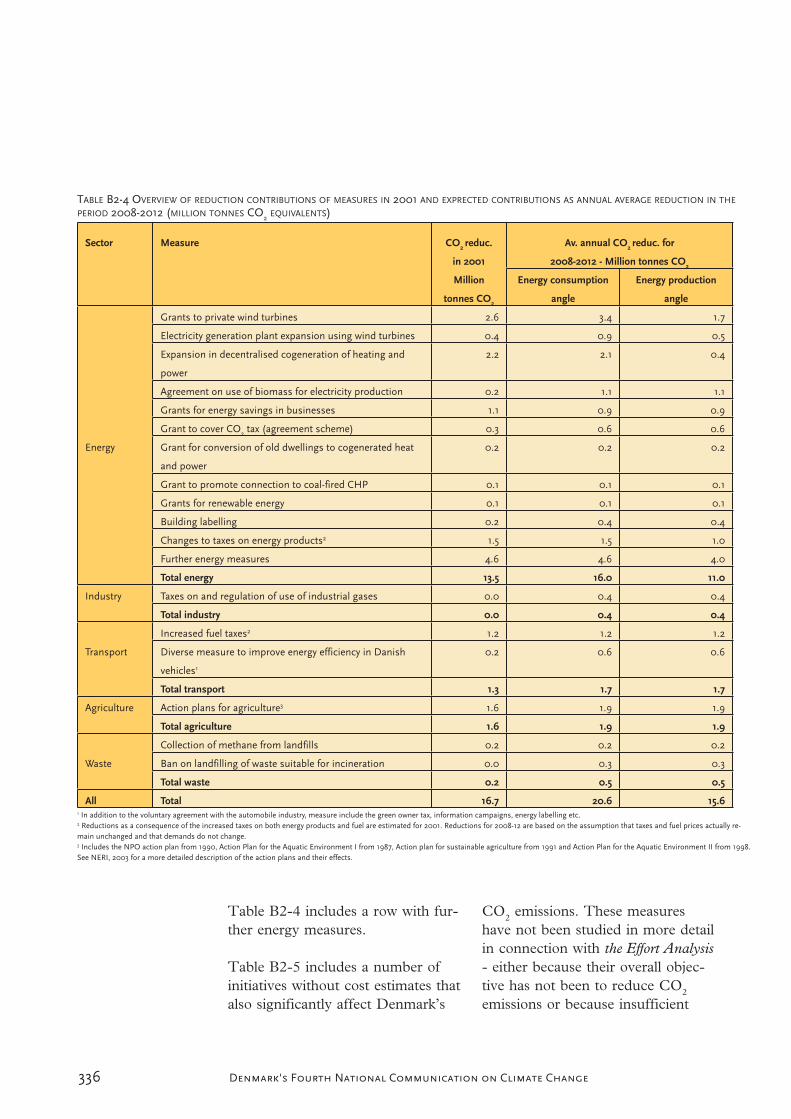
336 Denmark's Fourth National Communication on Climate Change
Table B2-4 includes a row with fur-ther energy measures.
Table B2-5 includes a number of initiatives without cost estimates that also significantly affect Denmark’s
CO2 emissions. These measures have not been studied in more detail in connection with the Effort Analysis- either because their overall objec-tive has not been to reduce CO2
emissions or because insufficient
TABLE B2-4 OVERVIEW OF REDUCTION CONTRIBUTIONS OF MEASURES IN 2001 AND EXPRECTED CONTRIBUTIONS AS ANNUAL AVERAGE REDUCTION IN THE
PERIOD 2008-2012 (MILLION TONNES CO2 EQUIVALENTS)
Sector Measure CO2 reduc.
in 2001
Million
tonnes CO2
Av. annual CO2 reduc. for
2008-2012 - Million tonnes CO2
Energy consumption
angle
Energy production
angle
Energy
Grants to private wind turbines 2.6 3.4 1.7
Electricity generation plant expansion using wind turbines 0.4 0.9 0.5
Expansion in decentralised cogeneration of heating and
power
2.2 2.1 0.4
Agreement on use of biomass for electricity production 0.2 1.1 1.1
Grants for energy savings in businesses 1.1 0.9 0.9
Grant to cover CO2 tax (agreement scheme) 0.3 0.6 0.6
Grant for conversion of old dwellings to cogenerated heat
and power
0.2 0.2 0.2
Grant to promote connection to coal-fired CHP 0.1 0.1 0.1
Grants for renewable energy 0.1 0.1 0.1
Building labelling 0.2 0.4 0.4
Changes to taxes on energy products2 1.5 1.5 1.0
Further energy measures 4.6 4.6 4.0
Total energy 13.5 16.0 11.0
Industry Taxes on and regulation of use of industrial gases 0.0 0.4 0.4
Total industry 0.0 0.4 0.4
Transport
Increased fuel taxes2 1.2 1.2 1.2
Diverse measure to improve energy efficiency in Danish
vehicles1
0.2 0.6 0.6
Total transport 1.3 1.7 1.7
Agriculture Action plans for agriculture3 1.6 1.9 1.9
Total agriculture 1.6 1.9 1.9
Waste
Collection of methane from landfills 0.2 0.2 0.2
Ban on landfilling of waste suitable for incineration 0.0 0.3 0.3
Total waste 0.2 0.5 0.5
All Total 16.7 20.6 15.61 In addition to the voluntary agreement with the automobile industry, measure include the green owner tax, information campaigns, energy labelling etc.2 Reductions as a consequence of the increased taxes on both energy products and fuel are estimated for 2001. Reductions for 2008-12 are based on the assumption that taxes and fuel prices actually re-main unchanged and that demands do not change.3 Includes the NPO action plan from 1990, Action Plan for the Aquatic Environment I from 1987, Action plan for sustainable agriculture from 1991 and Action Plan for the Aquatic Environment II from 1998.See NERI, 2003 for a more detailed description of the action plans and their effects.

337Denmark's Fourth National Communication on Climate Change
data were available for a proper as-sessment of the measure’s effects within the budget framework. In another context how much these ad-ditional measures would contribute to CO2 reductions in 2008-12 has been assessed. The effect 2008-12 is estimated on the basis of energy statistics from 2001 combined with assumptions used in calculations for the Climate Strategy. The results of this assessment can be seen in table B2-5.
The measures analysed are assessed to have reduced approx. 16.7 mil-lion tonnes CO2 in total in 2001. Furthermore it is assessed that Den-mark – seen from the so-called en-ergy production angle – would have emitted approx. 15.6 million tonnes CO2 more on average per year in
the period 2008-12, is the measures analysed had not been implemented. Moreover the measures analysed will lead to further reductions in 2008-12 of approx. 5.0 million tonnes CO2 per year, however this will be countered by the emissions from the increased electricity ex-ports made possible by the measures implemented. The total emission of CO2 seen from the so-called energy consumption angle would thus have been approx. 20.6 million tonnes greater without the measures.
TABLE B2-5 OVERVIEW OF THE ESTIMATE OF CO2 REDUCTIONS FROM FURTHER ENERGY MEASURES
Measure1 Estimate of
CO2 reductions in
2008-12
(million tonnes CO2)
Estimate of CO2
reductions in 2008-12 from
energy policy of 1990s
(million tonnes CO2)
Central CHP (coal-CHP) as replacement for individual oil-fired heating 1.8 0
Conversion from central electricity production from coal to natural gas 1.4 1.4
Establishment of other decentralised CHP that are not included under the
measure Expansion in decentralised cogeneration of heating and power (in-
cluding industrial CHP, biogas CHP and waste CHP)2
2.7 1.2
Separate district heating production from biomass 0.7 0.7
Utilisation of industrial surplus heat for district heating 0.3 0.1
Separate district heating production from waste 0.4 0
Natural gas supply for heating of individual buildings 1.2 0.6
Natural gas supply for industrial processes 1.1 0.6
Total 9.6 4.6
1 It has been assumed that these measures are primarily fully implemented and that 2001 reductions correspond to the reduction stated for 2008-12.2 This measure entails an increase in emissions of the greenhouse gas methane. In the estimate of CO2 reductions for 2008-12, an increase in methane corresponding to 0.3 million tonnes CO2equivalents has been included. The estimate of CO2 reductions in 2008-12 from the energy policy of the 1990s includes an increase in methane corresponding to 0.1 million tonnes CO2 equivalents.

338 Denmark's Fourth National Communication on Climate Change
This Annex includes examples of JI projects in the form of a brief description of the following three projects:
1) Biomass energy from sawdust in Rumania2) Agropolychim fertiliser factory in Bulgaria3) Wind turbine park in Türisalu in Estonia
Programme or project title: Biomass energy from sawdust in Rumania
Objective: Replace fossil fuels with biomass in energy supply in 5 cities in Rumania
Recipient country Sector Expected CO2 reduction purchased by DK
Expected to be in operation by
Rumania Energy supply(district heating)
721,108 tonnes CO2
equivalentsApril 2004
Description: The project concerns utilising sawdust from forestry in Rumanian energy supply in 5 cities instead of oil andnatural gas.
The project was launched in spring 2004 and has subsequently ensured reductions in greenhouse gas emissions. The projectcontributes to reducing pollution caused by wood waste that traditionally was dumped in nature, and furthermore it secures astabile district heating supply for citizens in the five cities.
Technology transferred: Biomass-based district heating
Programme or project title: Agropolychim fertiliser factory in Bulgaria
Objective: Reduce nitrous oxide emissions from a fertiliser factory
Recipient country Sector Expected CO2 reductionpurchased by DK
Expected to be in operation by
Bulgaria Industry 1,150,000 tonnes CO2
equivalentsOctober 2005
Description: The project will lead to the fertiliser factory Agropolychim by the Black Sea reducing its N2O emissions from theproduction of nitrogen fertiliser. Nitrous oxide is a greenhouse gas with a global warming potential (GWP) of 310 times CO2’sGWP. In the period 2005 to 2012 the total reduction of nitrous oxide is expected to correspond to 3.75 million tonnes CO2.Denmark’s agreement with the fertiliser factory includes transferral of 1.15 million tonnes CO2 credits and option to purchasean additional 2.6 million tonnes. As an important part of the contract, the surplus gained by the factory from the sale of its CO2
credits is to be used to establish a wastewater treatment plant for the factory’s wastewater. Today the factory’s wastewater isone of the biggest sources of pollution to the Black Sea, especially with nitrogen.
Technology transferred: Catalytic removal of N2O emissions from the production of fertiliser
Programme or project title: Wind turbine park in Türisalu in Estonia
Objective: Replace electricity from oil-slate-fired power plants with renewable energy
Recipient country Sector Expected CO2 reduction purchased by DK
Expected to be in operation by
Estonia Renewable energy 403,686 tonnes CO2
equivalents2006
Description: 13 wind turbines with a total capacity of 21.45 MW will be placed on a former Soviet missile base in Türisalu outsideof Estonia’s capital Tallinn. The turbines will produce cleaner and renewable energy that will replace electricity from Estonia’soil-slate-fired power plants. Therefore in addition to the CO2 reduction, the wind turbine park will also lead to other considerableenvironmental advantages because oil slate is a very polluting energy source.
Technology transferred: Modern wind turbines
Annex C Description of selected JI projects
339Denmark's Fourth National Communication on Climate Change
This Annex consists of the following two sub-annexes:
Annex D1: Installations cov-ered by the Act on CO2 Allowances 2005-2007.
List including overview of installa-tions covered by the Danish imple-mentation of the EU Allowances Directive, and the size of the quota allocated to each installation for the period 2005-2007 as of 1 February 2005.
Annex D Supplementary information on the al lowance scheme in Denmark
Annex D2: Information on Den-mark’s national CO2 emissions trad-ing registry
1. Information on the registry ad-ministrator
2. Cooperation with other coun-tries concerning operation ofthe registry
3. Standards for data exchange
4. Procedures for administration and operation of the emissions trading registry
5. Safety standards
6. Information available to the public
7. Internet address for the registry
8. Protection, maintenance and recreation of data
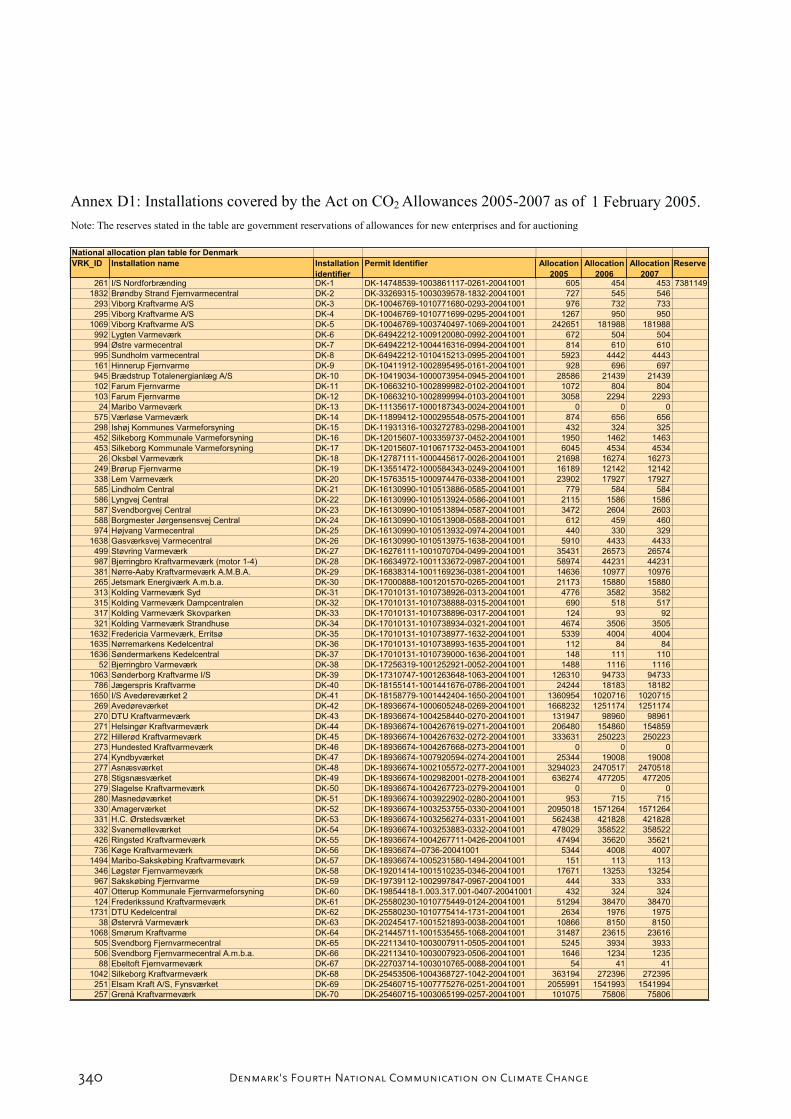
340 Denmark's Fourth National Communication on Climate Change
Note: The reserves stated in the table are government reservations of allowances for new enterprises and for auctioning
National allocation plan table for Denmark
VRK_ID Installation name Installation
identifier
Permit Identifier Allocation
2005
Allocation
2006
Allocation
2007
Reserve
261 I/S Nordforbrænding DK-1 DK-14748539-1003861117-0261-20041001 605 454 453 73811491832 Brøndby Strand Fjernvarmecentral DK-2 DK-33269315-1003039578-1832-20041001 727 545 546293 Viborg Kraftvarme A/S DK-3 DK-10046769-1010771680-0293-20041001 976 732 733295 Viborg Kraftvarme A/S DK-4 DK-10046769-1010771699-0295-20041001 1267 950 950
1069 Viborg Kraftvarme A/S DK-5 DK-10046769-1003740497-1069-20041001 242651 181988 181988992 Lygten Varmeværk DK-6 DK-64942212-1009120080-0992-20041001 672 504 504994 Østre varmecentral DK-7 DK-64942212-1004416316-0994-20041001 814 610 610995 Sundholm varmecentral DK-8 DK-64942212-1010415213-0995-20041001 5923 4442 4443161 Hinnerup Fjernvarme DK-9 DK-10411912-1002895495-0161-20041001 928 696 697945 Brædstrup Totalenergianlæg A/S DK-10 DK-10419034-1000073954-0945-20041001 28586 21439 21439102 Farum Fjernvarme DK-11 DK-10663210-1002899982-0102-20041001 1072 804 804103 Farum Fjernvarme DK-12 DK-10663210-1002899994-0103-20041001 3058 2294 229324 Maribo Varmeværk DK-13 DK-11135617-1000187343-0024-20041001 0 0 0
575 Værløse Varmeværk DK-14 DK-11899412-1000295548-0575-20041001 874 656 656298 Ishøj Kommunes Varmeforsyning DK-15 DK-11931316-1003272783-0298-20041001 432 324 325452 Silkeborg Kommunale Varmeforsyning DK-16 DK-12015607-1003359737-0452-20041001 1950 1462 1463453 Silkeborg Kommunale Varmeforsyning DK-17 DK-12015607-1010671732-0453-20041001 6045 4534 453426 Oksbøl Varmeværk DK-18 DK-12787111-1000445617-0026-20041001 21698 16274 16273
249 Brørup Fjernvarme DK-19 DK-13551472-1000584343-0249-20041001 16189 12142 12142338 Lem Varmeværk DK-20 DK-15763515-1000974476-0338-20041001 23902 17927 17927585 Lindholm Central DK-21 DK-16130990-1010513886-0585-20041001 779 584 584586 Lyngvej Central DK-22 DK-16130990-1010513924-0586-20041001 2115 1586 1586587 Svendborgvej Central DK-23 DK-16130990-1010513894-0587-20041001 3472 2604 2603588 Borgmester Jørgensensvej Central DK-24 DK-16130990-1010513908-0588-20041001 612 459 460974 Højvang Varmecentral DK-25 DK-16130990-1010513932-0974-20041001 440 330 329
1638 Gasværksvej Varmecentral DK-26 DK-16130990-1010513975-1638-20041001 5910 4433 4433499 Støvring Varmeværk DK-27 DK-16276111-1001070704-0499-20041001 35431 26573 26574987 Bjerringbro Kraftvarmeværk (motor 1-4) DK-28 DK-16634972-1001133672-0987-20041001 58974 44231 44231381 Nørre-Aaby Kraftvarmeværk A.M.B.A. DK-29 DK-16838314-1001169236-0381-20041001 14636 10977 10976265 Jetsmark Energiværk A.m.b.a. DK-30 DK-17000888-1001201570-0265-20041001 21173 15880 15880313 Kolding Varmeværk Syd DK-31 DK-17010131-1010738926-0313-20041001 4776 3582 3582315 Kolding Varmeværk Dampcentralen DK-32 DK-17010131-1010738888-0315-20041001 690 518 517317 Kolding Varmeværk Skovparken DK-33 DK-17010131-1010738896-0317-20041001 124 93 92321 Kolding Varmeværk Strandhuse DK-34 DK-17010131-1010738934-0321-20041001 4674 3506 3505
1632 Fredericia Varmeværk, Erritsø DK-35 DK-17010131-1010738977-1632-20041001 5339 4004 40041635 Nørremarkens Kedelcentral DK-36 DK-17010131-1010738993-1635-20041001 112 84 841636 Søndermarkens Kedelcentral DK-37 DK-17010131-1010739000-1636-20041001 148 111 110
52 Bjerringbro Varmeværk DK-38 DK-17256319-1001252921-0052-20041001 1488 1116 11161063 Sønderborg Kraftvarme I/S DK-39 DK-17310747-1001263648-1063-20041001 126310 94733 94733786 Jægerspris Kraftvarme DK-40 DK-18155141-1001441676-0786-20041001 24244 18183 18182
1650 I/S Avedøreværket 2 DK-41 DK-18158779-1001442404-1650-20041001 1360954 1020716 1020715269 Avedøreværket DK-42 DK-18936674-1000605248-0269-20041001 1668232 1251174 1251174270 DTU Kraftvarmeværk DK-43 DK-18936674-1004258440-0270-20041001 131947 98960 98961271 Helsingør Kraftvarmeværk DK-44 DK-18936674-1004267619-0271-20041001 206480 154860 154859272 Hillerød Kraftvarmeværk DK-45 DK-18936674-1004267632-0272-20041001 333631 250223 250223273 Hundested Kraftvarmeværk DK-46 DK-18936674-1004267668-0273-20041001 0 0 0274 Kyndbyværket DK-47 DK-18936674-1007920594-0274-20041001 25344 19008 19008277 Asnæsværket DK-48 DK-18936674-1002105572-0277-20041001 3294023 2470517 2470518278 Stigsnæsværket DK-49 DK-18936674-1002982001-0278-20041001 636274 477205 477205279 Slagelse Kraftvarmeværk DK-50 DK-18936674-1004267723-0279-20041001 0 0 0280 Masnedøværket DK-51 DK-18936674-1003922902-0280-20041001 953 715 715330 Amagerværket DK-52 DK-18936674-1003253755-0330-20041001 2095018 1571264 1571264331 H.C. Ørstedsværket DK-53 DK-18936674-1003256274-0331-20041001 562438 421828 421828332 Svanemølleværket DK-54 DK-18936674-1003253883-0332-20041001 478029 358522 358522426 Ringsted Kraftvarmeværk DK-55 DK-18936674-1004267711-0426-20041001 47494 35620 35621736 Køge Kraftvarmeværk DK-56 DK-18936674--0736-20041001 5344 4008 4007
1494 Maribo-Sakskøbing Kraftvarmeværk DK-57 DK-18936674-1005231580-1494-20041001 151 113 113346 Løgstør Fjernvarmeværk DK-58 DK-19201414-1001510235-0346-20041001 17671 13253 13254967 Sakskøbing Fjernvarme DK-59 DK-19739112-1002997847-0967-20041001 444 333 333407 Otterup Kommunale Fjernvarmeforsyning DK-60 DK-19854418-1.003.317.001-0407-20041001 432 324 324124 Frederikssund Kraftvarmeværk DK-61 DK-25580230-1010775449-0124-20041001 51294 38470 38470
1731 DTU Kedelcentral DK-62 DK-25580230-1010775414-1731-20041001 2634 1976 197538 Østervrå Varmeværk DK-63 DK-20245417-1001521893-0038-20041001 10866 8150 8150
1068 Smørum Kraftvarme DK-64 DK-21445711-1001535455-1068-20041001 31487 23615 23616505 Svendborg Fjernvarmecentral DK-65 DK-22113410-1003007911-0505-20041001 5245 3934 3933506 Svendborg Fjernvarmecentral A.m.b.a. DK-66 DK-22113410-1003007923-0506-20041001 1646 1234 123588 Ebeltoft Fjernvarmeværk DK-67 DK-22703714-1003010765-0088-20041001 54 41 41
1042 Silkeborg Kraftvarmeværk DK-68 DK-25453506-1004368727-1042-20041001 363194 272396 272395251 Elsam Kraft A/S, Fynsværket DK-69 DK-25460715-1007775276-0251-20041001 2055991 1541993 1541994257 Grenå Kraftvarmeværk DK-70 DK-25460715-1003065199-0257-20041001 101075 75806 75806
Annex D1: Installations covered by the Act on CO2 Allowances 2005-2007 as of 1 February 2005.

341Denmark's Fourth National Communication on Climate Change
National allocation plan table for Denmark
VRK_ID Installation name Installation
identifier
Permit Identifier Allocation
2005
Allocation
2006
Allocation
2007
Reserve
259 Elsam Kraft A/S, Studstrupværket DK-71 DK-25460715-1003065217-0259-20041001 2494800 1871100 1871099282 Elsam Kraft A/S, Skærbækværket DK-72 DK-25460715- 1003050386-0282-20041001 821116 615837 615838288 Elsam Kraft A/S, Herningværket DK-73 DK-25460715-1008477988-0288-20041001 337302 252977 252977290 Elsam Kraft A/S, Ringkøbing Kraftvarmeværk DK-74 DK-25460715-1010337603-0290-20041001 28291 21218 21219291 Elsam Kraft A/S, Skjern Kraftvarmeværk DK-75 DK-25460715-1010337646-0291-20041001 36699 27524 27524520 Elsam Kraft A/S, Enstedværket DK-76 DK-25460715-1002980617-0520-20041001 2502100 1876575 1876576635 Elsam Kraft A/S, Frederikshavn Kraftvarmeværk DK-77 DK-25460715-1003043318-0635-20041001 68476 51357 51356636 Elsam Kraft A/S, Nordjyllandsværket DK-78 DK-25460715-1005247303-0636-20041001 1855302 1391476 1391476637 Hirtshals Kraftvarmeværk DK-79 DK-25460715-1003043343-0637-20041001 33396 25047 25047990 Elsam Kraft A/S, Esbjergværket DK-80 DK-25460715-1008477821-0990-20041001 1767963 1325972 1325973415 Energi Randers Produktion A/S DK-81 DK-25481984-1007759963-0415-20041001 299766 224824 224824416 Energi Randers Produktion A/S DK-82 DK-25481984-1009623945-0416-20041001 1107 830 831960 Energi Randers Produktion A/S DK-83 DK-25481984-1009623953-0960-20041001 240 180 179
1490 Energi Randers Produktion A/S DK-84 DK-25481984-1009257612-1490-20041001 6236 4677 4677289 Måbjergværket A/S DK-85 DK-25495977-1007775284-0289-20041001 14620 10965 10965283 Horsens Kraftvarmeværk DK-86 DK-25496086-1007775373-0283-20041001 73994 55496 55496154 KVV Grønningen/Central 2 DK-87 DK-25525795-1010757467-0154-20041001 31650 23738 23738988 KVV Tårnvej DK-88 DK-25525795-1007789161-0988-20041001 58042 43531 43531365 Nyborg Forsyning og Service DK-89 DK-25535456-1003314105-0365-20041001 834 626 625326 Korsør Kommunale Varmeforsyning DK-90 DK-25673840-1003294517-0326-20041001 31273 23455 2345540 Østkraft DK-91 DK-25798929-1008145764-0040-20041001 76257 57193 57193
192 EnergiGruppen Jylland, Holstebrovej DK-92 DK-25809807-1010775309-0192-20041001 4794 3596 3595193 EnergiGruppen Jylland, Nord DK-93 DK-25809807-1010775341-0193-20041001 1735 1301 1301
1244 EnergiGruppen Jylland, Vest DK-94 DK-25809807-1010775392-1244-20041001 53 40 40216 Vestforsyning Varme DK-95 DK-26704065-1010775961-0216-20041001 1869 1402 1401217 Vestforsyning Varme A/S DK-96 DK-26704065-1010775988-0217-20041001 608 456 455218 Vestforsyning Varme A/S DK-97 DK-26704065-1010776046-0218-20041001 1813 1360 1360219 Vestforsyning Varme A/S DK-98 DK-26704065-1010776011-0219-20041001 1448 1086 1086220 Vestforsyning Varme A/S DK-99 DK-26704065-1010776003-0220-20041001 3911 2933 2934129 Faaborg Fjernvarme A/S DK-100 DK-26721059-1003311702-0129-20041001 36916 27687 27686571 Vojens Fjernvarme DK-101 DK-28032617-1010752325-0571-20041001 41593 31195 3119510 Albertslund Varmeværk DK-102 DK-29808228-1003267160-0010-20041001 1082 812 811
529 Thisted Varmeforsyning DK-103 DK-30992512-1003030685-0529-20041001 2268 1701 1701567 Vinderup Varmeværk DK-104 DK-31220912-1001672876-0567-20041001 22344 16758 16757565 Videbæk energiforsyning DK-105 DK-31242711-1001673227-0565-20041001 337 253 252566 Videbæk Energiforsyning DK-106 DK-31242711-1010767063-0566-20041001 27631 20723 20723423 Ringe Fjernvarmeselskab DK-107 DK-32476813-1003037642-0423-20041001 24570 18427 18427536 Tranbjerg Varmeværk DK-108 DK-33016719-1001698824-0536-20041001 156 117 118459 Skagen Varmeværk DK-109 DK-33507410-1001705973-0459-20041001 2457 1843 1843
1449 Skagen Kraftvarmeværk DK-110 DK-33507410-1010581539-1449-20041001 38252 28689 28689207 Hjallerup Fjernvarmeselskab DK-111 DK-34681228-1001723737-0207-20041001 23318 17489 17489388 Odense Kommune VC Bellinge DK-112 DK-35209115-1010757157-0388-20041001 1066 799 799389 Odense Kommune VC Billedskærervej DK-113 DK-35209115-1010757165-0389-20041001 4536 3402 3401390 Odense Kommune VC Bolbro DK-114 DK-35209115-1010757211-0390-20041001 2130 1597 1597392 Odense Kommune VC Centrum DK-115 DK-35209115-1010757807-0392-20041001 2968 2226 2225393 Odense Kommune VC Dyrup DK-116 DK-35209115-1010757866-0393-20041001 459 344 345395 Odense Kommune VC Dalum DK-117 DK-35209115-1010757815-0395-20041001 1590 1192 1192398 Odense Kommune VC Korup DK-118 DK-35209115-1010757904-0398-20041001 930 697 697400 Odense Kommune VC Næsby DK-119 DK-35209115-1010757955-0400-20041001 1464 1098 1097402 Odense Kommune VC Pårup DK-120 DK-35209115-1010757998-0402-20041001 1869 1402 1401403 Odense Kommune VC Sanderum DK-121 DK-35209115-1010758005-0403-20041001 1271 953 953405 Odense Kommune VC Sydøst DK-122 DK-35209115-1010758021-0405-20041001 1233 925 925406 Odense Kommune VC Vollsmose DK-123 DK-35209115-1010758048-0406-20041001 1752 1314 1314104 Fredericia Fjernvarme DK-124 DK-35478116-1003045929-0104-20041001 218 164 163105 Fredericia Fjernvarme DK-125 DK-35478116-1003045930-0105-20041001 33 25 25511 Sønderborg Fjernvarme DK-126 DK-35602313-1009505527-0511-20041001 619 464 465515 Sønderborg Fjernvarme DK-127 DK-35602313-1003046196-0515-20041001 1422 1066 1067556 Varmecentral Søndermarken DK-128 DK-35607919-1010774108-0556-20041001 482 362 361557 Varmecentral Toften DK-129 DK-35607919-1010774116-0557-20041001 929 697 697577 Aabenraa Fjernvarme DK-130 DK-36152710-1010792963-0577-20041001 1598 1199 1199578 Aabenraa Fjernvarme DK-131 DK-36152710-1010792955-0578-20041001 247 185 186580 Aabenraa Fjernvarme DK-132 DK-36152710-1010792947-0580-20041001 359 269 269443 Rødekro Fjernvarmecentral DK-133 DK-36154012-1001742170-0443-20041001 1670 1252 1253545 Tønder Fjernvarmeselskab Amba DK-134 DK-36421312-1.001.745.454-0545-20041001 2029 1522 1522339 Lemvig Varmeværk DK-135 DK-36892412-1001749941-0339-20041001 5756 4317 4317245 Billund Varmeværk I DK-136 DK-37251518-1010779835-0245-20041001 12582 9437 9437246 Billund Varmeværk II DK-137 DK-37251518-1001753730-0246-20041001 37704 28278 28279425 Rindum Værket DK-138 DK-37560219-1003054010-0425-20041001 22763 17072 17073296 I/S Vildbjerg Varmeværk DK-139 DK-37683310-1001758574-0296-20041001 27778 20834 2083463 Brovst Fjernvarme DK-140 DK-37809217-1001759685-0063-20041001 21074 15806 15805
461 Skanderborg Fjernvarme DK-141 DK-37949019-1001761239-0461-20041001 337 253 25295 Hedelund Spidslastcentral DK-142 DK-39877511-1010774698-0095-20041001 799 599 599
Annex D1: Installations covered by the Act on CO2 Allowances 2005-2007 as of 1 February 2005.

342 Denmark's Fourth National Communication on Climate Change
National allocation plan table for Denmark
VRK_ID Installation name Installation
identifier
Permit Identifier Allocation
2005
Allocation
2006
Allocation
2007
Reserve
97 Hjerting Varmeværk DK-143 DK-39877511-1010774701-0097-20041001 64 48 4998 Spangsbjerg-Gjesing Varmecentral DK-144 DK-39877511-1010774728-0098-20041001 1162 872 87299 Sædding Varmeværk DK-145 DK-39877511-1010774736-0099-20041001 2557 1918 1917
361 Nakskov Fjernvarme DK-146 DK-40734511-1003302364-0361-20041001 82 62 62523 Tarm Varmeværk A.m.b.a. DK-147 DK-40893113-1001802909-0523-20041001 0 0 0215 Hobro Varmeværk DK-148 DK-41429615-1001810468-0215-20041001 2098 1574 1573188 Hedensted Fjernvarme DK-149 DK-41529911-1001812204-0188-20041001 19915 14936 1493780 Dagnæs-Bækkelund Varmeværk DK-150 DK-41540214-1003064635-0080-20041001 225 169 168
430 Roskilde Varmeforsyning DK-151 DK-42162019-1003287705-0430-20041001 3386 2540 2539432 Roskilde Varmeforsyning DK-152 DK-42162019-1003288415-0432-20041001 765 574 573156 Gråsten Kommunale Varmeforsyning DK-153 DK-43005154-1003322971-0156-20041001 21080 15810 15810152 Grenå Varmeværk DK-154 DK-43774417-1003079965-0152-20041001 653 490 490939 Bredstrup Varmeværk DK-155 DK-43774417-1003079977-0939-20041001 340 255 254357 Mølholm Varmeværk DK-156 DK-44424010-1001852238-0357-20041001 113 85 85673 Hundige Fjernvarmeværk A.m.b.a. DK-157 DK-44492350-1001853489-0673-20041001 591 443 444301 Jyderup Varmeværk DK-158 DK-44835010-1003297590-0301-20041001 19863 14897 14897203 Frederiksgade Varmecentral DK-159 DK-44887118-1010701992-0203-20041001 2169 1627 1627204 Ullerød Varmecentral DK-160 DK-44887118-1009303940-0204-20041001 697 523 522205 Kgs. Vænge Varmecentral DK-161 DK-44887118-1010702034-0205-20041001 588 441 440206 Elmegaarden Varmecentral DK-162 DK-44887118-1010702018-0206-20041001 688 516 51617 Ikast El- og Varmeværk DK-163 DK-25161513-1003083171-0017-20041001 4265 3199 319925 Nykøbing S. Varmeværk DK-164 DK-46917928-1001888952-0025-20041001 28848 21636 21635
308 Kerteminde Kommunale Varmeforsyning DK-165 DK-46953614-1003312485-0308-20041001 960 720 719385 Nørresundby Fjernvarmeforsyning DK-166 DK-50530213-1001950220-0385-20041001 456 342 341
1070 Brønderslev Kraftvarme DK-167 DK-52080312-1009740313-1070-20041001 88981 66736 667361409 Svendborg Kraftvarmeværk DK-168 DK-54802013-1008705484-1409-20041001 56781 42586 42585258 Århusværket DK-169 DK-55133018-1009490503-0258-20041001 649 487 487591 Århus Kommunale Værker Risskov Varmecentral DK-170 DK-55133018-1010680383-0591-20041001 306 230 229597 Århus Kommunale Værker Jens Juuls Vej DK-171 DK-55133018-1010680359-0597-20041001 2882 2162 2162598 Århus Kommunale Værker Viby Varmecentral DK-172 DK-55133018-1010680375-0598-20041001 285 214 213604 Århus Kommunale Værker Gjellerup DK-173 DK-55133018-1010680367-0604-20041001 779 584 585554 I/S Vamdrup Fjernvarme DK-174 DK-55946817-1002041931-0554-20041001 15643 11732 11732419 Ribe Fjernvarmecentral DK-175 DK-57205628-1010706714-0419-20041001 82 61 61420 Ribe Kraftvarmeværk DK-176 DK-57205628-1002058838-0420-20041001 40148 30111 30111372 Nykøbing Mors Fjernvarmeværk DK-177 DK-57494115-1002063337-0372-20041001 30093 22570 22570169 Haderslev Fjernvarme DK-178 DK-58061212-1003123407-0169-20041001 4791 3593 3593170 Haderslev Fjernvarme DK-179 DK-58061212-1003123419-0170-20041001 21930 16447 16447247 Brande Fjernvarmecentral DK-180 DK-58176613-1002075632-0247-20041001 24862 18646 1864745 Augustenborg Fjernvarme DK-181 DK-59283111-1002096146-0045-20041001 1266 950 94962 Broager Fjernvarmeselskab DK-182 DK-59352318-1002097051-0062-20041001 15333 11500 11499
457 Sindal Varmeforsyning DK-183 DK-59426915-1002097944-0457-20041001 22300 16725 16725304 Kjellerup Fjernvarme DK-184 DK-60247412-1002110216-0304-20041001 272 204 205
2 Assens fjernvarme Amba DK-185 DK-61877215-1003147413-0002-20041001 32 24 2450 Bramming Fjernvarmecentral DK-186 DK-63446319-1002170663-0050-20041001 49634 37226 37226
533 Toftlund Fjernvarmecentral DK-187 DK-63690619-1.002.175.112-0533-20041001 21515 16136 16136509 Sæby Varmeværk DK-188 DK-64429418-1002189756-0509-20041001 55654 41740 41741543 Taars Varmeværk Amba DK-189 DK-64463411-1002190406-0543-20041001 13970 10477 10477190 Helsingør Kommunale Værker DK-190 DK-64502018-1010657128-0190-20041001 854 640 641191 Helsingør Kommunale Værker DK-191 DK-64502018-1003280037-0191-20041001 3218 2413 2413209 Hjørring Varmeforsyning DK-192 DK-64544616-1003156575-0209-20041001 434 325 325210 Hjørring Varmeforsyning DK-193 DK-64544616-1003156630-0210-20041001 147923 110942 110943214 Hjørring Varmeforsyning DK-194 DK-64544616-1003156587-0214-20041001 1056 792 791574 Vrå Varmeværk DK-195 DK-64771728-1002195366-0574-20041001 11781 8836 8836146 Glostrup Kommunale Varmeforsyning DK-196 DK-65120119-1010748883-0146-20041001 171 128 128227 Horsens Varmeværk DK-197 DK-66166228-1003161700-0227-20041001 3075 2306 2307228 Horsens Varmeværk DK-198 DK-66166228-1003161712-0228-20041001 638 479 479172 Hadsten Varmeværk DK-199 DK-67750411-1002257575-0172-20041001 330 248 248335 Langeskov Kommunale Fjernvarme DK-200 DK-67892615-1003312783-0335-20041001 370 278 27733 Vejle Fjernvarme A.m.b.a. DK-201 DK-67932218-1002261339-0033-20041001 433 325 325
463 I/S Skive Fjernvarme DK-202 DK-68326214-1003169877-0463-20041001 59519 44639 44639464 I/S Skive Fjernvarme DK-203 DK-68326214-1003169890-0464-20041001 1145 859 859475 SK-Varme A/S DK-204 DK-27736904-1010782941-0475-20041001 912 684 685478 SK-Varme A/S DK-205 DK-27736904-1010782917-0478-20041001 743 557 558970 Solrød Fjernvarmeværk a.m.b.a. DK-206 DK-69330428-1002294343-0970-20041001 722 541 541991 Hvide Sande Fjernvarme DK-207 DK-69914128-1002309201-0991-20041001 30019 22514 22514373 Næstved Varmeværk DK-208 DK-69995713-1003173770-0373-20041001 265 199 199376 Næstved Varmeværk DK-209 DK-69995713-1003173800-0376-20041001 741 556 556125 Frederiksværk Kommunale Varmeværker DK-210 DK-70097117-1009059608-0125-20041001 3968 2976 2975572 Bødkervænget Varmecentral DK-211 DK-70921219-1004013689-0572-20041001 1365 1024 102473 CTR, Nybrovej Centralen DK-212 DK-74132111-1010668456-0073-20041001 802 602 60274 CTR, Spidslastcentral Phistersvej DK-213 DK-74132111-1010668464-0074-20041001 392 294 29376 CTR, Kbh. Lufthavn Centralen DK-214 DK-74132111-1010668472-0076-20041001 1142 856 857
Annex D1: Installations covered by the Act on CO2 Allowances 2005-2007 as of 1 February 2005.
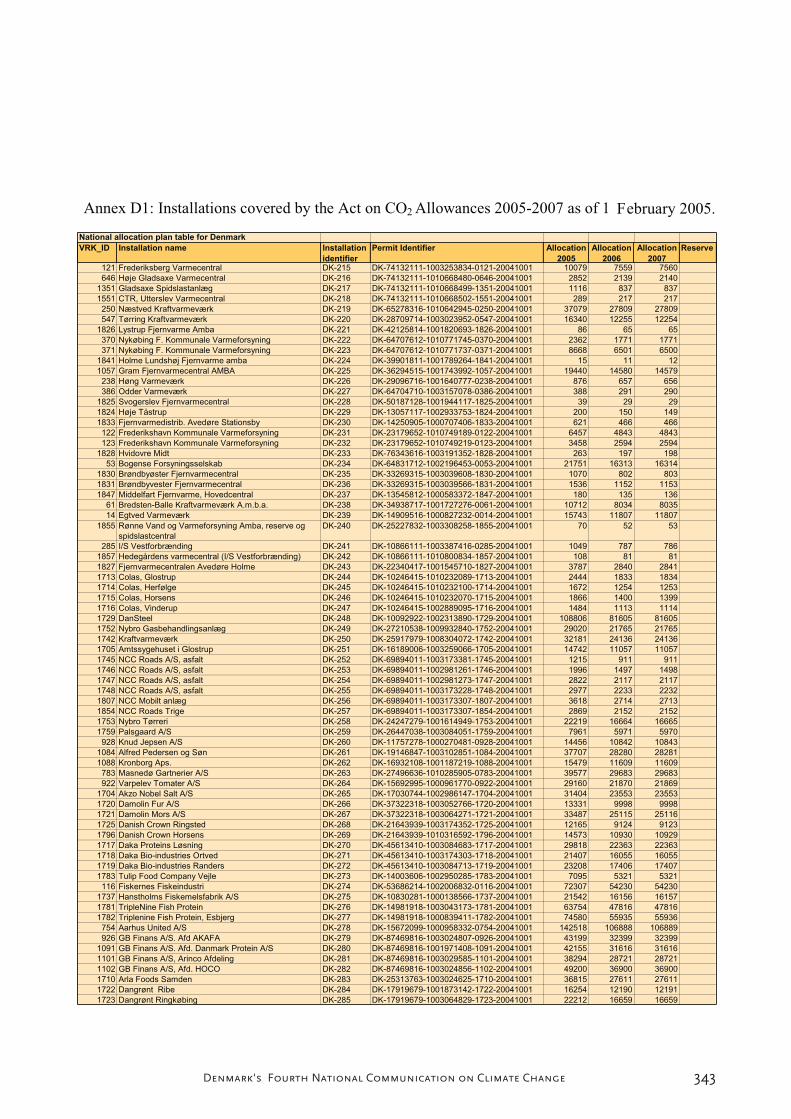
343Denmark's Fourth National Communication on Climate Change
Annex D1: Installations covered by the Act on CO2 Allowances 2005-2007 as of 1 February 2005.
National allocation plan table for Denmark
VRK_ID Installation name Installation
identifier
Permit Identifier Allocation
2005
Allocation
2006
Allocation
2007
Reserve
121 Frederiksberg Varmecentral DK-215 DK-74132111-1003253834-0121-20041001 10079 7559 7560646 Høje Gladsaxe Varmecentral DK-216 DK-74132111-1010668480-0646-20041001 2852 2139 2140
1351 Gladsaxe Spidslastanlæg DK-217 DK-74132111-1010668499-1351-20041001 1116 837 8371551 CTR, Utterslev Varmecentral DK-218 DK-74132111-1010668502-1551-20041001 289 217 217250 Næstved Kraftvarmeværk DK-219 DK-65278316-1010642945-0250-20041001 37079 27809 27809547 Tørring Kraftvarmeværk DK-220 DK-28709714-1003023952-0547-20041001 16340 12255 12254
1826 Lystrup Fjernvarme Amba DK-221 DK-42125814-1001820693-1826-20041001 86 65 65370 Nykøbing F. Kommunale Varmeforsyning DK-222 DK-64707612-1010771745-0370-20041001 2362 1771 1771371 Nykøbing F. Kommunale Varmeforsyning DK-223 DK-64707612-1010771737-0371-20041001 8668 6501 6500
1841 Holme Lundshøj Fjernvarme amba DK-224 DK-39901811-1001789264-1841-20041001 15 11 121057 Gram Fjernvarmecentral AMBA DK-225 DK-36294515-1001743992-1057-20041001 19440 14580 14579238 Høng Varmeværk DK-226 DK-29096716-1001640777-0238-20041001 876 657 656386 Odder Varmeværk DK-227 DK-64704710-1003157078-0386-20041001 388 291 290
1825 Svogerslev Fjernvarmecentral DK-228 DK-50187128-1001944117-1825-20041001 39 29 291824 Høje Tåstrup DK-229 DK-13057117-1002933753-1824-20041001 200 150 1491833 Fjernvarmedistrib. Avedøre Stationsby DK-230 DK-14250905-1000707406-1833-20041001 621 466 466122 Frederikshavn Kommunale Varmeforsyning DK-231 DK-23179652-1010749189-0122-20041001 6457 4843 4843123 Frederikshavn Kommunale Varmeforsyning DK-232 DK-23179652-1010749219-0123-20041001 3458 2594 2594
1828 Hvidovre Midt DK-233 DK-76343616-1003191352-1828-20041001 263 197 19853 Bogense Forsyningsselskab DK-234 DK-64831712-1002196453-0053-20041001 21751 16313 16314
1830 Brøndbyøster Fjernvarmecentral DK-235 DK-33269315-1003039608-1830-20041001 1070 802 8031831 Brøndbyvester Fjernvarmecentral DK-236 DK-33269315-1003039566-1831-20041001 1536 1152 11531847 Middelfart Fjernvarme, Hovedcentral DK-237 DK-13545812-1000583372-1847-20041001 180 135 136
61 Bredsten-Balle Kraftvarmeværk A.m.b.a. DK-238 DK-34938717-1001727276-0061-20041001 10712 8034 803514 Egtved Varmeværk DK-239 DK-14909516-1000827232-0014-20041001 15743 11807 11807
1855 Rønne Vand og Varmeforsyning Amba, reserve ogspidslastcentral
DK-240 DK-25227832-1003308258-1855-20041001 70 52 53
285 I/S Vestforbrænding DK-241 DK-10866111-1003387416-0285-20041001 1049 787 7861857 Hedegårdens varmecentral (I/S Vestforbrænding) DK-242 DK-10866111-1010800834-1857-20041001 108 81 811827 Fjernvarmecentralen Avedøre Holme DK-243 DK-22340417-1001545710-1827-20041001 3787 2840 28411713 Colas, Glostrup DK-244 DK-10246415-1010232089-1713-20041001 2444 1833 18341714 Colas, Herfølge DK-245 DK-10246415-1010232100-1714-20041001 1672 1254 12531715 Colas, Horsens DK-246 DK-10246415-1010232070-1715-20041001 1866 1400 13991716 Colas, Vinderup DK-247 DK-10246415-1002889095-1716-20041001 1484 1113 11141729 DanSteel DK-248 DK-10092922-1002313890-1729-20041001 108806 81605 816051752 Nybro Gasbehandlingsanlæg DK-249 DK-27210538-1009932840-1752-20041001 29020 21765 217651742 Kraftvarmeværk DK-250 DK-25917979-1008304072-1742-20041001 32181 24136 241361705 Amtssygehuset i Glostrup DK-251 DK-16189006-1003259066-1705-20041001 14742 11057 110571745 NCC Roads A/S, asfalt DK-252 DK-69894011-1003173381-1745-20041001 1215 911 9111746 NCC Roads A/S, asfalt DK-253 DK-69894011-1002981261-1746-20041001 1996 1497 14981747 NCC Roads A/S, asfalt DK-254 DK-69894011-1002981273-1747-20041001 2822 2117 21171748 NCC Roads A/S, asfalt DK-255 DK-69894011-1003173228-1748-20041001 2977 2233 22321807 NCC Mobilt anlæg DK-256 DK-69894011-1003173307-1807-20041001 3618 2714 27131854 NCC Roads Trige DK-257 DK-69894011-1003173307-1854-20041001 2869 2152 21521753 Nybro Tørreri DK-258 DK-24247279-1001614949-1753-20041001 22219 16664 166651759 Palsgaard A/S DK-259 DK-26447038-1003084051-1759-20041001 7961 5971 5970928 Knud Jepsen A/S DK-260 DK-11757278-1000270481-0928-20041001 14456 10842 10843
1084 Alfred Pedersen og Søn DK-261 DK-19146847-1003102851-1084-20041001 37707 28280 282811088 Kronborg Aps. DK-262 DK-16932108-1001187219-1088-20041001 15479 11609 11609783 Masnedø Gartnerier A/S DK-263 DK-27496636-1010285905-0783-20041001 39577 29683 29683922 Varpelev Tomater A/S DK-264 DK-15692995-1000961770-0922-20041001 29160 21870 21869
1704 Akzo Nobel Salt A/S DK-265 DK-17030744-1002986147-1704-20041001 31404 23553 235531720 Damolin Fur A/S DK-266 DK-37322318-1003052766-1720-20041001 13331 9998 99981721 Damolin Mors A/S DK-267 DK-37322318-1003064271-1721-20041001 33487 25115 251161725 Danish Crown Ringsted DK-268 DK-21643939-1003174352-1725-20041001 12165 9124 91231796 Danish Crown Horsens DK-269 DK-21643939-1010316592-1796-20041001 14573 10930 109291717 Daka Proteins Løsning DK-270 DK-45613410-1003084683-1717-20041001 29818 22363 223631718 Daka Bio-industries Ortved DK-271 DK-45613410-1003174303-1718-20041001 21407 16055 160551719 Daka Bio-industries Randers DK-272 DK-45613410-1003084713-1719-20041001 23208 17406 174071783 Tulip Food Company Vejle DK-273 DK-14003606-1002950285-1783-20041001 7095 5321 5321116 Fiskernes Fiskeindustri DK-274 DK-53686214-1002006832-0116-20041001 72307 54230 54230
1737 Hanstholms Fiskemelsfabrik A/S DK-275 DK-10830281-1000138566-1737-20041001 21542 16156 161571781 TripleNine Fish Protein DK-276 DK-14981918-1003043173-1781-20041001 63754 47816 478161782 Triplenine Fish Protein, Esbjerg DK-277 DK-14981918-1000839411-1782-20041001 74580 55935 55936754 Aarhus United A/S DK-278 DK-15672099-1000958332-0754-20041001 142518 106888 106889926 GB Finans A/S. Afd AKAFA DK-279 DK-87469816-1003024807-0926-20041001 43199 32399 32399
1091 GB Finans A/S. Afd. Danmark Protein A/S DK-280 DK-87469816-1001971408-1091-20041001 42155 31616 316161101 GB Finans A/S, Arinco Afdeling DK-281 DK-87469816-1003029585-1101-20041001 38294 28721 287211102 GB Finans A/S, Afd. HOCO DK-282 DK-87469816-1003024856-1102-20041001 49200 36900 369001710 Arla Foods Samden DK-283 DK-25313763-1003024625-1710-20041001 36815 27611 276111722 Dangrønt Ribe DK-284 DK-17919679-1001873142-1722-20041001 16254 12190 121911723 Dangrønt Ringkøbing DK-285 DK-17919679-1003064829-1723-20041001 22212 16659 16659

344 Denmark's Fourth National Communication on Climate Change
Annex D1: Installations covered by the Act on CO2 Allowances 2005-2007 as of 1 February 2005.
National allocation plan table for Denmark
VRK_ID Installation name Installation
identifier
Permit Identifier Allocation
2005
Allocation
2006
Allocation
2007
Reserve
1701 A/S AROVIT PETFOOD DK-286 DK-78804912-1003198515-1701-20041001 13786 10340 10339500 Danisco Sugar, Nykøbing Sukkerfabrik DK-287 DK-11350356-1003073438-0500-20041001 121886 91415 91415740 Danisco Sugar, Nakskov Sukkerfabrik DK-288 DK-11350356-1003073359-0740-20041001 160339 120254 120255742 Danisco Sugar, Assens Sukkerfabrik DK-289 DK-11350356-1003073426-0742-20041001 85840 64380 64379
1799 Danisco Gørlev DK-290 DK-11350356-1003073505-1799-20041001 26190 19642 19643760 CP Kelko ApS DK-291 DK-21210285-1001573553-0760-20041001 132797 99598 99598
1730 De Danske Spritfabrikker Aalborg DK-292 DK-21409677-1003073529-1730-20041001 7406 5555 5555734 Carlsberg Danmark A/S DK-293 DK-25508386-1003138695-0734-20041001 40722 30542 30541
1403 Carlsberg A/S DK-294 DK-25508386-1000619820-1403-20041001 27647 20735 207351568 Danish Malting Group DK-295 DK-16993409-1001199629-1568-20041001 40180 30135 301351087 Dragsbaek Maltfabrik A/S DK-296 DK-71174611-1002336930-1087-20041001 40264 30198 301991738 Harboes Bryggeri A/S DK-297 DK-43910515-1001845554-1738-20041001 8044 6033 60321703 Midtjydsk Farveri DK-298 DK-34730210-1001724356-1703-20041001 19436 14577 145761732 EGETÆPPER A/S DK-299 DK-38454218-1001767559-1732-20041001 7822 5866 5867364 Novopan Træindustri A/S DK-300 DK-11766110-1002911982-0364-20041001 20901 15676 15676743 Dalum Papir A/S DK-301 DK-20284196-1003138658-0743-20041001 73846 55385 55385782 Dalum Papir Maglemølle DK-302 DK-20284196-1003138646-0782-20041001 6912 5184 5184
1771 SCA Packaging Djursland DK-303 DK-40547819-1001798079-1771-20041001 0 0 01772 Skjern Papirfabrik A/S DK-304 DK-83031212-1003207862-1772-20041001 15735 11801 11801744 Brødrene Hartmann A/S DK-305 DK-63049611-1003151998-0744-20041001 97632 73224 73224
1 Shell Raffinaderiet Fredericia DK-306 DK-10373816-1002893194-0001-20041001 600169 450127 4501271773 Statoil Raffinaderiet DK-307 DK-28142412-1003022853-1773-20041001 648450 486338 4863381775 Sun Chemical A/S DK-308 DK-21420018-1001535091-1775-20041001 19163 14372 143721751 Novozymes A/S DK-309 DK-10007127-1007675476-1751-20041001 19107 14330 14330302 Kemira, Fredericia DK-310 DK-10604133-1002898822-0302-20041001 73813 55360 55360
1396 Cheminova A/S DK-311 DK-12760043-1000441076-1396-20041001 111670 83752 83752751 BASF Health & Nutrition A/S DK-312 DK-67340728-1002249342-0751-20041001 40836 30627 30626
1750 Novo Nordisk A/S DK-313 DK-24256790-1007676162-1750-20041001 13321 9991 99911736 Haldor Topsøe A/S DK-314 DK-41853816-1003065230-1736-20041001 37166 27875 278751109 Roulunds Fabrikker A/S DK-315 DK-27364926-1001760037-1109-20041001 27333 20500 204991712 Codan Gummi A/S DK-316 DK-21372315-1003003370-1712-20041001 6220 4665 46661766 Rexam Glass Holmegaard A/S DK-317 DK-18445042-1003465733-1766-20041001 86502 64877 648771770 Saint Gobain Isover A/S DK-318 DK-11933238-1000301355-1770-20041001 11389 8542 85421702 A/S Bachmanns Teglværk DK-319 DK-31978017-1001683002-1702-20041001 6236 4677 46781711 Carl Matzens Teglværk A/S DK-320 DK-42125210-1001820681-1711-20041001 4395 3296 32961734 Gråsten Teglværk DK-321 DK-40294619-1001794437-1734-20041001 5518 4138 41391739 Helligsø Teglværk A/S DK-322 DK-36967110-1001750470-1739-20041001 8096 6072 60721741 Højslev Tegl A/S DK-323 DK-67863828-1003550278-1741-20041001 7385 5539 55381743 Lafarge Tekkin A/S - Volstrup Teglværk DK-324 DK-31310113-1002934402-1743-20041001 6964 5223 52221744 LUNDGÅRD TEGLVÆRK A/S DK-325 DK-38016210-1001761987-1744-20041001 12316 9237 92371749 Nordtegl A/S DK-326 DK-75922019-1002474738-1749-20041001 4948 3711 37111757 Orebo Teglværk A/S DK-327 DK-26171350-1001478753-1757-20041001 7232 5424 54251761 PETERSEN TEGL EGERNSUND A/S DK-328 DK-28672012-1001634638-1761-20041001 9478 7109 71091762 PETERSMINDE TEGLVÆRK A/S DK-329 DK-33778716-1000268567-1762-20041001 15889 11917 119171763 Pipers Teglværker A/S Gandrup Teglværk DK-330 DK-23998513-1003013090-1763-20041001 23081 17311 173101764 PIPERS TEGLVÆRKER A/S Hammershøj Teglværk DK-331 DK-23998513-1003013089-1764-20041001 20050 15038 150371780 Ydby Teglværk A/S DK-332 DK-81664315-1007655432-1780-20041001 10704 8028 80271784 Tychsen's Teglværk A/S DK-333 DK-15517077-1000937672-1784-20041001 5832 4374 43741785 Vedstaarup Teglværk A/S DK-334 DK-48791018-1001920902-1785-20041001 16256 12192 121931774 STOFFERS TEGLVÆRK A/S DK-335 DK-82753915-1001679006-1774-20041001 5652 4239 42401786 Vesterled Teglværk A/S DK-336 DK-82753915-1002654599-1786-20041001 7558 5669 56691544 Villemoes Teglværk DK-337 DK-45231216-1001865577-1544-20041001 6836 5127 51271788 Vindø Teglværk A/S DK-338 DK-32232515-1001687185-1788-20041001 10729 8047 80461760 Pedershvile Teglværk DK-339 DK-10502306-1002997604-1760-20041001 12958 9718 97191765 Prøvelyst Teglværk DK-340 DK-10502306-1002997598-1765-20041001 13097 9823 98231789 WIENERBERGER A/S DK-341 DK-10502306-1002896764-1789-20041001 6814 5110 5111
7 Aalborg Portland A/S DK-342 DK-14244441-1002952999-0007-20041001 3333987 2500490 25004911733 Faxe Kalk, Ovnanlægget Stubberup DK-343 DK-20882182-1005184196-1733-20041001 132805 99604 996031726 Danogips DK-344 DK-54050313-1003103433-1726-20041001 25363 19022 190231735 Gyproc A/S DK-345 DK-27237916-1001610372-1735-20041001 24772 18579 185791727 DANSK ETERNIT A/S DK-346 DK-58711713-1002086335-1727-20041001 13546 10159 101591776 Tarco Vej A/S DK-347 DK-10977193-1003321148-1776-20041001 1275 956 9571777 Tarco Vej A/S DK-348 DK-10977193-1002905302-1777-20041001 3422 2567 25671778 Tarco Vej A/S DK-349 DK-10977193-1002905326-1778-20041001 3247 2435 24361779 Tarco Vej A/S DK-350 DK-10977193-1002905314-1779-20041001 2910 2182 21831767 Rockwool A/S Doense DK-351 DK-42391719-1003070026-1767-20041001 53238 39929 399291768 Rockwool A/S, Hedehusene DK-352 DK-42391719-1003070002-1768-20041001 35320 26490 264911769 Rockwool A/S, Vamdrup DK-353 DK-42391719-1003070014-1769-20041001 60536 45402 454021728 Dansk Leca A/S DK-354 DK-59983016-1003135246-1728-20041001 78285 58714 587131756 Maxit Ølst DK-355 DK-12841736-1002931142-1756-20041001 69788 52341 523411395 Danfoss DK-356 DK-20165715-1002999115-1395-20041001 35420 26565 265641754 ODENSE STAALSKIBSVÆRFT A/S DK-357 DK-45739910-1003085393-1754-20041001 19621 14716 14716
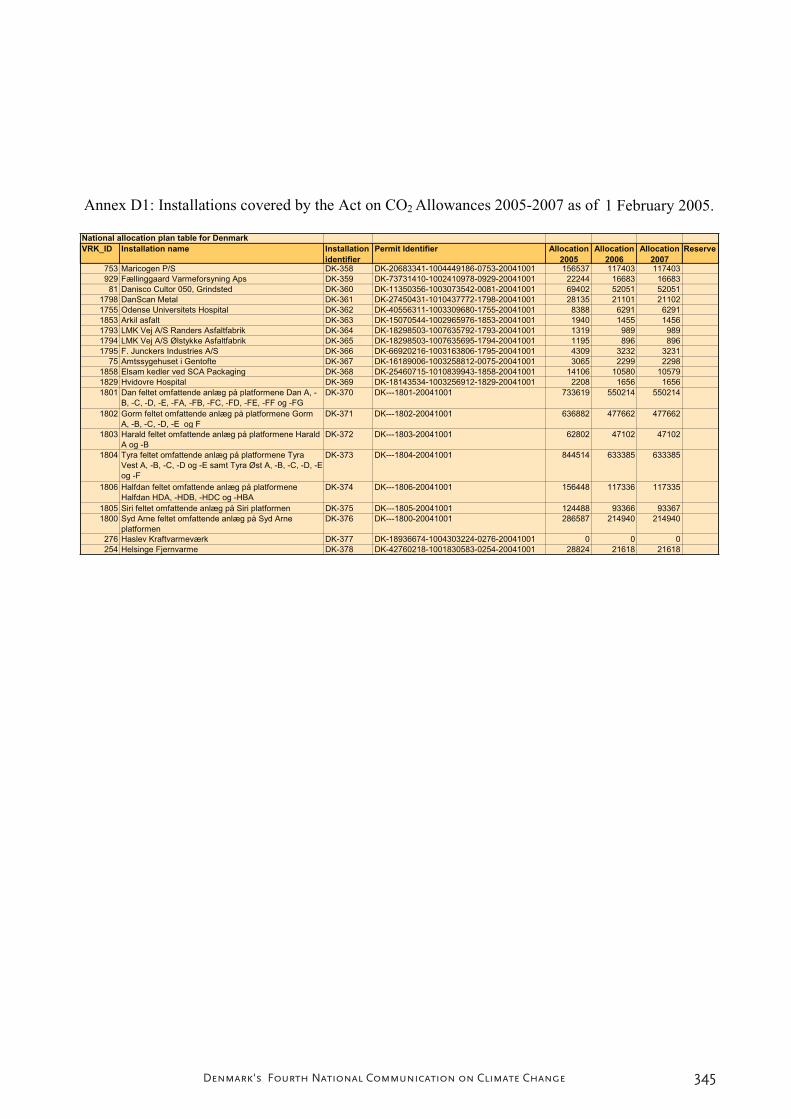
345Denmark's Fourth National Communication on Climate Change
National allocation plan table for Denmark
VRK_ID Installation name Installation
identifier
Permit Identifier Allocation
2005
Allocation
2006
Allocation
2007
Reserve
753 Maricogen P/S DK-358 DK-20683341-1004449186-0753-20041001 156537 117403 117403929 Fællinggaard Varmeforsyning Aps DK-359 DK-73731410-1002410978-0929-20041001 22244 16683 1668381 Danisco Cultor 050, Grindsted DK-360 DK-11350356-1003073542-0081-20041001 69402 52051 52051
1798 DanScan Metal DK-361 DK-27450431-1010437772-1798-20041001 28135 21101 211021755 Odense Universitets Hospital DK-362 DK-40556311-1003309680-1755-20041001 8388 6291 62911853 Arkil asfalt DK-363 DK-15070544-1002965976-1853-20041001 1940 1455 14561793 LMK Vej A/S Randers Asfaltfabrik DK-364 DK-18298503-1007635792-1793-20041001 1319 989 9891794 LMK Vej A/S Ølstykke Asfaltfabrik DK-365 DK-18298503-1007635695-1794-20041001 1195 896 8961795 F. Junckers Industries A/S DK-366 DK-66920216-1003163806-1795-20041001 4309 3232 3231
75 Amtssygehuset i Gentofte DK-367 DK-16189006-1003258812-0075-20041001 3065 2299 22981858 Elsam kedler ved SCA Packaging DK-368 DK-25460715-1010839943-1858-20041001 14106 10580 105791829 Hvidovre Hospital DK-369 DK-18143534-1003256912-1829-20041001 2208 1656 16561801 Dan feltet omfattende anlæg på platformene Dan A, -
B, -C, -D, -E, -FA, -FB, -FC, -FD, -FE, -FF og -FGDK-370 DK---1801-20041001 733619 550214 550214
1802 Gorm feltet omfattende anlæg på platformene GormA, -B, -C, -D, -E og F
DK-371 DK---1802-20041001 636882 477662 477662
1803 Harald feltet omfattende anlæg på platformene HaraldA og -B
DK-372 DK---1803-20041001 62802 47102 47102
1804 Tyra feltet omfattende anlæg på platformene TyraVest A, -B, -C, -D og -E samt Tyra Øst A, -B, -C, -D, -Eog -F
DK-373 DK---1804-20041001 844514 633385 633385
1806 Halfdan feltet omfattende anlæg på platformeneHalfdan HDA, -HDB, -HDC og -HBA
DK-374 DK---1806-20041001 156448 117336 117335
1805 Siri feltet omfattende anlæg på Siri platformen DK-375 DK---1805-20041001 124488 93366 933671800 Syd Arne feltet omfattende anlæg på Syd Arne
platformenDK-376 DK---1800-20041001 286587 214940 214940
276 Haslev Kraftvarmeværk DK-377 DK-18936674-1004303224-0276-20041001 0 0 0254 Helsinge Fjernvarme DK-378 DK-42760218-1001830583-0254-20041001 28824 21618 21618
Annex D1: Installations covered by the Act on CO2 Allowances 2005-2007 as of 1 February 2005.

346 Denmark's Fourth National Communication on Climate Change
1. Information on the registry
administrator
The Danish Environmental Pro-tection AgencyStrandgade 29DK-1401 Copenhagen KTel. : +45 32 66 01 60Fax: +45 32 66 02 01e-mail: [email protected]
2. Cooperation with other
countries concerning the op-
eration of the registry
Denmark does not cooperate with other countries concerning the administration or operation of the Danish CO2 emissions trading registry.
3. Standards for data exchange
The Danish registry system fol-lows the UN Data Exchange Standards 7.
4. Procedures for administra-
tion and operation of the
emissions trading registry
The procedures are described in the Commission regula-tion (EC) no. 2216/2004 on a standardised and secure system of registries adopted pursuant to the Parliament and Council directive 2003/87/EC and the Parliament and Council decision 280/2004/EC.Denmark is in compliance with the procedures stated in the regulation.
5. Safety standards
The registry is safeguarded with a FireWall based on 2 Cisco
Annex D2: Information on Denmark’s national CO2 allowance registry
FireWall Software Modules (FWSM) in a Catalyst 6507. There is dual access from all servers to the Internet, ensuring that a single error will not cause disconnection. The RILO ports on the servers are connected to the internal networks, mak-ing it possible to have remote control of the machines via a secure net. Software is updated as required. The entire system is monitored regularly and all security violations are recorded and corrected as soon as pos-sible. As regards the network, administrative access to the machines from the Ministry’s internal network is secure. The Registry can only be accessed via the programme through WEB-Services. These WEB-Services can be accessed either through an open part (the initial communication) or a secure part (the register software ap-plication itself).The secure part of the system is based on SSL. Similarly the system is designed so as to make it impossible to use the same password more than once in the system. The Registry’s production system consists of 2 servers, a WEB server and a database server. The servers are configured so that a single disc error will not stop the system. Furthermore as regards the disc, the DB server is set up so that the transaction log and the database are physi-cally located on separate discs. Everyone who registers as us-
347Denmark's Fourth National Communication on Climate Change
ers of the registry receives their own username and password and is instructed to ensure that these remain confidential. If a user discovers that an unauthor-ized person has gained access to his/her password, the password must be changed in the registry immediately and the registry administration must be notified. The registry automatically dis-connects when access as been inactive for some time. You must log on again using your username and password.
6. Information available to the
public
Only the information stated in article 9 and the corresponding appendices in the Commission regulation (EC) no. 2216/2004 on a standardised and secure system of registries adopted pursuant to the Parliament and Council directive 2003/87/EC and the Parliament and Council decision 280/2004/EC is avail-able to the public.
7. Internet address for the reg-
istry
http://dketreu.mst.dk/
8. Protection, maintenance and
recreation of data
A total back-up is carried out on a nightly basis. The system is configured with a high error tolerance level. Furthermore the configuration of the system makes it possible to re-install it at a different physical location. The registry is covered by the
general emergency plan for the Danish Ministry of the Environ-ment.
Only persons authorised by the min-istry will be granted access to the production environment.
Only representatives appointed by the administrator of the registry and a small number of employees in the host organisation have access to all data in the registry system. All of these persons are covered by a duty of non-disclosure. Any physical or technical access to the system from the system administrator (the host organisation) will be logged.
The registry administrators change their passwords every three months and when needed.
Emergency plan for the Danish
CO2
Emissions Trading Registry:
The description below includes a check list to be used in the event of an emergency situation affecting the Danish Emissions Trading Registry. The check list is to be used if the telephone company’s (TDC) ser-vice centre is out of order, or if the equipment the system uses is dam-aged. The check list refers to the general system documentation for the Danish Emissions Trading Reg-istry, which includes a detailed de-scription of procedures. The starting point for reinstallation is to give pri-ority to actions so as to ensure that an operative system is established as soon as possible and that users, including CITL/ITL, experience as little down time as possible.

348 Denmark's Fourth National Communication on Climate Change
Check list:
1. Contact the hardware group of the Centre for Corporate Man-agement to get a server/PC.
2. Place the server/PC in the hub at the Centre for Corporate Management, IT Services, Rentemestervej 8, building A, first floor.
3. Install Microsoft Windows 2003 on the server.
4. Install Microsoft SQL2000 on the server.
5. Install Microsoft Internet Infor-mation Server on the server.
6. Install Backup client on the server.
7. Install the ETR system and adapt it to Danish conditions (menu bar, the EPA logo, EPA fonts and colours, conditions etc.).
8. Set up user on the SQL server.
9. Re-establish the certificate for a secure connection between CITL and the Danish ETR.
10. Read in a backup of the Danish ETR database.
11. Start Register services on the server.
The Danish ETR will now run on a temporary installation, and work to re-establish a new permanent pro-duction system will be continued.
349Denmark's Fourth National Communication on Climate Change
This Annex consists of the following 2 sub-annexes:
Annex E1: The results of Den-mark’s May 2005 ‘with measures’ projection of greenhouse gas emis-sions 2004-2030, cf. Memorandum from NERI, May 2005.
Note to Tables E1-1 to E1-8: The tables show the historical and pro-jected greenhouse gas emissions in ´000 tonnes CO2 equivalents for CO2, methane (CH4), nitrous ox-ide (N2O) and the F-gases (HFCs, PFCs and SF6) respectively. Calcu-lation of the emissions for the vari-ous IPCC categories are described in chapters 2-9 in Projection of greenhouse gas emissions 2004 to 2030, Memorandum to the Danish EPA, NERI, May 2005 – except for emissions from the use of solvents (6). CO2 emissions from the use of solvents are based on a new method developed by NERI for calculation of the NMVOC emissions. The conversion factor from NMVOC to carbon is assumed to be 0.85 and the historical emissions in 2003 have been used for the projection of the NMVOC emissions. Emissions from storage of coal have previously been included in the historical invento-ries, however they are not included in the projections now. In the same magnitude, projections for industrial processes do not yet include sources that have not been implemented in the historical inventories. It is therefore expected that in the next reporting of the historical invento-ries to the Climate Convention, the
Annex E Results and supplementary information concerning greenhouse gas projections
sources included in the historical inventories will fully concur with the sources included in the projections. In total these changes will corre-spond to less than 0.1 million tonnes CO2 equivalents.
Notes to Table E1-8:
* Include process emissions – that is corresponding to the IPCC category Industry, in that industry’s energy consumption is included under En-ergy – as well as emissions from the use of organic solvents.
** Only includes methane and ni-trous oxide from agriculture, that is corresponding to the IPCC category Agriculture – in that agriculture’s energy consumption is included un-der Energy.
*** Includes the total net emissions from land-use, land-use change and forestry in accordance with the Cli-mate Convention, which is different from what can be included under Articles 3.3 and 3.4 of the Kyoto Protocol.
**** Also includes emissions from wastewater treatment, cf. the IPCC guidelines.
Annex E2: A brief description of the work involved in preparing the energy projections.
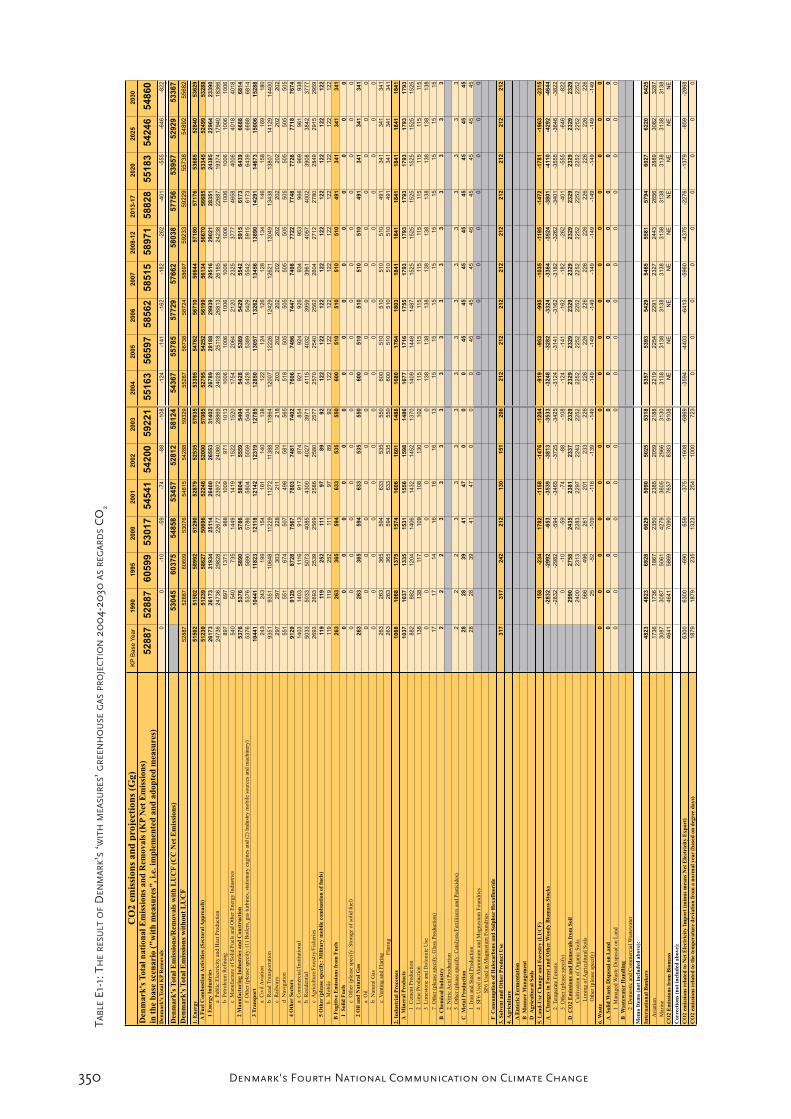
350 Denmark's Fourth National Communication on Climate Change
CO
2 e
mis
sio
ns
an
d p
roje
ctio
ns
(Gg
)K
P B
ase
Year
1990
1995
2000
2001
2002
2003
2004
2005
2006
2007
2008-1
22013-1
72020
2025
2030
Den
mark
'sT
ota
l n
ati
on
al
Em
issi
on
s an
d R
emovals
(K
P N
et E
mis
sion
s)
in t
he
base
sce
nari
o (
"w
ith
mea
sure
s", i.
e. i
mp
lem
ente
d a
nd
ad
op
ted
mea
sure
s )5
28
87
52
88
76
05
99
53
01
75
45
41
54
20
05
92
21
55
16
35
65
97
58
56
25
85
15
58
97
15
88
28
55
18
35
42
46
54
86
0
Den
mark
'sT
ota
l K
P R
emovals
00
-10
-59
-74
-88
-108
-124
-141
-162
-182
-262
-401
-555
-646
-822
00
0
Den
mark
'sT
ota
l E
mis
sion
s/R
emovals
wit
h L
UC
F (
CC
Net
Em
issi
on
s)5
30
45
60
37
55
48
58
53
45
75
28
12
58
12
45
43
67
55
78
55
77
29
57
66
25
80
38
57
75
65
39
57
52
92
95
33
67
Den
mark
'sT
ota
l E
mis
sion
s w
ith
ou
t L
UC
F52887
52887
60609
53076
54615
54288
59329
55287
56738
58724
58697
59233
59229
55738
54892
55682
1.
En
ergy
51502
51502
58992
51290
52879
52535
57635
53395
54762
56710
56644
57180
57176
53685
52840
53629
A F
uel
Com
bu
stio
n A
ctiv
itie
s (S
ecto
ral A
pp
roa
ch)
51239
51239
58627
50696
52246
52000
57085
52795
54252
56199
56134
56670
56685
53345
52499
53288
1 E
ner
gy I
nd
ust
ries
26173
26173
31934
25114
26400
26553
31402
26789
28188
29939
29516
29021
28351
24385
22964
23390
a
P
ubli
c E
lect
rici
ty a
nd H
eat
Pro
du
ctio
n24736
24736
29828
22677
23972
24060
28869
24028
2511
826813
26185
24238
22687
19374
17940
18366
b
P
etro
leum
Ref
inin
g897
897
1371
988
1009
971
1013
1006
1006
1006
1006
1006
1006
1006
1006
1006
c
M
anufa
cture
of
Soli
d F
uel
s an
d O
ther
En
erg
y I
nd
ust
ries
540
540
735
1449
1419
1522
1520
1754
2064
2120
2325
3777
4658
4006
4018
4018
2 M
an
ufa
ctu
rin
g I
nd
ust
ries
an
d C
on
stru
ctio
n5376
5376
5890
5786
5804
5559
5404
5428
5389
5429
5542
5915
6173
6439
6688
6814
f
O
ther
(ple
ase
spec
ify:
(1)
Bo
iler
s, g
as t
urb
ines
, st
atio
nar
y e
ng
ines
an
d (
2)
Ind
ust
ry m
ob
ile
sou
rces
and m
ach
iner
y)
5376
5376
5890
5786
5804
5559
5404
5428
5389
5429
5542
5915
6173
6439
6688
6814
3 T
ran
sport
10441
10441
11823
12118
12142
12319
12785
12850
13057
13262
13456
13890
14291
14673
15006
15288
a
C
ivil
Avia
tion
243
243
199
154
161
140
138
122
124
126
128
134
146
158
169
180
b
R
oad
Tra
nsp
ort
atio
n9351
9351
10648
11229
11272
11388
11864
12007
12226
12429
12621
13049
13438
13807
14129
14400
c
R
ailw
ays
297
297
303
228
211
210
218
203
202
202
202
202
202
202
202
202
d
N
avig
atio
n551
551
674
507
498
581
565
518
505
505
505
505
505
505
505
505
4 O
ther
Sec
tors
9129
9129
8728
7567
7803
7481
7402
7606
7496
7447
7498
7722
7748
7726
7718
7674
a
C
om
mer
cial
/Inst
ituti
on
al1403
1403
1116
913
917
874
854
921
924
926
934
953
966
969
961
938
b
R
esid
enti
al5033
5033
5073
4085
4300
4027
3971
411
54032
3959
3961
4057
4002
3908
3842
3777
c
Agri
cult
ure
/Fore
stry
/Fis
her
ies
2693
2693
2539
2569
2586
2580
2577
2570
2540
2562
2604
2712
2780
2849
2915
2959
5 O
ther
(p
lease
sp
ecif
y:
Mil
ita
ry m
ob
ile
com
bu
stio
n o
f fu
els)
119
119
252
111
97
89
92
122
122
122
122
122
122
122
122
122
b.
Mobil
e11
911
9252
111
97
89
92
122
122
122
122
122
122
122
122
122
B
Fu
git
ive
Em
issi
on
s fr
om
Fu
els
263
263
365
594
633
535
550
600
510
510
510
510
491
341
341
341
1
Soli
d F
uel
s0
00
00
00
00
00
00
00
0
c
O
ther
(ple
ase
spec
ify:
Sto
rag
e o
f so
lid
fu
el)
00
00
00
00
00
00
00
00
2 O
il a
nd
Natu
ral
Gas
263
263
365
594
633
535
550
600
510
510
510
510
491
341
341
341
a
O
il0
00
00
00
00
00
00
00
0
b
Nat
ura
l G
as0
00
00
00
00
00
00
00
0
cV
enti
ng a
nd F
lari
ng
263
263
365
594
633
535
550
600
510
510
510
510
491
341
341
341
Fla
rin
g263
263
365
594
633
535
550
600
510
510
510
510
491
341
341
341
2.
Ind
ust
rial
Pro
cess
es1068
1068
1375
1574
1606
1601
1488
1680
1764
1803
1841
1841
1841
1841
1841
1841
A
Min
eral
Pro
du
cts
1037
1037
1335
1531
1556
1598
1486
1677
1716
1755
1793
1793
1793
1793
1793
1793
1
Cem
ent
Pro
duct
ion
882
882
1204
1406
1432
1452
1370
1409
1448
1487
1525
1525
1525
1525
1525
1525
2
Lim
e P
roduct
ion
138
138
117
109
108
130
102
115
115
115
115
115
115
115
115
115
3
Lim
esto
ne
and D
olo
mit
e U
se0
00
00
00
138
138
138
138
138
138
138
138
138
7
Oth
er (
ple
ase
spec
ify:
Gla
ss P
rod
uct
ion
)17
17
14
16
16
16
13
15
15
15
15
15
15
15
15
15
B
C
hem
ical
Ind
ust
ry
22
23
33
33
33
33
33
33
2
Nit
ric
Aci
d P
roduct
ion
5
Oth
er (
ple
ase
spec
ify:
Cat
aly
sts/
Fer
tili
zers
an
d P
esti
cid
es)
22
23
33
33
33
33
33
33
C
M
etal
Pro
du
ctio
n28
28
39
41
47
00
045
45
45
45
45
45
45
45
1
Iron a
nd S
teel
Pro
duct
ion
28
28
39
41
47
00
045
45
45
45
45
45
45
45
4
SF
6 U
sed i
n A
lum
iniu
m a
nd
Mag
nes
ium
Fo
un
dri
es0
00
00
00
00
S
F6 U
sed i
n M
agnes
ium
Fo
un
dri
es
F
C
on
sum
pti
on
of
Halo
carb
on
s a
nd
Su
lph
ur
Hex
afl
uo
rid
e
3.
Solv
ent
an
d O
ther
Pro
du
ct U
se317
317
242
212
130
151
206
212
212
212
212
212
212
212
212
212
4.A
gri
cult
ure
A E
nte
ric
Fer
men
tati
on
B
M
an
ure
Man
agem
ent
D
Agri
cult
ura
l S
oil
s
5.
Lan
d-U
se C
han
ge
an
d F
ore
stry
(L
UC
F)
158
-234
1782
-1158
-1476
-1204
-919
-953
-995
-1035
-1195
-1472
-1781
-1963
-2315
A
Ch
an
ges
in
Fore
st a
nd
Oth
erW
oo
dy
Bio
ma
ss S
tock
s-2
832
-2992
-653
-3539
-3813
-3533
-3248
-3282
-3324
-3364
-3524
-3801
-4110
-4292
-4644
2
Tem
per
ate
Fore
sts
-2832
-2982
-594
-3465
-3725
-3425
-3124
-3141
-3162
-3182
-3262
-3401
-3555
-3646
-3822
5
Oth
er (
ple
ase
spec
ify)
0-1
0-5
9-7
4-8
8-1
08
-124
-141
-162
-182
-262
-401
-555
-646
-822
D
C
O2 E
mis
sion
s an
d R
emov
als
fro
m S
oil
2990
2758
2435
2381
2337
2329
2329
2329
2329
2329
2329
2329
2329
2329
2329
C
ult
ivat
ion o
f O
rgan
ic S
oil
s2400
2313
2283
2297
2243
2252
2252
2252
2252
2252
2252
2252
2252
2252
2252
Lim
ing o
f A
gri
cult
ura
l S
oil
s566
496
261
201
233
226
226
226
226
226
226
226
226
226
226
Oth
er (
ple
ase
spec
ify)
25
-52
-109
-116
-139
-149
-149
-149
-149
-149
-149
-149
-149
-149
-149
6.W
ast
e0
00
00
00
00
00
00
00
0
A
Soli
d W
ast
e D
isp
osa
l on
Lan
d0
00
00
00
00
00
00
00
0
1
Man
aged
Was
te D
isposa
l o
n L
and
00
00
00
00
00
00
00
00
B
Wast
ewate
r H
an
dli
ng
2
Dom
esti
c an
d C
om
mer
cial
Was
tew
ater
Mem
o I
tem
s (n
ot
incl
ud
ed a
bove)
:
Inte
rnati
on
al
Bu
nk
ers
4823
4823
6928
6629
5990
5025
5318
5357
5393
5429
5465
5581
5794
6027
6220
6425
Avia
tion
1736
1736
1867
2350
2385
2059
2188
2219
2254
2291
2327
2443
2656
2889
3082
3287
Mar
ine
3087
3087
5061
4279
3605
2966
3130
3138
3138
3138
3138
3138
3138
3138
3138
3138
CO
2 E
mis
sion
s fr
om
Bio
mass
4641
4641
5869
7090
7637
8383
9108
NE
NE
NE
NE
NE
NE
NE
NE
NE
Corr
ecti
on
s (n
ot
incl
ud
ed a
bove)
:
CO
2 e
mis
sion
s re
late
d t
o N
et E
lect
rici
ty I
mp
ort
(m
inu
s m
ean
s N
et E
lect
rici
ty E
xp
ort
) 6300
6300
-690
659
-375
-1608
-6869
-3594
-4403
-6413
-5960
-4375
-2276
-1379
-859
-2868
CO
2 e
mis
sion
s re
late
d t
o t
he
tem
per
atu
re d
evia
tio
n f
rom
a n
orm
al
yea
r (b
ase
d o
n d
egre
e d
ay
s)1879
1879
235
1323
254
1000
723
00
00
00
00
0
TAB
LE E
1-1:
TH
ER
ESU
LTO
F D
ENM
AR
K’S
‘WIT
HM
EASU
RES
’GR
EEN
HO
USE
GA
SPR
OJE
CTI
ON
200
4-20
30A
SR
EGA
RD
S C
O2
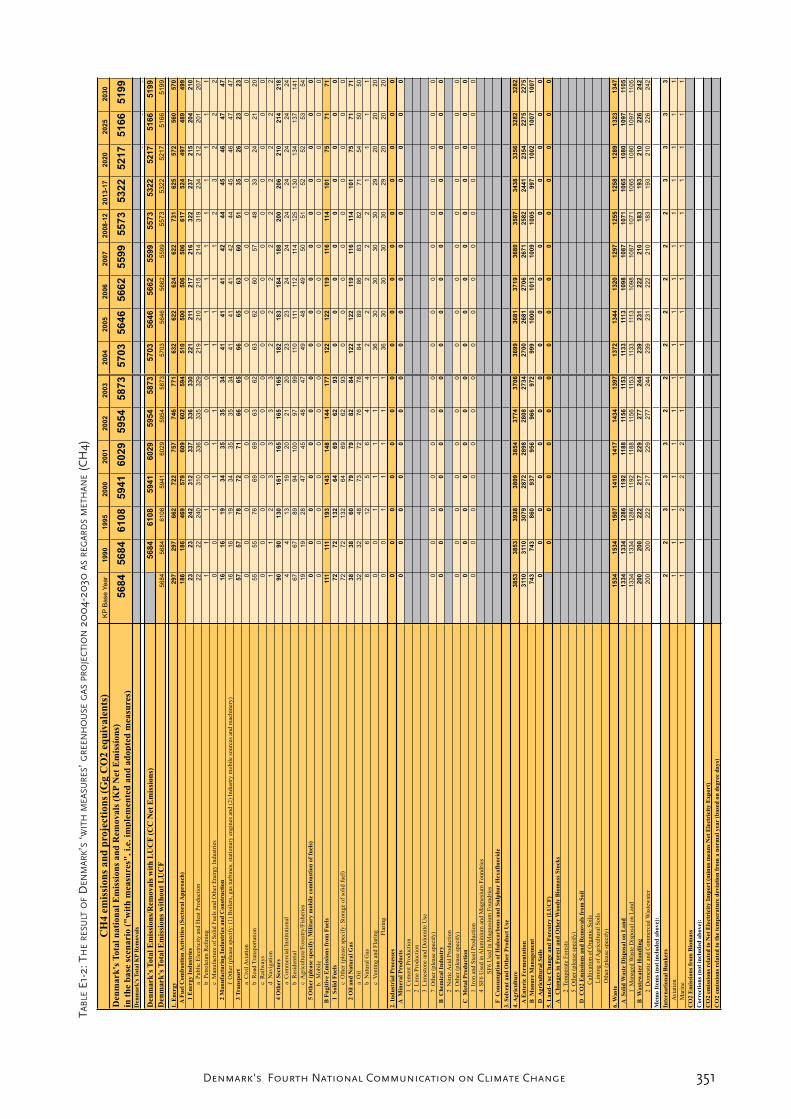
351Denmark's Fourth National Communication on Climate Change
CH
4 e
mis
sion
s an
d p
roje
ctio
ns
(Gg C
O2 e
qu
ivale
nts
)K
P B
ase
Year
1990
1995
2000
2001
2002
2003
2004
2005
2006
2007
2008-1
22013-1
72020
2025
2030
Den
ma
rk's
To
tal
na
tio
na
l E
mis
sio
ns
an
d R
emo
va
ls (
KP
Net
Em
issi
on
s)
in t
he
ba
se s
cen
ari
o (
"w
ith
mea
sure
s",
i.e.
im
ple
men
ted
an
d a
do
pte
d m
easu
res)
5684
5684
6108
5941
6029
5954
5873
5703
5646
5662
5599
5573
5322
5217
5166
5199
Den
ma
rk's
To
tal
KP
Rem
ov
als
00
0
Den
ma
rk's
To
tal
Em
issi
on
s/R
emo
va
ls w
ith
LU
CF
(C
C N
et E
mis
sio
ns)
56
84
61
08
59
41
60
29
59
54
58
73
57
03
56
46
56
62
55
99
55
73
53
22
52
17
51
66
51
99
Den
ma
rk's
To
tal
Em
issi
on
s w
ith
ou
t L
UC
F5684
5684
6108
5941
6029
5954
5873
5703
5646
5662
5599
5573
5322
5217
5166
5199
1.
En
erg
y297
297
662
722
757
746
771
632
622
624
622
731
625
572
560
570
A F
uel
Co
mb
ust
ion
Act
ivit
ies
(Sec
tora
l A
pp
roa
ch)
186
186
469
579
609
602
594
510
500
506
506
617
524
497
489
499
1 E
ner
gy
In
du
stri
es23
23
242
312
337
336
330
221
211
217
216
322
237
215
204
210
a
P
ub
lic
Ele
ctri
city
an
d H
eat
Pro
du
ctio
n22
22
240
310
336
335
329
219
210
215
214
319
234
212
201
207
b
P
etro
leu
m R
efin
ing
11
10
00
01
11
11
11
11
c
M
anu
fact
ure
of
So
lid
Fu
els
and
Oth
er E
ner
gy
In
du
stri
es0
01
11
11
11
11
23
22
2
2
Ma
nu
fact
uri
ng
In
du
stri
es a
nd
Co
nst
ruct
ion
16
16
19
34
35
35
34
41
41
41
42
44
45
46
47
47
f
O
ther
(p
leas
e sp
ecif
y:
(1)
Bo
iler
s, g
as t
urb
ines
, st
atio
nar
y e
ng
ines
an
d (
2)
Ind
ust
ry m
ob
ile
sou
rces
an
d m
achin
ery
)16
16
19
34
35
35
34
41
41
41
42
44
45
46
47
47
3 T
ran
spo
rt57
57
78
72
71
66
65
66
65
63
60
51
35
26
23
23
a
C
ivil
Av
iati
on
00
00
00
00
00
00
00
00
b
R
oad
Tra
nsp
ort
atio
n55
55
76
69
69
63
62
63
62
60
57
48
33
24
21
20
c
R
ailw
ays
00
00
00
00
00
00
00
00
d
N
avig
atio
n1
12
33
33
22
22
22
22
2
4
Oth
er S
ecto
rs90
90
130
161
165
165
165
182
183
184
188
200
206
210
214
218
a
C
om
mer
cial
/In
stit
uti
on
al4
413
19
20
21
20
23
23
24
24
24
24
24
24
24
b
R
esid
enti
al67
67
89
94
100
97
99
110
111
112
114
125
130
134
137
141
c
Ag
ricu
ltu
re/F
ore
stry
/Fis
her
ies
19
19
28
47
45
48
47
49
48
49
50
51
52
52
53
54
5 O
ther
(p
lea
se s
pec
ify
: M
ilit
ary
mo
bil
e co
mb
ust
ion
of
fuel
s)0
00
00
00
00
00
00
00
0
b
. M
ob
ile
00
00
00
00
00
00
00
00
B
Fu
git
ive
Em
issi
on
s fr
om
Fu
els
111
111
193
143
148
144
177
122
122
119
116
114
101
75
71
71
1
So
lid
Fu
els
72
72
132
64
69
62
93
00
00
00
00
0
c
O
ther
(p
leas
e sp
ecif
y:
Sto
rag
e o
f so
lid
fu
el)
72
72
132
64
69
62
93
00
00
00
00
0
2
Oil
an
d N
atu
ral
Ga
s38
38
60
79
79
82
84
122
122
119
116
114
101
75
71
71
a
O
il32
32
48
73
72
76
78
84
89
86
83
82
71
54
50
50
b
N
atu
ral
Gas
66
12
56
44
22
22
21
11
1
cV
enti
ng
an
d F
lari
ng
00
11
11
136
30
30
30
30
29
20
20
20
Fla
rin
g0
01
11
11
36
30
30
30
30
29
20
20
20
2.
Ind
ust
ria
l P
roce
sses
00
00
00
00
00
00
00
00
A
Min
era
l P
rod
uct
s0
00
00
00
00
00
00
00
0
1
C
emen
t P
rod
uct
ion
2
L
ime
Pro
du
ctio
n
3
L
imes
ton
e an
d D
olo
mit
e U
se
7
O
ther
(p
leas
e sp
ecif
y)
00
00
00
00
00
00
00
00
B
C
hem
ica
l In
du
stry
0
00
00
00
00
00
00
00
0
2
N
itri
c A
cid
Pro
du
ctio
n
5
O
ther
(p
leas
e sp
ecif
y)
00
00
00
00
00
00
00
00
C
M
eta
l P
rod
uct
ion
00
00
00
00
00
00
00
00
1
Ir
on
an
d S
teel
Pro
du
ctio
n0
00
00
00
00
00
00
00
0
4
SF
6 U
sed
in
Alu
min
ium
an
d M
agn
esiu
m F
ou
nd
ries
S
F6
Use
d i
n M
agn
esiu
m F
ou
nd
ries
F
C
on
sum
pti
on
of
Ha
loca
rbo
ns
an
d S
ulp
hu
r H
exa
flu
ori
de
3.
So
lven
t a
nd
Oth
er P
rod
uct
Use
4.A
gri
cult
ure
3853
3853
3938
3809
3854
3774
3706
3699
3681
3719
3680
3587
3438
3356
3282
3282
A E
nte
ric
Fer
men
tati
on
3110
3110
3079
2872
2898
2808
2734
2700
2681
2706
2671
2582
2441
2354
2275
2275
B
M
an
ure
Ma
na
gem
ent
743
743
860
937
956
966
972
999
1000
1013
1009
1005
997
1002
1007
1007
D
Ag
ricu
ltu
ral
So
ils
00
00
00
00
00
00
00
00
5.
La
nd
-Use
Ch
an
ge
an
d F
ore
stry
(L
UC
F)
00
00
00
00
00
00
00
0
A
Ch
an
ges
in
Fo
rest
an
d O
ther
Wo
od
y B
iom
ass
Sto
cks
2
Tem
per
ate
Fo
rest
s
5
O
ther
(p
leas
e sp
ecif
y)
D
C
O2
Em
issi
on
s a
nd
Rem
ov
als
fro
m S
oil
C
ult
ivat
ion
of
Org
anic
So
ils
Lim
ing
of
Ag
ricu
ltu
ral
So
ils
Oth
er (
ple
ase
spec
ify
)
6.W
ast
e1534
1534
1507
1410
1417
1434
1397
1372
1344
1320
1297
1255
1258
1289
1323
1347
A
So
lid
Wa
ste
Dis
po
sal
on
La
nd
1334
1334
1286
1192
1188
1156
1153
1133
1113
1098
1087
1071
1065
1080
1097
1105
1
M
anag
ed W
aste
Dis
po
sal
on
Lan
d1334
1334
1286
1192
1188
1156
1153
1133
1113
1098
1087
1071
1065
1080
1097
1105
B
Wa
stew
ate
r H
an
dli
ng
200
200
222
217
229
277
244
239
231
222
210
183
193
210
226
242
2
D
om
esti
c an
d C
om
mer
cial
Was
tew
ater
200
200
222
217
229
277
244
239
231
222
210
183
193
210
226
242
Mem
o I
tem
s (n
ot
incl
ud
ed a
bo
ve)
:
Inte
rna
tio
na
l B
un
ker
s2
23
33
22
22
22
23
33
3
Av
iati
on
11
11
11
11
11
11
11
11
Mar
ine
11
22
21
11
11
11
11
11
CO
2 E
mis
sio
ns
fro
m B
iom
ass
Co
rrec
tio
ns
(no
t in
clu
ded
ab
ov
e):
CO
2 e
mis
sio
ns
rela
ted
to
Net
Ele
ctri
city
Im
po
rt (
min
us
mea
ns
Net
Ele
ctri
city
Ex
po
rt)
CO
2 e
mis
sio
ns
rela
ted
to
th
e te
mp
era
ture
dev
iati
on
fro
m a
no
rma
l y
ear
(ba
sed
on
deg
ree
da
ys)

352 Denmark's Fourth National Communication on Climate Change
N2
O e
mis
sio
ns
an
d p
roje
ctio
ns
(Gg
CO
2 e
qu
iva
len
ts)
KP
Base
Year
1990
1995
2000
2001
2002
2003
2004
2005
2006
2007
2008-2
012
2013-2
017
2020
2025
2030
Den
ma
rk's
To
tal
na
tio
na
l E
mis
sio
ns
an
d R
emo
va
ls (
KP
Net
Em
issi
on
s)
in t
he
ba
se s
cen
ari
o (
"w
ith
mea
sure
s",
i.e.
im
ple
men
ted
an
d a
dop
ted
mea
sure
s )10713
10713
9657
8615
8380
8035
8060
7566
7102
7070
7042
6942
6760
6628
6530
6543
Den
mark
'sT
ota
l K
P R
emovals
Den
mark
'sT
ota
l E
mis
sion
s/R
emovals
wit
h L
UC
F (
CC
Net
Em
issi
on
s)10713
9657
8615
8380
8035
8060
7566
7102
7070
7042
6942
6760
6628
6530
6543
Den
mark
'sT
ota
l E
mis
sion
s w
ith
ou
t L
UC
F10713
10713
9657
8615
8380
8035
8060
7566
7102
7070
7042
6942
6760
6628
6530
6543
1. E
ner
gy
590
590
761
790
822
840
913
903
933
971
988
1025
1060
1052
1063
1076
A F
uel
Com
bu
stio
n A
ctiv
itie
s (S
ecto
ral A
pp
roach
)589
589
759
787
818
837
910
900
930
968
985
1022
1058
1050
1062
1075
1
En
ergy I
nd
ust
ries
276
276
327
255
270
275
328
295
306
324
321
313
314
283
273
268
a
P
ubli
c E
lect
rici
ty a
nd H
eat
Pro
duct
ion
260
260
304
227
242
247
298
264
271
288
282
257
247
224
214
209
b
P
etro
leum
Ref
inin
g9
915
1111
1111
1111
1111
1111
1111
11 c
M
anufa
cture
of
Soli
d F
uel
s an
d O
ther
Ener
gy I
ndust
ries
66
917
17
18
18
21
25
25
28
45
56
48
48
48
2
Man
ufa
ctu
rin
g I
nd
ust
ries
an
d C
on
stru
ctio
n54
54
56
57
57
58
56
59
58
58
59
63
66
68
71
72
f
O
ther
(ple
ase
spec
ify:
(1)
Boil
ers,
gas
turb
ines
, st
atio
nar
y e
ngin
es a
nd (
2)
Indust
ry m
obil
e so
urc
es a
nd m
achin
ery)
54
54
56
57
57
58
56
59
58
58
59
63
66
68
71
72
3
Tra
nsp
ort
147
147
270
380
394
408
430
445
466
485
503
540
570
590
608
624
a
C
ivil
Avia
tion
33
32
22
32
22
22
33
33
b
R
oad
Tra
nsp
ort
atio
n131
131
252
367
381
394
416
432
453
473
491
527
557
577
595
611
c
R
ailw
ays
33
32
22
22
22
22
22
22
d
N
avig
atio
n10
10
12
88
10
98
88
88
88
88
4
Oth
er S
ecto
rs110
110
104
94
97
95
95
100
99
99
100
104
106
107
108
109
a
C
om
mer
cial
/Inst
ituti
onal
12
12
10
88
78
1111
1111
1111
1111
11 b
R
esid
enti
al57
57
58
51
53
51
50
53
52
52
53
56
57
57
58
58
c
Agri
cult
ure
/Fore
stry
/Fis
her
ies
41
41
36
36
36
37
36
36
36
36
36
37
38
39
39
40
5
Oth
er (
ple
ase
sp
ecif
y:
Mil
itary
mob
ile
com
bu
stio
n o
f fu
els)
11
31
21
12
22
22
22
22
b. M
obil
e1
13
12
11
22
22
22
22
2 B
Fu
git
ive
Em
issi
on
s fr
om
Fu
els
11
23
33
33
33
33
32
22
1
S
oli
d F
uel
s0
00
00
00
00
00
00
00
0
c
O
ther
(ple
ase
spec
ify:
Sto
rage
of
soli
d f
uel
)0
00
00
00
00
00
0 2
Oil
an
d N
atu
ral
Gas
11
23
33
33
33
33
32
22
a
O
il
b
N
atura
l G
as
c
Ven
ting a
nd F
lari
ng
11
23
33
33
33
33
32
22
Fla
ring
11
23
33
33
33
33
32
22
2. In
du
stri
al
Pro
cess
es1043
1043
904
1004
885
774
895
450
00
00
00
00
A M
iner
al
Pro
du
cts
00
00
00
00
00
00
00
00
1 C
emen
t P
roduct
ion
2 L
ime
Pro
duct
ion
3 L
imes
tone
and D
olo
mit
e U
se
7 O
ther
(ple
ase
spec
ify)
00
00
00
00
00
00
00
00
B
C
hem
ical
Ind
ust
ry
1043
1043
904
1004
885
774
895
450
00
00
00
00
2 N
itri
c A
cid P
roduct
ion
1043
1043
904
1004
885
774
895
450
00
00
00
00
5 O
ther
(ple
ase
spec
ify)
00
00
00
00
00
00
00
00
C
M
etal
Pro
du
ctio
n0
00
00
00
00
00
00
00
0
1 Ir
on a
nd S
teel
Pro
duct
ion
4 S
F6 U
sed i
n A
lum
iniu
m a
nd M
agnes
ium
Foundri
es
S
F6 U
sed i
n M
agnes
ium
Foundri
es
F
C
on
sum
pti
on
of
Halo
carb
on
s an
d S
ulp
hu
r H
exafl
uori
de
3. S
olv
ent
an
d O
ther
Pro
du
ct U
se0
00
00
00
00
00
00
00
0
4.A
gri
cult
ure
8993
8993
7907
6756
6616
6363
6192
6152
6108
6038
5993
5856
5639
5515
5406
5406
A E
nte
ric
Fer
men
tati
on
B
M
an
ure
Man
agem
ent
685
685
642
601
604
588
560
563
552
538
538
539
524
516
505
505
D
Agri
cult
ura
l S
oil
s8308
8308
7265
6154
6012
5775
5632
5589
5556
5500
5455
5317
5114
4999
4900
4900
5. L
an
d-U
se C
han
ge
an
d F
ore
stry
(L
UC
F)
00
00
00
00
00
00
00
0
A C
han
ges
in
Fore
st a
nd
Oth
erW
ood
y B
iom
ass
Sto
cks
2
Tem
per
ate
Fore
sts
5 O
ther
(ple
ase
spec
ify)
D
C
O2 E
mis
sion
s an
d R
emovals
fro
m S
oil
C
ult
ivat
ion o
f O
rgan
ic S
oil
s
L
imin
g o
f A
gri
cult
ura
l S
oil
s
O
ther
(ple
ase
spec
ify)
6.W
ast
e88
88
85
65
57
58
61
61
61
61
61
61
61
61
61
61
A S
oli
d W
ast
e D
isp
osa
l on
Lan
d
1 M
anag
ed W
aste
Dis
posa
l on L
and
B
Wast
ewate
r H
an
dli
ng
88
88
85
65
57
58
61
61
61
61
61
61
61
61
61
61
2 D
om
esti
c an
d C
om
mer
cial
Was
tew
ater
88
88
85
65
57
58
61
61
61
61
61
61
61
61
61
61
Mem
o I
tem
s (n
ot
incl
ud
ed a
bove)
:
Inte
rnati
on
al
Bu
nk
ers
78
78
119
109
96
80
85
85
86
86
86
88
90
92
95
97
Avia
tion
18
18
20
25
26
22
24
24
24
25
25
26
29
31
33
36
M
arin
e60
60
99
84
71
58
61
61
61
61
61
61
61
61
61
61
CO
2 E
mis
sion
s fr
om
Bio
mass
Corr
ecti
on
s (n
ot
incl
ud
ed a
bove)
:
CO
2 e
mis
sion
s re
late
d t
o N
et E
lect
rici
ty I
mp
ort
(m
inu
s m
ean
s N
et E
lect
rici
ty E
xp
ort
)
CO
2 e
mis
sion
s re
late
d t
o t
he
tem
per
atu
re d
evia
tion
fro
m a
norm
al
yea
r (b
ase
d o
n d
egre
e d
ays)

353Denmark's Fourth National Communication on Climate Change
HF
Cs
emis
sion
s an
d p
roje
ctio
ns
(Gg C
O2 e
qu
ivale
nts
, act
ual
emis
sion
s)K
P B
ase
Ye
ar
19
90
19
95
20
00
20
01
20
02
20
03
20
04
20
05
20
06
20
07
20
08
-12
20
13
-17
20
20
20
25
20
30
Den
ma
rk's
To
tal
na
tio
na
l E
mis
sio
ns
an
d R
emo
va
ls (
KP
Net
Em
issi
on
s)
in t
he
ba
se s
cen
ari
o (
"w
ith
mea
sure
s",
i.e.
im
ple
men
ted
an
d a
do
pte
d m
easu
res )
21
80
21
86
05
64
76
72
69
57
50
77
37
41
76
17
03
40
711
811
811
8
Den
mark
'sT
ota
l K
P R
emovals
00
0
Den
ma
rk's
To
tal
Em
issi
on
s/R
emo
va
ls w
ith
LU
CF
(C
C N
et E
mis
sio
ns)
0218
605
647
672
695
750
773
741
761
703
407
118
118
118
Den
ma
rk's
To
tal
Em
issi
on
s w
ith
ou
t L
UC
F218
0218
605
647
672
695
750
773
741
761
70
34
07
118
118
118
1. E
ner
gy
A F
uel
Com
bu
stio
n A
ctiv
itie
s (S
ecto
ral A
pp
roach
)
1
En
ergy I
nd
ust
ries
a
P
ubli
c E
lect
rici
ty a
nd H
eat
Pro
duct
ion
b
P
etro
leum
Ref
inin
g
c
M
anufa
cture
of
Soli
d F
uel
s an
d O
ther
Ener
gy I
ndust
ries
2
Man
ufa
ctu
rin
g I
nd
ust
ries
an
d C
on
stru
ctio
n
f
O
ther
(ple
ase
spec
ify:
(1)
Boil
ers,
gas
turb
ines
, st
atio
nar
y e
ngin
es a
nd (
2)
Indust
ry m
obil
e so
urc
es a
nd m
achin
ery)
3
Tra
nsp
ort
a
C
ivil
Avia
tion
b
R
oad
Tra
nsp
ort
atio
n
c
R
ailw
ays
d
N
avig
atio
n
4
Oth
er S
ecto
rs
a
C
om
mer
cial
/Inst
ituti
onal
b
R
esid
enti
al
c
Agri
cult
ure
/Fore
stry
/Fis
her
ies
5
Oth
er (
ple
ase
sp
ecif
y:
Mil
itary
mob
ile
com
bu
stio
n o
f fu
els)
b. M
obil
e
B
Fu
git
ive
Em
issi
on
s fr
om
Fu
els
1
S
oli
d F
uel
s
c
O
ther
(ple
ase
spec
ify:
Sto
rage
of
soli
d f
uel
)
2
Oil
an
d N
atu
ral
Gas
a
O
il
b
N
atura
l G
as
c
Ven
ting a
nd F
lari
ng Fla
ring
2. In
du
stri
al
Pro
cess
es218
0218
605
647
672
695
750
773
741
761
703
407
118
118
118
A M
iner
al
Pro
du
cts
1 C
emen
t P
roduct
ion
2 L
ime
Pro
duct
ion
3 L
imes
tone
and D
olo
mit
e U
se
7 O
ther
(ple
ase
spec
ify)
B
C
hem
ical
Ind
ust
ry
00
00
00
00
00
00
00
00
2 N
itri
c A
cid P
roduct
ion
5 O
ther
(ple
ase
spec
ify)
00
00
00
00
00
00
00
00
C
M
etal
Pro
du
ctio
n0
00
00
00
00
00
00
00
0
1 Ir
on a
nd S
teel
Pro
duct
ion
4 S
F6 U
sed i
n A
lum
iniu
m a
nd M
agnes
ium
Foundri
es
S
F6 U
sed i
n M
agnes
ium
Foundri
es
F
C
on
sum
pti
on
of
Halo
carb
on
s an
d S
ulp
hu
r H
exafl
uori
de
218
0218
605
647
672
695
750
773
741
761
703
407
118
118
118
3. S
olv
ent
an
d O
ther
Pro
du
ct U
se
4.A
gri
cult
ure
A E
nte
ric
Fer
men
tati
on
B
M
an
ure
Man
agem
ent
D
Agri
cult
ura
l S
oil
s
5. L
an
d-U
se C
han
ge
an
d F
ore
stry
(L
UC
F)
A C
han
ges
in
Fore
st a
nd
Oth
erW
ood
y B
iom
ass
Sto
cks
2
Tem
per
ate
Fore
sts
5 O
ther
(ple
ase
spec
ify)
D
C
O2 E
mis
sion
s an
d R
emovals
fro
m S
oil
C
ult
ivat
ion o
f O
rgan
ic S
oil
s
L
imin
g o
f A
gri
cult
ura
l S
oil
s
O
ther
(ple
ase
spec
ify)
6.W
ast
e
A S
oli
d W
ast
e D
isp
osa
l on
Lan
d
1 M
anag
ed W
aste
Dis
posa
l on L
and
B
Wast
ewate
r H
an
dli
ng
2 D
om
esti
c an
d C
om
mer
cial
Was
tew
ater
Mem
o I
tem
s (n
ot
incl
ud
ed a
bove)
:
Inte
rnati
on
al
Bu
nk
ers
Avia
tion
M
arin
e
CO
2 E
mis
sion
s fr
om
Bio
mass
Corr
ecti
on
s (n
ot
incl
ud
ed a
bove)
:
CO
2 e
mis
sion
s re
late
d t
o N
et E
lect
rici
ty I
mp
ort
(m
inu
s m
ean
s N
et E
lect
rici
ty E
xp
ort
)
CO
2 e
mis
sion
s re
late
d t
o t
he
tem
per
atu
re d
evia
tion
fro
m a
norm
al
yea
r (b
ase
d o
n d
egre
e d
ays)

354 Denmark's Fourth National Communication on Climate Change
PF
Cs
emis
sio
ns
an
d p
roje
ctio
ns
(Gg
CO
2 e
qu
iva
len
ts,
act
ua
l em
issi
on
s)K
P B
ase
Ye
ar
19
90
19
95
20
00
20
01
20
02
20
03
20
04
20
05
20
06
20
07
20
08
-20
12
20
13
-20
17
20
20
20
25
20
30
Den
ma
rk's
To
tal
na
tio
na
l E
mis
sio
ns
an
d R
emo
va
ls (
KP
Net
Em
issi
on
s)
in t
he
ba
se s
cen
ari
o (
"w
ith
mea
sure
s",
i.e.
im
ple
men
ted
an
d a
do
pte
d m
easu
res)
10
11
82
22
21
91
61
41
211
10
86
66
Den
ma
rk's
To
tal
KP
Rem
ov
als
00
0
Den
ma
rk's
To
tal
Em
issi
on
s/R
emo
va
ls w
ith
LU
CF
(C
C N
et E
mis
sio
ns)
01
18
22
22
19
16
14
12
11
10
86
66
Den
ma
rk's
To
tal
Em
issi
on
s w
ith
ou
t L
UC
F1
01
18
22
22
19
16
14
12
111
08
66
6
1.
En
erg
y
A F
uel
Co
mb
ust
ion
Act
ivit
ies
(Sec
tora
l A
pp
roa
ch)
1 E
ner
gy
In
du
stri
es
a
P
ub
lic
Ele
ctri
city
an
d H
eat
Pro
du
ctio
n
b
P
etro
leu
m R
efin
ing
c
M
anu
fact
ure
of
So
lid
Fu
els
and
Oth
er E
ner
gy
In
du
stri
es
2 M
an
ufa
ctu
rin
g I
nd
ust
ries
an
d C
on
stru
ctio
n
f
O
ther
(p
leas
e sp
ecif
y:
(1)
Bo
iler
s, g
as t
urb
ines
, st
atio
nar
y e
ng
ines
an
d (
2)
Ind
ust
ry m
ob
ile
sou
rces
an
d m
ach
iner
y)
3 T
ran
spo
rt
a
C
ivil
Av
iati
on
b
R
oad
Tra
nsp
ort
atio
n
c
R
ailw
ays
d
N
avig
atio
n
4 O
ther
Sec
tors
a
C
om
mer
cial
/In
stit
uti
on
al
b
R
esid
enti
al
c
Ag
ricu
ltu
re/F
ore
stry
/Fis
her
ies
5 O
ther
(p
lea
se s
pec
ify
: M
ilit
ary
mo
bil
e co
mb
ust
ion
of
fuel
s)
b
. M
ob
ile
B
Fu
git
ive
Em
issi
on
s fr
om
Fu
els
1
So
lid
Fu
els
c
O
ther
(p
leas
e sp
ecif
y:
Sto
rag
e o
f so
lid
fu
el)
2 O
il a
nd
Na
tura
l G
as
a
O
il
b
N
atu
ral
Gas
c
Ven
tin
g a
nd
Fla
rin
g Fla
rin
g
2.
Ind
ust
ria
l P
roce
sses
10
11
82
22
21
91
61
41
211
10
86
66
A
Min
era
l P
rod
uct
s
1
C
emen
t P
rod
uct
ion
2
L
ime
Pro
du
ctio
n
3
L
imes
ton
e an
d D
olo
mit
e U
se
7
O
ther
(p
leas
e sp
ecif
y)
B
C
hem
ica
l In
du
stry
0
00
00
00
00
00
00
00
0
2
N
itri
c A
cid
Pro
du
ctio
n
5
O
ther
(p
leas
e sp
ecif
y)
00
00
00
00
00
00
00
00
C
M
eta
l P
rod
uct
ion
00
00
00
00
00
00
00
00
1
Ir
on
an
d S
teel
Pro
du
ctio
n
4
S
F6
Use
d i
n A
lum
iniu
m a
nd
Mag
nes
ium
Fo
un
dri
es
S
F6
Use
d i
n M
agn
esiu
m F
ou
nd
ries
F
C
on
sum
pti
on
of
Ha
loca
rbo
ns
an
d S
ulp
hu
r H
exa
flu
ori
de
10
11
82
22
21
91
61
41
211
10
86
66
3.
So
lven
t a
nd
Oth
er P
rod
uct
Use
4.A
gri
cult
ure
A E
nte
ric
Fer
men
tati
on
B
M
an
ure
Ma
na
gem
ent
D
Ag
ricu
ltu
ral
So
ils
5.
La
nd
-Use
Ch
an
ge
an
d F
ore
stry
(L
UC
F)
A
Ch
an
ges
in
Fo
rest
an
d O
ther
Wo
od
y B
iom
ass
Sto
cks
2
Tem
per
ate
Fo
rest
s
5
O
ther
(p
leas
e sp
ecif
y)
D
C
O2
Em
issi
on
s a
nd
Rem
ov
als
fro
m S
oil
C
ult
ivat
ion
of
Org
anic
So
ils
Lim
ing
of
Ag
ricu
ltu
ral
So
ils
Oth
er (
ple
ase
spec
ify
)
6.W
ast
e
A
So
lid
Wa
ste
Dis
po
sal
on
La
nd
1
M
anag
ed W
aste
Dis
po
sal
on
Lan
d
B
Wa
stew
ate
r H
an
dli
ng
2
D
om
esti
c an
d C
om
mer
cial
Was
tew
ater
Mem
o I
tem
s (n
ot
incl
ud
ed a
bo
ve)
:
Inte
rna
tio
na
l B
un
ker
s
Av
iati
on
Mar
ine
CO
2 E
mis
sio
ns
fro
m B
iom
ass
Co
rrec
tio
ns
(no
t in
clu
ded
ab
ov
e):
CO
2 e
mis
sio
ns
rela
ted
to
Net
Ele
ctri
city
Im
po
rt (
min
us
mea
ns
Net
Ele
ctri
city
Ex
po
rt)
CO
2 e
mis
sio
ns
rela
ted
to
th
e te
mp
era
ture
dev
iati
on
fro
m a
no
rma
l y
ear
(ba
sed
on
deg
ree
da
ys)
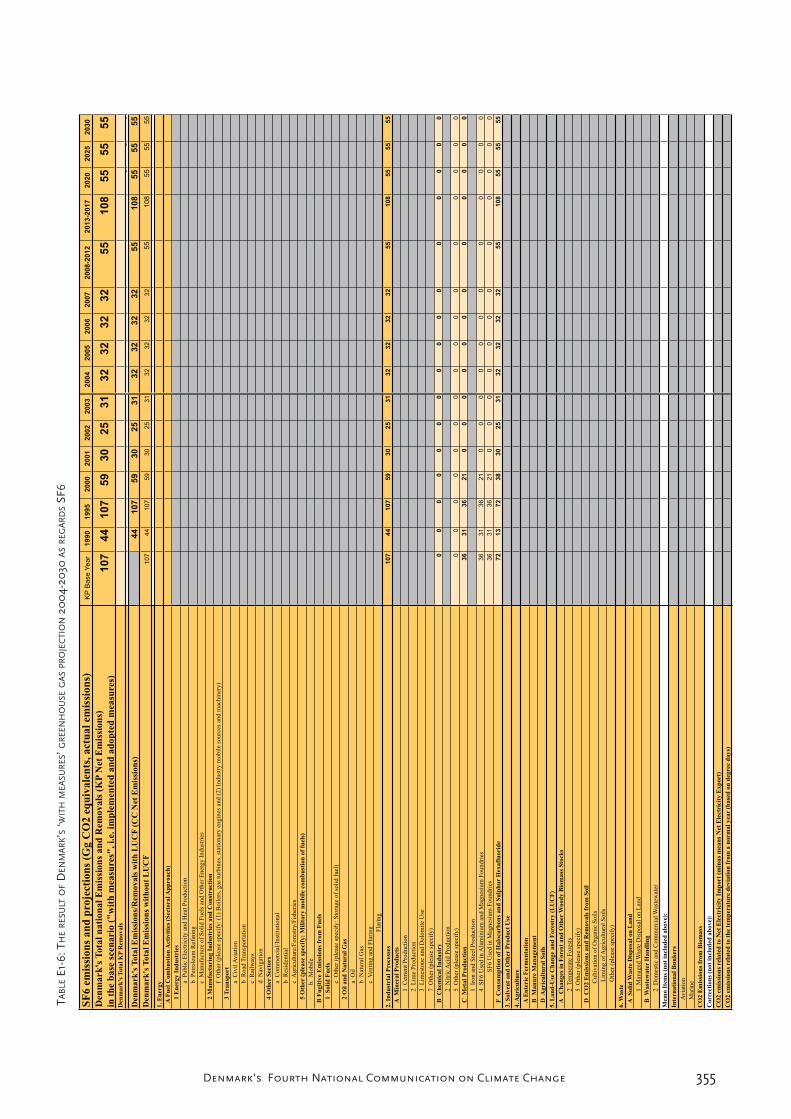
355Denmark's Fourth National Communication on Climate Change
SF
6 e
mis
sion
s an
d p
roje
ctio
ns
(Gg C
O2 e
qu
ivale
nts
, act
ual
emis
sion
s)K
P B
ase
Ye
ar
19
90
19
95
20
00
20
01
20
02
20
03
20
04
20
05
20
06
20
07
20
08
-20
12
20
13
-20
17
20
20
20
25
20
30
Den
mark
'sT
ota
l n
ati
on
al
Em
issi
on
s an
d R
emovals
(K
P N
et E
mis
sion
s)
in t
he
base
sce
nari
o (
"w
ith
mea
sure
s", i.
e. i
mp
lem
ente
d a
nd
ad
op
ted
mea
sure
s )107
44
107
59
30
25
31
32
32
32
32
55
108
55
55
55
Den
ma
rk's
To
tal
KP
Rem
ov
als
00
0
Den
ma
rk's
To
tal
Em
issi
on
s/R
emovals
wit
h L
UC
F (
CC
Net
Em
issi
on
s)4
41
07
59
30
25
31
32
32
32
32
55
10
85
55
55
5
Den
ma
rk's
To
tal
Em
issi
on
s w
ith
ou
t L
UC
F107
44
107
59
30
25
31
32
32
32
32
55
10
85
55
55
5
1.
En
erg
y
A F
uel
Co
mb
ust
ion
Act
ivit
ies
(Sec
tora
l A
pp
roa
ch)
1 E
ner
gy
In
du
stri
es
a
P
ub
lic
Ele
ctri
city
an
d H
eat
Pro
du
ctio
n
b
P
etro
leu
m R
efin
ing
c
M
anu
fact
ure
of
So
lid
Fu
els
and
Oth
er E
ner
gy
In
du
stri
es
2 M
an
ufa
ctu
rin
g I
nd
ust
ries
an
d C
on
stru
ctio
n
f
O
ther
(p
leas
e sp
ecif
y:
(1)
Bo
iler
s, g
as t
urb
ines
, st
atio
nar
y e
ng
ines
an
d (
2)
Ind
ust
ry m
ob
ile
sou
rces
an
d m
ach
iner
y)
3 T
ran
spo
rt
a
C
ivil
Av
iati
on
b
R
oad
Tra
nsp
ort
atio
n
c
R
ailw
ays
d
N
avig
atio
n
4 O
ther
Sec
tors
a
C
om
mer
cial
/In
stit
uti
on
al
b
R
esid
enti
al
c
Ag
ricu
ltu
re/F
ore
stry
/Fis
her
ies
5 O
ther
(p
lea
se s
pec
ify
: M
ilit
ary
mo
bil
e co
mb
ust
ion
of
fuel
s)
b
. M
ob
ile
B
Fu
git
ive
Em
issi
on
s fr
om
Fu
els
1
So
lid
Fu
els
c
O
ther
(p
leas
e sp
ecif
y:
Sto
rag
e o
f so
lid
fu
el)
2 O
il a
nd
Na
tura
l G
as
a
O
il
b
N
atu
ral
Gas
c
Ven
tin
g a
nd
Fla
rin
g Fla
rin
g
2.
Ind
ust
ria
l P
roce
sses
107
44
107
59
30
25
31
32
32
32
32
55
108
55
55
55
A
Min
era
l P
rod
uct
s
1
C
emen
t P
rod
uct
ion
2
L
ime
Pro
du
ctio
n
3
L
imes
ton
e an
d D
olo
mit
e U
se
7
O
ther
(p
leas
e sp
ecif
y)
B
C
hem
ica
l In
du
stry
0
00
00
00
00
00
00
00
0
2
N
itri
c A
cid
Pro
du
ctio
n
5
O
ther
(p
leas
e sp
ecif
y)
00
00
00
00
00
00
00
00
C
M
eta
l P
rod
uct
ion
36
31
36
21
00
00
00
00
00
00
1
Ir
on
an
d S
teel
Pro
du
ctio
n
4
S
F6
Use
d i
n A
lum
iniu
m a
nd
Mag
nes
ium
Fo
un
dri
es36
31
36
21
00
00
00
00
00
00
S
F6
Use
d i
n M
agn
esiu
m F
ou
nd
ries
36
31
36
21
00
00
00
00
00
00
F
C
on
sum
pti
on
of
Ha
loca
rbo
ns
an
d S
ulp
hu
r H
exa
flu
ori
de
72
13
72
38
30
25
31
32
32
32
32
55
108
55
55
55
3.
So
lven
t a
nd
Oth
er P
rod
uct
Use
4.A
gri
cult
ure
A E
nte
ric
Fer
men
tati
on
B
M
an
ure
Ma
na
gem
ent
D
Ag
ricu
ltu
ral
So
ils
5.
La
nd
-Use
Ch
an
ge
an
d F
ore
stry
(L
UC
F)
A
Ch
an
ges
in
Fo
rest
an
d O
ther
Wo
od
y B
iom
ass
Sto
cks
2
Tem
per
ate
Fo
rest
s
5
O
ther
(p
leas
e sp
ecif
y)
D
C
O2
Em
issi
on
s a
nd
Rem
ov
als
fro
m S
oil
C
ult
ivat
ion
of
Org
anic
So
ils
Lim
ing
of
Ag
ricu
ltu
ral
So
ils
Oth
er (
ple
ase
spec
ify
)
6.W
ast
e
A
So
lid
Wa
ste
Dis
po
sal
on
La
nd
1
M
anag
ed W
aste
Dis
po
sal
on
Lan
d
B
Wa
stew
ate
r H
an
dli
ng
2
D
om
esti
c an
d C
om
mer
cial
Was
tew
ater
Mem
o I
tem
s (n
ot
incl
ud
ed a
bo
ve)
:
Inte
rna
tio
na
l B
un
ker
s
Av
iati
on
Mar
ine
CO
2 E
mis
sio
ns
fro
m B
iom
ass
Co
rrec
tio
ns
(no
t in
clu
ded
ab
ov
e):
CO
2 e
mis
sio
ns
rela
ted
to
Net
Ele
ctri
city
Im
po
rt (
min
us
mea
ns
Net
Ele
ctri
city
Ex
po
rt)
CO
2 e
mis
sio
ns
rela
ted
to
th
e te
mp
era
ture
dev
iati
on
fro
m a
no
rma
l y
ear
(ba
sed
on
deg
ree
da
ys)

356 Denmark's Fourth National Communication on Climate Change
GH
Gs
emis
sio
ns
an
d p
roje
ctio
ns
(Gg
CO
2 e
qu
iva
len
ts)
KP
Base
Year
1990
1995
2000
2001
2002
2003
2004
2005
2006
2007
2008-1
22013-1
72020
2025
2030
Den
mark
'sT
ota
l n
ati
on
al
Em
issi
on
s an
d R
emovals
(K
P N
et E
mis
sion
s)
in t
he
base
sce
nari
o (
"w
ith
mea
sure
s", i.
e. i
mp
lem
ente
d a
nd
ad
op
ted
mea
sure
s )6
96
09
69
32
87
66
90
68
25
56
96
50
68
90
87
39
01
69
22
97
01
64
72
08
07
19
59
72
25
47
14
33
67
20
66
61
21
66
78
1
Den
mark
'sT
ota
l K
P R
emovals
00
-10
-59
-74
-88
-108
-124
-141
-162
-182
-262
-401
-555
-646
-822
Den
mark
'sT
ota
l E
mis
sion
s/R
emovals
wit
h L
UC
F (
CC
Net
Em
issi
on
s)6
94
87
76
46
67
00
95
68
56
66
75
21
72
80
46
84
34
69
35
27
12
47
711
06
71
32
17
03
61
65
98
06
48
03
65
28
8
Den
mark
'sT
ota
l E
mis
sion
s w
ith
ou
t L
UC
F69609
69328
76700
68314
69724
68996
74009
69353
70305
72242
72141
72516
71833
67761
66767
67603
1. E
ner
gy
52390
52390
60415
52802
54458
54121
59319
54930
56317
58305
58254
58936
58862
55309
54463
55276
A F
uel
Com
bu
stio
n A
ctiv
itie
s (S
ecto
ral A
pp
roach
)52014
52014
59855
52062
53673
53439
58589
54205
55683
57673
57625
58309
58266
54891
54049
54862
1
En
ergy I
nd
ust
ries
26472
26472
32503
25680
27007
27164
32059
27304
28705
30481
30053
29656
28902
24882
23441
23868
a
P
ubli
c E
lect
rici
ty a
nd H
eat
Pro
duct
ion
25018
25018
30372
23214
24550
24642
29496
24511
25598
27316
26681
24815
23169
19809
18356
18782
b
P
etro
leum
Ref
inin
g908
908
1387
999
1020
982
1024
1017
1017
1017
1017
1017
1017
1017
1017
1017
c
M
anufa
cture
of
Soli
d F
uel
s an
d O
ther
Ener
gy I
ndust
ries
546
546
744
1467
1436
1541
1539
1776
2089
2147
2354
3824
4716
4056
4068
4068
2
Man
ufa
ctu
rin
g I
nd
ust
ries
an
d C
on
stru
ctio
n5447
5447
5965
5877
5896
5651
5494
5528
5489
5529
5644
6022
6283
6553
6806
6933
f
O
ther
(ple
ase
spec
ify:
(1)
Boil
ers,
gas
turb
ines
, st
atio
nar
y e
ngin
es a
nd (
2)
Indust
ry m
obil
e so
urc
es a
nd m
achin
ery)
5447
5447
5965
5877
5896
5651
5494
5528
5489
5529
5644
6022
6283
6553
6806
6933
3
Tra
nsp
ort
10645
10645
12171
12570
12607
12793
13280
13361
13587
13811
14019
14481
14897
15289
15637
15935
a
C
ivil
Avia
tion
246
246
202
157
164
142
140
124
126
128
130
137
149
161
172
184
b
R
oad
Tra
nsp
ort
atio
n9537
9537
10976
11666
11722
11845
12342
12503
12741
12962
13169
13624
14028
14408
14745
15032
c
R
ailw
ays
300
300
306
230
213
212
220
205
204
204
204
204
204
204
204
204
d
N
avig
atio
n562
562
688
518
508
593
577
529
516
516
516
516
516
516
516
516
4
Oth
er S
ecto
rs9329
9329
8961
7822
8065
7741
7662
7888
7778
7730
7786
8026
8060
8043
8041
8001
a
C
om
mer
cial
/Inst
ituti
onal
1419
1419
1139
940
945
902
882
955
958
961
968
988
1001
1005
996
972
b
R
esid
enti
al5156
5156
5219
4229
4453
4174
4120
4278
4196
4123
4128
4237
4189
4099
4037
3976
c
Agri
cult
ure
/Fore
stry
/Fis
her
ies
2754
2754
2603
2653
2667
2665
2660
2655
2624
2646
2690
2801
2870
2940
3008
3053
5
Oth
er (
ple
ase
sp
ecif
y:
Mil
itary
mob
ile
com
bu
stio
n o
f fu
els)
120
120
256
112
99
90
94
124
124
124
124
124
124
124
124
124
b. M
obil
e120
120
256
112
99
90
94
124
124
124
124
124
124
124
124
124
B
Fu
git
ive
Em
issi
on
s fr
om
Fu
els
376
376
560
740
785
682
729
725
635
631
629
627
595
418
414
414
1
S
oli
d F
uel
s72
72
132
64
69
62
93
00
00
00
00
0
c
O
ther
(ple
ase
spec
ify:
Sto
rage
of
soli
d f
uel
)72
72
132
64
69
62
93
00
00
00
00
0 2
Oil
an
d N
atu
ral
Gas
303
303
428
676
716
620
636
725
635
631
629
627
595
418
414
414
a
O
il32
32
48
73
72
76
78
84
89
86
83
82
71
54
50
50
b
N
atura
l G
as6
612
56
44
22
22
21
11
1 c
Ven
ting a
nd F
lari
ng
265
265
368
599
638
540
554
639
543
543
543
543
523
363
363
363
Fla
ring
265
265
368
599
638
540
554
639
543
543
543
543
523
363
363
363
2. In
du
stri
al
Pro
cess
es2436
2155
2604
3259
3191
3095
3129
2927
2583
2589
2645
2609
2364
2020
2020
2020
A M
iner
al
Pro
du
cts
1037
1037
1335
1531
1556
1598
1486
1677
1716
1755
1793
1793
1793
1793
1793
1793
1 C
emen
t P
roduct
ion
882
882
1204
1406
1432
1452
1370
1409
1448
1487
1525
1525
1525
1525
1525
1525
2 L
ime
Pro
duct
ion
138
138
117
109
108
130
102
115
115
115
115
115
115
115
115
115
3 L
imes
tone
and D
olo
mit
e U
se138
138
138
138
138
138
138
138
138
7 O
ther
(ple
ase
spec
ify:
Gla
ss P
roduct
ion)
17
17
14
16
16
16
13
15
15
15
15
15
15
15
15
15
B
C
hem
ical
Ind
ust
ry
1045
1045
906
1006
888
777
897
453
33
33
33
33
2 N
itri
c A
cid P
roduct
ion
1043
1043
904
1004
885
774
895
450
00
00
00
00
5 O
ther
(ple
ase
spec
ify:
Cat
alyst
s/F
erti
lize
rs a
nd P
esti
cides
)2
22
33
33
33
33
33
33
3 C
M
etal
Pro
du
ctio
n64
60
74
62
47
00
045
45
45
45
45
45
45
45
1 Ir
on a
nd S
teel
Pro
duct
ion
28
28
39
41
47
00
045
45
45
45
45
45
45
45
4 S
F6 U
sed i
n A
lum
iniu
m a
nd M
agnes
ium
Foundri
es36
31
36
21
00
00
00
00
00
00
S
F6 U
sed i
n M
agnes
ium
Foundri
es36
31
36
21
00
00
00
00
00
00
F
C
on
sum
pti
on
of
Halo
carb
on
s an
d S
ulp
hu
r H
exafl
uori
de
290
13
290
660
700
719
746
798
819
786
804
768
523
179
179
179
3. S
olv
ent
an
d O
ther
Pro
du
ct U
se317
317
242
212
130
151
206
212
212
212
212
212
212
212
212
212
4.A
gri
cult
ure
12845
12845
11845
10565
10470
10138
9898
9852
9788
9756
9673
9444
9077
8870
8688
8688
A E
nte
ric
Fer
men
tati
on
3110
3110
3079
2872
2898
2808
2734
2700
2681
2706
2671
2582
2441
2354
2275
2275
B
M
an
ure
Man
agem
ent
1428
1428
1501
1538
1560
1555
1532
1562
1552
1551
1547
1544
1522
1518
1513
1513
D
Agri
cult
ura
l S
oil
s8308
8308
7265
6154
6012
5775
5632
5589
5556
5500
5455
5317
5114
4999
4900
4900
5. L
an
d-U
se C
han
ge
an
d F
ore
stry
(L
UC
F)
158
-234
1782
-1158
-1476
-1204
-919
-953
-995
-1035
-1195
-1472
-1781
-1963
-2315
A C
han
ges
in
Fore
st a
nd
Oth
erW
ood
y B
iom
ass
Sto
cks
-2832
-2992
-653
-3539
-3813
-3533
-3248
-3282
-3324
-3364
-3524
-3801
-4110
-4292
-4644
2
Tem
per
ate
Fore
sts
-2832
-2982
-594
-3465
-3725
-3425
-3124
-3141
-3162
-3182
-3262
-3401
-3555
-3646
-3822
5 O
ther
(ple
ase
spec
ify)
0-1
0-5
9-7
4-8
8-1
08
-124
-141
-162
-182
-262
-401
-555
-646
-822
D
C
O2 E
mis
sion
s an
d R
emovals
fro
m S
oil
2990
2758
2435
2381
2337
2329
2329
2329
2329
2329
2329
2329
2329
2329
2329
C
ult
ivat
ion o
f O
rgan
ic S
oil
s2400
2313
2283
2297
2243
2252
2252
2252
2252
2252
2252
2252
2252
2252
2252
L
imin
g o
f A
gri
cult
ura
l S
oil
s566
496
261
201
233
226
226
226
226
226
226
226
226
226
226
O
ther
(ple
ase
spec
ify)
25
-52
-109
-116
-139
-149
-149
-149
-149
-149
-149
-149
-149
-149
-149
6.W
ast
e1622
1622
1593
1475
1475
1492
1457
1433
1405
1381
1358
1316
1319
1350
1385
1409
A S
oli
d W
ast
e D
isp
osa
l on
Lan
d1334
1334
1286
1192
1188
1156
1153
1133
1113
1098
1087
1071
1065
1080
1097
1105
1 M
anag
ed W
aste
Dis
posa
l on L
and
1334
1334
1286
1192
1188
1156
1153
1133
1113
1098
1087
1071
1065
1080
1097
1105
B
Wast
ewate
r H
an
dli
ng
288
288
307
283
287
336
305
300
292
283
271
244
254
271
287
303
2 D
om
esti
c an
d C
om
mer
cial
Was
tew
ater
288
288
307
283
287
336
305
300
292
283
271
244
254
271
287
303
Mem
o I
tem
s (n
ot
incl
ud
ed a
bove)
:
Inte
rnati
on
al
Bu
nk
ers
4904
4904
7050
6741
6088
5108
5405
5445
5481
5517
5554
5671
5887
6122
6317
6525
Avia
tion
1755
1755
1888
2376
2411
2083
2212
2244
2280
2316
2353
2470
2686
2921
311
63324
M
arin
e3149
3149
5162
4365
3677
3025
3193
3201
3201
3201
3201
3201
3201
3201
3201
3201
CO
2 E
mis
sion
s fr
om
Bio
mass
4641
4641
5869
7090
7637
8383
9108
NE
NE
NE
NE
NE
NE
NE
NE
NE
Corr
ecti
on
s (n
ot
incl
ud
ed a
bove)
:
CO
2 e
mis
sion
s re
late
d t
o N
et E
lect
rici
ty I
mp
ort
(m
inu
s m
ean
s N
et E
lect
rici
ty E
xp
ort
) 6300
6300
-690
659
-375
-1608
-6869
-3594
-4403
-6413
-5960
-4375
-2276
-1379
-859
-2868
CO
2 e
mis
sion
s re
late
d t
o t
he
tem
per
atu
re d
evia
tion
fro
m a
norm
al
yea
r (b
ase
d o
n d
egre
e d
ays)
1879
1879
235
1323
254
1000
723
00
00
00
00
0
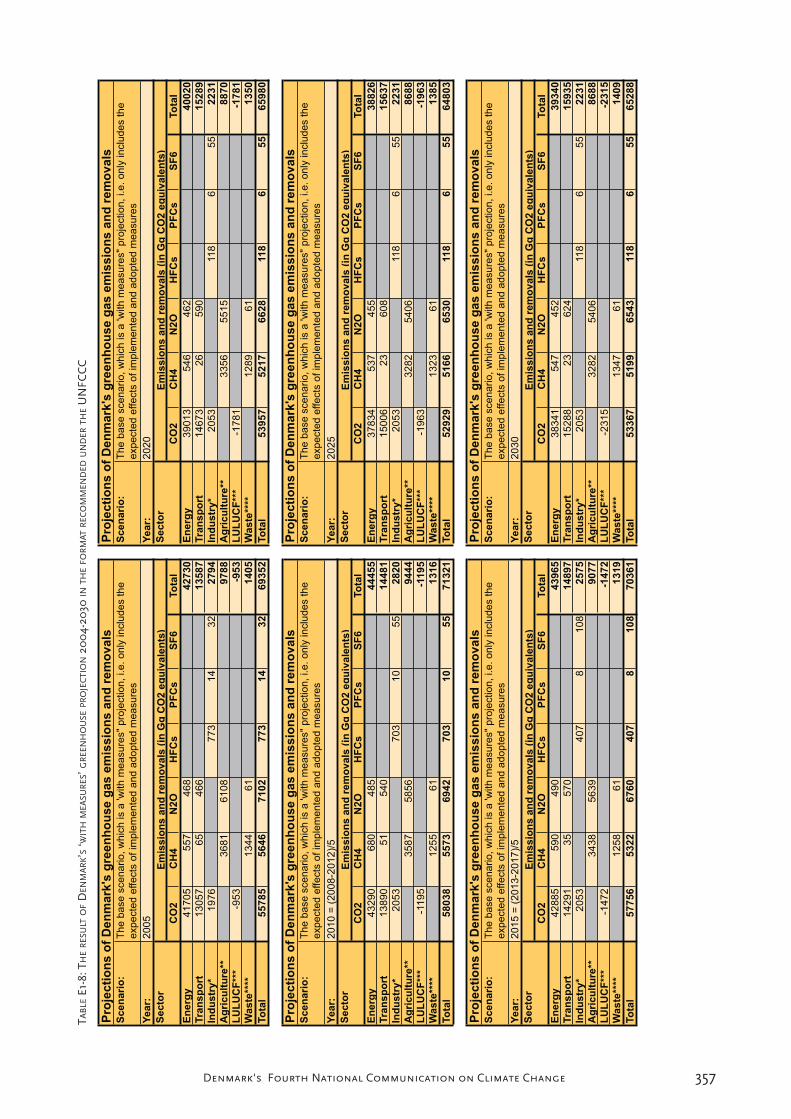
357Denmark's Fourth National Communication on Climate Change
Pro
jecti
on
s o
f D
en
mark
's g
reen
ho
use g
as e
mis
sio
ns a
nd
rem
ovals
Pro
jecti
on
s o
f D
en
mark
's g
reen
ho
use g
as e
mis
sio
ns a
nd
rem
ovals
Sc
en
ari
o:
Sc
en
ari
o:
Ye
ar:
20
05
Ye
ar:
20
20
Se
cto
rS
ec
tor
CO
2C
H4
N2
OH
FC
sP
FC
sS
F6
To
tal
CO
2C
H4
N2
OH
FC
sP
FC
sS
F6
To
tal
En
erg
y4
17
05
55
74
68
42
73
0E
ne
rgy
39
01
35
46
46
24
00
20
Tra
ns
po
rt1
30
57
65
46
61
35
87
Tra
ns
po
rt1
46
73
26
59
01
52
89
Ind
us
try
*1
97
67
73
14
32
27
94
Ind
us
try
*2
05
311
86
55
22
31
Ag
ric
ult
ure
**3
68
16
10
89
78
8A
gri
cu
ltu
re**
33
56
55
15
88
70
LU
LU
CF
***
-95
3-9
53
LU
LU
CF
***
-17
81
-17
81
Wa
ste
****
13
44
61
14
05
Wa
ste
****
12
89
61
13
50
To
tal
55
78
55
64
67
10
27
73
14
32
69
35
2To
tal
53
95
75
21
76
62
811
86
55
65
98
0
Pro
jecti
on
s o
f D
en
mark
's g
reen
ho
use g
as e
mis
sio
ns a
nd
rem
ovals
Pro
jecti
on
s o
f D
en
mark
's g
reen
ho
use g
as e
mis
sio
ns a
nd
rem
ovals
Sc
en
ari
o:
Sc
en
ari
o:
Ye
ar:
20
10
= (
20
08
-20
12
)/5
Ye
ar:
20
25
Se
cto
rS
ec
tor
CO
2C
H4
N2
OH
FC
sP
FC
sS
F6
To
tal
CO
2C
H4
N2
OH
FC
sP
FC
sS
F6
To
tal
En
erg
y4
32
90
68
04
85
44
45
5E
ne
rgy
37
83
45
37
45
53
88
26
Tra
ns
po
rt1
38
90
51
54
01
44
81
Tra
ns
po
rt1
50
06
23
60
81
56
37
Ind
us
try
*2
05
37
03
10
55
28
20
Ind
us
try
*2
05
311
86
55
22
31
Ag
ric
ult
ure
**3
58
75
85
69
44
4A
gri
cu
ltu
re**
32
82
54
06
86
88
LU
LU
CF
***
-11
95
-11
95
LU
LU
CF
***
-19
63
-19
63
Wa
ste
****
12
55
61
13
16
Wa
ste
****
13
23
61
13
85
To
tal
58
03
85
57
36
94
27
03
10
55
71
32
1To
tal
52
92
95
16
66
53
011
86
55
64
80
3
Pro
jecti
on
s o
f D
en
mark
's g
reen
ho
use g
as e
mis
sio
ns a
nd
rem
ovals
Pro
jecti
on
s o
f D
en
mark
's g
reen
ho
use g
as e
mis
sio
ns a
nd
rem
ovals
Sc
en
ari
o:
Sc
en
ari
o:
Ye
ar:
20
15
= (
20
13
-20
17
)/5
Ye
ar:
20
30
Se
cto
rS
ec
tor
CO
2C
H4
N2
OH
FC
sP
FC
sS
F6
To
tal
CO
2C
H4
N2
OH
FC
sP
FC
sS
F6
To
tal
En
erg
y4
28
85
59
04
90
43
96
5E
ne
rgy
38
34
15
47
45
23
93
40
Tra
ns
po
rt1
42
91
35
57
01
48
97
Tra
ns
po
rt1
52
88
23
62
41
59
35
Ind
us
try
*2
05
34
07
81
08
25
75
Ind
us
try
*2
05
311
86
55
22
31
Ag
ric
ult
ure
**3
43
85
63
99
07
7A
gri
cu
ltu
re**
32
82
54
06
86
88
LU
LU
CF
***
-14
72
-14
72
LU
LU
CF
***
-23
15
-23
15
Wa
ste
****
12
58
61
13
19
Wa
ste
****
13
47
61
14
09
To
tal
57
75
65
32
26
76
04
07
81
08
70
36
1To
tal
53
36
75
19
96
54
311
86
55
65
28
8
Th
e b
ase
sce
na
rio
, w
hic
h is
a 'w
ith m
ea
sure
s" p
roje
ctio
n,
i.e.
on
ly in
clu
de
s th
e
exp
ect
ed
effe
cts
of
imp
lem
en
ted
an
d a
do
pte
d m
ea
sure
s
Th
e b
ase
sce
na
rio
, w
hic
h is
a 'w
ith m
ea
sure
s" p
roje
ctio
n,
i.e.
on
ly in
clu
de
s th
e
exp
ect
ed
effe
cts
of
imp
lem
en
ted
an
d a
do
pte
d m
ea
sure
s
Em
iss
ion
s a
nd
re
mo
va
ls (
in G
g C
O2
eq
uiv
ale
nts
)
Em
iss
ion
s a
nd
re
mo
va
ls (
in G
g C
O2
eq
uiv
ale
nts
)
Th
e b
ase
sce
na
rio
, w
hic
h is
a 'w
ith m
ea
sure
s" p
roje
ctio
n,
i.e.
on
ly in
clu
de
s th
e
exp
ect
ed
effe
cts
of
imp
lem
en
ted
an
d a
do
pte
d m
ea
sure
s
Em
iss
ion
s a
nd
re
mo
va
ls (
in G
g C
O2
eq
uiv
ale
nts
)
Th
e b
ase
sce
na
rio
, w
hic
h is
a 'w
ith m
ea
sure
s" p
roje
ctio
n,
i.e.
on
ly in
clu
de
s th
e
exp
ect
ed
effe
cts
of
imp
lem
en
ted
an
d a
do
pte
d m
ea
sure
s
Em
iss
ion
s a
nd
re
mo
va
ls (
in G
g C
O2
eq
uiv
ale
nts
)
Th
e b
ase
sce
na
rio
, w
hic
h is
a 'w
ith m
ea
sure
s" p
roje
ctio
n,
i.e.
on
ly in
clu
de
s th
e
exp
ect
ed
effe
cts
of
imp
lem
en
ted
an
d a
do
pte
d m
ea
sure
s
Em
iss
ion
s a
nd
re
mo
va
ls (
in G
g C
O2
eq
uiv
ale
nts
)
Th
e b
ase
sce
na
rio
, w
hic
h is
a 'w
ith m
ea
sure
s" p
roje
ctio
n,
i.e.
on
ly in
clu
de
s th
e
exp
ect
ed
effe
cts
of
imp
lem
en
ted
an
d a
do
pte
d m
ea
sure
s
Em
iss
ion
s a
nd
re
mo
va
ls (
in G
g C
O2
eq
uiv
ale
nts
)
358 Denmark's Fourth National Communication on Climate Change
A brief description of the work in-volved in preparing the energy pro-jections.
The work involved in preparing the energy projections goes through the following stages:
1. Final energy consumption of businesses and the domestic sector (except transport)
2. Energy consumption for pro-duction of electricity and district heating
3. Own consumption by refineries and gas works
4. Own consumption by the North Sea, including flaring
5. Industrial cogenerated heating and power, mini cogenerated heating and power, biogas etc.
6. Energy consumption by trans-port
The economic macro model EMMA is calculated in item 1. Ramses, which is a technical/economic opti-misation model, is used for calcula-tions in item 2 based on input of the energy consumption from the housing models and EMMA. Item 3 is automatically projected based on the latest statistics. Item 4 is pro-jected on the basis of the informa-tion from Mærsk and statements of the Danish oil and gas reserves. Item 5 is projected on the basis of cur-rent plans to expand – after which it remains unchanged. The Danish
Annex E2: A brief description of the work involved in preparing the energy projections
Road Directorate has provided the main part of the transport projection (item 6), however the Danish En-ergy Authority has prepared the very simple projections of international shipping, military transport and the size of cross-border trading. More-over, the Danish Road Directorate’s tender for electric trains is adjusted to the statistics. The different parts of the projection are collected in the Danish Energy Authority’s collec-tive model, which can be used to calculate gross energy consumption and energy-related CO2 emissions. Extracts from this model are given to NERI, and NERI has calculated emissions from the energy sector.
As mentioned, projections of the final energy consumption in the business and domestic sectors are based on an ADAM/EMMA projec-tion. EMMA is a macro model that describes the final energy consump-tion broken down into a number of sectors and seven types of energy. It is based on historical experience with the behaviour of businesses and households and is documented in Environmental satellite models for ADAM, NERI Technical Report no. 148, NERI 1995.
In EMMA, energy consumption is determined by three factors: produc-tion, energy prices/taxes and energy efficiencies/ trends. Increased eco-nomic activity will increase the de-mand for energy input, whereas in-creased energy prices and taxes will pull in the direction of a more lim-ited demand for the fuels. Improved energy efficiency will mean that pro-
359Denmark's Fourth National Communication on Climate Change
duction can be maintained using less energy, and in EMMA this results in reduced energy consumption.
The EMMA system is structured based on the link between five en-ergy-specific models developed at NERI and Risø National Labora-tory. These models determine the use of seven types of energy (liq-uid fuels, solid fuels, gas, biofuels, transport energy, electricity and district heating) in the domestic and business sectors, conversion of fuels (solid fuels, liquid fuels, gas, biomass) by the supply sector to electricity and district heating, and it calculates the emissions this use of energy entails. EMMA is structured as a satellite model to ADAM, which is a widely used Danish macro-eco-nomic model that covers the entire economy.
The ADAM/EMMA system can calculate the effect of a number of initiatives. One of the most impor-tant aspects though, is that energy prices play an important role. The overall level for energy prices affects the total energy consumption, and the relationship between the prices of different types of energy affects the composition of energy consump-tion. Therefore the model can esti-mate the effect of CO2 taxes, which in part raise all energy prices and in part change the relative energy prices, so that e.g. coal, which emits a lot of CO2, is more expensive than natural gas that emits less CO2.
The projection of production in the business sector and inflation is based
on ADAM projections prepared by the Ministry of Finance.
Projection of the production of electricity and district heating (item 2 above) has been calculated us-ing the Danish Energy Authority’s Ramses-model based on the demand for electricity and district heating as calculated in the projection of the consumer sectors. In the projection, the production of electricity and heating is broken down into existing and possibly new production facili-ties based on the facilities’ technical specifications, price of fuel and CO2
emissions trading prices. The model also determines electricity prices on the Nordic market and the scope of electricity exchange with the other Nordic countries and takes account of the limits to the trading capacity. The production of electricity has been liberalised throughout the Nor-dic countries and therefore there is no close link to Denmark’s demand, rather, it is based on the character-istics of the individual facility and the market prices. Industrial and lo-cal mini combined heat and power production are not projected in the Ramses model, therefore a separate (bottom-up) projection of this pro-duction has been prepared.
A more detailed description of Ramses can be found in the follow-ing.
Ramses (version 6) is a technical-economic model that describes the production of electricity and district heating in a random number of elec-tricity areas, at present in the Nordic

360 Denmark's Fourth National Communication on Climate Change
countries. It is a partially linear opti-misation model that can calculate the production and fuel consumption at a great number of installations on a hourly basis. As the model is mainly designed for analysing the effects in Denmark, at present the Danish in-stallations are described in more de-tail than utilities in the other Nordic countries.
The model calculates the price of electricity that creates equilibrium on the market. As regards electricity, the Nordic countries are divided into five areas separated by transmission connections with a maximum trans-fer capacity. If the need for trans-missions exceeds the capacity, the price of electricity differs in the ar-eas. The five areas are Finland, Swe-den, Norway, western Denmark and eastern Denmark. As regards district heating there are far more isolated areas that each have their own price.
In addition to information concern-ing the transmission connections and detailed information on the type, efficacy and size of installation, the following input are used in the mod-el: fuel prices, CO2 allowances pric-es, fuel taxes as well as the demand for electricity and district heating in the area. Output from the model in-cludes production, fuel consumption and emissions from each installation, and the price of electricity in each area.
In the model, all installations in each area are sorted according to the short-term, marginal production costs for electricity. Production is set
in motion at the utilities one after another – starting with the cheap-est one, and this continues until the demand (including any need for ex-ports or imports) in each operational hour is met. The marginal costs of the most expensive producing instal-lations thus set the price of electricity in the area. The largest hydropower plants have been given special treat-ment because they can adjust the time of production for strategic rea-sons using the water reservoirs.
The decision concerning investments in new utilities is kept separate from the model. Investments are only made if model calculations show that the installation can recover the in-vestment, assuming specific rates of subsidies for RE (particularly wind turbines) are given, and free CO2
allowances for fossil-based installa-tions, etc. Installations placed in an area where district heating is needed typically have a competitive advan-tage due to income from the sale of heat.
In addition to prices and amounts, the model can estimate the overall system’s security of supply as re-gards electricity. This is done on the basis of stochastic input on the prob-ability of damage to installations and transmission connections, time series for production from wind turbines and hydropower as well as the varia-tion in consumption.
Ra mses is used both for projection and analysis purposes. For example, it has been used to analyse the effect of new transmission connections,

361Denmark's Fourth National Communication on Climate Change
new wind turbine farms, changes in electricity consumption or changes in the prices of fuels and CO2 allow-ances.
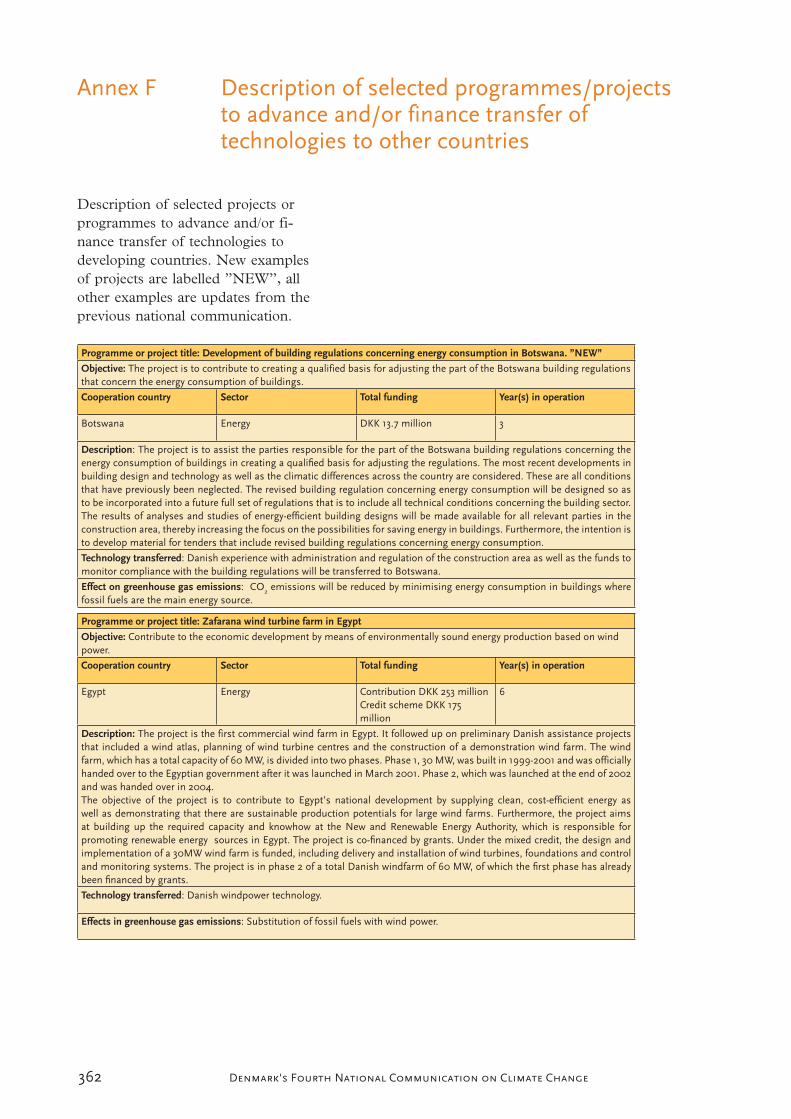
362 Denmark's Fourth National Communication on Climate Change
Description of selected projects or programmes to advance and/or fi-nance transfer of technologies to developing countries. New examples of projects are labelled ”NEW”, all other examples are updates from the previous national communication.
Programme or project title: Development of building regulations concerning energy consumption in Botswana. ”NEW”
Objective: The project is to contribute to creating a qualified basis for adjusting the part of the Botswana building regulationsthat concern the energy consumption of buildings.
Cooperation country Sector Total funding Year(s) in operation
Botswana Energy DKK 13.7 million 3
Description: The project is to assist the parties responsible for the part of the Botswana building regulations concerning theenergy consumption of buildings in creating a qualified basis for adjusting the regulations. The most recent developments inbuilding design and technology as well as the climatic differences across the country are considered. These are all conditionsthat have previously been neglected. The revised building regulation concerning energy consumption will be designed so asto be incorporated into a future full set of regulations that is to include all technical conditions concerning the building sector.The results of analyses and studies of energy-efficient building designs will be made available for all relevant parties in theconstruction area, thereby increasing the focus on the possibilities for saving energy in buildings. Furthermore, the intention isto develop material for tenders that include revised building regulations concerning energy consumption.
Technology transferred: Danish experience with administration and regulation of the construction area as well as the funds tomonitor compliance with the building regulations will be transferred to Botswana.
Effect on greenhouse gas emissions: CO2 emissions will be reduced by minimising energy consumption in buildings wherefossil fuels are the main energy source.
Programme or project title: Zafarana wind turbine farm in Egypt
Objective: Contribute to the economic development by means of environmentally sound energy production based on windpower.
Cooperation country Sector Total funding Year(s) in operation
Egypt Energy Contribution DKK 253 millionCredit scheme DKK 175million
6
Description: The project is the first commercial wind farm in Egypt. It followed up on preliminary Danish assistance projectsthat included a wind atlas, planning of wind turbine centres and the construction of a demonstration wind farm. The windfarm, which has a total capacity of 60 MW, is divided into two phases. Phase 1, 30 MW, was built in 1999-2001 and was officiallyhanded over to the Egyptian government after it was launched in March 2001. Phase 2, which was launched at the end of 2002and was handed over in 2004.The objective of the project is to contribute to Egypt’s national development by supplying clean, cost-efficient energy aswell as demonstrating that there are sustainable production potentials for large wind farms. Furthermore, the project aimsat building up the required capacity and knowhow at the New and Renewable Energy Authority, which is responsible forpromoting renewable energy sources in Egypt. The project is co-financed by grants. Under the mixed credit, the design andimplementation of a 30MW wind farm is funded, including delivery and installation of wind turbines, foundations and controland monitoring systems. The project is in phase 2 of a total Danish windfarm of 60 MW, of which the first phase has alreadybeen financed by grants.
Technology transferred: Danish windpower technology.
Effects in greenhouse gas emissions: Substitution of fossil fuels with wind power.
Annex F Description of selected programmes/projects to advance and/or finance transfer of technologies to other countries
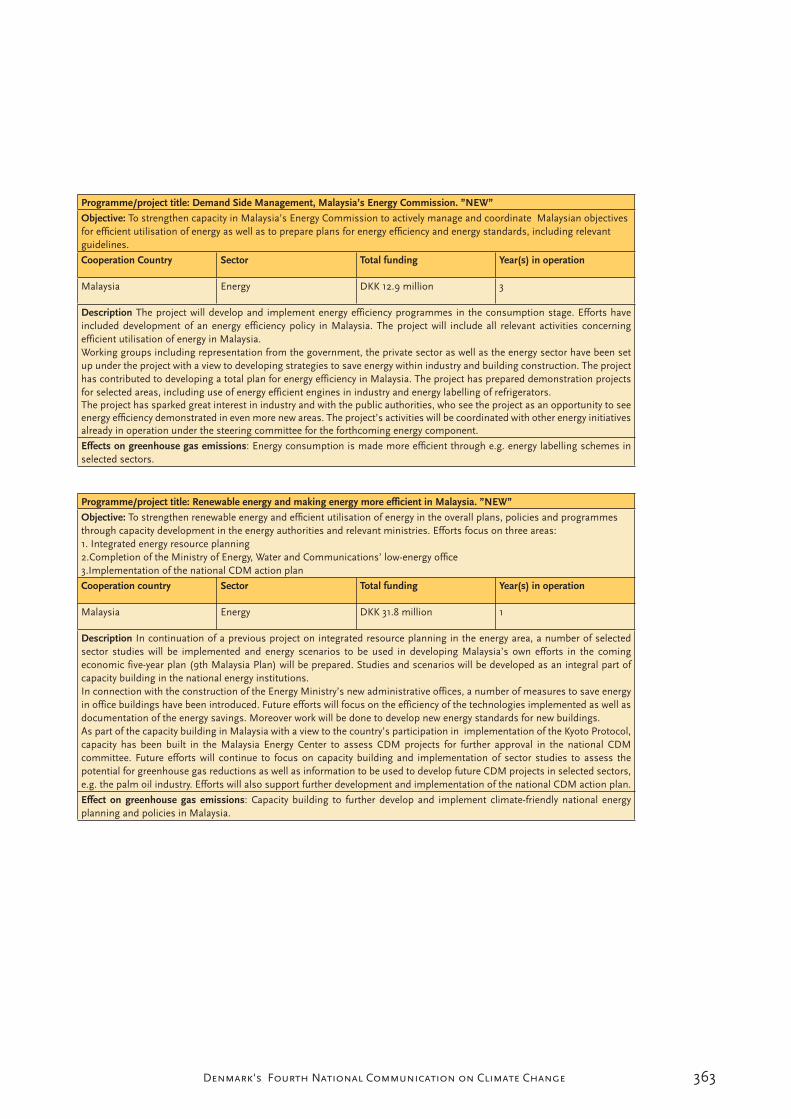
363Denmark's Fourth National Communication on Climate Change
Programme/project title: Demand Side Management, Malaysia’s Energy Commission. ”NEW”
Objective: To strengthen capacity in Malaysia’s Energy Commission to actively manage and coordinate Malaysian objectivesfor efficient utilisation of energy as well as to prepare plans for energy efficiency and energy standards, including relevantguidelines.
Cooperation Country Sector Total funding Year(s) in operation
Malaysia Energy DKK 12.9 million 3
Description The project will develop and implement energy efficiency programmes in the consumption stage. Efforts haveincluded development of an energy efficiency policy in Malaysia. The project will include all relevant activities concerningefficient utilisation of energy in Malaysia.Working groups including representation from the government, the private sector as well as the energy sector have been setup under the project with a view to developing strategies to save energy within industry and building construction. The projecthas contributed to developing a total plan for energy efficiency in Malaysia. The project has prepared demonstration projectsfor selected areas, including use of energy efficient engines in industry and energy labelling of refrigerators.The project has sparked great interest in industry and with the public authorities, who see the project as an opportunity to seeenergy efficiency demonstrated in even more new areas. The project’s activities will be coordinated with other energy initiativesalready in operation under the steering committee for the forthcoming energy component.
Effects on greenhouse gas emissions: Energy consumption is made more efficient through e.g. energy labelling schemes inselected sectors.
Programme/project title: Renewable energy and making energy more efficient in Malaysia. ”NEW”
Objective: To strengthen renewable energy and efficient utilisation of energy in the overall plans, policies and programmesthrough capacity development in the energy authorities and relevant ministries. Efforts focus on three areas:1. Integrated energy resource planning2.Completion of the Ministry of Energy, Water and Communications’ low-energy office3.Implementation of the national CDM action plan
Cooperation country Sector Total funding Year(s) in operation
Malaysia Energy DKK 31.8 million 1
Description In continuation of a previous project on integrated resource planning in the energy area, a number of selectedsector studies will be implemented and energy scenarios to be used in developing Malaysia’s own efforts in the comingeconomic five-year plan (9th Malaysia Plan) will be prepared. Studies and scenarios will be developed as an integral part ofcapacity building in the national energy institutions.In connection with the construction of the Energy Ministry’s new administrative offices, a number of measures to save energyin office buildings have been introduced. Future efforts will focus on the efficiency of the technologies implemented as well asdocumentation of the energy savings. Moreover work will be done to develop new energy standards for new buildings.As part of the capacity building in Malaysia with a view to the country’s participation in implementation of the Kyoto Protocol,capacity has been built in the Malaysia Energy Center to assess CDM projects for further approval in the national CDMcommittee. Future efforts will continue to focus on capacity building and implementation of sector studies to assess thepotential for greenhouse gas reductions as well as information to be used to develop future CDM projects in selected sectors,e.g. the palm oil industry. Efforts will also support further development and implementation of the national CDM action plan.
Effect on greenhouse gas emissions: Capacity building to further develop and implement climate-friendly national energyplanning and policies in Malaysia.
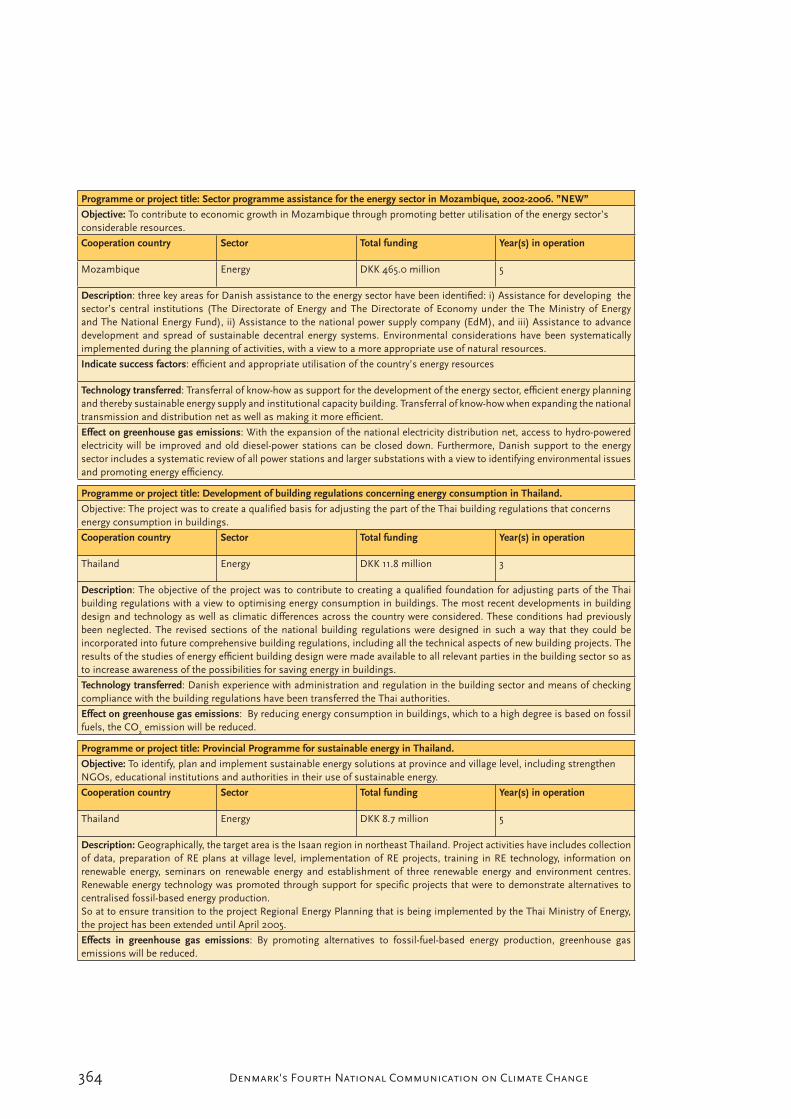
364 Denmark's Fourth National Communication on Climate Change
Programme or project title: Sector programme assistance for the energy sector in Mozambique, 2002-2006. ”NEW”
Objective: To contribute to economic growth in Mozambique through promoting better utilisation of the energy sector’sconsiderable resources.
Cooperation country Sector Total funding Year(s) in operation
Mozambique Energy DKK 465.0 million 5
Description: three key areas for Danish assistance to the energy sector have been identified: i) Assistance for developing thesector’s central institutions (The Directorate of Energy and The Directorate of Economy under the The Ministry of Energyand The National Energy Fund), ii) Assistance to the national power supply company (EdM), and iii) Assistance to advancedevelopment and spread of sustainable decentral energy systems. Environmental considerations have been systematicallyimplemented during the planning of activities, with a view to a more appropriate use of natural resources.
Indicate success factors: efficient and appropriate utilisation of the country’s energy resources
Technology transferred: Transferral of know-how as support for the development of the energy sector, efficient energy planningand thereby sustainable energy supply and institutional capacity building. Transferral of know-how when expanding the nationaltransmission and distribution net as well as making it more efficient.
Effect on greenhouse gas emissions: With the expansion of the national electricity distribution net, access to hydro-poweredelectricity will be improved and old diesel-power stations can be closed down. Furthermore, Danish support to the energysector includes a systematic review of all power stations and larger substations with a view to identifying environmental issuesand promoting energy efficiency.
Programme or project title: Development of building regulations concerning energy consumption in Thailand.
Objective: The project was to create a qualified basis for adjusting the part of the Thai building regulations that concernsenergy consumption in buildings.
Cooperation country Sector Total funding Year(s) in operation
Thailand Energy DKK 11.8 million 3
Description: The objective of the project was to contribute to creating a qualified foundation for adjusting parts of the Thaibuilding regulations with a view to optimising energy consumption in buildings. The most recent developments in buildingdesign and technology as well as climatic differences across the country were considered. These conditions had previouslybeen neglected. The revised sections of the national building regulations were designed in such a way that they could beincorporated into future comprehensive building regulations, including all the technical aspects of new building projects. Theresults of the studies of energy efficient building design were made available to all relevant parties in the building sector so asto increase awareness of the possibilities for saving energy in buildings.
Technology transferred: Danish experience with administration and regulation in the building sector and means of checkingcompliance with the building regulations have been transferred the Thai authorities.
Effect on greenhouse gas emissions: By reducing energy consumption in buildings, which to a high degree is based on fossilfuels, the CO2 emission will be reduced.
Programme or project title: Provincial Programme for sustainable energy in Thailand.
Objective: To identify, plan and implement sustainable energy solutions at province and village level, including strengthenNGOs, educational institutions and authorities in their use of sustainable energy.
Cooperation country Sector Total funding Year(s) in operation
Thailand Energy DKK 8.7 million 5
Description: Geographically, the target area is the Isaan region in northeast Thailand. Project activities have includes collectionof data, preparation of RE plans at village level, implementation of RE projects, training in RE technology, information onrenewable energy, seminars on renewable energy and establishment of three renewable energy and environment centres.Renewable energy technology was promoted through support for specific projects that were to demonstrate alternatives tocentralised fossil-based energy production.So at to ensure transition to the project Regional Energy Planning that is being implemented by the Thai Ministry of Energy,the project has been extended until April 2005.
Effects in greenhouse gas emissions: By promoting alternatives to fossil-fuel-based energy production, greenhouse gasemissions will be reduced.
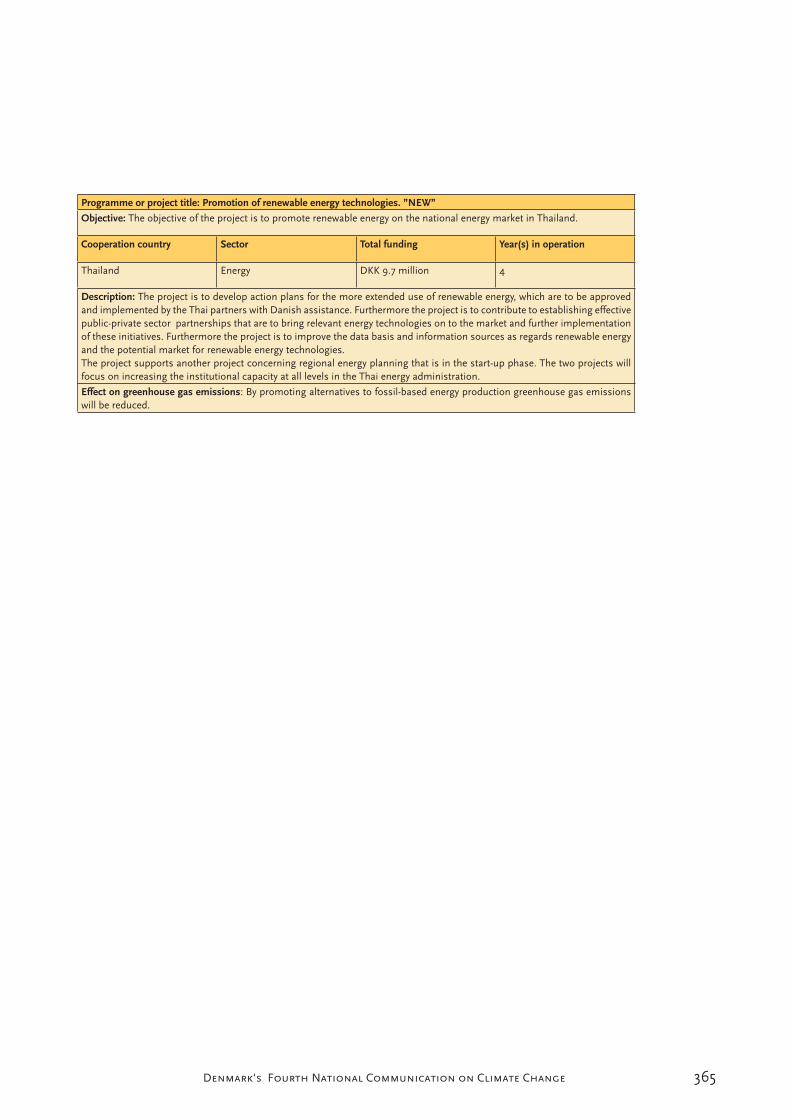
365Denmark's Fourth National Communication on Climate Change
Programme or project title: Promotion of renewable energy technologies. ”NEW”
Objective: The objective of the project is to promote renewable energy on the national energy market in Thailand.
Cooperation country Sector Total funding Year(s) in operation
Thailand Energy DKK 9.7 million 4
Description: The project is to develop action plans for the more extended use of renewable energy, which are to be approvedand implemented by the Thai partners with Danish assistance. Furthermore the project is to contribute to establishing effectivepublic-private sector partnerships that are to bring relevant energy technologies on to the market and further implementationof these initiatives. Furthermore the project is to improve the data basis and information sources as regards renewable energyand the potential market for renewable energy technologies.The project supports another project concerning regional energy planning that is in the start-up phase. The two projects willfocus on increasing the institutional capacity at all levels in the Thai energy administration.
Effect on greenhouse gas emissions: By promoting alternatives to fossil-based energy production greenhouse gas emissionswill be reduced.

366 Denmark's Fourth National Communication on Climate Change
THE DANISH METEOROLOGICAL INSTITUTE (DMI)
The research projects for the period 2002-2003 below have been financed by the European Com-mission’s research programme, the European meteorological satellite organisation, EUMETSAT, as well as national research councils and programmes.
DEMETER. Development of a European Multi-model Ensemble system for seasonal to inter-annual prediction.
PREDICATE. Mechanisms and predictability of decadal fluctuations in Atlantic-European climate.
DETECT. Detection of changing radiative forcing over the recent decades
PROMISE. Predictability and variability of monsoons, and the agricultural and hydrological impacts of climate change.
PRISM. Programme for Integrated earth System Modelling.
PRUDENCE. Prediction of Regional scenarios and Uncertainties for Defining European Climate change risks and effects. The
project is coordinated by DMI.
STARDEX. Statistical and Regional Dynamical downscaling of Extremes for European regions.
CAL. Coupling of Atmospheric Layers.
GLIMPSE. Global Implications of Arctic climate processes and feedbacks.
CWE. “Climate, Water and Energy.
SAT-MAP-CLIMATE. Satellite based bio-geophysical parameter mapping and aggregation modelling for CLIMATE models. (The
Risø Wind Energy Department also contributes.)
Application of seasonal climate forecasts for improved management strategies for crops in Western Africa.
Consequences of climate change for the oceanic environment near Greenland.
CONWOY. Consequences of Weather and climate changes for marine and freshwater ecosystems.
PSC Climate. Polar Stratospheric Clouds and ozone depletion: The role in global climate change.
MAPSCORE. Mapping of polar Stratospheric Clouds and Ozone levels relevant to the Region of Europe.
SAMMOA. Spring-to-Autumn Measurements and Modelling of Ozone and Active species.
CANDIDOZ. Chemical And Dynamical Influences on Decadal Ozone Changes.
GREENICE. Greenland arctic shelf ice and climate experiment.
MOEN. Meridional Overturning Exchange with Nordic Seas.
CONVECTION. Greenland Sea Convection Mechanisms and their Climatic Implications.
EUMETSAT OZON and UV SAF. The development and implementation of certain activities of a EUMETSAT Satellite Applica-
tion Facility on ozone monitoring.
HIBISCUS. Impact of tropical convection on the upper troposphere and lower stratosphere at global scale.
OFR-cirrus. Subvisible cirrus clouds and the effect on the transport of water vapour to the stratosphere.
VOGUE. Validation of ENVISAT ozone and NO2 products from ground based measurements in Greenland.
RAMAS. Radiometer for atmospheric measurements of Summit.
ENSEMBLES. The ENSEMBLES project.
QUANTIFY. Quantifying the climate impact of global and European transport systems.
GRAS SAF. The development of a EUMETSAT Satellite Application Facility for GRAS meteorology, including a visiting scientist
programme. The project is run by DMI.
Ocean and Sea Ice SAF. The development of a EUMETSAT Ocean and Sea Ice Satellite Application Facility.
West Nordic Ocean Climate. Circulation in the North Atlantic, transport across the Greenland-Scotland ridge. Financed by the Nor-
dic Council of Ministers.
Annex G List of selected recent and current climate-related research projects
367Denmark's Fourth National Communication on Climate Change
GEOLOGICAL SURVEY OF DENMARK AND GREENLAND - GEUS
Ice-edge monitoring Collection of time series of melt from the ice sheet in southern Greenland. Will presumably be expanded with a
Dancea project. Project period: 2003-2006.
EUROSTRATAFORM. Analyses of marine systems and present processes on the European continental margin with a view to im-
prove understanding of long climate data series. Project Period: 2002-2005.
Lake –climate interactions in space and time. Studies of lake data to understand the processes linking the state of lakes with climate
variations. Project period 2003.
Green Ice. Studies of the sea ice north of Greenland to determine changes in thickness etc. caused by climate changes. Project pe-
riod: 2003-2006.
Euro Clim. Establishment of monitoring and warning system for climate changes based on ice and water data in Greenland. Project
period: 2001-2005.
Cryosat. Participation in establishment of the programme for the CRYOSAT satellite for monitoring ice sheets, glaciers and sea ice.
Project period: 2003-2005.
ANCIENT BEECH FOREST: Studies of the range of beech forests in Europe based on fossil DNA and pollen with a view to illu-
minate the evolution of beech seen in a climatic context. Project period:2004-2007
Holocene Greenland. Identification of holocene palaeohoydrographic changes in the Greenland fjords and coastal areas in relation to
climate changes. Project period: 1999-2003.
“Norse – Climate. Studies of the natural conditions in the period 1000-1500 AD in order to cast light on the Norse’s living condi-
tions in Greenland. Project period: 2001- 2006.
History of the ice sheet. Studies of the extent of the ice sheet during the last Ice Age in the northern part of west Greenland. Project
period 2002-2006.
Davies Strait. Studies of surface and deep water circulation in Davies Strait at west Greenland with the aim of understanding links
between oceanographic changes and climate change since the last glacial maximum. Project period: 2005-2007.
DART. Quantify the dynamics of forest-tundra ecotone response to climate and land-use changes. Project period: 2000-2003.
Effects of climate changes. Development of a concept for monitoring climate changes in Denmark, the Faroe Islands, Greenland and
adjacent areas. Project period 2003-2006.
METROL. Investigations of methane emissions from the seabed in the North Sea and Danish inland waters with a view to possible
climate impacts. Project period: 2002-2006.
PACLIVA. Comparison of the climate system in the North Atlantic in the relatively cold year 2000 with the climate system that pre-
vailed from 8,000 to 6,000 years ago. Project period 2002-2006.
PASTFIRE. Studies of the relation between climate changes and past fires in forests and steppes. Paleofire incidence and emergence
are analysed to understand causes of future fires. Project period 2005-2006.
DEGVEC. Studies of vegetation response and feedback on climate changes in eight European countries. Development of dynamic
vegetation models to assess vegetation-climate interactions. Project period: 2005-2007.
Glacial earth quakes. Studies and site determination of near-surface earth quakes caused by movements of glaciers and the ice sheet
in Greenland. A possible tool to monitor glacier movement and its relation to climate changes. Project period: 2005-2006.
CO2STORE. On-land and long term Saline Aquifer CO2 storage: Assessment of geology, safety and economy of future potential
storage-sites for CO2 in Europe. The project includes detailed studies of four potential storage-structures. Continuation of geophical
monitoring of CO2 injection at the Sleipner field (SACS project). Project period: 2003-2006.
CASTOR. CO2 from Capture to Storage: GEUS is co-ordinating mapping of geological storage capacity in eight eastern European
countries. The project also includes research on separation of CO2 and a demonstration plant for CO2 separation in Esbjerg (Elsam
and Energi E2). Project period: 2004-2008.
CO2SINK. In-situ R&D Laboratory for Geological Storage of CO2: Pilot study and construction of demonstration plant for CO2
storage at Berlin. It is expected that injection of limited amounts of CO2 will take place in the period 2006-2009. The injection will
368 Denmark's Fourth National Communication on Climate Change
be monitored with a suite of geophysical instruments, and a risk-assessment will be made based on the collected data. Project period:
2004-2009.
ULCOS. Ultra Low CO2 Steelmaking: Development of new technology for reducing CO2-emission from the steel industry. GEUS
is participating with a subproject on potential geological storage of CO2 from selected European steel plants. Project period: 2004-
2009.
EOCAPACITY: Mapping of geological storage capacity in Europe (eastern and southern European countries). The project is a
continuation of the methodologies and objectives from the GETSTCO project. The project includes co-operation and exchange of
experience with China. Project period: 2006-2009.
AARHUS UNIVERSITY (GEOLOGICAL INSTITUTE)
The EU project HOLSMEER. Late Holocene Shallow Marine Environments of Europe. The focus of the project is climate
changes in the last 2,000 years. The investigations are being carried out on, inter alia, marine drilling cores from Portugal in the
south to the coastal areas of Iceland and Norway in the north. Project period: 2001-2003.
• KRONPAL. Chronology and paleoclimate: Integration of marine cores from Iceland with AMS 14C datings, ash chronology and ice
cores. The project examines large and small oceanographic shifts in the North Atlantic in the last 15,000 years and problems con-
cerning exact dating of these. Project period: 2003-2006.
• PACLIVA. see under Danish Meteorological Institute.
Varved, Holocene and interglacial lake sediments in Denmark. Lake sediments from the last 11,500 years from interglacial periods
with rhythmic stratifications (year strata, layers of glacial deposit) are being studied with a number of detailed stratigraphic methods.
One of the aims is to determine how quickly the terrestrial environment and the aquatic environment have reacted to climate changes
in the past. Project period: 2003-2005.
CONWOY: see under Danish Meteorological Institute.
Constraining the age and extent of Scandinavian Ice Sheet advances during the last glaciation in its type area in Poland with absolute
dating techniques, SNF, 2004-2006. Goal: The project intends to date Weichselian sediments in central and northern Poland using
the luminescence method to determine the age and extent of ice sheet fluctuations with special reference to the controversial Isotope
Stage 4 glaciation, and to evaluate these fluctuations in the context of global climatic trends of the last 100,000 years.
DASARG. “The Davies Strait Arctic Gateway: Ocean circulation and West Greenland Climate Change since the Last Glacial Maxi-
mum”. The project studies changes in ocean circulation, ocean ice extent, climate and meltwater from Greenland at the west Green-
land coast since the Last Glacial Maximum (the last 25,000 years). The project is also focusing on the possible anti-phase between
south-western Greenland and north-western Europe, which has been observed in recent weather patterns. The project is supported
by the Research Council for Nature and the Universe. International Polar Year Expression-of-Intent no. 1003. Project period: 2005-
2007.
Quaternary paleoclimate in northern Russia and arctic Siberia. Paleoecological studies in northern Russia and arctic Siberia, with the
purpose of studying the coupling between climate changes and variations in ocean currents and water exchange between the Arctic
Ocean and the Atlantic during the last 150,000 years.
Paleoenvironment and paleoclimate in the Baltic region in the last interglacial. Studies of climate and hydrographics in the Baltic re-
gion during the last interglacial 130,000- 115,000 years BP.
Consequences of weather and climate changes for marine and freshwater ecosystems (www.conwoy.ku.dk). Part of the funding is for
a PhD-project “influence of temperature changes on phytoplancton”. The research aims to quantify the influence of temperatures
on species composition and functioning in bacterial and phytoplancton communities in both fresh and marine waters. Project period:
2002-2005.
Mapping on the influence of climate on fish resources in the Limfjord. In a co-operation between NERI and the counties involved.
369Denmark's Fourth National Communication on Climate Change
Parasites, Climate Changes and Biodiversity. Parasite-mediated climatic impacts on diversity and structure of marine floral and
faunal communities. The research aims to map the extent of the influence of expected climate changes on coastal floral and faunal
communities solely through changes in parasite-host interactions. Project during: 3 years.
Analysis of climate signals in long time-series of fish catch data in waters around the Faroe Islands.
Impact of climate changes on migration patterns of fish in Danish waters.
Evolutionary and physiological adaptations to climatic conditions and their changes, with special interest in temperature adapta-
tions (see www.biology.au.dk/aces). In co-operation with Skejby Hospital, NERI and DIAS, Foulum. Project period: 2002-2005.
A macroecological, biogeographical perspective on plants’ biocomplexity under global change. The project aims to improve the
understanding of the impact on natural ecosystems of the ongoing global environmental changes, with special focus on climatic
influences on plant ranges and diversity. A co-operation with NERI. Project period: 2005-2008.
DENIMOB: Benthic invertebrate guts as “mobile microsites” in sediments: hot spots for denitrification and N2O production?. A
Marie Curie Intra-European Fellowship project. Project period: 2005-2006.
DANISH INSTITUTE OF AGRICULTURAL SCIENCES
DINOG. Dinitrogen fixation and nitrous oxide losses in organic grass-clover pastures: An integrated experimental and modelling
approach. The purpose is to quantify nitrogen fixation and nitrous oxide emission from grasslands through monitoring, laboratory
tests and modelling of nitrification and denitrification. Project period: 2001-2004.
MIDAIR. Greenhouse gas mitigation for organic and conventional dairy production. The purpose of this project is to identify and
quantify the main sources of greenhouse gas emissions from organic and conventional milk production and to indicate strategies
for mitigating these emissions. Project period: 2001-2004.
GREENGRASS. Sources and Sinks of Greenhouse Gases from managed European Grasslands and Mitigation Strategies. The
purpose of this project is to quantify exchange of carbon dioxide, nitrous oxide and methane from grassland in Europe through
monitoring and modelling, and to evaluate the potential for mitigation in selected operating strategies. Project period: 2002-2004.
PRUDENCE. Prediction of Regional scenarios and Uncertainties for Defining European Climate change risks and Effects. The
purpose of this project is to improve the basis for projecting climate effects through modelling and to interpret predictions and un-
certainties in relation to the EU’s policy for adaptation to and mitigation of climate changes. Project period 2002-2004.
Knowledge synthesis on energy in organic farming. Purpose: to gather knowledge about energy consumption, possible savings and
energy production in organic farming and to evaluate the possibilities for requirements on the use of fossil energy in organic pro-
duction. Project period: 2002-2003.
UNIVERSITY OF COPENHAGEN
Department of Geophysics
Projects are in progress within the following areas:
Ice cores and climate parameters, datings.
The carbon cycle/the ocean's circulation and physical properties.
The stability of the climate.
Atmospheric CO2 transports.
Large-scale meteorology.
Statistical analyses of climate data.

370 Denmark's Fourth National Communication on Climate Change
Geological Institute
Projects are in progress in the following areas:
Long lake cores from Denmark and this and the previous interglacial period.
Correlation between Greenland ice cores and lake cores in Denmark by means of well-dated ash strata from Iceland or the Eifel area
in Germany.
Institute of Geography
FITES. Fire in Tropical Ecosystems. FITES has studied the distribution, controls/causes and effects, including climatic ones, of sa-
vannah fires in the Sudanese and south-Sahelian zone of Africa. Project period: 1986-2003.
INTEO. Integration of Earth Observation Data in Distributed Hydrological Models. INTEO studies the use of Earth Observation
data for running, calibrating and validating hydrological models, at the scale of large river basins, allowing assessment of the effect of
climatic change on water resource availability. Project period: 1996 – 2005.
Land use and carbon cycle in Senegal. The project studies the impact of land use change on carbon storage in vegetation and soils
in Senegal. Project period: 1999 – 2002.
NECC. Nordic Centre for Studies of Ecosystem Carbon Exchange and its interaction with the climate system. The interaction be-
tween CO2 and climate is being studied over selected Nordic ecosystems, ranging from agricultural areas on Zealand to the tundra in
north Sweden. Project period: 2003-2007.
EO-FLUX. Earth observation data for up-scaling carbon Flux and water Budget at Zealand. CO2 and H2O exchange over Zealand is
being determined on the basis of satellite data, CO2 measurements and hydrological modelling. Project period: 2001-2003.
Institute of Molecular Biology
Forest Carbon – Nitrogen Trajectories (FORCAST). The objective was to investigate carbon and nitrogen pools and fluxes in Euro-
pean forest ecosystems. Project period: 1999-2003.
Institute of Chemistry, The Atmosphere Group
Establishment of relevant physical and chemical quantities: IR absorption spectra, velocity and photolytic constants, uptake coeffi-
cients, formation of CCN (Cloud Condensation Nuclei) etc. Project period: ongoing.
Botanical Institute
Biogeochemistry in the Arctic – processes, controls and sensitivity to global change. Measurement of drivers and controls of biogeo-
chemical nutrient and carbon cycling in arctic ecosystems and probable impacts on the cycles of a predicted climate change. Project
period: 2000-2002.
Processes in the plant-microbe-soil interface: Implications for ecosystem function. Experimental assessment of probable impact of
future projected climate change on processes in the plant-microbe-soil system in Arctic ecosystems that have been manipulated to
mimic future changes in environmental conditions. Project period: 2003–2005.
FITES - Fire in Tropical Ecosystems. Studies of the effect of fire on decomposition of matter, biodiversity and greenhouse gas emis-
sions in savannah ecosystems. The Botanical, Geographic and Zoological Institutes and the Botanical Museum are participating in
the project.
RISØ NATIONAL LABORATORY
Department for Plant Research
EU project CarbonEuroflux. Exchange of CO2 between the atmosphere and the forest ecosystem. Project period: 1996 - .
371Denmark's Fourth National Communication on Climate Change
EU CORE project. Climate –Atmosphere Interaction. Its goal is to produce continuous field measurements on atmosphere-biosphere
interactions on six field research stations run by four participants (University of Helsinki, Finnish Meteorological Institute, National
University of Ireland, Galway, and Risø National Laboratory. Project period: 2000-2003.
EU project VULCAN. Effect of heating and drying out on heath ecosystems' function, biodiversity and plant composition. In the
project experimental heating and drying out of semi-natural ecosystems is being carried out in six European countries to study the
effects on the ecosystems. Project period: 2001-2004.
EU project GREENGRASS. Sources and sinks of greenhouse gasses from managed European grasslands and mitigation scenarios.
The purpose is to acquire detailed knowledge about CO2, CH4 and N2O fluxes from grassland along European climate gradients and
under varying forms of use and cultivation with a view to evaluating possible mitigation options by changing cultivation and land-use
practice. Project period: 2001- 2004.
EU project NOFRETTE. Nitrogen oxide emissions from European forest ecosystems. The project covers emissions of NO and
N2O from forest ecosystems. Its purpose is partly to determine the size of these emissions and partly to describe the fundamental
processes that drive the NO/N2O emissions from European forest ecosystems under the influence of geographically determined vari-
ations in nitrogen deposition, climate and soil conditions and types of forest. Project period: 2001 – 2004.
Emissions of greenhouse gases and nitrogen fixation in alfalfa. The project aims at clarifying emissions of N2O from grazed alfalfa
fields and determine what share of biologically fixed nitrogen is released as N2O. Project period: 2000-2004.
Recovery of forest ecosystems from acidification - impacts of climate change. In this project model calculations are being carried out
of the effect of climate changes on the recovery processes for soil acidification under the agreed protocols for reduction of sulphur
and nitrogen emissions. Project period 2001-2003.
UV impacts on the vegetation in Zackenberg, Greenland. The main purpose of the project is to establish a relatively simple and ro-
bust method for continuous monitoring of the effects of UV radiation on selected Arctic species of plant in Zackenberg, Greenland.
Project period: 2001- 2004.
CLIMAITE - Climate change effects on biological processes in terrestrial ecosystems. A Danish climate centre aimed at creating a
cohesive understanding of how interacting climate changes will affect biological processes in nature. Based on large-scale field tests
with realistic manipulations of temperature, precipitation and CO2. Project period 2005-2009.
Energy System Group
Assessment and Dissemination activity on major Investment Opportunities for renewable electricity in Europe using the REBUS tool
- Admire Rebus. Funded by the EU ALTERNER programme. Project period: 2002-2003.
Green-X Deriving optimal promotion strategies for increasing the share of RES-E in a dynamic European electricity market. The
core objective of this project is to facilitate a significantly increased electricity generation from renewable energy sources (RES-E)
in a liberalised electricity market with minimal costs to European citizen. To identify most important strategies the dynamic toolbox
Green-X will be developed. Project period 2002-2004.
Department for Wind Energy
SAT-MAP-CLIMATE. Satellite based bio-geophysical parameter mapping and aggregation modelling for CLIMATE models. The
purpose of the project was to extract information from satellite pictures of surface roughness over land, sea and land temperatures,
albedo and plant cover and to utilise the resulting maps in weather forecasting and climate models. Project period: 1999-2002 (DMI
also participated.).
WATERMED. Water use Efficiency in natural vegetation and agricultural areas by remote sensing in the Mediterranean basin. The
purpose of the project is to map water balance and vegetation in the Mediterranean area, in both Europe and Africa, on the basis of
satellite pictures and modelling. Project period: 2000-2003.

372 Denmark's Fourth National Communication on Climate Change
EO-FLUX-BUDGET. Earth Observation data for up-scaling carbon FLUX and water BUDGET at Zealand. The purpose of the
project is to determine the CO2 and water balance for a region (Zealand) on the basis of satellite pictures and modelling. The results
complement point measurements of CO2 and water balance in a climate context. Project period 2000-2004.
EU project AutoFlux. The objective of the AutoFlux project has been to develop an instrumentation system AutoFlux for routine
unattended use on Voluntary Observing Ships or unmanned buoys, for monitoring climate relevant surface fluxes over the oceans.
Project period 1998-2002.
NEAREX. Modelling and measuring the transport of CO2 to the Greenland Sea from Eastern/Central Europe. Project period: 1998-
2002.
NATIONAL ENVIRONMENTAL RESEARCH INSTITUTE (NERI)
Department for Marine Ecology
MARINBASIS. Environmental monitoring in Zackenberg. Marine monitoring of abiotic and biotic reactions on year-to-year varia-
tions and long-term climate changes with a view to being able to predict and document the effects of the expected climate changes.
Project period: 1995 - and following decades.
ANOXIA IN SEA ICE: Importance for C and N cycling in the Arctic – Implications of reduction in sea ice distribution and thick-
ness on nitrogen and carbon transformations. Project period: 2001-2003.
NARP. The bio production and energy transfer in the Nordic Seas, the role of key zooplanktons in a system with rapid climate
changes. Project period: 2001-2003.
CASES. Canadian Arctic Shelf Exchange Study. Central goal: To understand and model the response of the Mackenzie Shelf eco-
system to atmospheric, oceanic and continental forcing of sea-ice cover variability. Project period: 2003-2007+.
CANABA. Carbon flux and ecosystem feed back in the northern Barents Sea in an era of climate change. Project period: 2003-
2006.
Consequences of climatic changes on Greenlandic marine ecosystems. Project period: 2001-2003.
Functional diversity of bacteria and phytoplankton in the Disco Bay, Greenland Project period: 2001-2003.
Department of Arctic Environment
The biological monitoring programme BioBasis, in Zackenberg, northeast Greenland. Monitoring of biotic reactions on year-to-
year variations and long-term climate changes with a view to being able to predict and document the effects of the expected climate
changes. Project period: 1995 and following decades.
The natural geographic monitoring programme GeoBasis in Zackenberg, northeast Greenland. Monitoring of abiotic reactions on
year-to-year variations and long-term changes in the climate with a view to being able to predict and document the effects of the ex-
pected climate changes. Project period: 1995 and following decades.
Environmental monitoring in Zackenberg - Marine Basis. Project period 1995 and following decades.
Anoxia in sea ice: Importance for C and N cycling in the Arctic. Project period: 2001-2003.
Effect of climate on Arctic marine ecosystems. Project period: 2001-2003.
The bio production and energy transfer in the Nordic Seas, the role of key zooplanktons in a system with rapid climate changes.
Project period: 2001-2003.
The Collared Lemming (Dicrostonyx groenlandicus) in Greenland: Population Dynamics and Habitat Selection in Relation to Food
Quality. The study was focused on the collared lemming’s food biology and habitat selection in relation to the 4-year cyclical fluctua-
tions in population. Project period: 1999-2002.
Carbon balance for a High-Arctic ecosystem. The purpose of the project is to estimate the annual carbon exchange in the Zacken-
berg area. Project period: 2002-2005.
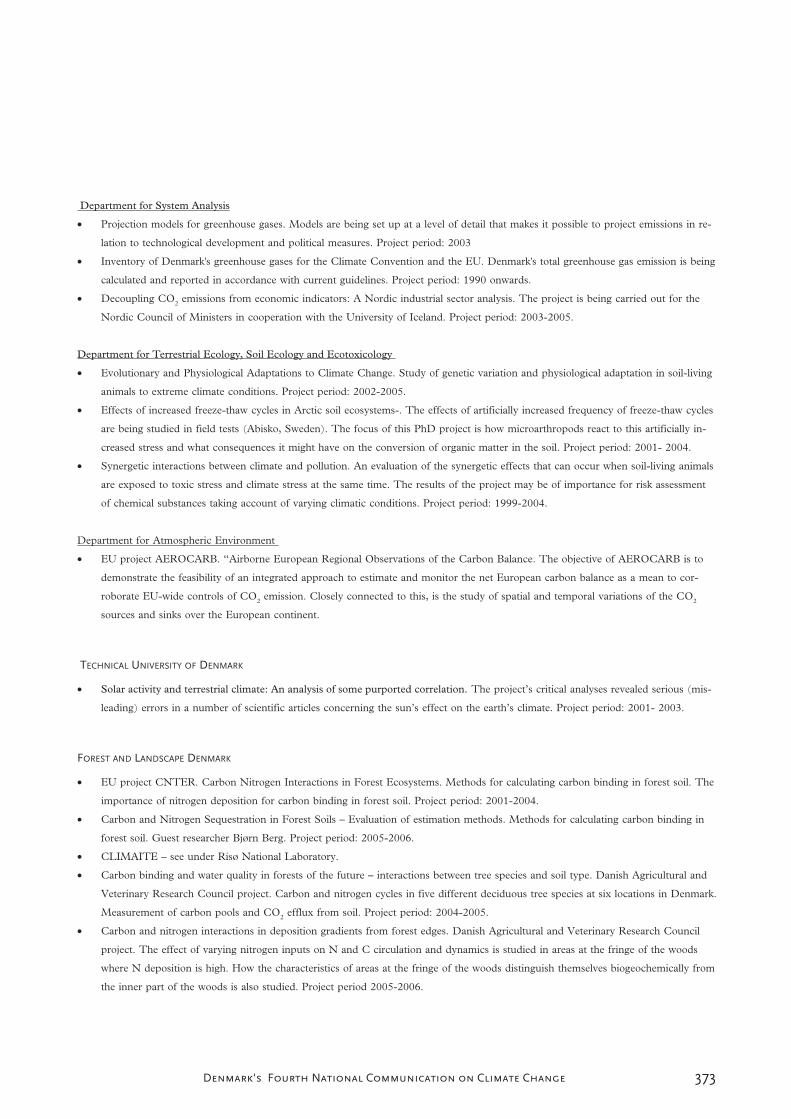
373Denmark's Fourth National Communication on Climate Change
Department for System Analysis
Projection models for greenhouse gases. Models are being set up at a level of detail that makes it possible to project emissions in re-
lation to technological development and political measures. Project period: 2003
Inventory of Denmark's greenhouse gases for the Climate Convention and the EU. Denmark's total greenhouse gas emission is being
calculated and reported in accordance with current guidelines. Project period: 1990 onwards.
Decoupling CO2 emissions from economic indicators: A Nordic industrial sector analysis. The project is being carried out for the
Nordic Council of Ministers in cooperation with the University of Iceland. Project period: 2003-2005.
Department for Terrestrial Ecology, Soil Ecology and Ecotoxicology
Evolutionary and Physiological Adaptations to Climate Change. Study of genetic variation and physiological adaptation in soil-living
animals to extreme climate conditions. Project period: 2002-2005.
Effects of increased freeze-thaw cycles in Arctic soil ecosystems-. The effects of artificially increased frequency of freeze-thaw cycles
are being studied in field tests (Abisko, Sweden). The focus of this PhD project is how microarthropods react to this artificially in-
creased stress and what consequences it might have on the conversion of organic matter in the soil. Project period: 2001- 2004.
Synergetic interactions between climate and pollution. An evaluation of the synergetic effects that can occur when soil-living animals
are exposed to toxic stress and climate stress at the same time. The results of the project may be of importance for risk assessment
of chemical substances taking account of varying climatic conditions. Project period: 1999-2004.
Department for Atmospheric Environment
EU project AEROCARB. “Airborne European Regional Observations of the Carbon Balance. The objective of AEROCARB is to
demonstrate the feasibility of an integrated approach to estimate and monitor the net European carbon balance as a mean to cor-
roborate EU-wide controls of CO2 emission. Closely connected to this, is the study of spatial and temporal variations of the CO2
sources and sinks over the European continent.
TECHNICAL UNIVERSITY OF DENMARK
Solar activity and terrestrial climate: An analysis of some purported correlation. The project’s critical analyses revealed serious (mis-
leading) errors in a number of scientific articles concerning the sun’s effect on the earth’s climate. Project period: 2001- 2003.
FOREST AND LANDSCAPE DENMARK
EU project CNTER. Carbon Nitrogen Interactions in Forest Ecosystems. Methods for calculating carbon binding in forest soil. The
importance of nitrogen deposition for carbon binding in forest soil. Project period: 2001-2004.
Carbon and Nitrogen Sequestration in Forest Soils – Evaluation of estimation methods. Methods for calculating carbon binding in
forest soil. Guest researcher Bjørn Berg. Project period: 2005-2006.
CLIMAITE – see under Risø National Laboratory.
Carbon binding and water quality in forests of the future – interactions between tree species and soil type. Danish Agricultural and
Veterinary Research Council project. Carbon and nitrogen cycles in five different deciduous tree species at six locations in Denmark.
Measurement of carbon pools and CO2 efflux from soil. Project period: 2004-2005.
Carbon and nitrogen interactions in deposition gradients from forest edges. Danish Agricultural and Veterinary Research Council
project. The effect of varying nitrogen inputs on N and C circulation and dynamics is studied in areas at the fringe of the woods
where N deposition is high. How the characteristics of areas at the fringe of the woods distinguish themselves biogeochemically from
the inner part of the woods is also studied. Project period 2005-2006.
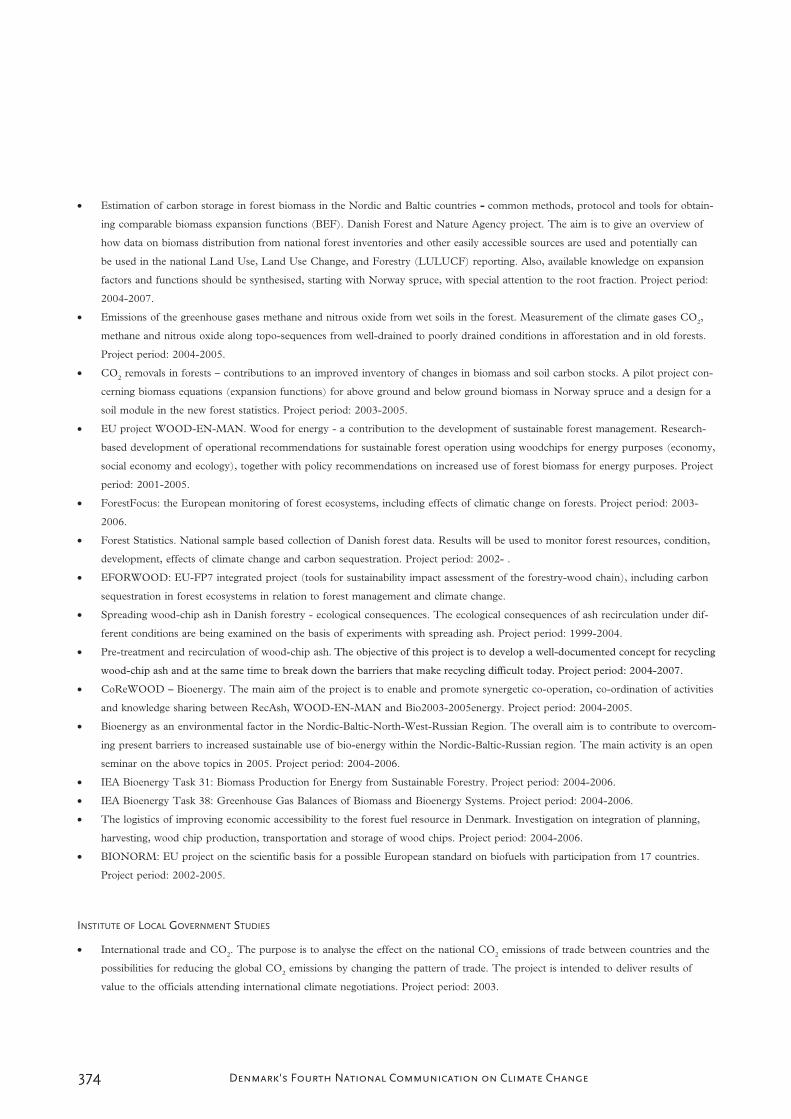
374 Denmark's Fourth National Communication on Climate Change
Estimation of carbon storage in forest biomass in the Nordic and Baltic countries - common methods, protocol and tools for obtain-
ing comparable biomass expansion functions (BEF). Danish Forest and Nature Agency project. The aim is to give an overview of
how data on biomass distribution from national forest inventories and other easily accessible sources are used and potentially can
be used in the national Land Use, Land Use Change, and Forestry (LULUCF) reporting. Also, available knowledge on expansion
factors and functions should be synthesised, starting with Norway spruce, with special attention to the root fraction. Project period:
2004-2007.
Emissions of the greenhouse gases methane and nitrous oxide from wet soils in the forest. Measurement of the climate gases CO2,
methane and nitrous oxide along topo-sequences from well-drained to poorly drained conditions in afforestation and in old forests.
Project period: 2004-2005.
CO2 removals in forests – contributions to an improved inventory of changes in biomass and soil carbon stocks. A pilot project con-
cerning biomass equations (expansion functions) for above ground and below ground biomass in Norway spruce and a design for a
soil module in the new forest statistics. Project period: 2003-2005.
EU project WOOD-EN-MAN. Wood for energy - a contribution to the development of sustainable forest management. Research-
based development of operational recommendations for sustainable forest operation using woodchips for energy purposes (economy,
social economy and ecology), together with policy recommendations on increased use of forest biomass for energy purposes. Project
period: 2001-2005.
ForestFocus: the European monitoring of forest ecosystems, including effects of climatic change on forests. Project period: 2003-
2006.
Forest Statistics. National sample based collection of Danish forest data. Results will be used to monitor forest resources, condition,
development, effects of climate change and carbon sequestration. Project period: 2002- .
EFORWOOD: EU-FP7 integrated project (tools for sustainability impact assessment of the forestry-wood chain), including carbon
sequestration in forest ecosystems in relation to forest management and climate change.
Spreading wood-chip ash in Danish forestry - ecological consequences. The ecological consequences of ash recirculation under dif-
ferent conditions are being examined on the basis of experiments with spreading ash. Project period: 1999-2004.
Pre-treatment and recirculation of wood-chip ash. The objective of this project is to develop a well-documented concept for recycling
wood-chip ash and at the same time to break down the barriers that make recycling difficult today. Project period: 2004-2007.
CoReWOOD – Bioenergy. The main aim of the project is to enable and promote synergetic co-operation, co-ordination of activities
and knowledge sharing between RecAsh, WOOD-EN-MAN and Bio2003-2005energy. Project period: 2004-2005.
Bioenergy as an environmental factor in the Nordic-Baltic-North-West-Russian Region. The overall aim is to contribute to overcom-
ing present barriers to increased sustainable use of bio-energy within the Nordic-Baltic-Russian region. The main activity is an open
seminar on the above topics in 2005. Project period: 2004-2006.
IEA Bioenergy Task 31: Biomass Production for Energy from Sustainable Forestry. Project period: 2004-2006.
IEA Bioenergy Task 38: Greenhouse Gas Balances of Biomass and Bioenergy Systems. Project period: 2004-2006.
The logistics of improving economic accessibility to the forest fuel resource in Denmark. Investigation on integration of planning,
harvesting, wood chip production, transportation and storage of wood chips. Project period: 2004-2006.
BIONORM: EU project on the scientific basis for a possible European standard on biofuels with participation from 17 countries.
Project period: 2002-2005.
INSTITUTE OF LOCAL GOVERNMENT STUDIES
International trade and CO2. The purpose is to analyse the effect on the national CO2 emissions of trade between countries and the
possibilities for reducing the global CO2 emissions by changing the pattern of trade. The project is intended to deliver results of
value to the officials attending international climate negotiations. Project period: 2003.
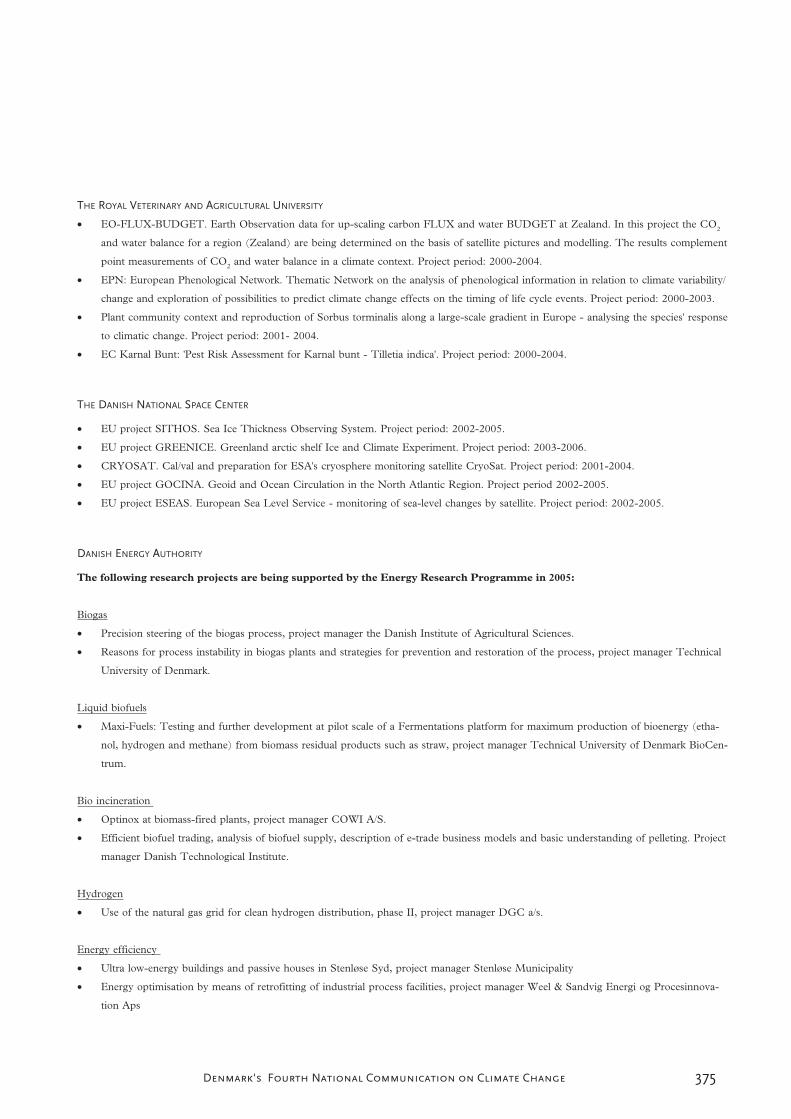
375Denmark's Fourth National Communication on Climate Change
THE ROYAL VETERINARY AND AGRICULTURAL UNIVERSITY
EO-FLUX-BUDGET. Earth Observation data for up-scaling carbon FLUX and water BUDGET at Zealand. In this project the CO2
and water balance for a region (Zealand) are being determined on the basis of satellite pictures and modelling. The results complement
point measurements of CO2 and water balance in a climate context. Project period: 2000-2004.
EPN: European Phenological Network. Thematic Network on the analysis of phenological information in relation to climate variability/
change and exploration of possibilities to predict climate change effects on the timing of life cycle events. Project period: 2000-2003.
Plant community context and reproduction of Sorbus torminalis along a large-scale gradient in Europe - analysing the species' response
to climatic change. Project period: 2001- 2004.
EC Karnal Bunt: 'Pest Risk Assessment for Karnal bunt - Tilletia indica'. Project period: 2000-2004.
THE DANISH NATIONAL SPACE CENTER
EU project SITHOS. Sea Ice Thickness Observing System. Project period: 2002-2005.
EU project GREENICE. Greenland arctic shelf Ice and Climate Experiment. Project period: 2003-2006.
CRYOSAT. Cal/val and preparation for ESA's cryosphere monitoring satellite CryoSat. Project period: 2001-2004.
EU project GOCINA. Geoid and Ocean Circulation in the North Atlantic Region. Project period 2002-2005.
EU project ESEAS. European Sea Level Service - monitoring of sea-level changes by satellite. Project period: 2002-2005.
DANISH ENERGY AUTHORITY
The following research projects are being supported by the Energy Research Programme in 2005:
Biogas
Precision steering of the biogas process, project manager the Danish Institute of Agricultural Sciences.
Reasons for process instability in biogas plants and strategies for prevention and restoration of the process, project manager Technical
University of Denmark.
Liquid biofuels
Maxi-Fuels: Testing and further development at pilot scale of a Fermentations platform for maximum production of bioenergy (etha-
nol, hydrogen and methane) from biomass residual products such as straw, project manager Technical University of Denmark BioCen-
trum.
Bio incineration
Optinox at biomass-fired plants, project manager COWI A/S.
Efficient biofuel trading, analysis of biofuel supply, description of e-trade business models and basic understanding of pelleting. Project
manager Danish Technological Institute.
Hydrogen
Use of the natural gas grid for clean hydrogen distribution, phase II, project manager DGC a/s.
Energy efficiency
Ultra low-energy buildings and passive houses in Stenløse Syd, project manager Stenløse Municipality
Energy optimisation by means of retrofitting of industrial process facilities, project manager Weel & Sandvig Energi og Procesinnova-
tion Aps

376 Denmark's Fourth National Communication on Climate Change
Innovative and energy efficient refurbishment of public buildings – Danish parallel project to BRITA in PuBs, a demonstration project
under the EU Sixth Framework Programme, project manager Danish Building and Urban Research.
Reduced energy consumption for ventilation of buildings where low-polluting materials and furniture have been chosen systematically,
project manager Technical University of Denmark.
Individual or collective heating supply for new housing areas in the near and distant future, project manager RAMBØLL
Energy efficient production and distribution of domestic hot water in dwellings in light of the EU Building Directive and coming national
requirements regarding energy consumption in buildings, project manager Technical University of Denmark.
OPTIPOLYGEN (OPTimum Integration of POLYGENeration in the Food Industry), project manager FORCE Technology.
Development of low-energy classification 1 standard houses, project manager Technical University of Denmark.
Society
Consequences of quota regulations on developments in the Danish energy sector – scenario analyses, project manager RAMBØLL a/s.
Solar energy
Solar City Horsens – solar cell roofs in low-energy buildings of the future, project manager Byfornyelse Danmark.
Solar cells – the significance of the spread of solar cells on price reductions, as well as the need and consequences for operational targets,
project manager PA Energy A/S.
Heat pumps
Demonstration of gas-fired diffusion-absorption heating pumps for one-family houses, project manager DGC a/s.
Wind energy
Programme for Research in Applied Aeroelasticity, project manager Risø National Laboratory.
Improved design basis for large wind turbine wings made of fibre composites (Phase 3), project manager Risø National Laboratory.
Soil-Structure interaction of foundations for offshore wind turbines, project manager Aalborg University.
Project supported by the Energy Research Programme – 2004:
Biomass
Use of straw in biogas plants and possibilities to increase energy utilisation, project manager the Danish Institute of Agricultural Science.
Methods to optimise biogas yield at manure-based biogas facilities, project manager Technical University of Denmark (Environment &
Resources).
Collective biogas plants of the future – the interplay between separation of manure and biogas production, project manager the Food and
Resource Economics Institute.
Possible after-treatment of separated solid fraction from biogas production, preliminary project, project manager Rambøll a/s.
IEA, Fischer Tropsch fuels for transport, project manager Technical University of Denmark (Mechanics, Energy and Construction).
Bioethanol production part 3 (follow-up of parts 1 and 2), project manager Technical University of Denmark (Biocentrum).
IEA, Bioenergy Agreement Task: Biomass Combustion and Co-firing. Danish representation 2004-06, project manager dk-TEKNIK
ENERGI & MILJØ.
IEA, Bioenergy Agreement Task: Thermal Gasification of Biomass. Danish representation 2004-06, project manager dk-TEKNIK EN-
ERGI & MILJØ.
Integration of SOFC fuel cell and two-step process, project manager COWI A/S.
GreenFuelCell – Integrated gasification fuel-cell plant (SOFC), project manager TK Energi A/S.

377Denmark's Fourth National Communication on Climate Change
Dissemination of research results within bioenergy, project manager BioPress.
IEA, Task: Biomass Production for energy from Sustainable Forestry (2004-06), project manager Forest and Landscape Denmark.
IEA, Task: Greenhouse Gas Balances of Biomass and Bioenergy Systems (2004-06), project manager Forest and Landscape Den-
mark.
Energy efficiency
Development of process optimisation in a U-loop fermentor, project manager UniBio A/S.
High insulated glass structures in multi-storey dwellings, measurements and evaluation, Phase 2, project manager SBI/Danish Build-
ing and Urban Research.
Fuel cells
Development of 2 kW natural gas reformer for high and low temperature PEM fuel cells, project manager DGC – Danish Gas
Technology Centre.
DK-SOFC b, Long-term SOFC development, project manager Risø National Laboratory.
Solar energy
Standard house with integrated photovoltaic panels, project manager EnergiMidt A/S.
IEA, SHC, Management of Task PV/Thermal Solar Systems (Maximisation of energy yield from photovoltaic systems), project
manager Esbensen Rådg. Ing.
Development, production and demonstration of a new and improved ARCON HT-SA solar collector, project manager Planenergi.
Wind energy
Electrical design and optimisation of wind turbines, project manager Aalborg University (Energy Technology).
Dynamical wake model for detailed aeroelastic simulation of wind turbines in farms, project manager Risø National Laboratory.
Programme for Research in Applied Aeroelasticity, project manager Risø National Laboratory.
Projects concerning social aspects
Short-term flexibility in electricity consumption - quantification, stimulation and valuation, project manager Risø National Labora-
tory.
Energy taxes, environment and competitiveness, project manager Institute of Local Government Studies Denmark.
Energy consumption in the domestic sector: An econometric analysis of the effect of the energy label scheme and building regula-
tions, project manager Institute of Local Government Studies Denmark.
Energy storage and system integration
Electrolysis for energy storage and grid balancing, project manager INCOTECO.
The Integration of Micro-CHP and Renewable Energy Systems (Micro-CHeaP), project manager dk-TEKNIK ENERGI & MILJØ.
Projects supported by the Energy Research Programme - 2003
Biomass
Production of bioethanol - part 2, project manager Technical University of Denmark/BioCentrum/CPB (Risø National Laboratory/
Plant Research Department, Novozymes).

378 Denmark's Fourth National Communication on Climate Change
LIFTOFF gasification plant in Gjøl 3A) dk-TEKNIK (CIRAD, Gjøl CHP Company, TKE, National Technical Univ. of Athens,
ARMINES/Ecole des Mines d'Albi-Carmaux).
The pyrolysis conditions influence on the tar content in the gas from a staged biomass gasifier, project manager TK Energi AS
(CIRAD/CEA).
Optimisation of straw-fired boilers for district heating, project manager dk-TEKNIK (manufacturers of boiler plant).
Wave power
Wave power: Development project for prototype design of AquaBuOY and incorporation of Power Take Off system, project man-
ager Rambøll a/s.
Energy efficiency
Low energy lighting sources and fixtures based on light diode technologies for outdoor lighting, e.g. for road lighting, project man-
ager Lumistrator Aps.
Deamonification - significant energy-saving new biological method for removing nitrogen from industrial wastewater, project man-
ager C.P. Kelco (Envicare, Hannover University, Herning Municipality, Aalborg University.
IEA Annex 36 Retrofitting educational buildings, project manager Danish Building and Urban Research.
Solar energy
Solar cells and architecture - BIPV in refurbishment projects and new buildings, project manager Byfornyelse Danmark.
Electricity producing sun screens, project manager Danish Building and Urban Research (Dasolas Internat., Gaia Solar, TI-SolEn-
ergi-Centret, Servodan, Esbensen).
IEA PVPS work in 2004 and 2005 (co-financed with PSO), project manager EnergiMidt A/S.
Wind energy
Wind measurements. Development and documentation of new and existing methods for remote and in-situ measurements of wind,
project manager Risø National Laboratory.
Research of material technology for surface coating of wind turbine wings and development of testing methods for lifetime of coat-
ings, project manager FORCE (Risø National Laboratory, Aalborg University).
Improved design basis for large wind turbine wings made of fibre composites (phase II), project manager Risø National Laboratory
(Technical University of Denmark; Aalborg University, LM Glasfiber, Vestas).
System integration
Advanced storage concepts for solar thermal systems in low energy buildings, project manager Department of Civil Engineering/
Technical University of Denmark (participants form a number of European countries).
Expressor heat pump for heat production in small-scale CHPs, project manager TI (Association of Danish CHPs, City Univ./Lon-
don).
THE DANISH COASTAL AUTHORITY
COMCOAST. The project is sponsored by the EU, and the pilot project aims at carrying out a socio-economic cost-benefit analysis
of moving a dike at Rømø farther in land, as an alternative to strengthening the existing dike. Project period 2004-2007.
Effects of Climate Change on the Coast. The project aims at establishing calculation models for coastal erosion as a function of cli-
mate change. Project period 2002-2006.

379Denmark's Fourth National Communication on Climate Change
1 INTRODUCTION ..................... 2
1.1 Systematic observations.......................... 2
1.2 Data availability..................................... 2
2 METEOROLOGICAL AND
ATMOSPHERIC
OBSERVATIONS ............................3
2.1 Contributing to GCOS ............................ 3
2.2 GCOS Surface Network /
GSN Stations ......................................... 3
2.3 GCOS Upper Air Network /
GUAN Stations ...................................... 3
2.4 GCOS Global Atmospheric Watch /
GAW Stations ........................................ 3
2.5 Other national meteorological and
atmospheric observations:....................... 4
2.5.1 Climatological/meteorological
surface stations ................................................ 4
2.5.2 Precipitation observation networks
(stations and radar).......................................... 5
2.5.3 Surface radiation and sunshine
observation network......................................... 6
2.5.4 Solar ultraviolet (UV) radiation and
stratospheric ozone stations.............................. 6
2.5.5 Upper air strata measurements
- Radio sounding observations.......................... 6
2.5.6 Ice observations............................................... 7
2.5.7 Climatological data sets ................................... 7
2.5.8 Air quality monitoring...................................... 7
3 OCEANOGRAPHIC OBSERVATIONS9
3.1 Contributing to GCOS ............................ 9
3.2 Voluntary observing ships/VOS ...............10
3.3 Tide gauge/GLOSS ................................10
3.4 Automatic shipboard aerological
programme (ASAP) ..............................10
3.5 Other national oceanographic and
maritime observations ...........................11
3.5.1 Sea temperatures ........................................... 11
3.5.2 National tide gauge network........................... 11
3.5.3 Hydrographic and marine surveys................... 11
4 TERRESTRIAL
OBSERVATIONS .......................... 12
5 SPACE-BASED
OBSERVATIONS .......................... 12
Annex H Denmark’s report on systematic climate observations for the global climate observing system (GCOS)
Denmark’s Report OnSystematic Observations ForThe Global Climate Observing System(Gcos) In Connection With The FourthNational CommunicationUnder The United NationsFramework Convention On ClimateChange (UNFCCC)
Source: The Meteorological Institute and
The National Environmental Research Institute
The annual mean temperature, Denmark, 1873-2004

380 Denmark's Fourth National Communication on Climate Change
5.1 ESA and EUMETSAT
satellites and programmes......................13
5.2 GPS data from the Ørsted, SAC-C and
CHAMP satellites..................................14
6 ACTIVITIES IN DEVELOPING
COUNTRIES RELATING TO
OBSERVATIONS .......................... 14
7 LIST OF ACRONYMS ................... 16
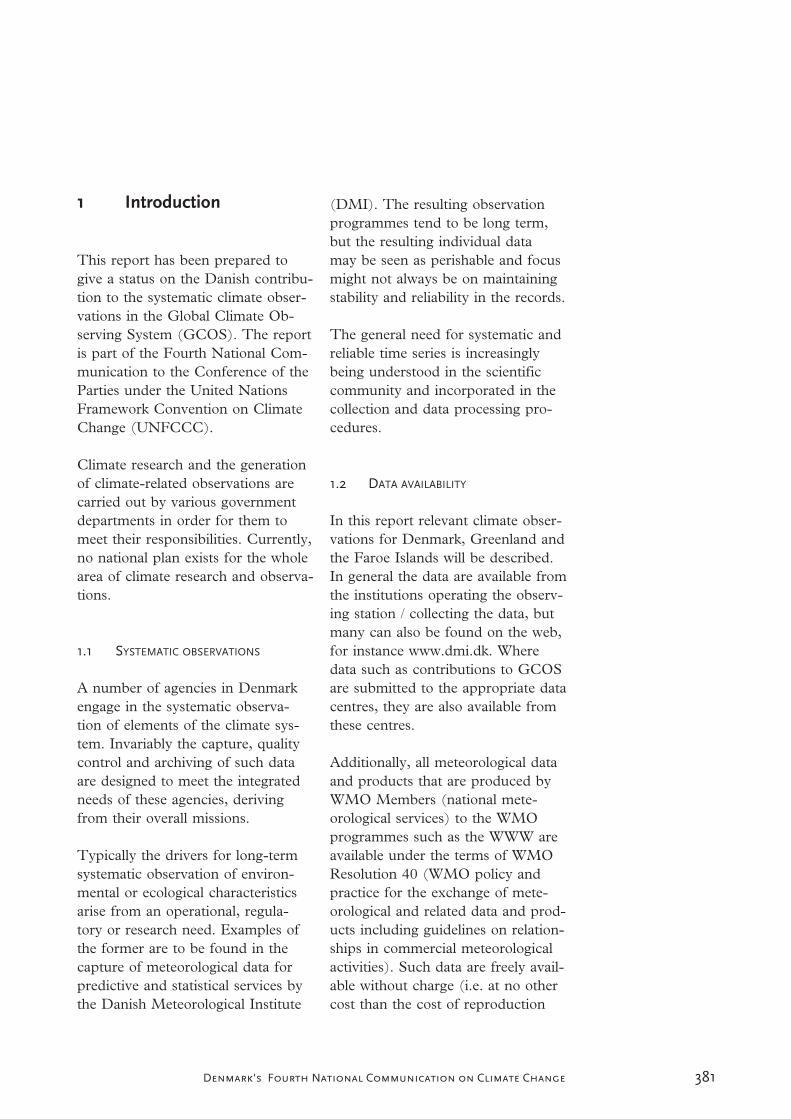
381Denmark's Fourth National Communication on Climate Change
1 Introduction
This report has been prepared to give a status on the Danish contribu-tion to the systematic climate obser-vations in the Global Climate Ob-serving System (GCOS). The report is part of the Fourth National Com-munication to the Conference of the Parties under the United Nations Framework Convention on Climate Change (UNFCCC).
Climate research and the generation of climate-related observations are carried out by various government departments in order for them to meet their responsibilities. Currently, no national plan exists for the whole area of climate research and observa-tions.
1.1 SYSTEMATIC OBSERVATIONS
A number of agencies in Denmark engage in the systematic observa-tion of elements of the climate sys-tem. Invariably the capture, quality control and archiving of such data are designed to meet the integrated needs of these agencies, deriving from their overall missions.
Typically the drivers for long-term systematic observation of environ-mental or ecological characteristics arise from an operational, regula-tory or research need. Examples of the former are to be found in the capture of meteorological data for predictive and statistical services by the Danish Meteorological Institute
(DMI). The resulting observation programmes tend to be long term, but the resulting individual data may be seen as perishable and focus might not always be on maintaining stability and reliability in the records.
The general need for systematic and reliable time series is increasingly being understood in the scientific community and incorporated in the collection and data processing pro-cedures.
1.2 DATA AVAILABILITY
In this report relevant climate obser-vations for Denmark, Greenland and the Faroe Islands will be described. In general the data are available from the institutions operating the observ-ing station / collecting the data, but many can also be found on the web, for instance www.dmi.dk. Where data such as contributions to GCOS are submitted to the appropriate data centres, they are also available from these centres.
Additionally, all meteorological data and products that are produced by WMO Members (national mete-orological services) to the WMO programmes such as the WWW are available under the terms of WMO Resolution 40 (WMO policy and practice for the exchange of mete-orological and related data and prod-ucts including guidelines on relation-ships in commercial meteorological activities). Such data are freely avail-able without charge (i.e. at no other cost than the cost of reproduction
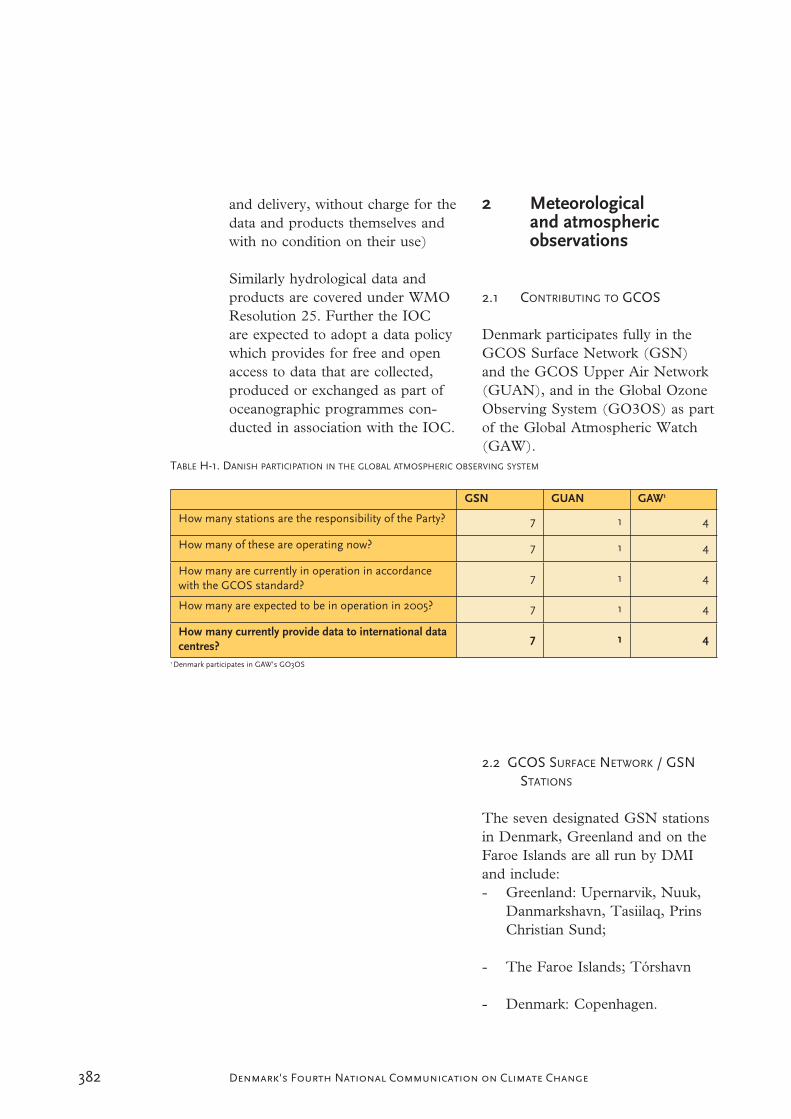
382 Denmark's Fourth National Communication on Climate Change
and delivery, without charge for the data and products themselves and with no condition on their use)
Similarly hydrological data and products are covered under WMO Resolution 25. Further the IOC are expected to adopt a data policy which provides for free and open access to data that are collected, produced or exchanged as part of oceanographic programmes con-ducted in association with the IOC.
2 Meteorologicaland atmospheric observations
2.1 CONTRIBUTING TO GCOS
Denmark participates fully in the GCOS Surface Network (GSN) and the GCOS Upper Air Network (GUAN), and in the Global Ozone Observing System (GO3OS) as part of the Global Atmospheric Watch (GAW).
2.2 GCOS SURFACE NETWORK / GSNSTATIONS
The seven designated GSN stations in Denmark, Greenland and on the Faroe Islands are all run by DMI and include:- Greenland: Upernarvik, Nuuk,
Danmarkshavn, Tasiilaq, Prins Christian Sund;
- The Faroe Islands; Tórshavn
- Denmark: Copenhagen.
GSN GUAN GAW1
How many stations are the responsibility of the Party? 7 1 4
How many of these are operating now? 7 1 4
How many are currently in operation in accordancewith the GCOS standard?
7 1 4
How many are expected to be in operation in 2005? 7 1 4
How many currently provide data to international data centres?
7 1 4
1 Denmark participates in GAW’s GO3OS

383Denmark's Fourth National Communication on Climate Change
All of these stations currently meet the GCOS standard for surface ob-servation.
2.3 GCOS UPPER AIR NETWORK /GUAN STATIONS
Only one GUAN station is desig-nated for Denmark, Greenland and the Faroe Islands and it is situated in Narsarsuaq, Greenland. The station is run by DMI and is operated in ac-cordance with the GCOS standard. A survey of the station’s 2004 results shows that 88% of the soundings reached a pressure of 30 hPa.
2.4 GCOS GLOBAL ATMOSPHERIC
WATCH / GAW STATIONS
As part of the GAW programme, Denmark contributes to the Global Ozone Observing System (GO3OS) with three stations in Greenland and one in Denmark. The sta-tions in Kangerlussuaq (Greenland) and Copenhagen (Denmark) are equipped with Brewer spectrometers, the station in Pituffik (Greenland) is equipped with a Dobson and a SAOZ spectrometer, and the sta-tion in Illoqqortoormiut (Green-land) is equipped with a SAOZ spectrometer. The spectrometer in Illoqqortoormiut is operated by Service d’Aeronomie (France) in cooperation with DMI while all other spectrometers are operated by DMI. All data are available from DMI. The stations in Greenland are primary and secondary stations in the Network for the Detection of
Stratospheric Change (NDSC) that is supported by the International Ozone Commission, the UNEP and the WMO.
2.5 OTHER NATIONAL METEOROLOGI-CAL AND ATMOSPHERIC OBSERVATIONS:2.5.1 Climatological/meteorological
surface stations
DMI operates and receives data from a network of approximately 100 automatic meteorological sta-tions in Denmark, Greenland and on the Faroe Islands. Measurements are made in accordance with the WMO recommendations.
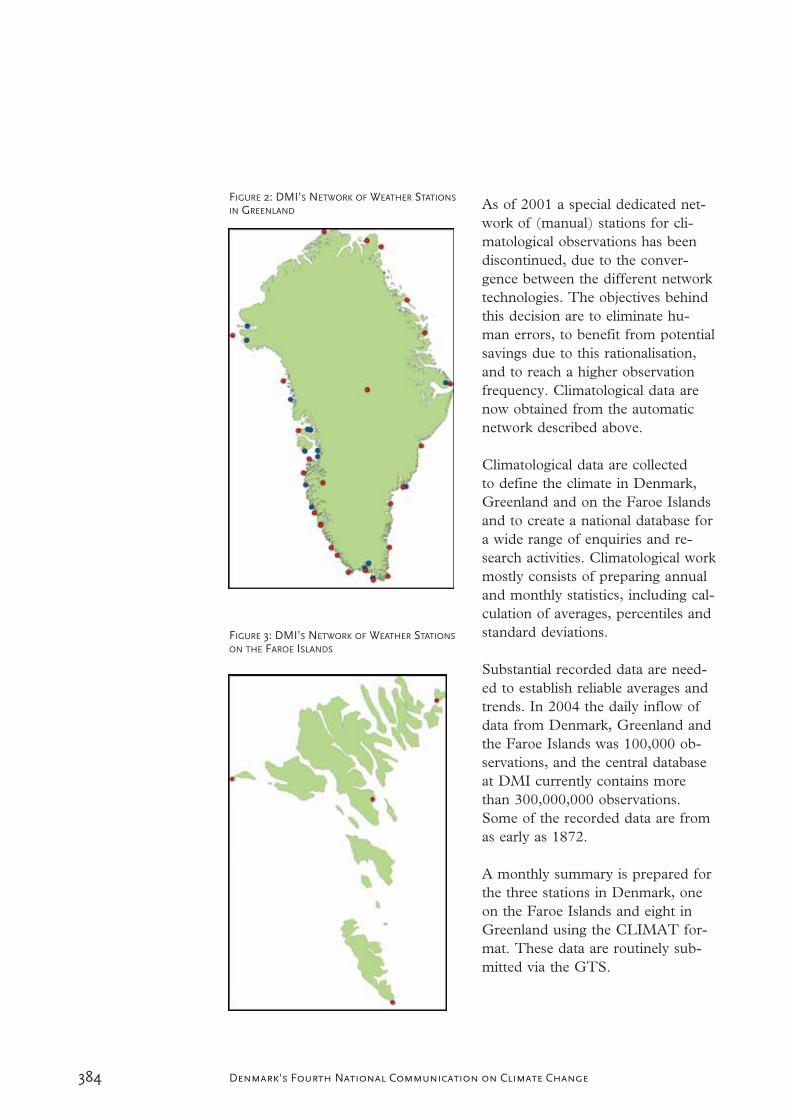
384 Denmark's Fourth National Communication on Climate Change
As of 2001 a special dedicated net-work of (manual) stations for cli-matological observations has been discontinued, due to the conver-gence between the different network technologies. The objectives behind this decision are to eliminate hu-man errors, to benefit from potential savings due to this rationalisation, and to reach a higher observation frequency. Climatological data are now obtained from the automatic network described above.
Climatological data are collected to define the climate in Denmark, Greenland and on the Faroe Islands and to create a national database for a wide range of enquiries and re-search activities. Climatological work mostly consists of preparing annual and monthly statistics, including cal-culation of averages, percentiles and standard deviations.
Substantial recorded data are need-ed to establish reliable averages and trends. In 2004 the daily inflow of data from Denmark, Greenland and the Faroe Islands was 100,000 ob-servations, and the central database at DMI currently contains more than 300,000,000 observations. Some of the recorded data are from as early as 1872.
A monthly summary is prepared for the three stations in Denmark, one on the Faroe Islands and eight in Greenland using the CLIMAT for-mat. These data are routinely sub-mitted via the GTS.
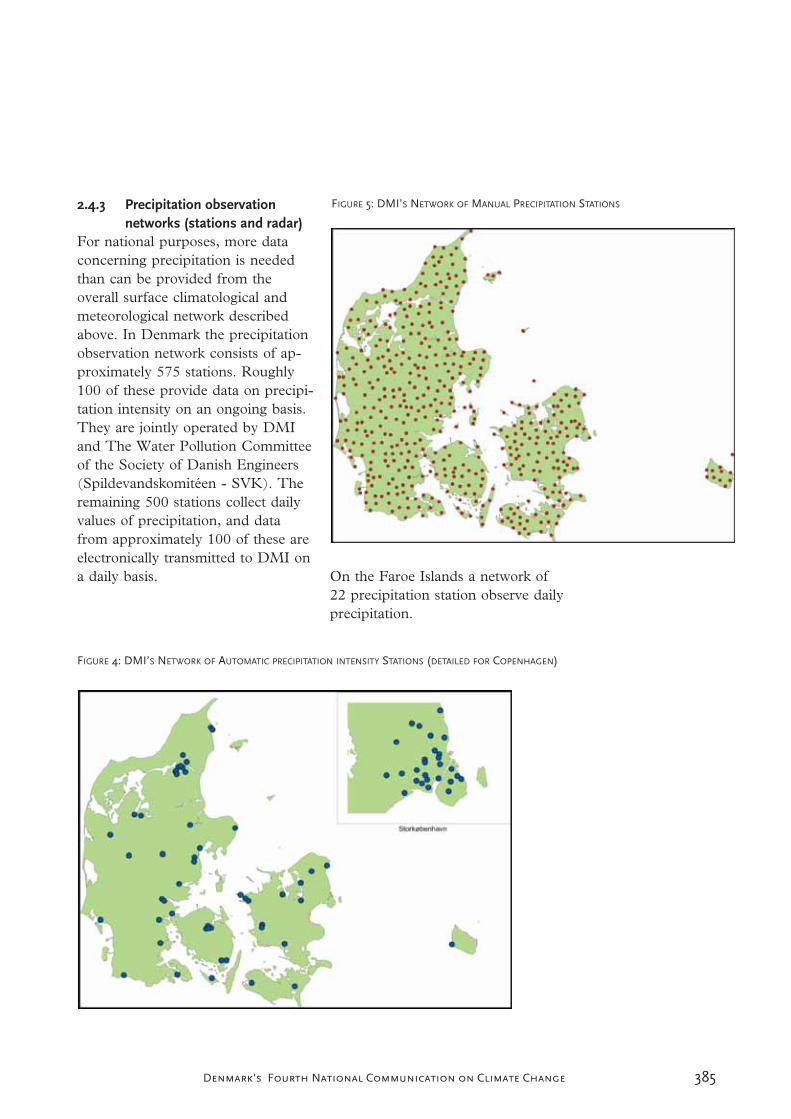
385Denmark's Fourth National Communication on Climate Change
2.4.3 Precipitation observation networks (stations and radar)
For national purposes, more data concerning precipitation is needed than can be provided from the overall surface climatological and meteorological network described above. In Denmark the precipitation observation network consists of ap-proximately 575 stations. Roughly 100 of these provide data on precipi-tation intensity on an ongoing basis. They are jointly operated by DMI and The Water Pollution Committee of the Society of Danish Engineers (Spildevandskomitéen - SVK). The remaining 500 stations collect daily values of precipitation, and data from approximately 100 of these are electronically transmitted to DMI on a daily basis. On the Faroe Islands a network of
22 precipitation station observe daily precipitation.
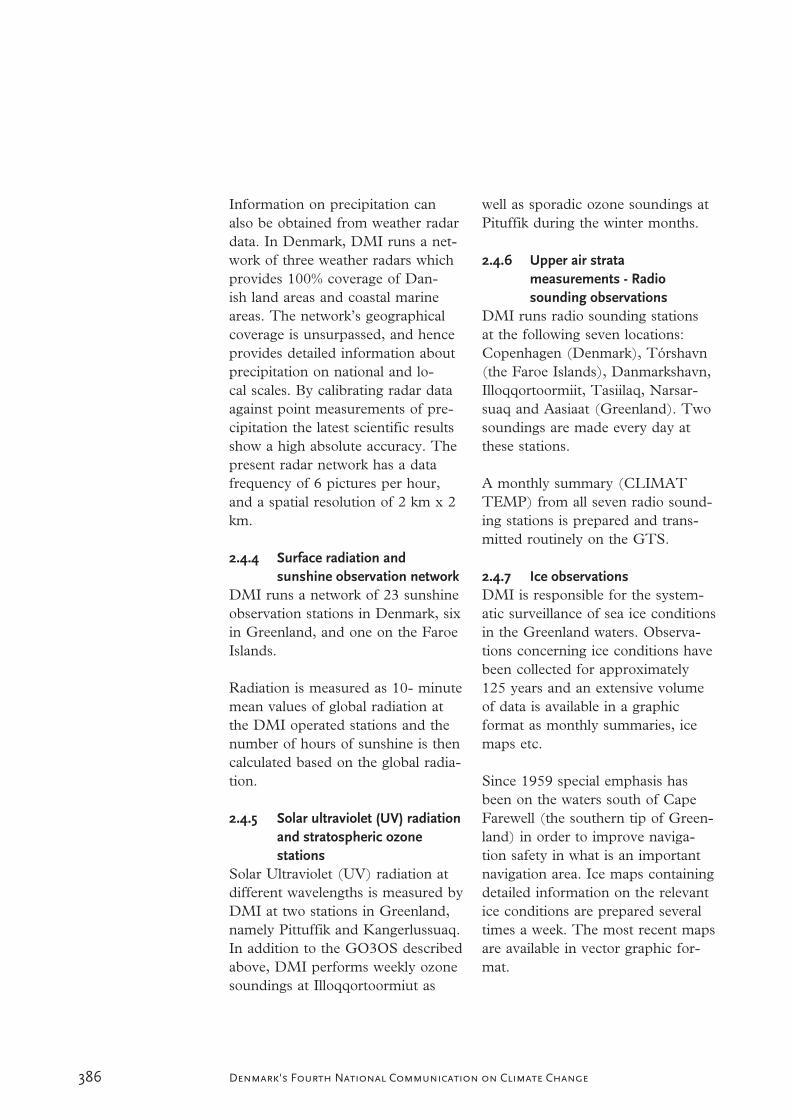
386 Denmark's Fourth National Communication on Climate Change
Information on precipitation can also be obtained from weather radar data. In Denmark, DMI runs a net-work of three weather radars which provides 100% coverage of Dan-ish land areas and coastal marine areas. The network’s geographical coverage is unsurpassed, and hence provides detailed information about precipitation on national and lo-cal scales. By calibrating radar data against point measurements of pre-cipitation the latest scientific results show a high absolute accuracy. The present radar network has a data frequency of 6 pictures per hour, and a spatial resolution of 2 km x 2 km.
2.4.4 Surface radiation and sunshine observation network
DMI runs a network of 23 sunshine observation stations in Denmark, six in Greenland, and one on the Faroe Islands.
Radiation is measured as 10- minute mean values of global radiation at the DMI operated stations and the number of hours of sunshine is then calculated based on the global radia-tion.
2.4.5 Solar ultraviolet (UV) radiation and stratospheric ozone stations
Solar Ultraviolet (UV) radiation at different wavelengths is measured by DMI at two stations in Greenland, namely Pittuffik and Kangerlussuaq.In addition to the GO3OS described above, DMI performs weekly ozone soundings at Illoqqortoormiut as
well as sporadic ozone soundings at Pituffik during the winter months.
2.4.6 Upper air strata measurements - Radiosounding observations
DMI runs radio sounding stations at the following seven locations: Copenhagen (Denmark), Tórshavn (the Faroe Islands), Danmarkshavn, Illoqqortoormiit, Tasiilaq, Narsar-suaq and Aasiaat (Greenland). Two soundings are made every day at these stations.
A monthly summary (CLIMAT TEMP) from all seven radio sound-ing stations is prepared and trans-mitted routinely on the GTS.
2.4.7 Ice observationsDMI is responsible for the system-atic surveillance of sea ice conditions in the Greenland waters. Observa-tions concerning ice conditions have been collected for approximately 125 years and an extensive volume of data is available in a graphic format as monthly summaries, ice maps etc.
Since 1959 special emphasis has been on the waters south of Cape Farewell (the southern tip of Green-land) in order to improve naviga-tion safety in what is an important navigation area. Ice maps containing detailed information on the relevant ice conditions are prepared several times a week. The most recent maps are available in vector graphic for-mat.
387Denmark's Fourth National Communication on Climate Change
Since 2000 weekly summaries of the ice conditions for all Greenland wa-ters have been prepared. These sum-maries, which are based on satellite data, are generated semi-automati-cally and are primarily intended for climatological analyses as the energy radiation from the sea is highly de-pendent on whether it is covered with ice or not.
2.4.8 Climatological data setsOver the years, DMI has established a number of very long climatologi-cal series with differing periods of information representing Denmark, Greenland and the Faroe Islands.
The long daily time series include: precipitation, temperature, atmo-spheric pressure and cloud cover for a number of Danish locations, 1874-2004 as well as precipitation and temperatures for two Greenland Stations 1874-2004 (DMI Technical Report no. 05-04).
The long monthly time series in-clude: temperatures, precipitation, atmospheric pressure, cloud cover and snow for stations in Denmark, Greenland and on the Faroe Islands (DMI Technical Report 05-05).
The long annual time series include: temperature for a number of stations in Denmark, Greenland and on the Faroe Islands (1873-2004), as well as temperatures, precipitation, hours of sunshine and cloud cover given as national averages for Denmark (DMI Technical Report 05-06).
2.4.9 Air quality monitoring
Air pollution is automatically moni-tored in both urban and rural areas across Denmark. This monitoring network is operated by NERI and measures a wide range of pollutants:
Nitrogen monoxide (NO)
Nitrogen dioxides (NO2)
Ozone (O3)
Sulphur dioxide (SO2)
Total Suspended Particulate matter, TSP (PM10)
The chemical composition of particles (sulphate, sea salt, heavy metals etc.)
Nitrogen compounds (ammonia (gas), particulate ammonium, sum of nitric acid and particu-late nitrate)
Benzene, toluene and xylene (BTX)
Carbon monoxide (CO)
Furthermore, at a number of NERI stations deposition of air pollution via precipitation is monitored. Figure 6 shows the types and distribution of air quality monitoring stations across Denmark, and in Table 2 the meas-urements taken at the different sta-tions are listed. Current monitoring data from air monitoring stations, reports from previous quarters as well as development trends for the air quality in Denmark can be found on NERI’s website (www.dmu.dk).

388 Denmark's Fourth National Communication on Climate Change
Prognoses of air pollution in Den-mark for the next three days as well as detailed prognoses for Copenha-gen and Ålborg can also be found here.
In addition to the ozone measure-ments mentioned above, DMI oper-ates an ozone monitoring station at Jægersborg in a suburban environ-ment near Copenhagen as well as a station in Store Jyndevad in a rural area in the south of Jutland. Real-time hourly data are presented on DMI's website (http://www.dmi.dk). Data with a time resolution of 10 minutes are also available from DMI.
3 Oceanographicobservations
3.2 CONTRIBUTING TO GCOS
Oceanographic observations for GCOS are based on the GOOS climate module for the open ocean, which comprises the following pro-grammes: drifting and moored buoy programmes managed by the DBCP (Data Buoy Co-operation Panel), the Ship of Opportunity Programme (SOOP), the Argo array of profiling floats, the Global Sea Level Observ-ing System (GLOSS), the Voluntary Observing Ships Programme (VOS) and the Automated Shipboard Aero-logical Programme (ASAP).
Denmark participates in the VOS, GLOSS and ASAP programmes as summarised in table 3 below.
3.3 VOLUNTARY OBSERVING SHIPS/VOS
VOS is an international scheme developed approximately 150 years ago by which special ocean-go-ing ships are recruited to collect and report meteorological observa-tions. Contributions made by VOS ships to the Global Observing Sys-tem (GOS) of the World Weather Watch (WWW) are extremely important. Moreover, these observa-tions increasingly contribute to glo-bal climate studies through the VOS Climate Project VOSClim. VOS ob-servations are disseminated via GTS and are archived by many national meteorological services.

389Denmark's Fourth National Communication on Climate Change
At the end of 2004, the Danish fleet of voluntary observing ships consist-ed of 47 ships. DMI has the opera-tional and technical responsibility for the observations, which are reported from the ships every third hour.
3.4 TIDE GAUGE/GLOSS
GLOSS is an international pro-gramme coordinated by IOC for the establishment of global and regional advanced sea level networks to be used in climate research, oceano-graphic research as well as research concerning the sea level in coastal
Location NO, NO2 BTX O3 SO2 SO2
Particu-late mass
(TSP,PM10)
Chemicalcomposi-
tion of particles
N com-pounds
COPrecipi-tation
Mean time 30 min 30 min 30 min 24 hours 24 hours 24 hours 24 hours 30 min
Ålborg (street) X X X X X
Ålborg (city back-ground)
X X X X
Århus (street) X X X X
Århus (city back-ground)
X X X X
Lille Valby X X X X
Copenhagen(street)
X X X X X X
Copenhagen (citybackground)
X X X X X
Odense (street) X X X X
Odense (city back-ground)
X X X X
Keldsnor X X X X X X X
Anholt X X X X X
Ulborg X X X X X X
Tange/Sepstrup X X X X
Frederiksborg X X X X
Lindet X X X X
Pedersker X
Hansted X
VOS SOOP Tide gauges(GLOSS)
SFCdrifting bu-
oys(DBCP)
SUB-SFCfloats(Argo)
Mooredbuoys
(DBCP)
ASAP
How many stations is the Party respon-sible for?
47 0 4 0 0 0 2
How many stations provide data to inter-national data centres?
47 0 1 0 0 0 2
How many stations are expected to be inoperation in 2005?
40-50 0 1 0 0 0 2
390 Denmark's Fourth National Communication on Climate Change
areas. The main component of GLOSS is the Global Core Network (GCN) of 287 sea level stations around the world that monitor long-term climate change and oceano-graphic sea level variations. There is a GLOSS station in Tórshavn (Faroe Islands), which is operated by DMI. The relevant mean values from the stations are transmitted to the Permanent Service for Mean Sea Level (PSMSL) hosted by the Proudman Oceanographic Labora-tory in the UK.
The PSMSL, established in 1933, is a global database containing infor-mation on long-term sea level varia-tions based on tide gauges. Informa-tion on monthly and annual mean sea levels is reported to PMSLS from 15 stations in Denmark and one on the Faroe Islands.
3.5 AUTOMATIC SHIPBOARD AEROLOGI-CAL PROGRAMME (ASAP)
The ASAP in its present form began in the mid1980s. The programme’s objective is to record profile data from the upper air strata in ocean areas using automated sounding systems carried on board merchant ships plying regular ocean routes. Several national meteorological serv-ices operate ASAP units and the collected data are made available in real time via GTS. ASAP data are archived alongside other radio sounding data by many national meteorological services. ASAP is an important contribution to both the WWW and GCOS. Today most of
the soundings are from the North Atlantic and north-west Pacific, but the programme is expanding to other ocean basins through a new, co-operative World-wide Recurring ASAP Project (WRAP).
Denmark operates two ASAP units mounted on ships plying fixed routes from Denmark to Greenland.
The European meteorological co-operation EUMETNET started a special E-ASAP programme in December 2000. The programme aims at joint operation of the ASAP programmes under the European meteorological institutes.
3.6 OTHER NATIONAL OCEANOGRAPHIC
AND MARITIME OBSERVATIONS
3.6.2 Sea temperaturesDenmark has a network for the col-lection of sea temperatures at 13 coastal stations around Denmark. The stations are operated by DMI, the Royal Danish Administration for Navigation and Hydrography, the Danish Coastal Authority, and lo-cal authorities respectively. Data are available from each of the responsi-ble bodies. Furthermore, sea surface temperatures are monitored using satellites, and DMI prepares daily maps for the North Sea and Baltic Sea areas.
3.6.3 National tide gauge networkIn Denmark an extensive national network of tide gauges are operated jointly by DMI, the Royal Danish Administration for Navigation and
391Denmark's Fourth National Communication on Climate Change
Hydrography, local authorities and the Danish Coastal Authority. The network consists of 81 automatic sta-tions.
In Greenland a tide gauge station is operated by National Survey and Cadastre (KMS). On the Faroe Is-lands one station is operated in Tór-shavn by DMI. Data are available from the responsible bodies.
3.6.4 Hydrographic and marine surveys
The National Environmental Re-search Institute has the overall re-sponsibility for surveillance of the Danish waters. Surveillance of fjords and coastal waters is carried our by the regional authorities approximate-ly 24-47 times a year, while NERI is responsible for mapping the open waters on five expeditions per year where the objective is to: - determine the current situation in
open Danish waters- trace the impact of land-based
discharges of pollutants- establish reference data for local
monitoring in coastal areas- secure continued time series for
trend monitoring
All of the surveys are part of the Danish nationwide monitoring pro-gramme NOVANA, and many of the surveys are part of the HEL-COM monitoring programme for the Baltic Sea area as well as the OSPARCOM monitoring pro-gramme for Kattegat, Skagerrak and the North Sea. All marine NO-VANA data (regional and state) are collected annually in the national
marine database, MADS, by NERI, and can be downloaded from the in-ternet at: http://mads.dmu.dk .
The Danish Institute for Fisheries Research carries out yearly surveys in Danish waters, primarily in the North Sea and the Baltic Sea. Rel-evant oceanographic parameters are measured and recorded for these areas.
Furthermore, DMI is involved in the following projects:
- Measurements of water transports across the Greenland-Scotland Ridge
During the Nordic WOCE pro-ring the Nordic WOCE pro-gramme (1993-97) observations of the water transport across the Greenland-Scotland Ridge were initiated and the measurements have been continued after the closing of the Nordic WOCE programme. The goal of the ob-servation campaign was to put reliable numbers on the volume transports of the various current components flowing in and out of the Nordic Seas, and especially to investigate possible seasonal and inter-annual variability, which might reflect changes in the glo-bal thermohaline circulation.thermohaline circulation.
- Monitoring of the oceanographic conditions along West Greenland
As a member to the North At-lantic Fisheries Organisation (NAFO), Denmark/Greenland has the responsibility for monitor-ing the physical oceanographic conditions along the west coast of

392 Denmark's Fourth National Communication on Climate Change
Greenland. The formal responsi-bility for performing these meas-urements is placed at the Green-land Nature Institute, Nuuk. Since 1998 the Institute has allo-cated the work by contract to the Danish Meteorological Institute. The temperature and salinity is measured at standard stations along the Greenland west coast so as to obtain knowledge about the marine climate in the area. The marine climate has a great impact on the reproduction and survival of the fish species living in the area – some of which are close to extinction. These data are therefore of great importance when assessing conditions con-cerning the fisheries.
- Monitoring of the oceanographic con-ditions around the Faroe Islands
Four times a year the Fisheries Laboratory in Tórshavn moni-tors the oceanographic conditions around the Faroe Islands in four standard sections so as to study the water mass composition and its variability in the area.
4 Terrestrialobservations
Monitoring snow cover, sea ice and surface radiation is a natural part of DMI’s activities. DMI does not carry out any additional terrestrial observations that can be related to climate change. However, some cli-mate-related research includes moni-toring the effect of climate terrestrial conditions.

393Denmark's Fourth National Communication on Climate Change
5 Space-basedobservations
Denmark contributes to space-based observations through its member-ship of the European Space Agency ESA (a partnership of 15 European Member States, with Canada affili-ated), EUMETSAT (the European Organisation for the Exploitation of Meteorological Satellites, a partner-ship of 18 European Member States and eight cooperating States), and by the use of small national satellites. This report, that focuses on Den-mark’s specific needs and efforts, does not as such include detailed in-formation on platforms and sensors. The Danish strategy for earth ob-servations (EO) is largely delivered through participation in international programmes and to some extent through national programmes such as the Ørsted satellite.
The Danish space activities are not coordinated by one central insti-tution. The Ministry of Science, Technology and Innovation repre-sents Denmark in ESA, whereas the responsibility for the meteorological observation aspects (EUMETSAT) lies with the Ministry of Transport and Energy.
The actual activities are carried out by several organisations, such as DMI, the Technical University of Denmark, the Danish Space Re-search Institute and of course private industry.
5.2 ESA AND EUMETSAT SATELLITES
AND PROGRAMMES
The ESA platforms that are either currently in operation or are due for launch before the end of 2005, and the projects in which Denmark par-ticipates, include:- ERS-2. Launched in 1995. Fol-
low up to ERS-1 by examining the Earth by radar, microwaves and infrared radiation. Carries an additional instrument to ob-serve the ozone hole.
- ENVISAT. Launched in 2002. European environmental satellite to succeed ERS satellites with advanced versions of the instru-ments used in ERS-2 and sev-eral important new instruments.
- MSG-1 (ESA and EUMET-SAT) launched in 2002. MSG-2 launch planned for June 2005. The Meteosat Second Genera-tion geostationary satellites will provide far more precise weath-er information than the current Meteosat, which has operated over the Equator since 1977.
- METOP-1 (ESA and EUMET-SAT) with advanced instru-ments for measuring atmospher-ic conditions etc. is expected to be launched in the course of 2006. While Meteosat and MSG observe the weather conditions in Europe and Africa from a geostationary position above the Equator, METOP will have a significantly lower polar orbit

394 Denmark's Fourth National Communication on Climate Change
and will therefore cover the Ar-tic and Antarctic areas.
DMI represents Denmark in EUMETSAT, which currently has the following programmes:
- MTP (Meteosat Transition Pro-gramme). Operation of Meteo-sat-7, -6 (standby), -5 (Indian Ocean) in geostationary orbit.
- MSG (Meteosat Second Gen-eration). Future operation of MSG-1, -2, and –3 in geosta-tionary orbit.
- EPS (European Polar System). Future operation of METOP-1 (launch planned for 2006), -2 and –3 in polar orbit.
As part of its distributed application ground segment EUMETSAT has a network of Satellite Application Facilities (SAFs) that are special-ised development and processing centres (see http://www.eumetsat.de for details). These centres utilise the specific expertise available at the national meteorological institutes in EUMETSAT’s Member States, and complement EUMETSAT’s own production of standard meteorologi-cal products derived from satellite data. Seven SAF projects are under-going development, focusing on the following applications:
- SAF for support for nowcasting and very short range forecasting
- Ocean and sea ice SAF
- Ozone monitoring SAF
- Numerical Weather Prediction SAF
- Climate monitoring SAF
- GRAS meteorology SAF
- Land surface analysis SAF
A number of these are relevant re-garding of GCOS monitoring. DMI hosts the GRAS meteorology SAF and also contributes to the ocean and sea ice SAF as well as the ozone monitoring SAF.
5.2 GPS DATA FROM THE ØRSTED,SAC-C AND CHAMP SATELLITES
Measurement of the GPS radio oc-cultations is a new and very promis-ing technique for both numerical weather prediction and for monitor-ing and identifying climate change processes. This was first demon-strated by the American GPS/MET mission. The research satellites Ørsted, SAC-C and CHAMP are all equipped with high precision GPS receivers that are required to per-form this kind of profile measure-ments in the atmosphere. GPS data from the Danish Ørsted satellite, launched in 1999, has been used in the EU project CLIMAP (CLImateand environment Monitoring with GPS based Atmospheric Profiling)to study the impact on numerical weather prediction. As these data need no calibration, they may prove very valuable for climate monitoring

395Denmark's Fourth National Communication on Climate Change
purposes, as several data sets and model forecasts can be combined.
The primary objective of the CLI-MAP project was to demonstrate the value of the GPS technique in rela-tion to Numerical Weather Predic-tions (NWP). The project includes data from GPS reception at ground level as well as from Low Earth Orbiting (LEO) satellites. An end-to-end chain for processing satellite-based GPS radio occultation data was developed: From GPS signal re-ception to assimilation into the NWP models. The chain included op-erational reception of tracking data from the Ørsted satellite with associ-ated level-0 processing and archiving (has been developed and is operated by the Danish company TERMA A/S and DMI). This concept will also be used by DMI in connection with the new GPS data received from the German CHAMP and the Argentine SACC satellite.
6 Activities in developing countries relating to observations
From 1997 to 2004 DMI par-ticipated in a project in cooperation with the Meteorological Services Department of Ghana (MSD). The objective of the project was prima-rily to re-establish a meteorological observation network in Ghana and thereby ensure the collection of data. At the same time, the project aimed at improving communication and utilisation of the collected data. At the time of finalisation of the project, MSD had a successful observation network of approximately 300 sta-tions that record the basic meteoro-logical parameters.
The DMI/Danish Climate Centre coordinated the project Applica-tion of seasonal climate forecasts for improved management of crops in western Africa. The objective was to explore the possibilities of adjusting crop management practice for a se-lected agricultural crop (groundnuts) in Ghana, western Africa, using the best available seasonal climate fore-casts. The project was funded by the Danish Council for Development Research (Rådet for Ulandsforskning - RUF).

396 Denmark's Fourth National Communication on Climate Change
7 List of acronyms
ASAP Automated Shipboard Aerological Programme
CHAMP Challenging Mini-satellite Payload
CLIMAT Climate message encoded for the WMO network
CLIMAT-TEMPCLIMAT from upper air soundings
CLIMAP Climate and environment Monitoring with GPS based Atmospheric Sounding
DIAS Danish Institute of Agricultural Science
DMI Danish Meteorological Institute
DBCP Data Buoy Cooperation Panel
EO Earth Observations
ERS European Research Satellite
ESA European Space Agency
EUMETSAT European Organization for the Exploitation of Meteorological Satellites
GAW Global Atmospheric Watch of WMO
GCN Global Core Network (of GLOSS)
GCOS Global Climate Observing System
GLOSS Global Sea Level Observing System
GNSS Global Navigation Satellite System
GO3OS Global Ozone Observing System
GPS Global Positioning System
GPS/MET GPS Meteorology
GRAS GNNS Receiver for Atmospheric sounding
GSN GCOS Surface Network
GTS Global Telecommunications System
GOOS Global Ocean Observing System
GUAN GCOS Upper Air Network
HELCOM Helsinki Commission - Baltic Marine Environment Protection Commission
IOC Intergovernmental Oceanographic Commission (of UNESCO)
LEO Low Earth Orbiting
MSD Meteorological Services Department (Ghana)
NDSC Network for the Detection of Stratospheric Change
NERI National Environmental Research Institute
NOVA2003 Danish Aquatic Environment monitoring and Assessment Programme
OSPARCOM Oslo and Paris Commissions on the North East Atlantic Sea
SAC-C Satélite de Aplicaciones Científicas-C
SAF Satelite application facility
SFC Surface (Drifters)
SOOP Ship of Opportunity Programme
SVK The Water Pollution Committee of the Society of Danish Engineers
UV Ultraviolet
VOS Voluntary Observing Ships
WMO World Meteorological Organization
WRAP World-wide Recurring ASAP Project
WWW World Weather Watch (of WMO)

397Denmark's Fourth National Communication on Climate Change
Climate policy in Denmark in general
Ministry of Finance, Ministry of the Environ-
ment, Ministry of Taxation, Ministry of Foreign
Affairs, and Ministry of Economic and Business
Affairs, 2003: A cost-effective climate strat-
egy. Ministry of Finance (in Danish).
The Danish Government, February 2003: Pro-
posal for a climate strategy in Denmark (in
Danish).
The Danish Environmental Protection Agency,
2003: Denmark’s Third National Com-
munication on Climate Change - under the
United Nations Framework Convention on
Climate Change.
In general and cross-sectional on efforts:
The Ministry of the Environment, 2004: The
Danish National Allocation Plan, March
2004.
The Danish Environmental Protection Agency,
2005a: Denmark’s CO2 Emissions – Efforts
in the Period 1990-2001 and the costs in-
volved – Main Report, Statement from the
Danish EPA no. 2, 2005 (in Danish).
The Danish Environmental Protection Agency,
2005b: Denmark’s CO2 Emissions – Efforts
in the Period 1990-2001 and the costs in-
volved – Annex Report, Statement from the
Danish EPA no. 3, 2005 (in Danish).
Taxes
Augustsen, Drejer, Hansen & Lund-Andersen,
2005: The Institute of State Authorized Pub-
lic Accountants in Denmark (FSR) Tax laws
including notes 2005, Forlaget Thompson
(in Danish).
The Danish Central Customs and Tax Admin-
istration, 2004: Guidelines on Excise Duties
2004 (in Danish).
Energy
The Danish Energy Authority (2003): A cost-
effective fulfilment of Denmark’s reduction
commitments. Documentation of projections
and analyses in the energy area. The Danish
Energy Authority (in Danish).
The Danish Energy Authority (2005a): Energy
political measures in the 1990s: Costs and
CO2 effects, January 2005. Technical back-
ground report concerning calculations in the
energy areas in the Danish EPA report (in
Danish).
The Danish Energy Authority (2005b): Back-
ground report for Energy Strategy 2025
(Energy Projections etc.), June 2005 (in
Danish).
Transport
The Danish Road Directorate, 2002: The
transport sector’s energy consumption and
emissions (in Danish)
Industry
Statutory Order no. 552 of 2 July 2002 regu-
lating certain industrial greenhouse gases.
Circular no.132 of 13 June 1996 on
municipal regulations concerning the
disposal of refrigeration equipment
containing CFCs (in Danish).
The Danish Refrigerating Installers’ Environ-
mental Scheme (KMO) (2004): About KMO.
(in Danish).
Annex I Literature
398 Denmark's Fourth National Communication on Climate Change
Consolidated Act no. 208 of 22 March 2001
on surcharges of certain ozone-depleting
substances and greenhouse gases (in Dan-
ish).
Pedersen, P.H. (1999): Replacing potent
greenhouse gases (HFCs, PFCs and SF6).
Danish EPA (in Danish).
Miljøstyrelsen (2003): Hvad koster det at re-
ducere CO2 -mankoen? Reduktionspotentiale
og omkostninger i udvalgte sektorer. Miljøs-
tyrelsen.
The Danish Central Customs and Tax Adminis-
tration ( 2004): Guidelines on Excise Duties
2004-1, Duties on CFCs, HFCs, PFCs and
SF6 (in Danish).
The Danish EPA (2005): Consumption and
emission of ozone-depleting substances and
certain greenhouse gases 2003 (in Danish).
Agriculture and forestry
Aftale om Vandmiljøplan III 2005-2015, 2004:
Aftale mellem regeringen, dansk Folkeparti
og Kristendemokraterne.
Andersson, N.E. (2004a): Nedsættelse af
CO2 emission fra væksthuse gennem forbed-
ret isolering, DJF.
Andersson, N.E. (2005a): Nedsættelse af
CO2 emission fra væksthuse gennem ændret
klimastyring, DJF. In: Olesen, J.E. (ed.):
Drivhusgasser fra jordbruget – reduktions-
muligheder. Danmarks JordbrugsForskning.
Andersson, N.E. (2004c): Nedsættelse af
CO2 emission og energiforbrug fra væk-
sthuse gennem isolering og forbedret luft-
fugtighedsstyring, DJF.
Anthon, S. & SNS (2003): Skovens rolle i
implementeringen af Kyoto-aftalen i Dan-
mark. Ikke-energipolitiske tiltag.
Grant, R., Blicher-Mathiesen, G., Jørgensen,
V., Kyllingsbæk, A., Poulsen, H.D., Børsting,
C., Jørgensen, J.O., Schou, J.S., Kristensen,
E.S., Waagepetersen, J. & Mikkelsen, H.E.
(2000). Vandmiljøplan II - midtvejsevaluer-
ing. Miljø- og Energiministeriet, Danmarks
Miljøundersøgelser, Silkeborg, Denmark. 65
pp.
Gyldenkærne, S: (2004): Estmater for de
emissionsmæssige konsekvenser ved af-
brænding af fjerkrægødning, notat til Dansk
Slagtefjerkræ. DMU.
Gyldenkærne, S. & M.H. Mikkelsen (2004):
Projection of Greenhouse Gas Emission
from the Agricultural Sector. DMU.
Gyldenkærne, S., B. Münier, J.E. Olesen, S.E.
Olesen, B.M. Petersen & B.T. Christensen
(2004): Opgørelse af CO2-emissioner fra
arealanvendelse og ændringer i arealanven-
delse. DMU og DJF.
Gyldenkærne, S., Münier, B., Olesen, J.E.,
Olesen, S.E., Petersen, B.M. & Christensen,
B.T. (2005). Opgørelse af CO2-emissioner
fra arealanvendelse og ændringer i
arealanvendelse. Arbejdsrapport fra DMU
(under udarbejdelse).
Jacobsen, B.H., J. Abildtrup, M. Andersen,
T. Christensen, B. Hasler, Z.B. Hussain, H.
Huusom, J.D. Jensen, J.S. Schou & J.E.
Ørum (2004): Omkostninger ved reduktion
af landbrugets næringsstoftab til vandmiljøet
– Forarbejde til Vandmiljøplan III.
Fødevareøkonomisk Institut.
Mikkelsen, M.H., Gyldenkærne, S., Poulsen,

399Denmark's Fourth National Communication on Climate Change
H.D., Olesen, J.E. & Sommer, S.G. (2005).
Opgørelse og beregningsmetode for
landbrugets emissioner af ammoniak og
drivhusgasser 1985-2002. Arbejdsrapport fra
DMU Nr. 204.
Olesen, J.E., Andersen, J.M., Jacobsen, B.H.,
Hvelplund, T., Jørgensen, U., Schou, J.S.,
Graversen, J., Dalgaard, T. & Fenhann, J.
(2001). Kvantificering af tre tiltag til reduk-
tion af landbrugets udledning af drivhusgas-
ser. DJF-rapport Markbrug 48.
Olesen et al. (2001a): Emission af drivhusgas-
ser fra dansk landbrug. Danmarks Jordbrugs-
Forskning.
Olesen et al. (2001b): Kvantificering af tre
tiltag til reduktion af landbrugets emission af
drivhusgasser. Danmarks JordbrugsForskn-
ing.
Olesen, J.E., Petersen, S.O., Gyldenkærne, S.,
Mikkelsen, M.H., Jacobsen, B.H., Vesterdal,
L., Jørgensen, A.M.K., Christensen, B.T.,
Abildtrup, J., Heidmann, T. & Rubæk, G.
(2004). Jordbrug og klimaændringer - sam-
spil til vandmiljøplaner. DJF rapport Mark-
brug nr. 109.
Olesen, J.E., E.M. Hansen & L. Elsgaard
(2004b): CO2 og N2O emission fra pløjefri
dyrkningssystemer. Danmarks JordbrugsFor-
skning.
Olesen, E., S.O. Petersen, S. Gyldenkærne,
M.H. Mikkelsen, B.H. Jacobsen, L. Vesterdal,
A.K. Jørgensen, B.T. Christensen, J. Abildtrup,
T. Heidmann & G. Rubæk (2004a): Forbere-
delse af Vandmiljøplan III Rapport fra Klim-
agruppen (F11) Jordbrug og klimaændringer
– samspil til vandmiljøplaner. Danmarks Jor-
dbrugsForskning.
Olesen et al. (2004b): Drivhusgasser fra jor-
dbruget – reduktionsmuligheder. Danmarks
JordbrugsForskning.
Olesen, J.E. (2004): Vurdering af effek-
ten VMP III på landbrugets udledning af
drivhusgasser. Danmarks JordbrugsForskn-
ing.
Olesen (2004c): Muligheder for reduktion af
drivhusgasemissioner i jordbruget In: Olesen,
J.E. (ed.) Drivhusgasser fra jordbruget
– reduktionsmuligheder. Danmark Jordbrugs-
Forskning.
Olesen, J.E. (2005). Muligheder for reduk-
tion af drivhusgasemissioner i jordbruget. I:
Olesen, J.E. (red). Drivhusgasser fra jord-
bruget - reduktionsmuligheder. DJF rapport
Markbrug nr. 113, s. 12-32.
Skov- og Naturstyrelsen (2004): Vejledning
om tilskud til privat skovrejsning.
Skov- og Naturstyrelsen (2002): Vejledning
om medfinanciering af offentlig skovtil-
plantning.
Sommer, S.G., Petersen, S.O. & Møller, H.B.
(2004): Algorithms for calculating methane
and nitrous oxide emissions from manure
management. Nutrient Cycling in Agroeco-
systems 69, 143-154.
Weisberg, M.R., T. Hvelplund, P. Lund & J.E.
Olesen (2003): Metan fra husdyr: Muligheder
for reduktion ved ændret fodring. Notat til
undergruppen vedr. samspil mellem landbrug
og klimaændringer (F-11). Danmarks Jord-
brugsForskning.

400 Denmark's Fourth National Communication on Climate Change
Waste
Bekendtgørelse: nr. 581 af 24. juni 1996 om
bortskaffelse, planlægning og registrering af
affald.
Bekendtgørelse: nr. 619 af 27. juni 2000 om
affald.
Energistyrelsen (2001): Omkostninger ved
CO2-reduktion for udvalgte tiltag – Bilag-
srapport. Energistyrelsen.
Miljøministeriet (2003): Affaldsstrategi 2005-
08, Miljøministeriet.
Miljøstyrelsen (1997): Affaldsafgiften 1987-
1996, Arbejdsrapport fra Miljøstyrelsen nr.
96. Miljøstyrelsen, Miljø- og Energiminis-
teriet.
Miljøstyrelsen (2003b): Hvad koster det at re-
ducere CO2-mankoen - Reduktionspotentiale
og omkostninger i udvalgte sektorer. Miljøs-
tyrelsen.
Miljøstyrelsen (2004b): CO2-reduktion gen-
nem nedbringelse af mængden af plast, der
forbrændes på affaldsforbrændingsanlæg.
Notat fra referencegruppen for affaldsområ-
det i forbindelse med opfølgning på klimas-
trategien.
Emission inventories
Houghton et al., 1997.
Illerup et al., 2000, 2001, 2002, 2003, 2004 og
2005: Denmark’s National Inventory Report
– submitted under the UNFCCC.
Emission projections
Danmarks Miljøundersøgelser, 1995: Environ-
mental satellite models for ADAM, NERI
Technical Report no. 148.
Danmarks Miljøundersøgelser, Maj 2005:
Fremskrivning af drivhusgasemissioner 2004
til 2030, Arbejdsnotat til Miljøstyrelsen.
Danmarks Miljøundersøgelser, 2006: Projec-
tions of Denmark’s Greenhouse Gas Emis-
sions 2004 - 2030 (in prep.).
Vulnerability, effects and adaption
Fenger, J. og Frich,P. (DMU) 2002: Dansk
tilpasning til et ændret klima.
Heide-Jørgensen, H.S. & Johnsen, I., 1998:
Ecosystem Vulnerability to Climate Change
in Greenland and the Faroe Islands.
– Miljønyt no. 33, Ministry of Environment
and Energy, Denmark (266 pp.).
Meltofte, H. (ed.), 2002: Sne, is og 35 grad-
ers kulde. Hvad er effekterne af klimaæn-
dringer i Nordøstgrønland? – TEMA-rap-
port fra DMU 41/2002 (88 pp.).
Climate research and observations
Andersen, U.J., Kaas, E. and W .May, 2001:
Changes in the storm climate in the North
Atlantic / European region as simulated by
GCM time-slice experiments at high resolu-
tion. Danmarks Klimacenter Rapport 01-1,
DMI, 15 pp.
Cappelen, J., 2005: The Climate of Denmark
with the Faroe Islands and Greenland 2004.
DMI Technical Report No. 05-01.

401Denmark's Fourth National Communication on Climate Change
Cappelen, J., 2005: DMI daily data collection
1873-2004, Denmark and Greenland. DMI
Technical Report 05-04.
Cappelen, J., 2005: DMI Monthly Climate
Data Collection 1860-2004, Denmark,
Faroe Island and Greenland. An update
of: NACD, REWARD, NORDKLIM and
NARP datasets. DMI Technical Report 05-
05.
Cappelen, J., 2005: DMI annual climate data
collection 1873-2004, Denmark, The Faroe
Islands and Greenland - with Graphics and
Danish Abstracts. DMI Technical Report
05-06.
Cappelen, J., 2004: The Climate of Denmark
- Key Climatic Figures, 2000-2003. DMI
Technical Report No. 04-05.
Cappelen, J., 2000: The Climate of Den-
mark - Key Climatic Figures, 1990-99. DMI
Technical Report No. 00-08.
Cappelen, J. og Laursen, E.V., 2000: Daily
Temperature Normals - Denmark, The
Faroe Islands and Greenland. DMI Teknisk
Rapport 00-17.
Cappelen, J., Jørgensen,B.V., Laursen,E.V.,
Stannius L.S. og Thomsen, R.S., 2000: The
Observed Climate of Greenland, 1958-99
with Climatological Standard Normals,
1961-90. DMI Teknisk Rapport 00-18.
Cappelen, J. and Jørgensen, B. V., 1999:
Observed Wind Speed and Direction in
Denmark - with Climatological Standard
Normals, 1961-90. DMI Technical Report
99-13.
Cappelen, J. and Laursen, E.V., 1998: The
Climate of The Faroe Islands - With Cli-
matological Standard Normals, 1961-1990.
DMI Technical Report 98-14.
Christensen, J.H. (Ed.), 2005: Prediction of
Regional scenarios and Uncertainties for
Defining European Climate change risks and
Effects (PRUDENCE). Final Report, sub-
mitted to EU commission.
Christensen, J.H., T.R. Carter, and F. Giorgi,
2002: PRUDENCE Employs New Methods
to Assess European Climate Change, EOS,
AGU, 83, 147.
Christensen, J.H. og Christensen, O.B., 2001:
Regional Climate Scenarios – A study on
precipitation. I: Jørgensen, A.M., Fenger, J.
og Halsnæs, K. (red.) Climate Change Re-
search – Danish Contributions. DMI/Dan-
marks Klimacenter, København, 408 pp.
Christensen, J.H. and O.B. Christensen, 2003:
Severe Summer Flooding in Europe, Nature,
421, 805-806.
Christensen, O.B. and J.H. Christensen, 2004:
Intensification of extreme European summer
precipitation in a warmer climate. Global
and Planetary Change, 44, 107-11.7
Christensen, O. B., J. H. Christensen, and M.
Botzet, 2002: Heavy Precipitation Occur-
rence in Scandinavia Investigated with a Re-
gional Climate Model, in Implications of cli-
matic change for the hydrological cycle and
for water management (ed. M. Beniston),
Advances in Global Change Research, Klu-
wer Academic Publishers, Dordrecht (The
Netherlands) and Boston (USA), 2002.
Duun-Christensen, J.T., 1992: Vandstand-
sændringer i Danmark. I Fenger, J. and
Torp, U. (Eds.), Drivhuseffekt og Klimaæn-

402 Denmark's Fourth National Communication on Climate Change
dringer - hvad kan det betyde for Danmark.
Miljøministeriet, København. 288 pp.
ECON Center for økonomisk analyse, 2002:
Kortlægning af dansk forskning på klimaom-
rådet og forslag til styrkelse af indsatsom-
råder, udarbejdet for Arbejdsgruppen for et
Dansk Klimaforskningsprogram.
Frich, P. et al., 1997: Observed Precipitation
in Denmark, 1961-90. DMI Technical Re-
port 97-8.
Jørgensen, A.M., Fenger, J., Halsnæs, K.
(Eds.), 2001: Climate Change Research
- Danish Contributions. DMI/Danmarks Kli-
macenter, København, 408 pp.
Kaas, E., U. Andersen, R. A. Flather, J. A.
Williams, D. L. Blackman , P. Lionello, F.
Dalan, E. Elvini, A. Nizzero, P. Malguzzi ,
A. Pfizenmayer, H. von Storch, D. Dillingh,
M. Philippart, J. de Ronde, M. Reistad, K.
H. Midtbø, O. Vignes, H. Haakenstad, B.
Hackett and I. Fossum, 2001: Synthesis of the
STOWASUS-2100 project. Danmarks Kli-
macenter Rapport 01-2, DMI, 23 pp.
Kaas, E. et al, 2001: Synthesis of the
STOWASUS-2100 project: Regional storm,
wave and surge scenarios for the 2100 cen-
tury. Danmarks Klimacenter rapport 01-3.
DMI.
Kiilsholm, S., J.H. Christensen, K. Dethloff,
and A. Rinke, 2003: Net accumulation of
the Greenland Ice Sheet: Modelling Arctic
regional climate change. Geoph. Re. Lett.,
30,doi10.1029/2002GL015742.
Laursen, E.V and Rosenørn, S., 2002: New
hours of bright sunshine normals for Den-
mark, 1961-1990. DMI Technical Report
02-25.
Laursen E.V., Rikke Sjølin Thomsen and John
Cappelen, 1999 : Observed Air Tempera-
ture, Humidity, Pressure, Cloud Cover and
Weather in Denmark - with Climatological
Standard Normals, 1961-90. DMI Technical
Report 99-05.
May W., 1999: A time-slice experiment with
the ECHAM4 A-GCM at high resolution:
The experimental design and the assessment
of climate change as compared to a green-
house gas experiment with ECHAM4/OPYC
at low resolution. DMI Scientific report No.
99-2.
May, W. and Roeckner, E., A time-slice ex-
periment with the ECHAM4 AGCM at high
resolution, 2001: the impact of horizontal
resolution on annual mean climate change,
Climate Dynamics, 17, 407-420.
May, W., 2001: Impact of horizontal reso-
lution on the simulation of seasonal climate
in the Atlantic/European area for present
and future times, Climate Research, Vol. 16:
pp. 203-223, March 21, 2001.
Petersen, H. et.al, ,2001: The Arctic. Pp.
303-330 in Climate Change Research, Dan-
ish Contributions.,– Danish Meteorological
Institute.
Pickart, R.S., Spall, M.A., Ribergaard, M.H.,
Moore, G.W.K. and Milliff, R.F., 2003: Deep
convection in the Irminger Sea forced by
the Greenland tip jet. Nature, 424, 152-156,
doi:10.1038/nature01729.
Projects at DMI supported by the European
Commission – DMI Technical Report 98-3, 85
pp.
403Denmark's Fourth National Communication on Climate Change
Research and Development Projects – Progress
1998 - DMI Technical Report 99-19, 1999,
122 pp.
Richarson, 1999: Rysgaard, S., Vang, T.,
Stjernholm, M., Rasmussen, B., Windelin, A.
& Kiilsholm, S. 2003: Physical conditions,
carbon transport and climate change impacts
in a NE Greenland fjord. Arctic, Antarctic
and Alpine Research 35.
Schöne, D. and Schulte, A., 1999: Forstwirt-
schaft nach Kyoto: Ansätze zur Quanti-
fizierung und betrieblichen Nutzung von
Kohlenstoffsenken. Forstarchiv 70: 167-176.
Stainforth, D.A., T. Aina, C. Christensen, M.
Collins, N. Faull, D. J. Frame, J. A. Kettlebor-
ough, S. Knight, A. Martin, J. M. Murphy, C.
Piani, D. Sexton, L. A. Smith, R. A. Spicer,
A. J. Thorpe and M. R. Allen: “Uncertainty
in predictions of the climate response to ris-
ing levels of greenhouse gases, Nature, 433,
403-406.
Stendel, M. Schmith, T., Roeckner, E. and Cu-
basch, U., 2000: The climate of the 21st cen-
tury: Transient simulations with a coupled
atmosphere-ocean general circulation model.
Danmarks Klimacenter Rapport 00-6, DMI,
15 pp.
Stendel, M., Schmith, T. og Christensen, J.H.,
2001: Simulations of Future Climate with a
Coupled Atmosphere-Ocean General Cir-
culation Model. I: Jørgensen, A.M., Fenger,
J., Halsnæs, K. (Eds.); Climate Change
Research - Danish Contributions. DMI/Dan-
marks Klimacenter, København, 408 pp.

404 Denmark's Fourth National Communication on Climate Change
Publisher:Ministry of the Environment,Danish Environmental Protection Agency,Strandgade 29, DK-1401 Copenhagen KTelephone + 45 32660100Telefax + 45 32660479Internet http://www.mst.dk
Year of publication: 2005
Title:Denmark’s Fourth National Communication onClimate Change
Subtitle:Under the United Nations Framework Conven-tion on Climate Change
Author(s):Rasmussen, Erik (red);Jørgensen, Jesper (red)
Performing organization(s):
Danish Environmental Protection Agency; Da-nish Forest and Nature Agency; National Env-ironmental Research Institute; Geological Sur-vey of Denmark and Greenland; Danish EnergyAuthority; Ministry of Foreign Affairs; Ministryof Finance; Ministry of Taxation, Ministry ofTransport and Energy; Danish MeteorologicalInstitute; Danish Coastal Authority; Ministryof Food, Agriculture and Fisheries; DanishInstitute of Agricultural Sciences; Forest andLandscape Denmark; Greenland Home Rule,including the Department for Environment andNature; Faroe Home Rule, including the Mi-nistry of the Interior; Statistics Denmark; RisøNational Laboratory; University of Copenhagen;University of Aarhus; Technical University ofDenmark; Institute of Local Government Studi-es – Denmark; Royal Veterinary and AgriculturalUniversity
Abstract:”Denmark’s Fourth National Communicationon Climate Change” is the fourth nationalreport on Denmark’s implementation of its ob-ligations under the United Nations FrameworkConvention on Climate Change.
Supplementary notes:Denmark’s First National Communicationsubmitted under the UNFCCC was publishedin 1994 under the title ”Climate Protection inDenmark” (Miljøstyrelsen).”Denmark’s Second National Communicationon Climate Change” (Miljøstyrelsen) is from1997 and ”Denmark’s Third National Commu-nication on Climate Change” (Miljøstyrelsen)was published in 2003.
Edition closed (month/year): november 2005
Number of pages: 404 Format: A4
Number of copies: 1500
ISBN: 87-7614-891-2 Graphic Design:
Printed by: Schultz
Price (incl. 25 % VAT): Free of charge
Distributed by: The Ministry of the EnvironmentFrontlinienRentemestervej 8, 2400 København NVPhone: +45 70 12 02 [email protected]@frontlinien.dk
Reproduction is authorized provided the sourceis acknowledgedPrinted on 100% recycled paper Cyclus
Data Sheet

”Denmark’s Fourth National Communication on Climate Change” is the
fourth national report on Denmark’s implementation of its obligations
under the United Nations Framework Convention on Climate Change.
ISBN 87-7614-891-2Price: Free of charge.
The Ministry of the EnvironmentFrontlinienRentemestervej 8 2400 København NVPhone: +45 70 12 02 [email protected] • Internet www.frontlinien.dk