A model for improving microbial biofuel production using a synthetic feedback loop
10
RESEARCH ARTICLE A model for improving microbial biofuel production using a synthetic feedback loop Mary J. Dunlop • Jay D. Keasling • Aindrila Mukhopadhyay Received: 7 November 2009 / Revised: 22 January 2010 / Accepted: 2 February 2010 / Published online: 25 February 2010 Ó The Author(s) 2010. This article is published with open access at Springerlink.com Abstract Cells use feedback to implement a diverse range of regulatory functions. Building synthetic feedback control systems may yield insight into the roles that feed- back can play in regulation since it can be introduced independently of native regulation, and alternative control architectures can be compared. We propose a model for microbial biofuel production where a synthetic control system is used to increase cell viability and biofuel yields. Although microbes can be engineered to produce biofuels, the fuels are often toxic to cell growth, creating a negative feedback loop that limits biofuel production. These toxic effects may be mitigated by expressing efflux pumps that export biofuel from the cell. We developed a model for cell growth and biofuel production and used it to compare several genetic control strategies for their ability to improve biofuel yields. We show that controlling efflux pump expression directly with a biofuel-responsive pro- moter is a straightforward way of improving biofuel pro- duction. In addition, a feed forward loop controller is shown to be versatile at dealing with uncertainty in biofuel production rates. Keywords Feedback control Biofuels Biological control systems Transcriptional regulation Efflux pump Feed forward loop Introduction Organisms use feedback to respond to changing conditions, optimize the use of resources, and maintain homeostasis. The versatility of feedback control in gene regulation is evidenced by the frequency with which positive and neg- ative feedback loops appear in regulatory networks (Alon 2007). Examples of synthetic feedback control systems have been successfully implemented. Applications include a population control circuit (You et al. 2004) and a con- trollable yeast mating pathway (Bashor et al. 2008). Several studies focus on the modular nature of feedback control (Win and Smolke 2008; Topp and Gallivan 2007; Goldberg et al. 2009). In particular, work on controller design has used toggle switches (Kobayashi et al. 2004; Anesiadis et al. 2008) and synthetic promoters (Farmer and Liao 2000) to control gene expression in response to a sensed signal. A systematic study of the properties of alternative control strategies may lend insight into how different feedback architectures can be used to regulate gene expression. Microbial biofuel production is one area where synthetic feedback regulation has the potential for great impact. Biofuels are a promising form of alternative energy that may replace existing fuel sources such as gasoline, jet fuel, or diesel without requiring engine modifications or addi- tional infrastructure development (Savage et al. 2008; Fortman et al. 2008). Typical biofuel production processes start with cellulose from plant matter. Using enzymes and chemical pretreatment processes, the cellulose is broken down into sugars like glucose or pentose. These sugars are then fed to microorganisms (such as Saccharomyces cerevisiae or Escherichia coli) that convert the sugar into biofuel (Fig. 1a). M. J. Dunlop J. D. Keasling A. Mukhopadhyay (&) Joint BioEnergy Institute, Lawrence Berkeley National Laboratory, 1 Cyclotron Rd., Mail Stop 978-4121, Berkeley, CA 94720, USA e-mail: [email protected] J. D. Keasling Department of Chemical Engineering, University of California, Berkeley, CA 94720, USA 123 Syst Synth Biol (2010) 4:95–104 DOI 10.1007/s11693-010-9052-5
-
Upload
independent -
Category
Documents
-
view
0 -
download
0
Transcript of A model for improving microbial biofuel production using a synthetic feedback loop

RESEARCH ARTICLE
A model for improving microbial biofuel production usinga synthetic feedback loop
Mary J. Dunlop • Jay D. Keasling •
Aindrila Mukhopadhyay
Received: 7 November 2009 / Revised: 22 January 2010 / Accepted: 2 February 2010 / Published online: 25 February 2010
� The Author(s) 2010. This article is published with open access at Springerlink.com
Abstract Cells use feedback to implement a diverse
range of regulatory functions. Building synthetic feedback
control systems may yield insight into the roles that feed-
back can play in regulation since it can be introduced
independently of native regulation, and alternative control
architectures can be compared. We propose a model for
microbial biofuel production where a synthetic control
system is used to increase cell viability and biofuel yields.
Although microbes can be engineered to produce biofuels,
the fuels are often toxic to cell growth, creating a negative
feedback loop that limits biofuel production. These toxic
effects may be mitigated by expressing efflux pumps that
export biofuel from the cell. We developed a model for cell
growth and biofuel production and used it to compare
several genetic control strategies for their ability to
improve biofuel yields. We show that controlling efflux
pump expression directly with a biofuel-responsive pro-
moter is a straightforward way of improving biofuel pro-
duction. In addition, a feed forward loop controller is
shown to be versatile at dealing with uncertainty in biofuel
production rates.
Keywords Feedback control � Biofuels �Biological control systems � Transcriptional regulation �Efflux pump � Feed forward loop
Introduction
Organisms use feedback to respond to changing conditions,
optimize the use of resources, and maintain homeostasis.
The versatility of feedback control in gene regulation is
evidenced by the frequency with which positive and neg-
ative feedback loops appear in regulatory networks (Alon
2007).
Examples of synthetic feedback control systems have
been successfully implemented. Applications include a
population control circuit (You et al. 2004) and a con-
trollable yeast mating pathway (Bashor et al. 2008).
Several studies focus on the modular nature of feedback
control (Win and Smolke 2008; Topp and Gallivan 2007;
Goldberg et al. 2009). In particular, work on controller
design has used toggle switches (Kobayashi et al. 2004;
Anesiadis et al. 2008) and synthetic promoters (Farmer and
Liao 2000) to control gene expression in response to a
sensed signal. A systematic study of the properties of
alternative control strategies may lend insight into how
different feedback architectures can be used to regulate
gene expression.
Microbial biofuel production is one area where synthetic
feedback regulation has the potential for great impact.
Biofuels are a promising form of alternative energy that
may replace existing fuel sources such as gasoline, jet fuel,
or diesel without requiring engine modifications or addi-
tional infrastructure development (Savage et al. 2008;
Fortman et al. 2008). Typical biofuel production processes
start with cellulose from plant matter. Using enzymes and
chemical pretreatment processes, the cellulose is broken
down into sugars like glucose or pentose. These sugars are
then fed to microorganisms (such as Saccharomyces
cerevisiae or Escherichia coli) that convert the sugar into
biofuel (Fig. 1a).
M. J. Dunlop � J. D. Keasling � A. Mukhopadhyay (&)
Joint BioEnergy Institute, Lawrence Berkeley National
Laboratory, 1 Cyclotron Rd., Mail Stop 978-4121,
Berkeley, CA 94720, USA
e-mail: [email protected]
J. D. Keasling
Department of Chemical Engineering, University of California,
Berkeley, CA 94720, USA
123
Syst Synth Biol (2010) 4:95–104
DOI 10.1007/s11693-010-9052-5
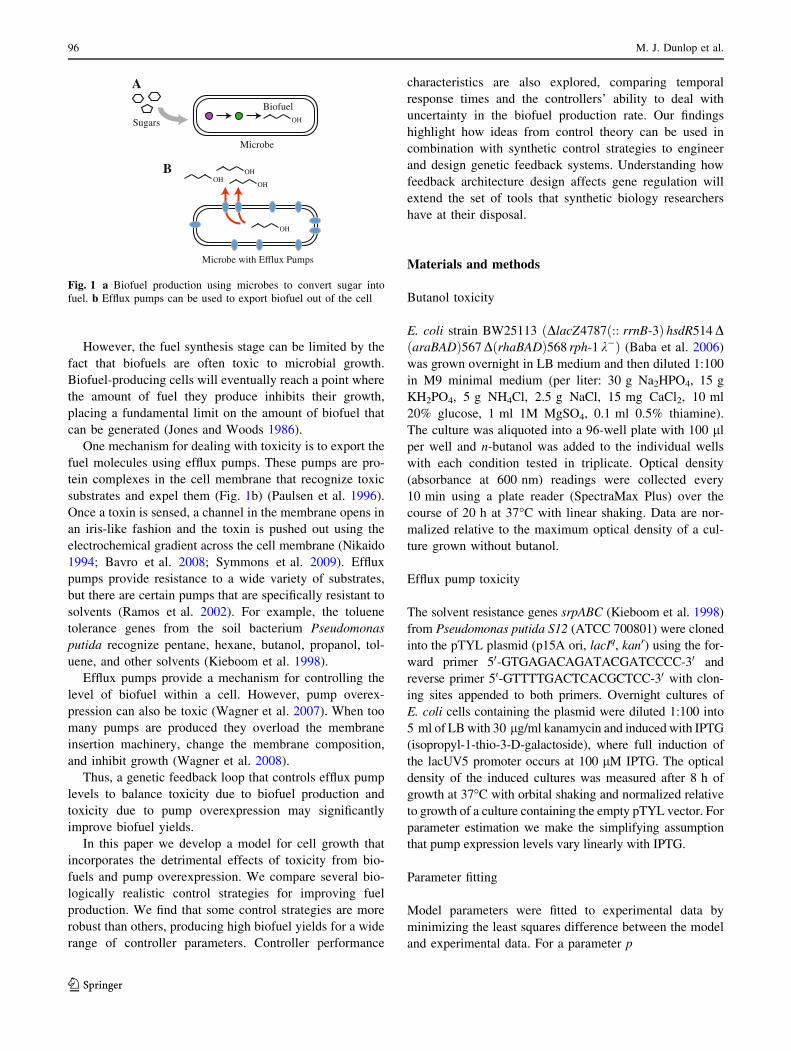
However, the fuel synthesis stage can be limited by the
fact that biofuels are often toxic to microbial growth.
Biofuel-producing cells will eventually reach a point where
the amount of fuel they produce inhibits their growth,
placing a fundamental limit on the amount of biofuel that
can be generated (Jones and Woods 1986).
One mechanism for dealing with toxicity is to export the
fuel molecules using efflux pumps. These pumps are pro-
tein complexes in the cell membrane that recognize toxic
substrates and expel them (Fig. 1b) (Paulsen et al. 1996).
Once a toxin is sensed, a channel in the membrane opens in
an iris-like fashion and the toxin is pushed out using the
electrochemical gradient across the cell membrane (Nikaido
1994; Bavro et al. 2008; Symmons et al. 2009). Efflux
pumps provide resistance to a wide variety of substrates,
but there are certain pumps that are specifically resistant to
solvents (Ramos et al. 2002). For example, the toluene
tolerance genes from the soil bacterium Pseudomonas
putida recognize pentane, hexane, butanol, propanol, tol-
uene, and other solvents (Kieboom et al. 1998).
Efflux pumps provide a mechanism for controlling the
level of biofuel within a cell. However, pump overex-
pression can also be toxic (Wagner et al. 2007). When too
many pumps are produced they overload the membrane
insertion machinery, change the membrane composition,
and inhibit growth (Wagner et al. 2008).
Thus, a genetic feedback loop that controls efflux pump
levels to balance toxicity due to biofuel production and
toxicity due to pump overexpression may significantly
improve biofuel yields.
In this paper we develop a model for cell growth that
incorporates the detrimental effects of toxicity from bio-
fuels and pump overexpression. We compare several bio-
logically realistic control strategies for improving fuel
production. We find that some control strategies are more
robust than others, producing high biofuel yields for a wide
range of controller parameters. Controller performance
characteristics are also explored, comparing temporal
response times and the controllers’ ability to deal with
uncertainty in the biofuel production rate. Our findings
highlight how ideas from control theory can be used in
combination with synthetic control strategies to engineer
and design genetic feedback systems. Understanding how
feedback architecture design affects gene regulation will
extend the set of tools that synthetic biology researchers
have at their disposal.
Materials and methods
Butanol toxicity
E. coli strain BW25113 ðDlacZ4787ð:: rrnB-3Þ hsdR514 DðaraBADÞ567 DðrhaBADÞ568 rph-1 k�Þ (Baba et al. 2006)
was grown overnight in LB medium and then diluted 1:100
in M9 minimal medium (per liter: 30 g Na2HPO4, 15 g
KH2PO4, 5 g NH4Cl, 2.5 g NaCl, 15 mg CaCl2, 10 ml
20% glucose, 1 ml 1M MgSO4, 0.1 ml 0.5% thiamine).
The culture was aliquoted into a 96-well plate with 100 ll
per well and n-butanol was added to the individual wells
with each condition tested in triplicate. Optical density
(absorbance at 600 nm) readings were collected every
10 min using a plate reader (SpectraMax Plus) over the
course of 20 h at 37�C with linear shaking. Data are nor-
malized relative to the maximum optical density of a cul-
ture grown without butanol.
Efflux pump toxicity
The solvent resistance genes srpABC (Kieboom et al. 1998)
from Pseudomonas putida S12 (ATCC 700801) were cloned
into the pTYL plasmid (p15A ori, lacIq, kanr) using the for-
ward primer 50-GTGAGACAGATACGATCCCC-30 and
reverse primer 50-GTTTTGACTCACGCTCC-30 with clon-
ing sites appended to both primers. Overnight cultures of
E. coli cells containing the plasmid were diluted 1:100 into
5 ml of LB with 30 lg/ml kanamycin and induced with IPTG
(isopropyl-1-thio-3-D-galactoside), where full induction of
the lacUV5 promoter occurs at 100 lM IPTG. The optical
density of the induced cultures was measured after 8 h of
growth at 37�C with orbital shaking and normalized relative
to growth of a culture containing the empty pTYL vector. For
parameter estimation we make the simplifying assumption
that pump expression levels vary linearly with IPTG.
Parameter fitting
Model parameters were fitted to experimental data by
minimizing the least squares difference between the model
and experimental data. For a parameter p
OHSugars
Microbe
Biofuel
A
B
OH
OHOH
OH
Microbe with Efflux Pumps
Fig. 1 a Biofuel production using microbes to convert sugar into
fuel. b Efflux pumps can be used to export biofuel out of the cell
96 M. J. Dunlop et al.
123

minpknðpÞmodel � nexperimentk2:
Global sensitivity analysis
Global sensitivity analysis was conducted using a variance-
based method to find the sensitivity and total sensitivity
indices for all controller parameters (Saltelli et al. 2008).
The controller parameters were used as inputs and the final
biofuel concentration (be(T); T = 100 h) was used as the
output. Monte Carlo distributions for the parameter values
were generated by finding the combination of parameters
that maximized biofuel yield. For each controller design a
gradient ascent algorithm was started from 100 random
initial conditions and the maximum and the statistical
variation around it were used to generate a set of Monte
Carlo points for the sensitivity analysis.
Simulations
All simulations were conducted in Matlab (the MathWorks,
Inc.) using the ode45 solver and custom analysis software.
Noise in the biofuel production rate was simulated using
an Ornstein-Uhlenbeck process with a log normal distri-
bution with l = 1, r = 0.35, and s = 1 h (Dunlop et al.
2008; Rosenfeld et al. 2005). This noisy signal, g(t), was
included in the model by replacing the intracellular biofuel
equation with _bi ¼ abgðtÞn� dbpbi: The same noise signal
was used to compare the performance of all four control-
lers. Noise simulations were repeated 5,000 times and
results were averaged.
Results
Cell growth and biofuel production model
Without any control of biofuel production, the host
microbe will make biofuel at the maximum level that the
metabolically engineered system allows. When biofuel
levels are high enough they will be toxic to cell growth.
This negative feedback loop, shown in Fig. 2a, reduces
biofuel yields.
Cell growth is modeled as in (You et al. 2004) by
_n ¼ annð1� nÞ � dnbin; ð1Þ
where n is the normalized cell density; a value of n = 1 is
the maximum level of cell growth supported by the nutri-
ents supplied in the growth medium, assuming no toxicity.
This equation represents the standard growth curve of a
microbial culture (Fig. 2b). The parameter an describes the
specific growth rate of the cells. bi is the intracellular
biofuel concentration. dn is the biofuel toxicity coefficient,
which is biofuel-specific since some compounds are much
more toxic than others (Kieboom et al. 1998).
We estimate the parameters an and dn directly using
experimental data. Setting bi = 0 we fit the model in Eq. 1
to the experimental growth curve data without biofuel. an is
estimated to be 0.66 1/h, equivalent to a 1 h cell division
time (ln(2)/an). Figure 2b shows the experimental data and
model fits for growth in the absence of biofuel (blue dots
and line, respectively).
Experimental data for exogenously added butanol was
used to estimate dn. Overall cell growth was inhibited when
butanol was added. For the levels of butanol indicated in
the figure (the values of bi), dn was estimated by mini-
mizing the difference between experimental data and the
modeled system. The model fit is compared to the exper-
imental results in Fig. 2b. In reality, exogenous butanol
levels will be higher than the corresponding intracellular
levels that cells experience, however, for simplicity we
assume these values are the same when estimating dn.
Metabolically engineered microbes can currently pro-
duce biofuels like butanol in small quantities (Atsumi et al.
2008; Steen et al. 2008). Although current production
levels in E. coli and S. cerevisiae are not toxic to cell
growth, as yield improves growth inhibition will become a
serious limitation (Jones and Woods 1986).
Acellular
dynamics
bi
0 5 10 15 200
0.5
1
Time (hours)
Cel
l Den
ity
B0 mM
175 mM275 mM
650 mM
Butanol Toxicity
Time (hours)
n (n
orm
.)b i
(m
M)
C
0
0.5
1
0 10 20 30 400
500
1000
Fig. 2 Biofuel production without export. a Cells produce intracel-
lular biofuel bi, which inhibits their growth, and consequently limits
biofuel production. b Experimental growth curves (dots and errorbars) are fit to the model in Eq. 1 to estimate the model parameters an
and dn (model fits shown as solid lines). The amount of butanol added
to the culture is indicated in the figure, where experimental data is for
exogenously added butanol in cells without intracellular butanol
production. c Simulation of cell growth and biofuel production.
Growth inhibition occurs when biofuel produced by the cells reaches
toxic levels. Simulation parameters are an = 0.66 1/h, dn = 0.91
1/M h, and ab = 0.1 1/h
A model for improving microbial biofuel production 97
123
Initially, we assume biofuel is produced in proportion to
cell density:
_bi ¼ abn;
where bi is the intracellular level of biofuel and ab is the
biofuel production rate. This model makes the simplifying
assumption that biofuel cannot diffuse through the cell
membrane. Figure 2c shows a simulation of the biofuel-
producing cells. The cells begin to produce biofuel, which
inhibits their growth, eventually killing the entire popula-
tion. Similar effects have been observed in the butanol-
producing microbe Clostridium acetobutylicum (Van Der
Westhuizen et al. 1982; Jones and Woods 1986).
In summary, cell growth and biofuel production are
modeled as
_n ¼ ann 1� nð Þ � dnbin ð2Þ_bi ¼ abn: ð3Þ
The system is at equilibrium when ðn; biÞ ¼ ð0; b�i Þ;where b�i is any value of bi; the exact value achieved
depends on the initial conditions.
Model for biofuel export using efflux pumps
When efflux pumps are used to export biofuel from the cell
the extracellular level of biofuel (be) will increase, allow-
ing intracellular biofuel levels to remain low (Fig. 3a).
However, efflux pump expression is also limited by bio-
logical considerations. If pumps are expressed too highly
they consume cellular resources that are necessary for cells
to function properly and can change the membrane com-
position (Wagner et al. 2007). Thus, there are two limits on
pump expression: levels that are too low will cause biofuel
toxicity and kill the cells, while overexpression will also
result in cell death. An intermediate level of pump
expression can balance these two competing factors.
The growth model from Eq. 1 is extended to include
toxicity due to pump expression:
_n ¼ annð1� nÞ � dnbin�annp
pþ cp
; ð4Þ
where p is the concentration of efflux pump proteins and cp
sets the toxicity threshold.
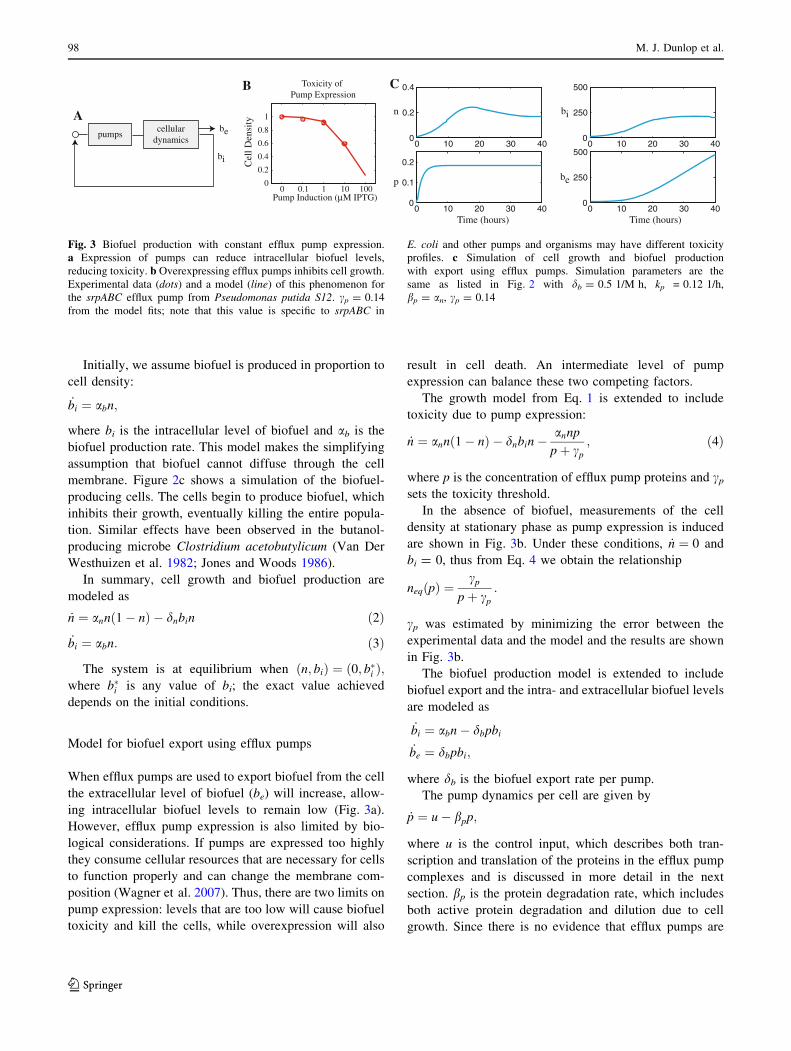
In the absence of biofuel, measurements of the cell
density at stationary phase as pump expression is induced
are shown in Fig. 3b. Under these conditions, _n ¼ 0 and
bi = 0, thus from Eq. 4 we obtain the relationship
neqðpÞ ¼cp
pþ cp
:
cp was estimated by minimizing the error between the
experimental data and the model and the results are shown
in Fig. 3b.
The biofuel production model is extended to include
biofuel export and the intra- and extracellular biofuel levels
are modeled as
_bi ¼ abn� dbpbi
_be ¼ dbpbi;
where db is the biofuel export rate per pump.
The pump dynamics per cell are given by
_p ¼ u� bpp;
where u is the control input, which describes both tran-
scription and translation of the proteins in the efflux pump
complexes and is discussed in more detail in the next
section. bp is the protein degradation rate, which includes
both active protein degradation and dilution due to cell
growth. Since there is no evidence that efflux pumps are
Acellular
dynamicsbe
bi Cel
l Den
sity
B C
pumps
0 0.1 1 10 1000
0.2
0.4
0.6
0.8
1
Pump Induction (μM IPTG)
Toxicity of Pump Expression
Time (hours)
bn i
Time (hours)
p be
0 10 20 30 400
0.2
0.4
0 10 20 30 400
250
500
0 10 20 30 400
250
500
0 10 20 30 400
0.1
0.2
Fig. 3 Biofuel production with constant efflux pump expression.
a Expression of pumps can reduce intracellular biofuel levels,
reducing toxicity. b Overexpressing efflux pumps inhibits cell growth.
Experimental data (dots) and a model (line) of this phenomenon for
the srpABC efflux pump from Pseudomonas putida S12. cp = 0.14
from the model fits; note that this value is specific to srpABC in
E. coli and other pumps and organisms may have different toxicity
profiles. c Simulation of cell growth and biofuel production
with export using efflux pumps. Simulation parameters are the
same as listed in Fig. 2 with db = 0.5 1/M h, kp = 0.12 1/h,
bp = an, cp = 0.14
98 M. J. Dunlop et al.
123

actively degraded, bp is assumed to be proportional to the
growth rate (Rosenfeld et al. 2005).
The simplest form of pump expression places the genes
under the control of a constitutive promoter. In this situa-
tion pump expression is constant. Figure 3c shows a sim-
ulation of the biofuel export system with constant pump
expression (u = kp). Note that the number of cells stabi-
lizes at a constant value rather than decaying to zero, as it
did without efflux pumps. The levels of intracellular bio-
fuel also stabilize, and extracellular levels of biofuel rise.
This constant biofuel production following stationary phase
has been observed experimentally (e.g., Supplementary
Fig. 2 from Atsumi et al. 2008).
In summary, the following dynamics describe cell
growth, biofuel production, and export:
_n ¼ annð1� nÞ � dnbin�annp
pþ cp
ð5Þ
_bi ¼ abn� dbpbi ð6Þ_p ¼ u� bpp ð7Þ
and the output is given by
_be ¼ dbpbi: ð8Þ
Efflux pump controller models
We investigate several strategies for controlling pump
expression to maximize biofuel yield.
Four alternative controllers are shown in Fig. 4. The
simplest controller is a constitutive promoter (Fig. 4a)
where pumps are expressed at a constant rate
_p ¼ kp � bpp:
The strength of efflux pump expression is represented by kp.
It is possible to tune the transcription and translation rates of
a gene by choosing promoters with alternative strengths
(Ellis et al. 2009) or by modifying the ribosome binding site
strength (Salis et al. 2009). Thus, kp can be changed to tune
biofuel production. Because the pump expression is not
related to biofuel levels we expect this controller will be
suboptimal, but it is the easiest system to design and test.
The second controller actuates pump expression in
response to intracellular biofuel levels (Fig. 4b). There are
examples of biofuel-responsive promoters that are regulated
by transcription factors that sense biofuel, e.g. (Willardson
et al. 1998). Such a promoter could be used to drive
expression of efflux pump genes. Typical promoters respond
linearly within a range, but saturate above a certain threshold
of sensed substrate. We model this class of promoters by
_p ¼ kpbi
bi þ cb
� bpp;
where cb defines the threshold level above which the pro-
moter’s response saturates.
Biofuel can also be used indirectly to control pump
expression. For example, Fig. 4c shows a controller where a
biofuel-sensing repressor regulates expression of a transcrip-
tion factor that controls efflux pump expression. This repres-
sor cascade strategy has the advantage of using a native
regulatory system to control pump expression directly. Efflux
pumps are often controlled by a single repressor (Paulsen et al.
1996), where relief of repression leads to efflux pump
expression. These native regulatory proteins could be used for
control. This type of controller is modeled by
_r ¼ kr
bi þ cb
� brr
_p ¼ kp
r þ cr
� bpp;
where r is the repressor protein concentration, kr and kp are
the production rates for the repressor and pump proteins
and cb and cr specify the threshold values of biofuel and the
repressor protein for the promoters.
The final control strategy we consider is similar to the
repressor cascade, but uses a feed forward loop to control
pump expression, as shown in Fig. 4d. The feed forward loop
discussed here is a network motif that appears frequently in
gene regulation (Mangan and Alon 2003). This should be
distinguished from the class of feed forward loops used in
control theory, where a system is engineered to respond to
input signals in a predetermined way based on a model of the
BA
pump genes
OH
OH
pump genes
pump genes
OH
OH
repressor
C
D
Constant Biofuel-Responsive
Repressor Cascade
Feed Forward Loop
pump genes
OH
OH
repressor
Fig. 4 Different schemes for controlling efflux pump expression.
a With constant control the pump expression is driven by a
constitutive promoter. b A promoter regulated by a transcription
factor that senses biofuel is used to drive efflux pump expression
directly. c In the repressor cascade biofuel represses production of a
transcription factor, which in turn represses efflux pump expression.
d The feed forward loop uses both biofuel and a transcription factor
to control pump expression, while the transcription factor is also
controlled by a biofuel-responsive promoter
A model for improving microbial biofuel production 99
123

dynamics (Astrom and Murray 2008). In the genetic feed
forward loop shown in Fig. 4d, biofuel inhibits expression of
the pump repressor and simultaneously activates expression
of the efflux pump genes. This controller can turn on pump
expression to a small extent and then, with a delay, fully
commit to expressing the pumps; there is no corresponding
delay in turning off gene expression so the process can easily
be shut down (Mangan and Alon 2003; Wall et al. 2005).
Because pump expression can be toxic, this control strategy
may have a distinct advantage since the genes can be turned
on at a low level in response to the presence of biofuels and
then turned on more completely only if necessary. The
controller is modeled by
_r ¼ kr
bi þ cbr
� brr
_p ¼ kp
r þ cr
bi
bi þ cbp
� bpp;
where the parameters are the same as defined in the
repressor cascade, but cbr and cbp set the thresholds for
biofuel sensed at the promoter for the repressor and the
pump genes, respectively.
For each of these controllers we calculate the maximum
amount of biofuel that can be produced, how sensitive this
maximum production level is to changes in the controller
parameters (i.e., how precise do the biological parts need to
be), and how quickly controller responds to changes.
Controller performance and sensitivity
For a constant controller Fig. 5a and b show how the final
biofuel yield (be(T); T = 100 h) varies as a function of the
promoter strength. T = 100 h was chosen to allow suffi-
cient time in stationary phase; resulting trends are similar
for other values of T. At low levels of pump expression the
biofuel is not exported and biofuel toxicity limits yields.
When pumps are expressed highly, the toxicity of pump
overexpression limits cell growth. Thus, biofuel yield is
maximized at an intermediate promoter strength where
biofuel and pump toxicity effects are balanced. This
maximal level is significantly higher than what could be
reached without any biofuel export (Fig. 2c).
For a biofuel-responsive promoter, Fig. 5c shows how
the final biofuel yield depends on the parameters kp and cb.
Again, there is a trade off between toxicity due to biofuel
and toxicity due to pump overexpression. However, the
wide plateau of high biofuel production levels suggests that
a broad range of biofuel sensors will allow maximal biofuel
yield provided the promoter strength can be tuned. This is
an encouraging finding since the parameters associated
with biofuel sensors (such as the saturation value) can be
more complicated to tune than promoter strengths. It is
interesting to note that the maximum biofuel yield is not
significantly higher with the biofuel-responsive promoter
than it is with constitutive expression.
The dependence on kp of the four controllers is com-
pared in Fig. 6. All four controllers are capable of pro-
ducing similar maximal levels of biofuel, with the three
non-constitutive promoters slightly outperforming the
constant controller. However, some controllers are more
sensitive to the system parameters than others. For exam-
ple, the constant controller produces high levels of biofuel
for only a small set of kp values compared to the other
controllers, as evidenced by how ‘‘sharp’’ the peak is. A
wider peak indicates that the promoter strength does not
need to be tuned as precisely to reach near-maximal biofuel
yields. The feed forward loop controller is particularly
insensitive to changes in kp, with a large range of promoter
strengths giving high biofuel yields.
Table 1 shows global sensitivity indices for each of the
four controllers’ parameters. The Si sensitivity indices rank
which parameters cause the greatest deviation from the
maximum be(T). A larger Si value indicates that a change in
this parameter will have a large change on be(T). The total
sensitivity index STi quantifies how interactions between
this parameter and all other model parameters contribute to
changes in be(T). The constant controller only has one
parameter so its sensitivity analysis results are trivial. The
biofuel-responsive controller parameters contribute equally
CA Final Biofuel Concentration (mM)
Promoter Threshold (γb)
Concentration (mM)
Promoter Strength (kp)
Promoter Strength (kp)
Toxicity Levels
10−2
10−1
100
101
102
Prom
oter
Str
engt
h (k
p)
10−2
10−1
100
101
102
Biofuel ToxictyPump ToxicityTotal Toxicity (Biofuel + Pump)
B
Final Biofuel Concentration (mM)
0
0.2
0.4
0.6
0.8
10−3
10−2
10−1
100
101
10−3
10−2
10−1
100
1010
500
1000
1500
2000
500 1000 15000
Fig. 5 Toxicity tradeoffs in biofuel production. a Final biofuel
concentration (be(T); T = 100 h) as a function of promoter strength
for constitutive pump expression. b Toxicity of biofuel (orange line)
and pumps (blue line) at time T is defined by dnbi(T) and anp(T)/(p(T)
? cp), respectively. The sum of the two toxicity curves is also shown
(dashed line). Note that the maximum be(T) in a occurs at the
minimum of the total toxicity curve. c Biofuel production as a
function of promoter strength and threshold for a biofuel-responsive
promoter. Parameters are the same as in Fig. 3 unless noted
100 M. J. Dunlop et al.
123

to model variation, though when secondary interactions are
considered kp plays a greater role. In the repressor cascade
controller the promoter strengths, kp and kr, are more
sensitive to parameter variation than the thresholds cr and
cb. The feed forward loop controller places a more even
balance on the role of its five parameters.
Controller performance characteristics
The performance characteristics of a controller, such as
response time and ability to handle noise, become
particularly important when there is uncertainty in the
system. Under optimized conditions the four controllers
produced similar biofuel yields, but do these results persist
when the system deviates from optimal?
Figure 7a shows toxicity results for the four controllers
as a function of time using the parameter values that
maximize be(T). All four controllers ultimately achieve the
same total toxicity level, however, they reach this point by
different paths. The constant controller turns on pump
production immediately, even though there is no biofuel
present. This causes an immediate increase in pump tox-
icity, though the pumps are present as soon as biofuel starts
to appear and thus biofuel toxicity is smoothly controlled.
The other three controllers all delay pump expression until
biofuel is sensed. This gives the cell population a period of
time without any toxicity mediating its growth, but pump
production must be turned on quickly in response to sensed
biofuel. The repressor cascade and feed forward loop
controllers produce similar results, but the feed forward
loop has a faster temporal response, turning on and then
settling to a final expression level more rapidly. Although
the biofuel-responsive promoter is not quite as responsive
as the more complicated controllers, it still does a good job
of responding to biofuel levels and is a good choice for a
straightforward control system.
If the actual biofuel production rate ða�bÞ is different
from the nominal conditions for which the controller
parameters have been optimized (ab), the controller selec-
tion becomes more important. Figure 7b shows that the
four controllers handle differences in the biofuel produc-
tion rate to a different extent. When a�b [ ab the system
produces more biofuel than in the nominal case. Because
the constant controller does not sense biofuel levels
directly, the cells do not adjust the pump expression levels
accordingly and miss out on potential yield. The feed
forward loop controller does the best job responding to the
changed conditions, exploiting the increase in biofuel
production to achieve high biofuel yields. This perfor-
mance advantage is likely due to the quick response times
of the feed forward loop controller. When a�b\ab the
system produces less biofuel than in the nominal case and
none of the systems have good yields because there is less
biofuel around.
These controller performance differences can also mat-
ter if there is noise in the system. For example, if a�b varies
over time due to extrinsic or intrinsic noise (Elowitz et al.
2002) in the system a good controller will track relevant
changes in internal biofuel levels and adjust pump
expression accordingly. For example, Fig. 7c shows the
internal biofuel level for the system with four different
controllers given the same noisy a�bðtÞ: Averages of many
noise simulations show that the feed forward loop con-
troller is consistently better at handling noise than the other
10−3
10−2
10−1
100
101
102
103
0
500
1000
1500
2000
Promoter Strength (kp)
Final Biofuel Concentration (mM)
Constant
Biofuel-Responsive
Repressor Cascade
Feed Forward Loop
Fig. 6 Overall biofuel yield as a function of kp. The controller
parameters that give the maximum biofuel yield are: Constant, kp
= 0.12; Biofuel-responsive, kp = 4.34, cb = 5.72; Repressor cascade,
kp = 7.23, cr = 0.19, kr = 5.01, cb = 0; Feed forward loop, kp = 2.64,
cr = 0.016, cbp = 5.89, kr = 0.048, cbr = 0. Other parameters are the
same as those listed in Fig. 3
Table 1 Sensitivity and total sensitivity indices for controller
parameters
Si STi
Constant
kp 1.00 1.00
Biofuel-responsive
kp 0.26 0.76
cb 0.25 0.60
Repressor cascade
kp 0.45 0.72
cr 0.07 0.11
kr 0.23 0.45
cb 0.01 0.01
Feed forward loop
kp 0.09 0.31
cr 0.07 0.26
cbp 0.21 0.47
kr 0.11 0.38
cbr 0.04 0.21
A model for improving microbial biofuel production 101
123
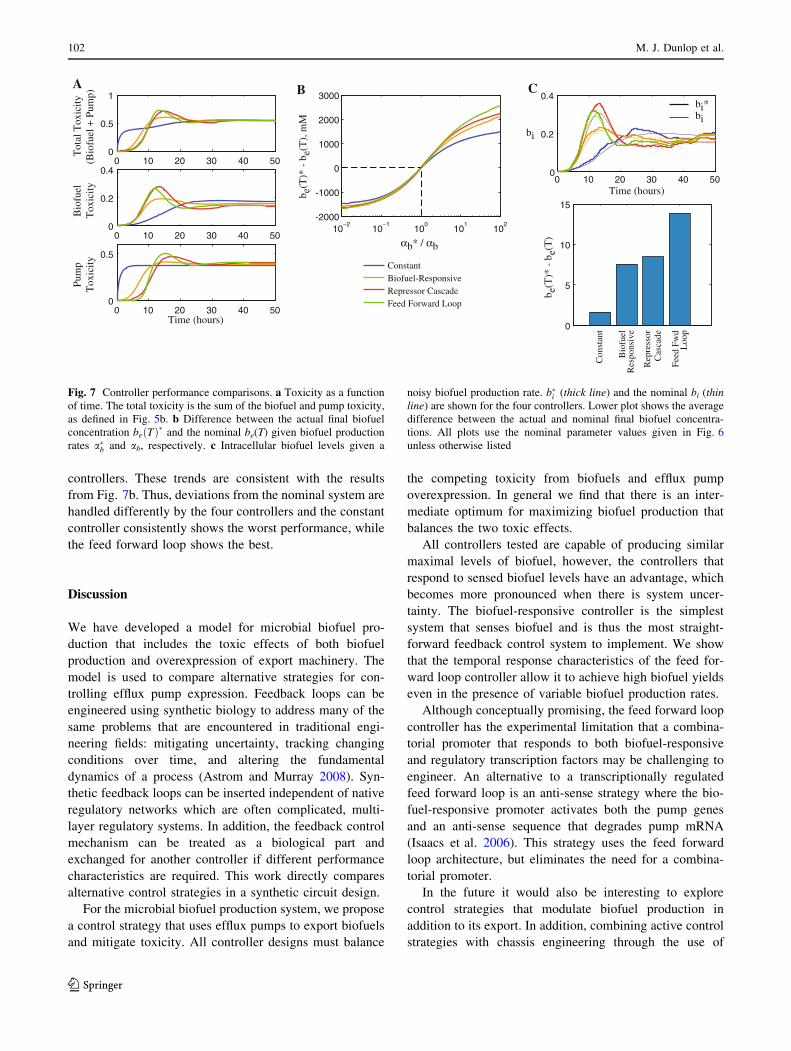
controllers. These trends are consistent with the results
from Fig. 7b. Thus, deviations from the nominal system are
handled differently by the four controllers and the constant
controller consistently shows the worst performance, while
the feed forward loop shows the best.
Discussion
We have developed a model for microbial biofuel pro-
duction that includes the toxic effects of both biofuel
production and overexpression of export machinery. The
model is used to compare alternative strategies for con-
trolling efflux pump expression. Feedback loops can be
engineered using synthetic biology to address many of the
same problems that are encountered in traditional engi-
neering fields: mitigating uncertainty, tracking changing
conditions over time, and altering the fundamental
dynamics of a process (Astrom and Murray 2008). Syn-
thetic feedback loops can be inserted independent of native
regulatory networks which are often complicated, multi-
layer regulatory systems. In addition, the feedback control
mechanism can be treated as a biological part and
exchanged for another controller if different performance
characteristics are required. This work directly compares
alternative control strategies in a synthetic circuit design.
For the microbial biofuel production system, we propose
a control strategy that uses efflux pumps to export biofuels
and mitigate toxicity. All controller designs must balance
the competing toxicity from biofuels and efflux pump
overexpression. In general we find that there is an inter-
mediate optimum for maximizing biofuel production that
balances the two toxic effects.
All controllers tested are capable of producing similar
maximal levels of biofuel, however, the controllers that
respond to sensed biofuel levels have an advantage, which
becomes more pronounced when there is system uncer-
tainty. The biofuel-responsive controller is the simplest
system that senses biofuel and is thus the most straight-
forward feedback control system to implement. We show
that the temporal response characteristics of the feed for-
ward loop controller allow it to achieve high biofuel yields
even in the presence of variable biofuel production rates.
Although conceptually promising, the feed forward loop
controller has the experimental limitation that a combina-
torial promoter that responds to both biofuel-responsive
and regulatory transcription factors may be challenging to
engineer. An alternative to a transcriptionally regulated
feed forward loop is an anti-sense strategy where the bio-
fuel-responsive promoter activates both the pump genes
and an anti-sense sequence that degrades pump mRNA
(Isaacs et al. 2006). This strategy uses the feed forward
loop architecture, but eliminates the need for a combina-
torial promoter.
In the future it would also be interesting to explore
control strategies that modulate biofuel production in
addition to its export. In addition, combining active control
strategies with chassis engineering through the use of
A
0 10 20 30 40 500
0.5
1
0 10 20 30 40 500
0.2
0.4
0 10 20 30 40 500
0.5
Tot
al T
oxic
ity(B
iofu
el +
Pum
p)B
iofu
elT
oxic
ityPu
mp
Tox
icity Constant
Biofuel-ResponsiveRepressor CascadeFeed Forward Loop
Time (hours)
10−2
10−1
100
101
102
-2000
-1000
0
1000
2000
3000B
αb* / αb
b e(T
)* -
be(
T),
mM
C
0 10 20 30 40 500
0.2
0.4
Time (hours)
bi
0
5
10
15
b e(T
)* -
be(
T)
Con
stan
t
Rep
ress
orC
asca
de
Bio
fuel
Res
pons
ive
Feed
Fw
dL
oop
bi*bi
Fig. 7 Controller performance comparisons. a Toxicity as a function
of time. The total toxicity is the sum of the biofuel and pump toxicity,
as defined in Fig. 5b. b Difference between the actual final biofuel
concentration beðTÞ� and the nominal be(T) given biofuel production
rates a�b and ab, respectively. c Intracellular biofuel levels given a
noisy biofuel production rate. b�i (thick line) and the nominal bi (thinline) are shown for the four controllers. Lower plot shows the average
difference between the actual and nominal final biofuel concentra-
tions. All plots use the nominal parameter values given in Fig. 6
unless otherwise listed
102 M. J. Dunlop et al.
123

stoichiometric model predictions (Burgard et al. 2003) may
have complementary benefits.
This work highlights how a control theory approach can
be used to gain insight into synthetic biology design,
considering realistic biological control strategies in com-
bination with classic control theory methods. Controller
architectures and corresponding analysis methods should
be broadly applicable in synthetic biology design.
Acknowledgments This work was conducted at the Department of
Energy Joint BioEnergy Institute (http://www.jbei.org) supported by
the US Department of Energy, Office of Science, Office of Biological
and Environmental Research, and through contract DE-AC02-
05CH11231 between Lawrence Berkeley National Laboratory and the
US Department of Energy.
Open Access This article is distributed under the terms of the
Creative Commons Attribution Noncommercial License which per-
mits any noncommercial use, distribution, and reproduction in any
medium, provided the original author(s) and source are credited.
References
Alon U (2007) An introduction to systems biology: design principles
of biological circuits. Chapman & Hall/CRC, Boca Raton
Anesiadis N, Cluett WR, Mahadevan R (2008) Dynamic metabolic
engineering for increasing bioprocess productivity. Metab Eng
10(5):255–266
Astrom KJ, Murray RM (2008) Feedback systems: an introduction for
scientists and engineers. Princeton University Press, Princeton
Atsumi S, Hanai T, Liao JC (2008) Non-fermentative pathways for
synthesis of branched-chain higher alcohols as biofuels. Nature
451(7174):86–U13
Baba T, Ara T, Hasegawa M, Takai Y, Okumura Y, Baba M,
Datsenko KA, Tomita M, Wanner BL, Mori H (2006) Construc-
tion of Escherichia coli K-12 in-frame, single-gene knockout
mutants: the Keio collection. Mol Syst Biol 2, Article number
2006.0008. doi:10.1038/msb4100050
Bashor CJ, Helman NC, Yan SD, Lim WA (2008) Using engineered
scaffold interactions to reshape map kinase pathway signaling
dynamics. Science 319(5869):1539–1543
Bavro VN, Pietras Z, Furnham N, Perez-Cano L, Fernandez-Recio J,
Pei XY, Misra R, Luisi B (2008) Assembly and channel opening
in a bacterial drug efflux machine. Mol Cell 30(1):114–121
Burgard AP, Pharkya P, Maranas CD (2003) OptKnock: a bilevel
programming framework for identifying gene knockout strate-
gies for microbial strain optimization. Biotechnol Bioeng
84(6):647–657
Dunlop MJ, Cox RS, Levine JH, Murray RM, Elowitz MB (2008)
Regulatory activity revealed by dynamic correlations in gene
expression noise. Nat Genet 40(12):1493–1498
Ellis T, Wang X, Collins JJ (2009) Diversity-based, model-guided
construction of synthetic gene networks with predicted func-
tions. Nat Biotechnol 27(5):465–471
Elowitz MB, Levine AJ, Siggia ED, Swain PS (2002) Stochastic gene
expression in a single cell. Science 297(5584):1183–1186
Farmer WR, Liao JC (2000) Improving lycopene production in
Escherichia coli by engineering metabolic control. Nat Biotech-
nol 18(5):533–537
Fortman JL, Chhabra S, Mukhopadhyay A, Chou H, Lee TS, Steen E,
Keasling JD (2008) Biofuel alternatives to ethanol: pumping the
microbial well. Trends Biotechnol 26(7):375–381
Goldberg SD, Derr P, DeGrado WF, Goulian M (2009) Engineered
single- and multi-cell chemotaxis pathways in E. coli. Mol Syst
Biol 5:283
Isaacs FJ, Dwyer DJ, Collins JJ (2006) RNA synthetic biology. Nat
Biotechnol 24(5):545–554
Jones DT, Woods DR (1986) Acetone-butanol fermentation revisited.
Microbiol Rev 50(4):484–524
Kieboom J, Dennis JJ, de Bont JAM, Zylstra GJ (1998) Identification
and molecular characterization of an efflux pump involved in
Pseudomonas putida S12 solvent tolerance. J Biol Chem 273(1):
85–91
Kobayashi H, Kaern M, Araki M, Chung K, Gardner TS, Cantor CR,
Collins JJ (2004) Programmable cells: interfacing natural and
engineered gene networks. Proc Natl Acad Sci USA 101(22):
8414–8419
Mangan S, Alon U (2003) Structure and function of the feed-forward
loop network motif. Proc Natl Acad Sci USA 100(21):11980–
11985
Nikaido H (1994) Prevention of drug access to bacterial targets—
permeability barriers and active efflux. Science 264(5157):
382–388
Paulsen IT, Brown MH, Skurray RA (1996) Proton-dependent
multidrug efflux systems. Microbiol Rev 60(4):575–608
Ramos JL, Duque E, Gallegos M-T, Godoy P, Ramos-Gonzalez MI,
Rojas A, Teran W, Segura A (2002) Mechanisms of solvent
tolerance in gram-negative bacteria. Annu Rev Microbiol
56:743–768. doi:10.1146/annurev.micro.56.012302.161038
Rosenfeld N, Young JW, Alon U, Swain PS, Elowitz MB (2005)
Gene regulation at the single-cell level. Science 307(5717):
1962–1965
Salis HM, Mirsky EA, Voigt CA (2009) Automated design of
synthetic ribosome binding sites to control protein expression.
Nat Biotechnol 27(10):946–950, October, ISSN 1087-0156. doi:
10.1038/nbt.1568. URL http://dx.doi.org/10.1038/nbt.1568
Saltelli A, Ratto M, Andres T, Campolongo F, Cariboni J, Gatelli D,
Saisana M, Tarantola S (2008) Global sensitivity analysis: the
primer. Wiley, Chichester
Savage DF, Way J, Silver PA (2008) Defossiling fuel: how synthetic
biology can transform biofuel production. ACS Chem Biol
3(1):13–16
Steen EJ, Chan R, Prasad N, Myers S, Petzold CJ, Redding A, Ouellet
M, Keasling JD (2008) Metabolic engineering of Saccharomycescerevisiae for the production of n-butanol. Microb Cell Factories
7:36
Symmons MF, Bokma E, Koronakis E, Hughes C, Koronakis V
(2009) The assembled structure of a complete tripartite bacterial
multidrug efflux pump. Proc Natl Acad Sci USA 106(17):7173–
7178
Topp S, Gallivan JP (2007) Guiding bacteria with small molecules
and RNA. J Am Chem Soc 129(21):6807–6811
Van Der Westhuizen A, Jones DT, Woods DR (1982) Autolytic
activity and butanol tolerance of Clostridium acetobutylicum.
Appl Environ Microbiol 44(6):1277–1281
Wagner S, Baars L, Ytterberg AJ, Klussmeier A, Wagner CS, Nord O,
Nygren PA, van Wijk KJ, de Gier JW (2007) Consequences of
membrane protein overexpression in Escherichia coli. Mol Cell
Proteomics 6(9):1527–1550
Wagner S, Klepsch MM, Schlegel S, Appel A, Draheim R, Tarry
M, Hogbom M, van Wijk KJ, Slotboom DJ, Persson JO,
de Gier JW (2008) Tuning Escherichia coli for membrane
protein overexpression. Proc Natl Acad Sci USA 105(38):
14371–14376
Wall ME, Dunlop MJ, Hlavacek WS (2005) Multiple functions of a
feed-forward-loop gene circuit. J Mol Biol 349(3):501–514
Willardson BM, Wilkins JF, Rand TA, Schupp JM, Hill KK, Keim P,
Jackson PJ (1998) Development and testing of a bacterial
A model for improving microbial biofuel production 103
123

biosensor for toluene-based environmental contaminants. Appl
Environ Microbiol 64(3):1006–1012
Win MN, Smolke CD (2008) Higher-order cellular information
processing with synthetic RNA devices. Science 322(5900):
456–460
You LC, Cox RS, Weiss R, Arnold FH (2004) Programmed
population control by cell-cell communication and regulated
killing. Nature 428(6985):868–871
104 M. J. Dunlop et al.
123