A Mixed Method Study of 3rd Grade Literacy Development in Mexico and the Influence of the Turno...
54
El Turno Escolar 1 Running head: Literacy Development and the Turno Escolar A Mixed Method Study of 3 rd Grade Literacy Development in Mexico and the Influence of the Turno Escolar Bryant T. Jensen Arizona State University DRAFT, March 2008 Paper presented at the 52nd Annual Meeting of the Comparative and International Education Society (CIES) at Teachers College, Columbia University, New York City.
Transcript of A Mixed Method Study of 3rd Grade Literacy Development in Mexico and the Influence of the Turno...

El Turno Escolar 1
Running head: Literacy Development and the Turno Escolar
A Mixed Method Study of 3rd Grade Literacy Development
in Mexico and the Influence of the Turno Escolar
Bryant T. Jensen
Arizona State University
DRAFT, March 2008
Paper presented at the 52nd Annual Meeting of the Comparative and International
Education Society (CIES) at Teachers College, Columbia University, New York City.

El Turno Escolar 2
Abstract
As equitable educational opportunity remains an important element of development in
Mexico, this study uses multiple methods to assess ways in which student, classroom,
and school variables influence literacy learning (or reading) for third grade students
across states (including the Federal District). In this paper I combine case study data
with descriptive statistics (frequency assessments, means, standard deviations, and
mean comparisons) and a series of hierarchal linear models to evaluate the influence of
the turno escolar (i.e., school shift) on student literacy learning. More specifically, the
influence of the turno escolar is assessed along with the modalidad escolar as school
effects on literacy learning, and the difference of such effects across states, are
evaluated. Limitations to the dataset and relevant recommendations for further research,
policy, and practices are offered.
Keywords: mixed methods; primary schooling; literacy development; school shift
El Turno Escolar 3
Introduction
Considered a wealthy developing (or newly industrialized) country, one of Mexico’s
greatest challenges to entering the developed world and the 21st century is extending
equitable educational opportunities to its large child population. In more specific terms,
this means improving student learning opportunities and outcomes for diverse segments
of the Mexican child populations (Vegas & Petrow, 2007). While gross economic gains
in Mexico are moving forward through free trade agreements and increased
involvement in the global market; if such are not accompanied with thoughtful
initiatives designed to improve social opportunities (such as education and health
care)—including their fair distribution among the Mexican public—national
development will be stifled (Fägerlind & Saha, 1989; Sen, 1999). Thus, equitable
educational opportunity remains an important element of development in Mexico.
Certainly the role of education in the development of economies and societies
remains a highly disputed topic within academic circles (Adams, 2001; Carnoy, 2006;
Epstein & Carroll, 2005; Fägerlind & Saha, 1989; Kubow & Fossum, 2003; Wigley &
Akkoyunlu-Wigley, 2006). Disagreements between the grand theories concerning
education in development—i.e., structural functionalism, Marxism, and
postmodernism—are attributable to ideological differences and mixed reactions to
policy reforms concerning third world development following World War II (Epstein &
Carroll, 2005). While none of the views disregard the importance of education in
development, they dispute the construction of education, its purposes, its distribution
among diverse peoples, viable definitions of “development”, and meaningful ways to
study education in the process of development. These topics will likely be sources of
debate for years to come (Adams, 2001).

El Turno Escolar 4
My view, and the conceptual backdrop of this paper, is that elements from each
of the major theoretical orientations can converge to account for both local and general
phenomena related to education in development. This is the lens I use to approach
conceptual concerns related to educational development of children in Mexico. Of a
matter of course, my view discounts certain principles held by each of the three grand
theories while acknowledging the enduring value of others. As an introductory measure,
I put forth three theoretical assertions concerning the role of education in development.
First, contrary to the structural-functional approach, the function of education in
society cannot be unitary. Skills emphasized in rural Oaxacan schools, for example,
differ from the curriculum at an inner-city school in Mexico City. Course content,
appropriate behavior, and institutional processes are dependent on the histories and
values held within each society, or subgroups within that society (Valenzuela &
Valenzuela, 1998). The issue of “what should be learned” is often an on-going struggle
between local political and market-driven forces particular to each society (Carnoy &
Levin, 1985). Learning is purposeful, yet the process by which that purpose is
determined and its eventual outcome vary across societies, as argued by several neo-
Marxists (Kubow & Fossum, 2003).
Second, increased educational opportunity must be viewed as more than a path
to economic well-being. While sophisticated economic analyses in recent years provide
convincing evidence on ways in which educational attainment (and more recently
academic achievement) is directly and indirectly associated with the economic
prosperity of individuals and societies, education is more than a means to capital (Sen,
1999). It has, for example, the potential of decreasing social inequality through the
provision of equitable learning opportunities (Reimers, 2000). Equally distributed
student learning within societies is vital to democracy and fair economic opportunity.
El Turno Escolar 5
So while the relationship between educational advancement and economic development
within societies is important, the development of education should not be viewed solely
in these terms. It should also be viewed as end of development, not merely a means
(Sen, 1999; Wigley & Akkoyunlu-Wigley, 2006).
A third and final theoretical assertion is that classroom processes are central to
our understanding of education in development. This claim highlights an important
shortcoming of structural-functional and Marxist frameworks: their inability to
adequately describe, analyze, and interpret processes within the classroom. A theory of
education in development should be conversant in curriculum, instruction, as well as the
social and cognitive development of the child. This is especially true if educational
research is to have practical relevance (Reimers & McGinn, 1997).
As perspectives in international development increasingly shift their focus from
economic indicators (e.g., per capita income, GDP, income distribution) to indices of
human development (e.g., disease risk, literacy, life expectancy, health, maternal
survival) to evaluate the progress of developing and underdeveloped nations (Sachs,
2005; Sen, 1999; United Nations Development Programme, 1997, 2000), there will be a
stronger demand for applied (and creative) work in the social sciences. In terms of the
role of education in development, the Human Developmental Index (HDI)—currently
the foremost instrument used to measure and compare human development between
nations (Chatterjee, 2005; Sen, 2000)—considers educational attainment, yet does not
seek to define educational quality or the processes that influence it.
As student learning will become an increasingly important aspect of
development in developing nations (particularly in Latin America [Vegas & Petrow,
2007]), this study analyzes the literacy performance of a nationally representative

El Turno Escolar 6
sample of Mexican children enrolled in third grade during the 2005-2006 school year, in
combination with case studies of three children attending different schools in Mexico.
The purpose of this study is to evaluate the influence of el turno escolar (the school
shift) on student learning nationally. Before discussing the methods and results of this
study, I offer a short literature review presenting a conceptual approach to student
learning in development, and a brief synopsis of what is currently known concerning the
sources of student learning inequality in Mexico’s basic education system (i.e., grades
1-9) at the individual, classroom, school, and state levels.
Literature Review
Psychologists, linguists, sociologists, anthrolopologists, and other social scientist
have sought for several decades to define quality in education, and to research the
intersecting factors that influence it. In this study I conceive student learning and its fair
distribution as quality—that the social and cognitive processes through which
knowledge is encoded and retained by individuals, and then equally distributed among
the student population, constitutes an important element of societal development.
Certainly the intersecting individual, social, and cultural aspects influencing
student learning are complex. And the common input-output models developed by
economists to evaluate causal relations (Glewwe & Kremer, 2006) do not do justice to
the convoluted nature of the phenomena. While clear and precise analyses producing
understandable and relevant results for practitioners and policymakers are critical
(Reimers & McGinn, 1997; Rosekrans, 2006), such efforts can be thwarted by
simplified models that disregard elemental processes which shape learning.
A practical way to approach student learning is by understanding the multiple
levels that influence its development (Bray & Thomas, 1995). This means that in

El Turno Escolar 7
addition to considering individual characteristics (e.g., motivation, attention, cognitive
processing, personal background), processes within the classroom, school, and state are
evaluated simultaneously. This “multilevel” approach is particularly useful when
making comparisons between groups, societies or nations (Bray & Thomas, 1995). It
conceives the effects of the school on student learning to be influenced by educational
policies and practices broadly (e.g., within districts and/or states), and that student
development and learning potential depend not only on an individual’s background and
personal attributes, but also classroom processes which are often shaped by school-level
policies and practices.
The role of classroom processes on student learning has been entertained
extensively by education researchers. Over the years this work has provided ample
evidence, for example, that the amount of time students are exposed to curriculum (i.e.,
time on task) can increase learning (Karweit, 1982; Reimers & McGinn, 1997) and that
educational policies to increase time on task, in turn, improve achievement scores
generally. However, this represents only an initial step as students benefit differentially
from increased time on task. Much is yet unknown concerning the best use of time and
differential curricular and instructional strategies needed to produce greater learning
benefits for students from diverse backgrounds (Miller, 1995; Portes, 2005), and how to
optimally train teachers to bring that about (Reimers & McGinn, 1997).
In Mexico, extensive work has been done in recent years to evaluate certain
school and state effects on student learning. A recent study by Backhoff, Andrade,
Sánchez and Peon (2007), for example, found that third grade students’ scores in
science, reading literacy (or Spanish), civic education, mathematics, geography, and
history varied substantially by school modality, a variable used in Mexico to
differentiate between five school types: private, urban public, rural public, indigenous
El Turno Escolar 8
education, and community courses. On average, students attending private schools
performed better in all areas compared to students in other modalities, followed by
urban public, rural public, and students in indigenous schools who demonstrated the
lowest mean performance across subjects. Surprisingly, though students enrolled
community courses (or cursos comunitarios—schools operated by the Consejo
Nacional de Fomento Educativo and located in remote locations where regular
education services do not exist) had been found in previous studies to demonstrate
among the lowest achievement patterns in sixth and ninth grade (Backhoff, Andrade,
Sánchez, & Bouzas, 2006), Backhoff, Andrade, Sánchez and Peon (2007) found their
third grade literacy and mathematics scores to be quite high, second only to children in
private schools. Perplexed at this finding, authors speculated that the unexpectedly high
scores of students attending cursos comunitarios (less than one percent of the third
grade student population in 2006) were possibly due to sampling problems or improper
test administration. Where little evidence is available to support such hypotheses,
however, the surprisingly high average performance of third grade students must be
considered representative.
In this same study, the effect of school modality varied across states. That is, the
distribution of third grade students by modality and the size of the learning difference
between schools fluctuated from state to state (including the Federal District). In
literacy learning, for example, students demonstrated state-to-state differences as large
as a half of a national standard deviation, whereas many state averages were not
statistically different from the national mean (Backhoff, Andrade, Sánchez & Peon,
2007).
In Mexico, less is known about the role of student characteristics on academic
learning. Again, most of the nationally representative work focuses on the school level

El Turno Escolar 9
and the state effects on student learning (Backhoff, Andrade, Sánchez, & Peon, 2007)
though some recent work by the Instituto Nacional para la Evaluación de la Educación
(INEE) assesses the influence of social inequality of family backgrounds (Backhoff,
Bouzas, Hernández, & García, 2007). This study by Backhoff and colleagues found that
students (in 3rd and 9th grade) varied greatly in terms of parent education, parent
expectations of educational attainment, amount of educational resources in the home,
and other home factors shaping the “cultural capital” related with educational success.
Children were not distributed equally among schools, but were highly clustered into
schools with other students who had similar “cultural capital” profiles. Some clustering
was found at the state level. These conditions in the home accounted for most of the
school and states effects on math and reading literacy outcomes, and some 4 to 5
percent of the student effects.
Because the individual level accounts for more variation in student learning over
and above the school and state (Backhoff, Bouzas, Hernández, & García, 2007),
theoretical and empirical work assessing individual factors (and their clustering with
schools and states) will continue to be paramount to improve educational opportunities
for Mexican children. Moreover, the classroom (often the “black box” in nationally
representative research) is an indispensable level of analysis to educational
improvement (Reimers & McGinn, 1997). Much of the individual variation accounting
for student learning is clustered within the classroom—attributable to instructional
practices and other classroom processes.
As mentioned previously, this study uses INEE data, informed by preliminary
results from three case studies, to assess the influence of the school shift on literacy
learning for third grade students in Mexico. Case study data, including classroom
observations, and interviews with students, family members, teachers, and peers, are

El Turno Escolar 10
used to problematize, direct, and inform quantitative analyses. This is done as a way to
understand not only the general influences el turno escolar has on literacy learning, but
also to develop hypotheses concerning ways in which it influences classroom-level
processes and, therefore, student learning.
My interest in the school shift arose from a qualitative study I conducted in
2004-2005 in which I observed classrooms and interviewed school staff, students, and
parents at urban primary schools in Mexico as a way of understanding educational
practices in schools and classrooms (Jensen, 2005, 2008). One discovery from this study
was that many children attended schools in the afternoon while most children attended
during the day (i.e., the morning shift). Apparently this practice has grown as the
Mexican government has sought to expand school access to traditionally marginalized
populations without necessarily building more schools.
Teachers and other school staff I interviewed perceived certain differences
between shifts. In terms of the children, they mentioned that those attending afternoon
shifts (i.e., el turno vespertino) had greater economic disadvantage, less academic skill
development, and were less engaged in school curricula in comparison to those
attending morning shifts (Jensen, 2005). Moreover, according to teachers interviewed,
the parents of vespertino children were less involved in school functions and
demonstrated more domestic problems than parents of matutino (i.e., the morning shift)
children. Finally, interviewees also asserted that these perceptions of children and
families within shifts were common among teachers and, as such, teachers typically
help lower academic expectations of students attending afternoon sessions.
To my knowledge, the generalizability of these notions has not been evaluated
with a national sample of children. While I do not pretend to get at each of them in this

El Turno Escolar 11
study, I use data from a national sample of third grade students, in combination with
three case studies, to assess how the school shift influences literacy development.
Methods
Using multiple methods in educational research is vital if we are to understand the
complexity of the phenomenon under study (Smith, 2006). Yet combining methods also
introduces difficult challenges concerning study designs and procedures, especially
when multiple method studies use concurrent rather than sequential designs. In the
present study I combine case study data (most of which is qualitative—data from
interviews and observations) with quantitative assessments of student learning to
understand ways in which the school shift influences literacy development nationally
among third grade students. More specifically, preliminary findings from case study
data analysis led me to consider school modality as an additional school-level co-
variate—i.e., in addition to the school shift—influencing literacy scores. Moreover, a
hierarchical linear model was eventually developed to test the nesting of these school
effects within states, as well as individual achievement variation within schools.
Four months before looking at the quantitative data at INEE, I sampled three
students within different school types in Mexico. Because managing educational
bureaucracies in Mexico can be daunting (Jensen, 2005), I realized I would need an
advocate—someone who knew someone who worked at the school—to be granted
access and support from school staff to carry out my study. After using my contacts to
the best of my ability, and after nearly 2 months of working hard at it, the primary
school sites were selected: a rural public school in Puebla, a private school in Mexico
City, and a urban public school in Morelos. Within each of these schools I then used
third-grade students’ grades in español (given by teacher, on a scale of 1 to 10) to select
“at random” a child who demonstrated “average” performance in class—i.e., neither

El Turno Escolar 12
high nor low scores. Thus, a male student was selected in Puebla, and females in
Morelos and Mexico City, as my case study participants.
Before entering the classroom to gather observational data concerning students’
behaviors, teachers’ instructional strategies, and classroom activities, I decided to
interview school staff further about the school shift. Semi-structured questions were
posed, which resulted quickly in an important consideration—private schools rarely
have shifts, and afternoon shifts in rural communities are diminishing as migration from
rural to urban sectors increases. Were the school shifts, therefore, concentrated in urban
public schools nationally? This finding from interviews with school staff made me
decide to include school modality in my evaluation of el turno escolar on student
literacy learning.
As I continue to gather case study data on these students, much of that data has
yet to be analyzed. This includes information not only on classroom processes
associated with student learning, but also descriptions of home activities and
relationships, as well as the local histories of the schools and communities within which
students learn. These data will certainly be useful as I continue to grapple with the
complexity of student literacy learning, and the contextual features shaping differential
outcomes.
Quantitative analyses assessing the influence of student literacy learning
presented in this paper, therefore, consider the influences of the school shift, school
modality, and state (including the Federal District). All data were taken from the INEE
Excale literacy exam, which assesses reading comprehension and linguistic reflection,
including knowledge of grammar, spelling, and punctuation (Backhoff, Andrade,
Sánchez, & Peon, 2007).

El Turno Escolar 13
The sample of students (n = 16,563) was determined through a stratification of
school modalities within states, and the random selection of students within selected
schools. Though information in the database was provided concerning the school shift
(i.e., matutino, vespertino, nocturno, discontinuo, or mixto), the sampling was not
conducted to be representative of students within turnos escolares. Thus, the
distributions of the weighted sample compared the population of students enrolled in
different school shifts within states were disparate. The original student weight,
therefore, was adjusted to account for school shift distribution (using a dichotomous
shift variable—i.e., matutuino, no matutino) within states.
The remainder of this study presents a series of descriptive statistics as well as a
hierarchal linear model to assess to influence of the school shift, the school modality,
and states on student literacy learning. For each of the subgroups considered, sample
sizes, frequencies, means, and standard deviation estimates (with their respective
standard error scores) were analyzed, as shown in the appended tables. Means and
standard deviations for subgroups with sample sizes less 30 students were suppressed
due to their questionable psychometric properties and the inflated standard errors
associated with computed estimates. Two-tailed mean comparisons using 95 percent
confidence intervals were also conducted to compare the statistical significance of
children attending matutino versus non-matutino schools within school modalities and
states. SPSS analysis software was used for data cleaning and organization and SAS
was used to compute estimates. In each case, the macros and student sample weights
provided by the INEE were applied to produce the reported estimates of plausible value
scores for each group.
A series of three-level hierarchal linear models were run to evaluate the nested
contributions of school modality and school shift (and their interaction) within state on

El Turno Escolar 14
student literacy scores, as well as the individual variation within school effects
(Raudenbush & Byrk, 2002). First, a null model was analyzed using HLM6 software to
determine how of much of the Excale reading literacy score variation of third grade
students with schools was accounted for at the student level, and how much of the state
variation was accounted for at the school level. In each HLM model, Level 1 was the
student level, Level 2 schools, and Level 3 states. Each model is described below.
Null Model
Level 1: Yij = π0j + eij
Level 2: π0j = ß00j + r0j
Level 3: ß00j = γ000 + u00
In the null model, Yij is equal to the individual literacy score of student i within
school j in the first level, while π0j is the intercept, defined as the expected literacy
achievement of students generally. The error term, eij, represents a unique effect
associated with person i attending school j. In the second level, ß00j is the intercept or
mean literacy achievement for urban public schools, which were coded as the base
category in each of the three HLM models. The final element at the second level, r0j, is
the random error in reading scores at the school level. At the third level, γ000 is the grand
mean of student reading achievement and u00 is the random error at the state level.
In the next model, identified as Model 1, one school-level predictor was added to
the null model to assess it’s unique influence on student literacy scores, and the variance
of this effect across states. The equations for this model are presented below.
Model 1
Level 1: Yij = π0ij + eij
Level 2: π0j = ß00j + ß01 j *(matutino) + r0 j
Level 3: ß00 j = γ000 + u00

El Turno Escolar 15
ß01 j = γ010 + u01
Like the null model, Yij is equal to the individual literacy score of student i within
school j in Model 1, while π0j is the intercept, defined as the expected literacy
achievement of students in general. And eij represents a unique effect associated with
person i attending school j. At the second level, again, ß00j is the intercept or mean
literacy achievement for urban public schools. ß01 j is the regression coefficient
associated with no matutino schools (including vespertino, nocturno, mixto, and
discontinuo shifts), which were coded “0”. Matutino schools were coded “1”. r0j is the
random error in reading scores not accounted for by the school shift effect. Finally, γ000
is the mean of student reading achievement respective of the model (i.e., urban public
schools), u00 is the random error at the state level, γ010 is the average difference between
matutino and urban public schools, and u01 is random error in at the state level.
In the final model, Model 2, school modalities were combined with the school
variable at the second level to determine their combined effect (including interactions of
random effects) on the literacy scores of third grade students in Mexico. Equations
associated with this model are presented below.
Model 2
Level 1: Yij = π0ij + eij
Level 2: π0ij = ß00j + ß01 j *(rural) + ß02 j *(edu ind) + ß03 j *(cc) + ß04 j *(private)
+ ß05 j *(matutino) + ß06 j *(rural_matutino) + ß07 j *(edu ind_matutino)
+ ß08 j *(cc_matutino) + ß09 j *(private_matutino) + r0 j
Level 3: ß00 j = γ000 + u00
ß01 j = γ010 + u 01
ß02 j = γ020
ß03 j = γ030

El Turno Escolar 16
ß04 j = γ040 + u 04
ß05 j = γ050 + u 05
ß06 j = γ060
ß07 j = γ070
ß08 j = γ080
ß09 j = γ090
The level-1 equation is repeated from the previous two models. At the school level, ß00j
is the intercept or mean literacy achievement for urban public schools associated with
the model, and ß01 j-04 j are the regression parameters associated with school modality
categories. ß01 j is the regression coefficient associated with rural public schools where
rural public schools were coded “1” and all other school modality categories were coded
“0”; ß02 j is the regression coefficient associated with indigenous education schools
where indigenous schools were coded “1” and all other school modality categories were
coded “0”; and ß04 j is the regression coefficient associated with private schools where
private schools were coded “1” and all other school modality categories were coded “0”.
Coefficient ß05 j is the regression coefficient associated with no matutino schools, which
were coded “0”, while matutino schools were coded “1”.
Coefficients ß06 j-09 j represent the regression parameters associated with
interactions between school modality categories and the school shift. More specifically,
ß06 j is the regression coefficient associated with the interaction between rural public
schools and matutino schools; ß07 j is the regression coefficient associated with the
interaction between indigenous and matutino schools; ß08 j is the regression coefficient
associated with the interaction between community courses and matutino schools; and
ß09 j is the regression coefficient associated with the interaction between private and
matutino schools. The error term, r0 j, is the residual variance of student literacy scores

El Turno Escolar 17
at the school level not accounted for by school modalities, the school shift, and their
interaction.
Because rural public schools, private schools, and school shifts (including
matutino or no matutino categories) were represented at the national level—i.e., in each
state—coefficients ß01 j, ß04 j, and ß05 j were conceived of as random, while the effects of
indigenous education schools or community courses were considered fixed because they
were concentrated within certain states. Moreover, the interaction effects were also
considered fixed.
Error estimates (u 01-03) at the state level, therefore, were only computed for rural
public schools, private schools, and for the dichotomous school shift variable. These
indicate the variance of the effect of school variables across states (including the
Federal District). Moreover, γ000 is the grand mean of student reading achievement
respective of the model, u00 is the random error at the state level, and γ010-090 are literacy
mean differences between each school group and the model grand mean.
Results
In this section I describe results from quantitative analyses described above—
descriptive studies (including group and subgroup distribution frequencies, means, and
standard deviations), mean comparisons, and results from hierarchal linear modeling.
Though case study data paralleling quantitative analyses in this study are largely
unanalyzed at this point, I wish to re-emphasize that interviews and observations carried
out at the three school sites shaped how I approached quantitative analyses. Specifically,
early on in this study it was brought to my attention that a thorough assessment of the
influence of the school shift on reading outcomes of elementary school children in
Mexico would require evaluated the co-influence of school modalities. Further analysis
after case study data gathering has been completed (June 2008) will certainly shed
El Turno Escolar 18
additional insight on the nesting of child characteristics, classroom processes, school
effects, and possibly state effects on student literacy learning. Such analyses will
present further questions in need of study in order to improve the quality and equality of
educational opportunity for Mexican students.
In the first set of descriptive analyses, I assessed the influence of the turno
escolar on reading outcomes of third grade students nationally during the 2005-2006
school year. Table 1 and Figure 1 demonstrate variation between school shifts. In the
population, 4 in 5 third grade students attended the matutino or morning shift, while
17.4 percent of third grade students attended the vespertino (or afternoon) shift, .1
percent the nocturno (or night) shift, 2.5 percent the discontinuo (or discontinuous)
shift, and less than .1 percent the mixto (or mixed) shift. Because the subsample sizes
attending the nocturno (n = 11) and mixto (n = 12) shifts were so small, standard errors
associated with mean standard deviation scores for these groups were inflated. This
produced the large confidence intervals associated with means for these two groups in
Figure 1. Thus, in subsequent analyses, descriptive statistics were suppressed (i.e., not
reported) for subsamples smaller than 30 students in which standard errors were
inflated.
Next, all non-matutino groups were collapsed into one category (see Table 2).
As shown in Table 2 and Figure 2, 20 percent of the third grade population was reported
as attending a non-matutino shift. Moreover, at the national level, children attending
morning shifts performed better, on average, than those attending others (an average
difference score of 18.7 points, roughly .2 of a national [or pooled] standard deviation).
Knowing student literacy achievement variation fluctuated by state (including the
Federal District) (Backhoff , Andrade, Sánchez, & Peon, 2007), I then decided to assess
the size fluctuation of mean differences between shifts by state.

El Turno Escolar 19
Table 3 includes mean literacy score variation by state, including the
distribution of children in the national sample and population attending school in each
state. While large discrepancies are found between sample and population (census data
gathered by the Secretaría de Educación Pública) frequencies (e.g., the state of
México), student weights applied to all analyses corrected distributional differences.
Figure 3 demonstrates mean student reading scores by state from the lowest to
highest averages. The national mean bar (whose width represents the 95 percent
confidence interval of the national mean estimate) offers an idea of which states are
below the national average. It should be mentioned here that students in Oaxaca were
excluded from the 2005-2006 study due to political disturbance during the time of
assessment, in which the state branch of the Sindicato Nacional de Trabajadores
Educativos (the National Teacher Labor Union) was heavily involved. While many of
the student mean scores within states were not statistically different from the national
mean, there were those who performed above and below the national average. Namely,
Guerrero, Yucatán, Tabasco, and Michoacán produced the lowest state mean score
while Baja California Sur, Nuevo León, and the Federal District were at the top.
Next, frequencies, means, and standard deviations were computed by school
shift within states. As expected, the size of the average reading score difference varied
by state (see Table 4). Moreover, the distribution of the third grade student population
enrolled into schools by shift also varied from state to state. For example, in Baja
California 33.5 percent of third grade students attended a non-matutino school, while
8.2 percent in Zacatecas did. Interestingly a few states showed small reading
achievement benefits for non-matutino over matutino students, though none of the mean
differences were statistically significant. On the other hand, large mean differences—
most of which were statistically significant—were found for several states in which

El Turno Escolar 20
students in non- matutino shifts scored lower than those attending matutino shifts in the
same school. The size of significant differences varied from .4 to .7 of a pooled standard
deviation, and included the states of Baja California, Chiapas, Morelos, Nuevo León,
Querétaro, Sonora, Tabasco, and Tamaulipas.
Figure 4 displays turno differences by state, in which states are ordered by their
overall mean in student reading achievement. The largest gaps between shifts are found
in states whose average achievement is either lower of higher than the national norm.
Further analysis should evaluate the within state processes that contribute to larger
learning differences between turnos.
Some of the large mean differences between school shifts by state were not
found to be statistically significant (see Table 4). For example, in Baja California Sur
the difference was larger than a third of a standard deviation, yet it was not significant.
This is due to the large standard errors associated with the mean and standard deviation
estimates of non-matutino students in this state. Estimates associated with school shifts
would be more precise if the national sample would have been stratified by turno
escolar, in addition to state and school modality. This is an important consideration if
we are to understand further the school shift phenomenon.
As mentioned above, findings from interviews related to case study data caused
me to consider the combining influence of the school shift with school modality. In
Table 5, frequencies, mean, and standard deviation estimates are provided by school
modality at the national level. Means and confidence intervals are also displayed in
Figure 5. As shown, most children attended urban public schools (61.7 percent),
followed by rural public (23.1 percent), private (8.3 percent), indigenous (6.0 percent),
and community course schools (.9 percent). Furthermore, means scores fluctuated
substantially between school modalities, where private schools scored the highest, on

El Turno Escolar 21
average, and indigenous education schools the lowest. Backhoff, Andrade, Sánchez and
Peon (2007) discuss these findings at length, including three hypotheses to why students
enrolled in community course schools produced a relatively high mean score when past
studies have found other age groups attending these schools to perform below the other
modalities. In short, they postulate that the unexpectedly high mean estimate of children
attending cursos comunitarios was attributable to sampling problems, improper test
administration, or that the finding represents a reality.
Next, the influence of the school shift on reading scores within school modalities
was assessed analyzing the descriptive statistics of students attending los turnos within
each modality (see Table 6). Frequency distributions show that larger portions children
attending indigenous and urban public schools were enrolled in non-matutino shifts
compared to the other school modality categories. That is, 91.4 percent of all children
enrolled in a non-matutino shift attending an indigenous or a urban public school. The
comparably low percent of rural public students attending a non-matutino shift
confirmed the finding that children in rural areas typically go to the school in the
morning—that due to immigration patterns in recent decades (i.e., migrants fleeing rural
communities), school shifts in these areas have declined.
Figure 6 displays mean literacy differences by school shift within school
modality. Again, the large confidence intervals in mean reading scores of non-matutino
children in cursos comunitarios and escuelas privadas are due to the large standard
errors associated with their mean and standard deviation estimates, which, in turn, are
directly related to the sample selection process. Certainly samples stratified by the
school shift would decrease the error terms, provide more precise estimates, and,
therefore, better interpretations concerning the combining influence of the school shift
and school modality on student learning outcomes (as well as other indicators).

El Turno Escolar 22
Even so, a significant mean difference in reading scores between shifts was
found for children attending urban public schools, where those attending morning shifts
performed 15.4 points higher, on average, than those attending non-morning shifts
within the same school modality.
Because descriptive analyses showed that the school shift, school modality, and
the state each accounted for unique variation in student literacy learning, multilevel
analyses were then conducted to evaluate the nested contributions of school modality
and school shift (and their interaction) within state. As a reference, descriptive statistics
and mean comparisons between school shifts by modality within states are provided in
Table 9 (estimates only provided for subgroups in which sample sizes could support the
analysis).
Multilevel coefficient estimates (produced using HLM6 software) associated
with the null model as well as Model 1 and Model 2 are provided in Table 7. Moreover,
the variance components and effect sizes associated with each model are afforded in
Table 8. In the null model, a significant portion of student achievement variance was
accounted for at the school and state levels. However, most of the variance remained at
the individual level. In Model 1, the school shift was added to the second level (i.e.,
schools). The beta coefficient associated with the school shift was found to be
statistically significant at the .05 level. Following the recommendations of Roberts and
Monaco (2006), an effect size coefficient (i.e., R2) was calculated by subtracting the
computed school-level variance component from the school-level variance component
of the null model, and then dividing the difference by the null school-level variance
component. The result was R2 = .059, meaning 5.9 percent of the student achievement
variation at the school level in the null model was accounted for by the effect of the

El Turno Escolar 23
school shift, at the national level. Importantly, as discovered in the descriptive analyses,
the size of the effect of the school shift varied between states (see Table 8).
In Model 2, the effect of the school modality on student literacy was combined
with the school shift in the second level of the model. Interactions between the school
shift and levels of the school modality were included. Not surprising, significant effects
were found for levels of school modality. That is, rural public schools were found to be
significantly lower than urban public schools (i.e., the base category for this variable),
and private schools were found to be significantly higher. Moreover, the effect of the
school shift remained significant at the .05 level, though the unstandardized beta
coefficient associated with the effect of the school shift decreased from 17.4 in Model 1
to 13.9 in Model 2, suggesting some shared student achievement variance between el
turno escolar and la modalidad escolar (i.e., school modality). However, none of the
interactions between the school shift variable and levels of school modality (with the
exception of the base category—urban public schools), were found to be significant.
An effect size estimate was then calculated to determine how much of the
variance in student reading achievement at the school level was accounted for by the
school shift and modality. The result suggests that 37.1 percent of the student learning
variation at the school level was accounted for by the model (see Table 8). Moreover,
the size of the effect of school modality and the school shift was found to vary by state
(see Table 8).
Discussion
Efficient and equitable student learning in Mexico, as throughout the developing and
underdeveloped world, will continue to be a salient concern for those studying and
working toward societal development. Moreover, educational research and their creative
combination of designs and methods should assist policymaker and practitioners

El Turno Escolar 24
involved in improving educational delivery. This means having a clearer understanding
of ways in which student variables interact with classroom processes, as well as the
school and state effects that influence differences in learning outcomes.
In this study I sought to combine methodologies to understand how the turno
escolar relates to differences in student literacy learning among Mexican students who
attended third grade during the 2005-2006 school year. Preliminary findings from case
studies helped reorient the design of quantitative analyses to include school modality.
As this area (i.e., case studies) of my study develops, I anticipate a richer understanding
of how student characteristics and classroom processes may relate to the school effects
analyzed presented in this paper.
A strength of this study was the inclusion of multilevel modeling. The
descriptive statistics included left unclear the proportional variance in student reading
performance accounted for by the school shift, school modality, and states (including
the Federal District). Computed estimates in HLM models, however, provided
information on the variance in student literacy learning accounted for at the individual,
school, and state levels (i.e., null model) generally, as well as the proportional variance
the school shift and school modality accounted for at the school level. Moreover, it was
found that the size of the school effects varied across states.
In essence, the question posed in this study—whether the school shift
significantly influenced literacy learning of elementary school students—received a
mixed answer. Yes, the influence is significant at the national level, where children
attending morning school perform better than those enrolled in other shifts. However,
the size of the effect depends on which state the students live in and the school modality
they attend. Further research should look deeper into the regions and school types in
which the shift has a stronger influence on literacy learning. Again, multiple methods

El Turno Escolar 25
and creative designs will be needed if this work is to have a meaningful impact on
policy and practice. Particularly, we need to know how the school shift relates with the
classroom processes (including instructional strategies, curricular approaches, and
teacher-student relationships) and student characteristics that shape learning.
The variance components of the null HLM model shown in Table 8 are very
insightful. Here, 75.7 percent of the variance in student reading achievement accounted
for by students, schools, and states nationally was accounted for at the student level.
Certainly a great deal of student variation is also accounted for by classrooms. Unless
we tweak our research tools to get at classroom processes nationally, we are able to
explain only a limited portion of student achievement variance. We are limited in our
ability to identify effective interventions in order to improve learning opportunities
broadly, and for specific subpopulations of students most at-risk for academic failure.
I conclude with a few recommendations concerning further research efforts, and
some considerations for policymakers in Mexico. Our ability to understand the
influence of the school shift on student learning nationally is slightly tainted by the fact
that this variable is not considered presently in the sampling process for Excale
assessments. As explained earlier, the errors associated with estimates computed to
understand achievement patterns among students enrolled in different shifts are quite
high in many cases. Often this is due to small subsample sizes within groups. Smaller
confidence intervals, and more precise mean comparison estimates would be facilitated
by including the school shift as an additional stratification in sampling process.
While this paper assesses the influence of the school shift on achievement
outcomes nationally, it does not show how large the effect sizes of the school shift are
in states and school modalities in which the effect was found to be significant.
El Turno Escolar 26
Segmented multilevel analyses in those states where significant differences were found
would be useful to see how large particular effects really are.
Finally, educational policymakers in Mexico may (rightly) ask, “so what?”. This
paper provides evidence that separating students into different turnos can have
unfavorable results in terms of their literacy learning outcomes. In many ways, this
phenomenon embodies the changing mindset of educational policymakers in developing
countries from a concern to access expansion in basic education to addressing quality.
Students cannot be simply stuffed into classrooms, and then be expected to learn
equally. Especially in states (i.e., Baja California, Chiapas, Morelos, Nuevo León,
Querétaro, Sonora, Tabasco, and Tamaulipas) and school modalities (i.e., urban public)
in which the turno is found to have the greatest influence on student learning,
alternatives should be considered by educational policymakers. Where possible, piloting
alternatives should be accompanied with grounded research efforts to document
progress and identify its contributors.

El Turno Escolar 27
References
Adams, D. (2001). Continuing the debate on education and development. Comparative Education Review, 45(5), 616-628.
Backhoff, E., Andrade, E., Sánchez, A., & Bouzas, A., (2006). El aprendizaje del español y las matemáticas en la educación básica en México: Sexto de primaria y tercero de segundaria. México, DF: Instituto Nacional para la Evaluación de la Educación.
Backhoff , E., Andrade, E., Sánchez, A., & Peon, M. (2007). El aprendizaje en tercero de primaria en México: Español, matemáticas, ciencias naturales y ciencias sociales. México, DF: Instituto Nacional para la Evaluación de la Educación.
Backhoff, E., Bouzas, A., Contreras, C., Hernández, E., & García, M. (2007). Factores escolares y aprendizaje en México: El caso de la educación básica. México, DF: Instituto Nacional para la Evaluación de la Educación. Backhoff, E., Bouzas, A., Hernández, E., & García, M. (2007). Aprendizaje y
desigualdad social en México: Implicaciones de política educativa en el nivel básico. México, DF: Instituto Nacional para la Evaluación de la Educación.
Bray, M., & Thomas, R. M. (1995). Levels of comparison in educational studies: Different insights from different literatures and the value of multilevel analyses. Harvard Educational Review, 65(3), 472-490.
Carnoy, M. (2006). Rethinking the comparative—and the international. Comparative Education Review, 50(4), 551-570. Carnoy, M., & Levin, H. M. (1985). Schooling and work in the democratic state. Stanford, CA: Stanford University Press.
Chatterjee, S. K. (2005). Measurement of human development: An alternative approach. Journal of Human Development, 6(1), 31-44. Epstein, E. H., & Carroll, K. T. (2005). Abusing ancestors: Historical functionalism and
the postmodern deviation in comparative education. Comparative Education Review, 49(1), 62-88.
Fägerlind, I., & Saha, L. J. (1989). Education and national development: A comparative perspective (2nd ed.). New York: Pergamon. Glewwe, P., & Kremer, M. (2006). Schools, teachers, and education outcomes in
developing countries. In E. A. Hanushek & F. Welch (Eds.), Handbook of the Economics of Education, Volume 1. Toronto: North Holland.
Jensen, B.T. (2005). Culture and practice of Mexican primary schooling: Implications
for improving policy and practice in the U.S., Current Issues in Education [Online], 8(25). Available: http://cie.asu.edu/volume8/number24/
Jensen, B. T. (2008). Raising questions for binational research in education: An

El Turno Escolar 28
exploration of Mexican primary school structure. In E. Szecsy, J. Rodriguez, & S. Nogueron (Eds.), A Resource Book: The Second Binational Symposium. Tempe, AZ: Center for Southwest Education Equity and Language Diversity.
Karweit, N. (1982). Time on task: A research review. Paper presented at a meeting of the National Commission on Excellence in Education, Washington, DC.
Kubow, P. L., & Fossum, P. R. (2003). Comparative education: Exploring issues in international perspective. Upper Saddle River, NJ: Merrill/Prentice Hall.
Miller, L. S., (1995). An American imperative: Accelerating minority educational advancement. New Haven, CT: Yale University Press.
Portes, P. (2005). Dismantling educational inequality: A cultural-historical approach to closing the achievement gap. New York: Peter Lang Publishing. Raudenbush, S. W., & Byrk, A. S. (2002). Hierarchal linear models: Applications and data analysis methods. Thousand Oaks, CA: Sage Publications. Reimers, F. (2000). ¿Equidad en la educación? Educación, desigualdad y opiniones de
política en América Latina en el siglo XXI. La Revista Iberoamericana de Educación, 23.
Reimers, F., & McGinn, N. (1997). Informed dialogue: Using education research to
shape educational policy around the World. Westport, CN: PRAEGER Roberts, J. K., & Monaco, J. P. (2006), Effect size for the two-level linear multilevel
model. Paper presented at the annual meeting of the American Educational Research Association, San Francisco, CA.
Rosekrans, K. (2006). Using Participatory Research and Informed Dialogue to Influence Education Policy: Lessons from El Salvador. Journal of Education in International Development 2:2. Retrieved from http://www.equip123.net/JEID/articles/3/InfluencingPolicy.pdf
Sachs, J. D. (2005). The end of poverty: Economic possibilities of our time. London:
Penguin Books. Sen, A. (1999). Development as Freedom. New York: Anchor Books. Sen, A. (2000). A decade of human development. Journal of Human Development, 1(1), 17-23. Smith, M. L. (2006). Multiple methodology in education research. In J. L. Green, G.
Camili, & P. B. Elmore (Eds.), Handbook of complementary methods in education research. Mahwah, NJ: Lawrence Erlbaum Associates.
United Nations Development Programme (1997). Human development report: Human
development to eradicate poverty. Paris: United Nations Development Programme.

El Turno Escolar 29
United Nations Development Programme (2000). Human development report: Human rights and human development. Paris: United Nations Development Programme. Vegas, E., & Petrow, J. (2007). Raising student learning in Latin America: The challenge for the 21st century. Washington, DC: The World Bank.
Valenzuela, J. S., & Valenzuela, A. (1998). Modernization and dependency: Alternative
perspectives in the study of Latin American underdevelopment. In M. A. Seligson & J. T. Passe-Smith (Eds.), Development and underdevelopment: The political economy of global inequity (pp. 263-276). Boulder, CO: Lynne Reinner Publishers.
Wigley, S., & Akkoyunlu-Wigley, A. (2006). Human capabilities versus human capital: Gauging the value of education in developing countries. Social Indicators Research, 78, 287-304.

El Turno Escolar 30
Figures
Figure 1. Literacy means and confidence intervals of 3rd grade Mexican children by
turno escolar (school shift) categories, 2005-2006

El Turno Escolar 31
Figure 2. Literacy means and confidence intervals of 3rd grade Mexican children by
dichotomous turno escolar (school shift) categories, 2005-2006
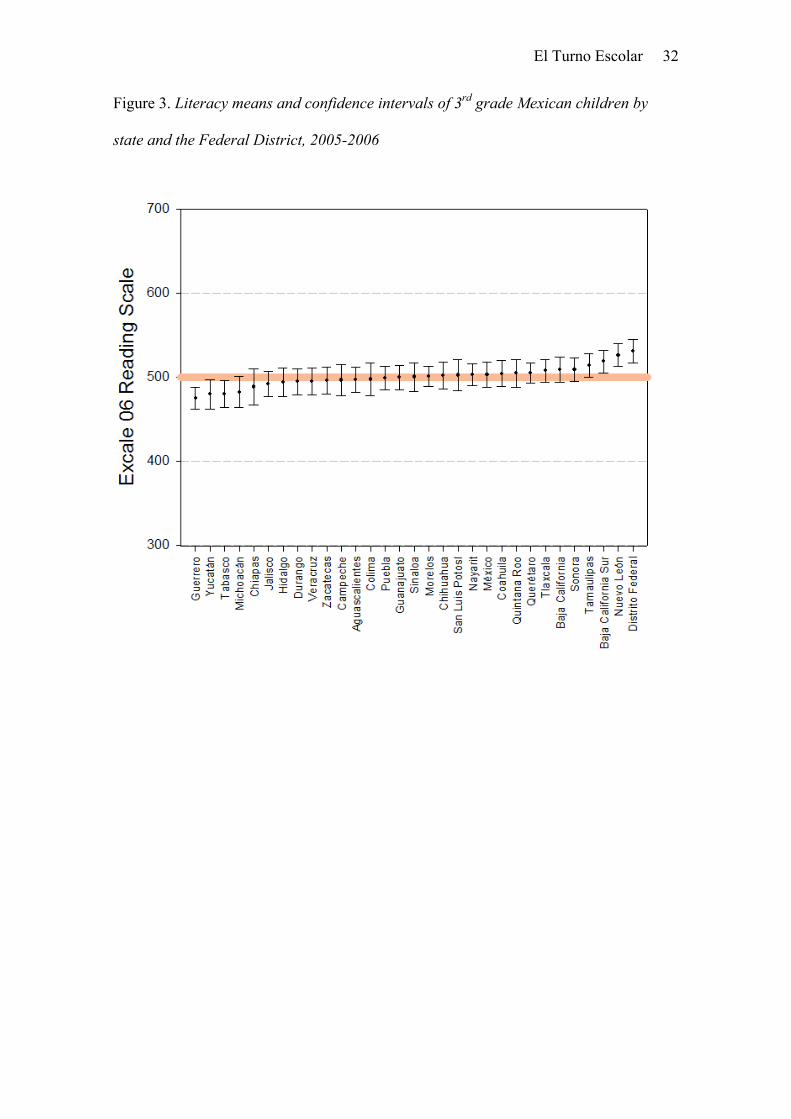
El Turno Escolar 32
Figure 3. Literacy means and confidence intervals of 3rd grade Mexican children by
state and the Federal District, 2005-2006

El Turno Escolar 33
Figure 4. Literacy means and confidence intervals of 3rd grade Mexican children by
turno escolar within state and the Federal District, 2005-2006

El Turno Escolar 34
Figure 5. Literacy means and confidence intervals of 3rd grade Mexican children by
school modality, 2005-2006

El Turno Escolar 35
Figure 6. Literacy means and confidence intervals of 3rd grade Mexican children by
turno escolar within school modality, 2005-2006

El Turno Escolar 36
Tables
Table 1. Third Grade Literacy Scores in Mexico by Turno Escolar Categories, 2005-
2006
Turno n % n N % N Mean score Standard deviation
Mean S.E. S.D. S.E. National 16563 100.0 2399355 100.0 500 (2.1) 100 (1.3) matutino 13809 83.4 1918884 80.0 504 (2.3) 100 (1.3) vespertino 2287 13.8 418080 17.4 489 (5.0) 97 (2.6) nocturno 11 0.1 2314 0.1 478 (37.1) 110 (36.2) discontinuo 444 2.7 59727 2.5 475 (10.6) 96 (4.0) mixto 12 0.1 350 0.0 556 (26.1) 84 (21.1)

El Turno Escolar 37
Table 2. Third Grade Literacy Scores and Mean Comparisons in Mexico by
Dichotomous Turno Escolar Categories, 2005-2006
Turno n % n N % N Mean scoreStandard deviation Mean ∆ C.I.
Mean S.E. S.D. S.E. National 16563 100.0 2399355 100.0 500 (2.1) 100 (1.3) matutino 13809 83.4 1918884 80.0 505 (2.3) 100 (1.4) 18.7 8.4 no matutino 2754 16.6 480471 20.0 486 (4.3) 98 (2.8) 29.1

El Turno Escolar 38
Table 3. Third Grade Literacy Scores in Mexico by State, 2005-2006
State n % n N % N Mean score Standard deviation
Mean S.E. S.D. S.E. National 16563 100.0 2399355 100.0 500 (2.1) 100 (1.3) Aguascalientes 546 3.3 25286 1.1 497 (7.7) 97 (5.3) Baja California 614 3.7 64192 2.7 509 (7.6) 101 (4.2)
Baja California Sur 541 3.3 10899 0.5 518 (6.9) 100 (4.7)
Campeche 472 2.8 18058 0.8 496 (9.4) 100 (5.9) Coahuila 531 3.2 54809 2.3 504 (7.9) 101 (4.3) Colima 512 3.1 11657 0.5 497 (9.8) 100 (5.6) Chiapas 532 3.2 135309 5.6 488 (11.1) 106 (7.1) Chihuahua 608 3.7 73542 3.1 501 (8.2) 99 (5.2) Distrito Federal 445 2.7 157058 6.5 531 (7.1) 99 (5.0) Durango 543 3.3 36148 1.5 494 (7.9) 99 (8.0) Guanajuato 455 2.7 123919 5.2 499 (7.4) 102 (6.5) Guerrero 493 3.0 94423 3.9 474 (6.6) 92 (5.6) Hidalgo 563 3.4 57106 2.4 494 (8.5) 100 (3.5) Jalisco 524 3.2 147472 6.1 492 (7.6) 102 (5.4) México 511 3.1 297041 12.4 502 (7.6) 93 (4.6) Michoacán 559 3.4 101094 4.2 482 (9.4) 104 (9.3) Morelos 621 3.7 35343 1.5 501 (6.2) 98 (3.0) Nayarit 483 2.9 21200 0.9 502 (6.7) 98 (4.4) Nuevo León 512 3.1 84506 3.5 526 (7.0) 101 (4.9) Puebla 652 3.9 133774 5.6 499 (7.1) 102 (5.5) Querétaro 521 3.1 38697 1.6 505 (6.2) 101 (5.4) Quintana Roo 590 3.6 28508 1.2 504 (8.3) 100 (4.9) San Luis Potosí 533 3.2 58612 2.4 502 (9.4) 96 (4.8) Sinaloa 510 3.1 59624 2.5 500 (8.7) 103 (4.5) Sonora 530 3.2 52077 2.2 509 (7.3) 98 (4.3) Tabasco 434 2.6 48788 2.0 480 (8.1) 91 (4.9) Tamaulipas 529 3.2 64013 2.7 514 (7.3) 103 (4.7) Tlaxcala 589 3.6 28782 1.2 507 (7.0) 102 (5.3) Veracruz 553 3.3 168496 7.0 495 (8.4) 95 (4.9) Yucatán 643 3.9 36888 1.5 479 (8.8) 99 (4.1) Zacatecas 414 2.5 31726 1.3 496 (8.2) 97 (5.4)

El Turno Escolar 39
Table 4. Third Grade Literacy Scores and Mean Comparisons in Mexico by
Dichotomous Turno Escolar Categories within State, 2005-2006
State Turno n % n N % N Mean score Standard deviation
Mean ∆ C.I.
Mean S.E. SD SE National 16563 100.0 2399355 100.0 500 (2.1) 100 (1.3) Aguascalientes matutino 471 86.3 19879 78.6 495 (6.4) 95 (5.3) 6.8 -58.6 no matutino 75 13.7 5407 21.4 502 (32.5) 104 (15.2) 72.2 Baja Calif. matutino 466 75.9 42700 66.5 527 (7.2) 100 (5.1) 49.8 22.1 no matutino 148 24.1 21492 33.5 477 (13.6) 94 (7.2) 77.4 Baja Calif. Sur matutino 453 83.7 8475 77.8 527 (6.5) 100 (4.5) 36.6 -4 no matutino 88 16.3 2424 22.2 490 (17.8) 95 (9.5) 77.3 Campeche matutino 394 83.5 14861 82.3 498 (9.2) 98 (6.0) 8.9 -30 no matutino 78 16.5 3197 17.7 489 (18.2) 105 (11.8) 47.8 Coahuila matutino 421 79.3 43074 78.6 513 (10.0) 100 (5.8) 30.8 -3.8 no matutino 110 20.7 11735 21.4 482 (14.9) 98 (7.3) 65.5 Colima matutino 406 79.3 8682 74.5 504 (9.7) 97 (4.0) 18.7 -24.9 no matutino 106 20.7 2975 25.5 485 (20.4) 102 (15.6) 62.3 Chiapas matutino 351 66.0 99950 73.9 509 (13.3) 108 (8.7) 72.7 34.9 no matutino 181 34.0 35359 26.1 437 (13.5) 87 (7.3) 110.5 Chihuahua matutino 424 69.7 53279 72.4 500 (8.6) 100 (5.6) 4.3 -22.3 no matutino 184 30.3 20263 27.6 504 (12.9) 98 (8.8) 30.9 Distrito Fed. matutino 352 79.1 116837 74.4 535 (9.3) 102 (5.5) 16.2 -18.3 no matutino 93 20.9 40221 25.6 519 (14.9) 90 (10.3) 50.6 Durango matutino 401 73.8 29382 81.3 501 (7.1) 96 (5.9) 27.6 -22.1 no matutino 142 26.2 6766 18.7 473 (25.1) 106 (18.9) 77.4 Guanajuato matutino 352 77.4 98629 79.6 501 (9.7) 102 (8.9) 10.2 -19 no matutino 103 22.6 25290 20.4 491 (11.7) 100 (8.2) 39.5 Guerrero matutino 457 92.7 84699 89.7 474 (7.4) 93 (6.2) 3.9 -39.9 no matutino 36 7.3 9724 10.3 478 (21.1) 82 (14.8) 47.7 Hidalgo matutino 558 99.1 53393 93.5 493 (8.4) 100 (3.6) n/a n/a no matutino 5 0.9 3713 6.5 n/a n/a n/a n/a n/a Jalisco matutino 425 81.1 105084 71.3 494 (8.2) 92 (4.6) 10.2 -36 no matutino 99 18.9 42388 28.7 484 (20.1) 120 (8.6) 56.4 México matutino 415 81.2 234164 78.8 508 (10.3) 98 (5.3) 19.1 -14.5 no matutino 96 18.8 62877 21.2 489 (12.7) 80 (10.0) 52.7 Michoacán matutino 469 83.9 83281 82.4 485 (10.1) 104 (11.2) 18.0 -35.4 no matutino 90 16.1 17813 17.6 467 (25.4) 96 (13.4) 71.5 Morelos matutino 520 83.7 27738 78.5 509 (7.7) 99 (2.7) 40.9 9.7 no matutino 101 16.3 7605 21.5 468 (12.7) 85 (7.4) 72.2 Nayarit matutino 431 89.2 17699 83.5 500 (7.3) 97 (5.2) 7.5 -18.2 no matutino 52 10.8 3501 16.5 508 (11.7) 98 (11.2) 33.3 Nuevo León matutino 447 87.3 61857 73.2 535 (9.7) 100 (5.1) 45.5 13.3 no matutino 65 12.7 22649 26.8 489 (11.9) 97 (9.3) 77.7 Puebla matutino 580 89.0 120046 89.7 504 (8.1) 101 (5.9) 15.1 -49.2 no matutino 72 11.0 13728 10.3 488 (28.3) 104 (15.3) 79.5 Querétaro matutino 400 76.8 30544 78.9 516 (7.8) 99 (5.6) 36.9 1.8 no matutino 121 23.2 8153 21.1 479 (14.1) 98 (9.6) 72.1 Quintana Roo matutino 445 75.4 19157 67.2 503 (6.6) 99 (6.2) 7.3 -34.6 no matutino 145 24.6 9351 32.8 510 (20.9) 103 (10.1) 49.2 San Luis Pot. matutino 466 87.4 50151 85.6 504 (8.2) 98 (5.9) 5.9 -39.3

El Turno Escolar 40
no matutino 67 12.6 8461 14.4 498 (23.9) 85 (11.9) 51.1 Sinaloa matutino 455 89.2 46941 78.7 506 (7.9) 104 (4.6) 27.8 -28.4 no matutino 55 10.8 12683 21.3 478 (27.8) 96 (10.3) 83.9 Sonora matutino 386 72.8 40767 78.3 523 (8.6) 100 (6.1) 35.8 8.6 no matutino 144 27.2 11310 21.7 487 (10.2) 88 (7.8) 62.9 Tabasco matutino 406 93.5 44007 90.2 484 (7.5) 92 (4.9) 40.3 1.7 no matutino 28 6.5 4781 9.8 443 (17.1) 72 (10.9) 79 Tamaulipas matutino 456 86.2 48488 75.7 526 (6.1) 101 (4.2) 52.3 11.8 no matutino 73 13.8 15525 24.3 473 (20.8) 97 (12.0) 92.7 Tlaxcala matutino 513 87.1 24640 85.6 514 (7.6) 103 (5.2) 20.9 -23 no matutino 76 12.9 4142 14.4 493 (19.8) 98 (13.9) 64.9 Veracruz matutino 493 89.2 142715 84.7 493 (8.9) 93 (3.7) 5.4 -64.3 no matutino 60 10.8 25781 15.3 498 (32.7) 102 (20.0) 75 Yucatán matutino 607 94.4 31086 84.3 478 (7.6) 100 (4.3) 18.8 -40.7 no matutino 36 5.6 5802 15.7 497 (31.2) 88 (20.2) 78.3 Zacatecas matutino 389 94.0 29136 91.8 499 (8.9) 97 (5.4) n/a n/a no matutino 25 6.0 2590 8.2 n/a n/a n/a n/a n/a
n/a – not made available – data suppressed due to small sample size (n < 30) and inflated standard errors associated with computed estimates

El Turno Escolar 41
Table 5. Third Grade Literacy Scores in Mexico by School Modality, 2005-2006
n % n N % N Mean score Standard Deviation
Mean SE SD SE National 16563 100.0 2399355 100.0 500 (2.1) 100 (1.3) Urbanas Públicas 6987 42.2 1479702 61.7 501 (2.8) 98 (1.5) Rurales Públicas 3841 23.2 553948 23.1 479 (3.3) 94 (3.4) Educación Indígena 1628 9.8 144793 6.0 453 (5.0) 90 (3.9) Cursos Comunitarios 326 2.0 22374 0.9 530 (7.4) 107 (5.0) Privadas 3781 22.8 198538 8.3 571 (4.0) 99 (2.7)

El Turno Escolar 42
Table 6. Mexico 3rd Grade Literacy Scores and Mean Comparisons by Turno within
Modality
Modality Turno n %n N %N Mean score Standard deviation
Mean ∆ C.I.
Mean S.E. S.D. S.E. National 16563 100.0 2399355 100.0 500 (2.1) 100 (1.3) Urbanas Púb matutino 4966 71.1 1081622 73.1 507 (3.6) 97 (1.8) 15.4 2.9 no matutino 2021 28.9 398080 26.9 492 (4.8) 98 (2.9) 27.9 Rurales Púb matutino 3585 93.3 515983 93.1 480 (3.9) 94 (3.4) 14.1 -10.7 no matutino 256 6.7 37965 6.9 466 (11.8) 84 (10.0) 38.9 Educ Indígena matutino 1232 75.7 103651 71.6 457 (4.9) 89 (4.4) 20.0 -3.6 no matutino 396 24.3 41142 28.4 437 (11.5) 88 (6.5) 43.7 Cursos Comu matutino 303 92.9 20927 93.5 531 (8.0) 107 (5.1) n/a n/a no matutino 23 7.1 1447 6.5 n/a n/a n/a n/a n/a Privadas matutino 3723 98.5 196701 99.1 571 (3.7) 99 (2.6) 12.8 -39.0 no matutino 58 1.5 1837 0.9 558 (26.6) 94 (9.3) 64.5
n/a – not made available – data suppressed due to small sample size (n < 30) and inflated standard errors associated with computed estimates

El Turno Escolar 43
Table 7. Coefficient estimates associated with hierarchal linear models
Null Model Model 1 Model 2 ß SE p ß SE p ß SE p Intercept 501.6* 2.7 0.000 487.9* 4.9 0.000 492.4* 4.6 0.000School Shift matutino 17.4* 5.7 0.005 13.9* 6.4 0.037Sch Modality rural -33.1* 14.1 0.026 educ ind -28.7 13.1 0.064 cc 33.3 19.9 0.100 private 77.4* 19.1 0.001Interactions rural*matutino 12.3 15.17 0.420 Edu ind*matutino -16.2 10.6 0.143 cc*matutino -9.7 25.5 0.705 Private*matutino -18.2 20.7 0.399
*significant at the .05 level

El Turno Escolar 44
Table 8. Variance Components and effect sizes associated with hierarchal linear models
Variance
Component SD p R2 Null Model Student 7548.2 86.9 School 2276.4* 47.7 0.000 State 147.5* 12.1 0.000 Model 1 Student 7555.2 86.9 School 2143.2* 46.3 0.000 0.059 State 316.4* 17.8 0.000 School Shift Effect by State 392.2* 19.8 0.000 Model 2 Student 7616.4 87.3 School 1432.3* 37.8 0.000 0.371 State 261.0* 16.2 0.000 Rural Effect by State 361.9* 19.0 0.000 Private Effect by State 458.0* 21.4 0.001 School Shift Effect by State 392.2* 19.8 0.000
*significant at the .05 level

El Turno Escolar 45
Table 9. Mexico 3rd Grade Literacy Scores and Mean Comparisons by Turno, Modality, and State
State Modality Turno n %n N %N Mean score Stand. Dev. Mean ∆ C.I Mean S.E. S.D. S.E. National 16563 100.0 2399355 100.0 500 (2.1) 100 (1.3) Aguascalientes Urb Púb matutino 188 73.2 12585 70.9 487 (8.7) 92 (6.0) 12.9 -58.3 non-matutino 69 26.8 5166 29.1 500 (33.7) 104 (16.5) 84.1 Rur Púb matutino 144 96.0 4679 95.1 474 (10.3) 85 (9.8) n/a n/a non-matutino 6 4.0 241 4.9 n/a n/a n/a n/a n/a Edu Ind matutino 0 0.0 0 0.0 non-matutino 0 0.0 0 0.0 Cur Com matutino 2 100.0 47 100.0 n/a n/a n/a n/a non-matutino 0 0.0 0 0.0 Priv matutino 137 100.0 2568 100.0 575 (15.8) 90 (6.2) non-matutino 0 0.0 0 0.0 Baja California Urb Púb matutino 179 59.9 30169 60.5 522 (8.3) 97 (7.1) 47.3 18.7 non-matutino 120 40.1 19732 39.5 474 (14.4) 93 (8.1) 76.0 Rur Púb matutino 144 83.7 4876 77.5 500 (14.5) 93 (7.5) 20.0 -71.3 non-matutino 28 16.3 1418 22.5 520 (43.6) 93 (11.6) 111.4 Edu Ind matutino 5 100.0 1230 80.8 n/a n/a n/a n/a non-matutino 0 0.0 292 19.2 Cur Com matutino 5 100.0 243 100.0 n/a n/a n/a n/a non-matutino 0 0.0 0 0.0 Priv matutino 133 100.0 6182 99.2 591 (15.0) 96 (6.2) non-matutino 0 0.0 50 0.8 Baja Calif Sur Urb Púb matutino 208 75.6 6105 73.3 528 (7.9) 98 (6.0) 39.4 -4.6 non-matutino 67 24.4 2227 26.7 489 (18.8) 94 (10.0) 83.3 Rur Púb matutino 114 90.5 1573 94.4 498 (15.5) 95 (10.2) n/a n/a non-matutino 12 9.5 94 5.6 n/a n/a n/a n/a n/a Edu Ind matutino 0 0.0 0 0.0 non-matutino 0 0.0 0 0.0 Cur Com matutino 0 0.0 1 1.5

El Turno Escolar 46
non-matutino 0 0.0 64 98.5 Priv matutino 131 93.6 796 95.3 576 (12.3) 101 (8.3) n/a n/a non-matutino 9 6.4 39 4.7 n/a n/a n/a n/a n/a Campeche Urb Púb matutino 143 66.5 8264 74.3 508 (13.3) 92 (8.6) 10.5 -29.0 non-matutino 72 33.5 2861 25.7 498 (17.7) 104 (14.3) 50.0 Rur Púb matutino 125 95.4 5018 93.7 476 (15.0) 99 (12.8) n/a n/a non-matutino 6 4.6 336 6.3 n/a n/a n/a n/a n/a Edu Ind matutino 2 100.0 541 100.0 n/a n/a n/a n/a non-matutino 0 0.0 0 0.0 Cur Com matutino 1 100.0 135 100.0 n/a n/a n/a n/a non-matutino 0 0.0 0 0.0 Priv matutino 123 100.0 903 100.0 572 (12.2) 102 (10.8) non-matutino 0 0.0 0 0.0 Coahuila Urb Púb matutino 159 61.4 32243 73.8 508 (13.2) 97 (8.1) 25.5 -13.3 non-matutino 100 38.6 11472 26.2 483 (15.3) 98 (7.4) 64.2 Rur Púb matutino 118 92.2 5405 95.4 471 (12.8) 82 (10.8) n/a n/a non-matutino 10 7.8 263 4.6 n/a n/a n/a n/a n/a Edu Ind matutino 0 0.0 0 0.0 non-matutino 0 0.0 0 0.0 Cur Com matutino 2 100.0 132 100.0 n/a n/a n/a n/a non-matutino 0 0.0 0 0.0 Priv matutino 142 100.0 5294 100.0 584 (8.4) 97 (7.7) non-matutino 0 0.0 0 0.0 Colima Urb Púb matutino 164 61.7 6330 68.2 503 (12.3) 92 (5.2) 16.9 -28.0 non-matutino 102 38.3 2958 31.8 486 (20.6) 102 (15.7) 61.8 Rur Púb matutino 120 96.8 1388 98.8 476 (13.9) 97 (9.9) n/a n/a non-matutino 4 3.2 17 1.2 n/a n/a n/a n/a n/a Edu Ind matutino 0 0.0 0 0.0 non-matutino 0 0.0 0 0.0 Cur Com matutino 0 0.0 60 100.0 non-matutino 0 0.0 0 0.0 Priv matutino 122 100.0 904 100.0 554 (17.4) 109 (9.8) non-matutino 0 0.0 0 0.0

El Turno Escolar 47
Chiapas Urb Púb matutino 133 85.8 40194 87.1 540 (24.2) 108 (13.3) n/a n/a non-matutino 22 14.2 5979 12.9 n/a n/a n/a n/a n/a Rur Púb matutino 90 100.0 39979 99.4 488 (21.6) 108 (14.5) non-matutino 0 0.0 257 0.6 Edu Ind matutino 64 28.7 11897 29.0 463 (16.1) 88 (12.3) 31.2 -12.1 non-matutino 159 71.3 29090 71.0 431 (13.5) 86 (8.3) 74.4 Cur Com matutino 63 100.0 5516 100.0 526 (18.3) 99 (11.4) non-matutino 0 0.0 0 0.0 Priv matutino 1 100.0 2364 98.6 n/a n/a n/a n/a non-matutino 0 0.0 33 1.4 Chihuahua Urb Púb matutino 192 71.9 41366 73.8 493 (9.7) 98 (6.7) 19.7 -13.5 non-matutino 75 28.1 14687 26.2 512 (16.0) 93 (13.0) 52.8 Rur Púb matutino 89 74.8 6574 73.6 507 (16.4) 101 (16.8) 17.4 -53.2 non-matutino 30 25.2 2356 26.4 490 (28.9) 108 (15.6) 87.9 Edu Ind matutino 12 14.1 403 13.2 n/a n/a n/a n/a n/a n/a non-matutino 73 85.9 2648 86.8 469 (15.1) 95 (10.3) n/a Cur Com matutino 0 0.0 103 18.9 non-matutino 6 100.0 441 81.1 n/a n/a n/a n/a Priv matutino 131 100.0 4833 97.4 553 (15.3) 95 (9.9) non-matutino 0 0.0 131 2.6 Distrito Federal Urb Púb matutino 206 69.6 82326 67.5 510 (9.7) 94 (6.8) 8.4 -26.6 non-matutino 90 30.4 39567 32.5 519 (14.9) 90 (10.4) 43.4 Rur Púb matutino 11 100.0 1012 72.1 n/a n/a n/a n/a non-matutino 0 0.0 391 27.9 Edu Ind matutino 0 0.0 0 0.0 non-matutino 0 0.0 0 0.0 Cur Com matutino 0 0.0 3 12.5 non-matutino 3 100.0 21 87.5 n/a n/a n/a n/a Priv matutino 135 100.0 33496 99.3 595 (12.8) 95 (7.3) non-matutino 0 0.0 242 0.7 Durango Urb Púb matutino 139 85.8 17127 79.8 509 (10.9) 94 (8.0) n/a n/a non-matutino 23 14.2 4334 20.2 n/a n/a n/a n/a n/a Rur Púb matutino 122 92.4 10385 95.4 476 (10.0) 91 (10.0) n/a n/a

El Turno Escolar 48
non-matutino 10 7.6 499 4.6 n/a n/a n/a n/a n/a Edu Ind matutino 13 11.6 142 9.9 n/a n/a n/a n/a n/a n/a non-matutino 99 88.4 1298 90.1 483 (11.8) 86 (10.2) n/a Cur Com matutino 0 0.0 0 0.0 non-matutino 10 100.0 635 100.0 n/a n/a n/a n/a Priv matutino 127 100.0 1728 100.0 572 (17.3) 97 (13.7) non-matutino 0 0.0 0 0.0 Guanajuato Urb Púb matutino 118 56.5 50047 70.1 496 (16.5) 99 (8.2) 2.8 -39.1 non-matutino 91 43.5 21298 29.9 494 (12.8) 105 (8.7) 44.8 Rur Púb matutino 96 89.7 37120 90.6 485 (14.8) 95 (16.5) n/a n/a non-matutino 11 10.3 3870 9.4 n/a n/a n/a n/a n/a Edu Ind matutino 0 0.0 153 97.5 non-matutino 0 0.0 4 2.5 Cur Com matutino 10 90.9 565 91.9 n/a n/a n/a n/a n/a n/a non-matutino 1 9.1 50 8.1 n/a n/a n/a n/a n/a Priv matutino 128 100.0 10744 99.4 578 (11.2) 101 (7.8) non-matutino 0 0.0 68 0.6 Guerrero Urb Púb matutino 123 81.5 33938 80.4 475 (11.2) 84 (5.4) n/a n/a non-matutino 28 18.5 8268 19.6 n/a n/a n/a n/a n/a Rur Púb matutino 118 95.9 29592 96.4 485 (13.8) 101 (14.4) n/a n/a non-matutino 5 4.1 1120 3.6 n/a n/a n/a n/a n/a Edu Ind matutino 175 98.3 16724 98.1 444 (9.3) 76 (5.5) n/a n/a non-matutino 3 1.7 322 1.9 n/a n/a n/a n/a n/a Cur Com matutino 40 100.0 1754 100.0 608 (23.9) 129 (11.9) non-matutino 0 0.0 0 0.0 Priv matutino 1 100.0 2691 99.5 n/a n/a n/a n/a non-matutino 0 0.0 14 0.5 Hidalgo Urb Púb matutino 174 97.2 20114 86.0 502 (13.0) 96 (6.3) n/a n/a non-matutino 5 2.8 3278 14.0 n/a n/a n/a n/a n/a Rur Púb matutino 109 100.0 21141 98.5 485 (16.4) 97 (7.9) non-matutino 0 0.0 320 1.5 Edu Ind matutino 120 100.0 7435 98.5 446 (15.8) 95 (10.2) non-matutino 0 0.0 115 1.5

El Turno Escolar 49
Cur Com matutino 17 100.0 1023 100.0 n/a n/a n/a n/a non-matutino 0 0.0 0 0.0 Priv matutino 138 100.0 3680 100.0 573 (11.4) 96 (8.1) non-matutino 0 0.0 0 0.0 Jalisco Urb Púb matutino 157 64.3 66822 63.6 481 (11.3) 88 (6.9) 7.6 -46.3 non-matutino 87 35.7 38205 36.4 489 (22.0) 121 (9.5) 61.4 Rur Púb matutino 93 88.6 19163 83.0 486 (14.9) 80 (11.2) n/a n/a non-matutino 12 11.4 3936 17.0 n/a n/a n/a n/a n/a Edu Ind matutino 7 100.0 1000 100.0 n/a n/a n/a n/a non-matutino 0 0.0 0 0.0 Cur Com matutino 11 100.0 596 100.0 n/a n/a n/a n/a non-matutino 0 0.0 0 0.0 Priv matutino 157 100.0 17503 98.6 553 (12.7) 96 (6.5) non-matutino 0 0.0 247 1.4 México Urb Púb matutino 164 64.3 160767 73.5 510 (14.0) 98 (7.5) 17.1 -23.4 non-matutino 91 35.7 57852 26.5 493 (14.4) 79 (10.4) 57.6 Rur Púb matutino 132 96.4 43994 90.2 474 (13.8) 81 (7.7) n/a n/a non-matutino 5 3.6 4756 9.8 n/a n/a n/a n/a n/a Edu Ind matutino 5 100.0 2978 97.0 n/a n/a n/a n/a non-matutino 0 0.0 91 3.0 Cur Com matutino 8 100.0 660 98.7 n/a n/a n/a n/a non-matutino 0 0.0 9 1.3 Priv matutino 106 100.0 25765 99.3 566 (16.0) 97 (10.9) non-matutino 0 0.0 169 0.7 Michoacán Urb Púb matutino 92 62.6 38628 71.7 484 (15.3) 98 (11.6) 15.9 -37.7 non-matutino 55 37.4 15232 28.3 468 (27.0) 96 (14.7) 69.4 Rur Púb matutino 77 100.0 30589 95.4 479 (23.2) 115 (25.1) non-matutino 0 0.0 1475 4.6 Edu Ind matutino 148 85.1 3471 81.1 455 (13.0) 88 (8.8) n/a n/a non-matutino 26 14.9 808 18.9 n/a n/a n/a n/a n/a Cur Com matutino 14 100.0 1170 100.0 n/a n/a n/a n/a non-matutino 0 0.0 0 0.0 Priv matutino 138 93.9 9423 96.9 523 (10.5) 90 (7.7) n/a n/a

El Turno Escolar 50
non-matutino 9 6.1 298 3.1 n/a n/a n/a n/a n/a Morelos Urb Púb matutino 210 74.7 19413 74.2 501 (10.4) 97 (4.2) 32.3 -4.6 non-matutino 71 25.3 6763 25.8 469 (14.2) 82 (8.7) 69.1 Rur Púb matutino 154 83.7 5031 86.3 487 (11.1) 90 (6.3) 25.0 -22.1 non-matutino 30 16.3 799 13.7 462 (26.6) 108 (18.8) 72.1 Edu Ind matutino 3 100.0 82 65.6 n/a n/a n/a n/a non-matutino 0 0.0 43 34.4 Cur Com matutino 5 100.0 141 100.0 n/a n/a n/a n/a non-matutino 0 0.0 0 0.0 Priv matutino 148 100.0 3071 100.0 592 (10.9) 87 (6.8) non-matutino 0 0.0 0 0.0 Nayarit Urb Púb matutino 129 76.3 9547 75.9 499 (10.0) 90 (6.8) 15.3 -10.5 non-matutino 40 23.7 3037 24.1 515 (12.0) 95 (11.1) 41.1 Rur Púb matutino 86 87.8 5377 92.1 484 (16.1) 99 (15.2) n/a n/a non-matutino 12 12.2 464 7.9 n/a n/a n/a n/a n/a Edu Ind matutino 103 100.0 1545 100.0 501 (14.4) 102 (9.3) non-matutino 0 0.0 0 0.0 Cur Com matutino 4 100.0 238 100.0 n/a n/a n/a n/a non-matutino 0 0.0 0 0.0 Priv matutino 109 100.0 992 100.0 577 (16.0) 101 (9.7) non-matutino 0 0.0 0 0.0 Nuevo León Urb Púb matutino 216 81.2 44946 68.4 526 (12.4) 98 (6.8) 40.7 3.7 non-matutino 50 18.8 20717 31.6 485 (12.2) 97 (9.3) 77.7 Rur Púb matutino 90 94.7 6588 78.0 545 (17.7) 100 (12.8) n/a n/a non-matutino 5 5.3 1860 22.0 n/a n/a n/a n/a n/a Edu Ind matutino 0 0.0 0 0.0 non-matutino 0 0.0 0 0.0 Cur Com matutino 0 0.0 93 100.0 non-matutino 0 0.0 0 0.0 Priv matutino 141 93.4 10230 99.3 567 (13.8) 102 (8.8) n/a n/a non-matutino 10 6.6 72 0.7 n/a n/a n/a n/a n/a Puebla Urb Púb matutino 131 67.9 63886 82.8 515 (13.5) 97 (9.5) 26.6 -46.5 non-matutino 62 32.1 13247 17.2 488 (28.4) 104 (15.4) 99.7

El Turno Escolar 51
Rur Púb matutino 158 100.0 33975 98.8 468 (11.5) 92 (6.8) non-matutino 0 0.0 402 1.2 Edu Ind matutino 159 94.1 11854 99.4 480 (10.6) 99 (12.4) n/a n/a non-matutino 10 5.9 71 0.6 n/a n/a n/a n/a n/a Cur Com matutino 12 100.0 712 100.0 n/a n/a n/a n/a non-matutino 0 0.0 0 0.0 Priv matutino 120 100.0 9619 99.9 580 (16.3) 99 (7.5) non-matutino 0 0.0 8 0.1 Querétaro Urb Púb matutino 107 49.3 13281 66.1 528 (15.9) 98 (7.0) 44.7 -0.3 non-matutino 110 50.7 6810 33.9 483 (14.3) 102 (12.2) 89.8 Rur Púb matutino 148 93.1 10820 90.8 465 (9.4) 74 (8.8) n/a n/a non-matutino 11 6.9 1091 9.2 n/a n/a n/a n/a n/a Edu Ind matutino 3 100.0 1120 92.6 n/a n/a n/a n/a non-matutino 0 0.0 90 7.4 Cur Com matutino 8 100.0 486 100.0 n/a n/a n/a n/a non-matutino 0 0.0 0 0.0 Priv matutino 134 100.0 4837 96.8 604 (11.1) 89 (6.4) non-matutino 0 0.0 162 3.2 Quintana Roo Urb Púb matutino 181 61.6 12470 59.0 501 (7.4) 93 (7.6) 13.2 -28.8 non-matutino 113 38.4 8649 41.0 515 (21.2) 102 (11.0) 55.3 Rur Púb matutino 133 80.6 3727 86.8 458 (11.7) 84 (6.8) 18.2 -46.6 non-matutino 32 19.4 569 13.2 440 (31.9) 89 (18.8) 83.1 Edu Ind matutino 3 100.0 584 81.5 n/a n/a n/a n/a non-matutino 0 0.0 133 18.5 Cur Com matutino 1 100.0 86 100.0 n/a n/a n/a n/a non-matutino 0 0.0 0 0.0 Priv matutino 127 100.0 2290 100.0 599 (14.2) 94 (7.1) non-matutino 0 0.0 0 0.0 San Luis Potosí Urb Púb matutino 105 68.6 21102 73.9 519 (14.4) 94 (9.5) 18.4 -30.8 non-matutino 48 31.4 7435 26.1 501 (26.7) 88 (13.2) 67.7 Rur Púb matutino 105 96.3 19985 96.0 485 (14.4) 94 (13.3) n/a n/a non-matutino 4 3.7 823 4.0 n/a n/a n/a n/a n/a Edu Ind matutino 118 88.7 3368 95.0 451 (13.0) 92 (8.8) n/a n/a

El Turno Escolar 52
non-matutino 15 11.3 177 5.0 n/a n/a n/a n/a n/a Cur Com matutino 27 100.0 1106 100.0 n/a n/a n/a n/a non-matutino 0 0.0 0 0.0 Priv matutino 111 100.0 4590 99.4 563 (17.2) 102 (7.9) non-matutino 0 0.0 26 0.6 Sinaloa Urb Púb matutino 175 79.5 25317 69.7 502 (10.3) 99 (6.5) 27.0 -37.2 non-matutino 45 20.5 11016 30.3 475 (31.3) 96 (11.8) 91.2 Rur Púb matutino 125 92.6 15830 90.7 492 (17.0) 106 (8.9) n/a n/a non-matutino 10 7.4 1623 9.3 n/a n/a n/a n/a n/a Edu Ind matutino 3 100.0 353 100.0 n/a n/a n/a n/a non-matutino 0 0.0 0 0.0 Cur Com matutino 16 100.0 799 94.8 n/a n/a n/a n/a non-matutino 0 0.0 44 5.2 Priv matutino 136 100.0 4642 100.0 577 (14.7) 92 (7.3) non-matutino 0 0.0 0 0.0 Sonora Urb Púb matutino 157 55.9 28650 72.7 525 (10.3) 95 (9.7) 37.8 8.0 non-matutino 124 44.1 10750 27.3 487 (10.3) 88 (7.9) 67.5 Rur Púb matutino 99 100.0 6466 94.0 494 (13.7) 91 (10.1) non-matutino 0 0.0 410 6.0 Edu Ind matutino 10 100.0 820 91.4 n/a n/a n/a n/a non-matutino 0 0.0 77 8.6 Cur Com matutino 1 100.0 50 100.0 n/a n/a n/a n/a non-matutino 0 0.0 0 0.0 Priv matutino 119 85.6 4781 98.5 577 (15.0) 101 (11.6) n/a n/a non-matutino 20 14.4 73 1.5 n/a n/a n/a n/a n/a Tabasco Urb Púb matutino 149 84.2 17499 79.5 502 (10.0) 94 (8.7) 58.6 16.4 non-matutino 28 15.8 4519 20.5 443 (17.1) 72 (10.9) 100.8 Rur Púb matutino 129 100.0 22239 99.0 466 (11.7) 84 (8.4) non-matutino 0 0.0 219 1.0 Edu Ind matutino 4 100.0 1318 96.8 n/a n/a n/a n/a non-matutino 0 0.0 43 3.2 Cur Com matutino 6 100.0 367 100.0 518 (46.5) 73 (22.3) non-matutino 0 0.0 0 0.0

El Turno Escolar 53
Priv matutino 118 100.0 2584 100.0 541 (14.9) 95 (8.8) non-matutino 0 0.0 0 0.0 Tamaulipas Urb Púb matutino 224 75.4 36239 70.5 525 (7.5) 93 (4.5) 51.6 11.7 non-matutino 73 24.6 15172 29.5 473 (20.8) 97 (12.0) 91.6 Rur Púb matutino 127 100.0 7702 95.9 497 (12.2) 107 (8.9) non-matutino 0 0.0 326 4.1 Edu Ind matutino 0 0.0 0 0.0 non-matutino 0 0.0 0 0.0 Cur Com matutino 4 100.0 362 95.8 n/a n/a n/a n/a non-matutino 0 0.0 16 4.2 Priv matutino 101 100.0 4185 99.7 593 (20.7) 118 (9.4) non-matutino 0 0.0 11 0.3 Tlaxcala Urb Púb matutino 173 69.5 16131 80.5 524 (10.6) 100 (6.6) 30.3 -17.9 non-matutino 76 30.5 3897 19.5 493 (19.8) 98 (13.9) 78.5 Rur Púb matutino 177 100.0 5560 97.1 475 (12.6) 94 (10.0) non-matutino 0 0.0 164 2.9 Edu Ind matutino 4 100.0 388 83.1 n/a n/a n/a n/a non-matutino 0 0.0 79 16.9 Cur Com matutino 4 100.0 220 100.0 n/a n/a n/a n/a non-matutino 0 0.0 0 0.0 Priv matutino 155 100.0 2341 99.9 551 (12.4) 99 (8.2) non-matutino 0 0.0 2 0.1 Veracruz Urb Púb matutino 114 70.4 63137 75.8 512 (15.5) 97 (8.0) 2.0 -77.6 non-matutino 48 29.6 20205 24.2 514 (35.7) 107 (17.3) 81.6 Rur Púb matutino 88 97.8 57876 91.6 467 (12.1) 76 (8.1) n/a n/a non-matutino 2 2.2 5278 8.4 n/a n/a n/a n/a n/a Edu Ind matutino 145 100.0 12666 98.9 476 (12.8) 94 (12.0) non-matutino 0 0.0 135 1.1 Cur Com matutino 35 100.0 2107 100.0 526 (24.3) 115 (15.1) non-matutino 0 0.0 0 0.0 Priv matutino 111 91.7 6929 97.7 560 (11.8) 90 (9.2) n/a n/a non-matutino 10 8.3 163 2.3 n/a n/a n/a n/a n/a

El Turno Escolar 54
Yucatán Urb Púb matutino 227 95.4 21053 81.4 473 (11.0) 97 (5.6) n/a n/a non-matutino 11 4.6 4798 18.6 n/a n/a n/a n/a n/a Rur Púb matutino 141 92.8 5373 89.3 458 (11.9) 92 (10.2) n/a n/a non-matutino 11 7.2 643 10.7 n/a n/a n/a n/a n/a Edu Ind matutino 126 92.0 1958 92.2 458 (11.5) 83 (7.9) n/a n/a non-matutino 11 8.0 165 7.8 n/a n/a n/a n/a n/a Cur Com matutino 0 0.0 167 100.0 non-matutino 3 100.0 0 0.0 n/a n/a n/a n/a Priv matutino 113 100.0 2702 98.9 574 (19.3) 100 (8.5) non-matutino 0 0.0 29 1.1 Zacatecas Urb Púb matutino 129 83.8 14214 88.5 509 (13.4) 94 (6.8) n/a n/a non-matutino 25 16.2 1844 11.5 n/a n/a n/a n/a n/a Rur Púb matutino 123 100.0 12625 94.4 475 (12.1) 92 (9.0) non-matutino 0 0.0 746 5.6 Edu Ind matutino 0 0.0 0 0.0 non-matutino 0 0.0 0 0.0 Cur Com matutino 7 100.0 546 100.0 n/a n/a n/a n/a non-matutino 0 0.0 0 0.0 Priv matutino 130 100.0 1751 100.0 578 (17.5) 94 (8.2) non-matutino 0 0.0 0 0.0 12.9 -58.3 n/a – not made available – data suppressed due to small sample size (n < 30) and inflated standard errors associated with computed estimates