A Mirage - Indo-Global Social Service Society
476
Assessment of Swachh Bharat Abhiyan and SWM Rules 2016: Wastepickers Perspective Across India A Mirage The Alliance of Indian Waste-pickers
-
Upload
khangminh22 -
Category
Documents
-
view
4 -
download
0
Transcript of A Mirage - Indo-Global Social Service Society

Assessment of Swachh Bharat Abhiyan and SWM Rules 2016: Wastepickers Perspective Across India
A Mirage
The Alliance of Indian Waste-pickers


Credits
AuthorsPinky Chandran, Sandya Narayanan, Dr. Umashankar Subramanian, from the Solid Waste Management Round Table (SWMRT), Bengaluru
Book DesignRadhika Motani
PhotographsPinky Chandran
For CitationA MIRAGEAssessment of Swachh Bharat Abhiyan and SWM Rules 2016: Waste pickers Perspective Across India, September 2019
Published by: The Alliance of Indian Waste-pickers

A MirageAssessment of Swachh Bharat Abhiyan and SWM Rules 2016:
Wastepickers Perspective Across India
September 2019
Prepared by:
Solid Waste Management Round Table ( SWMRT), Bengaluru
Commissioned by:
The Alliance of Indian Waste-pickers

Contents8 Abbreviations
12 Operational Definitions
14 List of Tables 14 List of Figures 16 List of Boxes 17 List of Photographs 21 Preface 23 Acknowledgement
27 Chapter 1: Introduction to the Study on the Status of Wastepickers in India
1.1. Objectives
1.2. Conceptual Framework of the Study
1.3. Study Methodology
1.4. Limitations of the Study
1.5. Structure of the Report

37 Chapter 2: Literature Review relevant to Wastepickers and Waste Practices
2.1 Existing Legislations, Policies and other Government
Orders, Documents, Reports
2.2 Conclusion
57 Chapter 3: Results and Findings of the Survey 3.1 Socio Demographics
3.2 Waste Practices
3.3 Social Security
3.4 Knowledge and Perception
117 Chapter 4: Evaluating the perception & practices through Focus Group Discussions
4.1 FGD Methodology
4.2 FGD Limitations
4.3 FGD Findings
4.4 Overall Impressions
4.5 Other Observations
129 Chapter 5: Presenting City Status of waste practices and inclusion of waste pickers through Case Studies
5.1 Mysuru
5.2 Patna
5.3 Gurugram
5.4 Indore
5.5 Shillong
197 Chapter 6:Drawing Conclusions 219 Chapter 7: Recommendations 229 Endnotes 231 Works Cited 247 About the Authors 249 Annexures 1
452 Annexures 2
463 Annexures 3

8
AbbreviationsADB: Asian Development Bank
AICTSL: Atal Indore City Transport Service Ltd.
AIW: Alliance of Indian Wastepickers
ALF: Area Level Federation
AusAID: Australian AID
Bio-CNG: Bio Compressed Natural Gas
BOT: Build-operate- Transfer
BMC: Bombay Municipal Corporation
BPL: Below Poverty Line
BSPCB: Bihar State Pollution Control Board
BUIDCO: Bihar Urban Infrastructure Development Corporation
CBO: Community Based Organisation
CCEA: Cabinet Committee on Economic Affairs
CDP: City Development Plan
CEPI: Comprehensive Environmental Pollution Index
CHF: Cooperative Housing Foundation
CHO: Chief Health Officer
CIG: Common Interest Group
CII: Confederation of Indian Industry
CITB: City Improvement Trust Board ( CITB)
CLC: City Livelihoods Centre
CLF: City Level Federation
CMMU: City Mission Management Unit
CPA: Critically Polluted Area
CPCB: Central Pollution Control Board
CPHEEO: Central Public Health and Environmental Engineering Organisation
CSE: Centre for Science and Environment
CSP: City Sanitation Plan
CRP: Community Resource Person
DAY-NULM: Deendayal Antyodaya Yojana- National Urban Livelihoods Mission
DBRC: Dalit Bahujan Resource Centre
DLF: Delhi Land and Finance
DMC: Delhi Metropolitan Region
DPR: Detailed Project Report
DR: Doctor
DRCC: Dry Resource Collection Center
DTDC: Door to Door Collection
DWCC: Dry Waste Collection Centers
EIA: Environmental Impact Assessment
EDP: Entrepreneurship Development Program
EPR: Extended Producers Responsibilities
ESC: Empowered Standing Committee
ESI: Employees State Insurance

9
ESTP: Employment through Skills Training and Placement
FGD: Focus Group Description
GAP: Gender Action Plan
GIZ: Deutsche Gesellschaft für Internationale Zusammenarbeit
GoI: Government of India
GOK: Government of Karnataka
GPS: Global Positioning System
GSM: Global System for Mobile Communications
HDPEHigh-density polyethylene
HPEC: High Powered Expert Committee
HSIDC: Haryana State Infrastructure Development Corporation
HUDA: Haryana Urban Development Authority
IB: Itinerant Buyers
ICON SWM: International Conference on Sustainable Waste Management
ID Cards: Identity Cards
IEC: Information Education and Communication
IEBCC: Information, Education and Behavior Change Communication
IGSSs: Indo Global Social Service Society
IL & FS Infrastructure Leasing & Financial Services
IMC: Indore Municipal Corporation
INR: Indian Rupees
ISWM: Integrated Solid Waste Management
IWP: Informal Waste Pickers
JNNURM: Jawaharlal Nehru National Urban Renewal Mission
JUSCO: Jamshedpur Utility Services Company Limited
KKPKP: Kagad Kach Patra Kashtakari Panchayat
KMC: Karnataka Municipal Corporation
MBO: Member based organisation
MCC: Municipal Corporation of Chandigarh
MCC: Mysore City Corporation
MCF: Municipal Council of Faridabad
MCG: Municipal Council of Gurgaon
MCT: Municipal Corporation Tirupati
MEAL: Meghalaya Environment Active Legislators
MFF: Multitranche Financing Facility
MM Act : Meghalaya Municipal Act
MIS: Management Information Systems
MoEF & CC: Ministry of Environment, Forests and Climate Change
MoHUA: Ministry of Housing and Urban Affairs
M oSJ & E: Ministry of Social Justice and Empowerment
MoUD: Ministry of Urban Development
MNRE: Ministry of New and Renewable Energy
MPSPCB: Madhya Pradesh State Pollution Control Board
MRC: Material Recovery Centre
MRF: Material Recovery Facility

10
MSW: Municipal Solid Waste
MUDA: Mysore Urban Development Authority
NAPCC : National Action Plan for Climate Change
NDMC: New Delhi Municipal Council
NDTV: New Delhi Television Limited
NEP: National Environment Policy
NEERI: National Environmental and Engineering Research Institute
NERCCDIP: North Eastern Regional Capital City Development Investment Programme
NGO: Nongovernmental organisation
NGT: National Green Tribunal
NITI: National Institution for Transforming India,
MIUA: National Instuite of Urban Affairs
NMMC: Navi Mumbai Municipal Corporation
NOS: National Occupational Standards
NSDC: National Skill Development Corporation
NSDM: National Skill Development Mission
NSKFDC: National Safai Karamacharis Finance Development Corporation
NSPL: Nidan Swacchdhara Private Limited
NSQC: National Skills Qualifications Committee
NULM: National Urban Livelihood Mission
ODF: Open Defecation Free
OHSAS: Occupational Health and Safety Assessment Series
O & M: Operations and Maintenance
OWC: Organic Waste Convetor
PCA Act: Prevention of Cruelty to Animals, Act
PCC: Plastic Collection Centre
PET: Polyethylene terephthalate
PF: Provident Fund
PIB: Press Information Bureau
PMC: Pune Municipal Corporation
PMKVY: Pradhan Mantri Kaushal Vikas Yojana
PPE: Personal Protective Equipment
PPPs: Public Private Partnerships
PPT: Power Point Presentation
PtMC: Patna Municipal Corporation
PWM Rules: Plastic waste Management Rules
RDF: Refuse Derived Fuel
RPL: Recognition of Prior Learning
RTE: Right to Education
SALAH: Social Action for Literacy and Health
SBA: Swachh Bharat Abhiyan
SBM ( U): Swachh Bharat Mission ( Urban)
SC: Scheduled Caste
SCA: State Channelising Agencies
SCC: Smart City Challenge

11
SCGJ: Sector Councils for Green Jobs
SEP: Self-Employment Programme
SHEL: Sunil Hi Tech Engineers Limited
SHG: Self Help Group
SIPMIU: State Investment Planning Management and Implementation Unit
SLB: Service Level Benchmarking
SLA: State Level Advisory
SMEC: Snowy Mountains Engineering Corporation
SMS: Stree Mukti Sanghatana
SPCB: State Pollution Control Board
SPV: Special Purpose VehicleSS: Swachh Survekshan
ST: Scheduled Tribe
SWM: Solid Waste Management
SWMRT : Solid Waste Management Roundtable
SWM Rules: Solid Waste Management Rules 2016
TPD: Tons Per Day
UDD: Urban Development Department
ULB: Urban Local Bodies
UT: Union Territory
VGF Viability Gap Funding
WIEGO: Women in Informal Employment Globalizing and Organizing
WTE: Waste to Energy
YUVA Youth for Unity and Volunatary Action
ZWM: Zero Waste Management

12
Operational DefinitionsDoor- to-door Collection
"Door to door collection" means collection of solid waste from the door step of households, shops, commercial establishments, offices , institutional or any other nonresidential premises and includes collection of such waste from entry gate or a designated location on the ground floor in a housing society , multi storied building or apartments , large residential, commercial or institutional complex or premises;. ( SWM Rules 2016)
Dump Sites “Dump sites” means a land utilised by local body for disposal of solid waste without following the principlesof sanitary land filling; ( SWM Rules 2016)
E-Waste
Electronic Waste
Garbage pile/HeapsMeans an accumulation of garbage/trash in the middle of the neighbourhood or market
Group D work Includes technical and non-technical posts ( List as per the Railways)
Informal waste collector “Informal waste collector” includes individuals, associations or waste traders who are involved in sorting, sale and purchase of recyclable materials; ( SWM Rules 2016)
Itinerant Buyer Itinerant buyers are those who purchase small quantities ofscrap from households, offices, shops and other small commercialestablishment ( Draft National Policy for Ensuring Decent Livelihoods in the Recycling Industry August 2008)
Materials recovery facility
“Materials recovery facility” (MRF) means a facility where non-compostable solid waste can be temporarily stored by the local body or any other entity mentioned in rule 2 or any person or agency authorised by any of them to facilitate segregation, sorting and recovery of recyclables from various components of waste by authorised informal sector of waste pickers, informal recyclers or any other work force engaged by the localbody or entity mentioned in rule 2for the purpose before the waste is delivered or taken up for its processing or disposal; ( SWM Rules 2016)
13
Secondary storage
"Secondary storage" means the temporary containment of solid waste after collection at secondary waste storage depots or MRFs or bins for onward transportation of the waste to the processing or disposal facility; ( SWM Rules 2016)
Transfer station “Transfer station” means a facility created to receive solid waste from collection areas and transport in bulk in covered vehicles or containers to waste processing and, or, disposal facilities; (SWM Rules 2016)
“Waste picker” “Waste picker” means a person or groups of persons informally engaged in collection and recovery of reusable and recyclable solid waste from the source of waste generation the streets, bins, material recovery facilities, processing and waste disposal facilities for sale to recyclers directly or through intermediaries to earn their livelihood. ( SWM Rules 2016)
Waste sorter A person or a group of persons engaged in the process of sorting waste by category, type, kind and within that stream could be engaged in secondary sorting

14
List of TablesTable No 3.1.1: City wise Distribution of RespondentsTable No 3.1.2: Socio demographics of the Respondents
List of Figures1.1: Conceptual Framework of the Study
3.1.1: City wise Number of Respondents
3.1.2: Distribution of respondents according to type of waste picker
3.1.3: City wise distribution of respondents and type of waste picker
3.1.4: Overall Distribution of Respondents Age Group
3.1.5 : City wise Distribution of Respondents and Age Group (years)
3.1.6: Overall Distribution of Respondents according to Gender
3.1.7: City wise distribution of respondents and Gender
3.1.8: Overall Distribution of Respondents and Social Distribution
3.1.9: City wise Distribution of respondents and Social Distribution
3.1.10: Distribution of respondents based on type of waste picker
and Social Distribution
3.1.11: Overall Distribution of Respondents and Religion
3.1.12: City wise distribution of respondents and religion
3.1.13: Overall Distribution of Respondents and Family Type
3.1.14: City wise Distribution of Respondents and Family Type
3.1.15: Distribution of respondents and place of residence
3.1.16: City wise distribution (percentage) of place of residence
3.1.17: Distribution of residence and area of dwelling
3.1.18: City wise distribution of residence and area of dwelling
3.1.19: Distribution of respondents and mobile phone use
3.1.20: City wise distribution of respondents and type of mobile phone use
3.1.21: Distribution of respondents and land ownership
3.1.22: City wise distribution of respondents and land ownership
3.1.23: Distribution of respondents and main source of income
3.1.24: City wise distribution of respondents and main source of income
3.1.25: Distribution of respondents according to their monthly household
income (INR)
3.1.26: City wise distribution of respondents and monthly household
income (INR)
3.1.27: Distribution of type of waste pickers and household monthly income
3.1.28: Distribution of respondents according to household monthly income
(INR) from waste collection
3.1.29: City wise respondents and household monthly income (INR) from
waste collection /sorting
3.1.30: Distribution of repondents according to type of water picker and
monthly income (INR) from waste collection

15
3.1.31: Repondents and possesion of Identity card
3.1.32: Distribution of respondents and posession of Identity card
3.1.33: Distribution of respondents with bank account
3.1.34: City wise distribution of respondents with bank account
3.1.35: Distribution of respondents and type of bank account
3.1.36: City wise distribution of respondents and type of bank account
3.1.37: Distribution of type of waste pickers and of bank account
3.1.38: Distribution of type of waste picker and account in bank (type)
3.1.39: Distribution of respondents(percent) and Self Help Group
3.1.40: City wise distribution of respondent who are part of SHG
3.1.41: Distribution of respondents according type of waster picker and SHG
3.1.42: Part of SHG and type of waste picker
3.1.43: Distribution of respondents and loan
3.1.44: Source of loan
3.1.45: City wise percent of respondents availed loan
3.1.46: Distribution of respondents basedon source of loan and type of waste picker
3.1.47: Purpose of loan
3.1.48: Health issues due to waste collection (percent)
3.1.49: Type of health issues due to waste collection
3.2.1: Distribution of respondents and number of years in waste collection
3.2.2: Distribution of respondents and number of years in waste collection
3.2.3: Distribution of respondents and type of waste they collect
3.2.4: Distribution of respondents and mode of collection
3.2.5: Distribution of respondents (percent) according to place of waste collection
3.2.6: General time of waste collection
3.2.7: Distribution of respondents (responses) and time of waste colleciton
3.2.8: Type of waste picker and time of waste collection
3.2.9: Reason of collecting waste in specific time
3.2.10: City Wise distribution of respondents and reason for specific time of waste
collection
3.2.11: Number of respondents store waste
3.2.12: Storage of waste collection
3.2.13: Type of waste picker and place of storage
3.2.14: Distribution of respondents and place of waste soritng
3.2.15: Place of selling waste
3.2.16: Distribution of respondents based on employer
3.2.17: Distribution of respondents according to their association with NGO/MBO/
Trade union
3.2.18: City wise respondents associated with NGO/MBO/Trade union
3.2.19: Distribution of respondents associated with Municipality
3.2.20: Distribution of respondents and association with municipality
3.2.21: Type of waste picker and association with municipality
16
3.2.22: Respondents (%) associated with municipality and badge/ID card
3.3.1 : Access to health facility
3.3.2: Access to educational facility
3.3.3: Type of Health Insurance possessed
3.3.4: Type of educational facility received
3.3.5 : Benefits received by respondents through NGO/MBO
3.3.6: Reason for choice of waste picking as an occupation
3.4.1: Knowledge of SBA
3.4.2: City wise respondents and knowledge of SBA
5: Map of India – cities profiled for Case studies
5.1.1: Quantity of MSW Generated in the City
7.2.1.d - 1: Bangalore’s Material Value Flow Chain
7.2.1.d-2 : Value Chain Interrupted
List of Boxes1.1: Legislations and other Committees Reports on contribution of wastepickers and
recommendations for integration
1.2: Categorisation of Cities
2.1: Excerpt from Chapter 2: Section
2.2: Swachh Bharat Mission Manual on Municipal Solid Waste Management
2.2: Excerpt from Swachh Survekshan 2017
4.1: Gender wise participation in Numbers
4.2: FGD Respondent Quote 13-Shillong
4.3: FGD Respondent Quote 1- Shillong
4.4: FGD Respondent Quote 4- Guntur
5.1.1: Fast Facts of Mysuru
5.2.1: Fast Facts of Patna
5.2.2: Quote- r. R K Sinha on Patna
5.2.3: Data submitted to the Smart City Challenge
5.3.1: Fast Facts of Gurugram
5.3.2: Observations and informal interview by authors
6.1.B: Where do wastepickers pick in Indore and Mysore
6.3 : Status of Integration
6.3.c: Status of inclusion based on indication
6.4: Benefits from SBA and Perception of SBA
7.2.1: Examples of identification of the Informal Recycling Value Chain and Snap Shot
of Requirements
17
List of PhotographsPhoto 1: Cover Image: A Waste picker at the Material Recovery facility, Indore, India
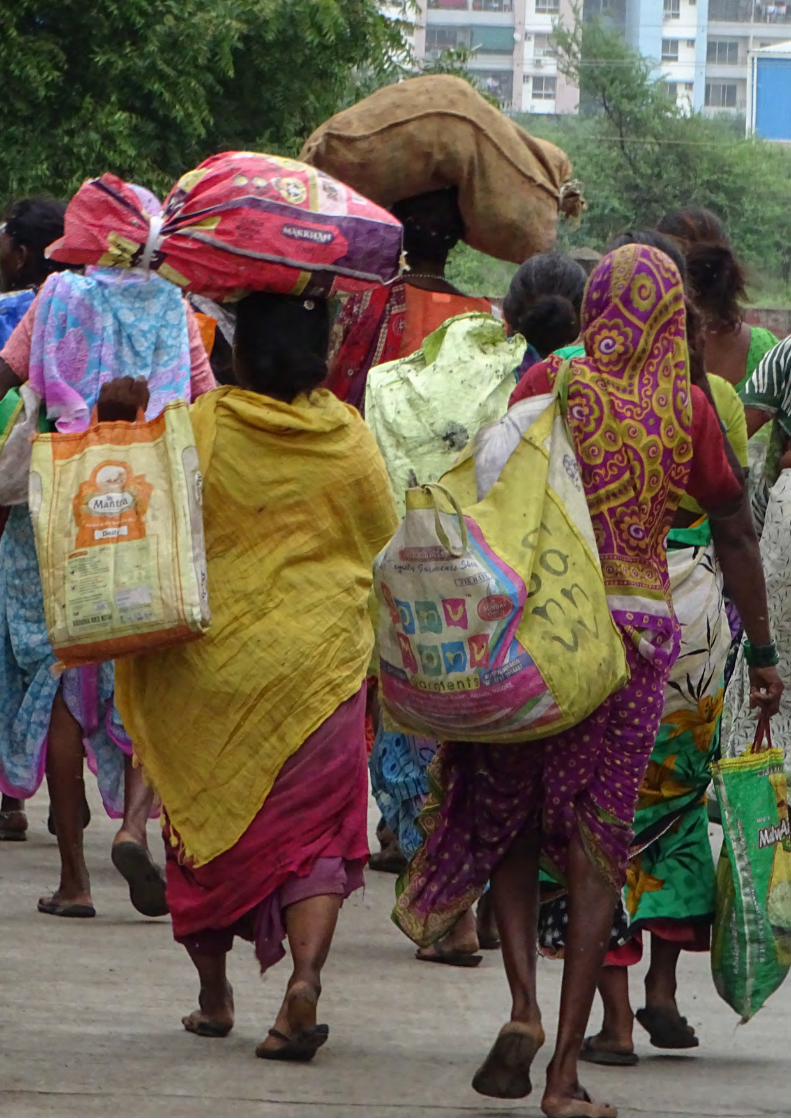
Photo 2: Wastepickers at Pune, India
Photo 3: Swachh Bharat Hoarding at Chamrajpura, Mysuru, India
Photo 4: Waste Collection Area, outside Sindhi Colony, Chembur, Mumbai, India
Photo 5: Recycling Station managed by VRecycle at Benaulim, Goa, India
Photo 6: Wastepickers at the Deoguradia Landfill, Indore, India
Photo 7: Segregated Dry Waste at the waste pickers colony, Mysuru, India
Photo 8: Bailed PET, Rangpuri, New Delhi, India
Photo 9: FGD participants: Members from Iainehskhem Self-Help Group, Shillong
along with Georgina Jarman Lamare, Community Project Coordinator and Pinky
Chandran ( Research Team)
Photo 10: FGD Participants from Panchkula, Haryana in Bengaluru, India
Photo 11: FGD Participants – Indore, India
Photo 12: Western Express Highway, Vile Parle East, Mumbai, India
Photo 13 a: Waste Picker Colony, Mysuru, India
Photo 13 b: MSW Processing Unit- O&M by IL&FS Environmental Infrastructure &
Services Ltd, Vidyaranyapura, Mysuru, India
Photo 13 c: Zero Waste Management Unit Ward no 28, Mysuru, India
Photo 13 d: Waste picker Collection Cycle, Mysuru
Photo 13 e: Waste Picker Colony, Mysuru, India
Photo 13 f: Photo Collage - From left to right Waste Collection Vehicle ( Blue for Dry
Waste , Green for Wet Waste), Dry waste for secondary recycling at waste picker
colony, dry waste at the zero waste ward. Extreme Right: Dry Waste Collection Center,
Mysuru
Photo 14 a: Street near Budh Murti Kadam Kun, Patna
Photo 14 b: Patna Nagar Nigam Waste Collection Cart
Photo 14 c: Wastepickers – Waste Collection Cart, Patna
Photo 14 d: Dry waste for secondary recycling at waste picker colony, Patna
Photo 14 e: Photo Collage: From top centre: Informal Waste workers at Daldali Rpad,
Golambar; Extreme left: Segregated waste at FCI Colony, Kaliket Nagar, Danapur,
Bihar , Field staff from Nidan
Photo 15 a : Informal waste collector at Sector 24, Gurugram
Photo 15 b: A dumpyard behind DLF Cyber City, Phase 2, Gurugram
Photo 15 c: Wastepicker Colony in Gurugram
Photo 15 d: Mixed Paper bailed for secondary processing at the informal recycling
cluster, Gurugram
Photo 15 e: Photo Collage - Informal recycling at the wastepicker colony
Photo 16 a: Housing Colony, Indore

18
Photo 16 b: Devguradia Landfill Bioremediation Green Belt Site
Photo 16 c: One of the Hosuing Colonies, Post Eviction, at Vaibhav Nagar
Photo 16 d: Plastic Collection Centre (PCC) , Deoguradia, Indore
Photo 16 e: Wastepickers at the Deoguradia, MRF
Photo 16 f: Transfer Station at I T Park, Davv Takshila Parisar, Indore
Photo 16 g: Devguradia Landfill Bioremediation Site
Photo 16 h: Photo Collage (Left to Right)
Waste Worker at the PCC, Deoguradia, Municipal worker at the Transfer Station
at IT Park, Davv Takshila Parisar, Transfer Station Capsule at IT Park, the facility at
Deoguradia, Scrap Dealer’s Collection
Photo 17a: Itinerant Buyer at Shillong
Photo 17 b: Sign Board at Shillong
Photo 17 c: The Landfill Marten Mawlai, Shillong
Photo 17 d: The Compost Unit managed the SHG, Shillong
Photo 17 e: A waste picker at the landfill site, Shillong
Photo 17 f: Photo Collage: Glimpses from the landfill Marten Mawlai, Shillong
Photo 18: Mixed paper waste, Delhi
Photo 19: Occupational ID Cards Shillong, Mysuru and Indore
Photo 20: Informal recycling at Mahipalpur, New Delhi
Photo 21: PET Bottles ready for secondary segregation
Photo 22: Wastepicker at Pimpri Chinchwod, India
Photo 23: Swatch member composting at an apartment, Pune
Photo 24: Primary Collection Vehicle, Shillong
Photo 25: Blue & Green Dustbins

19

20

21
PrefaceMirage: an optical illusion caused by atmospheric conditions; especially the appearance of a sheet of water in a desert or on a hot road caused by the refraction of light from the sky of heated air.The Oxford Dictionary
“Wastepickers integration”, has become a catchword with policymakers, post the Solid Waste Management Rules 2016, and the introduction of the Swachh Survekshan - a survey to rank cities on various sanitation and cleanliness parameters under Swachh Bharat Mission (Urban) in January 2016. In the race to be number one, are cities being true to the spirit of inclusion and integration, or is it just playing safe and attempting a bureaucratic tick box exercise? Is understanding and interpretation of the Rules and the Rankings uniform across different stakeholders? What is the level of comprehension?
These were some of the questions that needed to be answered among the members of the Alliance of Indian Wastepickers (AIW), an all India Network of organisations working with and for wastepickers empowerment. They approached the Solid Waste Management Roundtable (SWMRT), in May 2018, to conduct a study to assess the perception of the SBA with respect to solid waste management among the wastepickers and suggest appropriate interventions. SWMRT is registered trust consisting of SWM practitioners working towards the cause of sustainable decentralised waste management in Bangalore, since 2009.
Twenty cities were surveyed, and a total of 1869 wastepickers were interviewed by the member organisations of AIW. At SWMRT, we felt that in order to understand wastepickers inclusion into the country’s waste management system, it is essential to go beyond only studying the perception of wastepickers. It was important to also visit a few cities, hold discussions and meetings with partner organisations, wastepickers groups and municipality officials vis-à-vis the SBA Guidelines, SWM Rules 2016 and the Swachh Survekshan.
We also believe that no study of waste pickers can be done without understanding the existing system of dry waste management practices at two levels: The formal system led by the municipality and the way the informal waste sector have been organised around the dry waste collection, outside or complimenting the existing municipal services. The study has aimed to take a holistic view of a city level, particularly those that have been ranked in the top five consistently like Indore and Mysore.
Our journeys through the visits to different cities and our personal experiences of Bengaluru have led us to question if a mirage exists? Embracing a concept “integration of wastepickers” is a long way from actually being implemented in practice. Acceptance is the first step towards change, and there needs to be continued and focused approach to move from “paper” to “participation”. The question also arises if ULB efforts are being retrofitted, to tick the box of becoming the best performing city in the National Rankings of SS? What is it that we are actually

22
seeing? A rising tide (read inclusion) or is it a mirage? What are the new practices and developments that are emerging?
This Report seeks to look past the narratives of the rankings, looks closer at the letter and spirit of the Rules, dwells on the efforts made so far, explores the possible reasons for actions not happening and presents both an overview and a detailed discussion on the realities of the implementation and the present day status of the wastepickers in India.
Pinky Chandran, Sandya Narayanan, Dr Umashankar Subramanian, from the Solid Waste Management Round Table (SWMRT), Bengaluru

23
AcknowledgementsWaste is “complicated” and the term “integration”, is a contested word. As authors, we have found ourselves questioning terminologies, questioning complications and correlations and articulating our understandings. This has been made possible because of the many people who have shared their time, knowledge and practice with us.
And in no particular order we wish to thank Priyanka, Vijaya, Pooja, from Radio Active 90.4 MHz and Tejaswini Thethi for the transcription of the focus group discussions ( FGDs) and the interviews of Mysore and Mumbai respectively.
We are grateful to Dr. Suman Attiwilli, our research assistant for helping out with the presentation of the data analysis. Our deepest gratitude to the Hasiru Dala Team in Bengaluru and Mysore, for agreeing to be a part of the pilot testing at different levels – Survey Design, field testing of sample questionnaires, pre and post the app launch in Bengaluru and the FGD, city tour, interviews with different stakeholders in Mysore. The pilot testing helped us refine our questions, evaluate the feasibility, time and improve upon the study design, while providing with valuable insights.
We would also like to acknowledge the AIW partner organisations Action Aid, Jaipur; Bal Vikas Dhara, Delhi; Dalit Bahujan Resource Centre ( DBRC), Guntur, Tenali and other cities of Andhra Pradesh; Hasiru Dala, Bengaluru, Mysore, Chamrajnagar and Tumkur; Jan Vikas Society, Indore; Kagad Kach Patra Kashtakari Panchayat (KKPKP), Pune; Iainehskhem Self Help Group ( SHG), Shillong; Lok Adhikar, Delhi; Parisar Bhagini Vikas Sangha ( PBVS), Navi Mumbai; Parisar Sakhi Vikas Sangathana ( PSVS), Thane; Samman, Bhopal; SEVA, Nashik; Stree Mukti Sanghatana (SMS), Mumbai, Yavatmal, Wardha; Social Action for Literacy and Health (SALAH), Kalyan and Wainganga Trust, Balaghat for their time in undertaking the field survey.
We are thankful to the team members Hasiru Dala, Jan Vikas Society, Nidan, Sahaas, Chintan- Safai Sena, Bal Vikas Dara, VRecycle, SMS, KKPKP, DBRC, and Iainehskhem SHG Shillong, for facilitating some of the site visits, interviews and focus group discussions and accompanying us, translating, recording and sometimes doubling up as photographers.
We acknowledge the role of Indo Global Social Service Society ( IGSSS) in supporting the research project financially, intellectually and by developing the app for the survey. We are thankful to Women in Informal Employment Globalizing and Organizing (WIEGO) for financially supporting the research project, a special thanks for WIEGO’s Delhi Focus City team for reviewing the first drafts of the report.
Special thank you to Radhika Motani for designing the report.

24
We are extremely grateful to Dr. Manisha Anantharaman, Assistant Professor, Justice, Community and Leadership, St. Mary’s College of California, USA for going beyond just a critical peer review, to picking up on nuances and subtleties.
We were fortunate enough to benefit from the working space provided by Radio Active- Jain University, during the course of the research. We have a special gratitude towards Shakunthala and Kamali from Radio Active-Jain University and Hasiru Dala, for providing us with endless tea/coffees, lunch, snacks and print outs.
We also express our deep appreciation to Kabir Arora and Karishma Lokhandwala, who coordinated this project and all the alliance members.


27
IntroductionSwachh Bharat Abhiyan (SBA) was launched in 2014, as a nationwide campaign with the vision to achieve twin objectives of an Open Defecation Free (ODF) and Clean India. In March 2016, the Ministry of Environment Forests and Climate Change (MoEF & CC) Government of India (GoI), notified the Solid Waste Management (SWM) Rules 2016, & the Plastic Waste Management (PWM) Rules 2016 and in a firsts of sorts acknowledged ‘wastepickers and other informal waste collectors’, by defining them and recognising their role in recycling. Prior to that, the Ministry of Housing and Urban Affairs launched The Swachh Survekshan SS - a survey to rank cities on various sanitation and cleanliness parameters under Swachh Bharat Mission –Urban ( SBM-U) in January 2016, with the aim of promoting healthy competition towards the concept of ‘swachhata’. Within this rating the ULBs are also rated on the Percentage of Informal Waste Pickers formally integrated into Sustainable Livelihoods through Self Help Groups/ Cooperatives/Contractors/NGOs. The 2019 results proudly states 83,898, informal workers across the whole country have been formally integrated into sustainable livelihoods. There have been instances where using the SBA framework the Urban Local Bodies (ULBs) have worked in tandem with waste pickers organizations and ensured their inclusion and there are other instances where it has not.
A step back into history and from anecdotal evidence one sees a pattern of indifference, denial, rejection or ignorance of the existences of wastepickers. As a consequence, wastepickers have been socially and economically marginalised, with low earnings, lack of social status and access to finance, technology or other social security. ( Chikarmane, Dr. Deshpande and Narayan 2001)
SMS in Mumbai, (late eighties), KKPKP in Pune (early nineties), and Chintan in Delhi (early 2000) have spearheaded mobilization of wastepickers for livelihood development, the need for formal recognition and have championed methods of integrating wastepickers into the city’s solid waste collection directly or through partnerships such as SWaCH Cooperative and KKPKP in Pune. Thus began the long struggle, where informal waste workers have been collectively mobilising for rights including:
• Right to Identity and Recognition ( Occupational identity cards)
• Right to Waste ( Access to clean, segregated dry waste)
• Right to Organising (Formation of collectives, Trade unions, cooperatives, SHGs, social enterprises etc.)
• Right to Sorting Spaces ( Earmarking infrastructure spaces in the city)
• Right to Representation ( Governments to ensure that wastepickers are
1

28
consulted and are part of various boards, or committees that make policy or recommendations)
• Right to Training, Capacity Building and Skill Building
• Access to social security ( medical insurance, scholarships for children, access to credit etc) (Chikarmane and Narayan, Rising from the Waste – Organising Wastepickers in India, Thailand and the Philippines 2009)
Over the years, numerous committees, commissions, reports and legislation have acknowledged the contribution of wastepickers and have made recommendations. Refer Box 1:
1995: The Planning Commission constituted a High Power Committee on Solid Waste Management under the Chairmanship of Prof. J.S. Bajaj, Member, Planning Commission, Government of India, 1995,
1999: Recommendations for The Modernization of Solid Waste Management in Class I Cities in India : By Report of The Committee Constituted by The Hon’ble Supreme Court of India
2002: The Report of the Second Indian National Labour Commission-20022006: National Environment Policy 2006,
2008: National Action Plan for Climate Change 2008
2008: The Performance Audit Report on Management of Waste in India submitted by the office of the Comptroller and Auditor General ( CAG) (December 2008)
2008: The Unorganized Workers’ Social Security Act 2008 has several definitions, schemes and acts relevant to the informal waste sector.
2008: The High Powered Expert Committee (HPEC) for estimating the investment requirement for urban infrastructure services set up by the Ministry of Urban Development in May, 2008
2009: The Asian Development Bank (ADB) retained ICRA Management Consulting Services Limited (IMaCS) to develop the Toolkit for implementation of Public Private Partnerships (PPPs) in Municipal Solid Waste Management (MSWM) sector.
2010: Report of the Committee to Evolve Road Map on Management of Wastes in India, MOEF 2010
2010: Report of the committee set up to frame National Sustainable Habitat Standards for the Municipal Solid Waste Management
2010: The Ministry of Urban Development circular dated March 2010 Circular
2011: 2011: E Waste in India, Research Unit (LARRDIS) Rajya Sabha Secretariat, New Delhi , June, 2011, recognising the contribution of the
29
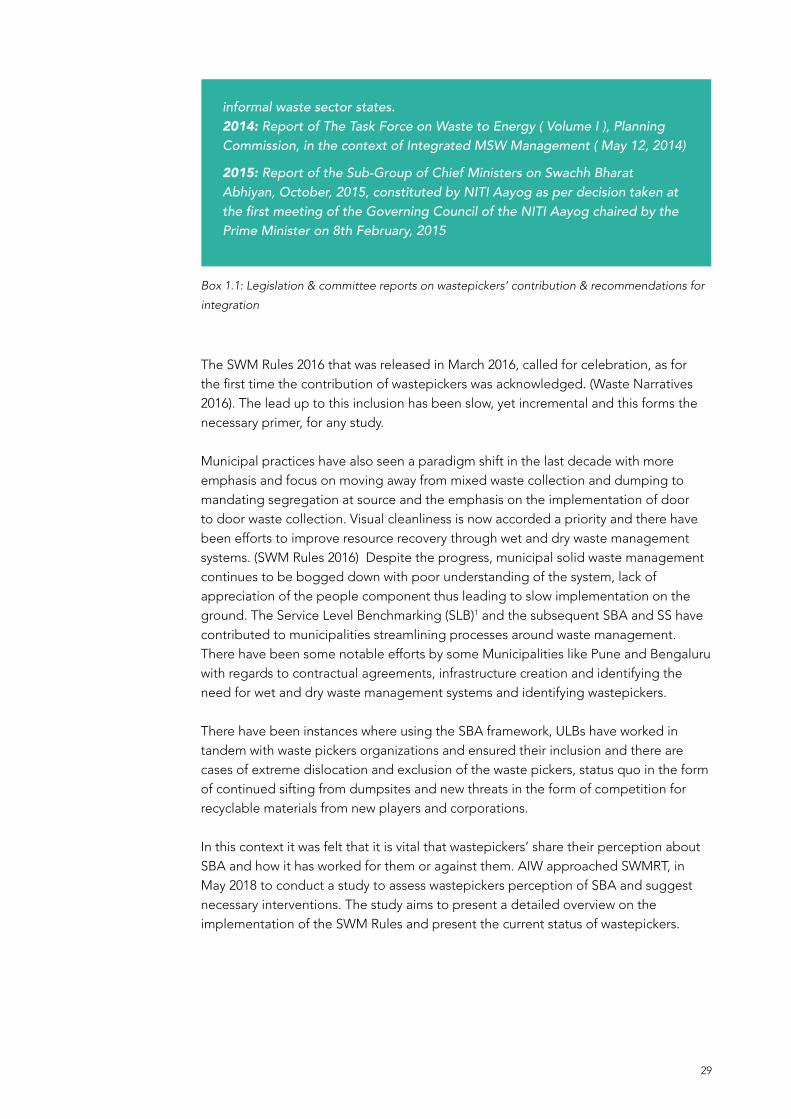
Box 1.1: Legislation & committee reports on wastepickers’ contribution & recommendations for
integration
(Chandran, Arora, et al. 2018)The SWM Rules 2016 that was released in March 2016, called for celebration, as for the first time the contribution of wastepickers was acknowledged. (Waste Narratives 2016). The lead up to this inclusion has been slow, yet incremental and this forms the necessary primer, for any study.
Municipal practices have also seen a paradigm shift in the last decade with more emphasis and focus on moving away from mixed waste collection and dumping to mandating segregation at source and the emphasis on the implementation of door to door waste collection. Visual cleanliness is now accorded a priority and there have been efforts to improve resource recovery through wet and dry waste management systems. (SWM Rules 2016) Despite the progress, municipal solid waste management continues to be bogged down with poor understanding of the system, lack of appreciation of the people component thus leading to slow implementation on the ground. The Service Level Benchmarking (SLB)1 and the subsequent SBA and SS have contributed to municipalities streamlining processes around waste management. There have been some notable efforts by some Municipalities like Pune and Bengaluru with regards to contractual agreements, infrastructure creation and identifying the need for wet and dry waste management systems and identifying wastepickers.
There have been instances where using the SBA framework, ULBs have worked in tandem with waste pickers organizations and ensured their inclusion and there are cases of extreme dislocation and exclusion of the waste pickers, status quo in the form of continued sifting from dumpsites and new threats in the form of competition for recyclable materials from new players and corporations.
In this context it was felt that it is vital that wastepickers’ share their perception about SBA and how it has worked for them or against them. AIW approached SWMRT, in May 2018 to conduct a study to assess wastepickers perception of SBA and suggest necessary interventions. The study aims to present a detailed overview on the implementation of the SWM Rules and present the current status of wastepickers.
informal waste sector states. 2014: Report of The Task Force on Waste to Energy ( Volume I ), Planning Commission, in the context of Integrated MSW Management ( May 12, 2014)
2015: Report of the Sub-Group of Chief Ministers on Swachh Bharat Abhiyan, October, 2015, constituted by NITI Aayog as per decision taken at the first meeting of the Governing Council of the NITI Aayog chaired by the Prime Minister on 8th February, 2015

30
1.1 Objectives of the StudyTwo broad focus areas were identified- waste pickers and waste practices. Under each of them two and three objectives were identified, respectively. The objectives were designed with a focus on assessing the ground realities vis-à-vis the compliance of the Municipalities to the requirements prescribed to them by the SBA and the SWM Rules 2016: a. Perception & Knowledge of Waste pickers on SBA
• To assess the knowledge of SBA among waste pickers
• To assess the perception of SBA among waste pickers
b. Assessment of Waste Practices of the City
• To assess the practice of waste collection and segregation among waste pickers
• To enumerate the factors influencing the practice of waste collection
• To assess the prevalence of informal waste pickers formally integrated into SWM in respective city and India as whole
1.2 Conceptual Framework
The following were identified as necessary in the framework for engagement:
Status of Waste Pickers in India
Variables
Age
Sex
No of years in Waste Collection
Association with organisations
Association with Municipality
Socioeconomic status
Type of waste picker
Municipality actions
Visibility of SBA
Waste Pickers’ Perception of SBA
Bye Laws/ Policies
SWM Processes and Practices
Activities
Survey
FGD
Activities
Secondary data analysis (bye laws, reports)
Activities
Field Visit
Interviews
Variables
Citizen Participation
Strength of AIW member organisations
InfrastructureStatus of implementation of SWM rules
Motivation of Municipality
Figure1.1: Conceptual framework of the study

31
1.3 MethodologyGiven that the aim of the study is to assess waste picker’s perception of SBA and perceptions which include opinions, beliefs and attitudes based on experiences vary, we were of the belief that no single research method can do justice about the nature of perception and hence used the following methods:
Research Method:
• Study Design: Cross Sectional Study
• Data : Qualitative and quantitative
• Both Primary and Secondary Data
Primary
• Formal Survey to gauge wastepickers profile and knowledge of SBA
• Focus Group Discussions with wastepickers on perception and knowledge of SBA
• Site Visits, Photo documentation, in-depth interviews and field observations, to document waste practices.
Secondary
• Desk Review, which includes published research articles, newspaper reports, key legislations – national, state and municipality level.
Process InvolvedTo start with a series of meetings were held to finalize the technical aspects, objectives and methodology of the study with the AIW representatives. AIW was represented by Mr. Kabir Arora and SWMRT was represented by Ms Pinky Chandran, Ms Sandya Narayanan, and Dr Umashankar Subramanian. It was decided that, a cross sectional study shall be undertaken across cities where AIW partner organisations are located, representing North, South, East, Central, West and North East India. Cities were categorised based on the Ministry of Finance, Department of Expenditure 20152 that is, Category X (City with population 50 lakh and above), Category Y (City with population 5 to 50 lakh, Category Z (Cities with Population less than 5 lakh).

32
Category X City Category Y City Category Z City
Bengaluru Vijaywada Chamrajnagar
Mumbai Guntur Shillong
Pune Mysore* Tenali
New Delhi Indore Thane
Bhopal Tumkur
Nagpur Kalyan
Nashik Balaghat
Jaipur Yavatmal
Kolhapur Wardha
Box 1.2: Categorisation of Cities
* Mysore and Mysuru have been used interchangeably throughout the document. The official
name is Mysuru
The sample size for the study was calculated based on size of the city population. The survey was conducted in 22 cities and covered 3800 wastepickers.
Proforma for data collection (survey questionnaire)
A draft proforma for data collection was prepared by the team of SWMRT on the basis of the TOR and objectives agreed on the inception report. Once the questionnaire was designed, a pilot study was conducted with surveyors from Hasiru Dala in June 2018. This helped provide feedback to refine the questionnaire further. It was then sent to AIW for approval, and based on feedback the questions were reduced, keeping in mind the difficulties of surveyors on field.
The final version was sent to IGSSS, to develop an app. The app was tested by SWMRT members and feedback provided. Following that field testing was done with representative members of Hasiru Dala, for feedback and inputs. The final version was then released to members of AIW, with instructions to download and operate. Post the download training for same was provided by respective staff of the AIW organizations to data enumerators.
The proforma consists following sections.
• Identification ( particulars of respondents)
• Informed consent
• Section 1: Household characteristics
• Section 2: Household income and expenditure
• Section 3: Healthcare
• Section 4: Waste collection sorting and Selling
• Section 5: Occupational support and consumables
• Section 6: working condition
33
• Section 7 : Social security and other benefits
• Section 8: Knowledge about SBA
• Section 9 : Perception about SBA
Focus Group Discussions
The purpose of the field visit was to conduct FGD with wastepickers in eight cities (Mysore, Panchkula, Indore, Patna, Guntur, Shillong, Mumbai and Bengaluru)3 to explore the waste picker perception of SBA in depth – to get views and ideas, understand the on ground issue and look at feedback and suggestions for improvements. A pilot FGD was conducted in Mysore on 13th July 2018. This helped refine the questions for the FGD and the one-on-one interviews. The following themes were adopted:
Theme 1: Warm Up and Introductions: Theme 2: AIW member organisation association and thoughts on formal and informal workersTheme 3: Awareness and Perception about SBA Segment 4: Conclusions and Expectations of SBAA total of 199 wastepickers participated in the FGD.
Case Study
Case Study was done with the following objectives:
• To assess the integration and role of Waste Pickers within the Municipality
• To assess the Dry waste Management system set up by the Municipality
This included field observations, one-on-one interviews with key stakeholders and visits wastepickers colonies, dumpsites and other processing units. Five cities have been profiled – Patna, Gurugram, Mysuru, Indore and Shillong.
1.4 Limitations• Not enough verifiable official Swachh Survekshan data was available to do with
enumeration and integration of waste pickers.
• The Municipal officers, who were interviewed, requested that they remain anonymous.
• There were limitations to the survey numbers.
• The survey, though planned to be translated into regional language, was not undertaken. A perception study is very dependent on the surveyors and their understanding of the questions.
• The Survey questionnaire was restricted to waste picker collection and perceptions.

34
1.5 Structure of the ReportThe report contains seven chapters including the introductory and concluding chapters. Chapter two is a literature review of existing studies on waste pickers, waste practices and existing legislations and an understanding of registration and integration.
Chapter three and four is the report of the survey and FGD and consists of the methodology, results and findings of the survey. Chapter five focuses on five case studies- Patna, Gurugram, Mysore, Indore and Shillong. Ch 6 discusses the findings and draws the conclusions. Chapter seven provides specific recommendations for AIW member organisations and for Municipalities on inclusion of wastepickers in SWM functions.

35

37
Literature ReviewThis literature review has been prepared with the two fold objective of supporting the findings and outcomes of this study and to improve our understanding of the deep seated nature of the problems that will have to be addressed by the government if the status of the waste pickers is to be actualised as visualised in the SWM Rules 2016 and the SBA. In line with the objectives to ascertain the status of wastepickers post SBA and SWM Rules 2016, we narrowed down our literature review to a review of all Government legislations, policies, and other government documents between the years 2016 and 2019 with the exception of SBA.
In our initial readings, articles, theses/dissertations, conference proceedings, were looked at, but since most of it focused on the state of wastepickers, need for identity and identity cards and made a case for their inclusion in the SWM Rules, it was decided not to include them. A case in point is the document Untapped Potential: Securing livelihoods dependant on ‘Waste’, which provides a detailed review of the law and policies framework governing the waste and recycling industry. (Madhav 2010). The SWM Rules 2016 clearly acknowledges the term waste pickers, other informal waste collectors and mandates that the municipalities start a scheme for registration of wastepickers. While we acknowledge the body work prior to March 2016, we feel it is important to limit the scope of the review*4.
2.1 Existing Legislations, Policies and Other Government Orders, Documents, ReportsIn this segment we look at the legislations in chronological order from the year 2014, as the SBM sets the tone for this chapter. We have also looked different bye laws prescribing inclusion and integration of wastepickers.
2.1.1 Swachh Bharat MissionLaunched in 2014, the Swachh Bharat Mission put the spotlight on MSW, with twin goals of cleanliness and sanitation. The Guidelines for SBM released by the MoUD, GOI have a mention of special focus groups, urging state governments to pursue the cause of wastepickers:
2
38
2.5.5 In their efforts to streamline and formalize SWM systems it shall be the endeavor of ULBs that the informal sector workers in waste management (rag pickers) are given priority to upgrade their work conditions and are enumerated and integrated into the formal system of SWM in cities. (Chandran, Radio ActiveCR 2019) The guidelines did not provide any concrete guidelines on the workings of this priority focus, leaving the state governments a clear hand in interpretation, design and implementation. It also makes no mention of the need to strengthen the informal recycling industry through the implementation of Extended Producers Responsibility. The guidelines instead incentivise waste to energy and are technological solutions oriented. (Arora 2015)
2.1.2 Plastic Waste Management RulesOn 18th March 2016, the Ministry of Environment, Forest and Climate Change, notified the Plastic Waste Management (PWM) Rules 2016. The rules defined, “waste pickers” as individuals or agencies, groups of individuals voluntarily engaged or authorised for picking of recyclable plastic waste.”, a modification from the Plastic Waste ( Management & Handling ) Rules 2011, which defined wastepickers as individuals or groups of individuals engaged in the collection of plastic waste (MoEF 2011). The emphasis of the 2016 Rules was on the phrase “authorised for picking recyclable plastic waste”. This questions if only those who are authorised can pick plastic waste.
The overall thrust of the rules is on plastic waste minimization, source segregation, recycling, involving waste pickers, recyclers and waste processors in collection of plastic waste fraction either from households or any other source of its generation or intermediate material recovery facility … (PWM Rules 2016) and Section 6 of the PWM Rules states the responsibility of local body is to engage with civil societies or groups working with wastepickers and the Section 8 states the responsibility of waste generator is to handover segregated waste to the ULB or Gram Panchayat or agencies appointed by them or registered wastepickers, recyclers or collection agencies”. While these provisions are good on paper, in reality is leaves a lot of scope for interpretation. Two contentious phrases “segregated waste (plastic)” and “registered waste pickers and recyclers”, goes against the Karnataka High Court directions in December 20155 which states that all wastepickers have first right to waste. In this case to be read as first right to recyclables. Second the responsibility of registration is not explicitly mentioned. It assumes that wastepickers have been registered. Again with recyclers, the onus is with the State Pollution Control Board (SPCB). Rule 13, section states, “Every person recycling or processing waste or proposing to recycle or process plastic waste shall make an application to the State Pollution Control Board or the Pollution Control Committee, for grant of registration or renewal of registration for the recycling unit,”, what it fails to consider are the number of actors before this, that lead up to the recycler. The Form VI- which the State Governments have to submit for the Annual Report asks a question on the number of unregistered Manufacturing or Recycling Units (in residential or unapproved areas), making informal recycling illegal and unauthorised, and thereby criminalising existing operations. What is needed is an appreciation of the informal recycling pyramid and the actors and the need for co-existence as stated in the National Environmental Policy (NEP) that “there should be efforts to give legal recognition to, and strengthen the informal sector systems of collection and recycling of various materials [and] in particular, enhance their access to institutional finance and relevant technologies”. (NEP 2006)

39
2.1.3 Solid Waste Management Rules 2016Municipal Solid Waste Management Rules were revised and published titled SWM Rules 2016, on 8th April 2016. The Rules for the first time recognised the terms “waste pickers” and other “informal waste collectors”. Section 11 of the Rules, states; “The Urban Development Department ( UDD ) will have to prepare State Policy in consultation with stakeholders including representatives of wastepickers, acknowledging the primary role that the entire informal recycling chain plays in managing waste and to provide broad guidelines on integration into the waste management system, including door to door waste. It also states the UUD will have to start a scheme to register wastepickers and waste dealers and to strengthen implementation; they have to constitute a State Level Advisory (SLA) committee that includes representative of wastepickers and other informal recycler and one representative from the recycling industry.
Section 4- Under duties of waste generator, it states; “All resident welfare, market association, gated communities, institutions, bulk generators, hotels and restaurants shall handover segregated recyclable material to authorised wastepickers or recyclers, which is significant step in providing access to waste. Further, Sec 15 again puts the focus on the ULB /Village Panchayats to recognise establish a system to integrate wastepickers and facilitate their participation in SWM, including door to door collection. It states that they must also direct waste generators to hand over segregated waste to authorised wastepickers or waste collectors. A significant clause under 15, ( h) is that directs ULBs to set up material recovery facilities or secondary storage facilities with sufficient space for sorting of recyclable materials to enable informal or authorised waste pickers and waste collectors to separate recyclables from the waste provide easy access to wastepickers and recyclers for collection of segregated recyclable waste such as paper, plastic, metal, glass, textile from the source of generation or from material recovery facilities”. (SWM Rules 2016). This clause in essence recognises informal free roaming wastepickers and also emphasis first right access to waste.
2.1.4 Swachh Bharat Mission Manual on Municipal Solid Waste ManagementThe Swachh Bharat Mission Manual on Municipal Solid Waste Management – 2016, by CPHEEO, MoUD, GoI was released in June 2016 after being revised to align with the SWM Rules 2016, PWM Rules 2016, C & D Rules 2016, and E-Waste Rules 2016. The Part 1 of the manual draws attention to the relevance of informal waste workers:
• Reflecting on the ISWM framework it highlights gender equity and informal sector integration -two key components of a successful SWM system. It also recognises job creation possibilities through recycling, the need for organising, acknowledging them as partners, the need to access social security, loans, tax exemptions, and reserving land for decentralised processing, skill development and offering service contracts. See Box 3

40
Chapter 2, Sec 2.2 Options for enabling conditions and supportive actions for this inclusive approach involve:
• involvement of informal sector workers into formal system with legal recognition, reflection in relevant policy decisions and membership based associations (cooperatives, SHGs);
• officially recognising these informal associations as viable partner organizations for solid waste management (SWM) service delivery;
• motivating private sector, NGOs, SHGs to involve these informal associations in SWM service delivery by upgrading them from being waste pickers on streets to waste collectors from source;
• promoting schemes to provide social security and health benefits to members of these associations;
• providing low-interest loans to registered organizations of wastepickers (e.g., SHGs) seeking to bid for tenders and contracts;
• providing incentives to encourage participation of informal sector associations through excise and tax exemptions and other fiscal concessions;
• giving priority to these associations in taking up small contracts of waste collection and small-scale processing as informal sector enterprises;
• reserving land in development plans for decentralised processing of biodegradable waste, and for setting up material recovery facilities;
• Supporting capacity development programmes for informal sector Associations, especially catering to the special needs of women.
• The manual also lays down the steps involved in preparing the solid waste management plan and highlights the need for stakeholder consultations, clearly outlining the need for inclusion of marginalised or vulnerable groups of people who are all part of the MSWM process. ( Chapter 2, Section 2.6)
• The Manual also highlights the need for access to adequate and appropriate personal protective equipment, as one of the outcomes of professionalising SWM services is that the workers work in safe and healthy conditions. It also states the importance of training. ( Chapter 2, Section 2.7)
• Chapter 2, Section 11 is devoted to the role of the informal sector; it clearly recognises the valuable role they place in subsidizing costs, environmental impacts and highlight the need to integrate into the formal SWM system. In the key message for decision makers, it specifies that informal sector should be encouraged to work in either centralised or decentralised MRFs, while ensuring environmental, health and safety safeguards, with social identity, social security, health care benefits and stable livelihoods. It goes on to mention that they should be engaged in door-to-door collection.
Box 2.: Excerpt from chapter 2- Swachh Bharat Mission Manula on Municipal Solid Waste
Mamagement

41
• Chapter 4 Section 3.1, in the classification of MRFs recognises that small scale units are typically owned, operated and managed by the informal sector
• Under Section 10, within the IEC programme, one of the key target groups includes the informal sector and also stresses that for effective communication community participation is a must.
Part 2 of the Manual on Municipal Solid Waste Management provides guidance to ULBs in planning, designing and monitoring of municipal solid waste management systems.
• The Chapter 1 provides stepwise guidance to local authorities in preparation of MSWM plans.
• Section 1.2.4 page 7, talks about integration of the informal sector- “Creation of livelihoods, social acceptance, and security for informal sector workers and regularising the recycling sector are all benefits of integrating the informal sector”. The section also emphasises the need to empower them to work as entrepreneurs so that in future, they can own small recycling facilities.
• In the Section 1.4, page 38, 39 under the Table 1.4 Matrix for Collection of Baseline Information Under Institutional Aspects specify the need for identification of Stakeholders which includes list of known recyclers in the ULB, approximate number of wastepickers and persons involved in the kabadi system within the ULB jurisdiction and identification of NGOs, voluntary groups, SHGs involved in SWM.
• Section 1.4.5.9 page 100 Arrangements for Informal Sector Integration, mentions policy directives that have existed in order to integrate waste pickers and under enabling conditions and supportive actions to promote integration lists “ Encouraging informal sector, NGO and CBO through linkage to National Urban Livelihoods Mission”. Under the Scope for Informal Sector Integration in Municipal Solid Waste Management Activities, the chapter recommends the following: Door-to-door collection, Sorting of recyclable waste, Collection and segregation of recyclable material, Manual sorting at the conveyor belt in a material recovery facility, Setup and management of recyclable or reusable waste take-back or buy-back facilities supported by adequate and appropriate skill enhancement arranged for by the urban local body (ULB) or other concerned departments, Waste sorters in processing facilities (e.g., at the sorting conveyor). Under Capacity Building and Training of Informal Sector for Providing Municipal Solid Waste Management Services, page 102, the following are listed: Improvement of managerial skills (business management, accounting, marketing, negotiation skills), Maintenance of work ethics and organisation or team work, Training in sorting, processing, recycling techniques, and value added services, Formalisation requirements for waste worker organisations, Environmental and health aspects of waste management activities, Occupational hygiene and safety, Business support services linked to large scale formal recycling industries.
• In the Section 2.1.5, developing a waste minimisation programme in ULBs, the section makes a mention for the need for forward and backward linkages and states the need to develop an institutional mechanism with all relevant stakeholders to facilitate implementation. “Identification and registration of scrap dealers and recyclers is a pre-requisite to assess the viability and sufficiency of recycling facilities in the ULB”.

42
• The Section 2.3.7 - Role of the Informal sector in primary waste collection, starts by quoting the Clause 15 c, d and h of the SWM Rules 2016 and highlights the role the informal sector plays in recycling, resource recovery . Scrap dealers are also acknowledged are compared to micro-entrepreneurs. This section states that the aim must be to raise the status from waste pickers to waste collectors and provide them with working tools and PPE. The section also stresses the need to institutionalize the process to ensure rights of workers supported by appropriate local policies and bye-laws. The section also states the need for the state to consider provision of social security and welfare benefits – including health check-ups, medical health care and treatment facilities. “Care must be taken to ensure that workers (be they contractual or otherwise) have access to proper facilities such as separate toilets for men and women, storage space for their belongings, etc.”
• The Section 3.1.6 Informal Sector Involvement In Recycling page 222, states the multiple contributions the informal recycling sector makes – including supplementing the formal system, making their various different types of waste, employment, the linkages with formal economy through the recycling chain offsetting carbon emissions and like the earlier sections mentions the need to organise them, provide them with an identity card and access to social security.
2.1.5 Draft Model Municipal Solid Waste (Management & Handling, Cleanliness and Sanitation Rules/Bye-Laws in September 2016, by MOUD, GOI
The SWM Rules 2016, 15 (e), directed the ULBS to frame Bye-laws to notify the rules within one year of the announcement of the Rules. The MoUD, GOI, released the Draft Model Municipal Solid Waste (Management & Handling, Cleanliness and Sanitation Rules/Bye-Laws in September 2016 (2016). The draft model byelaw is inadequate and has not kept up with the progressive suggestions detailed by the SWM Rules 2016 or the Manual on Municipal Solid Waste Management 2016 by CPHEEO. There is no mention of wastepickers registration in the bye law, assuming that the State/ City policy will take it into account. Section 5.4, under of delivery of segregated premises waste, and 6.5 under point-to-point waste collection service state; “deliver waste to wastepickers / waste collector of others”, without explicitly ensuring access to waste, thereby leading to interpretation which opens up competition from non-wastepickers into the sector. Section 5.10 acknowledging the need for a separate vehicle for dry waste, makes no mention of wastepickers operating or accessing them. Section 6.9 talks about Dry waste Sorting Centers being manned/ operated by registered cooperative societies of waste-pickers, not in line with the Manual or the SWM Rules 2016. (Draft Model Municipal Solid Waste ( Management & Handling), Cleanliness and Sanitation Rules /Bye-laws 2016)
2.1.6 Swachh Survekshan 2015 to 2018In October 2015, 73 cities were given two months preparatory time to be a part of an extensive survey which was conducted by Quality Council of India and titled ‘Swachh Survekshan’. (PIB 2016) The survey ranked municipalities on two broad themes
43
– ODF and SWM and also included Information, Education and Behavior Change Communication (IEBC) activity. The actual survey was conducted 5th January 2016 and 20th January 2016 and the results were declared on 15th February 2016 with Mysore, Chandigarh and Tiruchirappalli clinching the top three slots.
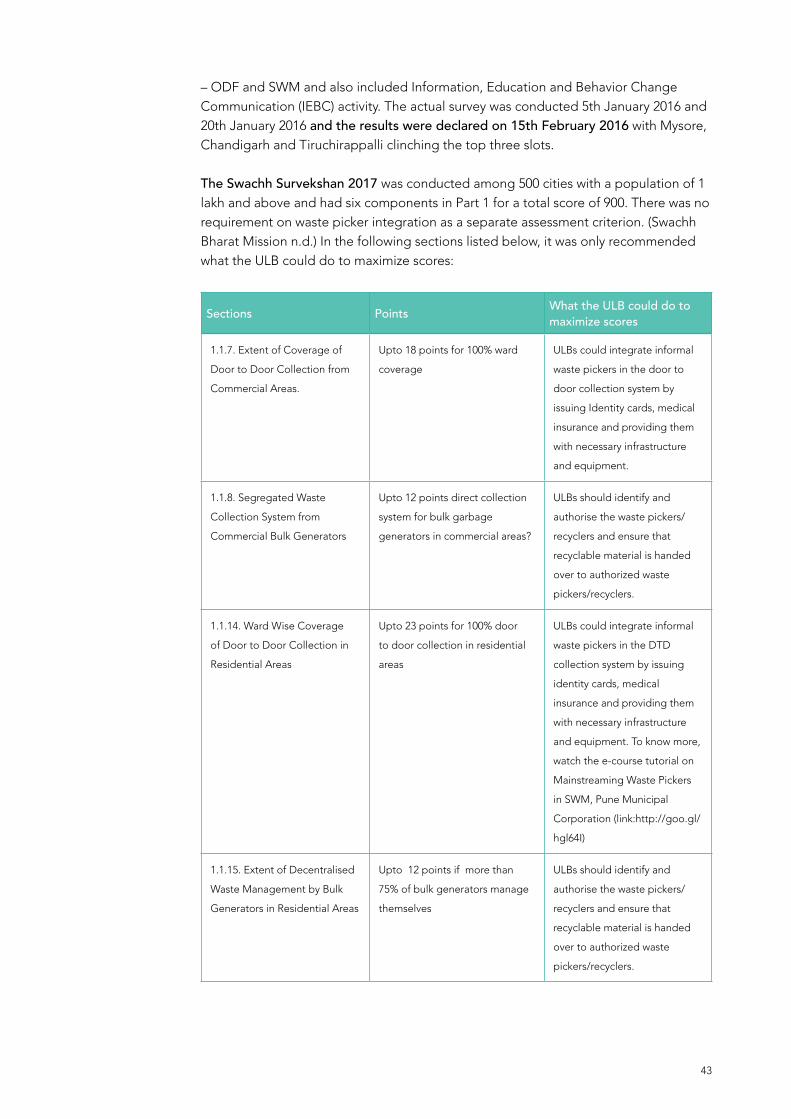
The Swachh Survekshan 2017 was conducted among 500 cities with a population of 1 lakh and above and had six components in Part 1 for a total score of 900. There was no requirement on waste picker integration as a separate assessment criterion. (Swachh Bharat Mission n.d.) In the following sections listed below, it was only recommended what the ULB could do to maximize scores:
Sections Points What the ULB could do to maximize scores
1.1.7. Extent of Coverage of
Door to Door Collection from
Commercial Areas.
Upto 18 points for 100% ward
coverage
ULBs could integrate informal
waste pickers in the door to
door collection system by
issuing Identity cards, medical
insurance and providing them
with necessary infrastructure
and equipment.
1.1.8. Segregated Waste
Collection System from
Commercial Bulk Generators
Upto 12 points direct collection
system for bulk garbage
generators in commercial areas?
ULBs should identify and
authorise the waste pickers/
recyclers and ensure that
recyclable material is handed
over to authorized waste
pickers/recyclers.
1.1.14. Ward Wise Coverage
of Door to Door Collection in
Residential Areas
Upto 23 points for 100% door
to door collection in residential
areas
ULBs could integrate informal
waste pickers in the DTD
collection system by issuing
identity cards, medical
insurance and providing them
with necessary infrastructure
and equipment. To know more,
watch the e-course tutorial on
Mainstreaming Waste Pickers
in SWM, Pune Municipal
Corporation (link:http://goo.gl/
hgl64I)
1.1.15. Extent of Decentralised
Waste Management by Bulk
Generators in Residential Areas
Upto 12 points if more than
75% of bulk generators manage
themselves
ULBs should identify and
authorise the waste pickers/
recyclers and ensure that
recyclable material is handed
over to authorized waste
pickers/recyclers.

44
The SS 2017 Report has a legend which says Informal Waste Picker Engagement with three colour schemes: Green for Fully Achieved, Yellow for Partially Achieved and Red for Not Achieved. The top 9 cities have been marked green, as compliant.
1. Indore ( All wards engage informal waste pickers for solid waste management and undertake sweeping twice a day)
2. Bhopal
3. Vishakapatnam ( More than 75% of wards engage informal waste pickers for SWM, and undertake sweeping twice a day in all notified commercial areas, including all festivals and Sundays)
4. Surat ( More than 70% of wards engage informal waste pickers for SWM, and undertake sweeping twice a day in all notified commercial areas, including all festivals and Sundays)
5. Mysuru
6. Tiruchirappalli ( There are informal wastepickers engaged by the ULB for solid waste management and covers more than 70% of the wards
7. NDMC
8. Navi Mumbai ( More than 70% of wards engage informal waste pickers for SWM, and undertake sweeping twice a day in all notified commercial areas, including all festivals and Sundays)
9. Tirupati (SS Report 2017 n.d.)
Swachh Survekshan 2018, was significant as for the first time, the Survekshan rated cities based on the Percentage of Informal Waste Pickers formally integrated into SWM in the city, as per SWM 2016 Rules and awarded up to 32 Marks, if 100% were integrated. The means of verification included Copy of survey/study report for identification of waste pickers in the city, ward wise list of wastepickers with ID numbers issued to them, copy of contract, if wastepickers were integrated with an outsourced form or a copy of the contract with SHGs that have enrolled informal waste pickers in their groups and list of ward allocations by wastepickers.
Another significant criteria was in Section 2.4 percentage of dry waste collected/treated by either decentralised or centralised processing for 50 marks, which listed one of the means of verification, from the five points listed as Survey report indicating total wastepickers in the and dry waste collection centers in the city.
Box 2.2: Excerpt from SS 2017
1.2.2. Availability of Mechanical
Secondary Segregation of
MSW Before Processing /
Treatment
upto 45 points if technologies
used for segregation before
processing for treatment
For ULBs which have a strong
presence of waste pickers in
the city, they should tap the
potential of such resource
by formalizing them through
provision of identity cards,
medical insurance and other
equipment.
45
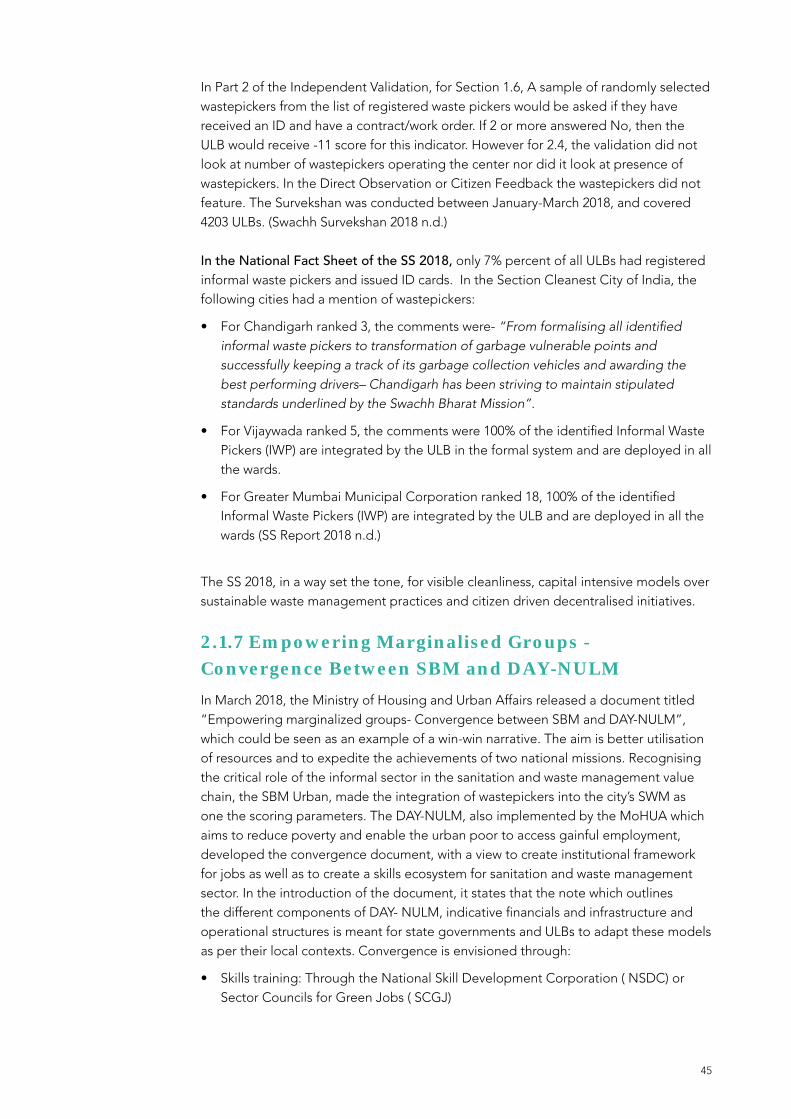
In Part 2 of the Independent Validation, for Section 1.6, A sample of randomly selected wastepickers from the list of registered waste pickers would be asked if they have received an ID and have a contract/work order. If 2 or more answered No, then the ULB would receive -11 score for this indicator. However for 2.4, the validation did not look at number of wastepickers operating the center nor did it look at presence of wastepickers. In the Direct Observation or Citizen Feedback the wastepickers did not feature. The Survekshan was conducted between January-March 2018, and covered 4203 ULBs. (Swachh Survekshan 2018 n.d.)
In the National Fact Sheet of the SS 2018, only 7% percent of all ULBs had registered informal waste pickers and issued ID cards. In the Section Cleanest City of India, the following cities had a mention of wastepickers:
• For Chandigarh ranked 3, the comments were- “From formalising all identified informal waste pickers to transformation of garbage vulnerable points and successfully keeping a track of its garbage collection vehicles and awarding the best performing drivers– Chandigarh has been striving to maintain stipulated standards underlined by the Swachh Bharat Mission”.
• For Vijaywada ranked 5, the comments were 100% of the identified Informal Waste Pickers (IWP) are integrated by the ULB in the formal system and are deployed in all the wards.
• For Greater Mumbai Municipal Corporation ranked 18, 100% of the identified Informal Waste Pickers (IWP) are integrated by the ULB and are deployed in all the wards (SS Report 2018 n.d.)
The SS 2018, in a way set the tone, for visible cleanliness, capital intensive models over sustainable waste management practices and citizen driven decentralised initiatives.
2.1.7 Empowering Marginalised Groups - Convergence Between SBM and DAY-NULMIn March 2018, the Ministry of Housing and Urban Affairs released a document titled “Empowering marginalized groups- Convergence between SBM and DAY-NULM”, which could be seen as an example of a win-win narrative. The aim is better utilisation of resources and to expedite the achievements of two national missions. Recognising the critical role of the informal sector in the sanitation and waste management value chain, the SBM Urban, made the integration of wastepickers into the city’s SWM as one the scoring parameters. The DAY-NULM, also implemented by the MoHUA which aims to reduce poverty and enable the urban poor to access gainful employment, developed the convergence document, with a view to create institutional framework for jobs as well as to create a skills ecosystem for sanitation and waste management sector. In the introduction of the document, it states that the note which outlines the different components of DAY- NULM, indicative financials and infrastructure and operational structures is meant for state governments and ULBs to adapt these models as per their local contexts. Convergence is envisioned through:
• Skills training: Through the National Skill Development Corporation ( NSDC) or Sector Councils for Green Jobs ( SCGJ)

46
• Social mobilization and institution building: In the form SHGs, as well as services through City Livelihoods Centers (CLCs). Higher up in the structure through Area Level Federations ( ALFs) and City Level Federations ( CLFs)
• Financial inclusion and self-employment: By converging with ongoing programs under the Ministry of Social Justice and Empowerment to improve financial access such as the NSKFDC. And through the Entrepreneurship Development Programs (EDP) under Self Employment program( SEP)
• Capacity building: By constituting a Convergence Task Force comprising of Sate Mission Directors of Day –NULM and SBM-U. In additional ULBs to engage with Civil Society Organisations for training workers and SHG members for SBM-U in roles defined by the National Skills Qualification Framework
The document lists the Responsibilities of ULBS and the City Mission Management Unit (CMMU) which includes:
• The identification of wastepickers , issue of identity cards and registration of wastepickers at the CLCs
• Skill Training of Marginalised groups and Enterprises by validation of city level skill gap- by mapping existing informal workers, wastepickers, preparation of detailed project reports (DPRs) for specific waste management projects, facilitate training, preparation of City Livelihoods Plan to explore the options of livelihoods and to conduct Recognition of Prior Learning (RPL) for informal workers as per the advisory issued by DAYNULM in convergence with Pradhan Mantri Kaushal Vikas Yojana (PMKVY).
• Formation and handholding of common Interest Groups ( CIG) of marginalised groups through community resource organisations, and access to finance by establishing a revolving fund through Day NULM, appointment and training of Bank Mitras and micro enterprise community consultants and to facilitate bank linkage and access to subsidized loans.
• Identification of projects where ULBs have insufficient human resources, they can outsource activities to SHGs/CIGs by appointing SHG members as “Swachhagrahis”, and the ULB can also allocate funds to them from the SBM-U budget for IEC activities for behaviour change campaigns
• Under Monitoring mechanisms, it lists the need to set up systems to monitor convergence and ensure responsible waste management practices, including land holding support for regular payment of loan installments.
Key elements under Livelihoods for identified vulnerable groups for informal /itinerant wastepickers, but not limited to:
• Mobilization and training regarding safety, counselling regarding substance abuse, and enrolment into existing service frameworks of the ULB.
• Registration and provision of ID cards.
• Allocating space for dry waste collection centres/ material recovery centres, composting.
• Engaging them in door-to-door waste collection contracts.

47
• Allowing them to earn income through waste recovery. (Ministry of Housing and Urban Affairs 2018)
This convergence document in essence helps put into action, many of the asks from the wastepickers groups, and organisations.
2.1.8 The Swachh Survekshan 2019The Swachh Survekshan 2019 increased the scoring in the parameter that looked at percentage of Informal Waste Pickers formally integrated into Sustainable Livelihoods through SHGs/Cooperatives/Contractors/NGOs to 40 points. It graded ULBs that demonstrated convergence between SBM (U) and NULM and Skill Development. The means of verification though is not substantial; it lists copy of the survey report of on field assessment of waste pickers in the city and specifies that the survey must be not more than a year old. What would be interesting to look into is a comparative of the survey undertaken by the ULBs for the three year period and track the integration progress against the parameters listed in the Convergence Document of SBM-U and Day- NULM. (Swachh Survekshan 2019)
The National Fact Sheet of the SS 2019 lists “537 ULBs have identified & integrated 1.2 Lakh Informal Waste Pickers within their cities into sustainable livelihoods”.
• Mysuru ranked 3rd in SS 2019 states 100% of the identified Informal Waste Pickers (IWP) are integrated by the ULB and are deployed in all the wards
• Ujjain ranked number four, states where, with the help of self-help groups/NGOs 100% of Informal Waste Pickers are formally integrated into sustainable livelihoods. 100%
• Chennai ranked number 61, states Under Service Level progress, it was witnessed that 100 % of informal waste pickers were integrated within the ULB. (SS Report 2019)
The report does not acknowledge the convergence document, nor does it state integration as an important criterion, again falling back on visual cleanliness. Again with the 100% integration there are no best practices that are showcased.
2.1.9 NGT on the Compliance of SWM Rules 2016In the affidavit submitted by the CPCB, on 6th March 2017, in compliance of the NGT order dated 1st March 2017, “All the State Government/Union Territories shall file their response to the report to Central Pollution Control Board. The Central Pollution Control Board shall examine such responses and submit their comments/recommendations to the Tribunal. The State Government/Union Territories who have filed their response and compliance report to the judgment of the Tribunal in Almitra H Patel Vs. Union of India case, and if they have been received till date by the Central Pollution Control Board, then they would be examined and report-cum-recommendation be submitted to the Tribunal”. (CPCB, Affidavit on Behalf of the Central Pollution Control Board, in compliance of this Hon'ble Tribunal's Order dated 1st March 2017 2017) The affidavit stated that the CPCB had received 16 responses and they had provided comments on the Action plan submitted by States for SWM. In the consolidated document only Maharashtra had mentioned, “regarding involvement
48
of waste pickers and waste dealers mentioned in the proposed state policy.” (CPCB, Comments on Action Plan Submitted by States for Solid Waste Management ( In compliance of the Hon'ble NGT order dated 22.12.2016 & 07.02.2017) n.d.)
In the matter of Compliance of Municipal Solid Waste Management Rules, 2016 O.A. No. 606/2018 the revised order corrected on: 31.08.2018 stated that though the rules were framed in the year 2016 implementation on ground hasn’t taken off. The order quoted from CPCB’s Annual Report of April 2018 and stated that there have been serious deficiencies in the reports of most States, in spite of being two years into the rules.
In the order of this Tribunal dated 22.12.2016, directions were issued for implementation of the Rules, 2016. Direction was issued for the action plan to be prepared in terms of the Rules, 2016 within four weeks. Action under Rule 6(b) and 15 of the Rules, 2016 was directed to be taken by January, 2017 which was to be complied by 01.07.2017.
In the order the MoHUA suggested the need for Performance Audit. A point to be noted is that within the parameters listed for monitoring “integration of waste pickers was not listed”. Point 16, was on the Notification of Bye Laws: Frame bye-laws incorporating the provisions of MSW Rules, 2016 and ensuring timely implementation. (National Green Tribunal 2018)
2.1.10 Bye Laws/State Policies/Action PlansBased on the NGT Order, we decided to look at the Bye-Laws of various cities that were ranked in the top 15 of SS 2019.
The State Policy and the City Bye Laws seek to implement the Rules and the vision outlined. The three specific rules of the SWM Rules which address the inclusion of waste pickers are:
• Rule 11 which provides recognition and acknowledgement of the waste pickers, by ensuring their representation in stakeholder meetings, by providing guidelines for integration, access and municipal infrastructure support
• Rule 15, to facilitate their participation in the door to door collection, set up facilities for dry waste management and provide access to the waste picker for operations and benefit from the revenue
• Rule 4 to ensure that bulk generators so identified by the Rules shall handover recyclable material to the authorised waste pickers
Some key indicators were identified and verified for in the legislations in the form of bye laws, policies, action plans
1. Definition of wastepickers
2. Registration of wastepickers
3. Plan for dry waste that includes wastepickers
4. Integration of wastepickers in the door to door collection
49
5. Access provided to the wastepickers by the Municipality
Based on the information in public domain we could only find Bye Laws of Indore, Mysuru, NDMCM, Navi Mumbai and Tirupati. In addition we chose Chandigarh, Chennai that were judged as Best State Capital/UT in 'Solid Waste Management' and Fastest Mover' State Capital/UT respectively. We chose Uttarakhand, as Gauchar was adjudged as the Cleanest Ganga City for the first time. Even though, according to the CPCB report, Uttarakhand was classified as one of the worst states in the country in terms of solid waste management. (Jha 2018). Lastly we also chose Pune and West Bengal, as Pune has been a champion of waste picker integration and West Bengal as an example for complete exclusion.
1. Indore Municipal Corporation Solid Waste Management Bye Law 2018
Indore is probably one of the few cities which have issued all the four byelaws at the same instance in 2018. The SWM byelaws identify in particular the need for collection of segregated waste in separate streams using fixed compactor transfer stations. Also identified is the process of setting up sweeping beats with the use of both manual and mechanical sweepers. Overall there seems to be a particular focus on processes and systems supported by automation. The bye laws also give importance to decentralised processing through home composting and on site processing, supporting it with incentives like awarding and recognition and rebates in property tax.
The plastic byelaws specify in great detail the requirement of the producers, importers and brand owners to lay out a plan for collection, submission of used multi layered plastic sachet or pouches or packaging by this plan with time lines and the need to phase out the use of non-recyclable multi-layered plastic within two years’ time. It also plans to carry out surprise checks, enforcement squads in each ward and the need for publicity for compliance on use of plastic.
There is no definition of wastepickers listed, however in the section on responsibilities of the IMC, it lists that incentives may be provided for recycling to the informal waste sector, it also speaks of the need to streamline and formalize wastepickers and are accorded priority to upgrade their work conditions, and are enumerated and integrated into the formal system of SWM. (Indore Municipal Corporation 2018)
2. Karnataka Municipal Corporation Model Solid Waste Management Bye-laws, 2018
It is to be noted that though the draft, are in public domain, the same has been withdrawn by the State Government at the State Level Advisory Board Meeting following opposition by stakeholders for not following due diligence on 2nd February 2019. (SWMRT 2018) (UDD 2019)
3. New Delhi Municipal Council Solid Waste Management Bye-Laws, 2017
The NDMC’s bye law focuses is on user fee for implementation of waste management services, penalties for littering and non-compliance. Chapter II section 4 has provisions listed out in SWM Rules 2016, but it fails to take into account the component on integration of wastepickers. In Section 5, it mentions that in order to implement door-to-door collection as outlined in SWM Rules 2016, they will integrate the informal door to door collection system with NDMC collection system. And that the NDMC or authorised waste collectors shall be responsible to cover all streets/lanes of each zone
50
for the primary collection. Given that the definition of Sanitary Worker is listed, and is separate from the other terminologies used but not defined waste pickers, waste collector, one can only make assumptions. In Section 6 x, it states that all Dhalaos( Community Waste Storage Bins), will be converted into Recycling centers for Dry Waste and that authorised agents or waste dealers will be allowed to operate, dispose and sell, failing to take into account access to wastepickers. The other problematic clause in Sectiion 8 iv under processing of waste NDMC shall ensure that recyclables such as paper, plastic, metal, glass, textile etc. go to authorized recyclers. (New Delhi Municipal Council 2018)
4. Navi Mumbai Municipal Corporation Cleanliness and Sanitation Bye Laws 2017
The Byelaws quote from Maharashtra Municipal Act or Environment Protection Act 1986 and the Municipal Solid Waste(Management and Handling) Rules 2016 and Maharashtra Non-Biodegradable (Proper Scientific Collection, Storing Disposal in the areas of Municipal Corporation) Act 2006 notified under Maharashtra Non-Biodegradable Control (Garbage) Act 2006, for words and expressions used in these bye laws but not defined shall have the meanings.
The Municipal bye laws have in addition to the overall aspects has particularly laid emphasis on the aspect of dry waste collection and on visual cleanliness. In order to regulate and facilitate the sorting of the recyclables and non-recyclable waste the bye laws provide for as many dry waste sorting centers as possible and required, to be operated by waste pickers and their cooperatives. It makes a reference to the Rule 3(2) (i) of Maharashtra Non-Biodegradable Solid Waste (Proper & Scientific Collection Storing and Disposal in the area of Municipal Corporation Rules 2006), for handling of non-biodegradable waste and prohibits the throwing of biodegradable and non-biodegradable garbage in public drains , sewage lines , natural or manmade lakes , wet lands , restriction or prohibition on use of certain non-biodegradable material.
The bye laws have identified several aspects which affect the visual cleanliness like car parking on the roads which interfere with street sweeping, sticking of posters and painting on walls, encroachments, use of plastic carry bags, pamphlet distribution, and advertising on premises/vehicles. (Navi Mumbai Municipal Corporation 2017) (Environment Department, Government of Maharashtra 2006)
5. Municipal Corporation Tirupati Solid Waste ( Management & Handling), Cleanliness Rules/ByeLaws 2018
The bye law defines that the collection from source should be done based on a Micro Pocket. This is defined as the smallest work area and the basic sanitation unit in a ward/division for maintaining sanitation and handling of solid waste, which has been identified as comprising of 300-400 households. The bye laws have further identified the number of public health workers that have to be deployed per micro pocket. The bye law directs the setting up of a web based grievance redressal system, bio metric / smart card technologies for recording attendance and creation of transparency and public accessibility. The bye law proposes to promote home composting while incentivising through awarding, recognition and further by offering rebates. Under responsibilities of MCT, it lists the same as the Indore Waste Management Bye Laws that incentives may be provided for recycling to the informal waste sector, it also
51
speaks of the need to streamline and formalise wastepickers and are accorded priority to upgrade their work conditions, and are enumerated and integrated into the formal system of SWM. (Municipal Corporation Tirupati 2016)
6. Final Draft Public Health Bye-Laws for the Surat Municipal Corporation of Gujarat State, May 2016
The Surat Municipal Corporation has a very broad focus on public health. The bye laws specifying the responsibility of the State lays down its objective towards environmental protection, raising the level of nutrition , standard of living and public health , scientific management of all kinds of waste ; effective legal and administrative framework for municipal authorities to regulate implementation of municipal waste management and sanitation facilities. The Bye - Laws covers solid waste management, liquid waste management, air & noise pollution, and other sanitation and public health aspects like food, sanitation, community and public toilets, open defecation, manual scavenging, water and vector borne diseases etc. Municipal Solid wastes have been classified into 30 different categories, which include plastic waste, E - waste, bio - medical waste, c & d waste etc. Generators of waste have been classified into 21 different categories, which include residential, commercial, government, heritage residential and commercial building & premises, market places, slaughter houses, dairy and cattle sheds etc. It has been made compulsory to segregate waste into dry and wet waste for all the generators of waste. The Bye Laws make it extremely difficult for wastepickers to access any kind of dry waste, as the entire emphasis is on agency, authorised agent, and individual or private safai workers. In essence there is no identification, acknowledgement or recognition of wastepickers or other informal waste workers. (Surat Municipal Corporation 2016)
7. Municipal Corporation of Chandigarh Solid Waste Management Byelaws 2018
Chandigarh’s Bye Laws defines waste pickers, and waste traders. On the whole the bye laws have shown compliance with the Rules 2016 by identifying all requirements under the law. However the overall thrust in the bye laws appears to be towards collection and transportation to centralised facilities, even though there are mentions of decentralised composting and bio-methanation facilities. The bulk generators have been identified and directed to process on site. At the same time the schedule of user fees for handing over to authorised waste collectors. There is some disincentive by charging additional user fees linked to weight of waste generated per day, which may act as a deterrent and force bulk generators to process on site. In the case of dry waste, waste pickers have been recognised for sorting and handling of dry waste at the MRF or sorting sheds. At the same time it is planned that recycling centres will be set up in multiple locations where all the dry waste must be deposited. The bye laws however states that these recycling centres will be managed by authorised agents or waste dealers who will also sell the recyclables and keep the sale realisation. Under responsibilities of MCC, it lists the same as the Indore and Tirupati Waste Management Bye Laws that incentives may be provided for recycling to the informal waste sector, it also speaks of the need to streamline and formalize wastepickers and are accorded priority to upgrade their work conditions, and are enumerated and integrated into the formal system of SWM. The bye laws therefore well intentioned appear to be ambiguous on certain aspects. (Municipal Corporation of Chandigarh

52
2018)8. The Greater Chennai Corporation, Solid Waste Management Bye-Laws, 2016
The bye laws issued in 2016 appears to have a central focus on decentralised processing, the purpose of which is defined as ‘for maximising processing of biodegradable waste and recovery of recyclables and minimising of transportation of waste and its disposal’. It identifies the setting up of composting and bio methanation plants in all suitable locations including markets. In fact it goes a step further to identify that the landfilling of mixed waste should be stopped and the goal should be zero waste to landfill. To this end it also supports in a big way maximising of onsite by recommending that the building plans should be scrutinised for space allocation for collection, storage and processing on site. The bye laws also recommend the integration of SHG and waste pickers in the door to door collection. It also recommends a setting up of a Citizen Resource base which will prepare and publish lists of experts, solution and service providers, officials’ guidance and assistance which is a welcome inclusion. A not so well thought out aspect seems to be on dry waste management , where localised dry waste collection centers, sorting sheds or MRF is not given an equal thrust like that for bio degradable waste. Further the scope of EPR appears to be problematic, which identifies as responsible for even the recyclable materials like packaging products such as plastic, tin, glass and corrugated boxes for environmentally sound management till end of life of packaging products. (The Greater Chennai Corporation 2016)
9.Urban Municipal Solid Waste Management Action Plan for the State of Uttarakhand August 2017
The Action Plan for the State of Uttarakhand states the vision for a Swachh Uttarakhand is in line with the Swachh Bharat Mission. …to ensure hygienic, clean and litter free environment across the state, where waste is treated as a resource, managed scientifically in an environmentally sustainable manner and zero waste reaches landfills by 2040. It identifies thirteen guiding principles which identify the importance of segregation at source, public participation, resource recovery and recycling. It also recognises that waste pickers play a critical role in recycling and EPR should be used for incentivising recycling. Focus is also given to ensuring that project implementation is done in a way that is financially self-sustaining based on the principle of “Polluters to Pay”. Very high in the list of strategies identified is the need to set up a scheme to integrate waste pickers into door to door collection and set up material recovery facilities where waste pickers will recover recyclable waste. Keeping in view the goal of zero waste to landfill the EPR strategy requires disbursement of fees from the producers to the collectors, mainly waste pickers and informal sector individuals in addition to other agencies in order to incentivise the collection of the recyclables which are currently ending up in the landfill. (Urban Development Directorate Dehradun 2017)
10. Pune Municipal Corporation Public Health and Sanitation Bye- Laws 2017
Pune Bye Laws drafted in 2017 have been published as a Public health and Sanitation bye laws and is in essence, very comprehensive in its approach. It has included aspects of Public health, pollution, mitigation by disease prevention along with different types of waste management solid, liquid, C&D, bio medical and e-waste. 21 types of waste and 13 types of waste generators have been identified, which is similar in

53
approach to Surat Waste Management Bye Laws. This is the only bye- law which has mentioned integrated waste picker door to door collectors along with the other types of Municipal staff. In addition to all the overall specified conditions for proper collection and transportation of segregated waste to the respective decentralised or centralised facilities, , stringent conditions for certain categories of non-residential bulk generators like hotels, restaurants, wedding halls, slaughter houses, chicken ,fish and mutton shops, hospitals and health care institutions, private gardens and dairy and cattle sheds, for carrying out on site wet waste processing has been laid down. Residential societies or complexes with over 200 units or occupying over 0.4HA have been identified as bulk generators. Property tax rebate has been provided to those carrying out on site processing. The bye law has very comprehensively looked at plastic waste management. The bye law looks at recognising existing informal waste collection / aggregation facilities as MRF, subject to compliance of conditions. Unlike other bye laws the subject of EPR has been elaborated by identifying two models for allocating EPR credit where the Corporation would enter into a 5 year contract with Producers towards meeting their EPR obligation. The bye laws also directs for self-compliance form to be filled in annually by the institutional generators, retailers and recycling treatment plants. (Pune Municipal Corporation 2017)
11. State Policy and Strategy on Solid Waste Management for Urban Areas of West Bengal
The policy of West Bengal in an attempt to rectify and improve the various existing problems in the waste management processes. They have identified the setting up of fixed compactor transfer stations as an intervention to improving efficiency of collection and transportation. The policy also draws to attention both the municipalities and private outsourced organisations have been unsuccessful in managing solid waste. Therefore the policy aims to enable self-help groups who will be formed into cooperatives to carry out collection. Secondary storage bins are planned and it is proposed that the waste pickers will be deployed at the secondary storage for sorting and recovering of plastic items, e waste, sharps, glass, and metal scrap. The Policy expresses caution in the ability to collect segregated waste even though it is the rule. It there appears that the sorting from the secondary storage bins would take place from mixed waste. No other reference is made to dry waste sorting sheds or material recovery facilities. (Urban Development & Muncipal Affairs Department, Government of West Bengal n.d.)
Based on the review of these Bye Laws / State Policy/Action Plans, (Refer Annexure Table) we have classified the City/State into 3 categories:
Highly inclusive: Pune where every indicator requiring mention of wastepickers was fulfilled, Uttarakhand is featured here because of the commitment stated to the integration of waste pickers in the strategy , also the only legislation which has gone as far as looking at compensation to the wastepickers for the non-recyclable waste collected through EPR
Medium inclusion: Tirupati, Chennai, NDMC, Indore and Chandigarh with mention of at least 2 or 3 of the 5 indicators are included.
Total Exclusion: Surat, Navi Mumbai, and West Bengal are exclusionary in their legislations. The wastepickers find least /no mention in almost all the indicators.
54
2.1.11 NSKFDC and Interventions for WastepickersThe NSKFDC, which is a Government of India undertaking under the aegis of Ministry of Social Justice & Empowerment, decided to include wastepickers as target group for providing financing and self-development skills. In the letter dated 30th August 2016 addressed to the AIW, it said, “It is informed that the Ministry of SJ&E, GoI vide its letter No. 19014/03/2016 –SCD-IV ( SRMS) dated 23rd June 2016 conveyed the approval for following amendment of definition of Safai Karamcharis and inclusion of definition of sanitation work in the Article of Association of NSKFDC. The definition of Safai Karamachari means a person engaged in or employed for any sanitation work and includes rag pickers, but excludes domestic worker and manual scavengers. Sanitation work includes cleaning of drains, platforms and the work which involves collection, handling and disposing of garbage, sweeping and such other sanitation work”.
The letter details that after the inclusion of wastepickers as a target group of NSKFDC, all existing guidelines and schemes available to Safai Karamacharis, Scavengers will be applicable to them. The schemes are channelised through State Channelizing Agencies (SCA), Regional Rural and Nationalised Banks. The SCA are nominated by State/UT governments. They offer loan based and non-loan based schemes including skill development, workshops, awareness programmes and job fairs. With the loan based scheme, there is Green Business Scheme at a cheap credit at an interest rate 4 % per annum. (NSKFDC 2016)
2.1.12 Green Skills CouncilThe Skill Council for Green Jobs (SCGJ), a not for profit, independent society, aligned to the NSDM and promoted by MNRE and CII, was established in 2015. Under the Sector Green Jobs, and sub sector Solid Waste Management:
1. The Qualifications Pack for “Recyclable Waste Collector & Segregator”, which was drafted on 10th March 2016, was finally given NSQC Clearance on 19th December 2018. The four compulsory modules includes four National Occupational Standards ( NOS): Collection of Recyclable Waste (which prepares the applicant to be competent on understanding waste- signs, symbols and colour codes for SWM, types of generators, understand collection and transportation including precautions to be undertaken); Segregation of Recyclable Waste ( which includes identifying different types of recyclables, understanding and segregation recyclable and non-recyclable waste, the physical and chemical properties of waste and handling these waste); Personal Health and Work Safety ( this module is about the use of PPE and personal hygiene); Entrepreneurship which is about economics and finance in recycling and take the participant through ascertaining different prices of materials, choosing aggregators based on market situation and the calculations of trade margins. All the sessions include theory and practical components. The course duration is 160 Hours and one of the criteria for eligibility is a minimum of two years of work experience (SCJG, QUALIFICATIONS PACK - OCCUPATIONAL STANDARDS FOR GREEN JOBS Recyclable Waste Collector & n.d.) (SCJG 2017). This module is good for cities for where the ULB has informal arrangement with informal waste collectors and in places where organisations and institutions are working with informal waste workers.

55
2. The second pack is titled Manager-Waste Management with three electives – Biomass Depot, Compost Yard or Dry Waste Center and the eligibility is for graduates with two years of experience. The pack was drafted on 7th February 2017, reviewed on 27th March 2018 and hasn’t yet received NSQC Clearance. The compulsory module in this pack includes Carrying Out Market Analysis, preparation of Business plan (operational plan), understanding existing laws and policies and health and safety at workplace. (SCJG, Qualifications Pack- Manager- Waste Management (Electives: Biomass Depot/Compost Yard/Dry Waste Center) n.d.) (SCGJ, Model Curriculum Manager- Waste Management (Electives: Biomass Depot/Compost Yard/Dry Waste Center) 2018). This pack was be expanded to include Scrap Dealers and Medium Scrap Traders/Dealers and any Waste Picker running a Dry waste Collection Center, given that they have been in the business. This module must be expanded to those without formal education, who have been in the waste business for over five years.
3. The third pack is titled “Waste Picker”. The job description listed is in line with the SWM Rules 2016. This pack was drafted on 28th February 2017, reviewed on 7th April 2017 and received the NSQC clearance on 19th December 2018. The minimum age for eligibility is 16 years. The four compulsory module includes Searching and Collecting Waste (This is for at the basic level, for someone entering into waste picking), Preparation and Sale of Recyclables (This talks about choosing the right aggregator, value addition etc), Collection of waste from door-to-door ( apart identifying generators, it also includes do’s and don’ts , support in collection and transportation), the last module is on Maintaining Personal Health and Safety. (SCGJ, Qualifications Pack- Waste Picker n.d.) (SCGJ, Model Curriculum Waste Picker 2017). In the document justifying the need for this qualification, the SCGJ says that Smart Cities and SBA provide opportunities for improving health, hygiene and safety with waste management and given that the country has 82,609 wards, assuming that each ward could take in 10 waste pickers, the estimated requirement for this job is about 8,26,090. (National Qualifications Register 2018) In June 2018, SCGJ met with members of AIW to discuss training of 3000 waste pickers.
2.2 Conclusion Looking at the evolving framework from 2014, it is apparent that by 2018 wastepickers integration has received emphasis in the central legislations and rules. The state and city policies and byelaws looked at briefly in this section also reflect in some cases the intent of the law. An understanding of this review is therefore important to understand, compare and contrast the implementation and if it adequately reflects in the status of the wastepickers.


57
3 Result and FindingsThe results of the survey study are presented under following sub chapters:
• Socio-demographics
• Waste practices
• Social security
• Knowledge and Perception of SBA
3.1 Socio-Demographics of the RespondentsThe Study covered a total population of 2202 including survey, FGD, and interviews. The survey alone covered a total population of 1894 waste pickers from selected 20 cities across India, which included category X, category Y and category Z. Of the 1894 waste pickers contacted 1869 agreed to participate in the survey. Maximum waste pickers surveyed were from Guntur or practical purpose Guntur includes data from Yelur, and Vijaywada also (269 participants, 14.4%), followed by Delhi (228 participants, 12.2%), and least were from Chamrajanagar (3 participant, 0.2%) and Navi Mumbai ( 7 participants , 0.4%).
Table No 3.1.1: City wise distribution of respondents
CityFrequency (N)
Percent (%) CityFrequency (N)
Percent (%)
Balaghat 53 2.8 Mysore 149 8
Bengaluru 174 9.3 Nasik 106 5.7
Bhopal 102 5.5 Navi Mumbai 7 0.4
Chamrajnagar 3 0.2 Pune 122 6.5
Delhi 228 12.2 Shillong 60 3.2
Guntur 269 14.4 Tenali 32 1.7
Indore 114 6.1 Thane 65 3.5
Jaipur 96 5.1 Tumkur 31 1.7
Kalyan 59 3.2 Wardha 25 1.3
Mumbai 149 8 Yawatmal 25 1.3

58
Figure 3.1.1 City wise number of respondents
Type of Waste Picker
The survey intended to cover all types of waste pickers and people working in waste collection. As reported by the respondents 66% of them are free roaming independent waste pickers, door-to-door collectors (19%), waste sorter (7.5%), free roaming migrant waste collectors (3%) and about less one percent were itenerant buyers(0.6%).
Free roaming /independent local
Free roaming migrant
Itinerant buyer
Waste sorter
Door-to-door collector
Other informal worker
Others
19%
7%
1%
3%
66%
1% 3%
Figure 3.1.2: Distribution of respondents according to type of waste picker
City
Num
ber
of r
esp
ond
ents

59
City Wise: In almost all the cities free roaming local are maximum except in Delhi and Pune. Among the cities number of respondents who are free roaming independent local in Balaghat (91%), Bengaluru (53%), Bhopal (53%), Guntur (89%), Indore (75%), Jaipur (95%), Kalyan (51%), Mumbai (81%), Mysore (88%), Nashik (99%), Shillong (53%), Tenali (63%), Thane (88%), Tumkur (90%), Wardha (100%) and Yawatmal (100%).In cities of Delhi (67%), Pune (98%), Bengaluru (19%), Bhopal (29%), Jaipur (5%) are Door-to-door collectors. Maximum waste sorters are in Kalyan (47%), Shillong (47%), Tenali (16%), Indore (13%), Thane (12%), Bengaluru (10%), Guntur (7%), Balaghat, Bhopal, Delhi, and Mysore are 4% each.
Figure:3.1.3 City wise distribution of respondents and type of waste picker

60
Socio-Demographics ParticularsNumber of Respondents (N=1869)
Percent (%)
Age-Group (years) Upto 20 133 7.1
21 to 30 598 32
31 to 40 549 29.4
41 to 50 335 17.9
51 to 60 188 10.1
61 to 70 57 3
71 and above 9 0.5
Gender Male 588 31.5
Female 1280 68.5
Transgender 1 0.1
Social L Distribution Backward Caste 200 10.7
General 130 7
Scheduled Caste 1014 54.3
Scheduled Tribe 525 28.1
Religion Hindu 1182 63.2
Muslims 254 13.6
Christian 159 8.5
Jain 1 0.1
Buddhist 223 11.9
Others 50 2.7
Family type Joint Family 335 17.9
Nuclear Family 1467 78.5
Single Person 67 3.6
Table 3.1.2: Socio-demographic of the respondents
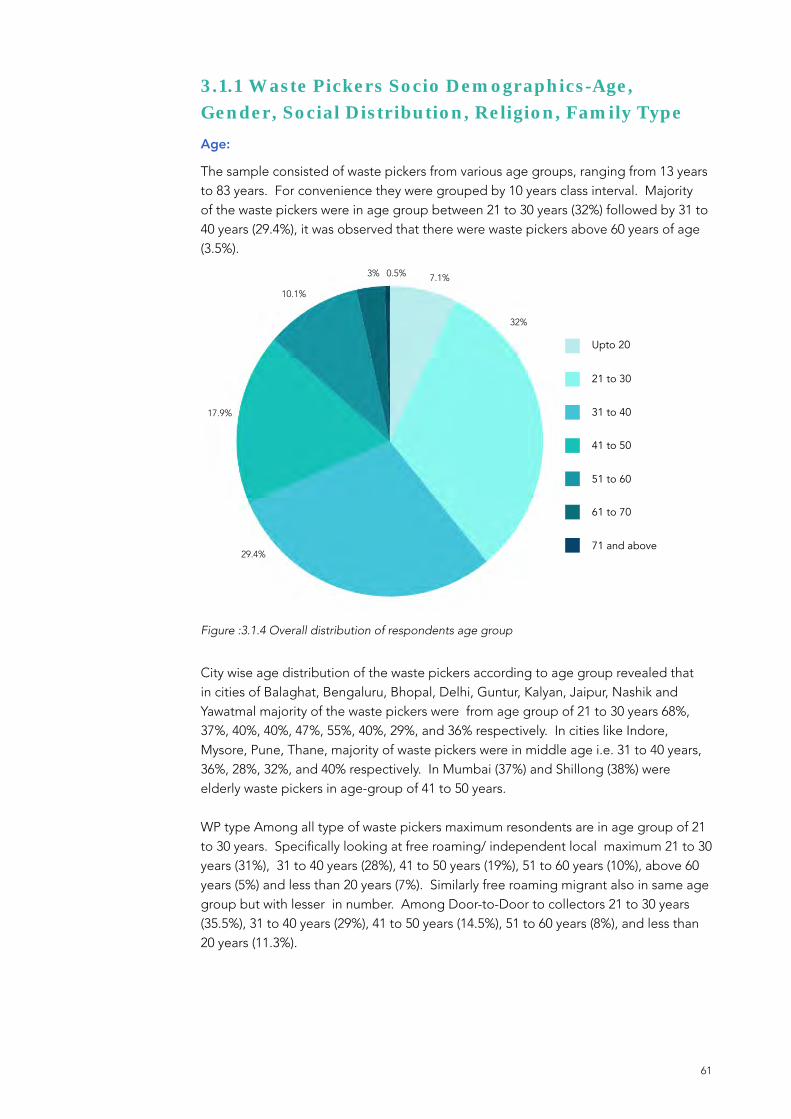
61
3.1.1 Waste Pickers Socio Demographics-Age, Gender, Social Distribution, Religion, Family TypeAge:
The sample consisted of waste pickers from various age groups, ranging from 13 years to 83 years. For convenience they were grouped by 10 years class interval. Majority of the waste pickers were in age group between 21 to 30 years (32%) followed by 31 to 40 years (29.4%), it was observed that there were waste pickers above 60 years of age (3.5%).
City wise age distribution of the waste pickers according to age group revealed that in cities of Balaghat, Bengaluru, Bhopal, Delhi, Guntur, Kalyan, Jaipur, Nashik and Yawatmal majority of the waste pickers were from age group of 21 to 30 years 68%, 37%, 40%, 40%, 47%, 55%, 40%, 29%, and 36% respectively. In cities like Indore, Mysore, Pune, Thane, majority of waste pickers were in middle age i.e. 31 to 40 years, 36%, 28%, 32%, and 40% respectively. In Mumbai (37%) and Shillong (38%) were elderly waste pickers in age-group of 41 to 50 years.
WP type Among all type of waste pickers maximum resondents are in age group of 21 to 30 years. Specifically looking at free roaming/ independent local maximum 21 to 30 years (31%), 31 to 40 years (28%), 41 to 50 years (19%), 51 to 60 years (10%), above 60 years (5%) and less than 20 years (7%). Similarly free roaming migrant also in same age group but with lesser in number. Among Door-to-Door to collectors 21 to 30 years (35.5%), 31 to 40 years (29%), 41 to 50 years (14.5%), 51 to 60 years (8%), and less than 20 years (11.3%).
Upto 20
21 to 30
31 to 40
41 to 50
51 to 60
61 to 70
71 and above
Figure :3.1.4 Overall distribution of respondents age group
29.4%
17.9%
10.1%
3%
32%
7.1%0.5%

62
Gender
With regard to gender, the respondents were from all genders, Male, Female and Transgender. Majority were female respondents 1280 in number (68.5%), one-third of the respondents were males 588 (31.5%). There was one transgender waste picker also.
Upto 20 21 to 30 31 to 40 41 to 50 51 to 60 61 to 70 71 and above
Male
Female
Figure :3.1.6 Overall distribution of respondents according to gender
Figure 3.1.5 : City wise distribution of respondents and age goup (years)
69%
31%
City
Num
ber
of r
esp
ond
ents

63
Almost all cities have more females as waste pickers, except Delhi where there were more males (60%).
Figure:3.1.7 City wise distribution of respondents and Gender
Gender wise distribution of the type of waste picker reveals that female waste pickers are more in number among free roaming /independent local (75.5%) and waste sorter (68%), males are more in among free roaming migrant (56.5%) and Itinerant buyers (67%). Amonst the door-to-door collectors both male and females are equal 50% each. There is only one free roaming waste picker who has identified herself as trangender
Social Distribution
Little more than half of the respondents belonged to scheduled caste (54.3%), nearly one fourth belonged scheduled tribe (28%), and one-tenth were from backward communities, also least from General category (7%).
Male Female
City

64
Backward caste
General
Scheduled caste
Scheduled tribe
Figure 3.1.8 : Overall distribution of respondents and social distribution
City wise: Social distribution reveals that in most of the cities of Bengaluru (35%), Indore (61%), Jaipur (95%), Mumbai (93%), Mysore (83%), Nashik (100%), Pune (70%), Thane (91%), Tumkur (61%), Wardha (100%), and Yawatmal (100%) waste pickers belonged to scheduled caste. In cities, Delhi (56%), Guntur (45%), Kalyan (64%), Shillong (100%) of waste pickers belonged to Scheduled Tribe. Followed by Backward caste, waste pickers from backward caste were present in cities in all cities except Delhi, Nashik, Shillong, Tenali, Wardha and Yawatmal. Waste Pickers from General category were present only cities of Bhopal (1%), Bengaluru (32%), Delhi (12%), Guntur (11%), Mumbai (4%), Pune (7%), and Kalyan (2%).
Type of waste picker: On comparing type of waste picker and Social Distribution it shows that maximum number of free roaming/ independent local (59%), free roaming migrant (34%), Itinerant buyer (50%), door-to-door collector (51%) are scheduled caste. Maximum numbers of waste sorter (51%) is scheduled tribe. Among general category free roaming migrant are highest (29%) and itinerant buyers are higher among backward caste (4.2%).
54%
28%
11%
7%

65
Figure 3.1.10: Distribution of respondents based on type of waste picker and social distribution
Religion
Among all the respondents about 63.2% were Hindus, 13.6% Muslims, 12% Buddhist, 8.5% Christians. There was also one waste picker from Jain Community
Backward caste
Backward caste
General
General
Scheduled caste
Scheduled caste
Scheduled tribe
Scheduled tribe
Figure3.1.9: City wise distribution of respondents and social distribution
City
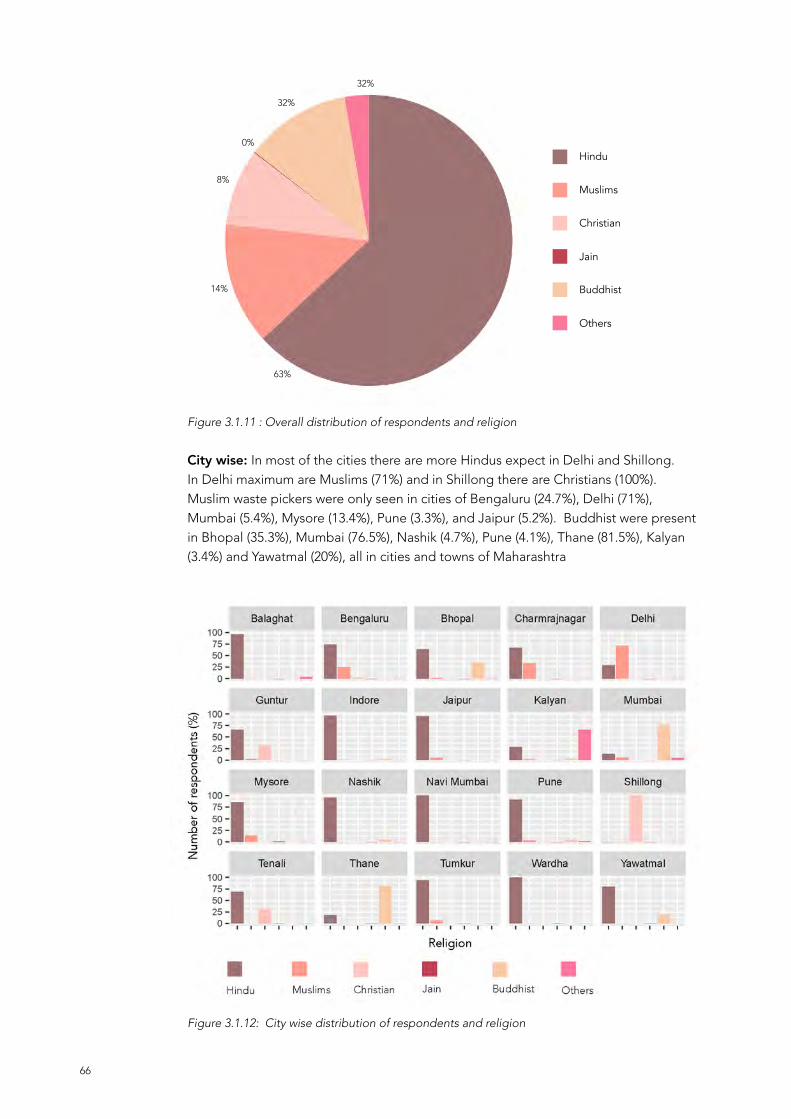
66
Figure 3.1.12: City wise distribution of respondents and religion
Hindu
Muslims
Christian
Jain
Buddhist
Others
Figure 3.1.11 : Overall distribution of respondents and religion
City wise: In most of the cities there are more Hindus expect in Delhi and Shillong. In Delhi maximum are Muslims (71%) and in Shillong there are Christians (100%). Muslim waste pickers were only seen in cities of Bengaluru (24.7%), Delhi (71%), Mumbai (5.4%), Mysore (13.4%), Pune (3.3%), and Jaipur (5.2%). Buddhist were present in Bhopal (35.3%), Mumbai (76.5%), Nashik (4.7%), Pune (4.1%), Thane (81.5%), Kalyan (3.4%) and Yawatmal (20%), all in cities and towns of Maharashtra
63%
14%
8%
0%
32%
32%

67
Family Type
More than two-third of the waste pickers were from nuclear family, only about 18 percent lived in a joined family, nearly about 4 percent of them were living alone without any family members, this includes those who were living away from family and also those do not have any family at all.
Joint family
Nuclear family
Single person
Figure 3.1.13: Overall Distribution of Respondents and Family Type
In cites of Pune, Indore, Mumbai, Bhopal and Bengaluru waste pickers were living in both joint family and nuclear family. In all other cities they were there were living as nuclear family. There were no persons living as single / or without family in Bhopal, Indore, Mumbai, Shillong, Thane, Balagat and Wardha
Joint family Nuclear family Single person
Figure 3.1.14 : City wise Distribution of Respondents and Family Type
78%
4%
18%

68
3.1.2 Waste Pickers Socio Demographics - Residence, Phone, Land Ownership
Socio-demographics Particulars Number of Respondents (N=1869)
Percent
Place of residence House 1574 84.2
Scrap Dealer Shop 34 1.8
Relative’s House 3 0.2
Friends’ House 2 0.1
Godown 40 2.1
Facility Provided by
scrap dealer
18 1
Streets 28 1.5
Government Shelter 107 5.7
Shifting places
everyday
5 0.3
Others 58 3.1
Location of dwelling Slum Colony 1278 68
Government Land 264 14
Private Land 223 12
Regular Colony 67 4
Possession of Phone Others 37 2
Normal GSM 1617 86.5
Smart Phone without
internet
56 3
Smart Phone with
internet
196 10.5
Ownership of Land Own Land 275 15
Do Not own land 1594 85

69
Residence
Among the respondents 1574 (84%) lived in their house, 5.7% lived in one or other Government shelter, 1.8% in scrap dealer shop, nearly about 2% resided in godowns and 1.5% lived on the streets. Very negligible percentage of waste pickers stayed in relatives house and friends house or shifted places every day, its around 0.2%, 0.1%, 0.3% respectively.
City wise: In all the cities maximum percentage of respondents stay in their house, Bengaluru (68%), Bhopal (66%), Delhi (91%), Guntur (94%), Indore (95%), Mumbai (99%), Pune (91%), shillong (100%), Tenali (97%), Tumkur (97%), Kalyan (100%), Jaipur (76%) and Yawatmal (100%). Only in cities of Bhopal (25%), Jaipur (6%), Mysore (43%), and Pune (1%) waste pickers stayed at Government shelters. Among the respondents from Japur (17%) stay at scrap dealers shop and waste pickers in Bengaluru, Mysore, and Tenali (3% each). In Bengaluru (4%), Mysore (7%) and Jaipur (1%) respondents lived in facility provided by scrap dealer
House
Scrap dealer shop
Relative’s house
Friends’s house
Godown
Facility provided by scrap dealer
Government shelter
Shifting places everyday
Others
Figure 3.1.15: Distribution of respondents and place of residence
84%
2%
0%
3%0%6%
2%
2%1%

70
Slum colony
Government land
Private land
Regular colony
Others
On looking at their area of dwelling 68% were located in slum colony, and 14 % in government land, 12% in private land. Only about 4% if the respondents dwelling are in regular colony.
Figure 3.1.17: Distribution of residence and area of dwelling.
Figure 3.1.16: City wise distribution (percentage) of place of residence
68%
14%
12%
4% 2%

71
City wise: Majority of waste pickers dwelling in Bengaluru city (60%) and Shillong (100%) are in private land, rest other cities most of the waste pickers dwelling are in slum colony. In cities of Jaipur (48%), Indore (76%) and Balaghat ( 77%) Majority of waste pickers dwelling are in Government land. Only in cities of Bengaluru (5%), Bhopal (15%), Guntur (3%), Indore (2%), Mysore (1%), Pune (5%), Thane (4%) and Jaipur (5%) waste pickers’ dwelling are in regular colony.
Phone
All the waste pickers are using cell phone (100%). Among them 86.5% are using Normal GSM phone, one-tenth of them use smart phone with internet.
Normal GSM
Smart phone without internet
Smart phone with internet
Figure 3.1.19 : Distribution of respondents and mobile phone use
Figure 3.1.18: City wise distribution of residence and area of dwelling.
86%
3%
11%
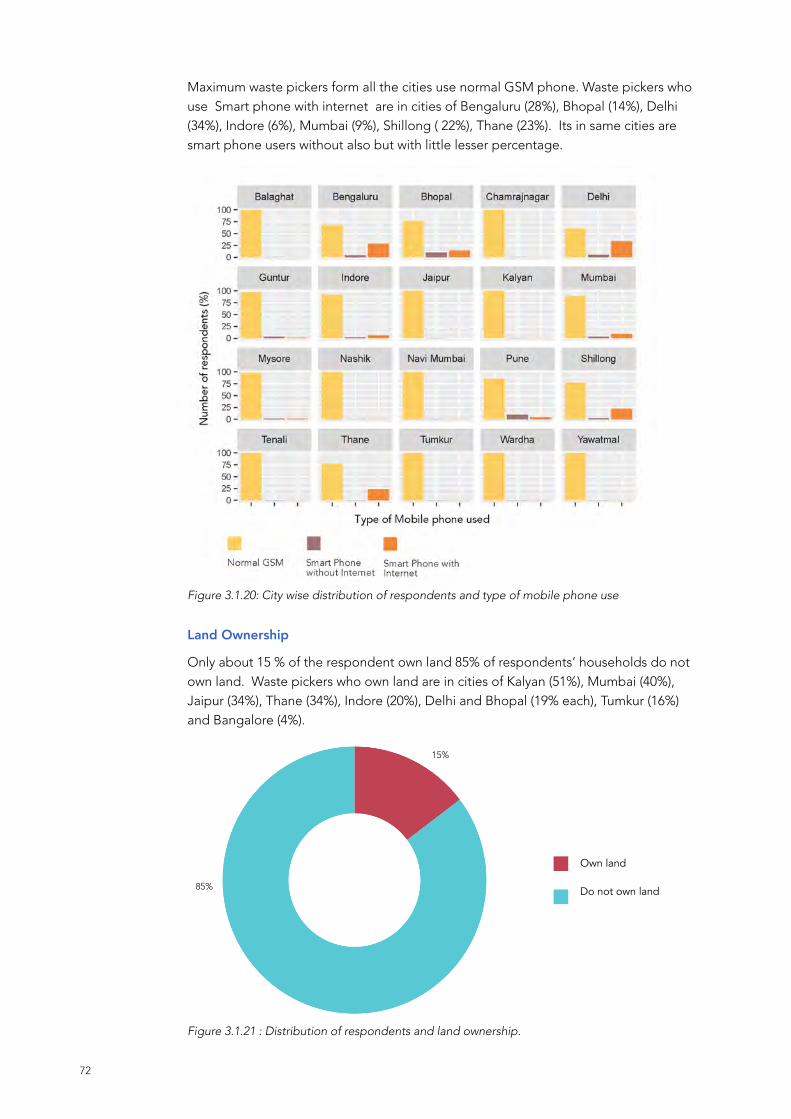
72
Figure 3.1.21 : Distribution of respondents and land ownership.
Maximum waste pickers form all the cities use normal GSM phone. Waste pickers who use Smart phone with internet are in cities of Bengaluru (28%), Bhopal (14%), Delhi (34%), Indore (6%), Mumbai (9%), Shillong ( 22%), Thane (23%). Its in same cities are smart phone users without also but with little lesser percentage.
Land Ownership
Only about 15 % of the respondent own land 85% of respondents’ households do not own land. Waste pickers who own land are in cities of Kalyan (51%), Mumbai (40%), Jaipur (34%), Thane (34%), Indore (20%), Delhi and Bhopal (19% each), Tumkur (16%) and Bangalore (4%).
Own land
Do not own land
Figure 3.1.20: City wise distribution of respondents and type of mobile phone use
15%
85%

73
3.1.3 Waste Pickers Socio Demographics – Source of Income/Monthly Income Source of Income-Main
Majority of the respondents main source of income was waste collection (93%), about 4.8 % were working for salary in waste collection/sorting, only about 1% were scrap dealers.
Waste collection Salary/wages Scrap dealing Business Others
Figure 3.1.23: Distribution of respondents and main source of income
Figure 3.1.22: City wise distribution of respondents and land ownership
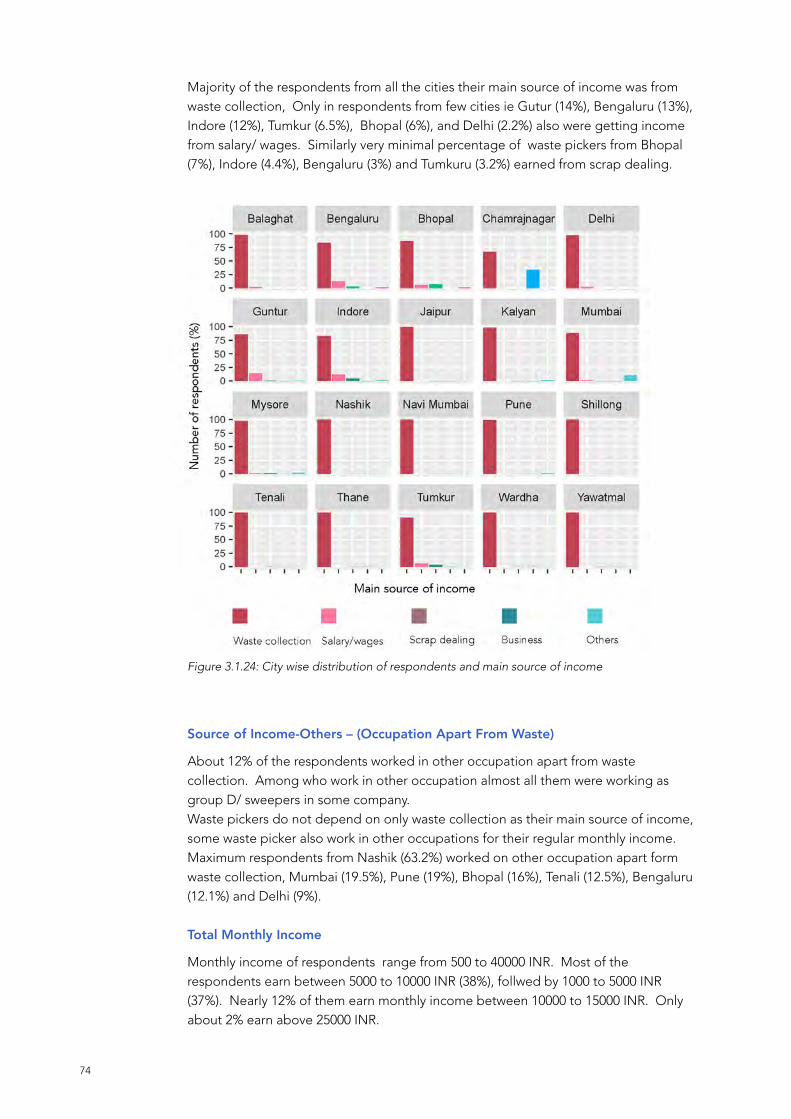
74
Figure 3.1.24: City wise distribution of respondents and main source of income
Majority of the respondents from all the cities their main source of income was from waste collection, Only in respondents from few cities ie Gutur (14%), Bengaluru (13%), Indore (12%), Tumkur (6.5%), Bhopal (6%), and Delhi (2.2%) also were getting income from salary/ wages. Similarly very minimal percentage of waste pickers from Bhopal (7%), Indore (4.4%), Bengaluru (3%) and Tumkuru (3.2%) earned from scrap dealing.
Source of Income-Others – (Occupation Apart From Waste)
About 12% of the respondents worked in other occupation apart from waste collection. Among who work in other occupation almost all them were working as group D/ sweepers in some company.Waste pickers do not depend on only waste collection as their main source of income, some waste picker also work in other occupations for their regular monthly income. Maximum respondents from Nashik (63.2%) worked on other occupation apart form waste collection, Mumbai (19.5%), Pune (19%), Bhopal (16%), Tenali (12.5%), Bengaluru (12.1%) and Delhi (9%).
Total Monthly Income
Monthly income of respondents range from 500 to 40000 INR. Most of the respondents earn between 5000 to 10000 INR (38%), follwed by 1000 to 5000 INR (37%). Nearly 12% of them earn monthly income between 10000 to 15000 INR. Only about 2% earn above 25000 INR.
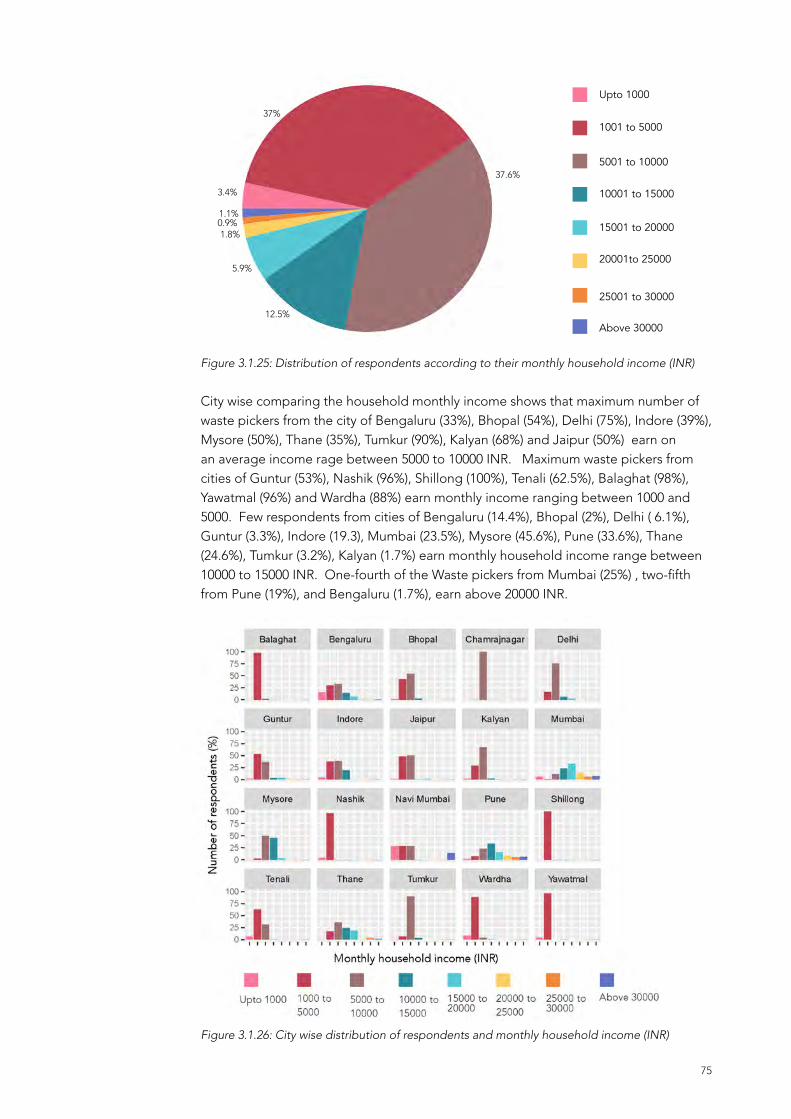
75
Upto 1000
1001 to 5000
5001 to 10000
10001 to 15000
15001 to 20000
20001to 25000
25001 to 30000
Above 30000
Figure 3.1.25: Distribution of respondents according to their monthly household income (INR)
City wise comparing the household monthly income shows that maximum number of waste pickers from the city of Bengaluru (33%), Bhopal (54%), Delhi (75%), Indore (39%), Mysore (50%), Thane (35%), Tumkur (90%), Kalyan (68%) and Jaipur (50%) earn on an average income rage between 5000 to 10000 INR. Maximum waste pickers from cities of Guntur (53%), Nashik (96%), Shillong (100%), Tenali (62.5%), Balaghat (98%), Yawatmal (96%) and Wardha (88%) earn monthly income ranging between 1000 and 5000. Few respondents from cities of Bengaluru (14.4%), Bhopal (2%), Delhi ( 6.1%), Guntur (3.3%), Indore (19.3), Mumbai (23.5%), Mysore (45.6%), Pune (33.6%), Thane (24.6%), Tumkur (3.2%), Kalyan (1.7%) earn monthly household income range between 10000 to 15000 INR. One-fourth of the Waste pickers from Mumbai (25%) , two-fifth from Pune (19%), and Bengaluru (1.7%), earn above 20000 INR.
Figure 3.1.26: City wise distribution of respondents and monthly household income (INR)
37%
37.6%
3.4%
1.1%0.9%1.8%
5.9%
12.5%

76
WP type On comparing the type of waste pickers, about 44 % of the free roaming local waste picker earn between 1000 to 5000 and 34% earn between 5000 to 10000 INR. One-tenth of the free roaming waste pickers earn between 10000 to 15000,5% between 15000 to 20000 and only 2% above 25000 INR. Among the waste sorters 47% earn 1000 to 5000, and 42% between 5000 to 10000, 8% 10000 to 15000 INR. Among the Door-to-Door collectors 50% earn 5000 to 10000 followed by 18% 10000 to 15000 INR, 16% 1000 to 5000, 4% between 20000 to 25000 INR. There were 4% of the door to doo collectors who earn above 25000, some earn as high as 40000. Among those who earn above 25000 INR majority of them are door-to-door collectors.
Free roaming migrant
Itinerant buyer
Waste sorter
Door-to-door collector
Other informal worker
OthersFree roaming/independent local
Figure 3.1.27 : Distribution of type of waste pickers and household monthly income
Monthly Income From Waste Collection
Monthly income from waste collection range from 500 to 40000 INR. About 45% earn between 5000 to 10000 INR, 40% between 1000 to 5000 INR, 1% earn above 20000 INR.Similar to findings of household monthly income , maximum number of waste picker earn between 5000 to 10000 INR.
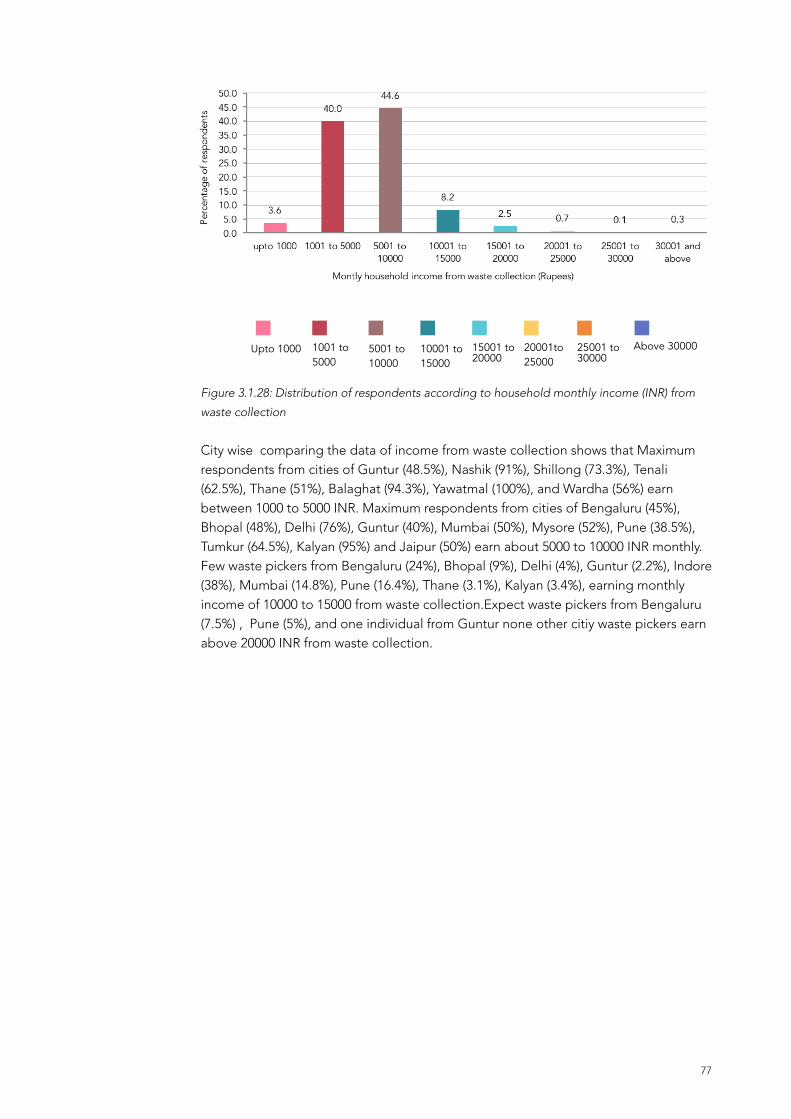
77
Figure 3.1.28: Distribution of respondents according to household monthly income (INR) from
waste collection
City wise comparing the data of income from waste collection shows that Maximum respondents from cities of Guntur (48.5%), Nashik (91%), Shillong (73.3%), Tenali (62.5%), Thane (51%), Balaghat (94.3%), Yawatmal (100%), and Wardha (56%) earn between 1000 to 5000 INR. Maximum respondents from cities of Bengaluru (45%), Bhopal (48%), Delhi (76%), Guntur (40%), Mumbai (50%), Mysore (52%), Pune (38.5%), Tumkur (64.5%), Kalyan (95%) and Jaipur (50%) earn about 5000 to 10000 INR monthly. Few waste pickers from Bengaluru (24%), Bhopal (9%), Delhi (4%), Guntur (2.2%), Indore (38%), Mumbai (14.8%), Pune (16.4%), Thane (3.1%), Kalyan (3.4%), earning monthly income of 10000 to 15000 from waste collection.Expect waste pickers from Bengaluru (7.5%) , Pune (5%), and one individual from Guntur none other citiy waste pickers earn above 20000 INR from waste collection.
Upto 1000 1001 to 5000
5001 to 10000
10001 to 15000
15001 to 20000
20001to 25000
25001 to 30000
Above 30000
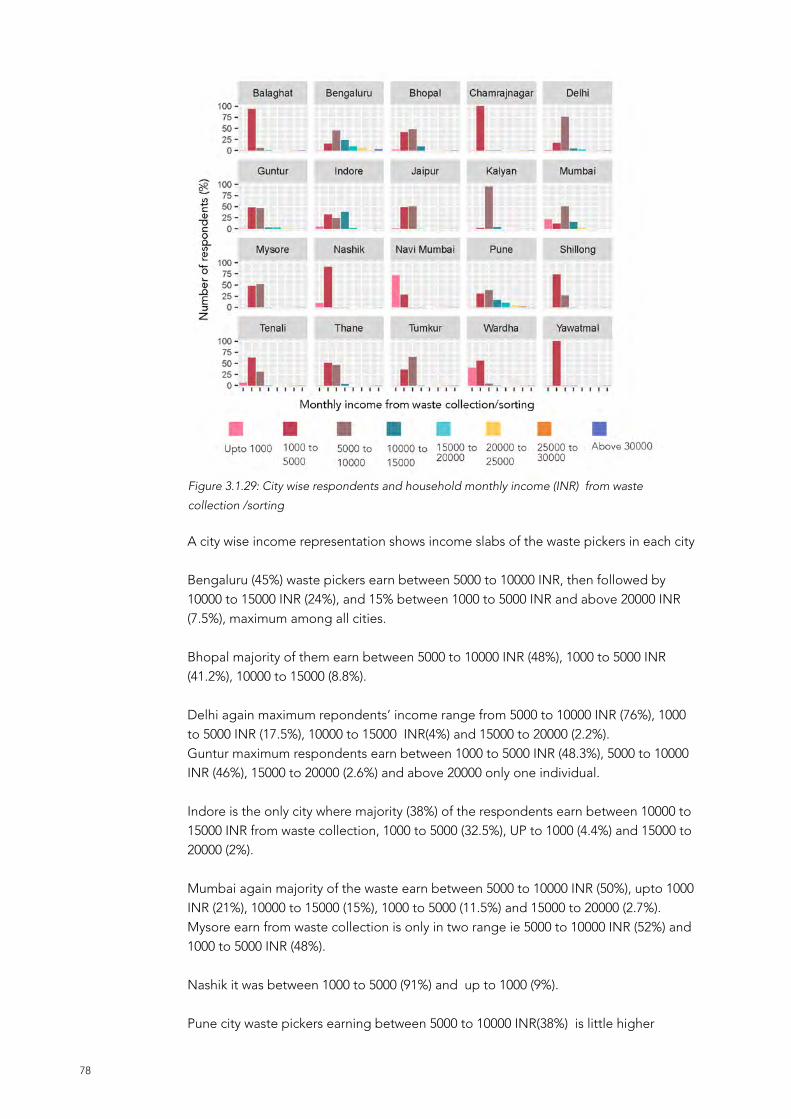
78
A city wise income representation shows income slabs of the waste pickers in each city
Bengaluru (45%) waste pickers earn between 5000 to 10000 INR, then followed by 10000 to 15000 INR (24%), and 15% between 1000 to 5000 INR and above 20000 INR (7.5%), maximum among all cities.
Bhopal majority of them earn between 5000 to 10000 INR (48%), 1000 to 5000 INR (41.2%), 10000 to 15000 (8.8%).
Delhi again maximum repondents’ income range from 5000 to 10000 INR (76%), 1000 to 5000 INR (17.5%), 10000 to 15000 INR(4%) and 15000 to 20000 (2.2%). Guntur maximum respondents earn between 1000 to 5000 INR (48.3%), 5000 to 10000 INR (46%), 15000 to 20000 (2.6%) and above 20000 only one individual.
Indore is the only city where majority (38%) of the respondents earn between 10000 to 15000 INR from waste collection, 1000 to 5000 (32.5%), UP to 1000 (4.4%) and 15000 to 20000 (2%).
Mumbai again majority of the waste earn between 5000 to 10000 INR (50%), upto 1000 INR (21%), 10000 to 15000 (15%), 1000 to 5000 (11.5%) and 15000 to 20000 (2.7%).Mysore earn from waste collection is only in two range ie 5000 to 10000 INR (52%) and 1000 to 5000 INR (48%). Nashik it was between 1000 to 5000 (91%) and up to 1000 (9%).
Pune city waste pickers earning between 5000 to 10000 INR(38%) is little higher
Figure 3.1.29: City wise respondents and household monthly income (INR) from waste
collection /sorting

79
compared to 1000 to 5000 INR (30.3%), 10000 to 15000 INR (16.4%), 15000 to 20000 INR (10%) and above 20000 INR (5%).
Shillong Maximum waste picker earn monthly income from waste is ranging between 1000 to 5000 INR (73%) and 5000 to 10000 (27%).
Tenali , similar to Shillong, also maximum waste pickers are earning between 1000 to 5000 INR ( 62%) and 5000 to 10000 INR (31%).
Thane city shows the same pattern but difference between the range is very minimal 1000 to 5000 INR (50%), 5000 to 10000 INR (46.2%) and only two members earn between 10000 to 15000 INR.
Among the smaller cities Kalyan waste pickers are much better off, majority earn between 5000 to 10000 (95%) and 10000 to 15000 INR (3.5%). Whereas in Balaghat maximum member income range from 1000 to 5000 INR (95%) and 5000 to 10000 INR (6%). Situation is different in Jaipur, almost is 50 % each between 1000 to 5000 and 5000 to 10000 INR
WP Type Comparing the type of waste picker and monthly income from waste collection reveals that maximum number of free roaming indepent local earn between 1000 to 5000 INR (48%) and followed by 5000 to 10000 INR (39%), very few of the free roaming indepent waste picker earn between 10000 to 15000 INR (6%). Among the free roaming migrant maximum earn between 5000 to 10000 (53%), 10000 to 15000 INR (18%). Itenerant buyers also is similar to migrant maximum earn between 5000 to 10000 INR (50%), 1000 to 5000 INR (42%) and around 8% earn between 10000 to 15000 INR. Door-to-door collectors are better off among all, maximum percent of the respondents earn between 5000 to 10000 INR (55%), 1000 to 5000 INR (23%), 10000 to 15000 INR (11%), and above 20000 INR (4.2%).
Upto 1000 1001 to 5000
5001 to 10000
10001 to 15000
15001 to 20000
20001to 25000
Figure 3.1.30 :Distribution of repondents according to type of water picker and monthly income
(INR) from waste collection

80
3.1.4 Waste Pickers Socio Demographics – ID Card/ Bank Account/SHG/Loan
Identiy Card
Almost Nighty eight percent of the respondents had one or other identiy card, only 2 percent did not posses any. Among those who had ID card 89% of them had Adhar card, 65% voter ID card, 50% ration card. Nearly 37% of the respondents even had pan card.
Adhar card/UID
Voter ID
Pan card
Ration card
BPL card
Driving license
None
Others
Figure 3.1.31: Repondents and possesion of identity card
City wise From the data it is observed that majority (more than 90%) of the waste pickers from all the cities posses adhar card, except in cities of Bengaluru (87%) , Delhi (85%) and Shillong (38%). Those respondents who posses pan card maximum are from Mumbai (81%), Nashik (73%), Pune (71%), Thane (77%), Kalyan (78%), Bengaluru (43%), Delhi (38%), Guntur (14.5%), Mysore (42%) and Tumkur (25%). Similarly respondents from these also posses ration card, among these lowest percentage of respondents who have ration card are from Delhi (21%), other cities are little better.
19%
7%
1% 2%
13%
24%
33%
1%

81
Bank Account
Availability of Bank account : About 58% of the waste pickers have bank account.
Bank account
No bank account
Figure 3.1.30 :Distribution of repondents with bank account
City wise Majority of the waste pickers from Pune city (94%), Indore (82%), Mumbai (85%) have bank account. Very least percentage (6 to 15%) of Waste pickers from Tenali, Balaghat and Jaipur posses bank account.
Figure 3.1.32: Distribution of respondents and posession of identity card
58%
42%

82
Waste picker type Among the type of waste pickers eighty three percent of itenerant buyers, seventy five percent of door-to-door collectors, 58% of waste sorters, 53% free roaming local waster pickers have savings account one or other type of bank. Type of Bank Account: Among those who posses bank account 56% have a account in nationalized bank, 19% each in cooperative bank and Jan Dhan Yoja account. Only about 4% have account in post office.
Saving in nationalized bank
Saving in cooperative bank
Jan dhan yojana
Post office
Others
Figure 3.1.35: Distribution of respondents and type of bank account
Figure 3.1.34: City wise distribution of respondents with bank account
56%
2%4%
19%
19%

83
City wise Maxmimum waste pickers in Bengaluru (92%), Delhi (66%), Guntur (75.3%), Indore (44%), Mumbai (75.6%), Pune (80%), Thane (92%) posses acount in Nationalized banks. Maximum waste pickers from Bhopal (53.2%) and Shillong (81.6%) have their account in Cooperative Banks. Almost 97% of waste pickers from Nashik have Jan Dhan Yojana account. Only in Mysore city maximum waste pickers have savings account in Post Office. From the data it suggests that the post office is least preffered for saving bank account, and Nationalized banks are highly preferred.
WP Type On comparing waste picker wise bank account, it shows that almost all types of waste pickers have bank account in one or other type of banks. Amongst them majority of the itenerant buyers (83%) and Door-to-door collectors (75%) have account in banks. About 53% of free roaming/independent local and 43% of free roaming migrant hold bank account.
Figure 3.1.36: City wise distribution of respondents and type of bank account

84
Yes No
Figure 3.1.37 : Distribution of type of waste pickers and of bank account
Bank Type Looking at the bank account holders based on account in type of bank, Nationalized bank is the prefered type of bank for their account. Maximum respondents of free roaming have account in nationalized bank (53%), 18 percent in cooperative bank, 24% in Jan Dhan Yojana and 6% in post office. Similarly migrant waste pickers also have in nationalized bank (59%), cooperative bank (26%), Jan Dhan Yojana (15%) and none in post office. Percentage of Waste sorters who hold account are 58% in nationalized bank, 31% in cooperative banks and only 4% in post office. Maximum percent of door-to-door collectors have account in nationalized bank (72%), cooperative bank (17%), Jan Dhan Yojana (12.5%) and Post Officer (2%). Itinerant buyers have accound in nationalized (60%) and cooperative banks (40%).
Nationalized bank
Co-operative bank
Jan dhan yojana
Post office Others
Figure 3.1.38: Distribution of type of waste picker and account in bank (type)
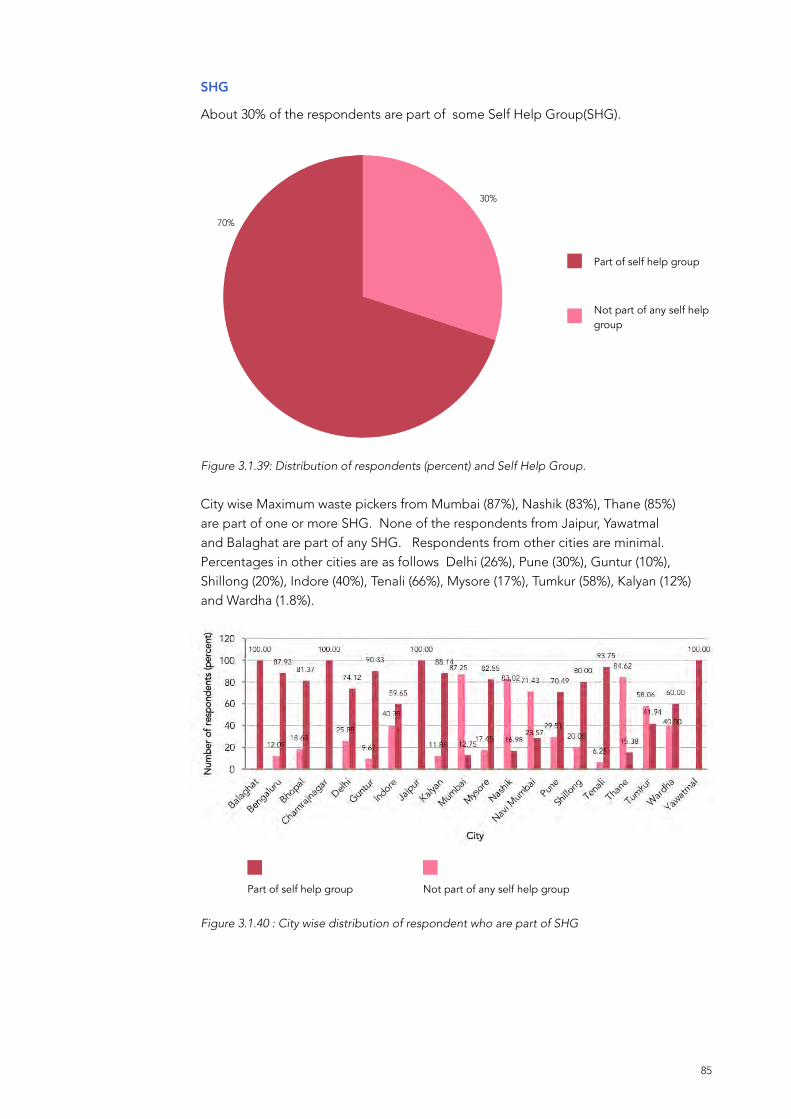
85
SHG
About 30% of the respondents are part of some Self Help Group(SHG).
Part of self help group
Not part of any self help group
Figure 3.1.39: Distribution of respondents (percent) and Self Help Group.
City wise Maximum waste pickers from Mumbai (87%), Nashik (83%), Thane (85%) are part of one or more SHG. None of the respondents from Jaipur, Yawatmal and Balaghat are part of any SHG. Respondents from other cities are minimal. Percentages in other cities are as follows Delhi (26%), Pune (30%), Guntur (10%), Shillong (20%), Indore (40%), Tenali (66%), Mysore (17%), Tumkur (58%), Kalyan (12%) and Wardha (1.8%).
Part of self help group Not part of any self help group
Figure 3.1.40 : City wise distribution of respondent who are part of SHG
30%
70%

86
Part of self help group Not part of any self help group
Figure 3.1.41: Distribution of respondents according type of waster picker and SHG
Waste picker Type Among those who are part of SHG majority are free roaming local waste picker (73%), but very few of Door-to-Door collectors(16%), waste sorter (4.3%) and itenerant buyer (0.5%) are part of SHG. Nearly one-forth of the itenerany buyers, one-third of the free roaming local, 16 % of free roaming migrant, 17% of waste sorters and one-forth of the Door-to-door collectors are are part of SHG.
Free roaming migrant
Itinerant buyer
Waste sorter
Door-to-door collector
Other informal worker
OthersFree roaming/independent local
Figure 3.1.42: Part of SHG and type of waste picker

87
Loan
Source of Loan Only about twenty two percent of the respondents have availed loan from any sources. Among those who have availed loan their main source is from Self Help Group (28%), followed by Microfinance (18%), friends (14%), and money lenders as well as scrap dealers (13%). Only minimum (7%) of respondents have availed load from any nationalized bank.
Availed
Not availed
Figure 3.1.43: Distribution of respondents and loan
Figure 3.1.44: Source of loan
Nationalized bank
Cooperative bank
Money lender
SHG
Microfinance
Friends
Scrap dealer
Employer
22%
78%
13%
14%
18% 29%
13%
4%
7%2%

88
Availed Not availed
City wise data on availing loan reveals that respondents from Mumbai (76.5%) have availed loan from one or other sources and least is from Shillong (5%). Repondents from Yawatmal, Nashik, and Kalyan have not availed any loan. Few respondents from other cities also have availed loan, Bengaluru (15%), Bhopal (37%), Delhi (7.5%), and Guntur (8.9%).
Figure 3.1.45: City wise percent of respondents availed loan
Waste Picker Type Among the type of waste pickers, free roaming local waste pickers have recevied loan from their employers(90%), money lenders(87%), SHG (84%), friends (74%), Microfinance (70%), Co-operative society(57%). Only about fifty one percent have availed loan from nationalized banks. It’s the door-to-door collectors who avail from nationalized bank maximum (30%).
Free roaming migrant
Itinerant buyer
Waste sorter
Door-to-door collector
Other informal worker
OthersFree roaming/independent local
Figure3.1.46: Distribution of respondents based on source of loan and type of waste picker
Source of loan availed

89
Purpose of Loan Respondents who have availed loan said the Main reason for availing loan was for house (21%) and health (20%), marriage and health (11% each), family business (12%) , business and vehicle (6 and 5% respectively).
House
Yes
Vehicle
No
Business
Don’t know
Family member business
Don’t remember
Children education
Marriage
Health
Others
Figure 3.1.47 : Purpose of loan
3.1.5 Waste Pickers Socio Demographics – Health Health
The data collected revealed that fifty four percent of the respondents in last three months have had one or other health issues due to their current occupation of waste collection. Among those who had health issues complained of skin complaints (22%), minor cuts (20%), backache/bodyache (20%), Animal and insect bite (14%). About two percent of the waste pickers had permanent damage to body parts.
Figure 3.1.48: Health issues due to waste collection (percent)
21%
14%
20%
11%
11%
12%
5%
6%
34%
8%
4%
54%

90
Minor cuts
Major cuts
Accident/RTA
Skin infection
Backache/bodyache
Permanent damage tobody parts
Animals bites
Respiratory issues
Burns/chemical injury
Insect bites
Others
Figure 3.1.49 : Type of health issues due to waste collection
3.2 Waste Practices
3.2. 1 Type of Waste/Model of Collection/Place of Collection/Time of CollectionThis section describes the results of waste collection, sorting and selling practices of the waste pickers.
Figure 3.2.1: Distribution of respondents and number of years in waste collection
Up to 5
6 -10 11-15 16-20 21-25 26-30 31-35 41-4536-40 46-50
22%
2%
5%
23%
1%7%
7%
3%
7%
3%
20%
91
Number of years waste pickers in the current occupation of waste collection, sorting and other related work range from 1 year to 60 years. About one-fourth of the respondents were in waste collection occupation since six to ten years, about twenty percent of the waste pickers are working around 11 to 15 years and 16% were involved over past 16 to 20 years. Near 5 % were working for nearly 40 to 50 years.
City wise data In cities like Pune, Delhi, Shillong and Kalyan a higher number of waste pickers were found to be working between 11 to 15 years. Over seventeen percent of the respondents are in their first year of waste collection, and about 20% in their second year. In most of the cities , a majority of the waste pickers are working for 6 to 10 years in waste collection with Balaghat at a maximum (68%) followed by Bengalore (20%), Bhopal (26%), Guntur (35%), Mysore (32%), Pune (34%), Shillong (27%), Tumkur (32%), Jaipur (30%) and Wardha (52%). In the next grouping working between 11-15 years the highest number of waste pickers were found to be in the cities of Kalyan (30%) and Delhi (28%) followed by Bengaluru(20%), Bhopal (16%), Guntur (20%), Indore (16%), Mumbai (10%), Nashik (12.3%), Pune (32%), Shillong (23%), Tenali (31%), Thane (14%), Jaipur (25%), Yawatmal (16%) and Wardha (20%). Maximum number of respondents in the cities of Indore (25%), Mumbai (25.5%), Nashik (26%), Thane (21.5%), and Yawatmal (20%) are working between 16 to 20 years in waste collection. Waste picker working between 31 to 40 years were found to be maximum in Yatwal (20%), Mumbai (16%) followed by Nashik (14%), Thanke (11%), Indore (10%), Shillong (6%), Bengaluru (4%) Mysore (9%), Wardha (4%), Jaipur (3%), and Bhopal 3%. Waste pickers from Mumbai (8.7%), Indore (4.4%), Thenali (3%), Mysore (3.4%) and Jaipur (2.1%) are working above 40 years in waste in waste collection.
Waste Picker Type: Among the free roaming/independent local , a maximum number of respondents are working in waste collection between 6 to 10 years (26%), followed by 11 to 15 years (19%), 16 to 20 years (18%), 21 to 25 years (11%), 26 to 30 years( 8%), and 31 to 40 years (7.4%). Only about 1.4% of the free roaming/indepent local waste pickers have started waste collection recently less than one year, and about 2.4% between 2 to 3 years. Among the free roaming migrant maximum are working between 6 to 10 years (21%) followed by 4 to 6 years and 6 to 10 years 18% each, about 11% are working since 11 to 15 years, 10% upto one year, very few are working above 30 years (3.2%) in waste collection. Among the itinerant buyers, one third of them (33%) are working between 6 to 10 years, 25% between 16 to 20 years, 21 to 25 years (17%), 8.3% each between 26 to 30 years and 4 to 5 years. There are no itinerant buyers in last 3 years. Waste sorters are working for more number of years, among them maximum 11 to 15 years (18%), followed by 6 to 10 years (16.4%), 16 to 20 years (15.7%), and about 8% have started sorting less than one year.

92
Type of Waste
According to the data received from waste pickers majority of them collect all type of waste/ mixed waste (dry waste only) which includes paper, plastic, metals etc. There are some waste collectors who collects only few materials specifically either single or few combined such as paper (39%), Cardboard (35%), plastics (41%), Metals (34%), others collect Glass, Clothes/textile, E-waste, 23%, 13% and 14 respectively. There few who collect only hair and bone (3%).
Figure 3.2.3: Distribution of respondents and type of waste they collect
Figure 3.2.2: Distribution of respondents and number of years in waste collection
Mixed/all type
Paper Cardboard
Plastics Metals Hair Bones GlassClothes/textile
E-waste Others
93
City wise data In almost all cities majority of the the waste pickers collected all type of waste, except for Thane and Wardha where they collect only specific items.
Balaghat and Jaipur: collect only mixed type (100%),
Bengaluru : majority collect all type of waste (82%), paper (69%), cardboard (67%), plastics (66%), metals (48%), Hair (24%), Bones (5%), Clothes/textile (26%), glass (47%), and E-waste (25%).
Bhopal : majority collect paper and cardboard (75%), followed by all types and plastics (72%), hair (50%) metals (72%), bones 24%, glass (40%) and ewaste 23%. The collection of hair was found to be the highest in Bhopal .
Delhi : Maximum ( nearly 97%) collect all type, paper (19%), Cardboard (16.2%), plactics (21%), metals (3%), and hair (3%).
Guntur: All types (88%), paper (4.5%), Cardboard (4%), plastics (14%) and metals and hair (3%). Indore : Maximum collect all types (95%), paper, metals and plastic (51%), hair (40%) next highest among all cities, bone (3%), clothes (31%) , glass (48%), and E-waste (7%).
Mumbai: Maximum waste pickers collected plastics (78%), followed by paper (75%), cardboard (71%), e-waste (70%), metals (69%), all type (68%), bones (6%), hair (5%) and clothes/textiles (54%).
Mysore: Maximum collect paper (79%), plastics (78%), cardboard and all type (77%), hair (25%), bones (7%), cloth (23%), glass(32%) and E-waste (21%).
In Shillong, Tumkur and Thenaili 100 % waste pickers collect all types, in Pune almost all 99% collect all types. Majority waste picker in Thane collect plastics (95%) and metals (94%), cardboard (94%).
Waste picker type: Almost all type of waste pickers collect all types.
Free roaming independent collect all types ( 84%), paper (41%), cardboard (37%, plastic (42%), Metals (37%), hair (10%), bones 2.2 %, clothes 12%, glass 24%, and e-waste (16%).
Free roaming migrant: maximum waste pickers collect all types (74%), paper and plastic each (73%), cardboard (68%), hair (65%), bones (31%), clothes (23%), glass (53%), and E-waste 55%.
Door-to-door collectors: Maximum collect all type of waste, followed by plastic ( 21%) paper (21%) cardboard 19% and 12 % collect hair.

94
Mode of Collection
For all the waste collection, main mode of collection is walking on foot carring bag (70%), next prefered mode was E-Cycle (10.3%), followed by push cart (9%), bicycle (6.6%). The mode of collection also suggests reason for occupation health such as bodyache/backache
On foot carrying bag
Bicycle
Non-motorised tricycle
Motorised tricycle
Push Cart
E-cycle
Auto
Others
Figure 3.2.4: Distribution of respondents and mode of collection
City wise data:In almost all the cities the main mode of collection of waste is on foot, carrying a bag. This is except in Delhi and Pune where the main mode is E-cycle in Delhi and and by push Cart in Pune.
Balaghat: Majority of waste picker collect on foot (79%), bicycle (19%), non motorised tri-cycle( 2%). Bengaluru : Majority on foot ( 55%), followed by auto ( 22%), and bicycle (15%).
Bhopal : About 63% collect on food, and 20% on non motorised tricycle, bicycle (18%), 7% on push cart and about 3% use motorised tricycle.
Delhi : Majority collect on E-Cycle, on foot, bicycle, and non mortorised its about 6% each.
Guntur: Collection here is mainly on foot(80%) and push cart (12%)
Indore: Almost 98% collect on foot and only about 2% on push cart.
Pune : 79% collect on push cart and about 23% by auto. In cities of Kalyan, Nashik, Shillong, Tumkur, Yawatmal and Wardha everyone collect only on foot. Waste picker type: Almost all type of waste picker collect waste on foot carrying bag except for door-door to colletor 36% on e-cycle and push cart (30%) .
65%
6%
2%
2%
8%
10%
4%3%

95
Place of Collection
About fifty seven percent of the waste picker collect waste from the same area they live in. Only about one-third (35%) collect in other areas also. Nearly about one third of the respondents said they collect anywhere on the streets as they walk or where ever they go. Only about 17% collect from households. There were only 7.5% of the waste pickers who collected from the areas approved by municipality door-to-door. This also demonstrates that integration of waste pickers has not been implemented properly by the municipalities. There are still about 10% of people who collect waste materials from landfills
Figure 3.2.5: Distribition of respondents (percent) according to placeof waste collection
City wise data : In the cities of Bengaluru (97%), Delhi (60%), Guntur( 47%), Mumbai (48%), Nashik (98%), Tenali (72%) and Jaipur (96%) majority of the waste pickers collect waste from the same areas where they live. In cities of Bhopal (53%), Indore (70%), Mysore (87%), Balaghat (87%), and Yawatmal (96%) majority of waste pickers collect waste in other areas. In Shillong, its anywhere on the streets, without any boundary,
Same area where living
Garbage lorry
Other areas also
From ports
Anywhere on the streets
Appar-tments
From households
Transfer points
Garbagepile/heaps
Market place
Factory
Whole sale Yards
Shops/malls
Municipalapproved area door-to-door
Landfill
Others
Secondary points
27%
17%
8%
8.1%
5.4%
2.4%
4.3%
4.6%
1.1%0.7%
0.4%
4.2%
1.6%2.2%
0.3%3.6% 1.3%

96
and Tumkur (65%) collection from transfer points was the highest. Waste pickers from Pune (18%), Guntur (10%) Bengaluru ( 12%), and Bhopal (22%), collect in municipal provided area.
Bengaluru: apart from same street waste pickers collect from other places (55%), house hold (14%), shops/malls (6%), market place (7%), apartment (5%).
Bhopal: majority collect from other areas (53%), same area (44%), and anywhere on the street (31%), from garbage pile (33%), municipality provided area (22%), household and landfill (18% each), shops and mall (20%) and apartment (17%).
Delhi: Majority waste picker collect in same area they live in, from other areas (34%), household (28%), apartment (24%), anywhere on the streets (12%), landfill (9%), and market place (6%).
Guntur: Most of the waste pickers collect in same area (47%), other areas (36%), anywhere on the streets (30%), municipality provided area (10%), house hold (7%), Garbage, factory and shops/ mall (4% each).
Indore: Majority collect in other areas (70%), anywhere on the street (42%), Garbage piles (25%), same area (19%), factory (9%), household (8%), shop / mall and landfill (4% each).
Mumbai : Majority collect in same area (48%), other areas (25%), anywhere on the streets (19%), landfill (11%), factory (10%), transfer points ( 9%), shop/malls (5%), market place and apartment 3% and 2 % respectively.
Mysore :Waste pickers collect waste from almost all possible sources, majority of waste pickers collect from other areas they live in, same area (66%), anywhere on street (70%), house hold (46%), garbage heap/pile (27%), shops/malls (25%), factory (22%), secondary point (23%), garbage lorry (17%), transfer point (9%) market place (8%) and from landfill its about (15%).
Nashik: Most of the waste pickers collect in same area (98%), other areas (15%) anywhere on the streets (53%), shop/mall, (10%), garbage pile (9%), land fill (8%), transfer point and municipality provided area 3% each.
Pune :Maximum waste pickers collect from source . Majority collect from house hold (67%), apartment (57%), municipality provided area (34%), shops/malls, and on the streets (4% each), same street, least among all cities (2%).
Shillong : Waste pickers collect on the streets, and maximum from landfill (47%), and same street (45%).
In cities of Jaipur, Yawatmal and Wardha almost all wastepickers collect on the street, Tenali, maximum same street (72%), anywhere on the street (50%), and landfill, garbage and factory was 3% each.

97
Time of Collection
Generally waste pickers have their own time of collection on their convinience and need. Among the waste pickers who participated in the survey around 38% of them collect waste full day, and equal percentage (37%) collect early moring. Few of the waste pickers collect only half day (17%), evening (2.3%) only. Less than 1 % collect only at night, about 3% of the respondents did not have specific time of collection, they collected at their convieneince.
Half day
Half day
Early morning
Early morning
Evening only
Evening only
Night only
Night only
No Specific time
No specific time
Others
Others
Full day
Full day
Figure 3.2.6: General time of waste collection
Figure 3.2.7: Distribution of respondents (responses) and time of waste colleciton
39%
1%3%1%2%
37%
17%
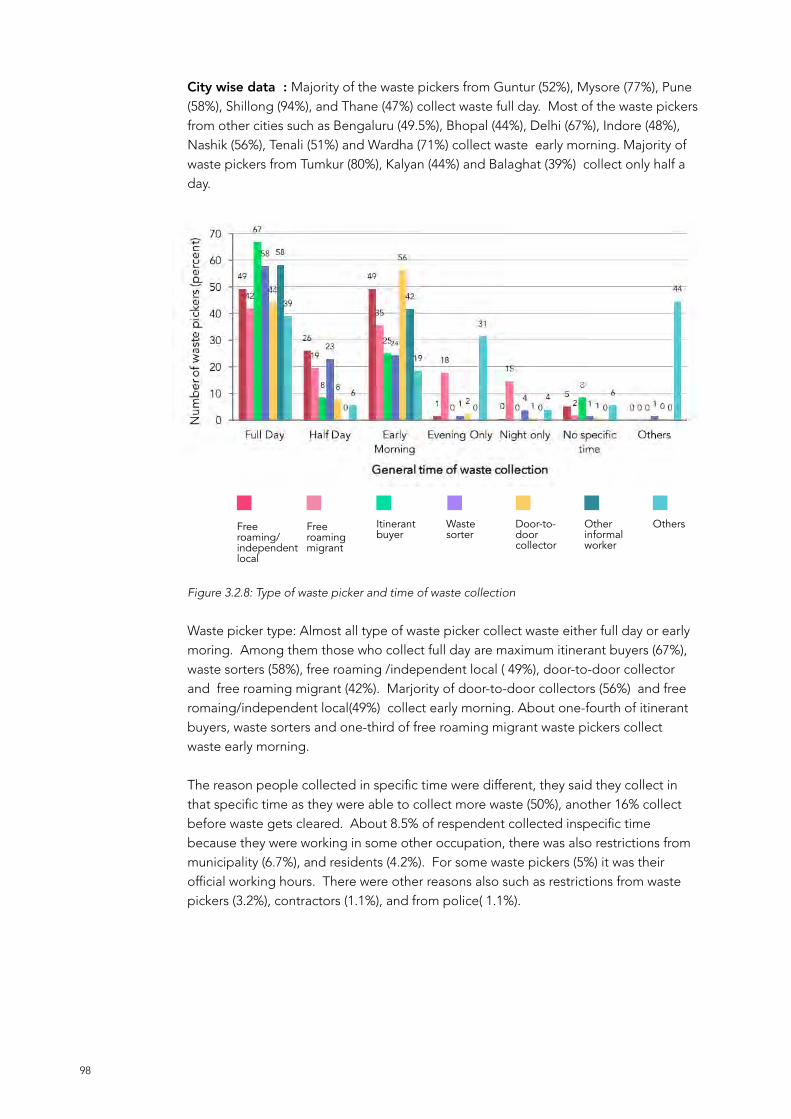
98
City wise data : Majority of the waste pickers from Guntur (52%), Mysore (77%), Pune (58%), Shillong (94%), and Thane (47%) collect waste full day. Most of the waste pickers from other cities such as Bengaluru (49.5%), Bhopal (44%), Delhi (67%), Indore (48%), Nashik (56%), Tenali (51%) and Wardha (71%) collect waste early morning. Majority of waste pickers from Tumkur (80%), Kalyan (44%) and Balaghat (39%) collect only half a day.
Free roaming migrant
Itinerant buyer
Waste sorter
Door-to-door collector
Other informal worker
OthersFree roaming/independent local
Figure 3.2.8: Type of waste picker and time of waste collection
Waste picker type: Almost all type of waste picker collect waste either full day or early moring. Among them those who collect full day are maximum itinerant buyers (67%), waste sorters (58%), free roaming /independent local ( 49%), door-to-door collector and free roaming migrant (42%). Marjority of door-to-door collectors (56%) and free romaing/independent local(49%) collect early morning. About one-fourth of itinerant buyers, waste sorters and one-third of free roaming migrant waste pickers collect waste early morning.
The reason people collected in specific time were different, they said they collect in that specific time as they were able to collect more waste (50%), another 16% collect before waste gets cleared. About 8.5% of respendent collected inspecific time because they were working in some other occupation, there was also restrictions from municipality (6.7%), and residents (4.2%). For some waste pickers (5%) it was their official working hours. There were other reasons also such as restrictions from waste pickers (3.2%), contractors (1.1%), and from police( 1.1%).
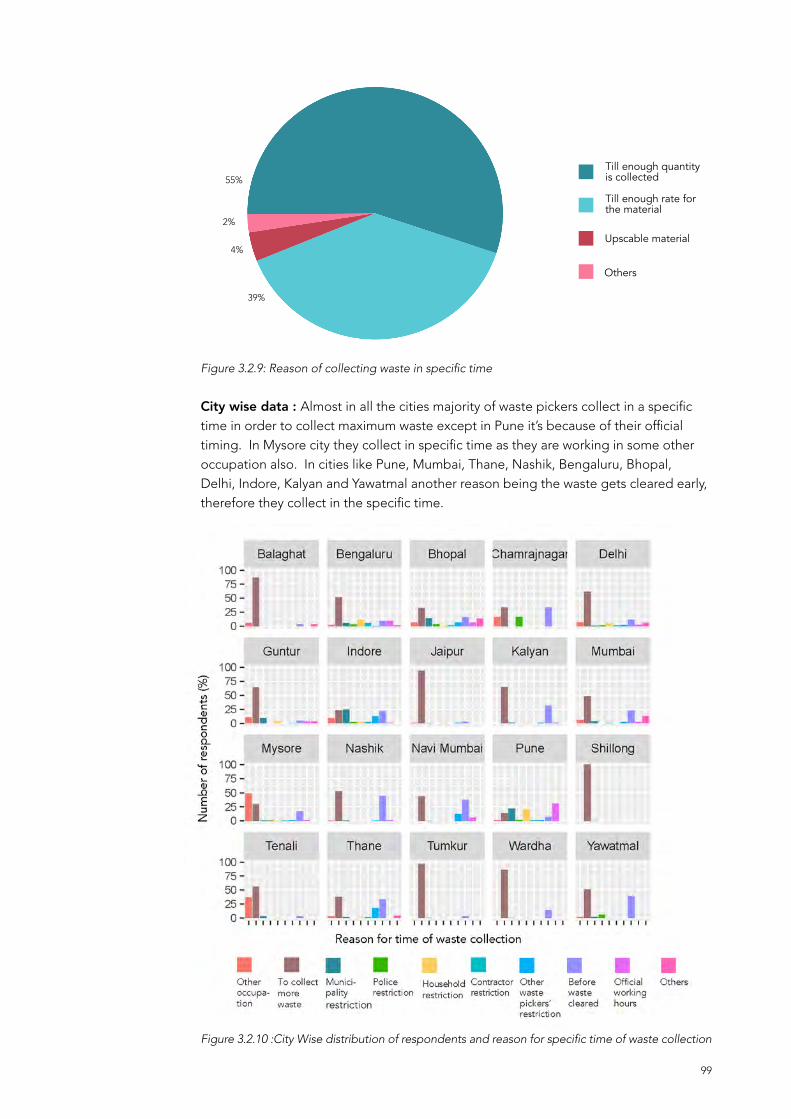
99
Upscable material
Others
Till enough quantity is collected
Till enough rate for the material
Figure 3.2.9: Reason of collecting waste in specific time
City wise data : Almost in all the cities majority of waste pickers collect in a specific time in order to collect maximum waste except in Pune it’s because of their official timing. In Mysore city they collect in specific time as they are working in some other occupation also. In cities like Pune, Mumbai, Thane, Nashik, Bengaluru, Bhopal, Delhi, Indore, Kalyan and Yawatmal another reason being the waste gets cleared early, therefore they collect in the specific time.
Figure 3.2.10 :City Wise distribution of respondents and reason for specific time of waste collection
39%
4%
2%
55%

100
Waste picker type : Majority of the free roaming waste picker (74%) mentioned that they were able to collect more waste in that specific time, about 27% collect before the waste gets cleared and nearly 11% working in other occupation therefore they have to collect only morning, evening or at night. Few (7%) of the waste pickers also mentioned there were restrictions from municipality. Similarly even free roaming migrant (69%) expressed that they were able to collect more waste that specific time, over 19% working in other occupation as well. Like others 48% of the door-to-door collectors were able to collect more waste, for about 23% of the door-to-door collectors it was their official timing, nearly one-fifth of them said there were restriction from municipality and equal percentage (19%) mentioned restriction from household.
Working Hours
General working hours of the respondents range from one hour to 13 hours per day, but most of them work 8 hours a day (30%), followed by 6 hours per day (15%), 5 hours per day (12%). Nearly 7% of the respondents worked 12 hours per day. Only about 1.5% worked less than 3 hours per day.
3.2.2.Waste Storage/Sorting/Sale
Storage
Among all the waste collectors, 50 % of them do not store their collection, they sell on the same day. About 32% store for a day or more, nearly about 17% store waste occasionally. Those who store most of them store at their house (42%) and Godown (22.5%). Less than one-fifty (18%) store in some vacant land nearby to their place. Only about 11 % of the waste pickers store in municipality provided area. Nearly about 3% of the respondents store the collected materials on the streets. The waste pickers who store (n=604) the waste, store for atleast for a day to over a month. One-fifth of them store for 2 days, one-tenth of them store for a week, and 13 % store for a fortnight, only about 10% store for a month or so. On equiring the reason for storage, majority of them 55% (74% of cases) stored till enough quantity is accumulated so that they can be sold in the market. Nearly 39% (52% of cases) store till they get proper rate/value for the material collected. Some also said that they upscalable materials (30%) so then can store for long.

101
No
Sometime
Yes
Figure 3.2.11: Number of respondents store waste
City wise data :Out of the waste pickers who store, majority of the waste pickers from Delhi (53%), Indore (60%), Jaipur (77%), Mumbai (77%), Mysore (81%), Nashik (100%), and Wardha (89%) store their waste collected at their house. Most of the waste pickers from Balaghat (67%), Bengaluru (71%), Tumkur (80%), Thane (50%) store in godowns. Most waste pickers from Pune (38%) and Shillong (100%) store in municipal provided area, similarly waste pickers from Bhopal (73%), Guntur (44%), Kalyan (71%), Tenali (100%) store in vacant land. Few of them from Balaghat (33%), Guntur (11%), Mumbai (3%), Pune (15%) and Tumkur (20%) store on the streets.
Vacant land
Godown
Streets
Municipal provided area
Shared space withfellow workers
Others
House
Figure 3.2.12: Storage of waste collection
32%
18%
50%
42%3%1%
11%
3%
22%
18%

102
Vacant land Godown Streets Municipal provided area
Shared space with fellow workers
OthersHouse
Waste Picker type : Majority of the free roaming/independent local (57%) and door-to-door collectors (36%) store at their house. Most of the free roaming migrant(76%) and Itinerant buyers (57%) store at godown. Among the waste sorters (50%) and all other informal workers store at municipality provided area. Nearly 25% of the free roaming store at vacant land, 12% in godowns, free roaming migrant also store at house (15%) and vacant land (9%). Similarly itinerant buyers store at house (29%) and on the streets. Among the door-to-door collectors store at multiple locations, vacant land (5%), godown (31%), streets (5%) and municipality provided area (15%).
In almost all city they store till enough material is collected
Figure 3.2.13: Type of waste picker and place of storage
Sorting
As per the data majority of the waste pickers (84%) sort their waste collected, some collect segregated waste. Those who sort (n=1576) most of them sort at their residence (45% of the respondents, 37% of the responses ), few sort (31% of respondents , and 25% of responses) in front of the shop they sell their products, around 19% of respondents (15% of respondses) sort on the streets. Only those who store in municipality provided area sort in the same place.

103
Front of shop
Wholesale deler
Roadside or streets
Recyclers
Municipal provided area
DWCC/MRF
Godown / Shared space
Others
Friends place
Others
Home
Local Scrap dealer
Figure 3.2.14: Distribution of respondents and place of waste soritng
Citywise: Most of the Waste pickers from almost all the cities sort their waste collected except Wardha and Yawatmal where most of the waste pickers do not sort.
Sale
After sorting majority of the waste pickers (78 %) sell their collected materials to local scrap dealers, only about 12 % sell to whole sale dealers and 3.6% to DWCC/MRF.
Figure 3.2.15: Place of selling waste
36.8%3.4%0.2%
10.3%
9.1%
15.3%
24.9%
78%
5%3%
3%
11%

104
3.2.3 Employment Type – Self Employed or Wage Earners, SalaryMajority of the waste pickers were self employed, only about 3.4% are employed by municipality and about 6% by scrap dealers.Those who are on employed (n=232) 67% received payment by cash, about 28% by direct bank transfer and less than 2% by cheque payment. Seventy six percent received monthly, 12% daily and 11% weekly. Only about 53% of the employees received salary on time, about 37% have job description, 63% do not have specific job description. About 10% of the respondend said they had to pay some money for the work or agency, similarly about 2.5 % paid for truck and 3.3 % had to pay to municipality people.
Scrap dealer
NGO
Municipality
Others
Self employed
Figure 3.2.16: Distribution of respondents based on employer
3.2.4 Association/IdentityAssociation
Among these about half (50%) of the respondents are associated with some oragnization be it NGO/MBO/Trade Unions/Cooperatives. But only very of them have contract with NGO/MBO (14%). One-fourth of the respondents were associated with municipality (26%).
87.6%1.3%3.4%2%
5.7%

105
Associated withNGO/MBO
Not associated withNGO/MBO
Figure 3.2.17: Distribution of respondents according to their association with NGO/MBO/Trade
union
City wise As reported by the waste pickers, out of those are associated with NGO/MBO/trade union, Pune tops the list of cities where all 100 % are associated with one or other organization, followed by Mumbai (94%), Delhi (73%), and Tumkur (97%). None of the waste contacted in shillong were associated with any organization, similarly in Balaghat, Jaipur and Yawatmal too. One-third of the respondent in Bangalore were associated with organization, about half of the waste pickers responded in Indore, Mysore, kalyan and Wardha were associated with with NGO/MBO/trade union.
Associated with NGO/MBO As reported by the waste pickers, out of those who were associated with with NGO/MBO/trade union, maximum (19%) were associated with Parisar Bhagini Vikas Sanghatana, followed by Hasirudala (17%), Bala Vikas Dhara (15%), SwaCH (13%), SEVA (11%), Jan Vikas Society (6%), DBRC (7.5%) and Stree Mukti Sanghatana (2.5%). Other such as KKWS,KKPKP, Lokadhikar and SALAH were less than 10%.
50% 50%

106
Yes No
Figure 3.2.18: City wise respondents associated with NGO/MBO/Trade union etc
Associated with Municipality One-fourth of the respondents were associated with municipality (26%). Waste pickers from Pune and Mysore almost all are associated with Municipality (99%), kalyan (69%), Bengaluru (20%), Bhopal (16%), Guntur (16%), Shillong (47%), Thane (54%), and Wardha (44%) Indore (14%) depite being ranked number one in survekshan only fourtheen percent of waste pickers were associated with Municipality. None of the respondents from Jaipur, Mumbai, Nashik, Yawatmal and Balaghat were associated. Ninty nine percent of the waste pickers from Delhi and Mysore were not associated with the respective municipality.
Associated withmunicipality
Not associated withmunicipality
Figure 3.2.19: Distribution of respondents associated with Municipality
26.9%
73.1%

107
Associated withmunicipality
Not associated withmunicipality
Figure 3.2.20: Distribution of respondents and association with municipality
WP Type Assessing the type of waste picker and association with municipality it is observed that twenty one percent of the free roaming/independent local, free roaming migrant (13%), Itinerant buyer (67%) waste sorter (52%) and Doot-to-door collectors (41%) are associated with Municipality.
Yes No
Figure 3.2.21 : Type of waste picker and association with municipality

108
Figure 3.2.22: Respondents (%) associated with municipality and badge/ID card
City Wise Looking at city wise type of waste pickers associated with municipality reveals that maximum number of free roaming/independent waste pickers from Mysore (98.5%) are associated with municipality, Guntur (11.2%), Bengaluru (24%), Bhopal (4%),Indore (14%), Thane (61.4%), Kalyan (50%), Wardha (44%). None of the other cities free roaming waste pickers are associated with municipalities. All the waste sorters from Mysore, Shillong, Tenali are associated with Municipality and in other cities Bengaluru (12%), Guntur (42%), Indore (13%), as well as Kalyan (93%). Almost all the Door-to-door collector from Mysore, Guntur and Pune are associated with municipality, followed by Bhopal (33.3%) and Bengaluru (21%).
Identity
Being associated with any municipality means waste pickers must possess atleast a badge/ID card and uniform as per SBA guidelines. But the survey revealed that among those who were associated with Municipality (N=502) eighty seven percent of the respondents did not have any contract with the respective Municiplalities, and about only sixteen percent had uniforms. Nearly about 85% of the respondents who were associated with municipalities posess badge/ID card. Among those who had uniform more than half of them were provided by NGO (54%), about 41% by Municipality, and trade union only 1.6%. Only in cities of Bhopal, Guntur, Indore, Pune, Shillong, Thane, Tumkur the Municipalities have provided uniform, elsewhere NGO/MBO/Voluntary organizations have provided. Comparing the type of waste picker and uniform, nearly 45 % of the door-to-door collectors have uniform, 21.4% of the waste sorters, 11.3% of free roaming migrant and 6.8% of the free roaming / independent local have uniforms.
Yes
No
15%
85%

109
3.3. Social Security
3.3.1 Benefits ReceivedAccess to basic health and educational facility is important for every individual, out of all the respondents only 28% of the them stated that they had access to health facility, and about 30% access to educational facility. Only about 7.6% have some kind of health insurance, and among those who had health insurance (150), most of them had government health (67%) insurance, private (27%) and group insurance (6%). Only about 8% had life insurance
No
No
Can’t say
Can’t say
Yes
Yes
Figure 3.3.2: Access to educational facility
Figure 3.3.1: Access to health facility
28.3%
30.3%
7.3%
62.4%
8%
63.8%
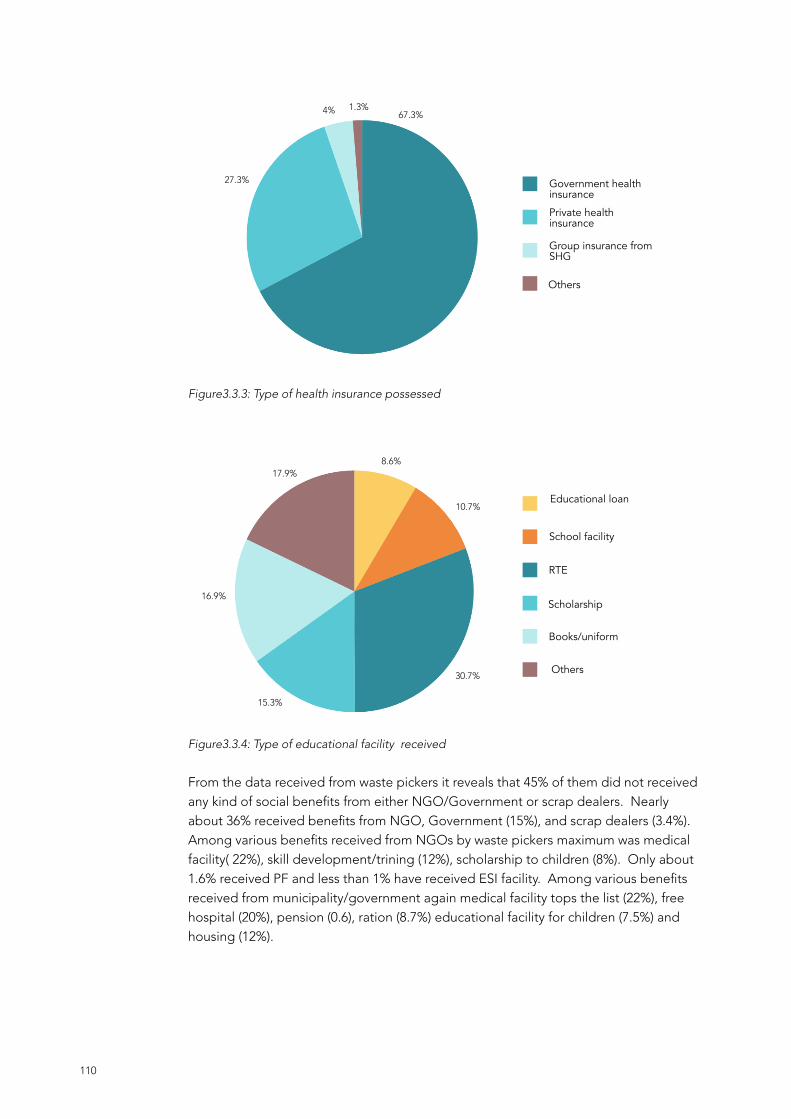
110
Figure3.3.3: Type of health insurance possessed
Figure3.3.4: Type of educational facility received
From the data received from waste pickers it reveals that 45% of them did not received any kind of social benefits from either NGO/Government or scrap dealers. Nearly about 36% received benefits from NGO, Government (15%), and scrap dealers (3.4%). Among various benefits received from NGOs by waste pickers maximum was medical facility( 22%), skill development/trining (12%), scholarship to children (8%). Only about 1.6% received PF and less than 1% have received ESI facility. Among various benefits received from municipality/government again medical facility tops the list (22%), free hospital (20%), pension (0.6), ration (8.7%) educational facility for children (7.5%) and housing (12%).
School facility
RTE
Others
Scholarship
Books/uniform
Others
Government healthinsurance
Educational loan
Private healthinsurance
Group insurance fromSHG
27.3%
4% 1.3%67.3%
8.6%17.9%
16.9%
15.3%
30.7%
10.7%

111
3.3.2 Occupational Choice
Researchers wanted to know why the respondents were in this waste collection profession, their motivation that keeps them going despite knowing various challenges in the work and working condition. About 43% said they did the work because their parents did it, they continued. For some this is was only job they knew(41%), about 27% did this job because they did not get any other job. Only 4.3 % felt it was secured job. Nearly 13.2 % of the respondents said it was easy entry, and low skilled (21%), therefore they were doing the waste collection work.Majority of the respondents (62%) desire to continue in the waste collection profession, but nearly 20% do not want continue and 18% are confused and have not decided.
Housing
Hostelfacility forchildren
Medicalfacility
Skill develo-pment/training
Freehospital
Scholarshipto children
Healthinsurance
Materialsupport
Legal aid
Pension
Financialassistance
Ration
Loan
PF
Recognitionin society
Educationfacility forchildren
ESI Others
Figure 3.3.5: Benefits received by respondents through NGO/MBO
22%
6%
5%
3%
7%
4%5%
9%
1%
12%
8%
3%
1%
4%
2%1%
5% 2%

112
My parentsdid it, socontinued
Only jobI know
Didn’t getany other job
Forced to do this job
Low skilled
Easy entry No investmentrequired
Friendssuggested
Secured job
Figure 3.3.6: Reason for choice of waste picking as an occupation
3.4 Knowledge and Perception
3.4.1 Knowledgew.r.t Information About SBA
From the data its observed that out all the respondents surveyed Majoriy of them had not heard about SBA only 707 ( 38%) of them had heard about SBA and around 12 % have heard but didn’t understand what it was about.
No
Don’t know
Heard but didn’t understand
Yes
Figure 3.4.1: Knowledge of SBA
38%
13%
8%
41%

113
Citywise Most of the waste pickers from Bhopal (67%), Delhi (50%), Indore (87%), Mumbai (78%), Pune (52%) and Balaghat (92%) had heard about SBA. Most of the waste pickers from Bengaluru (74%), Guntur (67%), Shillong (97%), Tumkur (97%), Jaipur (88%) and Yawatmal (44%) had not heard about SBA. Among those who have heard about SBA their main source (multiple response) of information was from Television (75%), followed by NGO (36%), friends (25%). Those who have heard about SBA majority of them think SBA is about building toilets (75%), keeping surrounding clean (69%), and waste segregation (56%). Out of 707 respondents only 18% said some government official had approached them to seek their participation for SBA.
WP type Comparing type of waste pickers and their knowledge of SBA, among all types maximum number of Itinerany buyers (58.3%), Door-to-Door collectors (48%), waste sorters (41%), free roaming local (34%) and free roaming migrant 31% have some knowledge about SBA.
Figure 3.4.2: City wise respondents and knowledge of SBA
w.r.t Training From SBA
As minimum as 44 ( 6.2 %) of the waste pickers who had heard about SBA had received some kind of training. Among these who received training on SBA, only about 52% of them received training from municipality and 38% by NGO. Out of those who received training only 66% said it the training was related to waste collection, and 18% didn’t know for what purpose the training was and also what was the training

114
w.r.t Benefits from SBA
Seventy percent of the waste pickers who had some knowledge of SBA there was nothing for waste pickers in SBA. Seventy seven felt there is no benefit for waste pickers in SBA and its policies.Sixty eight percent of the respondents there was some kind of medical facility and only about 4% of them received some benefits. Only 7 individuals said they had received ID card , 5 received from Municipality jobs, 6 individuals got some PF/ESI facility. Among those who received benefits, only 9 waste pickers said that their living condition changed after SBA, 17 felt there was no change.
3.4.2 PerceptionFor the section of perception only 575 waste pickers responded to the questions. Even among those who answered few waste pickers skipped some questions, few did not answer certain questions, due to lack of knowledge. Therefore the each question the number of respondents vary
w.r.t Benefits From SBA
Out of the 575 waste pickers, 35% of them strongly agreed that there was some benefit for them and their family from SBA and 29 % agreed there were some benefits, Only about 14% disagreed and said there were no benefits to them or family. About half them perceive that SBA may increase their salary.
w.r.t Public Perception
35% felt public perception of waste picker has not changed, but 24% of waste pickers were of the opinion that public percetion has changed. One-third did not have idea about it.w.r.t Protection
Some waste pickers (28%) were of the opinion that SBA may protect them from all kind of harrassments, equal percentage perceive that they are not protected from any harrassment due to SBA
w.r.t Skill Training
About 40% are of the opinion that SBA has improved their skills and capacity. Mostly about 46% of the waste picker perceived that there was some kind discrimination by the municipality.
w.r.t Waste Practices
Only 43% of the waste pickers feel they part of theSWM system, another 43% are of the opinion that collection of waste at souce would be helpful and one-third ( 34%) feel waste collection at source is not helpful. Only 43% felt that there was first access to waste. Only 44% say they have access to dry waste. 41% said their access to doot to door collection has improved
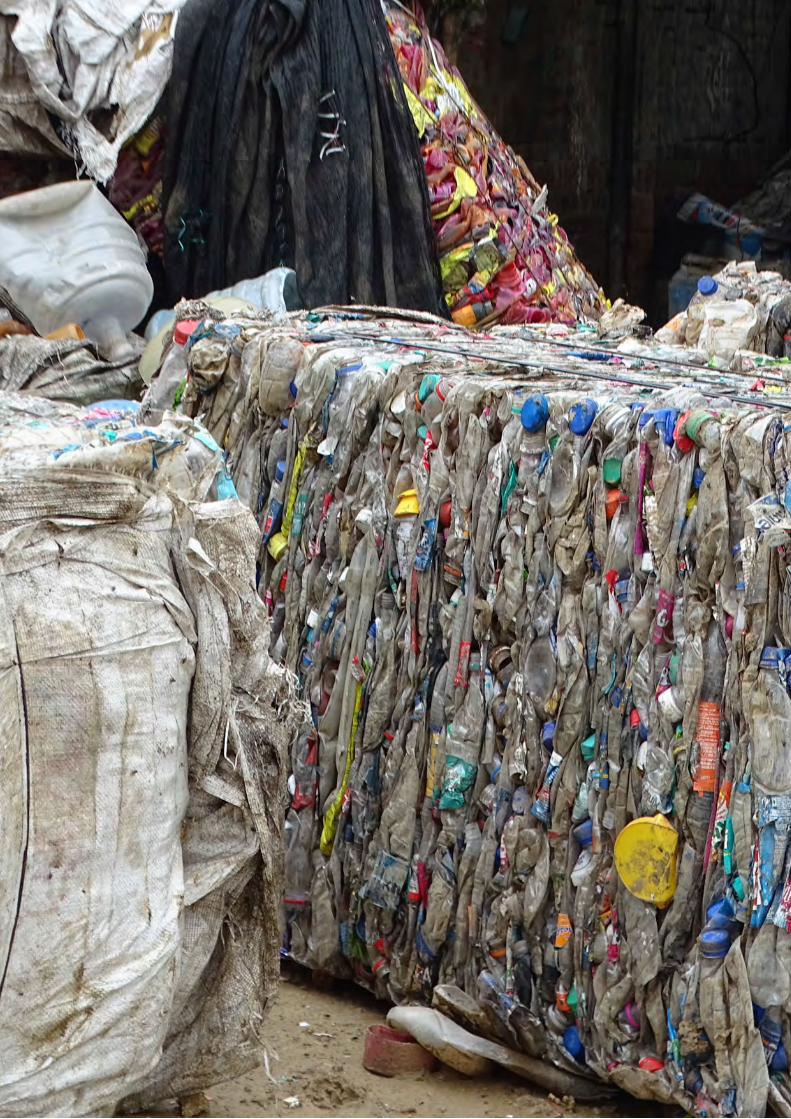


117
Evaluating the Perception & Practices Through Focus Group Discussions Background
The chapter below summarises focus group findings conducted as part of the study. The findings are based on the FGDs that were conducted between July 2017 and September 2017, across seven cities – Mysuru, Panchkula (conducted in Bengaluru), Indore, Patna, Guntur, Shillong and Mumbai. The purpose of the FGDs with wastepickers in the seven cities was to explore the waste picker knowledge and perception of SBA in depth – to get views and ideas, understand the on ground issues and look at feedback and suggestions.
4.1 MethodologyIn the six cities - Mysuru, Indore, Patna, Guntur, Shillong and Mumbai that FGD was conducted, the host organisation was asked to arrange for wastepickers as per the following criteria: “To be representative of geography, gender, type of waste collected, registered and unregistered, local and migrant, and those who received a contract ”. The NGOs were given free hand to decide the need to schedule one or two discussions depending on the numbers not exceeding 25. Participants were also briefed that the discussions would be recorded and photographed.
Each FGD was for a period of one and half hour and was broken into four segments:
Segment 1 was Warm Up and Introductions: This segment is designed to capture basic information of the waste picker, (how long, why did you join, family in waste collection) the working conditions and to understand waste collection (when did you go, method of collection, what do you collect, price for each item, where do you sell) affiliations with organisations (associated /registered, training, social security).
Segment 2 was to understand NGO Association and thoughts on formal and informal workers – the discussions also included the need for occupational ID cards, social security, occupational safety gears and contracts in the municipality.
4

118
Segment 3 focused on Swacch Bharat and aimed at capturing awareness and knowledge of SBA.
Segment 4 was the conclusion and aimed at capturing wastepickers expectations from SBA.
4.2 Limitations• In many cities the FGD were not representative of geography, gender, type of
waste collected, registered and unregistered, local and migrant, and those who received a contract.
4.3 Focus Group Discussions (FGD) FindingsResults from the nine FGD across seven cities have been summarised under five main themes. The themes grouped under:
• Profile of the Respondents
• Practices associated with waste picking
• Association with member based organisation of AIW/ Municipality
• Awareness of SBA
• Expectations of SBA
4.3.a. Profile of the RespondentsThe FGD covered a total of 199 respondents. There was over 90% participation by women. Most of the participants were in the age group of 21 to 70.
City Male Female
Mysore 2 31
Panchkula 6 4
Indore 0 78
Patna 11 0
Guntur 6 5
Shillong 0 26
Mumbai 0 30
Total 25 174
Box 4.1: Gender wise participants number in the PGD
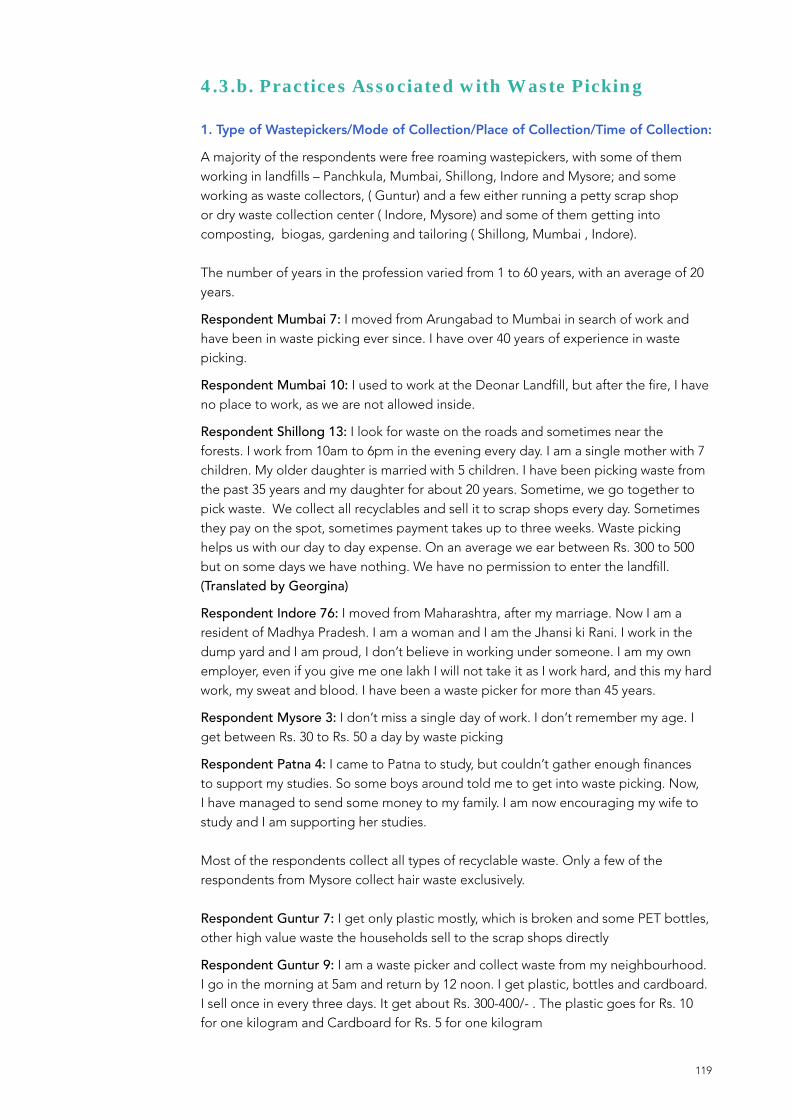
119
4.3.b. Practices Associated with Waste Picking
1. Type of Wastepickers/Mode of Collection/Place of Collection/Time of Collection:
A majority of the respondents were free roaming wastepickers, with some of them working in landfills – Panchkula, Mumbai, Shillong, Indore and Mysore; and some working as waste collectors, ( Guntur) and a few either running a petty scrap shop or dry waste collection center ( Indore, Mysore) and some of them getting into composting, biogas, gardening and tailoring ( Shillong, Mumbai , Indore).
The number of years in the profession varied from 1 to 60 years, with an average of 20 years.
Respondent Mumbai 7: I moved from Arungabad to Mumbai in search of work and have been in waste picking ever since. I have over 40 years of experience in waste picking.
Respondent Mumbai 10: I used to work at the Deonar Landfill, but after the fire, I have no place to work, as we are not allowed inside.
Respondent Shillong 13: I look for waste on the roads and sometimes near the forests. I work from 10am to 6pm in the evening every day. I am a single mother with 7 children. My older daughter is married with 5 children. I have been picking waste from the past 35 years and my daughter for about 20 years. Sometime, we go together to pick waste. We collect all recyclables and sell it to scrap shops every day. Sometimes they pay on the spot, sometimes payment takes up to three weeks. Waste picking helps us with our day to day expense. On an average we ear between Rs. 300 to 500 but on some days we have nothing. We have no permission to enter the landfill.(Translated by Georgina)
Respondent Indore 76: I moved from Maharashtra, after my marriage. Now I am a resident of Madhya Pradesh. I am a woman and I am the Jhansi ki Rani. I work in the dump yard and I am proud, I don’t believe in working under someone. I am my own employer, even if you give me one lakh I will not take it as I work hard, and this my hard work, my sweat and blood. I have been a waste picker for more than 45 years.
Respondent Mysore 3: I don’t miss a single day of work. I don’t remember my age. I get between Rs. 30 to Rs. 50 a day by waste picking
Respondent Patna 4: I came to Patna to study, but couldn’t gather enough finances to support my studies. So some boys around told me to get into waste picking. Now, I have managed to send some money to my family. I am now encouraging my wife to study and I am supporting her studies.
Most of the respondents collect all types of recyclable waste. Only a few of the respondents from Mysore collect hair waste exclusively.
Respondent Guntur 7: I get only plastic mostly, which is broken and some PET bottles, other high value waste the households sell to the scrap shops directly
Respondent Guntur 9: I am a waste picker and collect waste from my neighbourhood. I go in the morning at 5am and return by 12 noon. I get plastic, bottles and cardboard. I sell once in every three days. It get about Rs. 300-400/- . The plastic goes for Rs. 10 for one kilogram and Cardboard for Rs. 5 for one kilogram

120
2. Reasons for Getting into Waste Picking
Majority of the women mentioned that they were the sole bread earners in the family, often doubling up as caregivers to grandchildren, or children or spouse with disabilities. Most of them took to waste picking given the ease of entry and flexible timings. It was easy to learn on the job.
Respondent Panchkula 3: I am a painter by profession, but disappearing work, because of printing technology, reduced payment, led me to look around. I moved from Gorakpur to Panchkula and someone told me about the dumping ground. I have been working since 2014.
Respndent Mumbai 8: I worked as a domestic worker and also did some work for the Municipality, but the payment was not good and I had to manage my family and hence took to waste picking. The other important aspect was that it has flexible hours. I can go when I want to, and still be there for my family.
Respondent Shillong 20: I tried many different kinds of jobs, including running a chai ( Tea) Shop on the highway. I have 6 children, and needed to support them, hence took to wastepicking, as there is some kind of regularity in income.
Respondent Guntur 3: My parents and grandparents were in wastepicking. We live here near the landfill, so it is easier for us to pick waste
3. Where Do They Sort, Store and Sell?
Most wastepickers sold their collection to the scrap dealer, with the exception of Indore, as those working on the municipal site, had to sell their material to the person authorised by the municipality. With sorting it varied, some sorted at home, or the place they sold and some sorted on the road.
Respondent Shillong 5: I have been working at the landfill from the year 2000. I collect every day and aggregate up to a month or up to 200 kgs and then sell it to the highest bidding scrap dealer who comes here to collect at the landfill.
Respondent Patna 5: We normally sort at home or the place we sell. But the scrap dealers sometimes cheat us, as if it rains then the prices automatically goes down. We don’t get good rates. Infact no one gives us good rates. It’s difficult to go to another kabbadi (scrap shop) too, as then we will end of only bargaining. Sometimes we sort at any place we get, and then Nigar Nigam sometimes takes away our bora (bag) and then asks us to pay. Last week they took three of our bora and we had to pay Rs. 2000 only then they released it.
Respondent Guntur 11: I store waste in my house upto a week and then sell it
Respondent Guntur 12: I store my waste in the dumping yard.
Respondent Mysore 6: I got for collection early morning from black spots and sort at home and the sell it to my local scrap dealer.

121
4.3.c. Association with Member Based Organisation of AIW/MunicipalityOver 60% of the participants were associated with the NGO. Only in Shillong and Panchkula, the wastepickers were associated with Municipality. The discussions centered on identity, occupational ID cards and the work being undertaken, skill up gradation and other benefits. On the discussion on use of personal protection over 65% did not use any personal protection.
1. Associations
Respondent Mumbai 11: Jyoti and other people from SMS would visit us and talk to us, and eventually we realised that the idea was come together. And slowly that sort of consciousness came about. SMS started encouraging communities to form SHGS. We then started forming SHGs consisting of 10-15 women. Each community has an SHG and they started sharing problems and interventions were designed accordingly. This led to the need for a federation and Parisar Bhagini Vikas Sangha was formed. Soon after we also formed and registered different cooperatives.
Respondent Mumbai 13: Within the SHG, we started sharing stories. All the women used to go the house of the person who has a problem. For example, if there is someone, some husband who is abusing the wife, all the women in the community would go to their house and talk to the husband and explain to them and how they can go about it. That’s what the SHG does in terms of moral support and in terms of financial support; they see what they can do. Say someone has an illness or urgent financial need maybe for education, so they formally apply for a loan. The federation then grants a loan.
Respondent Mumbai 5: Earlier we would have to rely on their household (in-laws) for any sort of problems. Now if we have to discuss their problems, they approach the women in the SHG/cooperative for help. We are united because we know that they can rely on each other for whatever problems that we face. Individually we are empowered and together we are progressing
Respondent Shillong 1: Earlier we were all seen as just wastepickers and were allowed to be. Somewhere in the year 2000 the municipal board wanted to push us away thinking we were a nuisance. So we went to the board and took photos and submitted to the government, but nothing happened, till the ADB project came. The current Department (Municipality) has helped us form an SHG to strengthen our livelihood. They also organised a 2 day training program on composting and now many people come and interview us, they take our pictures, shake our hands and visit us at the dump yard to buy our compost.(Translated by Georgina)
Respondent Panchkula 2: Our Commissioner Saheb has recognised our hard work at the dumping ground. He got a bathroom constructed and provided us access to drinking water too. He only has sent us to Bengaluru to learn more about the wastepickers and how they work here.
Respondent Guntur 2 : I was working as wastepickers earlier, but I got into the municipality recently and regret it, as salaries are not paid on time. I will see for some more time, otherwise will go back to waste picking.
122
2. Identity and Occupational ID Card
Respondent Mumbai 1: We have ID cards from Stree Mukti Sanghatana, but not BMC. We have been asking for cards from 2008. In 2010 we organised a huge protest, but nothing happened. So SMS gave us cards. The BMC are afraid if they give us cards we might demand work as formal labourers.
Respondent Patna 1 and 5: We also need ID cards. We heard that other cities were giving to people like us.
Respondent Indore 12: I have no card, some of my colleagues have it
Respondent Indore 22: My card was for one year, now it has expired, I don’t know what to do.
Respondent Mysore 2: I have young children to support, as I am a single mother. I go in the afternoon for waste picking. I sometimes encounter police problem and they want to check my bag of waste collected and sometimes I get eve teased by men smoking. From the time, I have got ID card, it has been easy. I got the ID card because of Hasiru Dala.
3. Recognition and Access to Space
Respondent Mumbai: Earlier we did not care for our appearances; we did not think we were important. But now, we focus on ourselves, we take care of ourselves. Small things like pinning my saree are so important. Now, even our husbands have started recognising that.
Respondent Mumbai: Earlier for important functions like Independence Day or Republic Day only men and children would participate, but now, we go too. When I was invited to hoist a flag, it was one of my life-changing moments. The experience of conducting such an important ceremony was very powerful and I am grateful to SMS for that.
Respondent Patna 1: Through the company I travelled to Mumbai and met with other wastepickers
4.3.d. Awareness on SBAWith the exception of Patna, where only one respondent had heard of SBA, all the rest has some kind of awareness. With awareness and knowledge about SBA, the responses were unanimous, centered on cleanliness:
Respondent Panchkula 9: I vaguely remember. It’s about cleanliness.
Respondent Shillong 4: Yes, people have come and given awareness about SBA, segregation of waste, plastic waste etc. There has also been river clean ups.
Respondent Indore 17: Yes we have heard about SBA, but in the name of cleanliness, our kitchens have also been cleaned. What’s the point of cleanliness, if we don’t have work to do, or food to eat?
Respondent Indore 24: We are grateful for the cleanliness, but what about our stoves (chulas)? The Nagar Nigam takes away my bora (bag) in the name of cleanliness. I have to have a fine to have that released. I can’t walk much, as I am disabled. What’s the point of the cleanliness, if you can’t bear to see the sight of us? We are actually doing you a service.

123
Respondent Guntur 4: I was earlier working as a wastepicker. Now, I have a job in the municipality tractor, that collects waste from the roads and door-to-door. We normally get about 5 kg worth of recyclable material, which we sell and divide the money among the people in the truck, so each one of us gets about Rs. 50. If we are lucky we get about Rs. 200
The tractor load is then taken to the dump yard. We haven’t got our salary for over six months now. So this is all that we get.(Translated by Vijaya)
Respondent Indore 16: In the name of cleanliness, now I have no work. The bus pass is expensive, as I have been moved to the housing colony away from the city. It is terrible that I don’t even have access to the landfill, as I don’t have permission to enter; only some people have. With whatever I get I can only afford to boil rice and water and feed my kids.
Respondent Mysore 31: It’s about cleanliness, keeping surroundings clean and toilets
Respondent Patna 1: We are not aware. But yes Swachh Bharat sounds familiar!Respondent Shillong: It’s about segregation of waste, cleanliness, not throwing out garbage!
Respondent Mumbai 19: They say remove poverty, but they have removed the poor and hardworking in the name of cleanliness
Respondent Indore 37: I got my daughter married by working as a wastepicker, now in the name of cleanliness, they shouldn’t cheat me. I did service all these years, now you bring boys who can drive truck and throw us all out.
Hum garibo ke gar mein, Swachh Bharat ho gaya. Ghar mein sabi dhaba ka safai hogya, kunki mal nahin milta hai (In the house of poor, there is all cleanliness, as our vessels are clean too. There is nothing to eat, as we don’t have access to waste).
Majority of the respondents did not see the link between issuance of ID cards as an SBA requirement except Mumbai and Indore. In Indore they saw it as an entry point to enter the landfill and dump yard. They were not aware of the process of integration, as well. In Guntur, they assumed that municipality work was something that local government was doing off its own accord. Many of them felt that while the ID card acknowledged them as wastepickers, it did not recognise the need for access to waste, which was problematic.
Respondent Guntur 3: I am happy that I got into the municipality street sweeping, earlier I was waste picking.
Respondent Guntur 9: For me working with the municipality is a matter of prestige. There is more dignity, even though there is no regular money.
Shillong was the only place where the respondents who worked in the landfill in Shillong used boots, masks, gloves provided by the municipality. And in Guntur, a few of those working with the municipality had been given coats, uniforms, gloves and boots. They have not been given masks.

124
4.3.e. Expectations of SBAIn the last part of the FGD the discussions around recommendations and expectations of SBA; centered on the need for access to waste, occupational ID card duration to be at least 10 years, reskilling within the waste industry.
Respondent Panchkula 6: I don’t know what to expect from Swachh Bharat. I am very happy with our Commissioner Saheb
Respondent Indore 10: I used to run a small petty shop, but after Swachh Bharat, all the mall ( material) is going to the NGO at the landfill, I have no waste coming at all. My shop is not polluting and so, Swachh Bharat must take care of people like me and all the kabadi dukan ( scrap shops). They must be allowed to function with material coming to them too
Respondent Indore 13: In the name of Swachh Bharat, they must not take our boras ( bags), nor must they fine us. All wastepickers like us who have no entry into the landfill, must be allowed to function, as we are not dirtying the city, but cleaning the city.
Respondent Indore 5 : I believe that for people like us, working in waste picking, there must not be a retirement age. In the name of cleanliness, we all have been retired and we don’t have any social security or family support, what are we going to eat? If the highest office in India does not have a retirement age, then why should I? They put me in garden waste as an alternative, but soon removed me as I was 70. I don’t think, in the name of Swachh Bharat such things be allowed.
Respondent Indore 18: I don’t think putting us in stitching is the right thing to do, for ranking. We are wastepickers and we must get a choice in what we want to do. Payment must be regular and must be monitored. For ID cards there must be some mechanism to renew. Mine is all expired. If every year I have to renew, where should I go, what should I do?
Respondent Indore 26: At the landfill, we must be allowed to sell to other scrap dealers; we shouldn’t be restricted to sell to this one person only as the rates are very low.
Respondent Mumbai 4: I think if we are recognised as stakeholders, we must be given a more active part and be treated as other workers, with access to waste and social security.
Respondent Mumbai 10: BMC must give us land to work and plastic ban must not take away our recyclables, SBA must see to that.
4.4 Overall ImpressionsPractices Associated with Waste Picking
There is a certain streak of independence that was clearly visible in all the free roaming waste pickers. The ability to earn their own livelihoods without having to depend on others was especially evident in the older women. Many also acknowledged that after trying out other jobs, waste picking came to the rescue to make ends meet. For some the lack of opportunities or skill was the reason they choose to pick waste.
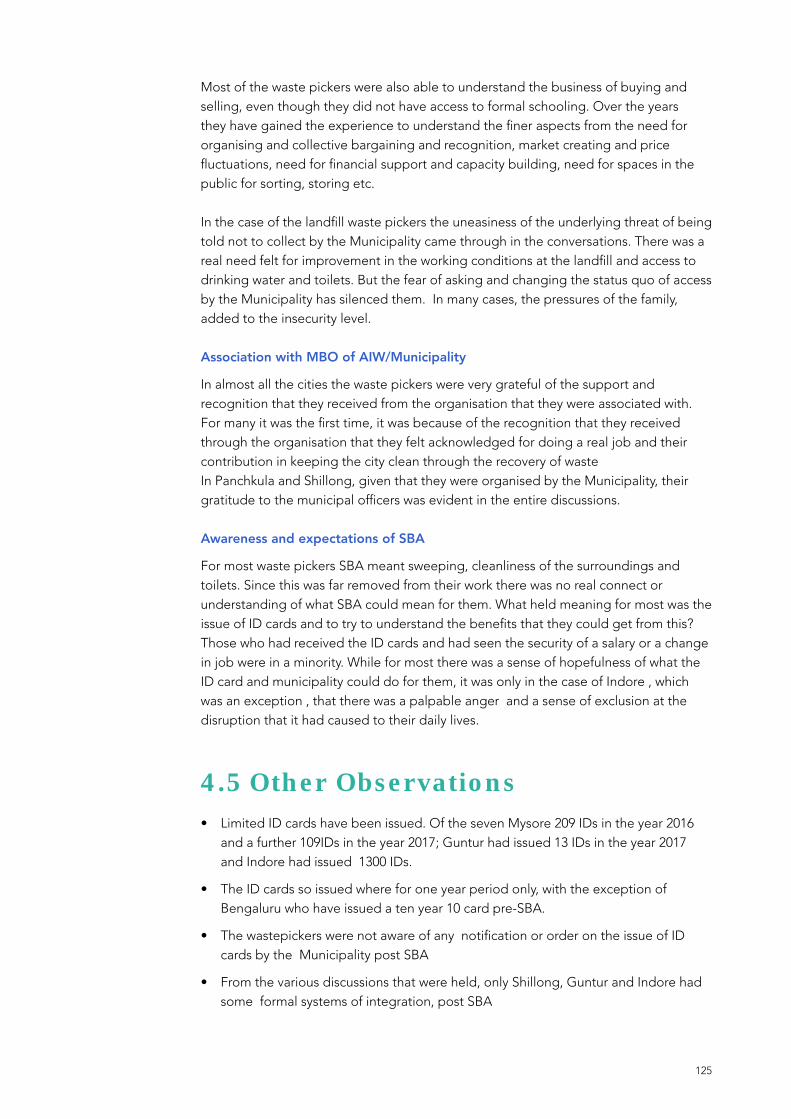
125
Most of the waste pickers were also able to understand the business of buying and selling, even though they did not have access to formal schooling. Over the years they have gained the experience to understand the finer aspects from the need for organising and collective bargaining and recognition, market creating and price fluctuations, need for financial support and capacity building, need for spaces in the public for sorting, storing etc.
In the case of the landfill waste pickers the uneasiness of the underlying threat of being told not to collect by the Municipality came through in the conversations. There was a real need felt for improvement in the working conditions at the landfill and access to drinking water and toilets. But the fear of asking and changing the status quo of access by the Municipality has silenced them. In many cases, the pressures of the family, added to the insecurity level.
Association with MBO of AIW/Municipality
In almost all the cities the waste pickers were very grateful of the support and recognition that they received from the organisation that they were associated with. For many it was the first time, it was because of the recognition that they received through the organisation that they felt acknowledged for doing a real job and their contribution in keeping the city clean through the recovery of waste In Panchkula and Shillong, given that they were organised by the Municipality, their gratitude to the municipal officers was evident in the entire discussions.
Awareness and expectations of SBA
For most waste pickers SBA meant sweeping, cleanliness of the surroundings and toilets. Since this was far removed from their work there was no real connect or understanding of what SBA could mean for them. What held meaning for most was the issue of ID cards and to try to understand the benefits that they could get from this? Those who had received the ID cards and had seen the security of a salary or a change in job were in a minority. While for most there was a sense of hopefulness of what the ID card and municipality could do for them, it was only in the case of Indore , which was an exception , that there was a palpable anger and a sense of exclusion at the disruption that it had caused to their daily lives.
4.5 Other Observations• Limited ID cards have been issued. Of the seven Mysore 209 IDs in the year 2016
and a further 109IDs in the year 2017; Guntur had issued 13 IDs in the year 2017 and Indore had issued 1300 IDs.
• The ID cards so issued where for one year period only, with the exception of Bengaluru who have issued a ten year 10 card pre-SBA.
• The wastepickers were not aware of any notification or order on the issue of ID cards by the Municipality post SBA
• From the various discussions that were held, only Shillong, Guntur and Indore had some formal systems of integration, post SBA

126
• It was found that no effort to retain the primary role of the Waste Pickers to manage dry waste within the Municipal system, instead some alternative job options like tailoring, street sweeping has been introduced. The numbers absorbed in these jobs is insignificant and this effort does not reflect seriousness as the salaries are unpaid. Shillong was the only variation where, under the North Eastern Regional Capital City Development Investment Programme (NERCCDIP), State Investment Planning Management and Implementation Unit (SIPMIU), Urban Affairs Department, the wastepickers were organised as an SHG in November 2014, with the sole objective of enhancing livelihood. They ventured into indigenous composting.
• Most of the wastepickers expressed no confidence that the SBA has any benefit for the waste pickers. No association seen by Waste pickers, given that they are unaware of the NULM Convergence Guidelines with SBA.
• Limited correlation made between municipalities on wastepickers integration and the requirements of SBA
• It was found that an exceptional situation existed in Indore, with displacement and relocation of waste pickers almost totally depriving them of any informal sector operations.
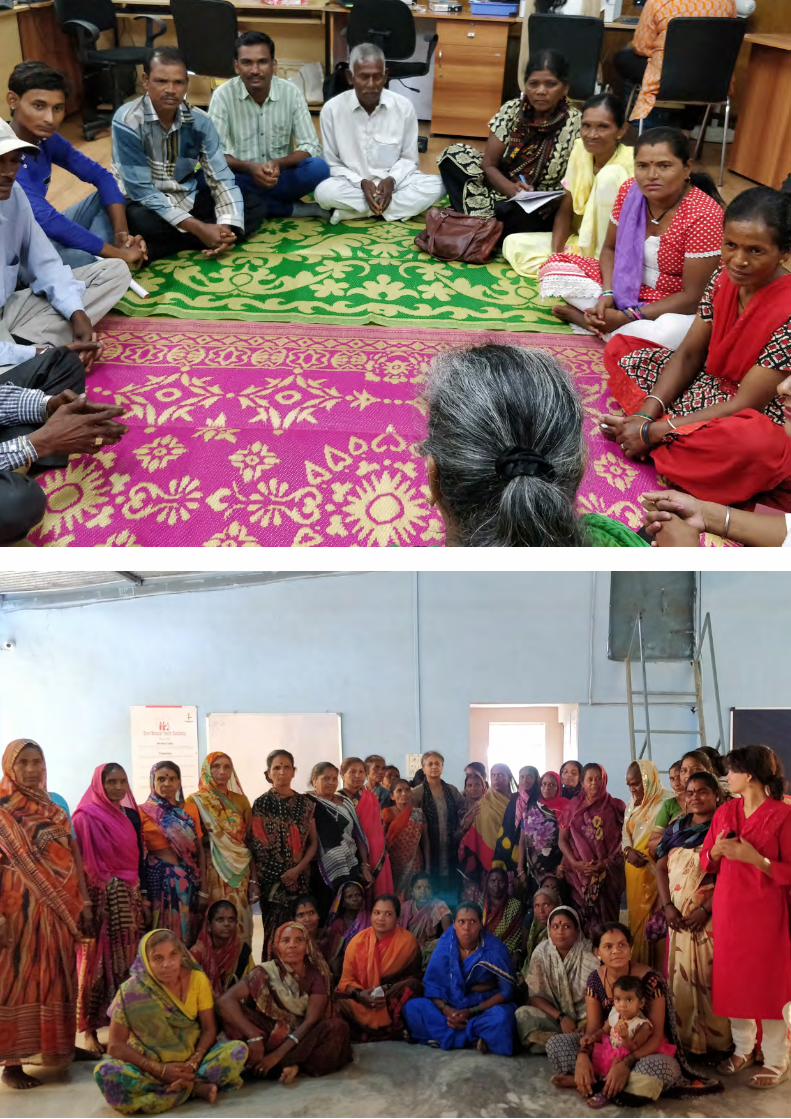


129
5Case StudiesIn this chapter, we profile five cities - Mysore, Indore, Patna, Gurugram, and Shillong based on the visits made to the city, one-on-one informal interviews with key stakeholders, site visits, field observations and secondary literature.
In terms of selection of the cities, Mysore and Indore were selected because of their consistent ranking in the SS. Patna and Shillong were selected randomly based on those that ranked poorly in the SS. And Gurugram, as it had missed the 100th mark by 5 spots in 2018.
In these cities, we have looked at the existing Municipal Solid Waste Management system, the rules and regulations and the presence of the informal waste workers in the city and the process of integration.
Figure 5.1: Cities profiled for case studies
Gurugram
Indore
PatnaShilong
Mysore
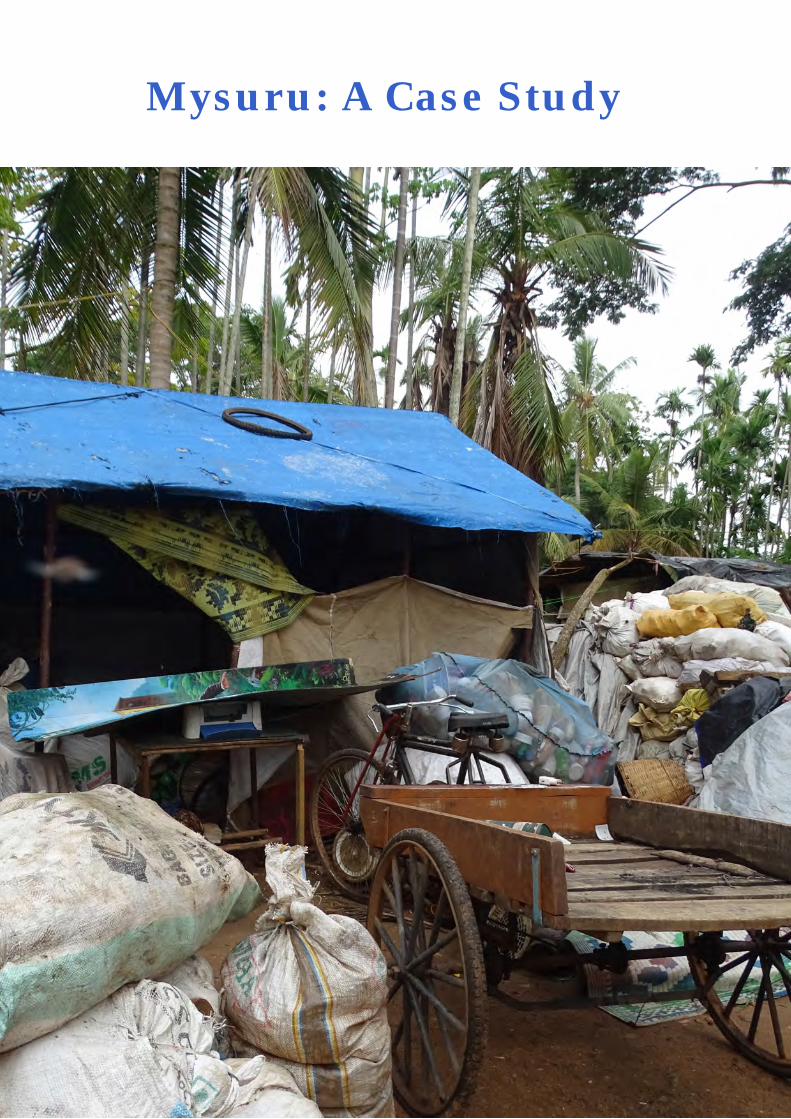
Mysuru: A Case Study

131
5.1 MysuruMysore or Mysuru as it is officially known is located about 145 kms from Bengaluru. A popular tourist spot and known for its cultural heritage, Mysuru has been consistently ranked in the top 10 of the Swachh Survekshan – No 1 in 2016, No 5 in 2017, No 8 in 2018 and No 3 in 2019.
Fast Facts
State Karnataka
Area 128.42Sq.kms
Population as per 2011 census 9,20,550
Number of Wards 65
Number of Properties 172783
Waste Generation/Day
Segregation Level
Administrative Body Mysore City Corporation
Box 5.1.1: Fast facts on Mysuru
Source: Mysore City Corporation (http://www.mysorecity.mrc.gov.in/)
Background
In 1904, Mysore established the City Improvement Trust Board (CITB), under the patronage of the Royal Family and the Mysore City Administration. The Board was entrusted with all tasks related to planning, creating civic amenities such as drainage, sewage systems, circles, boulevards among others. The formation of the CITB was a result of the recommendation from a committee constituted by the then Maharaja of Mysore H. H Sri Nalwadi Krishna Raja Wodeyar – IV, to prevent the return of the plague that gripped the city in 1898-99 and a repeat of a fire mishap a year earlier in 1987 . (Mysore Urban Development Authority (MUDA) n.d.). According to an article in The Hindu, going by historical reports, Mysuru had a head start in sanitation due to the presence of the CITB, from well-planned layouts, broad roads with tree-lined, piped drinking water and sewage treatment, a legacy that has been continued. (The Hindu 2019). This was corroborated by Dr. H Ramachandra, CHO, Mysore City Corporation. (Dr. Ramachandra 2018).
Mysuru has always been recognised as a best performing city in terms of effective waste management, from collection and transportation perspective:
• Award for excellence in SWM, by the MOUD in November 2009, at the ICOn SWM Conference in Calcutta
• Ministry of Urban Development awarded MCC as the Second Clean City in May 2010, based on cleanliness, disposal of solid waste, door to door collection among the others.

132
• Best Clean City February 2011, awarded by the Urban Development Department, Government of Karnataka
• Mysore tops Swachh Bharat rankings for 476 cities. The survey conducted during 2014-15 was commissioned by the Ministry of Urban Development as required under the National Sanitation Policy of 2008.
Current Situation
Given Mysuru’s head start in waste management, the door to door collection and transportation system is very well streamlined. Waste is being collected in two categories- biodegradable and non-biodegradable; GPS was introduced in early 2010, automated payment directly to collector’s accounts. The estimated waste generation of solid waste in 2017 was 402 TPD. (ZWM MYSORE PPT, CSEINDIA 2017)
Within the processing and disposal, Mysuru has both centralised and decentralised destinations.
Quantity of Municipal Solid Waste Generated in the City
Sl No Generator NumberUnit generation per day
Estimated quantity (MT)
1 Population * 9,38,386 360 gram/ capita/
day
338
2 Commercial
Establishments
20,329 1.0 kgs per unit per
day
20
3 Hotels and
Restaurants
716 30 kg/ unit 21
4 Marriage and
Function halls
124 50 kg/ unit 6
5 Street Sweeping 17
Total MSW generated per day in MT (* Includes areas covered beyond
MCC limits.)
402
Table 5.1.1: Quantity of MSW generated in the city
Source: ZWM Mysore PPT, CSE India
Centralised Units: Quick Facts
• A 200TPD composting plant has been functioning since 2001. The plant is operated and maintained by IL&FS, on a PPP basis. There is no tipping fee paid by the MCC, on the contrary IL& FS pay a royalty of Rs. 6 lakhs per annum to the MCC. (Dr. Ramachandra 2018) (M.S and Dr. Nagendra 2015) (Swachh Bharat Mission (Urban), Ministry of Housing and Urban Affairs, Government of India 2018) In terms of the output, various reports have quoted differently – 45-50 MT of organic compost is produced daily through windrow composting method (2018) 85 TPD composted (2017)

133
• The site adjacent to the composting plant, is a 100 year old dump yard and a sewage farm spread over 100 acres has a sanitary landfill operated by JUSCO at a capacity 90TPD. The contract was awarded in 2010 on a build-operate-transfer (BOT) basis, for a period of 23 years. (Sinha 2010)
Photo 13 b: MSW Processing Unit- O&M by IL&FS Environmental Infrastructure & Services Ltd,
Vidyaranyapura

134

135
Decentralised Units: Quick Facts
• 9 Zero Waste Management Units, however only 7 operational. Collects waste in two categories from households by auto tippers or push carts. Caters to about 3-4 wards or roughly about 10,000 households, employs about 55-60 pourakarmikas. At the unit, after secondary, aerobic composting method is used for wet waste and dry waste is segregated into about 25-27 categories. On an average about 65-66 Mt of compost is produced, which is distributed to farmers and dry waste is sold to recyclers. The staff salaries are paid from the revenue of the sales and some amount is given back to the corporation. (Dr. Ramachandra 2018) (ZWM MYSORE PPT, CSEINDIA 2017) (Mysore City Corporation n.d.) (Tripathy 2018)
• 47 Dry Waste Collection Centers ( DWCCs) were set up by the MCC in 2017, with a nominal inflow of 150 kgs of dry waste daily. The DWCCs are small sheds where sorting and storage of dry waste can take place. The door-to-door collection primary collection vehicles drop off the waste at the centers. Only nine centers are operated by the wastepickers.
Photo 13 c: Zero Waste Management Unit Ward no 28,
Mysuru
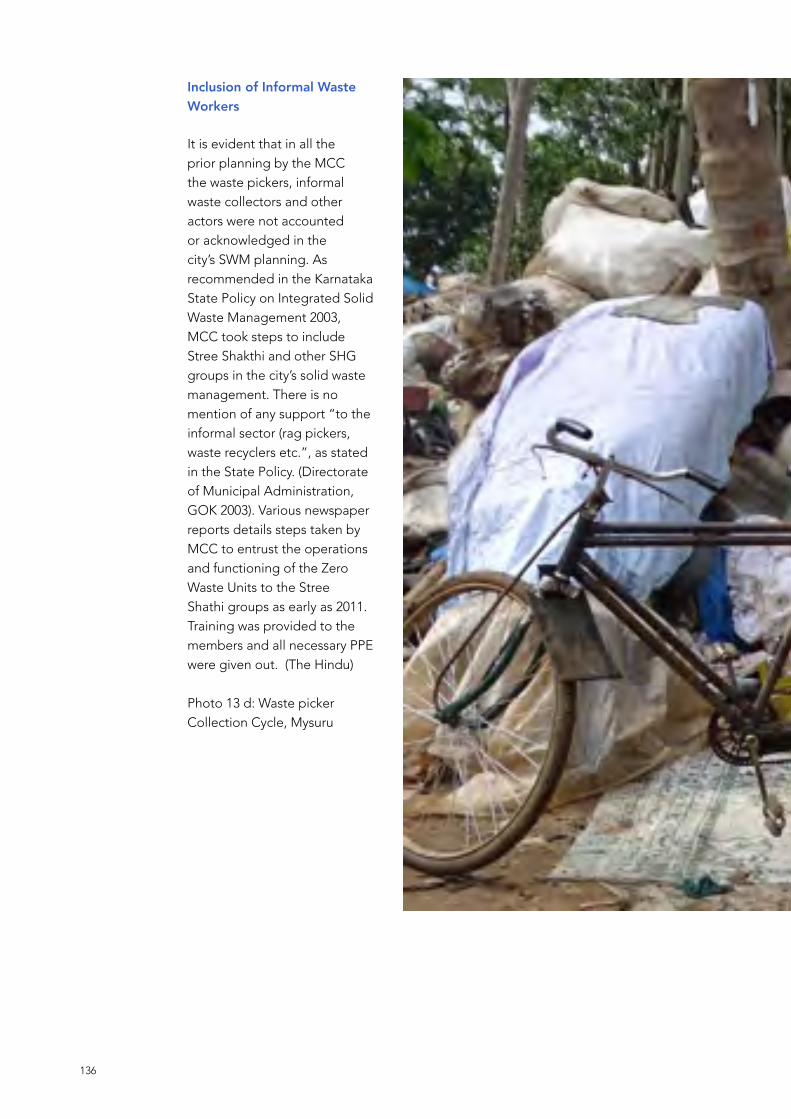
136
Inclusion of Informal Waste Workers
It is evident that in all the prior planning by the MCC the waste pickers, informal waste collectors and other actors were not accounted or acknowledged in the city’s SWM planning. As recommended in the Karnataka State Policy on Integrated Solid Waste Management 2003, MCC took steps to include Stree Shakthi and other SHG groups in the city’s solid waste management. There is no mention of any support “to the informal sector (rag pickers, waste recyclers etc.”, as stated in the State Policy. (Directorate of Municipal Administration, GOK 2003). Various newspaper reports details steps taken by MCC to entrust the operations and functioning of the Zero Waste Units to the Stree Shathi groups as early as 2011. Training was provided to the members and all necessary PPE were given out. (The Hindu)
Photo 13 d: Waste picker Collection Cycle, Mysuru

137

138
In January 2016, Hasiru Dala approached MCC, in the context of identifying wastepickers in the city. The letter stated that 130 wastepickers have been identified and there is estimated 500 wastepickers in an around MCC and there was a need for scientific identification and registration. MCC responded positively and in the letter dated 4th August 2016, stated the need to provide ID cards with immediate effect to the wastepickers in all wards. 209 occupational identity cards were issued to wastepickers on 27th September 2016, 109 Id cards were given on 26th July 2017 and additional cards were issued in January 2019. Following the pilot set up of a DWCC which was operational in October 2016, the MCC issued a letter 6th December 2016, stating the need to set up 47 DWCCs within six months. It also stated that survey has to undertake to map industries, shops around from where waste can be collected. Another noteworthy mention is the people who are engaged in operating the DWCC must be trained by Hasiru Dala. In 2017, the MCC set up 47 Dry Waste Collection Centers. Of which 16 DWCCs were given to wastepickers, mentored by Hasiru Dala for the year 2017-18, but due to issues with the MCC, only nine centers are run by wastepickers. Of the nine centers, two centers that are women-run are supported by NSKFDC. In March 2018, the MCC signed a three year MOU with ITC, for the management of all the 47 DWCCs. (Times of India 2018), though Hasiru Dala, also has been given a work order to manage the DWCCs
Wastepicker colonies have sprung up at Vidyaranyapura in the recent years, as nearly 50% of the waste is not processed and dump yards make for easy retrieval of high value material such as PET and HDPE plastics. The colonies accommodate about 12 to 15 families with a total of 40 to 50 residents at any given point of time. Water and sanitation are the main issues. (Interview at Wastepicker Colony at Vidyaranyapura 2018)
Mysuru also houses a wastepickers who collect hair, in exchange for aluminum vessels or clothes. They live in Government provided accommodation and also work in other informal work like domestic work, or coolie and engage in hair picking as their primary occupation. Most of the women walk about 10 to 12 kilometers, to collect hair. They then come home, wash, comb, dry and aggregate. It takes anywhere between 8 to 10 days to collect one kilogram of hair. It is then sold to an aggregator. (Interview with wastepickers who collect hair in Mysuru 2018)
Observations• Mysuru places great emphasis on visual cleanliness of the city and has engaged
in street sweeping and placement of dustbins. The city has scored highly in all surveys, as it is also litter free.
• In terms of planning the city adopted a decentralised approach early on, but failed to capitalise or scale up on the same. It has also set up dry waste collection centres in 75% of its wards which see an inflow of less than 2% of waste and of which less than a fifth are operated by wastepickers.
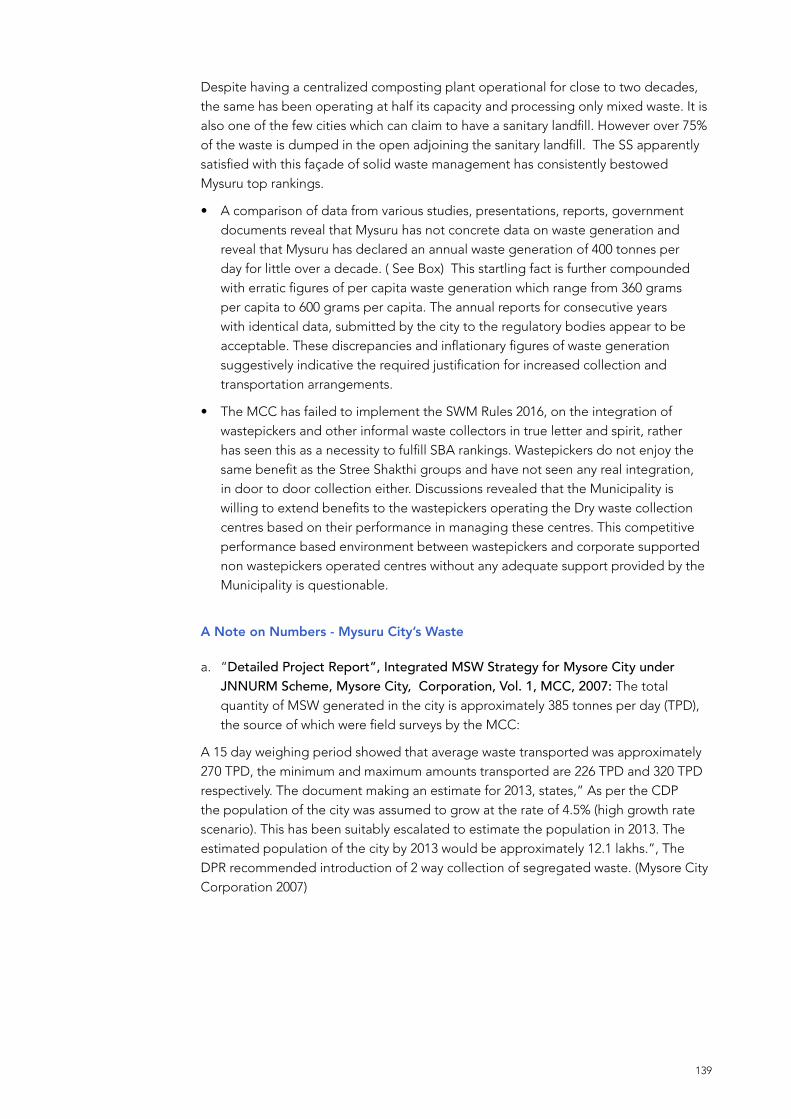
139
Despite having a centralized composting plant operational for close to two decades, the same has been operating at half its capacity and processing only mixed waste. It is also one of the few cities which can claim to have a sanitary landfill. However over 75% of the waste is dumped in the open adjoining the sanitary landfill. The SS apparently satisfied with this façade of solid waste management has consistently bestowed Mysuru top rankings.
• A comparison of data from various studies, presentations, reports, government documents reveal that Mysuru has not concrete data on waste generation and reveal that Mysuru has declared an annual waste generation of 400 tonnes per day for little over a decade. ( See Box) This startling fact is further compounded with erratic figures of per capita waste generation which range from 360 grams per capita to 600 grams per capita. The annual reports for consecutive years with identical data, submitted by the city to the regulatory bodies appear to be acceptable. These discrepancies and inflationary figures of waste generation suggestively indicative the required justification for increased collection and transportation arrangements.
• The MCC has failed to implement the SWM Rules 2016, on the integration of wastepickers and other informal waste collectors in true letter and spirit, rather has seen this as a necessity to fulfill SBA rankings. Wastepickers do not enjoy the same benefit as the Stree Shakthi groups and have not seen any real integration, in door to door collection either. Discussions revealed that the Municipality is willing to extend benefits to the wastepickers operating the Dry waste collection centres based on their performance in managing these centres. This competitive performance based environment between wastepickers and corporate supported non wastepickers operated centres without any adequate support provided by the Municipality is questionable.
A Note on Numbers - Mysuru City’s Waste
a. “Detailed Project Report”, Integrated MSW Strategy for Mysore City under JNNURM Scheme, Mysore City, Corporation, Vol. 1, MCC, 2007: The total quantity of MSW generated in the city is approximately 385 tonnes per day (TPD), the source of which were field surveys by the MCC:
A 15 day weighing period showed that average waste transported was approximately 270 TPD, the minimum and maximum amounts transported are 226 TPD and 320 TPD respectively. The document making an estimate for 2013, states,” As per the CDP the population of the city was assumed to grow at the rate of 4.5% (high growth rate scenario). This has been suitably escalated to estimate the population in 2013. The estimated population of the city by 2013 would be approximately 12.1 lakhs.”, The DPR recommended introduction of 2 way collection of segregated waste. (Mysore City Corporation 2007)
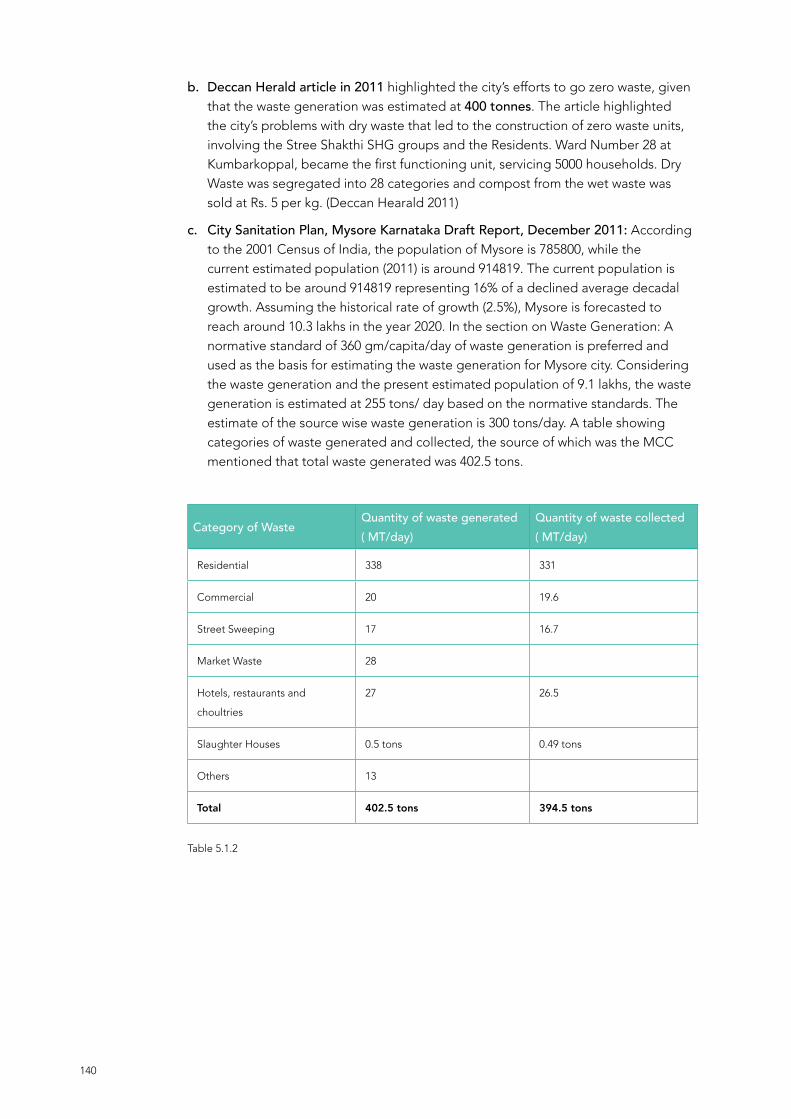
140
b. Deccan Herald article in 2011 highlighted the city’s efforts to go zero waste, given that the waste generation was estimated at 400 tonnes. The article highlighted the city’s problems with dry waste that led to the construction of zero waste units, involving the Stree Shakthi SHG groups and the Residents. Ward Number 28 at Kumbarkoppal, became the first functioning unit, servicing 5000 households. Dry Waste was segregated into 28 categories and compost from the wet waste was sold at Rs. 5 per kg. (Deccan Hearald 2011)
c. City Sanitation Plan, Mysore Karnataka Draft Report, December 2011: According to the 2001 Census of India, the population of Mysore is 785800, while the current estimated population (2011) is around 914819. The current population is estimated to be around 914819 representing 16% of a declined average decadal growth. Assuming the historical rate of growth (2.5%), Mysore is forecasted to reach around 10.3 lakhs in the year 2020. In the section on Waste Generation: A normative standard of 360 gm/capita/day of waste generation is preferred and used as the basis for estimating the waste generation for Mysore city. Considering the waste generation and the present estimated population of 9.1 lakhs, the waste generation is estimated at 255 tons/ day based on the normative standards. The estimate of the source wise waste generation is 300 tons/day. A table showing categories of waste generated and collected, the source of which was the MCC mentioned that total waste generated was 402.5 tons.
Category of WasteQuantity of waste generated ( MT/day)
Quantity of waste collected ( MT/day)
Residential 338 331
Commercial 20 19.6
Street Sweeping 17 16.7
Market Waste 28
Hotels, restaurants and
choultries
27 26.5
Slaughter Houses 0.5 tons 0.49 tons
Others 13
Total 402.5 tons 394.5 tons
Table 5.1.2

141
The document stated that per capita generation varies from 400 to 450 gm/per capita except in ward No. 9 which is very high at 600 gm/per capita. Two-way segregation was already in place. In the table showing the ward wise waste generated was 357 tons and collected 349 tons from the door to door collection. (City Sanitation Plan, Mysore Karnataka Draft Report 2011)
d. Annual Report 2015-16 on implementation of Solid Waste Management Rules, 2016, in the State of Karnataka, dated 2nd February 2017 stated: Mysuru City Corporation has 10 lakhs population and generates 402 TPD of MSW. Quantity of waste generated: 402 TPD; Quantity of waste collected: 394 TPD; Quantity of Waste processed by way of composting offsite: 200TPD; Quantity of waste processed by way of composting in decentralised waste management ( on site) 45-90 TPD; Quantity of inerts rejects land filled: 90-100TPD. Under good practices Zero waste management and separate chain link system for animal waste has been listed. 100% door to door collection mentioned. (Karnataka State Pollution Control Board 2017)
e. Pre-Feasibility Report – Establishing MUNICIPAL SOLID WASTE PROCESSING AND SCIENTIFIC DISPOSAL FACILITY FOR RAYANAKERE, MYSURU CITY dated 20th May 2016: The city has been divided into 65 municipal wards and the approximate population is 920550 (2011 Census). The estimated quantum of MSW currently generated in the city is approximately 402 MT. (Mysore City Corporation 2016)
f. Annual report to be submitted by the State Pollution Control Board or Pollution Control Committee Committees to the Central Pollution Control Board for the year 2016-17 dated 23rd November 2017 stated: Mysuru city Corporation has 10 lakhs population, and generates 402 TPD of MSW. Quantity of waste generated: 402TPD; Quantity of waste collected: 394 TPD; Quantity of waste processed by way composting offsite: 200 TPD; Quantity of waste processed by way of Composting in decentralized waste management (on site): 45-90 TPD (out of 9 de centralized unit only 7 are working each unit is handling about 4 to 6 TPD. Totally it comes to around 35 to 45 TPD); Quantity of inert rejects landfilled: 90-l00TPD. With good practices, the list included GPS tracking, Caller Tune to educate residents among the others. (Karnataka State Pollution Control Board 2017)
g. Final Environment Impact Assessment Report Baseline Study Period (March to May 2017) Construction of 150 TDP Municipal Solid Waste Treatment Facility at Sy. No.39, Rayanakere, Mysore, Karnataka, proposed by the Mysore City Corporation February 2018, states the Health Officer/Commissioner of MCC, proposed the new facility. In the Introduction section it states that, “The estimated quantum of MSW currently generated in the city is approximately 402 MT. However currently there is a lack of handling 250 TPD of waste that is directly finding its place as a dump within the Sewage farm area”. Hence the need for the facility.
In the section on Brief Project Description, the report states the following: The city has been divided into 65 municipal wards. Mysore has a population of 9.2 Lakhs as per the 2011 census and had the growth rate of about 27 % in the last decade. The

142
design population for the year 2016 and 2021 is 10.58 lakh and 12.2 Lakh respectively. The total waste generation as per generator based assessment, which is sum of waste collected from households, commercial establishments, markets, hotels & restaurants and street sweeping is estimated at 402 tons per day. The normative estimate based on the per capita waste generation of 400 grams per capita is 423 tons. The waste collected and transported is 354 tons per day. The design waste generation of 425 tons per day is adopted as a realistic waste generation. At average collection & transport of 354 tons per day the collection efficiency is 83%.The report goes on to detail existing processing infrastructure – nine zero waste facilities of 5 tons per day capacity and the Vidyaranyapuram Composting facility of 200 TDP. In planning for future needs, the MCC required capacity to process is about 711 tons per day and it envisions a split across 3 facilities – Vidyaranyapuram ( 200 TPD), Kesare ( 200 TPD) and Rayanakere ( 150 TDP). They are also exploring a MRF option with WTE to handle about 285 tons of installed capacity of 300 TPD. The baseline for this was the quantity of waste processed and disposed assessed at 422 tons per day in 2017. The required capacity with a 10 year design based on the population growth of 30 % decadal increase and 2 % annual growth in the waste generation rate. The normative estimate based on the per capita waste generation of 400grams per capita is 422 tons. Of the 150 TPD the products so generated will be 22-23 TPD of compost and 40 TPD of RDF. (SMS ENVOCARE LIMITED 2018)
h. Transforming urban landscapes of India: Success Stories in Solid Waste Management, Swachh Bharat Mission (Urban), Ministry of Housing and Urban Affairs, Government of India, 2018, details success stories in SWM : For Mysore it states, The corporation has set up 9 Zero waste management units and 47 material recovery facilities in the city, which cater to 200 MT of waste generated, whereas the remaining 200 MT goes to a centralized waste treatment facility, which has a waste to compost plant for treating wet waste and a material recovery facility for recovery of recyclables. Waste generation per day has been listed 400 MT per day. Mysuru City Corporation has set up a Waste to Compost plant on PPP basis with IL&FS. The plant has been running successfully since 2001. The plant is currently running to its full capacity and managing 50% of waste (200 MT) generated in the city 45-50 MT of organic compost is produced daily through windrow composting method. (Swachh Bharat Mission (Urban), Ministry of Housing and Urban Affairs, Government of India 2018)
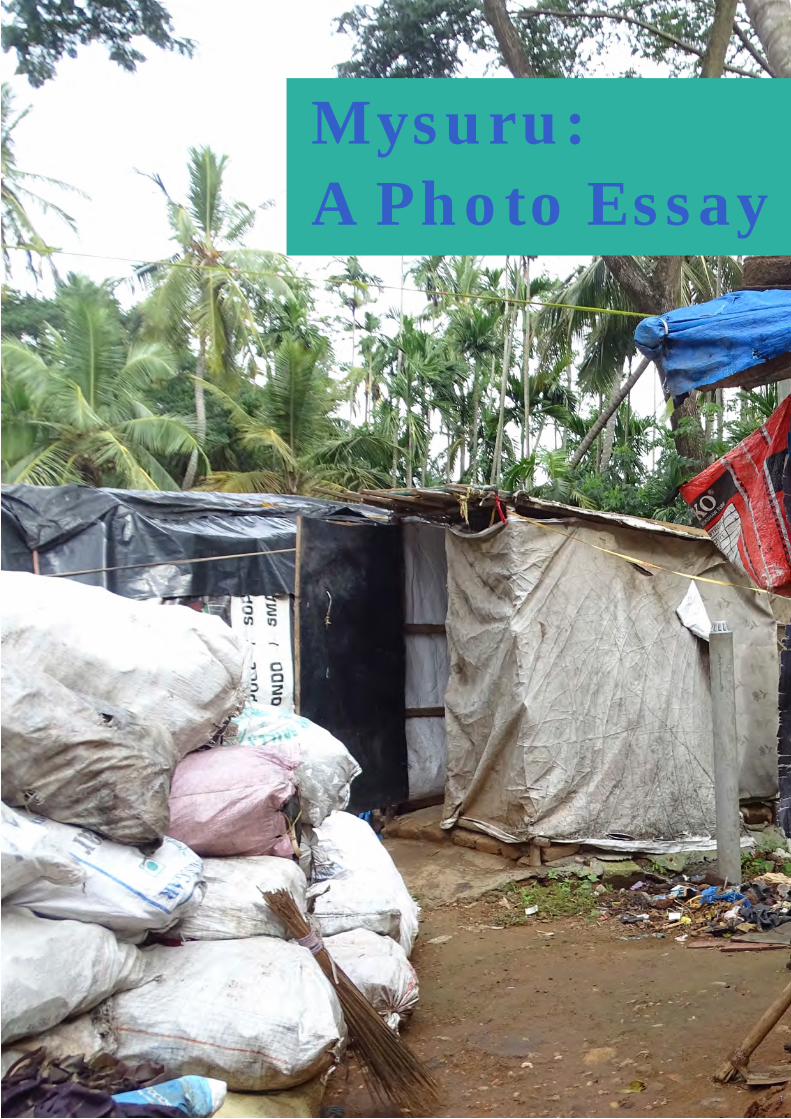
Mysuru: A Photo Essay

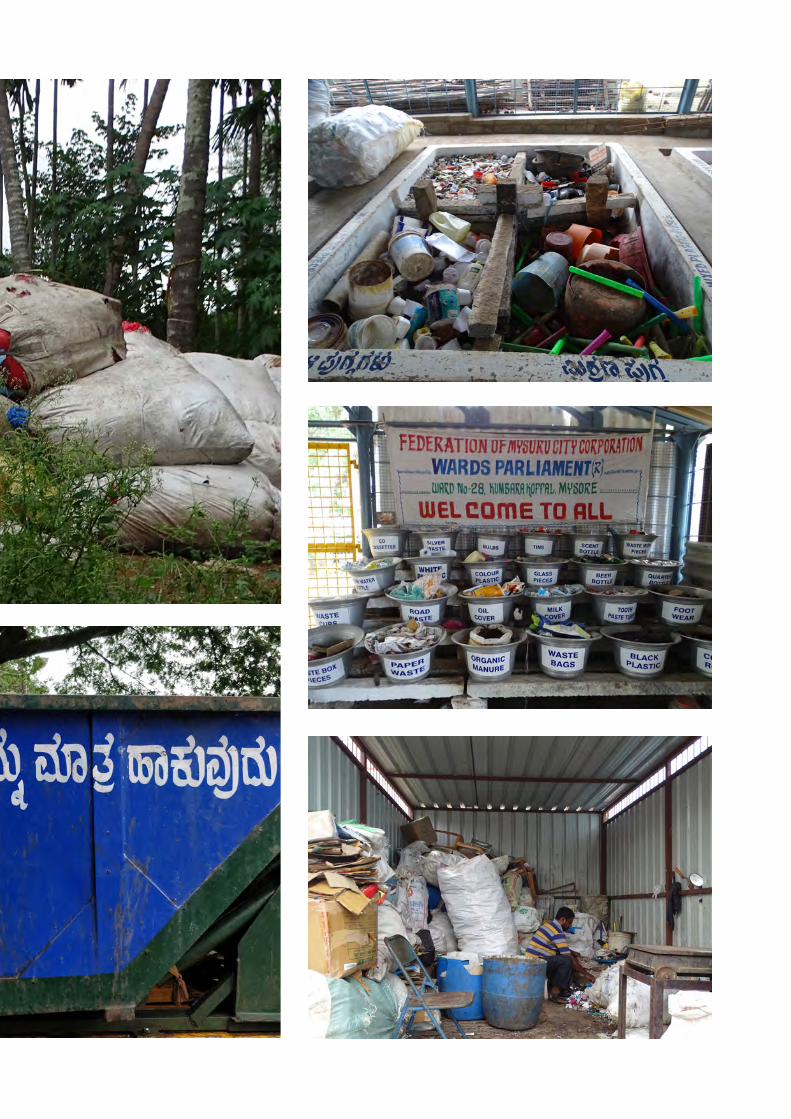

146
Patna: A Case Study
147
5.2. PatnaPatna is the largest city and state capital of Bihar. Patna has been identified as a Smart City.
Fast Facts
State Bihar
Area 3,202 Sq. Km
Population as per 2011 census 16,84,222lakhs
Number of Wards 75
Number of Hosueholds 223088
Waste Generation/Day 644- 850m tonnes per day
Segregation Level NA
Administrative Body Patna Municipal Corporation or Patna Nagar
Nigam
Box 5.2.1: Fast facts on Patna
Source: Centre for Science and Environment
(https://www.cseindia.org/patna-municipal-corporation-8292 )
Urban Development & Housing Department, Government of Bihar
(http://urban.bih.nic.in/Acts/AR-01-04-10-2018.pdf)
Background
Patna Municipal Corporation was established on 15th August 1952, by the Government of Bihar. Patna has five administrative zones (circles) and 75 wards. The circles New Capital Circle (16 wards), Kankarbagh Circle (11 wards), Bankipore Circle (12 wards), Patna City Circle (20 wards) and Patliputra Circle (16 wards). (Bihar Times 2016) The Assistant Health Officers are in charge of Sanitation work. (Patna Municipal Corporation n.d.).
Patna has followed a traditional approach of collection, transportation and dumping waste. In the year 2002, the Patna Municipal Corporation (PtMC) entered into a formal working arrangement with Nidan and Nidan Swachhdhara Private Limited (NSPL), an NGO and company working with waste pickers, for door-to-door collection. Through this arrangement, about 63000 households were serviced. This arrangement featured as a best practice in the Compendium of Global Best Practices- Urban Solid Waste Management, by the NIUA. (National Institute of Urban Affairs 2015) (Pathways to Development 2016). However, difference cropped in and contract has not been renewed. (Nidan n.d.) . For the rest of the city, that did not have door to door collection, waste was deposited in the central bin placed on the road; other waste was dumped in vacant lands, parks, roads etc. The paper also described the method and equipment used to pick waste – which included shovels, cat machines and JCB machines and the waste was sent to the dumping grounds. ( Kumar Bhanu and Kumar 2014). The dumping ground situated at Ramchak Bairiya village on the outskirts of

148
Patna, has been at the in the news from 2011, given the frequent outbreak of fire, the smell, health related complaints from the neighbourhood. The Bihar State Pollution Control Board also held a public hearing on the issue in March 2011, but with no suitable outcome. (Tripathi 2012)
In 2014, the Bihar Urban Infrastructure Development Corporation Limited ( BUIDCo) entered into a Concession Agreement with Patna Green Energy Private Limited (Concessionaire) for the design, financing, development, construction, operation, maintenance, management and transfer of a Regional Solid Waste to energy for electricity. The project was earmarked at the existing dump site Ramchak Bairiya, spread over 78.89 acres. In addition to generating electricity, the concessionaire was also expected to maintain the landfill. (Bihar Urban Infrastructure Development Corporation Limited 2014). In the same year BUIDCo has also entered into a PPP with Mumbai-based Company Sunil HiTech Engineers Limited (SHEL), to manage solid waste in the city. (Rumi, Waste management firm’s contract terminated 2018)
In a newspaper report in August 2016, the Patna Municipal Commissioner was quoted saying the Empowered Standing Committee (ESC) has decided to, “purchase two self-propelled heavy duty vacuum sweepers, one truck mounted road sweeping machine, one disilter, 800 secondary storage containers of 1.1 cubic metre capacity, 50 secondary storage containers of 2.5 cubic metre capacity, 200 decorated dustbins and six twin bin dumper placers for solid waste management. Altogether Rs13 crore would be used from Solid Waste Management Fund to purchase the equipment”. (Bihar Times 2016)
In another newspaper report in 2016, stated that Patna’s Garbage dumping site would be operational, and could accommodate about 1000 tons of garbage every day. It also stated that Patna’s daily garbage generation was about 800-900 tons. Patna Green Energy Private Limited was quoted as Special Purpose Vehicle (SPV), formed for the landfill site, would complete the development of the complex, to generate 10MW electricity in two years period. (Times of India 2016)
Box 5.2.2 : Quote DR. R K Sinha on Patna
Dr. R K Sinha, Environment Conservationist, speaking at a book release in July 2016 titled,” Not in my Backyard- Solid Waste Management in Indian Cities”, by the Centre for Science and Environment said“Patna is one of the worst cities in terms solid waste management. One can see heaps of solid waste piled up on the banks of the Ganga River here. Apart from the ecological cost, this is also a method to illegally reclaim land. Waste management is an issue where the onus is not only on the state and municipal authorities, but every household has to be part of this”. (Centre for Science and Environment 2016)

149
Current Situation
The per capita waste generation in Patna is about 331 gm/d. The system for collection of waste varies, as only 60% of Patna has regular door-to-door service. Segregation of waste at source is not the norm. User fee is pegged at Rs. 30/- per month. Earlier, when collection was outsourced, user fee collected was Rs. 60 per month. (Rumi, Door-to-door trash collection from October 2018)
Box 5.2.3 : Data Submitted to the Smart City Challenge
• Door to Door Collection - 20% to 80%
• Efficiency in Collection of Solid Waste – 60% to 65%
• Efficiency in redressal of Customer Complaints – 40% to 50%
SWM Initiatives undertaken includes:
• Procured 720 Hand carts, 1324 of 1.1 Cum Bins, Tricycle Rickshaws 225, 135 Tractors, JCB 13, Robot 12, Compactors 25, Tippers 8, Haiwa 19
• Weighbridge at Landfill site installed and operational
• Waste to Energy Plant of 11.5 MW is being commissioned at Bairia village.
(The Smart City Challenge Stage 2 n.d.)(Source: Patna Nagar Nigam)
Photo 14 b: Patna Nagar Nigam Waste Collection Cart

150
In 2018, the Urban Development and Housing Department, Government of Bihar put out a Draft Comprehensive Solid Waste Management Policy and Strategy for Urban Local Bodies of Bihar, in a view to provide proper guidance to the ULBs in managing solid waste generated in their respective areas.
The document identified few important aspects
• ULBs of Bihar lack managerial, administrative, financial and institutional management and technical knowhow of managing urban solid waste
• Availability of land to establish SWM facility was identified as a constraint
• Lack of data availability as no formal study has been conducted to identify quality and quantity of waste generated in the state.
• Using a CPCB data of 2000, the document pegs per capita waste generation in Patna Municipal Corporation at 0.4kg per capita per day. Given the number of households at 2, 23,088, the waste generated per day is about 446 tonnes. (Annual waste will be 162854 TPA).
• Based on the survey conducted by the Government of Bihar, Patna’s reflects about 60% in 100% Door-to-Door collection from wards.
The document borrows from SWM Rules 2016, in terms of the duty of the waste generator, the need to put in place and streamline door-to-door collection. The document does outline the need and utility of a community collection system, as a primary storage point from households and in markets.
“Various sizes of community containers (From 1.1 cum to 4.5 cum) are available with the ULBs for collection of Municipal Solid Waste. The waste collected from the residential and commercial areas temporarily stored in these community containers and transported to centralized waste processing site in case of availability of processing facility or directly sent to the dumping site for open dumping.” (Draft Comprehensive Solid Waste Management Policy and Strategy for Urban Local Bodies of Bihar 2018)
In June 2018, BUIDCO, terminated the contract with Mumbai-based Company Sunil HiTech Engineers Limited (SHEL), on the grounds of improper handling of solid waste management and attributed the poor rankings in cleanliness survey to the company. (Rumi, Waste management firm’s contract terminated 2018)
In 2019, the NGT noting Bihar’s poor management of waste, said can lead to emergency kind of situation and urged Bihar chief secretary to submit quarterly reports. (PTI 2019). Patna was ranked 262 in the 2017 SS and 312 in 2018 (Swachh Survekshan 2018: Never Mind The Previous Poor Rankings, Patna Hopes For Better Performance This Year 2018). A research article in 2018, attributes Patna’s poor management to lack of technical expertise and appropriate institutional arrangement, unwilling of the ULB to introduce proper systems of collection, transportation and destinations, indifference and lack of awareness from citizens”. It goes on to say this creates an occupational health risk for wastepickers, who work in this environment. (Dr. Anand, Raman and Rani 2018)

151
Integration of Informal Waste Workers
Photo 14 c : Wastepickers Collection Cart, Patna

152
Patna’s integration of wastepickers in the city’s solid waste management as early as 2002 was often cited as a best practice, and hence it is important to look at the work undertaken by Nidan Swachhdhara Private Limited (NSPL), in the area of Patna’s solid waste management. NSPL had its roots in Nidan, an NGO set up in 1996, with the aim of empowering the informal sector workers such as the wastepickers in providing them a secure livelihood. Having worked under the donor model, Nidan’s quest for sustainability led them to the formation of NSPL. Prior to this, they did experiment registering a cooperative, which did not materialise, as they did not receive formal recognition. Registered in 2002, as a private sector company, NSPL focuses on creating professional workforce of sanitation workers called Safai Mitras, who are then linked to opportunities in the waste space. In order boost worker identity, the wastepickers are called Safai Mitras, and are encouraged to be a part of the company. About 185 wastepickers are the shareholders in the company, with a few representatives on the board of the company. The company status allows NSPL to bid for contracts with households, municipalities and institutions, on par with other private limited companies (national and international) in the waste sector. NSPL operates on user fee basis. The contract with the PtMC from 2005 to 2011, had the potential to be taken up on a large scale, but was limited to four wards. Activities undertaken included – Door-to-door garbage collection (for households, restaurants and shops for a monthly fee), Composting and recycling of dry waste through the kabadi Center for sale and purchase of dry waste from the wastepickers. In order to support the waste pickers, NSPL also bids for Housekeeping contracts. (Nidan n.d.) (New Concept Information Systems for UNICEF 2012)
Observations• There has been no acknowledgement of the role of the wastepickers/informal
waste collectors by the Municipality, despite a very strong organised workforce in the form NSPL.
• Patna needs to set in place the system for implementing SWM Rules, 2016, before charging ahead with large scale waste to electricity projects.

Patna: A Photo Essay

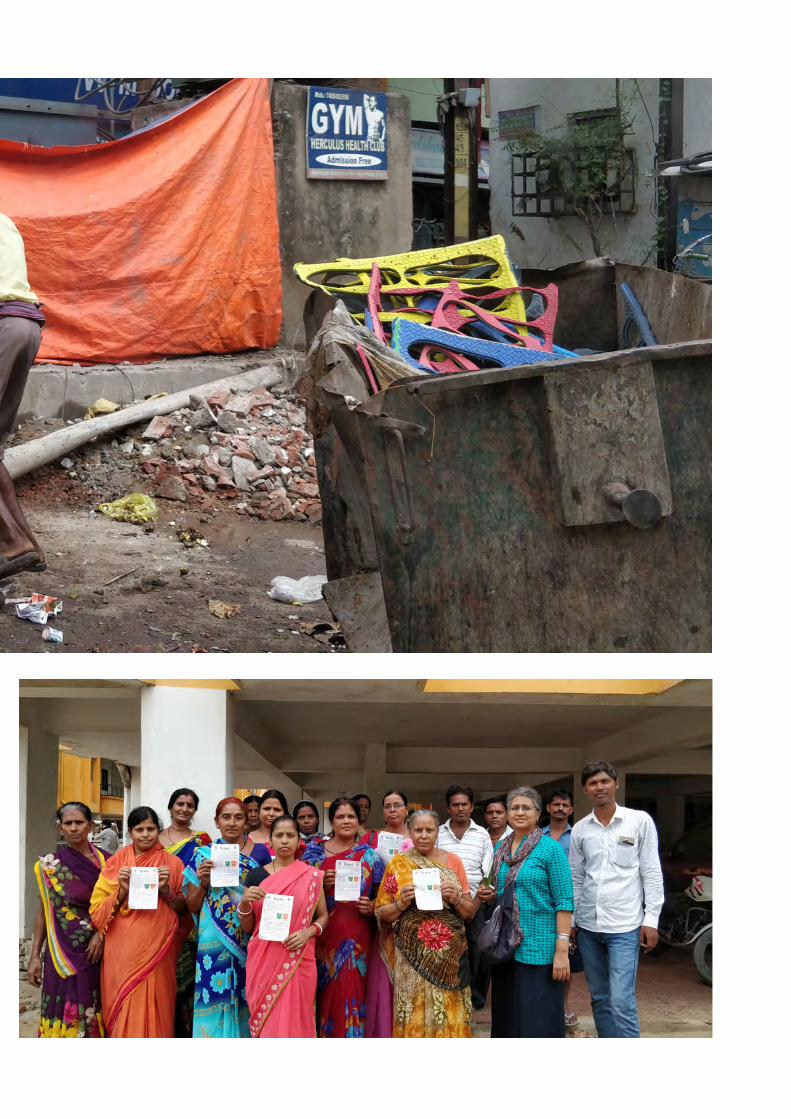

156
Gurugram: A Case Study

157
State Haryana
Area 232 Sq. Km
Population as per 2011 census 876969
Number of Wards 35
Number of Hosueholds NA
Waste Generation/Day 1000 tons per day, along with 800 tons per day
from Faridabad
Segregation Level NA
Administrative Body Municipal Corporation or Gurugram
Background
“Gurgaon is a disaster, a horror story of how urbanisation should not happen. It is not merely Gurgaon—little Gurgaons are emerging all over Delhi. When these monstrosities were being ‘developed’, did anyone think about where the water for them would come from, and where the waste generated by them would go? Now they exist and answers have to be found. I have nothing to say except to say that this isn’t development, but mal-development.” -Ramaswamy R Aiyer, Former Secretary, Water Resources, GoI (Kumar and Misra 2012)
Gurugram, initially incorporated in the Delhi Metropolitan Region, in Delhi’s first Master Plan in 1962, (Delhi Development Authority 1962), became a part of the Haryana administration in 1966, and was never in the limelight till the Indian economy liberalized. Envisioned as a knowledge city, Gurugram, located at roughly 30 kilometers south of Delhi, urbanized rapidly from 1996. Sleek, high rise tower structures housing office spaces and apartments and large shopping malls, spaces for work, stay and entertainment, this poster city, is now everyone’s favourite punching bag, when it comes to civic amenities- unplanned streets, electricity shortage, urban flooding, and improper waste management. (Narayan 2015) (Joshi 2016) (Singh 2016) (A. Kumar 2017). Early on in 2008, the Hindustan Times ran a series titled Gurgaon collapsing, of which one of them was titled “Global Destination or Garbage Dump?” which questioned the state of affairs on the issue of waste management. (Ahuja 2008) (Kalyan 2017)
5.3 Gurugram (Gurgaon)Gurgaon as it is popularly called or Gurugram (officially), is one of the leading financial hubs in the country, with the third highest per capita income in India after Chandigarh and Mumbai. It is also known as the Millennial City.
Fast Facts
Box 5.3.1: Fast facts on Gurugram
Source: Municipal Corporation Gurugram (https://www.mcg.gov.in)

158
The Governor of Haryana, as per the Haryana Municipal Corporation Act, 1994 declared the constitution of Municipal Council of Gurgaon In June 2008 and Municipal Corporation of Gurgaon or MCG started functioning. The total area of the city is about 232 square km and it is divided into 35 municipal wards. Administratively, it comprises of four zones 1, 2, 3, 4: three subdivisions Gurugram South, Gurugram North and Pataudi and five Tehsils – Gurugram, Sohna, Farrukhnagar, Pataudi and Manesar. It has 50 villages, 150 residential colonies and 2 Industrial Sectors. (2019).
It is interesting to note that solid waste in Gurugram is managed by multiple agencies Haryana State Infrastructure Development Corporation (HSIDC) and the Harayana Urban Development Authority (HUDA), including MCG and the approach has always been traditional – collect, transport, dispose to a centralised location. (A. Kumar 2015).
In September 2015, the then Minister for Haryana ULB directed the then Additional Chief Secretary, to amend the Haryana Municipal Corporation Building Bye Law, 2014, to be able to legalise the need for bulk generators (which included all private institutions, townships, group housing societies, hotels, motels and restaurants, banquet halls and marriage palaces, educational institutions and industrial institutions which generate more than 25 kg biodegradable waste per day) to manage their biodegradable waste. (The Pioneer 2015). In 2017, the then Principal Secretary to Government of Haryana issued a memo, on the adoption of the Haryana Building Code 2017, which unfortunately failed to take into account the Minister’s directions and solid waste management did not feature in Chapter 8 Sustainable Measures. Only in Chapter 12 - Environment Clearance for Category A and B buildings it listed Separate wet and dry bins must be provided at the ground level for facilitating segregation of waste.” (Government of Haryana 2017)
According to the Pre-feasibility Report by HUDA on the Integrated Solid Waste Management Facility at Village Bandhwari, “The Municipal Corporation of Gurgaon (MCG) is the apex body responsible for waste planning and management in the city. As far as its operational role is concerned, MCG is only responsible for waste generated in its municipal area (primarily old Gurgaon). Waste management in HUDA sectors is undertaken by private contractors, RWAs as well as by permanent employees of HUDA”. (Haryana Urban Development Authority 2016)
The dumpsite, spread across 32 acres is located on the Gurugram-Faridabad road, was initially set up as a landfill-cum-waste treatment facility under JNNURM in 2010-11. The plant was dysfunctional but continued to receive garbage from both Gurugram and Faridabad, despite two major fire incidents (Karki 2017). The Pre-feasibility Report 2016 detailing the size and magnitude of operations listed that the project was designed to handle approximately 1100 TPD MSW on a daily basis and the processing facilities would include Bio Methanation, Composting, RDF processing and RDF to power. (Haryana Urban Development Authority 2016)

159
In 2017, MCG outsourced waste management services to a private agency, Eco Green Energy Private Limited, by signing a concession agreement with 22 year validity. The authorization letter certified that Eco Green was “the authorised waste collector for door-to-door collection & transportation of MSW for residential colonies, HUDA sectors, village areas etc., commercial, institutional, hotels, hostels, hospitals, shopping complexes, office complexes, government offices, industrial or any other waste generators, with the MCG limits”. (Inter ULB MOU Solid Waste Bandhwari MCG and MCF 2016) (Concession Agreement Eco Green 2017) ( Municipal Corporation of Gurugram 2018)
Current Situation
According to the document titled “Gurugram: A framework for Sustainable Development”, “It is estimated that about 90 percent of the Municipal Solid Waste (MSW) is disposed of at the landfill in Bandhwari with little processing. There are about 3,648 sanitary workers which include both permanent and contractual workforce, supporting the city in collection and recycling of waste4. Given the amount of waste generated in the city and the limited availability of land and serious concerns on the air quality, MCG is working towards improving the waste management process by encouraging decentralized systems for bulk waste generators and at the same time improving the centralized system. (Roychowdhury and Puri 2017)
In May 2018, the Government of Haryana issued an addendum to the Haryana Building Code 2017 and included the following: The definition of “Solid Waste Management Plant” Includes collection of primary segregated solid waste from door to door. This has to be secondary segregated on daily basis & segregated solid waste shall be processed in the organic waste convertor (OWC) Machines/Biodegradable Waste Convertor”. (Amendment in the Haryana Building Code-2017-Chapter1, 6 & 7 2018) (Government of Haryana 2018)The NGT in 2019, questioned both the Gurgaon Municipal Corporation and Eco Green on improper waste management and open waste dumping and non-implementation of the SWM Rules 2016 (Ratna 2019)
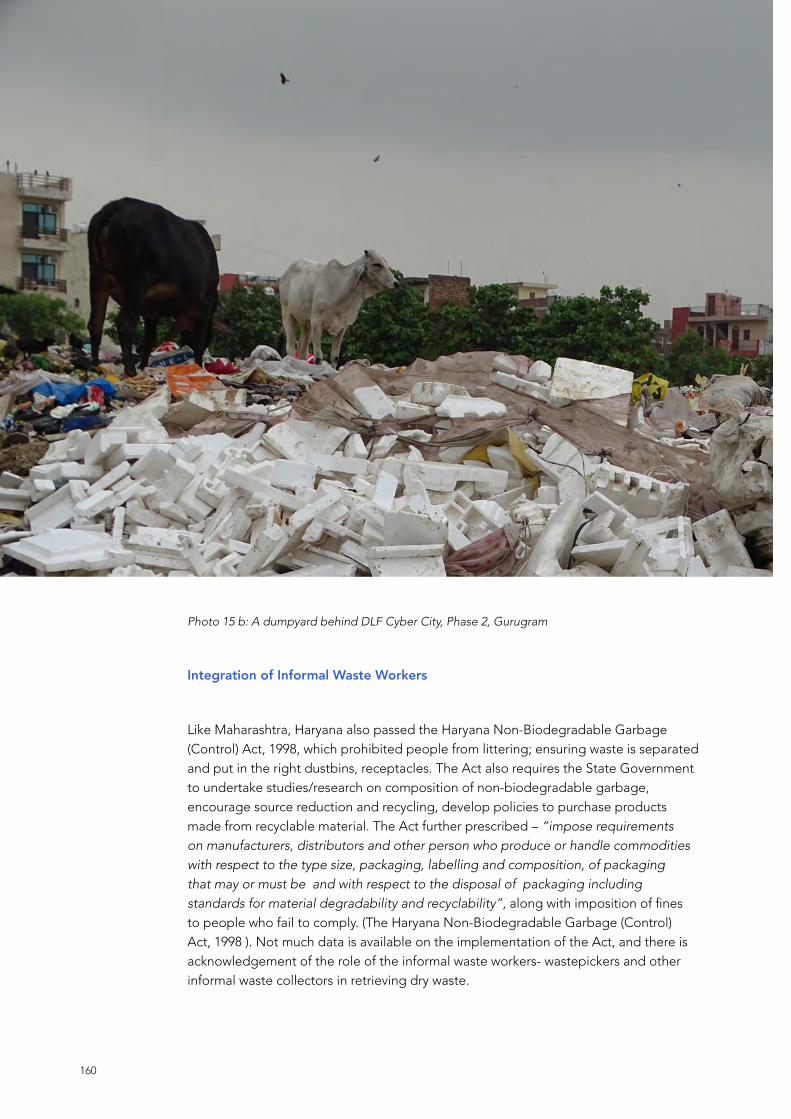
160
Integration of Informal Waste Workers
Like Maharashtra, Haryana also passed the Haryana Non-Biodegradable Garbage (Control) Act, 1998, which prohibited people from littering; ensuring waste is separated and put in the right dustbins, receptacles. The Act also requires the State Government to undertake studies/research on composition of non-biodegradable garbage, encourage source reduction and recycling, develop policies to purchase products made from recyclable material. The Act further prescribed – “impose requirements on manufacturers, distributors and other person who produce or handle commodities with respect to the type size, packaging, labelling and composition, of packaging that may or must be and with respect to the disposal of packaging including standards for material degradability and recyclability”, along with imposition of fines to people who fail to comply. (The Haryana Non-Biodegradable Garbage (Control) Act, 1998 ). Not much data is available on the implementation of the Act, and there is acknowledgement of the role of the informal waste workers- wastepickers and other informal waste collectors in retrieving dry waste.
Photo 15 b: A dumpyard behind DLF Cyber City, Phase 2, Gurugram
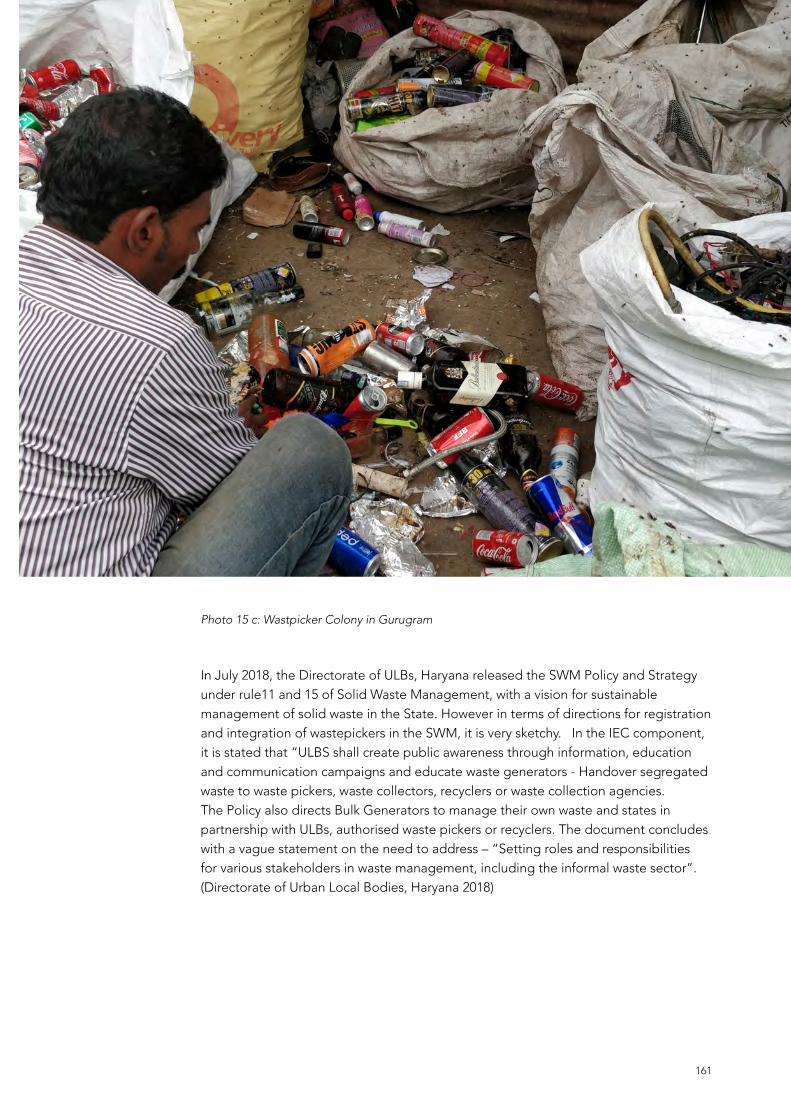
161
Photo 15 c: Wastpicker Colony in Gurugram
In July 2018, the Directorate of ULBs, Haryana released the SWM Policy and Strategy under rule11 and 15 of Solid Waste Management, with a vision for sustainable management of solid waste in the State. However in terms of directions for registration and integration of wastepickers in the SWM, it is very sketchy. In the IEC component, it is stated that “ULBS shall create public awareness through information, education and communication campaigns and educate waste generators - Handover segregated waste to waste pickers, waste collectors, recyclers or waste collection agencies. The Policy also directs Bulk Generators to manage their own waste and states in partnership with ULBs, authorised waste pickers or recyclers. The document concludes with a vague statement on the need to address – “Setting roles and responsibilities for various stakeholders in waste management, including the informal waste sector”. (Directorate of Urban Local Bodies, Haryana 2018)

162
In December 2018, a Times of India article titled read “Ragpickers to collect garbage before Swachh Rating”, the article further said, that following complaints on management of waste and a meeting on SS, it was decided that Eco Green would tweak its model and integrate wastepickers in the door-to-door collection. It further said that 1200 wastepickers would be employed and a proposed material recover facility would be set up, for secondary segregation with a long term strategy to form a cooperative society for wastepickers to provide them with loan and insurance facilities. (Times of India 2018)
Key Observations• Gurugram needs a full-fledged, working framework of decentralised and
segregated collection. There are residents that have been leading the change like the Nirvana Country housing in Sector 50, Vipul Belmonte in DLF 5 and Silver Oaks in DLF Phase 1 (Tribune India 2019) (Dhankhar 2018)
• Gurugram, has a formal system with collection and transportation system operating through a concessionaire agreement and a collection system operating through informal waste collectors, which is termed as integration. See Box 5.3.2
• The Government cannot outsource the job of registration and integration of wastepickers and other informal waste collectors to a private agency
Box 5.3.2 Observations and informal interview by authors
Source: Observations and informal interview by authors
Levels of operations:
A visit to two of the informal waste colonies – Nathupur and the Mehrauli-Gurgaon Road, , Sector 24 reveal, that there are multiple levels of operations that take place:
1. The informal waste collector pays the Dealer (also called Agent or Dalal) for permission to operate in a geographical package, and they in turn pays the Smart Collector belonging to the authorised agency. The informal waste collector carries out the actual collection from the households.
2. The informal waste collector does a buyback of mixed waste from the housekeeping staff of the RWA.
The Informal Recycling System
Around 12 informal waste colonies exist, with over 15000 waste workers. Each colony have about 3 to 4 work leaders. Each sorting area employs about 15 to 25 people, and given the condition of waste about 9 types of recyclable plastics is recovered. The rent paid per sorting area varies between 5000-10,000/-To dispose of the wet waste and other soiled materials and rejects, they have to pay Rs. 30,000 per day per tractor to dispose at the landfill.

Gurugram: A Photo Essay
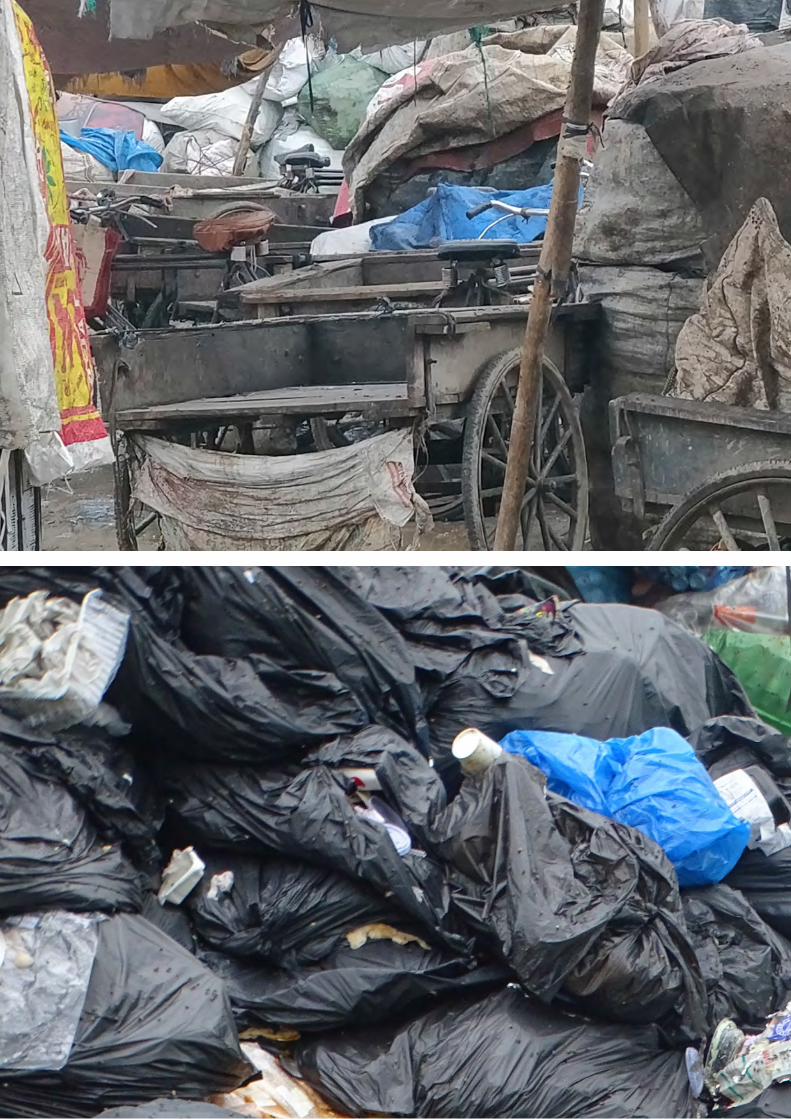
164

165

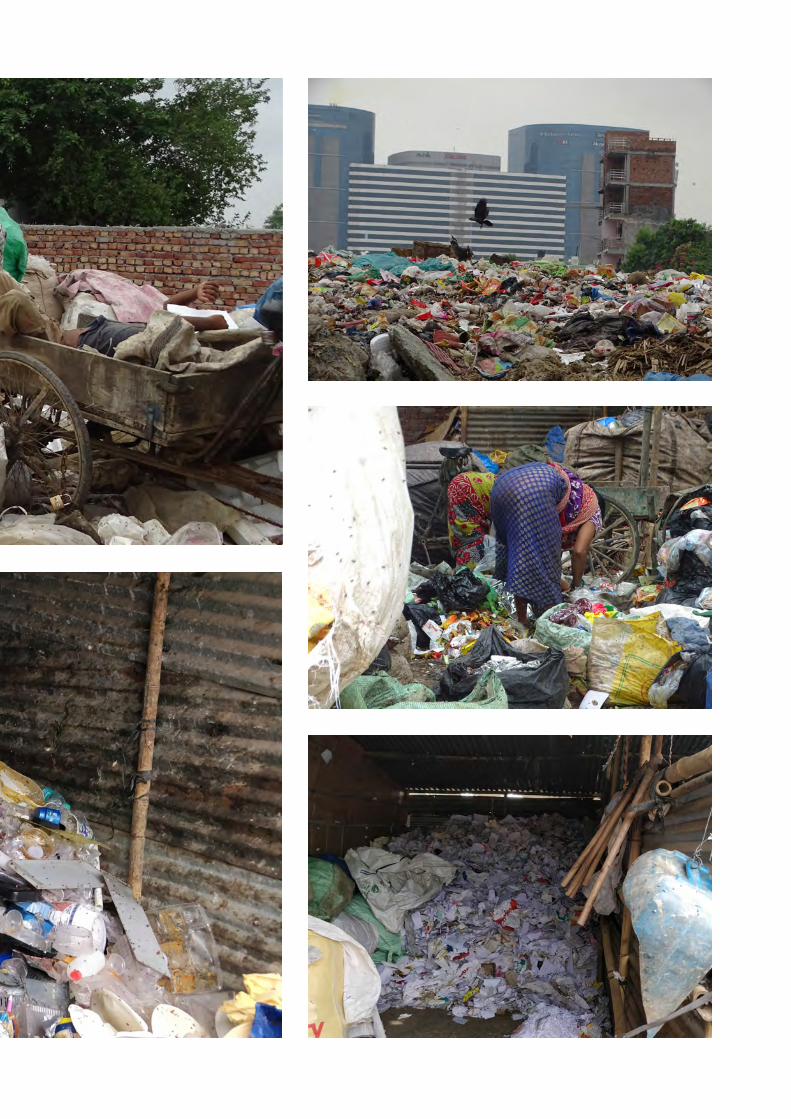

168
Indore: A Case Study
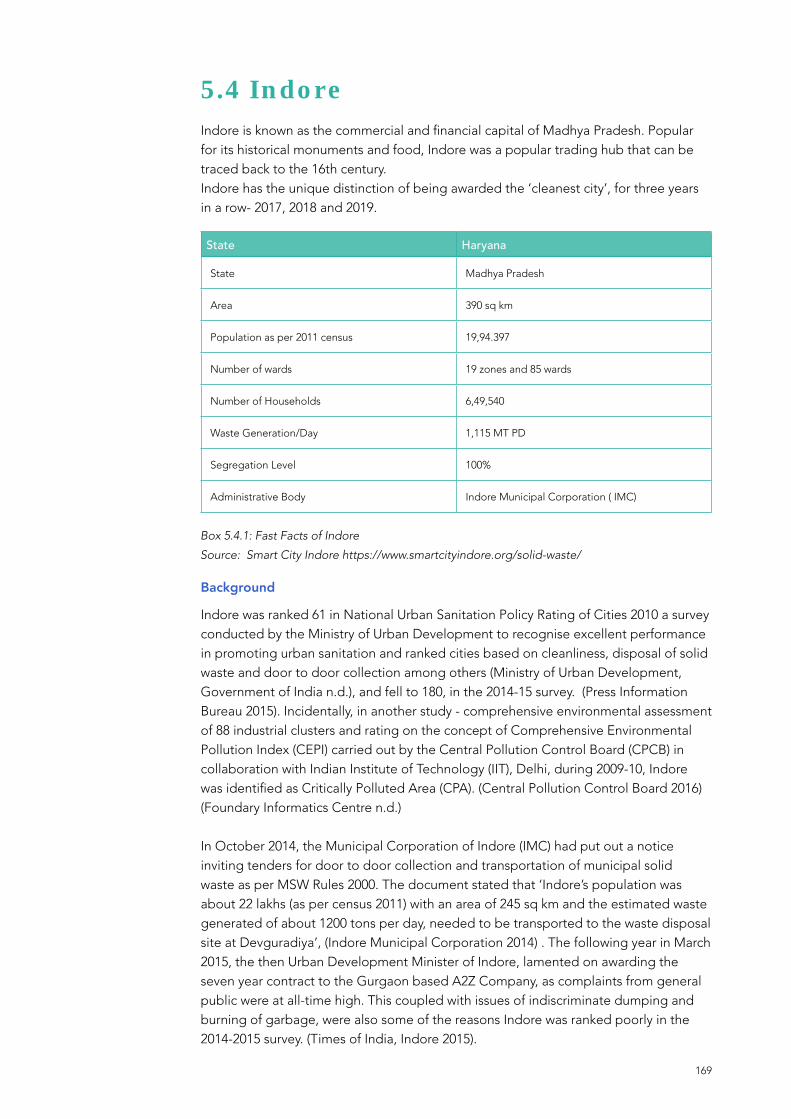
169
5.4 IndoreIndore is known as the commercial and financial capital of Madhya Pradesh. Popular for its historical monuments and food, Indore was a popular trading hub that can be traced back to the 16th century. Indore has the unique distinction of being awarded the ‘cleanest city’, for three years in a row- 2017, 2018 and 2019.
State Haryana
State Madhya Pradesh
Area 390 sq km
Population as per 2011 census 19,94.397
Number of wards 19 zones and 85 wards
Number of Households 6,49,540
Waste Generation/Day 1,115 MT PD
Segregation Level 100%
Administrative Body Indore Municipal Corporation ( IMC)
Box 5.4.1: Fast Facts of Indore
Source: Smart City Indore https://www.smartcityindore.org/solid-waste/
Background
Indore was ranked 61 in National Urban Sanitation Policy Rating of Cities 2010 a survey conducted by the Ministry of Urban Development to recognise excellent performance in promoting urban sanitation and ranked cities based on cleanliness, disposal of solid waste and door to door collection among others (Ministry of Urban Development, Government of India n.d.), and fell to 180, in the 2014-15 survey. (Press Information Bureau 2015). Incidentally, in another study - comprehensive environmental assessment of 88 industrial clusters and rating on the concept of Comprehensive Environmental Pollution Index (CEPI) carried out by the Central Pollution Control Board (CPCB) in collaboration with Indian Institute of Technology (IIT), Delhi, during 2009-10, Indore was identified as Critically Polluted Area (CPA). (Central Pollution Control Board 2016) (Foundary Informatics Centre n.d.)
In October 2014, the Municipal Corporation of Indore (IMC) had put out a notice inviting tenders for door to door collection and transportation of municipal solid waste as per MSW Rules 2000. The document stated that ‘Indore’s population was about 22 lakhs (as per census 2011) with an area of 245 sq km and the estimated waste generated of about 1200 tons per day, needed to be transported to the waste disposal site at Devguradiya’, (Indore Municipal Corporation 2014) . The following year in March 2015, the then Urban Development Minister of Indore, lamented on awarding the seven year contract to the Gurgaon based A2Z Company, as complaints from general public were at all-time high. This coupled with issues of indiscriminate dumping and burning of garbage, were also some of the reasons Indore was ranked poorly in the 2014-2015 survey. (Times of India, Indore 2015).

170
To prevent fire and air pollution in summer, the IMC tried to make temporary arrangements (Times of India, Indore 2015), yet in May 2015, a fire broke out at the Devaguradia trenching ground, destroying machinery at the A2Z’s waste disposal plant. The newspaper report also quoted that fire was set to dispose garbage ( Times of India, Indore 2015) (Hindustan Times, Indore 2015). This quote resonated with the IMC’s submission to the Madhya Pradesh High Court that A2Z company was burning waste at the trenching ground in 2012 (Times of India, Indore 2012). In September 2015, IMC cancelled A2Z Infrastructure Company’s contract and decided to make investments in owning waste management systems. (Hindustan Times, Indore 2015). Problems continued to plague IMC, as the CPCB issued a notice to the IMC, for unscientific waste management and sewerage, based on the report by the Madhya Pradesh State Pollution Control Board ( PMSPCB) , in October 2015. The report stated that there was no practice of segregation of waste at source and mixed waste was being dumped at the disposal site. The report also highlighted the issues of legacy waste and garbage burning. (Times of India, Indore 2015). Around the same time the Madhya Pradesh High Court directed the IMC to formulate a comprehensive time-bound programme to manage the city’s waste (Hindustan Times, Indore 2015) . A detailed survey revealed that state of affairs at various levels across human resources, infrastructure, operations, capacity building, data management and governance, etc. This included open dumping, burning of waste, irregular collection, demotivated staff, high absenteeism, inefficient supervision, non-running vehicles among the others. ( Hindu Business Line 2018) (The Indian Express 2017)
The IMC adopted various measures to achieve the top place. The vision was to make the city Bin free, Litter free and Dust free. The roadmap charted to actualise the vision was by enforcing segregation of waste at source into wet and dry; door- to door waste collection, along with separate collection for bulk generators and commercial areas and construction and demolition debris; biometric attendance and GPS monitoring of vehicles; mechanized road sweeping, evening cleaning, cleaning of drains and other vacant plots; constructing processing facilities including decentralised composting units, transfer station, sanitary landfill, plastic processing unit and an extensive IEBCC activity. (Indore Blog 2017) (Smart City Indore n.d.) (Swachh Survekshan 2019 n.d.)
As a first step, IMC started pilot projects from December 2015 to January 2016 in two wards 71 and 42, for effective door to door collection. From February 2016, the IMC went ahead with a yearlong phased approach in eliminating the large collection bins, streamlined door-to-door collection and upgraded necessary infrastructure and a large scale door-to-door awareness campaign. (Swachh Bharat Mission Indore Municipal Corporation (IMC) n.d.)
In the Swachh Survekshan -2016 – ranks of 73 cities, Indore was placed 25. (PIB 2016). Yet, the problems of landfill continued, prompting students staying around the Devguradia landfill to write to the Chief Minister to act on the problem of burning garbage (Hindustan Times, Indore 2016). (@indoreantipollution Facebook n.d.). By the year 2017, IMC started bioremediation of the landfill, controlled the smell and placed two firefighting vans to control emergency firebreak outs (Times of India, Indore 2017) (The Better India 2019)
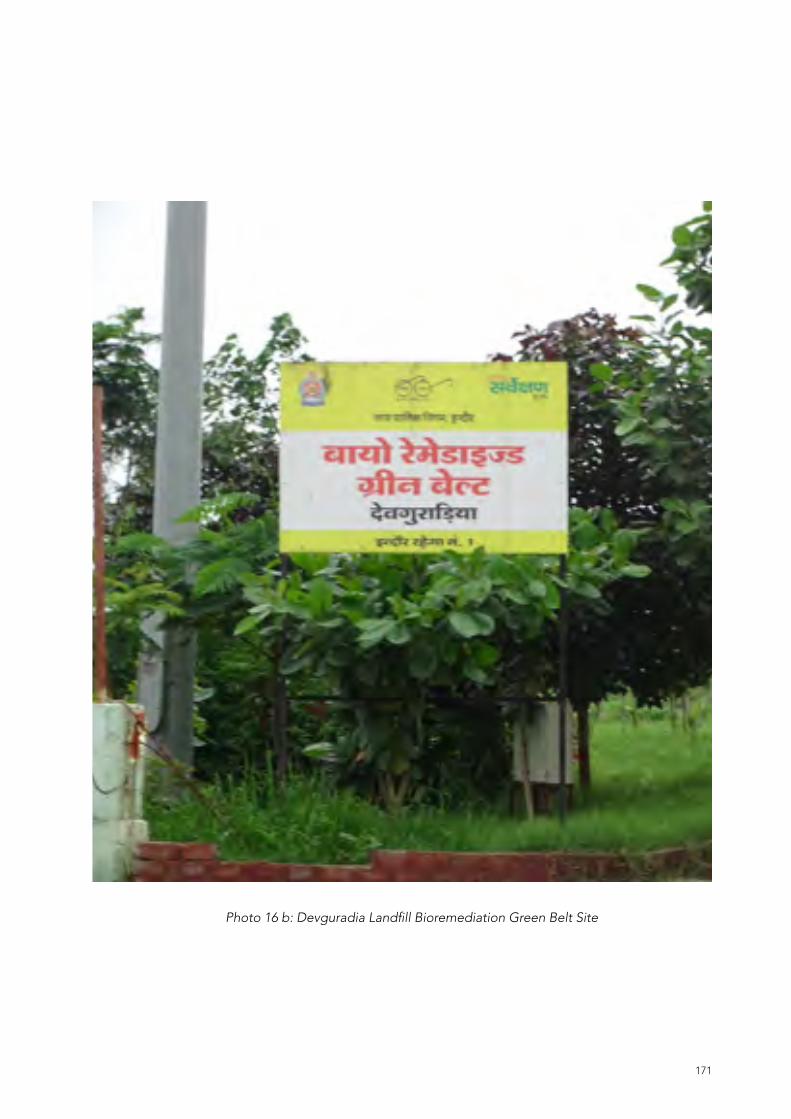
171
Photo 16 b: Devguradia Landfill Bioremediation Green Belt Site

172
Of Evictions and Removal of Stray Cattle
A disturbing trend in the name of cleanliness was the forced evictions and the removal of stray cattle, dogs and pigs, demolition of stray cattle shelter by the IMC from November 2016 in anticipation of the SBM evaluation. The settlements included Ganesh Nagar, Khajrana Ring Road, Ahir Khedi Road, Pragati Nagar, Sukhi Nivas and Banganga (YUVA ( Youth for Unity and Voluntary Action) 2016). (Swachh Bharat Mission Indore Municipal Corporation (IMC) n.d.) (Hindustan Times 2015) (Times of India Indore 2018)
Both these went against some of the existing legal safeguards: According to the Madhya Pradesh Nagariya Kshetro ke bhoomihin Vyakti (Pattadhruti Adhikaron Ka Pradan kiya Jana) Adhiniyam, 1984, ‘ Any person who wrongfully dispossesses or attempts to dispossess an occupier of a dwelling house will be liable for three months imprisonment’. (Madhya Pradesh Gazette 1984). According to Prevention of Cruelty to Animals Act, 1960 Section 11 ( 1) (i) and (j) of the, it is illegal to relocate stray animals; Section 11 ( 1) ( h), it is illegal to intentionally starve street dogs and take away their shelter. (The Prevention of Cruelty to Animals Act, 1960 n.d.) According to the Wildlife Protection Act, 1972, makes it illegal for anyone to capture, incite or bait street animals with the intent of causing harm. (The Wild Life (Protection) Act, 1972 n.d.).
Photo 16 c: One of the Hosuing Colonies, Post Eviction, at Vaibhav Nagar

173
Current Situation
Post 2016, the city has been claiming the number one slot, making it the only city to complete a hat trick of wining the Number 1 slot for the Cleanest City. In 2018, Indore was conferred the Four Leaves Award at Centre for Science and Environment (CSE)’s Convention on Urban Solid Waste Management in New Delhi. CSE assessed cities on different parameters that included segregation at source, collection, transportation, wet waste and dry waste processing, adoption of decentralised systems, the inclusion of informal sector in municipal systems and adoption and enforcement of SWM bye-laws and enforcement of Plastic Waste Management Rules, 2016, as part of its initiative ‘Forum of Cities that Segregate’. (Centre for Science 2018). Indore also won the award for the Cleanest City at Safaigiri Award 2018, by the India Today Group (India Today 2019). Indore is also the only Indian city to have ISO 9001:2015, ISO 14001: 2015 and OHSAS 18000:2007 certified centralised processing unit and is one of the three 5-star rated cities under the Star Rating of Garbage Free City certification programme of the MoHUA (Construction World 2019).
The Swachh Survekshan 2019’s Innovation and Best Practices Report on ULB led Initiatives highlights Indore’s integration of waste management to public transport. IMC developed a bio-methanation processing plant to generate bio-CNG and Compost on VGF Model in partnership with Mahindra Waste to Energy Solutions Ltd on a PPP model and signed an agreement with Indore Public Transport System Company (AICTSL). The plant utilises waste from the markets (fruit and vegetable). There is also an indigenous biogas cleaning and separation unit to purify methane, which is then compressed and filled into cylinders. The document states that 1000kgs of Bio-CNG is dispensed to city buses daily. (Swachh Survekshan 2019 Innovations and Best Practices n.d.)
Integration of Informal Waste Workers
In an Indian Express article titled “Inside India’s cleanest city’, the article states that wastepickers and the local garbage collectors resisted the new waste management plan adopted by the IMC, as about 1200 wastepickers lost their job. It goes on to state the IMC eventually adopted about 1000 garbage collectors and wastepickers adding to them to municipality’s existing force of 8000 sanitation workers. (The Indian Express 2019). The report titled Unequal Realities: Forced Evictions in Five Indian Cities 2016 draws to attention the loss of livelihood due to forced evictions and relocation and the inability of the IMC to integrate the informal waste workers into the formal system. The report states that about 250 waste pickers were given identity cards. (YUVA ( Youth for Unity and Voluntary Action) 2016). This correlates to another blog titled Waste Narratives which stated ‘Indore Municipal Corporation issued occupational identity cards to 250 wastepickers associated with Jan Vikas Society’, (Waste Narratives 2016), which is in contrast to the SS 2017 Report.
“The SS 2017 Report has a legend which says Informal Waste Picker Engagement with three colour schemes: Green for Fully Achieved, Yellow for Partially Achieved and Red for Not Achieved. Indore was marked green as fully compliant and stated all wards engage informal waste pickers for solid waste management and undertake sweeping twice a day (SS Report 2017 n.d.)’.
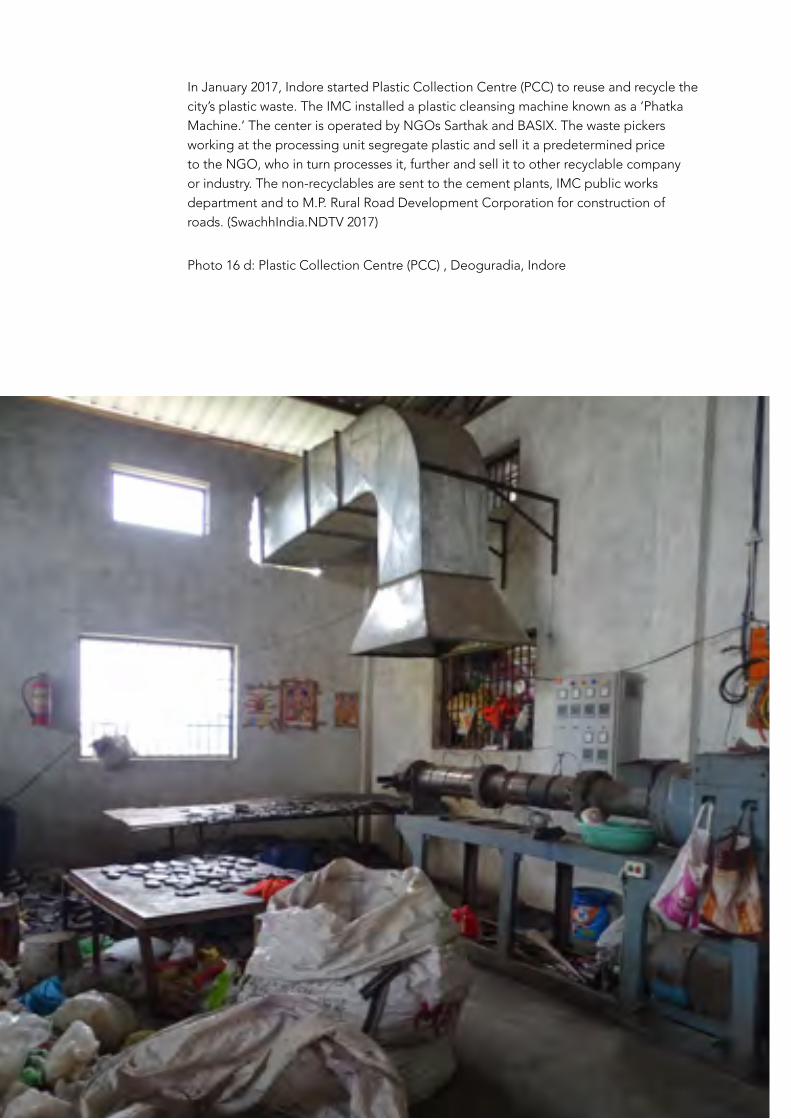
174
In January 2017, Indore started Plastic Collection Centre (PCC) to reuse and recycle the city’s plastic waste. The IMC installed a plastic cleansing machine known as a ‘Phatka Machine.’ The center is operated by NGOs Sarthak and BASIX. The waste pickers working at the processing unit segregate plastic and sell it a predetermined price to the NGO, who in turn processes it, further and sell it to other recyclable company or industry. The non-recyclables are sent to the cement plants, IMC public works department and to M.P. Rural Road Development Corporation for construction of roads. (SwachhIndia.NDTV 2017)
Photo 16 d: Plastic Collection Centre (PCC) , Deoguradia, Indore

175
Waste pickers submitted a letter to the IMC commissioner urging him to integrate wastepickers in Solid Waste Management of Indore city. The letter highlighted that “Waste-pickers are asked to wade through the mixed waste to recover recyclables, a lot of time waste-pickers end up in getting hurt by broken glass or sharp materials which are there in the mixed waste. They are forced to sell recovered materials to the Material Recovery Centre (MRC) operator, who does not provide the market price for scrap material, short-changing the waste-pickers labour and essentially engaging waste-pickers on piece rate without provisions of minimum wages, social security and welfare protection (including Provident Fund, Employee Social Insurance, Leaves and Bonus). Further worsening their existing financial and social position and requested for intervention”. (Global Alliance of Waste Pickers 2018)
Photo 16 e: Wastepickers at the Deoguradia, MRF

176
In December 2018, the Alliance of Indian Waste Pickers, submitted a memorandum urging the National Mission Director of Swachh Bharat Abhiyaan, urging the authorities to take note of the practices followed by the IMC, including that of catching wastepickers, confiscating dry waste, permission to some wastepickers to segregate waste within the centralised processing facility and dump yard, the need for occupational identity card with a validity for about 5- 10 years, need for upgrading livelihoods as per the SWM Rules 2016 among the others. (Waste Narratives 2018)
In 2018, the IMC released its Solid Waste Management Bye Laws 2018, which made a cursory reference to waste pickers and informal waste collectors. There is no definition of waste pickers or other informal waste collectors. The only acknowledgment of the informal recycling sector is under Section 12 Responsibilities of IMC, where it states in sub clause x – ‘IMC shall make efforts to streamline and formalize solid waste management systems and endeavor that the informal sector workers in waste management ( waste pickers) are given priority to upgrade their work conditions and are enumerated and integrated into the formal system of solid waste management.’ (Indore Municipal Corporation 2018)
Janvikas was awarded “Swachata Puraskar” by Indore Municipal Corporation on 2nd October 2016. The award was given by Smt. Malini Gaur, the Mayor of Indore Municipal Corporation to Janvikas Society on the occasion of Gandhi Jayanti for the outstanding contribution to thewelfare of the waste pickers in the city of Indore. Janvikas has been collaborating with Indore Municipal Corporation in creating awareness among people on clean city through door to door counselling, street plays, rallies etc as part of Swach Bharat Mission. Janvikas is working 2 zones in the city which consists of 9 wards (approximately 45,000 households).
Observations and other InterviewsOn 22nd July 2018, the authors visited Indore.
1. MRF Facility for Dry Waste
• The facility is run by BASIX and takes in dry segregated waste at source.
• The observation on Quality and quantity of waste revealed waste was mixed with inerts, not totally dry, also mixed with residual waste. Cardboard paper quality is compromised because of mixing. There was not much high value seen, PET was not visible too.
• The facility had a buy Back Model in practice. The vehicle tips the dry waste in to the open yard of the MRF. Waste Pickers are allowed access to the yard for retrieval, post segregation, the same is sold to the MRF and the remaining waste is sent to the Landfill
Rs. 38,643 is the buyback value of a single day from 105 waste pickers The Average price is Rs. 10. Therefore, Rs. 386 earned per day by a Waste Picker. So if we take an approximate of 50 kgs ((38643/10)/105)=38.6 kgs * 105 = ~5 TPD of dry waste. This is from one centre. There are 2 centres, so total dry waste retrieval is around 10tpd
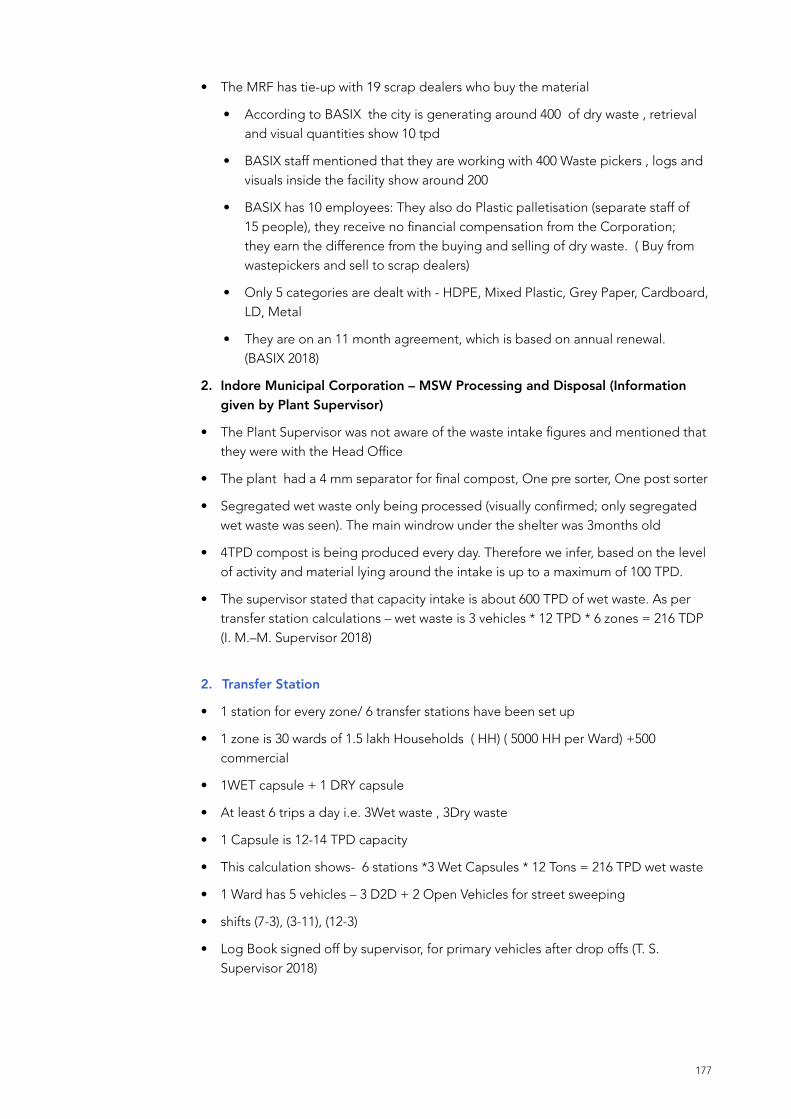
177
• The MRF has tie-up with 19 scrap dealers who buy the material
• According to BASIX the city is generating around 400 of dry waste , retrieval and visual quantities show 10 tpd
• BASIX staff mentioned that they are working with 400 Waste pickers , logs and visuals inside the facility show around 200
• BASIX has 10 employees: They also do Plastic palletisation (separate staff of 15 people), they receive no financial compensation from the Corporation; they earn the difference from the buying and selling of dry waste. ( Buy from wastepickers and sell to scrap dealers)
• Only 5 categories are dealt with - HDPE, Mixed Plastic, Grey Paper, Cardboard, LD, Metal
• They are on an 11 month agreement, which is based on annual renewal. (BASIX 2018)
2. Indore Municipal Corporation – MSW Processing and Disposal (Information given by Plant Supervisor)
• The Plant Supervisor was not aware of the waste intake figures and mentioned that they were with the Head Office
• The plant had a 4 mm separator for final compost, One pre sorter, One post sorter
• Segregated wet waste only being processed (visually confirmed; only segregated wet waste was seen). The main windrow under the shelter was 3months old
• 4TPD compost is being produced every day. Therefore we infer, based on the level of activity and material lying around the intake is up to a maximum of 100 TPD.
• The supervisor stated that capacity intake is about 600 TPD of wet waste. As per transfer station calculations – wet waste is 3 vehicles * 12 TPD * 6 zones = 216 TDP (I. M.–M. Supervisor 2018)
2. Transfer Station
• 1 station for every zone/ 6 transfer stations have been set up
• 1 zone is 30 wards of 1.5 lakh Households ( HH) ( 5000 HH per Ward) +500 commercial
• 1WET capsule + 1 DRY capsule
• At least 6 trips a day i.e. 3Wet waste , 3Dry waste
• 1 Capsule is 12-14 TPD capacity
• This calculation shows- 6 stations *3 Wet Capsules * 12 Tons = 216 TPD wet waste
• 1 Ward has 5 vehicles – 3 D2D + 2 Open Vehicles for street sweeping
• shifts (7-3), (3-11), (12-3)
• Log Book signed off by supervisor, for primary vehicles after drop offs (T. S. Supervisor 2018)
178
• The Smart City Indore website mentions the collected waste is transported by the Tri-partioned garbage tippers deployed in all 85 wards to the designated Garbage transfer station (GTS). To strengthen and reduce the cost of the Secondary Collection and Transportation System, IMC has constructed eight ultra-modern transfer stations of three types of models such as Ramp based static GTS, portable Compactors based GTS and semi portable Compactors based GTS installed by Hyva and TPS at different locations. (Smart City Indore n.d.)
Photo 16 f: Transfer Station at I T Park, Davv Takshila Parisar, Indore

179
180
1. Other Numbers
• As per the SS 2019 Innovations and Best Practices Report Market waste generated is about 20 TPD (Swachh Survekshan 2019 Innovations and Best Practices n.d.)
• According to the MPSPCB Annual Report for the year 2OL8-2OL9 under Solid Waste Management Rules, 2016., submitted to the CPCB, the Indore Cluster for Waste to Energy at Devguradiya is for total MSW of 1010 TPD, servicing towns Betma, Depalpur, Hatod, Indore, Manpur, Mhowgaon, Rau, RunjiGautampura at an estimated project cost of Rs. 470 Crores, at a concession period of 21 years including implementation under Public Private Partnership and an inter ULB agreement authorizing the biggest ULB to act as lead member of the cluster. (Madhya Pradesh State Pollution Control Board 2019)
• The Smart City Indore website mentions, ‘The total waste generation in Indore is 1115 MTPD. Out of the total waste 58.25% is the wet or organic waste, 41.75% is dry waste and 0.5% is household hazardous and sanitary waste. The total wet waste generation is 650 MTPD (Approximately) and dry waste generation is 465 MTPD (approximately)’. (Smart City Indore n.d.)

181
Indore: A Photo Essay


184
Shillong: A Case Study

185
State Meghalaya
Area 10.36 sq km
Population as per 2011 census City population is 143,229; its urban / metropolitan population is 354,759
Number of wards 27
Number of Households 31025HH
Waste Generation/Day 64 MT per day
Segregation Level NA
Administrative Body Shillong Municipal Board
Box 5.4.1 : Fast Facts of Shillong
Source: Shillong Municipal Board http://smb.gov.in/history.html
5.5 ShillongShillong, the capital of Meghalaya, is also known as the ‘Scotland of the East”, is a three hour drive from Guwahati. In the recent years, Shillong has become a popular destination for holiday –makers.
Background
Shillong was developed as an administrative and commercial center and served as the capital of the Assam province during the British Rule, until the formation of the state of Meghalaya in 1972. Shillong is an Urban Agglomeration consisting of Shillong Municipality, Shillong Cantonment and 10 other census towns (Clean Shillong Committee, Meghalaya. n.d.). The Shillong Municipal Board was formed, in 1910, comprising of 10 wards. From 1938 onwards Marten in Mawlai Mawion, became the official dumping site. Early attempts at managing solid waste started from 1974, with the Shillong Municipal Board (SMB) being responsible for management of solid wastes within the municipal boundaries of Shillong (10.26 sq. km) comprising of 27 wards. However segregation was not given a priority. (Shillong Municipal Board n.d.)
In 1991, the National Environmental and Engineering Research Institute (NEERI), Nagpur prepared a master plan for Shillong towards management of solid wastes. The report recommended biogas generation as a treatment option towards efficient SWM along with better collection, transportation and disposal methods. The implementation of the project did not take off. Early attempts of raising awareness on the importance of waste management included activities targeted at the educational institutions and clean up drives. In 1998, all educational intuitions were informed to collect waste paper and plastic for recycling as part of World Environment Day. The Meghalaya Environment Active Legislators (MEAL), Shillong also launched an awareness campaign on the need to keep water bodies clean and organised a massive cleanup drive of rivers and streams on June 27th, 1998. (Jyrwa 2008)

186
The CPCB’s Annual Report 2001-2002 prepared in compliance to the provision 8(2) of the Rules of the Municipal Solid Waste (Management & Handling) Rules, 2000, stated that Shillong Municipal Board has set up a compost plant for processing 100 TPD and improving the existing disposal site at Mawiong (Central Pollution Control Board 2004), as part of the Solid Waste Management Project for Shillong 2002, launched by the Government. The compost plant has the unique distinction of being the first in the North East region. The plant, though suffered from poor quality inputs, technical and marketing problems. ( SMEC India 2009)
Citizens began championing waste management and Clean Shillong. This saw the formation of an SHG by the Lasara Society in 2004. Seed funding from AusAID (the Australian Government’s development policy Australian aid) made it possible for the group to conduct baseline survey, purchase of vehicle engage in door to door collection. The program ran for 10 years in Mawlai and expanded to other localities (The Shillong Times 2014). In 2008, the government launched the Clean Shillong Campaign 2008, with the aim to check indiscriminate littering and dumping of waste on the roads, streets, and drains in the city and to enforce the sections of Meghalaya Municipal Act 1973. This campaign was discontinued from 2009 due to lack of funds. (Clean Shillong Committee, Meghalaya. n.d.)
On 26th February 2009, the Cabinet Committee on Economic Affairs (CCEA) approved the North-Eastern Region Capital Cities Development Investment Program (NERCCDIP), Project Phase 1 to be implemented by the Ministry of Urban Development over a six year period beginning in 2010 and funded by a loan via the Multitranche Financing Facility (MFF) of the Asian Development Bank (ADB). The project envisaged achieving sustainable urban development in the Project Cities of Agartala, Aizawl, Kohima, Gangtok and Shillong through investments in urban infrastructure sectors: (i) water supply; (ii) sewerage and sanitation; and (iii) solid waste management.
The draft Final DPR Solid Waste 2009 read “Municipal Solid Waste Management in Shillong may be classified into two categories i.e Organised areas: -areas falling under the jurisdiction of Shillong Municipality or Cantonment Board; Unorganised areas: - areas outside the Shillong Municipality or Cantonment Board;There are no actual records with respect to the solid waste generation in Shillong city. Available information reveals that the Shillong Municipal Board is lifting about 75-80 MT/ day and the Cantonment Board is lifting about 15 to18 MT/day. The solid waste generated in other towns of the Shillong agglomeration, viz Madanrting, Mawlai, Nongthymmai and Pynthor Umkhrah remains unaccounted for…” ( SMEC India 2009)In 2012, as part of the NERCCDIP, the SIPMIU submitted a draft Environmental Impact Assessment (EIA) Report for obtaining environmental clearance for development of a new sanitary landfill at Umsawli Village under the Greater Shillong Planning Area. (State Investment Project Management andImplementation Unit (SIPMIU), Shillong 2012). In the same year, Youth for Green Campaign was launched as an initiative to maintain cleanliness in public spaces and surroundings in collaboration with schools, colleges, NGOs interested in chalking out cleanliness programmes (Swachh India. NDTV 2017).

187
Photo 17 b: Sign Board at Shillong

188
In 2016, Government of Meghalaya issued an office memorandum ‘Guidelines for Solid Waste Management and cleanliness in Shillong City’, with special emphasis on segregation at source – into 6 categories, collection, transportation, processing and final disposal of solid waste. The guidelines specified colour codes for bins- Blue for non-biodegradable and Green for Biodegradable waste. The guidelines also stated that local authority will have to provide adequate infrastructure facilities such as waste collection services, litter bins, conveniently located community storage centres, dry waste collection centres, and composting centres. (Urban Affairs Department, Government of Meghalaya 2016)
In 2017, Phase 1 of the Sanitary Landfill for disposal of processed rejects and inert waste was inaugurated at Marten, Mawlai, as part of the NERCCDIP. (Department of Information and Public Relations, Government of Meghalaya 2017) (SP News Agency 2017)
Current Situation
The NERCCDIP has received an extension till the year 2019. The Meghalaya Government’s Status Report on directions issued by the NGT New Delhi, based on the order dated 16.01.2019 in O.A. NO. 606/2018, in the matter of compliance of the SWM Rules 2016 and order dated 19.02.2019 in O.A. No. 593/2017 states the following: The SMB collects an average 44.86 MT solid wastes on daily basis, with the introduction of door-to-door collection in all the wards. They have no provision for secondary storage. The SMB uses 3 (three) non tipping trucks, 18 (eighteen) truck-tippers, 1 (one) dumper-placer, 1 (one) refuse collector, 2 (two) JCB/loaders and 15 (fifteen) other vehicles for transportation of the collected solid waste to the disposal site. The report states that the board has a facility for processing biodegradable solid waste and that composting and recycling is managed by the SHG of wastepickers at Mawiong, with a capacity of about 8.72 TPD. The report states that the Shillong Cantonment Board shares the disposal facilities of the SMB. (Meghalaya State Pollution Control Board 2019)
Despite all the efforts in creating a sustainable waste management system, Shillong shows a downward trend in the SS Rankings from 18 in 2014, 53 in 2016, 276 in 2017, and 407 in 2018. (The Shillong Times 2017) (Press Information Bureau, Government of India 2017) (SS Report 2018 n.d.)
Photo 17 c: Marten Mawlai

189
190
Integration of Informal Waste Workers
A significant component of the NERCCDIP is the Gender Action Plan (GAP). As part of GAP a number of activities were undertaken, including public consultations and gender sensitization workshop to build awareness on the need for women’s active participation in SWM. Another key objective was enhancing livelihood opportunities in SWM, through formation of SHGs, better facilities at the solid waste management units and sites, income generation through use of recyclable materials etc. (North Eastern Region Urban Development Programme ( NERUDP) n.d.)
In 2013, a consultative meeting and census taking activity was undertaken with wastepickers at the Marten dump yard. 26 wastepickers participated in the meeting. Discussions included briefing on the NERCCDIP, the plans for development of the dump yard and potential employment opportunities. (State Investment Program Management and Implementation Unit (SIPMIU), 2015). In November 2014, the NERCCDIP SIPMIU, Urban Affairs Department and SBM, developed a plan to rehabilitate wastepickers working at the Marten dump site. They facilitated the formation of Iainehskhem Self-Help Group (SHG) with the objective of enhancing livelihoods. (Waste Narratives 2018).
In 2016, following a series of training programs -Self Help Group Management Training which included the workings of the SHG, finances, governances, group management, bookkeeping etc , the management on the mini compost plant, training on Trench Composting, Bokashi Composting and Vertical composting, (State Investment Programme Management & Implementation Unit (SIPMIU), NERCCDIP,Urban Affairs Department, Shillong, Meghalaya 2017), the SHG started working from 2017. (The Shillong Times 2019). Their project Garbage-to-gold, have produced over 10,000 kgs of compost manure and have certified by the Department of Agriculture Laboratory and the ICAR Laboratory. The 19 women part of the Iainehskhem SHG led by Bibisha Kharnaior, are also known as the Merry Maidens of Marten”, for their cohesive style of working, happiness and cooperation. The women conduct compost training sessions across Shillong and continue to work at the landfill picking out recyclables. The SHG has become a replicable model for inclusive and decentralized waste management other villages around Shillong. (Waste Narratives 2018)
The Meghalaya Government’s Status Report on directions issued by the NGT New Delhi, based on the order dated 16.01.2019 in O.A. NO. 606/2018, in the matter of compliance of the SWM Rules 2016 and order dated 19.02.2019 in O.A. No. 593/2017 states the following: In Shillong so far 54 (fifty four) waste pickers have been organised. ID’s and Personal Protective Equipment (PPE) have been issued to them. 19 (nineteen) waste pickers have formed a SHG and the group is now operating a mini composting unit of the Shillong Municipal Board at Marten. (Meghalaya State Pollution Control Board 2019). An important component of the wastepickers engagement in the city’s solid waste management is through the integration with the National Urban Livelihood Mission.

191
Photo 17 d:The Compost Unit Managed The SHG

192
Observations
• Through the NERCCDIP the city has all the plans in place to adopt decentralised and inclusive waste management systems. However the non-enforcement of segregation of waste at source is a serious problem. This coupled with the need for investment in decentralised facilities like community storage centres, dry waste collection centres, and composting centres are a priority.
• 54 wastepickers who work around the landfill site have been given wastepickers cards, the SBM will have to conduct another survey for free-roaming wastepickers. It is commendable to see the integration of the NULM program with SWM activities

Shillong: A Photo Essay


197
Discussions and ComparisionsIn this study, various approaches have been used to assess the status of wastepickers. The study presents a very detailed information across participating cities6 reflecting not just individual attributes of the waste pickers but also takes into account the external influences (historical, social, cultural) of the city that they live in, tempered with other influences that the environment exerts on the waste pickers and their practices. The approaches include surveys, focus group discussions, one-to-one interviews, key informant interview, observations, literature review, field tour which have lead up to this report. This section summarises the findings, compares and contrasts individual approach finding wherever possible with other literature, to present insights that informs our final recommendations.7 This chapter is presented in four broad themes: Socio-demographics, Waste practices, Social Security, Knowledge and Perception of SBA for each wastepickers type, representing their individual differences and by city. The chapter concludes with a discussion on key points.
6.1 Overview of the FindingsTo put in perspective the present status of wastepickers, comparisons of findings has been carried out wherever possible. The comparison has been carried out equivalent parameters in previously conducted surveys. The limitation, however is that most of the previous surveys are restricted to a city as against this survey which covers 20 cities ,so wherever possible surveys from at least 3 to 4 cities have been placed for comparison.
6.1 a. Socio-demographics – Age, Gender, Class, Religion In this section, we have looked at the following parameters- age, gender, religion, social distribution, place of stay and monthly income, as it is important to identify the characteristics of the wastepickers population presented in this segment. This helps to present information, which is a representative sample of the population of wastepickers in various cities and also provide insights and attributes of these characteristics.
6

198
Age
Among all the study participants, the age ranges from 13 years to 83 years. Majority of the wastepickers are in the age group of 21 to 40 years, which is about 62% and 40 to 60 years, which is about 28%. A comparison of the findings of the survey across other studies conducted at different periods of time, overall seems to reflect a consistency in the age group of between 20 to 40 and 40 to 60 years, at 64% and 26% (Chandran, Shekar, et al. 2014), 77% and 21% (CHF International India and Mythri Sarva Sava Samithi 2010), 53% and 42% ( Chikarmane, Dr. Deshpande and Narayan 2001) respectively. In the age groups of 60 and above, there are 3.5% waste pickers involved in waste picking, were we noted there has been an increase in percentage of wastepickers from 1.5% in 2010 (3.5%). While this does not reflect on the actual numbers that are engaged in the work of waste picking, it certainly reflects on the possibility of the unavailability of other occupational choices, literacy or reduced access to waste. It may be noted that Mumbai and Shillong at higher number of wastepickers in the age group of 41-60 years for 57% and 67% respectively.
Gender
It is found that there were more women about 68.5% in the waste picking profession, in comparison to men at 31.5%, comparable to the (2001) study. Gender wise distribution of the type of waste picker reveals that female waste pickers are more in number among free roaming/independent/local and waste sorters at 75.5 % and 68% respectively.
The Economic Survey of India 2017, estimated that the magnitude of inter-state migration in India was close to 9 million annually between 2011 and 2016, while Census 2011 pegs the total number of internal migrants in the country (accounting for inter- and intra-state movement) at a staggering 139 million. ( Sharma 2017). The Working group on Migration Report set up by the Ministry of Housing and Poverty Alleviation, which showed 36% males and 56% females. (Ministry of Housing and Urban Poverty Alleviation, GoI 2017). Our survey has shown that 57 % males have migrated.
Given the traditional role, of a male dominated profession, where it is directly dependent on their ability to raise capital, it is interesting to note that male Itinerant buyers were about 67%. In the door to door collectors segment it was found that males and females are equal. This is other than Delhi at 60% males which historically has shown a higher prevalence of males 76% (Sarkar 2003)
Religion
Among the respondents about 63.2% were Hindus, 13.6%, Muslims, 12% Buddhist and about 8.5% were Christians. The findings in Delhi showed that 71% were Muslims in line with previous study 52% (Sarkar 2003) and 80% (Eswaran and C.K 2013). In Shillong, it was observed all respondents were Christians.
Social Distribution
The prevalence of Scheduled Caste at 54.3% and Scheduled Tribe at 28% dominates waste picking is in line with previous studies which show a high prevalence at 46% (CHF International India and Mythri Sarva Sava Samithi 2010). However in one study in 2017 however observed that the ST was at 47.6% and SC was at 8.75% different from

199
the national trend. (Dr. Ashifa and Devi 2017). It is observed that 29% of free roaming migrants were from general category, which possibly enters into waste picking due to low entry barriers. It is also seen that 51% of waste sorters belong to scheduled tribe.
Place of Stay and Location Dwelling
Location of residence is unique to the city dependent on factors like the city policy on housing and social/ traditional arrangements that have continued. Previous studies like in Andhra (Dr. Ashifa and Devi 2017) show 68% live in makeshift tents and only about 31% live in houses and Pune (2001) show 38% who live in slums which have been the traditional location for previous generations also. In our study Pune shows an increase in percentage of people living in slum colony (68%), Guntur (93%), Tenali ( 100%). In Indore, after displacement, replacing the traditional dwelling colony of three generations, the residents were evicted, and moved to a government provided shelter/housing. 76% of the FGD participants in Indore were relocated to Bangarda Bada. (Shantha 2017) (Youth for Unity and Voluntary Action 2017),
It was found that interestingly income had very little role to play in place of stay. Out of 1869 respondents, 1278 irrespective of income slabs were seen to be living in slum colony. So it appears that the nature of the waste profession which involves sorting, storing at home is a determinant of the choice of place of stay. In Bengaluru, even though the place of stay was shown as private land, these are identified informal waste colonies, which is similar to the (CHF International India and Mythri Sarva Sava Samithi 2010) study, with the exception of Shillong where it was 100% private land occupancy.
Monthly Income
The biggest indicator of status of the waste pickers comes from the findings of the monthly income. The monthly income has been looked at in slabs of Rs. 5000 for the purpose of data collection. Here it is seen that 37% of the respondents were found to be in the bottom bracket of Rs. 1000 to Rs. 5000 per month followed by 38% in the Rs. 5000 to Rs.10,0000 slabs. Nearly 12% were found to be earning a monthly income of between Rs. 10,000 to Rs. 15,000 per month and about 2% were seen to be earning above Rs. 25,000 per month. The weighted average monthly income was calculated to be Rs.11, 407 taking all slabs . However, keeping in mind that about 10% showed a spread of incomes in the higher levels between Rs. 15,000 to Rs. 30,000 per month, the weighted average income for the 90% incomes reported was seen to be a weighted average of Rs. 10,393 per month.
These slab wise figures in absolute terms have been compared with findings over previous year’s findings (2001) while keeping in mind that the value of money has changed over the two decade period. Previous findings in (2017) showed 31% earned between Rs. 3000 to Rs. 5000 per month, 39% earned between Rs. 5000-Rs.7000, 21% earned between Rs. 7000 to Rs. 10,000 and 8% earned above Rs. 10,000. In the year (2014) findings showed 70% earned between Rs. 3000 to Rs. 6000 per month, 17% earned less than Rs. 3000 per month.
The weighted average income per month was also compared with the available data from previous findings. The study in (2001) stated that the average waste picker earns Rs. 3,375 per month. Calculations made by the authors, from the data of previous findings showed that the average income in (2014) was Rs. 4,354 per month, Rs. 6,325
200
per month in (2017) (Minimum Wage in Central Sphere w.e.f April 1, 2017 n.d.) (Ministry of Labour & Employment, GoI 2018).
The average incomes compared with the national minimum wage guidance figures for employment of sweeping and cleaning activities shows that in the (2014) study the minimum wage was between Rs. 3,600 to Rs. 6,210 per month, in the (2017) study was between Rs. 10,500 to Rs. 15,690 and in the year 2019 is between Rs. 11,190 to Rs. 16,740. A comparison of the monthly incomes earned as compared to the minimum wages shows the gap that remains between the two. A waste picker monthly earning was about 70% of the minimum wages in the year 2013, about 48% of the minimum wages in the year 2017 and about 81% of the minimum wages in the year 2019.
Some distinct city wise findings that are seen is that 3.6% who earn less than Rs. 1000 per month are from Mumbai and Nashik , Delhi accounts for the highest percentage of 9.2% in the slab of Rs. 5000 to Rs. 10,000 earnings per month. All the cities like Bengaluru (1.4%), Pune (0.9%) , Guntur (0.5%), Mumbai (0.2%) and Delhi (0.3%) have wastepickers who earn more than Rs. 15,000 and above either have contractual agreements with the Municipality or are door to door collectors. Further observations are that it is seen that the even the average earnings of the door to door collectors seen to be between Rs. 10,000 to Rs. 15,000 is lower than the average minimum wages of Rs. 13,970. It is to be pointed out that Indore shows about 38% of the waste pickers earn between Rs. 10,000 to Rs.15,000 per month. However side by side it was seen in the focus group discussions that 43% of the participants who were present reported that they were unemployed.
Bank Accounts/ID cards
The financial accessibility has improved over the years with close 98% having one or the other identity card, aadhar, voter id and ration card. Even Pan cards are used, though mostly in Maharashtra followed by Karnataka, possibly because both regions which have shown a high formal integration and organisation of waste pickers. Compare this with 67% of local wastepickers who were found to have ration cards and 65% voter ID in a study in (2010), less than 50% had ration cards in another study done in (Dr. Ashifa and Devi 2017). About 58% of the waste pickers have a bank account compares well with a study in (CHF International India and Mythri Sarva Sava Samithi 2010) which shows less than 25% of the waste pickers have bank accounts. In the city wise findings of wastepickers with bank accounts it can be seen where there is a high level of linkages with the Municipality or with waste picker organisations there is more financial access available. Case in points are Pune where 94% of the waste pickers have bank accounts, Indore and Mumbai with 87% and 85% having accounts followed by Bengaluru and Delhi at 50% . In Pune, Mumbai and Bengaluru this can be seen as the outcome of the waste picker registrations with waste picker organisations, as well as prevalence of contractual agreements with the municipality. Wastepickers in Indore are working as sanitation staff of the municipality for street sweeping. In Delhi wastepickers are working as informal door to door collectors.

201
6.1 b. Waste Practices Waste collection policy and practices are at the core, of a good SWM system that any city follows. Most cities are struggling to achieve door to door collection, much less segregation at source and the setting up of a dry waste management system. While there are a handful of cities which have progressed in streamlining processes, almost no city appears to have taken up a holistic approach which ensures that the environmental objective is met with social equity. Any good practices that are in place for inclusion of wastepickers are because of the presence and the persistence of the waste picker organisations that are working in those cities.
Bye Laws and Segregation at Source: Of the 10 cities that were visited by the authors (Indore, Patna, Mysuru, Gurugram, Bengaluru, Shillong, Guntur, Mumbai, Pune, Delhi) and in the focus group discussion ( Panchkula) and additionally from the survey findings of the 20 cities that were represented, less than a third of the cities have issued bye laws and notification for mandatory segregation at source. Mixed waste collection was the norm in most cities.
Door to door collection: Arrangements are in place in 9 out of 10 cities, the actual door to door collection is carried out by informal sector in 2 out of the 8 cities.
Landfill: Wastepickers are prevalent in the landfills in 9 (except Bengaluru) out of the 10 cities.
Dry waste system: Collection of dry waste from source takes place in 4 ( Mumbai, Pune, Indore, Bengaluru) out of the 10 cities, and by the wastepickers in 3 (Mumbai, Pune and Bengaluru) out of the 4 cities listed above. Municipality set up MRF , DWCC, sorting sheds are present in 7 out of the 10 cities and waste pickers are operating the same in 4 ( Bengaluru , Mumbai, Pune, Mysuru* ( partially ) out of the 7.
Municipal access and support: Shillong and Bengaluru show the highest utilization of municipal provided area at 42% and 41% respectively, followed by Pune at 33% and Indore at 8%. In Bengaluru this is further supported by auto collection (22%) In the other cities like Delhi and Mumbai access is provided for retrieving only with 63% and 54% stating storage is carried out at home.
Inclusion of waste pickers: Overall the cities that showed very low inclusion of wastepickers in the formal system , with the exception of Pune which has the oldest prevalent system of door to door collection system carried out by waste pickers who have entered into a contractual arrangement with the Municipality. This is also evident from the findings that in Pune 79% collect in a push cart and 23% by auto. Predominantly all collection is on foot carrying a bag with the exception of door to door collection where 36% collect by e-cycle and 30% collect by push cart. A look at the other areas collected from show wastepickers in Bengaluru, Delhi and Pune, work the full day and collect from households, shops, apartments. In Shillong, Thane and Kalyan wastepickers carry out collection from the landfill for the full day. However wastepickers in Pune and Indore faced restrictions from the Municipality and in Bengaluru and Pune wastepickers faced restrictions from the households restricting their access to waste.

202
It was found that the status of wastepickers inclusion in cities is a factor of the presence and extent of the engagement that is carried out by the waste picker organisations. In all the cities in which the wastepickers have fared better, have been seen to be the outcome of the organisations role in influencing the policies especially around waste practices. Most often it has been seen that the associations with the Municipality take place through a facilitating organisation ( many of them being AIW partner organisations) , which is either a waste picker member based organisation , trade unions, waste picker network organisations or non-government organisations . They play an important role in the mobilisation and organising wastepickers and very often also in their registration and integration with the Municipality. The municipal bye laws in these cities also reflect the waste practices and the role provided to the wastepickers. (Pune Municipal Corporation 2017). While most cities have been seen to be maintaining the status quo and have not progressed on improving their waste practices, some cities have shown very progressive role setting for the waste pickers. However there are municipalities which have completely disregarded the organisations and have in fact excluded waste pickers. (Surat Municipal Corporation 2016).
It is seen that 50% of the wastepickers are registered with organisations, 27% are registered with the Municipality and 35% or 17% of the total are registered with both the organization and the Municipality. A city wise finding of how wastepickers are associated in some form with either organization or municipality shows Pune and Nashik top the list with 100% of the wastepickers from these cities said they were registered either with the organization or with the municipality, followed by 94% from Mumbai. Overall 50% of the wastepickers were found to be registered with a waste picker organisation. It was also found that more wastepickers have been mobilized
Box 6.1b: Where do wastepickers pick in Indore and Mysore?
Where do wastepickers pick in the cleanest cities in India
The findings from the survey in the cities of Indore and Mysore show the Municipalities have streamlined processes to achieve the clean tag , but have not been inclusive in the process.
In Indore: 32% collect from areas other than where they stay, 22% collect anywhere, 11% collect from the areas they stay in, 14% collect from the garbage heaps,4% collect from households, 5% collect from factories, 2.4% collect from shops, malls and landfills. This collection is carried out by 82% for the full day and only 5% in the early morning. This can be attributed to the long distance of the city from the waste picker present place of stay after their recent relocation by the municipality.
In Mysore: 20.2% collect from areas other than where they stay, 16% collect from anywhere, 15% collect from the same area, 11% collect from households, 6% collect from garbage heaps, 5.7% collect from shops/ malls and slum colony and 3.4% collect from landfill. This collection is carried out for the full day by 47% and in the early morning by 42%.
203
in the last two years. This could be attributed to the positive impact that these organisations have created in the states they work in therefore moving from the metros to the smaller cities.
There are 15 organisations who have registered the most activity. However the following have registered the highest level of activity Parisar Bhagini Vikas Sangha, Maharashtra at 19%, Hasiru Dala, Karnataka at 17% and SEVA, Gujarat at 11%. It is also seen that 17% of wastepickers are registered for 1 year mostly in Mumbai and Delhi at 20% and 14% and in Mysore, Indore and Kalyan at 8% each. 20% wastepickers are registered for 2 years, 24% in Guntur, 15% in Indore and 13% each in Mysore and Tumkur. There is also an overall increase in registration with organisations in Delhi, Mumbai, Pune, Mysuru, Bengaluru and Thane. 23 cities have shown the presence of waste picker organisations, with waste picker registration being the highest in Pune at 24% followed by Mysuru at 12%, Amaranth, Guntur, Nanjangud and Bengaluru between 7 to 8%. As an outcome to the registration it is also seen that 16% overall have received uniforms, of which 54% have been provided by the organisations that they are associated with and 41% by the Municipality.
6.1 c. Social SecurityThe dismal findings of both the access to and benefits received be it basic health and education reflects the sorry condition of the social security status of the wastepickers. Only about 55% have received benefits of which 36% received it from the wastepickers organisations that they are associated with. Only about 15% received benefits from the government and this included medical facilities, free hospital, ration, educational facility for children and housing.
Various studies in the last couple of years have pointed out the vulnerable groups lack access to proper medical facilities and that the reach and quality of implementation of these programmes have been found to be feeble and insufficient. In the 2017 study evaluating factors affecting health seeking behaviours of women rag pickers in Mumbai observes that ‘Apart from the ignorance about health and disease found to be because of illiteracy, lower socioeconomic condition it has been found that there is a unavailability of good health care facility nearby to their locality and a difficulty in getting time to visit nearest health care facility because of the very long hours of work’. ( Wasnik, et al. 2017) (Mander and Manikandan 2009).
6.1 d. Knowledge of SBABetween the period 2016 and 2019, there have been significant number of rules, schemes and guidelines issued with respect to wastepickers integration. Chapter 2 undertakes a detailed assessment of all of them. The section on Knowledge and Perception of SBA of the survey was carried out to collect wastepickers impressions on how cities have utilised the scope of SBA and provided to ensure livelihood opportunities, access to social benefits, based on the various schemes and options suggested.About 707 wastepickers or 38% of the total respondents of the survey had heard about SBA and the perception study is limited to the responses from this number as the survey others had no knowledge of it and could not proceed further to the survey. In about 11 of the 20 cities the wastepickers had heard about SBA and associated it

204
with toilets, clean surroundings and waste segregation. In 4 of the 20 cities, of those who had heard said that government official had approached them to seek their participation for SBA. Of the type of wastepickers - itinerant buyers, door to door collectors, waste sorters, free roaming local and finally free roaming migrant in that order had some knowledge of SBA. For the section of perception only 575 wastepickers responses were received. Overall it is seen that less than half of the wastepickers who responded felt that there were benefits from SBA, sensed public perception of wastepickers had changed for the better, and mentioned a sense of protection because of recognition from SBA. They also felt that training would be beneficial to them. In terms of improvement of waste practices again, less than half agreed that SBA had positive impact on the various waste practices
6.2 Key FindingsFrom the young man in Patna, who took to waste picking to support his wife’s dream of pursuing her higher studies, to the housewife in Indore who ventures out for a few hours to collect waste so that she can earn enough to put food on the table, from the young mother of six who started working in a landfill, after making a loss running a tea shop on the highway in Shillong, to the hair picker in Mysore who walks long hours to source hair, from the painter who moved from Gorakphur to Panchkula dumpyard to the waste collector in Gurugram, who secures sorting space to support more than a dozen of sorters, in different locations, these reflect the diversity of the workers, the reasons for venturing to waste picking, and puts together a fascinating mosaic of reality of the informal waste workers, who work unobtrusively, in the shadows, supplementing the formal waste management systems. As cities, move towards streamlining the waste systems, wastepickers are now faced with a new order, that need adapting and scaling up to the news structures and systems, with minimum disruption and sensitivity. This can only be achieved through an appreciation of informal waste sector, an understanding of the existing status of the waste pickers and the social fabric that they operate under. As Sonia Dias, puts it “The process of integrating waste pickers requires governments and corporations to have an understanding of the complexities of waste picking and a willingness to think outside of the box in order to see waste management beyond conventional approaches” (Dias 2018).
In the previous section various attributes and characteristics were discussed and presented as overall findings over the broad themes of socio-demographic factors, understanding waste practices, status of social security and their knowledge of SBA. Cutting across cities, three functional categories appear to be common. Based on predominantly waste practices it defines the presence and entrants into these three categories.
• The free roaming independent wastepickers who is either a local or a migrant who works anywhere and anytime.
• The landfill/dump yard wastepickers who works mainly in the landfills.
• The door to door collector category which includes the door to door collectors, itinerant buyers and the waste sorters who assist them.

205
Free Roaming Waste Picker
It is the women who dominate among the free roaming waste pickers at 75% and the number of waste pickers up to 40 years of age is substantial at 63%. Through the FGDs we found that younger women often had to deal with the pressures of child birth, child rearing and running the home. In the case of the older women they were either caregivers or single. Only Delhi showed a higher prevalence of males.
53% have savings account of one or other type of bank. Less than a third of the waste pickers were found to be associated with SHG. But those associated with SHGs used the revolving credit or availed a loan from the SHG. Most of the others mostly received/took a loan from the scrap dealers. Most of the loan was used for house and health.
It was found that these women free roaming waste pickers go on foot and mostly 87% access waste in and around the areas that they live in. This allows them to work for a few hours at a stretch, either early in the morning before the waste is cleared by the Municipal workers or for about a half a day. The FGD revealed that this flexibility of work timings allows them to take care of their homes as well as supplement their incomes through other work such as domestic work, though this was found to be a very small percentage.
For most of the free roaming waste pickers, waste collection is the only source of income. Close to 10% were found to be working for about 12 hours a day, about 30% work for about 8 hours a day and the remaining work for about 5-6 hours a day. Half of them earn between Rs.1,000 to 5,000 per month and the other half between Rs. 5,000-10,000 and about 6% who earn between Rs.10,000-15,000 per month.
The free roaming waste picker is still not recognised in most cities and is not allowed to access waste from the households. Only about 17% collect from households. The FGD revealed that many face restrictions both from the Municipality and the residents. Some of them also reported restrictions from contractors and the police.
Most do not store their collection and sell on the same day, after sorting at home or in front of the shop. Most of them sell to the local scrap dealers. Less than a quarter are associated with the Municipality, but had ID cards. About 5% of them had received uniforms.
Access to health facility, insurance was mostly through the organisations that they were linked with .Benefits received were mostly medical facility, skill development and training, and scholarship for children. The government benefits which included free hospital, pension, ration, educational facility for children and housing was negligible. Most of the waste pickers were in this profession because of family tradition and this was the only job they knew. Only less than a quarter said it’s because they did not get any other job. Most of them desired to continue in this profession because it was low skilled and easy entry. Only a third of the free roaming waste pickers had heard about SBA.

206
Landfill Wastepickers
Landfill waste pickers are free roaming/independent waste pickers, who differ in their waste practices as they mostly, work in the landfill/dump yard. Therefore with regard to the socio demographics, social security and knowledge of SBA there is no special findings for this category.
The findings showed on an average about 10% collect waste from the landfills, though in some cities like Shillong there is a higher percentage of a landfill waste picker. As almost all the cities have operating landfills which are designated to be used by the waste collection vehicles for dumping, there mixed waste which lies unprocessed. The landfill/dump yard sites vary from city to city, with the exception of Bengaluru, who is now dumping waste in quarries. The landfill dumping areas are mostly without any enclosures and have open access in the smaller cities. In the larger cities access is a little more controlled. However in most cases the Municipalities, though not explicitly acknowledged by them, allow waste picker access to the landfills. The presence of these dump yards/landfills are testimony to the mixed waste practices that cities follow.
For the waste pickers the collection from land dumps is not easy. They are prone to accidents, due to presence of the earth excavating machines. The waste pickers are exposed to the fumes from the rotting dumps, intolerable smell and the exposure to unknown hazardous materials which are mixed in the large amounts of waste. The retrieval and recovery of the recyclable material has to be done by physically skimming through piles and piles of mountains of trash. Most landfill areas are away from the city limits so after collection the material has to be stored and then transported periodically in a larger vehicle. In the meantime temporary shelters have to be set up for the purpose. In some cities the waste pickers’ colonies have come up close to the landfill sites so that the collection and transportation of the material becomes easier. This in turn exposes waste pickers and their families to serious health hazards- contaminated ground water, poor ambient air quality, smell of the garbage, mosquitoes and other diseases, outbreak of fire and other accidents.
Door to Door Collector
This category broadly encompasses the informal waste collectors, sorters, itinerant buyers who are all self-employed. Within this categorization, we have included formal waste collectors and sorters, wastepickers who work in the compost facilities, and those employed as wage eraners or entered into a contract with the Municipality.
For the purpose of the survey a distinction between formal and informal collector was not entirely possible. Only by looking closely at the linkages with the Municipality was it possible to derive some specific findings for the formal collectors. The number of respondents belonging to this group was very small making it difficult to project the findings across all parameters as percentages whereas 75% of the door to door collectors, 58% of the waste sorter, 83% of itinerant buyers have a bank account. About 75% are up to the age of 40 years and 22% are between the ages of 40 to 60 years. It is seen that males and females are equal.

207
It is seen that wastepickers in this category earn higher incomes with 55% earning between Rs.5000 to Rs.10,000, 23% earning between Rs. 1000 to 5000 , 11% earning between Rs.10,000 to Rs.15,000 and about 4% earning above Rs. 20,000. Most are informal waste collectors with only 7.5% of the waste pickers collecting from the areas approved by the municipality door to door. However for the informal waste collectors, this is in the nature of income earned by a micro-entrepreneur and not as a wage earner. And therefore must be viewed as income used to pay off cost of operating the informal door-to-door collections and to the waste sorters, who work with them.
Based on the field visits and the one to one discussions that were conducted, the differences in the waste practices of each of the groups were very distinct. The groups of informal collectors are very well organised and arrange for their own collection, transportation, sorting and storage. They even pay for the secondary transportation of the biodegradable waste that is remaining after removing the recyclable material since the collection is only of mixed waste. They employ sorters additionally to enable the clearance of the day’s collection and for readiness of the collection of the following day. What is also unique is that the informal collector pays for access to the waste, mostly to the local representative of the contracting agency who has the formal contract with the Municipality. All of these operating expenditures have to be managed out of the revenues earned from the retrieved recyclables.
Dubbed as a formal system, where the groups of waste picker collectors found to be working by virtue of an agreement allowing them to rights to carry out door to door collect from within a allotted geographical area. Here the agency collects on a user fee basis areas approved by the municipality and the collection agency receive a meager compensation with an informal agreement that the shortfall is to be made up from retrieval and sale of the dry waste. The collectors therefore retrieve what they can by sorting in the roadside alongside the collection work before the waste is deposited at the secondary point for transportation to the dumping site.
Then there is the actual hiring of waste pickers who have been registered and trained, by the Municipality, to carry out either work at the composting centres, management of garden waste or deployed for sweeping. In most instances here it was found that though they were hired as wage earners their monthly wages were outstanding and were not paid by the Municipality. Only those collecting or sorting within the door to door collection system backed with contractual agreements like in Pune and Bangalore, with vehicles allotted, fixed timings of operations, municipal allotted sorting areas could be truly represented as working as Municipal door to door collectors. Only 4% were found to be using an auto for collection, 10% used a E cycle and about 8% used a push cart and 11% were using a Municipal provided area for sorting. Unfortunately this whole category across informal and formal waste collectors, sorters and itinerant buyers and those employed by the Municipalities in other activities represented less than 25% in the entire study, of which about 6% had undergone training.
208
6.3 Discussion on Registration and Integration Within the Scope of Existing Legislation and PoliciesSubsequent to the findings, this segment takes up for discussion the related legislations and policies alongside an assessment of how cities have utilized the various options and schemes provided within the scope of the legislations and policies.
Any reference to waste pickers in the SBA and the Rules is most often preceded by the two terms registration and integration. However no specific definition of these terms was found in any of the legislations. Given that the terms were open to interpretation, they were used interchangeably by municipalities. An attempt has therefore been made to bring more contexts and through this discussion create a better understanding of the scope of these terms as envisioned by the rules and the various laws.
Registration
a. Registration and its purpose as envisioned by the SWM Rules 2016
A good starting point for understanding the purpose of registration can be found in Section 11 which clearly states the need to acknowledge the primary role that the entire informal recycling chains plays in managing waste, and to look at integration into the city’s SWM, including door to door. In that context it lists, the needs to start a scheme for registering wastepickers and waste dealers.
In this context it apt to list the SBM Manual of MSWM- 2016, Chapter 2, Sec 2.2, where it lists “options for enabling conditions and supportive actions, for an inclusive approach”, one of which is the need for “ involvement of informal sector workers into formal system with legal recognition and reflection of the same in relevant policy decisions”. Provision of occupational ID cards, post registration is one of way of recognising the informal sector. The chapter also highlights the need to acknowledge them as partners, and allow them to access social security, health benefits, finance, and tax exemptions.
Registration has also become synonymous with issue of ID cards which is the process by which the waste picker identity is created in the municipal system and an occupational identity card is provided
b. The process of registration
The SWM Rules 11, states that any State policy will have to be provided in consultation with all stakeholders including representatives of wastepickers. The SBM Manual of MSWM- 2016 in Section 1.4 suggests the matrix for collection of baseline information which includes the list of all known recyclers in the ULB, the wastepickers and persons involved in the kabaddi system within the ULB jurisdiction. The Swachh Survekshan
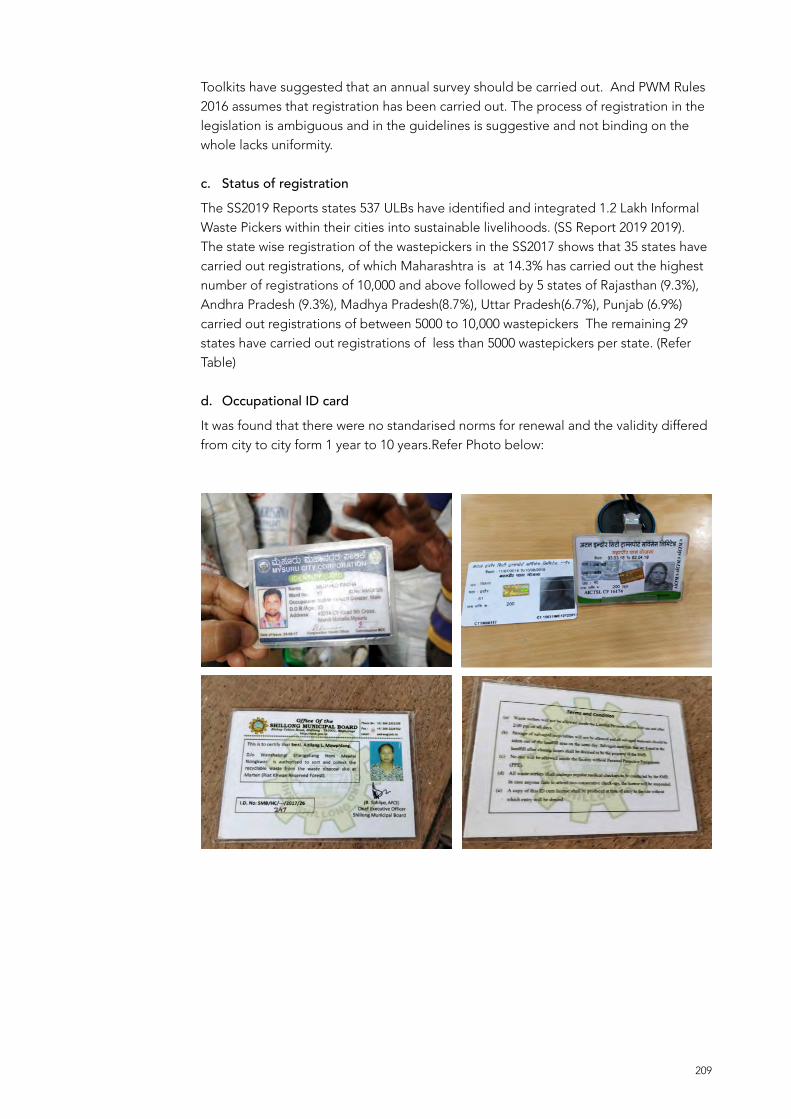
209
Toolkits have suggested that an annual survey should be carried out. And PWM Rules 2016 assumes that registration has been carried out. The process of registration in the legislation is ambiguous and in the guidelines is suggestive and not binding on the whole lacks uniformity.
c. Status of registration
The SS2019 Reports states 537 ULBs have identified and integrated 1.2 Lakh Informal Waste Pickers within their cities into sustainable livelihoods. (SS Report 2019 2019). The state wise registration of the wastepickers in the SS2017 shows that 35 states have carried out registrations, of which Maharashtra is at 14.3% has carried out the highest number of registrations of 10,000 and above followed by 5 states of Rajasthan (9.3%), Andhra Pradesh (9.3%), Madhya Pradesh(8.7%), Uttar Pradesh(6.7%), Punjab (6.9%) carried out registrations of between 5000 to 10,000 wastepickers The remaining 29 states have carried out registrations of less than 5000 wastepickers per state. (Refer Table)
d. Occupational ID card
It was found that there were no standarised norms for renewal and the validity differed from city to city form 1 year to 10 years.Refer Photo below:

210
e. Access to Schemes
NULM, NSKFDC and GSCJ, provide for various social benefits, finance schemes and skill development. They also provide for linkages and associations through social mobilisations. Refer Chapter 2- 2.1.8 and 2.1.9 for details Integration
a. The Purpose of Integration
The informal waste sector is an important and valuable contributor is many different ways, from job creation, mitigating environmental costs by recycling , (Read reducing the load of landfills and providing raw materials) and saving municipality costs for collection, transportation and disposal and as such for cities to be inclusive, it is imperative to include them. The purpose of integration spans across social acceptance, protection and inclusion, promoting economic productivity and environmental sustainability. According to a project document in Tunisia, “As a long term goal, integration should lead to options for exit strategies for the next generation of wastepickers - either to remain in the formal, modernised recycling system in Tunisian cities, or have exit options to pursue a profession of their choice sustained by a stronger family and state based social safety net. We understand that this vision is most likely a long-term goal be realized by - and for - future generations.” which is line with the overall advocacy on the process of integration. (Deutsche Gesellschaft für Internationale Zusammenarbeit (GIZ) GmbH 2015) (2008)
The SWM Rules 2016 clearly mandate three way segregation of waste, and recovery and management of dry waste. It further directs waste generators to hand over segregated waste. Integration of wastepickers into the system provides a win-win approach to all, given their knowledge, skill and expertise in retrieval, sorting and grading. This will also help insulate the potential threats, in the form of monopoly by corporates, intermediaries or agencies who bid for large scale waste management contracts. Access to segregated dry waste, also helps improve the working condition of the wastepickers, and allowing the wastepickers enter into contracts directly with the municipality also help retain the entrepreneurial nature of the profession at an individual level.
The thrust of integration, in this context is to ensure the wastepickers and other informal waste collectors and other actors in the recycling value chain, are treated on par with other workers, while eliminating negative characterisation, and promoting protection.
b. Prescription by SWM Rules 2016 and SS
The SWM Rules 2016 prescribes the integration of waste pickers and the informal waste collectors through three levels:
At the policy and planning level:
• Rule 11 prescribes recognition and acknowledgement of the primary role played by the waste pickers , waste collectors and the recycling industry in reducing the waste , by ensuring consultation with waste pickers representatives at the

211
High Integration Total ExclusionReference made to WP, but no strategy of integration
Pune, Uttarakhand West Bengal, Surat Chennai, NDMC and
Chandigarh
Box 6.3: Status of integration
stakeholder meetings, by providing broad guidelines regarding integration of waste pickers or informal waste collectors in the waste management systems and finally through ensuring allocation of suitable land for supporting all such activities of processing and disposal.
• Rule 23 further advises the inclusion of one representative from reputed Non-Governmental Organisation or Civil Society working for the waste pickers or informal recycler or solid waste management as member.
At the implementation level:
• Rule15. Reiterates the duties and responsibilities of local authorities and village Panchayats of census towns and urban agglomerations to establish a system for integration of these authorised waste-pickers and waste collectors to facilitate their participation in solid waste management including door to door collection of waste; to setup material recovery facilities or secondary storage facilities with sufficient space for sorting of recyclable materials to enable informal or authorised waste pickers and waste collectors to separate recyclables from the waste and provide easy access to waste pickers and recyclers for collection of segregated recyclable waste such as paper, plastic, metal, glass, textile from the source of generation or from material recovery facilities.
• Rule 4 further prescribes that waste generators like resident welfare and market associations, gated communities and institutions with more than 5000 sq. area and all hotels and restaurants shall facilitate collection of segregated waste in separate streams, handover recyclable material to either the authorised waste pickers or the authorised recyclers
c. Status of Integration
The Bye laws of some major cities / states that have been published in 2017-18 were taken up and checked for compliance of some salient requirements like waste picker definitions , inclusion of Rule 11,15, 4 as per the SWM Rules 2016, as discussed above:

212
Status of inclusion based on the indicators( Refer Table of Cities)
Definition of wastepicker:The bye laws were verified for whether there is a definition of wastepicker. Only 50% of the city bye laws of Chennai, Chandigarh, Bihar and Pune had a wastepicker definition. The other cities of Surat, Tirupati , NDMC, Indore and Navi Mumbai had no definition of wastepickers. Also they were referred to as rag pickers in addition to wastepickers
Registration of waste pickers is mentioned by only 5 of the 12 legislations. Tirupati, Chennai, NDMC and Pune refer to the same in their bye laws. The State policy of Haryana has also states its intention to start a scheme for registration of wastepickers, acknowledge their role and the need to issue broad guidelines . However the cities of Navi Mumbai, Surat, Indore, Bihar, Chandigarh have not made any mention of registration of wastepickers in their bye laws. Similarly the state action plans of West Bengal and Uttarakhand makes no mention of wastepicker registration.
Plan for dry waste including waste pickers
6 of the 12 legislations have planned for dry waste management with a role for wastepickers. The Haryana state policy talks of setting up MRF and to enable wastepickers to collect and sort, Chennai bye law states it will set up MRF and only non recyclable dry waste will be sent to RDF or WTE processing. It also allows wastepickers to benefit from the sale of dry waste. Pune bye laws look at setting up Only of community collection centres for plastic waste operated by wastepickers .
The Uttarakhand state action plan states that MRF or secondary storage facilities to be set up with sufficient space for sorting by wastepickers. Further, it states producer responsibility organisations will be responsible for disbursement of fees from the producers to the collectors( mainly waste pickers or informal sector individuals. This is the only city which has planned for discharging of extended producers responsibility through the producer responsibility organisations will be made accountable and further in a way in which it benefits the wastepickers. Bihar state byelaws directs that the urban local body shall set up MRF where wastepickers can sort and ensure that recyclables such as paper, plastic, metal, glass, textile etc. go to authorized recyclers through waste pickers. Surat bye laws state that it shall provide for as many dry waste sorting centres as possible and required and these shall be manned or operated by registered co operative societies of wastepickers or others. The remaining bye laws provide no dry waste access to waste pickers.Tirupati bye laws state that MRF shall be established and that all recyclables shall go to authorised recyclers , West Bengal plans for plastic to be dealt with through melting , in NDMC Dhalaos will be converted into recycling centres to be managed by authorised agents or waste dealers. Recyclables will go to authorised recyclers with revenue from sales to be retained by

213
Box 6.3c: Status of inclusion based on indication
them . In Chandigarh the bye laws state that the recyclables will go to the authorised recyclers and in Uttarakhand MRF to be managed by the waste collectors. Indore shall establish MRF and ensure that recyclable waste shall to go authorised recyclers, further plans that collected non biodegradable waste will be sent to processing facilities and used as feedstock for waste to energy or power processing plants
Waste pickers integrated in the door to door collection ( Rule 15)
Only 3 of the 12 legislations talk of integrating wastepickers in the door to door collection. The state policy of Haryana states that urban local bodies should facilitate their participation in solid waste management especially in the door to door collection of waste . The NDMC bye laws state that the informal door to door collection system should be integrated with the NDMC collection system. In Pune the bye laws also explicitly state that waste pickers shall carry out the door to door collection.The West Bengal after assessing various options clearly states that it prefers the door to door collection to be carried out by the resident society or self help group. The bye laws of Chennai, Chandigarh, Navi Mumbai, Surat , Tirupati, Indore and Bihar have no mention of waste picker inclusion in the door to door collection, instead talk of the same being carried out by agency, authorised waste collectors etc.
Access provided to wastepicker by the MunicipalityOnly 4 of the 12 legislations have directed the bulk generators to hand over the waste to wastepickers. Bihar , Tirupati, bulk generators can hand over recyclable waste to authorised wastepickers, Indore bye laws directs only the hotels and restaurants to hand over recyclable waste to wastepickers, West Bengal is providing access at the secondary transfer station for segregation and selling of recyclables, Pune allows handover of waste by bulk generators to authorised waste pickers, access to their community bins / collection points also integration into the wet waste processing facilities. The Haryana state policy and the remaining 6 city bye laws of Chennai, NDMC, Chandigarh do not specify any access to the waste pickers Surat specifies that the generators should deposit the dry waste/ recyclable waste in the community bins from where the same shall be collected by authorised agents/ agency /individuals. The Bihar bye law talks of providing training to wastepickers, Navi Mumbai in fact goes as far as to exempt the wastepickers from accessing the community bins and states that the local body shall ensure that at no point of time the community bins shall be overflowing or exposed to open environment , preventing their scattering by wastepickers, stray dogs and animals, birds etc

214
Integration for All
The SS city reports is based on the percentage of wards that engage informal waste pickers for SWM. It is important to note that the use of terminologies such as engage undercuts the wider scope and vision envisaged by the SBM Manual on MSWM “for legal recognition and enabling an inclusive approach of waste pickers”. It is necessary for the municipalities to read deeper into the laws and provide for integration options of all waste picker types based on their existing waste practices to the maximum extent possible, in addition to other newer options that can be looked at through skilling and training like organic waste processing facilities, as in case of Shillong.
6.4 Conclusion The objective of the study is to present the status of wastepickers and evaluate the performance of implementation of the existing legislations by the cities through their waste practices. The analysis of the status leads us back to the question raised at the outset on what is that we are seeing – “A Mirage or a Rising Tide”, especially around the processes of registration and integration.
The conclusions drawn from the findings of the study through the survey, focus group discussions and the case studies are presented under the broad theme of wastepickers and waste practices.
State and Status of Wastepickers
The state of waste practices in the cities and the status of the wastepickers working in them are far from satisfactory. Several points of concern vie for attention and need to be urgently addressed.
Municipal Sanitation workers in most cities compete with the wastepickers for the dry waste. This is further exacerbated by the poor door to door collection systems that exist in most cities, that too in the form of mixed waste, therefore driving waste pickers to pick from all other areas, garbage points, landfills, secondary storage, and transfer points. Landfill dumping is still the most convenient thereby limiting the access to recyclable waste.
Private lands, godowns, vacant spaces are used to sort door to door collection waste. Too little municipal support and infrastructure is in place for secondary storage and sorting. Of the few cities that have byelaws, MRFs and sorting facilities have been mandated; however the time frame within which this will be enabled is to be seen. In the meantime, other institutional intermediaries, authorized recyclers and agencies are competing to set up and manage the MRF. This is driven by the thrust to support big ticket projects of waste to energy as a panacea to deal with the problems of mixed waste, and given preference over recycling despite the lip service given to the importance of planning processing strategies as per the waste management hierarchy. It is important to recognise that women form a large part of the vulnerable population who need to earn their livelihood or supplement the family income to support the large number of children. It is important to provide them with necessary skilling and security of livelihood.

215
The availability of housing and its location is closely linked with the ability of the waste pickers to carry out their daily activities. The house acquires an occupational status and the stability without threat of eviction or dislocation is a big driver. This also prevents them from moving out of the informal / slum colonies as it provides them safety in their numbers. The use of their homes for the sorting and storage also is a big limiting factor as the acceptability of this outside the colonies by the other residents of the neighbourhood will not be forthcoming in the same way.
The socio economic status reflects the influences of linkages to the municipality. Cities in Maharashtra and Karnataka have shown a higher level of organisation or association with waste picker organisations or networks and those who are door to door collectors, also from the same regions, appear to be getting higher monthly income though lower than the minimum wages, have better financial accessibility to bank accounts and loans. However the gap between the monthly incomes earned by the waste pickers and the minimum wages still remains.
These conclusions are presented keeping in mind that the SWM Rules 2016 have recognized that a wastepickers means a person working independently or engaged, directly or through an agency, whether for wages or not, in the collection of reusable and recyclable solid waste from source of generation, streets, bins, containers, processing-material recovery or disposal facilities for the purpose of segregation, sorting and sale of waste to recyclers and who may be additionally engaged in activities such as handling, cleaning , composting and bio-methanisation plant maintenance . Further that the municipality shall endeavor that the wastepickers are given priority to upgrade their work conditions and are registered and integrated into the formal system of solid waste management as waste collectors.
In order to achieve this, the SBA since 2014, through the SS that have been evolving every year, has attempted to assess the municipalities for their efforts in registration of the wastepickers. This has been further supplemented by creating frameworks for convergence through the DAY-NULM where they can go through skills training, social mobilisation, bring in financial inclusion and strengthen the self-employment.
In this setting the study findings show that less that 15% of the wastepickers work with the municipality and more than 70% of them feel SBA is not for waste pickers. The primary reason for this poor show can at the very outset be attributed to the apathy in the policy and bye law creation by states, ULBs and Municipalities. The NGT has taken cognizance of this and has created State committees for monitoring the process of framing of byelaws and incorporating the provisions of the Rules and ensuring their timely implementation (National Green Tribunal, 2018). The city ranking system, however well intentioned, has ended up creating certain complacency in the cities that have found their way to the top. It has provided them an avenue for justification of their action taken, however unsuitable or inappropriate. 43% of the wastepickers who participated in the discussions were found to be unemployed because of the restrictions placed by the Indore Municipality, ranked first in the SS rankings. In addition the small number of those employed had not received their salaries for over three months. In Mysore, ranked 8th in the SS rankings, of the 47 dry waste collection centres that have been set up, only 9 have been allotted to the wastepickers for operations, though work order exists in paper. In both cities the inclusion of the wastepickers in the door to door collection system appears a very distant possibility.
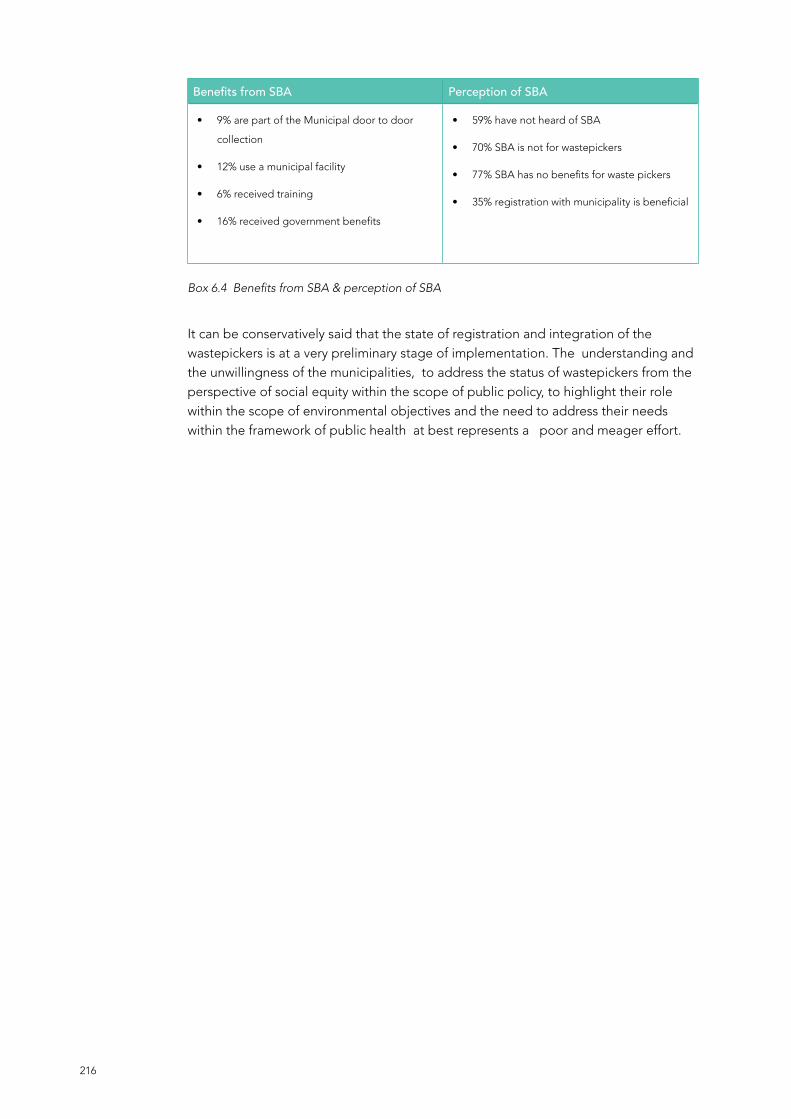
216
It can be conservatively said that the state of registration and integration of the wastepickers is at a very preliminary stage of implementation. The understanding and the unwillingness of the municipalities, to address the status of wastepickers from the perspective of social equity within the scope of public policy, to highlight their role within the scope of environmental objectives and the need to address their needs within the framework of public health at best represents a poor and meager effort.
Box 6.4 Benefits from SBA & perception of SBA
Benefits from SBA Perception of SBA
• 9% are part of the Municipal door to door
collection
• 12% use a municipal facility
• 6% received training
• 16% received government benefits
• 59% have not heard of SBA
• 70% SBA is not for wastepickers
• 77% SBA has no benefits for waste pickers
• 35% registration with municipality is beneficial
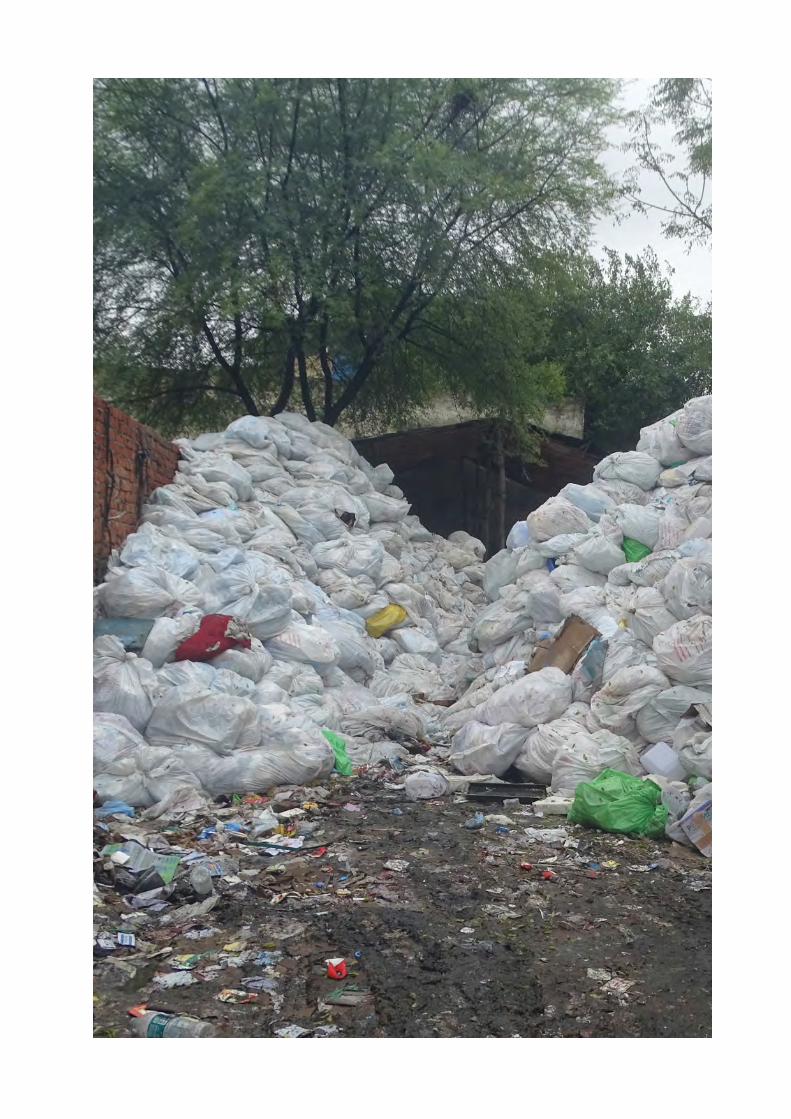


219
RecommendationsIn order to secure dignified, decent, and green livelihood for the informal waste economy, through the SBA Framework, it is imperative that an inclusive approach towards informal waste workers is undertaken.
7.1 Key Concerns• Lack of uniform appreciation: There is an urgent need to build a uniform
appreciation and understanding of the entire informal waste workers and the informal recycling value chain among the ULBs, and other government departments, as their contributions, scale and size are not recognised and documented. As evidenced in the literature review of the bye laws, some cities have adopted an exclusionary approach through non-inclusion and recognition of the entire sector.
• Lack of adherence to SWM Rules 2016: While the SWM Rules 2016 are comprehensive and address the need of registration and integration of the waste pickers. What is deficient, to a large degree, is the limited interpretation that has been used to draw up the model bye laws. This detailing has been missed even though SBA Manual and Guidelines drafted in 2016 has laid out options for enabling conditions and supportive actions for an inclusive approach. Two other glaring omissions are the approach on how to implement registration and integration and the lack of monitoring for its implementation. There is an urgent need to improve and update the byelaws such that it reduces the scope of ambiguity and interpretation and improves the impact.
• Lack of data on waste generated and characterisation: Lack of accurate data of waste generation, the characterisation of waste, makes it impossible to assess and plan for an integrated and sustainable waste management. The lacunae allows, for same data to be used for years, often going unnoticed, lack of transparency when pitching for funding and planning, and inability for comparisons, or future trend projections. This ends up in a sense of complacency and continuing status quo for mixed waste collection.
• Need for enforcement of segregation of waste at source: A prerequisite to better waste management and dignified access to waste for wastepickers and other informal waste collectors is segregation of waste at source.
• Ambivalence in roles of different stakeholders and lack of inter departmental coordination: Clarity on the specific roles around dry waste management, among
7

220
waste collectors, sanitary/municipal workers, waste pickers and informal waste collectors, authorised recyclers and agencies at the State Policy. Coordination within ULB and NULM.
7.2 Summary of Recommendations - Overall
7.2.1 Understanding and defining the process of Registration and issuance of occupational ID cards:The SWM Rules 2016 15 (c) states that the duty of local authorities is to “establish a system to recognise organisations of waste pickers or informal waste collectors…” In order to do so, the following steps are recommended:
a. Identify organisations of wastepickers: The first step is to identify, acknowledge and recognise organisations of wastepickers working in the City/State.
b. Consultation or FGD: In absence of such organisations of wastepickers, a short consultation /focus group discussion with wastepickers, informal waste collectors, scrap dealers and traders can be held to understand the size and diversity of the informal waste economy in the city. (The discussions can include estimating number of wastepickers and other informal actors in the informal recycling value chain, locations and work practices and presence of informal groups or associations.)
c. Collection of Baseline Information and Centralised Database: As listed in Manual on MSWM, it is important for the ULB to map all the actors involved in the recycling value chain, in the form of a universal survey. At the ULB level, in order to institutionalise the process, the Municipal Commissioner must issue a circular detailing the registration process, how to identify, what forms to be filled, the format of the survey, methodology, enlisting of technical experts, appointment of nodal officer, identifying of facilitators, cross-verification process and entry into the database and management of database. It is important that for enlisting of technical expert, only those individuals or organisations with organising and mobilisng wastepickers with more than 8 years of experience be listed for guidance. (Chandran, Shekar, et al. 2014) Please refer Annexure 3 BBMP Circular No.: A/PSR/509/11-12, for a detailed guidance note . In this process it is important that the ULB allocate a budget to undertake this exercise, which includes designing the form, app development to capture data, cross checking data for authenticity, maintaining a central database, issuance of smart card-bar code enabled, training surveyors, payment to surveyors and IEC component and set clear timelines.
d. Data Analysis, Identification of the Informal Recycling Value Chain and Mapping waste related work within the ULB limits: Post data collection, it is important to understand the landscape, of the informal waste economy to be able to plan for different types of waste related work with ULB limits for example- gardening, composting, door-to-door collection, management of MRF, sorting at MRF, service to bulk waste generators, and other government and institutional generators. (Mapping waste related work is possible, if the ULB has accurate data of waste

221
generation and the characterisation of waste in current terms). Data Analysis could be outsourced to an organisation of waste picker, or an academic institution/civil society of repute with similar experience with informal waste workers. See box: Example for Identification of the Informal Recycling Value Chain
Example for Identification of the Informal Recycling Value Chain and Snapshots of requirements Excerpt from Valuing Urban Waste: The need for comprehensive Recycling Policy (Chandran, Arora, et al. 2018)
Bengaluru reveals a complex thread of inter-connections at all levels within the traditional linear recycling pyramid. Embedded in each category of actors are multiple sub actors performing similar jobs but varying in either quality or type of material, scale, method of collection or processing. It’s important that the mapping of the actors is undertaken across the country to capture its trans-regional nature. It is also important to capture the colloquial names used for each actor.
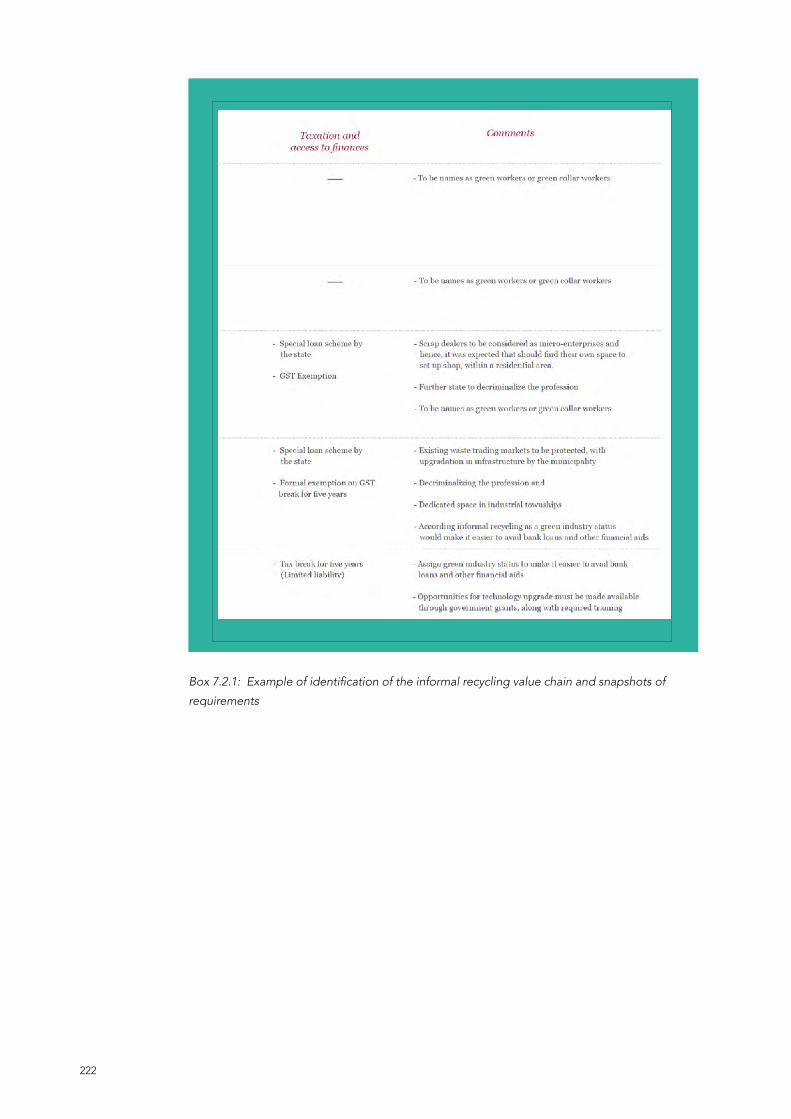
222
Box 7.2.1: Example of identification of the informal recycling value chain and snapshots of
requirements

223
Figure 7.2.1.d.1: Material Flow Value Chain
Author: Pinky Chandran

224
e. Issuance of Occupational ID cards: The occupational ID card, must be in smart card format, to avoid duplication of registration, and to track and cross-verify against both the Annual Reports submitted to State PCBs and the SS. The card should be durable and similar to ones issued by the RTO. The details must include:
Figure 7.2.1.d.2: Value Chai Interpreted
Participants in brainstorming exercise

225
Box 7.2 E Identity card contents
Front Side of the Card: Back Side of the Card:
• Logo and Name of the Municipality
• Occupational ID Card as title
• Name of the Waste picker
• Date of Birth /Age approximated, if not
available
• Gender
• Address and Contact Number if any
• Ward Number/Locality Name ( where
they stay)
• Identity Card Number
• Date of Issue and Validity – Ten Years
• Signature of Commissioner (or a person
at similar position in local bodies.
• The card is issued as per Solid Waste
Management Rules, 2016 & Unorganized
Workers Social Security Act, 2008.
• The holder of this card has a Right to
Collect Waste.
• This card is not valid for workers below
18 years of age
• No child labour involved.
• Wastepickers are not employees of the
Municipal Corporation/or any other
issuing authority.
• This card will be used for accessing
schemes specific to wastepickers and
informal workers.
• If you lose the card, you are eligible for
a duplicate card by paying the necessary
amount fixed by the ULB.
• Organization or Municipal body is not
responsible if the waste picker with the
identity card engages in any form of
nuisance or theft.
• If the card is found lost, please contact
the organization of wastepickers-
contact number written or the local ULB
office, or City Livelihood Center and
deposit the same
f. Linkage with City Livelihoods Centers: In order to bring in convergence, while the database must be centralised with ULB, the details of the registered informal waste workers must be shared.
7.2.2 Understanding Integration:The term inclusion and integration are often used interchangeably, but for the purpose of our report, we are looking at understanding “Integration” for an Inclusive Approach in the City’s SWM. The implied takeaway is that integration does not mean hiring them as permanent employees, though this is just one aspect, it means understanding the economy and creating enabling conditions and supportive actions to facilitate their participation in the city’s SWM. The SWM Rules 2016 ( c ) promote and establish a system for integration of these authorised waste-pickers and waste collectors to facilitate their participation in solid waste management including door to door

226
Box 7.3
Facilitative Action
An important point to note is there is no one size fits all solutions to facilitative actions but care must be taken to provide and include a wide range of actions, solutions, and approaches to enable integration.
a. Correlation of waste practices and Waste picker types
It is recommended that the co relation of waste practices of waste picker types within the formal SWM system be established between the waste picker type and the scope of work in various settings.
• In respect of the Free roaming wastepickers, retain the essential character of
collection of waste; (d) facilitate formation of Self Help Groups, provide identity cards and thereafter encourage integration in solid waste management including door to door collection of waste; (h) setup material recovery facilities or secondary storage facilities with sufficient space for sorting of recyclable materials to enable informal or authorised waste pickers and waste collectors to separate recyclables from the waste and provide easy access to waste pickers and recyclers for collection of segregated recyclable waste such as paper, plastic, metal, glass, textile from the source of generation or from material recovery facilities; specify ways of integration.
In order to be able to do so, the following actions are required:
Legislative Action – Through policies and therafter through byelaws Circulars, Memos
The State Policies and Bye Laws must explicitly recognise and acknowledge the informal waste economy, and detail the process of registration as stated above, provide legal identity and enable options to access waste as first right, allow rights to organise, bid for contracts at all levels – individual, collective, SHG, Cooperative, trade union, civil society, or a company, as legitimate service providers. Include the organisations of wastepickers and other informal waste workers in participatory policymaking processes like the State Level Advisory Committees and other equivalent committees formed by the Government.
From a decent work perspective, transition to formality is cast within each of the four pillars of (1) rights at work, (2) employment promotion, (3) social protection and (4) social dialogue, but its intrinsic value is essentially in the integration and the interaction amongst the policy actions covered under each them
Source: Report of the Tripartite Interregional Symposium on the informal economy: Enabling Transition to Formalization (Geneva 27- 29 November 2007) https://www.ilo.org/wcmsp5/groups/public/---ed_emp/---emp_policy/documents/meetingdocument/wcms_125519.pdf

227
independent self-employed workers who have the flexibility of work areas and timings through linkages to commercial and bulk generators for collection , registration at the City livelihood centres for providing the services of collection from generators
• In respect of Landfill wastepickers , retain the essential character of sorting and retrieval through engagement in manual sorting at the conveyor belts in material recovery facilities , preprocessing facilities or dry waste collection centres , as wage earners
• In respect of door to door collectors , Retain the essential character by engaging within the formal system of collection, handling and disposing of garbage , either as wage earners or through contractual agreements
b. Access to Infrastructure Services: As outlined by the SWM Rules 2016, setting up of MRF, or secondary storage facilities with sufficient space for sorting of recyclable materials is an important aspect of integration of wastepickers. The State and ULB will have to ensure that they are operated by wastepickers and scrap dealers, and ensure setting up of contract terms that are fair.
c. Access to Waste: If ULB has contracted waste services to private company- then it is important to ensure tangible and measurable inclusion in the terms of employment, minimum wages, assurance on keeping recyclables for sale in markets rather than to the company, ensure proper work conditions, safety equipment, training and rehabilitation into other waste services with timely payments
d. Training Capacity Building and Skill Development: Every effort must be made by all ULB to set a nodal officer who will carry out the necessary integration between the SWM departments and then Green Council and NULM schemes, which offers the necessary modules for training and skill building. All registered wastepickers must be exposed to these trainings.
e. IEC: Every effort should be made by the ULB to create an IEC strategy for wastepickers and other informal waste collectors keeping in mind that they are not exposed to traditional communication medium, but engage in more of outreach, community radio and other radio and hoardings as the literacy levels of the wastepickers is low. Therefore any strategy must take into account these limitations and attempt to plan for face-to-face engagements through the resource organisations who are best placed to reach out to them and educate them.
f. Relook at data presented in SS Ranking System: The SS ranking system runs a real risk of presenting a mirage if the accountability of the data submitted is not backed by annual report submission to the CPCB. The scrutiny of the data submission should result in non-compliance and action proceedings for erroneous reporting.
Cities have to be viewed as either as inclusive or excluding cities. This will impact each of the waste picker types differently, depending on the change in waste practices that cities bring in the nature of either being inclusive or excluding. It has to be understood that this impact is going to be far reaching and may end up entirely challenging the very existence of waste pickers as a livelihood option in the years to come, if there is no real inclusion of all waste pickers on a war footing. If such a thing were to ever take

228
place, the loss to sustainable solid waste management would be of great magnitude and needless to say at the cost of grave social injustice.
The question arises, how can we ensure that these women and men who are fighting the real battles of earning their daily incomes, supporting their children and getting benefits be brought into the ambit of registration even if it has to be at the cost of loss of ranking of these cities who aspire to feature in the list of cleanest cities of India and may not be able to proudly say ‘ 100% of the identified informal waste pickers are integrated by the ULB in the formal system and are deployed in all the wards’ These kind of wordings are not tenable and has converted the waste pickers life into a game of numbers in SS.
g. Coordination between Ministries, Departments, Missions and Pollution Control Board
From a holistic policy perspective, it is important that all rules, policies, directions are aligned and converged. Implementation on the ground should be laid out clearly, with all stakeholders responsibility elucidated, from a convergence point of view.

229
Endnotes1 Service Level Benchmarking (SLB) is an initiative covering water, sanitation, solid waste management and storm water drainage. It was launched by the Ministry of Urban Development in 2009.
2 Re-classification/Upgradation of Cities/Town on the basis of Census-2011 for the purpose of Grant of HRA to Central Government employees
3 Note: Panchukla FGD was conducted in Bengaluru
4 * Note: Only exception is the SBM Guidelines, 2014, Smart Cities 2015
5 Honble Justice N Kumar and B. V. Nagarathna 17/12/2015 Order in WP 24739/2012 W.P Nos. 24739-24740/2012, C/W. W. P. No. 46601/2012 30450/ 2012 & 46523/2012 http://karnatakajudiciary.kar.nic.in/caseStatus_CaseNumber.aspx
6 Participating cities in the survey
7 Note: The survey findings in particular have been compared with studies which have reported on similar parameters of profile and attributes which can be linked to historical and social factors, to ensure a fair comparison. Only for the purposes of the survey quantitative data comparison, studies previous to the time frame have been used as it allows for comparison of totally similar parameters. The studies used for comparison therefore span a period of almost two decades. This enables comparison of change of status making the findings of the comparison of great interest.

231
Works Cited1. Collectors, Scrap Traders and Recycling Enterproses in Pune.” 2001. https://
swachcoop.com/pdf/ILO%20Study.pdf (accessed May 10, 2019).
2. Hindu Business Line. Binless in Indore. 30 November 2018. https://www.thehindubusinessline.com/blink/cover/binless-in-indore/article25631563.ece (accessed May 30, 2019).
3. Karnad, Girish T G. Planning for urban infrastructure under decentralized governance_ a case study of Mysore city. 2002. http://shodhganga.inflibnet.ac.in:8080/jspui/handle/10603/91376 (accessed May 1, 2019).
4. Kumar Bhanu, Ar Amish, and Ar. Ravish Kumar. “Strategy for Municipal Solid Waste Management: - A Case Study of Patna.” International Journal of Chemical, Environmental & Biological Sciences (IJCEBS) Volume 2, Issue 4 (2014) ISSN 2320–4087 (Online), 2014.
5. Municipal Corporation of Gurugram. Authorisation Letter to Eco Green. Gurugram, Haryana, 8 June 2018.
6. Sharma, Krishnavatar. India has 139 million internal migrants. They must not be forgotten. 1 October 2017. https://www.weforum.org/agenda/2017/10/india-has-139-million-internal-migrants-we-must-not-forget-them/ (accessed May 12, 2019).
7. SMEC India. “Draft Final DPR-SWM Plan for GSPA: Community Assessment Report, Asian Development Bank TA 4779-IND .” State Investment Project Management and Implementation Unit (SIPMIU), Shillong. 24 June 2009. http://sipmiu.nic.in/sites/default/files/dpr-swm-gspa.pdf (accessed May 29, 2019).
8. Times of India, Indore. ‘ Indore Fire breaks out at Indore’s Devguradia trenching ground’,. 18 May 2015. https://timesofindia.indiatimes.com/city/indore/Fire-breaks-out-at-Indores-Devguradia-trenching-ground/articleshow/47326486.cms (accessed May 30, 2019).
9. Wasnik, Sumit Ghansham, Kamaxi Bhate, Arjun Mehta, and Mandar Sadawarte. “Evaluate the factors affecting health seeking behaviours of women rag pickers in Mumbai.” International Journal of Community Medicine and Public Health, 2017: 156-160.
10. @indoreantipollution Facebook . FaceBook Anti Pollution Bypass Indore. n.d. https://www.facebook.com/pg/indoreantipollution/videos/?ref=page_internal.
11. n.d. http://sipmiu.nic.in/sites/default/files/dpr-swm-gspa.pdf.
12. Administrative Staff College of India, Hyderabad. City Sanitation Plan, Mysore Karnataka Draft Report. December 2011. http://www.municipaladmn.gov.in/sites/municipaladmn.gov.in/files/CSP_Mysore.pdf (accessed May 1, 2019).
13. Chikarmane, Poornima, Medha Dr. Deshpande, and Lakshmi Narayan. “ILO- Report on Scrap Collectors, Scrap Traders and Recycling Enterproses in Pune.” 2001. https://swachcoop.com/pdf/ILO%20Study.pdf (accessed May 10, 2019).
14. Hindu Business Line. Binless in Indore. 30 November 2018. https://www.thehindubusinessline.com/blink/cover/binless-in-indore/article25631563.ece (accessed May 30, 2019).
232
15. Karnad, Girish T G. Planning for urban infrastructure under decentralized governance_ a case study of Mysore city. 2002. http://shodhganga.inflibnet.ac.in:8080/jspui/handle/10603/91376 (accessed May 1, 2019).
16. Kumar Bhanu, Ar Amish, and Ar. Ravish Kumar. “Strategy for Municipal Solid Waste Management: - A Case Study of Patna.” International Journal of Chemical, Environmental & Biological Sciences (IJCEBS) Volume 2, Issue 4 (2014) ISSN 2320–4087 (Online), 2014.
17. Municipal Corporation of Gurugram. Authorisation Letter to Eco Green. Gurugram, Haryana, 8 June 2018.
18. Sharma, Krishnavatar. India has 139 million internal migrants. They must not be forgotten. 1 October 2017. https://www.weforum.org/agenda/2017/10/india-has-139-million-internal-migrants-we-must-not-forget-them/ (accessed May 12, 2019).
19. SMEC India. “Draft Final DPR-SWM Plan for GSPA: Community Assessment Report, Asian Development Bank TA 4779-IND .” State Investment Project Management and Implementation Unit (SIPMIU), Shillong. 24 June 2009. http://sipmiu.nic.in/sites/default/files/dpr-swm-gspa.pdf (accessed May 29, 2019).
20. Times of India, Indore. ‘ Indore Fire breaks out at Indore’s Devguradia trenching ground’,. 18 May 2015. https://timesofindia.indiatimes.com/city/indore/Fire-breaks-out-at-Indores-Devguradia-trenching-ground/articleshow/47326486.cms (accessed May 30, 2019).
21. Wasnik, Sumit Ghansham, Kamaxi Bhate, Arjun Mehta, and Mandar Sadawarte. “Evaluate the factors affecting health seeking behaviours of women rag pickers in Mumbai.” International Journal of Community Medicine and Public Health, 2017: 156-160.
22. @indoreantipollution Facebook . FaceBook Anti Pollution Bypass Indore. n.d. https://www.facebook.com/pg/indoreantipollution/videos/?ref=page_internal.
23. n.d. http://sipmiu.nic.in/sites/default/files/dpr-swm-gspa.pdf.
24. Administrative Staff College of India, Hyderabad. City Sanitation Plan, Mysore Karnataka Draft Report. December 2011. http://www.municipaladmn.gov.in/sites/municipaladmn.gov.in/files/CSP_Mysore.pdf (accessed May 1, 2019).
25. Ahuja, Sanjeev K. Global destination or garbage dump? 23 September 2008. https://www.hindustantimes.com/india/global-destination-or-garbage-dump/story-Cw7t2ESLwAPoz3AAG3nYuN.html (accessed May 20, 2019).
26. “Amendment in the Haryana Building Code-2017-Chapter1, 6 & 7.” 8 May 2018. https://igbc.in/igbc/html_pdfs/Haryana%20Model%20Building%20By%20laws%202018.pdf (accessed May 23, 2019).
27. Arora, Kabir. Waste Narratives. 4 August 2015. https://wastenarratives.com/2015/08/04/swach-bharat-abhiyaan-smart-cities-mission-consider-waste-to-energy-smart-solution/ (accessed April 24, 2019).
28. BASIX, Information given by the Supervisor of, interview by Sandya Narayanan and Pinky Chandran. Understanding the MRF operations (22 July 2018).
29. Bihar Times. PMC carves out new Patliputra Circle. 17 August 2016. http://www.bihartimes.in/Newsbihar/2016/Aug/newsbihar17Aug3.html (accessed May 10, 2019).
233
30. —. PMC carves out new Patliputra Circle. 17 August 2016. http://www.bihartimes.in/Newsbihar/2016/Aug/newsbihar17Aug3.html (accessed May 10, 2019).
31. Bihar Urban Infrastructure Development Corporation Limited. “Draft Concession Agreement- Development of Regional Municipal Solid Waste to Energy ( Electricity) and Landfill Facility at Patna in Bihar.” 18 December 2014. https://www.pppinindia.gov.in/documents/20181/34422/Municipal+Waste+to+Energy+-+Patna.pdf/10e4f768-e158-40b6-bd34-a0734ce8d59d?version=1.0 (accessed May 10, 2019).
32. Central Pollution Control Board. Annual Report 2001-2002, { Annual Report prepared in compliance to the provision 8(2) of the Rules} MUNICIPAL SOLID WASTES(Management & Handling) Rules, 2000. 2004. http://municipaladmn.gov.in/sites/municipaladmn.gov.in/files/19._cpcb_annual_report_on_msw_rule_2000_implementation.pdf (accessed May 29, 2019).
33. —. “ENVIRONMENTAL STATUS OF BHOPAL CITY.” 2016. http://164.100.107.13/Environment_Status_Report_MadhyaPradesh_Bhopal_2016.pdf (accessed May 30, 2019).
34. Centre for Science and Environment. Centre for Science and Environment urges Bihar to segregate and ramp up waste collection and releases book on Solid Waste Management at Patna. 2016. https://www.cseindia.org/centre-for-science-and-environment-urges-bihar-to-segregate-and-ramp-up-waste-collection-and-releases-book-on-solid-waste-management-at-patna--6717 (accessed May 10, 2019).
35. Centre for Science. Indore ranks first in waste segregation amongst cities with population over 1 million. 7 June 2018. https://www.cseindia.org/cse-releases-its-rating-of-selected-cities-which-manage-and-segregate-their-waste-most-efficiently-8749 (accessed May 30, 2019).
36. Chandran, Pinky. Radio ActiveCR. 9 July 2019. https://radioactivecr.wordpress.com/2019/07/09/a-reference-list-of-government-of-india-policies-rulesschemes-and-reports-on-waste-management/ (accessed July 12, 2019).
37. Chandran, Pinky, Kabir, Arora, Marwan Abubaker, and Nalini Shekar. Valuing Urban Waste - The need for a comprehensive material recovery and recycling policyu. Bengaluru: Hasiru Dala, 2018.
38. Chandran, Pinky, Nalini Shekar, Marwan Abubaker, and Akshay Yadav. “Informal Waste Workers Contribution Bangalore.” Icon SWM. Hyderabad: Oxford Publishing House, 2014. 522 -532.
39. CHF International India and Mythri Sarva Sava Samithi. Sample Study of Informal Waste Pickers in Bangalore. Bangalore: CHF International India, 2010.
40. Chikarmane , Poornima, and Lakshmi Narayan. Rising from the Waste – Organising Wastepickers in India, Thailand and the Philippines. Thailand: Committee for Asian Women (CAW), 2009.
41. Clean Shillong Committee, Meghalaya. Clean Shillong. n.d. http://cleanshillong.nic.in/index.html (accessed May 29, 2019).
42. Concession Agreement Eco Green. Gurugram, Haryana, 24 July 2017.
43. Construction World. Indore has become a global model for solid waste management. May 2019. https://www.constructionworld.in/articles/interviews/

234
Indore-has-become-a-global-model-for-solid-waste-management/21030 (accessed June 1, 2019).
44. CPCB. “Affidavit on Behalf of the Central Pollution Control Board, in compliance of this Hon’ble Tribunal’s Order dated 1st March 2017.” CPCB, 6 Narch 2017.
45. —. “Comments on Action Plan Submitted by States for Solid Waste Management ( In compliance of the Hon’ble NGT order dated 22.12.2016 & 07.02.2017).” CPCB, n.d.
46. Dala, Hasiru. Waste Narratives. 23 April 2016. https://wastenarratives.com/2016/04/23/revised-solid-waste-management-rules-mandate-inclusion-of-wastepickers/ (accessed April 23, 2019).
47. Delhi Development Authority. “Master Plan for Delhi.” 1962. http://rgplan.org/delhi/MASTER-PLAN-FOR-DELHI_1962.pdf (accessed May 20, 2019).
48. Department of Information and Public Relations, Government of Meghalaya. “Press Release: SANITARY LANDFILL SITE INAUGURATED.” 2 October 2017. http://megipr.gov.in/pr.asp?dt=02-10-2017 (accessed May 29, 2019).
49. Deutsche Gesellschaft für Internationale Zusammenarbeit (GIZ) GmbH. “Tunisia: National Guidelines for Structural Integration of the Informal Sector in Solid Waste Management.” May 2015. https://www.retech-germany.net/fileadmin/retech/05_mediathek/laenderinformationen/Tunesien_guide_national_integration_du_secteur_informel_en_tunisie_en.pdf (accessed May 15, 2019).
50. Dhankhar , Leena . Gurugram RWAs inch towards self-sufficiency in waste segregation. 9 April 2018. https://www.hindustantimes.com/gurugram/gurugram-rwas-inch-towards-self-sufficiency-in-waste-segregation/story-4N5MV9fgSkOYjqbYAfpb0N.html (accessed May 24, 2019).
51. Dias, Sonia. Three ways waste pickers can be included in the new circular economy. 23 March 2018. https://www.equaltimes.org/three-ways-waste-pickers-can-be#.XOTty1IzbIU (accessed May 15, 2019).
52. Directorate of Municipal Administration, GOK. “Karnataka State Policy on Integrated Solid Waste Management .” 2003. http://www.hkrdb.kar.nic.in/documents/Downloads/Government%20Rules%20and%20Guidelines/SWM-Manual_on_State_Policy.pdf (accessed May 5, 2019).
53. Directorate of Urban Local Bodies, Haryana. “SWM Policy and Strategy under rule tl and 15 of Solid Waste Management.” 9 July 2018. https://ulbharyana.gov.in/img/pdf/SWM%20Policy%20and%20Strategy%20on%20Solid%20Waste%20Management.pdf (accessed May 23, 2019).
54. Dr. Anand, Subhash, Ekta Raman, and Usha Rani. “Role of Swachh Bharat Mission In Municipal Solid Waste Management In Patna.” Advance in Environmental Waste Management & Recycling, 2018.
55. Dr. Ashifa, K.M, and M. Sharmila Devi. “WELFARE AND SAFETY INDICATORS FOR WOMEN WASTE PICKERS IN RAJAPALYAM MUNICIPALITY.” International Journal of Research Granthaalayah, 2017.
56. Dr. Praveen Saxena, SCGJ. National Qualifications Register. 19 December 2018. https://www.nqr.gov.in/sites/default/files/QF_SGJ_Q6103_Waste%20Picker.pdf (accessed April 25, 2019).
235
57. Dr. Ramachandra, H, interview by Sandya Narayanan, Pinky Chandran and S Dr.Umashankar. Chief Health Officer (13 July 2018).
58. “Draft Comprehensive Solid Waste Management Policy and Strategy for Urban Local Bodies of Bihar.” 4 October 2018. http://urban.bih.nic.in/Acts/AR-01-04-10-2018.pdf (accessed May 7, 2019).
59. Environment Department, Government of Maharashtra. Maharashtra Non-Biodegradable (Proper Scientific Collection, Storing Disposal in the areas of Municipal Corporation) Act 2006 . 2006. http://mahenvis.nic.in/Pdf/Laws/Cbags_crules.pdf (accessed April 28, 2019).
60. Eswaran, Aparna , and Hameeda C.K. “The Waste Picking Community: Some Issues and Concerns.” Economic and Political Weekly ( EPW), 2013.
61. Foundary Informatics Centre. “Critically polluted 43 industrial clusters in India.” n.d. http://www.foundryinfo-india.org/Critically_polluted_43_industrial_clusters_in.aspx (accessed May 30, 2019).
62. Global Alliance of Waste Pickers. Indore Waste Management Model is Incomplete Without Participation of Waste-pickers. 2 August 2018. https://globalrec.org/2018/08/30/indore-waste-management-model-is-incomplete-without-participation-of-waste-pickers/ (accessed May 2019, 2019).
63. Government of Haryana. “Adoption of the Haryana Building Code 2017.” 7 March 2017. https://tcpharyana.gov.in/Notifications_Judgements/The_Haryana_Building_Code_2017.pdf (accessed May 22, 2019).
64. —. “The Haryana Building Code 2017 Alongwith amendments dated 22.12.2017 and 08.05.2018.” 8 May 2018. https://tcpharyana.gov.in/Policy/The%20Haryana%20Building%20Code-2017-Amendment-08.05.2018-Chapter-1-6-7.pdf (accessed May 23, 2019).
65. Government of India. The Prevention of Cruelty to Animals Act, 1960. n.d. https://indiacode.nic.in/bitstream/123456789/11237/1/the_prevention_of_cruelty_to_animals_act%2C_1960.pdf.
66. —. The Wild Life (Protection) Act, 1972. n.d. http://legislative.gov.in/sites/default/files/A1972-53_0.pdf.
67. Guidelines for Swachh Bharat Mission (SBM) . December 2014. http://swachhbharaturban.gov.in/writereaddata/SBM_Guideline.pdf (accessed April 23, 2019).
68. Haryana Urban Development Authority. “Pre-feasibility Report by HUDA on the Integrated Solid Waste Management Facility at Village Bandhwari.” May 2016. http://environmentclearance.nic.in/writereaddata/Online/TOR/14_Oct_2016_1952148476AXGDM1JPFR.pdf (accessed May 20, 2019).
69. Hindustan Times. Indore: IMC razes CP Shekhar Nagar, relocates dwellers. 11 October 2015. https://www.hindustantimes.com/indore/indore-imc-razes-cp-shekhar-nagar-relocates-dwellers/story-JB2snpxbVknvf6uBrVGnQK.html (accessed May 30, 2019).
70. Hindustan Times, Indore. Devguradiya trenching ground: Authorities mute spectator as miseries mount for locals. 20 May 2015. https://www.hindustantimes.

236
com/indore/devguradiya-trenching-ground-authorities-mute-spectator-as-miseries-mount-for-locals/story-8NpEgVvYbuvUp2Ne2pqsvO.html (accessed May 30, 2019).
71. —. “HC directs Indore civic body to come up with waste-disposal plan.” 31 October 2015. https://www.hindustantimes.com/indore/hc-directs-indore-civic-body-to-come-up-with-waste-disposal-plan/story-Iyca0C02XYrcjV9zs1SZKN.html (accessed May 30, 2019).
72. —. Indore: Children reach out to CM for Devguradia residents. 14 March 2016. https://www.hindustantimes.com/indore/indore-children-reach-out-to-cm-for-devguradia-residents/story-azBL1PE1HXdK2m0OGD6ZgI.html (accessed May 30, 2019).
73. —. Waste management in Indore to get investment boost. 9 September 2015. https://www.hindustantimes.com/indore/waste-management-in-indore-to-get-investment-boost/story-aK6eRYazpfBuLM1OymHbdO.html (accessed May 30, 2019).
74. Iainehskhem Self-Help Group, Shillong. Waste Narratives. 28 February 2018. https://wastenarratives.com/2018/02/28/the-journey-of-shillongs-waste-pickers-to-become-compost-suppliers-to-meghalaya-raj-bhawan/ (accessed May 29, 2019).
75. India Today. Indore wins award for being cleanest city. 25 July 2019. https://www.indiatoday.in/safaigiri-awards/story/indore-wins-award-for-being-cleanest-city-1354281-2018-10-02 (accessed July 28, 2019).
76. Indore Blog. INDORE WILL BE THE FIRST CITY IN INDIA TO INCORPORATE INTELLIGENT SOLID WASTE MANAGEMENT SYSTEM. 21 September 2017. https://indorehd.com/indore-will-first-city-india-incorporate-intelligent-solid-waste-management-system/ (accessed May 30, 2019).
77. Indore Municipal Corporation . “Notice Inviting Tenders.” 21 October 2014. http://swachhbharaturban.gov.in/writereaddata/Door_to_Door_Collection_indore.pdf (accessed May 30, 2019).
78. Indore Municipal Corporation. Indore Municipal Corporation Solid Waste Management Bye Laws 2018. 2018. http://www.imcindore.org/webindore/files/swm.pdf (accessed April 28, 2019).
79. Inter ULB MOU Solid Waste Bandhwari MCG and MCF. Gurugram, Harayana, 29 June 2016.
80. Interview by Pinky Chandran and Sandya Narayanan. Interview at Wastepicker Colony at Vidyaranyapura (July 2018).
81. Jha, Prashant. Uttarakhand among worst states in terms of waste management’. 14 September 2018. https://timesofindia.indiatimes.com/city/dehradun/ukhand-among-worst-states-in-terms-of-waste-management/articleshow/65801394.cms (accessed May 10, 2019).
82. Joshi, Vidhi. Gurgaon: what life is like in the Indian city built by private companies. 4 July 2016. https://www.theguardian.com/sustainable-business/2016/jul/04/gurgaon-life-city-built-private-companies-india-intel-google (accessed May 20, 2019).
83. Jyrwa, Erbanoris. Extension The Third Dimesnsion of Higher Education. New Delhi: Concept Publishing Company, 2008.

237
84. Kalyan, Rohan. Neo Delhi and the Politics of Postcolonial Urbanism. London: Taylor & Francis Ltd, 2017.
85. Karki, Sanjay Singh. “Locals slam move to develop waste plant in Bandhwari.” DNA. 12 July 2017. https://www.dnaindia.com/india/report-locals-slam-move-to-develop-waste-plant-in-bandhwari-2499399 (accessed May 20, 2019).
86. Karnataka State Pollution Control Board. Annual Report 2015-16 on implementation of Solid Waste Management Rules, 2016, in the State of Karnataka. 2 February 2017. https://www.kspcb.gov.in/Annual%20Report%20for%20the%20Year%202015-2016-26092017.pdf (accessed May 1, 2019).
87. —. Annual report to be submitted by the State Pollution Control Board or Pollution Control Committee Committees to the Central Pollution Control Board for the year 2016-17 . 23 November 2017. https://www.kspcb.gov.in/Annual%20Report%20for%20the%20Year%202016-17-29112017.pdf (accessed May 1, 2019).
88. Kebbehundi, Ramesh S . Deccan Hearald. 18 March 2011. https://www.deccanherald.com/content/146947/city-shows-way-zero-waste.html (accessed May 1, 2019).
89. Kumar, Arun. Today’s Gurgaon is not the city I envisioned: KP Singh, Chairman, DLF Ltd. 4 January 2017. https://economictimes.indiatimes.com/opinion/interviews/todays-gurgaon-is-not-the-city-i-envisioned-kp-singh-chairman-dlf-ltd/articleshow/56321195.cms (accessed May 20, 2019).
90. Kumar, Ashok. “Gurgaon struggles with garbage disposal issue.” The Hindu. 8 June 2015. https://www.thehindu.com/news/cities/Delhi/gurgaon-struggles-with-garbage-disposal-issue/article7293067.ece (accessed May 20, 2019).
91. Kumar, K P Narayana, and Udit Misra. Gurgaon: How not to Build a City. 2 August 2012. http://www.forbesindia.com/article/real-issue/gurgaon-how-not-to-build-a-city/33444/1 (accessed May 20, 2019).
92. Kumar, R Krishna. The Hindu. 5 January 2019. https://www.thehindu.com/sci-tech/energy-and-environment/clean-sweep-how-does-mysuru-bag-the-cleanest-city-tag-year-after-year/article25919964.ece (accessed May 1, 2019).
93. M.S, Pankaja, and H.N Dr. Nagendra. “A Study of Planning Aspects of Mysore city With respect to Green Concept.” Quest Journals -Journal of Architecture and Civil Engineering, 2015.
94. Madhav, Roopa. “Untapped Potential: Securing Livelihoods dependent on Waste, which provides a detailed review of law and policy in India.” SWaCHCoop.com. January 2010. https://swachcoop.com/pdf/WPandLaw.pdf (accessed April 24, 2019).
95. Madhya Pradesh Gazette. Madhya Pradesh Nagariya Kshetro ke bhoomihin Vyakti (Pattadhruti Adhikaron Ka. 16 April 1984. http://www.mpurban.gov.in/pdf/pattaactenglish.pdf (accessed May 30, 2019).
96. Madhya Pradesh State Pollution Control Board. “Annual Report for the year 2O18-2O19 under Solid Waste Management 2016.” 27 July 2019. http://www.mppcb.mp.gov.in/proc/MSW-Yearly-Report-2018-19.pdf (accessed August 26, 2019).
97. Mander, Harsh, and V Manikandan. Darkness under Lamps:Urban Slums and Food Entitlements in India. C e ntre for Equity Studies, 2009.
238
98. Meghalaya State Pollution Control Board. “Meghalaya Government’s Status Report on directions issued by the NGT New Delhi, based on the order dated 16.01.2019 in O.A. NO. 606/2018, in the matter of compliance of the SWM Rules 2016.” 2019. http://megspcb.gov.in/Form/Compliance%20of%20Municipal%20Solid%20Waste%20Management%20Rules,%202016.pdf (accessed August 1, 2019).
99. MINIMUM WAGE IN CENTRAL SPHERE W.E.F APRIL 1, 2017. n.d. http://www.hrinfo.in/2017/03/minimum-wage-in-central-sphere-wef.html (accessed April 30, 2019).
100. Ministry of Housing and Urban Affairs, GoI. Empowering marginalized groups -Convergence between SBM and DAY-NULM. March 2018. http://mohua.gov.in/upload/uploadfiles/files/Final%20SBM%20NULM%20Convergence%20Guideline-ilovepdf-compressed.pdf (accessed April 24, 2019).
101. Ministry of Housing and Urban Affairs, Government of India. Swachh Survekshan 2019 Innovations and Best Practices. n.d. http://164.100.228.143:8080/sbm/content/writereaddata/SS2019%20Innovations%20Report_compressed.pdf (accessed August 26, 2019).
102. Ministry of Housing and Urban Poverty Alleviation, GoI. “Report of the Working Group on Migration.” January 2017. http://mohua.gov.in/upload/uploadfiles/files/1566.pdf (accessed May 12, 2019).
103. Ministry of Labour & Employment, GoI. Ministry of Labour & Employment. 1 October 2018. https://labour.gov.in/minimum-wages-central-sphere (accessed April 30, 2019).
104. Ministry of Urban Development, Government of India. “RANK OF CITIES ON SANITATION 2009-2010.” n.d. http://im.rediff.com/news/2010/may/rank-of-cities-on-sanitation-2009-2010.pdf (accessed May 29, 2019).
105. Mission, Swachh Bharat. “Draft Model Municipal Solid Waste ( Management & Handling), Cleanliness and Sanitation Rules /Bye-laws.” Ministry of Urban Development, GoI, September 2016.
106. —. Draft Model Municipal Solid Waste (Management & Handling), Cleanliness and Sanitation RULES / BYE-LAWS. September 2016. http://164.100.228.143:8080/sbm/content/writereaddata/Draft%20Sanitation%20Byelaws.pdf.
107. MoEF, Ministry of Environment and Forests. India Water Portal. 2011. https://www.indiawaterportal.org/sites/indiawaterportal.org/files/Plastic%20waste%20%28management%20and%20handling%29%20rules_Ministry%20of%20Environment%20and%20Forests_Government%20of%20India%20%282011%29.pdf (accessed April 24, 2019).
108. Municipal Corporation of Chandigarh. Solid Waste Management Byelaws 2018. 2018. http://mcchandigarh.gov.in/sites/default/files/Notification%20Final%20SWM%202018_0.pdf (accessed April 28, 2019).
109. Municipal Corporation Tirupati . Municipal Corporation Tirupati Solid Waste ( Management & Handling), Cleanliness Rules/ByeLaws 2018 . 2016. https://tirupati.cdma.ap.gov.in/sites/default/files/MCT%20Solid%20Waste%28%20Managment%20%26%20Handling%29%2C%20Cleaniness%2C%20Sanitaion%20Rules%202018_1.PDF (accessed April 28, 2019).
239
110. Mysore City Corporation. ““Detailed Project Report”, Integrated MSW Strategy for Mysore City under JNNURM Scheme, Mysore City, Corporation, Vol. 1 .” Mysore, 2007.
111. —. Mysore City Corporation. n.d. http://www.mysorecity.mrc.gov.in/en/Health%20Section (accessed May 5, 2019).
112. —. PRE-FEASIBILITY REPORT ESTABLISHING MUNICIPAL SOLID WASTE PROCESSING AND SCIENTIFIC DISPOSAL FACILITY FOR RAYANAKERE, MYSURU CITY . 20 May 2016. http://environmentclearance.nic.in/writereaddata/FormB/TOR/PFR/20_May_2016_120629190E94B9QJTprefeasibilityreportRayanakere.pdf (accessed May 1, 2019).
113. Mysore Urban Development Authority (MUDA). n.d. http://www.mysuru.uda.gov.in/sites/mysuru.uda.gov.in/files/pdf/About%20Us%20%28MUDA%20History%29.pdf (accessed May 1, 2019).
114. Narayan, Sanjoy . “Gurgaon is an example of how not to urbanise India.” Hindustan Times. 10 August 2015. https://www.hindustantimes.com/columns/gurgaon-is-an-example-of-how-not-to-urbanise-india/story-KqAcFBWI8jp62fCvKTEPwK.html (accessed May 20, 2019).
115. National Green Tribunal. “Revised Orderd Correct 31.08.18 In the matter of Compliance of Municipal Solid Waste Management Rules 2016.” National Green Tribunal, 31 August 2018.
116. National Institute of Urban Affairs. Peer Experience and Reflective Learning Compendium of Global Good Practices- Urban Solid Waste Management. 2015. http://citynet-ap.org/wp-content/uploads/2015/05/GP-GL3-SWM.pdf (accessed May 10, 2019).
117. Navi Mumbai Municipal Corporation . “Navi Mumbai Municipal Corporation Cleanliness and Sanitation Bye Laws 2017”. 2017. https://www.nmmc.gov.in/documents/10156/329bed68-c0f6-4a98-b1e7-0dabf47d4dd8 (accessed April 28, 2019).
118. NEP, National Environment Policy. “National Environment Policy.” Ministry of Environment and Forest/Centre for Environment Education ( CEE), 2006.
119. New Concept Information Systems for UNICEF. Case Study of NSPL, NIDAN, Bihar. 2012. http://nidan.in/nidanwp/Documents/UNICEF-SI-WATSAN-NSPL-NIDAN-CASE%20STUDY-final%20draft%202012.pdf (accessed May 12, 2019).
120. New Delhi Municipal Council. “The New Delhi Municipal Council Solid Waste Management Bye-Laws, 2017.” The New Delhi Municipal Council Solid Waste Management Bye-Laws, 2017. New Delhi: DELHI GAZETTE : EXTRAORDINARY, 15 January 2018.
121. Nidan. Nidan. n.d. http://nidan.in/nidanwp/nidan-swachdhara-private-limited-nspl/ (accessed May 10, 2019).
122. North Eastern Region Urban Development Programme ( NERUDP). “Gender Action Plan for Shillong: Solid Waste Management and Sewerage ( Based on ADB approved GAP and as agreed in Gender Workshop).” n.d. https://nerudp.nic.in/GAP/GAP_Shiilong.pdf (accessed May 29, 2019).

240
123. NSKFDC. Waste Narratives. 30 August 2016. https://wastenarratives.files.wordpress.com/2016/11/letter1.pdf (accessed April 25, 2019).
124. Pathways to Development. Formally Involving Waste Pickers Would Make Our Cities Cleaner. 16 November 2016. http://offprint.in/en/articles/formally-involving-waste-pickers-would-make-our-cities-cleaner (accessed May 10, 2019).
125. Patna Municipal Corporation. n.d. http://pmc.bihar.gov.in/subpagethree.aspx?id=9&cont=1 (accessed May 10, 2019).
126. PIB. Press Information Bureau. 15 February 2016. http://pib.nic.in/newsite/PrintRelease.aspx?relid=136427 (accessed April 24, 2019).
127. Press Information Bureau. Mysore tops Swachh Bharat rankings for 476 cities ; 4 cities from Karnataka in top 10 West Bengal does well with 25 cities in top 100 ; 39 cities from South in top 100;. 8 August 2015. https://pib.gov.in/newsite/PrintRelease.aspx?relid=124639 (accessed May 30, 2019).
128. Press Information Bureau, Government of India. Swachh Survekshan 2017 Rankings. 4 May 2017. https://pib.gov.in/newsite/PrintRelease.aspx?relid=161535 (accessed May 29, 2019).
129. PTI. Lack of waste management in Bihar can lead to emergency-like situation: NGT. 22 March 2019. https://www.businesstoday.in/pti-feed/lack-of-waste-management-in-bihar-can-lead-to-emergency-like-situation-ngt/story/330049.html (accessed May 10, 2019).
130. Pune Municipal Corporation. Pune Municipal Corporation Public Health and Sanitation Bye- Laws 2017. 2017. https://www.pmc.gov.in/sites/default/files/Ghankachara-Bye-laws.pdf (accessed April 28, 2019).
131. PWM Rules. “Plastic Waste Management Rules, 2016.” Ministry of Enviornment, Forest and Climate Change ( MoEF & CC), March 2016.
132. Ratna, Pragya. NGT Raps Gurgaon MC and Others For Improper Waste Disposal In Aravalli Hills. 2 March 2019. http://www.indialegallive.com/national-green-tribunal/ngt-raps-gurgaon-authorities-for-improper-management-of-solid-waste-in-aravali-forest-61426 (accessed May 20, 2019).
133. Roychowdhury, Anumita, and Shubhra Puri. Gurugram: A framework for Sustainable Development. New Delhi: Centre for Science and Environment, 2017.
134. Rumi, Faryal. Door-to-door trash collection from October. 21 September 2018. https://timesofindia.indiatimes.com/city/patna/door-to-door-trash-collection-from-october/articleshow/65891295.cms (accessed May 12, 2019).
135. —. Waste management firm’s contract terminated. 3 June 2018. https://timesofindia.indiatimes.com/city/patna/waste-management-firms-contract-terminated/articleshow/64432013.cms (accessed May 10, 2019).
136. Saahas, Gurugram. “Implementing Source Segregation of Waste in Residential Communities.” February 2019. https://www.coca-colaindia.com/content/dam/journey/in/en/private/packaging-and-recycling/making-source-segregation-possible-useful-insights-from-the-alag-karo-programme.pdf (accessed May 20, 2019).
137. Sarkar, Papiya. “SOLID WASTE MANAGEMENT IN DELHI – A SOCIAL VULNERABILITY STUDY.” Proceedings of the Third International Conference on

241
Environment and Health, Chennai, India, 15-17 December,2003. Chennai, 2003. 451 – 464.
138. SCGJ, Skill Council for Green Jobs. Model Curriculum Manager- Waste Management (Electives: Biomass Depot/Compost Yard/Dry Waste Center). April 2018. http://sscgj.in/wp-content/uploads/2019/03/SGJ_Q6501_Manager-Waste-Management.pdf (accessed April 25, 2019).
139. —. Model Curriculum Waste Picker. 25 April 2017. http://sscgj.in/wp-content/uploads/2019/03/SGJ_Q6103-Waste-Picker-Model-Curriculum-20.7.pdf (accessed April 25, 2019).
140. —. Qualifications Pack- Waste Picker. n.d. http://sscgj.in/wp-content/uploads/2019/03/SGJ_Q6103_Waste-Picker_v1.pdf (accessed April 25, 2019).
141. SCJG, Skill Council for Green Jobs. Model Curriculum Recyclable Waste Collector & Segregator. 2017. http://sscgj.in/wp-content/uploads/2019/03/SGJ_Q6101-Recyclable-waste-collector-segregator.pdf (accessed April 25, 2019).
142. —. QUALIFICATIONS PACK - OCCUPATIONAL STANDARDS FOR GREEN JOBS Recyclable Waste Collector &. n.d. http://sscgj.in/wp-content/uploads/2019/03/SGJ_Q6101_Recyclable-Waste-Collector-and-Segregator_v1.pdf (accessed April 25, 2019).
143. —. Qualifications Pack- Manager- Waste Management (Electives: Biomass Depot/Compost Yard/Dry Waste Center). n.d. http://sscgj.in/wp-content/uploads/2019/03/SGJ_Q6501_Manager-Waste_Management_Electives_Biomass-Depot_Compost-Yard_Dry_Waste_Center_v1_09-04-2018.pdf (accessed April 26, 2019).
144. Shantha, Sukanya. “Demolitions, Evictions and Toilets for Show: How Indore Won Swachh Bharat’s Top Rank.” The Wire. 2 October 2017. https://thewire.in/politics/indore-swachh-bharat-abhiyan (accessed May 12, 2019).
145. Shillong City Census 2011 data. n.d. https://www.census2011.co.in/census/city/187-shillong.html.
146. Shillong Municipal Board. Shillong Municipal Board. n.d. http://smb.gov.in/projects.html.
147. Singh, Shivani. “Gurgaon is doomed: How not to plan and build a city.” Hindustan Times. 1 August 2016. https://www.hindustantimes.com/columns/gurgaon-is-doomed-how-not-to-plan-and-build-a-city/story-FzJPuGu4JpDR0lAixLiO3N.html (accessed May 20, 2019).
148. Sinha, Arindam. Jusco bags Rs 66 crore Mysore MSW contract. 13 July 2010. https://www.financialexpress.com/archive/jusco-bags-rs-66-crore-mysore-msw-contract/645540/ (accessed May 5, 2019).
149. Smart City Indore. n.d. https://www.smartcityindore.org/solid-waste/ (accessed May 30, 2019).
150. SMS ENVOCARE LIMITED. Final Environment Impact Assessment Report Construction of 150 TPD Municipal Solid Waste Treatment Facility . February 2018. http://www.environmentclearance.nic.in/writereaddata/FormB/EC/EIA_EMP/05022018HAZUBP7BRayankere_EIAforuploading.pdf (accessed May 1, 2019).

242
151. SP News Agency. “Sanitary Landfill site inaugurated by Urban Affair minister at at Marten, Mawlai today.” 2017. https://spnewsagency.com/sanitary-landfill-site-inaugurated-by-urban-affair-minister-at-at-marten-mawlai-today/ (accessed May 29, 2019).
152. SS Report 2017. Swachh Survekshan. n.d. http://swachhsurvekshan2018.org/Images/SS_2017_Report.pdf (accessed April 24, 2019).
153. SS Report 2018. Swachh Survekshan 2018. n.d. http://swachhsurvekshan2018.org/Images/SS_2018_Report_Final.pdf (accessed April 24, 2019).
154. State Investment Program Management and Implementation Unit (SIPMIU),. “Initial Environmental Examination (Updated) IND: North-Eastern Region Capital Cities Development Investment Program (Tranche 2) –Shillong, Meghalaya Subproject.” Asian Development Bank. February 2015. https://www.adb.org/sites/default/files/project-document/157783/35290-033-iee-09.pdf (accessed May 29, 2019).
155. State Investment Programme Management & Implementation Unit (SIPMIU), NERCCDIP,Urban Affairs Department, Shillong, Meghalaya . “Social Monitoring Report IND: North Eastern Region Capital Cities Development Investment Program (NERCCDIP) – T1 & T2 (Meghalaya)Period: July 2016 – December 2016 .” Asian Development Bank. March 2017. https://www.adb.org/sites/default/files/project-documents/35290/35290-033-smr-20.pdf (accessed May 29, 2019).
156. State Investment Project Management andImplementation Unit (SIPMIU), Shillong. “Draft EIA Report: EIA, EMP & OBTAINING ENVIRONMENTALCLEARANCE FOR DEVELOPMENT OF NEW SANITARY LANDFILL SITE FOR MSW IN SHILLONG, MEGHALAYA.” Meghalaya State Pollution Control Board. 2012. http://megspcb.gov.in/Documents/SIPMIU%20Shillong%20Draft%20EIA%20Report%20AM%20110512.pdf (accessed May 29, 2019).
157. Supervisor, Indore Municipal Corporation – MSW Processing and Disposal Plant, interview by Sandya Narayanan and Pinky Chandran. Filed Visit to MSW Processing and Disposal Plant, Deoguradia, Indore (22 July 2018).
158. Supervisor, Transfer Station, I.T Park, Davv Takshila Parisar, Indore, interview by Sandya Narayanan and Pinky Chandran. Field Visit to Transfer Station (22 July 2018).
159. Surat Municipal Corporation. FINAL DRAFT PUBLIC HEALTH BYE-LAWS FOR THE SURAT MUNICIPAL CORPORATION OF GUJARAT STATE May 2016. 2016. http://suratmunicipalcorporation.org:8020/News/3926.pdf (accessed April 28, 2019).
160. Swachh Bharat Mission (Urban), Ministry of Housing and Urban Affairs, Government of India. Transforming urban landscapes of India: Success Stories in Solid Waste Management. 2018. http://164.100.228.143:8080/sbm/content/writereaddata/SBM%20Coffee%20Table%20Book_Final.pdf (accessed May 1, 2019).
161. Swachh Bharat Mission Indore Municipal Corporation (IMC). n.d. https://cdn.cseindia.org/docs/photogallery/slideshows/06_20171212_IMC-SWM-Final-Indore.pdf.
162. Swachh Bharat Mission. SWACHH SURVEKSHAN 2017 : A GUIDEBOOK FOR URBAN LOCAL BODIES. n.d. http://sac.ap.gov.in/sac/UserInterface/Downlaods/

243
IECMaterials/Swachh%20Survekshan%202017%20Guide%20Book_Final_1st%20July_2016.pdf (accessed April 24, 2019).
163. Swachh India. NDTV. Swachhindia.ndtv.com. 4 September 2017. https://swachhindia.ndtv.com/in-meghalayas-nongstoin-hundreds-of-school-students-are-bringing-in-a-swachh-revolution-9602/ (accessed May 29, 2019).
164. Swachh Survekshan 2018 , Survey Toolkit. Swachh Survekshan 2018. n.d. http://swachhsurvekshan2018.org/Images/Swachh%20Survekshan%202018%20Toolkit%20-%20English.pdf (accessed April 24, 2019).
165. Swachh Survekshan 2018: Never Mind The Previous Poor Rankings, Patna Hopes For Better Performance This Year. 9 January 2018. https://swachhindia.ndtv.com/swachh-survekshan-2018-never-mind-the-previous-poor-rankings-patna-hopes-for-better-performance-this-year-15513/ (accessed May 10, 2019).
166. Swachh Survekshan 2019. “SS Report 2019.” Ministry of Housing and Urban Affairs, GoI. n.d. http://164.100.228.143:8080/sbm/content/writereaddata/SS2019%20Final%20Report.pdf (accessed April 24, 2019).
167. Swachh Survekshan 2019, Survey Toolkit. Ministry of Housing and Urban Affairs. 2019. http://164.100.228.143:8080/sbm/content/writereaddata/Survekshan%20Survey%202019%20Toolkit%2013.09.2018.pdf (accessed April 24, 2019).
168. SwachhIndia.NDTV. Indore’s Swachh Turnaround: Recycling 50% Of Its Plastic Waste. 6 September 2017. https://swachhindia.ndtv.com/indores-swachh-turnaround-recycling-50-plastic-waste-6673/ (accessed May 30, 2019).
169. SWM Rules. “Solid Waste Management Rules.” Ministry of Environment Forest and Climate Change, GOI, 2016.
170. SWMRT, Solid Waste Management RoundTable. Waste Chronicles. 9 August 2018. https://wastechronicle.wordpress.com/2018/08/09/do-not-leave-out-waste-pickers-from-karnatakas-waste-management-bylaws/ (accessed April 26, 2019).
171. The Better India. Indore IAS Officer Clears 13 Lakh Tons of Garbage from 100 Acres in 6 Months! 14 January 2019. https://www.thebetterindia.com/169584/ias-hero-indore-garbage-management-recycling/ (accessed May 30, 2019).
172. The Greater Chennai Corporation. The Greater Chennai Corporation, Solid Waste Management Bye-Laws, 2016. 2016. http://www.chennaicorporation.gov.in/images/swm_bye_laws.pdf (accessed April 28, 2019).
173. “The Haryana Non-Biodegradable Garbage (Control) Act, 1998 .” 4 March 1998. https://hspcb.gov.in/content/NBGarbageACT1998.pdf (accessed May 22, 2019).
174. The Hindu. “Garbage won’t go to waste in Mysore.” 6 May 2011. https://www.thehindu.com/incoming/garbage-wont-go-to-waste-in-mysore/article1994254.ece (accessed May 6, 2019).
175. The Indian Express. Here is how Indore became the cleanest city in India. 4 May 2017. https://indianexpress.com/article/india/heres-is-how-indore-became-the-cleanest-city-in-india-4640509/ (accessed May 30, 2019).
176. —. Inside India’s cleanest city, Indore. 7 April 2019. https://indianexpress.com/article/india/indore-indias-cleanest-city-swachh-bharat-mission-5662774/ (accessed May 30, 2019).
244
177. The Pioneer. Biodegradable waste disposal now mandatory in Haryana. 13 September 2015. https://www.dailypioneer.com/2015/state-editions/biodegradable-waste-disposal-now-mandatory-in-haryana.html (accessed May 22, 2019).
178. The Shillong Times. Dirty Shillong’s Swachh Rankings Drops to 276. 5 May 2017. http://theshillongtimes.com/2017/05/05/dirty-shillongs-swachh-ranking-drops-to-276/ (accessed May 29, 2019).
179. —. Helping Themselves Survive. 3 March 2019. http://theshillongtimes.com/2019/03/03/helping-themselves-survive/ (accessed May 29, 2019).
180. —. “Waste Managers.” 23 November 2014. http://theshillongtimes.com/2014/11/23/waste-managers/ (accessed May 29, 2019).
181. “The Smart City Challenge Stage 2.” n.d. http://smartcities.gov.in/upload/uploadfiles/files/SmartCityPlan_Patna.pdf.
182. The Waste Experts: Enabling Conditions for Informal Sector Integration in Solid Waste Management Lessons learned from Brazil, Egypt and India. Eschborn / Deutschland: Deutsche Gesellschaft für Technische Zusammenarbeit (GTZ) GmbH, 2008.
183. Times of India . ITC to be in charge of dry waste management in Mysuru for three years. 22 March 2018. https://timesofindia.indiatimes.com/city/mysuru/itc-to-be-in-charge-of-dry-waste-management-in-mysuru-for-three-years/articleshow/63404036.cms (accessed May 6, 2019).
184. Times of India Indore. Pattas allotted to only 244 people in CP Shekhar Nagar. 6 February 2018. https://timesofindia.indiatimes.com/city/indore/pattas-allotted-to-only-244-people-in-cp-shekhar-nagar/articleshow/62799439.cms (accessed May 30, 2019).
185. Times of India. “Patna’s garbage dumping site to become fully functional from Monday’ .” Times of India. 21 October 2016. https://timesofindia.indiatimes.com/city/patna/Citys-garbage-dumping-site-to-become-fully-functional-from-Monday/articleshow/54985805.cms (accessed May 10, 2019).
186. —. Ragpickers to collect garbage before city’s Swachh rating . 8 December 2018. https://timesofindia.indiatimes.com/city/gurgaon/ragpickers-to-collect-garbage-before-citys-swachh-rating/articleshow/66994751.cms?utm_source=contentofinterest&utm_medium=text&utm_campaign=cppst (accessed May 24, 2019).
187. Times of India, Indore. A2Z Company is given contract by Indore Municipal Corporation (IMC) for collection and disposal ofmunicipal solid waste in the city. Company is accused of burninggarbage in open at trenching ground at Devguraria against the direction of High Court. 20 May 2012. https://timesofindia.indiatimes.com/A2Z-Company-is-given-contract-by-Indore-Municipal-Corporation-IMC-for-collection-and-disposal-of-municipal-solid-waste-in-the-city-Company-is-accused-of-burning-garbage-in-open-at-trenching-ground-at-Devguraria-against- (accessed May 30, 2019).
188. —. Garbage disposal: Minister rues contract to A2Z, for snap decision. 19 March 2015. https://timesofindia.indiatimes.com/city/indore/Garbage-disposal-Minister-

245
rues-contract-to-A2Z-for-snap-decision/articleshow/46623335.cms (accessed May 30, 2019).
189. —. IMC in action mode to curb trenching ground fire. 30 April 2015. https://timesofindia.indiatimes.com/city/indore/IMC-in-action-mode-to-curb-trenching-ground-fire/articleshow/47111522.cms (accessed May 30, 2019).
190. —. “Notice for Indore municipal corporation over solid waste management.” 23 October 2015. https://timesofindia.indiatimes.com/city/indore/Notice-for-Indore-municipal-corporation-over-solid-waste-management/articleshow/49501212.cms (accessed May 30, 2019).
191. —. Residents near trenching ground finally get fresh air to bre .. 18 January 2017. https://timesofindia.indiatimes.com/city/indore/residents-near-trenching-ground-finally-get-fresh-air-to-breathe/articleshow/56640354.cms (accessed May 30, 2019).
192. Tribune India. A glimmer of hope for wasteful Gurugram. 16 March 2019. https://www.tribuneindia.com/news/weekly-pullouts/haryana-tribune/a-glimmer-of-hope-for-wasteful-gurugram/743986.html (accessed May 24, 2019).
193. Tripathi, Piyush Kumar. Waste trashes green norms. 27 March 2012. https://www.telegraphindia.com/states/bihar/waste-trashes-green-norms/cid/437611 (accessed May 10, 2019).
194. Tripathy, Upendra . “A 21st Century Vision on Waste to Energy in India: A Win-Win Strategy for Energy Security and Swachh Bharat Mission (CleanIndia Mission).” 10 May 2018. http://www.uncrd.or.jp/content/documents/6717FINAL-Background%20paper_Tripathy.pdf (accessed May 5, 2019).
195. UDD, GoK. Proceedings of the State Level Advisory Board Meeting held on 2/2/2019 under the Chairmanship of Principal Secretary UDD, GoK at Room no 317 Vikasa Soudha, Bangalore. Bangalore, Karnataka, 2 Februray 2019.
196. Urban Affairs Department, Government of Meghalaya. “Guidelines for Solid Waste Management and cleanliness in Shillong city.” 9 12 2016. http://meghalaya.gov.in/megcms/sites/default/files/circulars/final%20copy%202%20SWM_guidelines.pdf (accessed May 29, 2019).
197. Urban Development & Muncipal Affairs Department, Government of West Bengal. 10. State Policy and Strategy on Solid Waste Management for Urban Areas of West Bengal. n.d. https://www.google.com/search?q=West+Bengal+policy+on+Waste+Management&oq=We st+Bengal+policy+on+Waste+Management&aqs= chrome..69i57.12558j0j8&sourceid=chrome&ie=UTF-8 (accessed May 10, 2019).
198. Urban Development and Housing Department, Government of Bihar . “Draft Comprehensive Solid Waste Management Policy and Strategy for Urban Local Bodies of Bihar.” 4 October 2018. http://urban.bih.nic.in/Acts/AR-01-04-10-2018.pdf (accessed May 7, 2019).
199. Urban Development Directorate Dehradun. Urban Municipal Solid Waste Management Action Plan for the State of Uttrakhand . August 2017. http://udd.uk.gov.in/files/20170825_SWM_action_plan__revised_final_draft_with_comments_sent_to_state-_August_II.pdf (accessed May 10, 2019).
200. Waste Narratives. Indore Municipal Corporation Issues Occupational Identity Cards to Wastepickers. 17 December 2016. https://wastenarratives.

246
com/2016/12/15/indore-municipal-corporation-issues-occupational-identity-cards-to-wastepickers/ (accessed May 30, 2019).
201. Waste Narratives, Stories of Waste and Waste Workers . India’s cleanest city Indore evicting waste-pickers from work. 9 December 2018. https://wastenarratives.com/2018/12/09/indias-cleanest-city-indore-evicting-waste-pickers-from-work/ (accessed May 30, 2019).
202. Wastepickers, interview by Pinky Chandran and Sandya Narayanan. Interview with wastepickers who collect hair in Mysuru (July 2018).
203. Youth for Unity and Voluntary Action. “Unequal Realities: Forced Evictions in Five Indian Cities (2016). City Say.” 2017. http://yuvaindia.org/wp-content/uploads/2017/03/Eviction-Report-2016.pdf (accessed May 12, 2019).
204. YUVA ( Youth for Unity and Voluntary Action). Unequal Realities: Forced Evictions in Five Indian Cities - City Say. Mumbai, India: YUVA ( Youth for Unity and Voluntary Action), 2016.
205. ZWM MYSORE PPT, CSEINDIA. 2017. https://cdn.cseindia.org/userfiles/ZWM_MYSORE.pdf (accessed May 4, 2019).

247
Note on the Authors and Organisation
Pinky Chandran has over two decades of experience spanning careers across international education, research, training, community mobilization, waste management, livelihood development, policy advocacy, communication and strategy, and community media. Pinky is an active campaigner for decentralized community based waste management and is a founder member of the Solid Waste Management Roundtable, (SWMRT) Bengaluru, since 2009
Sandya Narayanan, was a stock broker by profession and is now an environmental activist. She has been part of the founding member team of Solid Waste Management Roundtable (SWMRT) Bengaluru since 2009 and was a facilitator for the My Clean Malleswaram – Smart Swachh Malleswaram ( 2013-2016) and has been a member of several city and state expert advisory committees.
Dr. Umashankar Subramanian is Public Health Informatics Specialists with over 16 years of experience in clinical and public health. He is currently working as the Principal of Padamshree School of Public Health. He is also an Adjunct Faculty at Texila American University and Texila International University, Guyana, South America. He is also a member of SWMRT.
Solid Waste Management Roundtable (SWMRT) Bengaluru is a public interest collective of SWM practitioners working of decentralised, sustainable and inclusive waste management. Launched in 2009, the group’s main goal is the adoption of sustainable waste management practices by citizens and municipalities, for improving public health, safe food , clean air and water and inclusive livelihoods.


249
Annexure 1: Tables
Type of Waste picker
City
Free Roaming/Indepen-dentLocal
Free Roaming Migrant
Itinerant Buyer
Waste Sorter
Door-to-Door Collector
Other informal worker
Benga-
luru
Count 92 29 0 17 33 0
% within
City
52.9 16.7 .0 9.8 19.0 0
% within
type of
waste
picker
7.4 46.8 .0 12.1 9.3 .0
% of
Total
4.9 1.6 .0 .9 1.8 .0
Bhopal Count 54 8 0 4 30 4
% within
City
52.9 7.8 .0 3.9 29.4 3.9
% within
type of
waste
picker
4.4 12.9 .0 2.9 8.5 33.3
% of
Total
2.9 .4 .0 .2 1.6 .2
Chamraj
nagar
Count 2 0 1 0 0 0
% within
City
66.7 .0 33.3 .0 .0 .0
% within
type of
waste
picker
.2 .0 8.3 .0 .0 .0
% of
Total
.1 .0 .1 .0 .0 .0
Table 3.1.2 City wise distribution of respondents and type of waste pickers

250
Delhi Count 43 0 1 7 152 3
% within
City
18.9 .0 .4 3.1 66.7 1.3
% within
type of
waste
picker
3.5 .0 8.3 5.0 43.1 25.0
% of
Total
2.3 .0 .1 .4 8.1 .2
Guntur Count 240 1 0 19 6 2
% within
City
89.2 .4 .0 7.1 2.2 .7
% within
type of
waste
picker
19.4 1.6 .0 13.6 1.7 16.7
% of
Total
12.8 .1 .0 1.0 .3 .1
Indore Count 86 8 1 15 1 2
% within
City
75.4 7.0 .9 13.2 .9 1.8
% within
type of
waste
picker
7.0 12.9 8.3 10.7 .3 16.7
% of
Total
4.6 .4 .1 .8 .1 .1
Mumbai Count 120 3 1 0 1 0
% within
City
80.5 2.0 .7 .0 .7 .0
% within
type of
waste
picker
9.7 4.8 8.3 .0 .3 .0
% of
Total
6.4 .2 .1 .0 .1 .0
Mysore Count 131 4 6 6 2 0
% within
City
87.9 2.7 4.0 4.0 1.3 .0
% within
type of
waste
picker
10.6 6.5 50.0 4.3 .6 .0
% of
Total
7.0 .2 .3 .3 .1 .0

251
Nashik Count 105 0 0 0 1 0
% within
City
99.1 .0 .0 .0 .9 .0
% within
type of
waste
picker
8.5 .0 .0 .0 .3 .0
% of
Total
5.6 .0 .0 .0 .1 .0
Navi
Mumbai
Count 7 0 0 0 0 0
% within
City
100.0 .0 .0 .0 .0 .0
% within
type of
waste
picker
.6 .0 .0 .0 .0 .0
% of
Total
.4 .0 .0 .0 .0 .0
Pune Count 0 0 0 1 120 0
% within
City
.0 .0 .0 .8 98.4 .0
% within
type of
waste
picker
.0 .0 .0 .7 34.0 .0
% of
Total
.0 .0 .0 .1 6.4 .0
Shillong Count 32 0 0 28 0 0
% within
City
53.3 .0 .0 46.7 .0 .0
% within
type of
waste
picker
2.6 .0 .0 20.0 .0 .0
% of
Total
1.7 .0 .0 1.5 .0 .0
Tenali Count 20 5 0 5 1 1
% within
City
62.5 15.6 .0 15.6 3.1 3.1
% within
type of
waste
picker
1.6 8.1 .0 3.6 .3 8.3
% of
Total
1.1 .3 .0 .3 .1 .1

252
Thane Count 57 0 0 8 0 0
% within
City
87.7 .0 .0 12.3 .0 .0
% within
type of
waste
picker
4.6 .0 .0 5.7 .0 .0
% of
Total
3.0 .0 .0 .4 .0 .0
Tumkur Count 28 1 2 0 0 0
% within
City
90.3 3.2 6.5 .0 .0 .0
% within
type of
waste
picker
2.3 1.6 16.7 .0 .0 .0
% of
Total
1.5 .1 .1 .0 .0 .0
Kalyan Count 30 1 0 28 0 0
% within
City
50.8 1.7 .0 47.5 .0 .0
% within
type of
waste
picker
2.4 1.6 .0 20.0 .0 .0
% of
Total
1.6 .1 .0 1.5 .0 .0
Balaghat Count 48 2 0 2 1 0
% within
City
90.6 3.8 .0 3.8 1.9 .0
% within
type of
waste
picker
3.9 3.2 .0 1.4 .3 .0
% of
Total
2.6 .1 .0 .1 .1 .0
Jaipur Count 91 0 0 0 5 0
% within
City
94.8 .0 .0 .0 5.2 .0
% within
type of
waste
picker
7.4 .0 .0 .0 1.4 .0
% of
Total
4.9 .0 .0 .0 .3 .0

253
Yawatmal Count 25 0 0 0 0 0
% within
City
100.0 .0 .0 .0 .0 .0
% within
type of
waste
picker
2.0 .0 .0 .0 .0 .0
% of
Total
1.3 .0 .0 .0 .0 .0
Wardha Count 25 0 0 0 0 0
% within
City
100.0 .0 .0 .0 .0 .0
% within
type of
waste
picker
2.0 .0 .0 .0 .0 .0
% of
Total
1.3 .0 .0 .0 .0 .0
Total Count 1236 62 12 140 353 12
% within
City
66.1 3.3 .6 7.5 18.9 .6
% within
type of
waste
picker
100.0 100.0 100.0 100.0 100.0 100.0
% of
Total
66.1 3.3 .6 7.5 18.9 .6
Table : City wise distribution of respondents an age group in years
Age Group in years
City Upto 20
21 to 30
31 to 40
41 to 50
51 to 60
61 to 70
71 and above
Total
Bengal-
uru
Count 12 68 56 24 12 1 1 174
% within
City
6.9 39.1 32.2 13.8 6.9 0.6 0.6 100.0
% within
Age
Group
9.0 11.4 10.2 7.2 6.4 1.8 11.1 9.3
% of
Total
0.6 3.6 3.0 1.3 0.6 0.1 0.1 9.3
Bhopal Count 13 37 21 22 5 2 2 102
% within
City
12.7 36.3 20.6 21.6 4.9 2.0 2.0 100.0

254
% within
Age
Group
9.8 6.2 3.8 6.6 2.7 3.5 22.2 5.5
% of
Total
0.7 2.0 1.1 1.2 0.3 0.1 0.1 5.5
Chamraj
nagar
Count 0 2 0 1 0 0 0 3
% within
City
0.0 66.7 0.0 33.3 0.0 0.0 0.0 100.0
% within
Age
Group
0.0 0.3 0.0 0.3 0.0 0.0 0.0 0.2
% of
Total
0.0 0.1 0.0 0.1 0.0 0.0 0.0 0.2
Delhi Count 27 93 82 17 9 0 0 228
% within
City
11.8 40.8 36.0 7.5 3.9 0.0 0.0 100.0
% within
Age
Group
20.3 15.6 14.9 5.1 4.8 0.0 0.0 12.2
% of
Total
1.4 5.0 4.4 0.9 0.5 0.0 0.0 12.2
Guntur Count 30 109 78 29 16 6 1 269
% within
City
11.2 40.5 29.0 10.8 5.9 2.2 0.4 100.0
% within
Age
Group
22.6 18.2 14.2 8.7 8.5 10.5 11.1 14.4
% of
Total
1.6 5.8 4.2 1.6 0.9 0.3 0.1 14.4
Indore Count 5 19 36 33 15 6 0 114
% within
City
4.4 16.7 31.6 28.9 13.2 5.3 0.0 100.0
% within
Age
Group
3.8 3.2 6.6 9.9 8.0 10.5 0.0 6.1
% of
Total
0.3 1.0 1.9 1.8 0.8 0.3 0.0 6.1
Mumbai Count 7 12 41 55 26 7 1 149
% within
City
4.7 8.1 27.5 36.9 17.4 4.7 0.7 100.0
% within
Age
Group
5.3 2.0 7.5 16.4 13.8 12.3 11.1 8.0
% of
Total
0.4 0.6 2.2 2.9 1.4 0.4 0.1 8.0

255
Mysore Count 2 35 42 33 21 13 3 149
% within
City
1.3 23.5 28.2 22.1 14.1 8.7 2.0 100.0
% within
Age
Group
1.5 5.9 7.7 9.9 11.2 22.8 33.3 8.0
% of
Total
0.1 1.9 2.2 1.8 1.1 0.7 0.2 8.0
Nashik Count 0 31 30 27 13 4 1 106
% within
City
0.0 29.2 28.3 25.5 12.3 3.8 0.9 100.0
% within
Age
Group
0.0 5.2 5.5 8.1 6.9 7.0 11.1 5.7
% of
Total
0.0 1.7 1.6 1.4 0.7 0.2 0.1 5.7
Navi
Mumbai
Count 1 2 3 0 1 0 0 7
% within
City
14.3 28.6 42.9 0.0 14.3 0.0 0.0 100.0
% within
Age
Group
0.8 0.3 0.5 0.0 0.5 0.0 0.0 0.4
% of
Total
0.1 0.1 0.2 0.0 0.1 0.0 0.0 0.4
Pune Count 0 28 40 27 23 4 0 122
% within
City
0.0 23.0 32.8 22.1 18.9 3.3 0.0 100.0
% within
Age
Group
0.0 4.7 7.3 8.1 12.2 7.0 0.0 6.5
% of
Total
0.0 1.5 2.1 1.4 1.2 0.2 0.0 6.5
Shillong Count 0 13 17 23 6 1 0 60
% within
City
0.0 21.7 28.3 38.3 10.0 1.7 0.0 100.0
% within
Age
Group
0.0 2.2 3.1 6.9 3.2 1.8 0.0 3.2
% of
Total
0.0 0.7 0.9 1.2 0.3 0.1 0.0 3.2
Tenali Count 1 12 4 4 9 2 0 32
% within
City
3.1 37.5 12.5 12.5 28.1 6.3 0.0 100.0
% within
Age
Group
0.8 2.0 0.7 1.2 4.8 3.5 0.0 1.7

256
% of
Total
0.1 0.6 0.2 0.2 0.5 0.1 0.0 1.7
Thane Count 0 10 26 16 12 1 0 65
% within
City
0.0 15.4 40.0 24.6 18.5 1.5 0.0 100.0
% within
Age
Group
0.0 1.7 4.7 4.8 6.4 1.8 0.0 3.5
% of
Total
0.0 0.5 1.4 0.9 0.6 0.1 0.0 3.5
Tumkur Count 2 12 10 4 3 0 0 31
% within
City
6.5 38.7 32.3 12.9 9.7 0.0 0.0 100.0
% within
Age
Group
1.5 2.0 1.8 1.2 1.6 0.0 0.0 1.7
% of
Total
0.1 0.6 0.5 0.2 0.2 0.0 0.0 1.7
Kalyan Count 3 28 16 7 3 2 0 59
% within
City
5.1 47.5 27.1 11.9 5.1 3.4 0.0 100.0
% within
Age
Group
2.3 4.7 2.9 2.1 1.6 3.5 0.0 3.2
% of
Total
0.2 1.5 0.9 0.4 0.2 0.1 0.0 3.2
Balaghat Count 7 29 15 2 0 0 0 53
% within
City
13.2 54.7 28.3 3.8 0.0 0.0 0.0 100.0
% within
Age
Group
5.3 4.8 2.7 0.6 0.0 0.0 0.0 2.8
% of
Total
0.4 1.6 0.8 0.1 0.0 0.0 0.0 2.8
Jaipur Count 19 39 18 7 8 5 0 96
% within
City
19.8 40.6 18.8 7.3 8.3 5.2 0.0 100.0
% within
Age
Group
14.3 6.5 3.3 2.1 4.3 8.8 0.0 5.1
% of
Total
1.0 2.1 1.0 0.4 0.4 0.3 0.0 5.1

257
Yawa-
tmal
Count 3 9 5 2 4 2 0 25
% within
City
12.0 36.0 20.0 8.0 16.0 8.0 0.0 100.0
% within
Age
Group
2.3 1.5 0.9 0.6 2.1 3.5 0.0 1.3
% of
Total
0.2 0.5 0.3 0.1 0.2 0.1 0.0 1.3
Wardha Count 1 10 9 2 2 1 0 25
% within
City
4.0 40.0 36.0 8.0 8.0 4.0 0.0 100.0
% within
Age
Group
0.8 1.7 1.6 0.6 1.1 1.8 0.0 1.3
% of
Total
0.1 0.5 0.5 0.1 0.1 0.1 0.0 1.3
Total Count 133 598 549 335 188 57 9 1869
% within
City
7.1 32.0 29.4 17.9 10.1 3.0 0.5 100.0
% within
Age
Group
100.0 100.0 100.0 100.0 100.0 100.0 100.0 100.0
% of
Total
7.1 32.0 29.4 17.9 10.1 3.0 0.5 100.0
Table 3.1.5 Age distribution and waste picker
Age Group in years
City Upto 20
21 to 30
31 to 40
41 to 50
51 to 60
61 to 70
71 and above
Total
Free
Roaming
Indepe-
ndent
Local
Count 88 381 351 237 125 46 8 1236
% within
type of
waste
picker
7.1 30.8 28.4 19.2 10.1 3.7 .6 100.0
% within
Age
Group
66.2 63.7 63.9 70.7 66.5 80.7 88.9 66.1
% of
Total
4.7 20.4 18.8 12.7 6.7 2.5 .4 66.1
Free
Roaming
Indepe-
ndent
Migrant
Count 7 22 18 9 5 1 0 62
% within
type of
waste
picker
11.3 35.5 29.0 14.5 8.1 1.6 .0 100.0

258
% within
Age
Group
5.3 3.7 3.3 2.7 2.7 1.8 .0 3.3
% of
Total
.4 1.2 1.0 .5 .3 .1 .0 3.3
Itinerant
Buyer
Count 0 3 4 4 1 0 0 12
% within
type of
waste
picker
.0 25.0 33.3 33.3 8.3 .0 .0 100.0
% within
Age
Group
.0 .5 .7 1.2 .5 .0 .0 .6
% of
Total
.0 .2 .2 .2 .1 .0 .0 .6
Waste
Sorter
Count 10 54 38 18 15 5 0 140
% within
type of
waste
picker
7.1 38.6 27.1 12.9 10.7 3.6 .0 100.0
% within
Age
Group
7.5 9.0 6.9 5.4 8.0 8.8 .0 7.5
% of
Total
.5 2.9 2.0 1.0 .8 .3 .0 7.5
Door-
to-Door
Collector
Count 25 118 113 57 35 5 0 353
% within
type of
waste
picker
7.1 33.4 32.0 16.1 9.9 1.4 .0 100.0
% within
Age
Group
18.8 19.7 20.6 17.0 18.6 8.8 .0 18.9
% of
Total
1.3 6.3 6.0 3.0 1.9 .3 .0 18.9
Other
informal
worker
Count 0 3 4 3 2 0 0 12
% within
type of
waste
picker
.0 25.0 33.3 25.0 16.7 .0 .0 100.0
% within
Age
Group
.0 .5 .7 .9 1.1 .0 .0 .6
% of
Total
.0 .2 .2 .2 .1 .0 .0 .6
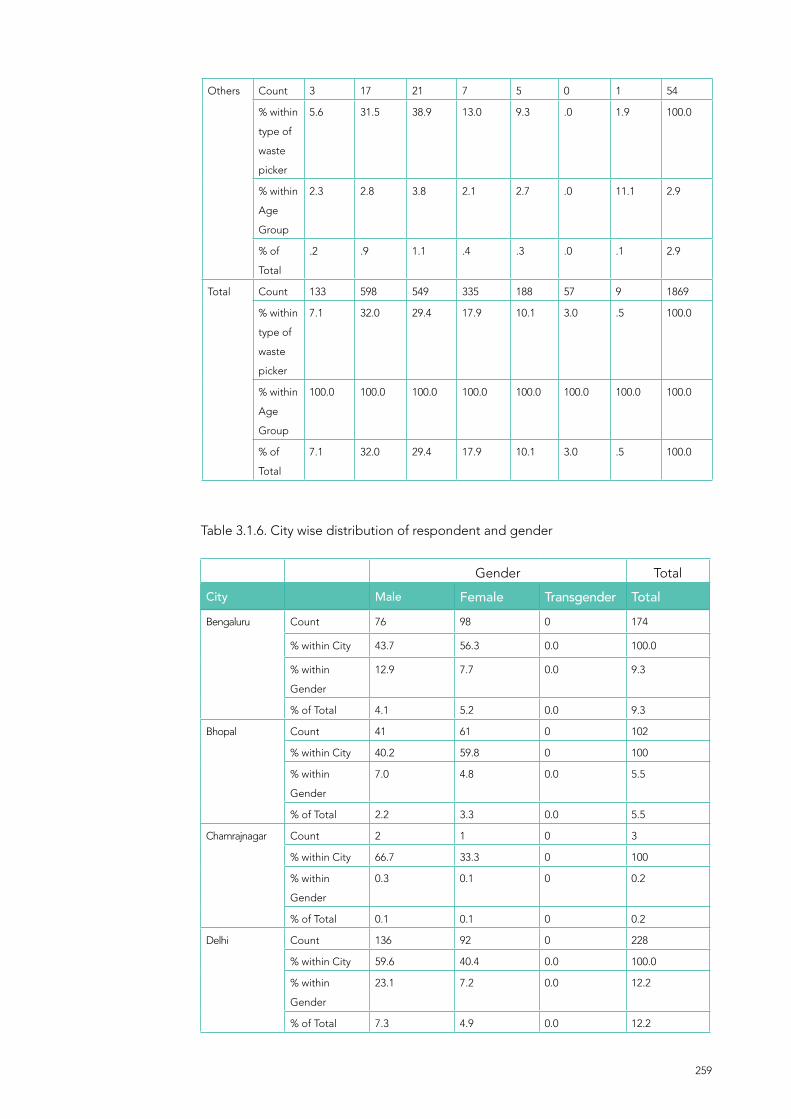
259
Others Count 3 17 21 7 5 0 1 54
% within
type of
waste
picker
5.6 31.5 38.9 13.0 9.3 .0 1.9 100.0
% within
Age
Group
2.3 2.8 3.8 2.1 2.7 .0 11.1 2.9
% of
Total
.2 .9 1.1 .4 .3 .0 .1 2.9
Total Count 133 598 549 335 188 57 9 1869
% within
type of
waste
picker
7.1 32.0 29.4 17.9 10.1 3.0 .5 100.0
% within
Age
Group
100.0 100.0 100.0 100.0 100.0 100.0 100.0 100.0
% of
Total
7.1 32.0 29.4 17.9 10.1 3.0 .5 100.0
Table 3.1.6. City wise distribution of respondent and gender
Gender Total
City Male Female Transgender Total
Bengaluru Count 76 98 0 174
% within City 43.7 56.3 0.0 100.0
% within
Gender
12.9 7.7 0.0 9.3
% of Total 4.1 5.2 0.0 9.3
Bhopal Count 41 61 0 102
% within City 40.2 59.8 0 100
% within
Gender
7.0 4.8 0.0 5.5
% of Total 2.2 3.3 0.0 5.5
Chamrajnagar Count 2 1 0 3
% within City 66.7 33.3 0 100
% within
Gender
0.3 0.1 0 0.2
% of Total 0.1 0.1 0 0.2
Delhi Count 136 92 0 228
% within City 59.6 40.4 0.0 100.0
% within
Gender
23.1 7.2 0.0 12.2
% of Total 7.3 4.9 0.0 12.2

260
Guntur Count 93 176 0 269
% within City 34.6 65.4 0.0 100.0
% within
Gender
15.8 13.8 0.0 14.4
% of Total 5.0 9.4 0.0 14.4
Indore Count 27 87 0 114
% within City 23.7 76.3 0.0 100.0
% within
Gender
4.6 6.8 0.0 6.1
% of Total 1.4 4.7 0.0 6.1
Mumbai Count 7 141 1 149
% within City 4.7 94.6 0.7 100.0
% within
Gender
1.2 11.0 100.0 8.0
% of Total 0.4 7.5 0.1 8.0
Mysore Count 45 104 0 149
% within City 30.2 69.8 0.0 100.0
% within
Gender
7.7 8.1 0.0 8.0
% of Total 2.4 5.6 0.0 8.0
Nashik Count 2 104 0 106
% within City 1.9 98.1 0.0 100.0
% within
Gender
0.3 8.1 0.0 5.7
% of Total 0.1 5.6 0.0 5.7
Navi Mumbai Count 0 7 0 7
% within City 0.0 100.0 0.0 100.0
% within
Gender
0.0 0.5 0.0 0.4
% of Total 0.0 0.4 0.0 0.4
Pune Count 48 74 0 122
% within City 39.3 60.7 0.0 100.0
% within
Gender
8.2 5.8 0.0 6.5
% of Total 2.6 4.0 0.0 6.5
Shillong Count 0 60 0 60
% within City 0.0 100.0 0.0 100.0
% within
Gender
0.0 4.7 0.0 3.2
% of Total 0.0 3.2 0.0 3.2
Tenali Count 11 21 0 32
% within City 34.4 65.6 0.0 100.0
% within
Gender
1.9 1.6 0.0 1.7
% of Total 0.6 1.1 0.0 1.7

261
Thane Count 2 63 0 65
% within City 3.1 96.9 0.0 100.0
% within
Gender
0.3 4.9 0.0 3.5
% of Total 0.1 3.4 0.0 3.5
Tumkur Count 3 28 0 31
% within City 9.7 90.3 0.0 100.0
% within
Gender
0.5 2.2 0.0 1.7
% of Total 0.2 1.5 0.0 1.7
Kalyan Count 15 44 0 59
% within City 25.4 74.6 0.0 100.0
% within
Gender
2.6 3.4 0.0 3.2
% of Total 0.8 2.4 0.0 3.2
Balaghat Count 30 23 0 53
% within City 56.6 43.4 0.0 100.0
% within
Gender
5.1 1.8 0.0 2.8
% of Total 1.6 1.2 0.0 2.8
Jaipur Count 50 46 0 96
% within City 52.1 47.9 0.0 100.0
% within
Gender
8.5 3.6 0.0 5.1
% of Total 2.7 2.5 0.0 5.1
Yawatmal Count 0 25 0 25
% within City 0 100 0 100
% within
Gender
0 2.0 0.0 1.3
% of Total 0 1.3 0.0 1.3
Wardha Count 0 25 0 25
% within City 0 100 0 100
% within
Gender
0.0 2.0 0.0 1.3
% of Total 0.0 1.3 0.0 1.3
Total Count 588 1280 1 1869
% within City 31.5 68.5 0.1 100.0
% within
Gender
100.0 100.0 100.0 100.0
% of Total 31.5 68.5 0.1 100.0

262
Table 3.1.7 Distribution of respondents according to waste picker and gender
Gender Total
Male Female Transgender
Free Roaming
/Independent
local
Count 302 933 1 1236
% within type
of waste picker
24.4 75.5 .1 100.0
% within
Gender
51.4 72.9 100.0 66.1
% of Total 16.2 49.9 .1 66.1
Free Roaming
Migrant
Count 35 27 0 62
% within type
of waste picker
56.5 43.5 .0 100.0
% within
Gender
6.0 2.1 .0 3.3
% of Total 1.9 1.4 .0 3.3
Itinerant Buyer Count 8 4 0 12
% within type
of waste picker
66.7 33.3 .0 100.0
% within
Gender
1.4 .3 .0 .6
% of Total .4 .2 .0 .6
Waste Sorter Count 45 95 0 140
% within type
of waste picker
32.1 67.9 .0 100.0
% within
Gender
7.7 7.4 .0 7.5
% of Total 2.4 5.1 .0 7.5
Door-to-Door
Collector
Count 177 176 0 353
% within type
of waste picker
50.1 49.9 .0 100.0
% within
Gender
30.1 13.8 .0 18.9
% of Total 9.5 9.4 .0 18.9
Other informal
worker
Count 5 7 0 12
% within type
of waste picker
41.7 58.3 .0 100.0
% within
Gender
.9 .5 .0 .6
% of Total .3 .4 .0 .6
Others Count 16 38 0 54
% within type
of waste picker
29.6 70.4 .0 100.0
% within
Gender
2.7 3.0 .0 2.9
% of Total .9 2.0 .0 2.9

263
Total Count 588 1280 1 1869
% within type
of waste picker
31.5 68.5 .1 100.0
% within
Gender
100.0 100.0 100.0 100.0
% of Total 31.5 68.5 .1 100.0
Table 3.1.8 City wise distribution of respondents and social group
Social Group Total
City Backward Caste
GeneralScheduled Caste
ScheduledTribe
Balaghat Count 1 0 26 26 53
% within City 1.90 0.00 49.10 49.10 100.00
% within
Social Group
0.50 0.00 2.60 5.00 2.80
% of Total 0.10 0.00 1.40 1.40 2.80
Bengaluru Count 18 55 61 40 174
% within City 10.30 31.60 35.10 23.00 100.00
% within
SocialGroup
9.00 42.30 6.00 7.60 9.30
% of Total 1.00 2.90 3.30 2.10 9.30
Bhopal Count 2 1 49 50 102
% within City 2.00 1.00 48.00 49.00 100.00
% within
SocialGroup
1.00 0.80 4.80 9.50 5.50
% of Total 0.10 0.10 2.60 2.70 5.50
Chamraj
nagar
Count 1 0 2 0 3
% within City 33.30 0.00 66.70 0.00 100.00
% within
SocialGroup
0.50 0.00 0.20 0.00 0.20
% of Total 0.10 0.00 0.10 0.00 0.20
Delhi Count 0 28 72 128 228
% within City 0.00 12.30 31.60 56.10 100.00
% within
SocialGroup
0.00 21.50 7.10 24.40 12.20
% of Total 0.00 1.50 3.90 6.80 12.20
Guntur Count 84 29 36 120 269
% within City 31.20 10.80 13.40 44.60 100.00
% within
SocialGroup
42.00 22.30 3.60 22.90 14.40
% of Total 4.50 1.60 1.90 6.40 14.40

264
Indore Count 28 0 70 16 114
% within City 24.60 0.00 61.40 14.00 100.00
% within
Social Group
14.00 0.00 6.90 3.00 6.10
% of Total 1.50 0.00 3.70 0.90 6.10
Jaipur Count 5 0 91 0 96
% within City 5.20 0.00 94.80 0.00 100.00
% within
Social Group
2.50 0.00 9.00 0.00 5.10
% of Total 0.30 0.00 4.90 0.00 5.10
Kalyan Count 4 1 16 38 59
% within City 6.80 1.70 27.10 64.40 100.00
% within
Social Group
2.00 0.80 1.60 7.20 3.20
% of Total 0.20 0.10 0.90 2.00 3.20
Mumbai Count 2 6 139 2 149
% within City 1.30 4.00 93.30 1.30 100.00
% within
Social Group
1.00 4.60 13.70 0.40 8.00
% of Total 0.10 0.30 7.40 0.10 8.00
Mysore Count 20 1 124 4 149
% within City 13.40 0.70 83.20 2.70 100.00
% within
Social Group
10.00 0.80 12.20 0.80 8.00
% of Total 1.10 0.10 6.60 0.20 8.00
Nashik Count 0 0 106 0 106
% within City 0.00 0.00 100.00 0.00 100.00
% within
Social Group
0.00 0.00 10.50 0.00 5.70
% of Total 0.00 0.00 5.70 0.00 5.70
Navi
Mumbai
Count 0 0 7 0 7
% within City 0.00 0.00 100.00 0.00 100.00
% within
Social Group
0.00 0.00 0.70 0.00 0.40
% of Total 0.00 0.00 0.40 0.00 0.40
Pune Count 27 9 85 1 122
% within City 22.10 7.40 69.70 0.80 100.00
% within
Social Group
13.50 6.90 8.40 0.20 6.50
% of Total 1.40 0.50 4.50 0.10 6.50
Shillong Count 0 0 0 60 60
% within City 0.00 0.00 0.00 100.00 100.00
% within
Social Group
0.00 0.00 0.00 11.40 3.20
% of Total 0.00 0.00 0.00 3.20 3.20

265
Tenali Count 0 0 2 30 32
% within City 0.00 0.00 6.20 93.80 100.00
% within
Social Group
0.00 0.00 0.20 5.70 1.70
% of Total 0.00 0.00 0.10 1.60 1.70
Thane Count 6 0 59 0 65
% within City 9.20 0.00 90.80 0.00 100.00
% within
Social Group
3.00 0.00 5.80 0.00 3.50
% of Total 0.30 0.00 3.20 0.00 3.50
Tumkur Count 2 0 19 10 31
% within City 6.50 0.00 61.30 32.30 100.00
% within
Social Group
1.00 0.00 1.90 1.90 1.70
% of Total 0.10 0.00 1.00 0.50 1.70
Wardha Count 0 0 25 0 25
% within City 0.00 0.00 100.00 0.00 100.00
% within
Social Group
0.00 0.00 2.50 0.00 1.30
% of Total 0.00 0.00 1.30 0.00 1.30
Yawatmal Count 0 0 25 0 25
% within City 0.00 0.00 100.00 0.00 100.00
% within
Social Group
0.00 0.00 2.50 0.00 1.30
% of Total 0.00 0.00 1.30 0.00 1.30
Total Count 200 130 1014 525 1869
% within City 10.70 7.00 54.30 28.10 100.00
% within
Social Group
100.00 100.00 100.00 100.00 100.00
% of Total 10.70 7.00 54.30 28.10 100.00
Table 3.1.9 Waste picker and social group distribution
Social Group Total
Backward Caste
General Category
Scheduled Caste
Scheduled Tribe
Free
Roaming /
Independent
local
Count 135 59 730 312 1236
% within
type of waste
picker
10.9 4.8 59.1 25.2 100.0
% within
Social Group
67.5 45.4 72.0 59.4 66.1
% of Total 7.2 3.2 39.1 16.7 66.1
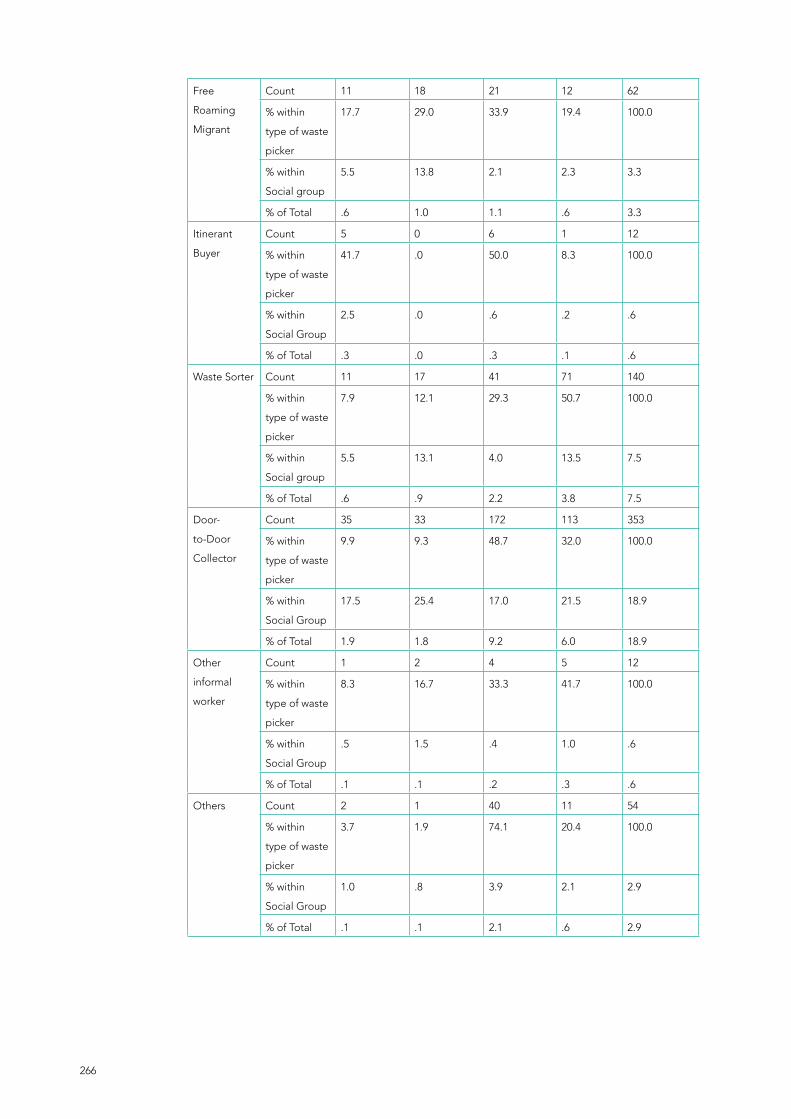
266
Free
Roaming
Migrant
Count 11 18 21 12 62
% within
type of waste
picker
17.7 29.0 33.9 19.4 100.0
% within
Social group
5.5 13.8 2.1 2.3 3.3
% of Total .6 1.0 1.1 .6 3.3
Itinerant
Buyer
Count 5 0 6 1 12
% within
type of waste
picker
41.7 .0 50.0 8.3 100.0
% within
Social Group
2.5 .0 .6 .2 .6
% of Total .3 .0 .3 .1 .6
Waste Sorter Count 11 17 41 71 140
% within
type of waste
picker
7.9 12.1 29.3 50.7 100.0
% within
Social group
5.5 13.1 4.0 13.5 7.5
% of Total .6 .9 2.2 3.8 7.5
Door-
to-Door
Collector
Count 35 33 172 113 353
% within
type of waste
picker
9.9 9.3 48.7 32.0 100.0
% within
Social Group
17.5 25.4 17.0 21.5 18.9
% of Total 1.9 1.8 9.2 6.0 18.9
Other
informal
worker
Count 1 2 4 5 12
% within
type of waste
picker
8.3 16.7 33.3 41.7 100.0
% within
Social Group
.5 1.5 .4 1.0 .6
% of Total .1 .1 .2 .3 .6
Others Count 2 1 40 11 54
% within
type of waste
picker
3.7 1.9 74.1 20.4 100.0
% within
Social Group
1.0 .8 3.9 2.1 2.9
% of Total .1 .1 2.1 .6 2.9

267
Total Count 200 130 1014 525 1869
% within
type of waste
picker
10.7 7.0 54.3 28.1 100.0
% within
Social Group
100.0 100.0 100.0 100.0 100.0
% of Total 10.7 7.0 54.3 28.1 100.0
Table 3.1.9 City wise distribution of respondents and religion
Religion Total
City Hindu Muslim Christian Sikh Jain Others
Benga-
luru
Count 128 43 3 0 0 0 174
% within
City
73.6 24.7 1.7 .0 .0 .0 100.0
% within
Religion
10.8 16.9 1.9 .0 .0 .0 9.3
% of Total 6.8 2.3 .2 .0 .0 .0 9.3
Bhopal Count 65 1 0 0 36 0 102
% within
City
63.7 1.0 .0 .0 35.3 .0 100.0
% within
Religion
5.5 .4 .0 .0 16.1 .0 5.5
% of Total 3.5 .1 .0 .0 1.9 .0 5.5
Chamraj
nagar
Count 2 1 0 0 0 0 3
% within
City
66.7 33.3 .0 .0 .0 .0 100.0
% within
Religion
.2 .4 .0 .0 .0 .0 .2
% of Total .1 .1 .0 .0 .0 .0 .2
Delhi Count 66 162 0 0 0 0 228
% within
City
28.9 71.1 .0 .0 .0 .0 100.0
% within
Religion
5.6 63.8 .0 .0 .0 .0 12.2
% of Total 3.5 8.7 .0 .0 .0 .0 12.2
Guntur Count 177 6 86 0 0 0 269
% within
City
65.8 2.2 32.0 .0 .0 .0 100.0
% within
Religion
15.0 2.4 54.1 .0 .0 .0 14.4
% of Total 9.5 .3 4.6 .0 .0 .0 14.4
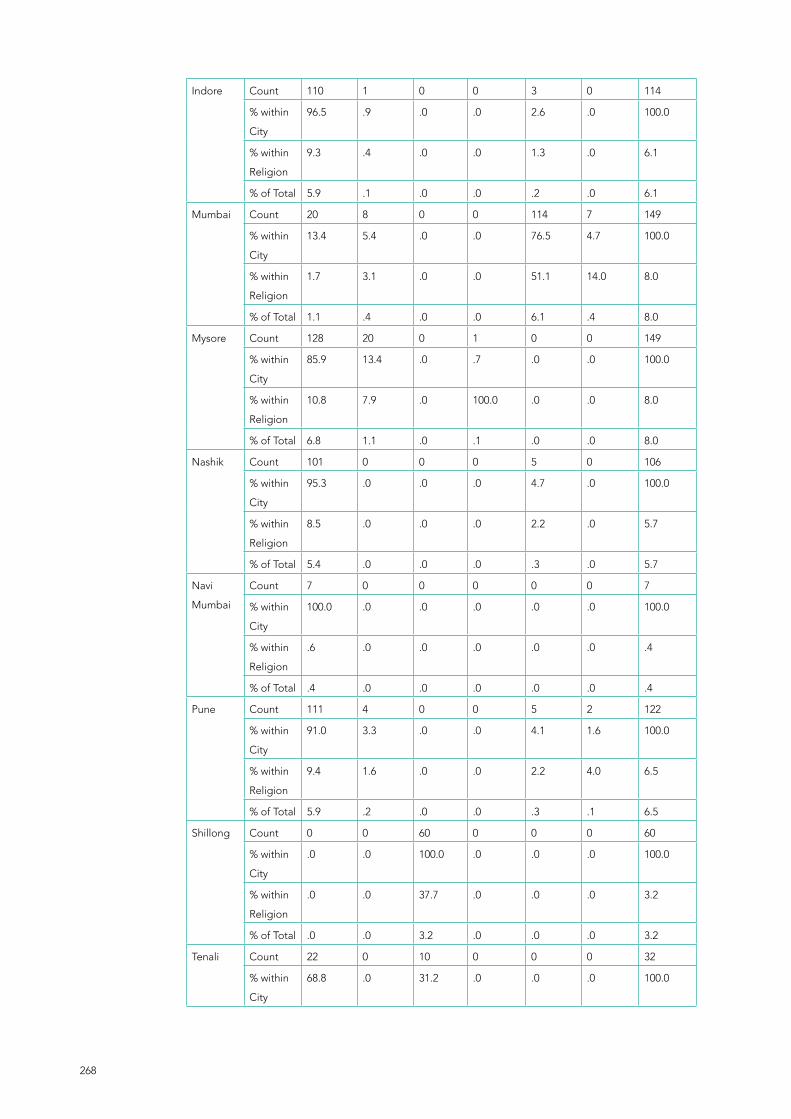
268
Indore Count 110 1 0 0 3 0 114
% within
City
96.5 .9 .0 .0 2.6 .0 100.0
% within
Religion
9.3 .4 .0 .0 1.3 .0 6.1
% of Total 5.9 .1 .0 .0 .2 .0 6.1
Mumbai Count 20 8 0 0 114 7 149
% within
City
13.4 5.4 .0 .0 76.5 4.7 100.0
% within
Religion
1.7 3.1 .0 .0 51.1 14.0 8.0
% of Total 1.1 .4 .0 .0 6.1 .4 8.0
Mysore Count 128 20 0 1 0 0 149
% within
City
85.9 13.4 .0 .7 .0 .0 100.0
% within
Religion
10.8 7.9 .0 100.0 .0 .0 8.0
% of Total 6.8 1.1 .0 .1 .0 .0 8.0
Nashik Count 101 0 0 0 5 0 106
% within
City
95.3 .0 .0 .0 4.7 .0 100.0
% within
Religion
8.5 .0 .0 .0 2.2 .0 5.7
% of Total 5.4 .0 .0 .0 .3 .0 5.7
Navi
Mumbai
Count 7 0 0 0 0 0 7
% within
City
100.0 .0 .0 .0 .0 .0 100.0
% within
Religion
.6 .0 .0 .0 .0 .0 .4
% of Total .4 .0 .0 .0 .0 .0 .4
Pune Count 111 4 0 0 5 2 122
% within
City
91.0 3.3 .0 .0 4.1 1.6 100.0
% within
Religion
9.4 1.6 .0 .0 2.2 4.0 6.5
% of Total 5.9 .2 .0 .0 .3 .1 6.5
Shillong Count 0 0 60 0 0 0 60
% within
City
.0 .0 100.0 .0 .0 .0 100.0
% within
Religion
.0 .0 37.7 .0 .0 .0 3.2
% of Total .0 .0 3.2 .0 .0 .0 3.2
Tenali Count 22 0 10 0 0 0 32
% within
City
68.8 .0 31.2 .0 .0 .0 100.0

269
% within
Religion
1.9 .0 6.3 .0 .0 .0 1.7
% of Total 1.2 .0 .5 .0 .0 .0 1.7
Thane Count 12 0 0 0 53 0 65
% within
City
18.5 .0 .0 .0 81.5 .0 100.0
% within
Religion
1.0 .0 .0 .0 23.8 .0 3.5
% of Total .6 .0 .0 .0 2.8 .0 3.5
Tumkur Count 29 2 0 0 0 0 31
% within
City
93.5 6.5 .0 .0 .0 .0 100.0
% within
Religion
2.5 .8 .0 .0 .0 .0 1.7
% of Total 1.6 .1 .0 .0 .0 .0 1.7
Kalyan Count 17 1 0 0 2 39 59
% within
City
28.8 1.7 .0 .0 3.4 66.1 100.0
% within
Religion
1.4 .4 .0 .0 .9 78.0 3.2
% of Total .9 .1 .0 .0 .1 2.1 3.2
Balaghat Count 51 0 0 0 0 2 53
% within
City
96.2 .0 .0 .0 .0 3.8 100.0
% within
Religion
4.3 .0 .0 .0 .0 4.0 2.8
% of Total 2.7 .0 .0 .0 .0 .1 2.8
Jaipur Count 91 5 0 0 0 0 96
% within
City
94.8 5.2 .0 .0 .0 .0 100.0
% within
Religion
7.7 2.0 .0 .0 .0 .0 5.1
% of Total 4.9 .3 .0 .0 .0 .0 5.1
Yawatmal Count 20 0 0 0 5 0 25
% within
City
80.0 .0 .0 .0 20.0 .0 100.0
% within
Religion
1.7 .0 .0 .0 2.2 .0 1.3
% of Total 1.1 .0 .0 .0 .3 .0 1.3
Wardha Count 25 0 0 0 0 0 25
% within
City
100.0 .0 .0 .0 .0 .0 100.0
% within
Religion
2.1 .0 .0 .0 .0 .0 1.3
% of Total 1.3 .0 .0 .0 .0 .0 1.3

270
Total Count 1182 254 159 1 223 50 1869
% within
City
63.2 13.6 8.5 .1 11.9 2.7 100.0
% within
Religion
100.0 100.0 100.0 100.0 100.0 100.0 100.0
% of Total 63.2 13.6 8.5 .1 11.9 2.7 100.0
Table 3.1.11 Type of Waste picker and religion
Religion Total
Type ofwaste picker
Hindu Muslim Christian Sikh Jain Others
Free
Roaming
Indepen-
dent
local
Count 855 69 106 1 183 22 1236
% within
type of
waste
picker
69.2 5.6 8.6 .1 14.8 1.8 100.0
Free
Roaming
Migrant
Count 29 26 1 0 6 0 62
% within
type of
waste
picker
46.8 41.9 1.6 .0 9.7 .0 100.0
Itinerant
Buyer
Count 6 5 0 0 1 0 12
% within
type of
waste
picker
50.0 41.7 .0 .0 8.3 .0 100.0
Waste
Sorter
Count 54 11 45 0 4 26 140
% within
type of
waste
picker
38.6 7.9 32.1 .0 2.9 18.6 100.0
Door-
to-Door
Collector
Count 199 125 6 0 21 2 353
% within
type of
waste
picker
56.4 35.4 1.7 .0 5.9 .6 100.0
Other
informal
worker
Count 8 2 1 0 1 0 12
% within
type of
waste
picker
66.7 16.7 8.3 .0 8.3 .0 100.0
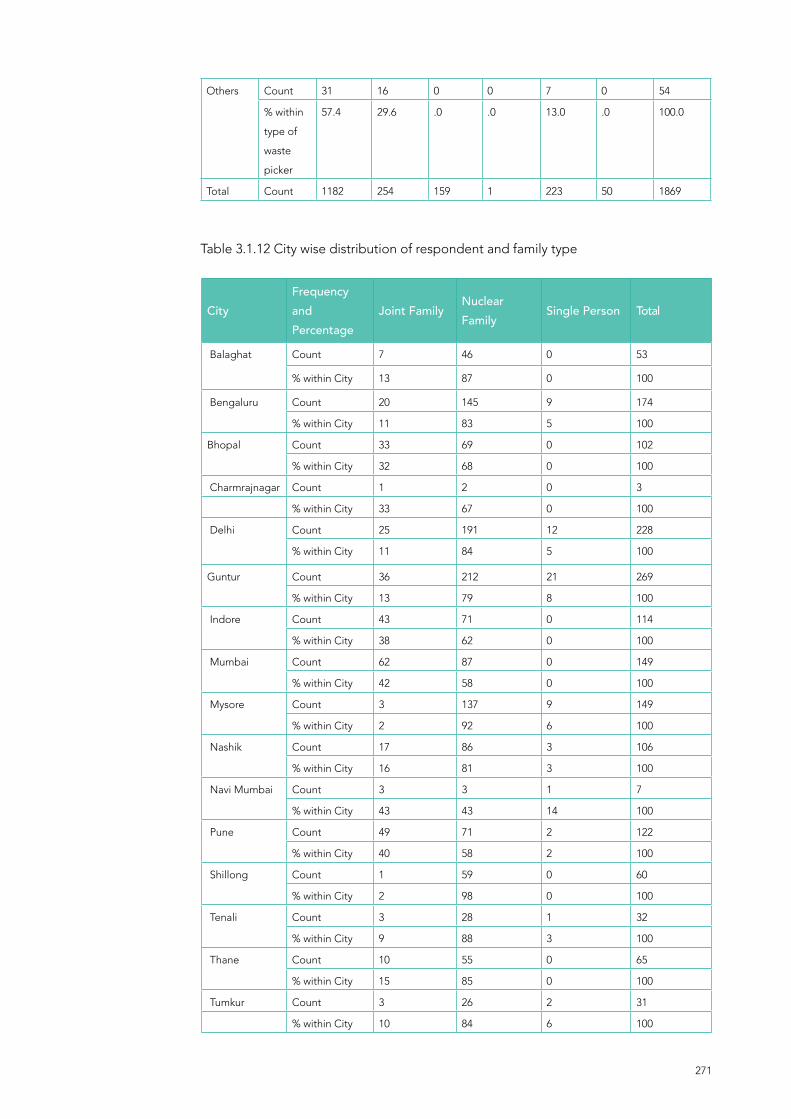
271
Others Count 31 16 0 0 7 0 54
% within
type of
waste
picker
57.4 29.6 .0 .0 13.0 .0 100.0
Total Count 1182 254 159 1 223 50 1869
Table 3.1.12 City wise distribution of respondent and family type
CityFrequency and Percentage
Joint FamilyNuclear Family
Single Person Total
Balaghat Count 7 46 0 53
% within City 13 87 0 100
Bengaluru Count 20 145 9 174
% within City 11 83 5 100
Bhopal Count 33 69 0 102
% within City 32 68 0 100
Charmrajnagar Count 1 2 0 3
% within City 33 67 0 100
Delhi Count 25 191 12 228
% within City 11 84 5 100
Guntur Count 36 212 21 269
% within City 13 79 8 100
Indore Count 43 71 0 114
% within City 38 62 0 100
Mumbai Count 62 87 0 149
% within City 42 58 0 100
Mysore Count 3 137 9 149
% within City 2 92 6 100
Nashik Count 17 86 3 106
% within City 16 81 3 100
Navi Mumbai Count 3 3 1 7
% within City 43 43 14 100
Pune Count 49 71 2 122
% within City 40 58 2 100
Shillong Count 1 59 0 60
% within City 2 98 0 100
Tenali Count 3 28 1 32
% within City 9 88 3 100
Thane Count 10 55 0 65
% within City 15 85 0 100
Tumkur Count 3 26 2 31
% within City 10 84 6 100

272
Kalyan Count 0 58 1 59
% within City 0 98 2 100
Jaipur Count 10 84 2 96
% within City 10 88 2 100
Wardha Count 9 16 0 25
% within City 36 64 0 100
Yawatmal Count 0 21 4 25
% within City 0 84 16 100
Total Count 335 1467 67 1869
% within City 18 78 4 100
Table 3.1.13 Waste picker socio-demographics – residence, phone, land and ownership
Socio-demographics Particulars
Number of Respondents (N=1869)
Percent
Place of residence House 1574 84.2
Scrap Dealer Shop 34 1.8
Relative’s House 3 0.2
Friends’ House 2 0.1
Godown 40 2.1
Facility Provided by
scrap dealer
18 1
Streets 28 1.5
Government Shelter 107 5.7
Shifting places everyday 5 0.3
Others 58 3.1
Location of dwelling Slum Colony 1278 68
Government Land 264 14
Private Land 223 12
Regular Colony 67 4
Others 37 2
Possession of Phone Normal GSM 1617 86.5
Smart Phone without
internet
56 3
Smart Phone with
internet
196 10.5
Ownership of Land Own Land 275 15
Do Not own land 1594 85

273
Table 3.1.14 city wise distribution of respondents and place of residence.FP= Frequency percentage within city, H= House, S= Scrap dealer shop, R= Relatives’house, F= Friends house, G=Gowdown, P= Facility provided by scrap dealer, ST= Streets, G= Government shelter, E= Shift place everyday, O= Others
City FP H S R F G P ST G E O
Balaghat Count 11 0 0 0 0 0 11 0 2 29
% within City 21 0 0 0 0 0 21 0 4 55
Bengaluru Count 118 6 1 0 20 7 1 7 0 14
% within City 68 3 1 0 11 4 1 4 0 8
Bhopal Count 67 4 1 1 0 0 0 26 3 0
% within City 66 4 1 1 0 0 0 25 3 0
Chamraj
nagar
Count 3 0 0 0 0 0 0 0 0 0
% within City 100 0 0 0 0 0 0 0 0 0
Delhi Count 208 0 0 1 18 0 0 0 0 1
% within City 91 0 0 0 8 0 0 0 0 0
Guntur Count 252 1 0 0 0 0 13 1 0 2
% within City 94 0 0 0 0 0 5 0 0 1
Indore Count 108 2 1 0 1 0 0 1 0 1
% within City 95 2 1 0 1 0 0 1 0 1
Jaipur Count 73 16 0 0 0 1 0 6 0 0
% within City 76 17 0 0 0 1 0 6 0 0
Kalyan Count 59 0 0 0 0 0 0 0 0 0
% within City 100 0 0 0 0 0 0 0 0 0
Mumbai Count 148 0 0 0 0 0 0 0 0 1
% within City 99 0 0 0 0 0 0 0 0 1
Mysore Count 71 4 0 0 0 10 0 64 0 0
% within City 48 3 0 0 0 7 0 43 0 0
Nashik Count 105 0 0 0 0 0 0 1 0 0
% within City 99 0 0 0 0 0 0 1 0 0
Navi
Mumbai
Count 7 0 0 0 0 0 0 0 0 0
% within City 100 0 0 0 0 0 0 0 0 0
Pune Count 111 0 0 0 0 0 0 1 0 10
% within City 91 0 0 0 0 0 0 1 0 8
Shillong Count 60 0 0 0 0 0 0 0 0 0
% within City 100 0 0 0 0 0 0 0 0 0
Tenali Count 31 1 0 0 0 0 0 0 0 0
% within City 97 3 0 0 0 0 0 0 0 0
Thane Count 62 0 0 0 0 0 3 0 0 0
% within City 95 0 0 0 0 0 5 0 0 0
Tumkur Count 30 0 0 0 1 0 0 0 0 0
% within City 97 0 0 0 3 0 0 0 0 0

274
Wardha Count 25 0 0 0 0 0 0 0 0 0
% within City
100 0 0 0 0 0 0 0 0 0
Yawatmal Count 25 0 0 0 0 0 0 0 0 0
% within City
100 0 0 0 0 0 0 0 0 0
Total Count 1574 34 3 2 40 18 28 107 5 58
% within City
84 2 0 0 2 1 1 6 0 3
Area of dwelling
City Slum Colony
GovtLand
Private land
Regular colony
Others Total
Bengaluru Count 24 17 104 9 20 174
% within
City
13.8 9.8 59.8 5.2 11.5 100.0
% within
area of
dwelling
1.9 6.4 46.6 13.4 80.0 9.3
% of Total 1.3 .9 5.6 .5 1.1 9.3
Bhopal Count 56 27 2 15 2 102
% within
City
54.9 26.5 2.0 14.7 2.0 100.0
% within
area of
dwelling
4.4 10.2 .9 22.4 16.7 5.5
% of Total 3.0 1.4 .1 .8 .1 5.5
Chamraj
nagar
Count 2 0 0 1 0 3
% within
City
66.7 .0 .0 33.3 .0 100.0
% within
area of
dwelling
.2 .0 .0 1.5 .0 .2
% of Total .1 .0 .0 .1 .0 .2
Delhi Count 228 0 0 0 0 228
% within
City
100.0 .0 .0 .0 .0 100.0
% within
area of
dwelling
17.8 .0 .0 .0 .0 12.2
% of Total 12.2 .0 .0 .0 .0 12.2
Table 3.1.15 City wise area of dwelling

275
Guntur Count 251 6 5 7 0 269
% within
City
93.3 2.2 1.9 2.6 .0 100.0
% within
area of
dwelling
19.6 2.3 2.2 10.4 .0 14.4
% of Total 13.4 .3 .3 .4 .0 14.4
Indore Count 25 87 0 2 0 114
% within
City
21.9 76.3 .0 1.8 .0 100.0
% within
area of
dwelling
2.0 33.0 .0 3.0 .0 6.1
% of Total 1.3 4.7 .0 .1 .0 6.1
Mumbai Count 137 4 1 0 7 149
% within
City
91.9 2.7 .7 .0 4.7 100.0
% within
area of
dwelling
10.7 1.5 .4 .0 54.0 8.0
% of Total 7.3 .2 .1 .0 .4 8.0
Mysore Count 132 7 2 8 0 149
% within
City
88.6 4.7 1.3 5.4 .0 100.0
% within
area of
dwelling
10.3 2.7 .9 11.9 .0 8.0
% of Total 7.1 .4 .1 .4 .0 8.0
Nashik Count 104 2 0 0 0 106
% within
City
98.1 1.9 .0 .0 .0 100.0
% within
area of
dwelling
8.1 .8 .0 .0 .0 5.7
% of Total 5.6 .1 .0 .0 .0 5.7
Navi
Mumbai
Count 7 0 0 0 0 7
% within
City
100.0 .0 .0 .0 .0 100.0
% within
area of
dwelling
.5 .0 .0 .0 .0 .4
% of Total .4 .0 .0 .0 .0 .4

276
Pune Count 83 10 6 18 5 122
% within
City
68.0 8.2 4.9 14.8 4.1 100.0
% within
area of
dwelling
6.5 3.8 2.7 26.9 24.3 6.5
% of Total 4.4 .5 .3 1.0 .3 6.5
Shillong Count 0 0 60 0 0 60
% within
City
.0 .0 100.0 .0 .0 100.0
% within
area of
dwelling
.0 .0 26.9 .0 .0 3.2
% of Total .0 .0 3.2 .0 .0 3.2
Tenali Count 32 0 0 0 0 32
% within
City
100.0 .0 .0 .0 .0 100.0
% within
area of
dwelling
2.5 .0 .0 .0 .0 1.7
% of Total 1.7 .0 .0 .0 .0 1.7
Thane Count 60 0 0 2 3 65
% within
City
92.3 .0 .0 3.1 4.6 100.0
% within
area of
dwelling
4.7 .0 .0 3.0 25.0 3.5
% of Total 3.2 .0 .0 .1 .2 3.5
Tumkur Count 31 0 0 0 0 31
% within
City
100.0 .0 .0 .0 .0 100.0
% within
area of
dwelling
2.4 .0 .0 .0 .0 1.7
% of Total 1.7 .0 .0 .0 .0 1.7
Kalyan Count 43 16 0 0 0 59
% within
City
72.9 27.1 .0 .0 .0 100.0
% within
area of
dwelling
3.4 6.1 .0 .0 .0 3.2
% of Total 2.3 .9 .0 .0 .0 3.2
Balaghat Count 3 41 9 0 0 53
% within
City
5.7 77.4 17.0 .0 .0 100.0

277
% within
area of
dwelling
.2 15.5 4.0 .0 .0 2.8
% of Total .2 2.2 .5 .0 .0 2.8
Jaipur Count 11 46 34 5 0 96
% within
City
11.5 47.9 35.4 5.2 .0 100.0
% within
area of
dwelling
.9 17.4 15.2 7.5 .0 5.1
% of Total .6 2.5 1.8 .3 .0 5.1
Yawatmal Count 24 1 0 0 0 25
% within
City
96.0 4.0 .0 .0 .0 100.0
% within
area of
dwelling
1.9 .4 .0 .0 .0 1.3
% of Total 1.3 .1 .0 .0 .0 1.3
Wardha Count 25 0 0 0 0 25
% within
City
100.0 .0 .0 .0 .0 100.0
% within
area of
dwelling
2.0 .0 .0 .0 .0 1.3
% of Total 1.3 .0 .0 .0 .0 1.3
Total Count 1278 264 223 67 37 1869
% within
City
68.4 14.1 11.9 3.6 1.9 100.0
% within
area of
dwelling
100.0 100.0 100.0 100.0 100.0 100.0
% of Total 68.4 14.1 11.9 3.6 1.3 100.0

278
Area of dwelling
Type of waste picker
Slum Colony
GovtLand
Private land
Regular colony
Others Total
Free
Roaming/
Indepen-
dent
Local
Count 854 208 122 20 31 1236
% within
type of
waste
picker
69.1 16.8 9.9 1.6 2.6 100.0
% within
area of
dwelling
66.8 78.8 54.7 29.9 84.0 66.1
% of Total 45.7 11.1 6.5 1.1 1.1 66.1
Free
Roaming
Migrant
Count 21 9 32 0 0 62
% within
type of
waste
picker
33.9 14.5 51.6 .0 .0 100.0
% within
area of
dwelling
1.6 3.4 14.3 .0 .0 3.3
% of Total 1.1 .5 1.7 .0 .0 3.3
Itinerant
Buyer
Count 6 3 0 3 0 12
% within
type of
waste
picker
50.0 25.0 .0 25.0 .0 100.0
% within
area of
dwelling
.5 1.1 .0 4.5 .0 .6
% of Total .3 .2 .0 .2 .0 .6
Waste
Sorter
Count 76 19 39 6 0 140
% within
type of
waste
picker
54.3 13.6 27.9 4.3 .0 100.0
% within
area of
dwelling
5.9 7.2 17.5 9.0 .0 7.5
% of Total 4.1 1.0 2.1 .3 .0 7.5
3.1.16 Type of waste picker and area of dwelling
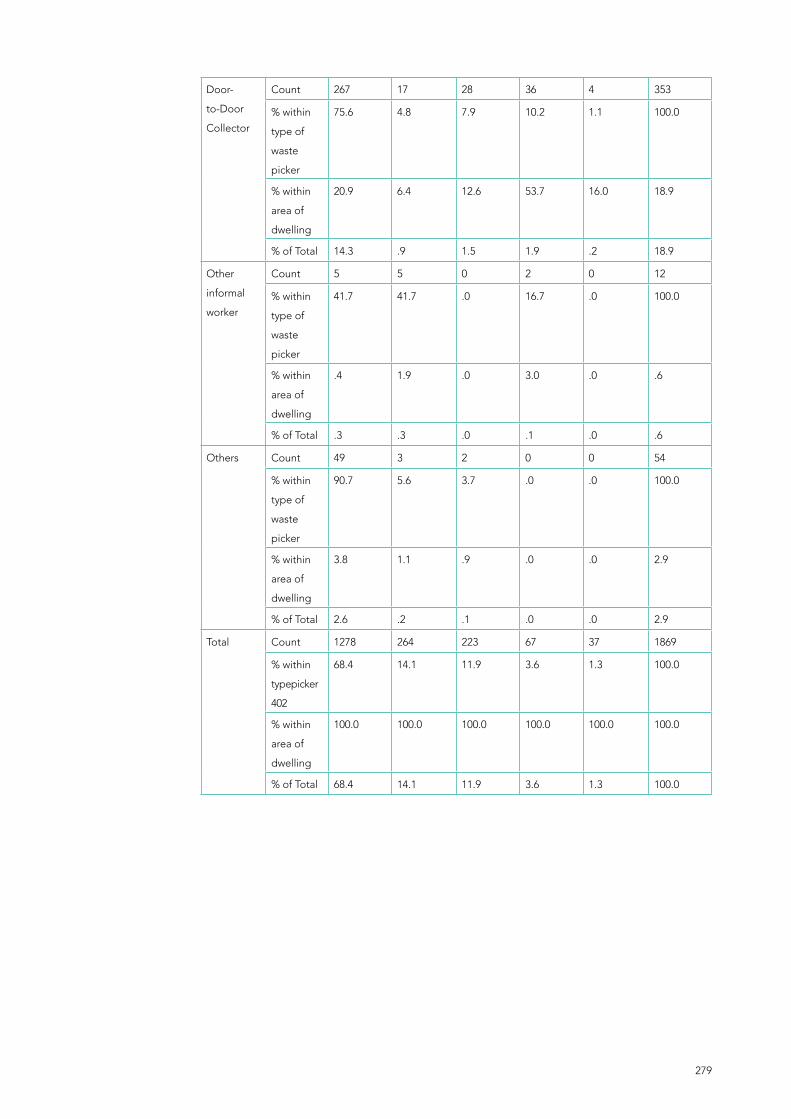
279
Door-
to-Door
Collector
Count 267 17 28 36 4 353
% within
type of
waste
picker
75.6 4.8 7.9 10.2 1.1 100.0
% within
area of
dwelling
20.9 6.4 12.6 53.7 16.0 18.9
% of Total 14.3 .9 1.5 1.9 .2 18.9
Other
informal
worker
Count 5 5 0 2 0 12
% within
type of
waste
picker
41.7 41.7 .0 16.7 .0 100.0
% within
area of
dwelling
.4 1.9 .0 3.0 .0 .6
% of Total .3 .3 .0 .1 .0 .6
Others Count 49 3 2 0 0 54
% within
type of
waste
picker
90.7 5.6 3.7 .0 .0 100.0
% within
area of
dwelling
3.8 1.1 .9 .0 .0 2.9
% of Total 2.6 .2 .1 .0 .0 2.9
Total Count 1278 264 223 67 37 1869
% within
typepicker
402
68.4 14.1 11.9 3.6 1.3 100.0
% within
area of
dwelling
100.0 100.0 100.0 100.0 100.0 100.0
% of Total 68.4 14.1 11.9 3.6 1.3 100.0

280
3.1.17 City wise distribution of respondents and type of mobile phone use
Type of mobile phone use
CityNormal GSM
Smart phone without internet
Smart phone with internet
Total
Bengaluru Count 119 7 48 174
% within City 68.4 4.0 27.6 100.0
% within type of
mobile phone
use
7.4 12.5 24.5 9.3
% of Total 6.4 .4 2.6 9.3
Bhopal Count 78 10 14 102
% within City 76.5 9.8 13.7 100.0
% within type of
mobile phone
use
4.8 17.9 7.1 5.5
% of Total 4.2 .5 .7 5.5
Chamrajnagar Count 3 0 0 3
% within City 100.0 .0 .0 100.0
% within type of
mobile phone
use
.2 .0 .0 .2
% of Total .2 .0 .0 .2
Delhi Count 139 12 77 228
% within City 61.0 5.3 33.8 100.0
% within type of
mobile phone
use
8.6 21.4 39.3 12.2
% of Total 7.4 .6 4.1 12.2
Guntur Count 260 7 2 269
% within City 96.7 2.6 .7 100.0
% within type of
mobile phone
use
16.1 12.5 1.0 14.4
% of Total 13.9 .4 .1 14.4
Indore Count 105 2 7 114
% within City 92.1 1.8 6.1 100.0
% within type of
mobile phone
use
6.5 3.6 3.6 6.1
% of Total 5.6 .1 .4 6.1

281
Mumbai Count 132 4 13 149
% within City 88.6 2.7 8.7 100.0
% within type of
mobile phone
use
8.2 7.1 6.6 8.0
% of Total 7.1 .2 .7 8.0
Mysore Count 146 1 2 149
% within City 98.0 .7 1.3 100.0
% within type of
mobile phone
use
9.0 1.8 1.0 8.0
% of Total 7.8 .1 .1 8.0
Nashik Count 106 0 0 106
% within City 100.0 .0 .0 100.0
% within type of
mobile phone
use
6.6 .0 .0 5.7
% of Total 5.7 .0 .0 5.7
Navi Mumbai Count 7 0 0 7
% within City 100.0 .0 .0 100.0
% within type of
mobile phone
use
.4 .0 .0 .4
% of Total .4 .0 .0 .4
Pune Count 105 12 5 122
% within City 86.1 9.8 4.1 100.0
% within type of
mobile phone
use
6.5 21.4 2.6 6.5
% of Total 5.6 .6 .3 6.5
Shillong Count 46 1 13 60
% within City 76.7 1.7 21.7 100.0
% within type of
mobile phone
use
2.8 1.8 6.6 3.2
% of Total 2.5 .1 .7 3.2
Tenali Count 32 0 0 32
% within City 100.0 .0 .0 100.0
% within type of
mobile phone
use
2.0 .0 .0 1.7
% of Total 1.7 .0 .0 1.7
Thane Count 50 0 15 65
% within City 76.9 .0 23.1 100.0
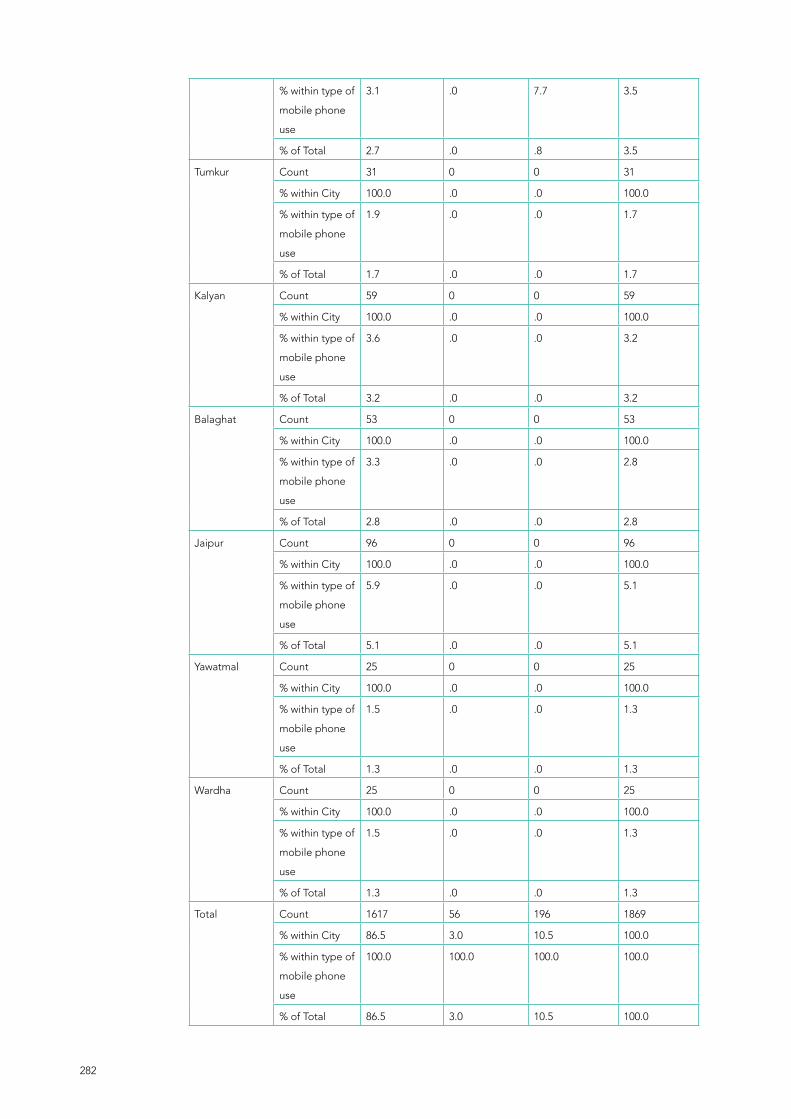
282
% within type of
mobile phone
use
3.1 .0 7.7 3.5
% of Total 2.7 .0 .8 3.5
Tumkur Count 31 0 0 31
% within City 100.0 .0 .0 100.0
% within type of
mobile phone
use
1.9 .0 .0 1.7
% of Total 1.7 .0 .0 1.7
Kalyan Count 59 0 0 59
% within City 100.0 .0 .0 100.0
% within type of
mobile phone
use
3.6 .0 .0 3.2
% of Total 3.2 .0 .0 3.2
Balaghat Count 53 0 0 53
% within City 100.0 .0 .0 100.0
% within type of
mobile phone
use
3.3 .0 .0 2.8
% of Total 2.8 .0 .0 2.8
Jaipur Count 96 0 0 96
% within City 100.0 .0 .0 100.0
% within type of
mobile phone
use
5.9 .0 .0 5.1
% of Total 5.1 .0 .0 5.1
Yawatmal Count 25 0 0 25
% within City 100.0 .0 .0 100.0
% within type of
mobile phone
use
1.5 .0 .0 1.3
% of Total 1.3 .0 .0 1.3
Wardha Count 25 0 0 25
% within City 100.0 .0 .0 100.0
% within type of
mobile phone
use
1.5 .0 .0 1.3
% of Total 1.3 .0 .0 1.3
Total Count 1617 56 196 1869
% within City 86.5 3.0 10.5 100.0
% within type of
mobile phone
use
100.0 100.0 100.0 100.0
% of Total 86.5 3.0 10.5 100.0

283
3.1.18 City wise distribution of respondents and land ownership
3.1.19 Distribution of main source of income
City Own Land (%) Do Not Own Land (%)
Balaghat 1 52
Bengaluru 7 167
Bhopal 19 83
Chamrajnagar 0 3
Delhi 43 185
Guntur 0 269
Indore 23 91
Jaipur 33 63
Kalyan 30 29
Mumbai 60 89
Mysore 1 148
Nashik 3 103
Navi Mumbai 1 6
Pune 11 111
Shillong 15 45
Tenali 0 32
Thane 22 43
Tumkur 5 26
Wardha 0 25
Yawatmal 0 25
Total 280 1589
Main source of Income Number of respondents Percent (%)
Waste Collection 1733 92.7
Salary/Wages 90 4.8
Scrap Dealing 20 1.1
Business 1 0.1
Others 25 1.3
Total 1869 100

284
Main source of income Total
City WasteCollection
Salary/wage
Scrap dealing
Business Others
Bengaluru Count 145 22 5 0 2 174
% within
City
83.3 12.6 2.9 .0 1.1 100.0
% within
main
source of
income
8.4 24.4 25.0 .0 8.0 9.3
% of Total 7.8 1.2 .3 .0 .1 9.3
Bhopal Count 88 6 7 0 1 102
% within
City
86.3 5.9 6.9 .0 1.0 100.0
% within
main
source of
income
5.1 6.7 35.0 .0 4.0 5.5
% of Total 4.7 .3 .4 .0 .1 5.5
Chamraj
nagar
Count 2 0 0 1 0 3
% within
City
66.7 .0 .0 33.3 .0 100.0
% within
main
source of
income
.1 .0 .0 100.0 .0 .2
% of Total .1 .0 .0 .1 .0 .2
Delhi Count 223 5 0 0 0 228
% within
City
97.8 2.2 .0 .0 .0 100.0
% within
main
source of
income
12.9 5.6 .0 .0 .0 12.2
% of Total 11.9 .3 .0 .0 .0 12.2
Guntur Count 230 37 1 0 1 269
% within
City
85.5 13.8 .4 .0 .4 100.0
% within
main
source of
income
13.3 41.1 5.0 .0 4.0 14.4
% of Total 12.3 2.0 .1 .0 .1 14.4
Table 3.1.20 Distribution of respondents and main source of income

285
Indore Count 94 14 5 0 1 114
% within
City
82.5 12.3 4.4 .0 .9 100.0
% within
main
source of
income
5.4 15.6 25.0 .0 4.0 6.1
% of Total 5.0 .7 .3 .0 .1 6.1
Mumbai Count 131 2 0 0 16 149
% within
City
87.9 1.3 .0 .0 10.7 100.0
% within
main
source of
income
7.6 2.2 .0 .0 64.0 8.0
% of Total 7.0 .1 .0 .0 .9 8.0
Mysore Count 145 1 1 0 2 149
% within
City
97.3 .7 .7 .0 1.3 100.0
% within
main
source of
income
8.4 1.1 5.0 .0 8.0 8.0
% of Total 7.8 .1 .1 .0 .1 8.0
Nashik Count 106 0 0 0 0 106
% within
City
100.0 .0 .0 .0 .0 100.0
% within
main
source of
income
6.1 .0 .0 .0 .0 5.7
% of Total 5.7 .0 .0 .0 .0 5.7
Navi
Mumbai
Count 7 0 0 0 0 7
% within
City
100.0 .0 .0 .0 .0 100.0
% within
main
source of
income
.4 .0 .0 .0 .0 .4
% of Total .4 .0 .0 .0 .0 .4
Pune Count 121 0 0 0 1 122
% within
City
99.2 .0 .0 .0 .8 100.0

286
% within
main
source of
income
7.0 .0 .0 .0 4.0 6.5
% of Total 6.5 .0 .0 .0 .1 6.5
Shillong Count 60 0 0 0 0 60
% within
City
100.0 .0 .0 .0 .0 100.0
% within
main
source of
income
3.5 .0 .0 .0 .0 3.2
% of Total 3.2 .0 .0 .0 .0 3.2
Tenali Count 32 0 0 0 0 32
% within
City
100.0 .0 .0 .0 .0 100.0
% within
main
source of
income
1.8 .0 .0 .0 .0 1.7
% of Total 1.7 .0 .0 .0 .0 1.7
Thane Count 65 0 0 0 0 65
% within
City
100.0 .0 .0 .0 .0 100.0
% within
main
source of
income
3.8 .0 .0 .0 .0 3.5
% of Total 3.5 .0 .0 .0 .0 3.5
Tumkur Count 28 2 1 0 0 31
% within
City
90.3 6.5 3.2 .0 .0 100.0
% within
main
source of
income
1.6 2.2 5.0 .0 .0 1.7
% of Total 1.5 .1 .1 .0 .0 1.7
Kalyan Count 58 0 0 0 1 59
% within
City
98.3 .0 .0 .0 1.7 100.0
% within
main
source of
income
3.3 .0 .0 .0 4.0 3.2
% of Total 3.1 .0 .0 .0 .1 3.2

287
Balaghat Count 52 1 0 0 0 53
% within
City
98.1 1.9 .0 .0 .0 100.0
% within
main
source of
income
3.0 1.1 .0 .0 .0 2.8
% of Total 2.8 .1 .0 .0 .0 2.8
Jaipur Count 96 0 0 0 0 96
% within
City
100.0 .0 .0 .0 .0 100.0
% within
main
source of
income
5.5 .0 .0 .0 .0 5.1
% of Total 5.1 .0 .0 .0 .0 5.1
Yawatmal Count 25 0 0 0 0 25
% within
City
100.0 .0 .0 .0 .0 100.0
% within
main
source of
income
1.4 .0 .0 .0 .0 1.3
% of Total 1.3 .0 .0 .0 .0 1.3
Wardha Count 25 0 0 0 0 25
% within
City
100.0 .0 .0 .0 .0 100.0
% within
main
source of
income
1.4 .0 .0 .0 .0 1.3
% of Total 1.3 .0 .0 .0 .0 1.3
Total Count 1733 90 20 1 25 1869
% within
City
92.7 4.8 1.1 .1 1.3 100.0
% within
main
source of
income
100.0 100.0 100.0 100.0 100.0 100.0
% of Total 92.7 4.8 1.1 .1 1.3 100.0

288
Table 3.1.21 Total monthly income
Household Monthly income (INR)
Number of respondents Percent (%)
Up to 1000 63 3.4
1001 to 5000 691 37
5001 to 10000 702 37.6
10001 to 15000 234 12.5
15001 to 20000 110 5.9
20001 to 25000 33 1.8
25001 to 30000 16 0.9
Above 30000 20 1.1
Total 1869 100
Table 3.1.22 City wise distribution of respondents and monthly house hold income( INR)
House hold monthly income (INR) Total
CityUpto
1000
1001
to
5000
5001
to
10000
10001
to
15000
15001
to
20000
20001
to
25000
25001
to
30000
Above
30000
Bengaluru Count 27 52 57 25 10 2 0 1 174
% within
City
15.5 29.9 32.8 14.4 5.7 1.1 .0 .6 100.0
% within
House
hold
monthly
income
42.9 7.5 8.1 10.7 9.1 6.1 .0 5.0 9.3
% of Total 1.4 2.8 3.0 1.3 .5 .1 .0 .1 9.3
Bhopal Count 1 44 55 2 0 0 0 0 102
% within
City
1.0 43.1 53.9 2.0 .0 .0 .0 .0 100.0
% within
House
hold
monthly
income
1.6 6.4 7.8 .9 .0 .0 .0 .0 5.5
% of Total .1 2.4 2.9 .1 .0 .0 .0 .0 5.5
Chamraj
nagar
Count 0 0 3 0 0 0 0 0 3
% within
City
.0 .0 100.0 .0 .0 .0 .0 .0 100.0

289
% within
House
hold
monthly
income
.0 .0 .4 .0 .0 .0 .0 .0 .2
% of Total .0 .0 .2 .0 .0 .0 .0 .0 .2
Delhi Count 0 37 172 14 5 0 0 0 228
% within
City
.0 16.2 75.4 6.1 2.2 .0 .0 .0 100.0
% within
House
hold
monthly
income
.0 5.4 24.5 6.0 4.5 .0 .0 .0 12.2
% of Total .0 2.0 9.2 .7 .3 .0 .0 .0 12.2
Guntur Count 6 144 99 9 10 1 0 0 269
% within
City
2.2 53.5 36.8 3.3 3.7 .4 .0 .0 100.0
% within
House
hold
monthly
income
9.5 20.8 14.1 3.8 9.1 3.0 .0 .0 14.4
% of Total .3 7.7 5.3 .5 .5 .1 .0 .0 14.4
Indore Count 5 43 44 22 0 0 0 0 114
% within
City
4.4 37.7 38.6 19.3 .0 .0 .0 .0 100.0
% within
House
hold
monthly
income
7.9 6.2 6.3 9.4 .0 .0 .0 .0 6.1
% of Total .3 2.3 2.4 1.2 .0 .0 .0 .0 6.1
Mumbai Count 9 1 17 35 49 20 8 10 149
% within
City
6.0 .7 11.4 23.5 32.9 13.4 5.4 6.7 100.0
% within
House
hold
monthly
income
14.3 .1 2.4 15.0 44.5 60.6 50.0 50.0 8.0
% of Total .5 .1 .9 1.9 2.6 1.1 .4 .5 8.0
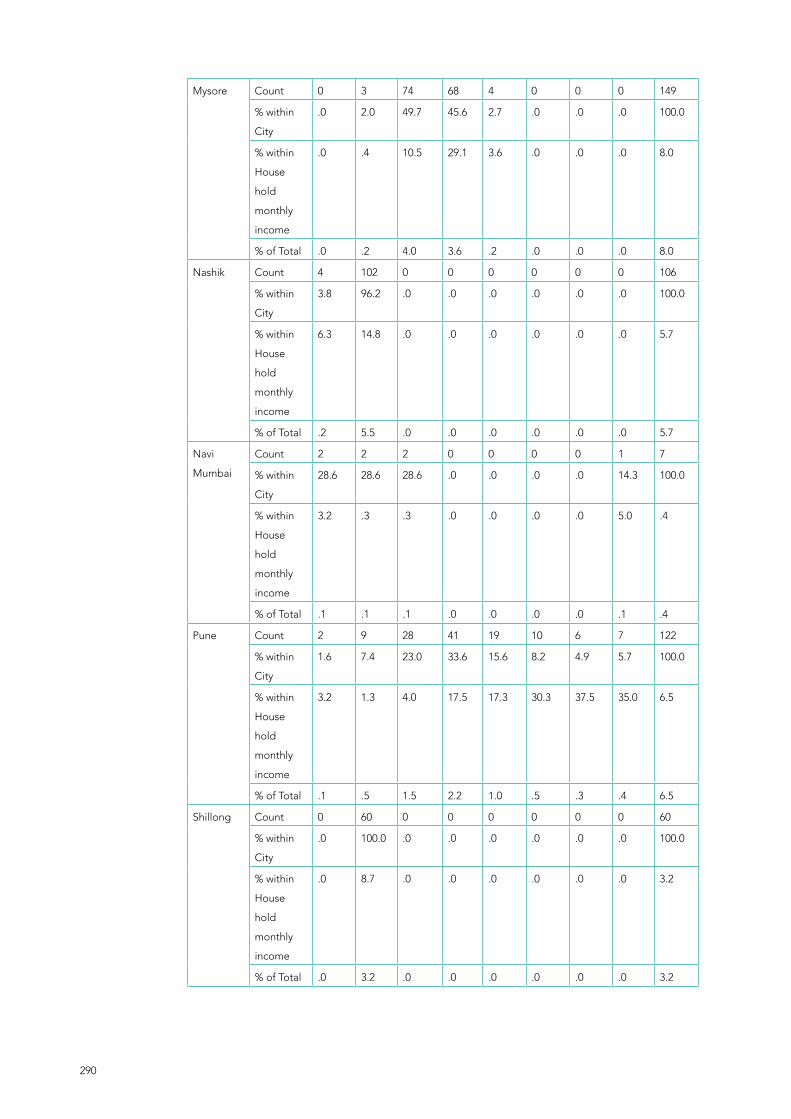
290
Mysore Count 0 3 74 68 4 0 0 0 149
% within
City
.0 2.0 49.7 45.6 2.7 .0 .0 .0 100.0
% within
House
hold
monthly
income
.0 .4 10.5 29.1 3.6 .0 .0 .0 8.0
% of Total .0 .2 4.0 3.6 .2 .0 .0 .0 8.0
Nashik Count 4 102 0 0 0 0 0 0 106
% within
City
3.8 96.2 .0 .0 .0 .0 .0 .0 100.0
% within
House
hold
monthly
income
6.3 14.8 .0 .0 .0 .0 .0 .0 5.7
% of Total .2 5.5 .0 .0 .0 .0 .0 .0 5.7
Navi
Mumbai
Count 2 2 2 0 0 0 0 1 7
% within
City
28.6 28.6 28.6 .0 .0 .0 .0 14.3 100.0
% within
House
hold
monthly
income
3.2 .3 .3 .0 .0 .0 .0 5.0 .4
% of Total .1 .1 .1 .0 .0 .0 .0 .1 .4
Pune Count 2 9 28 41 19 10 6 7 122
% within
City
1.6 7.4 23.0 33.6 15.6 8.2 4.9 5.7 100.0
% within
House
hold
monthly
income
3.2 1.3 4.0 17.5 17.3 30.3 37.5 35.0 6.5
% of Total .1 .5 1.5 2.2 1.0 .5 .3 .4 6.5
Shillong Count 0 60 0 0 0 0 0 0 60
% within
City
.0 100.0 .0 .0 .0 .0 .0 .0 100.0
% within
House
hold
monthly
income
.0 8.7 .0 .0 .0 .0 .0 .0 3.2
% of Total .0 3.2 .0 .0 .0 .0 .0 .0 3.2

291
Tenali Count 2 20 10 0 0 0 0 0 32
% within
City
6.2 62.5 31.2 .0 .0 .0 .0 .0 100.0
% within
House
hold
monthly
income
3.2 2.9 1.4 .0 .0 .0 .0 .0 1.7
% of Total .1 1.1 .5 .0 .0 .0 .0 .0 1.7
Thane Count 0 11 23 16 12 0 2 1 65
% within
City
.0 16.9 35.4 24.6 18.5 .0 3.1 1.5 100.0
% within
House
hold
monthly
income
.0 1.6 3.3 6.8 10.9 .0 12.5 5.0 3.5
% of Total .0 .6 1.2 .9 .6 .0 .1 .1 3.5
Tumkur Count 0 2 28 1 0 0 0 0 31
% within
City
.0 6.5 90.3 3.2 .0 .0 .0 .0 100.0
% within
House
hold
monthly
income
.0 .3 4.0 .4 .0 .0 .0 .0 1.7
% of Total .0 .1 1.5 .1 .0 .0 .0 .0 1.7
Kalyan Count 1 17 40 1 0 0 0 0 59
% within
City
1.7 28.8 67.8 1.7 .0 .0 .0 .0 100.0
% within
House
hold
monthly
income
1.6 2.5 5.7 .4 .0 .0 .0 .0 3.2
% of Total .1 .9 2.1 .1 .0 .0 .0 .0 3.2
Balaghat Count 0 52 1 0 0 0 0 0 53
% within
City
.0 98.1 1.9 .0 .0 .0 .0 .0 100.0
% within
House
hold
monthly
income
.0 7.5 .1 .0 .0 .0 .0 .0 2.8
% of Total .0 2.8 .1 .0 .0 .0 .0 .0 2.8

292
Jaipur Count 1 46 48 0 1 0 0 0 96
% within
City
1.0 47.9 50.0 .0 1.0 .0 .0 .0 100.0
% within
House
hold
monthly
income
1.6 6.7 6.8 .0 .9 .0 .0 .0 5.1
% of Total .1 2.5 2.6 .0 .1 .0 .0 .0 5.1
Yawatmal Count 1 24 0 0 0 0 0 0 25
% within
City
4.0 96.0 .0 .0 .0 .0 .0 .0 100.0
% within
House
hold
monthly
income
1.6 3.5 .0 .0 .0 .0 .0 .0 1.3
% of Total .1 1.3 .0 .0 .0 .0 .0 .0 1.3
Wardha Count 2 22 1 0 0 0 0 0 25
% within
City
8.0 88.0 4.0 .0 .0 .0 .0 .0 100.0
% within
House
hold
monthly
income
3.2 3.2 .1 .0 .0 .0 .0 .0 1.3
% of Total .1 1.2 .1 .0 .0 .0 .0 .0 1.3
Total Count 63 691 702 234 110 33 16 20 1869
% within
City
3.4 37.0 37.6 12.5 5.9 1.8 .9 1.1 100.0
% within
House
hold
monthly
income
100.0 100.0 100.0 100.0 100.0 100.0 100.0 100.0 100.0
% of Total 3.4 37.0 37.6 12.5 5.9 1.8 .9 1.1 100.0

293
Table 3.1.23 Type of waste picker and monthly household income (INR)
House hold monthly income (INR) Total
Types of
Waste
Picker
Upto
1000
1001
to
5000
5001
to
10000
10001
to
15000
15001
to
20000
20001
to
25000
25001
to
30000
Above
30000
Free
Roaming/
Independ-
ent
Local
Count 35 547 419 139 60 17 7 12 1236
% within
type of
waste
picker
2.8 44.3 33.9 11.2 4.9 1.4 .6 1.0 100.0
% within
House
hold
monthly
income
55.6 79.2 59.7 59.4 54.5 51.5 43.8 60.0 66.1
% of Total 1.9 29.3 22.4 7.4 3.2 .9 .4 .6 66.1
Free
Roaming
Migrant
Count 20 10 18 6 7 1 0 0 62
% within
type of
waste
picker
32.3 16.1 29.0 9.7 11.3 1.6 .0 .0 100.0
% within
House
hold
monthly
income
31.7 1.4 2.6 2.6 6.4 3.0 .0 .0 3.3
% of Total 1.1 .5 1.0 .3 .4 .1 .0 .0 3.3
Itinerant
Buyer
Count 0 1 3 6 2 0 0 0 12
% within
type of
waste
picker
.0 8.3 25.0 50.0 16.7 .0 .0 .0 100.0
% within
House
hold
monthly
income
.0 .1 .4 2.6 1.8 .0 .0 .0 .6
% of Total .0 .1 .2 .3 .1 .0 .0 .0 .6
Waste
Sorter
Count 3 66 59 11 1 0 0 0 140
% within
type of
waste
picker
2.1 47.1 42.1 7.9 .7 .0 .0 .0 100.0

294
% within
House
hold
monthly
income
4.8 9.6 8.4 4.7 .9 .0 .0 .0 7.5
% of Total .2 3.5 3.2 .6 .1 .0 .0 .0 7.5
Door-
to-Door
Collector
Count 4 57 174 63 29 13 6 7 353
% within
type of
waste
picker
1.1 16.1 49.3 17.8 8.2 3.7 1.7 2.0 100.0
% within
House
hold
monthly
income
6.3 8.2 24.8 26.9 26.4 39.4 37.5 35.0 18.9
% of Total .2 3.0 9.3 3.4 1.6 .7 .3 .4 18.9
Other
informal
worker
Count 1 2 8 1 0 0 0 0 12
% within
type of
waste
picker
8.3 16.7 66.7 8.3 .0 .0 .0 .0 100.0
% within
House
hold
monthly
income
1.6 .3 1.1 .4 .0 .0 .0 .0 .6
% of Total .1 .1 .4 .1 .0 .0 .0 .0 .6
Others Count 0 8 21 8 11 2 3 1 54
% within
type of
waste
picker
.0 14.8 38.9 14.8 20.4 3.7 5.6 1.9 100.0
% within
House
hold
monthly
income
.0 1.2 3.0 3.4 10.0 6.1 18.8 5.0 2.9
% of Total .0 .4 1.1 .4 .6 .1 .2 .1 2.9
Total Count 63 691 702 234 110 33 16 20 1869
% within
type of
waste
picker
3.4 37.0 37.6 12.5 5.9 1.8 .9 1.1 100.0
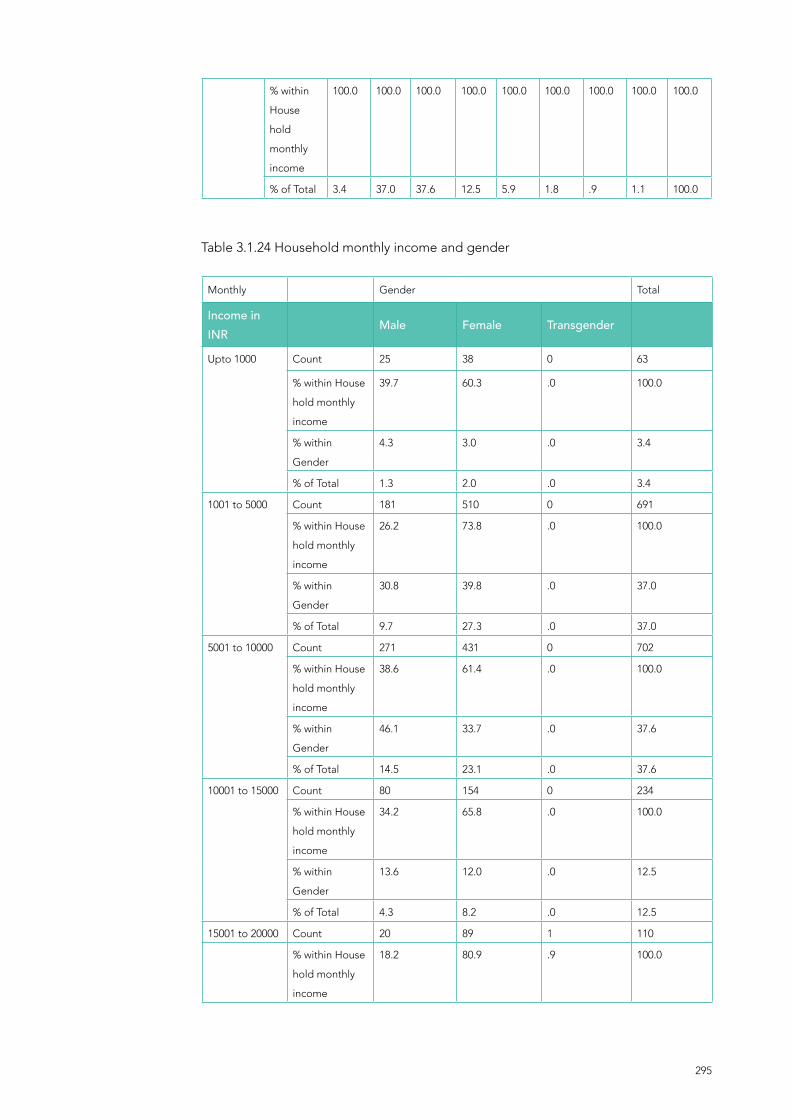
295
% within
House
hold
monthly
income
100.0 100.0 100.0 100.0 100.0 100.0 100.0 100.0 100.0
% of Total 3.4 37.0 37.6 12.5 5.9 1.8 .9 1.1 100.0
Table 3.1.24 Household monthly income and gender
Monthly Gender Total
Income in INR
Male Female Transgender
Upto 1000 Count 25 38 0 63
% within House
hold monthly
income
39.7 60.3 .0 100.0
% within
Gender
4.3 3.0 .0 3.4
% of Total 1.3 2.0 .0 3.4
1001 to 5000 Count 181 510 0 691
% within House
hold monthly
income
26.2 73.8 .0 100.0
% within
Gender
30.8 39.8 .0 37.0
% of Total 9.7 27.3 .0 37.0
5001 to 10000 Count 271 431 0 702
% within House
hold monthly
income
38.6 61.4 .0 100.0
% within
Gender
46.1 33.7 .0 37.6
% of Total 14.5 23.1 .0 37.6
10001 to 15000 Count 80 154 0 234
% within House
hold monthly
income
34.2 65.8 .0 100.0
% within
Gender
13.6 12.0 .0 12.5
% of Total 4.3 8.2 .0 12.5
15001 to 20000 Count 20 89 1 110
% within House
hold monthly
income
18.2 80.9 .9 100.0

296
% within
Gender
3.4 7.0 100.0 5.9
% of Total 1.1 4.8 .1 5.9
20001 to 25000 Count 5 28 0 33
% within House
hold monthly
income
15.2 84.8 .0 100.0
% within
Gender
.9 2.2 .0 1.8
% of Total .3 1.5 .0 1.8
25001 to 30000 Count 4 12 0 16
% within House
hold monthly
income
25.0 75.0 .0 100.0
% within
Gender
.7 .9 .0 .9
% of Total .2 .6 .0 .9
Above 30000 Count 2 18 0 20
% within House
hold monthly
income
10.0 90.0 .0 100.0
% within
Gender
.3 1.4 .0 1.1
% of Total .1 1.0 .0 1.1
Total Count 588 1280 1 1869
% within House
hold monthly
income
31.5 68.5 .1 100.0
% within
Gender
100.0 100.0 100.0 100.0
% of Total 31.5 68.5 .1 100.0
Table 3.1.25 Monthly income from waste collection
Monthly Income from waste collection (INR)
Number of respondents Percent (%)
up to 1000 68 3.6
1001 to 5000 747 40
5001 to 10000 834 44.6
10001 to 15000 154 8.2
15001 to 20000 46 2.5
20001 to 25000 13 0.7
25001 to 30000 2 0.1
Above 30000 5 0.3
Total 1869 100

297
Table 3.1.26 City wise distribution of respondents and monthly income from waste collection
Income from Waste collection
TotalCity
Upto
1000
1001
to
5000
5001
to
10000
10001
to
15000
15001
to
20000
20001
to
25000
25001
to
30000
300001
and
above
Bengaluru Count 0 26 78 41 16 8 0 5 174
% within
City
.0 14.9 44.8 23.6 9.2 4.6 .0 2.9 100.0
% within
Income
from
Waste
collection
.0 3.5 9.4 26.6 34.8 61.5 .0 100.0 9.3
% of Total .0 1.4 4.2 2.2 .9 .4 .0 .3 9.3
Bhopal Count 2 42 49 9 0 0 0 0 102
% within
City
2.0 41.2 48.0 8.8 .0 .0 .0 .0 100.0
% within
Income
from
Waste
collection
2.9 5.6 5.9 5.8 .0 .0 .0 .0 5.5
% of Total .1 2.2 2.6 .5 .0 .0 .0 .0 5.5
Chamraj
nagar
Count 0 3 0 0 0 0 0 0 3
% within
City
.0 100.0 .0 .0 .0 .0 .0 .0 100.0
% within
Income
from
Waste
collection
.0 .4 .0 .0 .0 .0 .0 .0 .2
% of Total .0 .2 .0 .0 .0 .0 .0 .0 .2
Delhi Count 1 40 173 9 5 0 0 0 228
% within
City
.4 17.5 75.9 3.9 2.2 .0 .0 .0 100.0
% within
Income
from
Waste
collection
1.5 5.4 20.7 5.8 10.9 .0 .0 .0 12.2
% of Total .1 2.1 9.3 .5 .3 .0 .0 .0 12.2
Guntur Count 1 130 124 6 7 1 0 0 269
% within
City
.4 48.3 46.1 2.2 2.6 .4 .0 .0 100.0

298
% within
Income
from
Waste
collection
1.5 17.4 14.9 3.9 15.2 7.7 .0 .0 14.4
% of Total .1 7.0 6.6 .3 .4 .1 .0 .0 14.4
Indore Count 5 37 27 43 2 0 0 0 114
% within
City
4.4 32.5 23.7 37.7 1.8 .0 .0 .0 100.0
% within
Income
from
Waste
collection
7.4 5.0 3.2 27.9 4.3 .0 .0 .0 6.1
% of Total .3 2.0 1.4 2.3 .1 .0 .0 .0 6.1
Mumbai Count 31 17 75 22 4 0 0 0 149
% within
City
20.8 11.4 50.3 14.8 2.7 .0 .0 .0 100.0
% within
Income
from
Waste
collection
45.6 2.3 9.0 14.3 8.7 .0 .0 .0 8.0
% of Total 1.7 .9 4.0 1.2 .2 .0 .0 .0 8.0
Mysore Count 0 72 77 0 0 0 0 0 149
% within
City
.0 48.3 51.7 .0 .0 .0 .0 .0 100.0
% within
Income
from
Waste
collection
.0 9.6 9.2 .0 .0 .0 .0 .0 8.0
% of Total .0 3.9 4.1 .0 .0 .0 .0 .0 8.0
Nashik Count 10 96 0 0 0 0 0 0 106
% within
City
9.4 90.6 .0 .0 .0 .0 .0 .0 100.0
% within
Income
from
Waste
collection
14.7 12.9 .0 .0 .0 .0 .0 .0 5.7
% of Total .5 5.1 .0 .0 .0 .0 .0 .0 5.7
Navi
Mumbai
Count 5 2 0 0 0 0 0 0 7
% within
City
71.4 28.6 .0 .0 .0 .0 .0 .0 100.0

299
% within
Income
from
Waste
collection
7.4 .3 .0 .0 .0 .0 .0 .0 .4
% of Total .3 .1 .0 .0 .0 .0 .0 .0 .4
Pune Count 0 37 47 20 12 4 2 0 122
% within
City
.0 30.3 38.5 16.4 9.8 3.3 1.6 .0 100.0
% within
Income
from
Waste
collection
.0 5.0 5.6 13.0 26.1 30.8 100.0 .0 6.5
% of Total .0 2.0 2.5 1.1 .6 .2 .1 .0 6.5
Shillong Count 0 44 16 0 0 0 0 0 60
% within
City
.0 73.3 26.7 .0 .0 .0 .0 .0 100.0
% within
Income
from
Waste
collection
.0 5.9 1.9 .0 .0 .0 .0 .0 3.2
% of Total .0 2.4 .9 .0 .0 .0 .0 .0 3.2
Tenali Count 2 20 10 0 0 0 0 0 32
% within
City
6.2 62.5 31.2 .0 .0 .0 .0 .0 100.0
% within
Income
from
Waste
collection
2.9 2.7 1.2 .0 .0 .0 .0 .0 1.7
% of Total .1 1.1 .5 .0 .0 .0 .0 .0 1.7
Thane Count 0 33 30 2 0 0 0 0 65
% within
City
.0 50.8 46.2 3.1 .0 .0 .0 .0 100.0
% within
Income
from
Waste
collection
.0 4.4 3.6 1.3 .0 .0 .0 .0 3.5
% of Total .0 1.8 1.6 .1 .0 .0 .0 .0 3.5
Tumkur Count 0 11 20 0 0 0 0 0 31
% within
City
.0 35.5 64.5 .0 .0 .0 .0 .0 100.0

300
% within
Income
from
Waste
collection
.0 1.5 2.4 .0 .0 .0 .0 .0 1.7
% of Total .0 .6 1.1 .0 .0 .0 .0 .0 1.7
Kalyan Count 0 1 56 2 0 0 0 0 59
% within
City
.0 1.7 94.9 3.4 .0 .0 .0 .0 100.0
% within
Income
from
Waste
collection
.0 .1 6.7 1.3 .0 .0 .0 .0 3.2
% of Total .0 .1 3.0 .1 .0 .0 .0 .0 3.2
Balaghat Count 0 50 3 0 0 0 0 0 53
% within
City
.0 94.3 5.7 .0 .0 .0 .0 .0 100.0
% within
Income
from
Waste
collection
.0 6.7 .4 .0 .0 .0 .0 .0 2.8
% of Total .0 2.7 .2 .0 .0 .0 .0 .0 2.8
Jaipur Count 1 47 48 0 0 0 0 0 96
% within
City
1.0 49.0 50.0 .0 .0 .0 .0 .0 100.0
% within
Income
from
Waste
collection
1.5 6.3 5.8 .0 .0 .0 .0 .0 5.1
% of Total .1 2.5 2.6 .0 .0 .0 .0 .0 5.1
Yawatmal Count 0 25 0 0 0 0 0 0 25
% within
City
.0 100.0 .0 .0 .0 .0 .0 .0 100.0
% within
Income
from
Waste
collection
.0 3.3 .0 .0 .0 .0 .0 .0 1.3
% of Total .0 1.3 .0 .0 .0 .0 .0 .0 1.3

301
Wardha Count 10 14 1 0 0 0 0 0 25
% within
City
40.0 56.0 4.0 .0 .0 .0 .0 .0 100.0
% within
Income
from
Waste
collection
14.7 1.9 .1 .0 .0 .0 .0 .0 1.3
% of Total .5 .7 .1 .0 .0 .0 .0 .0 1.3
Total Count 68 747 834 154 46 13 2 5 1869
% within
City
3.6 40.0 44.6 8.2 2.5 .7 .1 .3 100.0
% within
Income
from
Waste
collection
100.0 100.0 100.0 100.0 100.0 100.0 100.0 100.0 100.0
% of Total 3.6 40.0 44.6 8.2 2.5 .7 .1 .3 100.0
Table 3.1.27 Type of waste picker and monthly income from waste collection (INR)
Income from Waste collection
TotalType of
Waste
Picker
Upto
1000
1001
to
5000
5001
to
10000
10001
to
15000
15001
to
20000
20001
to
25000
25001
to
30000
300001
and
above
Free
Roaming/
Indepen-
dent
Local
Count 56 596 486 77 19 2 0 0 1236
% within
type of
waste
picker
4.5 48.2 39.3 6.2 1.5 .2 .0 .0 100.0
% within
Income
from
Waste
collection
82.4 79.8 58.3 50.0 41.3 15.4 .0 .0 66.1
% of Total 3.0 31.9 26.0 4.1 1.0 .1 .0 .0 66.1
Free
Roaming
Migrant
Count 5 9 33 11 4 0 0 0 62
% within
type of
waste
picker
8.1 14.5 53.2 17.7 6.5 .0 .0 .0 100.0

302
% within
Income
from
Waste
collection
7.4 1.2 4.0 7.1 8.7 .0 .0 .0 3.3
% of Total .3 .5 1.8 .6 .2 .0 .0 .0 3.3
Itinerant
Buyer
Count 0 5 6 1 0 0 0 0 12
% within
type of
waste
picker
.0 41.7 50.0 8.3 .0 .0 .0 .0 100.0
% within
Income
from
Waste
collection
.0 .7 .7 .6 .0 .0 .0 .0 .6
% of Total .0 .3 .3 .1 .0 .0 .0 .0 .6
Waste
Sorter
Count 0 45 70 19 4 0 0 2 140
% within
type of
waste
picker
.0 32.1 50.0 13.6 2.9 .0 .0 1.4 100.0
% within
Income
from
Waste
collection
.0 6.0 8.4 12.3 8.7 .0 .0 40.0 7.5
% of Total .0 2.4 3.7 1.0 .2 .0 .0 .1 7.5
Door-
to-Door
Collector
Count 2 83 195 39 19 10 2 3 353
% within
type of
waste
picker
.6 23.5 55.2 11.0 5.4 2.8 .6 .8 100.0
% within
Income
from
Waste
collection
2.9 11.1 23.4 25.3 41.3 76.9 100.0 60.0 18.9
% of Total .1 4.4 10.4 2.1 1.0 .5 .1 .2 18.9
Other
informal
worker
Count 2 2 6 2 0 0 0 0 12
% within
type of
waste
picker
16.7 16.7 50.0 16.7 .0 .0 .0 .0 100.0

303
% within
Income
from
Waste
collection
2.9 .3 .7 1.3 .0 .0 .0 .0 .6
% of Total .1 .1 .3 .1 .0 .0 .0 .0 .6
Others Count 3 7 38 5 0 1 0 0 54
% within
type of
waste
picker
5.6 13.0 70.4 9.3 .0 1.9 .0 .0 100.0
% within
Income
from
Waste
collection
4.4 .9 4.6 3.2 .0 7.7 .0 .0 2.9
% of Total .2 .4 2.0 .3 .0 .1 .0 .0 2.9
Total Count 68 747 834 154 46 13 2 5 1869
% within
type of
waste
picker
3.6 40.0 44.6 8.2 2.5 .7 .1 .3 100.0
% within
Income
from
Waste
collection
100.0 100.0 100.0 100.0 100.0 100.0 100.0 100.0 100.0
% of Total 3.6 40.0 44.6 8.2 2.5 .7 .1 .3 100.0
Table 3.1.28 Monthly income from waste collection and city wise and type of waste collection
Income from the waste collecters
TotalCity
Type of
Waste
Picker
Upto
1000
1001
to
5000
5001
to
10000
100001
to
15000
15001
to
20000
20001
to
25000
30001
and
above
Bengaluru Free Roaming
/Independent
local
Count 21 43 19 7 2 0 92
% within
type of
waste
picker
22.80 46.70 20.70 7.60 2.20 0.00 100.00
Free Roaming
Migrant
Count 0 19 6 4 0 0 29
% within
type of
waste
picker
0.00 65.50 20.70 13.80 0.00 0.00 100.00
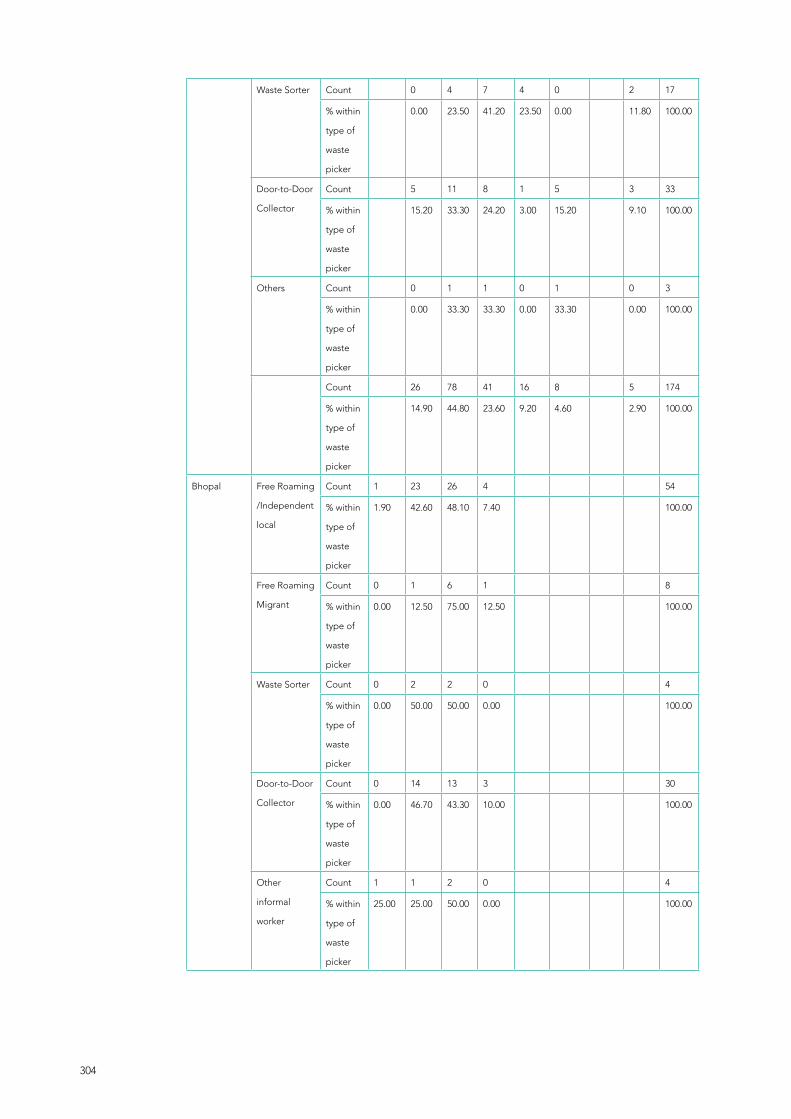
304
Waste Sorter Count 0 4 7 4 0 2 17
% within
type of
waste
picker
0.00 23.50 41.20 23.50 0.00 11.80 100.00
Door-to-Door
Collector
Count 5 11 8 1 5 3 33
% within
type of
waste
picker
15.20 33.30 24.20 3.00 15.20 9.10 100.00
Others Count 0 1 1 0 1 0 3
% within
type of
waste
picker
0.00 33.30 33.30 0.00 33.30 0.00 100.00
Count 26 78 41 16 8 5 174
% within
type of
waste
picker
14.90 44.80 23.60 9.20 4.60 2.90 100.00
Bhopal Free Roaming
/Independent
local
Count 1 23 26 4 54
% within
type of
waste
picker
1.90 42.60 48.10 7.40 100.00
Free Roaming
Migrant
Count 0 1 6 1 8
% within
type of
waste
picker
0.00 12.50 75.00 12.50 100.00
Waste Sorter Count 0 2 2 0 4
% within
type of
waste
picker
0.00 50.00 50.00 0.00 100.00
Door-to-Door
Collector
Count 0 14 13 3 30
% within
type of
waste
picker
0.00 46.70 43.30 10.00 100.00
Other
informal
worker
Count 1 1 2 0 4
% within
type of
waste
picker
25.00 25.00 50.00 0.00 100.00

305
Others Count 0 1 0 1 2
% within
type of
waste
picker
0.00 50.00 0.00 50.00 100.00
Count 2 42 49 9 102
% within
type of
waste
picker
2.00 41.20 48.00 8.80 100.00
Chamraj
nagar
Free Roaming
/Independent
local
Count 2 2
% within
type of
waste
picker
100.00 100.00
Itinerant
Buyer
Count 1 1
% within
type of
waste
picker
100.00 100.00
Count 3 3
% within
type of
waste
picker
100.00 100.00
Delhi Free Roaming
/Independent
local
Count 0 10 31 2 0 43
% within
type of
waste
picker
0.00 23.30 72.10 4.70 0.00 100.00
Itinerant
Buyer
Count 0 0 0 1 0 1
% within
type of
waste
picker
0.00 0.00 0.00 100.00 0.00 100.00
Waste Sorter Count 0 1 6 0 0 7
% within
type of
waste
picker
0.00 14.30 85.70 0.00 0.00 100.00
Door-to-Door
Collector
Count 1 24 116 6 5 152
% within
type of
waste
picker
0.70 15.80 76.30 3.90 3.30 100.00

306
Other
informal
worker
Count 0 0 3 0 0 3
% within
type of
waste
picker
0.00 0.00 100.00 0.00 0.00 100.00
Others Count 0 5 17 0 0 22
% within
type of
waste
picker
0.00 22.70 77.30 0.00 0.00 100.00
Count 1 40 173 9 5 228
% within
type of
waste
picker
0.40 17.50 75.90 3.90 2.20 100.00
Guntur Free Roaming
/Independent
local
Count 0 119 111 4 6 0 240
% within
type of
waste
picker
0.00 49.60 46.20 1.70 2.50 0.00 100.00
Free Roaming
Migrant
Count 0 0 1 0 0 0 1
% within
type of
waste
picker
0.00 0.00 100.00 0.00 0.00 0.00 100.00
Waste Sorter Count 0 11 8 0 0 0 19
% within
type of
waste
picker
0.00 57.90 42.10 0.00 0.00 0.00 100.00
Door-to-Door
Collector
Count 0 0 2 2 1 1 6
% within
type of
waste
picker
0.00 0.00 33.30 33.30 16.70 16.70 100.00
Other
informal
worker
Count 1 0 1 0 0 0 2
% within
type of
waste
picker
50.00 0.00 50.00 0.00 0.00 0.00 100.00
Others Count 0 0 1 0 0 0 1
% within
type of
waste
picker
0.00 0.00 100.00 0.00 0.00 0.00 100.00

307
Count 1 130 124 6 7 1 269
% within
type of
waste
picker
0.40 48.30 46.10 2.20 2.60 0.40 100.00
Indore Free Roaming
/Independent
local
Count 4 33 23 24 2 86
% within
type of
waste
picker
4.70 38.40 26.70 27.90 2.30 100.00
Free Roaming
Migrant
Count 1 2 1 4 0 8
% within
type of
waste
picker
12.50 25.00 12.50 50.00 0.00 100.00
Itinerant
Buyer
Count 0 1 0 0 0 1
% within
type of
waste
picker
0.00 100.00 0.00 0.00 0.00 100.00
Waste Sorter Count 0 1 2 12 0 15
% within
type of
waste
picker
0.00 6.70 13.30 80.00 0.00 100.00
Door-to-Door
Collector
Count 0 0 1 0 0 1
% within
type of
waste
picker
0.00 0.00 100.00 0.00 0.00 100.00
Other
informal
worker
Count 0 0 0 2 0 2
% within
type of
waste
picker
0.00 0.00 0.00 100.00 0.00 100.00
Others Count 0 0 0 1 0 1
% within
type of
waste
picker
0.00 0.00 0.00 100.00 0.00 100.00
Count 5 37 27 43 2 114
% within
type of
waste
picker
4.40 32.50 23.70 37.70 1.80 100.00

308
Mumbai Free Roaming
/Independent
local
Count 25 16 55 20 4 120
% within
type of
waste
picker
20.80 13.30 45.80 16.70 3.30 100.00
Free Roaming
Migrant
Count 3 0 0 0 0 3
% within
type of
waste
picker
100.00 0.00 0.00 0.00 0.00 100.00
Itinerant
Buyer
Count 0 1 0 0 0 1
% within
type of
waste
picker
0.00 100.00 0.00 0.00 0.00 100.00
Door-to-Door
Collector
Count 0 0 1 0 0 1
% within
type of
waste
picker
0.00 0.00 100.00 0.00 0.00 100.00
Others Count 3 0 19 2 0 24
% within
type of
waste
picker
12.50 0.00 79.20 8.30 0.00 100.00
Count 31 17 75 22 4 149
% within
type of
waste
picker
20.80 11.40 50.30 14.80 2.70 100.00
Mysore Free Roaming
/Independent
local
Count 67 64 131
% within
type of
waste
picker
51.10 48.90 100.00
Free Roaming
Migrant
Count 0 4 4
% within
type of
waste
picker
0.00 100.00 100.00
Itinerant
Buyer
Count 1 5 6
% within
type of
waste
picker
16.70 83.30 100.00

309
Waste Sorter Count 2 4 6
% within
type of
waste
picker
33.30 66.70 100.00
Door-to-Door
Collector
Count 2 0 2
% within
type of
waste
picker
100.00 0.00 100.00
Count 72 77 149
% within
type of
waste
picker
48.30 51.70 100.00
Nashik Free Roaming
/Independent
local
Count 10 95 105
% within
type of
waste
picker
9.50 90.50 100.00
Door-to-Door
Collector
Count 0 1 1
% within
type of
waste
picker
0.00 100.00 100.00
Count 10 96 106
% within
type of
waste
picker
9.40 90.60 100.00
Navi
Mumbai
Free Roaming
/Independent
local
Count 5 2 7
% within
type of
waste
picker
71.40 28.60 100.00
Count 5 2 7
% within
type of
waste
picker
71.40 28.60 100.00
Pune Waste Sorter Count 0 1 0 0 0 0 1
% within
type of
waste
picker
0.00 100.00 0.00 0.00 0.00 0.00 100.00

310
Door-to-Door
Collector
Count 36 46 20 12 4 2 120
% within
type of
waste
picker
30.00 38.30 16.70 10.00 3.30 1.70 100.00
Others Count 1 0 0 0 0 0 1
% within
type of
waste
picker
100.00 0.00 0.00 0.00 0.00 0.00 100.00
Count 37 47 20 12 4 2 122
% within
type of
waste
picker
30.30 38.50 16.40 9.80 3.30 1.60 100.00
Shillong Free Roaming
/Independent
local
Count 29 3 32
% within
type of
waste
picker
90.60 9.40 100.00
Waste Sorter Count 15 13 28
% within
type of
waste
picker
53.60 46.40 100.00
Count 44 16 60
% within
type of
waste
picker
73.30 26.70 100.00
Tenali Free Roaming
/Independent
local
Count 0 10 10 20
% within
type of
waste
picker
0.00 50.00 50.00 100.00
Free Roaming
Migrant
Count 1 4 0 5
% within
type of
waste
picker
20.00 80.00 0.00 100.00
Waste Sorter Count 0 5 0 5
% within
type of
waste
picker
0.00 100.00 0.00 100.00

311
Door-to-Door
Collector
Count 1 0 0 1
% within
type of
waste
picker
100.00 0.00 0.00 100.00
Other
informal
worker
Count 0 1 0 1
% within
type of
waste
picker
0.00 100.00 0.00 100.00
Count 2 20 10 32
% within
type of
waste
picker
6.20 62.50 31.20 100.00
Thane Free Roaming
/Independent
local
Count 27 28 2 57
% within
type of
waste
picker
47.40 49.10 3.50 100.00
Waste Sorter Count 6 2 0 8
% within
type of
waste
picker
75.00 25.00 0.00 100.00
Count 33 30 2 65
% within
type of
waste
picker
50.80 46.20 3.10 100.00
Tumkur Free Roaming
/Independent
local
Count 10 18 28
% within
type of
waste
picker
35.70 64.30 100.00
Free Roaming
Migrant
Count 0 1 1
% within
type of
waste
picker
0.00 100.00 100.00
Itinerant
Buyer
Count 1 1 2
% within
type of
waste
picker
50.00 50.00 100.00

312
Count 11 20 31
% within
type of
waste
picker
35.50 64.50 100.00
Kalyan Free Roaming
/Independent
local
Count 1 27 2 30
% within
type of
waste
picker
3.30 90.00 6.70 100.00
Free Roaming
Migrant
Count 0 1 0 1
% within
type of
waste
picker
0.00 100.00 0.00 100.00
Waste Sorter Count 0 28 0 28
% within
type of
waste
picker
0.00 100.00 0.00 100.00
Count 1 56 2 59
% within
type of
waste
picker
1.70 94.90 3.40 100.00
Balaghat Free Roaming
/Independent
local
Count 46 2 48
% within
type of
waste
picker
95.80 4.20 100.00
Free Roaming
Migrant
Count 2 0 2
% within
type of
waste
picker
100.00 0.00 100.00
Waste Sorter Count 2 0 2
% within
type of
waste
picker
100.00 0.00 100.00
Door-to-Door
Collector
Count 0 1 1
% within
type of
waste
picker
0.00 100.00 100.00

313
Count 50 3 53
% within
type of
waste
picker
94.30 5.70 100.00
Jaipur Free Roaming
/Independent
local
Count 1 46 44 91
% within
type of
waste
picker
1.10 50.50 48.40 100.00
Door-to-Door
Collector
Count 0 1 4 5
% within
type of
waste
picker
0.00 20.00 80.00 100.00
Count 1 47 48 96
% within
type of
waste
picker
1.00 49.00 50.00 100.00
Yawatmal Free Roaming
/Independent
local
Count 25 25
% within
type of
waste
picker
100.00 100.00
Count 25 25
% within
type of
waste
picker
100.00 100.00
Wardha Free Roaming
/Independent
local
Count 10 14 1 25
% within
type of
waste
picker
40.00 56.00 4.00 100.00
Count 10 14 1 25
% within
type of
waste
picker
40.00 56.00 4.00 100.00

314
Table 3.1.29 Type of Identity Cards possessed by respondents
Type of Identity Card Number of respondents Percent (%)
Aadhaar Card/UID 1669 32.8
Voter ID 1221 24
Pan Card 691 13.6
Ration Card 951 18.7
BPL Card 361 7.1
Driving License 51 1
None 108 2.1
Others 39 0.8
Total 5091 100
Table 3.1.30 City wise distribution of respondents and Identity card
Identity Card
TotalAadhar
card
Voter
ID
Pan
Card
Ration
card
BPL
Card
Driving
LicenseNone Others
Bengaluru Count 152 114 75 61 56 23 20 2 174
% within
City
87.4 65.5 43.1 35.1 32.2 13.2 11.5 1.1
% within
ID Card
9.1 9.3 10.9 6.4 15.5 45.1 18.5 5.1
% of Total 8.1 6.1 4.0 3.3 3.0 1.2 1.1 .1 9.3
Bhopal Count 91 76 11 58 13 1 7 0 102
% within
City
89.2 74.5 10.8 56.9 12.7 1.0 6.9 .0
% within
ID Card
5.5 6.2 1.6 6.1 3.6 2.0 6.5 .0
% of Total 4.9 4.1 .6 3.1 .7 .1 .4 .0 5.5
Chamraj
nagar
Count 3 0 0 0 0 0 0 0 3
% within
City
100.0 .0 .0 .0 .0 .0 .0 .0
% within
ID Card
.2 .0 .0 .0 .0 .0 .0 .0
% of Total .2 .0 .0 .0 .0 .0 .0 .0 .2
Delhi Count 195 156 87 48 8 9 8 0 228
% within
City
85.5 68.4 38.2 21.1 3.5 3.9 3.5 .0
% within
ID Card
11.7 12.8 12.6 5.0 2.2 17.6 7.4 .0
% of Total 10.4 8.3 4.7 2.6 .4 .5 .4 .0 12.2
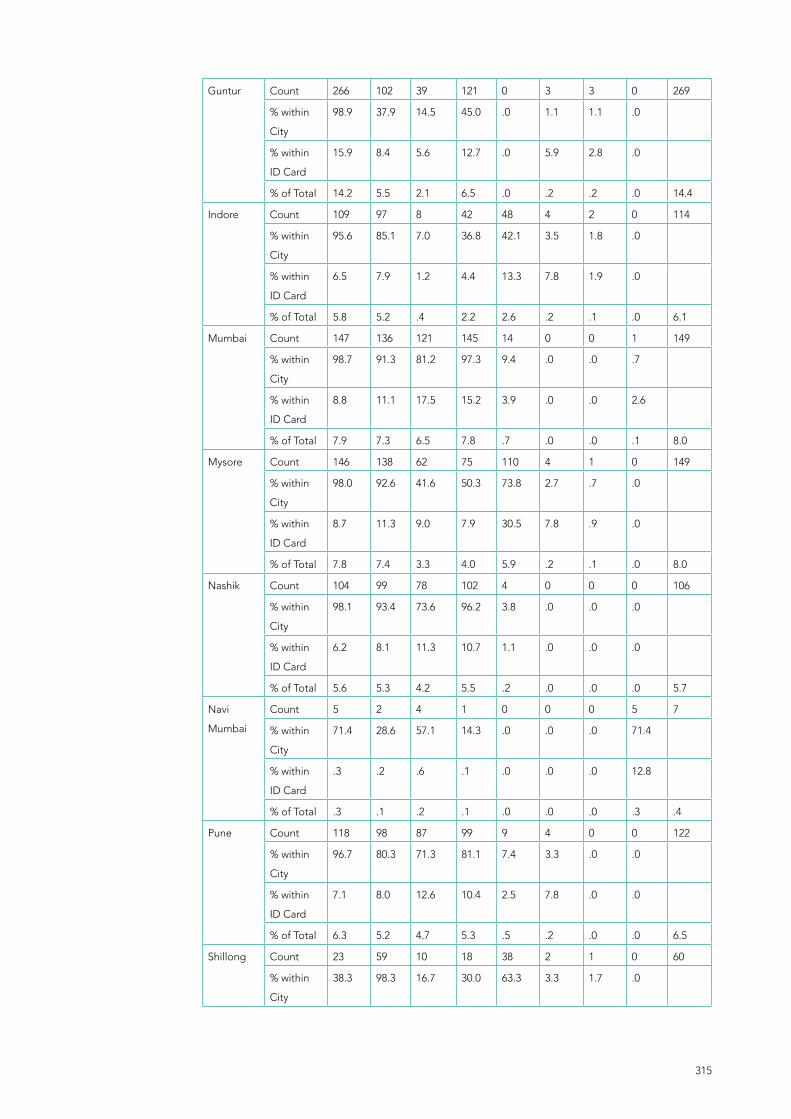
315
Table 3.1.29 Type of Identity Cards possessed by respondents Guntur Count 266 102 39 121 0 3 3 0 269
% within
City
98.9 37.9 14.5 45.0 .0 1.1 1.1 .0
% within
ID Card
15.9 8.4 5.6 12.7 .0 5.9 2.8 .0
% of Total 14.2 5.5 2.1 6.5 .0 .2 .2 .0 14.4
Indore Count 109 97 8 42 48 4 2 0 114
% within
City
95.6 85.1 7.0 36.8 42.1 3.5 1.8 .0
% within
ID Card
6.5 7.9 1.2 4.4 13.3 7.8 1.9 .0
% of Total 5.8 5.2 .4 2.2 2.6 .2 .1 .0 6.1
Mumbai Count 147 136 121 145 14 0 0 1 149
% within
City
98.7 91.3 81.2 97.3 9.4 .0 .0 .7
% within
ID Card
8.8 11.1 17.5 15.2 3.9 .0 .0 2.6
% of Total 7.9 7.3 6.5 7.8 .7 .0 .0 .1 8.0
Mysore Count 146 138 62 75 110 4 1 0 149
% within
City
98.0 92.6 41.6 50.3 73.8 2.7 .7 .0
% within
ID Card
8.7 11.3 9.0 7.9 30.5 7.8 .9 .0
% of Total 7.8 7.4 3.3 4.0 5.9 .2 .1 .0 8.0
Nashik Count 104 99 78 102 4 0 0 0 106
% within
City
98.1 93.4 73.6 96.2 3.8 .0 .0 .0
% within
ID Card
6.2 8.1 11.3 10.7 1.1 .0 .0 .0
% of Total 5.6 5.3 4.2 5.5 .2 .0 .0 .0 5.7
Navi
Mumbai
Count 5 2 4 1 0 0 0 5 7
% within
City
71.4 28.6 57.1 14.3 .0 .0 .0 71.4
% within
ID Card
.3 .2 .6 .1 .0 .0 .0 12.8
% of Total .3 .1 .2 .1 .0 .0 .0 .3 .4
Pune Count 118 98 87 99 9 4 0 0 122
% within
City
96.7 80.3 71.3 81.1 7.4 3.3 .0 .0
% within
ID Card
7.1 8.0 12.6 10.4 2.5 7.8 .0 .0
% of Total 6.3 5.2 4.7 5.3 .5 .2 .0 .0 6.5
Shillong Count 23 59 10 18 38 2 1 0 60
% within
City
38.3 98.3 16.7 30.0 63.3 3.3 1.7 .0

316
% within
ID Card
1.4 4.8 1.4 1.9 10.5 3.9 .9 .0
% of Total 1.2 3.2 .5 1.0 2.0 .1 .1 .0 3.2
Tenali Count 32 19 0 20 0 0 0 0 32
% within
City
100.0 59.4 .0 62.5 .0 .0 .0 .0
% within
ID Card
1.9 1.6 .0 2.1 .0 .0 .0 .0
% of Total 1.7 1.0 .0 1.1 .0 .0 .0 .0 1.7
Thane Count 64 49 50 53 7 0 1 8 65
% within
City
98.5 75.4 76.9 81.5 10.8 .0 1.5 12.3
% within
ID Card
3.8 4.0 7.2 5.6 1.9 .0 .9 20.5
% of Total 3.4 2.6 2.7 2.8 .4 .0 .1 .4 3.5
Tumkur Count 31 29 8 29 29 0 0 0 31
% within
City
100.0 93.5 25.8 93.5 93.5 .0 .0 .0
% within
ID Card
1.9 2.4 1.2 3.0 8.0 .0 .0 .0
% of Total 1.7 1.6 .4 1.6 1.6 .0 .0 .0 1.7
Kalyan Count 49 11 46 49 16 1 1 23 59
% within
City
83.1 18.6 78.0 83.1 27.1 1.7 1.7 39.0
% within
ID Card
2.9 .9 6.7 5.2 4.4 2.0 .9 59.0
% of Total 2.6 .6 2.5 2.6 .9 .1 .1 1.2 3.2
Balaghat Count 24 14 0 12 8 0 28 0 53
% within
City
45.3 26.4 .0 22.6 15.1 .0 52.8 .0
% within
ID Card
1.4 1.1 .0 1.3 2.2 .0 25.9 .0
% of Total 1.3 .7 .0 .6 .4 .0 1.5 .0 2.8
Jaipur Count 86 19 1 11 1 0 10 0 96
% within
City
89.6 19.8 1.0 11.5 1.0 .0 10.4 .0
% within
ID Card
5.2 1.6 .1 1.2 .3 .0 9.3 .0
% of Total 4.6 1.0 .1 .6 .1 .0 .5 .0 5.1
Yawatmal Count 1 1 1 1 0 0 24 0 25
% within
City
4.0 4.0 4.0 4.0 .0 .0 96.0 .0
% within
ID Card
.1 .1 .1 .1 .0 .0 22.2 .0
% of Total .1 .1 .1 .1 .0 .0 1.3 .0 1.3

317
Wardha Count 23 2 3 6 0 0 2 0 25
% within
City
92.0 8.0 12.0 24.0 .0 .0 8.0 .0
% within
ID Card
1.4 .2 .4 .6 .0 .0 1.9 .0
% of Total 1.2 .1 .2 .3 .0 .0 .1 .0 1.3
Total Count 1669 1221 691 951 361 51 108 39 1869
% of Total 89.3 65.3 37.0 50.9 19.3 2.7 5.8 2.1 100.0
Table 3.1.31 Type of waste picker and Identity card
Identity Card
TotalAadhar
card
Voter
ID
Pan
Card
Ration
card
BPL
Card
Driving
LicenseNone Others
Free
Roaming/
Indepen-
dent
Local
Count 1117 788 404 652 258 22 91 32 3364
% within
type of
waste
picker
33.2 23.4 12.0 19.4 7.7 .7 2.7 1.0
% within in
Identity
66.3 64.4 58.3 68.5 71.3 36.7 82.0 80.0
% of Total 21.8 15.4 7.9 12.7 5.0 .4 1.8 .6 65.6
Free
Roaming
Migrant
Count 54 34 18 16 16 1 8 1 148
% within
type of
waste
picker
36.5 23.0 12.2 10.8 10.8 .7 5.4 .7
% within in
Identity
3.2 2.8 2.6 1.7 4.4 1.7 7.2 2.5
% of Total 1.1 .7 .4 .3 .3 .0 .2 .0 2.9
Itinerant
Buyer
Count 11 10 5 8 5 2 0 0 41
% within
type of
waste
picker
26.8 24.4 12.2 19.5 12.2 4.9 .0 .0
% within in
Identity
.7 .8 .7 .8 1.4 3.3 .0 .0
% of Total .2 .2 .1 .2 .1 .0 .0 .0 .8
Waste
Sorter
Count 117 80 43 68 44 8 5 7 372
% within
type of
waste
picker
31.5 21.5 11.6 18.3 11.8 2.2 1.3 1.9
% within in
Identity
6.9 6.5 6.2 7.1 12.2 13.3 4.5 17.5
% of Total 2.3 1.6 .8 1.3 .9 .2 .1 .1 7.3
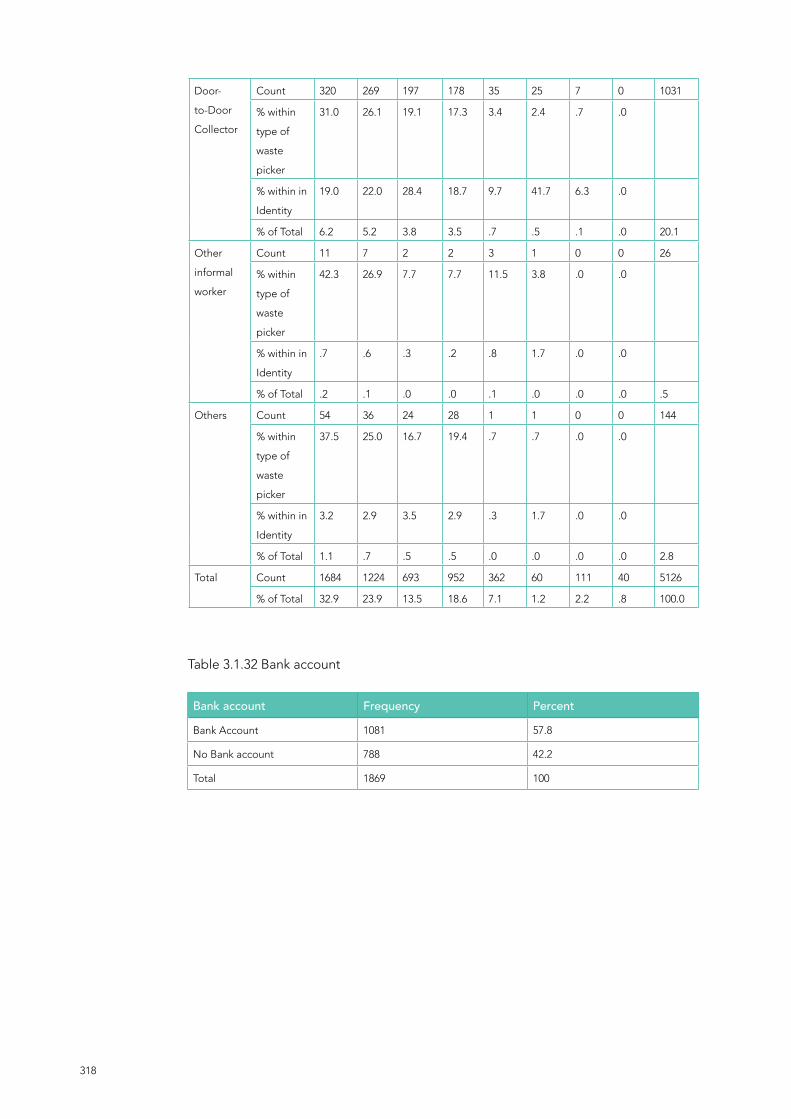
318
Door-
to-Door
Collector
Count 320 269 197 178 35 25 7 0 1031
% within
type of
waste
picker
31.0 26.1 19.1 17.3 3.4 2.4 .7 .0
% within in
Identity
19.0 22.0 28.4 18.7 9.7 41.7 6.3 .0
% of Total 6.2 5.2 3.8 3.5 .7 .5 .1 .0 20.1
Other
informal
worker
Count 11 7 2 2 3 1 0 0 26
% within
type of
waste
picker
42.3 26.9 7.7 7.7 11.5 3.8 .0 .0
% within in
Identity
.7 .6 .3 .2 .8 1.7 .0 .0
% of Total .2 .1 .0 .0 .1 .0 .0 .0 .5
Others Count 54 36 24 28 1 1 0 0 144
% within
type of
waste
picker
37.5 25.0 16.7 19.4 .7 .7 .0 .0
% within in
Identity
3.2 2.9 3.5 2.9 .3 1.7 .0 .0
% of Total 1.1 .7 .5 .5 .0 .0 .0 .0 2.8
Total Count 1684 1224 693 952 362 60 111 40 5126
% of Total 32.9 23.9 13.5 18.6 7.1 1.2 2.2 .8 100.0
Table 3.1.32 Bank account
Bank account Frequency Percent
Bank Account 1081 57.8
No Bank account 788 42.2
Total 1869 100

319
Table 3.1.33 City wise and bank account
CityBank Account
TotalYes No
Bengaluru Count 81 93 174
% within City 46.6 53.4 100.0
% within bank
account
7.5 11.8 9.3
% of Total 4.3 5.0 9.3
Bhopal Count 62 40 102
% within City 60.8 39.2 100.0
% within bank
account
5.7 5.1 5.5
% of Total 3.3 2.1 5.5
Chamrajnagar Count 0 3 3
% within City .0 100.0 100.0
% within bank
account
.0 .4 .2
% of Total .0 .2 .2
Delhi Count 118 110 228
% within City 51.8 48.2 100.0
% within bank
account
10.9 14.0 12.2
% of Total 6.3 5.9 12.2
Guntur Count 77 192 269
% within City 28.6 71.4 100.0
% within bank
account
7.1 24.4 14.4
% of Total 4.1 10.3 14.4
Indore Count 93 21 114
% within City 81.6 18.4 100.0
% within bank
account
8.6 2.7 6.1
% of Total 5.0 1.1 6.1
Mumbai Count 127 22 149
% within City 85.2 14.8 100.0
% within bank
account
11.7 2.8 8.0
% of Total 6.8 1.2 8.0

320
Mysore Count 99 50 149
% within City 66.4 33.6 100.0
% within bank
account
9.2 6.3 8.0
% of Total 5.3 2.7 8.0
Nashik Count 79 27 106
% within City 74.5 25.5 100.0
% within bank
account
7.3 3.4 5.7
% of Total 4.2 1.4 5.7
Navi Mumbai Count 6 1 7
% within City 85.7 14.3 100.0
% within bank
account
.6 .1 .4
% of Total .3 .1 .4
Pune Count 115 7 122
% within City 94.3 5.7 100.0
% within bank
account
10.6 .9 6.5
% of Total 6.2 .4 6.5
Shillong Count 49 11 60
% within City 81.7 18.3 100.0
% within bank
account
4.5 1.4 3.2
% of Total 2.6 .6 3.2
Tenali Count 2 30 32
% within City 6.2 93.8 100.0
% within bank
account
.2 3.8 1.7
% of Total .1 1.6 1.7
Thane Count 53 12 65
% within City 81.5 18.5 100.0
% within bank
account
4.9 1.5 3.5
% of Total 2.8 .6 3.5
Tumkur Count 25 6 31
% within City 80.6 19.4 100.0
% within bank
account
2.3 .8 1.7
% of Total 1.3 .3 1.7
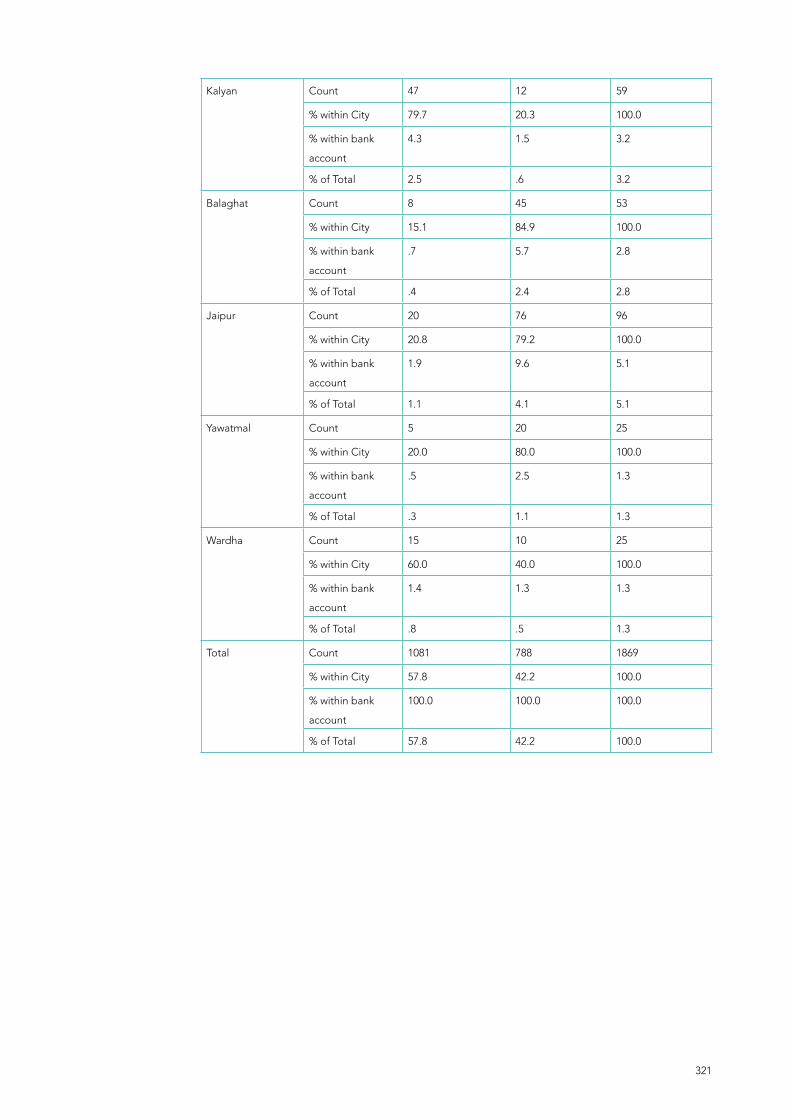
321
Kalyan Count 47 12 59
% within City 79.7 20.3 100.0
% within bank
account
4.3 1.5 3.2
% of Total 2.5 .6 3.2
Balaghat Count 8 45 53
% within City 15.1 84.9 100.0
% within bank
account
.7 5.7 2.8
% of Total .4 2.4 2.8
Jaipur Count 20 76 96
% within City 20.8 79.2 100.0
% within bank
account
1.9 9.6 5.1
% of Total 1.1 4.1 5.1
Yawatmal Count 5 20 25
% within City 20.0 80.0 100.0
% within bank
account
.5 2.5 1.3
% of Total .3 1.1 1.3
Wardha Count 15 10 25
% within City 60.0 40.0 100.0
% within bank
account
1.4 1.3 1.3
% of Total .8 .5 1.3
Total Count 1081 788 1869
% within City 57.8 42.2 100.0
% within bank
account
100.0 100.0 100.0
% of Total 57.8 42.2 100.0

322
Table 3.1.34 Type of waste picker and bank account.FP= Frequency percentage, I= Free roamimg independent local, M= Free roaming migrant, B= Itinerant buyer, S= Waste sorter, D= Door-to-door collector, W=Other informal worker, O=Others
Type of Waste Picker Total
BankAcc
FP I M B S D W O
Yes Count 659 27 10 81 265 6 33 1081
% within
bank
Account
61 3 1 8 25 1 3 100
% within
type
picker
53 44 83 58 75 50 61 58
% of
Total
35 1 1 4 14 0 2 58
No Count 577 35 2 59 88 6 21 788
% within
bank
account
73 4 0 8 11 1 3 100
% within
type of
waste
picker
47 57 17 42 25 50 39 42
% of
Total
31 2 0 3 5 0 1 42
Total Count 1236 62 12 140 353 12 54 1869
% within
bank
account
66 3 1 8 19 1 3 100
% within
type of
waste
picker
100 100 100 100 100 100 100 100
% of
Total
66 3 1 8 19 1 3 100

323
Table 3.1.35 Type of Bank account
Type of Bank Account Number of respondents Percent (%)
Nationalized Bank 628 56.1
Cooperative Bank 218 19.5
Jan Dhan Yojana 208 18.6
Post Office 47 4.2
Others 19 1.7
Total 1120 100
Table 3.1.36 City wise distribution of respondents based on possession of bank account and type of waste pickers.I= Free roamimg independent local, M= Free roaming migrant, S= Waste sorter, D= Door-to-door collector, O=Others, W=Other informal worker, B= Itinerant buyer
Type of Waste PickerTotal
City I M S D O W B
Bengaluru Bank
Account
Yes Count 38 9 4 29 1 81
% within
Bank
account
46.9 11.1 4.9 35.8 1.2
NO Count 54 20 13 4 2 93
% within
Bank
account
58.1 21.5 14.0 4.3 2.2
Total Count 92 29 17 33 3 174
Bhopal Bank
account
Yes Count 25 4 1 29 1 2 62
% within
Bank
account
40.3 6.5 1.6 46.8 1.6 3.2
No Count 29 4 3 1 1 2 40
% within
Bank
account
72.5 10.0 7.5 2.5 2.5 5.0
Total Count 54 8 4 30 2 4 102

324
Chamraj
nagar
Bank
account
No Count 2 1 3
% within
Bank
account
66.7 33.3
Total Count 2 1 3
Delhi Bank
account
Yes Count 19 4 81 11 2 1 118
% within
Bank
account
16.1 3.4 68.6 9.3 1.7 .8
No Count 24 3 71 11 1 0 110
% within
Bank
account
21.8 2.7 64.5 10.0 .9 .0
Total Count 43 7 152 22 3 1 228
Guntur Bank
account
Yes Count 60 0 9 6 1 1 77
% within
Bank
account
77.9 .0 11.7 7.8 1.3 1.3
No Count 180 1 10 0 0 1 192
% within
Bank
account
93.8 .5 5.2 .0 .0 .5
Total Count 240 1 19 6 1 2 269
Indore Bank
account
Yes Count 67 8 14 1 1 1 1 93
% within
Bank
account
72.0 8.6 15.1 1.1 1.1 1.1 1.1
No Count 19 0 1 0 0 1 0 21
% within
Bank
account
90.5 .0 4.8 .0 .0 4.8 .0
Total Count 86 8 15 1 1 2 1 114
Mumbai Bank
account
Yes Count 105 3 1 17 1 127
% within
Bank
account
82.7 2.4 .8 13.4 .8
No Count 15 0 0 7 0 22
% within
Bank
account
68.2 .0 .0 31.8 .0
Total Count 120 3 1 24 1 149
Mysore Bank
account
Yes Count 86 0 6 2 5 99
% within
Bank
account
86.9 .0 6.1 2.0 5.1

325
No Count 45 4 0 0 1 50
% within
Bank
account
90.0 8.0 .0 .0 2.0
Total Count 131 4 6 2 6 149
Nashik Bank
account
Yes Count 78 1 79
% within
Bank
account
98.7 1.3
No Count 27 0 27
% within
Bank
account
100.0 .0
Total Count 105 1 106
Navi
Mumbai
Bank
account
Yes Count 6 6
% within
Bank
account
100.0
No Count 1 1
% within
Bank
account
100.0
Total Count 7 7
Pune Bank
account
Yes Count 1 113 1 115
% within
Bank
account
.9 98.3 .9
No Count 0 7 0 7
% within
Bank
account
.0 100.0 .0
Total Count 1 120 1 122
Shillong Bank
account
Yes Count 29 20 49
% within
Bank
account
59.2 40.8
No Count 3 8 11
% within
Bank
account
27.3 72.7
Total Count 32 28 60
Tenali Bank
account
Yes Count 2 0 0 0 0 2
% within
Bank
account
100.0 .0 .0 .0 .0

326
No Count 18 5 5 1 1 30
% within
Bank
account
60.0 16.7 16.7 3.3 3.3
Total Count 20 5 5 1 1 32
Thane Bank
account
Yes Count 51 2 53
% within
Bank
account
96.2 3.8
No Count 6 6 12
% within
Bank
account
50.0 50.0
Total Count 57 8 65
Tumkur Bank
account
Yes Count 22 1 2 25
% within
Bank
account
88.0 4.0 8.0
No Count 6 0 0 6
% within
Bank
account
100.0 .0 .0
Total Count 28 1 2 31
Kalyan Bank
account
Yes Count 27 1 19 47
% within
Bank
account
57.4 2.1 40.4
No Count 3 0 9 12
% within
Bank
account
25.0 .0 75.0
Total Count 30 1 28 59
Balaghat Bank
account
Yes Count 6 1 1 0 8
% within
Bank
account
75.0 12.5 12.5 .0
No Count 42 1 1 1 45
% within
Bank
account
93.3 2.2 2.2 2.2
Total Count 48 2 2 1 53
Jaipur Bank
account
Yes Count 18 2 20
% within
Bank
account
90.0 10.0

327
No Count 73 3 76
% within
Bank
account
96.1 3.9
Total Count 91 5 96
Yawatmal Bank
account
Yes Count 5 5
% within
Bank
account
100.0
No Count 20 20
% within
Bank
account
100.0
Total Count 25 25
Wardha Bank
account
Yes Count 15 15
% within
Bank
account
100.0
No Count 10 10
% within
Bank
account
100.0
Total Count 25 25
Table 3.1.37 Distribution of respondents and SHG
Self Help Group No of Respondents (N) Percent (%)
Part of Self Help Group 560 30
Not part of any Self Help Group 1309 70
Total 1869 100
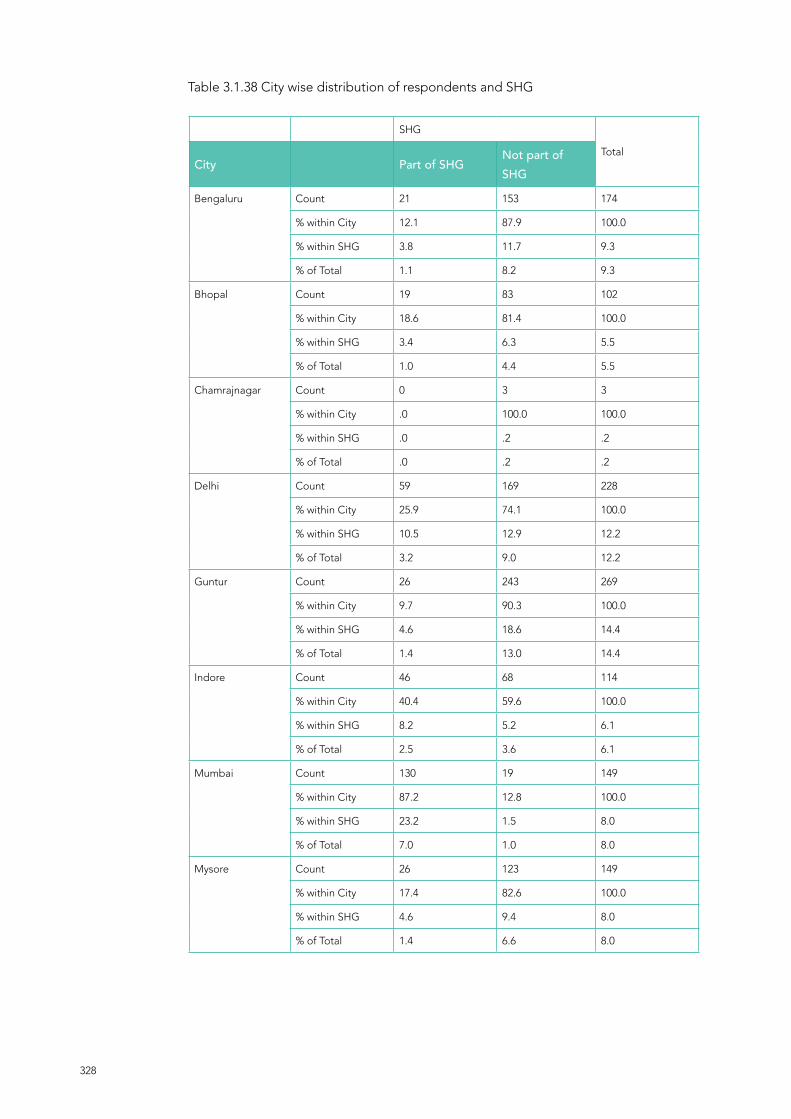
328
Table 3.1.38 City wise distribution of respondents and SHG
SHG
TotalCity Part of SHG
Not part of SHG
Bengaluru Count 21 153 174
% within City 12.1 87.9 100.0
% within SHG 3.8 11.7 9.3
% of Total 1.1 8.2 9.3
Bhopal Count 19 83 102
% within City 18.6 81.4 100.0
% within SHG 3.4 6.3 5.5
% of Total 1.0 4.4 5.5
Chamrajnagar Count 0 3 3
% within City .0 100.0 100.0
% within SHG .0 .2 .2
% of Total .0 .2 .2
Delhi Count 59 169 228
% within City 25.9 74.1 100.0
% within SHG 10.5 12.9 12.2
% of Total 3.2 9.0 12.2
Guntur Count 26 243 269
% within City 9.7 90.3 100.0
% within SHG 4.6 18.6 14.4
% of Total 1.4 13.0 14.4
Indore Count 46 68 114
% within City 40.4 59.6 100.0
% within SHG 8.2 5.2 6.1
% of Total 2.5 3.6 6.1
Mumbai Count 130 19 149
% within City 87.2 12.8 100.0
% within SHG 23.2 1.5 8.0
% of Total 7.0 1.0 8.0
Mysore Count 26 123 149
% within City 17.4 82.6 100.0
% within SHG 4.6 9.4 8.0
% of Total 1.4 6.6 8.0
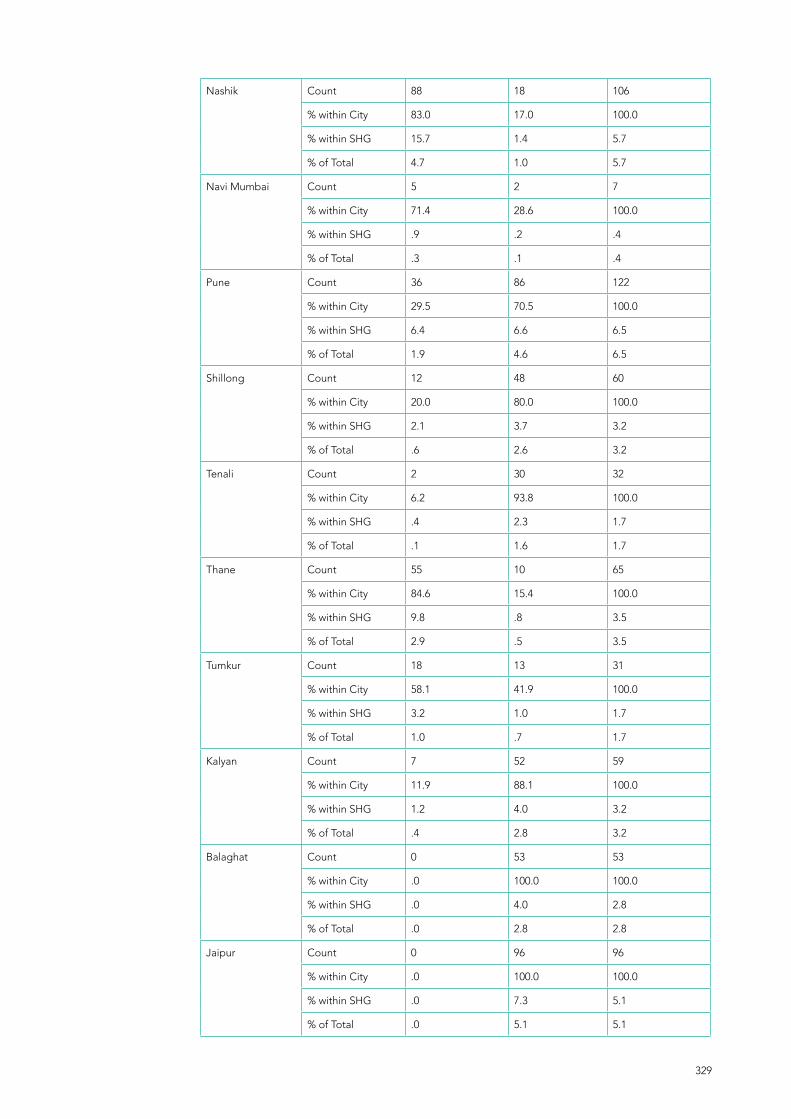
329
Nashik Count 88 18 106
% within City 83.0 17.0 100.0
% within SHG 15.7 1.4 5.7
% of Total 4.7 1.0 5.7
Navi Mumbai Count 5 2 7
% within City 71.4 28.6 100.0
% within SHG .9 .2 .4
% of Total .3 .1 .4
Pune Count 36 86 122
% within City 29.5 70.5 100.0
% within SHG 6.4 6.6 6.5
% of Total 1.9 4.6 6.5
Shillong Count 12 48 60
% within City 20.0 80.0 100.0
% within SHG 2.1 3.7 3.2
% of Total .6 2.6 3.2
Tenali Count 2 30 32
% within City 6.2 93.8 100.0
% within SHG .4 2.3 1.7
% of Total .1 1.6 1.7
Thane Count 55 10 65
% within City 84.6 15.4 100.0
% within SHG 9.8 .8 3.5
% of Total 2.9 .5 3.5
Tumkur Count 18 13 31
% within City 58.1 41.9 100.0
% within SHG 3.2 1.0 1.7
% of Total 1.0 .7 1.7
Kalyan Count 7 52 59
% within City 11.9 88.1 100.0
% within SHG 1.2 4.0 3.2
% of Total .4 2.8 3.2
Balaghat Count 0 53 53
% within City .0 100.0 100.0
% within SHG .0 4.0 2.8
% of Total .0 2.8 2.8
Jaipur Count 0 96 96
% within City .0 100.0 100.0
% within SHG .0 7.3 5.1
% of Total .0 5.1 5.1

330
Yawatmal Count 0 25 25
% within City .0 100.0 100.0
% within SHG .0 1.9 1.3
% of Total .0 1.3 1.3
Wardha Count 10 15 25
% within City 40.0 60.0 100.0
% within SHG 1.8 1.1 1.3
% of Total .5 .8 1.3
Total Count 560 1309 1869
% within City 30.0 70.0 100.0
% within SHG 100.0 100.0 100.0
% of Total 30.0 70.0 100.0
Table 3.1.39 Type of waste picker and SHG
SHG
Type of Waste Picker Part of Self Help Group
Not Part of Self Help Group
Free Roaming /
Independent local
Count 406 830
% within type of Waste
Picker
32.8 67.2
Free Roaming Migrant Count 10 52
% within type of Waste
Picker
16.1 83.9
Itinerant Buyer Count 3 9
% within type of Waste
Picker
25 75
Waste Sorter Count 24 116
% within type of Waste
Picker
17.1 82.9
Door-to-Door Collector Count 92 261
% within type of Waste
Picker
26.1 73.9
Other informal worker Count 2 10
% within type of Waste
Picker
16.7 83.3
Others Count 23 31
% within type of Waste
Picker
42.6 57.4
Total Count 560 1309
% within type of Waste
Picker
30.0 70.0

331
Table 3.1.40 Distribution of respondents availed loan
Loan No of Respondents (N) Percent (%)
Availed 412 22
Not Availed 1457 78
Total 1869 100
Table 3.1.41 Citywise distribution of respondents and loan
Loan
City Availed Non Availed
Bengaluru Count 26 148
% within City 14.9 85.1
Bhopal Count 38 64
% within City 37.3 62.7
Chamrajnagar Count 0 3
% within City 0 100
Delhi Count 17 211
% within City 7.5 92.5
Guntur Count 24 245
% within City 8.9 91.1
Indore Count 54 60
% within City 47.4 52.6
Mumbai Count 114 35
% within City 76.5 23.5
Mysore Count 43 106
% within City 28.9 71.1
Nashik Count 0 106
% within City 0 100
Navi Mumbai Count 3 4
% within City 42.9 57.1
Pune Count 23 99
% within City 18.9 81.1
Shillong Count 3 57
% within City 5 95
Tenali Count 2 30
% within City 6.3 93.8
Thane Count 43 22
% within City 66.2 33.8
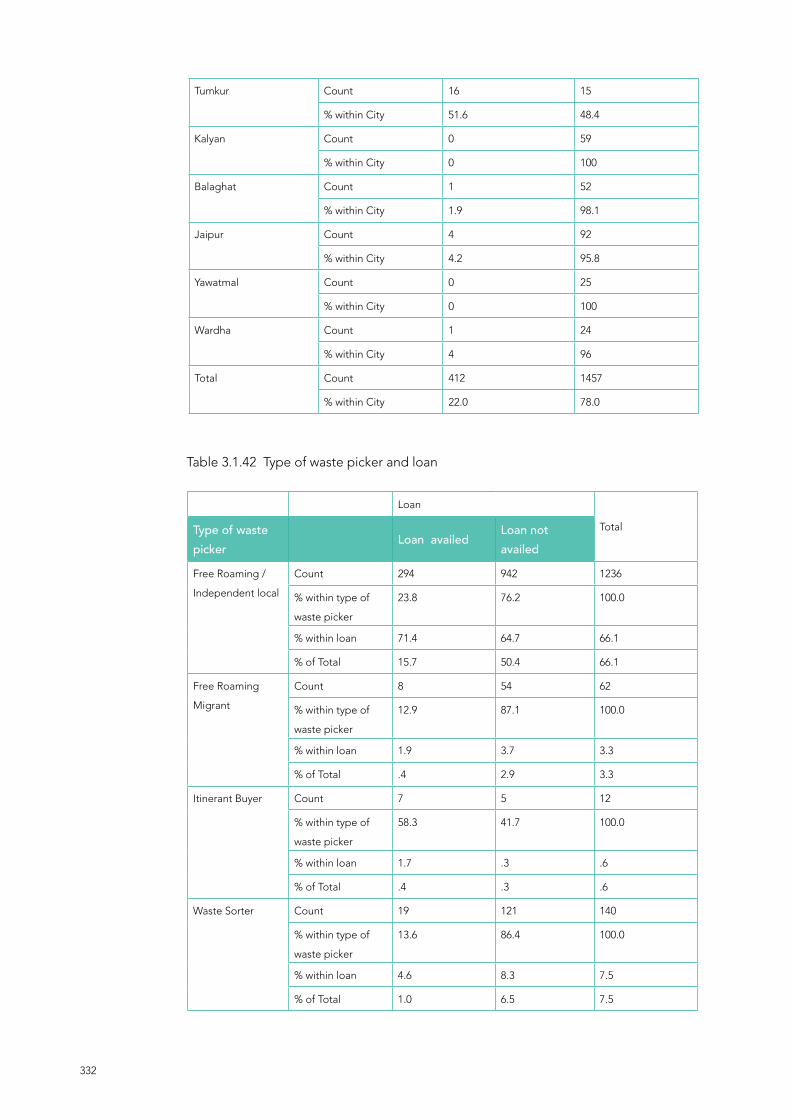
332
Tumkur Count 16 15
% within City 51.6 48.4
Kalyan Count 0 59
% within City 0 100
Balaghat Count 1 52
% within City 1.9 98.1
Jaipur Count 4 92
% within City 4.2 95.8
Yawatmal Count 0 25
% within City 0 100
Wardha Count 1 24
% within City 4 96
Total Count 412 1457
% within City 22.0 78.0
Table 3.1.42 Type of waste picker and loan
Loan
TotalType of waste picker
Loan availedLoan not availed
Free Roaming /
Independent local
Count 294 942 1236
% within type of
waste picker
23.8 76.2 100.0
% within loan 71.4 64.7 66.1
% of Total 15.7 50.4 66.1
Free Roaming
Migrant
Count 8 54 62
% within type of
waste picker
12.9 87.1 100.0
% within loan 1.9 3.7 3.3
% of Total .4 2.9 3.3
Itinerant Buyer Count 7 5 12
% within type of
waste picker
58.3 41.7 100.0
% within loan 1.7 .3 .6
% of Total .4 .3 .6
Waste Sorter Count 19 121 140
% within type of
waste picker
13.6 86.4 100.0
% within loan 4.6 8.3 7.5
% of Total 1.0 6.5 7.5

333
Door-to-Door
Collector
Count 69 284 353
% within type of
waste picker
19.5 80.5 100.0
% within loan 16.7 19.5 18.9
% of Total 3.7 15.2 18.9
Other informal
worker
Count 1 11 12
% within type of
waste picker
8.3 91.7 100.0
% within loan .2 .8 .6
% of Total .1 .6 .6
Others Count 14 40 54
% within type of
waste picker
25.9 74.1 100.0
% within loan 3.4 2.7 2.9
% of Total .7 2.1 2.9
Total Count 412 1457 1869
% within type of
waste picker
22.0 78.0 100.0
% within loan 100.0 100.0 100.0
% of Total 22.0 78.0 100.0
Table 3.1.43 City wise distribution of respondents, type of waste picker and loan.I= Free roamimg independent local, M= Free roaming migrant, B= Itinerant buyer, S= Waste sorter, D= Door-to-door collector, W=Other informal worker, O=Others
Type of Waste Picker
TotalCity I M B S D W O
Bengaluru loan Loan
Availed
Count 10 0 2 13 1 26
% within
loan
38.50 0.00 7.70 50.00 3.80 100.00%
Loan Not
Availed
Count 82 29 15 20 2 148
% within
loan
55.40 19.60 10.10 13.50 1.40 100.00%
Total Count 92 29 17 33 3 174
% within
loan
52.90% 16.70 9.80 19.00 1.70 100.00

334
Bhopal loan Loan
Availed
Count 16 1 0 19 1 1 38
% within
loan
42.10 2.60 0.00 50.00 2.60 2.60 100.00%
Loan Not
Availed
Count 38 7 4 11 3 1 64
% within
loan
59.40 10.90 6.20 17.20 4.70 1.60 100.00%
Total Count 54 8 4 30 4 2 102
% within
loan
52.90% 7.80 3.90 29.40 3.90 2.00 100.00
Chamraj
nagar
loan Loan Not
Availed
Count 2 1 3
% within
loan
66.70 33.30 100.00%
Total Count 2 1 3
% within
loan
66.70% 33.30 100.00
Delhi loan Loan
Availed
Count 0 1 3 12 0 1 17
% within
loan
0.00 5.90 17.60 70.60 0.00 5.90 100.00%
Loan Not
Availed
Count 43 0 4 140 3 21 211
% within
loan
20.40 0.00 1.90 66.40 1.40 10.00 100.00%
Total Count 43 1 7 152 3 22 228
% within
loan
18.90% 0.40 3.10 66.70 1.30 9.60 100.00
Guntur loan Loan
Availed
Count 18 0 4 1 0 1 24
% within
loan
75.00 0.00 16.70 4.20 0.00 4.20 100.00%
Loan Not
Availed
Count 222 1 15 5 2 0 245
% within
loan
90.60 0.40 6.10 2.00 0.80 0.00 100.00%
Total Count 240 1 19 6 2 1 269
% within
loan
89.20% 0.40 7.10 2.20 0.70 0.40 100.00
Indore loan Loan
Availed
Count 42 5 1 5 0 0 1 54
% within
loan
77.80 9.30 1.90 9.30 0.00 0.00 1.90 100.00%
Loan Not
Availed
Count 44 3 0 10 1 2 0 60
% within
loan
73.30 5.00 0.00 16.70 1.70 3.30 0.00 100.00%
Total Count 86 8 1 15 1 2 1 114
% within
loan
75.40% 7.00 0.90 13.20 0.90 1.80 0.90 100.00
Mumbai loan Loan
Availed
Count 101 2 1 1 9 114
% within
loan
88.60 1.80 0.90 0.90 7.90 100.00%

335
Loan Not
Availed
Count 19 1 0 0 15 35
% within
loan
54.30 2.90 0.00 0.00 42.90 100.00%
Total Count 120 3 1 1 24 149
% within
loan
80.50% 2.00 0.70 0.70 16.10 100.00
Mysore loan Loan
Availed
Count 37 0 3 3 0 43
% within
loan
86.00 0.00 7.00 7.00 0.00 100.00%
Loan Not
Availed
Count 94 4 3 3 2 106
% within
loan
88.70 3.80 2.80 2.80 1.90 100.00%
Total Count 131 4 6 6 2 149
% within
loan
87.90% 2.70 4.00 4.00 1.30 100.00
Nashik loan Loan Not
Availed
Count 105 1 106
% within
loan
99.10 0.90 100.00%
Total Count 105 1 106
% within
loan
99.10% 0.90 100.00
Navi
Mumbai
loan Loan
Availed
Count 3 3
% within
loan
100.00 100.00%
Loan Not
Availed
Count 4 4
% within
loan
100.00 100.00%
Total Count 7 7
% within
loan
100.00% 100.00
Pune loan Loan
Availed
Count 0 23 0 23
% within
loan
0.00 100.00 0.00 100.00%
Loan Not
Availed
Count 1 97 1 99
% within
loan
1.00 98.00 1.00 100.00%
Total Count 1 120 1 122
% within
loan
0.80 98.40 0.80 100.00
Shillong loan Loan
Availed
Count 1 2 3
% within
loan
33.30 66.70 100.00%
Loan Not
Availed
Count 31 26 57
% within
loan
54.40 45.60 100.00%
Total Count 32 28 60
% within
loan
53.30% 46.70 100.00
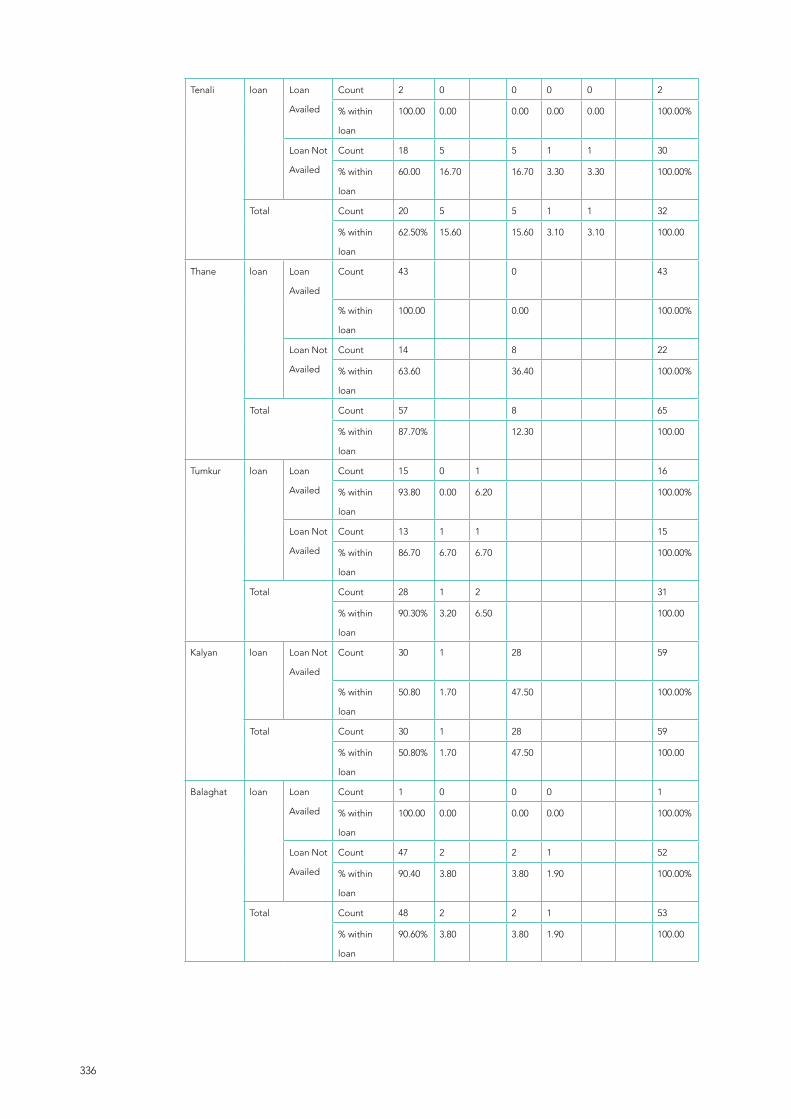
336
Tenali loan Loan
Availed
Count 2 0 0 0 0 2
% within
loan
100.00 0.00 0.00 0.00 0.00 100.00%
Loan Not
Availed
Count 18 5 5 1 1 30
% within
loan
60.00 16.70 16.70 3.30 3.30 100.00%
Total Count 20 5 5 1 1 32
% within
loan
62.50% 15.60 15.60 3.10 3.10 100.00
Thane loan Loan
Availed
Count 43 0 43
% within
loan
100.00 0.00 100.00%
Loan Not
Availed
Count 14 8 22
% within
loan
63.60 36.40 100.00%
Total Count 57 8 65
% within
loan
87.70% 12.30 100.00
Tumkur loan Loan
Availed
Count 15 0 1 16
% within
loan
93.80 0.00 6.20 100.00%
Loan Not
Availed
Count 13 1 1 15
% within
loan
86.70 6.70 6.70 100.00%
Total Count 28 1 2 31
% within
loan
90.30% 3.20 6.50 100.00
Kalyan loan Loan Not
Availed
Count 30 1 28 59
% within
loan
50.80 1.70 47.50 100.00%
Total Count 30 1 28 59
% within
loan
50.80% 1.70 47.50 100.00
Balaghat loan Loan
Availed
Count 1 0 0 0 1
% within
loan
100.00 0.00 0.00 0.00 100.00%
Loan Not
Availed
Count 47 2 2 1 52
% within
loan
90.40 3.80 3.80 1.90 100.00%
Total Count 48 2 2 1 53
% within
loan
90.60% 3.80 3.80 1.90 100.00

337
Jaipur loan Loan
Availed
Count 4 0 4
% within
loan
100.00 0.00 100.00%
Loan Not
Availed
Count 87 5 92
% within
loan
94.60 5.40 100.00%
Total Count 91 5 96
% within
loan
94.80% 5.20 100.00
Yawatmal loan Loan Not
Availed
Count 25 25
% within
loan
100.00 100.00%
Total Count 25 25
% within
loan
100.00% 100.00
Wardha loan Loan
Availed
Count 1 1
% within
loan
100.00 100.00%
Loan Not
Availed
Count 24 24
% within
loan
100.00 100.00%
Total Count 25 25
% within
loan
100.00% 100.00
Table 3.1.44 Source of loan
Responses
Source of Loan No of Respondents Percent (%)
Nationalized Bank 43 6.9
Cooperative Bank 21 3.3
Money Lender 81 12.9
SHG 176 28.1
Microfinance 111 17.7
Friends 85 13.6
Scrap Dealer 81 12.9
Employer 10 1.6
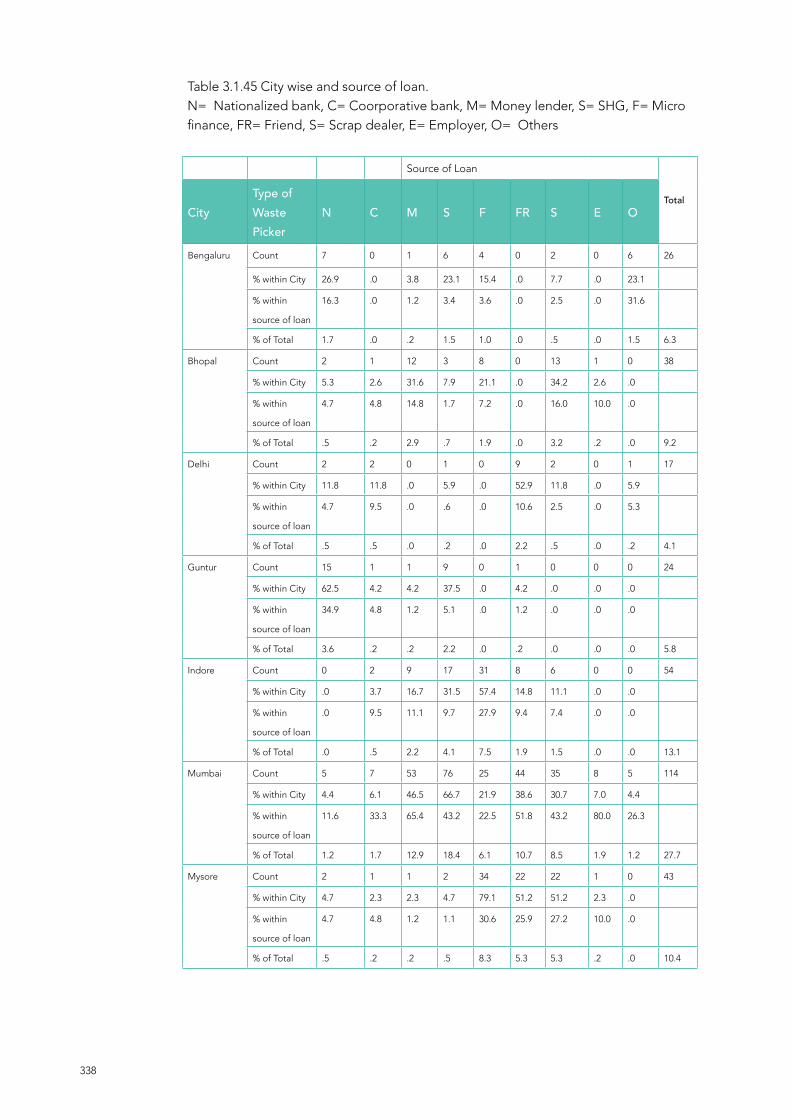
338
Table 3.1.45 City wise and source of loan.N= Nationalized bank, C= Coorporative bank, M= Money lender, S= SHG, F= Micro finance, FR= Friend, S= Scrap dealer, E= Employer, O= Others
Source of Loan
TotalCity
Type ofWastePicker
N C M S F FR S E O
Bengaluru Count 7 0 1 6 4 0 2 0 6 26
% within City 26.9 .0 3.8 23.1 15.4 .0 7.7 .0 23.1
% within
source of loan
16.3 .0 1.2 3.4 3.6 .0 2.5 .0 31.6
% of Total 1.7 .0 .2 1.5 1.0 .0 .5 .0 1.5 6.3
Bhopal Count 2 1 12 3 8 0 13 1 0 38
% within City 5.3 2.6 31.6 7.9 21.1 .0 34.2 2.6 .0
% within
source of loan
4.7 4.8 14.8 1.7 7.2 .0 16.0 10.0 .0
% of Total .5 .2 2.9 .7 1.9 .0 3.2 .2 .0 9.2
Delhi Count 2 2 0 1 0 9 2 0 1 17
% within City 11.8 11.8 .0 5.9 .0 52.9 11.8 .0 5.9
% within
source of loan
4.7 9.5 .0 .6 .0 10.6 2.5 .0 5.3
% of Total .5 .5 .0 .2 .0 2.2 .5 .0 .2 4.1
Guntur Count 15 1 1 9 0 1 0 0 0 24
% within City 62.5 4.2 4.2 37.5 .0 4.2 .0 .0 .0
% within
source of loan
34.9 4.8 1.2 5.1 .0 1.2 .0 .0 .0
% of Total 3.6 .2 .2 2.2 .0 .2 .0 .0 .0 5.8
Indore Count 0 2 9 17 31 8 6 0 0 54
% within City .0 3.7 16.7 31.5 57.4 14.8 11.1 .0 .0
% within
source of loan
.0 9.5 11.1 9.7 27.9 9.4 7.4 .0 .0
% of Total .0 .5 2.2 4.1 7.5 1.9 1.5 .0 .0 13.1
Mumbai Count 5 7 53 76 25 44 35 8 5 114
% within City 4.4 6.1 46.5 66.7 21.9 38.6 30.7 7.0 4.4
% within
source of loan
11.6 33.3 65.4 43.2 22.5 51.8 43.2 80.0 26.3
% of Total 1.2 1.7 12.9 18.4 6.1 10.7 8.5 1.9 1.2 27.7
Mysore Count 2 1 1 2 34 22 22 1 0 43
% within City 4.7 2.3 2.3 4.7 79.1 51.2 51.2 2.3 .0
% within
source of loan
4.7 4.8 1.2 1.1 30.6 25.9 27.2 10.0 .0
% of Total .5 .2 .2 .5 8.3 5.3 5.3 .2 .0 10.4

339
Navi
Mumbai
Count 0 1 0 1 0 0 0 0 1 3
% within City .0 33.3 .0 33.3 .0 .0 .0 .0 33.3
% within
source of loan
.0 4.8 .0 .6 .0 .0 .0 .0 5.3
% of Total .0 .2 .0 .2 .0 .0 .0 .0 .2 .7
Pune Count 4 0 0 7 5 1 0 0 6 23
% within City 17.4 .0 .0 30.4 21.7 4.3 .0 .0 26.1
% within
source of loan
9.3 .0 .0 4.0 4.5 1.2 .0 .0 31.6
% of Total 1.0 .0 .0 1.7 1.2 .2 .0 .0 1.5 5.6
Shillong Count 1 2 0 0 0 0 0 0 0 3
% within City 33.3 66.7 .0 .0 .0 .0 .0 .0 .0
% within
source of loan
2.3 9.5 .0 .0 .0 .0 .0 .0 .0
% of Total .2 .5 .0 .0 .0 .0 .0 .0 .0 .7
Tenali Count 0 0 0 2 0 0 0 0 0 2
% within City .0 .0 .0 100.0 .0 .0 .0 .0 .0
% within
source of loan
.0 .0 .0 1.1 .0 .0 .0 .0 .0
% of Total .0 .0 .0 .5 .0 .0 .0 .0 .0 .5
Thane Count 4 3 1 37 3 0 0 0 0 43
% within City 9.3 7.0 2.3 86.0 7.0 .0 .0 .0 .0
% within
source of loan
9.3 14.3 1.2 21.0 2.7 .0 .0 .0 .0
% of Total 1.0 .7 .2 9.0 .7 .0 .0 .0 .0 10.4
Tumkur Count 1 0 0 15 0 0 0 0 0 16
% within City 6.2 .0 .0 93.8 .0 .0 .0 .0 .0
% within
source of loan
2.3 .0 .0 8.5 .0 .0 .0 .0 .0
% of Total .2 .0 .0 3.6 .0 .0 .0 .0 .0 3.9
Balaghat Count 0 0 0 0 1 0 0 0 0 1
% within City .0 .0 .0 .0 100.0 .0 .0 .0 .0
% within
source of loan
.0 .0 .0 .0 .9 .0 .0 .0 .0
% of Total .0 .0 .0 .0 .2 .0 .0 .0 .0 .2
Jaipur Count 0 0 3 0 0 0 1 0 0 4
% within City .0 .0 75.0 .0 .0 .0 25.0 .0 .0
% within
source of loan
.0 .0 3.7 .0 .0 .0 1.2 .0 .0
% of Total .0 .0 .7 .0 .0 .0 .2 .0 .0 1.0
Wardha Count 0 1 0 0 0 0 0 0 0 1
% within City .0 100.0 .0 .0 .0 .0 .0 .0 .0
% within
source of loan
.0 4.8 .0 .0 .0 .0 .0 .0 .0
% of Total .0 .2 .0 .0 .0 .0 .0 .0 .0 .2
Total Count 43 21 81 176 111 85 81 10 19 412
% of Total 10.4 5.1 19.7 42.7 26.9 20.6 19.7 2.4 4.6 100.0

340
Table 3.1.46N= Nationalized bank, C= Coorporative bank, M= Money lender, S= SHG, F= Micro finance, FR= Friend, S= Scrap dealer, E= Employer, O= Others
Source of Loan
TotalType ofWastePicker
N C M S F FR S E O
Free
Roaming/
Indepen-
dent
Local
Count 22 12 71 148 78 63 65 9 10 294
% within
type of
waste picker
7.5 4.1 24.1 50.3 26.5 21.4 22.1 3.1 3.4
% within
source of
loan
51.2 57.1 87.7 84.1 70.3 74.1 80.2 90.0 52.6
% of Total 5.3 2.9 17.2 35.9 18.9 15.3 15.8 2.2 2.4 71.4
Free
Roaming
Migrant
Count 1 2 0 1 5 2 0 0 0 8
% within
type of
waste picker
12.5 25.0 .0 12.5 62.5 25.0 .0 .0 .0
% within
source of
loan
2.3 9.5 .0 .6 4.5 2.4 .0 .0 .0
% of Total .2 .5 .0 .2 1.2 .5 .0 .0 .0 1.9
Itinerant
Buyer
Count 1 0 1 1 4 4 3 0 1 7
% within
type of
waste picker
14.3 .0 14.3 14.3 57.1 57.1 42.9 .0 14.3
% within
source of
loan
2.3 .0 1.2 .6 3.6 4.7 3.7 .0 5.3
% of Total .2 .0 .2 .2 1.0 1.0 .7 .0 .2 1.7
Waste
Sorter
Count 4 3 0 6 7 4 3 0 0 19
% within
type of
waste picker
21.1 15.8 .0 31.6 36.8 21.1 15.8 .0 .0
% within
source of
loan
9.3 14.3 .0 3.4 6.3 4.7 3.7 .0 .0
% of Total 1.0 .7 .0 1.5 1.7 1.0 .7 .0 .0 4.6
Door-
to-Door
Collector
Count 13 1 7 13 13 8 6 1 8 69
% within
type of
waste picker
18.8 1.4 10.1 18.8 18.8 11.6 8.7 1.4 11.6
% within
source of
loan
30.2 4.8 8.6 7.4 11.7 9.4 7.4 10.0 42.1
% of Total 3.2 .2 1.7 3.2 3.2 1.9 1.5 .2 1.9 16.7

341
Other
informal
worker
Count 0 0 0 0 1 0 0 0 0 1
% within
type of
waste picker
.0 .0 .0 .0 100.0 .0 .0 .0 .0
% within
source of
loan
.0 .0 .0 .0 .9 .0 .0 .0 .0
% of Total .0 .0 .0 .0 .2 .0 .0 .0 .0 .2
Others Count 2 3 2 7 3 4 4 0 0 14
% within
type of
waste picker
14.3 21.4 14.3 50.0 21.4 28.6 28.6 .0 .0
% within
source of
loan
4.7 14.3 2.5 4.0 2.7 4.7 4.9 .0 .0
% of Total .5 .7 .5 1.7 .7 1.0 1.0 .0 .0 3.4
Total Count 43 21 81 176 111 85 81 10 19 412
% of Total 10.4 5.1 19.7 42.7 26.9 20.6 19.7 2.4 4.6 100.0
Table 3.1.47 City wise, type of waste picker and source of loan.I= Free roamimg independent local, S= Waste sorter, D= Door-to-door collector, O=Others, M= Free roaming migrant, W=Other informal worker, B= Itinerant buyer
Types of waste picker Tot-
alCity I S D O M W B
Bengaluru Nationalized
Bank
Count 0 0 7 0 7
%
within
Source
of loan
0.00 0.00 100.00 0.00
Money
Lender
Count 1 0 0 0 1
%
within
Source
of loan
100.00 0.00 0.00 0.00
SHG Count 2 1 3 0 6
%
within
Source
of loan
33.30 16.70 50.00 0.00
Microfinance Count 1 1 2 0 4
%
within
Source
of loan
25.00 25.00 50.00 0.00
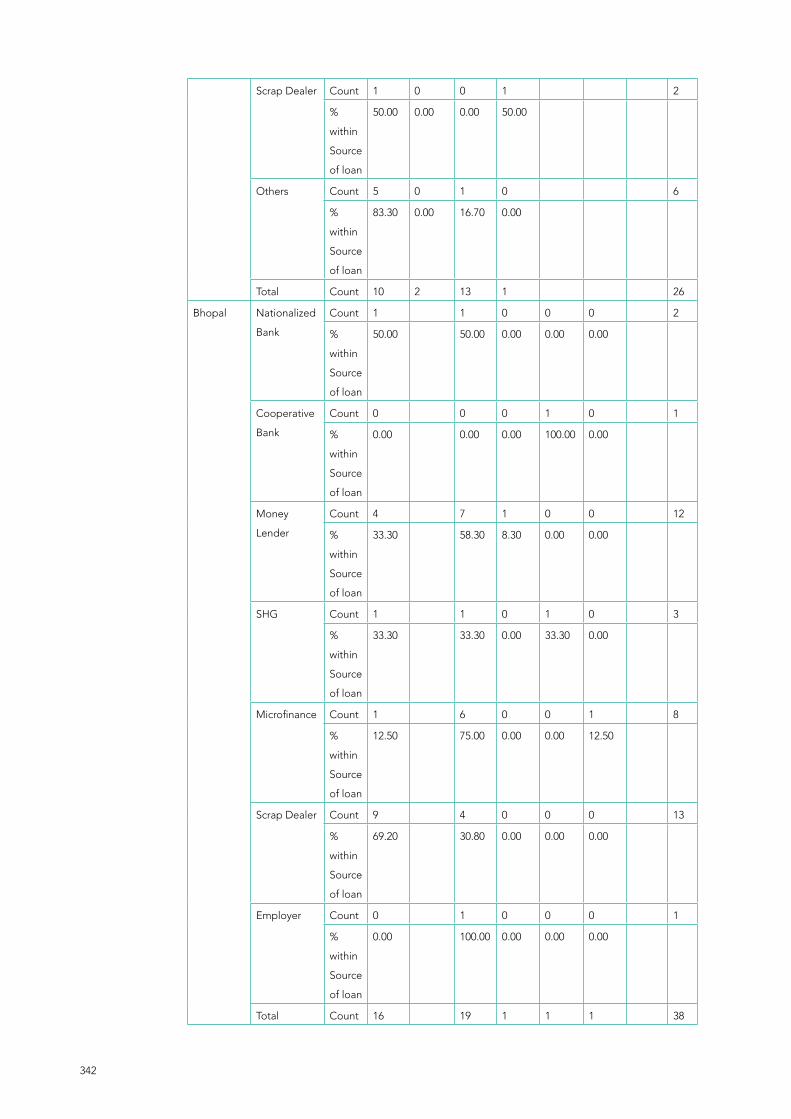
342
Scrap Dealer Count 1 0 0 1 2
%
within
Source
of loan
50.00 0.00 0.00 50.00
Others Count 5 0 1 0 6
%
within
Source
of loan
83.30 0.00 16.70 0.00
Total Count 10 2 13 1 26
Bhopal Nationalized
Bank
Count 1 1 0 0 0 2
%
within
Source
of loan
50.00 50.00 0.00 0.00 0.00
Cooperative
Bank
Count 0 0 0 1 0 1
%
within
Source
of loan
0.00 0.00 0.00 100.00 0.00
Money
Lender
Count 4 7 1 0 0 12
%
within
Source
of loan
33.30 58.30 8.30 0.00 0.00
SHG Count 1 1 0 1 0 3
%
within
Source
of loan
33.30 33.30 0.00 33.30 0.00
Microfinance Count 1 6 0 0 1 8
%
within
Source
of loan
12.50 75.00 0.00 0.00 12.50
Scrap Dealer Count 9 4 0 0 0 13
%
within
Source
of loan
69.20 30.80 0.00 0.00 0.00
Employer Count 0 1 0 0 0 1
%
within
Source
of loan
0.00 100.00 0.00 0.00 0.00
Total Count 16 19 1 1 1 38
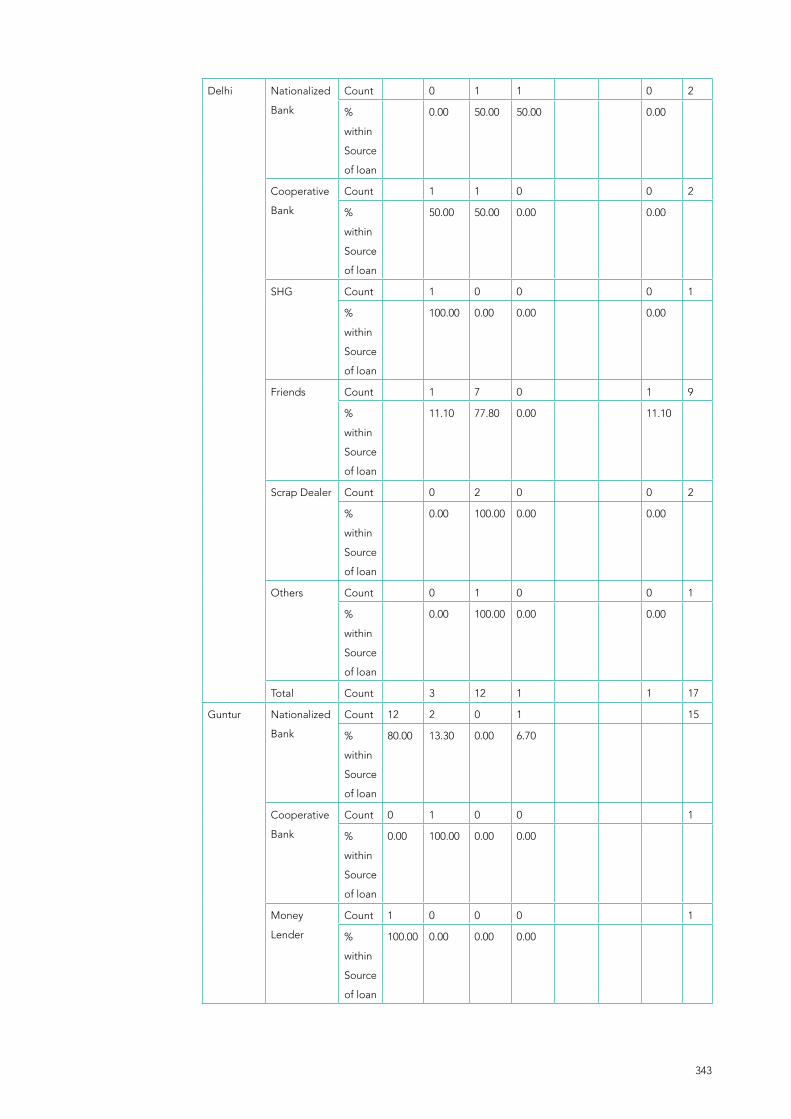
343
Delhi Nationalized
Bank
Count 0 1 1 0 2
%
within
Source
of loan
0.00 50.00 50.00 0.00
Cooperative
Bank
Count 1 1 0 0 2
%
within
Source
of loan
50.00 50.00 0.00 0.00
SHG Count 1 0 0 0 1
%
within
Source
of loan
100.00 0.00 0.00 0.00
Friends Count 1 7 0 1 9
%
within
Source
of loan
11.10 77.80 0.00 11.10
Scrap Dealer Count 0 2 0 0 2
%
within
Source
of loan
0.00 100.00 0.00 0.00
Others Count 0 1 0 0 1
%
within
Source
of loan
0.00 100.00 0.00 0.00
Total Count 3 12 1 1 17
Guntur Nationalized
Bank
Count 12 2 0 1 15
%
within
Source
of loan
80.00 13.30 0.00 6.70
Cooperative
Bank
Count 0 1 0 0 1
%
within
Source
of loan
0.00 100.00 0.00 0.00
Money
Lender
Count 1 0 0 0 1
%
within
Source
of loan
100.00 0.00 0.00 0.00

344
SHG Count 7 1 1 0 9
%
within
Source
of loan
77.80 11.10 11.10 0.00
Friends Count 1 0 0 0 1
%
within
Source
of loan
100.00 0.00 0.00 0.00
Total Count 18 4 1 1 24
Indore Cooperative
Bank
Count 2 0 0 0 0 2
%
within
Source
of loan
100.00 0.00 0.00 0.00 0.00
Money
Lender
Count 9 0 0 0 0 9
%
within
Source
of loan
100.00 0.00 0.00 0.00 0.00
SHG Count 14 3 0 0 0 17
%
within
Source
of loan
82.40 17.60 0.00 0.00 0.00
Microfinance Count 24 3 0 3 1 31
%
within
Source
of loan
77.40 9.70 0.00 9.70 3.20
Friends Count 5 0 1 2 0 8
%
within
Source
of loan
62.50 0.00 12.50 25.00 0.00
Scrap Dealer Count 6 0 0 0 0 6
%
within
Source
of loan
100.00 0.00 0.00 0.00 0.00
Total Count 42 5 1 5 1 54

345
Mumbai Nationalized
Bank
Count 4 0 0 1 0 5
%
within
Source
of loan
80.00 0.00 0.00 20.00 0.00
Cooperative
Bank
Count 3 0 3 1 0 7
%
within
Source
of loan
42.90 0.00 42.90 14.30 0.00
Money
Lender
Count 52 0 1 0 0 53
%
within
Source
of loan
98.10 0.00 1.90 0.00 0.00
SHG Count 68 1 7 0 0 76
%
within
Source
of loan
89.50 1.30 9.20 0.00 0.00
Microfinance Count 20 0 3 2 0 25
%
within
Source
of loan
80.00 0.00 12.00 8.00 0.00
Friends Count 41 0 3 0 0 44
%
within
Source
of loan
93.20 0.00 6.80 0.00 0.00
Scrap Dealer Count 32 0 3 0 0 35
%
within
Source
of loan
91.40 0.00 8.60 0.00 0.00
Employer Count 8 0 0 0 0 8
%
within
Source
of loan
100.00 0.00 0.00 0.00 0.00
Others Count 4 0 0 0 1 5
%
within
Source
of loan
80.00 0.00 0.00 0.00 20.00
Total Count 101 1 9 2 1 114

346
Mysore Nationalized
Bank
Count 0 1 1 2
%
within
Source
of loan
0.00 50.00 50.00
Cooperative
Bank
Count 1 0 0 1
%
within
Source
of loan
100.00 0.00 0.00
Money
Lender
Count 0 0 1 1
%
within
Source
of loan
0.00 0.00 100.00
SHG Count 2 0 0 2
%
within
Source
of loan
100.00 0.00 0.00
Microfinance Count 28 3 3 34
%
within
Source
of loan
82.40 8.80 8.80
Friends Count 16 3 3 22
%
within
Source
of loan
72.70 13.60 13.60
Scrap Dealer Count 16 3 3 22
%
within
Source
of loan
72.70 13.60 13.60
Employer Count 1 0 0 1
%
within
Source
of loan
100.00 0.00 0.00
Total Count 37 3 3 43

347
Navi
Mumbai
Cooperative
Bank
Count 1 1
%
within
Source
of loan
100.00
SHG Count 1 1
%
within
Source
of loan
100.00
Others Count 1 1
%
within
Source
of loan
100.00
Total Count 3 3
Pune Nationalized
Bank
Count 4 4
%
within
Source
of loan
100.00
SHG Count 7 7
%
within
Source
of loan
100.00
Microfinance Count 5 5
%
within
Source
of loan
100.00
Friends Count 1 1
%
within
Source
of loan
100.00
Others Count 6 6
%
within
Source
of loan
100.00
Total Count 23 23

348
Shillong Nationalized
Bank
Count 0 1 1
%
within
Source
of loan
0.00 100.00
Cooperative
Bank
Count 1 1 2
%
within
Source
of loan
50.00 50.00
Count 1 2 3
Tenali SHG Count 2 2
%
within
Source
of loan
100.00
Total Count 2 2
Thane Nationalized
Bank
Count 4 4
%
within
Source
of loan
100.00
Cooperative
Bank
Count 3 3
%
within
Source
of loan
100.00
Money
Lender
Count 1 1
%
within
Source
of loan
100.00
SHG Count 37 37
%
within
Source
of loan
100.00
Microfinance Count 3 3
%
within
Source
of loan
100.00
Total Count 43 43
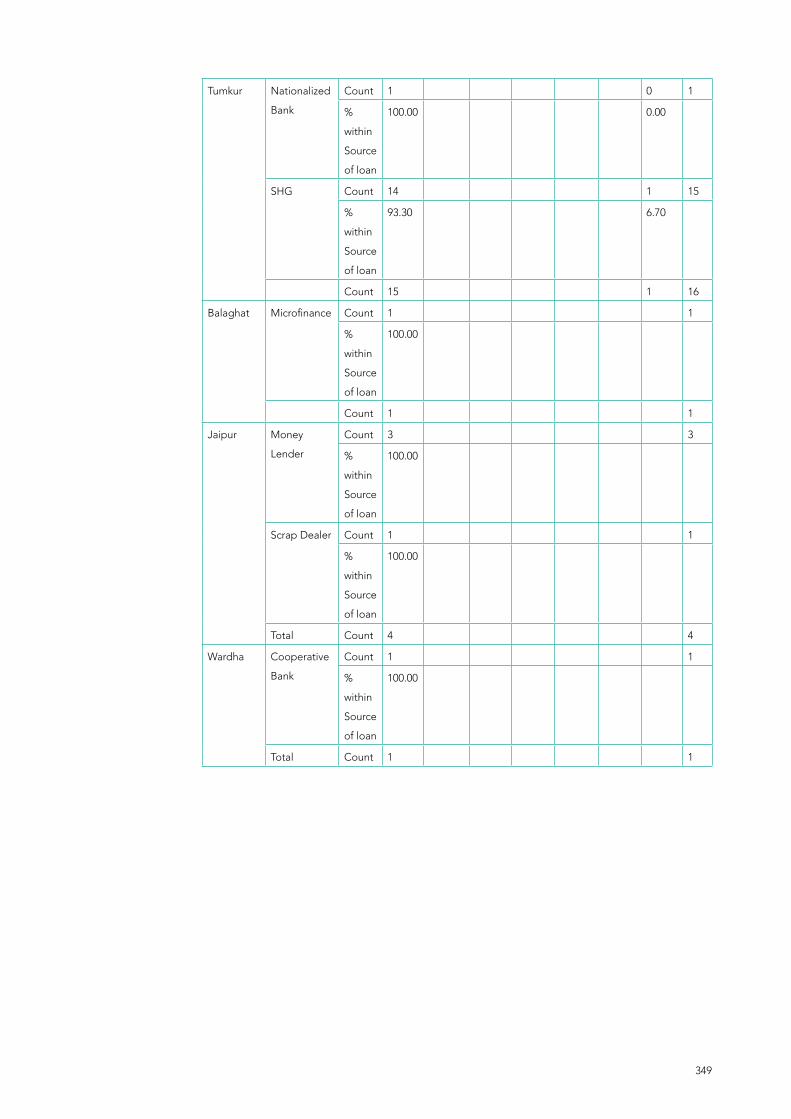
349
Tumkur Nationalized
Bank
Count 1 0 1
%
within
Source
of loan
100.00 0.00
SHG Count 14 1 15
%
within
Source
of loan
93.30 6.70
Count 15 1 16
Balaghat Microfinance Count 1 1
%
within
Source
of loan
100.00
Count 1 1
Jaipur Money
Lender
Count 3 3
%
within
Source
of loan
100.00
Scrap Dealer Count 1 1
%
within
Source
of loan
100.00
Total Count 4 4
Wardha Cooperative
Bank
Count 1 1
%
within
Source
of loan
100.00
Total Count 1 1

350
Table 3.1.48 Distribution of Respondents according to purpose of loan
Table 3.1.49 Distribution of respondents with health issues
Table 3.1.50 Distribution of respondents and type of health issues
Responses
Purpose of Loan No of Respondents (N) Percent (%)
Vehicle 31 5
Business 38 6
Family member business 74 12
Children Education 64 11
Marriage 64 11
Health 116 20
Others 83 14
Total 595 100
Health Issues due to waste collection
No of Respondents (N) Percent(%)
Yes 1007 53.9
No 631 33.8
Don't Know 162 8.7
Don't Remember 69 3.7
Total 1869 100
Responses
Type of Health issues No of Respondents (N) Percent (%)
Minor cuts 638 22.50
Major Injury 154 5.40
Accident / RTA 50 1.80
Skin Infection 625 22.10
Backache/bodyache 557 19.70
Permanent damage to body parts 67 2.40
Respiratory issues 206 7.30
Burns / Chemical injury 84 3.00
Animal Bites 209 7.40
Insect bites 209 7.40
Others 34 1.20
Total 2833 100

351
Table 3.2.1 Distribution of respondents according to number of years in waste collection
Number of years Number of Respondents (N) Percent (%)
Up to 5 291 16
6 to 10 477 26
11 to 15 366 20
16 to 20 298 16
21 to 25 170 9
26 to 30 125 7
31 to 35 59 3
36 to 40 48 3
41 to 45 13 1
46 to 50 18 1
55 and above 4 0
Total 1869 100
Table 3.1.45 City wise and source of loan.N= Number of respondents and percentage
Number of Years in Waste Collection
TotalCity N
Up to1
2 to3
4 to5
6 to10
11 to15
16 to21
21 to25
26 to30
31 to40
41 to50
ab-ove50
Bengaluru Count 8 26 26 39 35 24 5 4 7 0 0 174
% within
City
4.6 14.9 14.9 22.4 20.1 13.8 2.9 2.3 4.0 .0 .0 100.0
% within
Waste
Collection
Years
13.6 26.8 19.3 8.2 9.6 8.1 2.9 3.2 6.5 .0 .0 9.3
% of Total .4 1.4 1.4 2.1 1.9 1.3 .3 .2 .4 .0 .0 9.3
Bhopal Count 3 11 8 26 16 18 7 10 3 0 0 102
% within
City
2.9 10.8 7.8 25.5 15.7 17.6 6.9 9.8 2.9 .0 .0 100.0
% within
Waste
Collection
Years
5.1 11.3 5.9 5.5 4.4 6.0 4.1 8.0 2.8 .0 .0 5.5
% of Total .2 .6 .4 1.4 .9 1.0 .4 .5 .2 .0 .0 5.5

352
Chamraj
nagar
Count 0 1 1 1 0 0 0 0 0 0 0 3
% within
City
.0 33.3 33.3 33.3 .0 .0 .0 .0 .0 .0 .0 100.0
% within
Waste
Collection
Years
.0 1.0 .7 .2 .0 .0 .0 .0 .0 .0 .0 .2
% of Total .0 .1 .1 .1 .0 .0 .0 .0 .0 .0 .0 .2
Delhi Count 16 29 20 61 64 31 6 1 0 0 0 228
% within
City
7.0 12.7 8.8 26.8 28.1 13.6 2.6 .4 .0 .0 .0 100.0
% within
Waste
Collection
Years
27.1 29.9 14.8 12.8 17.5 10.4 3.5 .8 .0 .0 .0 12.2
% of Total .9 1.6 1.1 3.3 3.4 1.7 .3 .1 .0 .0 .0 12.2
Guntur Count 12 5 15 95 55 29 19 25 11 2 1 269
% within
City
4.5 1.9 5.6 35.3 20.4 10.8 7.1 9.3 4.1 .7 .4 100.0
% within
Waste
Collection
Years
20.3 5.2 11.1 19.9 15.0 9.7 11.2 20.0 10.3 6.5 25.0 14.4
% of Total .6 .3 .8 5.1 2.9 1.6 1.0 1.3 .6 .1 .1 14.4
Indore Count 1 1 4 7 18 29 17 19 12 5 1 114
% within
City
.9 .9 3.5 6.1 15.8 25.4 14.9 16.7 10.5 4.4 .9 100.0
% within
Waste
Collection
Years
1.7 1.0 3.0 1.5 4.9 9.7 10.0 15.2 11.2 16.1 25.0 6.1
% of Total .1 .1 .2 .4 1.0 1.6 .9 1.0 .6 .3 .1 6.1
Mumbai Count 10 1 5 7 15 38 17 19 24 13 0 149
% within
City
6.7 .7 3.4 4.7 10.1 25.5 11.4 12.8 16.1 8.7 .0 100.0
% within
Waste
Collection
Years
16.9 1.0 3.7 1.5 4.1 12.8 10.0 15.2 22.4 41.9 .0 8.0
% of Total .5 .1 .3 .4 .8 2.0 .9 1.0 1.3 .7 .0 8.0
Mysore Count 2 3 11 48 18 15 22 11 14 5 0 149
% within
City
1.3 2.0 7.4 32.2 12.1 10.1 14.8 7.4 9.4 3.4 .0 100.0
% within
Waste
Collection
Years
3.4 3.1 8.1 10.1 4.9 5.0 12.9 8.8 13.1 16.1 .0 8.0
% of Total .1 .2 .6 2.6 1.0 .8 1.2 .6 .7 .3 .0 8.0

353
Nashik Count 0 0 1 12 13 28 22 11 15 2 2 106
% within
City
.0 .0 .9 11.3 12.3 26.4 20.8 10.4 14.2 1.9 1.9 100.0
% within
Waste
Collection
Years
.0 .0 .7 2.5 3.6 9.4 12.9 8.8 14.0 6.5 50.0 5.7
% of Total .0 .0 .1 .6 .7 1.5 1.2 .6 .8 .1 .1 5.7
Navi
Mumbai
Count 1 0 0 1 1 2 2 0 0 0 0 7
% within
City
14.3 .0 .0 14.3 14.3 28.6 28.6 .0 .0 .0 .0 100.0
% within
Waste
Collection
Years
1.7 .0 .0 .2 .3 .7 1.2 .0 .0 .0 .0 .4
% of Total .1 .0 .0 .1 .1 .1 .1 .0 .0 .0 .0 .4
Pune Count 1 4 13 41 39 9 9 6 0 0 0 122
% within
City
.8 3.3 10.7 33.6 32.0 7.4 7.4 4.9 .0 .0 .0 100.0
% within
Waste
Collection
Years
1.7 4.1 9.6 8.6 10.7 3.0 5.3 4.8 .0 .0 .0 6.5
% of Total .1 .2 .7 2.2 2.1 .5 .5 .3 .0 .0 .0 6.5
Shillong Count 0 3 5 16 14 11 5 3 3 0 0 60
% within
City
.0 5.0 8.3 26.7 23.3 18.3 8.3 5.0 5.0 .0 .0 100.0
% within
Waste
Collection
Years
.0 3.1 3.7 3.4 3.8 3.7 2.9 2.4 2.8 .0 .0 3.2
% of Total .0 .2 .3 .9 .7 .6 .3 .2 .2 .0 .0 3.2
Tenali Count 0 3 12 4 1 6 2 1 2 1 0 32
% within
City
.0 9.4 37.5 12.5 3.1 18.8 6.2 3.1 6.2 3.1 .0 100.0
% within
Waste
Collection
Years
.0 3.1 8.9 .8 .3 2.0 1.2 .8 1.9 3.2 .0 1.7
% of Total .0 .2 .6 .2 .1 .3 .1 .1 .1 .1 .0 1.7
Thane Count 1 0 3 12 10 14 9 8 7 1 0 65
% within
City
1.5 .0 4.6 18.5 15.4 21.5 13.8 12.3 10.8 1.5 .0 100.0
% within
Waste
Collection
Years
1.7 .0 2.2 2.5 2.7 4.7 5.3 6.4 6.5 3.2 .0 3.5
% of Total .1 .0 .2 .6 .5 .7 .5 .4 .4 .1 .0 3.5

354
Tumkur Count 4 5 1 10 5 4 0 2 0 0 0 31
% within
City
12.9 16.1 3.2 32.3 16.1 12.9 .0 6.5 .0 .0 .0 100.0
% within
Waste
Collection
Years
6.8 5.2 .7 2.1 1.4 1.3 .0 1.6 .0 .0 .0 1.7
% of Total .2 .3 .1 .5 .3 .2 .0 .1 .0 .0 .0 1.7
Kalyan Count 0 0 0 15 18 15 11 0 0 0 0 59
% within
City
.0 .0 .0 25.4 30.5 25.4 18.6 .0 .0 .0 .0 100.0
% within
Waste
Collection
Years
.0 .0 .0 3.1 4.9 5.0 6.5 .0 .0 .0 .0 3.2
% of Total .0 .0 .0 .8 1.0 .8 .6 .0 .0 .0 .0 3.2
Balaghat Count 0 0 3 36 11 2 1 0 0 0 0 53
% within
City
.0 .0 5.7 67.9 20.8 3.8 1.9 .0 .0 .0 .0 100.0
% within
Waste
Collection
Years
.0 .0 2.2 7.5 3.0 .7 .6 .0 .0 .0 .0 2.8
% of Total .0 .0 .2 1.9 .6 .1 .1 .0 .0 .0 .0 2.8
Jaipur Count 0 1 7 29 24 15 13 2 3 2 0 96
% within
City
.0 1.0 7.3 30.2 25.0 15.6 13.5 2.1 3.1 2.1 .0 100.0
% within
Waste
Collection
Years
.0 1.0 5.2 6.1 6.6 5.0 7.6 1.6 2.8 6.5 .0 5.1
% of Total .0 .1 .4 1.6 1.3 .8 .7 .1 .2 .1 .0 5.1
Yawatmal Count 0 2 0 4 4 5 2 3 5 0 0 25
% within
City
.0 8.0 .0 16.0 16.0 20.0 8.0 12.0 20.0 .0 .0 100.0
% within
Waste
Collection
Years
.0 2.1 .0 .8 1.1 1.7 1.2 2.4 4.7 .0 .0 1.3
% of Total .0 .1 .0 .2 .2 .3 .1 .2 .3 .0 .0 1.3
Wardha Count 0 2 0 13 5 3 1 0 1 0 0 25
% within
City
.0 8.0 .0 52.0 20.0 12.0 4.0 .0 4.0 .0 .0 100.0
% within
Waste
Collection
Years
.0 2.1 .0 2.7 1.4 1.0 .6 .0 .9 .0 .0 1.3
% of Total .0 .1 .0 .7 .3 .2 .1 .0 .1 .0 .0 1.3
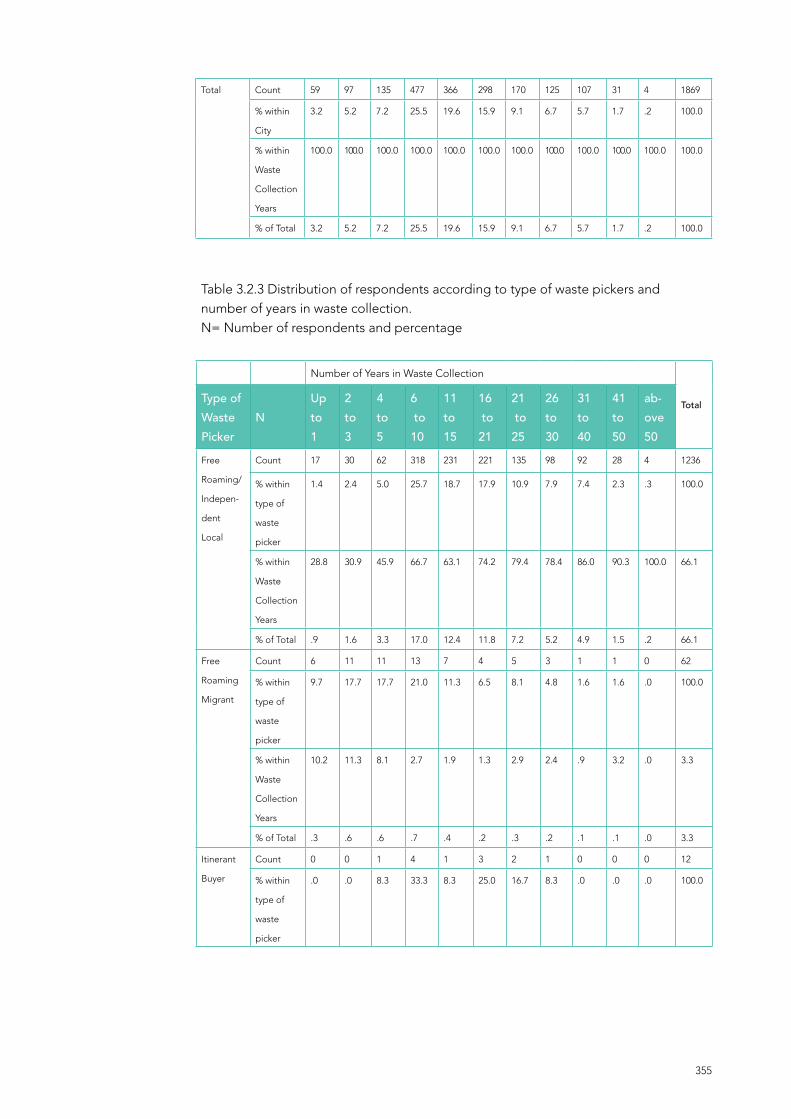
355
Total Count 59 97 135 477 366 298 170 125 107 31 4 1869
% within
City
3.2 5.2 7.2 25.5 19.6 15.9 9.1 6.7 5.7 1.7 .2 100.0
% within
Waste
Collection
Years
100.0 100.0 100.0 100.0 100.0 100.0 100.0 100.0 100.0 100.0 100.0 100.0
% of Total 3.2 5.2 7.2 25.5 19.6 15.9 9.1 6.7 5.7 1.7 .2 100.0
Table 3.2.3 Distribution of respondents according to type of waste pickers and number of years in waste collection.N= Number of respondents and percentage
Number of Years in Waste Collection
TotalType ofWaste Picker
NUp to1
2 to3
4 to5
6 to10
11 to15
16 to21
21 to25
26 to30
31 to40
41 to50
ab-ove50
Free
Roaming/
Indepen-
dent
Local
Count 17 30 62 318 231 221 135 98 92 28 4 1236
% within
type of
waste
picker
1.4 2.4 5.0 25.7 18.7 17.9 10.9 7.9 7.4 2.3 .3 100.0
% within
Waste
Collection
Years
28.8 30.9 45.9 66.7 63.1 74.2 79.4 78.4 86.0 90.3 100.0 66.1
% of Total .9 1.6 3.3 17.0 12.4 11.8 7.2 5.2 4.9 1.5 .2 66.1
Free
Roaming
Migrant
Count 6 11 11 13 7 4 5 3 1 1 0 62
% within
type of
waste
picker
9.7 17.7 17.7 21.0 11.3 6.5 8.1 4.8 1.6 1.6 .0 100.0
% within
Waste
Collection
Years
10.2 11.3 8.1 2.7 1.9 1.3 2.9 2.4 .9 3.2 .0 3.3
% of Total .3 .6 .6 .7 .4 .2 .3 .2 .1 .1 .0 3.3
Itinerant
Buyer
Count 0 0 1 4 1 3 2 1 0 0 0 12
% within
type of
waste
picker
.0 .0 8.3 33.3 8.3 25.0 16.7 8.3 .0 .0 .0 100.0

356
% within
Waste
Collection
Years
.0 .0 .7 .8 .3 1.0 1.2 .8 .0 .0 .0 .6
% of Total .0 .0 .1 .2 .1 .2 .1 .1 .0 .0 .0 .6
Waste
Sorter
Count 11 15 17 23 25 22 8 10 7 2 0 140
% within
type of
waste
picker
7.9 10.7 12.1 16.4 17.9 15.7 5.7 7.1 5.0 1.4 .0 100.0
% within
Waste
Collection
Years
18.6 15.5 12.6 4.8 6.8 7.4 4.7 8.0 6.5 6.5 .0 7.5
% of Total .6 .8 .9 1.2 1.3 1.2 .4 .5 .4 .1 .0 7.5
Door-
to-Door
Collector
Count 15 38 36 111 91 32 17 9 4 0 0 353
% within
type of
waste
picker
4.2 10.8 10.2 31.4 25.8 9.1 4.8 2.5 1.1 .0 .0 100.0
% within
Waste
Collection
Years
25.4 39.2 26.7 23.3 24.9 10.7 10.0 7.2 3.7 .0 .0 18.9
% of Total .8 2.0 1.9 5.9 4.9 1.7 .9 .5 .2 .0 .0 18.9
Other
informal
worker
Count 1 0 1 1 2 3 1 3 0 0 0 12
% within
type of
waste
picker
8.3 .0 8.3 8.3 16.7 25.0 8.3 25.0 .0 .0 .0 100.0
% within
Waste
Collection
Years
1.7 .0 .7 .2 .5 1.0 .6 2.4 .0 .0 .0 .6
% of Total .1 .0 .1 .1 .1 .2 .1 .2 .0 .0 .0 .6
Others Count 9 3 7 7 9 13 2 1 3 0 0 54
% within
type of
waste
picker
16.7 5.6 13.0 13.0 16.7 24.1 3.7 1.9 5.6 .0 .0 100.0
% within
Waste
Collection
Years
15.3 3.1 5.2 1.5 2.5 4.4 1.2 .8 2.8 .0 .0 2.9
% of Total .5 .2 .4 .4 .5 .7 .1 .1 .2 .0 .0 2.9

357
Total Count 59 97 135 477 366 298 170 125 107 31 4 1869
% within
type of
waste
picker
3.2 5.2 7.2 25.5 19.6 15.9 9.1 6.7 5.7 1.7 .2 100.0
% within
Waste
Collection
Years
100.0 100.0 100.0 100.0 100.0 100.0 100.0 100.0 100.0 100.0 100.0 100.0
% of Total 3.2 5.2 7.2 25.5 19.6 15.9 9.1 6.7 5.7 1.7 .2 100.0
Table 3.2.4 Distribution of respondents according to type of waste collection
Responses
Type of Waste Picker Number of responses
Percent (%) Percent of Cases (%)
Mixed / All type 1594 28.40 85.3
Paper 733 13.10 39.2
Cardboard 654 11.60 35.0
Plastics 769 13.70 41.1
Metals 632 11.30 33.8
Hair 207 3.70 11.1
Bones 57 1.00 3.0
Clothes / Textile 235 4.20 12.6
Glass 431 7.70 23.1
E-waste 265 4.70 14.2
Others 39 0.70 2.1
Total 5616 100.00 300
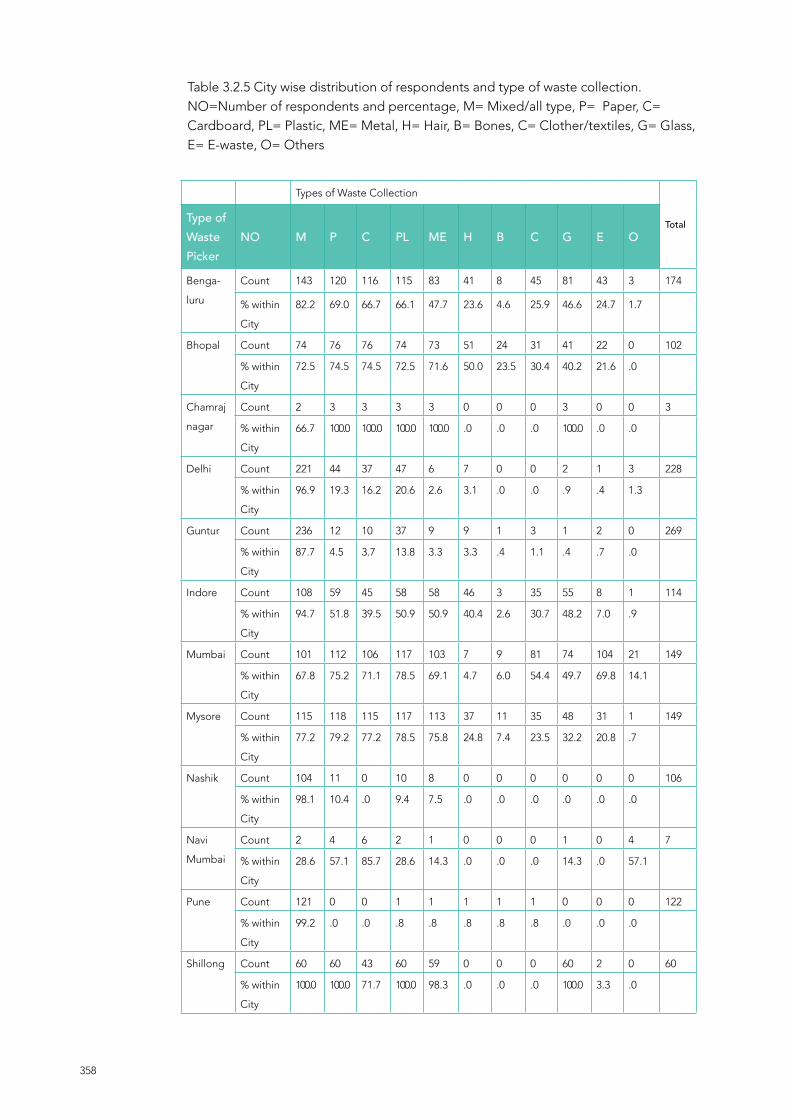
358
Table 3.2.5 City wise distribution of respondents and type of waste collection.NO=Number of respondents and percentage, M= Mixed/all type, P= Paper, C= Cardboard, PL= Plastic, ME= Metal, H= Hair, B= Bones, C= Clother/textiles, G= Glass,E= E-waste, O= Others
Types of Waste Collection
TotalType ofWaste Picker
NO M P C PL ME H B C G E O
Benga-
luru
Count 143 120 116 115 83 41 8 45 81 43 3 174
% within
City
82.2 69.0 66.7 66.1 47.7 23.6 4.6 25.9 46.6 24.7 1.7
Bhopal Count 74 76 76 74 73 51 24 31 41 22 0 102
% within
City
72.5 74.5 74.5 72.5 71.6 50.0 23.5 30.4 40.2 21.6 .0
Chamraj
nagar
Count 2 3 3 3 3 0 0 0 3 0 0 3
% within
City
66.7 100.0 100.0 100.0 100.0 .0 .0 .0 100.0 .0 .0
Delhi Count 221 44 37 47 6 7 0 0 2 1 3 228
% within
City
96.9 19.3 16.2 20.6 2.6 3.1 .0 .0 .9 .4 1.3
Guntur Count 236 12 10 37 9 9 1 3 1 2 0 269
% within
City
87.7 4.5 3.7 13.8 3.3 3.3 .4 1.1 .4 .7 .0
Indore Count 108 59 45 58 58 46 3 35 55 8 1 114
% within
City
94.7 51.8 39.5 50.9 50.9 40.4 2.6 30.7 48.2 7.0 .9
Mumbai Count 101 112 106 117 103 7 9 81 74 104 21 149
% within
City
67.8 75.2 71.1 78.5 69.1 4.7 6.0 54.4 49.7 69.8 14.1
Mysore Count 115 118 115 117 113 37 11 35 48 31 1 149
% within
City
77.2 79.2 77.2 78.5 75.8 24.8 7.4 23.5 32.2 20.8 .7
Nashik Count 104 11 0 10 8 0 0 0 0 0 0 106
% within
City
98.1 10.4 .0 9.4 7.5 .0 .0 .0 .0 .0 .0
Navi
Mumbai
Count 2 4 6 2 1 0 0 0 1 0 4 7
% within
City
28.6 57.1 85.7 28.6 14.3 .0 .0 .0 14.3 .0 57.1
Pune Count 121 0 0 1 1 1 1 1 0 0 0 122
% within
City
99.2 .0 .0 .8 .8 .8 .8 .8 .0 .0 .0
Shillong Count 60 60 43 60 59 0 0 0 60 2 0 60
% within
City
100.0 100.0 71.7 100.0 98.3 .0 .0 .0 100.0 3.3 .0

359
Tenali Count 32 0 0 0 0 0 0 0 0 0 0 32
% within
City
100.0 .0 .0 .0 .0 .0 .0 .0 .0 .0 .0
Thane Count 5 61 53 62 54 0 0 2 61 48 0 65
% within
City
7.7 93.8 81.5 95.4 83.1 .0 .0 3.1 93.8 73.8 .0
Tumkur Count 30 1 0 1 0 0 0 0 0 0 0 31
% within
City
96.8 3.2 .0 3.2 .0 .0 .0 .0 .0 .0 .0
Kalyan Count 62 44 41 42 33 2 0 0 1 2 5 59
% within
City
100.0 74.6 69.5 71.2 55.9 3.4 .0 .0 1.7 3.4 8.5
Balaghat Count 53 0 0 0 0 0 0 0 0 0 0 53
% within
City
100.0 .0 .0 .0 .0 .0 .0 .0 .0 .0 .0
Jaipur Count 96 0 0 0 0 0 0 0 0 0 0 96
% within
City
100.0 .0 .0 .0 .0 .0 .0 .0 .0 .0 .0
Yawat-
mal
Count 24 4 3 4 3 2 0 2 3 2 1 25
% within
City
96.0 16.0 12.0 16.0 12.0 8.0 .0 8.0 12.0 8.0 4.0
Wardha Count 5 4 0 19 25 4 0 0 0 0 0 25
% within
City
20.0 16.0 .0 76.0 100.0 16.0 .0 .0 .0 .0 .0
Total Count 1594 733 654 769 632 207 57 235 431 265 39 1869
Table 3.2.6 Distribution of respondents according to type of waste picker and type of waste collection.NO=Number of respondents and percentage, M= Mixed/all type, P= Paper, C= Cardboard, PL= Plastic, ME= Metal, H= Hair, B= Bones, C= Clother/textiles, G= Glass,E= E-waste, O= Others
Types of Waste Collection
TotalType ofWaste Picker
NO M P C PL ME H B C G E O
Free
Roaming
Indepe-
ndent
Local
Count 1044 503 457 515 453 122 27 155 300 192 11 1236
% within
type of
waste
picker
84.5 40.7 37.0 41.7 36.7 9.9 2.2 12.5 24.3 15.5 .9
Free
Roaming
Migrant
Count 46 45 42 45 40 19 0 14 33 34 0 62
% within
type of
waste
picker
74.2 72.6 67.7 72.6 64.5 30.6 .0 22.6 53.2 54.8 .0

360
Itinerant
Buyer
Count 10 8 8 7 7 2 3 5 5 3 0 12
% within
type of
waste
picker
83.3 66.7 66.7 58.3 58.3 16.7 25.0 41.7 41.7 25.0 .0
Waste
Sorter
Count 116 85 66 96 69 15 6 16 51 11 3 140
% within
type of
waste
picker
82.9 60.7 47.1 68.6 49.3 10.7 4.3 11.4 36.4 7.9 2.1
Door- to
door
collector
Count 336 73 66 75 47 42 18 38 35 21 1 353
% within
type of
waste
picker
95.2 20.7 18.7 21.2 13.3 11.9 5.1 10.8 9.9 5.9 .3
Other
informal
worker
Count 10 4 3 6 5 4 1 3 3 0 0 12
% within
type of
waste
picker
83.3 33.3 25.0 50.0 41.7 33.3 8.3 25.0 25.0 .0 .0
Others Count 32 15 12 25 11 3 2 4 4 4 24 54
% within
type of
waste
picker
59.3 27.8 22.2 46.3 20.4 5.6 3.7 7.4 7.4 7.4 44.4
Table 3.2.7 Mode of Collection
Responses
Mode of collectionNumber of responses
Percent (%) Percent of Cases (%)
On foot carrying bag 1297 64.40 69.4
Bicycle 123 6.10 6.6
Non-motorized tricycle 51 2.50 2.7
Motorized tricycle 36 1.80 1.9
Push Cart 166 8.20 8.9
E-cycle 192 9.50 10.3
Auto 91 4.50 4.9
Others 57 2.80 3.0
Total 2013 100.00 107.7

361
Table 3.2.8 City wise distribution of respondents and mode of collection.F= On foot carry bag, B= Bicycle, N= Non- motorised tricycle, M= Motorised tricycle,P= Push cart, E= E- cycle, A= Auto, O= Others
Mode of Collection Tot-
alCity F B N M P E A O
Bengaluru Count 95 27 0 1 1 0 39 12 174
% within City 54.6 15.5 .0 .6 .6 .0 22.4 6.9
% within
mode of
collection
7.3 22.0 .0 2.8 .6 .0 42.9 21.1
% of Total 5.1 1.4 .0 .1 .1 .0 2.1 .6 9.3
Bhopal Count 64 18 20 3 7 1 0 1 102
% within City 62.7 17.6 19.6 2.9 6.9 1.0 .0 1.0
% within
mode of
collection
4.9 14.6 39.2 8.3 4.2 .5 .0 1.8
% of Total 3.4 1.0 1.1 .2 .4 .1 .0 .1 5.5
Chamaraj
nagar
Count 2 1 0 0 0 0 0 0 3
% within City 66.7 33.3 .0 .0 .0 .0 .0 .0
% within
mode of
collection
.2 .8 .0 .0 .0 .0 .0 .0
% of Total .1 .1 .0 .0 .0 .0 .0 .0 .2
Delhi Count 14 14 4 14 1 175 3 16 228
% within City 6.1 6.1 1.8 6.1 .4 76.8 1.3 7.0
% within
mode of
collection
1.1 11.4 7.8 38.9 .6 91.1 3.3 28.1
% of Total .7 .7 .2 .7 .1 9.4 .2 .9 12.2
Guntur Count 215 18 7 0 32 5 0 2 269
% within City 79.9 6.7 2.6 .0 11.9 1.9 .0 .7
% within
mode of
collection
16.6 14.6 13.7 .0 19.3 2.6 .0 3.5
% of Total 11.5 1.0 .4 .0 1.7 .3 .0 .1 14.4
Indore Count 111 0 0 0 5 0 0 1 114
% within City 97.4 .0 .0 .0 4.4 .0 .0 .9
% within
mode of
collection
8.6 .0 .0 .0 3.0 .0 .0 1.8
% of Total 5.9 .0 .0 .0 .3 .0 .0 .1 6.1

362
Mumbai Count 124 1 1 0 0 0 0 23 149
% within City 83.2 .7 .7 .0 .0 .0 .0 15.4
% within
mode of
collection
9.6 .8 2.0 .0 .0 .0 .0 40.4
% of Total 6.6 .1 .1 .0 .0 .0 .0 1.2 8.0
Mysore Count 140 26 2 1 0 6 16 1 149
% within City 94.0 17.4 1.3 .7 .0 4.0 10.7 .7
% within
mode of
collection
10.8 21.1 3.9 2.8 .0 3.1 17.6 1.8
% of Total 7.5 1.4 .1 .1 .0 .3 .9 .1 8.0
Nashik Count 106 0 0 0 13 0 0 0 106
% within City 100.0 .0 .0 .0 12.3 .0 .0 .0
% within
mode of
collection
8.2 .0 .0 .0 7.8 .0 .0 .0
% of Total 5.7 .0 .0 .0 .7 .0 .0 .0 5.7
Navi
Mumbai
Count 7 0 0 0 0 0 0 0 7
% within City 100.0 .0 .0 .0 .0 .0 .0 .0
% within
mode of
collection
.5 .0 .0 .0 .0 .0 .0 .0
% of Total .4 .0 .0 .0 .0 .0 .0 .0 .4
Pune Count 1 0 0 2 96 0 28 0 122
% within City .8 .0 .0 1.6 78.7 .0 23.0 .0
% within
mode of
collection
.1 .0 .0 5.6 57.8 .0 30.8 .0
% of Total .1 .0 .0 .1 5.1 .0 1.5 .0 6.5
Shillong Count 60 0 0 0 0 0 0 0 60
% within City 100.0 .0 .0 .0 .0 .0 .0 .0
% within
mode of
collection
4.6 .0 .0 .0 .0 .0 .0 .0
% of Total 3.2 .0 .0 .0 .0 .0 .0 .0 3.2
Tenali Count 20 5 0 0 9 5 2 0 32
% within City 62.5 15.6 .0 .0 28.1 15.6 6.2 .0
% within
mode of
collection
1.5 4.1 .0 .0 5.4 2.6 2.2 .0
% of Total 1.1 .3 .0 .0 .5 .3 .1 .0 1.7
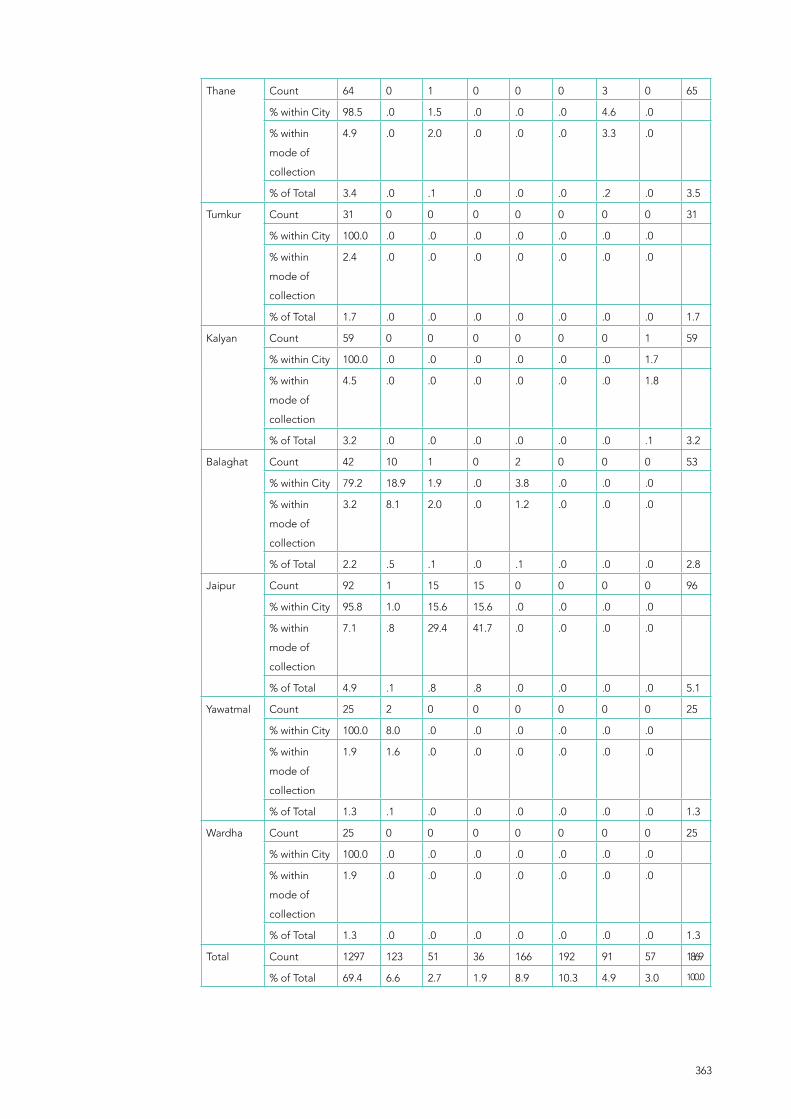
363
Thane Count 64 0 1 0 0 0 3 0 65
% within City 98.5 .0 1.5 .0 .0 .0 4.6 .0
% within
mode of
collection
4.9 .0 2.0 .0 .0 .0 3.3 .0
% of Total 3.4 .0 .1 .0 .0 .0 .2 .0 3.5
Tumkur Count 31 0 0 0 0 0 0 0 31
% within City 100.0 .0 .0 .0 .0 .0 .0 .0
% within
mode of
collection
2.4 .0 .0 .0 .0 .0 .0 .0
% of Total 1.7 .0 .0 .0 .0 .0 .0 .0 1.7
Kalyan Count 59 0 0 0 0 0 0 1 59
% within City 100.0 .0 .0 .0 .0 .0 .0 1.7
% within
mode of
collection
4.5 .0 .0 .0 .0 .0 .0 1.8
% of Total 3.2 .0 .0 .0 .0 .0 .0 .1 3.2
Balaghat Count 42 10 1 0 2 0 0 0 53
% within City 79.2 18.9 1.9 .0 3.8 .0 .0 .0
% within
mode of
collection
3.2 8.1 2.0 .0 1.2 .0 .0 .0
% of Total 2.2 .5 .1 .0 .1 .0 .0 .0 2.8
Jaipur Count 92 1 15 15 0 0 0 0 96
% within City 95.8 1.0 15.6 15.6 .0 .0 .0 .0
% within
mode of
collection
7.1 .8 29.4 41.7 .0 .0 .0 .0
% of Total 4.9 .1 .8 .8 .0 .0 .0 .0 5.1
Yawatmal Count 25 2 0 0 0 0 0 0 25
% within City 100.0 8.0 .0 .0 .0 .0 .0 .0
% within
mode of
collection
1.9 1.6 .0 .0 .0 .0 .0 .0
% of Total 1.3 .1 .0 .0 .0 .0 .0 .0 1.3
Wardha Count 25 0 0 0 0 0 0 0 25
% within City 100.0 .0 .0 .0 .0 .0 .0 .0
% within
mode of
collection
1.9 .0 .0 .0 .0 .0 .0 .0
% of Total 1.3 .0 .0 .0 .0 .0 .0 .0 1.3
Total Count 1297 123 51 36 166 192 91 57 1869
% of Total 69.4 6.6 2.7 1.9 8.9 10.3 4.9 3.0 100.0

364
Table 3.2.9 Type of waste picker and mode of waste collection.F= On foot carry bag, B= Bicycle, N= Non- motorised tricycle, M= Motorised tricycle,P= Push cart, E= E- cycle, A= Auto, O= Others
Mode of Collection Tot-
alCity F B N M P E A O
Free
Roaming
Indepen-
dent
Local
Count 1122 50 26 19 58 40 12 2 1236
% within
type of waste
picker
90.8 4.0 2.1 1.5 4.7 3.2 1.0 .2
% within
mode of
collection
86.5 40.7 51.0 52.8 34.9 20.8 13.2 3.5
% of Total 60.0 2.7 1.4 1.0 3.1 2.1 .6 .1 66.1
Free
Roaming
Migrant
Count 38 23 1 0 1 3 5 0 62
% within
type of waste
picker
61.3 37.1 1.6 .0 1.6 4.8 8.1 .0
% within
mode of
collection
2.9 18.7 2.0 .0 .6 1.6 5.5 .0
% of Total 2.0 1.2 .1 .0 .1 .2 .3 .0 3.3
Itinerant
Buyer
Count 9 6 1 0 0 3 3 0 12
% within
type of waste
picker
75.0 50.0 8.3 .0 .0 25.0 25.0 .0
% within
mode of
collection
.7 4.9 2.0 .0 .0 1.6 3.3 .0
% of Total .5 .3 .1 .0 .0 .2 .2 .0 .6
Waste
Sorter
Count 91 18 0 2 3 10 10 13 140
% within
type of waste
picker
65.0 12.9 .0 1.4 2.1 7.1 7.1 9.3
% within
mode of
collection
7.0 14.6 .0 5.6 1.8 5.2 11.0 22.8
% of Total 4.9 1.0 .0 .1 .2 .5 .5 .7 7.5
Door-
to-Door
Collector
Count 28 24 21 9 103 127 59 5 353
% within
type of waste
picker
7.9 6.8 5.9 2.5 29.2 36.0 16.7 1.4
% within
mode of
collection
2.2 19.5 41.2 25.0 62.0 66.1 64.8 8.8
% of Total 1.5 1.3 1.1 .5 5.5 6.8 3.2 .3 18.9

365
Other
informal
worker
Count 5 2 1 0 0 3 1 1 12
% within
type of waste
picker
41.7 16.7 8.3 .0 .0 25.0 8.3 8.3
% within
mode of
collection
.4 1.6 2.0 .0 .0 1.6 1.1 1.8
% of Total .3 .1 .1 .0 .0 .2 .1 .1 .6
Others Count 4 0 1 6 1 6 1 36 54
% within
type of waste
picker
7.4 .0 1.9 11.1 1.9 11.1 1.9 66.7
% within
mode of
collection
.3 .0 2.0 16.7 .6 3.1 1.1 63.2
% of Total .2 .0 .1 .3 .1 .3 .1 1.9 2.9
Tabled 3.2.10 Place of waste collection
Responses
Place of wastecollection
Number of responses
Percent (%) Percent of Cases (%)
Same area where living 1069 27.2 57.2
Other areas also 654 16.6 35.0
Anywhere on the streets 631 16.0 33.8
From Households 320 8.1 17.1
Garbage pile/ heap 213 5.4 11.4
Factory 93 2.4 5.0
Shops/Malls 170 4.3 9.1
Landfill 180 4.6 9.6
Secondary Points 42 1.1 2.2
Garbage lorry 29 .7 1.6
From ports 15 .4 .8
apartments 165 4.2 8.8
Transfer points 63 1.6 3.4
Market place 85 2.2 4.5
Whole Sale Yards 12 .3 .6
Municipal approved area
door-to-door
141 3.6 7.5
Others 52 1.3 2.8
Total 3934 100.0 210.5
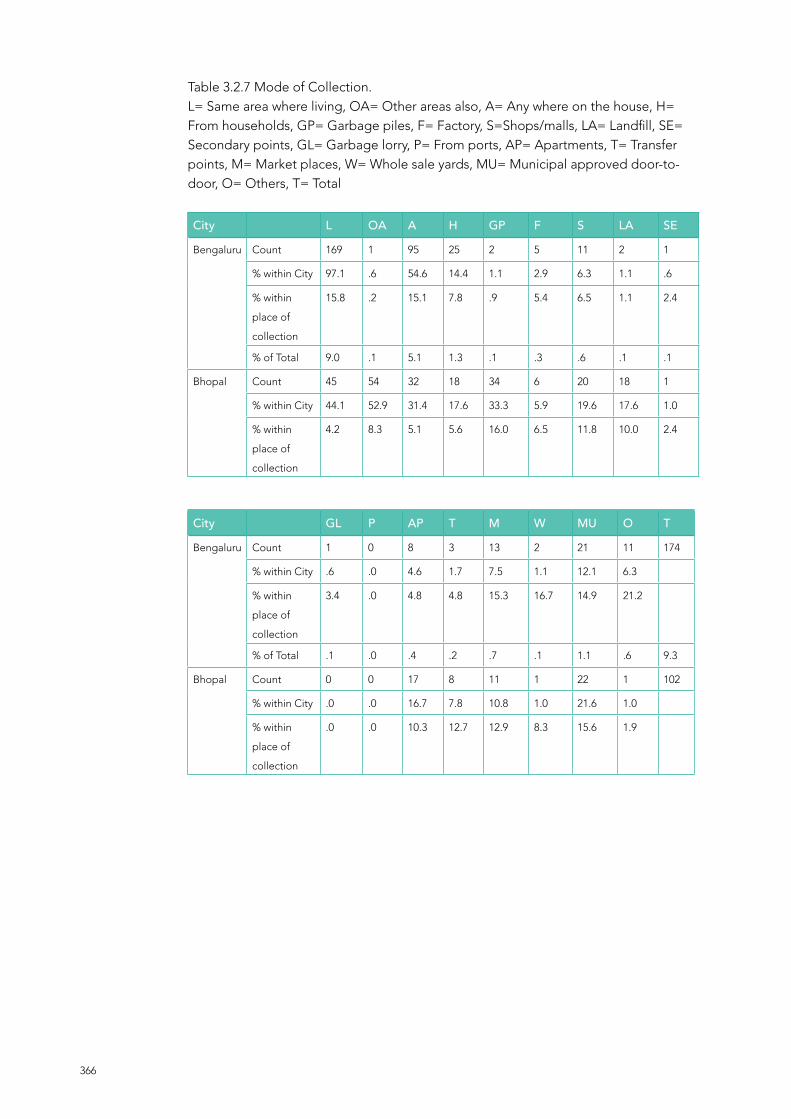
366
Table 3.2.7 Mode of Collection.L= Same area where living, OA= Other areas also, A= Any where on the house, H= From households, GP= Garbage piles, F= Factory, S=Shops/malls, LA= Landfill, SE= Secondary points, GL= Garbage lorry, P= From ports, AP= Apartments, T= Transfer points, M= Market places, W= Whole sale yards, MU= Municipal approved door-to-door, O= Others, T= Total
City L OA A H GP F S LA SE
Bengaluru Count 169 1 95 25 2 5 11 2 1
% within City 97.1 .6 54.6 14.4 1.1 2.9 6.3 1.1 .6
% within
place of
collection
15.8 .2 15.1 7.8 .9 5.4 6.5 1.1 2.4
% of Total 9.0 .1 5.1 1.3 .1 .3 .6 .1 .1
Bhopal Count 45 54 32 18 34 6 20 18 1
% within City 44.1 52.9 31.4 17.6 33.3 5.9 19.6 17.6 1.0
% within
place of
collection
4.2 8.3 5.1 5.6 16.0 6.5 11.8 10.0 2.4
City GL P AP T M W MU O T
Bengaluru Count 1 0 8 3 13 2 21 11 174
% within City .6 .0 4.6 1.7 7.5 1.1 12.1 6.3
% within
place of
collection
3.4 .0 4.8 4.8 15.3 16.7 14.9 21.2
% of Total .1 .0 .4 .2 .7 .1 1.1 .6 9.3
Bhopal Count 0 0 17 8 11 1 22 1 102
% within City .0 .0 16.7 7.8 10.8 1.0 21.6 1.0
% within
place of
collection
.0 .0 10.3 12.7 12.9 8.3 15.6 1.9

367
City L OA A H GP F S LA SE
Chamraj
nagar
% of Total 2.4 2.9 1.7 1.0 1.8 .3 1.1 1.0 .1
Count 3 2 1 0 0 0 2 3 0
% within City 100.0 66.7 33.3 .0 .0 .0 66.7 100.0 .0
% within place
of collection
.3 .3 .2 .0 .0 .0 1.2 1.7 .0
% of Total .2 .1 .1 .0 .0 .0 .1 .2 .0
Delhi Count 137 78 27 63 3 9 11 20 0
% within City 60.1 34.2 11.8 27.6 1.3 3.9 4.8 8.8 .0
% within place
of collection
12.8 11.9 4.3 19.7 1.4 9.7 6.5 11.1 .0
% of Total 7.3 4.2 1.4 3.4 .2 .5 .6 1.1 .0
Guntur Count 126 97 81 18 10 10 10 5 0
% within City 46.8 36.1 30.1 6.7 3.7 3.7 3.7 1.9 .0
% within place
of collection
11.8 14.8 12.8 5.6 4.7 10.8 5.9 2.8 .0
% of Total 6.7 5.2 4.3 1.0 .5 .5 .5 .3 .0
City GL P AP T M W MU O T
Chamraj
nagar
% of Total .0 .0 .9 .4 .6 .1 1.2 .1 5.5
Count 0 0 0 0 1 0 0 0 3
% within City .0 .0 .0 .0 33.3 .0 .0 .0
% within place
of collection
.0 .0 .0 .0 1.2 .0 .0 .0
% of Total .0 .0 .0 .0 .1 .0 .0 .0 .2
Delhi Count 1 0 54 0 14 0 8 13 228
% within City .4 .0 23.7 .0 6.1 .0 3.5 5.7
% within place
of collection
3.4 .0 32.7 .0 16.5 .0 5.7 25.0
% of Total .1 .0 2.9 .0 .7 .0 .4 .7 12.2
Guntur Count 0 0 2 0 7 1 27 1 269
% within City .0 .0 .7 .0 2.6 .4 10.0 .4
% within place
of collection
.0 .0 1.2 .0 8.2 8.3 19.1 1.9
% of Total .0 .0 .1 .0 .4 .1 1.4 .1 14.4

368
City L OA A H GP F S LA SE
Indore Count 22 80 48 9 28 10 5 5 0
% within City 19.3 70.2 42.1 7.9 24.6 8.8 4.4 4.4 .0
% within
place of
collection
2.1 12.2 7.6 2.8 13.1 10.8 2.9 2.8 .0
% of Total 1.2 4.3 2.6 .5 1.5 .5 .3 .3 .0
Mumbai Count 72 37 28 1 0 15 8 16 1
% within City 48.3 24.8 18.8 .7 .0 10.1 5.4 10.7 .7
% within
place of
collection
6.7 5.7 4.4 .3 .0 16.1 4.7 8.9 2.4
% of Total 3.9 2.0 1.5 .1 .0 .8 .4 .9 .1
City GL P AP T M W MU O T
Indore Count 0 0 0 1 0 0 0 2 114
% within City .0 .0 .0 .9 .0 .0 .0 1.8
% within
place of
collection
.0 .0 .0 1.6 .0 .0 .0 3.8
% of Total .0 .0 .0 .1 .0 .0 .0 .1 6.1
Mumbai Count 0 1 3 13 5 2 0 21 149
% within City .0 .7 2.0 8.7 3.4 1.3 .0 14.1
% within
place of
collection
.0 6.7 1.8 20.6 5.9 16.7 .0 40.4
% of Total .0 .1 .2 .7 .3 .1 .0 1.1 8.0

369
City L OA A H GP F S LA SE
Mysore Count 98 130 105 69 40 33 37 22 35
% within City 65.8 87.2 70.5 46.3 26.8 22.1 24.8 14.8 23.5
% within place
of collection
9.2 19.9 16.6 21.6 18.8 35.5 21.8 12.2 83.3
% of Total 5.2 7.0 5.6 3.7 2.1 1.8 2.0 1.2 1.9
Nashik Count 104 37 56 0 10 0 11 9 1
% within City 98.1 34.9 52.8 .0 9.4 .0 10.4 8.5 .9
% within place
of collection
9.7 5.7 8.9 .0 4.7 .0 6.5 5.0 2.4
% of Total 5.6 2.0 3.0 .0 .5 .0 .6 .5 .1
Navi
Mumbai
Count 5 0 0 0 0 0 0 0 0
% within City 71.4 .0 .0 .0 .0 .0 .0 .0 .0
% within place
of collection
.5 .0 .0 .0 .0 .0 .0 .0 .0
% of Total .3 .0 .0 .0 .0 .0 .0 .0 .0
City GL P AP T M W MU O T
Mysore Count 26 13 9 14 12 2 0 0 149
% within City 17.4 8.7 6.0 9.4 8.1 1.3 .0 .0
% within place
of collection
89.7 86.7 5.5 22.2 14.1 16.7 .0 .0
% of Total 1.4 .7 .5 .7 .6 .1 .0 .0 8.0
Nashik Count 0 0 0 0 3 0 3 0 106
% within City .0 .0 .0 .0 2.8 .0 2.8 .0
% within place
of collection
.0 .0 .0 .0 3.5 .0 2.1 .0
% of Total .0 .0 .0 .0 .2 .0 .2 .0 5.7
Navi
Mumbai
Count 0 0 0 2 0 0 0 2 7
% within City .0 .0 .0 28.6 .0 .0 .0 28.6
% within place
of collection
.0 .0 .0 3.2 .0 .0 .0 3.8
% of Total .0 .0 .0 .1 .0 .0 .0 .1 .4

370
City L OA A H GP F S LA SE
Pune Count 3 5 1 82 3 0 42 0 0
% within City 2.5 4.1 .8 67.2 2.5 .0 34.4 .0 .0
% within place
of collection
.3 .8 .2 25.6 1.4 .0 24.7 .0 .0
% of Total .2 .3 .1 4.4 .2 .0 2.2 .0 .0
Shillong Count 27 2 32 0 2 0 0 28 0
% within City 45.0 3.3 53.3 .0 3.3 .0 .0 46.7 .0
% within place
of collection
2.5 .3 5.1 .0 .9 .0 .0 15.6 .0
% of Total 1.4 .1 1.7 .0 .1 .0 .0 1.5 .0
Tenali Count 23 7 16 0 1 1 0 1 0
% within City 71.9 21.9 50.0 .0 3.1 3.1 .0 3.1 .0
% within place
of collection
2.2 1.1 2.5 .0 .5 1.1 .0 .6 .0
% of Total 1.2 .4 .9 .0 .1 .1 .0 .1 .0
City GL P AP T M W MU O T
Pune Count 0 0 69 0 2 0 58 1 122
% within City .0 .0 56.6 .0 1.6 .0 47.5 .8
% within place
of collection
.0 .0 41.8 .0 2.4 .0 41.1 1.9
% of Total .0 .0 3.7 .0 .1 .0 3.1 .1 6.5
Shillong Count 0 0 0 0 0 0 0 0 60
% within City .0 .0 .0 .0 .0 .0 .0 .0
% within place
of collection
.0 .0 .0 .0 .0 .0 .0 .0
% of Total .0 .0 .0 .0 .0 .0 .0 .0 3.2
Tenali Count 0 0 0 0 0 0 0 0 32
% within City .0 .0 .0 .0 .0 .0 .0 .0
% within place
of collection
.0 .0 .0 .0 .0 .0 .0 .0
% of Total .0 .0 .0 .0 .0 .0 .0 .0 1.7

371
City L OA A H GP F S LA SE
Thane Count 7 10 28 4 25 0 0 26 0
% within City 10.8 15.4 43.1 6.2 38.5 .0 .0 40.0 .0
% within place
of collection
.7 1.5 4.4 1.2 11.7 .0 .0 14.4 .0
% of Total .4 .5 1.5 .2 1.3 .0 .0 1.4 .0
Tumkur Count 18 17 6 0 0 0 0 0 0
% within City 58.1 54.8 19.4 .0 .0 .0 .0 .0 .0
% within place
of collection
1.7 2.6 1.0 .0 .0 .0 .0 .0 .0
% of Total 1.0 .9 .3 .0 .0 .0 .0 .0 .0
Kalyan Count 32 3 21 1 37 1 11 23 2
% within City 54.2 5.1 35.6 1.7 62.7 1.7 18.6 39.0 3.4
% within place
of collection
3.0 .5 3.3 .3 17.4 1.1 6.5 12.8 4.8
% of Total 1.7 .2 1.1 .1 2.0 .1 .6 1.2 .1
City GL P AP T M W MU O T
Thane Count 0 0 2 0 0 0 0 0 65
% within City .0 .0 3.1 .0 .0 .0 .0 .0
% within place
of collection
.0 .0 1.2 .0 .0 .0 .0 .0
% of Total .0 .0 .1 .0 .0 .0 .0 .0 3.5
Tumkur Count 0 0 0 20 1 0 0 0 31
% within City .0 .0 .0 64.5 3.2 .0 .0 .0
% within place
of collection
.0 .0 .0 31.7 1.2 .0 .0 .0
% of Total .0 .0 .0 1.1 .1 .0 .0 .0 1.7
Kalyan Count 0 0 0 1 14 3 0 0 59
% within City .0 .0 .0 1.7 23.7 5.1 .0 .0
% within place
of collection
.0 .0 .0 1.6 16.5 25.0 .0 .0
% of Total .0 .0 .0 .1 .7 .2 .0 .0 3.2

372
City L OA A H GP F S LA SE
Balaghat Count 44 46 40 28 11 2 2 2 1
% within City 83.0 86.8 75.5 52.8 20.8 3.8 3.8 3.8 1.9
% within place
of collection
4.1 7.0 6.3 8.8 5.2 2.2 1.2 1.1 2.4
% of Total 2.4 2.5 2.1 1.5 .6 .1 .1 .1 .1
Jaipur Count 92 0 7 2 7 1 0 0 0
% within City 95.8 .0 7.3 2.1 7.3 1.0 .0 .0 .0
% within place
of collection
8.6 .0 1.1 .6 3.3 1.1 .0 .0 .0
% of Total 4.9 .0 .4 .1 .4 .1 .0 .0 .0
City GL P AP T M W MU O T
Balaghat Count 1 1 1 1 2 1 1 0 53
% within City 1.9 1.9 1.9 1.9 3.8 1.9 1.9 .0
% within place
of collection
3.4 6.7 .6 1.6 2.4 8.3 .7 .0
% of Total .1 .1 .1 .1 .1 .1 .1 .0 2.8
Jaipur Count 0 0 0 0 0 0 0 0 96
% within City .0 .0 .0 .0 .0 .0 .0 .0
% within place
of collection
.0 .0 .0 .0 .0 .0 .0 .0
% of Total .0 .0 .0 .0 .0 .0 .0 .0 5.1
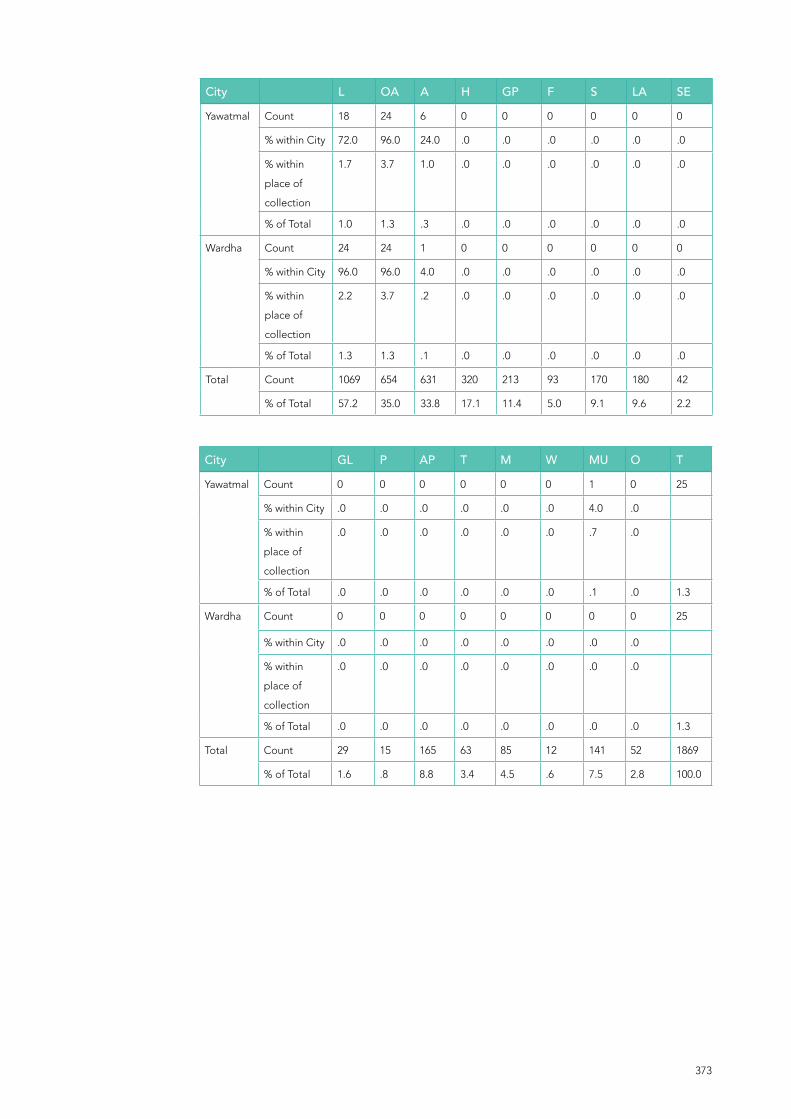
373
City L OA A H GP F S LA SE
Yawatmal Count 18 24 6 0 0 0 0 0 0
% within City 72.0 96.0 24.0 .0 .0 .0 .0 .0 .0
% within
place of
collection
1.7 3.7 1.0 .0 .0 .0 .0 .0 .0
% of Total 1.0 1.3 .3 .0 .0 .0 .0 .0 .0
Wardha Count 24 24 1 0 0 0 0 0 0
% within City 96.0 96.0 4.0 .0 .0 .0 .0 .0 .0
% within
place of
collection
2.2 3.7 .2 .0 .0 .0 .0 .0 .0
% of Total 1.3 1.3 .1 .0 .0 .0 .0 .0 .0
Total Count 1069 654 631 320 213 93 170 180 42
% of Total 57.2 35.0 33.8 17.1 11.4 5.0 9.1 9.6 2.2
City GL P AP T M W MU O T
Yawatmal Count 0 0 0 0 0 0 1 0 25
% within City .0 .0 .0 .0 .0 .0 4.0 .0
% within
place of
collection
.0 .0 .0 .0 .0 .0 .7 .0
% of Total .0 .0 .0 .0 .0 .0 .1 .0 1.3
Wardha Count 0 0 0 0 0 0 0 0 25
% within City .0 .0 .0 .0 .0 .0 .0 .0
% within
place of
collection
.0 .0 .0 .0 .0 .0 .0 .0
% of Total .0 .0 .0 .0 .0 .0 .0 .0 1.3
Total Count 29 15 165 63 85 12 141 52 1869
% of Total 1.6 .8 8.8 3.4 4.5 .6 7.5 2.8 100.0
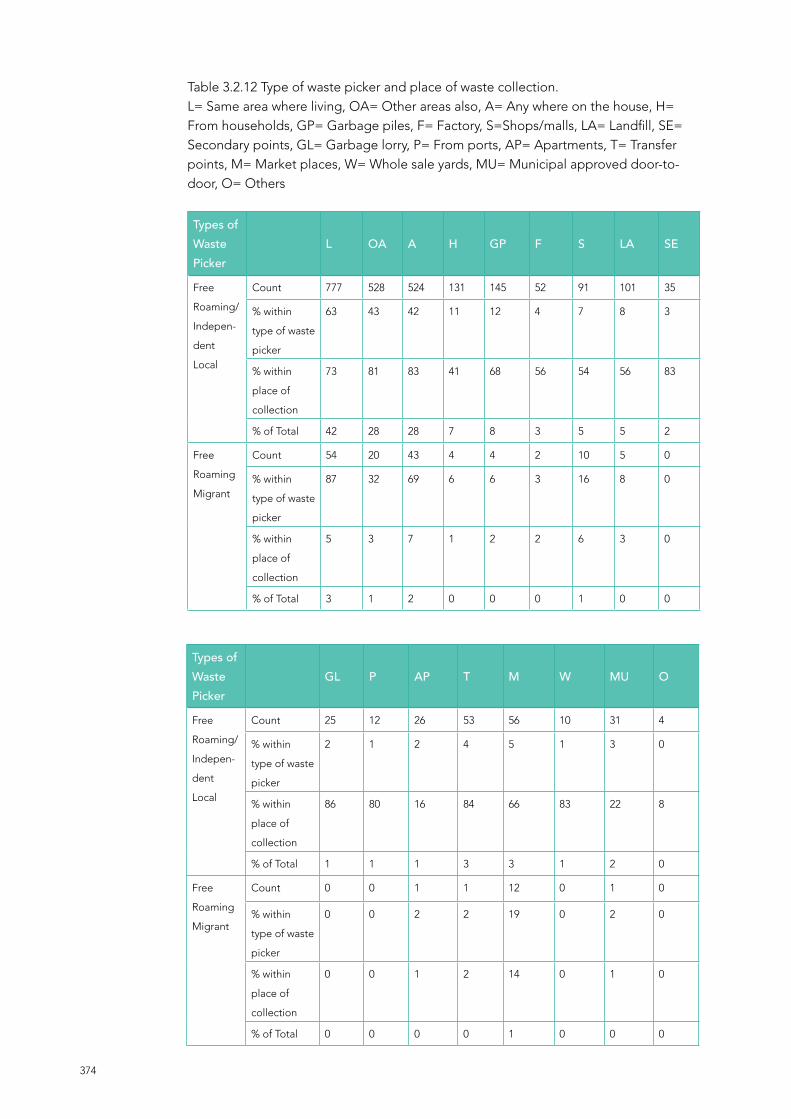
374
Types of Waste Picker
L OA A H GP F S LA SE
Free
Roaming/
Indepen-
dent
Local
Count 777 528 524 131 145 52 91 101 35
% within
type of waste
picker
63 43 42 11 12 4 7 8 3
% within
place of
collection
73 81 83 41 68 56 54 56 83
% of Total 42 28 28 7 8 3 5 5 2
Free
Roaming
Migrant
Count 54 20 43 4 4 2 10 5 0
% within
type of waste
picker
87 32 69 6 6 3 16 8 0
% within
place of
collection
5 3 7 1 2 2 6 3 0
% of Total 3 1 2 0 0 0 1 0 0
Types of Waste Picker
GL P AP T M W MU O
Free
Roaming/
Indepen-
dent
Local
Count 25 12 26 53 56 10 31 4
% within
type of waste
picker
2 1 2 4 5 1 3 0
% within
place of
collection
86 80 16 84 66 83 22 8
% of Total 1 1 1 3 3 1 2 0
Free
Roaming
Migrant
Count 0 0 1 1 12 0 1 0
% within
type of waste
picker
0 0 2 2 19 0 2 0
% within
place of
collection
0 0 1 2 14 0 1 0
% of Total 0 0 0 0 1 0 0 0
Table 3.2.12 Type of waste picker and place of waste collection.L= Same area where living, OA= Other areas also, A= Any where on the house, H= From households, GP= Garbage piles, F= Factory, S=Shops/malls, LA= Landfill, SE= Secondary points, GL= Garbage lorry, P= From ports, AP= Apartments, T= Transfer points, M= Market places, W= Whole sale yards, MU= Municipal approved door-to-door, O= Others

375
Types of Waste Picker
L OA A H GP F S LA SE
Itinerant
Buyer
Count 11 6 5 2 1 2 3 4 4
% within type
of waste picker
92 50 42 17 8 17 25 33 33
% within place
of collection
1 1 1 1 0 2 2 2 10
% of Total 1 0 0 0 0 0 0 0 0
Waste
Sorter
Count 73 16 25 11 52 10 9 49 2
% within type
of waste picker
52 11 18 8 37 7 6 35 1
% within place
of collection
7 2 4 3 24 11 5 27 5
% of Total 4 1 1 1 3 1 0 3 0
Door-
to-Door
Collector
Count 130 65 30 170 7 9 51 16 1
% within type
of waste picker
37 18 8 48 2 3 14 5 0
% within place
of collection
12 10 5 53 3 10 30 9 2
% of Total 7 3 2 9 0 0 3 1 0
Types of Waste Picker
GL P AP T M W MU O
Itinerant
Buyer
Count 3 1 0 1 1 0 0 0
% within type
of waste picker
25 8 0 8 8 0 0 0
% within place
of collection
10 7 0 2 1 0 0 0
% of Total 0 0 0 0 0 0 0 0
Waste
Sorter
Count 0 1 3 2 6 2 7 10
% within type
of waste picker
0 1 2 1 4 1 5 7
% within place
of collection
0 7 2 3 7 17 5 19
% of Total 0 0 0 0 0 0 0 1
Door-
to-Door
Collector
Count 0 0 133 5 9 0 100 6
% within type
of waste picker
0 0 38 1 3 0 28 2
% within place
of collection
0 0 81 8 11 0 71 12
% of Total 0 0 7 0 0 0 5 0
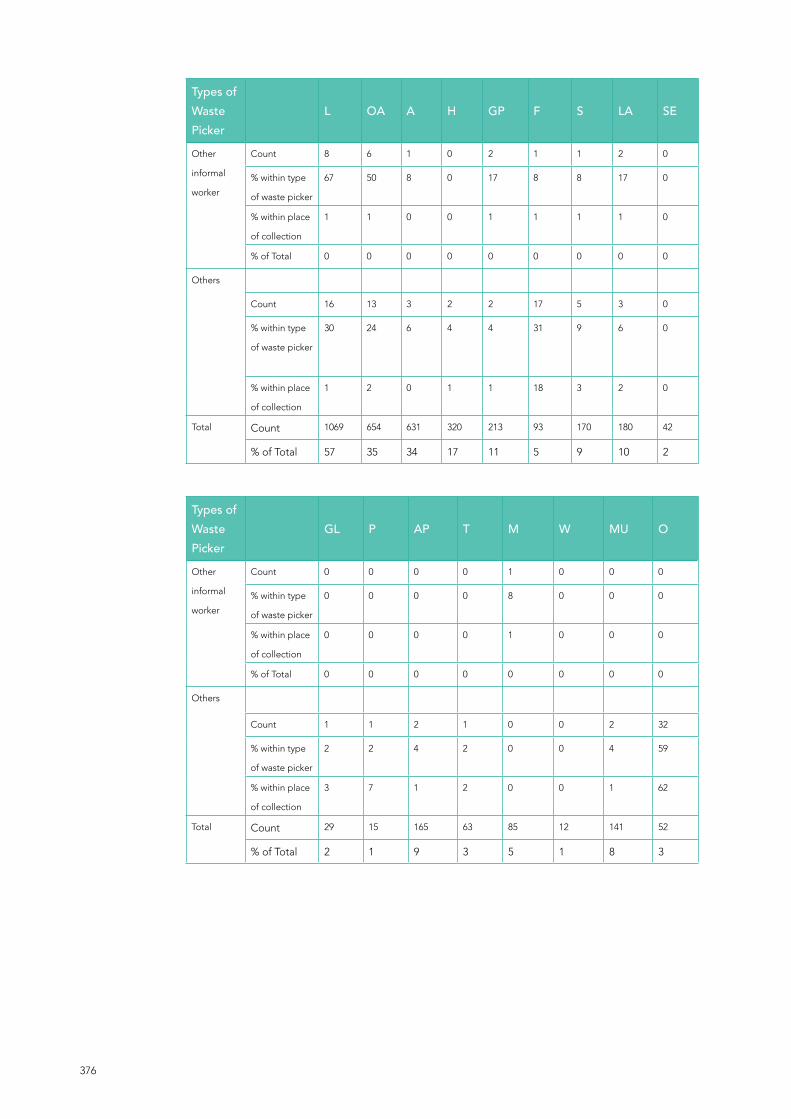
376
Types of Waste Picker
L OA A H GP F S LA SE
Other
informal
worker
Count 8 6 1 0 2 1 1 2 0
% within type
of waste picker
67 50 8 0 17 8 8 17 0
% within place
of collection
1 1 0 0 1 1 1 1 0
% of Total 0 0 0 0 0 0 0 0 0
Others
Count 16 13 3 2 2 17 5 3 0
% within type
of waste picker
30 24 6 4 4 31 9 6 0
% within place
of collection
1 2 0 1 1 18 3 2 0
Total Count 1069 654 631 320 213 93 170 180 42
% of Total 57 35 34 17 11 5 9 10 2
Types of Waste Picker
GL P AP T M W MU O
Other
informal
worker
Count 0 0 0 0 1 0 0 0
% within type
of waste picker
0 0 0 0 8 0 0 0
% within place
of collection
0 0 0 0 1 0 0 0
% of Total 0 0 0 0 0 0 0 0
Others
Count 1 1 2 1 0 0 2 32
% within type
of waste picker
2 2 4 2 0 0 4 59
% within place
of collection
3 7 1 2 0 0 1 62
Total Count 29 15 165 63 85 12 141 52
% of Total 2 1 9 3 5 1 8 3

377
Table 3.2.13 Time of waste collection
Responses
wastecollection time
Number of responses
Percent (%) Percent of Cases (%)
Full Day 907 38.40 48.5%
Half Day 397 16.80 21.2%
Early Morning 880 37.30 47.1%
Evening Only 54 2.30 2.9%
Night only 22 0.90 1.2%
No specific time 72 3.10 3.9%
Others 27 1.10 1.4%
Total 2359 100.00 126.2%
Table 3.2.14 City wise waste pickers and time of waste collection
City
No. of
respondents
and percentage
Full
Day
Half
Day
Early
Mor-
ning
Eve
only
Night
only
No
speci-
fic
time
Oth-
ersTotal
Bengaluru Count 53 12 102 20 11 6 2 206
% within City 25.7 5.8 49.5 9.7 5.3 2.9 1.0
Bhopal Count 40 16 48 0 1 4 0 109
% within City 36.7 14.7 44.0 0.0 0.9 3.7 0.0
Chamraj
nagar
Count 0 1 3 0 0 0 0 4
% within City 0 25 75 0 0 0 0
Delhi Count 53 9 156 6 5 1 3 233
% within City 22.7 3.9 67.0 2.6 2.1 0.4 1.3
Guntur Count 162 86 61 0 1 1 0 311
% within City 52.1 27.7 19.6 0.0 0.3 0.3 0
Indore Count 53 14 62 0 0 1 0 130
% within City 40.8 10.8 47.7 0.0 0.0 0.8 0.0
Mumbai Count 68 21 60 19 1 13 21 203
% within City 33.5 10.3 29.6 9.4 0.5 6.4 10.3
Mysore Count 137 12 16 3 0 9 0 177
% within City 77.4 6.8 9.0 1.7 0.0 5.1 0.0
Nashik Count 0 81 103 1 0 0 0 185
% within City 0 43.8 55.7 0.5 0 0 0
Navi
Mumbai
Count 0 0 7 0 0 0 0 7
% within City 0 0 100 0 0 0 0
Pune Count 90 15 45 2 0 1 1 154
% within City 58.4 9.7 29.2 1.3 0.0 0.6 0.6

378
Table 3.2.14 City wise waste pickers and time of waste collection
Types of
waste
picker
No. of
respondents
and percentage
Full
Day
Half
Day
Early
Mor-
ning
Eve
only
Night
only
No
speci-
fic
time
Oth-
ersTotal
Free
Roaming
Indepen-
dent/ Local
Count 608 322 607 16 4 63 0 1236
% within type of
picker
49.2 26.1 49.1 1.3 .3 5.1 .0
Free
Roaming
Migrant
Count 26 12 22 11 9 1 0 62
% within type of
picker
41.9 19.4 35.5 17.7 14.5 1.6 .0
Itinerant
Buyer
Count 8 1 3 0 0 1 0 12
% within type of
picker
66.7 8.3 25.0 .0 .0 8.3 .0
Waste
Sorter
Count 81 32 34 2 5 2 2 140
% within type of
picker
57.9 22.9 24.3 1.4 3.6 1.4 1.4
Door-
to-Door
Collector
Count 156 27 199 8 2 2 1 353
% within type of
picker
44.2 7.6 56.4 2.3 .6 .6 .3
Shillong Count 60 0 4 0 0 0 0 64
% within City 93.75 0 6.25 0 0 0 0
Tenali Count 11 4 17 1 0 0 0 33
% within City 33.3 12.1 51.5 3.0 0.0 0.0 0.0
Thane Count 38 7 30 0 3 2 0 80
% within City 47.5 8.75 37.5 0 3.75 2.5 0
Tumkur Count 5 25 1 0 0 0 0 31
% within City 16.1 80.6 3.2 0 0 0 0
Kalyan Count 24 37 23 0 0 0 0 84
% within City 28.6 44.0 27.4 0 0 0 0
Balaghat Count 37 38 20 0 0 2 0 97
% within City 38.1 39.2 20.6 0.0 0.0 2.1 0
Jaipur Count 60 3 84 0 0 0 0 147
% within City 40.8 2.0 57.1 0 0 0 0
Yawatmal Count 16 16 16 0 0 25 0 73
% within City 21.9 21.9 21.9 0.0 0.0 34.2 0
Wardha Count 0 0 22 2 0 7 0 31
% within City 0 0 71.0 6.5 0.0 22.6 0
Total Count 907 397 880 54 22 72 27 2359
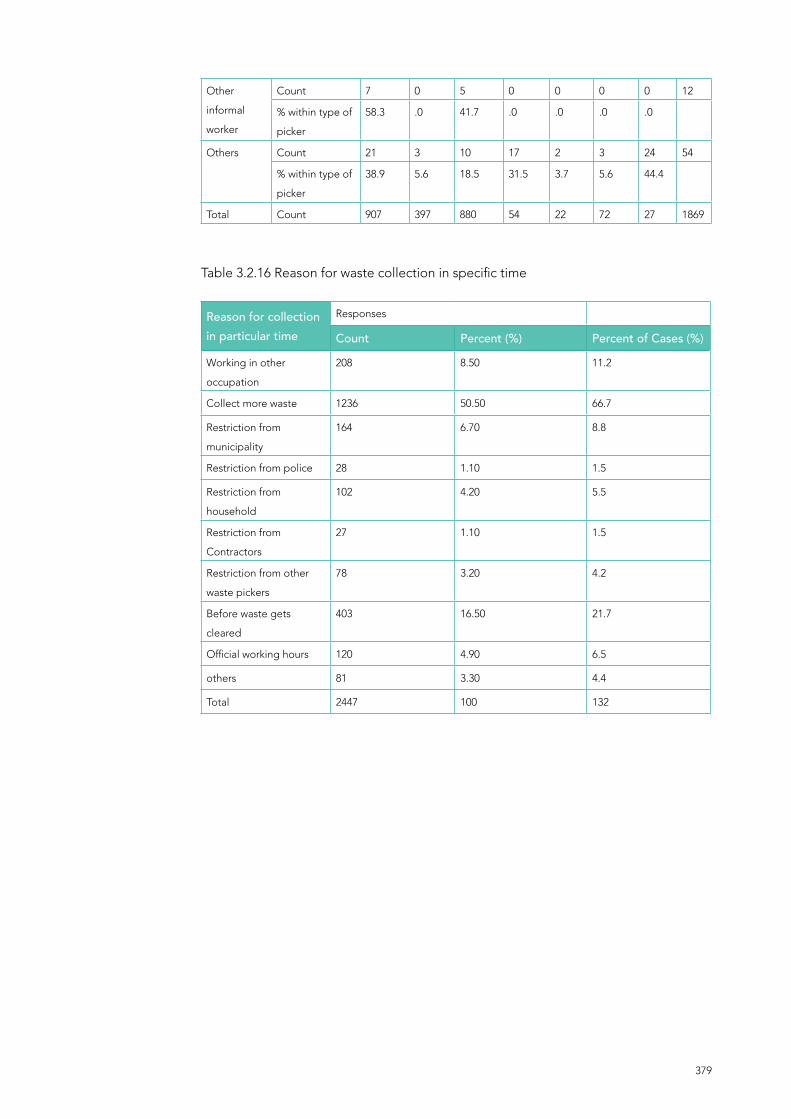
379
Other
informal
worker
Count 7 0 5 0 0 0 0 12
% within type of
picker
58.3 .0 41.7 .0 .0 .0 .0
Others Count 21 3 10 17 2 3 24 54
% within type of
picker
38.9 5.6 18.5 31.5 3.7 5.6 44.4
Total Count 907 397 880 54 22 72 27 1869
Table 3.2.16 Reason for waste collection in specific time
Reason for collection in particular time
Responses
Count Percent (%) Percent of Cases (%)
Working in other
occupation
208 8.50 11.2
Collect more waste 1236 50.50 66.7
Restriction from
municipality
164 6.70 8.8
Restriction from police 28 1.10 1.5
Restriction from
household
102 4.20 5.5
Restriction from
Contractors
27 1.10 1.5
Restriction from other
waste pickers
78 3.20 4.2
Before waste gets
cleared
403 16.50 21.7
Official working hours 120 4.90 6.5
others 81 3.30 4.4
Total 2447 100 132

380
Table 3.2.17 City wise respondents and reason for waste collection.OC= Working in other occupation, C= Collect more waste, M = Restriction frommunicipality, P= Restriction from police, H=Restriction from households C= Restriction from contractors, W= Restriction from other waste pickers, B= Before waste gets collected, H= Official working hours, O= Others, T= Total
Type ofWaste Picker
OC C M P H C W B H O T
Bengaluru Count 4 115 12 7 26 12 1 21 21 3 174
% within
City
2.3 66.1 6.9 4.0 14.9 6.9 .6 12.1 12.1 1.7
Bhopal Count 9 47 20 5 1 2 9 23 9 19 102
% within
City
8.8 46.1 19.6 4.9 1.0 2.0 8.8 22.5 8.8 18.6
Chamraj
nagar
Count 1 2 0 1 0 0 0 2 0 0 3
% within
City
33.3 66.7 .0 33.3 .0 .0 .0 66.7 .0 .0
Delhi Count 20 177 3 4 14 4 5 33 8 17 225
% within
City
8.9 78.7 1.3 1.8 6.2 1.8 2.2 14.7 3.6 7.5
Guntur Count 30 180 25 0 11 0 1 13 9 9 268
% within
City
11.2 67.2 9.3 .0 4.1 .0 .4 4.9 3.4 3.4
Indore Count 17 42 45 4 4 4 23 40 2 0 112
% within
City
15.2 37.5 40.2 3.6 3.6 3.6 20.5 35.7 1.8 .0
Mumbai Count 11 93 8 0 1 0 5 44 4 25 149
% within
City
7.4 62.4 5.4 .0 .7 .0 3.4 29.5 2.7 16.8
Mysore Count 92 55 1 1 1 1 2 32 2 0 143
% within
City
64.3 38.5 .7 .7 .7 .7 1.4 22.4 1.4 .0
Nashik Count 1 86 1 0 0 0 1 72 2 0 106
% within
City
.9 81.1 .9 .0 .0 .0 .9 67.9 1.9 .0
Navi
Mumbai
Count 0 7 0 0 0 0 2 6 1 0 7
% within
City
.0 100.0 .0 .0 .0 .0 28.6 85.7 14.3 .0
Pune Count 2 27 44 3 42 2 2 14 61 0 122
% within
City
1.6 22.1 36.1 2.5 34.4 1.6 1.6 11.5 50.0 .0
Shillong Count 0 57 0 0 0 0 0 0 0 0 57
% within
City
.0 100.0 .0 .0 .0 .0 .0 .0 .0 .0
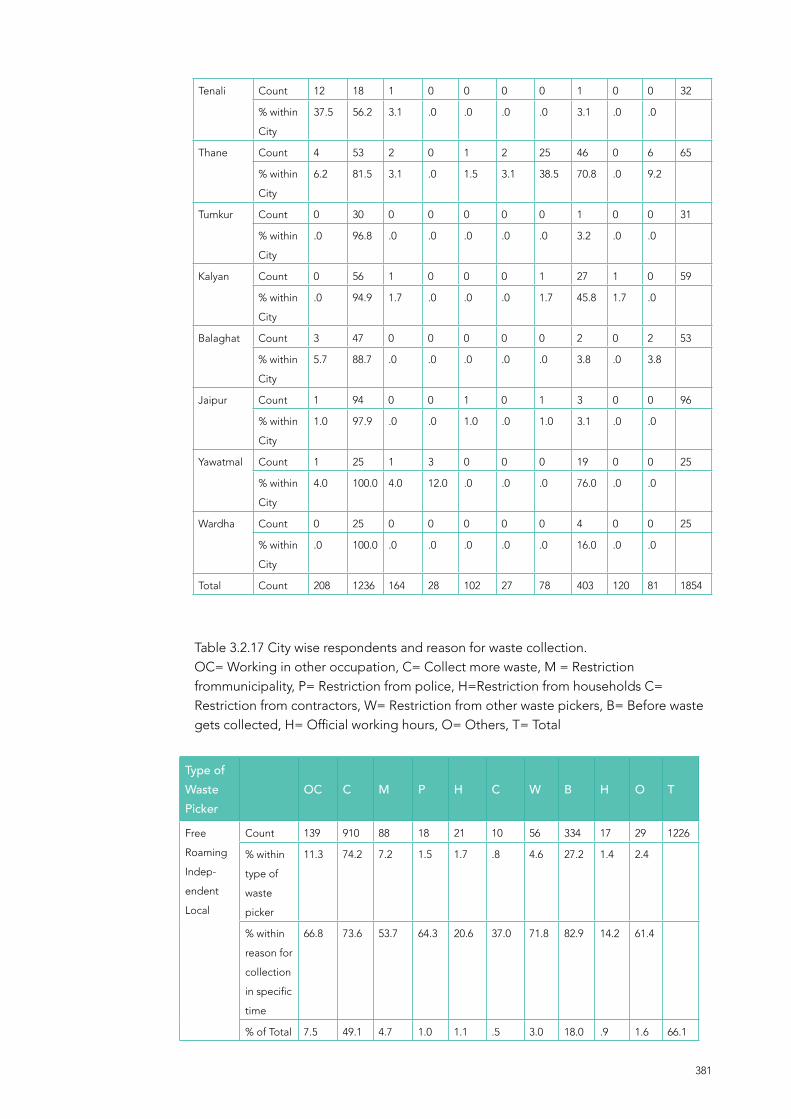
381
Tenali Count 12 18 1 0 0 0 0 1 0 0 32
% within
City
37.5 56.2 3.1 .0 .0 .0 .0 3.1 .0 .0
Thane Count 4 53 2 0 1 2 25 46 0 6 65
% within
City
6.2 81.5 3.1 .0 1.5 3.1 38.5 70.8 .0 9.2
Tumkur Count 0 30 0 0 0 0 0 1 0 0 31
% within
City
.0 96.8 .0 .0 .0 .0 .0 3.2 .0 .0
Kalyan Count 0 56 1 0 0 0 1 27 1 0 59
% within
City
.0 94.9 1.7 .0 .0 .0 1.7 45.8 1.7 .0
Balaghat Count 3 47 0 0 0 0 0 2 0 2 53
% within
City
5.7 88.7 .0 .0 .0 .0 .0 3.8 .0 3.8
Jaipur Count 1 94 0 0 1 0 1 3 0 0 96
% within
City
1.0 97.9 .0 .0 1.0 .0 1.0 3.1 .0 .0
Yawatmal Count 1 25 1 3 0 0 0 19 0 0 25
% within
City
4.0 100.0 4.0 12.0 .0 .0 .0 76.0 .0 .0
Wardha Count 0 25 0 0 0 0 0 4 0 0 25
% within
City
.0 100.0 .0 .0 .0 .0 .0 16.0 .0 .0
Total Count 208 1236 164 28 102 27 78 403 120 81 1854
Table 3.2.17 City wise respondents and reason for waste collection.OC= Working in other occupation, C= Collect more waste, M = Restriction frommunicipality, P= Restriction from police, H=Restriction from households C= Restriction from contractors, W= Restriction from other waste pickers, B= Before waste gets collected, H= Official working hours, O= Others, T= Total
Type ofWaste Picker
OC C M P H C W B H O T
Free
Roaming
Indep-
endent
Local
Count 139 910 88 18 21 10 56 334 17 29 1226
% within
type of
waste
picker
11.3 74.2 7.2 1.5 1.7 .8 4.6 27.2 1.4 2.4
% within
reason for
collection
in specific
time
66.8 73.6 53.7 64.3 20.6 37.0 71.8 82.9 14.2 61.4
% of Total 7.5 49.1 4.7 1.0 1.1 .5 3.0 18.0 .9 1.6 66.1
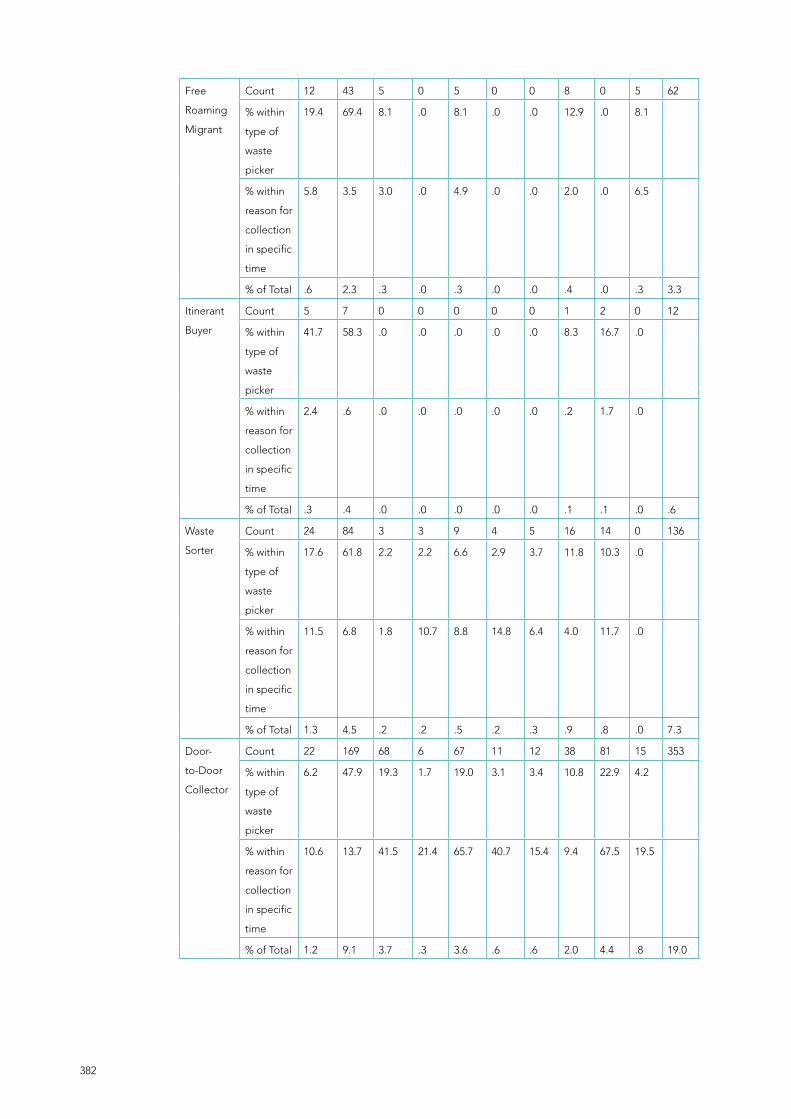
382
Free
Roaming
Migrant
Count 12 43 5 0 5 0 0 8 0 5 62
% within
type of
waste
picker
19.4 69.4 8.1 .0 8.1 .0 .0 12.9 .0 8.1
% within
reason for
collection
in specific
time
5.8 3.5 3.0 .0 4.9 .0 .0 2.0 .0 6.5
% of Total .6 2.3 .3 .0 .3 .0 .0 .4 .0 .3 3.3
Itinerant
Buyer
Count 5 7 0 0 0 0 0 1 2 0 12
% within
type of
waste
picker
41.7 58.3 .0 .0 .0 .0 .0 8.3 16.7 .0
% within
reason for
collection
in specific
time
2.4 .6 .0 .0 .0 .0 .0 .2 1.7 .0
% of Total .3 .4 .0 .0 .0 .0 .0 .1 .1 .0 .6
Waste
Sorter
Count 24 84 3 3 9 4 5 16 14 0 136
% within
type of
waste
picker
17.6 61.8 2.2 2.2 6.6 2.9 3.7 11.8 10.3 .0
% within
reason for
collection
in specific
time
11.5 6.8 1.8 10.7 8.8 14.8 6.4 4.0 11.7 .0
% of Total 1.3 4.5 .2 .2 .5 .2 .3 .9 .8 .0 7.3
Door-
to-Door
Collector
Count 22 169 68 6 67 11 12 38 81 15 353
% within
type of
waste
picker
6.2 47.9 19.3 1.7 19.0 3.1 3.4 10.8 22.9 4.2
% within
reason for
collection
in specific
time
10.6 13.7 41.5 21.4 65.7 40.7 15.4 9.4 67.5 19.5
% of Total 1.2 9.1 3.7 .3 3.6 .6 .6 2.0 4.4 .8 19.0

383
Other
informal
worker
Count 3 5 0 0 0 0 1 0 2 0 11
% within
type of
waste
picker
27.3 45.5 .0 .0 .0 .0 9.1 .0 18.2 .0
% within
reason for
collection
in specific
time
1.4 .4 .0 .0 .0 .0 1.3 .0 1.7 .0
% of Total .2 .3 .0 .0 .0 .0 .1 .0 .1 .0 .6
Others Count 3 18 0 1 0 2 4 6 4 32 54
% within
type of
waste
picker
5.6 33.3 .0 1.9 .0 3.7 7.4 11.1 7.4 59.3
% within
reason for
collection
in specific
time
1.4 1.5 .0 3.6 .0 7.4 5.1 1.5 3.3 37.7
% of Total .2 1.0 .0 .1 .0 .1 .2 .3 .2 1.8 2.9
Total Count 208 1236 164 28 102 27 78 403 120 77 1854
% of Total 11.2 66.7 8.8 1.5 5.5 1.5 4.2 21.7 6.5 4.2 100.0
3.2.19 General working hours of waste pickers
No of working hours No of Respondents
(N) Percent (%)
1 3 0.2
2 9 0.5
3 16 0.9
4 120 6.4
5 221 11.8
6 272 14.6
7 172 9.2
8 549 29.4
9 152 8.1
10 142 7.6
11 78 4.2
12 131 7
13 3 0.2
15 1 0.1
Total 1869 100

384
Table 3.2.20 City wise waste picker number of working hours in waste collection
CityNumber of hours per day in waste collection To-
tal1 2 3 4 5 6 7 8 9 10 11 12 13 15
Benga-
luru
Count 0 0 3 10 12 30 13 70 15 16 0 4 1 0 174
% within
City
.0 .0 1.7 5.7 6.9 17.2 7.5 40.2 8.6 9.2 .0 2.3 .6 .0 100.0
% within
working
hours
.0 .0 18.8 8.3 5.4 11.0 7.6 12.8 9.9 11.3 .0 3.1 33.3 .0 9.3
% of
Total
.0 .0 .2 .5 .6 1.6 .7 3.7 .8 .9 .0 .2 .1 .0 9.3
Bhopal Count 1 2 2 6 11 15 23 31 3 6 0 2 0 0 102
% within
City
1.0 2.0 2.0 5.9 10.8 14.7 22.5 30.4 2.9 5.9 .0 2.0 .0 .0 100.0
% within
working
hours
33.3 22.2 12.5 5.0 5.0 5.5 13.4 5.6 2.0 4.2 .0 1.5 .0 .0 5.5
% of
Total
.1 .1 .1 .3 .6 .8 1.2 1.7 .2 .3 .0 .1 .0 .0 5.5
Chamraj
nagar
Count 0 0 1 2 0 0 0 0 0 0 0 0 0 0 3
% within
City
.0 .0 33.3 66.7 .0 .0 .0 .0 .0 .0 .0 .0 .0 .0 100.0
% within
working
hours
.0 .0 6.2 1.7 .0 .0 .0 .0 .0 .0 .0 .0 .0 .0 .2
% of
Total
.0 .0 .1 .1 .0 .0 .0 .0 .0 .0 .0 .0 .0 .0 .2
Delhi Count 1 2 1 4 10 28 13 93 17 16 0 43 0 0 228
% within
City
.4 .9 .4 1.8 4.4 12.3 5.7 40.8 7.5 7.0 .0 18.9 .0 .0 100.0
% within
working
hours
33.3 22.2 6.2 3.3 4.5 10.3 7.6 16.9 11.2 11.3 .0 32.8 .0 .0 12.2
% of
Total
.1 .1 .1 .2 .5 1.5 .7 5.0 .9 .9 .0 2.3 .0 .0 12.2
Guntur Count 0 0 0 4 8 54 7 72 17 53 7 46 0 1 269
% within
City
.0 .0 .0 1.5 3.0 20.1 2.6 26.8 6.3 19.7 2.6 17.1 .0 .4 100.0
% within
working
hours
.0 .0 .0 3.3 3.6 19.9 4.1 13.1 11.2 37.3 9.0 35.1 .0 100. 14.4
% of
Total
.0 .0 .0 .2 .4 2.9 .4 3.9 .9 2.8 .4 2.5 .0 .1 14.4

385
Indore Count 0 0 0 2 24 14 9 50 7 3 0 5 0 0 114
%
within
City
.0 .0 .0 1.8 21.1 12.3 7.9 43.9 6.1 2.6 .0 4.4 .0 .0 100.0
%
within
working
hours
.0 .0 .0 1.7 10.9 5.1 5.2 9.1 4.6 2.1 .0 3.8 .0 .0 6.1
% of
Total
.0 .0 .0 .1 1.3 .7 .5 2.7 .4 .2 .0 .3 .0 .0 6.1
Mumbai Count 0 0 0 5 11 11 8 70 16 15 1 12 0 0 149
%
within
City
.0 .0 .0 3.4 7.4 7.4 5.4 47.0 10.7 10.1 .7 8.1 .0 .0 100.0
%
within
working
hours
.0 .0 .0 4.2 5.0 4.0 4.7 12.8 10.5 10.6 1.3 9.2 .0 .0 8.0
% of
Total
.0 .0 .0 .3 .6 .6 .4 3.7 .9 .8 .1 .6 .0 .0 8.0
Mysore Count 0 0 0 12 4 28 18 23 30 18 4 10 2 0 149
%
within
City
.0 .0 .0 8.1 2.7 18.8 12.1 15.4 20.1 12.1 2.7 6.7 1.3 .0 100.0
%
within
working
hours
.0 .0 .0 10.0 1.8 10.3 10.5 4.2 19.7 12.7 5.1 7.6 66.7 .0 8.0
% of
Total
.0 .0 .0 .6 .2 1.5 1.0 1.2 1.6 1.0 .2 .5 .1 .0 8.0
Nashik Count 0 0 0 48 39 18 1 0 0 0 0 0 0 0 106
%
within
City
.0 .0 .0 45.3 36.8 17.0 .9 .0 .0 .0 .0 .0 .0 .0 100.0
%
within
working
hours
.0 .0 .0 40.0 17.6 6.6 .6 .0 .0 .0 .0 .0 .0 .0 5.7
% of
Total
.0 .0 .0 2.6 2.1 1.0 .1 .0 .0 .0 .0 .0 .0 .0 5.7
Navi
Mumbai
Count 0 0 0 0 0 0 0 4 3 0 0 0 0 0 7
%
within
City
.0 .0 .0 .0 .0 .0 .0 57.1 42.9 .0 .0 .0 .0 .0 100.0
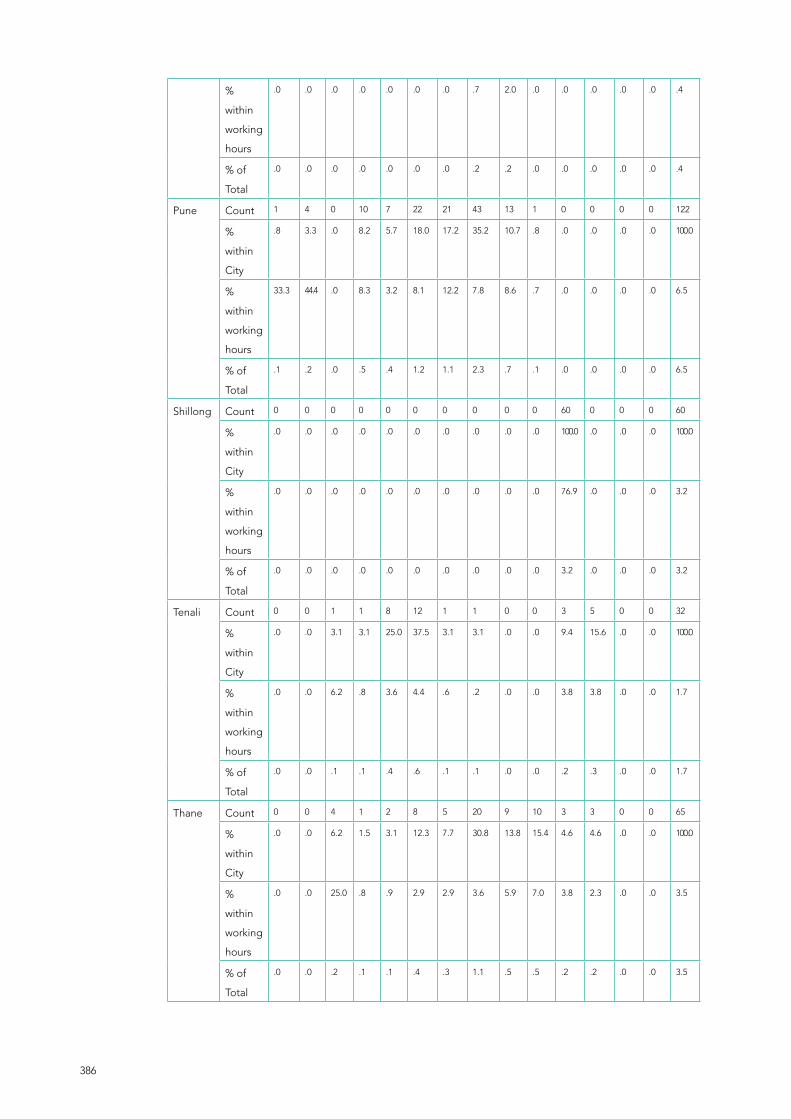
386
%
within
working
hours
.0 .0 .0 .0 .0 .0 .0 .7 2.0 .0 .0 .0 .0 .0 .4
% of
Total
.0 .0 .0 .0 .0 .0 .0 .2 .2 .0 .0 .0 .0 .0 .4
Pune Count 1 4 0 10 7 22 21 43 13 1 0 0 0 0 122
%
within
City
.8 3.3 .0 8.2 5.7 18.0 17.2 35.2 10.7 .8 .0 .0 .0 .0 100.0
%
within
working
hours
33.3 44.4 .0 8.3 3.2 8.1 12.2 7.8 8.6 .7 .0 .0 .0 .0 6.5
% of
Total
.1 .2 .0 .5 .4 1.2 1.1 2.3 .7 .1 .0 .0 .0 .0 6.5
Shillong Count 0 0 0 0 0 0 0 0 0 0 60 0 0 0 60
%
within
City
.0 .0 .0 .0 .0 .0 .0 .0 .0 .0 100.0 .0 .0 .0 100.0
%
within
working
hours
.0 .0 .0 .0 .0 .0 .0 .0 .0 .0 76.9 .0 .0 .0 3.2
% of
Total
.0 .0 .0 .0 .0 .0 .0 .0 .0 .0 3.2 .0 .0 .0 3.2
Tenali Count 0 0 1 1 8 12 1 1 0 0 3 5 0 0 32
%
within
City
.0 .0 3.1 3.1 25.0 37.5 3.1 3.1 .0 .0 9.4 15.6 .0 .0 100.0
%
within
working
hours
.0 .0 6.2 .8 3.6 4.4 .6 .2 .0 .0 3.8 3.8 .0 .0 1.7
% of
Total
.0 .0 .1 .1 .4 .6 .1 .1 .0 .0 .2 .3 .0 .0 1.7
Thane Count 0 0 4 1 2 8 5 20 9 10 3 3 0 0 65
%
within
City
.0 .0 6.2 1.5 3.1 12.3 7.7 30.8 13.8 15.4 4.6 4.6 .0 .0 100.0
%
within
working
hours
.0 .0 25.0 .8 .9 2.9 2.9 3.6 5.9 7.0 3.8 2.3 .0 .0 3.5
% of
Total
.0 .0 .2 .1 .1 .4 .3 1.1 .5 .5 .2 .2 .0 .0 3.5

387
Tumkur Count 0 0 0 4 21 0 0 6 0 0 0 0 0 0 31
%
within
City
.0 .0 .0 12.9 67.7 .0 .0 19.4 .0 .0 .0 .0 .0 .0 100.0
%
within
working
hours
.0 .0 .0 3.3 9.5 .0 .0 1.1 .0 .0 .0 .0 .0 .0 1.7
% of
Total
.0 .0 .0 .2 1.1 .0 .0 .3 .0 .0 .0 .0 .0 .0 1.7
Kalyan Count 0 0 0 0 0 0 0 48 10 1 0 0 0 0 59
%
within
City
.0 .0 .0 .0 .0 .0 .0 81.4 16.9 1.7 .0 .0 .0 .0 100.0
%
within
working
hours
.0 .0 .0 .0 .0 .0 .0 8.7 6.6 .7 .0 .0 .0 .0 3.2
% of
Total
.0 .0 .0 .0 .0 .0 .0 2.6 .5 .1 .0 .0 .0 .0 3.2
Bala
ghat
Count 0 0 1 5 42 1 1 2 0 1 0 0 0 0 53
%
within
City
.0 .0 1.9 9.4 79.2 1.9 1.9 3.8 .0 1.9 .0 .0 .0 .0 100.0
%
within
working
hours
.0 .0 6.2 4.2 19.0 .4 .6 .4 .0 .7 .0 .0 .0 .0 2.8
% of
Total
.0 .0 .1 .3 2.2 .1 .1 .1 .0 .1 .0 .0 .0 .0 2.8
Jaipur Count 0 0 0 0 2 18 49 16 11 0 0 0 0 0 96
%
within
City
.0 .0 .0 .0 2.1 18.8 51.0 16.7 11.5 .0 .0 .0 .0 .0 100.0
%
within
working
hours
.0 .0 .0 .0 .9 6.6 28.5 2.9 7.2 .0 .0 .0 .0 .0 5.1
% of
Total
.0 .0 .0 .0 .1 1.0 2.6 .9 .6 .0 .0 .0 .0 .0 5.1

388
Yawat
mal
Count 0 1 3 5 3 9 3 0 0 1 0 0 0 0 25
%
within
City
.0 4.0 12.0 20.0 12.0 36.0 12.0 .0 .0 4.0 .0 .0 .0 .0 100.0
%
within
working
hours
.0 11.1 18.8 4.2 1.4 3.3 1.7 .0 .0 .7 .0 .0 .0 .0 1.3
% of
Total
.0 .1 .2 .3 .2 .5 .2 .0 .0 .1 .0 .0 .0 .0 1.3
Wardha Count 0 0 0 1 17 4 0 0 1 1 0 1 0 0 25
%
within
City
.0 .0 .0 4.0 68.0 16.0 .0 .0 4.0 4.0 .0 4.0 .0 .0 100.0
%
within
working
hours
.0 .0 .0 .8 7.7 1.5 .0 .0 .7 .7 .0 .8 .0 .0 1.3
% of
Total
.0 .0 .0 .1 .9 .2 .0 .0 .1 .1 .0 .1 .0 .0 1.3
Total Count 3 9 16 120 221 272 172 549 152 142 78 131 3 1 1869
%
within
City
.2 .5 .9 6.4 11.8 14.6 9.2 29.4 8.1 7.6 4.2 7.0 .2 .1 100.0
%
within
working
hours
100.0 100.0 100.0 100.0 100.0 100.0 100.0 100.0 100.0 100.0 100.0 100.0 100.0 100.0 100.0
% of
Total
.2 .5 .9 6.4 11.8 14.6 9.2 29.4 8.1 7.6 4.2 7.0 .2 .1 100.0

389
Table 3.2.21 Type of waste picker and number of hours working in waste collection
Types of
waste
picker
Number of hours per day in waste collectionTo-
tal1 2 3 4 5 6 7 8 9 10 11 12 13 15
Count 1 1 8 104 185 198 116 278 103 109 47 82 3 1 1236
% within
type of
waste
picker
.1 .1 .6 8.4 15.0 16.0 9.4 22.5 8.3 8.8 3.8 6.6 .2 .1 100.0
% within
working
hours
33.3 11.1 50.0 86.7 83.7 72.8 67.4 50.6 67.8 76.8 60.3 62.6 100.0 100.0 66.1
% of
Total
.1 .1 .4 5.6 9.9 10.6 6.2 14.9 5.5 5.8 2.5 4.4 .2 .1 66.1
Free
Roaming
Migrant
Count 0 1 0 1 6 4 8 26 3 9 0 4 0 0 62
% within
type of
waste
picker
.0 1.6 .0 1.6 9.7 6.5 12.9 41.9 4.8 14.5 .0 6.5 .0 .0 100.0
% within
working
hours
.0 11.1 .0 .8 2.7 1.5 4.7 4.7 2.0 6.3 .0 3.1 .0 .0 3.3
% of
Total
.0 .1 .0 .1 .3 .2 .4 1.4 .2 .5 .0 .2 .0 .0 3.3
Itinerant
Buyer
Count 0 0 0 1 0 2 0 4 4 1 0 0 0 0 12
% within
type of
waste
picker
.0 .0 .0 8.3 .0 16.7 .0 33.3 33.3 8.3 .0 .0 .0 .0 100.0
% within
working
hours
.0 .0 .0 .8 .0 .7 .0 .7 2.6 .7 .0 .0 .0 .0 .6
% of
Total
.0 .0 .0 .1 .0 .1 .0 .2 .2 .1 .0 .0 .0 .0 .6
Waste
Sorter
Count 0 1 4 1 7 6 4 62 8 5 30 12 0 0 140
% within
type of
waste
picker
.0 .7 2.9 .7 5.0 4.3 2.9 44.3 5.7 3.6 21.4 8.6 .0 .0 100.0
% within
working
hours
.0 11.1 25.0 .8 3.2 2.2 2.3 11.3 5.3 3.5 38.5 9.2 .0 .0 7.5
% of
Total
.0 .1 .2 .1 .4 .3 .2 3.3 .4 .3 1.6 .6 .0 .0 7.5

390
Door-
to-Door
Collector
Count 2 5 3 13 20 57 44 136 29 15 0 29 0 0 353
% within
type of
waste
picker
.6 1.4 .8 3.7 5.7 16.1 12.5 38.5 8.2 4.2 .0 8.2 .0 .0 100.0
% within
working
hours
66.7 55.6 18.8 10.8 9.0 21.0 25.6 24.8 19.1 10.6 .0 22.1 .0 .0 18.9
% of
Total
.1 .3 .2 .7 1.1 3.0 2.4 7.3 1.6 .8 .0 1.6 .0 .0 18.9
Other
informal
worker
Count 0 1 0 0 2 2 0 6 0 0 1 0 0 0 12
% within
type of
waste
picker
.0 8.3 .0 .0 16.7 16.7 .0 50.0 .0 .0 8.3 .0 .0 .0 100.0
% within
working
hours
.0 11.1 .0 .0 .9 .7 .0 1.1 .0 .0 1.3 .0 .0 .0 .6
% of
Total
.0 .1 .0 .0 .1 .1 .0 .3 .0 .0 .1 .0 .0 .0 .6
Others Count 0 0 1 0 1 3 0 37 5 3 0 4 0 0 54
% within
type of
waste
picker
.0 .0 1.9 .0 1.9 5.6 .0 68.5 9.3 5.6 .0 7.4 .0 .0 100.0
% within
working
hours
.0 .0 6.2 .0 .5 1.1 .0 6.7 3.3 2.1 .0 3.1 .0 .0 2.9
% of
Total
.0 .0 .1 .0 .1 .2 .0 2.0 .3 .2 .0 .2 .0 .0 2.9
Total Count 3 9 16 120 221 272 172 549 152 142 78 131 3 1 1869
% within
type of
waste
picker
.2 .5 .9 6.4 11.8 14.6 9.2 29.4 8.1 7.6 4.2 7.0 .2 .1 100.0
% within
working
hours
100.0 100.0 100.0 100.0 100.0 100.0 100.0 100.0 100.0 100.0 100.0 100.0 100.0 100.0 100.0
% of
Total
.2 .5 .9 6.4 11.8 14.6 9.2 29.4 8.1 7.6 4.2 7.0 .2 .1 100.0
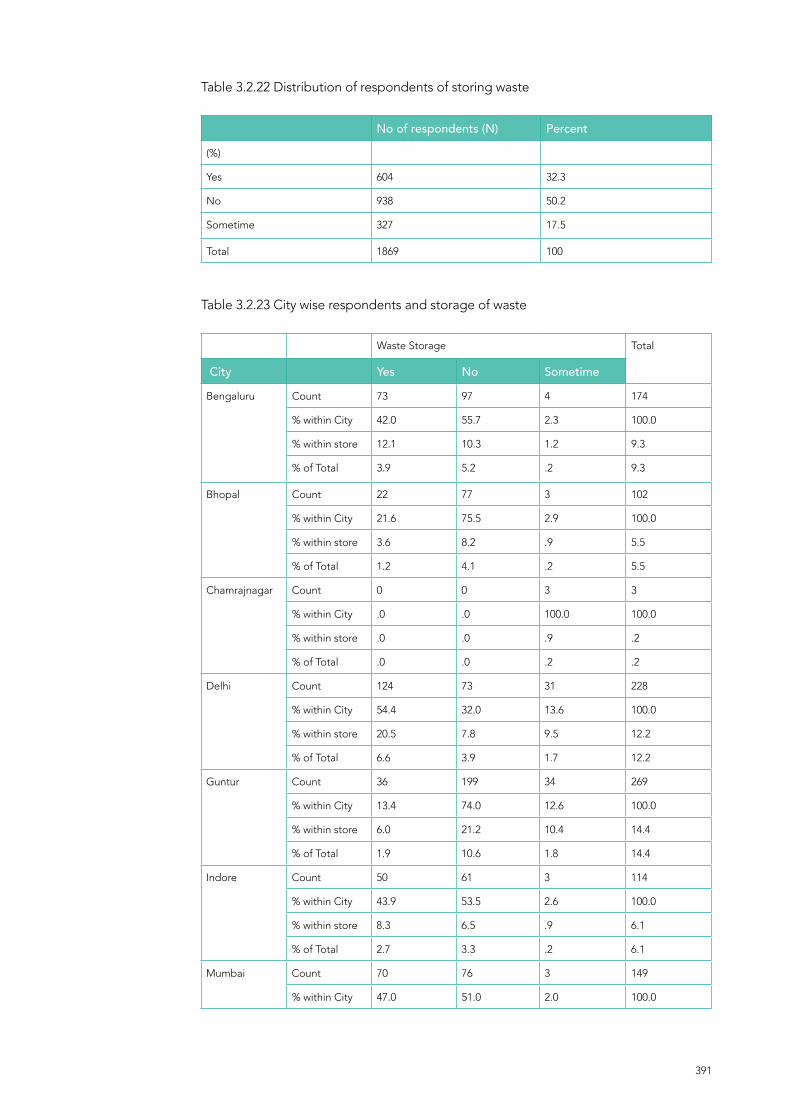
391
Table 3.2.22 Distribution of respondents of storing waste
Table 3.2.23 City wise respondents and storage of waste
No of respondents (N) Percent
(%)
Yes 604 32.3
No 938 50.2
Sometime 327 17.5
Total 1869 100
Waste Storage Total
City Yes No Sometime
Bengaluru Count 73 97 4 174
% within City 42.0 55.7 2.3 100.0
% within store 12.1 10.3 1.2 9.3
% of Total 3.9 5.2 .2 9.3
Bhopal Count 22 77 3 102
% within City 21.6 75.5 2.9 100.0
% within store 3.6 8.2 .9 5.5
% of Total 1.2 4.1 .2 5.5
Chamrajnagar Count 0 0 3 3
% within City .0 .0 100.0 100.0
% within store .0 .0 .9 .2
% of Total .0 .0 .2 .2
Delhi Count 124 73 31 228
% within City 54.4 32.0 13.6 100.0
% within store 20.5 7.8 9.5 12.2
% of Total 6.6 3.9 1.7 12.2
Guntur Count 36 199 34 269
% within City 13.4 74.0 12.6 100.0
% within store 6.0 21.2 10.4 14.4
% of Total 1.9 10.6 1.8 14.4
Indore Count 50 61 3 114
% within City 43.9 53.5 2.6 100.0
% within store 8.3 6.5 .9 6.1
% of Total 2.7 3.3 .2 6.1
Mumbai Count 70 76 3 149
% within City 47.0 51.0 2.0 100.0

392
% within store 11.6 8.1 .9 8.0
% of Total 3.7 4.1 .2 8.0
Mysore Count 21 43 85 149
% within City 14.1 28.9 57.0 100.0
% within store 3.5 4.6 26.0 8.0
% of Total 1.1 2.3 4.5 8.0
Nashik Count 1 23 82 106
% within City .9 21.7 77.4 100.0
% within store .2 2.5 25.1 5.7
% of Total .1 1.2 4.4 5.7
Navi Mumbai Count 0 7 0 7
% within City .0 100.0 .0 100.0
% within store .0 .7 .0 .4
% of Total .0 .4 .0 .4
Pune Count 52 20 50 122
% within City 42.6 16.4 41.0 100.0
% within store 8.6 2.1 15.3 6.5
% of Total 2.8 1.1 2.7 6.5
Shillong Count 28 32 0 60
% within City 46.7 53.3 .0 100.0
% within store 4.6 3.4 .0 3.2
% of Total 1.5 1.7 .0 3.2
Tenali Count 7 15 10 32
% within City 21.9 46.9 31.2 100.0
% within store 1.2 1.6 3.1 1.7
% of Total .4 .8 .5 1.7
Thane Count 4 61 0 65
% within City 6.2 93.8 .0 100.0
% within store .7 6.5 .0 3.5
% of Total .2 3.3 .0 3.5
Tumkur Count 5 26 0 31
% within City 16.1 83.9 .0 100.0
% within store .8 2.8 .0 1.7
% of Total .3 1.4 .0 1.7
Kalyan Count 55 0 4 59
% within City 93.2 .0 6.8 100.0
% within store 9.1 .0 1.2 3.2
% of Total 2.9 .0 .2 3.2
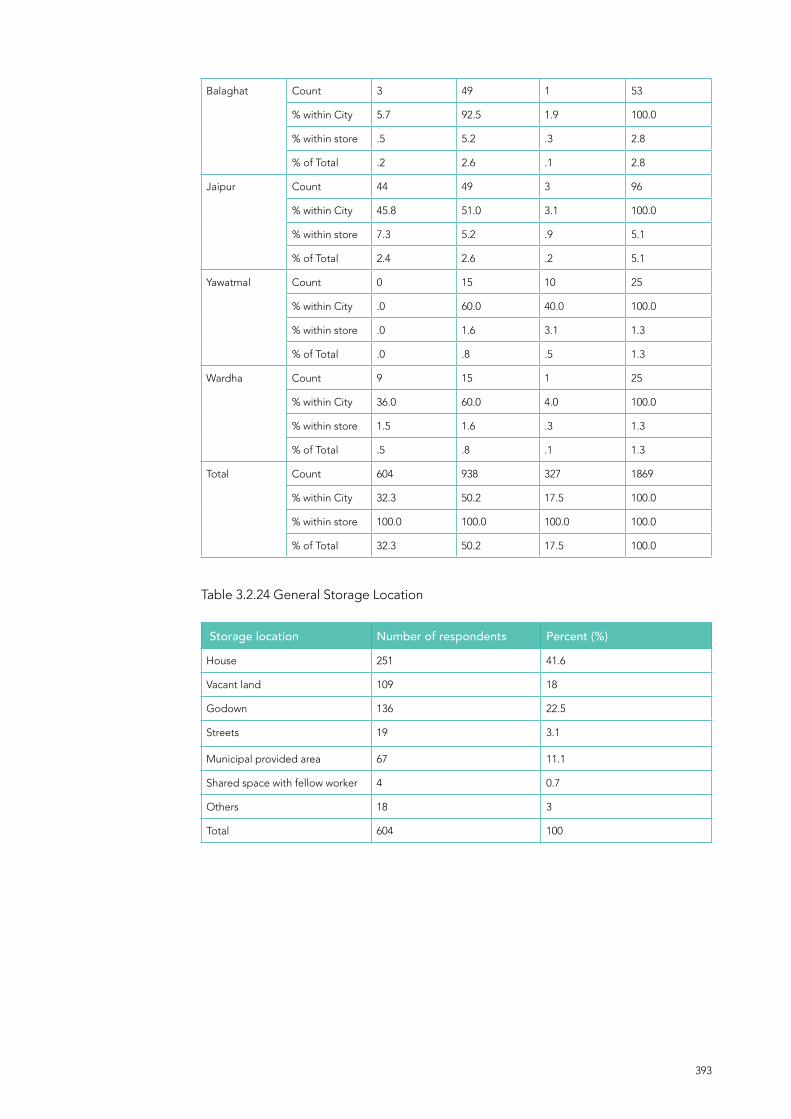
393
Balaghat Count 3 49 1 53
% within City 5.7 92.5 1.9 100.0
% within store .5 5.2 .3 2.8
% of Total .2 2.6 .1 2.8
Jaipur Count 44 49 3 96
% within City 45.8 51.0 3.1 100.0
% within store 7.3 5.2 .9 5.1
% of Total 2.4 2.6 .2 5.1
Yawatmal Count 0 15 10 25
% within City .0 60.0 40.0 100.0
% within store .0 1.6 3.1 1.3
% of Total .0 .8 .5 1.3
Wardha Count 9 15 1 25
% within City 36.0 60.0 4.0 100.0
% within store 1.5 1.6 .3 1.3
% of Total .5 .8 .1 1.3
Total Count 604 938 327 1869
% within City 32.3 50.2 17.5 100.0
% within store 100.0 100.0 100.0 100.0
% of Total 32.3 50.2 17.5 100.0
Table 3.2.24 General Storage Location
Storage location Number of respondents Percent (%)
House 251 41.6
Vacant land 109 18
Godown 136 22.5
Streets 19 3.1
Municipal provided area 67 11.1
Shared space with fellow worker 4 0.7
Others 18 3
Total 604 100

394
Table 3.2.25 City wise respondents and storage location.H= House, V= Vacant land, G= Gowdown, S= Streets, M= Municipal provided area, W= Shared space with fellow workers, O= Others, T= Total
Age Group in years
City H V G S M W O T
Benga-
luru
Count 16 0 52 0 2 1 2 73
% within
City
21.9 .0 71.2 .0 2.7 1.4 2.7 100.0
Bhopal Count 2 16 4 0 0 0 0 22
% within
City
9.1 72.7 18.2 .0 .0 .0 .0 100.0
Delhi Count 66 0 54 3 0 1 0 124
% within
City
53.2 .0 43.5 2.4 .0 .8 .0 100.0
Guntur Count 13 16 0 4 0 0 3 36
% within
City
36.1 44.4 .0 11.1 .0 .0 8.3 100.0
Indore Count 30 12 3 0 4 1 0 50
% within
City
60.0 24.0 6.0 .0 8.0 2.0 .0 100.0
Mumbai Count 54 11 0 2 2 0 1 70
% within
City
77.1 15.7 .0 2.9 2.9 .0 1.4 100.0
Mysore Count 17 1 3 0 0 0 0 21
% within
City
81.0 4.8 14.3 .0 .0 .0 .0 100.0
Nashik Count 1 0 0 0 0 0 0 1
% within
City
100 .0 .0 .0 .0 .0 .0 100.
Pune Count 3 5 4 8 20 0 12 52
% within
City
5.8 9.6 7.7 15.4 38.5 .0 23.1 100.0
Shillong Count 0 0 0 0 28 0 0 28
% within
City
.0 .0 .0 .0 100.0 .0 .0 100.0
Tenali Count 0 7 0 0 0 0 0 7
% within
City
.0 100.0 .0 .0 .0 .0 .0 100
Thane Count 0 0 2 0 2 0 0 4
% within
City
.0 .0 50.0 .0 50.0 .0 .0 100
Tumkur Count 0 0 4 1 0 0 0 5
% within
City
.0 .0 80.0 20.0 .0 .0 .0 100.0

395
Kalyan Count 7 39 0 0 8 1 0 55
% within
City
12.7 70.9 .0 .0 14.5 1.8 .0 100.0
Bhala
ghat
Count 0 0 2 1 0 0 0 3
% within
City
.0 .0 66.7 33.3 .0 .0 .0 100.0
Jaipur Count 34 1 8 0 1 0 0 44
% within
City
77.3 2.3 18.2 .0 2.3 .0 .0 100.0
Wardha Count 8 1 0 0 0 0 0 9
% within
City
88.9 11.1 .0 .0 .0 .0 .0 100.0
Total Count 251 109 136 19 67 4 18 604
% within
City
41.6 18.0 22.5 3.1 11.1 .7 3.0 100.0
Table 3.2.26 Type of waste picker and storage of waste
Type of waste
picker
Waste Storage Total
Yes No Sometime
Free Roaming
/Independent
local
Count 304 715 217 1236
% within type
of waste picker
24.6 57.8 17.6 100.0
% within
storage
50.3 76.2 66.4 66.1
% of Total 16.3 38.3 11.6 66.1
Free Roaming
Migrant
Count 33 20 9 62
% within type
of waste picker
53.2 32.3 14.5 100.0
% within
storage
5.5 2.1 2.8 3.3
% of Total 1.8 1.1 .5 3.3
Itinerant Buyer Count 7 2 3 12
% within type
of waste picker
58.3 16.7 25.0 100.0
% within
storage
1.2 .2 .9 .6
% of Total .4 .1 .2 .6

396
Waste Sorter Count 72 57 11 140
% within type
of waste picker
51.4 40.7 7.9 100.0
% within
storage
11.9 6.1 3.4 7.5
% of Total 3.9 3.0 .6 7.5
Door-to-Door
Collector
Count 165 108 80 353
% within type
of waste picker
46.7 30.6 22.7 100.0
% within
storage
27.3 11.5 24.5 18.9
% of Total 8.8 5.8 4.3 18.9
Other informal
worker
Count 1 8 3 12
% within type
of waste picker
8.3 66.7 25.0 100.0
% within
storage
.2 .9 .9 .6
% of Total .1 .4 .2 .6
Others Count 22 28 4 54
% within type
of waste picker
40.7 51.9 7.4 100.0
% within
storage
3.6 3.0 1.2 2.9
% of Total 1.2 1.5 .2 2.9
Total Count 604 938 327 1869
% within type
of waste picker
32.3 50.2 17.5 100.0
% within
storage
100.0 100.0 100.0 100.0
% of Total 32.3 50.2 17.5 100.0

397
Table 3.2.27
Reason for storing waste
City
Till enough quantity is collected
Till enough rate for the material
Upscale material
Others Total
Bengaluru Count 42 35 0 3 73
% within City 57.5 47.9 .0 4.1
Bhopal Count 19 5 0 0 22
% within City 86.4 22.7 .0 .0
Delhi Count 99 51 18 3 124
% within City 79.8 41.1 14.5 2.4
Guntur Count 30 5 0 5 36
% within City 83.3 13.9 .0 13.9
Indore Count 40 15 1 0 50
% within City 80.0 30.0 2.0 .0
Mumbai Count 30 61 2 2 70
% within City 42.9 87.1 2.9 2.9
Mysore Count 8 16 2 0 21
% within City 38.1 76.2 9.5 .0
Nashik Count 0 1 0 0 1
% within City .0 100.0 .0 .0
Pune Count 49 45 4 6 52
% within City 94.2 86.5 7.7 11.5
Shillong Count 28 25 0 0 28
% within City 100.0 89.3 .0 .0
Tenali Count 0 7 0 0 7
% within City .0 100.0 .0 .0
Thane Count 2 1 1 2 4
% within City 50.0 25.0 25.0 50.0
Tumkur Count 5 0 0 0 5
% within City 100.0 .0 .0 .0
Kalyan Count 55 0 2 0 55
% within City 100.0 .0 3.6 .0
Balaghat Count 3 0 0 0 3
% within City 100.0 .0 .0 .0
Jaipur Count 31 40 0 0 44
% within City 70.5 90.9 .0 .0

398
Wardha Count 8 8 0 0 9
% within City 88.9 88.9 .0 .0
Total Count 449 315 30 17 604
Table 3.2.28 Type of waste picker and reason for storing waste
Reason for storing waste
City
Till enough quantity is collected
Till enough rate for the material
Upscale material
Others Total
Free
Roaming /
Independent
local
Count 197 169 8 10 304
% within
type of waste
picker
64.8 55.6 2.6 3.3
Free
Roaming
Migrant
Count 16 18 0 1 33
% within
type of waste
picker
48.5 54.5 .0 3.0
Itinerant
Buyer
Count 5 4 2 0 7
% within
type of waste
picker
71.4 57.1 28.6 .0
Waste Sorter Count 67 36 3 1 72
% within
type of waste
picker
93.1 50.0 4.2 1.4
Door-
to-Door
Collector
Count 149 75 15 6 165
% within
type of waste
picker
90.3 45.5 9.1 3.6
Other
informal
worker
Count 1 0 0 0 1
% within
type of waste
picker
100.0 .0 .0 .0
Others Count 14 13 2 1 22
% within
type of waste
picker
63.6 59.1 9.1 4.5
Total Count 449 315 30 19 604

399
Table 3.2.29 Distribution of respondents sorting of waste
Table 3.2.30 General place of sorting
Sorting Frequency Percent
Yes 1576 84.3
No 293 15.7
Total 1869 100
Sorting Location Number of Responses Percent
Home 846 36.80
Front of shop 574 24.90
Roadside or streets 352 15.30
Municipal provided area 210 9.10
Godown / Shared space 236 10.30
Friends place 4 0.20
Others 79 3.40
Total 2301 100.00
Table 3.2.31 City wise respondents and place of sorting collected waste.H= Home, S= Front side of shops, R= Roadside or streets, M= Municipal provided ares, G= Gowdown/ shared space, F= Friends place, O= Others, T= Total
Place of sorting
H S R M G F O T
Bengaluru Count 43 57 0 2 76 0 12 190
% within
City
22.6 30.0 .0 1.1 40.0 .0 6.3
% within
place of
sorting
5.0 9.9 .0 .9 32.1 .0 12.9
% of
Total
1.8 2.4 .0 .1 3.3 .0 .5 8.1
Bhopal Count 35 48 23 23 2 0 0 131
% within
City
26.7 36.6 17.6 17.6 1.5 .0 .0
% within
place of
sorting
4.1 8.3 6.5 10.9 .8 .0 .0
% of
Total
1.5 2.1 1.0 1.0 .1 .0 .0 5.6
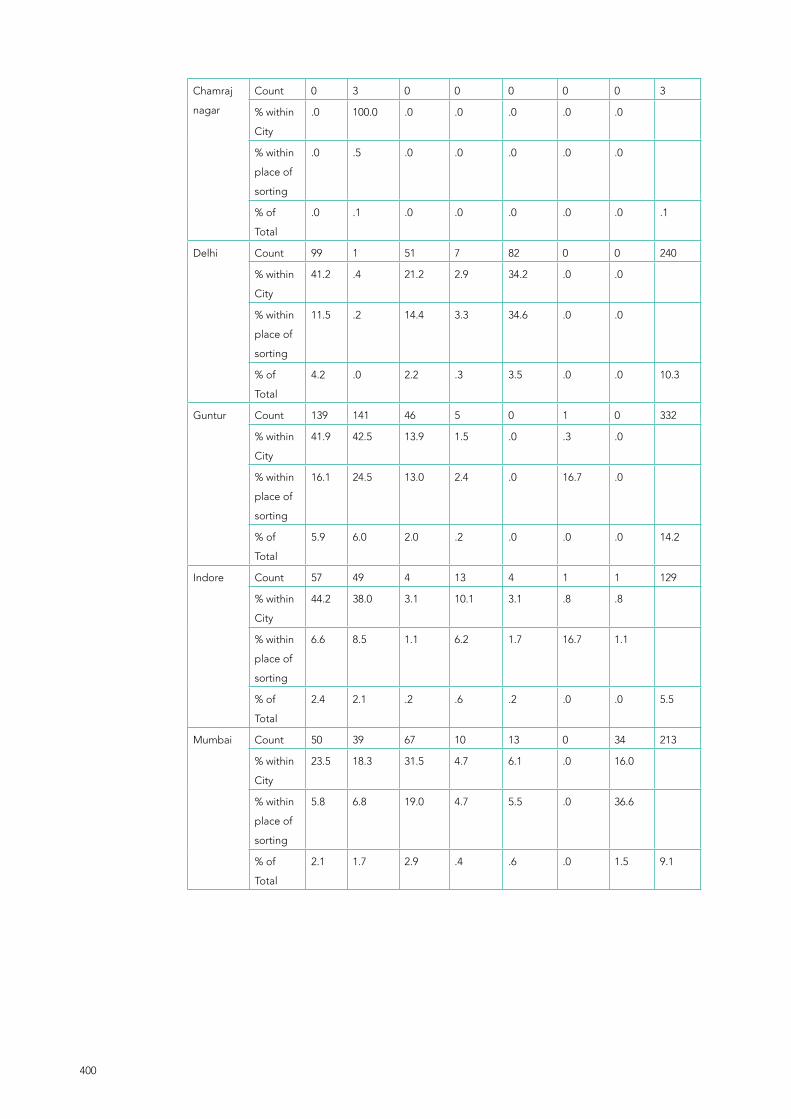
400
Chamraj
nagar
Count 0 3 0 0 0 0 0 3
% within
City
.0 100.0 .0 .0 .0 .0 .0
% within
place of
sorting
.0 .5 .0 .0 .0 .0 .0
% of
Total
.0 .1 .0 .0 .0 .0 .0 .1
Delhi Count 99 1 51 7 82 0 0 240
% within
City
41.2 .4 21.2 2.9 34.2 .0 .0
% within
place of
sorting
11.5 .2 14.4 3.3 34.6 .0 .0
% of
Total
4.2 .0 2.2 .3 3.5 .0 .0 10.3
Guntur Count 139 141 46 5 0 1 0 332
% within
City
41.9 42.5 13.9 1.5 .0 .3 .0
% within
place of
sorting
16.1 24.5 13.0 2.4 .0 16.7 .0
% of
Total
5.9 6.0 2.0 .2 .0 .0 .0 14.2
Indore Count 57 49 4 13 4 1 1 129
% within
City
44.2 38.0 3.1 10.1 3.1 .8 .8
% within
place of
sorting
6.6 8.5 1.1 6.2 1.7 16.7 1.1
% of
Total
2.4 2.1 .2 .6 .2 .0 .0 5.5
Mumbai Count 50 39 67 10 13 0 34 213
% within
City
23.5 18.3 31.5 4.7 6.1 .0 16.0
% within
place of
sorting
5.8 6.8 19.0 4.7 5.5 .0 36.6
% of
Total
2.1 1.7 2.9 .4 .6 .0 1.5 9.1
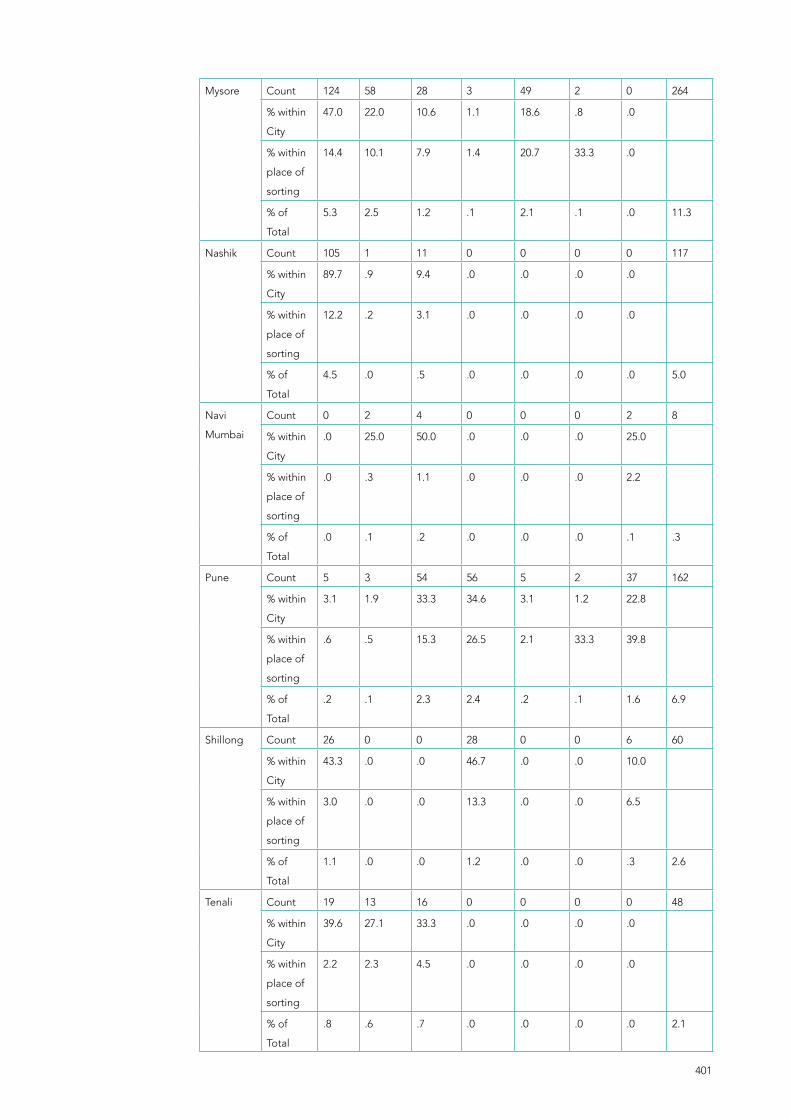
401
Mysore Count 124 58 28 3 49 2 0 264
% within
City
47.0 22.0 10.6 1.1 18.6 .8 .0
% within
place of
sorting
14.4 10.1 7.9 1.4 20.7 33.3 .0
% of
Total
5.3 2.5 1.2 .1 2.1 .1 .0 11.3
Nashik Count 105 1 11 0 0 0 0 117
% within
City
89.7 .9 9.4 .0 .0 .0 .0
% within
place of
sorting
12.2 .2 3.1 .0 .0 .0 .0
% of
Total
4.5 .0 .5 .0 .0 .0 .0 5.0
Navi
Mumbai
Count 0 2 4 0 0 0 2 8
% within
City
.0 25.0 50.0 .0 .0 .0 25.0
% within
place of
sorting
.0 .3 1.1 .0 .0 .0 2.2
% of
Total
.0 .1 .2 .0 .0 .0 .1 .3
Pune Count 5 3 54 56 5 2 37 162
% within
City
3.1 1.9 33.3 34.6 3.1 1.2 22.8
% within
place of
sorting
.6 .5 15.3 26.5 2.1 33.3 39.8
% of
Total
.2 .1 2.3 2.4 .2 .1 1.6 6.9
Shillong Count 26 0 0 28 0 0 6 60
% within
City
43.3 .0 .0 46.7 .0 .0 10.0
% within
place of
sorting
3.0 .0 .0 13.3 .0 .0 6.5
% of
Total
1.1 .0 .0 1.2 .0 .0 .3 2.6
Tenali Count 19 13 16 0 0 0 0 48
% within
City
39.6 27.1 33.3 .0 .0 .0 .0
% within
place of
sorting
2.2 2.3 4.5 .0 .0 .0 .0
% of
Total
.8 .6 .7 .0 .0 .0 .0 2.1

402
Thane Count 18 27 12 26 0 0 0 83
% within
City
21.7 32.5 14.5 31.3 .0 .0 .0
% within
place of
sorting
2.1 4.7 3.4 12.3 .0 .0 .0
% of
Total
.8 1.2 .5 1.1 .0 .0 .0 3.6
Tumkur Count 6 20 13 0 2 0 0 41
% within
City
14.6 48.8 31.7 .0 4.9 .0 .0
% within
place of
sorting
.7 3.5 3.7 .0 .8 .0 .0
% of
Total
.3 .9 .6 .0 .1 .0 .0 1.8
Kalyan Count 31 12 2 38 0 0 0 83
% within City
37.3 14.5 2.4 45.8 .0 .0 .0
% within place of sorting
3.6 2.1 .6 18.0 .0 .0 .0
% of Total
1.3 .5 .1 1.6 .0 .0 .0 3.6
Balaghat Count 0 51 2 0 0 0 0 53
% within City
.0 96.2 3.8 .0 .0 .0 .0
% within place of sorting
.0 8.9 .6 .0 .0 .0 .0
% of Total
.0 2.2 .1 .0 .0 .0 .0 2.3
Jaipur Count 83 16 0 0 4 0 0 103
% within City
80.6 15.5 .0 .0 3.9 .0 .0

403
% within place of sorting
9.6 2.8 .0 .0 1.7 .0 .0
% of Total
3.6 .7 .0 .0 .2 .0 .0 4.4
Yawatmal Count 5 23 18 0 0 0 0 46
% within
City
10.9 50.0 39.1 .0 .0 .0 .0
% within
place of
sorting
.6 4.0 5.1 .0 .0 .0 .0
% of
Total
.2 1.0 .8 .0 .0 .0 .0 2.0
Wardha Count 17 11 2 0 0 0 1 31
% within
City
54.8 35.5 6.5 .0 .0 .0 3.2
% within
place of
sorting
2.0 1.9 .6 .0 .0 .0 1.1
% of
Total
.7 .5 .1 .0 .0 .0 .0 1.3
Total Count 862 575 353 211 237 6 93 2337
% of
Total
36.9% 24.6% 15.1% 9.0% 10.1% .3% 4.0% 100.0%
Table 3.2.32 Type of waste picker and place of sorting.H= Home, S= Front side of shops, R= Roadside or streets, M= Municipal provided ares, G= Gowdown/ shared space, F= Friends place, O= Others, T= Total
Place of sorting
Type of waste picker
H S R M G F O T
Free
Roaming/
Indepen-
dent
Local
Count 670 508 234 59 69 2 27 1569
% within
type of
waste
picker
42.7 32.4 14.9 3.8 4.4 .1 1.7
% within
place of
sorting
77.7 88.3 66.3 28.0 29.1 33.3 29.0
% of
Total
28.7 21.7 10.0 2.5 3.0 .1 1.2 67.1

404
Free
Roaming
Migrant
Count 23 18 4 3 30 0 0 78
% within
type of
waste
picker
29.5 23.1 5.1 3.8 38.5 .0 .0
% within
place of
sorting
2.7 3.1 1.1 1.4 12.7 .0 .0
% of
Total
1.0 .8 .2 .1 1.3 .0 .0 3.3
Itinerant
Buyer
Count 7 5 2 1 6 0 0 21
% within
type of
waste
picker
33.3 23.8 9.5 4.8 28.6 .0 .0
% within
place of
sorting
.8 .9 .6 .5 2.5 .0 .0
% of
Total
.3 .2 .1 .0 .3 .0 .0 .9
Waste
Sorter
Count 40 23 11 59 25 1 2 161
% within
type of
waste
picker
24.8 14.3 6.8 36.6 15.5 .6 1.2
% within
place of
sorting
4.6 4.0 3.1 28.0 10.5 16.7 2.2
% of
Total
1.7 1.0 .5 2.5 1.1 .0 .1 6.9
Door-
to-Door
Collector
Count 96 16 99 82 72 3 42 410
% within
type of
waste
picker
23.4 3.9 24.1 20.0 17.6 .7 10.2
% within
place of
sorting
11.1 2.8 28.0 38.9 30.4 50.0 45.2
% of
Total
4.1 .7 4.2 3.5 3.1 .1 1.8 17.5
Other
informal
worker
Count 5 2 1 2 2 0 0 12
% within
type of
waste
picker
41.7 16.7 8.3 16.7 16.7 .0 .0

405
% within
place of
sorting
.6 .3 .3 .9 .8 .0 .0
% of
Total
.2 .1 .0 .1 .1 .0 .0 .5
Others Count 21 3 2 5 33 0 22 86
% within
type of
waste
picker
24.4 3.5 2.3 5.8 38.4 .0 25.6
% within
place of
sorting
2.4 .5 .6 2.4 13.9 .0 23.7
% of
Total
.9 .1 .1 .2 1.4 .0 .9 3.7
Total Count 862 575 353 211 237 6 93 2337
% of
Total
36.9 24.6 15.1 9.0 10.1 .3 4.0 100.0
Table 3.2.33 General Selling waste
Selling location No of responses Percent
Local Scrap dealer 1624 78.30
Wholesale dealer 230 11.10
Recyclers 61 2.90
DWCC /MRF 68 3.30
Others 92 4.40
Total 2075 100.00
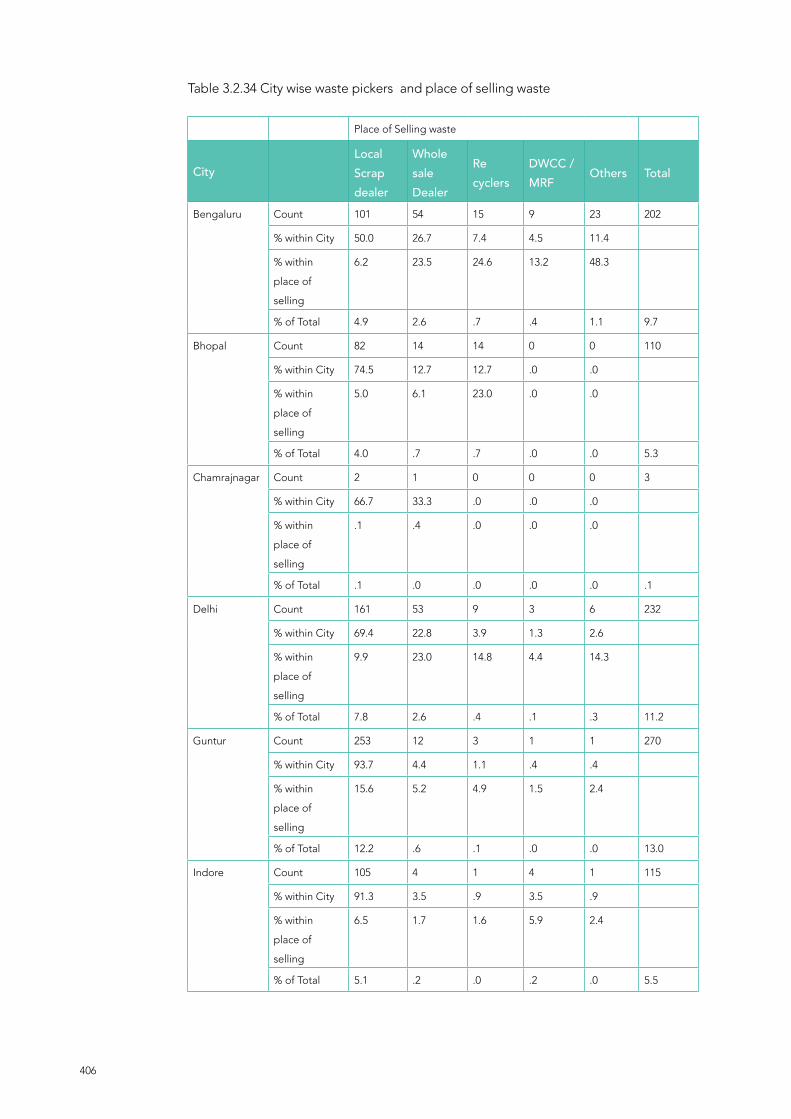
406
Table 3.2.34 City wise waste pickers and place of selling waste
Place of Selling waste
City Local Scrap dealer
WholesaleDealer
Recyclers
DWCC /MRF
Others Total
Bengaluru Count 101 54 15 9 23 202
% within City 50.0 26.7 7.4 4.5 11.4
% within
place of
selling
6.2 23.5 24.6 13.2 48.3
% of Total 4.9 2.6 .7 .4 1.1 9.7
Bhopal Count 82 14 14 0 0 110
% within City 74.5 12.7 12.7 .0 .0
% within
place of
selling
5.0 6.1 23.0 .0 .0
% of Total 4.0 .7 .7 .0 .0 5.3
Chamrajnagar Count 2 1 0 0 0 3
% within City 66.7 33.3 .0 .0 .0
% within
place of
selling
.1 .4 .0 .0 .0
% of Total .1 .0 .0 .0 .0 .1
Delhi Count 161 53 9 3 6 232
% within City 69.4 22.8 3.9 1.3 2.6
% within
place of
selling
9.9 23.0 14.8 4.4 14.3
% of Total 7.8 2.6 .4 .1 .3 11.2
Guntur Count 253 12 3 1 1 270
% within City 93.7 4.4 1.1 .4 .4
% within
place of
selling
15.6 5.2 4.9 1.5 2.4
% of Total 12.2 .6 .1 .0 .0 13.0
Indore Count 105 4 1 4 1 115
% within City 91.3 3.5 .9 3.5 .9
% within
place of
selling
6.5 1.7 1.6 5.9 2.4
% of Total 5.1 .2 .0 .2 .0 5.5

407
Mumbai Count 120 3 4 0 26 153
% within City 78.4 2.0 2.6 .0 17.0
% within
place of
selling
7.4 1.3 6.6 .0 61.9
% of Total 5.8 .1 .2 .0 1.3 7.4
Mysore Count 134 66 6 47 33 286
% within City 46.9 23.1 2.1 16.4 11.5
% within
place of
selling
8.3 28.7 9.8 69.1 66.0
% of Total 6.5 3.2 .3 2.3 1.6 13.8
Nashik Count 104 5 1 1 0 111
% within City 93.7 4.5 .9 .9 .0
% within
place of
selling
6.4 2.2 1.6 1.5 .0
% of Total 5.0 .2 .0 .0 .0 5.3
Navi Mumbai Count 7 4 0 0 0 11
% within City 63.6 36.4 .0 .0 .0
% within
place of
selling
.4 1.7 .0 .0 .0
% of Total .3 .2 .0 .0 .0 .5
Pune Count 113 0 8 0 1 122
% within City 92.6 .0 6.6 .0 .8
% within
place of
selling
7.0 .0 13.1 .0 2.4
% of Total 5.4 .0 .4 .0 .0 5.9
Shillong Count 60 0 0 0 0 60
% within City 100.0 .0 .0 .0 .0
% within
place of
selling
3.7 .0 .0 .0 .0
% of Total 2.9 .0 .0 .0 .0 2.9
Tenali Count 29 0 0 2 1 32
% within City 90.6 .0 .0 6.2 3.1
% within
place of
selling
1.8 .0 .0 2.9 2.4
% of Total 1.4 .0 .0 .1 .0 1.5

408
Thane Count 65 0 0 0 0 65
% within City 100.0 .0 .0 .0 .0
% within
place of
selling
4.0 .0 .0 .0 .0
% of Total 3.1 .0 .0 .0 .0 3.1
Tumkur Count 31 0 0 0 0 31
% within City 100.0 .0 .0 .0 .0
% within
place of
selling
1.9 .0 .0 .0 .0
% of Total 1.5 .0 .0 .0 .0 1.5
Kalyan Count 59 0 0 0 0 59
% within City 100.0 .0 .0 .0 .0
% within
place of
selling
3.6 .0 .0 .0 .0
% of Total 2.8 .0 .0 .0 .0 2.8
Balaghat Count 53 0 0 0 0 53
% within City 100.0 .0 .0 .0 .0
% within
place of
selling
3.3 .0 .0 .0 .0
% of Total 2.6 .0 .0 .0 .0 2.6
Jaipur Count 96 0 0 0 0 96
% within City 100.0 .0 .0 .0 .0
% within
place of
selling
5.9 .0 .0 .0 .0
% of Total 4.6 .0 .0 .0 .0 4.6
Yawatmal Count 24 14 0 1 0 39
% within City 61.5 35.9 .0 2.6 .0
% within
place of
selling
1.5 6.1 .0 1.5 .0
% of Total 1.2 .7 .0 .0 .0 1.9
Wardha Count 25 0 0 0 0 25
% within City 100.0 .0 .0 .0 .0
% within
place of
selling
1.5 .0 .0 .0 .0
% of Total 1.2 .0 .0 .0 .0 1.2
Total Count 1624 230 61 68 92 2075
% of Total 78.3 11.1 2.9 3.3 4.4 100.0

409
Table 3.2.35 Type of waste picker and place of selling waste
Place of Selling waste
Typeof waste picker
Local Scrap dealer
WholesaleDealer
Recyclers
DWCC /MRF
Others Total
Free Roaming
/Independent
local
Count 1181 110 6 42 48 1236
% within
type of waste
picker
95.6 8.9 .5 3.4 3.9
Free Roaming
Migrant
Count 50 26 1 5 6 62
% within
type of waste
picker
80.6 41.9 1.6 8.1 9.7
Itinerant Buyer Count 10 6 2 4 1 12
% within
type of waste
picker
83.3 50.0 16.7 33.3 8.3
Waste Sorter Count 106 20 9 9 4 140
% within
type of waste
picker
75.7 14.3 6.4 6.4 2.8
Door-to-Door
Collector
Count 256 54 38 5 9 353
% within
type of waste
picker
72.5 15.3 10.8 1.4 2.5
Other informal
worker
Count 7 3 0 2 0 12
% within
type of waste
picker
58.3 25.0 .0 16.7 .0
Others Count 14 11 5 1 24 54
% within
type of waste
picker
25.9 20.4 9.3 1.9 44.4
Count 1624 230 61 68 50 42

410
Table 3.2.36 Type of employment/employer
Employer Number of Respondents (N) Percent (%)
Self Employed 1637 87.6
Scrap dealer 106 5.7
Waste Picker Organization 38 2.0
Municipality 64 3.4
Others 24 1.3
Total 1869 100.0
Table 3.2.37 City wise waste pickers and type of employment
Employer
SelfScrap dealer
Waste pickerOrg
Munici-pality
Others Total
Bengaluru Count 141 19 5 3 6 174
% within City 81.0 10.9 2.9 1.7 3.4 100.0
% within
employer
8.6 17.9 13.2 4.7 25.0 9.3
% of Total 7.5 1.0 .3 .2 .3 9.3
Bhopal Count 56 7 3 28 8 102
% within City 54.9 6.9 2.9 27.5 7.8 100.0
% within
employer
3.4 6.6 7.9 43.8 33.3 5.5
% of Total 3.0 .4 .2 1.5 .4 5.5
Chamrajnagar Count 2 1 0 0 0 3
% within City 66.7 33.3 .0 .0 .0 100.0
% within
employer
.1 .9 .0 .0 .0 .2
% of Total .1 .1 .0 .0 .0 .2
Delhi Count 176 48 0 0 4 228
% within City 77.2 21.1 .0 .0 1.8 100.0
% within
employer
10.8 45.3 .0 .0 16.7 12.2
% of Total 9.4 2.6 .0 .0 .2 12.2
Guntur Count 218 11 10 28 2 269
% within City 81.0 4.1 3.7 10.4 .7 100.0
% within
employer
13.3 10.4 26.3 43.8 8.3 14.4
% of Total 11.7 .6 .5 1.5 .1 14.4

411
Indore Count 108 2 0 4 0 114
% within City 94.7 1.8 .0 3.5 .0 100.0
% within
employer
6.6 1.9 .0 6.2 .0 6.1
% of Total 5.8 .1 .0 .2 .0 6.1
Mumbai Count 129 1 17 0 2 149
% within City 86.6 .7 11.4 .0 1.3 100.0
% within
employer
7.9 .9 44.7 .0 8.3 8.0
% of Total 6.9 .1 .9 .0 .1 8.0
Mysore Count 145 4 0 0 0 149
% within City 97.3 2.7 .0 .0 .0 100.0
% within
employer
8.9 3.8 .0 .0 .0 8.0
% of Total 7.8 .2 .0 .0 .0 8.0
Nashik Count 106 0 0 0 0 106
% within City 100.0 .0 .0 .0 .0 100.0
% within
employer
6.5 .0 .0 .0 .0 5.7
% of Total 5.7 .0 .0 .0 .0 5.7
Navi Mumbai Count 7 0 0 0 0 7
% within City 100.0 .0 .0 .0 .0 100.0
% within
employer
.4 .0 .0 .0 .0 .4
% of Total .4 .0 .0 .0 .0 .4
Pune Count 121 0 1 0 0 122
% within City 99.2 .0 .8 .0 .0 100.0
% within
employer
7.4 .0 2.6 .0 .0 6.5
% of Total 6.5 .0 .1 .0 .0 6.5
Shillong Count 60 0 0 0 0 60
% within City 100.0 .0 .0 .0 .0 100.0
% within
employer
3.7 .0 .0 .0 .0 3.2
% of Total 3.2 .0 .0 .0 .0 3.2
Tenali Count 19 11 0 0 2 32
% within City 59.4 34.4 .0 .0 6.2 100.0
% within
employer
1.2 10.4 .0 .0 8.3 1.7
% of Total 1.0 .6 .0 .0 .1 1.7

412
Thane Count 64 0 1 0 0 65
% within City 98.5 .0 1.5 .0 .0 100.0
% within
employer
3.9 .0 2.6 .0 .0 3.5
% of Total 3.4 .0 .1 .0 .0 3.5
Tumkur Count 28 1 1 1 0 31
% within City 90.3 3.2 3.2 3.2 .0 100.0
% within
employer
1.7 .9 2.6 1.6 .0 1.7
% of Total 1.5 .1 .1 .1 .0 1.7
Kalyan Count 59 0 0 0 0 59
% within City 100.0 .0 .0 .0 .0 100.0
% within
employer
3.6 .0 .0 .0 .0 3.2
% of Total 3.2 .0 .0 .0 .0 3.2
Balaghat Count 52 1 0 0 0 53
% within City 98.1 1.9 .0 .0 .0 100.0
% within
employer
3.2 .9 .0 .0 .0 2.8
% of Total 2.8 .1 .0 .0 .0 2.8
Jaipur Count 96 0 0 0 0 96
% within City 100.0 .0 .0 .0 .0 100.0
% within
employer
5.9 .0 .0 .0 .0 5.1
% of Total 5.1 .0 .0 .0 .0 5.1
Yawatmal Count 25 0 0 0 0 25
% within City 100.0 .0 .0 .0 .0 100.0
% within
employer
1.5 .0 .0 .0 .0 1.3
% of Total 1.3 .0 .0 .0 .0 1.3
Wardha Count 25 0 0 0 0 25
% within City 100.0 .0 .0 .0 .0 100.0
% within
employer
1.5 .0 .0 .0 .0 1.3
% of Total 1.3 .0 .0 .0 .0 1.3
Total Count 1637 106 38 64 24 1869
% within City 87.6 5.7 2.0 3.4 1.3 100.0
% within
employer
100.0 100.0 100.0 100.0 100.0 100.0
% of Total 87.6 5.7 2.0 3.4 1.3 100.0
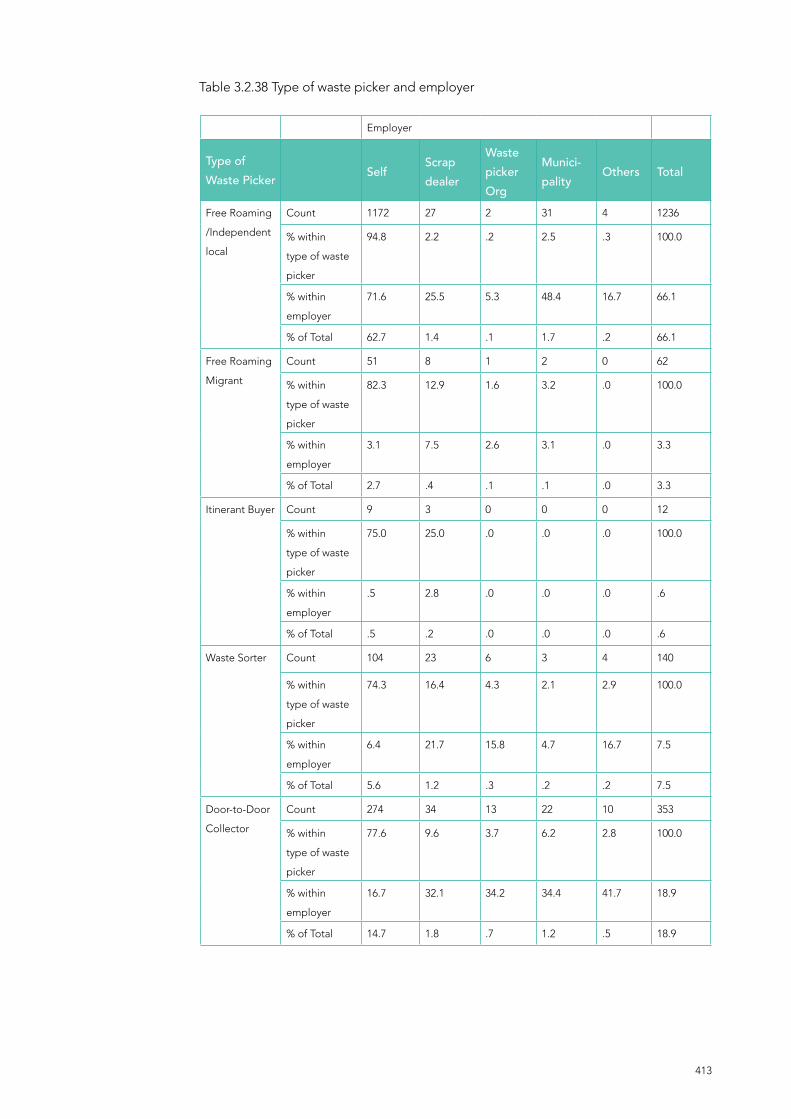
413
Table 3.2.38 Type of waste picker and employer
Employer
Type of Waste Picker Self
Scrap dealer
Waste pickerOrg
Munici-pality
Others Total
Free Roaming
/Independent
local
Count 1172 27 2 31 4 1236
% within
type of waste
picker
94.8 2.2 .2 2.5 .3 100.0
% within
employer
71.6 25.5 5.3 48.4 16.7 66.1
% of Total 62.7 1.4 .1 1.7 .2 66.1
Free Roaming
Migrant
Count 51 8 1 2 0 62
% within
type of waste
picker
82.3 12.9 1.6 3.2 .0 100.0
% within
employer
3.1 7.5 2.6 3.1 .0 3.3
% of Total 2.7 .4 .1 .1 .0 3.3
Itinerant Buyer Count 9 3 0 0 0 12
% within
type of waste
picker
75.0 25.0 .0 .0 .0 100.0
% within
employer
.5 2.8 .0 .0 .0 .6
% of Total .5 .2 .0 .0 .0 .6
Waste Sorter Count 104 23 6 3 4 140
% within
type of waste
picker
74.3 16.4 4.3 2.1 2.9 100.0
% within
employer
6.4 21.7 15.8 4.7 16.7 7.5
% of Total 5.6 1.2 .3 .2 .2 7.5
Door-to-Door
Collector
Count 274 34 13 22 10 353
% within
type of waste
picker
77.6 9.6 3.7 6.2 2.8 100.0
% within
employer
16.7 32.1 34.2 34.4 41.7 18.9
% of Total 14.7 1.8 .7 1.2 .5 18.9

414
Other informal
worker
Count 6 2 0 3 1 12
% within
type of waste
picker
50.0 16.7 .0 25.0 8.3 100.0
% within
employer
.4 1.9 .0 4.7 4.2 .6
% of Total .3 .1 .0 .2 .1 .6
Others Count 21 9 16 3 5 54
% within
type of waste
picker
38.9 16.7 29.6 5.6 9.3 100.0
% within
employer
1.3 8.5 42.1 4.7 20.8 2.9
% of Total 1.1 .5 .9 .2 .3 2.9
Total Count 1637 106 38 64 24 1869
% within
type of waste
picker
87.6 5.7 2.0 3.4 1.3 100.0
% within
employer604
100.0 100.0 100.0 100.0 100.0 100.0
% of Total 87.6 5.7 2.0 3.4 1.3 100.0
Table 3.2.39 Waste picker associated with any waste picker organisation
Association with Waste picker organization Frequency Percent
Yes 934 50.0
No 935 50.0
Total 1869 100.0
Table 3.2.40 City wise waste pickers associated with any waste picker organization
Association with waste picker
organisation
Yes No Total
Bengaluru Count 58 116 174
% within City 33.3 66.7 100.0
% within waste
picker organisation
6.2 12.4 9.3
% of Total 3.1 6.2 9.3

415
Bhopal Count 16 86 102
% within City 15.7 84.3 100.0
% within waste
picker organisation
1.7 9.2 5.5
% of Total .9 4.6 5.5
Chamrajnagar Count 3 0 3
% within City 100.0 .0 100.0
% within waste
picker organisation
.3 .0 .2
% of Total .2 .0 .2
Delhi Count 166 62 228
% within City 72.8 27.2 100.0
% within waste
picker organisation
17.8 6.6 12.2
% of Total 8.9 3.3 12.2
Guntur Count 56 213 269
% within City 20.8 79.2 100.0
% within waste
picker organisation
6.0 22.8 14.4
% of Total 3.0 11.4 14.4
Indore Count 52 62 114
% within City 45.6 54.4 100.0
% within waste
picker organisation
5.6 6.6 6.1
% of Total 2.8 3.3 6.1
Mumbai Count 140 9 149
% within City 94.0 6.0 100.0
% within waste
picker organisation
15.0 1.0 8.0
% of Total 7.5 .5 8.0
Mysore Count 71 78 149
% within City 47.7 52.3 100.0
% within waste
picker organisation
7.6 8.3 8.0
% of Total 3.8 4.2 8.0
Nashik Count 106 0 106
% within City 100.0 .0 100.0
% within waste
picker organisation
11.3 .0 5.7
% of Total 5.7 .0 5.7

416
Navi Mumbai Count 5 2 7
% within City 71.4 28.6 100.0
% within waste
picker organisation
.5 .2 .4
% of Total .3 .1 .4
Pune Count 122 0 122
% within City 100.0 .0 100.0
% within waste
picker organisation
13.1 .0 6.5
% of Total 6.5 .0 6.5
Shillong Count 0 60 60
% within City .0 100.0 100.0
% within waste
picker organisation
.0 6.4 3.2
% of Total .0 3.2 3.2
Tenali Count 13 19 32
% within City 40.6 59.4 100.0
% within waste
picker organisation
1.4 2.0 1.7
% of Total .7 1.0 1.7
Thane Count 55 10 65
% within City 84.6 15.4 100.0
% within waste
picker organisation
5.9 1.1 3.5
% of Total 2.9 .5 3.5
Tumkur Count 30 1 31
% within City 96.8 3.2 100.0
% within waste
picker organisation
3.2 .1 1.7
% of Total 1.6 .1 1.7
Kalyan Count 30 29 59
% within City 50.8 49.2 100.0
% within waste
picker organisation
3.2 3.1 3.2
% of Total 1.6 1.6 3.2
Balaghat Count 0 53 53
% within City .0 100.0 100.0
% within waste
picker organisation
.0 5.7 2.8
% of Total .0 2.8 2.8

417
Jaipur Count 0 96 96
% within City .0 100.0 100.0
% within waste
picker organisation
.0 10.3 5.1
% of Total .0 5.1 5.1
Yawatmal Count 0 25 25
% within City .0 100.0 100.0
% within waste
picker organisation
.0 2.7 1.3
% of Total .0 1.3 1.3
Wardha Count 11 14 25
% within City 44.0 56.0 100.0
% within waste
picker organisation
1.2 1.5 1.3
% of Total .6 .7 1.3
Total Count 934 935 1869
% within City 50.0 50.0 100.0
% within NGO403 100.0 100.0 100.0
% of Total 50.0 50.0 100.0
Table 3.2.41 Type of waste picker and association with waste picker organization
Typeof Wste Picker
Association with waste picker
organisation
Yes No Total
Free Roaming /
Independent local
Count 552 684 1236
% within type of
waste picker
44.7 55.3 100.0
% within waste
picker organisation
59.1 73.2 66.1
% of Total 29.5 36.6 66.1
Free Roaming
Migrant
Count 27 35 62
% within type of
waste picker
43.5 56.5 100.0
% within waste
picker organisation
2.9 3.7 3.3
% of Total 1.4 1.9 3.3
Itinerant Buyer Count 6 6 12
% within type of
waste picker
50.0 50.0 100.0
% within waste
picker organisation
.6 .6 .6
% of Total .3 .3 .6

418
Waste Sorter Count 40 100 140
% within type of
waste picker
28.6 71.4 100.0
% within waste
picker organisation
4.3 10.7 7.5
% of Total 2.1 5.4 7.5
Door-to-Door
Collector
Count 266 87 353
% within type of
waste picker
75.4 24.6 100.0
% within waste
picker organisation
28.5 9.3 18.9
% of Total 14.2 4.7 18.9
Other informal
worker
Count 4 8 12
% within type of
waste picker
33.3 66.7 100.0
% within waste
picker organisation
.4 .9 .6
% of Total .2 .4 .6
Others Count 39 15 54
% within type of
waste picker
72.2 27.8 100.0
% within waste
picker organisation
4.2 1.6 2.9
% of Total 2.1 .8 2.9
Total Count 934 935 1869
% within type of
waste picker
50.0 50.0 100.0
% within waste
picker organisation
100.0 100.0 100.0
% of Total 50.0 50.0 100.0
Table 3.2.42 Distribution of respondents associated with municipality
Associated with Municipality Frequency Percent
Yes 502 26.9
No 1367 73.1
Total 1869 100
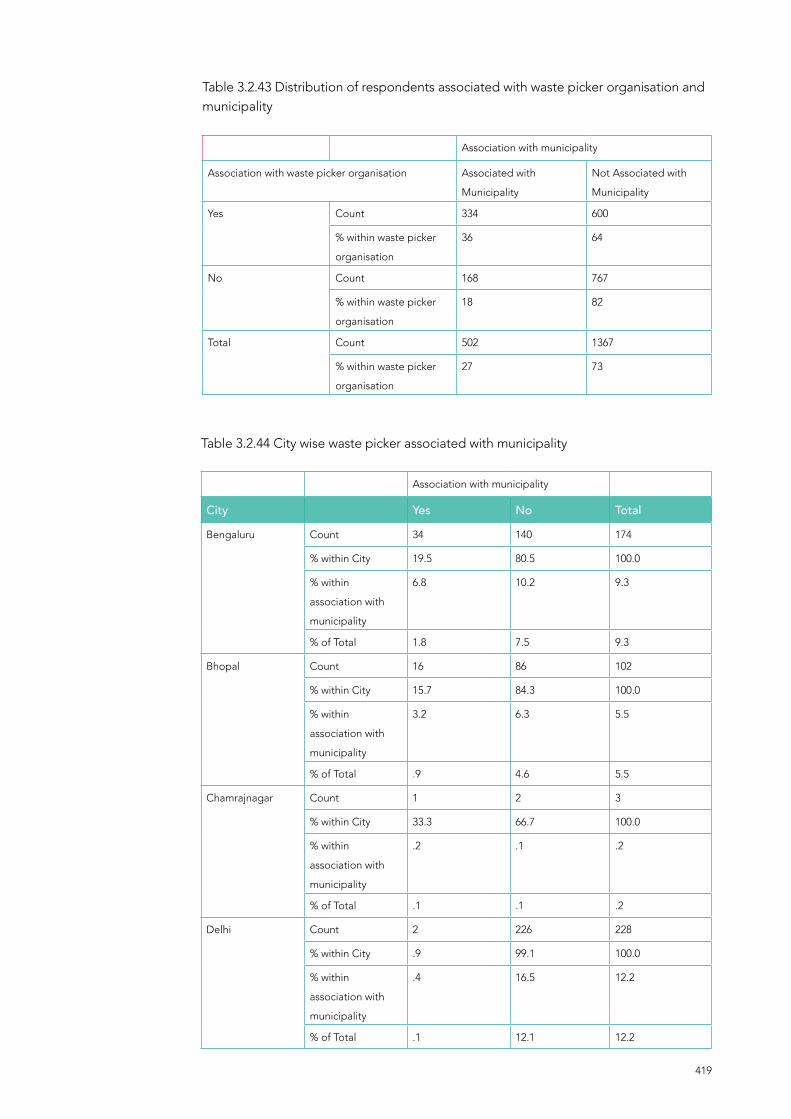
419
Table 3.2.44 City wise waste picker associated with municipality
Association with municipality
City Yes No Total
Bengaluru Count 34 140 174
% within City 19.5 80.5 100.0
% within
association with
municipality
6.8 10.2 9.3
% of Total 1.8 7.5 9.3
Bhopal Count 16 86 102
% within City 15.7 84.3 100.0
% within
association with
municipality
3.2 6.3 5.5
% of Total .9 4.6 5.5
Chamrajnagar Count 1 2 3
% within City 33.3 66.7 100.0
% within
association with
municipality
.2 .1 .2
% of Total .1 .1 .2
Delhi Count 2 226 228
% within City .9 99.1 100.0
% within
association with
municipality
.4 16.5 12.2
% of Total .1 12.1 12.2
Table 3.2.43 Distribution of respondents associated with waste picker organisation and municipality
Association with municipality
Association with waste picker organisation Associated with
Municipality
Not Associated with
Municipality
Yes Count 334 600
% within waste picker
organisation
36 64
No Count 168 767
% within waste picker
organisation
18 82
Total Count 502 1367
% within waste picker
organisation
27 73

420
Guntur Count 44 225 269
% within City 16.4 83.6 100.0
% within
association with
municipality
8.8 16.5 14.4
% of Total 2.4 12.0 14.4
Indore Count 16 98 114
% within City 14.0 86.0 100.0
% within
association with
municipality
3.2 7.2 6.1
% of Total .9 5.2 6.1
Mumbai Count 1 148 149
% within City .7 99.3 100.0
% within
association with
municipality
.2 10.8 8.0
% of Total .1 7.9 8.0
Mysore Count 147 2 149
% within City 98.7 1.3 100.0
% within
association with
municipality
29.3 .1 8.0
% of Total 7.9 .1 8.0
Nashik Count 0 106 106
% within City .0 100.0 100.0
% within
association with
municipality
.0 7.8 5.7
% of Total .0 5.7 5.7
Navi Mumbai Count 5 2 7
% within City 71.4 28.6 100.0
% within
association with
municipality
1.0 .1 .4
% of Total .3 .1 .4
Pune Count 121 1 122
% within City 99.2 .8 100.0
% within
association with
municipality
24.1 .1 6.5
% of Total 6.5 .1 6.5

421
Shillong Count 28 32 60
% within City 46.7 53.3 100.0
% within
association with
municipality
5.6 2.3 3.2
% of Total 1.5 1.7 3.2
Tenali Count 0 32 32
% within City .0 100.0 100.0
% within
association with
municipality
.0 2.3 1.7
% of Total .0 1.7 1.7
Thane Count 35 30 65
% within City 53.8 46.2 100.0
% within
association with
municipality
7.0 2.2 3.5
% of Total 1.9 1.6 3.5
Tumkur Count 0 31 31
% within City .0 100.0 100.0
% within
association with
municipality
.0 2.3 1.7
% of Total .0 1.7 1.7
Kalyan Count 41 18 59
% within City 69.5 30.5 100.0
% within
association with
municipality
8.2 1.3 3.2
% of Total 2.2 1.0 3.2
Balaghat Count 0 53 53
% within City .0 100.0 100.0
% within
association with
municipality
.0 3.9 2.8
% of Total .0 2.8 2.8
Jaipur Count 0 96 96
% within City .0 100.0 100.0
% within
association with
municipality
.0 7.0 5.1
% of Total .0 5.1 5.1

422
Yawatmal Count 0 25 25
% within City .0 100.0 100.0
% within
association with
municipality
.0 1.8 1.3
% of Total .0 1.3 1.3
Wardha Count 11 14 25
% within City 44.0 56.0 100.0
% within
association with
municipality
2.2 1.0 1.3
% of Total .6 .7 1.3
Total Count 502 1367 1869
% within City 26.9 73.1 100.0
% within
association with
municipality
100.0 100.0 100.0
% of Total 26.9 73.1 100.0
Table 3.2. 45 Type of waste picker and association with municipality
Type of Waste
Picker
Association with municipality
Yes No Total
Free Roaming /
Independent local
Count 259 977 1236
% within type of
waste picker
21.0 79.0 100.0
% within
association with
municipality
51.6 71.5 66.1
% of Total 13.9 52.3 66.1
Free Roaming
Migrant
Count 8 54 62
% within type of
waste picker
12.9 87.1 100.0
% within
association with
municipality
1.6 4.0 3.3
% of Total .4 2.9 3.3
Itinerant Buyer Count 8 4 12
% within type of
waste picker
66.7 33.3 100.0
% within
association with
municipality
1.6 .3 .6
% of Total .4 .2 .6

423
Waste Sorter Count 73 67 140
% within type of
waste picker
52.1 47.9 100.0
% within
association with
municipality
14.5 4.9 7.5
% of Total 3.9 3.6 7.5
Door-to-Door
Collector
Count 146 207 353
% within type of
waste picker
41.4 58.6 100.0
% within
association with
municipality
29.1 15.1 18.9
% of Total 7.8 11.1 18.9
Other informal
worker
Count 3 9 12
% within type of
waste picker
25.0 75.0 100.0
% within
association with
municipality
.6 .7 .6
% of Total .2 .5 .6
Others Count 5 49 54
% within type of
waste picker
9.3 90.7 100.0
% within
association with
municipality
1.0 3.6 2.9
% of Total .3 2.6 2.9
Total Count 502 1367 1869
% within type of
waste picker
26.9 73.1 100.0
% within
association with
municipality
100.0 100.0 100.0
% of Total 26.9 73.1 100.0
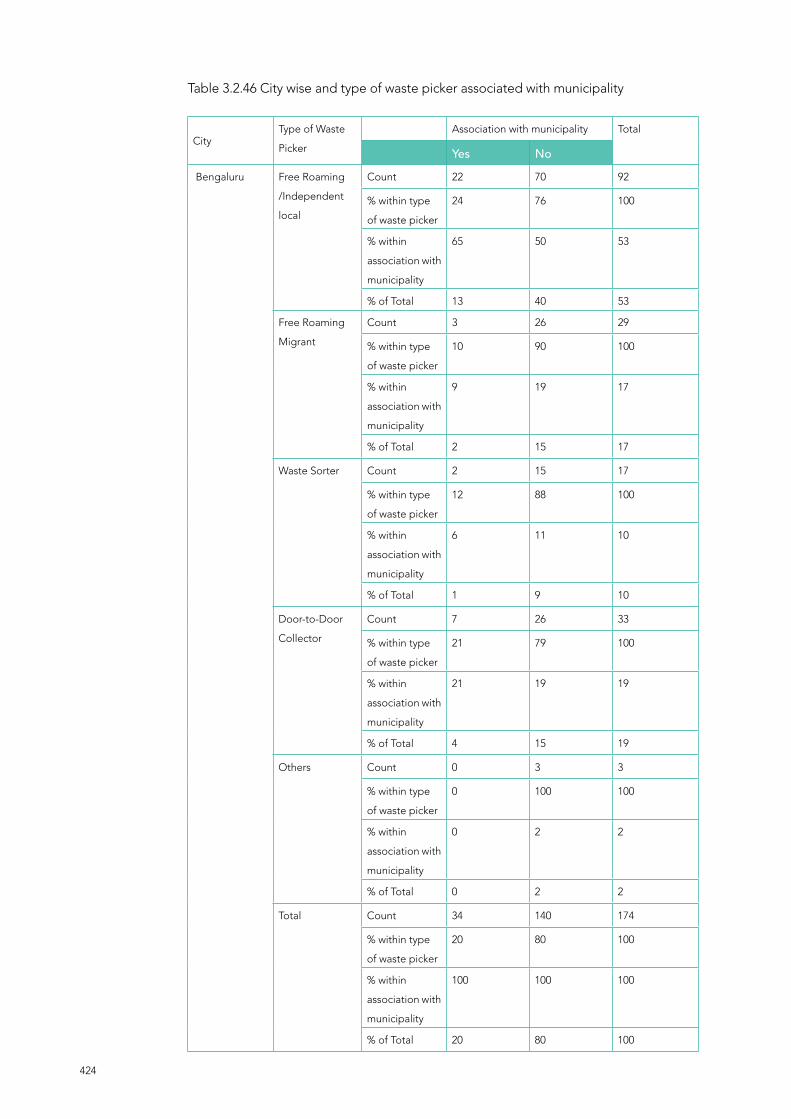
424
Table 3.2.46 City wise and type of waste picker associated with municipality
CityType of Waste
Picker
Association with municipality Total
Yes No
Bengaluru Free Roaming
/Independent
local
Count 22 70 92
% within type
of waste picker
24 76 100
% within
association with
municipality
65 50 53
% of Total 13 40 53
Free Roaming
Migrant
Count 3 26 29
% within type
of waste picker
10 90 100
% within
association with
municipality
9 19 17
% of Total 2 15 17
Waste Sorter Count 2 15 17
% within type
of waste picker
12 88 100
% within
association with
municipality
6 11 10
% of Total 1 9 10
Door-to-Door
Collector
Count 7 26 33
% within type
of waste picker
21 79 100
% within
association with
municipality
21 19 19
% of Total 4 15 19
Others Count 0 3 3
% within type
of waste picker
0 100 100
% within
association with
municipality
0 2 2
% of Total 0 2 2
Total Count 34 140 174
% within type
of waste picker
20 80 100
% within
association with
municipality
100 100 100
% of Total 20 80 100
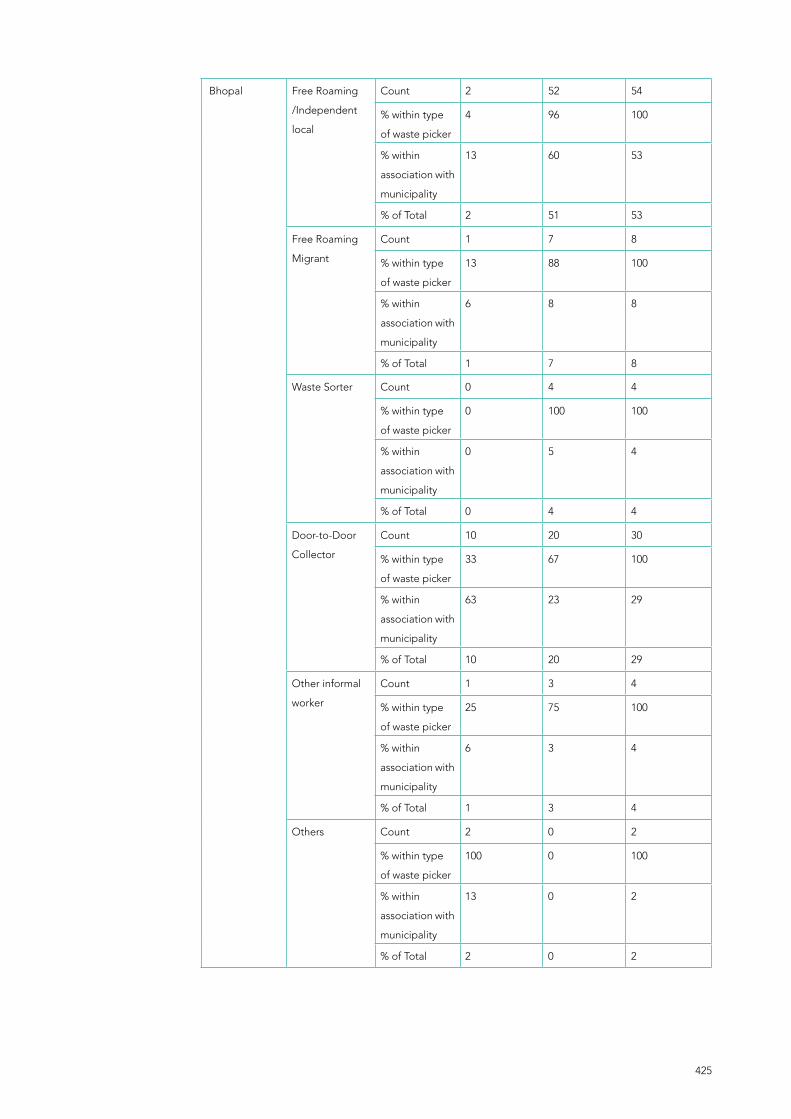
425
Bhopal Free Roaming
/Independent
local
Count 2 52 54
% within type
of waste picker
4 96 100
% within
association with
municipality
13 60 53
% of Total 2 51 53
Free Roaming
Migrant
Count 1 7 8
% within type
of waste picker
13 88 100
% within
association with
municipality
6 8 8
% of Total 1 7 8
Waste Sorter Count 0 4 4
% within type
of waste picker
0 100 100
% within
association with
municipality
0 5 4
% of Total 0 4 4
Door-to-Door
Collector
Count 10 20 30
% within type
of waste picker
33 67 100
% within
association with
municipality
63 23 29
% of Total 10 20 29
Other informal
worker
Count 1 3 4
% within type
of waste picker
25 75 100
% within
association with
municipality
6 3 4
% of Total 1 3 4
Others Count 2 0 2
% within type
of waste picker
100 0 100
% within
association with
municipality
13 0 2
% of Total 2 0 2
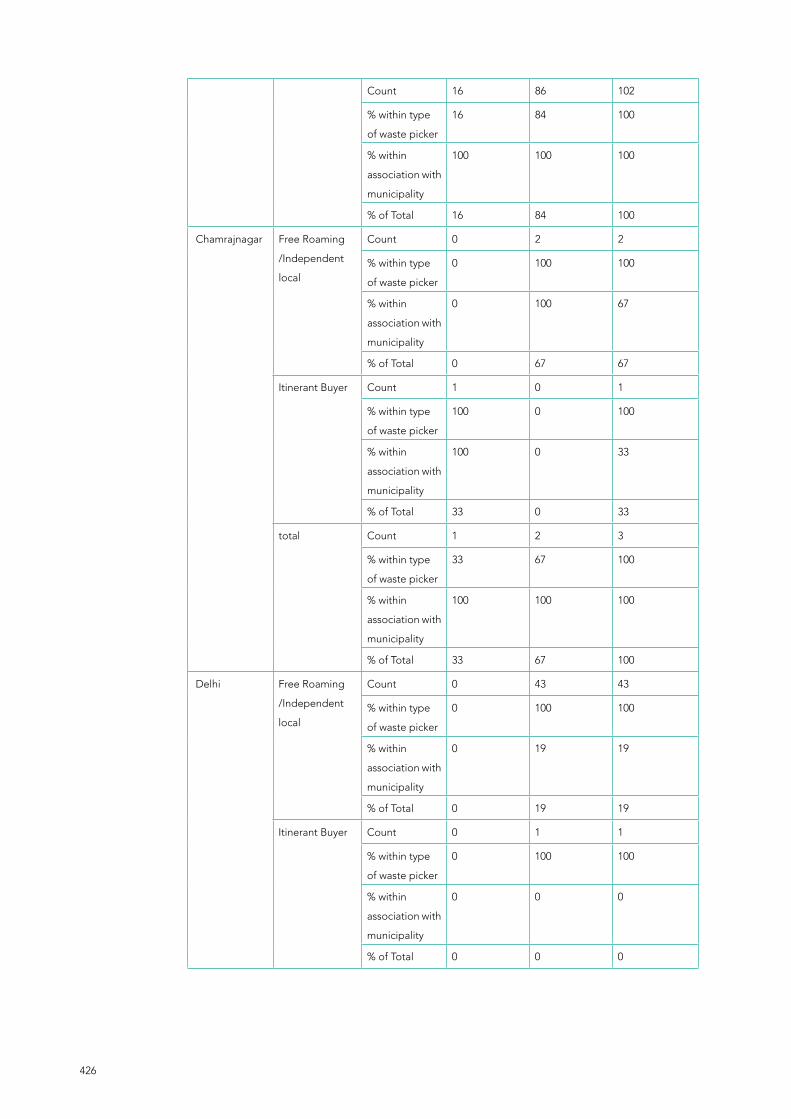
426
Count 16 86 102
% within type
of waste picker
16 84 100
% within
association with
municipality
100 100 100
% of Total 16 84 100
Chamrajnagar Free Roaming
/Independent
local
Count 0 2 2
% within type
of waste picker
0 100 100
% within
association with
municipality
0 100 67
% of Total 0 67 67
Itinerant Buyer Count 1 0 1
% within type
of waste picker
100 0 100
% within
association with
municipality
100 0 33
% of Total 33 0 33
total Count 1 2 3
% within type
of waste picker
33 67 100
% within
association with
municipality
100 100 100
% of Total 33 67 100
Delhi Free Roaming
/Independent
local
Count 0 43 43
% within type
of waste picker
0 100 100
% within
association with
municipality
0 19 19
% of Total 0 19 19
Itinerant Buyer Count 0 1 1
% within type
of waste picker
0 100 100
% within
association with
municipality
0 0 0
% of Total 0 0 0
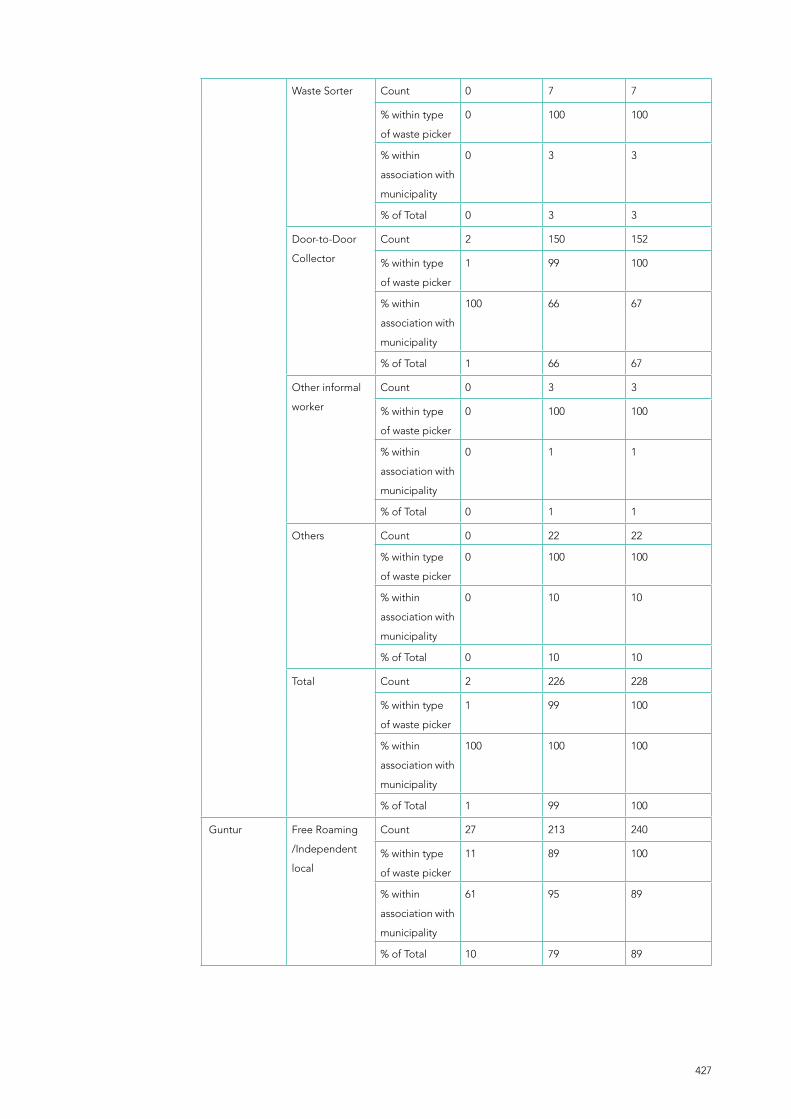
427
Waste Sorter Count 0 7 7
% within type
of waste picker
0 100 100
% within
association with
municipality
0 3 3
% of Total 0 3 3
Door-to-Door
Collector
Count 2 150 152
% within type
of waste picker
1 99 100
% within
association with
municipality
100 66 67
% of Total 1 66 67
Other informal
worker
Count 0 3 3
% within type
of waste picker
0 100 100
% within
association with
municipality
0 1 1
% of Total 0 1 1
Others Count 0 22 22
% within type
of waste picker
0 100 100
% within
association with
municipality
0 10 10
% of Total 0 10 10
Total Count 2 226 228
% within type
of waste picker
1 99 100
% within
association with
municipality
100 100 100
% of Total 1 99 100
Guntur Free Roaming
/Independent
local
Count 27 213 240
% within type
of waste picker
11 89 100
% within
association with
municipality
61 95 89
% of Total 10 79 89

428
Free Roaming
Migrant
Count 0 1 1
% within type
of waste picker
0 100 100
% within
association with
municipality
0 0 0
% of Total 0 0 0
Waste Sorter Count 8 11 19
% within type
of waste picker
42 58 100
% within
association with
municipality
18 5 7
% of Total 3 4 7
Door-to-Door
Collector
Count 6 0 6
% within type
of waste picker
100 0 100
% within
association with
municipality
14 0 2
% of Total 2 0 2
Other informal
worker
Count 2 0 2
% within type
of waste picker
100 0 100
% within
association with
municipality
5 0 1
% of Total 1 0 1
Others Count 1 0 1
% within type
of waste picker
100 0 100
% within
association with
municipality
2 0 0
% of Total 0 0 0
Total Count 44 225 269
% within type
of waste picker
16 84 100
% within
association with
municipality
100 100 100
% of Total 16 84 100

429
Indore Free Roaming
/Independent
local
Count 12 74 86
% within type
of waste picker
14 86 100
% within
association with
municipality
75 76 75
% of Total 11 65 75
Free Roaming
Migrant
Count 0 8 8
% within type
of waste picker
0 100 100
% within
association with
municipality
0 8 7
% of Total 0 7 7
Itinerant Buyer Count 1 0 1
% within type
of waste picker
100 0 100
% within
association with
municipality
6 0 1
% of Total 1 0 1
Waste Sorter Count 2 13 15
% within type
of waste picker
13 87 100
% within
association with
municipality
13 13 13
% of Total 2 11 13
Door-to-Door
Collector
Count 0 1 1
% within type
of waste picker
0 100 100
% within
association with
municipality
0 1 1
% of Total 0 1 1
Other informal
worker
Count 0 2 2
% within type
of waste picker
0 100 100
% within
association with
municipality
0 2 2
% of Total 0 2 2

430
Others Count 1 0 1
% within type
of waste picker
100 0 100
% within
association with
municipality
6 0 1
% of Total 1 0 1
Total Count 16 98 114
% within type
of waste picker
14 86 100
% within
association with
municipality
100 100 100
% of Total 14 86 100
Mumbai Free Roaming
/Independent
local
Count 1 119 120
% within type
of waste picker
1 99 100
% within
association with
municipality
100 80 81
% of Total 1 80 81
Free Roaming
Migrant
Count 0 3 3
% within type
of waste picker
0 100 100
% within
association with
municipality
0 2 2
% of Total 0 2 2
Itinerant Buyer Count 0 1 1
% within type
of waste picker
0 100 100
% within
association with
municipality
0 1 1
% of Total 0 1 1
Door-to-Door
Collector
Count 0 1 1
% within type
of waste picker
0 100 100
% within
association with
municipality
0 1 1
% of Total 0 1 1

431
Others Count 0 24 24
% within type
of waste picker
0 100 100
% within
association with
municipality
0 16 16
% of Total 0 16 16
Total Count 1 148 149
% within type
of waste picker
1 99 100
% within
association with
municipality
100 100 100
% of Total 1 99 100
Mysore Free Roaming
/Independent
local
Count 129 2 131
% within type
of waste picker
98 2 100
% within
association with
municipality
88 100 88
% of Total 87 1 88
Free Roaming
Migrant
Count 4 0 4
% within type
of waste picker
100 0 100
% within
association with
municipality
3 0 3
% of Total 3 0 3
Itinerant Buyer Count 6 0 6
% within type
of waste picker
100 0 100
% within
association with
municipality
4 0 4
% of Total 4 0 4
Waste Sorter Count 6 0 6
% within type
of waste picker
100 0 100
% within
association with
municipality
4 0 4
% of Total 4 0 4

432
Door-to-Door
Collector
Count 2 0 2
% within type
of waste picker
100 0 100
% within
association with
municipality
1 0 1
% of Total 1 0 1
Total Count 147 2 149
% within type
of waste picker
99 1 100
% within
association with
municipality
100 100 100
% of Total 99 1 100
Nashik Free Roaming
/Independent
local
Count 105 105
% within type
of waste picker
100 100
% within
association with
municipality
99 99
% of Total 99 99
Door-to-Door
Collector
Count 1 1
% within type
of waste picker
100 100
% within
association with
municipality
1 1
% of Total 1 1
Total Count 106 106
% within type
of waste picker
100 100
% within
association with
municipality
100 100
% of Total 100 100
Navi Mumbai Free Roaming
/Independent
local
Count 5 2 7
% within type
of waste picker
71 29 100
% within
association with
municipality
100 100 100
% of Total 71 29 100

433
Total Count 5 2 7
% within type
of waste picker
71 29 100
% within
association with
municipality
100 100 100
% of Total 71 29 100
Pune Waste Sorter Count 1 0 1
% within type
of waste picker
100 0 100
% within
association with
municipality
1 0 1
% of Total 1 0 1
Door-to-Door
Collector
Count 119 1 120
% within type
of waste picker
99 1 100
% within
association with
municipality
98 100 98
% of Total 98 1 98
Others Count 1 0 1
% within type
of waste picker
100 0 100
% within
association with
municipality
1 0 1
% of Total 1 0 1
Total Count 121 1 122
% within type
of waste picker
99 1 100
% within
association with
municipality
100 100 100
% of Total 99 1 100
Shillong Free Roaming
/Independent
local
Count 0 32 32
% within type
of waste picker
0 100 100
% within
association with
municipality
0 100 53
% of Total 0 53 53
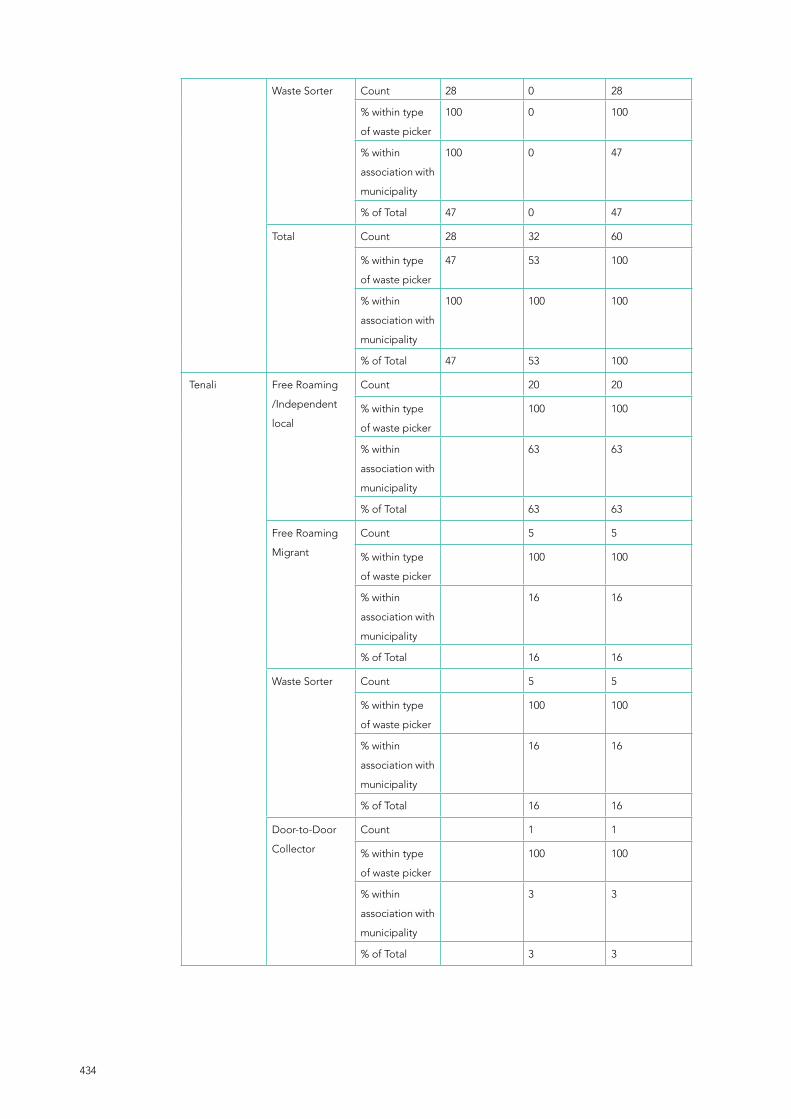
434
Waste Sorter Count 28 0 28
% within type
of waste picker
100 0 100
% within
association with
municipality
100 0 47
% of Total 47 0 47
Total Count 28 32 60
% within type
of waste picker
47 53 100
% within
association with
municipality
100 100 100
% of Total 47 53 100
Tenali Free Roaming
/Independent
local
Count 20 20
% within type
of waste picker
100 100
% within
association with
municipality
63 63
% of Total 63 63
Free Roaming
Migrant
Count 5 5
% within type
of waste picker
100 100
% within
association with
municipality
16 16
% of Total 16 16
Waste Sorter Count 5 5
% within type
of waste picker
100 100
% within
association with
municipality
16 16
% of Total 16 16
Door-to-Door
Collector
Count 1 1
% within type
of waste picker
100 100
% within
association with
municipality
3 3
% of Total 3 3
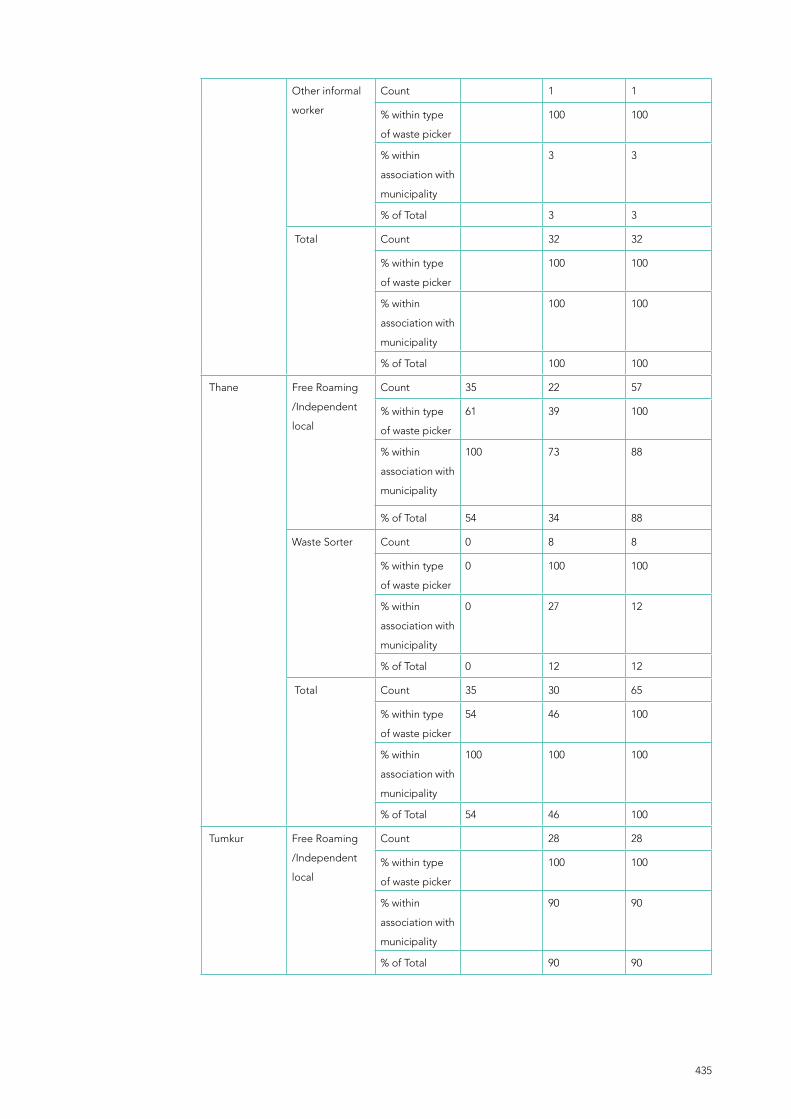
435
Other informal
worker
Count 1 1
% within type
of waste picker
100 100
% within
association with
municipality
3 3
% of Total 3 3
Total Count 32 32
% within type
of waste picker
100 100
% within
association with
municipality
100 100
% of Total 100 100
Thane Free Roaming
/Independent
local
Count 35 22 57
% within type
of waste picker
61 39 100
% within
association with
municipality
100 73 88
% of Total 54 34 88
Waste Sorter Count 0 8 8
% within type
of waste picker
0 100 100
% within
association with
municipality
0 27 12
% of Total 0 12 12
Total Count 35 30 65
% within type
of waste picker
54 46 100
% within
association with
municipality
100 100 100
% of Total 54 46 100
Tumkur Free Roaming
/Independent
local
Count 28 28
% within type
of waste picker
100 100
% within
association with
municipality
90 90
% of Total 90 90

436
Free Roaming
Migrant
Count 1 1
% within type
of waste picker
100 100
% within
association with
municipality
3 3
% of Total 3 3
Itinerant Buyer Count 2 2
% within type
of waste picker
100 100
% within
association with
municipality
6 6
% of Total 6 6
Total Count 31 31
% within type
of waste picker
100 100
% within
association with
municipality
100 100
% of Total 100 100
Kalyan Free Roaming
/Independent
local
Count 15 15 30
% within type
of waste picker
50 50 100
% within
association with
municipality
37 83 51
% of Total 25 25 51
Free Roaming
Migrant
Count 0 1 1
% within type
of waste picker
0 100 100
% within
association with
municipality
0 6 2
% of Total 0 2 2
Waste Sorter Count 26 2 28
% within type
of waste picker
93 7 100
% within
association with
municipality
63 11 47
% of Total 44 3 47

437
Total Count 41 18 59
% within type
of waste picker
69 31 100
% within
association with
municipality
100 100 100
% of Total 69 31 100
Balaghat Free Roaming
/Independent
local
Count 48 48
% within type
of waste picker
100 100
% within
association with
municipality
91 91
% of Total 91 91
Free Roaming
Migrant
Count 2 2
% within type
of waste picker
100 100
% within
association with
municipality
4 4
% of Total 4 4
Waste Sorter Count 2 2
% within type
of waste picker
100 100
% within
association with
municipality
4 4
% of Total 4 4
Door-to-Door
Collector
Count 1 1
% within type
of waste picker
100 100
% within
association with
municipality
2 2
% of Total 2 2
Total Count 53 53
% within type
of waste picker
100 100
% within
association with
municipality
100 100
% of Total 100 100

438
Jaipur Free Roaming
/Independent
local
Count 91 91
% within type
of waste picker
100 100
% within
association with
municipality
95 95
% of Total 95 95
Door-to-Door
Collector
Count 5 5
% within type
of waste picker
100 100
% within
association with
municipality
5 5
% of Total 5 5
Total Count 96 96
% within type
of waste picker
100 100
% within
association with
municipality
100 100
% of Total 100 100
Yawatmal Free Roaming
/Independent
local
Count 25 25
% within type
of waste picker
100 100
% within
association with
municipality
100 100
% of Total 100 100
Total Count 25 25
% within type
of waste picker
100 100
% within
association with
municipality
100 100
% of Total 100 100
Wardha Free Roaming
/Independent
local
Count 11 14 25
% within type
of waste picker
44 56 100
% within
association with
municipality
100 100 100
% of Total 44 56 100

439
Total Count 11 14 25
% within type
of waste picker
44 56 100
% within
association with
municipality
100 100 100
% of Total 44 56 100
Table 3.2.47 Distribution of respondents with identity card (type)
Type of Identity Card Number of responses Percentage (%)
Adhar Card/UID 1669 32.80
Voter ID 1221 24.00
Pan Card 691 13.60
Ration Card 951 18.70
BPL Card 361 7.10
Driving License 51 1.00
None 108 2.10
Others 39 0.80
Total 5091 100.00
Table 3.2.48 City wise distribution of respondents and type of identity card
Identity Card
TotalAadhar
card
Voter
ID
Pan
Card
Ration
card
BPL
Card
Driving
LicenseNone Others
Bengaluru Count 152 114 75 61 56 23 20 2 174
% within
City
87.4 65.5 43.1 35.1 32.2 13.2 11.5 1.1
% within
ID Card
9.1 9.3 10.9 6.4 15.5 45.1 18.5 5.1
% of Total 8.1 6.1 4.0 3.3 3.0 1.2 1.1 .1 9.3
Bhopal Count 91 76 11 58 13 1 7 0 102
% within
City
89.2 74.5 10.8 56.9 12.7 1.0 6.9 .0
% within
ID Card
5.5 6.2 1.6 6.1 3.6 2.0 6.5 .0
% of Total 4.9 4.1 .6 3.1 .7 .1 .4 .0 5.5

440
Chamraj
nagar
Count 3 0 0 0 0 0 0 0 3
% within
City
100.0 .0 .0 .0 .0 .0 .0 .0
% within
ID Card
.2 .0 .0 .0 .0 .0 .0 .0
% of Total .2 .0 .0 .0 .0 .0 .0 .0 .2
Delhi Count 195 156 87 48 8 9 8 0 228
% within
City
85.5 68.4 38.2 21.1 3.5 3.9 3.5 .0
% within
ID Card
11.7 12.8 12.6 5.0 2.2 17.6 7.4 .0
% of Total 10.4 8.3 4.7 2.6 .4 .5 .4 .0 12.2
Guntur Count 266 102 39 121 0 3 3 0 269
% within
City
98.9 37.9 14.5 45.0 .0 1.1 1.1 .0
% within
ID Card
15.9 8.4 5.6 12.7 .0 5.9 2.8 .0
% of Total 14.2 5.5 2.1 6.5 .0 .2 .2 .0 14.4
Indore Count 109 97 8 42 48 4 2 0 114
% within
City
95.6 85.1 7.0 36.8 42.1 3.5 1.8 .0
% within
ID Card
6.5 7.9 1.2 4.4 13.3 7.8 1.9 .0
% of Total 5.8 5.2 .4 2.2 2.6 .2 .1 .0 6.1
Mumbai Count 147 136 121 145 14 0 0 1 149
% within
City
98.7 91.3 81.2 97.3 9.4 .0 .0 .7
% within
ID Card
8.8 11.1 17.5 15.2 3.9 .0 .0 2.6
% of Total 7.9 7.3 6.5 7.8 .7 .0 .0 .1 8.0
Mysore Count 146 138 62 75 110 4 1 0 149
% within
City
98.0 92.6 41.6 50.3 73.8 2.7 .7 .0
% within
ID Card
8.7 11.3 9.0 7.9 30.5 7.8 .9 .0
% of Total 7.8 7.4 3.3 4.0 5.9 .2 .1 .0 8.0
Nashik Count 104 99 78 102 4 0 0 0 106
% within
City
98.1 93.4 73.6 96.2 3.8 .0 .0 .0
% within
ID Card
6.2 8.1 11.3 10.7 1.1 .0 .0 .0
% of Total 5.6 5.3 4.2 5.5 .2 .0 .0 .0 5.7

441
Navi
Mumbai
Count 5 2 4 1 0 0 0 5 7
% within
City
71.4 28.6 57.1 14.3 .0 .0 .0 71.4
% within
ID Card
.3 .2 .6 .1 .0 .0 .0 12.8
% of Total .3 .1 .2 .1 .0 .0 .0 .3 .4
Pune Count 118 98 87 99 9 4 0 0 122
% within
City
96.7 80.3 71.3 81.1 7.4 3.3 .0 .0
% within
ID Card
7.1 8.0 12.6 10.4 2.5 7.8 .0 .0
% of Total 6.3 5.2 4.7 5.3 .5 .2 .0 .0 6.5
Shillong Count 23 59 10 18 38 2 1 0 60
% within
City
38.3 98.3 16.7 30.0 63.3 3.3 1.7 .0
% within
ID Card
1.4 4.8 1.4 1.9 10.5 3.9 .9 .0
% of Total 1.2 3.2 .5 1.0 2.0 .1 .1 .0 3.2
Tenali Count 32 19 0 20 0 0 0 0 32
% within
City
100.0 59.4 .0 62.5 .0 .0 .0 .0
% within
ID Card
1.9 1.6 .0 2.1 .0 .0 .0 .0
% of Total 1.7 1.0 .0 1.1 .0 .0 .0 .0 1.7
Thane Count 64 49 50 53 7 0 1 8 65
% within
City
98.5 75.4 76.9 81.5 10.8 .0 1.5 12.3
% within
ID Card
3.8 4.0 7.2 5.6 1.9 .0 .9 20.5
% of Total 3.4 2.6 2.7 2.8 .4 .0 .1 .4 3.5
Tumkur Count 31 29 8 29 29 0 0 0 31
% within
City
100.0 93.5 25.8 93.5 93.5 .0 .0 .0
% within
ID Card
1.9 2.4 1.2 3.0 8.0 .0 .0 .0
% of Total 1.7 1.6 .4 1.6 1.6 .0 .0 .0 1.7
Kalyan Count 49 11 46 49 16 1 1 23 59
% within
City
83.1 18.6 78.0 83.1 27.1 1.7 1.7 39.0
% within
ID Card
2.9 .9 6.7 5.2 4.4 2.0 .9 59.0
% of Total 2.6 .6 2.5 2.6 .9 .1 .1 1.2 3.2

442
Balaghat Count 24 14 0 12 8 0 28 0 53
% within
City
45.3 26.4 .0 22.6 15.1 .0 52.8 .0
% within
ID Card
1.4 1.1 .0 1.3 2.2 .0 25.9 .0
% of Total 1.3 .7 .0 .6 .4 .0 1.5 .0 2.8
Jaipur Count 86 19 1 11 1 0 10 0 96
% within
City
89.6 19.8 1.0 11.5 1.0 .0 10.4 .0
% within
ID Card
5.2 1.6 .1 1.2 .3 .0 9.3 .0
% of Total 4.6 1.0 .1 .6 .1 .0 .5 .0 5.1
Yawatmal Count 1 1 1 1 0 0 24 0 25
% within
City
4.0 4.0 4.0 4.0 .0 .0 96.0 .0
% within
ID Card
.1 .1 .1 .1 .0 .0 22.2 .0
% of Total .1 .1 .1 .1 .0 .0 1.3 .0 1.3
Wardha Count 23 2 3 6 0 0 2 0 25
% within
City
92.0 8.0 12.0 24.0 .0 .0 8.0 .0
% within
ID Card
1.4 .2 .4 .6 .0 .0 1.9 .0
% of Total 1.2 .1 .2 .3 .0 .0 .1 .0 1.3
Total Count 1669 1221 691 951 361 51 108 39 1869
% of Total 89.3 65.3 37.0 50.9 19.3 2.7 5.8 2.1 100.0
Table 3.2.49 Type of waste picker and identity card
Identity Card
TotalAadhar
card
Voter
ID
Pan
Card
Ration
card
BPL
Card
Driving
LicenseNone Others
Free
Roaming/
Indepen-
dent
Local
Count 1117 788 404 652 258 22 91 32 3364
% within
type of
waste
picker
33.2 23.4 12.0 19.4 7.7 .7 2.7 1.0
% within
identity
card
66.3 64.4 58.3 68.5 71.3 36.7 82.0 80.0
% of Total 21.8 15.4 7.9 12.7 5.0 .4 1.8 .6 65.6

443
Free
Roaming
Migrant
Count 54 34 18 16 16 1 8 1 148
% within
type of
waste
picker
36.5 23.0 12.2 10.8 10.8 .7 5.4 .7
% within
identity
card
3.2 2.8 2.6 1.7 4.4 1.7 7.2 2.5
% of Total 1.1 .7 .4 .3 .3 .0 .2 .0 2.9
Itinerant
Buyer
Count 11 10 5 8 5 2 0 0 41
% within
type of
waste
picker
26.8 24.4 12.2 19.5 12.2 4.9 .0 .0
% within
identity
card
.7 .8 .7 .8 1.4 3.3 .0 .0
% of Total .2 .2 .1 .2 .1 .0 .0 .0 .8
Waste
Sorter
Count 117 80 43 68 44 8 5 7 372
% within
type of
waste
picker
31.5 21.5 11.6 18.3 11.8 2.2 1.3 1.9
% within
identity
card
6.9 6.5 6.2 7.1 12.2 13.3 4.5 17.5
% of Total 2.3 1.6 .8 1.3 .9 .2 .1 .1 7.3
Door-
to-Door
Collector
Count 320 269 197 178 35 25 7 0 1031
% within
type of
waste
picker
31.0 26.1 19.1 17.3 3.4 2.4 .7 .0
% within
identity
card
19.0 22.0 28.4 18.7 9.7 41.7 6.3 .0
% of Total 6.2 5.2 3.8 3.5 .7 .5 .1 .0 20.1
Other
informal
worker
Count 11 7 2 2 3 1 0 0 26
% within
type of
waste
picker
42.3 26.9 7.7 7.7 11.5 3.8 .0 .0
% within
identity
card
.7 .6 .3 .2 .8 1.7 .0 .0
% of Total .2 .1 .0 .0 .1 .0 .0 .0 .5

444
Others Count 54 36 24 28 1 1 0 0 144
% within
type of
waste
picker
37.5 25.0 16.7 19.4 .7 .7 .0 .0
% within
identity
card
3.2 2.9 3.5 2.9 .3 1.7 .0 .0
% of Total 1.1 .7 .5 .5 .0 .0 .0 .0 2.8
Total Count 1684 1224 693 952 362 60 111 40 5126
% of Total 32.9 23.9 13.5 18.6 7.1 1.2 2.2 .8 100.0
Count 1684 1224 693 952 362 60 111 40 5126
% of Total 32.9 23.9 13.5 18.6 7.1 1.2 2.2 .8 100.0
Table 3.3.1 Benefits Received
Table 3.3.2 Benefits Received from NGO
Benefits received Number of respondent Percent (%)
NGO 672 36.1
Government 281 15.1
Scrap Dealer 64 3.4
None 852 45.4
Total 1862 100
Responses
Benefits From NGO Number Percent (%)
Housing 29 2.10
Medical facility 306 21.90
Free Hospital 79 5.70
Health insurance 67 4.80
Legal aid 47 3.40
Financial assistance 100 7.20
Loan 49 3.50
Recognition in society 71 5.10
Educational facility for children 127 9.10
Hostel facility for children 20 1.40
Skill development / training 172 12.30
Scholarship to children 114 8.20
Material support 39 2.80

445
Pension 14 1.00
Ration 52 3.70
PF 23 1.60
ESI 13 0.90
Others 73 5.20
Total 1395 100.00
Table 3.3.3 Benefits received from Municipality
Responses
Benefits From Municipality Number Percent (%)
Housing 82 12.00
Medical facility 150 22.00
Free Hospital 135 19.80
Health insurance 51 7.50
Legal aid 5 0.70
Financial assistance 22 3.20
Loan 17 2.50
Recognition in society 19 2.80
Educational facility for children 51 7.50
Hostel facility for children 3 0.40
Skill development / training 10 1.50
Scholarship to children 30 4.40
Material support 27 4.00
Pension 4 0.60
Ration 59 8.70
Others 17 2.50
Total 682 100.00
Table 3.3.4 Access to health facility
Access to health facility Frequency Percent
Yes 528 28.3
No 1192 63.8
Can’t Say 149 8
Total 1869 100

446
Table 3.3.5 Access to educational facility
Table 3.3.6 Access to insurance facility
Access to educational facility Frequency Percent
Yes 566 30.3
No 1167 62.4
Can’t Say 136 7.3
Total 1869 100
Health Insurance Frequency Percent
Yes 142 7.6
No 1643 87.9
Can't Say 84 4.5
Total 1869 100
Table 3.3.7 Access to type of educational facility
Table 3.3.8 Type of health insurance
Responses
Type of educational facility Number Percent (%)
Educational Loan 101 8.60
School Facility 125 10.60
RTE 361 30.70
Scholarship 180 15.30
Books/Uniform 199 16.90
Others 210 17.90
Total 1176 100.00
Responses
Type of health insurance Number Percent (%)
Government Health Insurance 101 67.30
Private Health Insurance 41 27.30
Group Insurance from SHG 6 4.00
Others 2 1.30
Total 150 100.00

447
Table 3.4.1 Knowledge about SBA.MU= Do you think registering with MUNICIPALITY as part of SWACCH BHARATH ABHIYAN will ( Ask below question on 5 point scale and tick (✔ ) mark in relevant column )
MUStrongly agree (%)
Agree(%) Neutral(%)Disagree(%)
Strongly Disagree(%)
909 Benefit your family 35.5 29.01 21.6 8.9 5.0
910 Increase in your
salary
27.7 24.7 32.0 11.0 4.7
911 Public perception
about you has
improved
24.0 11.1 29.1 35.5 0.2
912 Protection from
harassment
28.4 14.0 30.9 26.7 0
913 Increase your skills/
capacity
25.6 14.3 27.9 32.2 0
914 Discrimination from
municipality
28.1 18.3 31.9 21.5 0.2
915 You are considered
part of solid waste
management
system
31.6 12.0 24.4 32.0 0
916 Collecting waste at
source is helpful
29.6 13.1 22.8 34.5 0
917 Waste picker has
first access to bin/
waste collection
34.6 13.0 24.1 28.2 0
918 Access to clean dry
waste is easier
31.1 13.8 22.6 32.5 0
919 Waste collection
from door –to-door
has improved
26.0 15.0 30.4 28.5 0
920 After registration
waste collection has
increased
24.9 19.3 30.0 25.8 0
921 After Swacch
Bharath Abhiyan
working condition
has improved
26.9 16.7 30.6 25.7 0
922 Collecting from
landfill has become
much easier
30.2 15.5 33.7 20.6 0
923 Collecting from
secondary point
has become much
easier
22.7 12.6 38.9 25.8 0

448
924 Threats from private
contractors has
increased
23.0 15.7 38.1 23.2 0
925 Harassments from
police reduced
31.2 16.6 33.3 18.7 0.2
Table 3.4.2 City Wise Knowledge about SBA
City
Yes No Don't KnowHead but didn’t understand
Bengaluru
Count 7 129 33 5
within City 4.02 74.14 18.97 2.87
Bhopal
Count 68 17 7 10
within City 66.67 16.67 6.86 9.80
Chamrajnagar
Count 0 3 0 0
within City 0 100 0 0
Delhi
Count 115 109 0 4
within City 50.44 47.81 0.00 1.75
Guntur
Count 23 179 66 1
within City 8.55 66.54 24.54 0.37
Indore
Count 99 12 2 1
within City 86.84 10.53 1.75 0.88
Mumbai
Count 117 30 0 2
within City 78.52 20.13 0.00 1.34
Mysore
Count 59 8 22 60
within City 39.60 5.37 14.77 40.27
Nashik
Count 0 0 1 105
within City 0.00 0.00 0.94 99.06
Navi Mumbai
Count 7 0 0 0
within City 100 0 0 0
Pune
Count 64 36 1 21
within City 52.46 29.51 0.82 17.21
Shillong
Count 2 58 0 0
within City 3.33 96.67 0.00 0.00
Tenali
Count 3 14 15 0
within City 9.375 43.75 46.875 0
Thane
Count 44 14 0 7
within City 67.69 21.54 0.00 10.77

449
Tumkur
Count 0 30 0 1
within City 0.00 96.77 0.00 3.23
Kalyan
Count 33 17 5 4
within City 55.93 28.81 8.47 6.78
Balaghat
Count 49 2 2 0
within City 92.45 3.77 3.77 0.00
Jaipur
Count 0 85 5 6
within City 0.00 88.54 5.21 6.25
Yawatmal
Count 5 11 1 8
within City 20 44 4 32
Wardha
Count 12 12 0 1
within City 48 48 0 4
Total
Count 707 766 160 236
within City 37.83 40.98 8.56 12.63
Table 3.4.3 Source of information about SBA
Responses
Source of information Number of respondents (N) Percent (%)
Television 530 29
Newspaper 170 9
Radio 157 9
NGO 257 14
Wall posters/Hoarding 129 7
Fellow Waste Picker 127 7
Family members 128 7
Scrap dealer /buyer 112 6
Friends 179 10
Employers 28 2
Others 19 1
Total 1836 100

450
Table 3.4.4 Perception of SBA.MU= Do you think registering with MUNICIPALITY as part of SWACCH BHARATH ABHIYAN will ( Ask below question on 5 point scale and tick (✔ ) mark in relevant column )
Sl.no MUStrongly agree (%)
Agree(%) Neutral(%)Disagree(%)
Strongly Disagree(%)
1 Benefit your family 35.5 29.01 21.6 8.9 5.0
2 Increase in your
salary
27.7 24.7 32.0 11.0 4.7
3 Public perception
about you has
improved
24.0 11.1 29.1 35.5 0.2
4 Protection from
harassment
28.4 14.0 30.9 26.7 0
5 Increase your skills/
capacity
25.6 14.3 27.9 32.2 0
6 Discrimination from
municipality
28.1 18.3 31.9 21.5 0.2
7 You are considered
part of solid waste
management
system
31.6 12.0 24.4 32.0 0
8 Collecting waste at
source is helpful
29.6 13.1 22.8 34.5 0
9 Waste picker has
first access to bin/
waste collection
34.6 13.0 24.1 28.2 0
10 Access to clean dry
waste is easier
31.1 13.8 22.6 32.5 0
11 Waste collection
from door –to-door
has improved
26.0 15.0 30.4 28.5 0
12 After registration
waste collection has
increased
24.9 19.3 30.0 25.8 0
13 After Swacch
Bharath Abhiyan
working condition
has improved
26.9 16.7 30.6 25.7 0
14 Collecting from
landfill has become
much easier
30.2 15.5 33.7 20.6 0

451
15 Collecting from
secondary point
has become much
easier
22.7 12.6 38.9 25.8 0
16 Threats from private
contractors has
increased
23.0 15.7 38.1 23.2 0
17 Harassments from
police reduced
31.2 16.6 33.3 18.7 0.2
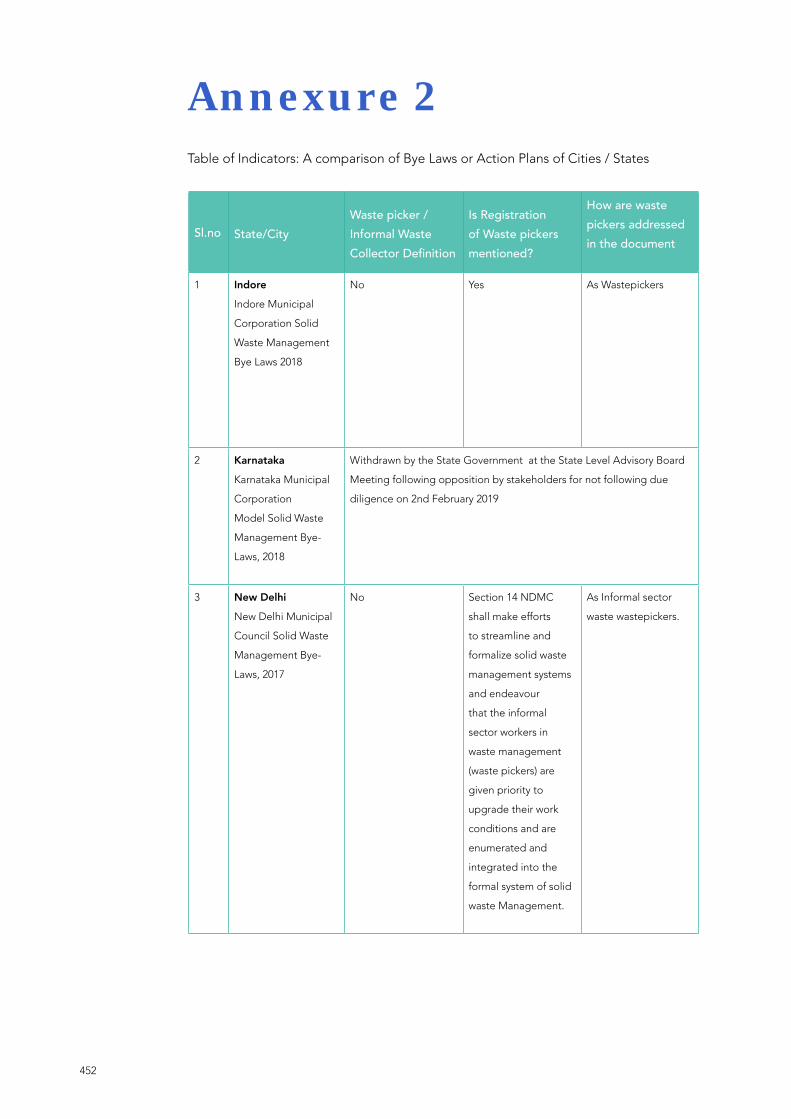
452
Annexure 2Table of Indicators: A comparison of Bye Laws or Action Plans of Cities / States
Sl.no State/CityWaste picker /Informal Waste Collector Definition
Is Registration of Waste pickers mentioned?
How are waste pickers addressed in the document
1 Indore
Indore Municipal
Corporation Solid
Waste Management
Bye Laws 2018
No Yes As Wastepickers
2 Karnataka
Karnataka Municipal
Corporation
Model Solid Waste
Management Bye-
Laws, 2018
Withdrawn by the State Government at the State Level Advisory Board
Meeting following opposition by stakeholders for not following due
diligence on 2nd February 2019
3 New Delhi
New Delhi Municipal
Council Solid Waste
Management Bye-
Laws, 2017
No Section 14 NDMC
shall make efforts
to streamline and
formalize solid waste
management systems
and endeavour
that the informal
sector workers in
waste management
(waste pickers) are
given priority to
upgrade their work
conditions and are
enumerated and
integrated into the
formal system of solid
waste Management.
As Informal sector
waste wastepickers.

453
Does the municipality have a specific plan for dry waste management?
Is Waste picker integrated into door-door collection?
Does the municipality provide waste pickers/informal waste collectors access to collect waste
Revenue from sale of recyclables
Yes Not mentioned Under Section 3 iv, v, vi
It makes a mention for
Residential welfare associations,
market associations, gated
communities and institutions,
hotels & restaurants to
handover recyclable material to
either authorised wastepickers/
vehicles
To authorised recyclers
operating MRF
Withdrawn by the State Government at the State Level Advisory Board Meeting following opposition by stakeholders for not
following due diligence on 2nd February 2019
NDMC shall convert its
existing Dhalaos or identify
specific location as per
requirement, as ‘Recycling
Centres’
Yes Under Chapter II, Section 4
iv, v, vi makes a mention for
Residential welfare associations,
market associations, gated
communities and institutions,
hotels & restaurants handover
segregated recyclable material
to either the authorised
waste pickers or the authorised
recyclers.
xv: Allows for Segregated bio-
degradable solid waste to be
handed over to /waste picker/
waste
collector or to the bio-
degradable waste collection
vehicle
The authorized agents and/
or authorized waste dealers
shall be allowed to dispose
of or sell
the recyclable waste to
the secondary market
or recycling units only in
consonance with the
provisions of SWM Rules.
The authorized agents and/
or authorized waste dealers
will be entitled to
retain sales realization
thereof

454
Sl.no State/CityWaste picker /Informal Waste Collector Definition
Is Registration of Waste pickers mentioned?
How are waste pickers addressed in the document
4 Navi Mumbai
Navi Mumbai
Municipal
Corporation
Cleanliness and
Sanitation Bye Laws
2017 to be read along
with Maharashtra
Non-Biodegradable
Solid Waste (Proper &
Scientific Collection
Storing and Disposal
Not mentioned Not mentioned Rag pickers
5 Tirupati
Municipal
Corporation
Tirupati Solid Waste
(Management &
Handling), Cleanliness
Rules/ByeLaws 2018
No Section 12 ix MCT
shall make efforts
to streamline and
formalise solid waste
management systems
and endeavour that the
informal sector workers
in waste management
( waste pickers) are given
priority to upgrade their
work conditions and
are enumerated and
integrated into the
formal system of solid
waste management
informal sector
workers in waste
management ( waste
pickers)

455
Does the municipality have a specific plan for dry waste management?
Is Waste picker integrated into door-door collection?
Does the municipality provide waste pickers/informal waste collectors access to collect waste
Revenue from sale of recyclables
Yes, as per the rules 3(2)
(i) of Maharashtra Non-
Biodegradable Solid Waste
(Proper & Scientific Collection
Storing and Disposal in the
area of Municipal Corporation
Rules
Section 6.9 says Dry waste
sorting centers shall be
manned/ operated by
registered co-operative
societies of rag pickers/
licensed recyclers or any other
Agents authorized/ appointed
by Navi Mumbai Municipal
Corporation
Not mentioned Section 3 ( 2) ii, states permit
rag pickers to separate
waste and to take away
non-biodegradable waste
from such collection centers
of the Maharashtra Non-
Biodegradable Solid Waste
6.8 c Assistant Commissioner
of respective wards shall ensure
that at no point of time the
community bins are overflowing
nor exposed to open
environment, preventing their
scattering by rag pickers, stray
animals or birds etc.
Section 3 ( 2) ii, states permit
rag pickers to separate
waste and to take away non-
biodegradable waste from
such collection centers
Section 7 d iii, states MCT
shall establish MRF and ensure
tat recyclables such as paper,
plastic, metal, glass, textile go
to authorised recyclers
Not mentioned Section 4 b states Residential
welfare associations,
market associations, gated
communities and institutions,
hotels & restaurants handover
segregated recyclable material
to either the authorised
waste pickers /vehicles
Sale from MRF goes to
authorised recyclers

456
Sl.no State/CityWaste picker /Informal Waste Collector Definition
Is Registration of Waste pickers mentioned?
How are waste pickers addressed in the document
6 Final Draft Public
Health Bye-Laws for
the Surat Municipal
Corporation of
Gujarat State, May
2016
No No Rag pickers

457
Does the municipality have a specific plan for dry waste management?
Is Waste picker integrated into door-door collection?
Does the municipality provide waste pickers/informal waste collectors access to collect waste
Revenue from sale of recyclables
Dry waste identified into 5 types includes ewaste
Chapter VII
The dry waste/recyclable waste shall be delivered
to the agents/agency/individual authorized by The
Surat Municipal Corporation at the time specified by
The Surat Municipal Corporation or shall be dumped
in the nearby separate containers for dry waste/
recyclable waste collection provided by The Surat
Municipal Corporation
The segregated dry waste/recyclable waste shall
be collected by the generator through private
safaiworkers/agents/agencies engaged by them for
the purpose and deposit the same in the separate
community bins provided for dry waste/recyclable
waste collection provided within the premises at
designated spots from where the same shall be
collected by authorized agents/agency/individual.
The generators can deliver the same directly to
agents/agencies/individuals authorized by The Surat
Municipal Corporation for the collection of same
through private safai workers
These dry waste sorting centers shall be on The
Surat Municipal Corporation’s land or land belonging
to the Government or other
bodies, made available especially for this purpose or
in the form of sheds or kiosks
provided at suitable public places and shall be
manned/operated by registered
cooperative societies of rag pickers/ licensed
recyclers or any other Agents authorized/appointed
by The Surat Municipal Corporation.
No No Retained by the authorised
recycler

458
Sl.no State/CityWaste picker /Informal Waste Collector Definition
Is Registration of Waste pickers mentioned?
How are waste pickers addressed in the document
7 Municipal
Corporation of
Chandigarh Solid
Waste Management
Byelaws 2018
Yes MCT shall make efforts
to streamline and
formalise solid waste
management systems
and endeavour that the
informal sector workers
in waste management
( waste pickers) are given
priority to upgrade their
work conditions and
are enumerated and
integrated into the
formal system of solid
waste management
Wastepickers or
other informal waste
recycling workers
8 The Greater Chennai
Corporation, Solid
Waste Management
Bye-Laws,
2016
Yes Yes
(b) establish a system to
recognize organizations
of waste pickers or
informal waste collectors
and promote and
establish a system for
integration of these
authorized waste-pickers
and waste collectors
to facilitate their
participation in solid
waste management
including door to door
collection of waste;
wastepickers

459
Does the municipality have a specific plan for dry waste management?
Is Waste picker integrated into door-door collection?
Does the municipality provide waste pickers/informal waste collectors access to collect waste
Revenue from sale of recyclables
Through the MRFs
The definition under MRF
mentions MRF or Sorting shed
means a facility established
by the Corporation or and
existing waste collection/
aggregation/ trading
facility authorised by the
Commissioner as such, where
segregated dry solid waste
can be temporarily stored by
the Corporation or any person
authorised by the Corporation
to facilitate segregation,
sorting, bailing, recovery
and temporary storage of
recyclables by waste pickers or
other informal waste recycling
workers before waste is
delivered or taken up for its
processing or disposal
Not mentioned Section III iv, v, vi
states Residential welfare
associations, market
associations, gated
communities and institutions,
hotels & restaurants handover
segregated recyclable material
to either the authorised
waste pickers or authorised
recyclers
Authorised recyclers can
retain the sales proceed
setup material recovery
facilities or secondary storage
facilities with sufficient space
for sorting of recyclable
materials to enable informal or
authorised waste pickers and
waste collectors to separate
recyclables from the waste and
provide easy access to waste
pickers and recyclers for
collection of segregated
recyclable waste such as paper,
plastic, metal, glass,
textile from the source of
generation or from material
recovery facilities;
Yes
(c) facilitate formation of
Self Help Groups, provide
identity cards and thereafter
encourage integration in
solid waste management
including door to door
collection of waste;
Section 4 (6, 7, 8) states
Residential welfare associations,
market associations, gated
communities and institutions,
hotels & restaurants handover
segregated recyclable material
to either the authorised
waste pickers or authorised
recyclers
Wastepickers benefit from
the sale of the recyclables
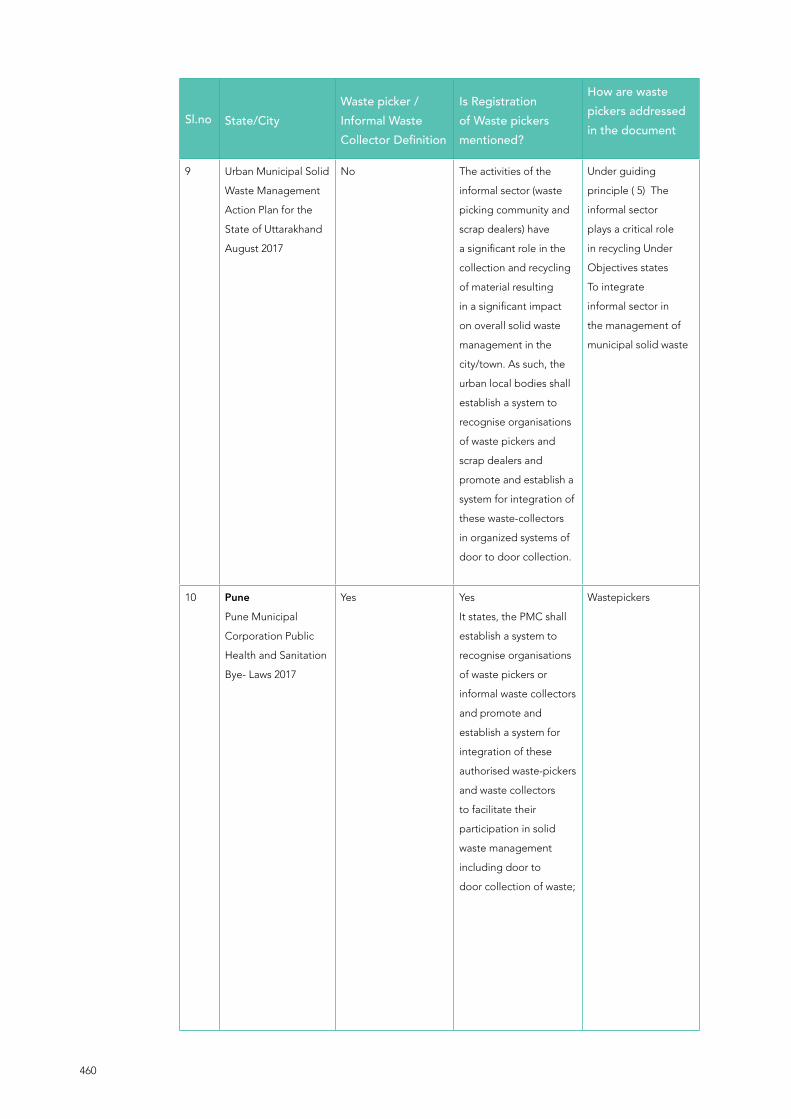
460
Sl.no State/CityWaste picker /Informal Waste Collector Definition
Is Registration of Waste pickers mentioned?
How are waste pickers addressed in the document
9 Urban Municipal Solid
Waste Management
Action Plan for the
State of Uttarakhand
August 2017
No The activities of the
informal sector (waste
picking community and
scrap dealers) have
a significant role in the
collection and recycling
of material resulting
in a significant impact
on overall solid waste
management in the
city/town. As such, the
urban local bodies shall
establish a system to
recognise organisations
of waste pickers and
scrap dealers and
promote and establish a
system for integration of
these waste-collectors
in organized systems of
door to door collection.
Under guiding
principle ( 5) The
informal sector
plays a critical role
in recycling Under
Objectives states
To integrate
informal sector in
the management of
municipal solid waste
10 Pune
Pune Municipal
Corporation Public
Health and Sanitation
Bye- Laws 2017
Yes Yes
It states, the PMC shall
establish a system to
recognise organisations
of waste pickers or
informal waste collectors
and promote and
establish a system for
integration of these
authorised waste-pickers
and waste collectors
to facilitate their
participation in solid
waste management
including door to
door collection of waste;
Wastepickers

461
Does the municipality have a specific plan for dry waste management?
Is Waste picker integrated into door-door collection?
Does the municipality provide waste pickers/informal waste collectors access to collect waste
Revenue from sale of recyclables
Material recovery facilities or
secondary storage facilities
shall be set up with
sufficient space for sorting of
recyclable materials to enable
authorised waste
collectors to separate
recyclables from the waste.
The system should be
developed
with the integration of local
waste pickers and recyclers for
collection of segregated
recyclable waste such as paper,
plastic, metal, glass, textile
from the source of
generation or from material
recovery facilities.
Not specifically mentioned Residential welfare associations,
market associations, gated
communities and institutions,
hotels & restaurants handover
segregated recyclable material
to either the authorised
waste pickers or authorised
recyclers
To wastepickers and other
collectors
MRFs will only accept
segregated Dry Waste / Non-
Biodegradable Waste;
Corporation shall:
a. Shall make efforts to register
or authorize existing informal
waste collection/
aggregation/ trading facilities
operated by registered
informal waste traders as MRFs
subject to compliance with
the provisions, standards and
specifications relating to such
facilities hereunder;
Yes
It states PMC shall
facilitate formation of Self
Help Groups, provide
identity cards and thereafter
encourage
integration in solid waste
management including door
to door collection of waste;
In accordance with the provisions
of the Solid Waste Management
Rules, 2016, the following
generators shall handover
recyclables to authorized waste-
pickers or waste traders, within
one year of notification of the
Solid Waste Management Rules,
2016:
i. All resident welfare and market
associations;
ii. Gated communities or
institutions having more than
5000 sq. mt. area;
iii. Hotels and Restaurants.
Every generator shall provide
free and easy access to
collection point/ Community
Bins to waste-pickers/
employees/ agents engaged
by the Corporation for primary
collection.
Can be retained by the
wastepickers


463
Annexure 3

464
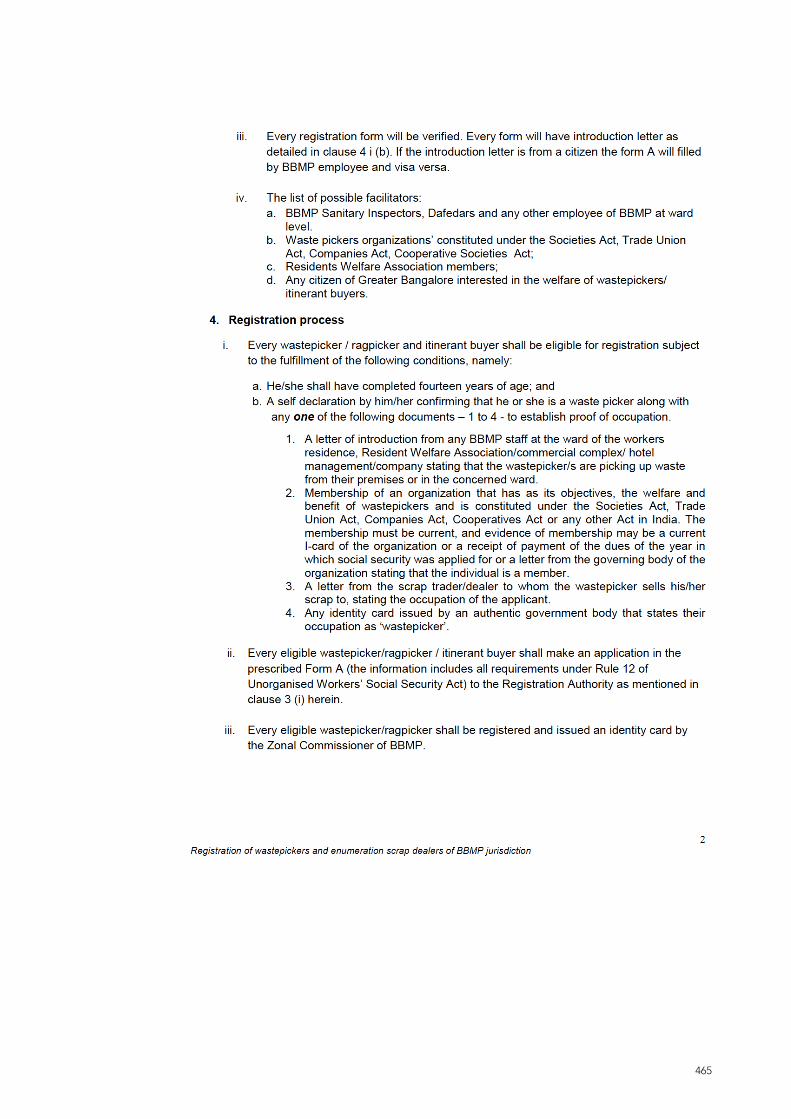
465

466

467

468
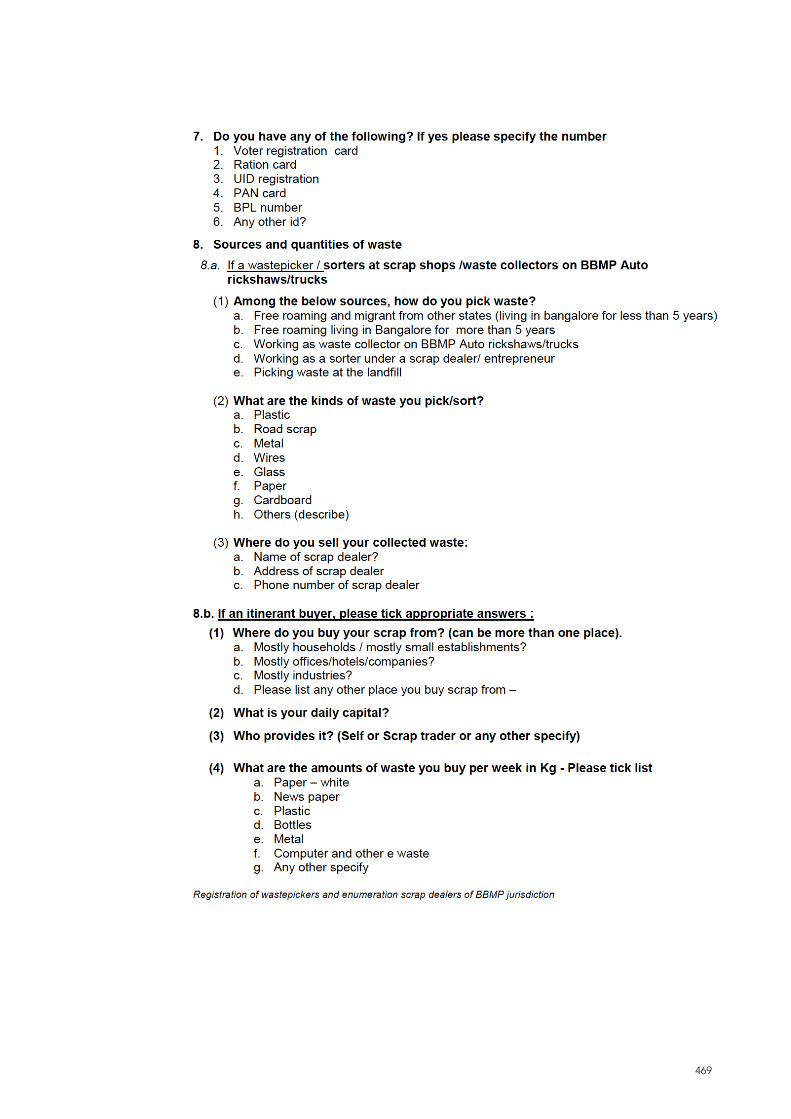
469

470

471

472


About the Alliance of Indian Wastepickers
The Alliance of Indian Wastepickers is more than a decade old national coalition of organizations working with waste-pickers and other informal waste collectors. The alliance was created to have coordinated efforts to ensure inclusion of waste pickers in various national level programmes. Organizations/members of the alliance represent more than 40000 waste-pickers and other informal waste-pickers in India. Secretariat of the alliance has been rotating amongst member organizations starting from Kagad Kach Patra Kashtakari Panchayat (KKPKP), Pune. After that, Bangalore based organization of wastepickers- Hasiru Dala hosted the secretariat for 3 years. Currently, the Secretariat of the coalition is hosted by Stree Mukti Sanghatana.
About IGSSS
Indo-Global Social Service Society (IGSSS) is a non-profit organisation working with the mandate for a humane social order based on truth, justice, freedom and equity. Established in 1960, IGSSS works for development, capacity building and enlightenment of the vulnerable communities across the country for their effective participation in development. With its presence in 25 states and one Union Territory of India, IGSSS has set its thematic focus on promoting sustainable livelihood, energising the youth as change makers, protecting lives, livelihood and assets from the impact of hazards, advocating for the rights of CityMakers (Urban Poor Residents) and developing cadre of leaders from the community and civil society organisations. Gender and Youth are underlining theme across all its interventions.
Indo-Global Social Service Society28, Institutional Area, Lodhi Road, New Delhi-110003Email - [email protected] - 011-45705000 Website - www.igsss.orgFacebook - www.facebook.com/igsssTwitter - @igsss